
| Exhibit 99.2 May 6, 2008 Fannie Mae 2008 Q1 10-Q Investor Summary |

| These materials present tables and other information about Fannie Mae, including information contained in Fannie Mae's Quarterly Report on Form 10-Q for the quarter ended March 31, 2008 ("2008 Q1 Form 10-Q"). These materials should be reviewed together with the 2008 Q1 Form 10-Q, copies of which are available on the company's Web site at www.fanniemae.com under the "Investor Relations" section of the Web site. More complete information about Fannie Mae, its business, business segments, financial condition and results of operations is contained in its 2008 Q1 Form 10-Q, which also includes more detailed explanations and additional information relating to the information contained in this presentation. Footnotes to the included tables have been omitted. |

| Forward Looking Statements/Risk Factors This presentation includes forward-looking statements, including statements relating to our future capital position, financial performance and condition, ability to take advantage of business opportunities, market share and credit losses; our strategy; the fair value of our net assets; our expectations regarding the housing, credit and mortgage markets; volatility in our results; and our future credit loss ratio. Future results may differ materially from what is indicated in these forward-looking statements. Factors that could cause actual results to differ materially include, but are not limited to, greater than expected delinquencies and credit losses on the mortgages we hold or guaranty; impairments, delinquencies and losses on loans that back our private-label mortgage-related securities investments; further declines in home prices in excess of our current expectations; a recession or other economic downturn; a default by one or more of our significant institutional counterparties on its obligations to us; the loss of business volume from any of our key lender customers; widening of credit spreads; and changes in interest rates, as well as others described in the "Risk Factors" sections in Fannie Mae's annual report on Form 10-K for the year ended December 31, 2007 ("2007 Form 10-K") and 2008 Q1 Form 10-Q and in its reports on Form 8-K. Other terms used but not defined in this presentation may be defined in our 2007 Form 10-K or 2008 Q1 Form 10-Q. |
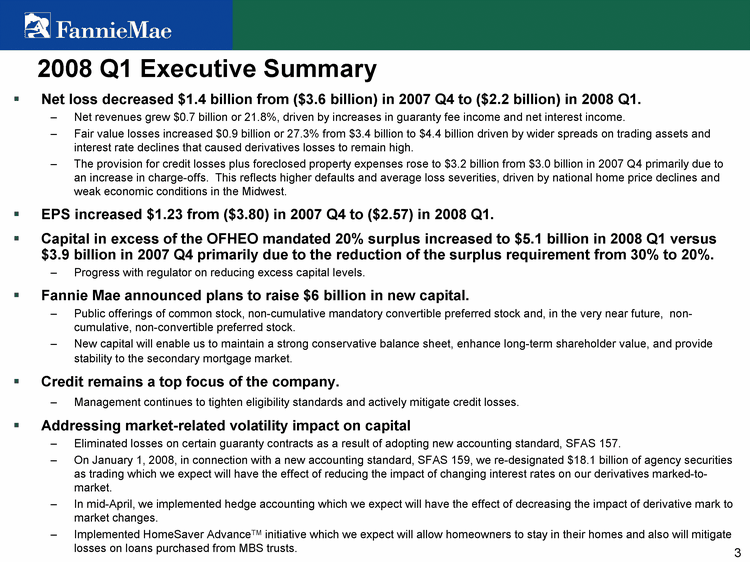
| 2008 Q1 Executive Summary Net loss decreased $1.4 billion from ($3.6 billion) in 2007 Q4 to ($2.2 billion) in 2008 Q1. Net revenues grew $0.7 billion or 21.8%, driven by increases in guaranty fee income and net interest income. Fair value losses increased $0.9 billion or 27.3% from $3.4 billion to $4.4 billion driven by wider spreads on trading assets and interest rate declines that caused derivatives losses to remain high. The provision for credit losses plus foreclosed property expenses rose to $3.2 billion from $3.0 billion in 2007 Q4 primarily due to an increase in charge-offs. This reflects higher defaults and average loss severities, driven by national home price declines and weak economic conditions in the Midwest. EPS increased $1.23 from ($3.80) in 2007 Q4 to ($2.57) in 2008 Q1. Capital in excess of the OFHEO mandated 20% surplus increased to $5.1 billion in 2008 Q1 versus $3.9 billion in 2007 Q4 primarily due to the reduction of the surplus requirement from 30% to 20%. Progress with regulator on reducing excess capital levels. Fannie Mae announced plans to raise $6 billion in new capital. Public offerings of common stock, non-cumulative mandatory convertible preferred stock and, in the very near future, non- cumulative, non-convertible preferred stock. New capital will enable us to maintain a strong conservative balance sheet, enhance long-term shareholder value, and provide stability to the secondary mortgage market. Credit remains a top focus of the company. Management continues to tighten eligibility standards and actively mitigate credit losses. Addressing market-related volatility impact on capital Eliminated losses on certain guaranty contracts as a result of adopting new accounting standard, SFAS 157. On January 1, 2008, in connection with a new accounting standard, SFAS 159, we re-designated $18.1 billion of agency securities as trading which we expect will have the effect of reducing the impact of changing interest rates on our derivatives marked-to- market. In mid-April, we implemented hedge accounting which we expect will have the effect of decreasing the impact of derivative mark to market changes. Implemented HomeSaver AdvanceTM initiative which we expect will allow homeowners to stay in their homes and also will mitigate losses on loans purchased from MBS trusts. |

| Consolidated Financial Results |

| Redemption of step rate debt added 17 bps, on an annualized basis, to the net interest yield in 2008 Q1. This reflects the reversal of interest accrued on step-rate debt because the debt was called before all the interest was paid. SOP 03-3 accretion increased net interest income by $35 million in 2008 Q1 (2 bps positive impact on net interest yield), $38 million in 2007 Q4 (2 bps), $21 million in 2007 Q3 (1 bp), $14 million in 2007 Q2 (1 bp), and $7 million in 2007 Q1 (less than 1 bp). If current market conditions continue, we expect net interest yield (excluding the benefit received from the redemption of step rate debt securities during 2008 Q1) to continue to increase for the remainder of 2008. Tax-Equivalent Net Interest Income and Yield 2007 Q1 2007 Q2 2007 Q3 2007 Q4 2008 Q1 Average Interest Earning Assets 797.6 805.2 826.9 804.5 833.205 Net Interest Yield 64 64 57 62 86 NIY (excl step rate) 63 63 55 57 69 (Avg Balance in billions) (Net Interest Yield in basis points) GAAP Net Interest Income ($M) $1,194 $1,193 $1,058 $1,136 $1,690 Tax-equivalent adjustment ($M) 92 90 87 85 83 Tax-equivalent NII ($M) $1,286 $1,283 $1,145 $1,221 $1,773 Step rate debt impact ($M) 22 19 28 96 347 Our net interest yield reflected the benefits of a steeper yield curve as we shifted our funding mix to a higher proportion of lower-rate, short-term debt. |
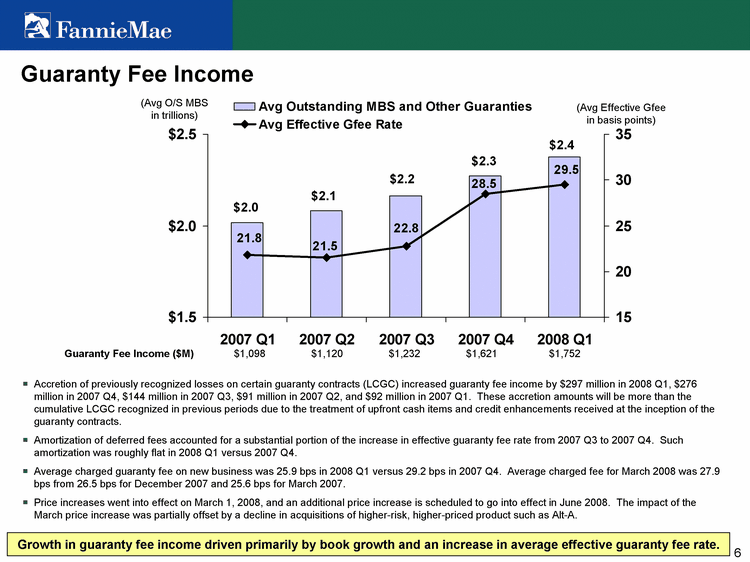
| Accretion of previously recognized losses on certain guaranty contracts (LCGC) increased guaranty fee income by $297 million in 2008 Q1, $276 million in 2007 Q4, $144 million in 2007 Q3, $91 million in 2007 Q2, and $92 million in 2007 Q1. These accretion amounts will be more than the cumulative LCGC recognized in previous periods due to the treatment of upfront cash items and credit enhancements received at the inception of the guaranty contracts. Amortization of deferred fees accounted for a substantial portion of the increase in effective guaranty fee rate from 2007 Q3 to 2007 Q4. Such amortization was roughly flat in 2008 Q1 versus 2007 Q4. Average charged guaranty fee on new business was 25.9 bps in 2008 Q1 versus 29.2 bps in 2007 Q4. Average charged fee for March 2008 was 27.9 bps from 26.5 bps for December 2007 and 25.6 bps for March 2007. Price increases went into effect on March 1, 2008, and an additional price increase is scheduled to go into effect in June 2008. The impact of the March price increase was partially offset by a decline in acquisitions of higher-risk, higher-priced product such as Alt-A. Guaranty Fee Income Guaranty Fee Income ($M) $1,098 $1,120 $1,232 $1,621 $1,752 2007 Q1 2007 Q2 2007 Q3 2007 Q4 2008 Q1 Avg Outstanding MBS and Other Guaranties 2.017 2.081 2.163 2.273 2.375 Avg Effective Gfee Rate 21.8 21.5 22.8 28.5 29.5 (Avg O/S MBS in trillions) (Avg Effective Gfee in basis points) Growth in guaranty fee income driven primarily by book growth and an increase in average effective guaranty fee rate. |
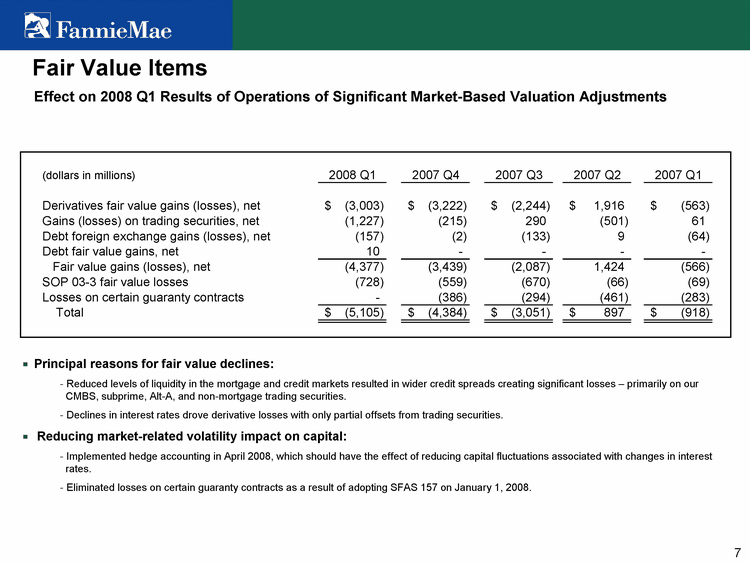
| Fair Value Items Effect on 2008 Q1 Results of Operations of Significant Market-Based Valuation Adjustments Principal reasons for fair value declines: Reduced levels of liquidity in the mortgage and credit markets resulted in wider credit spreads creating significant losses - primarily on our CMBS, subprime, Alt-A, and non-mortgage trading securities. Declines in interest rates drove derivative losses with only partial offsets from trading securities. Reducing market-related volatility impact on capital: Implemented hedge accounting in April 2008, which should have the effect of reducing capital fluctuations associated with changes in interest rates. Eliminated losses on certain guaranty contracts as a result of adopting SFAS 157 on January 1, 2008. |

| Effect on 2008 Q1 Results of Operations of Significant Market-Based Valuation Adjustments Actions to reduce future interest rate volatility associated with these items: In connection with adoption of SFAS 159, moved selected agency MBS to MTM accounting to reduce the impact of changing interest rates on derivative MTM. Implemented hedge accounting in April 2008. Fair Value Items Numbers may not foot due to rounding Wider credit spreads caused trading losses and lower interest rates triggered derivative losses. Hedge accounting is expected to have the effect of reducing volatility created by interest rates. Spread risk remains in trading portfolio. (dollars in billions) ($1.2) ($3.0) ($0.1) ($4.4) ($5.0) ($4.0) ($3.0) ($2.0) ($1.0) $0.0 Interest Rates/Volatility Spreads Other Total Derivatives ($B) ($3.1) $ - $0.1 ($3.0) Trading ($B) $1.8 ($3.0) $ - ($1.2) Other ($B) $ - $ - ($0.1) ($0.1) Total ($B) ($1.2) ($3.0) ($0.1) ($4.4) |
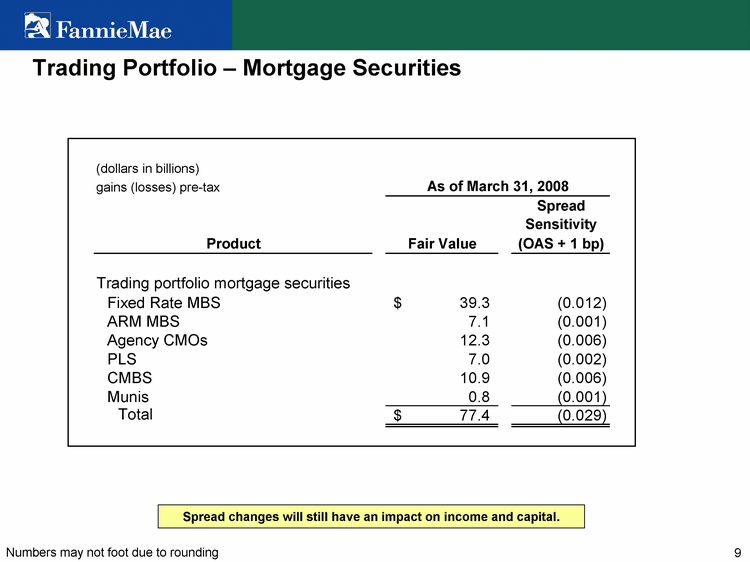
| Trading Portfolio - Mortgage Securities Numbers may not foot due to rounding Spread changes will still have an impact on income and capital. |
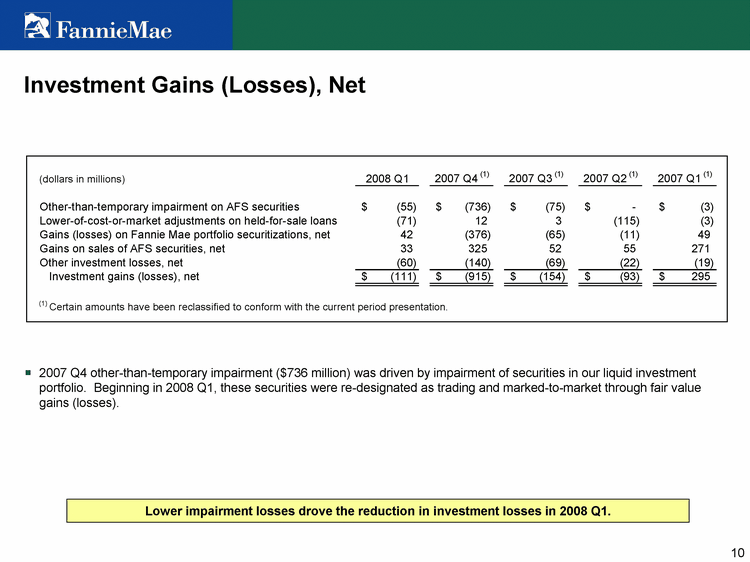
| Investment Gains (Losses), Net 2007 Q4 other-than-temporary impairment ($736 million) was driven by impairment of securities in our liquid investment portfolio. Beginning in 2008 Q1, these securities were re-designated as trading and marked-to-market through fair value gains (losses). Lower impairment losses drove the reduction in investment losses in 2008 Q1. |

| Subprime and Alt-A Private-Label Securities (In Portfolio) (dollars in billions) Numbers may not foot due to rounding Subprime and Alt-A AFS securities continue to perform and are credit-enhanced. Since the beginning of 2007, Fannie Mae has recorded through earnings net losses of $0.9 billion on Alt-A and $2.3 billion on subprime private-label securities and wraps. Current unrealized losses at March 31, 2008, on these trading securities is $2.3 billion. Additional detail regarding these securities is provided in Appendix I, pages 36-38. |

| Credit-Related Expenses/Credit Loss Performance Metrics Credit loss ratio (excluding the impact of SOP 03-3) increased to 12.6 bps in 2008 Q1 from 8.1 bps in 2007 Q4. The company expects the 2008 credit loss ratio of 13 to 17 basis points (excluding the impact of SOP 03-3) based on home price declines in 2008 of 7 to 9 percent. We also expect peak-to-trough declines in home prices of 15 to 19 percent. Allowance for loan losses and reserve for guaranty losses are influenced by a variety of factors such as delinquency trends, borrower behavior in rapidly declining markets, and the pace and depth of home price declines, particularly pronounced in certain regions. If the current negative trend in the housing market continues, we expect a further increase in our loss reserves during 2008 due to higher delinquencies, defaults, and loan loss severities. We expect credit losses to increase in 2009 relative to 2008. Increased realized credit losses drive higher credit-related expenses. Credit remains a key focus of the company. |

| Despite a reduction in the number of seriously delinquent loans purchased from MBS trusts, SOP 03-3 losses increased in 2008 Q1 as the average fair value of loans purchased fell from 70% in Q4 2007 to 62% in Q1 2008. Going forward, we expect that HomeSaver AdvanceTM, initiated in March 2008, will reduce the number of loans that we otherwise would have purchased out of MBS trusts in 2008. Losses on Seriously Delinquent Loans Purchased from Trusts/Cure Rates Re-performance Rates of Seriously Delinquent Single-Family Loans Purchased from MBS Trusts 94% 93% 72% 70% (1) Includes value of primary mortgage insurance 62% Increased losses on seriously delinquent loans purchased from MBS trusts driven by declines in average market price. |

| Proactive Credit Management Tightening underwriting and eligibility standards / reduced participation in riskier segments Stricter eligibility requirements - increasing FICOs, lowering LTVs and increasing documentation requirements Significantly reduced Alt-A acquisitions Increasing loss mitigation efforts Focused on work-outs Encourage servicers to ramp up work-outs and outreach programs to delinquent borrowers Provide incentives to attorneys and servicers to pursue alternatives to foreclosure Benefiting from credit enhancement on riskier loans; credit enhancement purchased primarily in prior quarters. Actively monitoring counterparties and enhancing counterparty collateral requirements Credit enhancement providers Servicers Substantial loss mitigation efforts are underway. |

| Single-Family Pricing and Credit Weighted Average G-Fee 2007 23.18 Q1 2008 25.04 3/1/2008 28.64 Weighted Average FICO 2007 716 Q1 2008 728 3/1/2008 737 Weighted Average Original LTV 2007 0.750000000232827 Q1 2008 0.73 3/1/2008 0.7 G-Fee Rate Credit Score - All Products LTV Ratio - All Products Improved credit and pricing metrics on new acquisitions, at the same time market share increases. Note: Figures are for Fannie Mae "flow" business only. |

| Change in Estimated After-Tax Fair Value of Net Assets (Non-GAAP) The estimated fair value of our net assets (non-GAAP) represents the estimated fair value of total assets less the estimated fair value of total liabilities. We reconcile the estimated fair value of our net assets (non-GAAP) to total stockholders' equity (GAAP) in Appendix II (pg 49) and Table 32 of our 2008 Q1 Form 10-Q. Fair value of net assets decreased by $21.4 billion, excluding the effect of the change in measuring the fair value of the GO and capital transactions, driven by change in GO and widening spreads. Under our new methodology, the GO value is estimated based on our most recent pricing for issuance of our guaranty. Approximately 40% of the increase in the fair value of our net guaranty obligation resulted from an increase in the underlying risk in our credit guaranty book as delinquencies increased and home prices declined; the remaining approximately 60% of the increase resulted from an increase in the risk premium required to take mortgage credit risk in the current market, as indicated by the pricing of our new guaranty business. Increase in guaranty obligation and wider credit spreads reduced the fair value of net assets. Numbers may not foot due to rounding |

| 2008 Q1 Capital Surplus - Sources and Uses of Excess Capital At March 31, 2008, Fannie Mae had $42.7 billion of core capital and a $5.1 billion capital surplus. Return of Capital Net Investment Note: 2008 Q1 capital surplus is a Fannie Mae estimate, and has not been certified by OFHEO * Includes impact of adopting SFAS 157 and SFAS 159 effective January 1, 2008. Numbers may not foot due to rounding * |

| APPENDIX I - Credit |

| Home Price Growth Rate in the U.S. Growth rates are from period-end to period-end. Note: Using the S&P/Case-Shiller weighting method, but excluding the increased impact of foreclosure sales on that index, our 2008 expected home price decline would be 10-13% (vs. 7-9%); our expected peak-to-trough decline would be 20-25% (vs. 15-19%). The S&P/Case-Shiller Index is value-weighted, whereas the Fannie Mae index is unit-weighted; hence the S&P/Case-Shiller index places greater weight on higher cost metropolitan areas. In addition, the S&P/Case Shiller index includes foreclosure sales; foreclosure sales are excluded from the Fannie Mae index and from this forecast. Foreclosure sales tend to depress the S&P/Case Shiller index relative to the Fannie Mae index. S&P/Case Shiller Index 9.8% 7.7% 10.6% 10.7% 14.6% 14.7% 0.2% -8.9% Fannie Mae Home Price Index 7.2% 5.9% 8.7% 7.9% 10.9% 11.8% 2.4% - -3.5% - -7% to -9% |
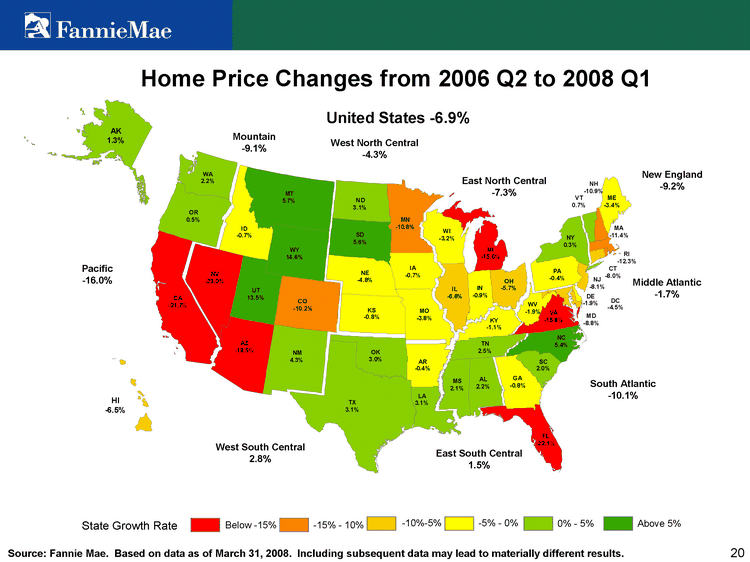
| Source: Fannie Mae. Based on data as of March 31, 2008. Including subsequent data may lead to materially different results. |

| Credit Loss Ratio/Delinquency Rates Higher credit loss ratio primarily due to worsening decline in home prices, particularly in the Midwest, California, Florida, Nevada, and Arizona, economic weakness in the Midwest, and rising delinquencies in our Alt-A book and 2006-2007 vintages. Our credit loss ratio excludes the impact of SOP 03-3 Fannie Mae expects its 2008 credit loss ratio to be within a range of 13-17 bps, factoring in a significant increase in loan default and severity rates, and a significant increase in acquisitions of foreclosed properties, as well as a 7 to 9% nationwide decline in home prices * Note: Credit loss ratio is defined as [Net charge-offs (excluding impact of SOP 03-3) + Foreclosed Property Expense (excluding impact of SOP 03-3)]/Average Guaranty Book of Business Note: As of 3/31/08, 21% of Fannie Mae's Single-Family guaranty book of business was credit enhanced. |
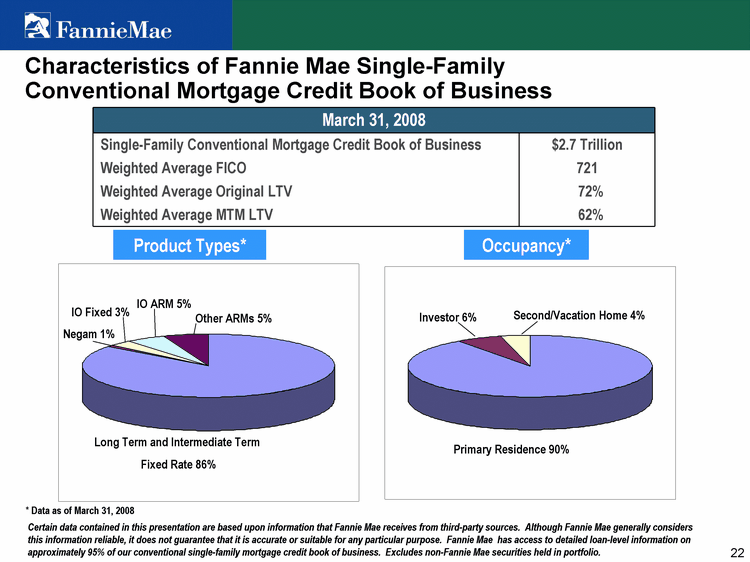
| Characteristics of Fannie Mae Single-Family Conventional Mortgage Credit Book of Business Product Types* Occupancy* * Data as of March 31, 2008 March 31, 2008 March 31, 2008 Single-Family Conventional Mortgage Credit Book of Business $2.7 Trillion Weighted Average FICO 721 Weighted Average Original LTV 72% Weighted Average MTM LTV 62% 90% Certain data contained in this presentation are based upon information that Fannie Mae receives from third-party sources. Although Fannie Mae generally considers this information reliable, it does not guarantee that it is accurate or suitable for any particular purpose. Fannie Mae has access to detailed loan-level information on approximately 95% of our conventional single-family mortgage credit book of business. Excludes non-Fannie Mae securities held in portfolio. Long Term and Intermediate Term Fixed Rate 86% Other ARMs 5% IO ARM 5% IO Fixed 3% Negam 1% Primary Residence 90% Second/Vacation Home 4% Investor 6% |

| Fannie Mae Subprime and Alt-A Exposure Total Exposure of $51.2 Billion Total Exposure of $344.6 Billion * Data as of March 31, 2008 Subprime Alt-A PLS Portfolio Investment $30.4 B PLS Wrap $12.8 B Purchased or Guaranteed Loans $8.0B Purchased or Guaranteed Loans $313.4 B PLS Portfolio Investment $30.6 B PLS Wrap $0.6 B ($8.3 B Held in Portfolio) (None Held in Portfolio) "Alt-A mortgage loan" generally refers to a mortgage loan that can be underwritten with reduced or alternative documentation than that required for a full documentation mortgage loan but may also include other alternative product features. As a result, Alt-A mortgage loans generally have a higher risk of default than non-Alt-A mortgage loans. In reporting our Alt-A exposure, we have classified mortgage loans as Alt-A if the lenders that deliver the mortgage loans to us have classified the loans as Alt-A based on documentation or other product features. We have classified private-label mortgage-related securities held in our investment portfolio as Alt-A if the securities were labeled as such when issued. "Subprime mortgage loan" generally refers to a mortgage loan made to a borrower with a weaker credit profile than that of a prime borrower. As a result of the weaker credit profile, subprime borrowers have a higher likelihood of default than prime borrowers. Subprime mortgage loans are typically originated by lenders specializing in this type of business or by subprime divisions of large lenders, using processes unique to subprime loans. In reporting our subprime exposure, we have classified mortgage loans as subprime if the mortgage loans are originated by one of these specialty lenders or a subprime division of a large lender. We have classified private-label mortgage-related securities held in our investment portfolio as subprime if the securities were labeled as such when issued. |
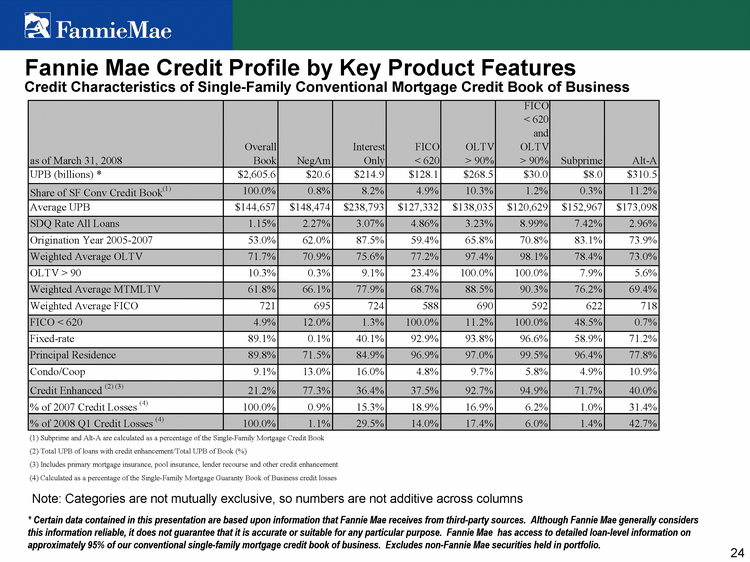
| Fannie Mae Credit Profile by Key Product Features Note: Categories are not mutually exclusive, so numbers are not additive across columns Credit Characteristics of Single-Family Conventional Mortgage Credit Book of Business * Certain data contained in this presentation are based upon information that Fannie Mae receives from third-party sources. Although Fannie Mae generally considers this information reliable, it does not guarantee that it is accurate or suitable for any particular purpose. Fannie Mae has access to detailed loan-level information on approximately 95% of our conventional single-family mortgage credit book of business. Excludes non-Fannie Mae securities held in portfolio. |

| Fannie Mae Credit Profile by Vintage and Key Product Features Credit Characteristics of Single-Family Conventional Mortgage Credit Book of Business by Vintage * Certain data contained in this presentation are based upon information that Fannie Mae receives from third-party sources. Although Fannie Mae generally considers this information reliable, it does not guarantee that it is accurate or suitable for any particular purpose. Fannie Mae has access to detailed loan-level information on approximately 95% of our conventional single-family mortgage credit book of business. Excludes non-Fannie Mae securities held in portfolio. |

| Data as of March 31, 2008 is not necessarily indicative of the ultimate performance and are likely to change, perhaps materially, in future periods. Consistent with industry trends, 2006 and 2007 vintages performing poorly. |

| Fannie Mae Credit Profile by State Credit Characteristics of Single-Family Conventional Mortgage Credit Book of Business by State * Certain data contained in this presentation are based upon information that Fannie Mae receives from third-party sources. Although Fannie Mae generally considers this information reliable, it does not guarantee that it is accurate or suitable for any particular purpose. Fannie Mae has access to detailed loan-level information on approximately 95% of our conventional single-family mortgage credit book of business. Excludes non-Fannie Mae securities held in portfolio. |
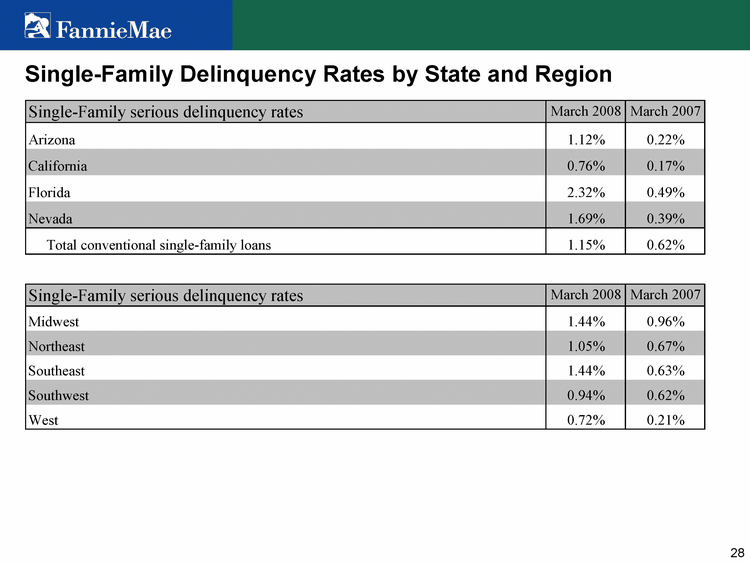
| Single-Family Delinquency Rates by State and Region |

| Home Price Growth/Decline and Fannie Mae Real Estate Owned (REO) in Key States On a national basis, REO net sales price compared with unpaid principal balance of mortgage loan has decreased from 93% in 2005 to 89% in 2006 to 78% in 2007 to 74% in Q1 2008 driving an increase in loss severity. Single-family REO and Home Price Statistics for Selected States 1 Based on Fannie Mae Home Price Index 1 |

| Fannie Mae Alt-A Credit Profile by Key Product Features Credit Characteristics of Single-Family Mortgage Credit Book of Business by Vintage (1) Defined as UPB of Alt-A loans with credit enhancement as a percent of UPB of all Alt-A loans. At 3/31/08, 8.9% of UPB of Alt-A loans carried only primary MI (no deductible), 27.1% had only pool insurance (which is generally subject to a deductible), 3.3% had primary MI and pool insurance, and 0.7% carried other credit enhancement such as lender recourse. "Alt-A mortgage loan" generally refers to a mortgage loan that can be underwritten with reduced or alternative documentation than that required for a full documentation mortgage loan but may also include other alternative product features. As a result, Alt-A mortgage loans generally have a higher risk of default than non-Alt-A mortgage loans. In reporting our Alt-A exposure, we have classified mortgage loans as Alt-A if the lenders that deliver the mortgage loans to us have classified the loans as Alt-A. |

| Fannie Mae Alt-A Loans Versus Loans Underlying Private Label Alt-A Securities All data and CDRs for Q1:08 are based on Jan-08 data. Private Label Security data are from First American CoreLogic, LoanPerformance. LoanPerformance estimates it captures 96 percent of Alt-A PLS. The PLS data includes some loans that Fannie Mae holds in its Alt-A securities portfolio. All summary collateral characteristics are weighted averages using current loan balances. Certain amounts have been calculated by Fannie Mae. 1st Qtr 2nd Qtr 3rd Qtr 4th Qtr East 20.4 27.4 90 20.4 West 30.6 38.6 34.6 31.6 North 45.9 46.9 45 43.9 Fannie Mae's Alt-A guaranteed book of business has more favorable credit characteristics than the loans backing Alt-A Private Label Securities (PLS). |

| New Business: Reduction in Alt-A acquisition volume reflects eligibility and pricing changes Eligibility: Deliveries after January 1, 2008: Reduced maximum LTV/CLTV to 90% Deliveries after March 1, 2008: Raised minimum FICO score to 660 regardless of LTV/CLTV Will no longer purchase No Income/No Asset documentation loans Will no longer purchase No Income/Verified Asset documentation type loans The maximum LTV/CLTV for cash-out refinance loans reduced to 75% for majority of property types Deliveries after June 1, 2008: Discontinuing the purchase of Interest-Only mortgage loans Deliveries after August 1, 2008 (announced early May): Reduced maximum LTV/CLTV to 75% and raised minimum FICO score to 680 regardless of LTV/CLTV for all reduced- documentation Alt-A mortgages Pricing: Beginning in 2007, we made several guaranty fee changes as a result of the turmoil in the market, resulting in higher guaranty fees for Alt-A mortgages For deliveries after August 1, 2008, we are making additional adjustments to guaranty fees for Alt-A mortgages that are focused on realigning our risk-based pricing with our tighter eligibility and credit standards Alt-A Risk Management UPB ($Bn) Share of Total Quarterly Acquisitions |

| Fannie Mae Subprime and Alt-A Private Label Security (PLS) Exposure - Securities/Wraps As of April 30, 2008, all of our private-label mortgage-related securities backed by Alt-A mortgage loans were rated AAA and none had been downgraded. However, approximately $4.5 billion or 15% of our Alt-A private-label mortgage-related securities had been placed under review for possible credit downgrade or on negative watch as of April 30, 2008. The percentages of our subprime private-label mortgage securities rated AAA and AA to BBB- were 42% and 48%, respectively, as of April 30, 2008, compared with 97% and 3% respectively as of December 31, 2007. The percentage of these securities rated below investment grade rose to 10% as of April 30, 2008. None of these securities were rated below investment grade as of December 31, 2007. Approximately $6.4 billion or 21% of our subprime private-label mortgage-related securities had been placed under review for possible credit downgrade or on negative watch as of April 30, 2008. |

| Investments in Alt-A Mortgage-Related Securities (Option ARM) Data as of March 31, 2008 |

| Investments in Alt-A Mortgage-Related Securities (Other) Data as of March 31, 2008 |

| Investments in Subprime Mortgage-Related Securities Data as of March 31, 2008 |
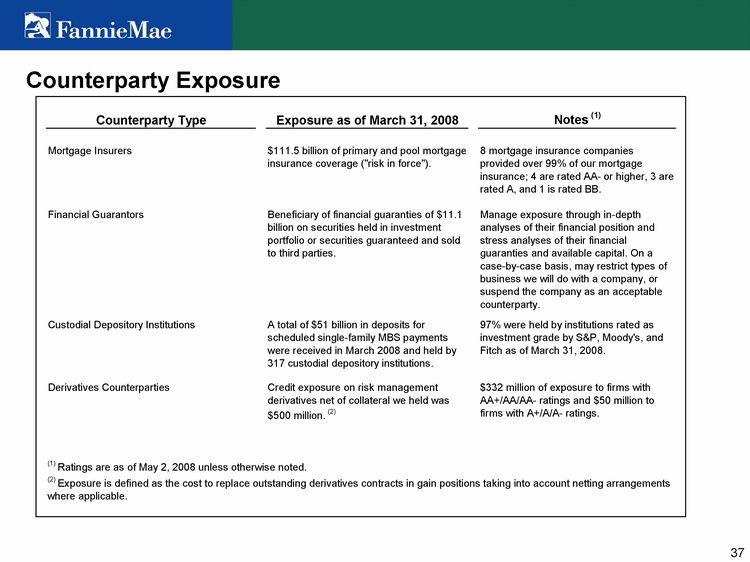
| Counterparty Exposure |

| Counterparty Exposure - Mortgage Insurers |
| APPENDIX II - Other |

| Economic Environment - Interest Rates Treasury information: FNM Economic Forecast, March 2008. Swap and Volatility: Capital Markets group. Net interest yield increased due to reduced funding costs and the retirement of step rate debt in 2008 Q1. Swap rate declines triggered net losses on derivatives. Widening credit spreads caused overall fair value losses on trading securities, more than offsetting the positive impact of falling rates. |

| Statements of Operations by Segment |

| Net Revenues and Net Income (Loss) by Segment |
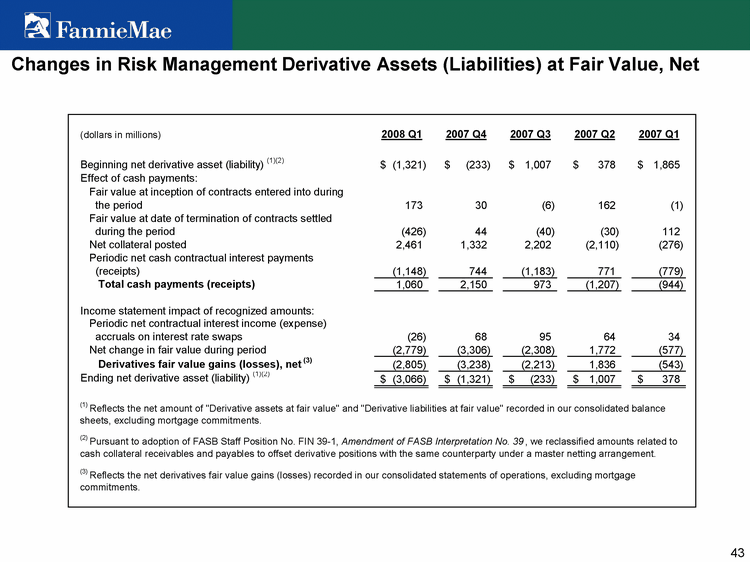
| Changes in Risk Management Derivative Assets (Liabilities) at Fair Value, Net |

| Purchased Options Premiums |
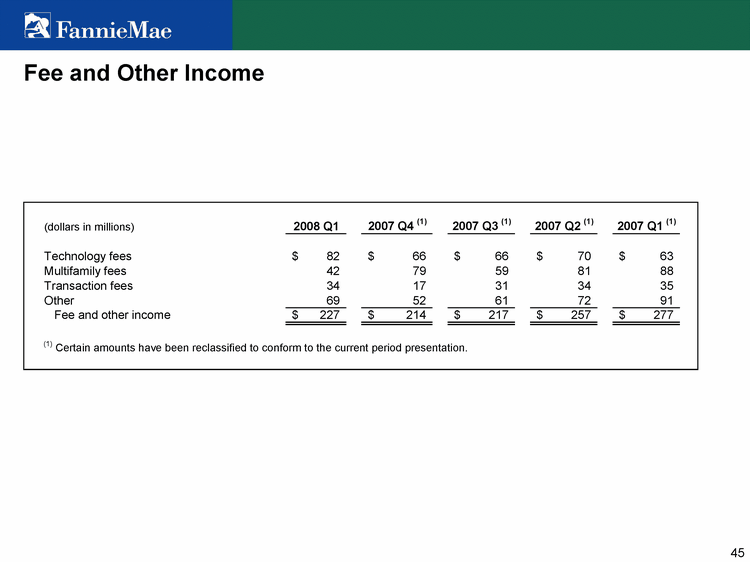
| Fee and Other Income |

| Selected Financial and Operating Statistics |

| Income Exposures Due to Changes in Interest Rates Overall effect - Addressing market-related volatility impact on capital Anticipate significant reduction in rate driven income statement volatility as a result of adoption of SFAS 159 (Fair Value Option) and implementation of hedge accounting in April 2008. Ongoing interest rate exposure to net income is balanced Fair Value Hedge Accounting - The change in the FV of the hedged assets, due to interest rates, will be included in net income. Continue to have income statement exposure to changes in interest rates, although significantly reduced, and spread risk on our trading assets. |

| Option Adjusted Spreads (OAS) - Lehman Source: LehmanLive(r) |

| The following sets forth a reconciliation of the estimated fair value of our net assets (non-GAAP) to total stockholders' equity (GAAP). A more detailed reconciliation is contained in Table 32 of the 2008 Q1 Form 10-Q. |

| Impairment Summary Impairments are recorded at fair value and not the value we expect to recover. At current market prices, the value we expect to recover is generally greater than fair value. In 2008 Q1, we recorded $52 million of other-than-temporary impairment on $750.6 million of unpaid principal balance of subprime private-label securities classified as AFS because we concluded that we did not have the intent to hold to recovery ($12 million) or it was no longer probable that we would collect all of the contractual principal and interest amounts due ($40 million). Beginning in 2008 Q1, securities in the liquid investment portfolio were re-designated as trading and marked to market through fair value gains (losses). |

| Additional Disclosure Items For April 2008, Fannie Mae's average duration gap was 2 months. For April 2008, Fannie Mae's net portfolio purchase commitments were approximately $28 billion. The serious delinquency rate in the single family book as of March 31, 2008, increased to 1.15%, from 0.98% as of December 31, 2007. |