U. S.
SECURITIES AND EXCHANGE COMMISSION
WASHINGTON, D. C. 20549
FORM N-CSR
CERTIFIED SHAREHOLDER REPORT OF REGISTERED
MANAGEMENT INVESTMENT COMPANIES
Investment Company Act file number 811-2918
DUPREE MUTUAL FUNDS
(Exact Name of Registrant as Specified in Charter)
125 South Mill Street, Vine Center, Suite 100
Lexington, Kentucky 40507
(Address of Principal Executive Offices) (Zip Code)
Allen E. Grimes, III
125 South Mill Street, Vine Center, Suite 100
Lexington, Kentucky 40507
(Name and address of agent for service)
Registrant’s Telephone Number, including Area Code (859) 254-7741
Date of fiscal year end: June 30, 2023
Date of reporting period: July 1, 2022 through June 30, 2023
Item 1. Report to Stockholders

June 30, 2023
ANNUAL REPORT
TO SHAREHOLDERS
ABOUT DUPREE MUTUAL FUNDS
In 1941, Dupree & Company, Inc. began business in Harlan, Kentucky as a small securities brokerage firm specializing in tax-exempt municipal bonds.
Over the years the firm, which in 1963 moved its offices to Lexington, Kentucky, grew to become a regional leader in public finance, helping to structure complex and innovative municipal bond financing for some of the largest public projects in the Commonwealth of Kentucky.
In 1979, Dupree & Company began what is now Dupree Mutual Funds with the Kentucky Tax-Free Income Series and became the Fund’s investment adviser. The Fund was one of the first single-state municipal bond funds in the country, and the first mutual fund to invest solely in Kentucky municipal bonds. Since then, several new offerings have been added to the Dupree Mutual Funds family:
Kentucky Tax-Free Short-to-Medium Series in 1987;
Intermediate Government Bond Series in 1992;
Tennessee Tax-Free Income Series in 1993;
Tennessee Tax-Free Short-to-Medium Series in 1994;
North Carolina Tax-Free Income Series in 1995;
North Carolina Tax-Free Short-to-Medium Series in 1995;
Alabama Tax-Free Income Series in 2000;
Mississippi Tax-Free Income Series in 2000; and
Taxable Municipal Bond Series in 2010.
Today, after more than 60 years in business, Dupree continues to be a pioneer in the industry. Our Kentucky, Tennessee, and Mississippi Series are currently the ONLY 100% “no-load” municipal bond funds available in those states. No-load means simply that shares of the funds are offered directly to investors with no front or back-end sales charges, as opposed to load funds, which are sold through brokerage firms or other institutions that typically carry sales charges.
At Dupree Mutual Funds, our goal is a simple one: to offer investors a high-quality, low-cost way to invest in municipal and government bonds while providing superior service to our shareholders. We encourage you to let us know how we’re doing.
TABLE OF CONTENTS
Management’s Discussion of Fund Performance: | Unaudited |
Twelve Months Ended June 30, 2023i
The investment objective of our tax-free municipal bond funds is to provide a high and stable level of tax-free income derived from state-specific municipal bonds without incurring undue risk to principal. The investment objective of our government bond fund is to provide a high and stable level of taxable income derived from securities of the U.S. government and its agencies without incurring undue risk to principal. Similarly, the investment objective of the taxable municipal bond fund is to provide a high and stable level of taxable income derived from taxable municipal securities without incurring undue risk to principal.
This report covers the twelve month period from July 1, 2022 through June 30, 2023 (the “reporting period”). After contracting during the first half of 2022, economic activity expanded at a modest but steady pace throughout the reporting period. Real gross domestic product (GDP) expanded at a impressive 3.2% annual rate during the third quarter of 2022. Economic growth then started to slow with real GDP increasing during the fourth quarter of 2022 at a 2.6% annual rate. The slowdown continued during the first quarter of 2023 with real GDP increasing at a 2.0% annual rate. The pace of economic growth picked up again during the second quarter of 2023 with real GDP increasing at a 2.4% annual rate (advance estimate).
Labor market conditions remained tight during the reporting period. Over the first five months of 2023, monthly job gains averaged a robust 314,000. The seasonally adjusted national unemployment rate was 3.6% in June, which is low by historical standards. Wage growth increased at a moderate pace, but at a slower pace than inflation, with average hourly earnings increasing at a 4.4% annual rate in June.
Key measures of inflation remained elevated well above the Fed’s longer-run goal of 2% during the reporting period. The Federal Reserve’s (Fed) preferred inflation index, the personal consumption expenditure price index (PCE), increased 3.0% on a year-over-year basis through June 30, 2023. The core PCE, which excludes food and energy prices, increased at an annual rate of 4.1% in June. The Consumer Price Index (CPI) increased at an annual rate of 3.0% rate in June. Inflation has proven to be more persistent than the Fed originally anticipated, but it has continued to slowly abate.
The Federal Open Market Committee (FOMC) raised the target rate for the Fed funds rate at six of its seven meetings held during the reporting period, with the Fed funds rate increasing by a total of 350 basis points. The target rate for the Fed funds rate ended the reporting period at 5.00%-5.25%. Notably, the Fed decided to pause its interest rate hikes at its June meeting to “allow the Committee to assess additional information and its implications for monetary policy.” In the meantime, the Fed continued to reduce its holdings of Treasury securities, agency debt, and agency mortgage-backed securities.
The municipal bond market posted positive total returns during the reporting period. The Bloomberg Municipal Bond Index (BMBI), which tracks investment grade municipal securities across all sectors and maturities, provided a total return of 3.19% for the twelve month period ended June 30, 2023. At the end of the reporting period, the BMBI had a modified adjusted duration of 6.06 years, an average coupon of 4.49%, and an average credit quality of AA2/AA3.
Municipal bond yields increased sharply (prices down) during the third quarter of 2022 as stubbornly high inflation and an aggressive Fed intent on bringing inflation under control continued to batter the bond market. However, municipal bonds rebounded nicely in the fourth quarter of 2022, with yields declining and prices rising. Favorable supply and demand dynamics led to a very solid performance for the municipal bond market during the first quarter of 2023. Performance was mostly flat during the second quarter of 2023. During the reporting period, most longer-dated tax-exempt municipal bonds outperformed shorter-dated tax-exempt municipal bonds and lower-rated credits outperformed higher-rated credits. Overall, despite experiencing some volatility, investment grade tax-exempt municipal bonds performed relatively well and ended up generating positive total returns for the twelve months ending June 30, 2023.
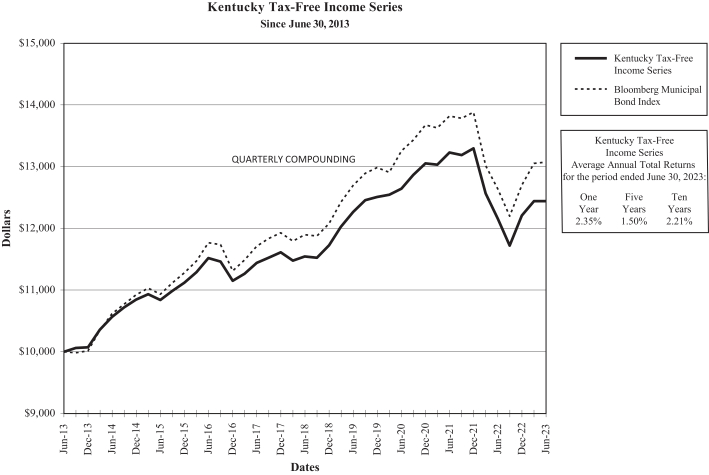
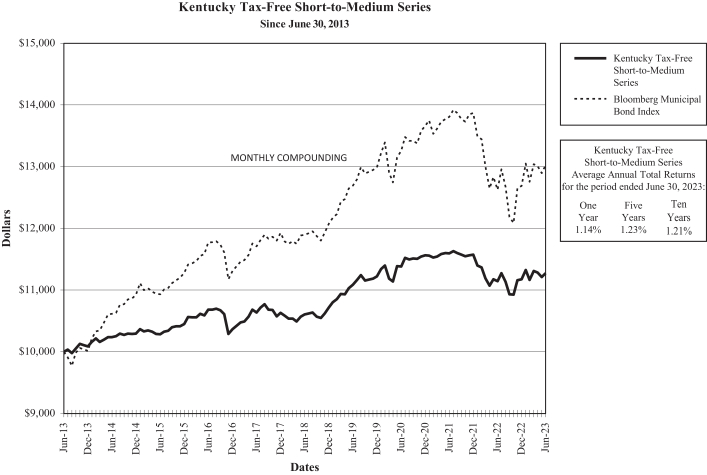
The Kentucky Tax-Free Income Series provided shareholders a total return of 2.35% for the twelve month period ended June 30, 2023. The Kentucky Tax-Free Short-to-Medium Series provided shareholders with a total return of 1.14% for the same time period. Both the Kentucky Tax-Free Income Series and Kentucky Tax-Free Short-to-Medium Series underperformed the BMBI during the reporting period due to the fact that both funds had shorter durations and higher credit qualities than the BMBI.
In 2022, Kentucky’s real GDP increased at a 1.8% annual rate; the 2021-2022 national growth rate was 2.1%. Kentucky’s 2022 current-dollar GDP was $260.3 billion. The state’s annual average seasonally adjusted unemployment rate at the end of June was 3.8%. In 2022, Kentucky had a per capita personal income of $52,109. Kentucky’s appropriation supported debt was rated A1 by Moody’s and A by Standard & Poor’s as of June 30, 2023.
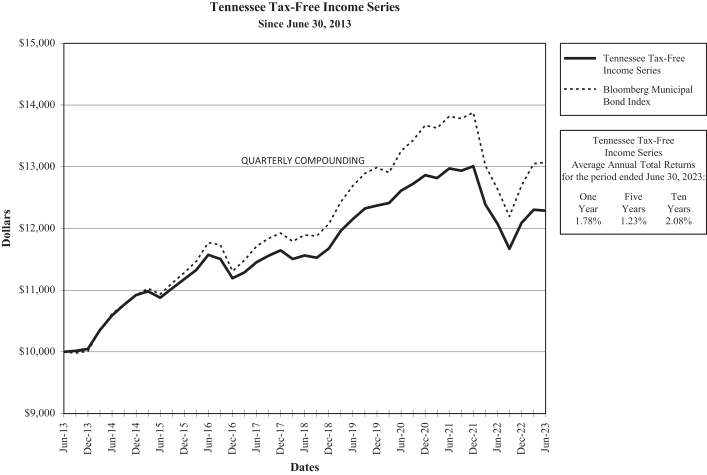
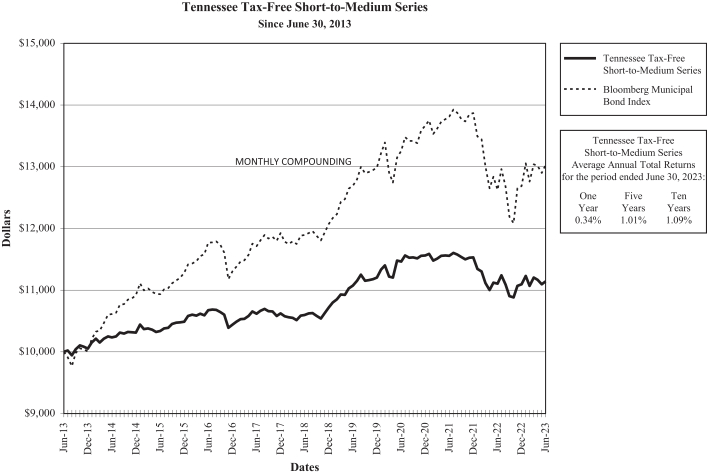
The Tennessee Tax-Free Income Series provided shareholders with a total return of 1.78% for the twelve month period ended June 30, 2023. The Tennessee Tax-Free Short-to-Medium Series provided a total return of 0.34% for the same time period. Both
i
the Tennessee Tax-Free Income Series and the Tennessee Tax-Free Short-to-Medium Series underperformed the BMBI during the reporting period due to the fact that both funds had shorter durations and higher credit qualities than the BMBI.
In 2022, Tennessee’s real GDP increased at a 4.3% annual rate; the 2021-2022 national growth rate was 2.1%. Tennessee’s 2022 current-dollar GDP was $475.7 billion. The state’s annual average seasonally adjusted unemployment rate at the end of June was 3.2%. In 2022, the state had a per capita personal income of $58,279. Tennessee’s general obligation (G.O.) bonds were rated Aaa by Moody’s and AAA by Standard & Poor’s as of June 30, 2023
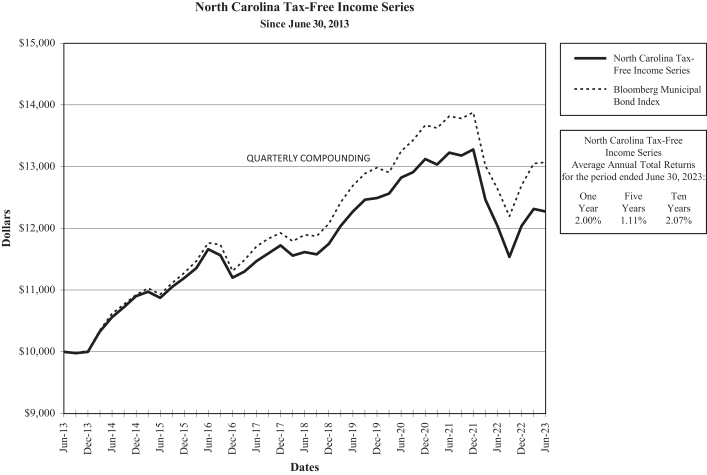
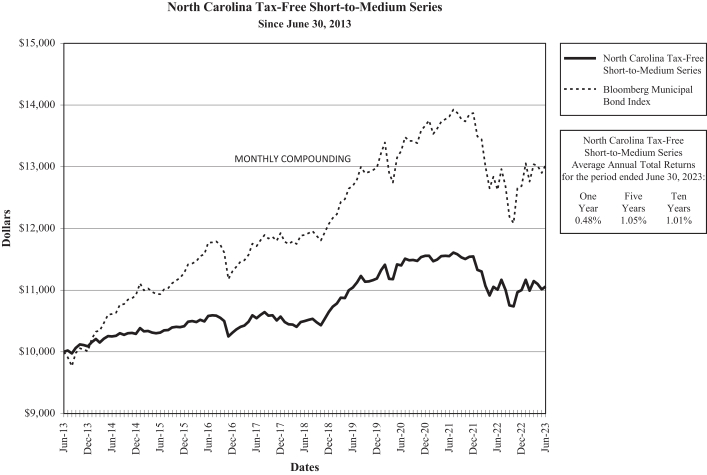
The North Carolina Tax-Free Income Series provided shareholders with a total return of 2.00% for the twelve month period ended June 30, 2023. The North Carolina Tax-Free Short-to-Medium Series provided shareholders with a total return of 0.48% for the same time period. Both the North Carolina Tax-Free Income Series and the North Carolina Tax-Free Short-to-Medium Series underperformed the BMBI during the reporting period due to the fact that both funds had shorter durations and higher credit qualities than the BMBI.
In 2022, North Carolina’s real GDP increased at a 3.2% annual rate; the 2021-2022 national growth rate was 2.1%. North Carolina’s 2022 current-dollar GDP was $730.0 billion. The state’s average annual seasonally adjusted unemployment rate at the end of June was 3.3%. In 2022, North Carolina had a per capita personal income of $57,416. North Carolina’s G.O. bonds were rated Aaa by Moody’s and AAA by Standard & Poor’s as of June 30, 2023.
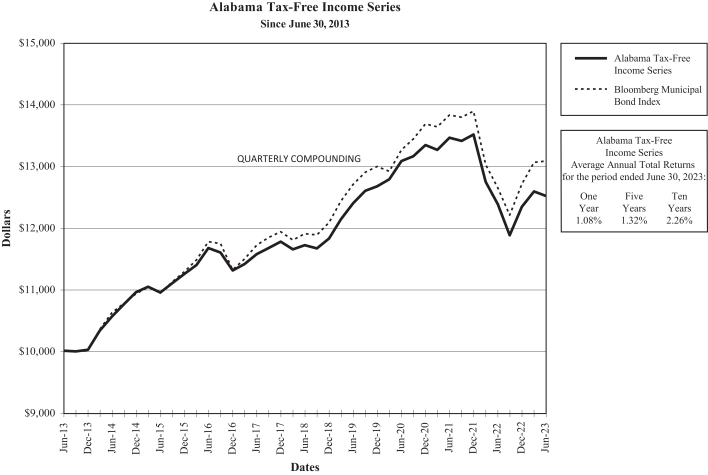
The Alabama Tax-Free Income Series provided shareholders with a total return of 1.08% for the twelve month period ended June 30, 2023. The Alabama Tax-Free Income Series underperformed the BMBI during the reporting period due to the fact that it had a shorter duration and higher credit quality than the BMBI.
In 2022, Alabama’s real GDP increased at a 1.6% annual rate; the 2021-2022 national growth rate was 2.1%. Alabama’s 2022 current-dollar GDP was $277.8 billion. The state’s average annual seasonally adjusted unemployment rate at the end of June was 2.2%. In 2022, Alabama had a per capita personal income of $50,637. Alabama’s G.O. bonds were rated Aa1 by Moody’s and AA by Standard & Poor’s as of June 30, 2023.
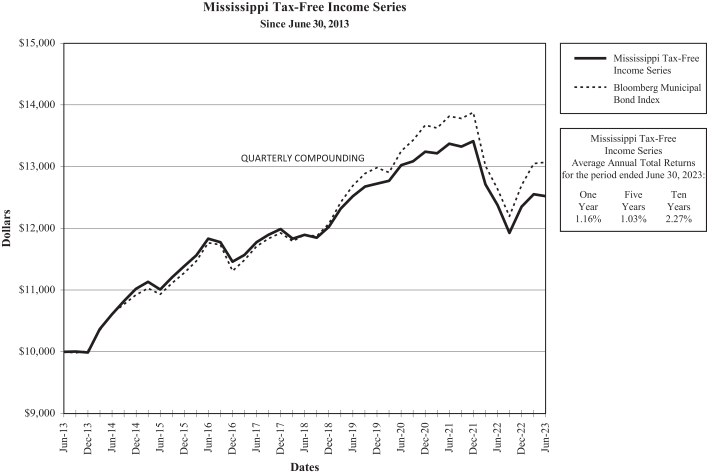
The Mississippi Tax-Free Income Series provided shareholders with a total return of 1.16% for the twelve month period ended June 30, 2023. The Mississippi Tax-Free Income Series underperformed the BMBI during the reporting period due to the fact that it had a shorter duration and higher credit quality than the BMBI.
In 2022, Mississippi’s real GDP increased at a 0.2% annual rate; the 2021-2022 national growth rate was 2.1%. Mississippi’s 2022 current-dollar GDP was $138.7 billion. The state’s average annual seasonally adjusted unemployment rate at the end of June was 3.1%. In 2022, Mississippi had a per capita personal income of $46,248. The state’s G.O. bonds were rated Aa2 by Moody’s and AA by Standard & Poor’s as of June 30, 2023
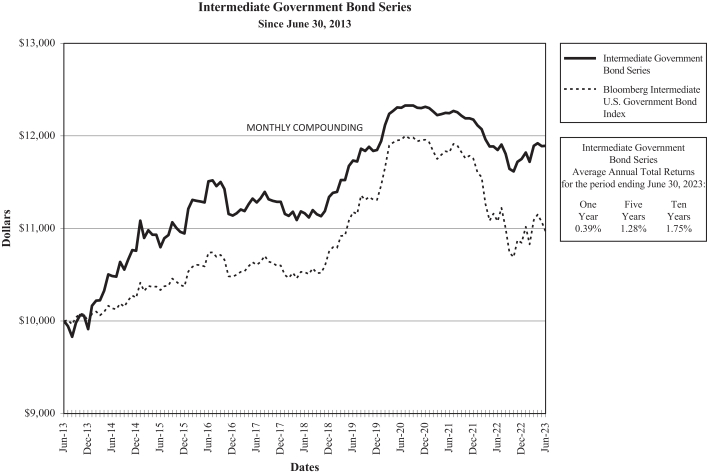
The Intermediate Government Bond Series provided shareholders with a total return of 0.39% for the twelve months ended June 30, 2023. The Bloomberg U.S. Intermediate Government Bond Index (BGBI) had a total return of -0.99% for the twelve month period ended June 30, 2023. Taxable yields increased during the reporting period causing bond prices to fall. The Intermediate Government Bond Series outperformed the BGBI due to the fact that it had a shorter duration than the index.
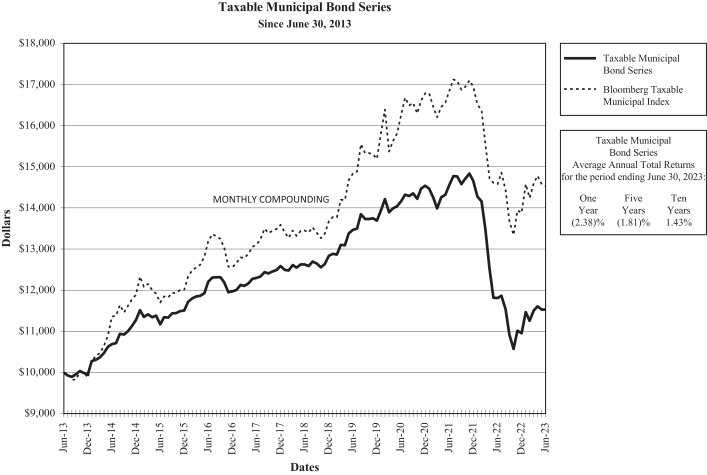
The Taxable Municipal Bond Series provided shareholders with a total return of -2.38% for the twelve month period ended June 30, 2023. The Bloomberg Municipal Bond Taxable Index (BTMI) had a total return of -0.295% for the same time period. Taxable municipal bonds typically track the performance of the U.S. Treasury market. Treasury yields increased during the reporting period, causing taxable municipal bond prices to fall. The Taxable Municipal Bond Series had a longer duration and nominal maturity than the BTMI which led to its underperformance during the reporting period.
Please note that index information is provided for reference only. No index can perfectly match the investments that make up a fund’s portfolio. In making investment decisions for our portfolios, we do not attempt to track indices. The Bloomberg Municipal Bond index is national in scope and does not necessarily reflect the performance of state-specific municipal bond funds. Indices do not take into account any operating expenses or transaction costs. An investment cannot be made directly in an index.
i Data are from the Bureau of Economic Analysis, the U.S. Department of Labor Bureau of Labor Statistics, and various other sources management deems to be reliable. Some of the quoted data are preliminary in nature and may be subject to revision. Any opinions expressed herein are those of the funds’ portfolio management and are current as of June 30, 2023. They are not guarantees of performance or investment results and should not be taken as investment advice. Past performance is not a guarantee of future performance and you may lose money investing in the funds.
ii
The illustrations below provide each Fund’s sector allocation and
summarize key information about each Fund’s investments as of June 30, 2023. | Unaudited |
| | | | |
| |
Alabama Tax-Free Income Series | |
| CREDIT QUALITY* | | % of Fair Value of
Investments Held | |
Aaa/AAA | | | 0.97% | |
Aa/AA | | | 95.47% | |
A | | | 1.47% | |
Not Rated | | | 2.09% | |
| | | | | |
| | | | 100.00% | |
| | | | | |
| | | | | |
| COMPOSITION | | | |
| | | % of Net Assets | |
Prerefunded | | | 25.49% | |
School Improvement | | | 21.40% | |
Public Facilities Revenue | | | 15.48% | |
University Consolidated Education and Building Revenue | | | 14.65% | |
Municipal Utility Revenue | | | 12.90% | |
Miscellaneous Public Improvement | | | 3.35% | |
Hospital and Healthcare Revenue | | | 2.64% | |
Refunding | | | 2.46% | |
Other Assets Less Liabilities | | | 1.63% | |
| | | | | |
| | | | 100.00% | |
| | | | | |
| | | | | |
| | | | | |
| | | | | |
| | | | | |
| | | | |
| |
Kentucky Tax-Free Income Series | |
| CREDIT QUALITY* | | % of Fair Value of
Investments Held | |
Aa/AA | | | 80.42% | |
A | | | 19.30% | |
Not Rated | | | 0.28% | |
| | | | | |
| | | | 100.00% | |
| | | | | |
| | | | | |
| | | | | |
| COMPOSITION | | | | |
| | | % of Net Assets | |
Miscellaneous Public Improvement | | | 35.31% | |
School Improvement | | | 20.63% | |
University Consolidated Education and Building Revenue | | | 12.90% | |
Municipal Utility Revenue | | | 8.11% | |
Prerefunded | | | 7.22% | |
Public Facilities Revenue | | | 5.52% | |
Hospital and Healthcare Revenue | | | 4.47% | |
Turnpikes/Toll Road/Highway Revenue | | | 2.77% | |
Refunding | | | 1.20% | |
Airport Revenue | | | 0.65% | |
Ad Valorem Property | | | 0.33% | |
Other Assets Less Liabilities | | | 0.89% | |
| | | | | |
| | | | 100.00% | |
| | | | | |
| | | | | |
| | | | |
| |
Kentucky Tax-Free Short-to-Medium Series | |
| CREDIT QUALITY* | | % of Fair Value of
Investments Held | |
Aa/AA | | | 61.15% | |
A | | | 37.63% | |
Not Rated | | | 1.22% | |
| | | | | |
| | | | 100.00% | |
| | | | | |
| | | | | |
| COMPOSITION | | | |
| | | % of Net Assets | |
Public Facilities Revenue | | | 17.70% | |
School Improvement | | | 17.11% | |
Miscellaneous Public Improvement | | | 12.06% | |
Turnpikes/Toll Road/Highway Revenue | | | 11.67% | |
University Consolidated Education and Building Revenue | | | 10.99% | |
Municipal Utility Revenue | | | 9.02% | |
Hospital and Healthcare Revenue | | | 7.64% | |
Prerefunded | | | 6.40% | |
Ad Valorem Property | | | 1.82% | |
Refunding | | | 1.58% | |
Airport Revenue | | | 1.41% | |
Other Assets Less Liabilities | | | 2.60% | |
| | | | | |
| | | | 100.00% | |
| | | | | |
| | | | | |
| | | | | |
| | | | |
| |
Mississippi Tax-Free Income Series | |
| CREDIT QUALITY* | | % of Fair Value of
Investments Held | |
Aaa/AAA | | | 7.12% | |
Aa/AA | | | 84.15% | |
A | | | 8.73% | |
| | | | | |
| | | | 100.00% | |
| | | | | |
| | | | | |
| COMPOSITION | | | |
| | | % of Net Assets | |
University Consolidated Education and Building Revenue | | | 32.76% | |
Prerefunded | | | 16.30% | |
Turnpikes/Toll Road/Highway Revenue | | | 9.27% | |
Miscellaneous Public Improvement | | | 7.73% | |
State and Local Mortgage/Housing Revenue | | | 6.95% | |
Refunding | | | 6.34% | |
School Improvement | | | 6.11% | |
Municipal Utility Revenue | | | 5.68% | |
Hospital and Healthcare Revenue | | | 5.26% | |
Public Facilities Revenue | | | 1.20% | |
Other Assets Less Liabilities | | | 2.40% | |
| | | | | |
| | | | 100.00% | |
| | | | | |
| | | | | |
| | | | | |
| | | | | |
iii
The illustrations below provide each Fund’s sector allocation and
summarize key information about each Fund’s investments as of June 30, 2023. | Unaudited |
| | | | |
| |
North Carolina Tax-Free Income Series | |
| CREDIT QUALITY * | | % of Fair Value of
Investments Held | |
Aaa/AAA | | | 6.07% | |
Aa/AA | | | 77.67% | |
A | | | 14.88% | |
Not Rated | | | 1.38% | |
| | | | | |
| | | | 100.00% | |
| | | | | |
| | | | | |
| COMPOSITION | | | |
| | | % of Net Assets | |
School Improvement | | | 20.20% | |
Public Facilities Revenue | | | 16.40% | |
Municipal Utility Revenue | | | 15.10% | |
University Consolidated Education and Building Revenue | | | 11.72% | |
Prerefunded | | | 10.60% | |
Hospital and Healthcare Revenue | | | 7.05% | |
Refunding | | | 6.38% | |
Miscellaneous Public Improvement | | | 4.08% | |
Airport Revenue | | | 3.73% | |
Turnpikes/Toll Road/Highway Revenue | | | 3.37% | |
State and Local Mortgage/Housing Revenue | | | 0.31% | |
Other Assets Less Liabilities | | | 1.06% | |
| | | | | |
| | | | 100.00% | |
| | | | | |
| | | | | |
| | | | | |
| | | | | |
| | | | |
| |
North Carolina Tax-Free Short-to-Medium Series | |
| CREDIT QUALITY * | | % of Fair Value of
Investments Held | |
Aaa/AAA | | | 9.72% | |
Aa/AA | | | 57.63% | |
A | | | 31.14% | |
Not Rated | | | 1.51% | |
| | | | | |
| | | | 100.00% | |
| | | | | |
| | | | | |
| COMPOSITION | | | |
| | | % of Net Assets | |
University Consolidated Education and Building Revenue | | | 29.57% | |
School Improvement | | | 13.48% | |
Municipal Utility Revenue | | | 12.17% | |
Refunding | | | 8.60% | |
Turnpikes/Toll Road/Highway Revenue | | | 8.26% | |
Miscellaneous Public Improvement | | | 7.59% | |
Public Facilities Revenue | | | 7.13% | |
Hospital and Healthcare Revenue | | | 3.73% | |
Prerefunded | | | 3.13% | |
Ad Valorem Property | | | 1.18% | |
Lease Revenue | | | 1.00% | |
Airport Revenue | | | 0.77% | |
Other Assets Less Liabilities | | | 3.39% | |
| | | | | |
| | | | 100.00% | |
| | | | | |
| | | | | |
| | | | | |
| | | | |
| |
Tennessee Tax-Free Income Series | |
| CREDIT QUALITY* | | % of Fair Value of
Investments Held | |
Aaa/AAA | | | 4.36% | |
Aa/AA | | | 80.18% | |
A | | | 15.46% | |
| | | | | |
| | | | 100.00% | |
| | | | | |
| | | | | |
| COMPOSITION | | | |
| | | % of Net Assets | |
Municipal Utility Revenue | | | 30.72% | |
Prerefunded | | | 16.34% | |
School Improvement | | | 12.75% | |
Hospital and Healthcare Revenue | | | 10.25% | |
Miscellaneous Public Improvement | | | 8.86% | |
Public Facilities Revenue | | | 5.07% | |
University Consolidated Education and Building Revenue | | | 4.43% | |
Refunding | | | 3.89% | |
Airport Revenue | | | 3.59% | |
State and Local Mortgage/Housing Revenue | | | 2.50% | |
Other Assets Less Liabilities | | | 1.60% | |
| | | | | |
| | | | 100.00% | |
| | | | | |
| | | | | |
| | | | | |
| | | | |
| |
Tennessee Tax-Free Short-to-Medium Series | |
| CREDIT QUALITY* | | % of Fair Value of
Investments Held | |
Aa/AA | | | 90.69% | |
A | | | 9.31% | |
| | | | | |
| | | | 100.00% | |
| | | | | |
| | | | | |
| | | | | |
| COMPOSITION | | | |
| | | % of Net Assets | |
Refunding | | | 36.17% | |
Municipal Utility Revenue | | | 21.32% | |
School Improvement | | | 14.19% | |
University Consolidated Education and Building Revenue | | | 8.98% | |
Prerefunded | | | 7.90% | |
Public Facilities Revenue | | | 6.97% | |
Miscellaneous Public Improvement | | | 0.96% | |
Other Assets Less Liabilities | | | 3.51% | |
| | | | | |
| | | | 100.00% | |
| | | | | |
| | | | | |
| | | | | |
| | | | | |
| | | | | |
| | | | | |
iv
The illustrations below provide each Fund’s sector allocation and
summarize key information about each Fund’s investments as of June 30, 2023. | Unaudited |
| | | | |
| |
Intermediate Government Bond Series | |
| CREDIT QUALITY* | | % of Fair Value of
Investments Held | |
Aaa/AAA | | | 100.00% | |
| | | | | |
| | | | | |
| | | | | |
| | | | | |
| | | | | |
| COMPOSITION | | | |
| | | % of Net Assets | |
Federal Home Loan Bank | | | 66.47% | |
Federal Home Loan Mortgage Corporation | | | 24.17% | |
Federal Farm Credit | | | 6.89% | |
Other Assets Less Liabilities | | | 2.47% | |
| | | | | |
| | | | 100.00% | |
| | | | | |
| | | | | |
| | | | | |
| | | | | |
| | | | | |
| | | | | |
| | | | | |
| | | | | |
| | | | | |
| | | | | |
| | | | | |
| | | | |
| |
Taxable Municipal Bond Series | |
| CREDIT QUALITY* | | % of Fair Value of
Investments Held | |
Aa/AA | | | 91.00% | |
A | | | 8.39% | |
Not Rated | | | 0.61% | |
| | | | | |
| | | | 100.00% | |
| | | | | |
| | | | |
| COMPOSITION | | | |
| | | | % of Net Assets | |
Municipal Utility Revenue | | | 22.18% | |
Public Facilities Revenue | | | 16.24% | |
University Consolidated Education and Building Revenue | | | 15.11% | |
Turnpikes/Toll Road/Highway Revenue | | | 8.39% | |
State and Local Mortgage/Housing Revenue | | | 7.94% | |
Miscellaneous Public Improvement | | | 6.16% | |
School Improvement | | | 6.00% | |
Marina/Port Authority Revenue | | | 5.83% | |
Hospital and Healthcare Revenue | | | 5.08% | |
Airport Revenue | | | 2.06% | |
Prerefunded | | | 0.58% | |
Other Assets Less Liabilities | | | 4.43% | |
| | | | | |
| | | | 100.00% | |
| | | | | |
| | | | | |
| | | | | |
| * | Ratings by Moody’s Investors Services, Inc. unless noted otherwise. See Schedules of Portfolio Investments for individual bond ratings. |
v
PERFORMANCE COMPARISON (Unaudited)
The following graphs compare the change in value of a $10,000 investment in each series of Dupree Mutual Funds with the change in value of a $10,000 investment in a comparable index. The comparisons are made over 10 years or since the inception of the series, if shorter than ten years. Results are for the fiscal years ended June 30.
PERFORMANCE DISCLOSURES
Past performance is not indicative of future results. The current performance may be lower or higher than the performance data quoted. The investment return and principal value of an investment will fluctuate so that an investor’s shares, when redeemed, may be worth more or less than the original cost.
The performance tables and the graphs above do not reflect the deduction of taxes that a shareholder would pay on fund distributions or the redemption of fund shares.
For performance data current to the most recent month-end call 800-866-0614 or visit our website at www.dupree-funds.com.
Notes on Graphs:
Results reflect reinvestment of all dividend and capital gain distributions. No index can perfectly match the investments that make up a fund’s portfolio. For each series, we have selected an index that we believe gives the most accurate picture of how the series performed during the reporting period. The investor should understand that an index is a mathematical hypothesis and does not reflect a real market situation. For example, the portfolio of each index is replaced with an entirely different portfolio each year without reflecting operating expenses or transaction costs. On the other hand, the fund’s performance reflects not only these factors but management costs as well.
vi
vii
viii
ix
x
xi
xii
xiii
xiv
xv
xvi
DUPREE MUTUAL FUNDS — ALABAMA TAX-FREE INCOME SERIES
SCHEDULE OF PORTFOLIO INVESTMENTS
Alabama Municipal Bonds
June 30, 2023
| | | | | | | | | | | | | | | | | | |
| Bond Description | | Coupon | | | Maturity
Date | | | Rating# | | Par Value | | | Fair Value | |
| PREREFUNDED BONDS | | | | | | | | | | | | | | | | | | |
| 25.49% of Net Assets | | | | | | | | | | | | | | | | | | |
Alabaster AL Board of Education Special Tax Warrants** | | | 5.000 | % | | | 09/01/2039 | | | A1 | | $ | 600,000 | | | $ | 612,412 | |
Auburn AL Waterworks Board Water Revenue | | | 5.000 | | | | 09/01/2036 | | | Aa2 | | | 250,000 | | | | 259,828 | |
Decatur City AL Board of Education Special Tax | | | 5.000 | | | | 02/01/2040 | | | Aa2 | | | 225,000 | | | | 231,597 | |
Jasper AL Warrants | | | 5.000 | | | | 03/01/2031 | | | A2 | | | 250,000 | | | | 252,995 | |
Jasper AL Warrants | | | 5.000 | | | | 03/01/2032 | | | A2 | | | 450,000 | | | | 455,391 | |
Limestone County AL Water & Sewer Authority | | | 4.750 | | | | 12/01/2033 | | | AA* | | | 290,000 | | | | 308,409 | |
Limestone County AL Water & Sewer Authority | | | 5.000 | | | | 12/01/2034 | | | AA-* | | | 250,000 | | | | 251,808 | |
Madison AL Warrants | | | 5.000 | | | | 04/01/2035 | | | Aa3 | | | 350,000 | | | | 361,669 | |
Northport AL Warrants** | | | 5.000 | | | | 08/01/2040 | | | AA* | | | 735,000 | | | | 749,781 | |
Trussville AL Warrants | | | 5.000 | | | | 10/01/2039 | | | NR | | | 445,000 | | | | 446,860 | |
Trussville AL Warrants** | | | 5.000 | | | | 10/01/2039 | | | Aa2 | | | 775,000 | | | | 778,441 | |
Tuscaloosa AL Warrants | | | 5.000 | | | | 07/01/2034 | | | Aa1 | | | 300,000 | | | | 305,676 | |
Tuscaloosa County AL Board of Education Special Tax School Warrants | | | 5.000 | | | | 02/01/2036 | | | Aa3 | | | 250,000 | | | | 269,168 | |
Tuscaloosa County AL Board of Education Special Tax School Warrants | | | 5.000 | | | | 02/01/2037 | | | Aa3 | | | 250,000 | | | | 269,168 | |
| | | | | | | | | | | | | | | | | | |
| | | | | | | | | | | | | | | | | 5,553,203 | |
| SCHOOL IMPROVEMENT BONDS | | | | | | | | | | | | | | | | | | |
| 21.40% of Net Assets | | | | | | | | | | | | | | | | | | |
Athens AL Warrants | | | 3.000 | | | | 05/01/2041 | | | Aa3 | | | 125,000 | | | | 103,660 | |
Bibb County AL Board of Education Special Tax | | | 4.000 | | | | 04/01/2032 | | | AA* | | | 380,000 | | | | 392,013 | |
Cherokee County AL Board of Education Tax Warrants | | | 4.000 | | | | 12/01/2034 | | | A1 | | | 310,000 | | | | 315,437 | |
Cherokee County AL Board of Education Tax Warrants | | | 4.250 | | | | 12/01/2042 | | | A1 | | | 150,000 | | | | 151,662 | |
Elmore County AL Board of Education | | | 4.000 | | | | 08/01/2038 | | | Aa3 | | | 250,000 | | | | 250,128 | |
Florence AL City Board of Education Special Tax School Warrants | | | 4.000 | | | | 03/01/2046 | | | Aa3 | | | 225,000 | | | | 213,089 | |
Guntersville AL Warrants | | | 3.000 | | | | 08/01/2040 | | | AA-* | | | 250,000 | | | | 208,530 | |
Houston County AL Board of Education Special Tax School Warrants | | | 3.000 | | | | 12/01/2037 | | | AA* | | | 250,000 | | | | 216,808 | |
Jackson County AL Board of Education School Tax Warrants | | | 3.000 | | | | 03/01/2038 | | | AA* | | | 350,000 | | | | 303,289 | |
Jefferson County AL Board of Education Public School Warrants | | | 4.000 | | | | 02/01/2042 | | | A1 | | | 325,000 | | | | 316,251 | |
Jefferson County AL Public Schools | | | 4.000 | | | | 02/01/2038 | | | A1 | | | 165,000 | | | | 164,815 | |
Madison AL Board of Education Special Tax School Warrants | | | 4.000 | | | | 02/01/2041 | | | Aa3 | | | 370,000 | | | | 364,927 | |
Marshall County AL Board of Education Special Tax School Warrants | | | 4.000 | | | | 03/01/2033 | | | A1 | | | 250,000 | | | | 252,768 | |
Mountain Brook AL City Board of Education | | | 3.000 | | | | 03/01/2042 | | | Aa1 | | | 250,000 | | | | 208,850 | |
Oxford AL Board of Education School Tax Warrants | | | 4.000 | | | | 05/01/2045 | | | Aa3 | | | 350,000 | | | | 333,778 | |
Pell City AL Warrants | | | 4.500 | | | | 02/01/2042 | | | AA* | | | 200,000 | | | | 203,270 | |
Pike Road AL Warrants | | | 5.000 | | | | 03/01/2043 | | | AA+* | | | 250,000 | | | | 276,848 | |
Saint Clair AL Board of Education Special Tax School Warrants | | | 5.000 | | | | 02/01/2040 | | | A1 | | | 125,000 | | | | 136,533 | |
Saint Clair County AL Board of Education Special Tax Warrants | | | 3.000 | | | | 02/01/2038 | | | A1 | | | 250,000 | | | | 217,273 | |
Troy AL Public Educational Building Authority | | | 5.250 | | | | 12/01/2036 | | | A1 | | | 30,000 | | | | 30,008 | |
| | | | | | | | | | | | | | | | | | |
| | | | | | | | | | | | | | | | | 4,659,937 | |
| PUBLIC FACILITIES REVENUE BONDS | | | | | | | | | | | | | | | | | | |
| 15.48% of Net Assets | | | | | | | | | | | | | | | | | | |
Adamsville AL Warrants | | | 3.000 | | | | 09/01/2045 | | | AA* | | | 250,000 | | | | 206,353 | |
AL State Corrections Institution Finance Authority | | | 5.000 | | | | 07/01/2042 | | | Aa2 | | | 350,000 | | | | 376,241 | |
Anniston AL Public Building Authority DHR Project | | | 5.250 | | | | 05/01/2030 | | | AA-* | | | 50,000 | | | | 50,057 | |
Anniston AL Public Building Authority DHR Project | | | 5.500 | | | | 05/01/2033 | | | AA-* | | | 200,000 | | | | 200,158 | |
Bessemer AL Public Educational Building Authority Revenue | | | 5.000 | | | | 07/01/2030 | | | AA* | | | 140,000 | | | | 140,080 | |
Birmingham Jefferson AL Civic Center Authority Revenue | | | 5.000 | | | | 05/01/2037 | | | Aa3 | | | 500,000 | | | | 533,310 | |
Birmingham Jefferson AL Civic Center Authority Revenue | | | 5.000 | | | | 05/01/2038 | | | Aa3 | | | 250,000 | | | | 265,510 | |
Boaz AL Warrants | | | 4.000 | | | | 02/01/2037 | | | AA* | | | 250,000 | | | | 251,138 | |
Bullock County AL Public Building Authority | | | 4.000 | | | | 10/01/2038 | | | AA-* | | | 500,000 | | | | 505,760 | |
Montgomery County AL Public Building Authority | | | 5.000 | | | | 03/01/2036 | | | Aa2 | | | 350,000 | | | | 375,641 | |
Phenix City AL Public Building Authority | | | 4.000 | | | | 10/01/2035 | | | AA-* | | | 100,000 | | | | 102,217 | |
Phenix City AL Public Building Authority | | | 4.000 | | | | 10/01/2037 | | | AA-* | | | 120,000 | | | | 120,853 | |
Saint Clair County AL Public Building Authority | | | 4.000 | | | | 02/01/2041 | | | AA-* | | | 250,000 | | | | 244,733 | |
| | | | | | | | | | | | | | | | | | |
| | | | | | | | | | | | | | | | | 3,372,051 | |
The accompanying footnotes are an integral part of the financial statements.
1
DUPREE MUTUAL FUNDS — ALABAMA TAX-FREE INCOME SERIES
SCHEDULE OF PORTFOLIO INVESTMENTS
Alabama Municipal Bonds
June 30, 2023
| | | | | | | | | | | | | | | | | | |
| Bond Description | | Coupon | | | Maturity
Date | | | Rating# | | Par Value | | | Fair Value | |
| UNIVERSITY CONSOLIDATED EDUCATION AND BUILDING REVENUE BONDS | |
| 14.65% of Net Assets | | | | | | | | | | | | | | | | | | |
AL Community College System Gadsden State Community College | | | 5.000 | % | | | 06/01/2038 | | | A1 | | $ | 325,000 | | | $ | 346,574 | |
AL State Public School & College Authority | | | 4.000 | | | | 11/01/2040 | | | Aa1 | | | 250,000 | | | | 250,463 | |
Auburn University AL General Fee Revenue | | | 4.000 | | | | 06/01/2036 | | | Aa2 | | | 380,000 | | | | 384,798 | |
Troy University AL Facilities Revenue | | | 5.000 | | | | 11/01/2028 | | | A1 | | | 250,000 | | | | 256,825 | |
Troy University AL Facilities Revenue | | | 4.000 | | | | 11/01/2032 | | | A1 | | | 300,000 | | | | 310,866 | |
Troy University AL Facilities Revenue | | | 5.000 | | | | 11/01/2037 | | | A1 | | | 200,000 | | | | 210,646 | |
University of AL General Fee Revenue | | | 5.000 | | | | 09/01/2037 | | | Aa3 | | | 250,000 | | | | 268,690 | |
University of AL Huntsville General Fee Revenue | | | 5.000 | | | | 09/01/2038 | | | Aa3 | | | 435,000 | | | | 465,572 | |
University of AL Huntsville General Fee Revenue | | | 5.000 | | | | 09/01/2038 | | | Aa3 | | | 500,000 | | | | 538,595 | |
University of South AL | | | 5.000 | | | | 04/01/2044 | | | A1 | | | 150,000 | | | | 157,004 | |
| | | | | | | | | | | | | | | | | | |
| | | | | | | | | | | | | | | | | 3,190,033 | |
| MUNICIPAL UTILITY REVENUE BONDS | | | | | | | | | | | | | | | | | | |
| 12.90% of Net Assets | | | | | | | | | | | | | | | | | | |
Athens AL Water & Sewer | | | 4.000 | | | | 05/01/2039 | | | A1 | | | 200,000 | | | | 199,992 | |
Athens AL Water & Sewer | | | 4.000 | | | | 05/01/2040 | | | A1 | | | 100,000 | | | | 99,631 | |
Berry AL Water & Sewer Revenue | | | 4.000 | | | | 09/01/2039 | | | AA* | | | 250,000 | | | | 251,320 | |
Birmingham AL Waterworks | | | 4.000 | | | | 01/01/2037 | | | Aa2 | | | 250,000 | | | | 252,280 | |
Birmingham AL Waterworks | | | 4.000 | | | | 01/01/2041 | | | Aa2 | | | 225,000 | | | | 220,556 | |
Limestone County AL Water & Sewer Authority | | | 4.750 | | | | 12/01/2035 | | | AA* | | | 400,000 | | | | 408,247 | |
Opelika AL Utilities Board | | | 4.000 | | | | 06/01/2039 | | | Aa3 | | | 250,000 | | | | 248,538 | |
Prattville AL Sewer Warrants | | | 4.000 | | | | 11/01/2042 | | | AA-* | | | 375,000 | | | | 364,635 | |
Scottsboro AL Waterworks Sewer & Gas | | | 4.000 | | | | 08/01/2040 | | | AA* | | | 150,000 | | | | 148,166 | |
Talladega AL Water & Sewer Revenue | | | 3.000 | | | | 09/01/2046 | | | AA* | | | 250,000 | | | | 188,925 | |
Tuskegee AL Utilities Board | | | 3.000 | | | | 08/01/2037 | | | A1 | | | 260,000 | | | | 234,291 | |
Warrior River AL Water Authority | | | 4.000 | | | | 08/01/2043 | | | AA* | | | 200,000 | | | | 192,238 | |
| | | | | | | | | | | | | | | | | | |
| | | | | | | | | | | | | | | | | 2,808,819 | |
| MISCELLANEOUS PUBLIC IMPROVEMENT BONDS | | | | | | | | | | | | | | | | | | |
| 3.35% of Net Assets | | | | | | | | | | | | | | | | | | |
Arab AL | | | 3.000 | | | | 12/01/2041 | | | AA* | | | 250,000 | | | | 206,968 | |
Birmingham AL Warrants | | | 4.000 | | | | 12/01/2035 | | | Aa3 | | | 250,000 | | | | 255,597 | |
Birmingham AL Warrants | | | 5.000 | | | | 12/01/2037 | | | Aa3 | | | 250,000 | | | | 266,455 | |
| | | | | | | | | | | | | | | | | | |
| | | | | | | | | | | | | | | | | 729,020 | |
| HOSPITAL AND HEALTHCARE REVENUE BONDS | | | | | | | | | | | | | | | | | | |
| 2.64% of Net Assets | | | | | | | | | | | | | | | | | | |
Chilton County AL Health Care Authority Chilton County Hospital** | | | 5.000 | | | | 11/01/2035 | | | AA-@ | | | 550,000 | | | | 575,377 | |
| | | | | | | | | | | | | | | | | | |
| REFUNDING BONDS | |
| 2.46% of Net Assets | | | | | | | | | | | | | | | | | | |
Montgomery AL Warrants | | | 5.000 | | | | 06/15/2035 | | | A1 | | | 500,000 | | | | 535,610 | |
| | | | | | | | | | | | | | | | | | |
Total Investments 98.37% of Net Assets (cost $22,374,738) (See footnote 6 for further explanation) | | | | | | | | | $ | 21,424,050 | |
| | | | | | | | | | | | | | | | | | |
Other assets in excess of liabilities 1.63% | | | | | | | | | | 355,843 | |
| | | | | | | | | | | | | | | | | | |
Net Assets 100% | | | | | | | | | | | | | | | | $ | 21,779,893 | |
| | | | | | | | | | | | | | | | | | |
| | # | | Ratings by Moody’s Investors Service unless noted otherwise. |
| | | | Bond ratings are unaudited and not covered by Report of Independent Registered Public Accounting Firm. |
| | | | All ratings are as of the date indicated and do not reflect subsequent changes. |
| | * | | Rated by Standard & Poor’s Corporation |
| | @ | | Rated by Fitch’s Investors Service |
| | ** | | Security is segregated against line of credit — see footnote 7 |
The accompanying footnotes are an integral part of the financial statements.
2
DUPREE MUTUAL FUNDS — ALABAMA TAX-FREE INCOME SERIES
SCHEDULE OF PORTFOLIO INVESTMENTS
Alabama Municipal Bonds
June 30, 2023
Other Information
The following is a summary of the inputs used, as of June 30, 2023, involving the Fund’s investments in securities carried at fair value. The inputs or methodology used for valuing securities may not be an indication of the risk associated with investing in those securities. For more information on valuation inputs, and their aggregation into the levels used in the table below, please refer to the Security Valuation section in the accompanying Notes to Financial Statements.
| | | | | | |
| | | Valuation Inputs | | Municipal Bonds | |
Level 1 | | Quoted Prices | | $ | — | |
Level 2 | | Other Significant Observable Inputs | | | 21,424,050 | |
Level 3 | | Significant Unobservable Inputs | | | — | |
| | | | | | |
| | | | $ | 21,424,050 | |
| | | | | | |
The accompanying footnotes are an integral part of the financial statements.
3
ALABAMA TAX-FREE INCOME SERIES
STATEMENT OF ASSETS AND LIABILITIES
June 30, 2023
| | | | | | | | |
ASSETS: | | | | | | | | |
Investments in securities, at fair value (Cost: $22,374,738) | | | | | | $ | 21,424,050 | |
Cash | | | | | | | 258,977 | |
Interest receivable | | | | | | | 251,508 | |
| | | | | | | | |
Total assets | | | | | | | 21,934,535 | |
LIABILITIES: | | | | | | | | |
Payable for: | | | | | | | | |
Distributions to shareholders | | | 77,328 | | | | | |
Fund shares redeemed | | | 36,637 | | | | | |
Investment advisory fee | | | 2,396 | | | | | |
Transfer agent fee | | | 6,562 | | | | | |
Printing expense | | | 10,554 | | | | | |
Registration fees | | | 5,124 | | | | | |
Professional fees | | | 4,388 | | | | | |
Audit fees | | | 4,117 | | | | | |
Trustees fees | | | 2,057 | | | | | |
Custodian fee | | | 906 | | | | | |
Accrued expenses | | | 4,573 | | | | | |
| | | | | | | | |
Total liabilities | | | | | | | 154,642 | |
| | | | | | | | |
NET ASSETS: | | | | | | | | |
Paid-in capital | | | | | | | 23,038,936 | |
Total accumulated loss | | | | | | | (1,259,043 | ) |
| | | | | | | | |
Total Net Assets | | | | | | $ | 21,779,893 | |
| | | | | | | | |
NET ASSET VALUE, offering price and redemption price per share
(1,909,846 shares outstanding; unlimited number of shares authorized; no par value) | | | | | | $ | 11.40 | |
| | | | | | | | |
STATEMENT OF OPERATIONS
For the year ended June 30, 2023
| | | | |
Net investment income: | | | | |
Interest income | | $ | 745,184 | |
| | | | |
Expenses: | | | | |
Investment advisory fee | | | 116,896 | |
Transfer agent fee | | | 34,055 | |
Registration fees | | | 14,847 | |
Custodian fee | | | 8,776 | |
Pricing fees | | | 7,665 | |
Compliance fees | | | 7,200 | |
Professional fees | | | 7,046 | |
Trustees fees | | | 3,408 | |
Other expenses | | | 16,607 | |
| | | | |
Total expenses | | | 216,500 | |
Fees waived by Adviser (Note 2) | | | (52,673 | ) |
Custodian fee reduction (Note 7) | | | (23 | ) |
| | | | |
Net expenses | | | 163,804 | |
| | | | |
Net investment income | | | 581,380 | |
| | | | |
Realized and unrealized loss on investments: | | | | |
Net realized loss | | | (308,354 | ) |
Net change in unrealized appreciation/depreciation | | | (66,438 | ) |
| | | | |
Net realized and unrealized loss on investments | | | (374,792 | ) |
| | | | |
Net increase in net assets resulting from operations | | $ | 206,588 | |
| | | | |
The accompanying footnotes are an integral part of the financial statements.
4
ALABAMA TAX-FREE INCOME SERIES
STATEMENTS OF CHANGES IN NET ASSETS
For the years ended June 30, 2023 and 2022
| | | | | | | | |
| | | 2023 | | | 2022 | |
Operations: | | | | | | | | |
Net investment income | | $ | 581,380 | | | $ | 606,402 | |
Net realized gain/(loss) on investments | | | (308,354 | ) | | | 13,595 | |
Net change in unrealized appreciation/depreciation | | | (66,438 | ) | | | (2,883,506 | ) |
| | | | | | | | |
Net increase/(decrease) in net assets resulting from operations | | | 206,588 | | | | (2,263,509 | ) |
Total distributions (Note 6) | | | (594,975 | ) | | | (608,060 | ) |
Net Fund share transactions (Note 4) | | | (3,592,740 | ) | | | 423,477 | |
| | | | | | | | |
Total decrease | | | (3,981,127 | ) | | | (2,448,092 | ) |
Net assets: | | | | | | | | |
Beginning of year | | | 25,761,020 | | | | 28,209,112 | |
| | | | | | | | |
End of year | | $ | 21,779,893 | | | $ | 25,761,020 | |
| | | | | | | | |
FINANCIAL HIGHLIGHTS
| | | | | | | | | | | | | | | | | | | | |
| Selected data for a share outstanding: | | For the years ended June 30, | |
| | | 2023 | | | 2022 | | | 2021 | | | 2020 | | | 2019 | |
Net asset value, beginning of year | | $ | 11.57 | | | $ | 12.86 | | | $ | 12.78 | | | $ | 12.43 | | | $ | 12.08 | |
| | | | | | | | | | | | | | | | | | | | |
Income from investment operations: | | | | | | | | | | | | | | | | | | | | |
Net investment income | | | 0.28 | | | | 0.27 | | | | 0.29 | | | | 0.33 | | | | 0.34 | |
Net gains/(losses) on investments (c) | | | (0.16 | ) | | | (1.29 | ) | | | 0.08 | | | | 0.35 | | | | 0.35 | |
| | | | | | | | | | | | | | | | | | | | |
Total from investment operations | | | 0.12 | | | | (1.02 | ) | | | 0.37 | | | | 0.68 | | | | 0.69 | |
Less distributions: | | | | | | | | | | | | | | | | | | | | |
Distributions from net investment income | | | (0.28 | ) | | | (0.27 | ) | | | (0.29 | ) | | | (0.33 | ) | | | (0.34 | ) |
Distributions from capital gains | | | (0.01 | ) | | | 0.00 | (b) | | | 0.00 | | | | 0.00 | | | | 0.00 | |
| | | | | | | | | | | | | | | | | | | | |
Total distributions | | | (0.29 | ) | | | (0.27 | ) | | | (0.29 | ) | | | (0.33 | ) | | | (0.34 | ) |
| | | | | | | | | | | | | | | | | | | | |
Net asset value, end of year | | $ | 11.40 | | | $ | 11.57 | | | $ | 12.86 | | | $ | 12.78 | | | $ | 12.43 | |
| | | | | | | | | | | | | | | | | | | | |
Total return | | | 1.08% | | | | (8.03)% | | | | 2.93% | | | | 5.49% | | | | 5.80% | |
Net assets, end of year (in thousands) | | $ | 21,780 | | | $ | 25,761 | | | $ | 28,209 | | | $ | 27,354 | | | $ | 26,154 | |
Ratio of net expenses to average net assets (a) | | | 0.70% | | | | 0.70% | | | | 0.70% | | | | 0.70% | | | | 0.70% | |
Ratio of gross expenses to average net assets | | | 0.93% | | | | 0.87% | | | | 0.80% | | | | 0.82% | | | | 0.84% | |
Ratio of net investment income to average net assets | | | 2.49% | | | | 2.19% | | | | 2.26% | | | | 2.58% | | | | 2.79% | |
Portfolio turnover | | | 4.46% | | | | 2.55% | | | | 13.38% | | | | 6.98% | | | | 16.54% | |
| (a) | | Percentages are after expense waivers and reductions by the Adviser and Custodian. The Adviser and Custodian have agreed not to seek recovery of these waivers and reductions. |
| (b) | | Rounds to less than $0.01. |
| (c) | | Realized and unrealized gains and losses per share in this caption may be balancing amounts necessary to reconcile the change in net asset value per share for the period, and may not reconcile with the Fund’s statement of operations due to share transactions for the period. |
The accompanying footnotes are an integral part of the financial statements.
5
DUPREE MUTUAL FUNDS — KENTUCKY TAX-FREE INCOME SERIES
SCHEDULE OF PORTFOLIO INVESTMENTS
Kentucky Municipal Bonds
June 30, 2023
| | | | | | | | | | | | | | | | | | |
| Bond Description | | Coupon | | | Maturity
Date | | | Rating# | | Par Value | | | Fair Value | |
| MISCELLANEOUS PUBLIC IMPROVEMENT BONDS | | | | | | | | | | | |
| 35.31% of Net Assets | | | | | | | | | | | | | | | | | | |
KY Association of Counties | | | 4.000 | % | | | 02/01/2029 | | | AA-* | | $ | 240,000 | | | $ | 249,869 | |
KY Association of Counties | | | 5.000 | | | | 02/01/2030 | | | AA-* | | | 385,000 | | | | 424,740 | |
KY Association of Counties | | | 5.000 | | | | 02/01/2031 | | | AA-* | | | 255,000 | | | | 280,906 | |
KY Association of Counties | | | 4.000 | | | | 02/01/2033 | | | AA-* | | | 420,000 | | | | 428,921 | |
KY Association of Counties | | | 4.000 | | | | 02/01/2034 | | | AA-* | | | 435,000 | | | | 443,983 | |
KY Association of Counties | | | 4.000 | | | | 02/01/2035 | | | AA-* | | | 690,000 | | | | 703,897 | |
KY Association of Counties | | | 4.000 | | | | 02/01/2035 | | | AA-* | | | 460,000 | | | | 468,551 | |
KY Association of Counties | | | 4.500 | | | | 02/01/2036 | | | AA-* | | | 445,000 | | | | 471,642 | |
KY Association of Counties | | | 4.000 | | | | 02/01/2037 | | | AA-* | | | 745,000 | | | | 749,634 | |
KY Association of Counties | | | 4.500 | | | | 02/01/2037 | | | AA-* | | | 460,000 | | | | 482,356 | |
KY Association of Counties | | | 4.000 | | | | 02/01/2038 | | | AA-* | | | 3,165,000 | | | | 3,167,532 | |
KY Association of Counties | | | 4.000 | | | | 02/01/2038 | | | AA-* | | | 1,045,000 | | | | 1,038,124 | |
KY Association of Counties | | | 4.500 | | | | 02/01/2038 | | | AA-* | | | 490,000 | | | | 508,723 | |
KY Association of Counties | | | 4.000 | | | | 02/01/2039 | | | AA-* | | | 1,000,000 | | | | 990,810 | |
KY Association of Counties | | | 4.500 | | | | 02/01/2039 | | | AA-* | | | 515,000 | | | | 531,650 | |
KY Association of Counties | | | 5.000 | | | | 02/01/2039 | | | AA-* | | | 550,000 | | | | 601,667 | |
KY Association of Counties | | | 4.500 | | | | 02/01/2040 | | | AA-* | | | 535,000 | | | | 549,948 | |
KY Association of Counties | | | 4.500 | | | | 02/01/2041 | | | AA-* | | | 565,000 | | | | 578,735 | |
KY Association of Counties | | | 3.500 | | | | 02/01/2042 | | | AA-* | | | 1,215,000 | | | | 1,098,688 | |
KY Association of Counties | | | 4.500 | | | | 02/01/2042 | | | AA-* | | | 1,050,000 | | | | 1,069,446 | |
KY Association of Counties | | | 4.500 | | | | 02/01/2043 | | | AA-* | | | 1,455,000 | | | | 1,482,194 | |
KY Association of Counties | | | 4.000 | | | | 02/01/2048 | | | AA-* | | | 920,000 | | | | 859,768 | |
KY Bond Corporation Finance Program | | | 3.000 | | | | 02/01/2032 | | | AA-* | | | 550,000 | | | | 530,937 | |
KY Bond Corporation Finance Program | | | 3.000 | | | | 02/01/2033 | | | AA-* | | | 1,010,000 | | | | 966,762 | |
KY Bond Corporation Finance Program | | | 3.000 | | | | 02/01/2034 | | | AA-* | | | 1,070,000 | | | | 1,010,262 | |
KY Bond Corporation Finance Program | | | 3.000 | | | | 02/01/2034 | | | AA-* | | | 925,000 | | | | 875,707 | |
KY Bond Corporation Finance Program | | | 3.000 | | | | 02/01/2035 | | | AA-* | | | 1,170,000 | | | | 1,091,271 | |
KY Bond Corporation Finance Program | | | 3.000 | | | | 02/01/2035 | | | AA-* | | | 930,000 | | | | 867,420 | |
KY Bond Corporation Finance Program | | | 3.000 | | | | 02/01/2036 | | | AA-* | | | 1,240,000 | | | | 1,135,617 | |
KY Bond Corporation Finance Program | | | 3.000 | | | | 02/01/2036 | | | AA-* | | | 965,000 | | | | 881,952 | |
KY Bond Corporation Finance Program | | | 3.000 | | | | 02/01/2037 | | | AA-* | | | 990,000 | | | | 882,179 | |
KY Bond Corporation Finance Program | | | 3.000 | | | | 02/01/2038 | | | AA-* | | | 980,000 | | | | 860,538 | |
KY Bond Corporation Finance Program | | | 3.000 | | | | 02/01/2038 | | | AA-* | | | 1,025,000 | | | | 892,857 | |
KY Bond Corporation Finance Program | | | 3.000 | | | | 02/01/2039 | | | AA-* | | | 1,050,000 | | | | 903,662 | |
KY Bond Corporation Finance Program | | | 3.000 | | | | 02/01/2040 | | | AA-* | | | 1,030,000 | | | | 873,440 | |
KY Bond Corporation Finance Program | | | 3.000 | | | | 02/01/2041 | | | AA-* | | | 1,000,000 | | | | 836,330 | |
KY Bond Corporation Finance Program | | | 3.000 | | | | 02/01/2041 | | | AA-* | | | 1,065,000 | | | | 891,852 | |
KY Bond Corporation Finance Program | | | 3.000 | | | | 02/01/2042 | | | AA-* | | | 420,000 | | | | 345,866 | |
KY Bond Corporation Finance Program | | | 3.000 | | | | 02/01/2043 | | | AA-* | | | 430,000 | | | | 347,096 | |
KY Bond Corporation Finance Program | | | 3.000 | | | | 02/01/2044 | | | AA-* | | | 450,000 | | | | 360,000 | |
KY Bond Corporation Finance Program | | | 3.000 | | | | 02/01/2047 | | | AA-* | | | 1,100,000 | | | | 827,354 | |
KY State Property & Building #105 | | | 4.750 | | | | 04/01/2031 | | | A1 | | | 2,110,000 | | | | 2,111,055 | |
KY State Property & Building #105 | | | 4.750 | | | | 04/01/2032 | | | A1 | | | 2,205,000 | | | | 2,206,125 | |
KY State Property & Building #105 | | | 4.750 | | | | 04/01/2033 | | | A1 | | | 2,310,000 | | | | 2,311,178 | |
KY State Property & Building #108 | | | 5.000 | | | | 08/01/2026 | | | A1 | | | 955,000 | | | | 987,833 | |
KY State Property & Building #108 | | | 5.000 | | | | 08/01/2028 | | | A1 | | | 2,670,000 | | | | 2,766,707 | |
KY State Property & Building #108 | | | 5.000 | | | | 08/01/2030 | | | A1 | | | 5,000,000 | | | | 5,182,150 | |
KY State Property & Building #108 | | | 5.000 | | | | 08/01/2032 | | | A1 | | | 8,820,000 | | | | 9,146,693 | |
KY State Property & Building #108 | | | 5.000 | | | | 08/01/2033 | | | A1 | | | 5,270,000 | | | | 5,463,040 | |
KY State Property & Building #108 | | | 5.000 | | | | 08/01/2034 | | | A1 | | | 4,900,000 | | | | 5,079,487 | |
KY State Property & Building #110 | | | 5.000 | | | | 08/01/2029 | | | A1 | | | 4,200,000 | | | | 4,349,562 | |
KY State Property & Building #110 | | | 5.000 | | | | 08/01/2032 | | | A1 | | | 1,515,000 | | | | 1,571,116 | |
KY State Property & Building #110 | | | 5.000 | | | | 08/01/2033 | | | A1 | | | 1,000,000 | | | | 1,036,630 | |
KY State Property & Building #110 | | | 5.000 | | | | 08/01/2034 | | | A1 | | | 1,900,000 | | | | 1,954,872 | |
KY State Property & Building #110 | | | 5.000 | | | | 08/01/2035 | | | A1 | | | 3,680,000 | | | | 3,805,010 | |
KY State Property & Building #112 | | | 5.000 | | | | 11/01/2028 | | | A1 | | | 2,765,000 | | | | 2,938,310 | |
KY State Property & Building #112 | | | 5.000 | | | | 02/01/2035 | | | A1 | | | 8,325,000 | | | | 8,706,535 | |
The accompanying footnotes are an integral part of the financial statements.
6
DUPREE MUTUAL FUNDS — KENTUCKY TAX-FREE INCOME SERIES
SCHEDULE OF PORTFOLIO INVESTMENTS
Kentucky Municipal Bonds
June 30, 2023
| | | | | | | | | | | | | | | | | | |
| Bond Description | | Coupon | | | Maturity
Date | | | Rating# | | Par Value | | | Fair Value | |
KY State Property & Building #112 | | | 5.000 | % | | | 02/01/2036 | | | A1 | | $ | 7,920,000 | | | $ | 8,234,978 | |
KY State Property & Building #115 | | | 5.000 | | | | 04/01/2033 | | | A1 | | | 4,565,000 | | | | 4,843,237 | |
KY State Property & Building #115 | | | 5.000 | | | | 04/01/2034 | | | A1 | | | 13,975,000 | | | | 14,811,544 | |
KY State Property & Building #115 | | | 5.000 | | | | 04/01/2036 | | | A1 | | | 14,460,000 | | | | 15,247,052 | |
KY State Property & Building #115 | | | 5.000 | | | | 04/01/2037 | | | A1 | | | 5,000,000 | | | | 5,255,950 | |
KY State Property & Building #117 | | | 5.000 | | | | 05/01/2031 | | | A1 | | | 5,055,000 | | | | 5,403,441 | |
KY State Property & Building #117 | | | 5.000 | | | | 05/01/2032 | | | A1 | | | 3,680,000 | | | | 3,933,662 | |
KY State Property & Building #117 | | | 5.000 | | | | 05/01/2033 | | | A1 | | | 3,550,000 | | | | 3,788,063 | |
KY State Property & Building #117 | | | 5.000 | | | | 05/01/2034 | | | A1 | | | 5,825,000 | | | | 6,217,780 | |
KY State Property & Building #117 | | | 5.000 | | | | 05/01/2035 | | | A1 | | | 5,065,000 | | | | 5,378,270 | |
KY State Property & Building #117 | | | 5.000 | | | | 05/01/2036 | | | A1 | | | 5,275,000 | | | | 5,566,180 | |
KY State Property & Building #119 | | | 5.000 | | | | 05/01/2030 | | | A1 | | | 3,685,000 | | | | 4,003,937 | |
KY State Property & Building #119 | | | 5.000 | | | | 05/01/2034 | | | A1 | | | 725,000 | | | | 783,007 | |
KY State Property & Building #119 | | | 5.000 | | | | 05/01/2035 | | | A1 | | | 10,000,000 | | | | 10,716,700 | |
KY State Property & Building #119 | | | 5.000 | | | | 05/01/2036 | | | A1 | | | 10,000,000 | | | | 10,643,200 | |
KY State Property & Building #119 | | | 5.000 | | | | 05/01/2037 | | | A1 | | | 500,000 | | | | 528,290 | |
KY State Property & Building #122 | | | 5.000 | | | | 11/01/2031 | | | A1 | | | 790,000 | | | | 868,566 | |
KY State Property & Building #122 | | | 5.000 | | | | 11/01/2033 | | | A1 | | | 1,000,000 | | | | 1,088,640 | |
KY State Property & Building #122 | | | 4.000 | | | | 11/01/2035 | | | A1 | | | 500,000 | | | | 509,370 | |
KY State Property & Building #122 | | | 4.000 | | | | 11/01/2036 | | | A1 | | | 750,000 | | | | 758,963 | |
KY State Property & Building #122 | | | 4.000 | | | | 11/01/2037 | | | A1 | | | 675,000 | | | | 676,256 | |
KY State Property & Building #122 | | | 4.000 | | | | 11/01/2038 | | | A1 | | | 5,345,000 | | | | 5,357,507 | |
KY State Property & Building #122 | | | 4.000 | | | | 11/01/2039 | | | A1 | | | 9,655,000 | | | | 9,668,421 | |
KY State Property & Building #126 | | | 5.000 | | | | 05/01/2039 | | | A1 | | | 5,565,000 | | | | 6,110,147 | |
KY State Property & Building #126 | | | 5.000 | | | | 05/01/2040 | | | A1 | | | 5,845,000 | | | | 6,357,840 | |
KY State Property & Building #126 | | | 5.000 | | | | 05/01/2041 | | | A1 | | | 6,135,000 | | | | 6,673,285 | |
KY State Property & Building #126 | | | 5.000 | | | | 05/01/2042 | | | A1 | | | 2,000,000 | | | | 2,156,800 | |
KY State Property & Building #126 | | | 4.000 | | | | 05/01/2042 | | | A1 | | | 1,980,000 | | | | 1,908,720 | |
KY State Property & Building #127 | | | 5.250 | | | | 06/01/2040 | | | A1 | | | 10,000,000 | | | | 11,176,200 | |
KY State Property & Building #127 | | | 5.250 | | | | 06/01/2041 | | | A1 | | | 8,745,000 | | | | 9,724,353 | |
KY State Property & Building #127 | | | 5.250 | | | | 06/01/2042 | | | A1 | | | 15,975,000 | | | | 17,687,520 | |
Louisville & Jefferson County Visitors & Convention Commission | | | 4.000 | | | | 06/01/2034 | | | Aa3 | | | 3,720,000 | | | | 3,794,958 | |
| | | | | | | | | | | | | | | | | | |
| | | | | | | | | | | | | | | | | 282,052,026 | |
| SCHOOL IMPROVEMENT BONDS | | | | | | | | | | | |
| 20.63% of Net Assets | | | | | | | | | | | | | | | | | | |
Bardstown KY Independent School District Finance Corporation | | | 4.000 | | | | 02/01/2040 | | | A1 | | | 1,495,000 | | | | 1,447,325 | |
Bardstown KY Independent School District Finance Corporation | | | 4.000 | | | | 02/01/2042 | | | A1 | | | 1,525,000 | | | | 1,453,645 | |
Bowling Green KY School District Finance Corporation | | | 4.000 | | | | 08/01/2034 | | | A1 | | | 1,890,000 | | | | 1,930,144 | |
Bowling Green KY School District Finance Corporation | | | 4.000 | | | | 08/01/2035 | | | A1 | | | 2,215,000 | | | | 2,251,614 | |
Bowling Green KY School District Finance Corporation | | | 4.000 | | | | 08/01/2036 | | | A1 | | | 2,305,000 | | | | 2,326,944 | |
Bowling Green KY School District Finance Corporation | | | 4.000 | | | | 08/01/2037 | | | A1 | | | 2,395,000 | | | | 2,405,993 | |
Bowling Green KY School District Finance Corporation | | | 4.000 | | | | 04/01/2043 | | | A1 | | | 3,085,000 | | | | 3,006,610 | |
Bowling Green KY School District Finance Corporation | | | 4.000 | | | | 04/01/2045 | | | A1 | | | 2,500,000 | | | | 2,418,625 | |
Bullitt County KY School District Finance Corporation | | | 4.000 | | | | 10/01/2035 | | | A1 | | | 1,820,000 | | | | 1,843,187 | |
Bullitt County KY School District Finance Corporation | | | 4.000 | | | | 10/01/2036 | | | A1 | | | 2,985,000 | | | | 3,009,328 | |
Bullitt County KY School District Finance Corporation | | | 4.000 | | | | 10/01/2037 | | | A1 | | | 3,075,000 | | | | 3,084,164 | |
Bullitt County KY School District Finance Corporation | | | 4.000 | | | | 03/01/2038 | | | A1 | | | 575,000 | | | | 568,681 | |
Butler County KY School District Finance Corporation | | | 4.000 | | | | 03/01/2037 | | | A1 | | | 360,000 | | | | 359,608 | |
Butler County KY School District Finance Corporation | | | 4.250 | | | | 03/01/2040 | | | A1 | | | 755,000 | | | | 756,050 | |
Clark County KY School District Finance Corporation | | | 4.000 | | | | 03/01/2039 | | | A1 | | | 3,090,000 | | | | 3,026,377 | |
Clark County KY School District Finance Corporation | | | 4.000 | | | | 03/01/2040 | | | A1 | | | 1,475,000 | | | | 1,432,918 | |
Covington KY Independent School District Finance Corporation | | | 4.000 | | | | 06/01/2041 | | | A1 | | | 490,000 | | | | 482,586 | |
Fayette County KY School District Finance Corporation | | | 5.000 | | | | 08/01/2028 | | | Aa3 | | | 1,330,000 | | | | 1,380,899 | |
Fayette County KY School District Finance Corporation | | | 4.750 | | | | 11/01/2031 | | | Aa3 | | | 1,730,000 | | | | 1,767,230 | |
Fayette County KY School District Finance Corporation** | | | 5.000 | | | | 08/01/2032 | | | Aa3 | | | 10,600,000 | | | | 11,023,152 | |
Fayette County KY School District Finance Corporation | | | 5.000 | | | | 08/01/2034 | | | Aa3 | | | 8,750,000 | | | | 9,084,863 | |
Glasgow KY School District Finance Corporation | | | 3.000 | | | | 02/01/2042 | | | A1 | | | 1,820,000 | | | | 1,490,653 | |
Hardin County KY School District Finance Corporation | | | 4.000 | | | | 05/01/2030 | | | Aa3 | | | 635,000 | | | | 651,078 | |
The accompanying footnotes are an integral part of the financial statements.
7
DUPREE MUTUAL FUNDS — KENTUCKY TAX-FREE INCOME SERIES
SCHEDULE OF PORTFOLIO INVESTMENTS
Kentucky Municipal Bonds
June 30, 2023
| | | | | | | | | | | | | | | | | | |
| Bond Description | | Coupon | | | Maturity
Date | | | Rating# | | Par Value | | | Fair Value | |
Jefferson County KY School District Finance Corporation | | | 5.000 | % | | | 10/01/2026 | | | Aa3 | | $ | 255,000 | | | $ | 270,438 | |
Jefferson County KY School District Finance Corporation | | | 5.000 | | | | 04/01/2030 | | | Aa3 | | | 975,000 | | | | 1,006,317 | |
Jefferson County KY School District Finance Corporation | | | 5.000 | | | | 04/01/2031 | | | Aa3 | | | 1,025,000 | | | | 1,057,923 | |
Jefferson County KY School District Finance Corporation | | | 5.000 | | | | 05/01/2033 | | | Aa3 | | | 5,145,000 | | | | 5,228,298 | |
Jefferson County KY School District Finance Corporation | | | 4.000 | | | | 06/01/2033 | | | Aa3 | | | 4,310,000 | | | | 4,431,973 | |
Jefferson County KY School District Finance Corporation | | | 4.750 | | | | 04/01/2034 | | | Aa3 | | | 1,165,000 | | | | 1,201,931 | |
Jefferson County KY School District Finance Corporation | | | 5.000 | | | | 05/01/2034 | | | Aa3 | | | 5,405,000 | | | | 5,492,507 | |
Jefferson County KY School District Finance Corporation | | | 4.000 | | | | 06/01/2034 | | | Aa3 | | | 3,500,000 | | | | 3,579,345 | |
Jefferson County KY School District Finance Corporation | | | 4.750 | | | | 04/01/2035 | | | Aa3 | | | 1,220,000 | | | | 1,255,709 | |
Jefferson County KY School District Finance Corporation | | | 3.000 | | | | 12/01/2035 | | | Aa3 | | | 11,140,000 | | | | 10,347,835 | |
Jefferson County KY School District Finance Corporation | | | 4.250 | | | | 10/01/2037 | | | Aa3 | | | 2,110,000 | | | | 2,135,468 | |
Jefferson County KY School District Finance Corporation | | | 3.000 | | | | 12/01/2038 | | | Aa3 | | | 6,470,000 | | | | 5,642,099 | |
Jefferson County KY School District Finance Corporation | | | 3.000 | | | | 12/01/2039 | | | Aa3 | | | 4,385,000 | | | | 3,779,344 | |
Jefferson County KY School District Finance Corporation | | | 3.000 | | | | 12/01/2040 | | | Aa3 | | | 1,940,000 | | | | 1,643,646 | |
Kenton County KY School District Finance Corporation | | | 4.000 | | | | 04/01/2036 | | | A1 | | | 1,210,000 | | | | 1,220,382 | |
Kenton County KY School District Finance Corporation | | | 4.000 | | | | 04/01/2037 | | | A1 | | | 1,255,000 | | | | 1,262,505 | |
Kenton County KY School District Finance Corporation | | | 4.000 | | | | 04/01/2038 | | | A1 | | | 1,300,000 | | | | 1,291,342 | |
Kenton County KY School District Finance Corporation | | | 3.000 | | | | 12/01/2040 | | | A1 | | | 1,965,000 | | | | 1,639,046 | |
Kenton County KY School District Finance Corporation | | | 3.000 | | | | 12/01/2041 | | | A1 | | | 2,025,000 | | | | 1,656,227 | |
Marion County KY School District Finance Corporation | | | 4.000 | | | | 04/01/2038 | | | A1 | | | 1,000,000 | | | | 992,240 | |
Marion County KY School District Finance Corporation | | | 4.000 | | | | 04/01/2040 | | | A1 | | | 1,190,000 | | | | 1,167,128 | |
Meade County KY School District Finance Corporation | | | 4.000 | | | | 06/01/2036 | | | A1 | | | 2,215,000 | | | | 2,236,242 | |
Meade County KY School District Finance Corporation | | | 4.000 | | | | 06/01/2037 | | | A1 | | | 2,255,000 | | | | 2,264,809 | |
Meade County KY School District Finance Corporation | | | 4.000 | | | | 06/01/2038 | | | A1 | | | 2,400,000 | | | | 2,386,584 | |
Morgan County KY School District Finance Corporation | | | 4.000 | | | | 08/01/2029 | | | A1 | | | 960,000 | | | | 993,648 | |
Oldham County KY School District Finance Corporation | | | 4.000 | | | | 10/01/2034 | | | A1 | | | 1,560,000 | | | | 1,580,358 | |
Paris KY Independent School District Finance Corporation | | | 4.000 | | | | 03/01/2042 | | | A1 | | | 1,000,000 | | | | 961,710 | |
Raceland-Worthington KY Independent School District Finance Corporation | | | 3.400 | | | | 06/01/2037 | | | A1 | | | 605,000 | | | | 568,379 | |
Scott County KY School District Finance Corporation | | | 4.500 | | | | 01/01/2025 | | | A1 | | | 4,890,000 | | | | 4,970,290 | |
Scott County KY School District Finance Corporation | | | 4.000 | | | | 02/01/2029 | | | Aa3 | | | 5,040,000 | | | | 5,281,466 | |
Scott County KY School District Finance Corporation | | | 4.000 | | | | 06/01/2035 | | | Aa3 | | | 1,440,000 | | | | 1,459,786 | |
Scott County KY School District Finance Corporation | | | 4.000 | | | | 10/01/2035 | | | Aa3 | | | 2,235,000 | | | | 2,267,609 | |
Scott County KY School District Finance Corporation | | | 4.000 | | | | 06/01/2036 | | | Aa3 | | | 1,500,000 | | | | 1,513,140 | |
Scott County KY School District Finance Corporation | | | 4.000 | | | | 10/01/2037 | | | Aa3 | | | 2,415,000 | | | | 2,424,394 | |
Scott County KY School District Finance Corporation | | | 5.000 | | | | 09/01/2041 | | | Aa3 | | | 7,120,000 | | | | 7,851,295 | |
Scott County KY School District Finance Corporation | | | 4.125 | | | | 04/01/2047 | | | Aa3 | | | 1,025,000 | | | | 1,001,394 | |
Shelby County KY School District Finance Corporation | | | 4.000 | | | | 08/01/2037 | | | Aa3 | | | 6,240,000 | | | | 6,275,880 | |
Shelby County KY School District Finance Corporation | | | 4.000 | | | | 08/01/2038 | | | Aa3 | | | 3,000,000 | | | | 3,000,780 | |
Warren County KY School District Finance Corporation | | | 4.000 | | | | 02/01/2040 | | | Aa3 | | | 2,000,000 | | | | 1,959,520 | |
Williamstown KY Independent School District Finance Corporation | | | 4.125 | | | | 05/01/2044 | | | A1 | | | 490,000 | | | | 483,566 | |
Woodford County KY School District Finance Corporation | | | 5.000 | | | | 08/01/2038 | | | A1 | | | 1,650,000 | | | | 1,807,525 | |
| | | | | | | | | | | | | | | | | | |
| | | | | | | | | | | | | | | | | 164,791,752 | |
| UNIVERSITY CONSOLIDATED EDUCATION AND BUILDING REVENUE BONDS | | | | | | | | | | | |
| 12.90% of Net Assets | | | | | | | | | | | | | | | | | | |
Boyle County Centre College | | | 5.000 | | | | 06/01/2037 | | | A3 | | | 2,865,000 | | | | 2,972,094 | |
Boyle County KY Educational Facilities Revenue Centre College | | | 5.250 | | | | 06/01/2043 | | | A3 | | | 2,000,000 | | | | 2,159,440 | |
KY Bond Development Corporation Educational Facilities Centre College | | | 5.000 | | | | 06/01/2033 | | | A3 | | | 1,345,000 | | | | 1,443,589 | |
KY Bond Development Corporation Educational Facilities Centre College | | | 5.000 | | | | 06/01/2034 | | | A3 | | | 1,605,000 | | | | 1,722,647 | |
KY Bond Development Corporation Educational Facilities Centre College | | | 5.000 | | | | 06/01/2035 | | | A3 | | | 2,165,000 | | | | 2,307,500 | |
KY Bond Development Corporation Educational Facilities Centre College | | | 5.000 | | | | 06/01/2036 | | | A3 | | | 2,835,000 | | | | 3,004,533 | |
KY Bond Development Corporation Educational Facilities Centre College | | | 5.000 | | | | 06/01/2038 | | | A3 | | | 1,340,000 | | | | 1,406,585 | |
KY Bond Development Corporation Educational Facilities Centre College | | | 4.000 | | | | 06/01/2038 | | | A3 | | | 200,000 | | | | 196,682 | |
The accompanying footnotes are an integral part of the financial statements.
8
DUPREE MUTUAL FUNDS — KENTUCKY TAX-FREE INCOME SERIES
SCHEDULE OF PORTFOLIO INVESTMENTS
Kentucky Municipal Bonds
June 30, 2023
| | | | | | | | | | | | | | | | | | |
| Bond Description | | Coupon | | | Maturity
Date | | | Rating# | | Par Value | | | Fair Value | |
KY Bond Development Corporation Educational Facilities Centre College | | | 3.000 | % | | | 06/01/2039 | | | A3 | | $ | 860,000 | | | $ | 702,465 | |
KY Bond Development Corporation Educational Facilities Centre College | | | 4.000 | | | | 06/01/2040 | | | A3 | | | 640,000 | | | | 618,566 | |
KY Bond Development Corporation Educational Facilities Centre College | | | 3.000 | | | | 06/01/2041 | | | A3 | | | 1,405,000 | | | | 1,140,073 | |
KY Bond Development Corporation Educational Facilities Centre College | | | 4.000 | | | | 06/01/2046 | | | A3 | | | 2,545,000 | | | | 2,353,820 | |
KY Bond Development Corporation Educational Facilities Centre College | | | 4.000 | | | | 06/01/2051 | | | A3 | | | 4,400,000 | | | | 3,987,148 | |
KY State Property & Building #114 | | | 5.000 | | | | 10/01/2032 | | | A1 | | | 2,795,000 | | | | 2,943,806 | |
KY State Property & Building #114 | | | 5.000 | | | | 10/01/2033 | | | A1 | | | 2,940,000 | | | | 3,094,673 | |
KY State Property & Building #114 | | | 5.000 | | | | 10/01/2034 | | | A1 | | | 3,090,000 | | | | 3,251,576 | |
KY State Property & Building #114 | | | 5.000 | | | | 10/01/2035 | | | A1 | | | 1,945,000 | | | | 2,035,695 | |
KY State Property & Building #116 | | | 5.000 | | | | 10/01/2035 | | | A1 | | | 4,165,000 | | | | 4,433,393 | |
KY State Property & Building #116 | | | 5.000 | | | | 10/01/2036 | | | A1 | | | 2,725,000 | | | | 2,892,806 | |
Murray State University | | | 5.000 | | | | 03/01/2032 | | | A1 | | | 2,220,000 | | | | 2,279,984 | |
Murray State University | | | 3.000 | | | | 09/01/2037 | | | A1 | | | 1,310,000 | | | | 1,161,446 | |
Murray State University | | | 3.000 | | | | 09/01/2039 | | | A1 | | | 1,390,000 | | | | 1,200,057 | |
Murray State University | | | 3.000 | | | | 09/01/2041 | | | A1 | | | 1,470,000 | | | | 1,243,958 | |
University of Kentucky Certificate of Participation | | | 4.000 | | | | 05/01/2033 | | | Aa3 | | | 885,000 | | | | 917,612 | |
University of Kentucky Certificate of Participation | | | 4.000 | | | | 05/01/2034 | | | Aa3 | | | 1,020,000 | | | | 1,051,569 | |
University of Kentucky Certificate of Participation | | | 4.000 | | | | 05/01/2039 | | | Aa3 | | | 4,660,000 | | | | 4,648,956 | |
University of Kentucky Certificate of Participation | | | 4.000 | | | | 05/01/2044 | | | Aa3 | | | 3,755,000 | | | | 3,692,216 | |
University of Kentucky General Receipts | | | 5.000 | | | | 04/01/2030 | | | Aa2 | | | 5,490,000 | | | | 5,670,182 | |
University of Kentucky General Receipts | | | 4.000 | | | | 10/01/2036 | | | Aa2 | | | 16,160,000 | | | | 16,352,625 | |
University of Kentucky General Receipts | | | 4.000 | | | | 10/01/2038 | | | Aa2 | | | 10,855,000 | | | | 10,905,042 | |
University of Kentucky Higher Educational | | | 4.750 | | | | 04/01/2034 | | | Aa2 | | | 5,435,000 | | | | 5,602,561 | |
University of Louisville | | | 3.000 | | | | 09/01/2039 | | | A1 | | | 1,450,000 | | | | 1,245,681 | |
University of Louisville | | | 3.000 | | | | 09/01/2040 | | | A1 | | | 1,495,000 | | | | 1,265,562 | |
University of Louisville | | | 3.000 | | | | 09/01/2042 | | | A1 | | | 1,575,000 | | | | 1,284,255 | |
Western KY University | | | 4.000 | | | | 09/01/2034 | | | A1 | | | 575,000 | | | | 586,477 | |
Western KY University | | | 4.000 | | | | 09/01/2035 | | | A1 | | | 595,000 | | | | 605,258 | |
Western KY University | | | 4.000 | | | | 09/01/2036 | | | A1 | | | 620,000 | | | | 627,527 | |
| | | | | | | | | | | | | | | | | | |
| | | | | | | | | | | | | | | | | 103,008,059 | |
| MUNICIPAL UTILITY REVENUE BONDS | | | | | | | | | | | |
| 8.11% of Net Assets | | | | | | | | | | | | | | | | | | |
KY Rural Water Finance Corporation | | | 4.500 | | | | 02/01/2024 | | | AA-* | | | 880,000 | | �� | | 880,220 | |
KY Rural Water Finance Corporation | | | 3.000 | | | | 02/01/2032 | | | AA-* | | | 240,000 | | | | 232,726 | |
KY Rural Water Finance Corporation | | | 3.000 | | | | 02/01/2033 | | | AA-* | | | 370,000 | | | | 360,043 | |
KY Rural Water Finance Corporation | | | 5.125 | | | | 02/01/2035 | | | AA-* | | | 295,000 | | | | 295,103 | |
KY Rural Water Finance Corporation | | | 3.000 | | | | 08/01/2036 | | | AA-* | | | 285,000 | | | | 262,211 | |
KY Rural Water Finance Corporation | | | 3.000 | | | | 08/01/2037 | | | AA-* | | | 280,000 | | | | 251,185 | |
KY State Association of Counties Finance Corporation | | | 4.000 | | | | 02/01/2031 | | | AA-* | | | 405,000 | | | | 419,058 | |
KY State Association of Counties Finance Corporation | | | 4.000 | | | | 02/01/2033 | | | AA-* | | | 415,000 | | | | 427,973 | |
Louisville & Jefferson County Metropolitan Sewer | | | 4.000 | | | | 05/15/2033 | | | Aa3 | | | 1,000,000 | | | | 1,005,550 | |
Louisville & Jefferson County Metropolitan Sewer | | | 4.750 | | | | 05/15/2034 | | | Aa3 | | | 2,230,000 | | | | 2,287,891 | |
Louisville & Jefferson County Metropolitan Sewer | | | 5.000 | | | | 05/15/2034 | | | Aa3 | | | 4,595,000 | | | | 4,836,421 | |
Louisville & Jefferson County Metropolitan Sewer | | | 4.750 | | | | 05/15/2035 | | | Aa3 | | | 2,245,000 | | | | 2,301,731 | |
Louisville & Jefferson County Metropolitan Sewer | | | 5.000 | | | | 05/15/2035 | | | Aa3 | | | 4,825,000 | | | | 5,072,812 | |
Louisville & Jefferson County Metropolitan Sewer | | | 4.750 | | | | 05/15/2036 | | | Aa3 | | | 2,795,000 | | | | 2,856,127 | |
Louisville & Jefferson County Metropolitan Sewer | | | 4.000 | | | | 05/15/2037 | | | Aa3 | | | 10,000,000 | | | | 10,177,100 | |
Louisville & Jefferson County Metropolitan Sewer | | | 3.000 | | | | 05/15/2044 | | | Aa3 | | | 21,515,000 | | | | 17,608,091 | |
Louisville & Jefferson County Metropolitan Sewer | | | 3.250 | | | | 05/15/2046 | | | Aa3 | | | 2,450,000 | | | | 2,052,439 | |
Murray KY Electric Plant | | | 3.000 | | | | 12/01/2036 | | | A1 | | | 370,000 | | | | 335,819 | |
Murray KY Electric Plant | | | 3.000 | | | | 12/01/2037 | | | A1 | | | 380,000 | | | | 338,272 | |
Murray KY Electric Plant | | | 3.000 | | | | 12/01/2038 | | | A1 | | | 395,000 | | | | 345,696 | |
Murray KY Electric Plant | | | 3.000 | | | | 12/01/2039 | | | A1 | | | 405,000 | | | | 350,815 | |
The accompanying footnotes are an integral part of the financial statements.
9
DUPREE MUTUAL FUNDS — KENTUCKY TAX-FREE INCOME SERIES
SCHEDULE OF PORTFOLIO INVESTMENTS
Kentucky Municipal Bonds
June 30, 2023
| | | | | | | | | | | | | | | | | | |
| Bond Description | | Coupon | | | Maturity
Date | | | Rating# | | Par Value | | | Fair Value | |
Murray KY Electric Plant | | | 3.000 | % | | | 12/01/2040 | | | A1 | | $ | 420,000 | | | $ | 359,570 | |
Murray KY Electric Plant | | | 3.000 | | | | 12/01/2041 | | | A1 | | | 430,000 | | | | 363,281 | |
Murray KY Electric Plant | | | 3.000 | | | | 12/01/2042 | | | A1 | | | 445,000 | | | | 366,253 | |
Owensboro KY Electric Light & Power | | | 4.000 | | | | 01/01/2031 | | | A3 | | | 245,000 | | | | 252,103 | |
Owensboro KY Electric Light & Power | | | 4.000 | | | | 01/01/2033 | | | A3 | | | 275,000 | | | | 282,326 | |
Owensboro KY Electric Light & Power | | | 4.000 | | | | 01/01/2034 | | | A3 | | | 305,000 | | | | 311,500 | |
Owensboro KY Electric Light & Power | | | 4.000 | | | | 01/01/2035 | | | A3 | | | 200,000 | | | | 203,402 | |
Owensboro KY Electric Light & Power | | | 4.000 | | | | 01/01/2036 | | | A3 | | | 325,000 | | | | 329,670 | |
Owensboro KY Electric Light & Power | | | 4.000 | | | | 01/01/2037 | | | A3 | | | 410,000 | | | | 412,800 | |
Owensboro KY Water Revenue | | | 4.000 | | | | 09/15/2034 | | | A1 | | | 2,075,000 | | | | 2,136,503 | |
Owensboro KY Water Revenue | | | 4.000 | | | | 09/15/2035 | | | A1 | | | 2,155,000 | | | | 2,203,509 | |
Owensboro KY Water Revenue | | | 4.000 | | | | 09/15/2037 | | | A1 | | | 1,950,000 | | | | 1,962,675 | |
Owensboro KY Water Revenue | | | 4.000 | | | | 09/15/2039 | | | A1 | | | 2,125,000 | | | | 2,117,372 | |
Owensboro-Daviess County KY Water | | | 4.000 | | | | 12/01/2043 | | | A+* | | | 800,000 | | | | 769,680 | |
| | | | | | | | | | | | | | | | | | |
| | | | | | | | | | | | | | | | | 64,767,927 | |
| PREREFUNDED BONDS | | | | | | | | | | | |
| 7.22% of Net Assets | | | | | | | | | | | | | | | | | | |
Fayette County KY School District Finance Corporation | | | 5.000 | | | | 10/01/2029 | | | Aa3 | | | 3,660,000 | | | | 3,675,701 | |
Fayette County KY School District Finance Corporation | | | 5.000 | | | | 10/01/2032 | | | Aa3 | | | 3,615,000 | | | | 3,630,508 | |
Fayette County KY School District Finance Corporation | | | 5.000 | | | | 10/01/2033 | | | Aa3 | | | 4,385,000 | | | | 4,403,812 | |
Frankfort KY Electric & Water | | | 4.750 | | | | 12/01/2034 | | | NR | | | 695,000 | | | | 710,499 | |
Frankfort KY Electric & Water | | | 4.750 | | | | 12/01/2035 | | | NR | | | 725,000 | | | | 741,168 | |
Frankfort KY Electric & Water | | | 4.750 | | | | 12/01/2036 | | | NR | | | 760,000 | | | | 776,948 | |
KY State Property & Building #106 | | | 5.000 | | | | 10/01/2028 | | | A1 | | | 2,030,000 | | | | 2,038,709 | |
KY State Property & Building #106 | | | 5.000 | | | | 10/01/2029 | | | A1 | | | 4,130,000 | | | | 4,148,337 | |
KY State Property & Building #106 | | | 5.000 | | | | 10/01/2030 | | | A1 | | | 7,165,000 | | | | 7,196,813 | |
KY State Property & Building #106 | | | 5.000 | | | | 10/01/2031 | | | A1 | | | 4,910,000 | | | | 4,931,800 | |
KY State Property & Building #106 | | | 5.000 | | | | 10/01/2032 | | | A1 | | | 6,275,000 | | | | 6,302,860 | |
KY State Turnpike Economic Development Road Revenue | | | 5.000 | | | | 07/01/2033 | | | Aa3 | | | 2,500,000 | | | | 2,500,125 | |
Lexington Fayette Urban County Government | | | 5.000 | | | | 01/01/2029 | | | Aa2 | | | 345,000 | | | | 354,912 | |
University of Kentucky General Receipts | | | 5.000 | | | | 04/01/2036 | | | Aa2 | | | 4,820,000 | | | | 4,876,587 | |
University of Kentucky General Receipts | | | 5.000 | | | | 04/01/2037 | | | Aa2 | | | 3,815,000 | | | | 3,859,788 | |
University of Kentucky General Receipts | | | 5.000 | | | | 04/01/2038 | | | Aa2 | | | 7,395,000 | | | | 7,481,817 | |
| | | | | | | | | | | | | | | | | | |
| | | | | | | | | | | | | | | | | 57,630,384 | |
| PUBLIC FACILITIES REVENUE BONDS | | | | | | | | | | | |
| 5.52% of Net Assets | | | | | | | | | | | | | | | | | | |
KY Bond Development | | | 5.000 | | | | 09/01/2035 | | | A2 | | | 1,275,000 | | | | 1,378,441 | |
KY Bond Development | | | 5.000 | | | | 09/01/2036 | | | A2 | | | 2,000,000 | | | | 2,143,580 | |
KY Bond Development | | | 5.000 | | | | 09/01/2038 | | | A2 | | | 1,125,000 | | | | 1,186,144 | |
KY State Certificate of Participation | | | 4.000 | | | | 04/15/2030 | | | A1 | | | 1,500,000 | | | | 1,555,560 | |
KY State Certificate of Participation | | | 4.000 | | | | 04/15/2031 | | | A1 | | | 1,350,000 | | | | 1,396,359 | |
KY State Certificate of Participation | | | 5.000 | | | | 06/15/2034 | | | A1 | | | 1,640,000 | | | | 1,696,842 | |
KY State Certificate of Participation | | | 5.000 | | | | 04/15/2038 | | | A1 | | | 10,000,000 | | | | 10,665,000 | |
KY State Certificate of Participation | | | 5.000 | | | | 06/15/2038 | | | A1 | | | 7,535,000 | | | | 7,749,897 | |
KY State Certificate of Participation | | | 4.000 | | | | 04/15/2048 | | | A1 | | | 1,000,000 | | | | 960,380 | |
Laurel County General Obligation | | | 4.000 | | | | 05/01/2031 | | | A2 | | | 1,295,000 | | | | 1,333,967 | |
Laurel County General Obligation | | | 4.000 | | | | 05/01/2034 | | | A2 | | | 1,440,000 | | | | 1,477,555 | |
Laurel County General Obligation | | | 4.000 | | | | 05/01/2035 | | | A2 | | | 1,495,000 | | | | 1,529,116 | |
Laurel County General Obligation | | | 4.000 | | | | 05/01/2036 | | | A2 | | | 1,555,000 | | | | 1,576,490 | |
Laurel County General Obligation | | | 4.000 | | | | 05/01/2037 | | | A2 | | | 1,620,000 | | | | 1,633,122 | |
Laurel County General Obligation | | | 4.000 | | | | 05/01/2038 | | | A2 | | | 1,680,000 | | | | 1,680,521 | |
Louisville & Jefferson County Visitors & Convention Commission | | | 4.000 | | | | 06/01/2032 | | | Aa3 | | | 2,325,000 | | | | 2,382,939 | |
Madison County KY Public Properties Judicial Center | | | 4.125 | | | | 06/01/2041 | | | A1 | | | 1,180,000 | | | | 1,154,347 | |
Marshall County Library | | | 4.000 | | | | 06/01/2038 | | | Aa3 | | | 1,060,000 | | | | 1,068,777 | |
River City, Inc. Parking Authority | | | 3.000 | | | | 12/01/2036 | | | Aa3 | | | 835,000 | | | | 763,616 | |
River City, Inc. Parking Authority | | | 3.000 | | | | 12/01/2037 | | | Aa3 | | | 860,000 | | | | 771,704 | |
| | | | | | | | | | | | | | | | | | |
| | | | | | | | | | | | | | | | | 44,104,357 | |
The accompanying footnotes are an integral part of the financial statements.
10
DUPREE MUTUAL FUNDS — KENTUCKY TAX-FREE INCOME SERIES
SCHEDULE OF PORTFOLIO INVESTMENTS
Kentucky Municipal Bonds
June 30, 2023
| | | | | | | | | | | | | | | | | | |
| Bond Description | | Coupon | | | Maturity
Date | | | Rating# | | Par Value | | | Fair Value | |
| HOSPITAL AND HEALTHCARE REVENUE BONDS | | | | | | | | | | | |
| 4.47% of Net Assets | | | | | | | | | | | | | | | | | | |
KY Development Corporation Hospital Facilities — St. Elizabeth | | | 4.000 | % | | | 05/01/2032 | | | AA* | | $ | 1,810,000 | | | $ | 1,842,001 | |
KY Development Corporation Hospital Facilities — St. Elizabeth | | | 4.000 | | | | 05/01/2035 | | | AA* | | | 1,390,000 | | | | 1,404,804 | |
KY Development Corporation Hospital Facilities — St. Elizabeth | | | 4.000 | | | | 05/01/2036 | | | AA* | | | 1,200,000 | | | | 1,209,888 | |
KY Development Corporation Hospital Facilities — St. Elizabeth | | | 5.000 | | | | 05/01/2039 | | | AA* | | | 7,185,000 | | | | 7,389,054 | |
Louisville & Jefferson County Norton Healthcare | | | 5.500 | | | | 10/01/2033 | | | A* | | | 2,000,000 | | | | 2,003,820 | |
Louisville & Jefferson County Norton Healthcare | | | 5.000 | | | | 10/01/2033 | | | A* | | | 6,810,000 | | | | 7,080,698 | |
Louisville & Jefferson County Norton Healthcare | | | 4.000 | | | | 10/01/2035 | | | A* | | | 3,850,000 | | | | 3,850,963 | |
Louisville & Jefferson County Norton Healthcare | | | 4.000 | | | | 10/01/2036 | | | A* | | | 7,005,000 | | | | 6,870,362 | |
Louisville & Jefferson County Norton Healthcare | | | 4.000 | | | | 10/01/2040 | | | A* | | | 1,000,000 | | | | 964,850 | |
Louisville & Jefferson County Norton Healthcare | | | 3.000 | | | | 10/01/2043 | | | A* | | | 4,000,000 | | | | 3,082,520 | |
| | | | | | | | | | | | | | | | | | |
| | | | | | | | | | | | | | | | | 35,698,960 | |
| TURNPIKES/TOLLROAD/HIGHWAY REVENUE BONDS | | | | | | | | | | | |
| 2.77% of Net Assets | | | | | | | | | | | | | | | | | | |
KY State Turnpike Economic Development Road Revenue | | | 5.000 | | | | 07/01/2029 | | | Aa3 | | | 4,000,000 | | | | 4,209,280 | |
KY State Turnpike Economic Development Road Revenue | | | 5.000 | | | | 07/01/2032 | | | Aa3 | | | 1,315,000 | | | | 1,363,155 | |
KY State Turnpike Economic Development Road Revenue | | | 5.000 | | | | 07/01/2032 | | | Aa3 | | | 1,765,000 | | | | 1,910,365 | |
KY State Turnpike Economic Development Road Revenue | | | 5.000 | | | | 07/01/2034 | | | Aa3 | | | 1,120,000 | | | | 1,176,302 | |
KY State Turnpike Economic Development Road Revenue | | | 5.000 | | | | 07/01/2036 | | | Aa3 | | | 400,000 | | | | 426,696 | |
KY State Turnpike Economic Development Road Revenue | | | 5.000 | | | | 07/01/2037 | | | Aa3 | | | 500,000 | | | | 530,470 | |
KY State Turnpike Economic Development Road Revenue | | | 5.000 | | | | 07/01/2038 | | | Aa3 | | | 1,100,000 | | | | 1,206,249 | |
KY State Turnpike Economic Development Road Revenue | | | 5.000 | | | | 07/01/2039 | | | Aa3 | | | 3,255,000 | | | | 3,543,458 | |
KY State Turnpike Economic Development Road Revenue | | | 5.000 | | | | 07/01/2040 | | | Aa3 | | | 2,250,000 | | | | 2,436,435 | |
KY State Turnpike Economic Development Road Revenue | | | 5.000 | | | | 07/01/2041 | | | Aa3 | | | 3,555,000 | | | | 3,829,197 | |
KY State Turnpike Economic Development Road Revenue | | | 5.000 | | | | 07/01/2042 | | | Aa3 | | | 1,400,000 | | | | 1,507,983 | |
| | | | | | | | | | | | | | | | | | |
| | | | | | | | | | | | | | | | | 22,139,590 | |
| REFUNDING BONDS | | | | | | | | | | | |
| 1.20% of Net Assets | | | | | | | | | | | | | | | | | | |
KY Association of Counties | | | 3.000 | | | | 02/01/2034 | | | AA-* | | | 480,000 | | | | 457,680 | |
KY Association of Counties | | | 3.000 | | | | 02/01/2035 | | | AA-* | | | 505,000 | | | | 474,660 | |
KY Association of Counties | | | 3.000 | | | | 02/01/2036 | | | AA-* | | | 510,000 | | | | 467,548 | |
KY State Property & Building #102 | | | 5.000 | | | | 05/01/2024 | | | Aa3 | | | 405,000 | | | | 405,207 | |
KY State Property & Building #108 | | | 5.000 | | | | 08/01/2025 | | | A1 | | | 2,690,000 | | | | 2,785,226 | |
KY State Property & Building #121 | | | 5.000 | | | | 02/01/2029 | | | A1 | | | 4,535,000 | | | | 4,988,363 | |
| | | | | | | | | | | | | | | | | | |
| | | | | | | | | | | | | | | | | 9,578,684 | |
| AIRPORT REVENUE BONDS | | | | | | | | | | | |
| 0.65% of Net Assets | | | | | | | | | | | | | | | | | | |
Kenton County Airport | | | 5.000 | | | | 01/01/2029 | | | A1 | | | 240,000 | | | | 251,549 | |
Kenton County Airport | | | 5.000 | | | | 01/01/2034 | | | A1 | | | 275,000 | | | | 301,977 | |
Kenton County Airport | | | 5.000 | | | | 01/01/2035 | | | A1 | | | 300,000 | | | | 327,840 | |
Kenton County Airport | | | 5.000 | | | | 01/01/2036 | | | A1 | | | 325,000 | | | | 352,255 | |
Kenton County Airport | | | 5.000 | | | | 01/01/2037 | | | A1 | | | 250,000 | | | | 269,010 | |
Kenton County Airport | | | 5.000 | | | | 01/01/2038 | | | A1 | | | 500,000 | | | | 535,175 | |
Kenton County Airport | | | 5.000 | | | | 01/01/2039 | | | A1 | | | 500,000 | | | | 533,635 | |
Kenton County Airport | | | 5.000 | | | | 01/01/2044 | | | A1 | | | 2,500,000 | | | | 2,637,550 | |
| | | | | | | | | | | | | | | | | | |
| | | | | | | | | | | | | | | | | 5,208,991 | |
| AD VALOREM PROPERTY BONDS | | | | | | | | | | | |
| 0.33% of Net Assets | | | | | | | | | | | | | | | | | | |
Henderson KY | | | 3.000 | | | | 09/01/2042 | | | Aa3 | | | 845,000 | | | | 707,426 | |
Henderson KY | | | 3.000 | | | | 09/01/2043 | | | Aa3 | | | 870,000 | | | | 721,569 | |
Warren County General Obligation | | | 4.000 | | | | 06/01/2035 | | | Aa1 | | | 1,175,000 | | | | 1,210,215 | |
| | | | | | | | | | | | | | | | | | |
| | | | | | | | | | | | | | | | | 2,639,210 | |
Total Investments 99.11% of Net Assets (cost $818,773,142) (See footnote 6 for further explanation) | | | | | | | | | $ | 791,619,940 | |
| | | | | | | | | | | | | | | | | | |
Other assets in excess of liabilities 0.89% | | | | | | | 7,200,799 | |
| | | | | | | | | | | | | | | | | | |
Net Assets 100% | | | | | | | | | | | | | | | | $ | 798,820,739 | |
| | | | | | | | | | | | | | | | | | |
The accompanying footnotes are an integral part of the financial statements.
11
DUPREE MUTUAL FUNDS — KENTUCKY TAX-FREE INCOME SERIES
SCHEDULE OF PORTFOLIO INVESTMENTS
Kentucky Municipal Bonds
June 30, 2023
| | # | | Ratings by Moody’s Investors Service unless noted otherwise. |
| | | | Bond ratings are unaudited and not covered by Report of Independent Registered Public Accounting Firm. |
| | | | All ratings are as of the date indicated and do not reflect subsequent changes. |
| | * | | Rated by Standard & Poor’s Corporation |
| | ** | | Security is segregated against line of credit — see footnote 7 |
Other Information
The following is a summary of the inputs used, as of June 30, 2023, involving the Fund’s investments in securities carried at fair value. The inputs or methodology used for valuing securities may not be an indication of the risk associated with investing in those securities. For more information on valuation inputs, and their aggregation into the levels used in the table below, please refer to the Security Valuation section in the accompanying Notes to Financial Statements.
| | | | | | |
| | | Valuation Inputs | | Municipal Bonds | |
Level 1 | | Quoted Prices | | $ | — | |
Level 2 | | Other Significant Observable Inputs | | | 791,619,940 | |
Level 3 | | Significant Unobservable Inputs | | | — | |
| | | | | | |
| | | | $ | 791,619,940 | |
| | | | | | |
The accompanying footnotes are an integral part of the financial statements.
12
KENTUCKY TAX-FREE INCOME SERIES
STATEMENT OF ASSETS AND LIABILITIES
June 30, 2023
| | | | | | | | |
| ASSETS: | | | | | | | | |
Investments in securities, at fair value (Cost: $818,773,142) | | | $ | 791,619,940 | |
Cash | | | | | | | 1,750,569 | |
Receivable from Adviser | | | | | | | 112,609 | |
Interest receivable | | | | | | | 8,578,363 | |
| | | | | | | | |
Total assets | | | | | | | 802,061,481 | |
LIABILITIES: | | | | | | | | |
Payable for: | | | | | | | | |
Distributions to shareholders | | | 2,414,558 | | | | | |
Fund shares redeemed | | | 215,508 | | | | | |
Investment advisory fee | | | 258,498 | | | | | |
Transfer agent fee | | | 79,187 | | | | | |
Audit fees | | | 125,336 | | | | | |
Trustees fees | | | 32,771 | | | | | |
Professional fees | | | 25,624 | | | | | |
Custodian fee | | | 20,145 | | | | | |
Accrued expenses | | | 69,115 | | | | | |
| | | | | | | | |
Total liabilities | | | | | | | 3,240,742 | |
| | | | | | | | |
NET ASSETS: | | | | | | | | |
Paid-in capital | | | | | | | 835,645,632 | |
Total accumulated loss | | | | (36,824,893 | ) |
| | | | | | | | |
Total Net Assets | | | | | | $ | 798,820,739 | |
| | | | | | | | |
NET ASSET VALUE, offering price and redemption price per share
(111,315,765 shares outstanding; unlimited number of shares authorized; no par value) | | | | | | $ | 7.18 | |
| | | | | | | | |
STATEMENT OF OPERATIONS
For the year ended June 30, 2023
| | | | |
Net investment income: | | | | |
Interest income | | $ | 26,096,517 | |
| | | | |
Expenses: | | | | |
Investment advisory fee | | | 3,204,857 | |
Transfer agent fee | | | 987,943 | |
Professional fees | | | 246,380 | |
Trustees fees | | | 118,168 | |
Custodian fee | | | 97,803 | |
Compliance fees | | | 34,906 | |
Pricing fees | | | 32,030 | |
Registration fees | | | 22,701 | |
Other expenses | | | 132,264 | |
| | | | |
Total expenses | | | 4,877,052 | |
Custodian fee reduction (Note 7) | | | (261 | ) |
| | | | |
Net expenses | | | 4,876,791 | |
| | | | |
Net investment income | | | 21,219,726 | |
| | | | |
Realized and unrealized gain/(loss) on investments: | | | | |
Net realized loss | | | (8,560,616 | ) |
Net change in unrealized appreciation/depreciation | | | 6,101,692 | |
| | | | |
Net realized and unrealized loss on investments | | | (2,458,924 | ) |
| | | | |
Net increase in net assets resulting from operations | | $ | 18,760,802 | |
| | | | |
The accompanying footnotes are an integral part of the financial statements.
13
KENTUCKY TAX-FREE INCOME SERIES
STATEMENTS OF CHANGES IN NET ASSETS
For the years ended June 30, 2023 and 2022
| | | | | | | | |
| | | 2023 | | | 2022 | |
Operations: | | | | | | | | |
Net investment income | | $ | 21,219,726 | | | $ | 22,611,319 | |
Net realized loss on investments | | | (8,560,616 | ) | | | (1,093,417 | ) |
Net change in unrealized appreciation/depreciation | | | 6,101,692 | | | | (102,942,618 | ) |
| | | | | | | | |
Net increase/(decrease) in net assets resulting from operations | | | 18,760,802 | | | | (81,424,716 | ) |
Total distributions (Note 6) | | | (21,219,726 | ) | | | (22,665,986 | ) |
Net Fund share transactions (Note 4) | | | (59,002,733 | ) | | | (44,005,954 | ) |
| | | | | | | | |
Total decrease | | | (61,461,657 | ) | | | (148,096,656 | ) |
Net assets: | | | | | | | | |
Beginning of year | | | 860,282,396 | | | | 1,008,379,052 | |
| | | | | | | | |
End of year | | $ | 798,820,739 | | | $ | 860,282,396 | |
| | | | | | | | |
FINANCIAL HIGHLIGHTS
| | | | | | | | | | | | | | | | | | | | |
| Selected data for a share outstanding: | | For the years ended June 30, | |
| | | 2023 | | | 2022 | | | 2021 | | | 2020 | | | 2019 | |
Net asset value, beginning of year | | $ | 7.20 | | | $ | 8.02 | | | $ | 7.86 | | | $ | 7.83 | | | $ | 7.60 | |
| | | | | | | | | | | | | | | | | | | | |
Income from investment operations: | | | | | | | | | | | | | | | | | | | | |
Net investment income | | | 0.19 | | | | 0.18 | | | | 0.20 | | | | 0.21 | | | | 0.22 | |
Net gains/(losses) on investments (c) | | | (0.02 | ) | | | (0.82 | ) | | | 0.16 | | | | 0.03 | | | | 0.24 | |
| | | | | | | | | | | | | | | | | | | | |
Total from investment operations | | | 0.17 | | | | (0.64 | ) | | | 0.36 | | | | 0.24 | | | | 0.46 | |
Less distributions: | | | | | | | | | | | | | | | | | | | | |
Distributions from net investment income | | | (0.19 | ) | | | (0.18 | ) | | | (0.20 | ) | | | (0.21 | ) | | | (0.22 | ) |
Distributions from capital gains | | | 0.00 | | | | 0.00 | (b) | | | 0.00 | (b) | | | 0.00 | | | | (0.01 | ) |
| | | | | | | | | | | | | | | | | | | | |
Total distributions | | | (0.19 | ) | | | (0.18 | ) | | | (0.20 | ) | | | (0.21 | ) | | | (0.23 | ) |
| | | | | | | | | | | | | | | | | | | | |
Net asset value, end of year | | $ | 7.18 | | | $ | 7.20 | | | $ | 8.02 | | | $ | 7.86 | | | $ | 7.83 | |
| | | | | | | | | | | | | | | | | | | | |
Total return | | | 2.35% | | | | (8.11)% | | | | 4.63% | | | | 3.08% | | | | 6.22% | |
Net assets, end of year (in thousands) | | $ | 798,821 | | | $ | 860,282 | | | $ | 1,008,379 | | | $ | 973,889 | | | $ | 969,264 | |
Ratio of net expenses to average net assets (a) | | | 0.60% | | | | 0.56% | | | | 0.56% | | | | 0.56% | | | | 0.57% | |
Ratio of gross expenses to average net assets | | | 0.60% | | | | 0.56% | | | | 0.56% | | | | 0.56% | | | | 0.57% | |
Ratio of net investment income to average net assets | | | 2.59% | | | | 2.31% | | | | 2.46% | | | | 2.66% | | | | 2.88% | |
Portfolio turnover | | | 10.67% | | | | 14.39% | | | | 5.92% | | | | 4.59% | | | | 10.23% | |
| (a) | | Percentages are after custodian expense reduction for which no recovery will be sought. |
| (b) | | Rounds to less than $0.01. |
| (c) | | Realized and unrealized gains and losses per share in this caption may be balancing amounts necessary to reconcile the change in net asset value per share for the period, and may not reconcile with the Fund’s statement of operations due to share transactions for the period. |
The accompanying footnotes are an integral part of the financial statements.
14
DUPREE MUTUAL FUNDS — KENTUCKY TAX-FREE SHORT-TO-MEDIUM SERIES
SCHEDULE OF PORTFOLIO INVESTMENTS
Kentucky Municipal Bonds
June 30, 2023
| | | | | | | | | | | | | | | | | | |
| Bond Description | | Coupon | | | Maturity
Date | | | Rating# | | Par Value | | | Fair Value | |
| PUBLIC FACILITIES REVENUE BONDS | | | | | | | | | | | | | | | | | | |
| 17.70% of Net Assets | | | | | | | | | | | | | | | | | | |
KY Bond Development | | | 5.000 | % | | | 09/01/2026 | | | A3 | | $ | 1,000,000 | | | $ | 1,046,720 | |
KY State Certificate of Participation | | | 4.000 | | | | 06/15/2024 | | | A1 | | | 300,000 | | | | 301,764 | |
Lexington Fayette Urban County Government — Court Facilities | | | 5.000 | | | | 10/01/2024 | | | A1 | | | 700,000 | | | | 713,069 | |
Livingston County KY Public Properties | | | 5.000 | | | | 08/01/2024 | | | A1 | | | 555,000 | | | | 564,313 | |
Mercer County KY Public Property | | | 4.000 | | | | 08/01/2024 | | | A1 | | | 720,000 | | | | 723,938 | |
Oldham County KY Public Facilities | | | 5.000 | | | | 02/01/2025 | | | A1 | | | 325,000 | | | | 333,005 | |
Oldham County KY Public Facilities | | | 5.000 | | | | 02/01/2024 | | | A1 | | | 285,000 | | | | 287,648 | |
River City Parking Authority | | | 5.000 | | | | 12/01/2024 | | | Aa3 | | | 340,000 | | | | 348,466 | |
Taylor County KY Public Courthouse | | | 4.000 | | | | 09/01/2027 | | | A1 | | | 700,000 | | | | 713,335 | |
Warren County KY Justice Center Expansion Corporation** | | | 5.000 | | | | 09/01/2023 | | | A1 | | | 1,250,000 | | | | 1,253,012 | |
Wolfe County KY Public Properties Corporation | | | 4.000 | | | | 04/01/2025 | | | A1 | | | 280,000 | | | | 281,638 | |
| | | | | | | | | | | | | | | | | | |
| | | | | | | | | | | | | | | | | 6,566,908 | |
| SCHOOL IMPROVEMENT BONDS | | | | | | | | | | | | | | | | | | |
| 17.11% of Net Assets | | | | | | | | | | | | | | | | | | |
Anderson County KY School District Finance Corporation | | | 3.000 | | | | 02/01/2029 | | | A1 | | | 500,000 | | | | 497,445 | |
Barren County KY School District Finance Corporation | | | 5.000 | | | | 08/01/2023 | | | A1 | | | 500,000 | | | | 500,670 | |
Bowling Green KY Independent School District Finance Corporation | | | 5.000 | | | | 08/01/2027 | | | A1 | | | 695,000 | | | | 732,509 | |
Fayette County KY School District Finance Corporation | | | 5.000 | | | | 03/01/2024 | | | Aa3 | | | 250,000 | | | | 252,863 | |
Jefferson County KY School District Finance Corporation | | | 4.000 | | | | 12/01/2023 | | | Aa3 | | | 500,000 | | | | 501,260 | |
Jefferson County KY School District Finance Corporation | | | 4.000 | | | | 06/01/2030 | | | Aa3 | | | 1,245,000 | | | | 1,285,872 | |
Laurel County KY School District Finance Corporation | | | 4.000 | | | | 06/01/2024 | | | A1 | | | 465,000 | | | | 467,409 | |
Newport KY Independent School District Finance Corporation | | | 3.500 | | | | 11/01/2028 | | | A1 | | | 425,000 | | | | 425,315 | |
Pike County KY School District Finance Corporation | | | 5.000 | | | | 08/01/2024 | | | A1 | | | 250,000 | | | | 254,358 | |
Pike County KY School District Finance Corporation | | | 5.000 | | | | 02/01/2025 | | | A1 | | | 900,000 | | | | 922,590 | |
Pike County KY School District Finance Corporation | | | 5.000 | | | | 08/01/2025 | | | A1 | | | 200,000 | | | | 206,916 | |
Pike County KY School District Finance Corporation | | | 4.000 | | | | 02/01/2028 | | | A1 | | | 295,000 | | | | 301,027 | |
| | | | | | | | | | | | | | | | | | |
| | | | | | | | | | | | | | | | | 6,348,234 | |
| MISCELLANEOUS PUBLIC IMPROVEMENT BONDS | | | | | | | | | | | | | | | | | | |
| 12.06% of Net Assets | | | | | | | | | | | | | | | | | | |
KY Association of Counties | | | 4.000 | | | | 02/01/2029 | | | AA-* | | | 630,000 | | | | 656,561 | |
KY State Property & Building #108 | | | 5.000 | | | | 08/01/2028 | | | A1 | | | 755,000 | | | | 782,345 | |
KY State Property & Building #126 | | | 5.000 | | | | 05/01/2030 | | | A1 | | | 750,000 | | | | 839,108 | |
KY State Property & Building #127 | | | 5.000 | | | | 06/01/2029 | | | A1 | | | 1,000,000 | | | | 1,106,570 | |
Somerset KY | | | 5.000 | | | | 06/01/2028 | | | A1 | | | 605,000 | | | | 664,006 | |
Somerset KY | | | 5.000 | | | | 06/01/2029 | | | A1 | | | 380,000 | | | | 423,768 | |
| | | | | | | | | | | | | | | | | | |
| | | | | | | | | | | | | | | | | 4,472,358 | |
| TURNPIKES/TOLLROAD/HIGHWAY REVENUE BONDS | | | | | | | | | | | | | | | | | | |
| 11.67% of Net Assets | | | | | | | | | | | | | | | | | | |
KY Asset Liability Commission Federal Highway | | | 5.000 | | | | 09/01/2024 | | | A2 | | | 500,000 | | | | 510,230 | |
KY Asset Liability Commission Federal Highway | | | 5.000 | | | | 09/01/2026 | | | A2 | | | 565,000 | | | | 576,690 | |
KY Asset Liability Commission Federal Highway^ | | | 5.000 | | | | 09/01/2026 | | | A2 | | | 330,000 | | | | 341,359 | |
KY Asset Liability Project Notes | | | 4.000 | | | | 09/01/2023 | | | A2 | | | 250,000 | | | | 250,333 | |
KY State Turnpike Authority Economic Development | | | 5.000 | | | | 07/01/2024 | | | Aa3 | | | 1,175,000 | | | | 1,193,140 | |
KY State Turnpike Authority Economic Development | | | 5.000 | | | | 07/01/2026 | | | Aa3 | | | 1,385,000 | | | | 1,458,267 | |
| | | | | | | | | | | | | | | | | | |
| | | | | | | | | | | | | | | | | 4,330,019 | |
| UNIVERSITY CONSOLIDATED EDUCATION AND BUILDING REVENUE BONDS | | | | | |
| 10.99% of Net Assets | | | | | | | | | | | | | | | | | | |
KY Bond Development Corporation Educational Facilities Centre College | | | 4.000 | | | | 06/01/2030 | | | A3 | | | 170,000 | | | | 177,091 | |
University of Kentucky General Receipts | | | 4.000 | | | | 04/01/2028 | | | Aa2 | | | 750,000 | | | | 753,510 | |
University of Louisville | | | 5.000 | | | | 03/01/2024 | | | A1 | | | 350,000 | | | | 353,406 | |
University of Louisville** | | | 5.000 | | | | 03/01/2024 | | | A1 | | | 2,000,000 | | | | 2,019,460 | |
University of Louisville | | | 4.000 | | | | 09/01/2030 | | | A1 | | | 745,000 | | | | 773,869 | |
| | | | | | | | | | | | | | | | | | |
| | | | | | | | | | | | | | | | | 4,077,336 | |
The accompanying footnotes are an integral part of the financial statements.
15
DUPREE MUTUAL FUNDS — KENTUCKY TAX-FREE SHORT-TO-MEDIUM SERIES
SCHEDULE OF PORTFOLIO INVESTMENTS
Kentucky Municipal Bonds
June 30, 2023
| | | | | | | | | | | | | | | | | | |
| Bond Description | | Coupon | | | Maturity
Date | | | Rating# | | Par Value | | | Fair Value | |
| MUNICIPAL UTILITY REVENUE BONDS | | | | | | | | | | | | | | | | | | |
| 9.02% of Net Assets | | | | | | | | | | | | | | | | | | |
Campbell & Kenton Counties Sanitation District #1 | | | 4.000 | % | | | 08/01/2031 | | | Aa2 | | $ | 1,000,000 | | | $ | 1,025,090 | |
Frankfort Electric & Water | | | 4.000 | | | | 12/01/2023 | | | NR | | | 440,000 | | | | 440,726 | |
Henderson KY | | | 4.000 | | | | 06/01/2028 | | | Aa3 | | | 385,000 | | | | 401,763 | |
KY Rural Water Financing Corporation | | | 5.000 | | | | 08/01/2029 | | | AA-* | | | 595,000 | | | | 662,133 | |
Northern KY Water | | | 5.000 | | | | 02/01/2026 | | | Aa2 | | | 815,000 | | | | 816,011 | |
| | | | | | | | | | | | | | | | | | |
| | | | | | | | | | | | | | | | | 3,345,723 | |
| HOSPITAL AND HEALTHCARE REVENUE BONDS | | | | | | | | | | | | | | | | | | |
| 7.64% of Net Assets | | | | | | | | | | | | | | | | | | |
KY Bond Development Corporation St Elizabeth Medical Center^ | | | 5.000 | | | | 05/01/2024 | | | AA* | | | 1,440,000 | | | | 1,458,173 | |
Warren County KY Hospital | | | 5.000 | | | | 04/01/2032 | | | AA-* | | | 1,200,000 | | | | 1,374,540 | |
| | | | | | | | | | | | | | | | | | |
| | | | | | | | | | | | | | | | | 2,832,713 | |
| PREREFUNDED BONDS | | | | | | | | | | | | | | | | | | |
| 6.40% of Net Assets | | | | | | | | | | | | | | | | | | |
KY State Property & Building #106 | | | 5.000 | | | | 10/01/2024 | | | A1 | | | 750,000 | | | | 753,345 | |
KY State Property & Building #106 | | | 5.000 | | | | 10/01/2025 | | | A1 | | | 615,000 | | | | 617,730 | |
KY State Property & Building #106** | | | 5.000 | | | | 10/01/2026 | | | A1 | | | 1,000,000 | | | | 1,004,440 | |
| | | | | | | | | | | | | | | | | | |
| | | | | | | | | | | | | | | | | 2,375,515 | |
| AD VALOREM PROPERTY BONDS | | | | | | | | | | | | | | | | | | |
| 1.82% of Net Assets | | | | | | | | | | | | | | | | | | |
Henderson KY | | | 5.000 | | | | 09/01/2029 | | | Aa3 | | | 600,000 | | | | 675,738 | |
| | | | | | | | | | | | | | | | | | |
| REFUNDING BONDS | | | | | | | | | | | | | | | | | | |
| 1.58% of Net Assets | | | | | | | | | | | | | | | | | | |
KY State Property & Building #112 | | | 5.000 | | | | 11/01/2026 | | | A1 | | | 555,000 | | | | 587,795 | |
| | | | | | | | | | | | | | | | | | |
| AIRPORT REVENUE BONDS | | | | | | | | | | | | | | | | | | |
| 1.41% of Net Assets | | | | | | | | | | | | | | | | | | |
Kenton County Airport | | | 5.000 | | | | 01/01/2026 | | | A1 | | | 500,000 | | | | 522,955 | |
| | | | | | | | | | | | | | | | | | |
Total Investments 97.40% of Net Assets (cost $36,763,668) (See footnote 6 for further explanation) | | | | | | | | | $ | 36,135,294 | |
| | | | | | | | | | | | | | | | | | |
Other assets in excess of liabilities 2.60% | | | | | | | | | | | | | | | | | 963,113 | |
| | | | | | | | | | | | | | | | | | |
| Net Assets 100% | | | | | | | | | | | | | | | | $ | 37,098,407 | |
| | | | | | | | | | | | | | | | | | |
| | # | | Ratings by Moody’s Investors Service unless noted otherwise. |
| | | | Bond ratings are unaudited and not covered by Report of Independent Registered Public Accounting Firm. |
| | | | All ratings are as of the date indicated and do not reflect subsequent changes. |
| | ^ | | When-issued security or extended settlement — see footnote 1(D) |
| | ** | | Security is segregated against line of credit — see footnote 7 |
Other Information
The following is a summary of the inputs used, as of June 30, 2023, involving the Fund’s investments in securities carried at fair value. The inputs or methodology used for valuing securities may not be an indication of the risk associated with investing in those securities. For more information on valuation inputs, and their aggregation into the levels used in the table below, please refer to the Security Valuation section in the accompanying Notes to Financial Statements.
| | | | | | |
| | | Valuation Inputs | | Municipal Bonds | |
Level 1 | | Quoted Prices | | $ | — | |
Level 2 | | Other Significant Observable Inputs | | | 36,135,294 | |
Level 3 | | Significant Unobservable Inputs | | | — | |
| | | | | | |
| | | | $ | 36,135,294 | |
| | | | | | |
The accompanying footnotes are an integral part of the financial statements.
16
KENTUCKY TAX-FREE SHORT-TO-MEDIUM SERIES
STATEMENT OF ASSETS AND LIABILITIES
June 30, 2023
| | | | | | | | |
ASSETS: | | | | | | | | |
Investments in securities, at fair value (Cost: $36,763,668) | | | $ | 36,135,294 | |
Cash | | | | | | | 324,215 | |
Bond sold receivable | | | | | | | 2,044,037 | |
Interest receivable | | | | | | | 497,341 | |
| | | | | | | | |
Total assets | | | | | | | 39,000,887 | |
LIABILITIES: | | | | | | | | |
Payable for: | | | | | | | | |
Investments purchased | | | 1,818,161 | | | | | |
Distributions to shareholders | | | 24,566 | | | | | |
Fund shares redeemed | | | 1,080 | | | | | |
Investment advisory fee | | | 12,077 | | | | | |
Transfer agent fee | | | 4,230 | | | | | |
Audit fees | | | 9,831 | | | | | |
Professional fees | | | 6,964 | | | | | |
Registration fees | | | 6,333 | | | | | |
Custodian fee | | | 4,748 | | | | | |
Trustee fees | | | 1,982 | | | | | |
Accrued expenses | | | 12,508 | | | | | |
| | | | | | | | |
Total liabilities | | | | | | | 1,902,480 | |
| | | | | | | | |
NET ASSETS: | | | | | | | | |
Paid-in capital | | | | | | | 37,943,307 | |
Total accumulated loss | | | | | | | (844,900 | ) |
| | | | | | | | |
Total Net Assets | | | | | | $ | 37,098,407 | |
| | | | | | | | |
NET ASSET VALUE, offering price and redemption price per share
(7,280,145 shares outstanding; unlimited number of shares authorized; no par value) | | | | | | $ | 5.10 | |
| | | | | | | | |
STATEMENT OF OPERATIONS
For the year ended June 30, 2023
| | | | |
Net investment income: | | | | |
Interest income | | $ | 1,008,201 | |
| | | | |
Expenses: | | | | |
Investment advisory fee | | | 208,372 | |
Transfer agent fee | | | 56,009 | |
Professional fees | | | 12,542 | |
Registration fees | | | 11,715 | |
Custodian fee | | | 11,267 | |
Compliance fees | | | 7,300 | |
Trustees fees | | | 6,036 | |
Pricing fees | | | 4,060 | |
Other expenses | | | 12,101 | |
| | | | |
Total expenses | | | 329,402 | |
Fees waived by Adviser (Note 2) | | | (37,083 | ) |
Custodian fee reduction (Note 7) | | | (30 | ) |
| | | | |
Net expenses | | | 292,289 | |
| | | | |
Net investment income | | | 715,912 | |
| | | | |
Realized and unrealized loss on investments: | | | | |
Net realized loss | | | (131,616 | ) |
Net change in unrealized appreciation/depreciation | | | (154,214 | ) |
| | | | |
Net realized and unrealized loss on investments | | | (285,830 | ) |
| | | | |
Net increase in net assets resulting from operations | | $ | 430,082 | |
| | | | |
The accompanying footnotes are an integral part of the financial statements.
17
KENTUCKY TAX-FREE SHORT-TO-MEDIUM SERIES
STATEMENTS OF CHANGES IN NET ASSETS
For the years ended June 30, 2023 and 2022
| | | | | | | | |
| | | 2023 | | | 2022 | |
Operations: | | | | | | | | |
Net investment income | | $ | 715,912 | | | $ | 703,577 | |
Net realized gain/(loss) on investments | | | (131,616 | ) | | | 6,030 | |
Net change in unrealized appreciation/depreciation | | | (154,214 | ) | | | (2,409,895 | ) |
| | | | | | | | |
Net increase/(decrease) in net assets resulting from operations | | | 430,082 | | | | (1,700,288 | ) |
Total distributions (Note 6) | | | (715,912 | ) | | | (703,577 | ) |
Net Fund share transactions (Note 4) | | | (5,581,701 | ) | | | 281,173 | |
| | | | | | | | |
Total decrease | | | (5,867,531 | ) | | | (2,122,692 | ) |
Net assets: | | | | | | | | |
Beginning of year | | | 42,965,938 | | | | 45,088,630 | |
| | | | | | | | |
End of year | | $ | 37,098,407 | | | $ | 42,965,938 | |
| | | | | | | | |
FINANCIAL HIGHLIGHTS
| | | | | | | | | | | | | | | | | | | | |
| Selected data for a share outstanding: | | For the years ended June 30, | |
| | | 2023 | | | 2022 | | | 2021 | | | 2020 | | | 2019 | |
Net asset value, beginning of year | | $ | 5.13 | | | $ | 5.42 | | | $ | 5.41 | | | $ | 5.36 | | | $ | 5.22 | |
| | | | | | | | | | | | | | | | | | | | |
Income from investment operations: | | | | | | | | | | | | | | | | | | | | |
Net investment income | | | 0.09 | | | | 0.08 | | | | 0.09 | | | | 0.09 | | | | 0.09 | |
Net gains/(losses) on investments (b) | | | (0.03 | ) | | | (0.29 | ) | | | 0.01 | | | | 0.05 | | | | 0.14 | |
| | | | | | | | | | | | | | | | | | | | |
Total from investment operations | | | 0.06 | | | | (0.21 | ) | | | 0.10 | | | | 0.14 | | | | 0.23 | |
Less distributions: | | | | | | | | | | | | | | | | | | | | |
Distributions from net investment income | | | (0.09 | ) | | | (0.08 | ) | | | (0.09 | ) | | | (0.09 | ) | | | (0.09 | ) |
| | | | | | | | | | | | | | | | | | | | |
Net asset value, end of year | | $ | 5.10 | | | $ | 5.13 | | | $ | 5.42 | | | $ | 5.41 | | | $ | 5.36 | |
| | | | | | | | | | | | | | | | | | | | |
Total return | | | 1.14% | | | | (3.85)% | | | | 1.86% | | | | 2.66% | | | | 4.56% | |
Net assets, end of year (in thousands) | | $ | 37,098 | | | $ | 42,966 | | | $ | 45,089 | | | $ | 47,389 | | | $ | 55,419 | |
Ratio of net expenses to average net assets (a) | | | 0.70% | | | | 0.70% | | | | 0.70% | | | | 0.70% | | | | 0.70% | |
Ratio of gross expenses to average net assets | | | 0.79% | | | | 0.78% | | | | 0.78% | | | | 0.78% | | | | 0.77% | |
Ratio of net investment income to average net assets | | | 1.72% | | | | 1.57% | | | | 1.66% | | | | 1.70% | | | | 1.81% | |
Portfolio turnover | | | 16.52% | | | | 13.09% | | | | 10.00% | | | | 2.75% | | | | 4.88% | |
| (a) | | Percentages are after expense waivers and reductions by the Adviser and Custodian. The Adviser and Custodian have agreed not to seek recovery of these waivers and reductions. |
| (b) | | Realized and unrealized gains and losses per share in this caption may be balancing amounts necessary to reconcile the change in net asset value per share for the period and may not reconcile with the Fund’s statement of operations due to share transactions for the period. |
The accompanying footnotes are an integral part of the financial statements.
18
DUPREE MUTUAL FUNDS — MISSISSIPPI TAX-FREE INCOME SERIES
SCHEDULE OF PORTFOLIO INVESTMENTS
Mississippi Municipal Bonds
June 30, 2023
| | | | | | | | | | | | | | | | | | |
| Bond Description | | Coupon | | | Maturity
Date | | | Rating# | | Par Value | | | Fair Value | |
| UNIVERSITY CONSOLIDATED EDUCATION AND BUILDING REVENUE BONDS | | | | | | | | | | | |
| 32.76% of Net Assets | | | | | | | | | | | | | | | | | | |
Jackson State University Educational Building | | | 5.000 | % | | | 03/01/2034 | | | Aa2 | | $ | 440,000 | | | $ | 452,976 | |
Mississippi State University Educational Building | | | 5.000 | | | | 11/01/2032 | | | Aa2 | | | 125,000 | | | | 130,164 | |
MS Development Bank Special Obligation Gulf Coast Community Project** | | | 4.000 | | | | 12/01/2034 | | | AA-* | | | 300,000 | | | | 305,271 | |
MS Development Bank Special Obligation Northwest MS Community College | | | 4.000 | | | | 03/01/2039 | | | AA-* | | | 225,000 | | | | 224,730 | |
MS Development Bank Special Obligation Pearl River Community College | | | 5.000 | | | | 10/01/2033 | | | AA-* | | | 125,000 | | | | 137,251 | |
MS State University Educational Building Corporation Revenue | | | 5.000 | | | | 08/01/2033 | | | Aa2 | | | 225,000 | | | | 244,343 | |
MS State University Educational Building Corporation Revenue | | | 4.000 | | | | 08/01/2036 | | | Aa2 | | | 250,000 | | | | 253,288 | |
University of Mississippi Educational Building Corporation | | | 5.000 | | | | 10/01/2031 | | | Aa2 | | | 205,000 | | | | 216,824 | |
University of Mississippi Educational Building Corporation | | | 3.000 | | | | 10/01/2034 | | | Aa2 | | | 200,000 | | | | 194,208 | |
University of MS Educational Building Corporation | | | 5.000 | | | | 10/01/2036 | | | Aa2 | | | 100,000 | | | | 113,883 | |
University of MS Educational Building Corporation | | | 4.000 | | | | 10/01/2037 | | | Aa2 | | | 100,000 | | | | 102,328 | |
University Southern MS Educational Building Corporation | | | 5.000 | | | | 09/01/2033 | | | Aa2 | | | 360,000 | | | | 384,750 | |
| | | | | | | | | | | | | | | | | | |
| | | | | | | | | | | | | | | | | 2,760,016 | |
| PREREFUNDED BONDS | | | | | | | | | | | | | | | | | | |
| 16.30% of Net Assets | | | | | | | | | | | | | | | | | | |
MS Development Bank Special Obligation Brandon Public Improvement | | | 5.000 | | | | 11/01/2033 | | | Aa3 | | | 150,000 | | | | 153,716 | |
MS Development Bank Special Obligation Hattiesburg Water & Sewer | | | 4.750 | | | | 12/01/2038 | | | AA* | | | 700,000 | | | | 704,340 | |
MS Development Bank Special Obligation West Jackson County Utility District | | | 5.000 | | | | 12/01/2033 | | | A* | | | 50,000 | | | | 50,349 | |
MS State General Obligation | | | 5.000 | | | | 10/01/2033 | | | Aa2 | | | 150,000 | | | | 163,515 | |
MS State University Educational Building Corporation Revenue** | | | 5.250 | | | | 08/01/2038 | | | Aa2 | | | 300,000 | | | | 300,510 | |
| | | | | | | | | | | | | | | | | | |
| | | | | | | | | | | | | | | | | 1,372,430 | |
| TURNPIKES/TOLLROAD/HIGHWAY REVENUE BONDS | | | | | | | | | | | | | | | | | | |
| 9.27% of Net Assets | | | | | | | | | | | | | | | | | | |
MS Development Bank Special Obligation Highway Construction | | | 5.000 | | | | 01/01/2025 | | | Aa3 | | | 200,000 | | | | 205,064 | |
MS Development Bank Special Obligation Highway Construction | | | 5.000 | | | | 01/01/2029 | | | Aa3 | | | 300,000 | | | | 318,680 | |
MS Development Bank Special Obligation Highway Construction | | | 4.000 | | | | 01/01/2030 | | | Aa3 | | | 175,000 | | | | 179,897 | |
MS Development Bank Special Obligation Marshall County | | | 5.000 | | | | 01/01/2030 | | | Aa3 | | | 75,000 | | | | 76,965 | |
| | | | | | | | | | | | | | | | | | |
| | | | | | | | | | | | | | | | | 780,606 | |
| MISCELLANEOUS PUBLIC IMPROVEMENT BONDS | | | | | | | | | | | | | | | | | | |
| 7.73% of Net Assets | | | | | | | | | | | | | | | | | | |
Mississippi State | | | 3.000 | | | | 06/01/2038 | | | Aa2 | | | 100,000 | | | | 88,636 | |
Mississippi State Gaming Tax Revenue | | | 5.000 | | | | 10/15/2035 | | | A3 | | | 125,000 | | | | 128,865 | |
Mississippi State Gaming Tax Revenue | | | 5.000 | | | | 10/15/2037 | | | A-* | | | 125,000 | | | | 131,694 | |
MS Development Bank Special Obligation Pascagoula | | | 4.000 | | | | 07/01/2024 | | | AA* | | | 300,000 | | | | 301,641 | |
| | | | | | | | | | | | | | | | | | |
| | | | | | | | | | | | | | | | | 650,836 | |
| STATE AND LOCAL MORTGAGE/HOUSING REVENUE BONDS | | | | | | | | | | | | | | | | | | |
| 6.95% of Net Assets | | | | | | | | | | | | | | | | | | |
Mississippi State Home Corporation | | | 3.950 | | | | 12/01/2042 | | | Aaa | | | 100,000 | | | | 96,058 | |
Mississippi State Home Corporation | | | 4.400 | | | | 12/01/2043 | | | Aaa | | | 350,000 | | | | 350,720 | |
Mississippi State Home Corporation | | | 4.050 | | | | 12/01/2047 | | | Aaa | | | 150,000 | | | | 138,383 | |
| | | | | | | | | | | | | | | | | | |
| | | | | | | | | | | | | | | | | 585,161 | |
| REFUNDING BONDS | | | | | | | | | | | | | | | | | | |
| 6.34% of Net Assets | | | | | | | | | | | | | | | | | | |
MS State Refunding** | | | 4.000 | | | | 10/01/2036 | | | Aa2 | | | 290,000 | | | | 295,095 | |
Starkville MS | | | 4.000 | | | | 06/01/2032 | | | A1 | | | 230,000 | | | | 238,522 | |
| | | | | | | | | | | | | | | | | | |
| | | | | | | | | | | | | | | | | 533,617 | |
| SCHOOL IMPROVEMENT BONDS | | | | | | | | | | | | | | | | | | |
| 6.11% of Net Assets | | | | | | | | | | | | | | | | | | |
MS Development Bank Special Obligation Canton School District | | | 5.000 | | | | 12/01/2033 | | | A1 | | | 100,000 | | | | 104,608 | |
MS Development Bank Special Obligation Lafayette County School District | | | 4.000 | | | | 04/01/2033 | | | AA* | | | 100,000 | | | | 101,953 | |
MS Development Bank Special Obligation Meridian Schools | | | 4.000 | | | | 04/01/2039 | | | A2 | | | 100,000 | | | | 99,072 | |
MS Development Bank Special Obligation Rankin School District | | | 4.000 | | | | 06/01/2038 | | | AA* | | | 100,000 | | | | 100,213 | |
The accompanying footnotes are an integral part of the financial statements.
19
DUPREE MUTUAL FUNDS — MISSISSIPPI TAX-FREE INCOME SERIES
SCHEDULE OF PORTFOLIO INVESTMENTS
Mississippi Municipal Bonds
June 30, 2023
| | | | | | | | | | | | | | | | | | |
| Bond Description | | Coupon | | | Maturity
Date | | | Rating# | | Par Value | | | Fair Value | |
MS Development Bank Special Obligation Vicksburg Warren School District | | | 5.500 | % | | | 03/01/2038 | | | AA* | | $ | 100,000 | | | $ | 109,018 | |
| | | | | | | | | | | | | | | | | | |
| | | | | | | | | | | | | | | | | 514,864 | |
| MUNICIPAL UTILITY REVENUE BONDS | | | | | | | | | | | | | | | | | | |
| 5.68% of Net Assets | | | | | | | | | | | | | | | | | | |
MS Development Bank Special Obligation Diamondhead Water & Sewer | | | 4.000 | | | | 07/01/2046 | | | A+* | | | 175,000 | | | | 167,874 | |
MS Development Bank Special Obligation Jackson Water & Sewer | | | 6.875 | | | | 12/01/2040 | | | Ba2 | | | 150,000 | | | | 151,746 | |
MS Development Bank Special Obligation Tupelo | | | 5.000 | | | | 05/01/2033 | | | Aa2 | | | 150,000 | | | | 158,595 | |
| | | | | | | | | | | | | | | | | | |
| | | | | | | | | | | | | | | | | 478,215 | |
| HOSPITAL AND HEALTHCARE REVENUE BONDS | | | | | | | | | | | | | | | | | | |
| 5.26% of Net Assets | | | | | | | | | | | | | | | | | | |
Jones County MS Hospital | | | 4.000 | | | | 04/01/2026 | | | AA* | | | 305,000 | | | | 311,612 | |
Medical Center Educational Building Corporation MS Revenue | | | 5.500 | | | | 12/01/2023 | | | Aa2 | | | 20,000 | | | | 20,182 | |
Medical Center Educational Building Corporation MS Revenue | | | 5.000 | | | | 06/01/2035 | | | Aa2 | | | 100,000 | | | | 110,886 | |
| | | | | | | | | | | | | | | | | | |
| | | | | | | | | | | | | | | | | 442,680 | |
| PUBLIC FACILITIES REVENUE BONDS | | | | | | | | | | | | | | | | | | |
| 1.20% of Net Assets | | | | | | | | | | | | | | | | | | |
MS Development Bank Special Obligation Tupelo | | | 4.000 | | | | 07/01/2037 | | | Aa2 | | | 100,000 | | | | 101,333 | |
| | | | | | | | | | | | | | | | | | |
Total Investments 97.60% of Net Assets (cost $8,334,509) (See footnote 6 for further explanation) | | | | | | | | | $ | 8,219,758 | |
| | | | | | | | | | | | | | | | | | |
Other assets in excess of liabilities 2.40% | | | | | | | | | | | | | | | | | 202,307 | |
| | | | | | | | | | | | | | | | | | |
Net Assets 100% | | | | | | | | | | | | | | | | $ | 8,422,065 | |
| | | | | | | | | | | | | | | | | | |
| | # | | Ratings by Moody’s Investors Service unless noted otherwise. |
| | | | Bond ratings are unaudited and not covered by Report of Independent Registered Public Accounting Firm. |
| | | | All ratings are as of the date indicated and do not reflect subsequent changes. |
| | * | | Rated by Standard & Poor’s Corporation |
| | ** | | Security is segregated against line of credit — see footnote 7 |
Other Information
The following is a summary of the inputs used, as of June 30, 2023, involving the Fund’s investments in securities carried at fair value. The inputs or methodology used for valuing securities may not be an indication of the risk associated with investing in those securities. For more information on valuation inputs, and their aggregation into the levels used in the table below, please refer to the Security Valuation section in the accompanying Notes to Financial Statements.
| | | | | | |
| | | Valuation Inputs | | Municipal Bonds | |
Level 1 | | Quoted Prices | | $ | — | |
Level 2 | | Other Significant Observable Inputs | | | 8,219,758 | |
Level 3 | | Significant Unobservable Inputs | | | — | |
| | | | | | |
| | | | $ | 8,219,758 | |
| | | | | | |
The accompanying footnotes are an integral part of the financial statements.
20
MISSISSIPPI TAX-FREE INCOME SERIES
STATEMENT OF ASSETS AND LIABILITIES
June 30, 2023
| | | | | | | | |
| ASSETS: | | | | | | | | |
Investments in securities, at fair value (Cost: $8,334,509) | | | $ | 8,219,758 | |
Cash | | | | | | | 159,112 | |
Interest receivable | | | | | | | 94,802 | |
| | | | | | | | |
Total assets | | | | | | | 8,473,672 | |
LIABILITIES: | | | | | | | | |
Payable for: | | | | | | | | |
Distributions to shareholders | | | 29,434 | | | | | |
Fund shares redeemed | | | 2,236 | | | | | |
Investment advisory fee | | | 934 | | | | | |
Transfer agent fee | | | 2,695 | | | | | |
Compliance fees | | | 4,016 | | | | | |
Printing expense | | | 2,798 | | | | | |
Audit fees | | | 1,663 | | | | | |
Professional fees | | | 1,474 | | | | | |
Custodian fee | | | 810 | | | | | |
Trustees fees | | | 656 | | | | | |
Accrued expenses | | | 4,891 | | | | | |
| | | | | | | | |
Total liabilities | | | | | | | 51,607 | |
| | | | | | | | |
NET ASSETS: | | | | | | | | |
Paid-in capital | | | | | | | 8,971,220 | |
Total accumulated loss | | | | (549,155 | ) |
| | | | | | | | |
Total Net Assets | | | | | | $ | 8,422,065 | |
| | | | | | | | |
NET ASSET VALUE, offering price and redemption price per share
(760,150 shares outstanding; unlimited number of shares authorized; no par value) | | | | | | $ | 11.08 | |
| | | | | | | | |
STATEMENT OF OPERATIONS
For the year ended June 30, 2023
| | | | |
Net investment income: | | | | |
Interest income | | $ | 272,998 | |
| | | | |
Expenses: | | | | |
Investment advisory fee | | | 44,375 | |
Transfer agent fee | | | 13,312 | |
Registration fees | | | 10,008 | |
Compliance fees | | | 7,055 | |
Custodian fee | | | 6,265 | |
Pricing fees | | | 5,001 | |
Professional fees | | | 2,675 | |
Trustees fees | | | 1,300 | |
Other expenses | | | 3,590 | |
| | | | |
Total expenses | | | 93,581 | |
Fees waived by Adviser (Note 2) | | | (31,513 | ) |
Custodian fee reduction (Note 7) | | | (17 | ) |
| | | | |
Net expenses | | | 62,051 | |
| | | | |
Net investment income | | | 210,947 | |
| | | | |
Realized and unrealized gain/(loss) on investments: | | | | |
Net realized loss | | | (434,469 | ) |
Net change in unrealized appreciation/depreciation | | | 232,834 | |
| | | | |
Net realized and unrealized loss on investments | | | (201,635 | ) |
| | | | |
Net increase in net assets resulting from operations | | $ | 9,312 | |
| | | | |
The accompanying footnotes are an integral part of the financial statements.
21
MISSISSIPPI TAX-FREE INCOME SERIES
STATEMENTS OF CHANGES IN NET ASSETS
For the years ended June 30, 2023 and the year 2022
| | | | | | | | |
| | | 2023 | | | 2022 | |
Operations: | | | | | | | | |
Net investment income | | $ | 210,947 | | | $ | 226,994 | |
Net realized gain/(loss) on investments | | | (434,469 | ) | | | 1,817 | |
Net change in unrealized appreciation/depreciation | | | 232,834 | | | | (1,080,034 | ) |
| | | | | | | | |
Net increase/(decrease) in net assets resulting from operations | | | 9,312 | | | | (851,223 | ) |
Total distributions (Note 6) | | | (212,273 | ) | | | (247,437 | ) |
Net Fund share transactions (Note 4) | | | (1,404,653 | ) | | | (283,311 | ) |
| | | | | | | | |
Total decrease | | | (1,607,614 | ) | | | (1,381,971 | ) |
Net assets: | | | | | | | | |
Beginning of year | | | 10,029,679 | | | | 11,411,650 | |
| | | | | | | | |
End of year | | $ | 8,422,065 | | | $ | 10,029,679 | |
| | | | | | | | |
FINANCIAL HIGHLIGHTS
| | | | | | | | | | | | | | | | | | | | |
| Selected data for a share outstanding: | | For the years ended June 30, | |
| | | 2023 | | | 2022 | | | 2021 | | | 2020 | | | 2019 | |
Net asset value, beginning of year | | $ | 11.22 | | | $ | 12.40 | | | $ | 12.37 | | | $ | 12.21 | | | $ | 11.92 | |
| | | | | | | | | | | | | | | | | | | | |
Income from investment operations: | | | | | | | | | | | | | | | | | | | | |
Net investment income | | | 0.26 | | | | 0.25 | | | | 0.27 | | | | 0.31 | | | | 0.33 | |
Net gains/(losses) on investments (c) | | | (0.14 | ) | | | (1.16 | ) | | | 0.05 | | | | 0.18 | | | | 0.29 | |
| | | | | | | | | | | | | | | | | | | | |
Total from investment operations | | | 0.12 | | | | (0.91 | ) | | | 0.32 | | | | 0.49 | | | | 0.62 | |
Less distributions: | | | | | | | | | | | | | | | | | | | | |
Distributions from net investment income | | | (0.26 | ) | | | (0.25 | ) | | | (0.27 | ) | | | (0.31 | ) | | | (0.33 | ) |
Distributions from capital gains | | | 0.00 | (b) | | | (0.02 | ) | | | (0.02 | ) | | | (0.02 | ) | | | 0.00 | (b) |
| | | | | | | | | | | | | | | | | | | | |
Total distributions | | | (0.26 | ) | | | (0.27 | ) | | | (0.29 | ) | | | (0.33 | ) | | | (0.33 | ) |
| | | | | | | | | | | | | | | | | | | | |
Net asset value, end of year | | $ | 11.08 | | | $ | 11.22 | | | $ | 12.40 | | | $ | 12.37 | | | $ | 12.21 | |
| | | | | | | | | | | | | | | | | | | | |
Total return | | | 1.16% | | | | (7.46)% | | | | 2.68% | | | | 4.01% | | | | 5.29% | |
Net assets, end of year (in thousands) | | $ | 8,422 | | | $ | 10,030 | | | $ | 11,412 | | | $ | 11,111 | | | $ | 11,325 | |
Ratio of net expenses to average net assets (a) | | | 0.70% | | | | 0.70% | | | | 0.70% | | | | 0.70% | | | | 0.70% | |
Ratio of gross expenses to average net assets | | | 1.06% | | | | 0.96% | | | | 0.96% | | | | 0.99% | | | | 0.97% | |
Ratio of net investment income to average net assets | | | 2.38% | | | | 2.06% | | | | 2.21% | | | | 2.51% | | | | 2.75% | |
Portfolio turnover | | | 22.86% | | | | 9.15% | | | | 8.85% | | | | 10.26% | | | | 4.65% | |
| (a) | | Percentages are after expense waivers and reductions by the Adviser and Custodian. The Adviser and Custodian have agreed not to seek recovery of these waivers and reductions. |
| (b) | | Rounds to less than $0.01. |
| (c) | | Realized and unrealized gains and losses per share in this caption may be balancing amounts necessary to reconcile the change in net asset value per share for the period, and may not reconcile with the Fund’s statement of operations due to share transactions for the period. |
The accompanying footnotes are an integral part of the financial statements.
22
DUPREE MUTUAL FUNDS — NORTH CAROLINA TAX-FREE INCOME SERIES
SCHEDULE OF PORTFOLIO INVESTMENTS
North Carolina Municipal Bonds
June 30, 2023
| | | | | | | | | | | | | | | | | | |
| Bond Description | | Coupon | | | Maturity
Date | | | Rating# | | Par Value | | | Fair Value | |
| SCHOOL IMPROVEMENT BONDS | | | | | | | | | | | | | | | | | | |
| 20.20% of Net Assets | | | | | | | | | | | | | | | | | | |
Brunswick County NC Limited Obligation | | | 5.000 | % | | | 06/01/2030 | | | Aa1 | | $ | 250,000 | | | $ | 259,490 | |
Brunswick County NC Limited Obligation | | | 5.000 | | | | 06/01/2031 | | | Aa1 | | | 250,000 | | | | 259,633 | |
Buncombe County NC Limited Obligation | | | 4.000 | | | | 06/01/2036 | | | Aa1 | | | 125,000 | | | | 129,979 | |
Burke County NC Limited Obligation | | | 4.000 | | | | 04/01/2034 | | | Aa3 | | | 250,000 | | | | 256,743 | |
Cabarrus County NC Limited Obligation | | | 4.000 | | | | 06/01/2034 | | | Aa1 | | | 795,000 | | | | 820,607 | |
Cabarrus County NC Limited Obligation | | | 5.000 | | | | 04/01/2035 | | | Aa1 | | | 1,435,000 | | | | 1,518,417 | |
Cabarrus County NC Limited Obligation | | | 4.000 | | | | 06/01/2035 | | | Aa1 | | | 1,650,000 | | | | 1,694,550 | |
Catawba County NC Limited Obligation | | | 4.000 | | | | 04/01/2042 | | | Aa2 | | | 420,000 | | | | 421,327 | |
Catawba County NC Limited Obligation | | | 4.000 | | | | 04/01/2043 | | | Aa2 | | | 320,000 | | | | 319,549 | |
Chatham County NC Limited Obligation | | | 4.000 | | | | 11/01/2036 | | | Aa2 | | | 750,000 | | | | 767,715 | |
Chatham County NC Limited Obligation | | | 4.000 | | | | 11/01/2037 | | | Aa2 | | | 2,000,000 | | | | 2,035,520 | |
Davidson County NC Limited Obligation | | | 5.000 | | | | 06/01/2032 | | | Aa2 | | | 500,000 | | | | 530,765 | |
Duplin County NC Limited Obligation | | | 5.000 | | | | 04/01/2032 | | | A1 | | | 750,000 | | | | 789,923 | |
Duplin County NC Limited Obligation | | | 5.000 | | | | 04/01/2034 | | | A1 | | | 865,000 | | | | 909,643 | |
Henderson County NC Limited Obligation | | | 4.000 | | | | 06/01/2034 | | | Aa2 | | | 200,000 | | | | 206,488 | |
Henderson County NC Limited Obligation | | | 4.000 | | | | 06/01/2037 | | | Aa2 | | | 750,000 | | | | 767,753 | |
Henderson County NC Limited Obligation | | | 4.000 | | | | 06/01/2038 | | | Aa2 | | | 500,000 | | | | 508,155 | |
Onslow County NC Limited Obligation | | | 5.000 | | | | 06/01/2033 | | | Aa2 | | | 500,000 | | | | 519,265 | |
Pitt County NC Limited Obligation | | | 4.000 | | | | 04/01/2031 | | | Aa2 | | | 500,000 | | | | 516,935 | |
Pitt County NC Limited Obligation | | | 4.000 | | | | 04/01/2034 | | | Aa2 | | | 550,000 | | | | 565,356 | |
Randolph County NC Limited Obligation | | | 3.000 | | | | 10/01/2036 | | | Aa3 | | | 325,000 | | | | 296,205 | |
Randolph County NC Limited Obligation | | | 4.000 | | | | 10/01/2037 | | | Aa3 | | | 250,000 | | | | 253,025 | |
Randolph County NC Limited Obligation | | | 4.000 | | | | 10/01/2039 | | | Aa3 | | | 250,000 | | | | 250,813 | |
Rutherford County NC Limited Obligation | | | 4.000 | | | | 03/01/2037 | | | A1 | | | 410,000 | | | | 414,293 | |
Rutherford County NC Limited Obligation | | | 4.000 | | | | 03/01/2039 | | | A1 | | | 500,000 | | | | 497,100 | |
Rutherford County NC Limited Obligation | | | 4.000 | | | | 03/01/2040 | | | A1 | | | 325,000 | | | | 320,317 | |
Sampson County NC Limited Obligation | | | 5.000 | | | | 12/01/2033 | | | A1 | | | 1,975,000 | | | | 2,062,231 | |
Sampson County NC Limited Obligation | | | 5.000 | | | | 09/01/2040 | | | A1 | | | 750,000 | | | | 785,835 | |
Scotland County NC | | | 4.500 | | | | 12/01/2036 | | | A* | | | 1,170,000 | | | | 1,195,354 | |
Surry County NC Limited Obligation | | | 4.000 | | | | 06/01/2034 | | | Aa3 | | | 350,000 | | | | 363,069 | |
Surry County NC Limited Obligation | | | 4.000 | | | | 06/01/2036 | | | Aa3 | | | 590,000 | | | | 601,835 | |
Surry County NC Limited Obligation | | | 4.000 | | | | 06/01/2037 | | | Aa3 | | | 730,000 | | | | 736,884 | |
Wake County NC Limited Obligation | | | 4.000 | | | | 09/01/2037 | | | Aa1 | | | 750,000 | | | | 769,358 | |
Wayne County NC | | | 4.000 | | | | 06/01/2034 | | | Aa3 | | | 1,500,000 | | | | 1,536,615 | |
Wilkes County NC Limited Obligation | | | 5.000 | | | | 06/01/2031 | | | A1 | | | 350,000 | | | | 363,353 | |
| | | | | | | | | | | | | | | | | | |
| | | | | | | | | | | | | | | | | 24,244,100 | |
| PUBLIC FACILITIES REVENUE BONDS | | | | | | | | | | | | | | | | | | |
| 16.40% of Net Assets | | | | | | | | | | | | | | | | | | |
Charlotte NC Certificate of Participation | | | 4.000 | | | | 06/01/2036 | | | Aa2 | | | 1,000,000 | | | | 1,029,740 | |
Charlotte NC Certificate of Participation | | | 4.000 | | | | 06/01/2037 | | | Aa2 | | | 3,000,000 | | | | 3,063,390 | |
Charlotte NC Certificate of Participation Convention Facility Project | | | 4.000 | | | | 06/01/2037 | | | Aa2 | | | 500,000 | | | | 509,765 | |
Charlotte NC Certificate of Participation Convention Facility Project | | | 4.000 | | | | 06/01/2039 | | | Aa2 | | | 1,000,000 | | | | 1,012,080 | |
Davidson County NC Limited Obligation | | | 4.000 | | | | 06/01/2037 | | | Aa2 | | | 200,000 | | | | 204,734 | |
Davidson County NC Limited Obligation | | | 4.000 | | | | 06/01/2040 | | | Aa2 | | | 635,000 | | | | 639,953 | |
Durham NC Limited Obligation | | | 4.000 | | | | 04/01/2036 | | | Aa1 | | | 1,000,000 | | | | 1,024,320 | |
Harnett County NC Limited Obligation | | | 4.000 | | | | 10/01/2038 | | | Aa3 | | | 1,055,000 | | | | 1,068,945 | |
Henderson County NC Limited Obligation | | | 5.000 | | | | 10/01/2030 | | | Aa2 | | | 250,000 | | | | 261,358 | |
Henderson County NC Limited Obligation | | | 5.000 | | | | 10/01/2031 | | | Aa2 | | | 500,000 | | | | 522,715 | |
Hoke County NC Limited Obligation | | | 3.000 | | | | 06/01/2039 | | | Aa3 | | | 1,065,000 | | | | 909,883 | |
Hoke County NC Limited Obligation | | | 3.000 | | | | 06/01/2040 | | | Aa3 | | | 750,000 | | | | 631,208 | |
Kannapolis NC Limited Obligation | | | 5.000 | | | | 04/01/2032 | | | A1 | | | 500,000 | | | | 506,170 | |
Moore County NC | | | 3.000 | | | | 06/01/2039 | | | Aa2 | | | 350,000 | | | | 306,054 | |
Onslow County NC Limited Obligation | | | 5.000 | | | | 06/01/2032 | | | Aa2 | | | 500,000 | | | | 519,455 | |
Orange County NC | | | 4.000 | | | | 10/01/2036 | | | Aa1 | | | 375,000 | | | | 386,070 | |
Orange County NC | | | 4.000 | | | | 10/01/2037 | | | Aa1 | | | 375,000 | | | | 383,948 | |
Orange County NC | | | 4.000 | | | | 10/01/2038 | | | Aa1 | | | 275,000 | | | | 280,016 | |
The accompanying footnotes are an integral part of the financial statements.
23
DUPREE MUTUAL FUNDS — NORTH CAROLINA TAX-FREE INCOME SERIES
SCHEDULE OF PORTFOLIO INVESTMENTS
North Carolina Municipal Bonds
June 30, 2023
| | | | | | | | | | | | | | | | | | |
| Bond Description | | Coupon | | | Maturity
Date | | | Rating# | | Par Value | | | Fair Value | |
Orange County NC | | | 4.000 | % | | | 10/01/2038 | | | Aa1 | | $ | 765,000 | | | $ | 778,954 | |
Orange County NC | | | 4.000 | | | | 10/01/2039 | | | Aa1 | | | 200,000 | | | | 202,532 | |
Raleigh NC Limited Obligation | | | 5.000 | | | | 10/01/2034 | | | Aa1 | | | 1,420,000 | | | | 1,456,180 | |
Randolph County NC Limited Obligation | | | 4.000 | | | | 10/01/2036 | | | Aa3 | | | 250,000 | | | | 256,108 | |
Randolph County NC Limited Obligation | | | 4.000 | | | | 10/01/2038 | | | Aa3 | | | 670,000 | | | | 672,915 | |
Surry County NC Limited Obligation** | | | 3.000 | | | | 10/01/2038 | | | Aa3 | | | 395,000 | | | | 345,665 | |
Surry County NC Limited Obligation | | | 3.000 | | | | 10/01/2039 | | | Aa3 | | | 1,000,000 | | | | 856,450 | |
Surry County NC Limited Obligation | | | 3.000 | | | | 10/01/2041 | | | Aa3 | | | 1,135,000 | | | | 936,999 | |
Thomasville NC Revenue | | | 4.000 | | | | 05/01/2036 | | | Aa3 | | | 500,000 | | | | 509,900 | |
Wilmington NC Limited Obligation | | | 4.000 | | | | 06/01/2036 | | | Aa1 | | | 230,000 | | | | 238,729 | |
Wilmington NC Limited Obligation | | | 4.000 | | | | 06/01/2037 | | | Aa1 | | | 170,000 | | | | 174,969 | |
| | | | | | | | | | | | | | | | | | |
| | | | | | | | | | | | | | | | | 19,689,205 | |
| MUNICIPAL UTILITY REVENUE BONDS | | | | | | | | | | | | | | | | | | |
| 15.10% of Net Assets | | | | | | | | | | | | | | | | | | |
Brunswick County NC Enterprise System Revenue | | | 5.000 | | | | 04/01/2031 | | | Aa2 | | | 500,000 | | | | 516,930 | |
Brunswick County NC Enterprise System Revenue | | | 4.000 | | | | 04/01/2039 | | | Aa2 | | | 1,000,000 | | | | 1,008,660 | |
Brunswick County NC Enterprise System Revenue | | | 3.000 | | | | 04/01/2046 | | | Aa2 | | | 500,000 | | | | 395,685 | |
Buncombe County NC Metropolitan Sewer District | | | 5.000 | | | | 07/01/2039 | | | Aaa | | | 550,000 | | | | 560,951 | |
Cary NC Combined Enterprise System Revenue | | | 4.000 | | | | 12/01/2042 | | | Aaa | | | 750,000 | | | | 756,638 | |
Clayton NC Water & Sewer Revenue | | | 5.000 | | | | 08/01/2040 | | | Aa3 | | | 700,000 | | | | 783,993 | |
Concord NC Utilities System Revenue | | | 4.500 | | | | 12/01/2034 | | | Aa2 | | | 1,000,000 | | | | 1,041,610 | |
Durham NC Utility System Revenue | | | 3.000 | | | | 08/01/2042 | | | Aa1 | | | 1,250,000 | | | | 1,060,263 | |
Fuquay-Varina NC Combined Utilities Revenue | | | 5.000 | | | | 04/01/2040 | | | Aa2 | | | 1,000,000 | | | | 1,037,390 | |
Gastonia NC Combined Utilities System Revenue | | | 5.000 | | | | 05/01/2034 | | | Aa2 | | | 570,000 | | | | 590,298 | |
Gastonia NC Combined Utilities System Revenue | | | 5.000 | | | | 05/01/2035 | | | Aa2 | | | 250,000 | | | | 259,175 | |
Lincoln County NC Enterprise System Revenue | | | 3.000 | | | | 08/01/2038 | | | AA* | | | 160,000 | | | | 141,502 | |
Lincoln County NC Enterprise System Revenue | | | 3.000 | | | | 08/01/2039 | | | AA* | | | 340,000 | | | | 296,990 | |
Lincoln County NC Enterprise System Revenue | | | 3.000 | | | | 08/01/2040 | | | AA* | | | 265,000 | | | | 228,843 | |
Lincoln County NC Enterprise System Revenue | | | 3.000 | | | | 08/01/2041 | | | AA* | | | 240,000 | | | | 203,758 | |
Martin County NC Limited Obligation Water and Sewer District | | | 4.750 | | | | 06/01/2034 | | | A2 | | | 1,150,000 | | | | 1,164,004 | |
NC Municipal Power Agency #1 Catawba Electric Revenue | | | 5.000 | | | | 01/01/2032 | | | A* | | | 500,000 | | | | 521,850 | |
Pender County NC Limited Obligation | | | 3.000 | | | | 06/01/2038 | | | Aa3 | | | 490,000 | | | | 430,279 | |
Pender County NC Limited Obligation | | | 3.000 | | | | 06/01/2045 | | | Aa3 | | | 500,000 | | | | 394,970 | |
Sampson County NC Water & Sewer District | | | 5.000 | | | | 06/01/2037 | | | A1/A* | | | 920,000 | | | | 947,453 | |
Union County NC Enterprise System Revenue | | | 4.000 | | | | 06/01/2038 | | | Aa2 | | | 500,000 | | | | 509,230 | |
Union County NC Enterprise System Revenue | | | 4.000 | | | | 06/01/2044 | | | Aa2 | | | 1,750,000 | | | | 1,735,248 | |
Union County NC Enterprise System Revenue | | | 3.000 | | | | 06/01/2046 | | | Aa2 | | | 1,500,000 | | | | 1,193,145 | |
Union County NC Enterprise System Revenue | | | 3.000 | | | | 06/01/2051 | | | Aa2 | | | 250,000 | | | | 193,710 | |
Wake County NC Industrial Facilities & Pollution Control Duke Energy | | | 4.000 | | | | 06/01/2041 | | | Aa3 | | | 1,260,000 | | | | 1,237,799 | |
Wilmington NC Storm Water Revenue | | | 5.000 | | | | 06/01/2035 | | | Aa2 | | | 500,000 | | | | 519,455 | |
Winston Salem NC Water & Sewer System Revenue | | | 3.000 | | | | 06/01/2046 | | | Aa1 | | | 500,000 | | | | 401,435 | |
| | | | | | | | | | | | | | | | | | |
| | | | | | | | | | | | | | | | | 18,131,264 | |
| UNIVERSITY CONSOLIDATED EDUCATION AND BUILDING REVENUE BONDS | |
| 11.72% of Net Assets | | | | | | | | | | | | | | | | | | |
Appalachian NC State University | | | 4.000 | | | | 05/01/2033 | | | A1 | | | 500,000 | | | | 515,735 | |
Appalachian NC State University** | | | 5.000 | | | | 05/01/2036 | | | A1 | | | 1,000,000 | | | | 1,074,910 | |
Iredell County NC Community College | | | 5.000 | | | | 04/01/2026 | | | Aaa | | | 225,000 | | | | 225,232 | |
Iredell County NC Community College | | | 5.000 | | | | 04/01/2027 | | | Aaa | | | 325,000 | | | | 325,293 | |
Scotland County NC | | | 5.000 | | | | 12/01/2033 | | | A* | | | 250,000 | | | | 266,490 | |
University of NC at Asheville | | | 4.000 | | | | 06/01/2036 | | | A2 | | | 1,350,000 | | | | 1,375,633 | |
University of NC at Charlotte Board of Governors | | | 4.000 | | | | 10/01/2037 | | | Aa3 | | | 750,000 | | | | 756,983 | |
University of NC at Charlotte Board of Governors | | | 5.000 | | | | 10/01/2042 | | | Aa3 | | | 250,000 | | | | 263,170 | |
University of NC at Wilmington | | | 4.000 | | | | 10/01/2037 | | | Aa3 | | | 750,000 | | | | 760,748 | |
University of NC Charlotte | | | 4.000 | | | | 10/01/2035 | | | Aa3 | | | 250,000 | | | | 254,988 | |
University of NC Charlotte | | | 4.000 | | | | 10/01/2036 | | | Aa3 | | | 250,000 | | | | 254,493 | |
University of NC Greensboro | | | 4.000 | | | | 04/01/2035 | | | Aa3 | | | 750,000 | | | | 769,898 | |
University of NC Greensboro | | | 4.000 | | | | 04/01/2036 | | | Aa3 | | | 500,000 | | | | 509,740 | |
University of NC Greensboro | | | 5.000 | | | | 04/01/2038 | | | Aa3 | | | 425,000 | | | | 455,167 | |
The accompanying footnotes are an integral part of the financial statements.
24
DUPREE MUTUAL FUNDS — NORTH CAROLINA TAX-FREE INCOME SERIES
SCHEDULE OF PORTFOLIO INVESTMENTS
North Carolina Municipal Bonds
June 30, 2023
| | | | | | | | | | | | | | | | | | |
| Bond Description | | Coupon | | | Maturity
Date | | | Rating# | | Par Value | | | Fair Value | |
University of NC Wilmington | | | 4.000 | % | | | 04/01/2037 | | | Aa3 | | $ | 385,000 | | | $ | 390,717 | |
University of NC Wilmington | | | 4.000 | | | | 04/01/2038 | | | Aa3 | | | 405,000 | | | | 408,297 | |
University of NC Wilmington | | | 4.000 | | | | 04/01/2039 | | | Aa3 | | | 1,380,000 | | | | 1,384,153 | |
University of NC Wilmington Limited Obligation | | | 5.000 | | | | 06/01/2033 | | | A1 | | | 550,000 | | | | 567,028 | |
University of NC Wilmington Limited Obligation | | | 4.000 | | | | 06/01/2034 | | | A1 | | | 500,000 | | | | 504,795 | |
University of North Carolina | | | 5.000 | | | | 10/01/2033 | | | A2 | | | 30,000 | | | | 30,001 | |
Western Carolina NC University | | | 5.000 | | | | 10/01/2035 | | | Aa3 | | | 1,000,000 | | | | 1,078,270 | |
Western Carolina NC University | | | 5.000 | | | | 10/01/2043 | | | Aa3 | | | 1,000,000 | | | | 1,054,790 | |
Western Carolina NC University | | | 5.000 | | | | 10/01/2045 | | | Aa3 | | | 825,000 | | | | 844,883 | |
| | | | | | | | | | | | | | | | | | |
| | | | | | | | | | | | | | | | | 14,071,414 | |
| PREREFUNDED BONDS | | | | | | | | | | | | | | | | | | |
| 10.60% of Net Assets | | | | | | | | | | | | | | | | | | |
Buncombe County NC Limited Obligation | | | 5.000 | | | | 06/01/2034 | | | Aa1 | | | 500,000 | | | | 508,670 | |
Charlotte NC Certificate of Participation | | | 4.000 | | | | 12/01/2034 | | | Aa1 | | | 290,000 | | | | 297,122 | |
High Point NC Combined Enterprise | | | 5.000 | | | | 11/01/2039 | | | Aa2 | | | 750,000 | | | | 768,480 | |
NC Eastern Municipal Power Agency | | | 6.000 | | | | 01/01/2025 | | | Baa2 | | | 1,150,000 | | | | 1,194,471 | |
NC State Capital Facilities Duke University | | | 5.000 | | | | 10/01/2041 | | | Aa1 | | | 1,000,000 | | | | 1,044,100 | |
New Hanover County NC Hospital Revenue New Hanover Regional Medical** | | | 5.000 | | | | 10/01/2034 | | | NR | | | 1,500,000 | | | | 1,635,150 | |
Raleigh NC Limited Obligation | | | 5.000 | | | | 10/01/2038 | | | Aa1 | | | 500,000 | | | | 502,220 | |
University of NC Charlotte | | | 5.000 | | | | 04/01/2035 | | | Aa3 | | | 595,000 | | | | 603,318 | |
University of NC Charlotte | | | 5.000 | | | | 04/01/2038 | | | Aa3 | | | 1,000,000 | | | | 1,013,980 | |
University of NC Charlotte | | | 5.000 | | | | 04/01/2040 | | | Aa3 | | | 1,550,000 | | | | 1,601,135 | |
University of NC Greensboro | | | 5.000 | | | | 04/01/2033 | | | Aa3 | | | 900,000 | | | | 911,169 | |
University of NC Greensboro | | | 5.000 | | | | 04/01/2039 | | | Aa3 | | | 2,120,000 | | | | 2,146,309 | |
Winston Salem NC Limited Obligation | | | 4.500 | | | | 06/01/2034 | | | Aa1 | | | 500,000 | | | | 506,420 | |
| | | | | | | | | | | | | | | | | | |
| | | | | | | | | | | | | | | | | 12,732,544 | |
| HOSPITAL AND HEALTHCARE REVENUE BONDS | | | | | | | | | | | | | | | | | | |
| 7.05% of Net Assets | | | | | | | | | | | | | | | | | | |
Charlotte Mecklenburg NC Hospital Authority Atrium Health | | | 5.000 | | | | 01/15/2033 | | | Aa3 | | | 210,000 | | | | 230,395 | |
Charlotte Mecklenburg NC Hospital Authority Atrium Health | | | 5.000 | | | | 01/15/2036 | | | Aa3 | | | 590,000 | | | | 635,760 | |
Charlotte Mecklenburg NC Hospital Authority Atrium Health | | | 4.000 | | | | 01/15/2043 | | | Aa3 | | | 250,000 | | | | 248,988 | |
Charlotte Mecklenburg NC Hospital Healthcare System | | | 5.000 | | | | 01/15/2039 | | | Aa3 | | | 1,500,000 | | | | 1,500,255 | |
NC State Medical Care Commission Health Care Facilities Rex Hospital | | | 5.000 | | | | 07/01/2033 | | | A2 | | | 750,000 | | | | 775,988 | |
NC State Medical Care Commission Health Care Facilities Rex Hospital | | | 4.000 | | | | 07/01/2039 | | | A2 | | | 550,000 | | | | 542,322 | |
NC State Medical Care Commission Health Care Facilities Rex Hospital | | | 4.000 | | | | 07/01/2040 | | | A2 | | | 1,750,000 | | | | 1,720,302 | |
NC State Medical Care Commission Health Care Facilities Vidant Health | | | 5.000 | | | | 06/01/2040 | | | A2 | | | 1,385,000 | | | | 1,399,072 | |
University of NC Chapel Hill Hospitals | | | 4.000 | | | | 02/01/2037 | | | Aa3 | | | 1,000,000 | | | | 1,006,950 | |
University of NC Chapel Hill Hospitals | | | 4.000 | | | | 02/01/2038 | | | Aa3 | | | 400,000 | | | | 400,188 | |
| | | | | | | | | | | | | | | | | | |
| | | | | | | | | | | | | | | | | 8,460,220 | |
| REFUNDING BONDS | | | | | | | | | | | | | | | | | | |
| 6.38% of Net Assets | | | | | | | | | | | | | | | | | | |
Asheville NC Limited Obligation | | | 3.000 | | | | 04/01/2041 | | | Aa1 | | | 250,000 | | | | 214,125 | |
Buncombe County NC Limited Obligation** | | | 5.000 | | | | 06/01/2035 | | | Aa1 | | | 1,000,000 | | | | 1,038,150 | |
Charlotte NC Certificate of Participation | | | 5.000 | | | | 06/01/2033 | | | Aa1 | | | 840,000 | | | | 841,050 | |
Charlotte NC Certificate of Participation | | | 5.000 | | | | 06/01/2034 | | | Aa1 | | | 750,000 | | | | 779,610 | |
Chatham County NC | | | 5.000 | | | | 11/01/2032 | | | Aa2 | | | 825,000 | | | | 865,351 | |
Durham County NC | | | 4.000 | | | | 06/01/2036 | | | Aaa | | | 225,000 | | | | 233,892 | |
Monroe NC Limited Obligation | | | 4.000 | | | | 03/01/2033 | | | Aa3 | | | 255,000 | | | | 261,156 | |
Monroe NC Limited Obligation** | | | 5.000 | | | | 03/01/2039 | | | Aa3 | | | 1,250,000 | | | | 1,295,062 | |
Rockingham County NC Limited Obligation | | | 4.500 | | | | 04/01/2032 | | | Aa3 | | | 500,000 | | | | 512,865 | |
Sampson County NC Limited Obligation | | | 4.000 | | | | 09/01/2036 | | | A1 | | | 1,000,000 | | | | 994,890 | |
Sampson County NC Limited Obligation | | | 4.000 | | | | 09/01/2037 | | | A1 | | | 500,000 | | | | 494,645 | |
Union County NC Limited Obligation Refunding | | | 5.000 | | | | 12/01/2024 | | | Aa1 | | | 125,000 | | | | 128,375 | |
| | | | | | | | | | | | | | | | | | |
| | | | | | | | | | | | | | | | | 7,659,171 | |
The accompanying footnotes are an integral part of the financial statements.
25
DUPREE MUTUAL FUNDS — NORTH CAROLINA TAX-FREE INCOME SERIES
SCHEDULE OF PORTFOLIO INVESTMENTS
North Carolina Municipal Bonds
June 30, 2023
| | | | | | | | | | | | | | | | | | |
| Bond Description | | Coupon | | | Maturity
Date | | | Rating# | | Par Value | | | Fair Value | |
| MISCELLANEOUS PUBLIC IMPROVEMENT BONDS | | | | | | | | | | | | | | | | | | |
| 4.08% of Net Assets | | | | | | | | | | | | | | | | | | |
Buncombe County NC Limited Obligation | | | 5.000 | % | | | 06/01/2033 | | | Aa1 | | $ | 600,000 | | | $ | 623,118 | |
Buncombe County NC Limited Obligation | | | 5.000 | | | | 06/01/2034 | | | Aa1 | | | 365,000 | | | | 380,315 | |
Charlotte NC Certificate of Participation | | | 5.000 | | | | 12/01/2029 | | | Aa1 | | | 340,000 | | | | 340,248 | |
Fuquay-Varina NC | | | 4.000 | | | | 08/01/2042 | | | Aa1 | | | 500,000 | | | | 504,955 | |
Rocky Mount NC Special Obligation | | | 4.500 | | | | 05/01/2032 | | | Aa3 | | | 1,500,000 | | | | 1,560,270 | |
Wilmington NC Limited Obligation | | | 3.000 | | | | 06/01/2037 | | | Aa1 | | | 370,000 | | | | 316,502 | |
Winston Salem NC | | | 4.000 | | | | 06/01/2043 | | | Aaa | | | 1,165,000 | | | | 1,177,349 | |
| | | | | | | | | | | | | | | | | | |
| | | | | | | | | | | | | | | | | 4,902,757 | |
| AIRPORT REVENUE BONDS | | | | | | | | | | | | | | | | | | |
| 3.73% of Net Assets | | | | | | | | | | | | | | | | | | |
Charlotte NC Douglas International Airport | | | 5.000 | | | | 07/01/2030 | | | Aa3 | | | 1,095,000 | | | | 1,114,293 | |
Charlotte NC Douglas International Airport | | | 5.000 | | | | 07/01/2036 | | | Aa3 | | | 250,000 | | | | 266,780 | |
Charlotte NC Douglas International Airport | | | 4.000 | | | | 07/01/2036 | | | Aa3 | | | 500,000 | | | | 507,580 | |
Charlotte NC Douglas International Airport | | | 5.000 | | | | 07/01/2037 | | | Aa3 | | | 700,000 | | | | 741,314 | |
Charlotte NC Douglas International Airport | | | 5.000 | | | | 07/01/2042 | | | Aa3 | | | 1,325,000 | | | | 1,383,022 | |
Charlotte NC Douglas International Airport | | | 4.000 | | | | 07/01/2044 | | | Aa3 | | | 480,000 | | | | 471,293 | |
| | | | | | | | | | | | | | | | | | |
| | | | | | | | | | | | | | | | | 4,484,282 | |
| TURNPIKES/TOLLROAD/HIGHWAY REVENUE BONDS | | | | | | | | | | | | | | | | | | |
| 3.37% of Net Assets | | | | | | | | | | | | | | | | | | |
NC State Grant Anticipation Revenue Vehicle Garvee | | | 5.000 | | | | 03/01/2030 | | | A2 | | | 200,000 | | | | 206,028 | |
NC State Turnpike Authority | | | 5.000 | | | | 01/01/2036 | | | AA* | | | 500,000 | | | | 533,890 | |
NC State Turnpike Authority | | | 5.000 | | | | 01/01/2038 | | | AA* | | | 2,415,000 | | | | 2,544,203 | |
NC State Turnpike Authority Triangle Expressway | | | 4.000 | | | | 01/01/2036 | | | Aa1 | | | 250,000 | | | | 256,740 | |
NC State Turnpike Authority Triangle Expressway | | | 4.000 | | | | 01/01/2039 | | | Aa1 | | | 500,000 | | | | 505,755 | |
| | | | | | | | | | | | | | | | | | |
| | | | | | | | | | | | | | | | | 4,046,616 | |
| STATE AND LOCAL MORTGAGE/HOUSING REVENUE BONDS | | | | | | | | | | | |
| .31% of Net Assets | | | | | | | | | | | | | | | | | | |
NC State Housing Finance Authority | | | 4.350 | | | | 07/01/2043 | | | Aa1 | | | 375,000 | | | | 367,631 | |
| | | | | | | | | | | | | | | | | | |
Total Investments 98.94% of Net Assets (cost $124,024,456) (See footnote 6 for further explanation) | | | | | | | | | $ | 118,789,204 | |
| | | | | | | | | | | | | | | | | | |
Other assets in excess of liabilities 1.06% | | | | | | | | | | | | | | | | | 1,273,162 | |
| | | | | | | | | | | | | | | | | | |
Net Assets 100% | | | | | | | | | | | | | | | | $ | 120,062,366 | |
| | | | | | | | | | | | | | | | | | |
| | # | | Ratings by Moody’s Investors Service unless noted otherwise. |
| | | | Bond ratings are unaudited and not covered by Report of Independent Registered Public Accounting Firm. |
| | | | All ratings are as of the date indicated and do not reflect subsequent changes. |
| | * | | Rated by Standard & Poor’s Corporation |
| | ** | | Security is segregated against line of credit — see footnote 7 |
Other Information
The following is a summary of the inputs used, as of June 30, 2023, involving the Fund’s investments in securities carried at fair value. The inputs or methodology used for valuing securities may not be an indication of the risk associated with investing in those securities. For more information on valuation inputs, and their aggregation into the levels used in the table below, please refer to the Security Valuation section in the accompanying Notes to Financial Statements.
| | | | | | |
| | | Valuation Inputs | | Municipal
Bonds | |
Level 1 | | Quoted Prices | | $ | — | |
Level 2 | | Other Significant Observable Inputs | | | 118,789,204 | |
Level 3 | | Significant Unobservable Inputs | | | — | |
| | | | | | |
| | | | $ | 118,789,204 | |
| | | | | | |
The accompanying footnotes are an integral part of the financial statements.
26
NORTH CAROLINA TAX-FREE INCOME SERIES
STATEMENT OF ASSETS AND LIABILITIES
June 30, 2023
| | | | | | | | |
| ASSETS: | | | | | | | | |
Investments in securities, at fair value (Cost: $124,024,456) | | | $ | 118,789,204 | |
Cash | | | | | | | 485,001 | |
Receivable for fund shares sold | | | | | | | 35,133 | |
Interest receivable | | | | | | | 1,175,780 | |
| | | | | | | | |
Total assets | | | | | | | 120,485,118 | |
LIABILITIES: | | | | | | | | |
Payable for: | | | | | | | | |
Distributions to shareholders | | | 202,953 | | | | | |
Fund shares redeemed | | | 110,993 | | | | | |
Investment advisory fee | | | 43,764 | | | | | |
Transfer agent fee | | | 22,977 | | | | | |
Audit fees | | | 8,314 | | | | | |
Trustees fees | | | 6,333 | | | | | |
Professional fees | | | 4,581 | | | | | |
Custodian fee | | | 2,386 | | | | | |
Accrued expenses | | | 20,451 | | | | | |
| | | | | | | | |
Total liabilities | | | | | | | 422,752 | |
| | | | | | | | |
NET ASSETS: | | | | | | | | |
Paid-in capital | | | | | | | 128,668,990 | |
Total accumulated loss | | | | (8,606,624 | ) |
| | | | | | | | |
Total Net Assets | | | | | | $ | 120,062,366 | |
| | | | | | | | |
NET ASSET VALUE, offering price and redemption price per share (11,218,971 shares outstanding; unlimited number of shares authorized; no par value) | | | | | | $ | 10.70 | |
| | | | | | | | |
STATEMENT OF OPERATIONS
For the year ended June 30, 2023
| | | | |
Net investment income: | | | | |
Interest income | | $ | 3,823,672 | |
| | | | |
Expenses: | | | | |
Investment advisory fee | | | 615,407 | |
Transfer agent fee | | | 156,775 | |
Professional fees | | | 43,250 | |
Pricing fees | | | 22,442 | |
Custodian fee | | | 21,307 | |
Trustees fees | | | 21,201 | |
Registration fees | | | 17,266 | |
Compliance fees | | | 7,201 | |
Other expenses | | | 32,139 | |
| | | | |
Total expenses | | | 936,988 | |
Fees waived by Adviser (Note 2) | | | (56,316 | ) |
Custodian fee reduction (Note 7) | | | (57 | ) |
| | | | |
Net expenses | | | 880,615 | |
| | | | |
Net investment income | | | 2,943,057 | |
| | | | |
Realized and unrealized gain/(loss) on investments: | | | | |
Net realized loss | | | (1,640,682 | ) |
Net change in unrealized appreciation/depreciation | | | 891,266 | |
| | | | |
Net realized and unrealized loss on investments | | | (749,416 | ) |
| | | | |
Net increase in net assets resulting from operations | | $ | 2,193,641 | |
| | | | |
The accompanying footnotes are an integral part of the financial statements.
27
NORTH CAROLINA TAX-FREE INCOME SERIES
STATEMENTS OF CHANGES IN NET ASSETS
For the years ended June 30, 2023 and 2022
| | | | | | | | |
| | | 2023 | | | 2022 | |
Operations: | | | | | | | | |
Net investment income | | $ | 2,943,057 | | | $ | 3,205,533 | |
Net realized loss on investments | | | (1,640,682 | ) | | | (281,248 | ) |
Net change in unrealized appreciation/depreciation | | | 891,266 | | | | (17,186,653 | ) |
| | | | | | | | |
Net increase/(decrease) in net assets resulting from operations | | | 2,193,641 | | | | (14,262,368 | ) |
Total distributions (Note 6) | | | (2,943,057 | ) | | | (3,205,533 | ) |
Net Fund share transactions (Note 4) | | | (13,617,496 | ) | | | (11,171,671 | ) |
| | | | | | | | |
Total decrease | | | (14,366,912 | ) | | | (28,639,572 | ) |
Net assets: | | | | | | | | |
Beginning of year | | | 134,429,278 | | | | 163,068,850 | |
| | | | | | | | |
End of year | | $ | 120,062,366 | | | $ | 134,429,278 | |
| | | | | | | | |
FINANCIAL HIGHLIGHTS
| | | | | | | | | | | | | | | | | | | | |
| Selected data for a share outstanding: | | For the years ended June 30, | |
| | | 2023 | | | 2022 | | | 2021 | | | 2020 | | | 2019 | |
Net asset value, beginning of year | | $ | 10.74 | | | $ | 12.05 | | | $ | 11.93 | | | $ | 11.68 | | | $ | 11.34 | |
| | | | | | | | | | | | | | | | | | | | |
Income from investment operations: | | | | | | | | | | | | | | | | | | | | |
Net investment income | | | 0.25 | | | | 0.24 | | | | 0.25 | | | | 0.27 | | | | 0.29 | |
Net gains/(losses) on investments (b) | | | (0.04 | ) | | | (1.31 | ) | | | 0.12 | | | | 0.25 | | | | 0.34 | |
| | | | | | | | | | | | | | | | | | | | |
Total from investment operations | | | 0.21 | | | | (1.07 | ) | | | 0.37 | | | | 0.52 | | | | 0.63 | |
Less distributions: | | | | | | | | | | | | | | | | | | | | |
Distributions from net investment income | | | (0.25 | ) | | | (0.24 | ) | | | (0.25 | ) | | | (0.27 | ) | | | (0.29 | ) |
| | | | | | | | | | | | | | | | | | | | |
Net asset value, end of year | | $ | 10.70 | | | $ | 10.74 | | | $ | 12.05 | | | $ | 11.93 | | | $ | 11.68 | |
| | | | | | | | | | | | | | | | | | | | |
Total return | | | 2.00% | | | | (9.01)% | | | | 3.12% | | | | 4.48% | | | | 5.69% | |
Net assets, end of year (in thousands) | | $ | 120,062 | | | $ | 134,429 | | | $ | 163,069 | | | $ | 161,366 | | | $ | 146,078 | |
Ratio of net expenses to average net assets (a) | | | 0.70% | | | | 0.68% | | | | 0.68% | | | | 0.69% | | | | 0.70% | |
Ratio of gross expenses to average net assets | | | 0.75% | | | | 0.68% | | | | 0.68% | | | | 0.69% | | | | 0.71% | |
Ratio of net investment income to average net assets | | | 2.34% | | | | 2.05% | | | | 2.07% | | | | 2.27% | | | | 2.58% | |
Portfolio turnover | | | 3.74% | | | | 6.57% | | | | 7.79% | | | | 9.88% | | | | 13.02% | |
| (a) | | Percentages are after expense waivers and reductions by the Adviser and Custodian. The Adviser and Custodian have agreed not to seek recovery of these waivers and reductions. |
| (b) | | Realized and unrealized gains and losses per share in this caption may be balancing amounts necessary to reconcile the change in net asset value per share for the period, and may not reconcile with the Fund’s statement of operations due to share transactions for the period. |
The accompanying footnotes are an integral part of the financial statements.
28
DUPREE MUTUAL FUNDS — NORTH CAROLINA TAX-FREE SHORT-TO-MEDIUM SERIES
SCHEDULE OF PORTFOLIO INVESTMENTS
North Carolina Municipal Bonds
June 30, 2023
| | | | | | | | | | | | | | | | | | |
| Bond Description | | Coupon | | | Maturity
Date | | | Rating# | | Par Value | | | Fair Value | |
| UNIVERSITY CONSOLIDATED EDUCATION AND BUILDING REVENUE BONDS | | | | | | | | | | | |
| 29.57% of Net Assets | | | | | | | | | | | | | | | | | | |
Appalachian NC State University | | | 4.000 | % | | | 10/01/2030 | | | Aa3 | | $ | 200,000 | | | $ | 206,628 | |
Pitt County NC Limited Obligation | | | 5.000 | | | | 04/01/2027 | | | Aa2 | | | 495,000 | | | | 527,180 | |
University of NC Charlotte | | | 5.000 | | | | 10/01/2025 | | | Aa3 | | | 110,000 | | | | 114,509 | |
University of NC Charlotte | | | 5.000 | | | | 04/01/2028 | | | Aa3 | | | 250,000 | | | | 258,420 | |
University of NC Greensboro | | | 5.000 | | | | 04/01/2026 | | | Aa3 | | | 400,000 | | | | 420,104 | |
University of NC Wilmington | | | 4.000 | | | | 06/01/2029 | | | A1 | | | 750,000 | | | | 766,792 | |
University of NC Wilmington Limited Obligation | | | 4.000 | | | | 06/01/2030 | | | A1 | | | 200,000 | | | | 204,030 | |
University of North Carolina at Wilmington | | | 5.000 | | | | 10/01/2026 | | | Aa3 | | | 300,000 | | | | 318,258 | |
Western Carolina University | | | 5.000 | | | | 10/01/2025 | | | Aa3 | | | 225,000 | | | | 234,423 | |
Western Carolina University | | | 5.000 | | | | 06/01/2027 | | | AA* | | | 250,000 | | | | 261,873 | |
| | | | | | | | | | | | | | | | | | |
| | | | | | | | | | | | | | | | | 3,312,217 | |
| SCHOOL IMPROVEMENT BONDS | | | | | | | | | | | | | | | | | | |
| 13.48% of Net Assets | | | | | | | | | | | | | | | | | | |
Brunswick County NC | | | 5.000 | | | | 08/01/2028 | | | Aaa | | | 250,000 | | | | 278,155 | |
Randolph County NC Limited Obligation | | | 5.000 | | | | 10/01/2025 | | | Aa3 | | | 250,000 | | | | 260,690 | |
Rutherford County NC Limited Obligation | | | 5.000 | | | | 03/01/2028 | | | A1 | | | 75,000 | | | | 81,898 | |
Rutherford County NC Limited Obligation | | | 5.000 | | | | 03/01/2029 | | | A1 | | | 175,000 | | | | 193,790 | |
Scotland County NC | | | 5.000 | | | | 12/01/2025 | | | A* | | | 270,000 | | | | 280,136 | |
Scotland County NC | | | 5.000 | | | | 12/01/2026 | | | A* | | | 250,000 | | | | 264,377 | |
Scotland County NC | | | 5.000 | | | | 12/01/2027 | | | A* | | | 140,000 | | | | 150,724 | |
| | | | | | | | | | | | | | | | | | |
| | | | | | | | | | | | | | | | | 1,509,770 | |
| MUNICIPAL UTILITY REVENUE BONDS | | | | | | | | | | | | | | | | | | |
| 12.17% of Net Assets | | | | | | | | | | | | | | | | | | |
Brunswick County NC Enterprise System Revenue** | | | 5.000 | | | | 04/01/2027 | | | Aa2 | | | 250,000 | | | | 258,595 | |
Cary NC Combined Enterprise Systems | | | 4.000 | | | | 12/01/2028 | | | Aaa | | | 250,000 | | | | 257,320 | |
Monroe NC Limited Obligation | | | 5.000 | | | | 03/01/2028 | | | Aa3 | | | 95,000 | | | | 99,935 | |
Monroe NC Limited Obligation | | | 5.000 | | | | 03/01/2029 | | | Aa3 | | | 195,000 | | | | 204,875 | |
NC Municipal Power Agency #1 Catawba Electric | | | 5.000 | | | | 01/01/2025 | | | A* | | | 100,000 | | | | 102,709 | |
NC Municipal Power Agency #1 Catawba Electric | | | 5.000 | | | | 01/01/2025 | | | A* | | | 140,000 | | | | 143,545 | |
NC Municipal Power Agency #1 Catawba Electric | | | 5.000 | | | | 01/01/2028 | | | A* | | | 125,000 | | | | 130,248 | |
Warren County NC Limited Obligation | | | 5.000 | | | | 06/01/2027 | | | A1 | | | 160,000 | | | | 165,678 | |
| | | | | | | | | | | | | | | | | | |
| | | | | | | | | | | | | | | | | 1,362,905 | |
| REFUNDING BONDS | | | | | | | | | | | | | | | | | | |
| 8.60% of Net Assets | | | | | | | | | | | | | | | | | | |
Charlotte NC Certificate of Participation | | | 4.000 | | | | 06/01/2025 | | | Aa1 | | | 100,000 | | | | 100,011 | |
Charlotte NC Certificate of Participation | | | 5.000 | | | | 12/01/2025 | | | Aa2 | | | 100,000 | | | | 104,751 | |
North Carolina State Limited Obligation | | | 5.000 | | | | 05/01/2028 | | | Aa1 | | | 125,000 | | | | 134,979 | |
Rockingham County NC Limited Obligation | | | 4.000 | | | | 04/01/2024 | | | Aa3 | | | 105,000 | | | | 105,663 | |
Sampson County NC Limited Obligation | | | 5.000 | | | | 12/01/2023 | | | A1 | | | 165,000 | | | | 166,130 | |
Sampson County NC Limited Obligation | | | 5.000 | | | | 09/01/2025 | | | A1 | | | 125,000 | | | | 129,409 | |
Sampson County NC Limited Obligation | | | 5.000 | | | | 09/01/2026 | | | A1 | | | 210,000 | | | | 221,558 | |
| | | | | | | | | | | | | | | | | | |
| | | | | | | | | | | | | | | | | 962,501 | |
| TURNPIKES/TOLLROAD/HIGHWAY REVENUE BONDS | | | | | | | | | | | | | | | | | | |
| 8.26% of Net Assets | | | | | | | | | | | | | | | | | | |
North Carolina State Grant Anticipation Revenue | | | 5.000 | | | | 03/01/2029 | | | A2 | | | 200,000 | | | | 223,022 | |
North Carolina State Grant Anticipation Revenue | | | 5.000 | | | | 03/01/2029 | | | A2 | | | 120,000 | | | | 123,499 | |
North Carolina State Grant Anticipation Revenue | | | 5.000 | | | | 03/01/2029 | | | A2 | | | 20,000 | | | | 22,302 | |
North Carolina State Limited Obligation | | | 5.000 | | | | 05/01/2029 | | | Aa1 | | | 225,000 | | | | 253,150 | |
North Carolina Turnpike Authority | | | 5.000 | | | | 01/01/2029 | | | A1 | | | 285,000 | | | | 303,428 | |
| | | | | | | | | | | | | | | | | | |
| | | | | | | | | | | | | | | | | 925,401 | |
| MISCELLANEOUS PUBLIC IMPROVEMENT BONDS | | | | | | | | | | | | | | | | | | |
| 7.59% of Net Assets | | | | | | | | | | | | | | | | | | |
Davidson County NC Limited Obligation | | | 5.000 | | | | 06/01/2028 | | | Aa2 | | | 315,000 | | | | 333,745 | |
Fuquay-Varina NC | | | 5.000 | | | | 08/01/2024 | | | Aa1 | | | 250,000 | | | | 255,243 | |
The accompanying footnotes are an integral part of the financial statements.
29
DUPREE MUTUAL FUNDS — NORTH CAROLINA TAX-FREE SHORT-TO-MEDIUM SERIES
SCHEDULE OF PORTFOLIO INVESTMENTS
North Carolina Municipal Bonds
June 30, 2023
| | | | | | | | | | | | | | | | | | |
| Bond Description | | Coupon | | | Maturity
Date | | | Rating# | | Par Value | | | Fair Value | |
Fuquay-Varina NC | | | 5.000 | % | | | 08/01/2025 | | | Aa1 | | $ | 250,000 | | | $ | 260,548 | |
| | | | | | | | | | | | | | | | | | |
| | | | | | | | | | | | | | | | | 849,536 | |
| PUBLIC FACILITIES REVENUE BONDS | | | | | | | | | | | | | | | | | | |
| 7.13% of Net Assets | | | | | | | | | | | | | | | | | | |
Buncombe County NC Limited Obligation** | | | 5.000 | | | | 06/01/2028 | | | Aa1 | | | 500,000 | | | | 519,170 | |
Monroe NC Limited Obligation | | | 5.000 | | | | 04/01/2026 | | | AA* | | | 265,000 | | | | 279,681 | |
| | | | | | | | | | | | | | | | | | |
| | | | | | | | | �� | | | | | | | | 798,851 | |
| HOSPITAL AND HEALTHCARE REVENUE BONDS | | | | | | | | | | | | | | | | | | |
| 3.73% of Net Assets | | | | | | | | | | | | | | | | | | |
Charlotte-Mecklenburg NC Hospital Authority Health Care System | | | 5.000 | | | | 01/15/2028 | | | Aa3 | | | 225,000 | | | | 236,156 | |
NC State Medical Care Commission Health Care Facilities | | | 4.000 | | | | 06/01/2024 | | | A2 | | | 180,000 | | | | 181,160 | |
| | | | | | | | | | | | | | | | | | |
| | | | | | | | | | | | | | | | | 417,316 | |
| PREREFUNDED BONDS | | | | | | | | | | | | | | | | | | |
| 3.13% of Net Assets | | | | | | | | | | | | | | | | | | |
New Hanover NC Hospital Revenue | | | 5.000 | | | | 10/01/2028 | | | | | | 150,000 | | | | 163,515 | |
North Carolina State Medical Care Commission Vidant Health | | | 5.000 | | | | 06/01/2028 | | | A2 | | | 180,000 | | | | 186,628 | |
| | | | | | | | | | | | | | | | | | |
| | | | | | | | | | | | | | | | | 350,143 | |
| AD VALOREM PROPERTY BONDS | | | | | | | | | | | | | | | | | | |
| 1.18% of Net Assets | | | | | | | | | | | | | | | | | | |
Smithville Township NC** | | | 5.000 | | | | 06/01/2024 | | | Aa2 | | | 130,000 | | | | 132,112 | |
| | | | | | | | | | | | | | | | | | |
| LEASE REVENUE BONDS | | | | | | | | | | | | | | | | | | |
| 1.00% of Net Assets | | | | | | | | | | | | | | | | | | |
New Hanover County NC Limited Obligation | | | 5.000 | | | | 06/01/2029 | | | Aa1 | | | 100,000 | | | | 112,386 | |
| | | | | | | | | | | | | | | | | | |
| AIRPORT REVENUE BONDS | | | | | | | | | | | | | | | | | | |
| 0.77% of Net Assets | | | | | | | | | | | | | | | | | | |
Charlotte NC Airport | | | 5.000 | | | | 07/01/2030 | | | Aa3 | | | 75,000 | | | | 85,682 | |
| | | | | | | | | | | | | | | | | | |
Total Investments 96.61% of Net Assets (cost $10,941,775 (See footnote 6 for further explanation) | | | $ | 10,818,820 | |
| | | | | | | | | | | | | | | | | | |
Other assets in excess of liabilities 3.39% | | | | 379,489 | |
| | | | | | | | | | | | | | | | | | |
Net Assets 100% | | | | | | | | | | | | | | | | $ | 11,198,309 | |
| | | | | | | | | | | | | | | | | | |
| | # | | Ratings by Moody’s Investors Service unless noted otherwise. |
| | | | Bond ratings are unaudited and not covered by Report of Independent Registered Public Accounting Firm. |
| | | | All ratings are as of the date indicated and do not reflect subsequent changes. |
| | * | | Rated by Standard & Poor’s Corporation |
| | ** | | Security is segregated against line of credit — see footnote 7 |
Other Information
The following is a summary of the inputs used, as of June 30, 2023, involving the Fund’s investments in securities carried at fair value. The inputs or methodology used for valuing securities may not be an indication of the risk associated with investing in those securities. For more information on valuation inputs, and their aggregation into the levels used in the table below, please refer to the Security Valuation section in the accompanying Notes to Financial Statements.
| | | | | | |
| | | Valuation Inputs | | Municipal Bonds | |
Level 1 | | Quoted Prices | | $ | — | |
Level 2 | | Other Significant Observable Inputs | | | 10,818,820 | |
Level 3 | | Significant Unobservable Inputs | | | — | |
| | | | | | |
| | | | $ | 10,818,820 | |
| | | | | | |
The accompanying footnotes are an integral part of the financial statements.
30
NORTH CAROLINA TAX-FREE SHORT-TO-MEDIUM SERIES
STATEMENT OF ASSETS AND LIABILITIES
June 30, 2023
| | | | | | | | |
ASSETS: | | | | | | | | |
Investments in securities, at fair value (Cost: $10,941,775) | | | $ | 10,818,820 | |
Cash | | | | | | | 297,353 | |
Interest receivable | | | | | | | 105,457 | |
| | | | | | | | |
Total assets | | | | | | | 11,221,630 | |
LIABILITIES: | | | | | | | | |
Payable for: | | | | | | | | |
Distributions to shareholders | | | 4,392 | | | | | |
Fund shares redeemed | | | 1,151 | | | | | |
Investment advisory fee | | | 1,842 | | | | | |
Transfer agent fee | | | 1,350 | | | | | |
Professional fees | | | 5,262 | | | | | |
Audit fees | | | 2,164 | | | | | |
Trustees fees | | | 1,077 | | | | | |
Custodian fee | | | 907 | | | | | |
Accrued expenses | | | 5,176 | | | | | |
| | | | | | | | |
Total liabilities | | | | | | | 23,321 | |
| | | | | | | | |
NET ASSETS: | | | | | | | | |
Paid-in capital | | | | | | | 11,485,463 | |
Total accumulated loss | | | | (287,154 | ) |
| | | | | | | | |
Total Net Assets | | | | | | $ | 11,198,309 | |
| | | | | | | | |
NET ASSET VALUE, offering price and redemption price per share (1,081,586 shares outstanding; unlimited number of shares authorized; no par value) | | | | | | $ | 10.35 | |
| | | | | | | | |
STATEMENT OF OPERATIONS
For the year ended June 30, 2023
| | | | |
Net investment income: | | | | |
Interest income | | $ | 297,816 | |
| | | | |
Expenses: | | | | |
Investment advisory fee | | | 61,555 | |
Transfer agent fee | | | 18,467 | |
Registration fees | | | 9,711 | |
Compliance fees | | | 6,953 | |
Custodian fee | | | 6,912 | |
Pricing fees | | | 5,347 | |
Professional fees | | | 3,696 | |
Trustees fees | | | 1,786 | |
Other expenses | | | 4,272 | |
| | | | |
Total expenses | | | 118,699 | |
Fees waived by Adviser (Note 2) | | | (32,494 | ) |
Custodian fee reduction (Note 7) | | | (18 | ) |
| | | | |
Net expenses | | | 86,187 | |
| | | | |
Net investment income | | | 211,629 | |
Realized and unrealized gain/(loss) on investments: | | | | |
Net realized loss | | | (156,205 | ) |
Net change in unrealized appreciation/depreciation | | | 5,844 | |
| | | | |
Net realized and unrealized loss on investments | | | (150,361 | ) |
| | | | |
Net increase in net assets resulting from operations | | $ | 61,268 | |
| | | | |
The accompanying footnotes are an integral part of the financial statements.
31
NORTH CAROLINA TAX-FREE SHORT-TO-MEDIUM SERIES
STATEMENTS OF CHANGES IN NET ASSETS
For the years ended June 30, 2023 and 2022
| | | | | | | | |
| | | 2023 | | | 2022 | |
Operations: | | | | | | | | |
Net investment income | | $ | 211,629 | | | $ | 203,455 | |
Net realized loss on investments | | | (156,205 | ) | | | (7,994 | ) |
Net change in unrealized appreciation/depreciation | | | 5,844 | | | | (832,809 | ) |
| | | | | | | | |
Net increase/(decrease) in net assets resulting from operations | | | 61,268 | | | | (637,348 | ) |
Total distributions (Note 6) | | | (211,629 | ) | | | (203,503 | ) |
Net Fund share transactions (Note 4) | | | (2,160,490 | ) | | | 1,110,314 | |
| | | | | | | | |
Total increase/(decrease) | | | (2,310,851 | ) | | | 269,463 | |
Net assets: | | | | | | | | |
Beginning of year | | | 13,509,160 | | | | 13,239,697 | |
| | | | | | | | |
End of year | | $ | 11,198,309 | | | $ | 13,509,160 | |
| | | | | | | | |
FINANCIAL HIGHLIGHTS
| | | | | | | | | | | | | | | | | | | | |
| Selected data for a share outstanding: | | For the years ended June 30, | |
| | | 2023 | | | 2022 | | | 2021 | | | 2020 | | | 2019 | |
Net asset value, beginning of year | | $ | 10.48 | | | $ | 11.17 | | | $ | 11.20 | | | $ | 11.02 | | | $ | 10.64 | |
| | | | | | | | | | | | | | | | | | | | |
Income from investment operations: | | | | | | | | | | | | | | | | | | | | |
Net investment income | | | 0.18 | | | | 0.17 | | | | 0.18 | | | | 0.17 | | | | 0.17 | |
Net gains/(losses) on investments (c) | | | (0.13 | ) | | | (0.69 | ) | | | (0.03 | ) | | | 0.18 | | | | 0.38 | |
| | | | | | | | | | | | | | | | | | | | |
Total from investment operations | | | 0.05 | | | | (0.52 | ) | | | 0.15 | | | | 0.35 | | | | 0.55 | |
Less distributions: | | | | | | | | | | | | | | | | | | | | |
Distributions from net investment income | | | (0.18 | ) | | | (0.17 | ) | | | (0.18 | ) | | | (0.17 | ) | | | (0.17 | ) |
Distributions from capital gains | | | 0.00 | | | | 0.00 | (b) | | | 0.00 | (b) | | | 0.00 | | | | 0.00 | |
| | | | | | | | | | | | | | | | | | | | |
Net asset value, end of year | | $ | 10.35 | | | $ | 10.48 | | | $ | 11.17 | | | $ | 11.20 | | | $ | 11.02 | |
| | | | | | | | | | | | | | | | | | | | |
Total return | | | 0.48% | | | | (4.72)% | | | | 1.32% | | | | 3.24% | | | | 5.19% | |
Net assets, end of year (in thousands) | | $ | 11,198 | | | $ | 13,509 | | | $ | 13,240 | | | $ | 12,977 | | | $ | 19,504 | |
Ratio of net expenses to average net assets (a) | | | 0.70% | | | | 0.70% | | | | 0.70% | | | | 0.70% | | | | 0.70% | |
Ratio of gross expenses to average net assets | | | 0.97% | | | | 0.92% | | | | 0.95% | | | | 0.91% | | | | 0.88% | |
Ratio of net investment income to average net assets | | | 1.72% | | | | 1.54% | | | | 1.56% | | | | 1.56% | | | | 1.55% | |
Portfolio turnover | | | 17.46% | | | | 13.13% | | | | 1.94% | | | | 9.59% | | | | 13.59% | |
| (a) | | Percentages are after expense waivers and reductions by the Adviser and Custodian. The Adviser and Custodian have agreed not to seek recovery of these waivers and reductions. |
| (b) | | Rounds to less than $0.01. |
| (c) | | Realized and unrealized gains and losses per share in this caption may be balancing amounts necessary to reconcile the change in net asset value per share for the period, and may not reconcile with the Fund’s statement of operations due to share transactions for the period. |
The accompanying footnotes are an integral part of the financial statements.
32
DUPREE MUTUAL FUNDS — TENNESSEE TAX-FREE INCOME SERIES
SCHEDULE OF PORTFOLIO INVESTMENTS
Tennessee Municipal Bonds
June 30, 2023
| | | | | | | | | | | | | | | | | | |
| Bond Description | | Coupon | | | Maturity
Date | | | Rating# | | Par Value | | | Fair Value | |
| MUNICIPAL UTILITY REVENUE BONDS | |
| 30.72% of Net Assets | | | | | | | | | | | | | | | | | | |
Chattanooga TN Electric Revenue | | | 5.000 | % | | | 09/01/2035 | | | AA-* | | $ | 250,000 | | | $ | 260,738 | |
Chattanooga TN Electric Revenue | | | 5.000 | | | | 09/01/2040 | | | AA-* | | | 2,325,000 | | | | 2,395,169 | |
Clarksville TN Electric System Revenue | | | 4.000 | | | | 09/01/2034 | | | Aa2 | | | 500,000 | | | | 515,480 | |
Clarksville TN Water Sewer & Gas Revenue | | | 4.000 | | | | 02/01/2036 | | | Aa2 | | | 1,475,000 | | | | 1,509,102 | |
Clarksville TN Water Sewer & Gas Revenue | | | 4.000 | | | | 02/01/2038 | | | Aa2 | | | 820,000 | | | | 830,963 | |
Franklin TN Water & Sewer Revenue and Tax Authority | | | 5.000 | | | | 04/01/2024 | | | Aaa | | | 750,000 | | | | 760,433 | |
Franklin TN Water & Sewer System Revenue | | | 4.000 | | | | 02/01/2036 | | | Aa2 | | | 250,000 | | | | 254,848 | |
Hallsdale Powell TN Utility District | | | 4.000 | | | | 04/01/2039 | | | AA* | | | 700,000 | | | | 703,899 | |
Hallsdale-Powell TN Utility District | | | 3.000 | | | | 04/01/2043 | | | AA* | | | 800,000 | | | | 663,424 | |
Hallsdale-Powell TN Utility District Knox County Water & Sewer | | | 4.000 | | | | 04/01/2035 | | | AA* | | | 315,000 | | | | 319,498 | |
Hallsdale-Powell TN Utility District Knox County Water & Sewer | | | 4.000 | | | | 04/01/2038 | | | AA* | | | 1,000,000 | | | | 1,003,060 | |
Harpeth Valley TN Utilities District | | | 5.000 | | | | 09/01/2034 | | | AA+* | | | 500,000 | | | | 511,560 | |
Harpeth Valley TN Utilities District | | | 4.000 | | | | 09/01/2045 | | | AA+* | | | 150,000 | | | | 148,254 | |
Harpeth Valley TN Utilities District Davidson & Williamson Counties | | | 4.000 | | | | 09/01/2039 | | | AA+* | | | 500,000 | | | | 510,380 | |
Knox Chapman TN Utility District | | | 5.000 | | | | 01/01/2031 | | | AA-* | | | 250,000 | | | | 257,330 | |
Knox Chapman TN Utility District | | | 5.000 | | | | 01/01/2033 | | | AA-* | | | 250,000 | | | | 257,293 | |
Knoxville TN Electric | | | 4.000 | | | | 07/01/2041 | | | Aa2 | | | 750,000 | | | | 751,125 | |
Knoxville TN Electric Revenue | | | 4.000 | | | | 07/01/2044 | | | Aa2 | | | 670,000 | | | | 663,421 | |
Memphis TN Gas System Revenue | | | 4.000 | | | | 12/01/2034 | | | Aa1 | | | 775,000 | | | | 795,421 | |
Memphis TN Gas System Revenue | | | 4.000 | | | | 12/01/2036 | | | Aa1 | | | 800,000 | | | | 816,560 | |
Memphis TN Gas System Revenue** | | | 4.000 | | | | 12/01/2037 | | | Aa1 | | | 1,310,000 | | | | 1,329,595 | |
Metropolitan Government Nashville & Davidson County Electric | | | 5.000 | | | | 05/15/2036 | | | AA* | | | 500,000 | | | | 508,990 | |
Metropolitan Government Nashville & Davidson County Electric | | | 5.000 | | | | 05/15/2039 | | | AA* | | | 500,000 | | | | 507,470 | |
Metropolitan Government Nashville & Davidson County TN Water & Sewer | | | 5.000 | | | | 07/01/2037 | | | Aa2 | | | 250,000 | | | | 266,780 | |
Portland TN Water & Sewer | | | 4.000 | | | | 04/01/2037 | | | A* | | | 900,000 | | | | 896,184 | |
Portland TN Water & Sewer | | | 4.000 | | | | 04/01/2040 | | | AA* | | | 750,000 | | | | 742,733 | |
Watauga River Regional Water Authority TN Waterworks | | | 4.000 | | | | 07/01/2037 | | | A* | | | 270,000 | | | | 270,891 | |
West Wilson TN Utility District Waterworks | | | 5.000 | | | | 06/01/2042 | | | AA* | | | 500,000 | | | | 553,790 | |
Williamson County Utilities | | | 4.000 | | | | 09/01/2041 | | | AA* | | | 500,000 | | | | 501,605 | |
| | | | | | | | | | | | | | | | | | |
| | | | | | | | | | | | | | | | | 19,505,996 | |
| PREREFUNDED BONDS | |
| 16.34% of Net Assets | | | | | | | | | | | | | | | | | | |
Bristol TN Electric Revenue | | | 5.000 | | | | 09/01/2038 | | | AA-* | | | 1,525,000 | | | | 1,529,483 | |
Gallatin TN Water & Sewer Revenue | | | 5.000 | | | | 01/01/2032 | | | AA* | | | 235,000 | | | | 241,752 | |
Memphis TN Electric System Revenue | | | 5.000 | | | | 12/01/2031 | | | Aa2 | | | 225,000 | | | | 230,886 | |
Memphis TN Electric System Revenue | | | 5.000 | | | | 12/01/2034 | | | Aa2 | | | 1,250,000 | | | | 1,282,000 | |
Memphis TN General Improvement | | | 5.000 | | | | 04/01/2034 | | | Aa2 | | | 500,000 | | | | 506,540 | |
Memphis TN General Improvement | | | 5.000 | | | | 04/01/2039 | | | Aa2 | | | 250,000 | | | | 253,270 | |
Memphis TN Refunding General Improvement | | | 5.000 | | | | 04/01/2031 | | | Aa2 | | | 800,000 | | | | 810,464 | |
Metropolitan Government Nashville & Davidson County Sports Authority | | | 5.000 | | | | 08/01/2031 | | | Aa3 | | | 1,500,000 | | | | 1,502,145 | |
Metropolitan Government Nashville & Davidson County Sports Authority | | | 5.000 | | | | 08/01/2038 | | | Aa3 | | | 755,000 | | | | 756,080 | |
Metropolitan Government Nashville & Davidson County Water & Sewer** | | | 5.000 | | | | 07/01/2030 | | | Aa2 | | | 500,000 | | | | 500,025 | |
Shelby County TN Health Education & Housing Facilities Board Rhodes College | | | 5.000 | | | | 08/01/2040 | | | A2 | | | 650,000 | | | | 664,826 | |
TN State School Bond Authority Higher Educational Facilities | | | 5.000 | | | | 11/01/2040 | | | Aa1 | | | 2,000,000 | | | | 2,091,820 | |
| | | | | | | | | | | | | | | | | | |
| | | | | | | | | | | | | | | | | 10,369,291 | |
| SCHOOL IMPROVEMENT BONDS | |
| 12.75% of Net Assets | | | | | | | | | | | | | | | | | | |
Coffee County TN | | | 4.000 | | | | 06/01/2037 | | | AA-* | | | 500,000 | | | | 509,765 | |
Coffee County TN | | | 4.000 | | | | 06/01/2041 | | | AA-* | | | 620,000 | | | | 619,981 | |
Franklin TN Special School District | | | 5.000 | | | | 06/01/2039 | | | Aa1 | | | 250,000 | | | | 272,115 | |
Johnson City TN | | | 4.000 | | | | 06/01/2036 | | | Aa2 | | | 1,150,000 | | | | 1,183,580 | |
Montgomery County TN | | | 4.000 | | | | 04/01/2036 | | | AA* | | | 260,000 | | | | 265,626 | |
Montgomery County TN | | | 4.000 | | | | 04/01/2037 | | | AA* | �� | | 1,920,000 | | | | 1,949,357 | |
The accompanying footnotes are an integral part of the financial statements.
33
DUPREE MUTUAL FUNDS — TENNESSEE TAX-FREE INCOME SERIES
SCHEDULE OF PORTFOLIO INVESTMENTS
Tennessee Municipal Bonds
June 30, 2023
| | | | | | | | | | | | | | | | | | |
| Bond Description | | Coupon | | | Maturity
Date | | | Rating# | | Par Value | | | Fair Value | |
Montgomery County TN | | | 4.000 | % | | | 06/01/2040 | | | Aa2 | | $ | 500,000 | | | $ | 503,295 | |
Shelby County TN | | | 5.000 | | | | 04/01/2037 | | | Aa1 | | | 500,000 | | | | 530,110 | |
Wilson County TN | | | 4.000 | | | | 04/01/2039 | | | AA+* | | | 1,495,000 | | | | 1,504,224 | |
Wilson County TN 10th Special School District | | | 4.000 | | | | 04/01/2037 | | | AA-* | | | 200,000 | | | | 203,594 | |
Wilson County TN 10th Special School District | | | 4.000 | | | | 04/01/2039 | | | AA-* | | | 550,000 | | | | 553,630 | |
| | | | | | | | | | | | | | | | | | |
| | | | | | | | | | | | | | | | | 8,095,277 | |
| HOSPITAL AND HEALTHCARE REVENUE BONDS | |
| 10.25% of Net Assets | | | | | | | | | | | | | | | | | | |
Knox County TN Health East Tennessee Children’s Hospital | | | 4.000 | | | | 11/15/2048 | | | A* | | | 900,000 | | | | 819,594 | |
Metropolitan Government Nashville & Davidson County TN Health | | | 5.000 | | | | 07/01/2035 | | | A* | | | 2,500,000 | | | | 2,590,850 | |
Metropolitan Government Nashville & Davidson County TN Health | | | 5.000 | | | | 07/01/2040 | | | A* | | | 950,000 | | | | 971,765 | |
Shelby County TN Health Education & Housing Facilities | | | 5.000 | | | | 05/01/2036 | | | A1 | | | 1,535,000 | | | | 1,603,998 | |
Shelby County TN Health Education & Housing Facilities — LeBonheur | | | 5.000 | | | | 05/01/2035 | | | A1 | | | 500,000 | | | | 524,850 | |
| | | | | | | | | | | | | | | | | | |
| | | | | | | | | | | | | | | | | 6,511,057 | |
| MISCELLANEOUS PUBLIC IMPROVEMENT BONDS | |
| 8.86% of Net Assets | | | | | | | | | | | | | | | | | | |
Germantown TN | | | 3.000 | | | | 12/01/2050 | | | Aaa | | | 415,000 | | | | 325,775 | |
Memphis TN | | | 4.000 | | | | 06/01/2041 | | | Aa2 | | | 1,120,000 | | | | 1,120,582 | |
Metropolitan Government Nashville & Davidson County TN | | | 4.000 | | | | 07/01/2033 | | | Aa2 | | | 1,470,000 | | | | 1,518,319 | |
Metropolitan Government Nashville & Davidson County TN | | | 4.000 | | | | 07/01/2034 | | | Aa2 | | | 500,000 | | | | 513,025 | |
Metropolitan Government Nashville & Davidson County TN | | | 4.000 | | | | 07/01/2036 | | | Aa2 | | | 500,000 | | | | 511,380 | |
TN State Series A | | | 5.000 | | | | 02/01/2036 | | | Aaa | | | 1,500,000 | | | | 1,635,000 | |
| | | | | | | | | | | | | | | | | | |
| | | | | | | | | | | | | | | | | 5,624,081 | |
| PUBLIC FACILITIES REVENUE BONDS | | | | | | | | | | | | | | | | | | |
| 5.07% of Net Assets | | | | | | | | | | | | | | | | | | |
Hamblen County TN | | | 4.000 | | | | 05/01/2039 | | | Aa3 | | | 1,250,000 | | | | 1,265,750 | |
Memphis Shelby County TN Industrial Development Board | | | 5.000 | | | | 11/01/2030 | | | Aa3 | | | 1,250,000 | | | | 1,325,488 | |
Metropolitan Government Nashville & Davidson County Convention Center | | | 5.000 | | | | 07/01/2026 | | | A1 | | | 630,000 | | | | 630,233 | |
| | | | | | | | | | | | | | | | | | |
| | | | | | | | | | | | | | | | | 3,221,471 | |
| UNIVERSITY CONSOLIDATED EDUCATION AND BUILDING REVENUE BONDS | |
| 4.43% of Net Assets | | | | | | | | | | | | | | | | | | |
Shelby County TN Health Education & Housing Facilities Board Rhodes College | | | 4.000 | | | | 08/01/2036 | | | A2 | | | 920,000 | | | | 928,814 | |
Shelby County TN Health Education & Housing Facilities Board Rhodes College | | | 4.000 | | | | 08/01/2037 | | | A2 | | | 1,030,000 | | | | 1,032,966 | |
Shelby County TN Health Education & Housing Facilities Board Rhodes College | | | 4.000 | | | | 08/01/2040 | | | A2 | | | 875,000 | | | | 853,790 | |
| | | | | | | | | | | | | | | | | | |
| | | | | | | | | | | | | | | | | 2,815,570 | |
| REFUNDING BONDS | |
| 3.89% of Net Assets | | | | | | | | | | | | | | | | | | |
Blount County TN | | | 5.000 | | | | 06/01/2037 | | | Aa2 | | | 1,000,000 | | | | 1,045,220 | |
Jackson TN Refunding | | | 4.000 | | | | 06/01/2037 | | | AA* | | | 405,000 | | | | 413,124 | |
Memphis TN Refunding | | | 5.000 | | | | 04/01/2033 | | | Aa2 | | | 250,000 | | | | 253,345 | |
Memphis TN Refunding | | | 5.000 | | | | 04/01/2035 | | | Aa2 | | | 250,000 | | | | 253,345 | |
Memphis TN Refunding | | | 5.000 | | | | 04/01/2040 | | | Aa2 | | | 500,000 | | | | 506,915 | |
| | | | | | | | | | | | | | | | | | |
| | | | | | | | | | | | | | | | | 2,471,949 | |
| AIRPORT REVENUE BONDS | |
| 3.59% of Net Assets | | | | | | | | | | | | | | | | | | |
Metropolitan Nashville Airport Authority | | | 5.000 | | | | 07/01/2034 | | | A1 | | | 800,000 | | | | 830,240 | |
Metropolitan Nashville Airport Authority | | | 5.000 | | | | 07/01/2035 | | | A1 | | | 250,000 | | | | 259,698 | |
Metropolitan Nashville Airport Authority | | | 5.000 | | | | 07/01/2040 | | | A1 | | | 1,160,000 | | | | 1,189,302 | |
| | | | | | | | | | | | | | | | | | |
| | | | | | | | | | | | | | | | | 2,279,240 | |
| STATE AND LOCAL MORTGAGE/HOUSING REVENUE BONDS | |
| 2.50% of Net Assets | | | | | | | | | | | | | | | | | | |
TN Housing Development Agency | | | 4.500 | | | | 07/01/2043 | | | Aa1 | | | 1,500,000 | | | | 1,486,320 | |
The accompanying footnotes are an integral part of the financial statements.
34
DUPREE MUTUAL FUNDS — TENNESSEE TAX-FREE INCOME SERIES
SCHEDULE OF PORTFOLIO INVESTMENTS
Tennessee Municipal Bonds
June 30, 2023
| | | | | | | | | | | | | | | | | | |
| Bond Description | | Coupon | | | Maturity
Date | | | Rating# | | Par Value | | | Fair Value | |
TN Housing Development Agency Residential Finance Program^ | | | 4.150 | % | | | 07/01/2038 | | | Aa1 | | $ | 100,000 | | | $ | 99,668 | |
| | | | | | | | | | | | | | | | | | |
| | | | | | | | | | | | | | | | | 1,585,988 | |
Total Investments 98.40% of Net Assets (cost $63,892,675) (See footnote 6 for further explanation) | | | | | | | | | $ | 62,479,920 | |
| | | | | | | | | | | | | | | | | | |
Other assets in excess of liabilities 1.60% | | | | | | | | | | | | | | | | | 1,016,995 | |
| | | | | | | | | | | | | | | | | | |
Net Assets 100% | | | | | | | | | | | | | | | | $ | 63,496,915 | |
| | | | | | | | | | | | | | | | | | |
| | # | | Ratings by Moody’s Investors Service unless noted otherwise. |
| | | | Bond ratings are unaudited and not covered by Report of Independent Registered Public Accounting Firm. |
| | | | All ratings are as of the date indicated and do not reflect subsequent changes. |
| | * | | Rated by Standard & Poor’s Corporation |
| | ^ | | When-issued security or extended settlement — see footnote 1(D) |
| | ** | | Security is segregated against line of credit — see footnote 7 |
Other Information
The following is a summary of the inputs used, as of June 30, 2023, involving the Fund’s investments in securities carried at fair value. The inputs or methodology used for valuing securities may not be an indication of the risk associated with investing in those securities. For more information on valuation inputs, and their aggregation into the levels used in the table below, please refer to the Security Valuation section in the accompanying Notes to Financial Statements.
| | | | | | |
| | | Valuation Inputs | | Municipal Bonds | |
Level 1 | | Quoted Prices | | $ | — | |
Level 2 | | Other Significant Observable Inputs | | | 62,479,920 | |
Level 3 | | Significant Unobservable Inputs | | | — | |
| | | | | | |
| | | | $ | 62,479,920 | |
| | | | | | |
The accompanying footnotes are an integral part of the financial statements.
35
TENNESSEE TAX-FREE INCOME SERIES
STATEMENT OF ASSETS AND LIABILITIES
June 30, 2023
| | | | | | | | |
ASSETS: | | | | | | | | |
Investments in securities, at fair value (Cost: $63,892,675) | | | | | | $ | 62,479,920 | |
Cash | | | | | | | 524,661 | |
Interest receivable | | | | | | | 802,816 | |
| | | | | | | | |
Total assets | | | | | | | 63,807,397 | |
LIABILITIES: | | | | | | | | |
Payable for: | | | | | | | | |
Investments purchased | | | 100,000 | | | | | |
Distributions to shareholders | | | 142,103 | | | | | |
Fund shares redeemed | | | 11,578 | | | | | |
Investment advisory fee | | | 22,243 | | | | | |
Transfer agent fee | | | 6,948 | | | | | |
Professional fees | | | 6,593 | | | | | |
Audit fees | | | 4,747 | | | | | |
Trustees fees | | | 2,730 | | | | | |
Custodian fee | | | 815 | | | | | |
Accrued expenses | | | 12,725 | | | | | |
| | | | | | | | |
Total liabilities | | | | | | | 310,482 | |
| | | | | | | | |
NET ASSETS: | | | | | | | | |
Paid-in capital | | | | | | | 65,849,135 | |
Total accumulated loss | | | | | | | (2,352,220 | ) |
| | | | | | | | |
Total Net Assets | | | | | | $ | 63,496,915 | |
| | | | | | | | |
NET ASSET VALUE, offering price and redemption price per share
(6,007,445 shares outstanding; unlimited number of shares authorized; no par value) | | | | | | $ | 10.57 | |
| | | | | | | | |
STATEMENT OF OPERATIONS
For the year ended June 30, 2023
| | | | |
Net investment income: | | | | |
Interest income | | $ | 2,122,605 | |
| | | | |
Expenses: | | | | |
Investment advisory fee | | | 330,682 | |
Transfer agent fee | | | 85,364 | |
Professional fees | | | 29,475 | |
Custodian fee | | | 13,835 | |
Registration fees | | | 13,489 | |
Pricing fees | | | 10,001 | |
Trustees fees | | | 9,633 | |
Compliance fees | | | 6,501 | |
Other expenses | | | 15,250 | |
| | | | |
Total expenses | | | 514,230 | |
Fees waived by Adviser (Note 2) | | | (51,495 | ) |
Custodian fee reduction (Note 7) | | | (37 | ) |
| | | | |
Net expenses | | | 462,698 | |
| | | | |
Net investment income | | | 1,659,907 | |
| | | | |
Realized and unrealized gain/(loss) on investments: | | | | |
Net realized loss | | | (742,186 | ) |
Net change in unrealized appreciation/depreciation | | | 93,095 | |
| | | | |
Net realized and unrealized loss on investments | | | (649,091 | ) |
| | | | |
Net increase in net assets resulting from operations | | $ | 1,010,816 | |
| | | | |
The accompanying footnotes are an integral part of the financial statements.
36
TENNESSEE TAX-FREE INCOME SERIES
STATEMENTS OF CHANGES IN NET ASSETS
For the years ended June 30, 2023 and 2022
| | | | | | | | |
| | | 2023 | | | 2022 | |
Operations: | | | | | | | | |
Net investment income | | $ | 1,659,907 | | | $ | 1,890,340 | |
Net realized loss on investments | | | (742,186 | ) | | | (24,886 | ) |
Net change in unrealized appreciation/depreciation | | | 93,095 | | | | (7,560,469 | ) |
| | | | | | | | |
Net increase/(decrease) in net assets resulting from operations | | | 1,010,816 | | | | (5,695,015 | ) |
Total distributions (Note 6) | | | (1,659,907 | ) | | | (1,890,340 | ) |
Net Fund share transactions (Note 4) | | | (9,462,519 | ) | | | (4,952,902 | ) |
| | | | | | | | |
Total decrease | | | (10,111,610 | ) | | | (12,538,257 | ) |
Net assets: | | | | | | | | |
Beginning of year | | | 73,608,525 | | | | 86,146,782 | |
| | | | | | | | |
End of year | | $ | 63,496,915 | | | $ | 73,608,525 | |
| | | | | | | | |
FINANCIAL HIGHLIGHTS
| | | | | | | | | | | | | | | | | | | | |
| Selected data for a share outstanding: | | For the years ended June 30, | |
| | | 2023 | | | 2022 | | | 2021 | | | 2020 | | | 2019 | |
Net asset value, beginning of year | | $ | 10.65 | | | $ | 11.71 | | | $ | 11.66 | | | $ | 11.51 | | | $ | 11.24 | |
| | | | | | | | | | | | | | | | | | | | |
Income from investment operations: | | | | | | | | | | | | | | | | | | | | |
Net investment income | | | 0.27 | | | | 0.26 | | | | 0.27 | | | | 0.28 | | | | 0.30 | |
Net gains/(losses) on investments (b) | | | (0.08 | ) | | | (1.06 | ) | | | 0.05 | | | | 0.15 | | | | 0.27 | |
| | | | | | | | | | | | | | | | | | | | |
Total from investment operations | | | 0.19 | | | | (0.80 | ) | | | 0.32 | | | | 0.43 | | | | 0.57 | |
Less distributions: | | | | | | | | | | | | | | | | | | | | |
Distributions from net investment income | | | (0.27 | ) | | | (0.26 | ) | | | (0.27 | ) | | | (0.28 | ) | | | (0.30 | ) |
| | | | | | | | | | | | | | | | | | | | |
Net asset value, end of year | | $ | 10.57 | | | $ | 10.65 | | | $ | 11.71 | | | $ | 11.66 | | | $ | 11.51 | |
| | | | | | | | | | | | | | | | | | | | |
Total return | | | 1.78% | | | | (6.92)% | | | | 2.84% | | | | 3.77% | | | | 5.12% | |
Net assets, end of year (in thousands) | | $ | 63,497 | | | $ | 73,609 | | | $ | 86,147 | | | $ | 95,680 | | | $ | 104,207 | |
Ratio of net expenses to average net assets (a) | | | 0.70% | | | | 0.70% | | | | 0.70% | | | | 0.70% | | | | 0.70% | |
Ratio of gross expenses to average net assets | | | 0.78% | | | | 0.71% | | | | 0.71% | | | | 0.71% | | | | 0.71% | |
Ratio of net investment income to average net assets | | | 2.51% | | | | 2.31% | | | | 2.35% | | | | 2.42% | | | | 2.63% | |
Portfolio turnover | | | 9.10% | | | | 11.61% | | | | 2.75% | | | | 3.46% | | | | 6.46% | |
| (a) | | Percentages are after expense waivers and reductions by the Adviser and Custodian. The Adviser and Custodian have agreed not to seek recovery of these waivers and reductions. |
| (b) | | Realized and unrealized gains and losses per share in this caption may be balancing amounts necessary to reconcile the change in net asset value per share for the period, and may not reconcile with the Fund’s statement of operations due to share transactions for the period. |
The accompanying footnotes are an integral part of the financial statements.
37
DUPREE MUTUAL FUNDS — TENNESSEE TAX-FREE SHORT-TO-MEDIUM SERIES
SCHEDULE OF PORTFOLIO INVESTMENTS
Tennessee Municipal Bonds
June 30, 2023
| | | | | | | | | | | | | | | | | | |
| Bond Description | | Coupon | | | Maturity
Date | | | Rating# | | Par Value | | | Fair Value | |
| REFUNDING BONDS | |
| 36.17% of Net Assets | | | | | | | | | | | | | | | | | | |
| Loudon County TN | | | 5.000 | % | | | 06/01/2025 | | | Aa2 | | $ | 150,000 | | | $ | 155,466 | |
Maryville TN | | | 5.000 | | | | 06/01/2026 | | | Aa2 | | | 350,000 | | | | 370,524 | |
Memphis TN General Improvement** | | | 5.000 | | | | 11/01/2023 | | | Aa2 | | | 350,000 | | | | 352,135 | |
Memphis-Shelby County TN Industrial Development Board | | | 5.000 | | | | 11/01/2027 | | | Aa3 | | | 200,000 | | | | 212,470 | |
Putnam County TN | | | 4.000 | | | | 04/01/2025 | | | Aa2 | | | 100,000 | | | | 101,349 | |
Sevierville TN | | | 5.000 | | | | 05/01/2028 | | | Aa3 | | | 125,000 | | | | 137,471 | |
| | | | | | | | | | | | | | | | | | |
| | | | | | | | | | | | | | | | | 1,329,415 | |
| MUNICIPAL UTILITY REVENUE BONDS | |
| 21.32% of Net Assets | | | | | | | | | | | | | | | | | | |
Hallsdale-Powell TN Utility District | | | 4.000 | | | | 04/01/2028 | | | AA* | | | 255,000 | | | | 261,408 | |
Maryville TN | | | 4.000 | | | | 06/01/2029 | | | Aa2 | | | 250,000 | | | | 258,065 | |
Springfield TN | | | 5.000 | | | | 06/01/2027 | | | Aa3 | | | 245,000 | | | | 264,492 | |
| | | | | | | | | | | | | | | | | | |
| | | | | | | | | | | | | | | | | 783,965 | |
| SCHOOL IMPROVEMENT BONDS | |
| 14.19% of Net Assets | | | | | | | | | | | | | | | | | | |
Bedford County TN | | | 4.000 | | | | 04/01/2027 | | | AA* | | | 250,000 | | | | 257,283 | |
White County TN | | | 4.000 | | | | 06/01/2027 | | | AA-* | | | 260,000 | | | | 264,420 | |
| | | | | | | | | | | | | | | | | | |
| | | | | | | | | | | | | | | | | 521,703 | |
| UNIVERSITY CONSOLIDATED EDUCATION AND BUILDING REVENUE BONDS | |
| 8.98% of Net Assets | | | | | | | | | | | | | | | | | | |
Shelby County TN Health Educational & Housing Facilities Rhodes College | | | 4.000 | | | | 08/01/2025 | | | A2 | | | 100,000 | | | | 101,661 | |
Shelby County TN Health Educational & Housing Facilities Rhodes College | | | 4.000 | | | | 08/01/2027 | | | A2 | | | 225,000 | | | | 228,600 | |
| | | | | | | | | | | | | | | | | | |
| | | | | | | | | | | | | | | | | 330,261 | |
| PREREFUNDED BONDS | |
| 7.90% of Net Assets | | | | | | | | | | | | | | | | | | |
Metropolitan Government Nashville & Davidson County TN Sports Authority | | | 5.250 | | | | 08/01/2024 | | | Aa3 | | | 190,000 | | | | 190,323 | |
Metropolitan Government Nashville & Davidson County TN Sports Authority | | | 5.250 | | | | 08/01/2026 | | | Aa3 | | | 100,000 | | | | 100,164 | |
| | | | | | | | | | | | | | | | | | |
| | | | | | | | | | | | | | | | | 290,487 | |
| PUBLIC FACILITIES REVENUE BONDS | |
| 6.97% of Net Assets | | | | | | | | | | | | | | | | | | |
Memphis-Shelby County TN Industrial Development Board | | | 5.000 | | | | 11/01/2024 | | | Aa3 | | | 250,000 | | | | 256,160 | |
| | | | | | | | | | | | | | | | | | |
| MISCELLANEOUS PUBLIC IMPROVEMENT BONDS | | | | | | | | | | | | | | | | | | |
| 0.96% of Net Assets | | | | | | | | | | | | | | | | | | |
Selmer TN | | | 4.000 | | | | 06/01/2025 | | | AA* | | | 35,000 | | | | 35,445 | |
| | | | | | | | | | | | | | | | | | |
Total Investments 96.49% of Net Assets (cost $3,584,107) (See footnote 6 for further explanation) | | | | | | | | | $ | 3,547,436 | |
| | | | | | | | | | | | | | | | | | |
Other assets in excess of liabilities 3.51% | | | | | | | | | | | | | | | | | 129,209 | |
| | | | | | | | | | | | | | | | | | |
Net Assets 100% | | | | | | | | | | | | | | | | $ | 3,676,645 | |
| | | | | | | | | | | | | | | | | | |
| | # | | Ratings by Moody’s Investors Service unless noted otherwise. |
| | | | Bond ratings are unaudited and not covered by Report of Independent Registered Public Accounting Firm. |
| | | | All ratings are as of the date indicated and do not reflect subsequent changes. |
| | * | | Rated by Standard & Poor’s Corporation |
| | ** | | Security is segregated against line of credit — see footnote 7 |
Other Information
The following is a summary of the inputs used, as of June 30, 2023, involving the Fund’s investments in securities carried at fair value. The inputs or methodology used for valuing securities may not be an indication of the risk associated with investing in those securities. For more information on valuation inputs, and their aggregation into the levels used in the table below, please refer to the Security Valuation section in the accompanying Notes to Financial Statements.
| | | | | | |
| | | Valuation Inputs | | Municipal Bonds | |
Level 1 | | Quoted Prices | | $ | — | |
Level 2 | | Other Significant Observable Inputs | | | 3,547,436 | |
Level 3 | | Significant Unobservable Inputs | | | — | |
| | | | | | |
| | | | $ | 3,547,436 | |
| | | | | | |
The accompanying footnotes are an integral part of the financial statements.
38
TENNESSEE TAX-FREE SHORT-TO-MEDIUM SERIES
STATEMENT OF ASSETS AND LIABILITIES
June 30, 2023
| | | | | | | | |
ASSETS: | | | | | | | | |
Investments in securities, at fair value (Cost: $3,584,107) | | | | | | $ | 3,547,436 | |
Cash | | | | | | | 112,284 | |
Receivable from Adviser | | | | | | | 44 | |
Interest receivable | | | | | | | 30,219 | |
| | | | | | | | |
Total assets | | | | | | | 3,689,983 | |
LIABILITIES: | | | | | | | | |
Payable for: | | | | | | | | |
Distributions to shareholders | | | 856 | | | | | |
Fund shares redeemed | | | 37 | | | | | |
Transfer agent fee | | | 125 | | | | | |
Professional fees | | | 4,391 | | | | | |
Pricing fees | | | 2,123 | | | | | |
Audit fees | | | 1,477 | | | | | |
Printing expense | | | 895 | | | | | |
Trustees fees | | | 721 | | | | | |
Custodian fee | | | 383 | | | | | |
Accrued expenses | | | 2,330 | | | | | |
| | | | | | | | |
Total liabilities | | | | | | | 13,338 | |
| | | | | | | | |
NET ASSETS: | | | | | | | | |
Paid-in capital | | | | | | | 3,984,874 | |
Total accumulated loss | | | | | | | (308,229 | ) |
| | | | | | | | |
Total Net Assets | | | | | | $ | 3,676,645 | |
| | | | | | | | |
NET ASSET VALUE, offering price and redemption price per share
(359,677 shares outstanding; unlimited number of shares authorized; no par value) | | | | | | $ | 10.22 | |
| | | | | | | | |
STATEMENT OF OPERATIONS
For the year ended June 30, 2023
| | | | |
Net investment income: | | | | |
Interest income | | $ | 95,933 | |
| | | | |
Expenses: | | | | |
Investment advisory fee | | | 20,848 | |
Transfer agent fee | | | 6,254 | |
Registration expense | | | 9,547 | |
Custodian fee | | | 6,105 | |
Compliance fees | | | 7,117 | |
Pricing fees | | | 3,752 | |
Professional fees | | | 1,269 | |
Trustees fees | | | 613 | |
Other expenses | | | 3,102 | |
| | | | |
Total expenses | | | 58,607 | |
Fees waived by Adviser (Note 2) | | | (23,537 | ) |
Fees waived by Transfer Agent (Note 2) | | | (5,809 | ) |
Custodian fee reduction (Note 7) | | | (16 | ) |
| | | | |
Net expenses | | | 29,245 | |
| | | | |
Net investment income | | | 66,688 | |
| | | | |
Realized and unrealized loss on investments: | | | | |
Net realized loss | | | (23,980 | ) |
Net change in unrealized appreciation/depreciation | | | (33,777 | ) |
| | | | |
Net realized and unrealized loss on investments | | | (57,757 | ) |
| | | | |
Net increase in net assets resulting from operations | | $ | 8,931 | |
| | | | |
The accompanying footnotes are an integral part of the financial statements.
39
TENNESSEE TAX-FREE SHORT-TO-MEDIUM SERIES
STATEMENTS OF CHANGES IN NET ASSETS
For the years ended June 30, 2023 and 2022
| | | | | | | | |
| | | 2023 | | | 2022 | |
Operations: | | | | | | | | |
Net investment income | | $ | 66,688 | | | $ | 83,245 | |
Net realized gain/(loss) on investments | | | (23,980 | ) | | | 3,481 | |
Net change in unrealized appreciation/depreciation | | | (33,777 | ) | | | (298,681 | ) |
| | | | | | | | |
Net increase/(decrease) in net assets resulting from operations | | | 8,931 | | | | (211,955 | ) |
Total distributions (Note 6) | | | (66,688 | ) | | | (83,245 | ) |
Net Fund share transactions (Note 4) | | | (758,531 | ) | | | (1,133,970 | ) |
| | | | | | | | |
Total decrease | | | (816,288 | ) | | | (1,429,170 | ) |
Net assets: | | | | | | | | |
Beginning of year | | | 4,492,933 | | | | 5,922,103 | |
| | | | | | | | |
End of year | | $ | 3,676,645 | | | $ | 4,492,933 | |
| | | | | | | | |
FINANCIAL HIGHLIGHTS
| | | | | | | | | | | | | | | | | | | | |
| Selected data for a share outstanding: | | For the years ended June 30, | |
| | | 2023 | | | 2022 | | | 2021 | | | 2020 | | | 2019 | |
Net asset value, beginning of year | | $ | 10.35 | | | $ | 10.94 | | | $ | 11.02 | | | $ | 10.82 | | | $ | 10.52 | |
| | | | | | | | | | | | | | | | | | | | |
Income from investment operations: | | | | | | | | | | | | | | | | | | | | |
Net investment income | | | 0.16 | | | | 0.17 | | | | 0.17 | | | | 0.17 | | | | 0.17 | |
Net gains/(losses) on investments (b) | | | (0.13 | ) | | | (0.59 | ) | | | (0.08 | ) | | | 0.20 | | | | 0.30 | |
| | | | | | | | | | | | | | | | | | | | |
Total from investment operations | | | 0.03 | | | | (0.42 | ) | | | 0.09 | | | | 0.37 | | | | 0.47 | |
Less distributions: | | | | | | | | | | | | | | | | | | | | |
Distributions from net investment income | | | (0.16 | ) | | | (0.17 | ) | | | (0.17 | ) | | | (0.17 | ) | | | (0.17 | ) |
| | | | | | | | | | | | | | | | | | | | |
Net asset value, end of year | | $ | 10.22 | | | $ | 10.35 | | | $ | 10.94 | | | $ | 11.02 | | | $ | 10.82 | |
| | | | | | | | | | | | | | | | | | | | |
Total return | | | 0.34% | | | | (3.89)% | | | | 0.81% | | | | 3.49% | | | | 4.48% | |
Net assets, end of year (in thousands) | | $ | 3,677 | | | $ | 4,493 | | | $ | 5,922 | | | $ | 6,600 | | | $ | 7,239 | |
Ratio of net expenses to average net assets (a) | | | 0.70% | | | | 0.70% | | | | 0.70% | | | | 0.70% | | | | 0.71% | |
Ratio of gross expenses to average net assets | | | 1.41% | | | | 1.19% | | | | 1.12% | | | | 1.14% | | | | 1.08% | |
Ratio of net investment income to average net assets | | | 1.60% | | | | 1.57% | | | | 1.54% | | | | 1.60% | | | | 1.57% | |
Portfolio turnover | | | 7.43% | | | | 0.00% | | | | 5.75% | | | | 4.55% | | | | 10.64% | |
| (a) | | Percentages are after expense waivers and reductions by the Adviser, Transfer Agent, and Custodian. The Adviser, Transfer Agent, and Custodian have agreed not to seek recovery of these waivers and reductions. |
| (b) | | Realized and unrealized gains and losses per share in this caption may be balancing amounts necessary to reconcile the change in net asset value per share for the period and may not reconcile with the Fund’s statement of operations due to share transactions for the period. |
The accompanying footnotes are an integral part of the financial statements.
40
DUPREE MUTUAL FUNDS — INTERMEDIATE GOVERNMENT BOND SERIES
SCHEDULE OF PORTFOLIO INVESTMENTS
U.S. Government Securities and Agencies
June 30, 2023
| | | | | | | | | | | | | | | | | | |
| Bond Description | | Coupon | | | Maturity
Date | | | Rating# | | Par Value | | | Fair Value | |
| FEDERAL HOME LOAN BANK | |
| 66.47% of Net Assets | | | | | | | | | | | | | | | | | | |
Federal Home Loan Bank | | | 4.900 | % | | | 11/28/2023 | | | Aaa | | $ | 500,000 | | | $ | 498,881 | |
Federal Home Loan Bank | | | 3.400 | | | | 07/19/2024 | | | Aaa | | | 900,000 | | | | 880,434 | |
Federal Home Loan Bank | | | 5.365 | | | | 09/09/2024 | | | Aaa | | | 1,750,000 | | | | 1,749,315 | |
Federal Home Loan Bank | | | 5.250 | | | | 10/28/2024 | | | Aaa | | | 350,000 | | | | 347,406 | |
Federal Home Loan Bank | | | 4.000 | | | | 01/22/2025 | | | Aaa | | | 900,000 | | | | 880,690 | |
Federal Home Loan Bank | | | 3.300 | | | | 06/09/2025 | | | Aaa | | | 500,000 | | | | 482,948 | |
Federal Home Loan Bank | | | 3.600 | | | | 07/18/2025 | | | Aaa | | | 900,000 | | | | 875,586 | |
Federal Home Loan Bank | | | 5.000 | | | | 07/28/2025 | | | Aaa | | | 250,000 | | | | 248,386 | |
Federal Home Loan Bank | | | 5.000 | | | | 04/24/2026 | | | Aaa | | | 300,000 | | | | 296,804 | |
Federal Home Loan Bank ** | | | 3.200 | | | | 06/10/2027 | | | Aaa | | | 250,000 | | | | 238,072 | |
| | | | | | | | | | | | | | | | | | |
| | | | | | | | | | | | | | | | | 6,498,522 | |
| FEDERAL HOME LOAN MORTAGE CORPORATION | |
| 24.17% of Net Assets | | | | | | | | | | | | | | | | | | |
Federal Home Loan Mortgage Corporation | | | 3.000 | | | | 06/13/2024 | | | Aaa | | | 250,000 | | | | 243,460 | |
Federal Home Loan Mortgage Corporation | | | 5.100 | | | | 11/26/2024 | | | Aaa | | | 500,000 | | | | 495,460 | |
Federal Home Loan Mortgage Corporation | | | 5.020 | | | | 01/27/2025 | | | Aaa | | | 250,000 | | | | 247,509 | |
Federal Home Loan Mortgage Corporation | | | 4.950 | | | | 11/28/2025 | | | Aaa | | | 1,000,000 | | | | 992,802 | |
Federal Home Loan Mortgage Corporation | | | 1.400 | | | | 07/28/2032 | | | Aaa | | | 500,000 | | | | 383,341 | |
| | | | | | | | | | | | | | | | | | |
| | | | | | | | | | | | | | | | | 2,362,572 | |
| FEDERAL FARM CREDIT | |
| 6.89% of Net Assets | | | | | | | | | | | | | | | | | | |
Federal Farm Credit Bank | | | 2.375 | | | | 08/01/2029 | | | Aaa | | | 750,000 | | | | 673,121 | |
| | | | | | | | | | | | | | | | | | |
Total Investments 97.53% of Net Assets (cost $9,906,191) (See footnote 6 for further explanation) | | | $ | 9,534,215 | |
| | | | | | | | | | | | | | | | | | |
Other assets in excess of liabilities 2.47% | | | | | | | | | | 241,803 | |
| | | | | | | | | | | | | | | | | | |
Net Assets 100% | | | | | | | | | $ | 9,776,018 | |
| | | | | | | | | | | | | | | | | | |
| | # | | Ratings by Moody’s Investors Service unless noted otherwise. |
| | | | Bond ratings are unaudited and not covered by Report of Independent Registered Public Accounting Firm. |
| | | | All ratings are as of the date indicated and do not reflect subsequent changes. |
| | ** | | Security is segregated against line of credit — see footnote 7 |
Other Information
The following is a summary of the inputs used, as of June 30, 2023, involving the Fund’s investments in securities carried at fair value. The inputs or methodology used for valuing securities may not be an indication of the risk associated with investing in those securities. For more information on valuation inputs, and their aggregation into the levels used in the table below, please refer to the Security Valuation section in the accompanying Notes to Financial Statements.
| | | | | | |
| | | Valuation Inputs | | Government
Agencies | |
Level 1 | | Quoted Prices | | | — | |
Level 2 | | Other Significant Observable Inputs | | $ | 9,534,215 | |
Level 3 | | Significant Unobservable Inputs | | | — | |
| | | | | | |
| | | | $ | 9,534,215 | |
| | | | | | |
The accompanying footnotes are an integral part of the financial statements.
41
INTERMEDIATE GOVERNMENT BOND SERIES
STATEMENT OF ASSETS AND LIABILITIES
June 30, 2023
| | | | | | | | |
ASSETS: | | | | | | | | |
Investments in securities, at fair value (Cost: $9,906,191) | | | | | | $ | 9,534,215 | |
Cash | | | | | | | 149,662 | |
Interest receivable | | | | | | | 111,657 | |
| | | | | | | | |
Total assets | | | | | | | 9,795,534 | |
LIABILITIES: | | | | | | | | |
Payable for: | | | | | | | | |
Distributions to shareholders | | | 4,826 | | | | | |
Fund shares redeemed | | | 248 | | | | | |
Transfer agent fee | | | 625 | | | | | |
Compliance fees | | | 3,591 | | | | | |
Professional fees | | | 2,338 | | | | | |
Custodian fee | | | 1,839 | | | | | |
Printing expense | | | 1,447 | | | | | |
Trustees fees | | | 604 | | | | | |
Accrued expenses | | | 3,998 | | | | | |
| | | | | | | | |
Total liabilities | | | | | | | 19,516 | |
| | | | | | | | |
NET ASSETS: | | | | | | | | |
Paid-in capital | | | | | | | 10,233,618 | |
Total accumulated loss | | | | | | | (457,600 | ) |
| | | | | | | | |
Total Net Assets | | | | | | $ | 9,776,018 | |
| | | | | | | | |
NET ASSET VALUE, offering price and redemption price per share
(1,050,361 shares outstanding; unlimited number of shares authorized; no par value) | | | | | | $ | 9.31 | |
| | | | | | | | |
STATEMENT OF OPERATIONS
For the year ended June 30, 2023
| | | | |
Net investment income: | | | | |
Interest income | | $ | 361,156 | |
| | | | |
Expenses: | | | | |
Investment advisory fee | | | 20,471 | |
Transfer agent fee | | | 15,353 | |
Custodian fee | | | 16,271 | |
Registration fees | | | 11,218 | |
Compliance fees | | | 7,130 | |
Pricing fees | | | 7,037 | |
Printing expense | | | 5,475 | |
Professional fees | | | 3,060 | |
Trustees fees | | | 1,474 | |
Other expenses | | | 4,331 | |
| | | | |
Total expenses | | | 91,820 | |
Fees waived by Adviser (Note 2) | | | (16,202 | ) |
Fees waived by Transfer Agent (Note 2) | | | (3,848 | ) |
Custodian fee reduction (Note 7) | | | (25 | ) |
| | | | |
Net expenses | | | 71,745 | |
| | | | |
Net investment income | | | 289,411 | |
| | | | |
Realized and unrealized loss on investments: | | | | |
Net realized loss | | | (40,521 | ) |
Net change in unrealized appreciation/depreciation | | | (218,529 | ) |
| | | | |
Net realized and unrealized loss on investments | | | (259,050 | ) |
| | | | |
Net increase in net assets resulting from operations | | $ | 30,361 | |
| | | | |
The accompanying footnotes are an integral part of the financial statements.
42
INTERMEDIATE GOVERNMENT BOND SERIES
STATEMENTS OF CHANGES IN NET ASSETS
For the years ended June 30, 2023 and 2022
| | | | | | | | |
| | | 2023 | | | 2022 | |
Operations: | | | | | | | | |
Net investment income | | $ | 289,411 | | | $ | 262,283 | |
Net realized gain/(loss) on investments | | | (40,521 | ) | | | 6,835 | |
Net change in unrealized appreciation/depreciation | | | (218,529 | ) | | | (643,365 | ) |
| | | | | | | | |
Net increase/(decrease) in net assets resulting from operations | | | 30,361 | | | | (374,247 | ) |
Total distributions (Note 6) | | | (289,411 | ) | | | (262,283 | ) |
Net Fund share transactions (Note 4) | | | (697,211 | ) | | | (675,223 | ) |
| | | | | | | | |
Total decrease | | | (956,261 | ) | | | (1,311,753 | ) |
Net assets: | | | | | | | | |
Beginning of year | | | 10,732,279 | | | | 12,044,032 | |
| | | | | | | | |
End of year | | $ | 9,776,018 | | | $ | 10,732,279 | |
| | | | | | | | |
FINANCIAL HIGHLIGHTS
| | | | | | | | | | | | | | | | | | | | |
| Selected data for a share outstanding: | | For the years ended June 30, | |
| | | 2023 | | | 2022 | | | 2021 | | | 2020 | | | 2019 | |
Net asset value, beginning of year | | $ | 9.54 | | | $ | 10.09 | | | $ | 10.37 | | | $ | 10.12 | | | $ | 9.87 | |
| | | | | | | | | | | | | | | | | | | | |
Income from investment operations: | | | | | | | | | | | | | | | | | | | | |
Net investment income | | | 0.27 | | | | 0.23 | | | | 0.23 | | | | 0.24 | | | | 0.25 | |
Net gains/(losses) on investments (b) | | | (0.23 | ) | | | (0.55 | ) | | | (0.28 | ) | | | 0.25 | | | | 0.25 | |
| | | | | | | | | | | | | | | | | | | | |
Total from investment operations | | | 0.04 | | | | (0.32 | ) | | | (0.05 | ) | | | 0.49 | | | | 0.50 | |
Less distributions: | | | | | | | | | | | | | | | | | | | | |
Distributions from net investment income | | | (0.27 | ) | | | (0.23 | ) | | | (0.23 | ) | | | (0.24 | ) | | | (0.25 | ) |
| | | | | | | | | | | | | | | | | | | | |
Net asset value, end of year | | $ | 9.31 | | | $ | 9.54 | | | $ | 10.09 | | | $ | 10.37 | | | $ | 10.12 | |
| | | | | | | | | | | | | | | | | | | | |
Total return | | | 0.39% | | | | (3.25)% | | | | (0.49)% | | | | 4.88% | | | | 5.12% | |
Net assets, end of year (in thousands) | | $ | 9,776 | | | $ | 10,732 | | | $ | 12,044 | | | $ | 15,677 | | | $ | 15,128 | |
Ratio of net expenses to average net assets (a) | | | 0.70% | | | | 0.70% | | | | 0.66% | | | | 0.68% | | | | 0.69% | |
Ratio of gross expenses to average net assets | | | 0.90% | | | | 0.75% | | | | 0.67% | | | | 0.68% | | | | 0.69% | |
Ratio of net investment income to average net assets | | | 2.83% | | | | 2.30% | | | | 2.25% | | | | 2.33% | | | | 2.50% | |
Portfolio turnover | | | 39.69% | | | | 17.50% | | | | 3.35% | | | | 5.07% | | | | 0.00% | |
| (a) | | Percentages are after expense waivers and reductions by the Adviser, Transfer Agent, and Custodian. The Adviser, Transfer Agent, and Custodian have agreed not to seek recovery of these waivers and reductions. |
| (b) | | Realized and unrealized gains and losses per share in this caption may be balancing amounts necessary to reconcile the change in net asset value per share for the period and may not reconcile with the Fund’s statement of operations due to share transactions for the period. |
The accompanying footnotes are an integral part of the financial statements.
43
DUPREE MUTUAL FUNDS — TAXABLE MUNICIPAL BOND SERIES
SCHEDULE OF PORTFOLIO INVESTMENTS
Taxable Municipal Bonds
June 30, 2023
| | | | | | | | | | | | | | | | |
| Bond Description | | Coupon | | | Maturity Date | | Rating# | | Par Value | | | Fair Value | |
| MUNICIPAL UTILITY REVENUE BONDS 22.18% of Net Assets | |
| Grant County WA Public Utility District | | | 3.336 | % | | 1/1/2041 | | Aa3 | | $ | 125,000 | | | $ | 100,548 | |
KY State Rural Water Finance Corporation | | | 3.000 | | | 8/1/2050 | | AA-* | | | 250,000 | | | | 169,450 | |
Metropolitan Government Nashville & Davidson County TN Recovery Zone | | | 6.693 | | | 7/1/2041 | | Aa2 | | | 200,000 | | | | 234,892 | |
OK State Municipal Power Authority | | | 6.310 | | | 1/1/2040 | | A2 | | | 95,000 | | | | 105,690 | |
Pigeon Forge TN Build America Recovery Zone | | | 7.125 | | | 6/1/2040 | | AA* | | | 300,000 | | | | 313,020 | |
| | | | | | | | | | | | | | | | |
| | | | | | | | | | | | | | | 923,600 | |
| PUBLIC FACILITIES REVENUE BONDS | |
| 16.24% of Net Assets | | | | | | | | | | | | | | | | |
Evanston IL Taxable Corporate Purpose Bonds | | | 4.250 | | | 12/1/2038 | | Aa2 | | | 75,000 | | | | 66,698 | |
Franklin County OH Convention Facilities Build America | | | 6.540 | | | 12/1/2036 | | Aa2 | | | 155,000 | | | | 173,918 | |
Metropolitan Government Nashville & Davidson County TN | | | 7.431 | | | 7/1/2043 | | A1 | | | 190,000 | | | | 228,184 | |
Montgomery AL Community Cooperative District | | | 2.815 | | | 11/1/2049 | | Aa1 | | | 200,000 | | | | 131,994 | |
Rhode Island Convention Center | | | 6.060 | | | 5/15/2035 | | A1 | | | 70,000 | | | | 75,408 | |
| | | | | | | | | | | | | | | | |
| | | | | | | | | | | | | | | 676,202 | |
| UNIVERSITY CONSOLIDATED EDUCATION AND BUILDING REVENUE BONDS | |
| 15.11% of Net Assets | | | | | | | | | | | | | | | | |
Mesa CO State College Auxiliary | | | 5.800 | | | 5/15/2040 | | Aa2 | | | 170,000 | | | | 176,499 | |
Mesa State College CO Auxiliary Facilities Build America | | | 6.746 | | | 5/15/2042 | | Aa2 | | | 100,000 | | | | 113,366 | |
Michigan State University Revenues** | | | 4.496 | | | 8/15/2048 | | Aa2 | | | 375,000 | | | | 339,161 | |
| | | | | | | | | | | | | | | | |
| | | | | | | | | | | | | | | 629,026 | |
| TURNPIKES/TOLLROAD/HIGHWAY REVENUE BONDS | |
| 8.39% of Net Assets | | | | | | | | | | | | | | | | |
Washoe County NV Highway Revenue | | | 7.969 | | | 2/1/2040 | | Aa3 | | | 280,000 | | | | 349,292 | |
| | | | | | | | | | | | | | | | |
| STATE AND LOCAL MORTGAGE/HOUSING REVENUE BONDS | |
| 7.94% of Net Assets | | | | | | | | | | | | | | | | |
Uptown Development Authority Texas | | | 3.464 | | | 9/1/2040 | | A1 | | | 200,000 | | | | 155,306 | |
VA State Housing Development Authority | | | 3.230 | | | 11/1/2050 | | Aa1 | | | 250,000 | | | | 175,155 | |
| | | | | | | | | | | | | | | | |
| | | | | | | | | | | | | | | 330,461 | |
| MISCELLANEOUS PUBLIC IMPROVEMENT BONDS | |
| 6.16% of Net Assets | | | | | | | | | | | | | | | | |
KY State Property & Buildings Build America** | | | 5.921 | | | 11/1/2030 | | A1 | | | 250,000 | | | | 256,413 | |
| | | | | | | | | | | | | | | | |
| SCHOOL IMPROVEMENT BONDS | |
| 6.00% of Net Assets | | | | | | | | | | | | | | | | |
Jefferson County TN Build America Bonds | | | 6.625 | | | 6/1/2040 | | Aa2 | | | 250,000 | | | | 250,025 | |
| | | | | | | | | | | | | | | | |
| MARINA/PORT AUTHORITY REVENUE BONDS | |
| 5.83% of Net Assets | | | | | | | | | | | | | | | | |
Miami Dade County FL Special Obligation | | | 7.500 | | | 4/1/2040 | | Aa2 | | | 200,000 | | | | 242,654 | |
| | | | | | | | | | | | | | | | |
| HOSPITAL AND HEALTHCARE REVENUE BONDS | |
| 5.08% of Net Assets | | | | | | | | | | | | | | | | |
Midland County TX Hospital District | | | 6.440 | | | 5/15/2039 | | Aa3 | | | 185,000 | | | | 211,523 | |
| | | | | | | | | | | | | | | | |
| AIRPORT REVENUE BONDS | |
| 2.06% of Net Assets | | | | | | | | | | | | | | | | |
Tri Cities TN Airport Authority Revenue | | | 3.625 | | | 5/1/2038 | | Aa2 | | | 100,000 | | | | 85,712 | |
| | | | | | | | | | | | | | | | |
| PREREFUNDED BONDS | |
| 0.58% of Net Assets | | | | | | | | | | | | | | | | |
Tri Cities TN Airport Authority Revenue | | | 3.625 | | | 5/1/2038 | | NR | | | 25,000 | | | | 24,148 | |
| | | | | | | | | | | | | | | | |
Total Investments 95.57% of Net Assets (cost $4,366,243) (See footnote 6 for further explanation) | | | | | | | | $ | 3,979,056 | |
| | | | | | | | | | | | | | | | |
Other assets in excess of liabilities 4.43% | | | | | | | | | | | | | | | 202,775 | |
| | | | | | | | | | | | | | | | |
Net Assets 100% | | | | | | | | | | | | | | $ | 4,181,831 | |
| | | | | | | | | | | | | | | | |
| | # | | Ratings by Moody’s Investors Service unless noted otherwise. |
| | | | Bond ratings are unaudited and not covered by Report of Independent Registered Public Accounting Firm. |
| | | | All ratings are as of the date indicated and do not reflect subsequent changes. |
| | * | | Rated by Standard & Poor’s Corporation |
| | ** | | Security is segregated against line of credit — see footnote 7 |
The accompanying footnotes are an integral part of the financial statements.
44
DUPREE MUTUAL FUNDS — TAXABLE MUNICIPAL BOND SERIES
SCHEDULE OF PORTFOLIO INVESTMENTS
Taxable Municipal Bonds
June 30, 2023
Other Information
The following is a summary of the inputs used, as of June 30, 2023, involving the Fund’s investments in securities carried at fair value. The inputs or methodology used for valuing securities may not be an indication of the risk associated with investing in those securities. For more information on valuation inputs, and their aggregation into the levels used in the table below, please refer to the Security Valuation section in the accompanying Notes to Financial Statements.
| | | | | | |
| | | Valuation Inputs | | Taxable
Municipal
Bonds | |
Level 1 | | Quoted Prices | | $ | — | |
Level 2 | | Other Significant Observable Inputs | | | 3,979,056 | |
Level 3 | | Significant Unobservable Inputs | | | — | |
| | | | | | |
| | | | $ | 3,979,056 | |
| | | | | | |
The accompanying footnotes are an integral part of the financial statements.
45
TAXABLE MUNICIPAL BOND SERIES
STATEMENT OF ASSETS AND LIABILITIES
June 30, 2023
| | | | | | | | |
ASSETS: | | | | | | | | |
Investments in securities, at fair value (Cost: $4,366,243) | | | | | | $ | 3,979,056 | |
Cash | | | | | | | 157,383 | |
Receivable from Adviser | | | | | | | 18,122 | |
Interest receivable | | | | | | | 57,411 | |
| | | | | | | | |
Total assets | | | | | | | 4,211,972 | |
LIABILITIES: | | | | | | | | |
Payable for: | | | | | | | | |
Distributions to shareholders | | | 4,518 | | | | | |
Transfer agent fee | | | 125 | | | | | |
Professional fees | | | 7,531 | | | | | |
Trustees fees | | | 5,934 | | | | | |
Registration fee | | | 3,619 | | | | | |
Pricing fees | | | 3,051 | | | | | |
Custodian fee | | | 2,379 | | | | | |
Accrued expenses | | | 2,984 | | | | | |
| | | | | | | | |
Total liabilities | | | | | | | 30,141 | |
| | | | | | | | |
NET ASSETS: | | | | | | | | |
Paid-in capital | | | | | | | 6,262,075 | |
Total accumulated loss | | | | | | | (2,080,244 | ) |
| | | | | | | | |
Total Net Assets | | | | | | $ | 4,181,831 | |
| | | | | | | | |
NET ASSET VALUE, offering price and redemption price per share
(552,836 shares outstanding; unlimited number of shares authorized; no par value) | | | | | | $ | 7.56 | |
| | | | | | | | |
STATEMENT OF OPERATIONS
For the year ended June 30, 2023
| | | | |
Net investment income: | | | | |
Interest income | | $ | 221,811 | |
| | | | |
Expenses: | | | | |
Investment advisory fee | | | 22,179 | |
Transfer agent fee | | | 6,654 | |
Custodian fee | | | 7,481 | |
Compliance fees | | | 7,202 | |
Registration fees | | | 7,012 | |
Pricing fees | | | 5,103 | |
Professional fees | | | 1,399 | |
Trustees fees | | | 684 | |
Other expenses | | | 2,875 | |
| | | | |
Total expenses | | | 60,589 | |
Fees waived by Adviser (Note 2) | | | (23,691 | ) |
Fees waived by Transfer Agent (Note 2) | | | (5,874 | ) |
Custodian fee reduction (Note 7) | | | (15 | ) |
| | | | |
Net expenses | | | 31,009 | |
| | | | |
Net investment income | | | 190,802 | |
| | | | |
Realized and unrealized loss on investments: | | | | |
Net realized loss | | | (175,419 | ) |
Net change in unrealized appreciation/depreciation | | | (153,179 | ) |
| | | | |
Net realized and unrealized loss on investments | | | (328,598 | ) |
| | | | |
Net decrease in net assets resulting from operations | | $ | (137,796 | ) |
| | | | |
The accompanying footnotes are an integral part of the financial statements.
46
TAXABLE MUNICIPAL BOND SERIES
STATEMENTS OF CHANGES IN NET ASSETS
For the years ended June 30, 2023 and 2022
| | | | | | | | |
| | | 2023 | | | 2022 | |
Operations: | | | | | | | | |
Net investment income | | $ | 190,802 | | | $ | 358,393 | |
Net realized loss on investments | | | (175,419 | ) | | | (1,476,608 | ) |
Net change in unrealized appreciation/depreciation | | | (153,179 | ) | | | (1,143,150 | ) |
| | | | | | | | |
Net decrease in net assets resulting from operations | | | (137,796 | ) | | | (2,261,365 | ) |
Total distributions (Note 6) | | | (192,498 | ) | | | (362,905 | ) |
Net Fund share transactions (Note 4) | | | (644,348 | ) | | | (6,815,481 | ) |
| | | | | | | | |
Total decrease | | | (974,642 | ) | | | (9,439,751 | ) |
Net assets: | | | | | | | | |
Beginning of year | | | 5,156,473 | | | | 14,596,224 | |
| | | | | | | | |
End of year | | $ | 4,181,831 | | | $ | 5,156,473 | |
| | | | | | | | |
FINANCIAL HIGHLIGHTS
| | | | | | | | | | | | | | | | | | | | |
| Selected data for a share outstanding: | | For the years ended June 30, | |
| | | 2023 | | | 2022 | | | 2021 | | | 2020 | | | 2019 | |
Net asset value, beginning of year | | $ | 8.09 | | | $ | 10.28 | | | $ | 10.40 | | | $ | 10.39 | | | $ | 10.24 | |
| | | | | | | | | | | | | | | | | | | | |
Income from investment operations: | | | | | | | | | | | | | | | | | | | | |
Net investment income | | | 0.33 | | | | 0.29 | | | | 0.34 | | | | 0.52 | | | | 0.51 | |
Net gains/(losses) on investments (b) | | | (0.53 | ) | | | (2.19 | ) | | | (0.06 | ) | | | 0.01 | | | | 0.15 | |
| | | | | | | | | | | | | | | | | | | | |
Total from investment operations | | | (0.20 | ) | | | (1.90 | ) | | | 0.28 | | | | 0.53 | | | | 0.66 | |
Less distributions: | | | | | | | | | | | | | | | | | | | | |
Distributions from net investment income | | | (0.33 | ) | | | (0.29 | ) | | | (0.34 | ) | | | (0.52 | ) | | | (0.51 | ) |
Distributions from capital gains | | | 0.00 | | | | 0.00 | | | | (0.06 | ) | | | 0.00 | | | | 0.00 | |
| | | | | | | | | | | | | | | | | | | | |
Total distributions | | | (0.33 | ) | | | (0.29 | ) | | | (0.40 | ) | | | (0.52 | ) | | | (0.51 | ) |
| | | | | | | | | | | | | | | | | | | | |
Net asset value, end of year | | $ | 7.56 | | | $ | 8.09 | | | $ | 10.28 | | | $ | 10.40 | | | $ | 10.39 | |
| | | | | | | | | | | | | | | | | | | | |
Total return | | | (2.38)% | | | | (18.86)% | | | | 2.72% | | | | 5.20% | | | | 6.64% | |
Net assets, end of year (in thousands) | | $ | 4,182 | | | $ | 5,156 | | | $ | 14,596 | | | $ | 13,722 | | | $ | 12,239 | |
Ratio of net expenses to average net assets (a) | | | 0.70% | | | | 0.70% | | | | 0.70% | | | | 0.70% | | | | 0.70% | |
Ratio of gross expenses to average net assets | | | 1.37% | | | | 1.00% | | | | 0.96% | | | | 1.02% | | | | 1.00% | |
Ratio of net investment income to average net assets | | | 4.31% | | | | 2.89% | | | | 3.30% | | | | 4.62% | | | | 4.99% | |
Portfolio turnover | | | 0.00% | | | | 8.39% | | | | 33.27% | | | | 16.28% | | | | 3.58% | |
| (a) | | Percentages are after expense waivers and reductions by the Adviser, Transfer Agent, and Custodian. The Adviser, Transfer Agent, and Custodian have agreed not to seek recovery of these waivers and reductions. |
| (b) | | Realized and unrealized gains and losses per share in this caption may be balancing amounts necessary to reconcile the change in net asset value per share for the period, and may not reconcile with the Fund’s statement of operations due to share transactions for the period. |
The accompanying footnotes are an integral part of the financial statements.
47
DUPREE MUTUAL FUNDS
NOTES TO FINANCIAL STATEMENTS
June 30, 2023
| 1. | | Organization and Significant Accounting Policies |
Dupree Mutual Funds is registered under the Investment Company Act of 1940, as amended, (“1940 Act”) as a no-load, open-end investment company. The Declaration of Trust of Dupree Mutual Funds (the “Trust”) permits the Trustees to create an unlimited number of series of investment portfolios (each a “Fund” and collectively, the “Funds”) and with respect to each series to issue an unlimited number of full or fractional shares of a single class. The Trust currently offers ten series:
Alabama Tax-Free Income Series
Kentucky Tax-Free Income Series
Kentucky Tax-Free Short-to-Medium Series
Mississippi Tax-Free Income Series
North Carolina Tax-Free Income Series
North Carolina Tax-Free Short-to-Medium Series
Tennessee Tax-Free Income Series
Tennessee Tax-Free Short-to-Medium Series
Intermediate Government Bond Series
Taxable Municipal Bond Series
The investment strategy of each of the eight state tax-free Funds is to invest exclusively in municipal securities issued by the states of Alabama, Kentucky, Mississippi, North Carolina and Tennessee, respectively. Normally, each Fund’s assets will be invested so that (1) at least 80% of the income earned on the investments will be exempt from Federal and state income taxes or (2) at least 80% of the Fund’s net assets will be invested in securities exempt from Federal and state income taxes.
The Intermediate Government Bond Series’ investment strategy is to invest only in obligations of the U.S. Treasury and agencies of the U.S. Government. The Intermediate Government Bond Series will buy bonds and notes that will maintain an average maturity of no more than ten years, and its weighted average nominal maturity will normally range between 3-10 years.
The Taxable Municipal Bond Series’ investment strategy is to invest in taxable municipal bonds of investment grade quality.
The following is a summary of significant accounting policies consistently followed by the Funds in the preparation of their financial statements. The policies are in conformity with accounting principles generally accepted in the United States (“U.S. GAAP”). The Trust operates as an investment company, as defined in Financial Accounting Standards Board (“FASB”) Accounting Standards Update 2013-08, and accordingly follows the investment company accounting and reporting guidance of Accounting Standards Codification (“ASC”) Topic 946 “Financial Services – Investment Companies.”
The Funds indemnify the Trust’s Officers and Trustees for certain liabilities that might arise from their performance of their duties to the Funds. Additionally, in the normal course of business, the Funds enter into contracts that contain a variety of representations and warranties and which provide general indemnifications. The Funds’ maximum exposure under these arrangements is unknown, as this would involve future claims that may be made against the Funds that have not yet occurred. However, based on experience, the Funds expect the risk of loss to be remote.
In general, securities for which market quotations are readily available are valued at current market value, as provided by independent third-party pricing agents. All other securities are valued at fair value as determined in good faith by the Funds’ Valuation Designee, Dupree & Company, Inc. (the “Valuation Designee”). The Valuation Designee is responsible for, among other things, monitoring the value of the Funds’ securities. These procedures involve the use of matrix pricing models which take into consideration, among other factors, years to maturity, call date, coupon rate, trading patterns, creditworthiness, supply and demand dynamics, trading characteristics, special circumstances of a security or trading market, and any other factors or market data considered relevant in determining the value for securities. The procedures also include weekly verification of market quotations provided by two independent pricing services. A bond valuation that is not supported by the matrix pricing model requires the Valuation Designee to fair value the security in accordance with
48
DUPREE MUTUAL FUNDS
NOTES TO FINANCIAL STATEMENTS
June 30, 2023
| 1. | | Organization and Significant Accounting Policies, continued |
Board approved policies and procedures (the “Valuation Procedures”). Pursuant to the Valuation Procedures, the Valuation Designee has the day-to-day responsibility for fair valuing the Trust’s securities or other assets. Securities valued by the Valuation Designee are reviewed by the Valuation Committee, which consists of all the Independent Trustees. Shares of open-end mutual funds in which the Funds invest, if any, are valued at their respective net asset values as reported by the underlying funds.
The Funds have adopted the provisions of FASB ASC 820, “Fair Value Measurements and Disclosures.” ASC 820 establishes a hierarchy that prioritizes the inputs to valuation techniques giving the highest priority to readily available unadjusted quoted prices in active markets for identical assets (level 1 measurements) and the lowest priority to unobservable inputs (level 3 measurements) when market prices are not readily available or reliable. The three levels of the hierarchy under ASC 820 are as follows:
| | |
| Level 1: | | Unadjusted quoted prices in active markets for identical securities. |
| Level 2: | | Prices determined using other significant observable inputs. Observable inputs, either directly or indirectly, are inputs that other market participants may use in pricing a security. These may include quoted prices for similar securities, interest rates, prepayment speeds, credit risk and others. |
| Level 3: | | Price determined using significant unobservable inputs. In situations where quoted prices or observable inputs are unavailable or deemed less relevant (for example, where there is little or no market activity for an investment at the end of the period), unobservable inputs may be used. Unobservable inputs reflect the Funds’ own assumptions about the factors market participants would use in pricing a security, and would be based on the best information available. |
The aggregate value by input level, as of June 30, 2023, for the Funds’ investments is included at the end of the Funds’ Schedules of Portfolio Investments.
| | B. | Investment Transactions |
Security transactions are accounted for on a trade date basis. Realized gains and losses on securities sold are determined on an identified cost basis.
Interest income, which includes the amortization of premiums and the accretion of discounts, is recorded on an accrual basis. Discounts or premiums on debt securities purchased are accreted or amortized to interest income over the lives of the respective securities using the effective interest method.
| | D. | When-Issued and Extended Settlement Securities |
The Funds may purchase securities with delivery or payment to occur at a later date. At the time the Funds enter into a commitment to purchase a security, the transaction is recorded and the value of the security is reflected in the net asset value. The value of the security may vary with market fluctuations. No interest is accrued by the Funds until the security is delivered and payment takes place. Losses may occur on these transactions due to changes in market conditions or the failure of counterparties to perform under the contract.
It is each Fund’s policy to qualify as a regulated investment company by complying with the requirements of the Internal Revenue Code (the “Code”) applicable to regulated investment companies, including the distribution of all or substantially all taxable and tax-exempt income to their shareholders. The Funds have met the requirements of the Code applicable to regulated investment companies for the year ended June 30, 2023. Therefore, no federal income tax provision is required. Management has analyzed the Funds’ tax positions for all open tax years and all major jurisdictions, and has concluded that as of June 30, 2023, no provision for income taxes is required in the financial statements. Therefore, no additional tax expense, including any interest and penalties, was recorded in the current year and no adjustments were made to prior periods. To the extent the Funds recognize interest and penalties, they are included in interest expense and other expenses, respectively, in the Statements of Operations. Open tax years are those that are open for examination by taxing authorities (i.e., generally the last three tax year ends and the interim tax period since then).
49
DUPREE MUTUAL FUNDS
NOTES TO FINANCIAL STATEMENTS
June 30, 2023
| 1. | | Organization and Significant Accounting Policies, continued |
Substantially all of the net investment income of the Funds is declared as a dividend to shareholders of record as of the close of business each day. Any net realized long term capital gains are distributed annually to shareholders. Distributions are payable in cash or in additional shares at the net asset value on the payable date. Distributions are determined in accordance with income tax regulations, which may differ from U.S. GAAP.
Distributions are paid at the following frequencies:
| | |
| Monthly: | | Kentucky Tax-Free Short-to-Medium Series North Carolina Tax-Free Short-to-Medium Series Tennessee Tax-Free Short-to-Medium Series Intermediate Government Bond Series Taxable Municipal Bond Series |
| |
| Quarterly: | | Alabama Tax-Free Income Series Kentucky Tax-Free Income Series Mississippi Tax-Free Income Series North Carolina Tax-Free Income Series Tennessee Tax-Free Income Series |
The preparation of these financial statements in conformity with U.S. GAAP requires management to make estimates and assumptions that affect the amounts of assets and liabilities and disclosures of contingent assets and liabilities at the date of the financial statements and the reported amounts of income and expenses during the period. Actual amounts could differ from those estimates.
Subsequent events occurring after June 30, 2023 have been evaluated by Dupree & Company, Inc. (the “Adviser”) for potential impact to this report through the date the financial statements were issued. The Adviser has determined that there were no material subsequent events that require recognition or disclosure in the Funds’ financial statements.
| 2. | | Investment Advisory Fee and Other Transactions with Affiliates |
Subject to the direction of the Trustees, the Adviser is responsible for the management of the Funds’ portfolios. Under the terms of the Investment Advisory Agreements between the Adviser and the Trust, on behalf of each Fund (each a “Agreement” and collectively, the “Agreements”) the Funds (except the Intermediate Government Bond Series) have agreed to pay to the Adviser as compensation for all services rendered, facilities furnished and expenses paid or assumed by it under the Agreements, a fee at the annual rate of 0.50 of 1% of the first $100,000,000 average daily net assets of each Fund determined separately; 0.45 of 1% of the average daily net assets between $100,000,001 and $150,000,000 of each Fund determined separately; 0.40 of 1% of the average daily net assets between $150,000,001 and $500,000,000 of each Fund determined separately; 0.35 of 1% of the average daily net assets between $500,000,001 and $750,000,000; and 0.30 of 1% of the average daily net assets between $750,000,001 and $1,000,000,000; and 0.25 of 1% of the average daily net assets in excess of $1,000,000,000. The Intermediate Government Bond Series has agreed to pay to the Adviser, as compensation for all services rendered, facilities furnished and expenses paid or assumed by it under the Agreement, a fee at the annual rate of 0.20 of 1% of average daily net assets.
Dupree & Company, Inc., also serving as the Funds’ transfer agent (the “Transfer Agent”), may voluntarily waive investment advisory fees and transfer agent fees payable to it under the Investment Advisory Agreement and Transfer Agent Agreement with each Fund, and assume and pay other operating expenses. Dupree & Company, Inc. will not seek to recoup any waived fees or other operating expenses it has assumed.
50
DUPREE MUTUAL FUNDS
NOTES TO FINANCIAL STATEMENTS
June 30, 2023
| 2. | | Investment Advisory Fee and Other Transactions with Affiliates, continued |
For the year ended June 30, 2023, fees voluntarily waived by the Adviser and Transfer Agent were as follows:
| | | | | | | | |
| | | Fees waived by Adviser | | | Fees waived by Transfer Agent | |
Alabama Tax-Free Income Series | | $ | 52,673 | | | $ | -0- | |
Kentucky Tax-Free Income Series | | | -0- | | | | -0- | |
Kentucky Tax-Free Short-to-Medium Series | | | 37,083 | | | | -0- | |
Mississippi Tax-Free Income Series | | | 31,513 | | | | -0- | |
North Carolina Tax-Free Income Series | | | 56,316 | | | | -0- | |
North Carolina Tax-Free Short-to-Medium Series | | | 32,494 | | | | -0- | |
Tennessee Tax-Free Income Series | | | 51,495 | | | | -0- | |
Tennessee Tax-Free Short-to-Medium Series | | | 23,537 | | | | 5,809 | |
Intermediate Government Bond Series | | | 16,202 | | | | 3,848 | |
Taxable Municipal Bond Series | | | 23,691 | | | | 5,874 | |
In addition, each Fund has entered into a Transfer Agent and Dividend Disbursing Agent Services Agreement with the Transfer Agent. The agreement provides for a fee computed on the average daily net asset value at the annual rate of 0.15 of 1% on the first $20,000,000 of average net assets and 0.12 of 1% of all amounts in excess of $20,000,000 of average net assets for each Fund.
For the year ended June 30, 2023, each member of the Board of Trustees that is not an “interested person” as defined in the 1940 Act (each, an “Independent Trustee”) received a fee of $40,000. In addition, all Independent Trustees are reimbursed by the Funds for all reasonable out-of-pocket expenses incurred by them in performing their duties. The fees are allocated on an average monthly net asset basis for each Fund. The Trustees fees for each Fund are disclosed on the Funds’ Statements of Operations.
| 3. | | Purchases and Sales of Securities |
During the year ended June 30, 2023, the cost of purchases and the proceeds from sales/calls and maturities of securities (excluding short-term securities and U.S. government obligations, except for the Intermediate Government Bond Series which are all U.S. government obligations) for each Fund were as follows:
| | | | | | | | |
| | | Purchases | | | Sales/Calls/
Maturities | |
Alabama Tax-Free Income Series | | $ | 1,021,566 | | | $ | 4,861,522 | |
Kentucky Tax-Free Income Series | | | 85,608,292 | | | | 132,882,301 | |
Kentucky Tax-Free Short-to-Medium Series | | | 6,727,805 | | | | 11,507,115 | |
Mississippi Tax-Free Income Series | | | 1,971,329 | | | | 3,378,865 | |
North Carolina Tax-Free Income Series | | | 4,630,929 | | | | 16,772,854 | |
North Carolina Tax-Free Short-to-Medium Series | | | 2,099,441 | | | | 3,321,479 | |
Tennessee Tax-Free Income Series | | | 5,899,365 | | | | 14,364,036 | |
Tennessee Tax-Free Short-to-Medium Series | | | 297,377 | | | | 1,016,613 | |
Intermediate Government Bond Series | | | 4,050,000 | | | | 7,166,113 | |
Taxable Municipal Bond Series | | | -0- | | | | 553,320 | |
51
DUPREE MUTUAL FUNDS
NOTES TO FINANCIAL STATEMENTS
June 30, 2023
As of June 30, 2023 and June 30, 2022, there were an unlimited number of shares of beneficial interest authorized. Transactions in capital shares were as follows:
| | | | | | | | | | | | | | | | |
| ALABAMA TAX-FREE INCOME SERIES | | Year Ended June 30, 2023 | | | Year Ended June 30, 2022 | |
| | | SHARES | | | AMOUNT | | | SHARES | | | AMOUNT | |
Shares sold | | | 106,654 | | | $ | 1,225,096 | | | | 196,960 | | | $ | 2,464,942 | |
Shares reinvested | | | 22,847 | | | | 258,934 | | | | 21,203 | | | | 259,715 | |
Shares redeemed | | | (445,957 | ) | | | (5,076,770 | ) | | | (186,054 | ) | | | (2,301,180 | ) |
Net increase/(decrease) | | | (316,456 | ) | | $ | (3,592,740 | ) | | | 32,109 | | | $ | 423,477 | |
| | | | | | | | | | | | | | | | |
| KENTUCKY TAX-FREE INCOME SERIES | | Year Ended June 30, 2023 | | | Year Ended June 30, 2022 | |
| | | SHARES | | | AMOUNT | | | SHARES | | | AMOUNT | |
Shares sold | | | 18,007,811 | | | $ | 129,297,152 | | | | 14,222,679 | | | $ | 110,952,605 | |
Shares reinvested | | | 1,617,641 | | | | 11,505,083 | | | | 1,593,379 | | | | 12,192,407 | |
Shares redeemed | | | (27,747,572 | ) | | | (199,804,968 | ) | | | (22,091,850 | ) | | | (167,150,966 | ) |
Net decrease | | | (8,122,120 | ) | | $ | (59,002,733 | ) | | | (6,275,792 | ) | | $ | (44,005,954 | ) |
| | | | | | | | | | | | | | | | |
KENTUCKY TAX-FREE SHORT-TO-MEDIUM SERIES | | Year Ended June 30, 2023 | | | Year Ended June 30, 2022 | |
| | | SHARES | | | AMOUNT | | | SHARES | | | AMOUNT | |
Shares sold | | | 817,153 | | | $ | 4,183,398 | | | | 1,771,390 | | | $ | 9,291,397 | |
Shares reinvested | | | 71,661 | | | | 365,372 | | | | 69,899 | | | | 369,565 | |
Shares redeemed | | | (1,988,780 | ) | | | (10,130,471 | ) | | | (1,787,360 | ) | | | (9,379,789 | ) |
Net increase/(decrease) | | | (1,099,966 | ) | | $ | (5,581,701 | ) | | | 53,929 | | | $ | 281,173 | |
| | | | | | | | | | | | | | | | |
| MISSISSIPPI TAX-FREE INCOME SERIES | | Year Ended June 30, 2023 | | | Year Ended June 30, 2022 | |
| | | SHARES | | | AMOUNT | | | SHARES | | | AMOUNT | |
Shares sold | | | 136,276 | | | $ | 1,530,717 | | | | 93,511 | | | $ | 1,129,927 | |
Shares reinvested | | | 7,925 | | | | 87,317 | | | | 7,991 | | | | 94,928 | |
Shares redeemed | | | (278,020 | ) | | | (3,022,687 | ) | | | (127,853 | ) | | | (1,508,166 | ) |
Net decrease | | | (133,819 | ) | | $ | (1,404,653 | ) | | | (26,351 | ) | | $ | (283,311 | ) |
| | | | | | | | | | | | | | | | |
NORTH CAROLINA TAX-FREE INCOME SERIES | | Year Ended June 30, 2023 | | | Year Ended June 30, 2022 | |
| | | SHARES | | | AMOUNT | | | SHARES | | | AMOUNT | |
Shares sold | | | 1,835,705 | | | $ | 19,595,273 | | | | 2,775,766 | | | $ | 31,815,282 | |
Shares reinvested | | | 194,022 | | | | 2,052,709 | | | | 185,936 | | | | 2,127,491 | |
Shares redeemed | | | (3,325,750 | ) | | | (35,265,478 | ) | | | (3,977,163 | ) | | | (45,114,444 | ) |
Net decrease | | | (1,296,023 | ) | | $ | (13,617,496 | ) | | | (1,015,461 | ) | | $ | (11,171,671 | ) |
52
DUPREE MUTUAL FUNDS
NOTES TO FINANCIAL STATEMENTS
June 30, 2023
| 4. | | Capital Shares, continued |
| | | | | | | | | | | | | | | | |
NORTH CAROLINA TAX-FREE SHORT-TO-MEDIUM SERIES | | Year Ended June 30, 2023 | | | Year Ended June 30, 2022 | |
| | | SHARES | | | AMOUNT | | | SHARES | | | AMOUNT | |
Shares sold | | | 111,610 | | | $ | 1,147,583 | | | | 211,127 | | | $ | 2,249,766 | |
Shares reinvested | | | 14,912 | | | | 154,847 | | | | 13,766 | | | | 149,521 | |
Shares redeemed | | | (334,342 | ) | | | (3,462,920 | ) | | | (120,761 | ) | | | (1,288,973 | ) |
Net increase/(decrease) | | | (207,820 | ) | | $ | (2,160,490 | ) | | | 104,132 | | | $ | 1,110,314 | |
| | | | | | | | | | | | | | | | |
| TENNESSEE TAX-FREE INCOME SERIES | | Year Ended June 30, 2023 | | | Year Ended June 30, 2022 | |
| | | SHARES | | | AMOUNT | | | SHARES | | | AMOUNT | |
Shares sold | | | 348,732 | | | $ | 3,678,503 | | | | 375,074 | | | $ | 4,292,365 | |
Shares reinvested | | | 99,631 | | | | 1,045,157 | | | | 100,146 | | | | 1,122,805 | |
Shares redeemed | | | (1,355,694 | ) | | | (14,186,179 | ) | | | (916,682 | ) | | | (10,368,072 | ) |
Net decrease | | | (907,331 | ) | | $ | (9,462,519 | ) | | | (441,462 | ) | | $ | (4,952,902 | ) |
| | | | | | | | | | | | | | | | |
TENNESSEE TAX-FREE SHORT-TO-MEDIUM SERIES | | Year Ended June 30, 2023 | | | Year Ended June 30, 2022 | |
| | | SHARES | | | AMOUNT | | | SHARES | | | AMOUNT | |
Shares sold | | | 37,305 | | | $ | 383,476 | | | | 13,467 | | | $ | 142,595 | |
Shares reinvested | | | 5,342 | | | | 54,798 | | | | 6,388 | | | | 68,137 | |
Shares redeemed | | | (116,967 | ) | | | (1,196,805 | ) | | | (127,241 | ) | | | (1,344,702 | ) |
Net decrease | | | (74,320 | ) | | $ | (758,531 | ) | | | (107,386 | ) | | $ | (1,133,970 | ) |
| | | | | | | | | | | | | | | | |
| INTERMEDIATE GOVERNMENT BOND SERIES | | Year Ended June 30, 2023 | | | Year Ended June 30, 2022 | |
| | | SHARES | | | AMOUNT | | | SHARES | | | AMOUNT | |
Shares sold | | | 83,360 | | | $ | 777,071 | | | | 53,838 | | | $ | 531,475 | |
Shares reinvested | | | 24,945 | | | | 233,525 | | | | 21,665 | | | | 213,220 | |
Shares redeemed | | | (182,638 | ) | | | (1,707,807 | ) | | | (144,096 | ) | | | (1,419,918 | ) |
Net decrease | | | (74,333 | ) | | $ | (697,211 | ) | | | (68,593 | ) | | $ | (675,223 | ) |
| | | | | | | | | | | | | | | | |
| TAXABLE MUNICIPAL BOND SERIES | | Year Ended June 30, 2023 | | | Year Ended June 30, 2022 | |
| | | SHARES | | | AMOUNT | | | SHARES | | | AMOUNT | |
Shares sold | | | 4,302 | | | $ | 32,671 | | | | 190,676 | | | $ | 1,881,495 | |
Shares reinvested | | | 17,813 | | | | 134,751 | | | | 27,855 | | | | 271,383 | |
Shares redeemed | | | (106,694 | ) | | | (811,770 | ) | | | (1,000,416 | ) | | | (8,968,359 | ) |
Net decrease | | | (84,579 | ) | | $ | (644,348 | ) | | | (781,885 | ) | | $ | (6,815,481 | ) |
State-Specific Concentration of Credit Risk
The Alabama Tax-Free Income Series, Kentucky Tax-Free Income Series, Kentucky Tax-Free Short-to-Medium Series, Mississippi Tax-Free Income Series, North Carolina Tax-Free Income Series, North Carolina Tax-Free Short-to-Medium Series, Tennessee Tax-Free Income Series, and Tennessee Tax-Free Short-to-Medium Series each invest solely in debt obligations issued by the states of Alabama, Kentucky, Mississippi, North Carolina, and Tennessee, respectively, and their respective political subdivisions, agencies and public authorities to obtain funds for various public purposes. Each of these state-specific
53
DUPREE MUTUAL FUNDS
NOTES TO FINANCIAL STATEMENTS
June 30, 2023
| 5. | | Principal Risks, continued |
Funds is more susceptible to economic and political factors adversely affecting issuers of their respective states’ municipal securities than a fund that is not geographically concentrated in these issuers to the same extent.
Municipal Securities Risk
Many municipal securities are issued to finance similar projects (such as those relating to education, health care, housing, transportation, and utilities). As a result, conditions in those sectors may affect the overall municipal securities market. In addition, changes in the financial condition of an individual municipal issuer can affect the overall municipal market. Municipal securities backed by current or anticipated revenues from a specific project or specific assets can be negatively affected by the discontinuance of the supporting taxation or the inability to collect revenues for the specific project or specific assets. Municipal securities may be less liquid than taxable bonds and there may be less publicly available information on the financial condition of municipal securities issuers than for issuers of other securities. Therefore, the investment performance of a Fund investing in municipal securities may be more dependent on the analytical abilities of the Adviser than if a Fund held other types of investments such as stocks or taxable bonds. The secondary market for municipal securities also tends to be less liquid than many other securities markets. This is primarily the result of lower capital commitments to the asset class by the dealer community. This may adversely affect a Fund’s ability to sell or value municipal securities it holds. A Fund may also invest in municipal lease obligations which differ from other municipal securities because the lease payments are subject to annual legislative appropriation. If the money is not appropriated, the lease can be cancelled without penalty and investors who own the lease obligations may not be paid.
Market Risk
The market values of municipal securities held by a Fund may go up or down, sometimes rapidly or unpredictably, as a result of market activity, interest rate fluctuations or as a result of supply and demand factors. Accordingly, the net asset value (“NAV”) of the Funds’ shares will fluctuate. When there are more buyers than sellers, prices tend to rise. Conversely, when there are more sellers than buyers, prices tend to fall. Municipal securities may be issued on a when-issued or delayed settlement, where payment and delivery take place at a future date. Since the market price of a when-issued or delayed settlement security may fluctuate during the time before payment and delivery, a Fund assumes the risk that the value of the security at delivery may be more or less than the purchase price.
Taxability Risk
The Funds’ investments in municipal securities rely on the opinion of the issuer’s bond counsel that the interest paid on those securities will not be subject to federal income tax. Tax opinions are generally provided at the time the municipal security is initially issued. However, after a Fund buys a security, the Internal Revenue Service may determine that the issuer has not complied with applicable tax requirements and a bond issued as tax-exempt should in fact be taxable. This may result in a significant decline in the value of the security.
Non-Diversification Risk (Kentucky Tax-Free Short-to-Medium Series, Mississippi Tax-Free Income Series, Tennessee Tax-Free Short-to-Medium Series and Taxable Municipal Bond Series, only)
These Funds are non-diversified, and may invest a greater percentage of their assets in a particular issuer or group of issuers than a diversified fund would. This increased investment in fewer issuers may result in increased volatility in the Funds’ performance and share price.
Risks Associated with Health Crises
Health Crises, such as the coronavirus (“COVID 19”) pandemic, can significantly stress the financial resources of municipal issuers, which may impair a municipal issuer’s ability to meet its financial obligations when due and may adversely impact the value of its bonds, which could negatively impact the performance of the Funds. Factors contributing to the economic stress on municipal issuers may include an increase in expenses associated with combatting the pandemic and a decrease in revenues supporting the issuer’s bonds due to factors such as lower sales tax revenue as a result of decreased consumer spending, lower income tax revenue due to higher unemployment, and a decrease in the value of collateral backing revenue bonds due to
54
DUPREE MUTUAL FUNDS
NOTES TO FINANCIAL STATEMENTS
June 30, 2023
| 5. | | Principal Risks, continued |
closures and/or curtailment of services and/or changes in consumer behavior. In light of the uncertainty surrounding the magnitude, duration, reach, costs and effects of a pandemic, as well as actions that could be taken by governmental authorities or other third parties, it is difficult to predict the level of financial stress and duration of such stress municipal issuers may experience. Changes in an issuer’s financial strength or changes in the credit rating assigned to an obligation may affect the market values and marketability of many or all municipal obligations of issuers in that state.
Issuer Cybersecurity Risk
Municipalities issuing securities in which the Funds invest, counterparties with which the Funds engage or transact, exchange and other financial market operators, banks, brokers, dealers and other financial institutions may experience cybersecurity breaches. Cybersecurity breaches can include unauthorized access to systems, networks, or devices; infection from computer viruses of other malicious software code; ransomware; and attacks that shut down, disable, slow or otherwise disrupt operations, business processes, or website access or functionality. These breaches may result in harmful disruptions to their operations and may negatively impact the financial condition for the municipal issuer, counterparty or other market participant. The Funds and their shareholders could be negatively impacted as a result.
At June 30, 2023, the Funds’ cost of investments for federal income tax purposes and the net unrealized depreciation of investments were as follows:
| | | | | | | | | | | | | | | | |
| | | Cost | | | Appreciation | | | Depreciation | | | Net unrealized
depreciation | |
Alabama Tax-Free Income Series | | $ | 22,374,738 | | | $ | 56,449 | | | $ | (1,007,137 | ) | | $ | (950,688 | ) |
Kentucky Tax-Free Income Series | | | 818,773,142 | | | | 3,372,622 | | | | (30,525,824 | ) | | | (27,153,202 | ) |
Kentucky Tax-Free Short-to-Medium Series | | | 36,763,668 | | | | 36,272 | | | | (664,646 | ) | | | (628,374 | ) |
Mississippi Tax-Free Income Series | | | 8,334,509 | | | | 26,703 | | | | (141,454 | ) | | | (114,751 | ) |
North Carolina Tax-Free Income Series | | | 124,024,456 | | | | 193,496 | | | | (5,428,748 | ) | | | (5,235,252 | ) |
North Carolina Tax-Free Short-to-Medium Series | | | 10,941,775 | | | | 9,074 | | | | (132,029 | ) | | | (122,955 | ) |
Tennessee Tax-Free Income Series | | | 63,892,675 | | | | 60,369 | | | | (1,473,124 | ) | | | (1,412,755 | ) |
Tennessee Tax-Free Short-to-Medium Series | | | 3,584,107 | | | | -0- | | | | (36,671 | ) | | | (36,671 | ) |
Intermediate Government Bond Series | | | 9,906,191 | | | | -0- | | | | (371,976 | ) | | | (371,976 | ) |
Taxable Municipal Bond Series | | | 4,375,707 | | | | 54,860 | | | | (451,511 | ) | | | (396,651 | ) |
At June 30, 2023, the Funds’ non-expiring capital loss carry-forwards available to offset future capital gains, were as follows:
| | | | | | | | | | | | |
| | | Short-term | | | Long-term | | | Total | |
Alabama Tax-Free Income Series | | $ | — | | | $ | 308,355 | | | $ | 308,355 | |
Kentucky Tax-Free Income Series | | | 1,395,027 | | | | 8,276,664 | | | | 9,671,691 | |
Kentucky Tax-Free Short-to-Medium Series | | | 84,910 | | | | 131,616 | | | | 216,526 | |
Mississippi Tax-Free Income Series | | | 123,423 | | | | 311,047 | | | | 434,470 | |
North Carolina Tax-Free Income Series | | | 1,277,364 | | | | 2,094,008 | | | | 3,371,372 | |
North Carolina Tax-Free Short-to-Medium Series | | | 54,833 | | | | 109.366 | | | | 164,199 | |
Tennessee Tax-Free Income Series | | | 174,082 | | | | 742,186 | | | | 916,268 | |
Tennessee Tax-Free Short-to-Medium Series | | | 2,170 | | | | 269,388 | | | | 271,558 | |
Intermediate Government Bond Series | | | 51,791 | | | | 33,833 | | | | 85,624 | |
Taxable Municipal Bond Series | | | 174,265 | | | | 1,509,330 | | | | 1,683,595 | |
The distributions from net realized gains are determined in accordance with federal income tax regulations, which may differ from GAAP. These differences are caused primarily due to the recognition of certain components of realized capital gains for federal income tax purposes. Where such differences are permanent in nature, they are reclassified in the components of net assets based on their ultimate characterization for federal income tax purposes. Any such reclassifications will have no effect on net assets, results of operations or net asset values per share of the Funds. For the year ended June 30, 2023, the Funds did not have any reclassification of net assets.
55
DUPREE MUTUAL FUNDS
NOTES TO FINANCIAL STATEMENTS
June 30, 2023
| 6. | | Federal Income Taxes, continued |
The tax character of distributions paid for the year ended June 30, 2023 and 2022 were as follows:
| | | | | | | | | | | | | | | | | | | | | | | | |
| | | 2023 | | | 2022 | |
| | | Tax
Exempt
Income | | | Ordinary
Income | | | Long-Term
Capital
Gain | | | Tax
Exempt
Income | | | Ordinary
Income | | | Long-Term
Capital
Gain | |
Alabama Tax-Free Income Series | | $ | 581,380 | | | $ | — | | | $ | 13,595 | | | $ | 606,402 | | | $ | — | | | $ | 1,658 | |
Kentucky Tax-Free Income Series | | | 21,219,726 | | | | — | | | | — | | | | 22,611,319 | | | | 3,399 | | | | 51,268 | |
Kentucky Tax-Free Short-to-Medium Series | | | 715,912 | | | | — | | | | — | | | | 703,577 | | | | — | | | | — | |
Mississippi Tax-Free Income Series | | | 210,947 | | | | — | | | | 1,326 | | | | 226,994 | | | | — | | | | 20,443 | |
North Carolina Tax-Free Income Series | | | 2,943,057 | | | | — | | | | — | | | | 3,205,533 | | | | — | | | | — | |
North Carolina Tax-Free Short-to-Medium Series | | | 211,629 | | | | — | | | | — | | | | 203,455 | | | | | | | | 48 | |
Tennessee Tax-Free Income Series | | | 1,659,907 | | | | — | | | | — | | | | 1,890,340 | | | | | | | | — | |
Tennessee Tax-Free Short-to-Medium Series | | | 66,688 | | | | — | | | | — | | | | 83,245 | | | | | | | | — | |
Intermediate Government Bond Series | | | — | | | | 289,411 | | | | — | | | | — | | | | 262,283 | | | | — | |
Taxable Municipal Bond Series | | | — | | | | 192,498 | | | | — | | | | — | | | | 362,905 | | | | — | |
At June 30, 2023, the Funds’ components of distributable earnings (accumulated losses) on a tax basis were as follows:
| | | | | | | | | | | | | | | | |
| | | Undistributed
Ordinary
Income | | | Undistributed
Tax-Exempt
Income | | | Undistributed Net
Long-term
Capital Gain | | | Net Unrealized
Appreciation/
Depreciation on
Investments | |
Alabama Tax-Free Income | | $ | — | | | | 77,328 | | | $ | — | | | $ | (950,688 | ) |
Kentucky Tax-Free Income | | | — | | | | 2,414,558 | | | | — | | | | (27,153,202 | ) |
Kentucky Tax-Free Short-to-Medium | | | — | | | | 24,566 | | | | — | | | | (628,374 | ) |
Mississippi Tax-Free Income | | | — | | | | 29,498 | | | | — | | | | (114,751 | ) |
North Carolina Tax-Free Income | | | — | | | | 202,953 | | | | — | | | | (5,235,252 | ) |
North Carolina Tax-Free Short-to-Medium | | | — | | | | 4,392 | | | | — | | | | (122,955 | ) |
Tennessee Tax-Free Income | | | — | | | | 118,906 | | | | — | | | | (1,412,755 | ) |
Tennessee Tax-Free Short-to-Medium | | | — | | | | 856 | | | | — | | | | (36,671 | ) |
Intermediate Government Bond | | | 4,826 | | | | — | | | | — | | | | (371,976 | ) |
Taxable Municipal Bond Series | | | 4,518 | | | | — | | | | — | | | | (396,651 | ) |
| | | | | | | | | | | | |
| | | Accumulated
Capital and
Other Losses | | | Other
Temporary
Differences | | | Total
Accumulated Losses | |
Alabama Tax-Free Income | | $ | (308,355 | ) | | $ | (77,328 | ) | | $ | (1,259,043 | ) |
Kentucky Tax-Free Income | | | (9,671,691 | ) | | | (2,414,558 | ) | | | (36,824,893 | ) |
Kentucky Tax-Free Short-to-Medium | | | (216,526 | ) | | | (24,566 | ) | | | (844,900 | ) |
Mississippi Tax-Free Income | | | (434,470 | ) | | | (29,432 | ) | | | (549,155 | ) |
North Carolina Tax-Free Income | | | (3,371,372 | ) | | | (202,953 | ) | | | (8,606,624 | ) |
North Carolina Tax-Free Short-to-Medium | | | (164,199 | ) | | | (4,392 | ) | | | (287,154 | ) |
Tennessee Tax-Free Income | | | (916,268 | ) | | | (142,103 | ) | | | (2,352,220 | ) |
Tennessee Tax-Free Short-to-Medium | | | (271,558 | ) | | | (856 | ) | | | (308,229 | ) |
Intermediate Government Bond | | | (85,624 | ) | | | (4,826 | ) | | | (457,600 | ) |
Taxable Municipal Bond Series | | | (1,683,593 | ) | | | (4,518 | ) | | | (2,080,244 | ) |
56
DUPREE MUTUAL FUNDS
NOTES TO FINANCIAL STATEMENTS
June 30, 2023
| 7. | | Line of Credit Agreement and Custodian Agreement |
Under the terms of an agreement with the Funds’ custodian, U.S. Bank, principal amounts up to 5% of a Fund’s net assets are available on a committed line of credit. Each Fund is permitted to borrow money as a temporary measure in order to pay redeeming shareholders. The principal amounts borrowed are due on demand. The current agreement expires on September 20, 2023. Interest is payable based on the published prime rate of the bank. Securities with a minimum value of three times the loan proceeds will be assigned as collateral until the balance of the note and unpaid interest is paid in full and terminated. Each Fund has segregated securities in order to cover potential loans.
At June 30, 2023, the Funds had an aggregate unused line of credit amount of $25,000,000. During the year ended June 30, 2023, the average interest rate on borrowings was 7.10% and the largest borrowing amount, the date of the largest borrowing, and the daily weighted average borrowings for each Fund were as follows:
| | | | | | | | | | | | |
| | | Largest
Borrowing | | | Date of Largest
Borrowing | | | Weighted
Average
Borrowing | |
Alabama Tax-Free Income Series | | $ | 468,000 | | | | 04/04/2023 | | | $ | 4,658 | |
Kentucky Tax Free Income Series | | | 62,000 | | | | 03/06/2023 | | | | 170 | |
Kentucky Tax-Free Short-to-Medium Series | | | 957,000 | | | | 06/09/2023 | | | | 8,879 | |
Mississippi Tax-Free Income Series | | | 140,000 | | | | 11/07/2022 | | | | 688 | |
North Carolina Tax-Free Income Series | | | 1,366,000 | | | | 12/29/2022 | | | | 27,148 | |
North Carolina Tax-Free Short-to-Medium Series | | | 312,000 | | | | 11/03/2022 | | | | 1,323 | |
Tennessee Tax-Free Income Series | | | 762,000 | | | | 09/14/2022 | | | | 6,866 | |
Tennessee Short-to-Medium Tax-Free Series | | | 99,000 | | | | 02/06/2023 | | | | 822 | |
Intermediate Government Bond Series | | | 71,000 | | | | 06/29/2023 | | | | 466 | |
Taxable Municipal Bond Series | | | 28,000 | | | | 04/27/2023 | | | | 342 | |
On August 24, 2023, the Board of Trustees approved an uncommitted, unsecured line of credit with U.S. Bank, N.A. effective September 20, 2023. The terms of the new agreement are substantially similar to those of the current agreement except (i) the Funds will not assign collateral until the balance of a note and unpaid interest is paid in full and terminated, (ii) the Funds will not segregate securities to cover potential loans, and (ii) the new agreement expires on September 18, 2024, but may be renewed annually.
The Funds have a contractual agreement with the custodian whereby the Funds compensate the custodian for custodial services incurred exceeding the credits realized as a result of uninvested cash balances. Credits realized as a result of uninvested cash balances are used to reduce each Fund’s custody fees. During the year, these credits reduced each Fund’s expenses by the amount shown on each Statement of Operations as “Custodian expense reduction.”
57
Report of Independent Registered Public Accounting Firm
To the Shareholders and Board of Trustees of
Dupree Mutual Funds
Opinion on the Financial Statements
We have audited the accompanying statements of assets and liabilities, including the schedules of portfolio investments, of Dupree Mutual Funds, comprising Alabama Tax-Free Income Series, Kentucky Tax-Free Income Series, Kentucky Tax-Free Short-to-Medium Series, Mississippi Tax-Free Income Series, North Carolina Tax-Free Income Series, North Carolina Tax-Free Short-to-Medium Series, Tennessee Tax-Free Income Series, Tennessee Tax-Free Short-to-Medium Series, Intermediate Government Bond Series, and Taxable Municipal Bond Series (the “Funds”), as of June 30, 2023, the related statements of operations for the year then ended, the statements of changes in net assets for each of the two years in the period then ended, the related notes, and the financial highlights for each of the three years in the period then ended (collectively referred to as the “financial statements”). In our opinion, the financial statements present fairly, in all material respects, the financial position of each of the Funds as of June 30, 2023 the results of their operations for the year then ended, the changes in net assets for each of the two years in the period then ended, and the financial highlights for each of the three years in the period then ended, in conformity with accounting principles generally accepted in the United States of America.
The Funds’ financial highlights for the years ended June 30, 2020 and prior, were audited by other auditors whose report dated August 26, 2020, expressed an unqualified opinion on those financial highlights.
Basis for Opinion
These financial statements are the responsibility of the Funds’ management. Our responsibility is to express an opinion on the Funds’ financial statements based on our audits. We are a public accounting firm registered with the Public Company Accounting Oversight Board (United States) (“PCAOB”) and are required to be independent with respect to the Funds in accordance with the U.S. federal securities laws and the applicable rules and regulations of the Securities and Exchange Commission and the PCAOB.
We conducted our audits in accordance with the standards of the PCAOB. Those standards require that we plan and perform the audit to obtain reasonable assurance about whether the financial statements are free of material misstatement whether due to error or fraud.
Our audits included performing procedures to assess the risks of material misstatement of the financial statements, whether due to error or fraud, and performing procedures that respond to those risks. Such procedures included examining, on a test basis, evidence regarding the amounts and disclosures in the financial statements. Our procedures included confirmation of securities owned as of June 30, 2023, by correspondence with the custodians and brokers; when replies were not received from brokers, we performed other auditing procedures. Our audits also included evaluating the accounting principles used and significant estimates made by management, as well as evaluating the overall presentation of the financial statements. We believe that our audits provide a reasonable basis for our opinion.
We have served as the Funds’ auditor since 2021.

COHEN & COMPANY, LTD.
Milwaukee, Wisconsin
August 29, 2023
58
DUPREE MUTUAL FUNDS
OTHER UNAUDITED INFORMATION
June 30, 2023
Trustee and officer information
The following table sets forth information as to the Trustees and officers:
| | | | | | | | | | |
Name, Address and Birth
Year | | Position(s) held
with Funds | | Term of Office and
Length of Time Served | | Principal Occupation(s) During Past 5 Years | | Number of
Portfolios in
Fund Complex
Overseen by
Trustee or
Nominee | | Other
Directorships
Held by Trustee
or Nominee
During Past Five
Years |
| Independent Trustees: | | | | | | | | | | |
James C. Baughman, Jr. 125 South Mill Street Lexington, KY 40507 (1962) | | Trustee, Chair of Nominating and Governance Committee | | Indefinite Term/ Since October 2007 | | President, CJN Advisors, LLC (2013 – present; business consulting); President, H&S1 KY Lexington, LLC (2017 – present; health and wellness); President, Blue Horse Entries, LLC (2014 – 2021; online business support services for equestrian events) | | 10 | | Advisory Board, Community Trust Bank |
Ann Rosenstein Giles 125 South Mill Street Lexington, KY 40507 (1952) | | Trustee, Chair of Valuation Committee | | Indefinite Term/ Since October 2011 | | AJ Marketing Partners (a strategic marketing consultant; 2012-present) | | 10 | | N/A |
Marc A. Mathews, 125 South Mill Street Lexington, KY 40507 (1958) | | Chairman, Trustee, Chair of Audit Committee | | Indefinite Term/ Since October 2011 | | Realtor, Bluegrass Sotheby’s International Realty (2021 – present); Consultant, National Association of College and University Business Officers (organization for higher education business professionals 2021 – present); Vice President for Finance and Business, Transylvania University (2009 – 2021) | | 10 | | Director, Bank of the Bluegrass (2011-2022) |
Knox van Nagell Pfister 125 South Mill Street Lexington, KY 40507 (1978) | | Trustee | | Indefinite Term/ Since August 2019 | | Managing Member of Knox Consulting LLC (October 2020 – present), (project management, advocacy, and organization-optimization services); Owner, Co-Founder of Terra Firma Construction, LLC (August 2021 – present); General Counsel, Mt. Brilliant Farm and Boone Creek LLC (2017 – 2020) | | 10 | | N/A |
| Interested Trustees and Officers of the Trust: | | | | | | | | | | |
Allen E. Grimes, III (1) 125 South Mill Street Lexington, KY 40507 (1962) | | President, Interested Trustee | | Annual Term/ President, May 2018 – present; Executive Vice President, October 2005 – May 2018; Indefinite Term/ Trustee since 2019 | | President, Dupree & Company, Inc. (2004 – present) | | 10 | | N/A |
Michelle M. Dragoo 125 South Mill Street Lexington, KY 40507 (1961) | | Vice President, Treasurer | | Annual Term/ Vice President & Treasurer, (October 2022 – present); Vice President, Secretary & Treasurer, October 1999 – October 2022 | | Vice President, Secretary, Treasurer of Dupree & Company, Inc. (1999 – present) | | N/A | | N/A |
Huston B. Combs 125 South Mill Street Lexington, KY 40507 (1976) | | Vice President & Secretary | | Annual Term/ Vice President & Secretary (October 2022 – present);Vice President (May 2018 – October 2022) | | Attorney/Registered Representative Dupree & Company, Inc. (2017 – present) | | N/A | | N/A |
59
DUPREE MUTUAL FUNDS
OTHER UNAUDITED INFORMATION
June 30, 2023
Trustee and officer information, continued
| | | | | | | | | | |
Name, Address and Birth
Year | | Position(s) held
with Funds | | Term of Office and
Length of Time Served | | Principal Occupation(s) During Past 5 Years | | Number of
Portfolios in
Fund Complex
Overseen by
Trustee or
Nominee | | Other
Directorships
Held by Trustee
or Nominee
During Past Five
Years |
Vincent Harrison 125 South Mill Street Lexington, KY 40507 (1971) | | Assistant Secretary & Assistant Treasurer | | Annual Term/ October 2015 – present | | Vice President of Dupree & Company, Inc. (2016 – present) | | N/A | | N/A |
Martin Dean Ultimus Fund Solutions, LLC 225 Pictoria Drive Suite 450 Cincinnati, OH 45246 (1963) | | Chief Compliance Officer | | Annual Term/ August 2017 – present | | President, Northern Lights Compliance Services, LLC (February 2023 – present); Senior Vice President, Head of Fund Compliance, Ultimus Fund Solutions, LLC (January 2016 – January 2023) | | N/A | | N/A |
| (1) | | Allen E. Grimes, III is considered to be an “interested person” as defined in section 2(a)(19) of the Investment Company Act of 1940 by virtue of his affiliation with the Adviser. |
As of June 30, 2023, none of the Independent Trustees or members of their immediate family held any beneficial interest in the Trust’s Investment Adviser. Further, the Trust does not have an underwriter.
The Statement of Additional Information (“SAI”) includes additional information about Trustees and officers and is available upon request without charge. Please call (800) 866-0614 to request the SAI.
Proxy Voting Information
A description of the policies and procedures that the Funds use to determine how to vote proxies relating to portfolio securities and information regarding how the Funds voted those proxies during the most recent twelve months ended June 30, 2023, is available without charge upon request by calling (800) 866-0614, or on the Securities and Exchange Commission’s (the “Commission”) website at http://www.sec.gov. For the year ended June 30, 2023, the Funds exercised no proxy votes due to the fact that the debt instruments in which the Funds invest carry no voting rights.
Quarterly Portfolio Disclosure
The Trust files a complete listing of portfolio holdings for each Fund as of the end of the first and third quarters of each fiscal year on Form N-PORT. The information will be publicly available 60 days after the end of the period.
The complete listing of each Fund’s portfolio holdings is available on the Commission’s website at http://www.sec.gov and will be made available to shareholders upon request by calling (800) 866-0614.
Liquidity Risk Management Program
The Trust has adopted and implemented a liquidity risk management program (the “Program”) as required by Rule 22e-4 under the Investment Company Act of 1940, as amended. The Trust’s Board of Trustees (the “Board”) designated certain officers of the Trust as the administrators of the Program (“collectively, the Liquidity Administrator”). The Program is reasonably designed to assess and manage the liquidity risk of each Fund. Liquidity risk is the risk that each Fund could not meet requests to redeem shares issued by each Fund without significant dilution of remaining investors’ interests.
The Liquidity Administrator provided a written report to the Board for consideration at its May 11, 2023 meeting that addressed the operation of the Program and provided an assessment of the adequacy and effectiveness of the Program during the period from April 1, 2022 through March 31, 2023 (the “Covered Period”). The report concluded that during the Covered Period the Program operated effectively and was adequately and effectively implemented to assess and manage each Fund’s liquidity risk. The Liquidity Administrator also reported that there were no liquidity events that impacted each Fund or its ability to timely meet redemptions without dilution to existing shareholders during the Covered Period.
There can be no assurance that the Program will achieve its objectives in the future. Further information on liquidity risk, and other principal risks to which an investment in each Fund may be subject, can be found in each Fund’s prospectus.
60
DUPREE MUTUAL FUNDS
OTHER UNAUDITED INFORMATION
June 30, 2023
Schedule of Shareholder Expenses
As a shareholder of the Funds, you incur ongoing costs including investment advisory fees and other Fund expenses. The following example is intended to help you understand your ongoing costs (in dollars) of investing in the Funds and to compare these costs with the ongoing costs of investing in other mutual funds.
Actual Expenses
The Actual line of the table below provides information about actual account values and actual expenses. You may use the information in this line, together with the amount you invested, to estimate the expenses that you paid over the period. Simply divide your account value by $1,000 (for example, an $8,600 account value divided by $1,000 = 8.6), then multiply the result by the number under the heading titled “Expenses Paid During the Six Months Ended June 30, 2023” to estimate the expenses you paid on your account during this period.
Hypothetical Example for Comparison Purposes
The hypothetical line of the table below provides information about hypothetical account values and hypothetical expenses based on each Fund’s actual expense ratio and an assumed rate of return of 5% per year before expenses which is not the Funds’ actual ending account balance or expenses you paid for the period. You may use this information to compare the ongoing costs of investing in the Funds and other funds. To do so, compare this 5% hypothetical example with the 5% hypothetical examples that appear in the shareholder reports of other funds.
| | | | | | | | | | | | | | | | |
| | | Net Expense
Ratio
Annualized
June 30, 2023 | | | Beginning
Account Value
January 1, 2023* | | | Ending
Account Value
June 30, 2023** | | | Expenses Paid During
the Six Months
Ended June 30, 2023 | |
Alabama Tax-Free Income Series | | | | | | | | | | | | | | | | |
| Actual | | | .70 | % | | $ | 1,000.00 | | | $ | 1,005.36 | | | $ | 3.45 | |
| Hypothetical | | | .70 | | | | 1,000.00 | | | | 1,024.79 | | | | 3.48 | |
Kentucky Tax-Free Income Series | | | | | | | | | | | | | | | | |
| Actual | | | .60 | | | | 1,000.00 | | | | 1,011.65 | | | | 2.99 | |
| Hypothetical | | | .60 | | | | 1,000.00 | | | | 1,024.79 | | | | 3.01 | |
Kentucky Tax-Free Short-to-Medium Series | | | | | | | | | | | | | | | | |
| Actual | | | .70 | | | | 1,000.00 | | | | 1,005.65 | | | | 3.45 | |
| Hypothetical | | | .70 | | | | 1,000.00 | | | | 1,024.79 | | | | 3.48 | |
Mississippi Tax-Free Income Series | | | | | | | | | | | | | | | | |
| Actual | | | .70 | | | | 1,000.00 | | | | 1,005.75 | | | | 3.45 | |
| Hypothetical | | | .70 | | | | 1,000.00 | | | | 1,024.79 | | | | 3.48 | |
North Carolina Tax-Free Income Series | | | | | | | | | | | | | | | | |
| Actual | | | .70 | | | | 1,000.00 | | | | 1,009.92 | | | | 3.46 | |
| Hypothetical | | | .70 | | | | 1,000.00 | | | | 1,024.79 | | | | 3.48 | |
North Carolina Tax-Free Short-to-Medium Series | | | | | | | | | | | | | | | | |
| Actual | | | .70 | | | | 1,000.00 | | | | 1,002.38 | | | | 3.45 | |
| Hypothetical | | | .70 | | | | 1,000.00 | | | | 1,024.79 | | | | 3.48 | |
Tennessee Tax-Free Income Series | | | | | | | | | | | | | | | | |
| Actual | | | .70 | | | | 1,000.00 | | | | 1,008.83 | | | | 3.46 | |
| Hypothetical | | | .70 | | | | 1,000.00 | | | | 1,024.79 | | | | 3.48 | |
Tennessee Tax-Free Short-to-Medium Series | | | | | | | | | | | | | | | | |
| Actual | | | .70 | | | | 1,000.00 | | | | 1,001.69 | | | | 3.45 | |
| Hypothetical | | | .70 | | | | 1,000.00 | | | | 1,024.79 | | | | 3.48 | |
61
DUPREE MUTUAL FUNDS
OTHER UNAUDITED INFORMATION
June 30, 2023
Schedule of Shareholder Expenses, continued
| | | | | | | | | | | | | | | | |
| | | Net Expense
Ratio
Annualized
June 30, 2023 | | | Beginning
Account Value
January 1, 2023* | | | Ending
Account Value
June 30, 2023** | | | Expenses Paid During
the Six Months
Ended June 30, 2023 | |
Intermediate Government Bond Series | | | | | | | | | | | | | | | | |
| Actual | | | .70 | % | | $ | 1,000.00 | | | $ | 1001.93 | | | $ | 3.45 | |
| Hypothetical | | | .70 | | | | 1,000.00 | | | | 1,024.79 | | | | 3.48 | |
Taxable Municipal Bond Series | | | | | | | | | | | | | | | | |
| Actual | | | .70 | | | | 1,000.00 | | | | 988.20 | | | | 3.42 | |
| Hypothetical | | | .70 | | | | 1,000.00 | | | | 1,024.79 | | | | 3.48 | |
| * | | The example is based on an investment of $1,000 invested at the beginning of the period. |
| ** | | Expenses are equal to the Funds’ annualized expense ratio, multiplied by the average account value over the period multiplied by [181/365] (to reflect one-half year period). |
62

Item 2. Code of Ethics: The registrant has adopted a code of ethics that applies to the principal executive officer, principal financial officer, principal accounting officer and persons performing similar functions, regardless of whether these individuals are employed by the registrant or a third party.
Item 3. Audit Committee Financial Expert: The board has determined that Marc A. Mathews possesses the attributes identified in Instruction (b) of Item 3 to Form N-CSR to qualify as an “audit committee financial expert,” and has designated Mr. Mathews as the audit committee financial expert. Mr. Mathews is an “independent” trustee pursuant to paragraph (a)(2) of Item 3 to Form N-CSR.
Item 4. Principal Accountant Fees and Services:
| | | | |
Year ended June 30, 2022: | | $ | 128,000 | |
Year ended June 30, 2023 | | $ | 128,000 | |
| | | | |
Year ended June 30, 2022: | | | None | |
Year ended June 30, 2023 | | | None | |
| | (c) | Tax Fees (consisting of income and excise tax compliance services) |
| | | | |
Year ended June 30, 2022: | | $ | 40,000 | |
Year ended June 30, 2023 | | $ | 40,000 | |
| | (d) | All Other Fees (Fees for all other services) |
| | | | |
Year ended June 30, 2022 | | $ | 17,000 | |
(consisted of examination of transfer agent ($5,000); Anti-Money Laundering advisory services ($7,000) and Review of Semi-Annual report ($5,000))
| | | | |
Year ended June 30, 2023 | | $ | 17,000 | |
(consisted of examination of transfer agent ($5,000); Anti-Money Laundering advisory services ($7,000) and Review of Semi-Annual report ($5,000))
| | (e) | (1) (2) The Registrant’s Audit Committee must pre-approve all audit services and non-audit services that the principal accountant provides to the Registrant. The Audit committee must also pre-approve any engagement of the principal accountant to provide non-audit services to the Registrant’s investment adviser, or any affiliate of the adviser that provides ongoing services to the Registrant, if such non-audit services directly impact the Registrant’s operations and financial reporting. All services (b) through (d) were pre-approved by the Audit Committee. |
| | (f) | The Registrant has been advised by the Principal Accountant that no persons other than full time permanent employees have been engaged to audit the Registrant’s Financial Statements for the fiscal year ended June 30, 2023. |
| | (g) | The aggregate non audit fees billed by the Registrant’s Accountant to the Registrant were: |
| | | | |
Year ended June 30, 2022: | | $ | 57,000 | |
Year ended June 30, 2023: | | $ | 57,000 | |
| | (h) | Services were pre-approved by the Registrant’s Audit Committee. |
Item 5. Not applicable.
Item 6.
| | (a) | Included as part of item 1. |
Item 7. Not applicable
Item 8. Not applicable.
Item 9. Not applicable
Item 10. There have been no changes to the procedures by which shareholders may recommend nominees to the board of trustees nominating committee.
Item 11. Controls and Procedures:
(a) The registrant’s principal executive officer and principal financial officer have concluded, based on their evaluation of the registrant’s disclosure controls and procedures as conducted within 90 days of the filing date of this report, that these disclosure controls and procedures are adequately designed and are operating effectively to ensure that information required to be disclosed by the registrant on Form N-CSR is recorded, processed, summarized and reported within the time periods specified in the Securities and Exchange Commission’s rules and forms.
(b) There were no changes in the registrant’s internal control over financial reporting that occurred during the period covered by this report that have materially affected, or are reasonably likely to materially affect, the registrant’s internal control over financial reporting.
Item 12. Not applicable.
Item 13. Exhibits
Section 906 Certifications
SIGNATURES
Pursuant to the requirements of the Securities Exchange Act of 1934 and the Investment Company Act of 1940, the registrant has duly caused this report to be signed on its behalf by the undersigned thereunto duly authorized.
| | |
| Dupree Mutual Funds |
| |
| By: | | /s/ Michelle M. Dragoo |
| Michelle M. Dragoo, Vice President, Treasurer |
| Date: August 29, 2023 |
Pursuant to the requirements of the Securities Exchange Act of 1934 and the Investment Company Act of 1940, this report has been signed below by the following persons on behalf of the registrant and in the capacities and on the dates indicated.
| | |
| Dupree Mutual Funds |
| |
| By: | | /s/ Allen E. Grimes, III |
| Allen E. Grimes, III, President |
| Date: August 29, 2023 |