EXHIBIT 2
Management’s Discussion and Analysis for the fiscal year ended December 31, 2003, dated February 26, 2004
Management’s Discussion and Analysis
February 26, 2004
This Management’s Discussion and Analysis (MD&A) contains forward-looking statements. These statements are based on certain estimates and assumptions and involve risks and uncertainties. Actual results may differ materially. See page 51 for additional information.
This MD&A should be read in conjunction with Suncor’s audited consolidated financial statements and the accompanying notes. All financial information is reported in Canadian dollars (Cdn$) and in accordance with Canadian generally accepted accounting principles (GAAP) unless noted otherwise. The financial measures cash flow from operations, return on capital employed (ROCE) and cash operating costs referred to in this MD&A, are not prescribed by GAAP and are outlined and reconciled in Non-GAAP Financial Measures on page 50.
Certain amounts in prior years have been reclassified to enable comparison with the current year’s presentation.
Natural gas converts to crude oil equivalent at a ratio of six thousand cubic feet to one barrel.
References to “Suncor” or “the company” mean Suncor Energy Inc., its subsidiaries and joint venture investments, unless the context otherwise requires.
The tables and charts in this document form an integral part of this MD&A.
Additional information about Suncor filed with Canadian securities commissions and the United States Securities and Exchange Commission (SEC), including periodic quarterly and annual reports and the Annual Information Form (AIF/40-F) is available on-line at www.sedar.com and www.sec.gov.
Suncor Overview and Strategic Priorities
Suncor Energy Inc. is an integrated energy company headquartered in Calgary, Alberta. The company operates four business segments:
• Oil Sands Suncor’s core business, located near Fort McMurray, Alberta, produces bitumen from oil sands and upgrades it to refinery feedstock, diesel fuel and byproducts.
• Natural Gas (NG) produces natural gas in Western Canada, providing revenues and creating a price hedge against the company’s purchased natural gas consumption.
• Energy Marketing and Refining – Canada (EM&R) operates a 70,000 barrel per day (bpd) capacity refinery in Sarnia, Ontario, and markets refined petroleum products to customers primarily in Ontario and Quebec, including retail customers in Ontario under the Sunoco brand. (Sunoco in Canada is separate and unrelated to Sunoco in the United States, which is owned by Sunoco, Inc. of Philadelphia.) EM&R also manages energy marketing and trading activities and sales of all Oil Sands and NG production. Financial results relating to the sales of Oil Sands and NG production are reported in those business segments.
• Refining and Marketing – U.S.A. (R&M) operates a 60,000 bpd capacity refinery in the Denver, Colorado area as well as related pipeline assets. R&M markets refined petroleum products under the Phillips 66-brand to customers primarily in Colorado and Wyoming, including retail customers in the Denver metropolitan area.
Suncor strategic priorities are:
Operational:
• Developing Suncor’s Oil Sands resource base through mining and in-situ technology and supplementing Suncor bitumen production with third party supply.
• Expanding Oil Sands extraction and upgrading facilities to increase crude oil production.
• Developing new refining and marketing opportunities that further integrate Suncor’s production into the marketplace.
• Managing environmental and social performance to earn continued stakeholder support for Suncor’s ongoing operations and growth plans.
• Maintaining a strong focus on worker, contractor and community safety as an overriding operational priority.
Financial:
• Controlling costs through a strong operational focus, economies of scale and improved management of engineering, procurement and construction of major projects.
• Reducing risk associated with natural gas price volatility by producing volumes that meet or exceed purchases.
• Maintaining debt at a target of 2.0 times cash flow from operations based on mid-cycle crude oil prices of US$22 West Texas Intermediate (WTI).
• Targeting opportunities that support a minimum 15% ROCE at US$22 WTI crude oil prices.
16
Selected Financial Information
ANNUAL FINANCIAL DATA
Year ended December 31 ($ millions except per share data) |
| 2003 |
| 2002 |
| 2001 |
|
Revenues |
| 6 306 |
| 5 032 |
| 4 294 |
|
Net earnings |
| 1 084 |
| 761 |
| 388 |
|
Total assets |
| 10 427 |
| 8 683 |
| 8 094 |
|
Long-term debt |
| 2 448 |
| 2 686 |
| 3 113 |
|
Dividends |
|
|
|
|
|
|
|
Common shares |
| 87 |
| 77 |
| 75 |
|
Preferred Securities |
| 45 |
| 48 |
| 48 |
|
Net earnings attributable to common shareholders per share – basic |
| 2.43 |
| 1.64 |
| 0.79 |
|
Net earnings attributable to common shareholders per share – diluted |
| 2.26 |
| 1.61 |
| 0.78 |
|
Cash dividends per share |
| 0.19 |
| 0.17 |
| 0.17 |
|
OUTSTANDING SHARE DATA
(as at December 31, 2003) |
|
|
| |
Number of common shares |
| 451,184,087 |
| |
Number of common share options |
| 21,015,567 |
| |
Number of common share options – exercisable |
| 8,190,714 |
| |
Preferred securities |
| $ | 476 | million |
QUARTERLY FINANCIAL DATA
|
| 2003 |
| 2002 |
| ||||||||||||
($ millions except per share data) |
| Mar. 31 |
| June 30 |
| Sept. 30 |
| Dec. 31 |
| Mar. 31 |
| June 30 |
| Sept. 30 |
| Dec. 31 |
|
Revenues |
| 1 676 |
| 1 292 |
| 1 700 |
| 1 638 |
| 1 077 |
| 1 289 |
| 1 257 |
| 1 409 |
|
Net earnings |
| 368 |
| 121 |
| 295 |
| 300 |
| 90 |
| 229 |
| 184 |
| 258 |
|
Net earnings attributable to common shareholders per share |
|
|
|
|
|
|
|
|
|
|
|
|
|
|
|
|
|
Basic |
| 0.84 |
| 0.29 |
| 0.64 |
| 0.67 |
| 0.18 |
| 0.52 |
| 0.38 |
| 0.56 |
|
Diluted |
| 0.77 |
| 0.26 |
| 0.62 |
| 0.61 |
| 0.18 |
| 0.49 |
| 0.37 |
| 0.55 |
|
(1) Refining and Marketing – U.S.A. data reflects five months of operations since acquisition on August 1, 2003.
(2) Excludes Corporate and Eliminations segment.
17
Quarterly net earnings for 2003 and 2002 have fluctuated due to a number of factors:
• The impact of winter weather resulted in Oil Sands production tending to be lower in the first quarter of both 2003 and 2002. There were also operational challenges in bringing the expanded Oil Sands facilities to production capacity in the first three quarters of 2002. Further, in the second quarter of 2003 there was a planned 30-day maintenance shutdown on Upgrader #1 that reduced production capacity.
• Fluctuations in commodity and refined product prices were influenced by seasonal demand variations. In the downstream this was reflected by higher demands for vehicle fuels and asphalt in summer, and heating fuels in winter. Fluctuations also occurred as a result of global and regional supply and demand.
• Commodity prices were unfavourably impacted in 2003 by an increase in the Canadian dollar compared to the U.S. dollar, which reduced the Canadian dollar revenue earned. The stronger Canadian dollar also increased foreign exchange gains on U.S. dollar denominated debt in 2003 compared to 2002.
• The 2003 acquisition of R&M increased earnings for the third and fourth quarters of 2003.
• Income tax changes in the second quarter of 2003 reduced earnings by $86 million ($100 million for the full year).
CONSOLIDATED FINANCIAL ANALYSIS
The following sets out an overview of Suncor’s consolidated financial results for 2003 compared to 2002. For a detailed analysis, see the various business segment discussions.
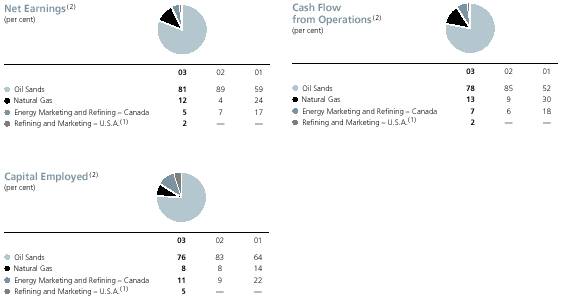
Net Earnings
Suncor’s net earnings increased to $1.08 billion in 2003, compared with $761 million in 2002. The increase was primarily due to record production from Oil Sands, higher benchmark crude oil and natural gas prices, higher foreign exchange gains and higher downstream margins. Net earnings were also positively impacted by contributions from the new R&M operations and lower interest charges. These impacts were partially offset by an increase in non-cash future income tax expense, a stronger Canadian dollar relative to the U.S. dollar, higher cash and non-cash operating expenses, and the absence in 2003 of an after-tax gain on the sale of Suncor’s retail natural gas marketing business in 2002.
NET EARNINGS COMPONENTS
Year ended December 31 ($ millions) |
| 2003 |
| 2002 |
| 2001 |
|
Net earnings before the following items: |
| 1 047 |
| 708 |
| 336 |
|
Sale of retail natural gas marketing business |
| — |
| 35 |
| — |
|
Foreign exchange gains on U.S. dollar denominated long-term debt |
| 137 |
| 8 |
| — |
|
Impact of income tax rate changes – favourable (unfavourable) |
| (100 | ) | 10 |
| 52 |
|
Net earnings |
| 1 084 |
| 761 |
| 388 |
|
The above table is intended to enhance a reader’s understanding of some of the factors impacting Suncor’s net earnings. For comparability purposes, readers should rely on the reported net earnings, which are prepared and presented in the Consolidated Financial Statements in accordance with GAAP.
INDUSTRY INDICATORS
(Average for the year unless otherwise noted) |
| 2003 |
| 2002 |
| 2001 |
|
WTI crude oil US$/barrel at Cushing |
| 31.05 |
| 26.10 |
| 25.90 |
|
Canadian 0.3% par crude Cdn$/barrel at Edmonton |
| 43.55 |
| 40.75 |
| 39.34 |
|
Light/heavy crude oil differential US$/barrel WTI @ Cushing/Bow River @ Hardisty |
| 8.00 |
| 5.95 |
| 9.50 |
|
Natural gas US$/thousand cubic feet (mcf) at Henry Hub |
| 5.45 |
| 3.25 |
| 4.40 |
|
Natural gas (Alberta spot) Cdn$/mcf at AECO |
| 6.70 |
| 4.05 |
| 6.30 |
|
New York Harbour 3-2-1 crack US$/barrel (1) |
| 5.30 |
| 3.35 |
| 4.45 |
|
Refined product demand (Ontario) percentage change over prior year (2) |
| 2.3 |
| 0.6 |
| (2.6 | ) |
Exchange rate: Cdn$/US$ |
| 0.72 |
| 0.64 |
| 0.64 |
|
(1) New York Harbour 3-2-1 crack is an industry indicator measuring the margin on a barrel of oil for gasoline and distillate. It is calculated by taking two times the New York Harbour gasoline margin plus one times the New York Harbour distillate margin and dividing by three.
(2) Figures for 2002 and 2001 are based on published government data. Figures for 2003 are internal estimates, based on preliminary government data.
18
Revenues were $6.3 billion in 2003, compared with $5.0 billion in 2002. The increase resulted primarily from the following:
• Increased crude oil production that drove higher sales volumes. In 2003, Oil Sands sales averaged 218,300 bpd of crude oil, compared with 205,300 bpd in 2002. Sales volumes were negatively impacted by a planned 30-day maintenance shutdown during the year. In 2002, challenges in bringing the expanded Oil Sands facilities to capacity in the first three quarters of the year resulted in lower than capacity production.
• Higher benchmark prices for crude oil and natural gas. Oil Sands crude oil price realization was also favourably impacted by a better sales mix of higher value products (light sweet crude oil and diesel fuel) in 2003 (63%) compared with 2002 (62%).
• Lower realized crude oil pricing differentials. During 2002 the challenges in bringing the expanded Oil Sands’ facilities to capacity resulted in some production being sold in markets with less favourable pricing.
• Higher refined product wholesale and retail prices due to higher crude oil prices. In addition, a 3% increase in refined product sales volumes had a positive impact on revenue.
• Additional revenues from the August 1, 2003 acquisition of the R&M assets.
Partially offsetting these increases were:
• Lower realizations on Suncor’s crude oil sales basket and natural gas sales as a result of a stronger Canadian dollar compared to the U.S. dollar. Because crude oil and natural gas are primarily sold based on U.S. dollar benchmark prices, a narrowing of the exchange rate difference reduced the Canadian dollar value of Suncor’s products.
• The absence in 2003 of $81 million in revenues from EM&R’s retail natural gas marketing business, which was sold in 2002.
Purchases of crude oil and products increased to $1.6 billion in 2003 compared with $1.2 billion a year earlier. The increase was primarily due to the following:
• An increase in purchases of crude oil from third parties to meet the feedstock requirements of the R&M refinery.
• Higher benchmark crude oil prices.
• A 3% sales volume increase in EM&R resulting in higher crude oil and other feedstock requirements. In addition, a power outage at the Sarnia refinery required third party purchases of finished product to ensure customer requirements were met.
The above factors were partially offset by the absence in 2003 of purchases for the retail natural gas marketing business that was sold in 2002.
Operating, selling and general expenses increased to $1.5 billion in 2003 from $1.3 billion in 2002. The primary reasons for the increase were:
• Expenses that resulted from the acquisition of the R&M operations.
• Increased planned maintenance activity due to higher production levels as well as unplanned maintenance activities in Oil Sands and EM&R’s Sarnia refinery.
• Increased reclamation costs at Oil Sands and NG.
• Higher operating expenses, including higher energy costs in all businesses.
• Higher compensation costs resulting from increased employee benefit costs (including pensions) and an increase in the number of employees, primarily as a result of the acquisition of the R&M assets and work force.
• Other expense increases including higher research and development (R&D) and information technology costs, higher charitable donations and higher insurance costs.
Transportation and other expenses increased to $133 million in 2003 from $128 million in 2002. The increase primarily reflects shipments by R&M, partially offset by lower Oil Sands pipeline toll costs. Increases in pipeline tolls due to Oil Sands sales volume increases were more than offset by the first time receipt of initial shipper toll adjustments. The toll adjustments are currently expected to continue until 2007.
Depreciation, depletion and amortization increased to $611 million in 2003 compared with $585 million in 2002. The increase was primarily due to higher NG depletion reflecting higher production levels and a higher depletion base. Depreciation associated with the R&M operations also contributed to the increase.
Exploration expenses in 2003 increased to $51 million from $26 million in 2002 primarily due to higher dry hole and seismic costs.
19
Royalty expenses increased to $139 million from $98 million in 2002. Higher royalties due to higher benchmark commodity prices and increased volumes, were partially offset by the absence of royalties related to one of Oil Sands’ original mining leases. Mining on this lease was completed in 2002. For a discussion about the expected impact of Crown royalties in future years, see Outlook on page 23.
Taxes other than income tax expense increased in 2003 to $426 million from $374 million in 2002, primarily due to additional excise taxes related to R&M operations.
The gain on disposal of assets increased to $17 million from $2 million in 2002. This primarily reflects the sale by NG of non-producing assets in 2003.
Financing (income) expenses reflected income of $66 million in 2003 compared with an expense of $124 million in 2002. The expense decrease was primarily due to the strengthening of the Canadian dollar versus the U.S. dollar, which resulted in a year-over-year foreign exchange gain of $157 million on U.S. dollar denominated debt. As well, lower levels of debt partially offset by higher variable interest rates and an increase in the level of capitalized interest on capital projects contributed to lower net interest expense.
Income tax expense increased to $720 million in 2003, compared with $383 million in 2002. Suncor’s effective income tax rate in 2003 was 40% compared to 33% in 2002. The higher effective rate in 2003 was primarily due to changes in both federal and provincial taxation policies that resulted in a combined non-cash tax charge of $100 million. The federal and provincial governments’ changes to resource sector taxation policies, to be phased in over the period 2003 to 2007, include a 7% reduction in the federal tax rate and introduction of the deductibility of Crown royalties. This was offset by the elimination of the federal and provincial resource allowance deduction.
With the above changes enacted in 2003, Suncor currently anticipates its effective tax rate in 2004 will be about 36%.
Corporate Office Expenses
After-tax corporate office expenses decreased to $4 million in 2003 from $128 million in 2002. Lower financing costs (discussed above) were partially offset by higher operating, selling and general expenses.
The increases in operating, selling and general expenses were comprised of higher compensation costs, including the costs associated with expensing employee stock options and deferred share units as well as higher R&D, information technology costs, charitable donations and insurance.
The corporate office had a net cash deficiency of $235 million in 2003, compared with $225 million in 2002. The higher deficiency primarily stems from information technology projects and R&D spending.
Cash Flow from Operations
Cash flow from operations increased in 2003 to $2.08 billion from $1.44 billion in 2002. Excluding the impacts of foreign exchange gains and non-cash future income tax expense, the increase was primarily due to the same factors that improved net earnings, as well as the absence in 2003 of payments made in 2002 under Suncor’s long-term employee incentive plans.
Dividends
In the second quarter of 2003, Suncor’s Board of Directors approved an increase in the quarterly dividend to $0.05 per share, from $0.0425 per share. Total dividends paid during 2003 were $0.1925 per share, compared with $0.17 in 2002. The Board periodically reviews the dividend policy, taking into consideration Suncor’s capital spending profile, financial position, financing requirements, cash flow and other relevant factors.
LIQUIDITY AND CAPITAL RESOURCES
Suncor’s capital resources at December 31, 2003, primarily consisted of cash flow from operations and available lines of credit. Suncor’s level of earnings and cash flow from operations depend on many factors, including commodity prices, production levels, downstream margins related to the operations of EM&R and R&M and Cdn$/US$ exchange rates.
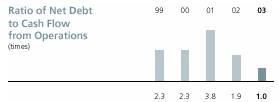
At December 31, 2003, Suncor’s net debt (short and long-term debt less cash and cash equivalents) was approximately $2.1 billion, a reduction of $580 million from December 31, 2002 year-end net debt of $2.7 billion and a reduction of more than $1 billion from year-end 2001 levels. Approximately $425 million of the reduction during 2003, and $890 million for the two-year period, was generated from cash flow, with the balance of both years’ reductions attributable to foreign exchange gains.
20
In 2003, Suncor replaced its available credit and term loan facilities of approximately $1.8 billion with new facilities of $1.7 billion. Suncor’s undrawn and uncommitted lines of credit at December 31, 2003, were approximately $1.6 billion. Suncor’s current long-term senior debt ratings are A- (Standard & Poor’s), A(low) (Dominion Bond Rating Service) and A3 (Moody’s Investors Service). All debt ratings have a stable outlook. In 2003, Moody’s removed its negative outlook in response to Suncor’s debt reduction over the last two years.
In December 2003, Suncor issued US$500 million of 5.95% Notes under an outstanding US$1 billion shelf prospectus. Suncor has now utilized the complete capacity that was available under this shelf. The net proceeds of the debt offering, together with borrowings under the company’s available credit and term loan facilities, will be used to repay the company’s 7.4% Debentures maturing February 2004 ($125 million) and to redeem the company’s 9.05% and 9.125% Preferred Securities in March 2004 ($276 million and US$162.5 million, respectively).
In 2000, Suncor entered into a financing arrangement with a third party. Under this arrangement Suncor sold an undivided interest in Oil Sands energy services assets for $101 million and leased the assets back from the third party. Suncor intends to repurchase the assets in 2004 and refinance the repurchase through revolving term debt facilities. Since this lease was capitalized for accounting purposes, it has been included in Suncor’s debt at the end of 2003.
Interest expense on debt continues to be influenced by the composition of the company’s debt portfolio, with Suncor benefiting from short-term floating interest rates continuing at near historic lows. To manage its fixed versus floating rate exposure, Suncor has entered into interest rate swaps with investment grade counterparties, resulting in the swapping of $600 million of fixed rate debt to variable rate borrowings.
Management of debt levels continues to be a priority given Suncor’s growth plans. The company believes a phased approach to future growth projects should improve its ability to manage project costs and debt levels. Suncor’s long-term target ratio for net debt to cash flow from operations is a maximum 2.0 times at mid-cycle crude oil pricing (US$22 WTI per barrel). At the end of 2003 this ratio (based on actual 2003 results) was 1.0 times compared with 1.9 times at year-end 2002. Strong commodity prices and record Oil Sands sales were key factors in this improvement. If the ratio included the company’s Preferred Securities it would have been 1.3 times in 2003.
Suncor believes it has the capital resources to fund its 2004 capital spending program of $1.7 billion and to meet current working capital requirements. Suncor believes a combination of cash flow from operations and its borrowing capacity will support this level of capital spending.
AGGREGATE CONTRACTUAL OBLIGATIONS AND OFF-BALANCE SHEET FINANCING
|
| Payments Due by Period |
| ||||||||
($ millions) |
| Total |
| 2004 |
| 2005-2006 |
| 2007-2008 |
| Later years |
|
Non-cancellable capital spending commitments |
| 85 |
| 85 |
| — |
| — |
| — |
|
Fixed-term debt and capital leases |
| 2 448 |
| 220 |
| 6 |
| 405 |
| 1 817 |
|
Operating lease agreements and pipeline capacity and energy services commitments |
| 4 775 |
| 187 |
| 405 |
| 430 |
| 3 753 |
|
Total |
| 7 308 |
| 492 |
| 411 |
| 835 |
| 5 570 |
|
21
The company is subject to financial and operating covenants related to its public market and bank debt. Failure to meet the terms of one or more of these covenants may constitute an Event of Default as described in the respective debt agreements, potentially resulting in accelerated repayment of one or more of the debt obligations.
In addition, a very limited number of the company’s commodity purchase agreements, off-balance sheet arrangements and derivative financial instrument agreements, contain provisions linked to debt ratings that may result in settlement of the outstanding transactions should the company’s debt ratings fall below investment grade status.
At December 31, 2003, the company was in compliance with all material covenants and its debt ratings were investment grade.
VARIABLE INTEREST ENTITIES AND GUARANTEES
At December 31, 2003, the company had various off-balance sheet arrangements with Variable Interest Entities (VIE) and indemnification agreements with third parties as described below.
The company has a securitization program in place to sell, on a revolving, fully serviced and limited recourse basis, up to $170 million of accounts receivable having a maturity of 45 days or less, to a third party. The third party is a multiple party securitization vehicle that provides funding for numerous asset pools. At December 31, 2003, $170 million in outstanding accounts receivable had been sold under the program. Under the recourse provisions, the company will provide indemnification against credit losses to a maximum of $70 million. A liability has not been recorded for this indemnification as the company believes it has no significant exposure to credit losses. Proceeds received from new securitizations and proceeds from collections reinvested in securitizations on a revolving basis for the year ended December 31, 2003, were nil and approximately $2.3 billion, respectively. The company recorded an after-tax loss of approximately $3 million on the securitization program in each of the last three years. There is no penalty to terminate this program. Management currently intends to keep this program in place for the foreseeable future.
In 1999, the company sold 2.13 million barrels of its crude oil inventory for $49 million to a third party while retaining the right to use the inventory for its operations through a five-year usage agreement. The third party’s sole asset is the inventory sold to it by the company. The company pays an annual usage fee of $7 million to the third party and receives a $4 million annual storage fee. The company has the right, but is not obligated, to repurchase the inventory at the spot price at the end of the agreement in June 2004. In order to reduce exposure to the spot price should it elect to repurchase the inventory, the company has entered into crude oil and U.S. dollar swap contracts fixing the purchase price of the crude oil on June 25, 2004, at Cdn$49 million.
In 1999, the company entered into an equipment sale and leaseback arrangement with a third party for proceeds of $30 million. The third party’s sole asset is the equipment sold to it and leased back by the company. The initial lease term covers a period of seven years and is accounted for as an operating lease. The company has provided a residual value guarantee on the equipment of up to $7 million should it elect not to repurchase the equipment at the end of the lease term. An early termination purchase option allows for the repurchase of the equipment at specified dates in 2003, 2004 and 2005. Had the company elected to terminate the lease at December 31, 2003, the total cost would have been $30 million. Annualized equipment lease payments in 2003 were $4 million (in each of 2002 and 2001 – $2 million).
The company has agreed to indemnify holders of the 9.125% Preferred Securities, the 7.15% Notes, the 5.95% Notes and the company’s credit facilities for added costs relating to taxes, assessments or other government charges or conditions, including any required withholding amounts. Similar indemnity terms apply to the receivables securitization program, the crude oil inventory monetization agreement and certain facility and equipment leases.
There is no limit to the maximum amount payable under the indemnification agreements described above. The company is unable to determine the maximum potential amount payable as government regulations and legislation are subject to change without notice. Under these agreements, Suncor has the option to redeem or terminate these contracts if additional costs are incurred.
22
OUTLOOK
Oil Sands is expected to operate at or near capacity in 2004, with production targeted between 225,000 and 230,000 bpd for the year. Production growth through expansion is not expected until 2005, when the company plans to increase Oil Sands capacity to 260,000 bpd. To achieve this goal, Suncor must achieve full production from the first phase of its Firebag in-situ operations and increase upgrading capacity through the construction of a vacuum unit. Both components of this expansion project are proceeding on schedule and costs are expected to approximate the budget estimate of $1 billion.
Expansion plans to increase production beyond 260,000 bpd are also being developed through an expansion known as the Voyageur growth strategy. In the first quarter of 2004, Suncor received regulatory approval to proceed with an expansion to Upgrader #2 that is expected to increase production capacity to 330,000 bpd in late 2007. The cost of the project is currently estimated at $3 billion including approximately $1.5 billion for the expansion to Upgrader #2 and $1.5 billion for development of additional Firebag in-situ stages, mining and extraction. As these cost estimates are based on preliminary scope and engineering, actual amounts may differ and the differences may be material. Suncor’s Board must approve the expansion plan and budget prior to construction beginning. A decision by the Board is expected in November 2004. (For further details, see page 39).
The final phase of Voyageur, including construction of a third Oil Sands upgrader and proportionate increases in bitumen supply, is intended to increase production capacity to 500,000 to 550,000 bpd in the 2010 to 2012 time frame. Preliminary cost estimates for this phase of production growth have not been made and are dependent on scope and engineering, market analysis, stakeholder consultation and environmental and socioeconomic impact assessments.
Production growth at Oil Sands is also expected to coincide with further investments at Suncor’s other businesses. Capital investment in NG may be required to increase natural gas production to meet its goal of exceeding internal purchases. In downstream operations, investments will be necessary to integrate Oil Sands production into refined product markets and to meet environmental legislation.
Suncor anticipates its growth plan to be largely financed from internal cash flow, which is dependent on commodity prices and other factors. Suncor is projecting an annual capital spending program of approximately $1.7 billion to $1.9 billion until about 2011 to support its growth strategy and sustain operations. Actual spending is subject to change due to such factors as internal and external approvals and capital availability. Refer to the discussion under Risk/Success Factors Affecting Performance on page 24 for additional factors that can have an impact on Suncor’s ability to generate funds to support investing activities.
Oil Sands Crown Royalties and Cash Income Taxes
Crown royalties in effect for oil sands operations require payments to the Government of Alberta, based on gross revenues less related transportation costs (R), less allowable costs (C), including the deduction of capital expenditures (the 25% R-C royalty), subject to a minimum payment of 1% of R. Suncor is currently in discussions with the government on several interrelated aspects of the company’s Oil Sands royalty structure. These discussions include finalizing the terms of Suncor’s option to transition to the generic bitumen-based royalty regime in 2009, which could include a reduction in allowable costs for royalty purposes. Discussions also include the royalty treatment of Suncor’s Firebag in-situ operations. The government currently classifies Firebag as a separate project from Suncor’s existing operations while Suncor believes Firebag is an expansion of its existing operations. Classification of Firebag as a separate project would result in a timing difference in royalty payments, whereby higher royalties would be payable in earlier years and lower royalties would be payable thereafter.
Absolute royalties payable for a particular period are impossible to accurately predict as they are highly sensitive to, among other factors, crude oil prices, foreign exchange rates and capital and operating costs. In 2003, Suncor paid royalties of $33 million, reflecting the minimum payment of 1% of R.
If Firebag is treated as a separate project, at just over US$26 per barrel WTI, the 25% R-C royalty formula would exceed the 1% of gross revenues minimum and royalties of $28 million would become payable during 2004, based on the following assumptions: a natural gas price of US$5.50 per mcf at Henry Hub;
23
a light/heavy oil differential to U.S. Gulf Coast of US$8 per barrel; and Cdn$/US$ exchange rate of 0.78. Using these same assumptions, for every US$1 per barrel increase in WTI, Suncor’s royalty payments would increase by approximately $25 million. Further, under these assumptions, the 25% R-C royalty would continue to apply to existing oil sands operations, other than Firebag, in future years. After 2009, the royalty would be based on bitumen value if Suncor exercised its option to transition to the generic royalty regime.
This sensitivity analysis incorporates operating and capital cost assumptions included in the company’s current budget and long-range plan, and is not an estimate, forecast or prediction of actual future events or circumstances.
The royalty provisions do not impact Suncor’s expectations for income taxes. For example, at US$33 per barrel WTI, based on prior years’ investment levels, future investment plans and the other assumptions stated, Suncor would not expect its Oil Sands operations to be cash taxable until well into the next decade.
Climate Change
Suncor’s effort to reduce greenhouse gas emissions is reflected in its pursuit of greater internal energy efficiency, investment in emissions offsets and carbon capture research and development.
Suncor continues to consult with governments about the impact of the Kyoto Protocol and plans to continue to actively manage its greenhouse gas emissions. The company currently estimates that in 2010 the impact of the Kyoto Protocol on Oil Sands cash operating costs would be an increase of about $0.20 to $0.27 per barrel. This estimate assumes a reduction obligation of 15% from 2010 business-as-usual energy intensity(1) and that the maximum price for carbon credits would, as the Government of Canada indicated in late 2002, be capped at $15 per tonne of carbon dioxide equivalent until 2012. Based on these assumptions, Suncor does not currently anticipate that the cost implications of federal and provincial climate change plans will have a material impact on its business or future growth plans.
The ultimate impact of Canada’s implementation of the Kyoto Protocol, however, remains subject to numerous risks, uncertainties and unknowns. These include the outcome of discussions between the federal and provincial governments, the form, impact and effectiveness of implementing legislation, the ultimate allocation of reduction obligations among economic sectors, and other details of Canada’s implementation plan, as well as international developments. In addition, the Government of Canada has not yet indicated what, if any, limitations will be placed on the price of carbon credits after 2012. It is not possible to predict how these and other Kyoto related issues will ultimately be resolved.
RISK/SUCCESS FACTORS AFFECTING PERFORMANCE
Suncor’s financial and operational performance is potentially affected by a number of factors including, but not limited to, commodity prices and exchange rates, environmental regulations, stakeholder support for growth plans, extreme cold in winter weather, regional labour issues and other issues discussed within Risk/Success Factors for each Suncor business segment. A more detailed discussion of risk factors is presented in the company’s most recent AIF/40-F, filed with securities regulatory authorities.
Commodity Prices, Refined Product Margins and Exchange Rates
Suncor’s future financial performance remains closely linked to hydrocarbon commodity prices, which can be influenced by many factors including global and regional supply and demand, worldwide political events and the weather. These factors, among others, can result in a high degree of price volatility. For example, from 2001 to 2003 the monthly average price for benchmark WTI crude oil ranged from a low of US$19.40 per barrel to a high of US$35.75 per barrel. While the highs and lows were not as pronounced in 2003 (US$28.10 to US$35.75 per barrel), these fluctuations create uncertainty from a planning perspective. During the same three-year period, the natural gas Henry Hub benchmark monthly average price ranged from a low of US$1.90 per thousand cubic feet (mcf) to a high of US$9.80 per mcf. In addition to supply and demand impacts, a degree of this variation was due to seasonality factors. Suncor currently believes commodity price volatility will continue.
Crude oil and natural gas prices are based on U.S. dollar benchmarks that result in Suncor’s realized prices being influenced by the Cdn$/US$ currency exchange rate, thereby creating an element of uncertainty for the
(1) Reflects the level of greenhouse gas emissions that would have occurred in the absence of energy efficiency and process improvements after 2000.
24
company. Should the Canadian dollar strengthen compared to the U.S. dollar, the negative effect on net earnings would be partially offset by foreign exchange gains on the company’s U.S. dollar denominated debt and U.S. dollar denominated Preferred Securities. Conversely, should the Canadian dollar weaken compared to the U.S. dollar, the positive effect on net earnings would be partially offset by foreign exchange losses on the company’s U.S. dollar denominated debt and U.S. dollar denominated Preferred Securities. Cash flow from operations is not impacted by the effects of foreign currency fluctuations on the the company’s U.S. dollar denominated debt and U.S. dollar denominated Preferred Securities.
Changes to the Cdn$/US$ exchange rate relationship can create significant volatility in foreign exchange gains or losses. On the outstanding US$1 billion in U.S. dollar denominated debt at the end of 2003, a $0.01 change in the Cdn$/US$ exchange rate would change earnings by approximately $15 million after-tax.
During 2003, the strengthening of the Canadian dollar against the U.S. dollar resulted in a $137 million after-tax foreign exchange gain on the company’s U.S. dollar denominated debt, and a $37 million after-tax foreign exchange gain on the U.S. dollar denominated Preferred Securities.
Suncor’s U.S. capital projects are expected to be partially funded from Canadian operations. A weaker Canadian dollar would result in a higher funding requirement for these projects.
SENSITIVITY ANALYSIS (1)
|
|
|
|
|
| Approximate Change in |
| ||||
|
| 2003 |
| Change |
| Pretax |
| After-tax |
| ||
Oil Sands |
|
|
|
|
|
|
|
|
| ||
Price of crude oil ($/barrel) (2) |
| $ | 37.19 |
| US$ | 1.00 |
| 64 |
| 42 |
|
Sweet/sour differential ($/barrel) |
| $ | 7.92 |
| US$ | 1.00 |
| 27 |
| 17 |
|
Sales (bpd) |
| 218 300 |
| 1 000 |
| 12 |
| 8 |
| ||
Natural Gas |
|
|
|
|
|
|
|
|
| ||
Price of natural gas ($/mcf) (2) |
| $ | 6.42 |
| 0.10 |
| 5 |
| 3 |
| |
Production of natural gas (mmcf/d) |
| 187 |
| 10 |
| 15 |
| 8 |
| ||
Energy Marketing and Refining – Canada |
|
|
|
|
|
|
|
|
| ||
Retail gasoline margins cents per litre (cpl) |
| 6.6 |
| 0.1 |
| 2 |
| 1 |
| ||
Refining/wholesale margin (cpl) (2) |
| 6.5 |
| 0.1 |
| 5 |
| 3 |
| ||
Refining and Marketing – U.S.A. |
|
|
|
|
|
|
|
|
| ||
Retail gasoline margins (cpl) |
| 5.6 |
| 0.1 |
| — |
| — |
| ||
Refining/wholesale margin (cpl) |
| 5.9 |
| 0.1 |
| 2 |
| 1 |
| ||
Consolidated |
|
|
|
|
|
|
|
|
| ||
Exchange rate: Cdn$/US$ |
| 0.72 |
| 0.01 |
| 44 |
| 35 |
| ||
(1) The sensitivity analysis shows the main factors affecting Suncor’s annual pretax cash flow from operations and after-tax earnings based on actual 2003 operations. The table illustrates the potential financial impact of these factors applied to Suncor’s 2003 results. A change in any one factor could compound or offset other factors.
(2) Includes the impact of hedging activities.
Derivative Financial Instruments
The company periodically enters into commodity-based derivative financial instruments such as forwards, futures, swaps and options to hedge against the potential adverse impact of changing market prices due to variations in the underlying commodity indices. The company also periodically enters into derivative financial instrument contracts such as interest rate swaps as part of its risk management strategy to manage exposure to interest rate fluctuations.
Commencing in the fourth quarter of 2002, the company began to use energy derivatives, including physical and financial swaps, forwards and options to gain market information and to earn trading revenues. Trading activities are accounted for at fair value in the company’s consolidated financial statements.
Derivative contracts accounted for as hedges are not recognized in the consolidated balance sheets. Realized and unrealized gains or losses on these contracts, including realized gains and losses on derivative hedging
25
contracts settled prior to maturity, are recognized in earnings and cash flows when the related sales revenues, costs, interest expense and cash flows are recognized.
Gains or losses resulting from changes in the fair value of derivative contracts that do not qualify for hedge accounting are recognized in earnings and cash flows when those changes occur.
Commodity Hedging Activities Suncor cannot control or accurately predict the prices of crude oil or natural gas. For this reason, the company has a hedging program that fixes a price or range of prices for crude oil and natural gas for specified periods of time for a percentage of Suncor’s total production. As at December 31, 2003, the company did not have any outstanding foreign currency hedges.
Suncor’s risk management objective with its hedging program is to reduce exposure to market volatility and support the company’s ability to finance growth. The Audit Committee and the Board of Directors meet with management regularly to assess Suncor’s hedging thresholds in light of its price forecast and cash requirements. To add more certainty to Suncor’s ability to finance future capital programs and manage debt, the Board authorized the hedging of 35% of the company’s crude oil volumes in 2004 and up to 30% for the period 2005 to 2007.
The company’s derivative hedging instruments do not require the payment of premiums or cash margin deposits prior to settlement. On settlement, these contracts result in cash receipts to the company, or payments by the company, for the difference between the derivative contract and market rates for the applicable volumes hedged during the contract term. Such cash receipts or payments offset corresponding decreases or increases in the company’s sales revenues or crude oil purchase costs. For accounting purposes, amounts received or paid on settlement are recorded as part of the related hedged sales or purchase transactions in the consolidated statements of earnings. In 2003, crude oil hedging decreased Suncor’s net earnings by $155 million. In 2002, hedging decreased net earnings by $160 million.
Crude oil hedge contracts outstanding at December 31, 2003, were as follows:
|
| Quantity |
| Average |
| Revenue |
| Hedge |
|
|
| (bpd) |
|
|
| ($ millions) |
|
|
|
As at December 31, 2003 |
|
|
|
|
|
|
|
|
|
Crude oil swaps |
| 68 000 |
| 24 |
| 772 | (b) | 2004 |
|
Costless collars |
| 11 000 |
| 21 – 24 |
| 109 – 125 | (b) | 2004 |
|
Crude oil swaps |
| 36 000 |
| 23 |
| 390 | (b) | 2005 |
|
(a) Average price of crude oil swaps is US$WTI per barrel at Cushing, Oklahoma.
(b) The revenue hedged is translated to Cdn$ at the year-end exchange rate for convenience purposes.
Financial Hedging Activities Suncor periodically enters into interest rate and cross-currency interest rate swap contracts as part of its strategy to manage exposure to interest rates. The interest rate swap contracts involve an exchange of floating rate and fixed rate interest payments between the company and investment grade counterparties. The cross-currency swap contracts can also involve an exchange of Canadian dollar interest payments and U.S. dollar interest payments, and an exchange of Canadian and U.S. dollar principal amounts at the maturity date of the underlying borrowing to which the swaps relate. The differentials on the exchange of periodic interest payments are recognized as an adjustment to interest expense.
The company has entered into various interest rate swap transactions at December 31, 2003. The swap transactions result in an average effective interest rate that is different from the stated interest rate of the related underlying long-term debt instruments.
26
Description of swap transaction |
| Principal Swapped |
| Swap |
| 2003 Effective |
|
Swap of 6.10% Medium Term Notes to floating rates |
| 150 |
| 2007 |
| 4.3 | % |
Swap of 6.80% Medium Term Notes to floating rates |
| 250 |
| 2007 |
| 4.9 | % |
Swap of 6.70% Medium Term Notes to floating rates |
| 200 |
| 2011 |
| 4.2 | % |
In 2003, these interest rate swap transactions reduced 2003 pretax interest expense by $12 million.
Fair Value of Derivative Hedging Instruments
The fair value of derivative hedging instruments is the estimated amount, based on third party market data, that the company would receive (pay) to terminate the contracts. Such amounts, which also represent the unrecognized and unrecorded gain (loss) on the contracts, were as follows at December 31:
($ millions) |
| 2003 |
| 2002 |
|
Revenue hedge swaps and collars |
| (285 | ) | (133 | ) |
Margin hedge swaps |
| 2 |
| 1 |
|
Interest rate and cross-currency interest rate swaps |
| 32 |
| 35 |
|
|
| (251 | ) | (97 | ) |
Energy Trading Activities In November 2002, Suncor commenced energy trading activities, focused on the commodities the company produces. These energy-trading activities are accounted for using the mark-to-market method and, as such, physical and financial energy contracts are recorded at fair value at each balance sheet date. For the year ended December 31, 2003, a net pretax loss of $3 million (2002 – $nil) from the settlement and revaluation of these contracts was reported as energy trading and marketing activities in the consolidated statements of earnings.
The fair value of unsettled energy trading assets and liabilities at December 31 are as follows:
($ millions) |
| 2003 |
| 2002 |
|
Energy trading assets |
| 5 |
| 2 |
|
Energy trading liabilities |
| 5 |
| 2 |
|
The valuation of the above contracts was based on actively quoted prices.
Counterparty Credit Risk The company may be exposed to certain losses in the event that counterparties to derivative financial instruments are unable to meet the terms of the contracts. The company’s exposure is limited to those counterparties holding derivative contracts with net positive fair values at the reporting date. The company minimizes this risk by only entering into agreements with investment grade counterparties, and through regular management review of potential exposure to, and credit ratings of, such counterparties. At December 31, the company had exposure to credit risk with counterparties as follows:
($ millions) |
| 2003 |
| 2002 |
|
Derivative contracts not accounted for as hedges |
| 30 |
| 28 |
|
Unrecognized derivative contracts |
| 27 |
| 23 |
|
|
| 57 |
| 51 |
|
Environmental Regulations
Environmental laws affect nearly all aspects of Suncor’s operations, imposing certain standards and controls on activities relating to oil and gas mining and conventional exploration, development and production. Environmental laws also affect refining, distribution and marketing of petroleum products and petrochemicals and require companies engaged in those activities to obtain necessary permits to operate. Environmental assessments and approvals are required before initiating most new projects or undertaking significant changes to existing operations.
In addition to these specifically known requirements, Suncor expects that changes to environmental laws could impose further requirements on companies operating in the energy industry. Some of the issues include the possible cumulative impacts of oil sands development in the Athabasca region; the need to reduce or stabilize various emissions; issues relating to global climate change, including the uncertainties and risks associated with Canada’s implementation of the Kyoto Protocol, and uncertainties associated with predicting emission intensity levels from Suncor’s future production; and other potential impacts of government regulation in areas such as land reclamation and restoration, water quality and usage, and reformulated fuels to support lower vehicle emissions. Changes in environmental laws could have an adverse effect on Suncor in terms of product demand, product formulation and quality, methods of production, and distribution and operating costs. The complexity of these issues makes it difficult to predict their future impact on the company.
27
Management anticipates capital expenditures and operating expenses could increase in the future as a result of the implementation of new and increasingly stringent environmental regulations.
Regulatory Approvals
Before proceeding with most major projects, Suncor must obtain regulatory approvals. The regulatory approval process can involve stakeholder consultation, environmental impact assessments and public hearings, among other factors. Failure to obtain regulatory approvals, or failure to obtain them on a timely basis, could result in delays, abandonment, or restructuring of projects and increased costs, all of which could negatively impact future earnings and cash flow.
CRITICAL ACCOUNTING POLICIES AND ESTIMATES
Suncor’s critical accounting policies are defined as those that are both important to the portrayal of the company’s financial position and operations and those that require management to make judgments based on underlying estimates and assumptions about future events and their effects. Underlying estimates and assumptions are based on historical experience and other factors that management believes to be reasonable under the circumstances. These estimates and assumptions are subject to change as new events occur, as more industry experience is acquired, as additional information is obtained and as Suncor’s operating environment changes. The company believes the following are the most critical accounting policies and estimates used in the preparation of its consolidated financial statements.
Property, Plant and Equipment
Suncor accounts for its Oil Sands in-situ and NG exploration and production activities using the “successful efforts” method. This policy was selected over the alternative full-cost method because Suncor believes it provides a more timely accounting of the success or failure of exploration and production activities.
The application of the successful efforts method of accounting requires Suncor’s management to determine the proper classification of activities designated as developmental or exploratory, which ultimately determines the appropriate accounting treatment of the costs incurred. The results from a drilling program can take considerable time to analyze and the determination that commercial reserves have been discovered requires both judgment and industry experience. Where it is determined that exploratory drilling will not result in commercial production, the exploratory “dry hole” costs are written off and reported as part of Oil Sands and NG exploration expenses in the consolidated statements of earnings. Dry hole expense can fluctuate from year to year due to such factors as the level of exploratory spending, the level of risk sharing with third parties participating in the exploratory drilling and the degree of risk in drilling in particular areas.
Properties that are assumed to be productive may, over a period of time, actually deliver oil and gas in quantities different than originally estimated because of changes in reservoir performance and/or adjustments in reserves. Such changes can require a test for the potential impairment of capitalized properties, based on estimates of future cash flow from the properties.Estimates of future cash flows are subject to significant management judgment concerning oil and gas prices, production quantities and operating costs.
Where management assesses that a property is fully or partially impaired, the book value of the property is reduced to fair value and either completely removed from the company’s records (“written off”) or partially removed from the company’s records (“written down”) and reported as part of Oil Sands and NG depreciation, depletion and amortization (DD&A) expenses in the consolidated statements of earnings.
The company’s plant and equipment are depreciated on a straight-line basis over the estimated useful life of the assets. Firebag and NG property costs are depleted on a unit of production (UOP) basis. In each case the expense is shown on the DD&A line in both the consolidated statements of earnings and in the schedules of segmented earnings. The straight-line basis reflects asset usage as a function of time rather than production levels. For example, the useful life of plant and equipment at Oil Sands and Firebag operations are not based on recorded reserves as the company has access to other undeveloped properties, and bitumen feedstock from third parties, as well as the ability to provide processing services for other producers’ bitumen. UOP amortization is used where that method better matches the asset utilization with production that the asset is associated with.
The company determines useful life based on prior experience with similar assets and, as necessary, in consultation with others who have expertise with the assets in question. However, the actual useful life of the assets may differ from management’s original estimate due to factors such as technological obsolescence, regulatory requirements and maintenance activity. As the majority of assets are depreciated on a straight-line
28
basis, a 10% reduction in the useful life of plant and equipment would increase annual DD&A by approximately 10%. This impact would be reflected in all business segments with the majority of the impact being in Oil Sands.
Negative revisions in NG reserve estimates will result in an increase in depletion expenses.
Overburden
As part of the process of mining oil sands, it is necessary to remove surface material such as muskeg, glacial deposits and sand. Overburden removal may precede mining of the oil sands deposit by as much as two years. Accordingly, the quantity of overburden removed in a given period may not bear any relationship to the quantity of oil sands mined in the period, and as such the cash outlays can be different than the amount amortized. In 2003, the overburden amortization charge was $208 million compared with actual cash overburden spending of $175 million. Oil Sands overburden amortization is reported as part of DD&A in the consolidated statements of earnings. Deferred overburden costs are reported as part of “deferred charges and other assets” in the consolidated balance sheets.
In order to ensure a proper matching of costs with revenues (such that each tonne of oil sands mined is allocated a proportionate share of overburden removal costs), the company has adopted the deferral method of accounting for overburden removal costs whereby all such costs are initially set up as a deferred charge.
To allocate the deferred overburden charges, a life-of-mine approach has been adopted for each mine pit, relating the removal of all overburden to the mining of all of the oil sands ore on leases where there is regulatory approval. By adopting this approach, an overburden stripping ratio is calculated that allows for the matching of revenues and expenses such that overburden removal costs are averaged over the life of the mine. Over time, through a combination of increased mine areas, additional drilling activity and operational experience, the company has seen its stripping ratios vary, which can increase or decrease the overburden amortization costs charged to the earnings statement. In 2003 the stripping ratio decreased by about 2% due to new operational information and mine plan changes. This favourable impact of about $4 million partially offset the increase due to higher production levels and higher operating costs.
Reclamation and Environmental Remediation Costs
Suncor’s reclamation and environmental remediation costs represent the costs of reclaiming the environment or restoring a site to a useful and acceptable condition, as determined by statutory or regulatory authorities, by contractual agreement, or by Suncor management. The scope of the activities and the nature of the costs are normally outlined in the current reclamation or environmental remediation plan. These include costs specifically related to the reclamation or environmental remediation project and any other costs that can be clearly identified with the project.
For 2003 and prior years, estimated reclamation costs at Oil Sands and NG were accrued on the unit of production basis based on proved and probable reserves. Estimated environmental remediation costs in EM&R and R&M were accrued in the period for sites where assessments indicated that such work was required. No accrual was made for assets with indeterminate lives, including Oil Sands upgrading and processing assets and downstream refining and marketing assets. Reclamation and environmental remediation costs were charged against earnings and reported as operating, selling and general expenses in the consolidated statements of earnings and the schedules of segmented data. These costs primarily affect the Oil Sands and NG segments. The accrued liability was included in the “accrued liabilities and other” line in the consolidated balance sheets.
In connection with company and external party reviews of Oil Sands and NG completed in the fourth quarter of 2003, Suncor increased its reclamation cost estimate to approximately $950 million, from the previous estimate of $650 million. Approximately $230 million of the increase was due to a change in the Oil Sands estimate to $840 million. The increase in estimated reclamation costs reflects changes in the scope, cost and timing of reclamation recovery activities, including consolidated tailings technology at Oil Sands and gas plant and facilities reclamation at NG. The majority of the costs in Oil Sands are projected to occur over a time horizon extending up to approximately 2060. In the fourth quarter of 2003, prospective changes in the reclamation cost estimate resulted in additional after-tax expense of approximately $2 million.
29
The greatest area of judgment and uncertainty with respect to the company’s reclamation cost estimates relates to its Oil Sands mining leases where there is a requirement to provide for land productivity equivalent to predisturbed conditions. To reclaim tailings ponds, Suncor is using a process referred to as consolidated tailings technology. At this time, no ponds have been fully reclaimed using this technology, although work is under way. The success and time to reclaim the tailings ponds could increase or decrease the current reclamation cost estimates. The company continues to monitor and assess other possible technologies and/or modifications to the consolidated tailings process now being used.
Refer to Recently Issued Canadian Accounting Standards on page 34 for a discussion of the financial accounting impacts of Suncor’s adoption of its new accounting policy for Asset Retirement Obligations, effective January 1, 2004.
Reserve Estimates
On an annual basis Suncor engages Gilbert Laustsen Jung Associates Ltd. (GLJ), independent petroleum consultants, to evaluate its oil and gas reserves. Subsequent to 2003, Suncor received GLJ’s evaluation reports of its Oil Sands mining reserves, Firebag in-situ reserves and its conventional NG reserves.
The accuracy of any reserve estimate is a function of the quality and quantity of available data, interpretation and judgment. As commodity prices fluctuate, the quantity of reserves recorded can vary, as the economic recoverability of oil and gas reserves is impacted by price fluctuations.
In reporting its reserves data, Suncor is relying on exemptive relief from Canadian Securities regulators contained in the Mutual Reliance Review System decision document dated December 22, 2003.
Oil Sands Mining Reserves
Proved and probable reserves estimates on Oil Sands mining leases are based on a detailed geological assessment, including drilling density. Estimates also consider production capacity and upgrading yields, mine plans, operating life and regulatory constraints. GLJ’s 2003 Oil Sands’ mining reserve evaluation report, dated February 20, 2004, included a reclassification of probable reserves to proved reserves reflecting the 2003 drilling program and the use of revised criteria for classifying portions of the ore body.
Suncor reports its Oil Sands mining reserves on a gross basis (that is prior to deductions of royalties). A reconciliation of gross Oil Sands mining reserves for each of the three years ended December 31, 2003, is as follows:
GROSS OIL SANDS MINING RESERVES (1)
Millions of synthetic crude oil barrels |
| Proved |
| Probable |
| Proved + |
|
December 31, 2000 |
| 422 |
| 2 034 |
| 2 456 |
|
Revisions of previous estimates |
| (1 | ) | (5 | ) | (6 | ) |
Extensions and discoveries |
| — |
| — |
| — |
|
Production |
| (45 | ) | — |
| (45 | ) |
Sales of minerals in place |
| — |
| — |
| — |
|
December 31, 2001 |
| 376 |
| 2 029 |
| 2 405 |
|
Revisions of previous estimates |
| 54 |
| (511 | ) | (457 | ) |
Extensions and discoveries |
| 3 |
| 45 |
| 48 |
|
Production |
| (75 | ) | — |
| (75 | ) |
Sales of minerals in place |
| — |
| — |
| — |
|
December 31, 2002 |
| 358 |
| 1 563 |
| 1 921 |
|
Revisions of previous estimates |
| 599 |
| (611 | ) | (12 | ) |
Extensions and discoveries |
| — |
| — |
| — |
|
Production |
| (79 | ) | — |
| (79 | ) |
Sales of minerals in place |
| — |
| — |
| — |
|
December 31, 2003 |
| 878 |
| 952 |
| 1 830 |
|
(1) Gross reserves means Suncor’s undivided percentage interest in reserves before deducting Crown royalties, freehold and overriding royalty interests.
30
Firebag In-situ Reserves
GLJ’s Firebag in-situ Oil Sands reserves evaluation report dated February 20, 2004, of Suncor’s Firebag in-situ reserves included an approximate 15% increase of proved and probable reserves. All of the reserves at the end of 2003 were categorized as non-producing and reflect a reclassification of a portion of probable reserves to proved status, now that the first stage of operations is capable of producing bitumen. Subsequent to 2003, Suncor began to produce small amounts of bitumen from Firebag.
Suncor reports its Firebag in-situ reserves net of projected royalties. A reconciliation of net Firebag in-situ reserves for each of the three years ended December 31, 2003 is as follows:
NET FIREBAG IN-SITU RESERVES (1)
Millions of barrels |
| Proved |
| Probable (2) |
| Proved + |
|
December 31, 2000 |
| — |
| — |
| — |
|
Revisions of previous estimates |
| — |
| — |
| — |
|
Extensions and discoveries |
| — |
| — |
| — |
|
Production |
| — |
| — |
| — |
|
Sales of minerals in place |
| — |
| — |
| — |
|
December 31, 2001 |
| — |
| — |
| — |
|
Revisions of previous estimates |
| — |
| — |
| — |
|
Extensions and discoveries |
| 124 |
| 1 410 |
| 1 534 |
|
Production |
| — |
| — |
| — |
|
Sales of minerals in place |
| — |
| — |
| — |
|
December 31, 2002 |
| 124 |
| 1 410 |
| 1 534 |
|
Revisions of previous estimates |
| 224 |
| 72 |
| 296 |
|
Extensions and discoveries |
| — |
| — |
| — |
|
Production |
| — |
| — |
| — |
|
Sales of minerals in place |
| — |
| — |
| — |
|
December 31, 2003 |
| 348 |
| 1 482 |
| 1 830 |
|
(1) Net reserves means Suncor’s undivided percentage interest in total reserves after deducting Crown royalties, freehold and overriding royalty interests. The calculation of these third party interests is uncertain and based on assumptions about future oil prices, production levels, operating costs and capital expenditures. For a more detailed description of these royalties, see page 23, Oil Sands Crown Royalties and Cash Income Taxes.
(2) Although Suncor is subject to Canadian disclosure rules in connection with the reporting of its reserves, Suncor has received exemptive relief from Canadian securities administrators permitting it to report its proved reserves in accordance with U.S. disclosure practices. In addition, although U.S. companies do not disclose probable reserves for non-mining properties, Suncor voluntarily discloses its probable reserves for its Firebag in-situ leases as it believes this information is useful to investors. As a result, Suncor’s Firebag in-situ reserve estimates may not be directly comparable to those made by U.S. companies. See Reliance on Exemptive Relief in Suncor’s Annual Information Form/Form 40-F dated February 26, 2004 and incorporated by reference herein.
31
NG Reserves
GLJ’s NG reserve evaluation report dated February 20, 2004, (comprised of both natural gas as well as crude oil and natural gas liquids) resulted in a net natural gas reserve decrease (excluding reductions due to current year production) of 3% for 2003. This reduction includes a decrease of approximately 11% due to technical revisions reflecting lower than expected performance, and additions of approximately 8% due to extensions and discoveries.
Suncor reports its NG proved reserves net of projected royalties and interests of third parties in accordance with U.S. disclosure practices. A reconciliation of Suncor’s net NG reserves for each of the three years ended December 31, 2003 is as follows:
NET NATURAL GAS PROVED RESERVES (1)
|
| Crude Oil |
| Natural Gas |
|
December 31, 2000 |
| 11 |
| 567 |
|
Revisions of previous estimates |
| — |
| 4 |
|
Extensions and discoveries |
| — |
| 20 |
|
Production |
| (1 | ) | (45 | ) |
Sales of minerals in place |
| — |
| (1 | ) |
December 31, 2001 |
| 10 |
| 545 |
|
Revisions of previous estimates |
| — |
| (18 | ) |
Extensions and discoveries |
| 1 |
| 39 |
|
Production |
| (1 | ) | (48 | ) |
Sales of minerals in place |
| — |
| (2 | ) |
December 31, 2002 |
| 10 |
| 516 |
|
Revisions of previous estimates |
| (2 | ) | (50 | ) |
Extensions and discoveries |
| 1 |
| 40 |
|
Production |
| (1 | ) | (50 | ) |
Sales of minerals in place |
| — |
| — |
|
December 31, 2003 |
| 8 |
| 456 |
|
(1) Net reserves means Suncor’s undivided percentage interest in total reserves after deducting interests of third parties, including Crown royalties, freehold and overriding royalty interests. The calculation of these third party interests is uncertain and based on assumptions about future natural gas prices, production levels, operating costs and capital expenditures.
Employee Future Benefits
The company provides a range of benefits to its employees and retired employees, including pensions and other post-retirement health care and life insurance benefits. The determination of obligations under the company’s benefit plans and related expenses requires the use of actuarial valuation methods and assumptions. Assumptions typically used in determining these amounts include, as applicable, rates of employee turnover, future claim costs, discount rates, future salary and benefit levels, return on plan assets, mortality rates and future medical costs. The fair value of plan assets is determined using market values. Actuarial valuations are subject to management judgment. Management continually reviews the assumptions in light of actual experience and expectations for the future. Changes in assumptions are accounted for on a prospective basis. Employee future benefit costs are reported as part of operating, selling and general expenses in the company’s consolidated statements of earnings and schedules of segmented earnings. The accrued benefit liability is reported as part of “accrued liabilities and other” in the consolidated balance sheets.
The assumed rate of return on plan assets considers the current level of expected returns on the fixed income portion of the plan assets portfolio, the historical level of risk premium associated with other asset classes in
32
the portfolio and the expected future returns on each asset class. The discount rate assumption is based on the year-end interest rate on high quality bonds with maturity terms equivalent to the benefit obligations. The rate of compensation increases is based on management’s judgment. The accrued benefit obligation and net periodic benefit cost for both pensions and other post-retirement benefits may differ significantly if different assumptions are used, as noted below.
A 1% change in the assumptions at which pension benefits and other post-retirement benefit liabilities could be effectively settled is as noted below.
|
| Rate of Return |
| Discount Rate |
| Rate of |
| ||||||
($ millions) |
| 1% |
| 1% |
| 1% |
| 1% |
| 1% |
| 1% |
|
Increase (decrease) to net periodic benefit cost |
| (3 | ) | 3 |
| (8 | ) | 10 |
| 4 |
| (3 | ) |
Increase (decrease) to benefit obligation |
| — |
| — |
| (83 | ) | 95 |
| 24 |
| (22 | ) |
Health care costs comprise a significant element of Suncor’s post-employment benefit obligation and an area where there is increasing cost pressure due to an aging North American society. Suncor has assumed a 12% annual rate of increase in the per capita cost of covered health care benefits for 2003, with an assumption that this rate will decrease by 0.5% annually, to 5% by 2017, and remain at that level thereafter.
A 1% change in the assumed health care cost trend rate would have the following effects:
($ millions) |
| 1% |
| 1% |
|
Increase (decrease) to total of service and interest cost components of net periodic post-retirement health care benefit cost |
| 1 |
| (1 | ) |
Increase (decrease) to the health care component of the accumulated post-retirement benefit obligation |
| 12 |
| (10 | ) |
Control Environment
Based on their evaluation as of December 31, 2003, Suncor’s Chief Executive Officer and Chief Financial Officer concluded that Suncor’s disclosure controls and procedures (as defined in Rules 13(a)-15(e) and 15(d)-15(e) under the United States Securities Exchange Act of 1934 (the Exchange Act)) are effective to ensure that information required to be disclosed by Suncor in reports that it files or submits under the Exchange Act is recorded, processed, summarized and reported within the time periods specified in the United States Securities and Exchange Commission (SEC) rules and forms. In addition, other than as described below, as of December 31, 2003, there were no changes in Suncor’s internal controls over financial reporting that occurred during 2003 that have materially affected, or are reasonably likely to materially affect its internal controls over financial reporting. Suncor will continue to periodically evaluate its disclosure controls and procedures and internal controls over financial reporting and will make any modifications from time to time as deemed necessary.
The company is in the process of implementing two major programs. Both include the review and design of processes, systems and controls. Suncor is implementing an Enterprise Resource Planning (ERP) system in all of its businesses to support the company’s growth plan. The phased implementation is currently planned to be complete by 2006. Implementing an ERP system on a widespread basis involves significant changes in business processes and extensive organizational training. The company currently believes a phased-in approach reduces the risks associated with making these changes. Suncor believes it is taking the necessary steps to monitor and maintain appropriate internal controls during this transition period. These steps include deploying resources to mitigate internal control risks and performing additional verifications and testing to ensure data integrity.
The company is also undertaking a comprehensive review of its existing internal controls over financial reporting, with a view to the upcoming effectiveness
33
certification and attestation requirements of Section 404 of the United States Sarbanes-Oxley Act of 2002. As a result of these initiatives, the company expects there will be a significant redesign of its business processes during 2004 and 2005, some of which relate to internal controls over financial reporting and disclosure controls and procedures.
The company has identified the need to implement an effective and functioning control environment to support financial reporting and disclosure processes in the R&M business unit. At December 31, 2003, certain of the compensating controls and processes that were initially put in place at the time of the acquisition have been enhanced. Further development of, and enhancements to, control processes and computerized systems are expected to be completed during 2004.
Change In Accounting Policies
During 2003, the company adopted a new accounting policy for stock-based compensation related to common share options. Pursuant to new transitional rules approved by the Canadian Institute of Chartered Accountants (CICA) in 2003, the company now records stock-based compensation expense in the company’s consolidated statements of earnings for all common share options granted to employees and non-employee directors on or after January 1, 2003 (“2003 options”), with a corresponding increase recorded as contributed surplus in the consolidated statements of changes in shareholders’ equity.
This change in accounting policy increased operating, selling and general expenses and contributed surplus by $7 million for the year ended December 31, 2003.
The CICA transitional rules allowed for either retroactive application, with or without restatement, or the prospective application chosen by the company. If compensation expense had been recorded for pre-2003 options on a retroactive basis, the company would have reported additional compensation costs under the fair value method of $30 million in 2003, $32 million in 2002 and $9 million in 2001.
RECENTLY ISSUED CANADIAN ACCOUNTING STANDARDS
Hedging Relationships
Canadian Accounting Guideline 13 (AcG 13) “Hedging Relationships” is applicable to the company’s hedging relationships in 2004 and subsequent fiscal years. AcG 13 specifies the circumstances in which hedge accounting is appropriate, including the identification, documentation, designation and effectiveness of hedges, as well as the discontinuance of hedge accounting. The Guideline does not specify hedge accounting methods. The company believes its hedging documentation and effectiveness testing are prepared in accordance with the provisions of AcG 13.
Asset Retirement Obligations
Effective January 1, 2004, the company will adopt, as required, the new Canadian standard “Asset Retirement Obligations” (ARO), which substantially harmonizes Canadian GAAP with U.S. GAAP in this area. This standard requires recognition of a liability for the future retirement obligations associated with the company’s property, plant and equipment. The fair value of the asset retirement obligations is to be recorded on a discounted basis (6.5% in 2004). This amount is capitalized as part of the cost of the related asset and amortized to expense over its useful life. The liability accretes until the company settles the obligation.
On an annual basis at Oil Sands and NG, the most probable costs of reclamation are estimated in as-spent dollars based on current information, the estimated timing of remedial actions, existing regulatory requirements and technology.
The impact of adopting this standard will be an increase to property, plant and equipment of $211 million, an increase to future tax assets of $110 million, an increase to accrued liabilities of $318 million, an increase to future tax liabilities of $73 million, and a decrease to retained earnings of $70 million. The company is required by the standard to restate retroactively the financial statements of prior years.
34
The adoption of this standard in 2004 is not expected to have a significant effect on after-tax expenses in 2004 compared with 2003. These costs for 2004 will be classified as both DD&A and operating, selling and general expenses. This change in classification will impact Oil Sands cash operating costs per barrel as a portion of these costs will now be allocated to non-cash DD&A.
Variable Interest Entities
In 2003, Canadian Accounting Guideline 15 (AcG 15) “Consolidation of Variable Interest Entities (VIEs)” was issued. Effective January 1, 2005, AcG 15 requires consolidation of a VIE where the company will absorb a majority of a VIEs losses, receive the majority of its returns, or both. Restatement of prior years, although encouraged, is not required. The company plans to prospectively apply AcG15 from adoption on January 1, 2005. The company will be required to consolidate the VIE related to the sale and leaseback of equipment described earlier on page 22. The company does not expect a significant impact on net earnings on consolidation of the equipment VIE. The impact on the balance sheet will be an increase to property, plant and equipment and an increase to long-term liabilities of approximately $20 million. The VIE involving the sale of crude oil inventory terminates June 25, 2004, prior to the effective date of AcG 15. The accounts receivable securitization program, as currently structured, does not meet the AcG 15 criteria for consolidation by Suncor.
Liabilities and Equity
In 2003, the Canadian Accounting Standards Board approved an amendment to Handbook Section 3860 “Financial Instruments – Disclosure and Presentation” requiring certain obligations that must or could be settled with an entity’s own equity instruments to be presented as liabilities. The new standard will require financial instruments such as the company’s 9.05% and 9.125% Preferred Securities to be classified as long-term debt rather than as equity. On January 15, 2004, the company gave formal notice to the holders of its Preferred Securities that it will redeem the securities on March 15, 2004. Notwithstanding that the Preferred Securities will have been redeemed by the time the new accounting standards become effective in 2005, Suncor will be required to restate its comparative financial statements for 2003 and 2004 to reflect the Preferred Securities as long-term debt rather than as equity. Based on year-end 2003 data, the reclassification is expected to reduce equity by $485 million, increase long-term debt by $486 million and increase deferred charges by $1 million. Preferred security dividends in 2003 of $45 million pretax ($27 million after-tax), reported as a reduction of retained earnings, will be reported as financing expense. Net earnings attributable to common shareholders in 2004 and 2003 are not expected to be materially affected.
35
Oil Sands
Located near Fort McMurray, Alberta, Suncor’s Oil Sands business forms the foundation of Suncor’s growth strategy and represents the most significant portion of the company’s assets. The business recovers bitumen through mining and in-situ development and upgrades it into refinery feedstock, diesel fuel and byproducts.
Oil Sands strategy focuses on:
• Acquiring long-life mineral leases with substantial bitumen resources in place.
• Sourcing low-cost bitumen supply through mining, in-situ development and third party supply agreements, and upgrading this bitumen supply into high value crude oil products that meet market demand.
• Increasing production capacity and improving reliability through staged expansion of oil sands upgrading facilities.
• Reducing costs through the application of technologies, economies of scale, direct management of growth projects, strategic alliances with key suppliers and continuous improvement of operations.
Highlights
SUMMARY OF RESULTS
Year ended December 31
($ millions unless otherwise noted) |
| 2003 |
| 2002 |
| 2001 |
|
Revenue |
| 3 061 |
| 2 616 |
| 1 372 |
|
Production (thousands of bpd) |
| 216.6 |
| 205.8 |
| 123.2 |
|
Average sales price ($/barrel) |
| 37.19 |
| 33.65 |
| 29.17 |
|
Net earnings |
| 888 |
| 790 |
| 283 |
|
Cash flow from operations |
| 1 803 |
| 1 475 |
| 486 |
|
Total assets |
| 7 762 |
| 6 896 |
| 6 409 |
|
Cash used in investing activities |
| 1 055 |
| 630 |
| 1 476 |
|
Net cash surplus |
| 799 |
| 729 |
| (1 025 | ) |
ROCE (%) (1) |
| 20.6 |
| 16.8 |
| 20.1 |
|
ROCE (%) (2) |
| 17.3 |
| 15.6 |
| 6.4 |
|
(1) Excludes capitalized costs related to major projects in progress. ROCE for Suncor’s operating segments is calculated in a manner consistent with consolidated ROCE as reconciled in Non-GAAP Financial Measures. See page 50.
(2) Includes capitalized costs related to major projects in progress.
SIGNIFICANT DEVELOPMENTS IN 2003
• Crude oil production increased by 5% to an average 216,600 bpd in 2003 compared with 205,800 bpd in 2002.
• �� Cash operating costs averaged $11.50 per barrel in 2003 compared with $11.10 per barrel in 2002. Higher natural gas prices more than offset the impact of efficiency initiatives and higher production levels.
• Construction of stage one of Suncor’s Firebag in-situ operation was completed on schedule. Steam injection began in the fourth quarter of 2003 and the first bitumen production was delivered to the upgrader for processing early in 2004. Full production capacity of 35,000 bpd of bitumen is expected in 2005.
• A maintenance shutdown was successfully completed on Upgrader #1. During the shutdown, a new fractionator was tied in to the upgrader. Both of these projects are expected to improve production reliability in the upgrader.
• A 10-year processing and sales agreement was signed with Petro-Canada, whereby Suncor will process approximately 27,000 bpd of bitumen for Petro-Canada into approximately 22,000 bpd of sour crude and sell an additional 26,000 bpd of Suncor sour crude. This agreement is slated to commence in 2008 (see page 40).
• Oil Sands announced plans for extension of the Steepbank mine, which would replace ore production that is expected to be depleted prior to the end of the decade.
• In the first quarter of 2004, Suncor negotiated a new three-year contract with its largest union representing approximately 1,500 employees at the Oil Sands operation.

36
ANALYSIS OF NET EARNINGS
Net earnings in 2003 increased to $888 million from $790 million in 2002. The increase was largely driven by higher benchmark commodity prices and record sales levels. These positive factors were partially offset by a year-over-year tax rate change of $133 million, higher cash expenses, increased project start-up expenses and the impact of a stronger Canadian dollar.

Oil Sands average production increased to 216,600 bpd in 2003, compared with 205,800 bpd in 2002. As expected, production was slightly lower than the 225,000 bpd capacity primarily due to a scheduled 30-day maintenance shutdown of Upgrader #1 in the second quarter. Sales levels for the year averaged 218,300 bpd compared with 205,300 bpd in 2002. Higher sales volumes increased earnings by $128 million.
Sales prices averaged $37.19 per barrel in 2003 (including the impact of pretax hedging losses of $239 million) compared with $33.65 per barrel in 2002 (including the impact of pretax hedging losses of $243 million). The average price realization was impacted by the following positive factors:
• A strengthening of WTI benchmark crude oil prices.
• An improved mix of the more valuable sweet crude oil and diesel fuel, which increased to 63% of total Oil Sands sales from 62% in 2002.
• Lower realized crude oil pricing differentials. During 2002, the challenges in bringing Oil Sands expanded facilities to capacity resulted in some production streams being sold in markets with less favourable pricing.
These positive factors were partially offset by a strengthening of the Canadian dollar against the U.S. dollar particularly in the second half of the year. Because crude oil is sold primarily based on U.S. dollar benchmark prices, the narrowing exchange rate decreased the Canadian dollar value of crude oil products.
The net impact of the above pricing factors increased earnings by $159 million in 2003.
Royalties
Pretax royalty expense in 2003 was $33 million, the same level as 2002. In both 2003 and 2002, Oil Sands was subject to the minimum 1% rate. For a discussion about Alberta Crown royalties, including the expected impact of Crown royalties in future years, see Outlook on page 23.
Cash Expenses
Cash expenses increased to $1.05 billion from $954 million in 2002. Expenses were higher year over year due to the following factors:
• Natural gas costs increased to $169 million in 2003, compared with $119 million in 2002. This was the result of higher natural gas prices, partially offset by a decreased reliance on purchased natural gas. Natural gas purchases decreased due to the use of more internally generated fuel.
• Higher energy costs and higher maintenance costs in the mine and extraction plants as a result of increased production volumes.
• Unplanned maintenance during 2003.
These higher expenses were partially offset by improved productivity from the truck and shovel fleet.
Transportation costs were unchanged. As an initial shipper on a major pipeline, Suncor’s tolls are subject to annual adjustments. In 2003, a first-time toll adjustment offset toll increases experienced in 2003. The toll adjustments are currently expected to continue until 2007.
Combined, the above factors resulted in a net increase in cash expenses that reduced earnings by $51 million.
Start-up Expenses
Project start-up costs in 2003 increased by $5 million, after-tax, reflecting the commissioning and start-up of Firebag.
37
Non-Cash Expenses
Non-cash DD&A expense, including overburden amortization expense increased marginally, to $451 million from $450 million in 2002.
In 2003, Oil Sands average overburden removal stripping ratio was 0.46 cubic metres of overburden for every tonne of ore mined. In 2002, this ratio was 0.47 cubic metres per tonne. While the lower stripping ratio reduced overburden amortization cost in 2003 compared with 2002, there was a net increase in the amortization charge due to higher volumes mined in 2003 and higher removal costs. Overburden amortization was $208 million in 2003 compared with $202 million in 2002.
Stripping ratios are expected to increase until 2006 as proportionately more mining activity is conducted on the company’s Millennium mine, which has a higher stripping ratio. From 2006 to 2010 it is expected that all of the mining production will come from the Millennium mine and the overburden amortization cost will increase. (For a discussion of stripping ratios see page 29.)
The impact of the expected higher overburden amortization costs is expected to be partially offset by a higher bitumen ore grade and a lower fines content per tonne mined.
Due to the use of judgment and the extended time frame associated with the company’s stripping ratio and bitumen recovery estimates, actual results may differ, and these differences may be material.
Tax Adjustments
The negative tax adjustment in 2003 compared with 2002 of $133 million primarily related to changes in the federal government’s taxation policies for the resource sector.
Operating Costs
Effective January 2003, Suncor revised its definition of cash and total operating costs to report only those costs directly related to producing a barrel of oil including natural gas and imported bitumen costs.
Under the new definition, cash operating costs increased to $911 million in 2003 compared with $835 million a year earlier primarily as a result of higher natural gas costs. Cash operating costs rose in 2003 to $11.50 per barrel from $11.10 per barrel in 2002.
Natural gas purchases decreased to 71 million cubic feet per day (mmcf/d) in 2003 from 79 mmcf/d in 2002, but Oil Sands costs rose to $6.95 per mcf in 2003 from $4.19 per mcf in 2002. This equates to a $0.90 per barrel increase in cash costs.
Non-cash costs per barrel decreased to $5.70 in 2003 from $6.00 in 2002 due to increased production volumes.
NET CASH SURPLUS ANALYSIS
Cash flow from operations increased to $1.8 billion during the year from $1.5 billion in 2002. The increase was due to the same factors that increased net earnings as well as payments made in 2002 under the employee long-term incentive plan, partially offset by increased cash overburden removal charges and increased reclamation spending in 2003.
Working capital decreased by $51 million in 2003 compared with an increase of $116 million in 2002. The net year-over-year reduction of $167 million is primarily due to the larger accounts receivable balance in 2002, as a result of record sales and comparatively higher price realizations at the end of 2002 compared with 2003.
Investing activities increased to slightly more than $1 billion in 2003 from $630 million in 2002. The increase was due to higher capital expenditures associated with Firebag and related upgrader expansions and improvements. Investing activities in 2003 also increased due to $97 million in higher costs resulting from the 30-day planned maintenance shutdown and $91 million to buy out leased mining equipment.
Combined, the above factors resulted in a net cash surplus of $799 million in 2003, compared with a surplus of $729 million in 2002.

38
OUTLOOK
Suncor’s Oil Sands operations continue to be the focus of the company’s business strategy. Independent evaluations currently place total Oil Sands mining and in-situ recoverable bitumen reserves and resources(1) at 12 billion barrels, including proved and probable in-situ and mining bitumen. This is equivalent to approximately 10 billion barrels of synthetic crude oil based on current processing yields.
Suncor’s future plans for Oil Sands remain focused on activities and investments expected to increase production, decrease operating costs and improve environment, health and safety performance.
Production Growth Plans
In 2004, Oil Sands production is expected to average 225,000 to 230,000 bpd from existing upgrading assets. The addition of a vacuum unit to Upgrader #2 and bitumen feed from Firebag stage one is planned to increase production capacity to 260,000 bpd by 2005. Both components of this expansion project are proceeding on schedule and costs are expected to approximate the budget estimate of $1 billion.
As part of its Voyageur growth strategy to increase production to 500,000 to 550,000 bpd in 2010 to 2012, Suncor announced plans to further boost production capacity to 330,000 bpd by late 2007. This increase to 330,000 bpd is expected to cost an estimated $3 billion including approximately $1.5 billion for expansions to Upgrader #2 and $1.5 billion for development of additional Firebag in-situ stages, mining and extraction. As these cost estimates are based on preliminary engineering, actual amounts will differ and the differences may be material.
The upgrading component of this project includes construction of a pair of coke drums, a sulphur recovery plant and other crude oil processing equipment. Plans have been submitted to regulators and were approved in the first quarter of 2004. Subject to Board of Directors approval, construction is scheduled to begin in late 2004.
Cost estimates for future stages of the Voyageur growth strategy, including potential construction and expansion of a third upgrading train, will be provided once preliminary engineering is completed. Ultimate development of these future stages requires approval of regulators and Suncor’s Board of Directors.
PRODUCTION PLAN
Description |
| Regulatory |
| Board of |
| Cost Estimate(2) |
| Production |
| Status | |
Firebag in-situ – stage one and upgrader vacuum unit |
| Yes |
| Yes |
| $ | 1 |
| 260,000 in 2005 |
| Firebag stage 1 construction complete. Vacuum unit under construction. Project is on schedule and on budget. |
|
|
|
|
|
|
|
|
|
|
| |
Additional Firebag in-situ stages and upgrader coker unit expansion |
| Yes |
| Firebag stage 2 approved. Additional stages and coker unit subject to approval. |
| $ | 3 |
| 330,000 in late 2007 |
| Firebag stage 2 construction under way. |
|
|
|
|
|
|
|
|
|
|
| |
Potential third upgrader – asset configuration still tobedetermined |
| No |
| No |
| Not available |
| 500,000 to 550,000 in 2010 to 2012 |
|
| |
(1) Resource volumes include quantities of oil and gas that are estimated, on a given date, to be potentially recoverable from known accumulations, but lack specific criteria to be classified as reserves. The criteria for not classifying these volumes as reserves include items such as insufficient drilling density and lack of near term development plans. U.S. companies are prohibited from disclosing estimates of probable reserves and resources for non-mining properties in filings with the United States Securities and Exchange Commission. As a result, Suncor’s aggregate reserve and resource estimates may not be comparable to those made by U.S. companies.
(2) These cost estimates are based on preliminary engineering. Actual amounts will differ and the differences may be material.
39
Mine Extension
Suncor announced an Environmental Impact Assessment on a proposed extension of its oil sands mining operations in January 2004. The proposed development, an extension of Suncor’s Steepbank mine, would replace ore production that is expected to be depleted prior to the end of the decade. Suncor is seeking regulatory approval by the end of 2006 with construction planned to commence in 2007. The mine is expected to be fully operational in 2010. Currently, capital development costs are estimated at $350 million. As these cost estimates are preliminary, actual amounts will differ and the differences may be material. Final approval from Suncor’s Board of Directors is also required before construction can proceed.
Third Party Bitumen
Incremental bitumen to feed the planned upgrader expansion is also expected to be provided under a processing agreement between Suncor and Petro-Canada, slated to take effect in 2008. Under the agreement, Suncor will process at least 27,000 bpd of Petro-Canada bitumen on a fee-for-service basis. Petro-Canada will retain ownership of the bitumen and resulting sour crude oil production of about 22,000 bpd. In addition, Suncor will sell an additional 26,000 bpd of Suncor proprietary sour crude oil production to Petro-Canada. Both the processing and sales components of the agreement will be for a minimum 10-year term.
Operating Costs
Suncor will continue to focus on reducing operating costs and is targeting a cash operating cost of $10.75 to $11.75 per barrel in 2004 (excluding project start-up costs). Oil Sands production targets do not reflect bitumen production from Firebag. Start-up of in-situ operations will occur throughout 2004 with full production expected in 2005. It is not possible to accurately predict production during the start-up period.
The cash operating cost outlook assumes a price of US$5.50 per mcf of natural gas at Henry Hub. Continued high natural gas prices will pose a significant challenge to achieving the 2004 operating cost target. A change of US$1.00 per mcf in the Henry Hub price of natural gas would result in a change of approximately Cdn$0.50 per barrel to cash operating costs.
RISK/SUCCESS FACTORS AFFECTING PERFORMANCE
Certain issues Suncor must manage that may affect performance include, but are not limited to, the following:
• Suncor’s ability to finance Oil Sands growth in a volatile commodity pricing environment. Also refer to Suncor Overview, Liquidity and Capital Resources on page 20.
• The ability to complete future projects both on time and on budget. This could be impacted by competition from other projects (including other oil sands projects) for skilled people, increased demands on the Fort McMurray infrastructure (housing, roads, schools, etc.), or higher prices for the products and services required to operate and maintain the operations. Suncor continues to address these issues through a comprehensive recruitment and retention strategy, working with the community to determine infrastructure needs, designing Oil Sands expansion to reduce unit costs, seeking strategic alliances with service providers and maintaining a strong focus on engineering, procurement and project management.
• Potential changes in the demand for refinery feedstock and diesel fuel. Suncor believes it can reduce the impact of this issue by entering into long-term supply agreements with major customers, expanding its customer base and offering a variety of blends of refinery feedstock to meet customer specifications.
• Volatility in crude oil and natural gas prices and exchange factors and the light/heavy and sweet/sour crude oil differentials. Prices and differentials are difficult to predict and impossible to control.
• Unplanned production or operational outages and slowdowns. Outages can impact both production levels and costs.
• Suncor’s relationship with its trade unions. Work disruptions have the potential to adversely affect Oil Sands operations and growth projects.
These factors and estimates are subject to certain risks, assumptions and uncertainties discussed on page 51 under Forward-looking Statements. Also refer to Suncor Overview, Risk/Success Factors Affecting Performance on page 24.
40
Natural Gas
Suncor’s NG business primarily produces conventional natural gas in Western Canada. NG’s production provides a price hedge that affords the company a degree of protection from volatile market prices of natural gas purchased for internal consumption.
NG’s strategy is focused on:
• Building competitive operating areas.
• Improving base business efficiency.
• Creating new, low-capital business opportunities.
NG’s long-term goals are to achieve a sustainable ROCE of 12% at mid-cycle prices (US$3.50 to US$4.00/mcf) and to ensure natural gas production keeps pace with company-wide natural gas purchases.
Highlights
SUMMARY OF RESULTS
Year ended December 31
($ millions unless otherwise noted) |
| 2003 |
| 2002 |
| 2001 |
|
Revenue |
| 512 |
| 339 |
| 481 |
|
Production (thousands of barrels of oil equivalent per day (boe/d)) |
| 34.9 |
| 33.7 |
| 33.4 |
|
Natural gas (mmcf/day) |
| 187 |
| 179 |
| 177 |
|
Natural gas liquids (thousands bpd) |
| 2.3 |
| 2.4 |
| 2.4 |
|
Crude oil (thousands bpd) |
| 1.4 |
| 1.5 |
| 1.5 |
|
Average sales price |
|
|
|
|
|
|
|
Natural gas ($/mcf) |
| 6.42 |
| 3.91 |
| 6.09 |
|
Natural gas liquids ($/barrel) |
| 36.08 |
| 29.35 |
| 34.38 |
|
Crude oil ($/barrel) |
| 40.29 |
| 31.72 |
| 33.92 |
|
Net earnings before tax adjustments |
| 85 |
| 33 |
| 97 |
|
Tax adjustments |
| 44 |
| 2 |
| 20 |
|
Net earnings |
| 129 |
| 35 |
| 117 |
|
Cash flow from operations |
| 300 |
| 164 |
| 280 |
|
Total assets |
| 784 |
| 765 |
| 722 |
|
Cash used in investing activities |
| 166 |
| 158 |
| 113 |
|
Net cash surplus |
| 143 |
| 28 |
| 211 |
|
ROCE (%) (1) |
| 29.2 |
| 9.2 |
| 32.1 |
|
(1) ROCE for Suncor operating segments is calculated in a manner consistent with consolidated ROCE as reconciled in Non-GAAP Financial Measures. See page 50.
SIGNIFICANT DEVELOPMENTS DURING 2003
• Higher commodity prices and the impact of favourable tax adjustments drove strong financial results.
• Production increased 4% to 187 mmcf/d in 2003 compared with 179 mmcf/d in 2002. Favourable drilling results in the Foothills operating area were a major factor in delivering volume additions.
• Divestment of non-core assets yielded proceeds of $12 million ($7 million after tax).

NG activities have continued to be directed towards developing properties.

NG production increased 4% in 2003.
Offsetting increasing internal natural gas consumption continues to be a key long-term strategy in NG. In 2003, Suncor produced 187 mmcf/d of natural gas. With the acquisition of the Denver refinery, natural gas purchases in the fourth quarter of 2003 were approximately 120 mmcf/d. Oil Sands consumed an additional 40 mmcf/d of non-purchased gas received, as available, under an existing third party agreement in exchange for coker gases produced as a byproduct of upgrading operations.
Analysis of Net Earnings
NG’s net earnings increased to $129 million in 2003 from $35 million in 2002 due to the favourable impact of commodity prices and decreased non-cash income tax expense, combined with increased production volumes and increased divestment gains. These factors were partially offset by higher royalty expenses, increased exploration expenses due to dry hole costs, higher DD&A and operating costs.
NG’s average natural gas production increased to 187 mmcf/d in 2003 from 179 mmcf/d in 2002. Including liquids, total production in 2003 was 34,900 boe/d compared with 33,700 boe/d in 2002. Volume additions were partially offset by natural reservoir declines in existing wells. The higher volumes increased earnings by $5 million in 2003.
41
In 2003, NG’s average realized price for natural gas was $6.42 per mcf, 64% higher than the average $3.91 per mcf realized in 2002. The higher WTI benchmark crude oil price in 2003 resulted in higher price realizations for NG’s crude oil and natural gas liquids production.
The combined impact of the above pricing factors increased earnings in 2003 by $88 million compared with 2002.
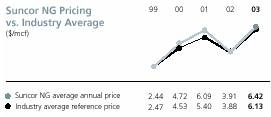
The 2003 industry average reference price is an estimate.

Expenses
Royalties on NG production increased to $106 million ($8.32 per boe) in 2003, up from $65 million ($5.27 per boe) in 2002. The higher royalties reflect higher average commodity prices and increased production, which reduced after-tax earnings by $21 million.
Exploration expenses increased to $40 million in 2003 compared with $17 million in 2002, which reduced after-tax earnings by $13 million. The increase was due to higher dry hole costs and seismic expenditures. DD&A expenses increased to $91 million in 2003 from $75 million in 2002. The increase of $9 million after-tax was due to a higher depletable cost base and higher production, along with increased amortization of unproved coal bed methane lands. Suncor plans to continue to acquire land and explore for coal bed methane in the United States.
Operating costs increased to $77 million from $69 million in 2002 due primarily to higher electricity and site reclamation costs. The increase reduced earnings by $3 million after-tax.
The positive tax adjustment in 2003 compared to 2002 of $42 million primarily related to changes in the federal government’s taxation policies for the resource sector.
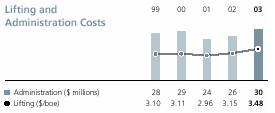
Lifting costs increased in 2003 due to increased electricity costs and employee benefit costs.
NET CASH SURPLUS ANALYSIS
NG’s net cash surplus was $143 million in 2003 compared with $28 million in 2002. Cash flow from operations increased to $300 million compared with $164 million a year earlier, largely due to higher commodity prices, partially offset by higher royalties. Working capital changed by $9 million in 2003 compared with a change of $22 million in 2002, due primarily to a reduction in accounts payable of $13 million. Cash used in investing activities increased to $166 million compared with $158 million in 2002 as a result of higher capital and exploration costs partially offset by divestment proceeds of $12 million from the sale of Mackenzie Delta non-core assets. There was no production, nor did Suncor have exploration or development plans for these assets.

42
OUTLOOK
NG’s long-term financial goal is to achieve a sustainable ROCE of 12% at mid-cycle natural gas prices (US$3.50 to US$4.00/mcf). To meet this goal, management plans to continue improving base business efficiency, with a focus on reducing operating costs and capturing benefits from strategic partnerships and supply chain management.
At the same time, NG continues to work towards an operational target of increasing production by 3% to 5% per year to keep pace with the company’s growing internal natural gas demands. In 2004, with continued development of the Firebag in-situ oil sands operation and full-year demands from the R&M refinery, Suncor’s purchased consumption of gas is expected to be approximately 120 mmcf/d.

To support these goals, the company has budgeted $195 million in capital spending for exploration and development in 2004. NG’s production goal for 2004 is 190 to 195 mmcf/d of natural gas production and approximately 3,300 bpd of crude oil and natural gas liquids.
NG will continue to leverage its expertise and existing assets to bring reserves into production in Western Canada. However, increasing production will likely require expansion through farm-ins,(1) joint-ventures or property acquisitions, which could expand the size and number of operating areas.
RISK/SUCCESS FACTORS AFFECTING PERFORMANCE
Certain issues Suncor must manage that may affect performance of the NG business include, but are not limited to, the following:
• Consistently and competitively finding and developing reserves that can be brought on stream economically. Positive or negative reserve revisions arising from technical and economic factors can have a corresponding positive or negative impact on asset valuation and depletion rates.
• The impact of market demand for land and services on capital and operating costs. Market demand and the availability of opportunities also influences the cost of acquisitions and the willingness of competitors to allow farm-ins on prospects.
• Risks and uncertainties associated with obtaining regulatory approval for exploration and development activities. These risks could add to costs or cause delays to projects.
These factors and estimates are subject to certain risks, assumptions and uncertainties discussed on page 51 under Forward-looking Statements. Refer to the Suncor Overview, Risk/Success Factors Affecting Performance on page 24.
(1) Acquisitions of all or part of the operating rights from the working interest owner. The acquirer assumes all or some of the burden of development in return for an interest in the property. The assignor usually retains an overriding royalty but may retain any type of interest.
43
Energy Marketing and Refining – Canada
Energy Marketing and Refining – Canada (EM&R) operates a 70,000 bpd (approximately 11,100 cubic metres per day) capacity refinery in Sarnia, Ontario, and markets refined products to industrial, wholesale and commercial customers primarily in Ontario and Quebec. Through its Sunoco-branded and joint venture operated service networks, the business markets products to retail customers in Ontario. The business also encompasses third party energy marketing activities and energy trading activities as well as providing marketing services for the sale of crude oil and natural gas on behalf of the Oil Sands and NG operations.
EM&R’s strategy is focused on:
• Enhancing the profitability of refining operations by improving reliability and product yields and enhancing operational flexibility to process a variety of feedstock.
• Increasing the profitability and efficiency of retail networks by improving average site throughput and growing non-fuel ancillary retail revenue.
• Creating downstream market opportunities to capture greater long-term value from Oil Sands production.
As a marketing channel for Suncor’s refined products, EM&R’s Ontario retail networks generated approximately 58% of EM&R’s total 2003 sales volumes of 94,400 bpd. EM&R’s retail networks comprise 279 Sunoco-branded retail service stations, 18 Sunoco-branded Fleet Fuel Cardlock sites, and two 50% retail joint venture(1) businesses that operate 147 Pioneer-branded retail service stations, 53 UPI-branded retail service stations and 14 UPI bulk distribution facilities for rural and farm fuels. Wholesale and industrial sales were responsible for approximately 37% of EM&R’s refined product sales in 2003. Sun Petrochemicals Company (SPC), a 50% joint venture between a Suncor subsidiary and a Toledo, Ohio based refiner, generated the remaining 5% of sales.
Highlights
SUMMARY OF RESULTS
Year ended December 31
($ millions unless otherwise noted) |
| 2003 |
| 2002 |
| 2001 |
|
Revenue |
| 2 671 |
| 2 508 |
| 2 673 |
|
Refined product sales (millions of litres) |
|
|
|
|
|
|
|
Sunoco retail gasoline |
| 1 599 |
| 1 642 |
| 1 575 |
|
Total |
| 5 477 |
| 5 286 |
| 5 419 |
|
Net earnings (loss) breakdown: |
|
|
|
|
|
|
|
Rack Back |
| 48 |
| 10 |
| 47 |
|
Rack Forward |
| 19 |
| 16 |
| 23 |
|
Energy marketing and trading activities |
| (2 | ) | 3 |
| — |
|
Gain on sale of retail natural gas marketing business |
| — |
| 35 |
| — |
|
Tax adjustments |
| (12 | ) | — |
| 10 |
|
Total net earnings |
| 53 |
| 64 |
| 80 |
|
Cash flow from operations |
| 164 |
| 112 |
| 165 |
|
Cash used in investing activities |
| 135 |
| 34 |
| 71 |
|
Net cash surplus |
| 29 |
| 63 |
| 111 |
|
ROCE (%) (1) |
| 10.2 |
| 12.5 |
| 18.4 |
|
(1) ROCE for Suncor operating segments is calculated in a manner consistent with consolidated ROCE as reconciled in Non-GAAP Financial Measures. See page 50.
SIGNIFICANT DEVELOPMENTS DURING 2003
• In October 2003, Suncor and Shell Canada Products entered into a long-term agreement under which EM&R’s Sarnia refinery will process high sulphur diesel from Shell’s Sarnia refinery into low sulphur diesel to meet federal regulations that take effect in 2006. The agreement with Shell is expected to result in cost efficiencies for both parties.
• In 2003, 53 Sunoco convenience stores were renovated to enhance their appearance and align with new Sunoco sites. Merchandise sales in these locations increased 13% within six months of completion of the renovations.
• EM&R’s refined product market share in its primary market of Ontario increased to 19% in 2003, compared to 17% in 2002. Approximately 93% of EM&R’s refined products were sold to the Ontario market in 2003.
(1) Pioneer Group Inc. is an independent company with which Suncor has a 50% joint venture partnership. UPI Inc. is a 50% joint venture company with GROWMARK Inc., a Midwest U.S. retail farm supply and grain marketing cooperative.
44
ANALYSIS OF NET EARNINGS
EM&R’s net earnings decreased to $53 million in 2003 from $64 million in 2002. Net earnings in 2002 included a $35 million after-tax gain on the sale of EM&R’s retail natural gas marketing business. Excluding the gain, net earnings increased by $24 million, or 83%, from 2002. This increase was primarily due to higher refining margins in 2003.
EM&R reports results based on an internal organizational structure. The Rack Back division includes Ontario refining operations, as well as sales and distribution to the Sarnia refinery’s largest industrial and reseller customers and the SPC joint venture. Rack Forward includes retail operations, cardlock and industrial/commercial sales, as well as the UPI and Pioneer joint ventures. EM&R results also include the impact of Suncor’s third party energy marketing and energy trading activities, that are reported separately in this analysis.
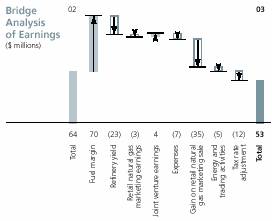
RACK BACK: REFINING AND INDUSTRIAL CUSTOMER DIVISION
Rack Back recorded improved net earnings of $48 million in 2003 compared with $10 million in 2002. The increase was due primarily to higher refining margins, partially offset by higher refinery expenses.
Refining margins averaged 6.5 cpl during 2003, up 35% from 4.8 cpl in 2002. The margin increase was largely a result of strong refined product demand and increased net earnings by $67 million. Increases in jet fuel, diesel fuel, petrochemical and heavy fuel oil sales volumes were partially offset by decreases in gasoline sales volumes.
Refinery utilization averaged 95% in 2003, unchanged from 2002. Utilization was less than capacity in 2003 primarily due to impacts of a widespread power outage that struck the northeastern United States and southern Ontario in August. Utilization was also affected by a planned 32-day maintenance shutdown on a portion of the refinery completed in the fourth quarter of 2003. Utilization capacity in 2002 was affected by a planned 34-day maintenance shutdown on a portion of the refinery’s operations, and a number of smaller, unplanned outages.
The favourable impact of improved margins and higher volumes was partially offset by higher product purchase costs associated with meeting customer needs during the power outage noted above. These factors, including the impact of higher commodity prices in 2003 compared with 2002, reduced earnings by $23 million.
Expenses for the Rack Back division increased by $11 million in 2003 compared with 2002 resulting in a $7 million reduction in net earnings. The increase reflects higher natural gas costs, employee future benefits expense, and unplanned refinery maintenance expenses primarily as a result of the power outage. The early settlement of certain natural gas contracts, prompted by an unfavourable change in the credit rating of a counterparty, resulted in an expense reduction of $12 million. These contracts were replaced at current market prices for the supply of natural gas in 2004.
Net earnings from the SPC joint venture increased by $2 million due to a combination of inventory draws and lower freight expenses.
RACK FORWARD: RETAIL AND COMMERCIAL CUSTOMER DIVISION
Rack Forward net earnings in 2003 decreased to $19 million from $51 million in 2002. Net earnings in 2002 included a $35 million after-tax gain on the sale of EM&R’s retail natural gas marketing business. Earnings excluding the retail natural gas sale increased $3 million year over year primarily due to higher diesel fuel, commercial and reseller gasoline margins, which increased earnings by $3 million, and higher UPI and Pioneer joint venture earnings of $2 million. This was partially offset by the absence of earnings in 2003 from the retail natural gas business, which had earnings of $3 million in 2002.
45
Average Sunoco-branded service station site throughput was 5.9 million litres per site in 2003 compared to 5.8 million litres per site in 2002. Site throughput is an important indicator of network efficiency. Total gasoline sales volumes in the Sunoco-branded retail network decreased to 1,599 million litres from 1,642 million litres in 2002. This volume decrease was attributed to local economic factors in the Ontario market, as well as site divestments and construction downtime related to network development. Sunoco-branded retail gasoline margins averaged 6.6 cpl, equal to the prior year.
EM&R’s Ontario retail gasoline market share, including all Sunoco and joint venture operated retail sites, was 19% compared to 20% in 2002.
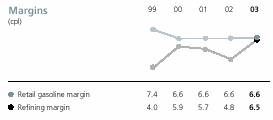
RELATED PARTY TRANSACTIONS
In accordance with GAAP, the Pioneer, UPI and SPC joint ventures are considered to be related parties to Suncor. EM&R supplies refined petroleum products to the Pioneer and UPI joint ventures. In addition, EM&R supplies petrochemical products to SPC. Suncor has a separate supply agreement with each of Pioneer, UPI and SPC. These supply agreements are evergreen, subject to termination only in accordance with the various agreements between the parties.
The following table summarizes the company’s related party transactions with Pioneer, UPI and SPC, after eliminations, for the year. These transactions are in the normal course of operations and have been conducted on the same terms as would apply with unrelated parties.
($ millions) |
| 2003 |
| 2002 |
| 2001 |
|
Operating revenues |
|
|
|
|
|
|
|
Sales to Energy Marketing and Refining – Canada segment joint ventures: |
|
|
|
|
|
|
|
Refined products |
| 301 |
| 321 |
| 300 |
|
Petrochemicals |
| 187 |
| 142 |
| 131 |
|
At December 31, 2003, amounts due from EM&R joint ventures were $36 million (2002 – $30 million).
ENERGY MARKETING AND TRADING ACTIVITIES
Third party energy marketing and energy trading activities, comprising both third party crude oil marketing, as well as financial and physical derivatives trading activities, resulted in a net loss of $2 million in 2003 compared to net earnings of $3 million in 2002. After-tax losses in energy trading activities during 2003 more than offset after-tax earnings from marketing activities. As energy trading activities commenced in late 2002, they did not have a significant impact on 2002’s financial results.
Energy trading activities by their nature can result in volatile and large fluctuations in earnings, both positive and negative. Prior to commencing the energy trading activities, a separate risk management function was set up to review and monitor practices and policies and provide independent verification and valuation of these activities.
TAX ADJUSTMENTS
EM&R 2003 net earnings included a $12 million future income tax charge, due to the repeal of previously announced reductions in income tax rates by the Ontario provincial government.
NET CASH SURPLUS ANALYSIS
EM&R’s net cash surplus decreased to $29 million in 2003 from $63 million in 2002. Cash flow from operations increased to $164 million in 2003 from $112 million in 2002. Working capital was unchanged in 2003, compared to an increase of $15 million in 2002, resulting in a year-over-year working capital improvement of $15 million.
The favourable impacts of the increased cash flow from operations and working capital were more than offset by an increase in cash used in investing activities, which increased to $135 million compared to $34 million in 2002. The increase primarily reflects capital expenditures associated with gasoline and diesel desulphurization projects at the Sarnia refinery, and the impact in 2002 of $62 million in proceeds received from the sale of the retail natural gas marketing business.
46
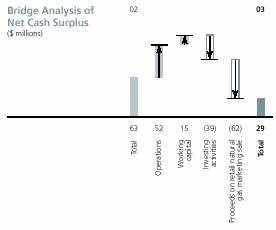
OUTLOOK
In October 2003, Suncor and Shell Canada Products entered into an agreement under which EM&R’s Sarnia refinery will process high sulphur diesel from Shell’s Sarnia refinery into low sulphur diesel, on a fee-for-service basis. The 20-year agreement is expected to enable both companies to meet federal regulations for on-road ultra low sulphur diesel fuel that take effect June 1, 2006. Operating a single hydrotreating unit, instead of two separate units, is expected to result in cost synergies to Suncor and Shell and environmental benefits for the Sarnia-Lambton community as one larger unit is expected to consume comparatively less energy and have lower greenhouse gas emissions. Engineering and construction details of the new facilities are in development. Construction of the facility is still subject to regulatory approval.
The project is expected to be completed in early 2006. Currently estimated to cost $300 million, the project is subject to change as detailed engineering is completed. In Suncor’s 2002 Annual Report, the company originally estimated it would cost $225 million to meet diesel desulphurization regulations. The estimate increased after Suncor reached an agreement with Shell and the project scope was expanded to accommodate the higher capacity.
In combination with the diesel desulphurization project, Suncor is currently assessing plans to modify the Sarnia refinery to permit the processing of additional Oil Sands crude oil. These modifications, as currently envisioned, are expected to increase refinery production capacity by about 10%, and make the refinery more competitive through lower feedstock costs over the long term. This cost estimate is based on preliminary scope and engineering, actual amounts may differ and the difference may be material.
Suncor is continuing to review the feasibility of a proposed ethanol plant in the Sarnia region. The proposed plant would produce approximately 200 million litres of ethanol annually for blending in Suncor’s Sunoco-branded fuels and fuels sold through its joint venture operated networks. The cost of constructing the facility is currently estimated to be $120 million. In February 2004, Suncor announced its proposal for funding was approved by the federal government’s Ethanol Expansion Program. Subject to final approvals, Suncor will receive a $22 million contribution towards the construction of an ethanol production facility. There are certain performance requirements that will determine if any of these funds need to be repaid.
Cost estimates are, by their nature, uncertain and can be subject to wide variances as engineering is developed and as construction progresses. Estimates are subject to revisions, which may be material.
RISK/SUCCESS FACTORS AFFECTING PERFORMANCE
Certain issues Suncor must manage that may affect performance of the EM&R business include, but are not limited to, the following:
• Management expects that fluctuations in demand for refined products, margin and price volatility, and market competition, including potential new market entrants, will continue to impact the business environment.
• There are certain risks associated with the execution of capital projects, including the risk of cost overruns. The diesel desulphurization project must be completed prior to June 1, 2006, to ensure compliance with the legislative requirements. Numerous risks and uncertainties can affect construction schedules, including the availability of labour and other impacts of competing projects drawing on the same resources during the same time period.
• Environment Canada is expected to finalize regulations reducing sulphur in off-road diesel fuel and light fuel oil to take effect later in the decade. Suncor believes that if the regulations are finalized as currently proposed, the new facilities for reducing sulphur in on-road diesel fuel should also allow the company to meet the requirements for reducing sulphur in off-road diesel and light fuel oil.
For a discussion of other risks, assumptions and uncertainties, refer to Suncor Overview, Risk/Success Factors Affecting Performance on page 24.
47
Refining and Marketing – U.S.A.
In August 2003, Suncor acquired its first U.S. refining and marketing business. This acquisition is part of an integration strategy aimed at improving access to the North American energy markets through acquisitions, long-term contracts and possible joint ventures.
R&M’s strategy is focused on:
• Enhancing the profitability of refining operations by improving reliability, product yields and operational flexibility to process a variety of feedstocks, including crude oil streams from Oil Sands operations.
• Creating additional downstream integration opportunities in the United States to capture greater long-term value from Oil Sands production.
Highlights
SUMMARY OF RESULTS
Five-month period ended December 31
(Cdn$ millions unless otherwise noted) |
| 2003 |
|
Revenue |
| 515 |
|
Refined product sales (millions of litres) |
|
|
|
Gasoline |
| 636 |
|
Total |
| 1 384 |
|
Net earnings |
| 18 |
|
Cash flow from operations |
| 34 |
|
Investing activities |
| 300 |
|
Net cash surplus (deficiency) |
| (220 | ) |
Assets include:
• A 60,000 bpd (approximately 9,500 cubic metres per day) capacity refinery located in the Denver, Colorado area.
• A 100% interest in the 480-kilometre Rocky Mountain pipeline system.
• A 65% interest in the 140-kilometre Centennial pipeline system.
• 43 Phillips 66-branded retail stations, primarily in the Denver, Colorado area.
ANALYSIS OF NET EARNINGS
Net earnings for the period from August 1, 2003, through December 31, 2003, were $18 million, including after-tax transition and start-up costs of approximately $4 million. Net earnings reflect average refining margins of 5.9 cpl, retail margins of 5.6 cpl and a refinery utilization rate of 98%. Net earnings in 2003 reflect the five-month period since the acquisition and are not necessarily indicative of the expected results of operations for a full year. The profitability of R&M is expected to vary throughout the year due to the seasonal nature of vehicle fuel and asphalt sales and the logistics of moving product into and out of Colorado. As a result, summer months are typically expected to be more profitable than winter months.
EXPENSES
Expenses of $484 million for 2003 were primarily driven by crude oil purchases of $342 million. The refinery relies on a mixture of heavy high sulphur and light low sulphur crude oil feedstocks from both Canadian and U.S. sources. Currently, only a small portion of R&M’s crude slate comes from Suncor’s Oil Sands operation. Other expenses included excise taxes, DD&A and selling, general and administrative costs.
NET CASH DEFICIENCY ANALYSIS
Cash flow from operations was $34 million, reflecting earnings generated in five months of operation, which are not necessarily indicative of the cash flow from operations to be expected for a full year. Working capital was $46 million reflecting R&M’s net liabilities balance at year-end, driven primarily by accrued liabilities for crude oil purchases and other accounts payable, partially offset by accounts receivable and inventory balances. Future working capital requirements will be assessed as R&M’s business strategy is more fully developed.
Cash used in investing activities was $300 million, primarily relating to costs associated with the acquisition of the business. This total includes $28 million of
48
expenditures reflecting transitional infrastructure costs and sustaining capital outlays, including expenditures related to meeting legislated limits for sulphur content in gasoline and diesel fuels.
Combined, the above factors resulted in a net cash deficiency of $220 million.
OUTLOOK
Based on preliminary engineering, R&M estimates it will spend approximately $250 million to $325 million (US$175 million to US$225 million) between 2003 and 2006 to meet fuels desulphurization legislation and to enable the refinery to integrate about 20,000 bpd of Oil Sands crude oil blends, with up to 15,000 bpd of Oil Sands sour crude. This cost estimate is based on preliminary scope and engineering. Actual amounts will differ and the differences may be material.
Suncor is currently assessing its plans for potential additional refinery modifications post-2006 in order to have the potential to integrate up to an additional 30,000 bpd of Oil Sands crude oil, including additional barrels of Oil Sands sour crude oil. Cost estimates for this project are not yet available.
In early March 2004, scheduled maintenance is planned for pipeline and refinery equipment. During this estimated 10-day maintenance period there will be minimal production. Customer requirements are expected to be met from inventory and third party purchases and exchanges.
R&M expects to spend an additional $35 million to $45 million (US$25 million to US$30 million) by 2006 to meet existing obligations between the refinery and the United States Environmental Protection Agency and the State of Colorado. The expenditures, intended to improve environmental performance, are currently expected to be primarily capital.
With the R&M acquisition, Suncor assumed a work force of approximately 585 employees, including about 300 retail employees. Suncor also assumed the existing contract with the local Paper, Allied-Industrial Chemical and Energy Workers International Union, which applies to hourly wage employees at the refinery. This four-year contract will expire in January 2006.
As part of its transition to operations in Colorado, Suncor has initiated a strategic marketing review to develop an integrated marketing plan for R&M. This work is expected to be completed in 2004.
RISK/SUCCESS FACTORS AFFECTING PERFORMANCE
Certain issues Suncor must manage that may affect performance of the R&M business include, but are not limited to, the following:
• Management expects continuing fluctuations in demand for refined products, margin and price volatility and market competitiveness, including potential new market entrants, will continue to impact the business.
• There are certain risks associated with the execution of the fuels desulphurization project, including ensuring construction and commissioning is completed in time to comply with the June 1, 2006 legislative requirements. Numerous risks and uncertainties can affect construction schedules, including the availability of labour and other impacts of competing projects drawing on the same resources during the same time period. As well, Suncor’s U.S. capital projects are expected to be partially funded from Canadian operations. A weaker Canadian dollar would result in a higher funding requirement for U.S. capital programs.
For a discussion of other risks, assumptions and uncertainties, refer to Suncor Overview, Risk/Success Factors Affecting Performance on page 24.
49
Non-GAAP Financial Measures
Certain financial measures referred to in this MD&A are not prescribed by GAAP. These non-GAAP financial measures do not have any standardized meaning and therefore are unlikely to be comparable to similar measures presented by other companies. Suncor includes cash flow from operations (dollars and per share amounts), ROCE, and operating costs per barrel data because investors may use this information to analyze operating performance, leverage and liquidity. The additional information should not be considered in isolation or as a substitute for measures of performance prepared in accordance with GAAP.
CASH FLOW FROM OPERATIONS PER COMMON SHARE
Cash flow from operations is expressed before changes in non-cash working capital. A reconciliation of net earnings to cash flow from operations is provided in the schedules of segmented data, which are an integral part of Suncor’s consolidated financial statements.
For the year ended December 31 |
|
|
| 2003 |
| 2002 |
| 2001 |
|
Cash flow from operations ($ millions) |
| A |
| 2 081 |
| 1 440 |
| 831 |
|
Dividends paid on Preferred Securities ($ millions, pretax) |
| B |
| 45 |
| 48 |
| 48 |
|
Weighted average number of common shares outstanding (millions of shares) |
| C |
| 449.8 |
| 447.8 |
| 445.0 |
|
Cash flow from operations (per share) |
| A/C |
| 4.63 |
| 3.22 |
| 1.87 |
|
Dividends paid on Preferred Securities (pretax, per share) |
| B/C |
| 0.10 |
| 0.11 |
| 0.11 |
|
Cash flow from operations after deducting dividends paid on Preferred Securities (per share) |
| (A-B)/C |
| 4.53 |
| 3.11 |
| 1.76 |
|
|
|
|
|
|
|
|
|
|
|
ROCE |
|
|
|
|
|
|
|
|
|
|
|
|
|
|
|
|
|
|
|
For the year ended December 31 ($ millions, except ROCE) |
|
|
| 2003 |
| 2002 |
| 2001 |
|
Adjusted net earnings |
|
|
|
|
|
|
|
|
|
Net earnings |
|
|
| 1 084 |
| 761 |
| 388 |
|
Add: after-tax financing expenses (income) |
|
|
| (75 | ) | 72 |
| 9 |
|
|
| D |
| 1 009 |
| 833 |
| 397 |
|
Capital employed – beginning of year |
|
|
|
|
|
|
|
|
|
Short-term and long-term debt, less cash and cash equivalents |
|
|
| 2 671 |
| 3 143 |
| 2 235 |
|
Shareholders’ equity |
|
|
| 3 458 |
| 2 780 |
| 2 472 |
|
|
|
|
| 6 129 |
| 5 923 |
| 4 707 |
|
Less capitalized costs related to major projects in progress (1) |
|
|
| (511 | ) | (178 | ) | (2 497 | ) |
|
| E |
| 5 618 |
| 5 745 |
| 2 210 |
|
Capital employed – end of year |
|
|
|
|
|
|
|
|
|
Short-term and long-term debt, less cash and cash equivalents |
|
|
| 2 091 |
| 2 671 |
| 3 143 |
|
Shareholders’ equity |
|
|
| 4 425 |
| 3 458 |
| 2 780 |
|
|
|
|
| 6 516 |
| 6 129 |
| 5 923 |
|
Less capitalized costs related to major projects in progress |
|
|
| (1 122 | ) | (511 | ) | (3 691 | ) |
|
| F |
| 5 394 |
| 5 618 |
| 2.232 |
|
Average capital employed |
| G=(E+F)/2 |
| 5 506 |
| 5 682 |
| 2 221 |
|
ROCE (%) |
| D/G |
| 18.3 |
| 14.6 |
| 17.8 |
|
(1) During 2001, Millennium was a significant major project in progress throughout the year that was commissioned late in December. As such, Millennium work in progress was included as a reduction of the capital employed at the end of the year for 2001, but excluded as a reduction of the 2002 capital employed at the beginning of the year.
50
OIL SANDS OPERATING COSTS
|
| 2003 |
| 2002 |
| 2001 |
| ||||||
For the year ended December 31 |
| $ millions |
| $/barrel |
| $ millions |
| $/barrel |
| $ millions |
| $/barrel |
|
Operating, selling and general expenses |
| 890 |
|
|
| 806 |
|
|
| 481 |
|
|
|
Less: natural gas costs and inventory changes |
| (176 | ) |
|
| (116 | ) |
|
| (94 | ) |
|
|
Taxes other than income taxes |
| 24 |
|
|
| 23 |
|
|
| 12 |
|
|
|
Cash costs |
| 738 |
| 9.30 |
| 713 |
| 9.50 |
| 399 |
| 8.80 |
|
Natural gas |
| 169 |
| 2.15 |
| 119 |
| 1.55 |
| 101 |
| 2.25 |
|
Imported bitumen (net of other reported product purchases) |
| 4 |
| 0.05 |
| 3 |
| 0.05 |
| 3 |
| 0.05 |
|
Cash operating costs |
| 911 |
| 11.50 |
| 835 |
| 11.10 |
| 503 |
| 11.10 |
|
Depreciation, depletion and amortization |
| 451 |
| 5.70 |
| 450 |
| 6.00 |
| 233 |
| 5.15 |
|
Total operating costs |
| 1 362 |
| 17.20 |
| 1 285 |
| 17.10 |
| 736 |
| 16.25 |
|
Production (thousands of barrels per day) |
| 216.6 |
| 205.8 |
| 123.2 |
| ||||||
FORWARD-LOOKING STATEMENTS
This Management’s Discussion and Analysis contains certain forward-looking statements that are based on Suncor’s current expectations, estimates, projections and assumptions that were made by the company in light of its experience and its perception of historical trends.
All statements that address expectations or projections about the future, including statements about Suncor’s strategy for growth, expected and future expenditures, commodity prices, costs, schedules, production volumes, operating and financial results and expected impact of future commitments, are forward-looking statements. Some of the forward-looking statements may be identified by words like “expects,” “anticipates,” “plans,” “intends,” “believes,” “projects,” “indicates,” “could,” “vision,” “goal,” “target,” “objective” and similar expressions. These statements are not guarantees of future performance and involve a number of risks and uncertainties, some that are similar to other oil and gas companies and some that are unique to Suncor. Suncor’s actual results may differ materially from those expressed or implied by its forward-looking statements and readers are cautioned not to place undue reliance on them.
The risks, uncertainties and other factors that could influence actual results include but are not limited to: changes in the general economic, market and business conditions; fluctuations in supply and demand for Suncor’s products, commodity prices and currency exchange rates; Suncor’s ability to respond to changing markets and to receive timely regulatory approvals; the successful and timely implementation of capital projects including growth projects (for example the Firebag in-situ development and Voyageur) and regulatory projects (for example, the clean fuels refinery modifications projects in Suncor’s downstream businesses); the accuracy of cost estimates, some of which are provided at the conceptual or other preliminary stage of projects and prior to commencement or conception of the detailed engineering needed to reduce the margin of error or level of accuracy; the integrity and reliability of Suncor’s capital assets; the cumulative impact of other resource development; future environmental laws; the accuracy of Suncor’s reserve, resource and future production estimates and its success at exploration and development drilling and related activities; the maintenance of satisfactory relationships with unions, employee associations and joint venture partners; competitive actions of other companies, including increased competition from other oil and gas companies or from companies that provide alternative sources of energy; the uncertainties resulting from potential delays or changes in plans with respect to projects or capital expenditures; actions by governmental authorities including the imposition of taxes or changes to fees and royalties, changes in environmental and other regulations; the ability and willingness of parties with whom Suncor has material relationships to perform their obligations to Suncor; and the occurrence of unexpected events such as fires, blowouts, freeze-ups, equipment failures and other similar events affecting Suncor or other parties whose operations or assets directly or indirectly affect Suncor. The foregoing important factors are not exhaustive. Many of these risk factors are discussed in further detail throughout this Management’s Discussion and Analysis and in the company’s Annual Information Form/Form 40-F on file with Canadian Securities Commissions and the SEC. Readers are also referred to the risk factors described in other documents that Suncor files from time to time with securities regulatory authorities. Copies of these documents are available without charge from the company.
51