QuickLinks -- Click here to rapidly navigate through this document
EXHIBIT 99.1
Suncor Energy Inc. 2017 Annual Report to Shareholders for the period ended
December 31, 2017
| | ||
 ANNUAL REPORT 2017 Suncor Energy Inc. |  | |
| |

CONTENTS
| 2 | The Suncor Advantage | |
| 4 | Message to Shareholders | |
| 9 | 2018 Corporate Guidance | |
| 10 | Advisories | |
| 14 | Management's Discussion and Analysis | |
| 77 | Management's Statement of Responsibility for Financial Reporting | |
| 78 | Management's Report on Internal Control over Financial Reporting | |
| 79 | Independent Auditor's Report | |
| 81 | Audited Consolidated Financial Statements and Notes | |
| 132 | Supplemental Financial and Operating Information | |
| 156 | Share Trading Information | |
| 157 | Leadership and Board Members |
| Production(mboe/d) | Funds Flow ($ millions) | |
 |  | |
Earnings($ millions) | Return on Capital Employed(%) | |
 | 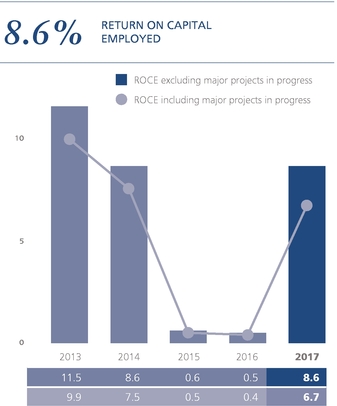 |
This Annual Report contains forward-looking statements based on Suncor's current expectations, estimates, projections and assumptions, as well as certain financial measures, namely operating earnings (loss), funds from operations, return on capital employed (ROCE), Oil Sands operations cash operating costs, Syncrude cash operating costs, Exploration and Production cash operating costs, Fort Hills cash operating costs and discretionary free funds flow, that are not prescribed by generally accepted accounting principles (GAAP). Refer to the Advisories section of this Annual Report and Suncor's Management's Discussion and Analysis dated March 1, 2018 (MD&A).
2017 ANNUAL REPORT Suncor Energy Inc. 1
Suncor's long-life, low-decline asset base, strong balance sheet, integrated model and cash flow diversification sets us apart from our peers. We strive to be the low-cost and low-carbon competitor in our sector. Capitalizing on key differentiators, including our expertise and focus on sustainable development and technology, has contributed to our industry-leading position and provided the foundation for delivering long-term value for shareholders.

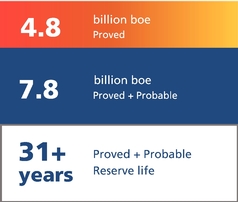
LONG-LIFE, LOW-DECLINE RESERVES BASE
We are working to unlock maximum value from our extensive resources through a continued focus on responsible development and cost discipline.
For more information on our reserves base, refer to our Annual Information Form dated March 1, 2018.
SUSTAINABLE DEVELOPMENT AND TECHNOLOGY
We are focused on being a low-cost, low-carbon producer and demonstrating leadership in environmental performance and social responsibility, while contributing to a strong economy.
Technology: Suncor is targeting cost reductions and improvements in greenhouse gas emissions, land and water use through technology development. Enhanced Solvent Extraction Incorporating Electromagnetic Heating (ESEIEH) and NSolvTM are aimed at reducing natural gas and water consumption at In Situ, and autonomous haul systems are expected to drive efficiency and safety improvements in oil sands mining.
Community: In 2017, Suncor completed the sale of a 49% interest in the East Tank Farm Development to the Fort McKay and Mikisew Cree First Nations for proceeds of approximately $503 million. This was the largest business investment to date by a First Nation entity in Canada, and demonstrates our commitment to working with the community on sustainable resource development. Since 1999, Suncor has spent approximately $3.9 billion with Aboriginal businesses (as direct contractors and subcontractors), nearly half of which has been spent since 2013.
Reclamation: Suncor was the first oil sands company to reclaim a tailings pond, with Wapisiw Lookout, and marked a milestone in reclamation with the opening of the Nikanotee Fen, one of the first reclaimed fen wetland watersheds in the world. In 2017, the Alberta Energy Regulator approved Suncor's Base plant tailings management plan, which will reduce fluid tailings inventory and decrease the overall number of tailings ponds on-site.
HIGHLIGHTS

For more information on our sustainable development, refer to Suncor's 2017 Report on Sustainability.
2 2017 ANNUAL REPORT Suncor Energy Inc.
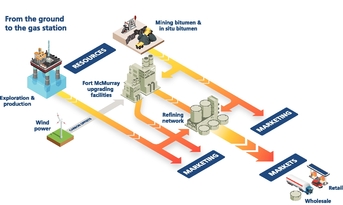
A PROVEN INTEGRATED MODEL
From the ground to the gas station, we optimize profits through each link in the value chain. Our highly efficient, integrated model limits Suncor's exposure to heavy crude differentials, with approximately 80% of bitumen production being upgraded to higher priced light oil or refined products. In addition, our offshore business provides geographic and cash flow diversification.
Midstream assets provide operational flexibility through the expansion of pipeline storage capacity and access to new international markets.

FINANCIAL STRENGTH
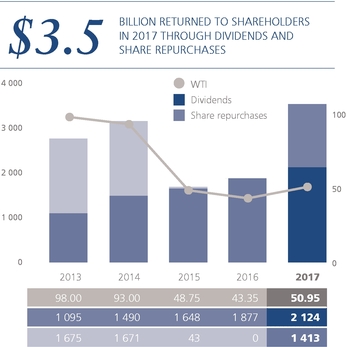
We aim to deliver competitive and sustainable returns to our shareholders by focusing on capital discipline, operational excellence and long-term profitable growth. Our strong balance sheet provides the foundation to increase returns and value to shareholders through consistent dividend growth, with 2017 marking the fifteenth consecutive year Suncor's annual dividend has increased, and share repurchases recommencing.
![]()
| Dividend Growth | Funds from Operations($ millions) | |
 |  |
2017 ANNUAL REPORT Suncor Energy Inc. 3
"There's no doubt Canada's energy industry has been tested by the "lower for longer" oil price environment of the past three years. For Suncor, however, this period proved to be not just a challenge, but an opportunity. With our integrated business model, strong balance sheet and our focus on capital discipline and operational excellence, Suncor has emerged stronger than ever. As a result, we are now well positioned to continue to grow the company – safely, reliably and profitably – for many years to come."
STEVE WILLIAMS

We have been on a multi-year path to improve reliability, reduce costs across our business and more prudently manage capital allocation. This journey began well before the oil price downturn, but has served us well through volatile times. While many competitors retreated or withdrew, we grew production, reduced costs, increased returns to shareholders by increasing dividends and buying shares back, all while maintaining a strong balance sheet.
Through it all, we stayed true to another key part of our business strategy – being a leader in sustainability. We understand that the economic, environmental and social dimensions of energy development are deeply integrated and success in one cannot be achieved without success in all.
By outperforming our peer group through a very challenging price cycle, we've earned investors' confidence. We're also proving that our oil sands business can be cost and increasingly carbon competitive on a global basis, underscoring our aspiration to be a long-term energy provider of choice.
As we marked our 50th year in the oil sands in 2017, it seemed fitting that Suncor started production at the Fort Hills project, which is poised to provide energy – and returns for investors – for the next 50 years. With another major growth project, Hebron, achieving first oil in 2017, we have further reason to look forward with a sense of confidence and optimism.
4 2017 ANNUAL REPORT Suncor Energy Inc.

2017: STRENGTH THROUGH INTEGRATION
Through another volatile year for the global energy industry, Suncor continued to grow and create shareholder value.
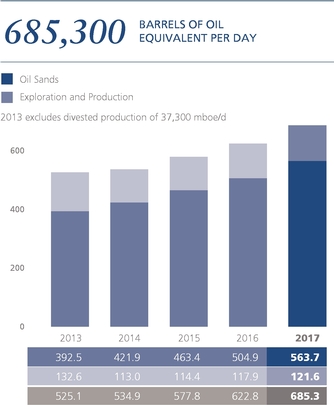
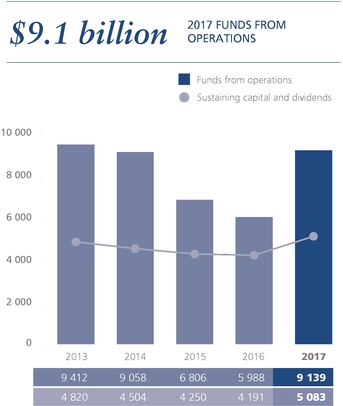
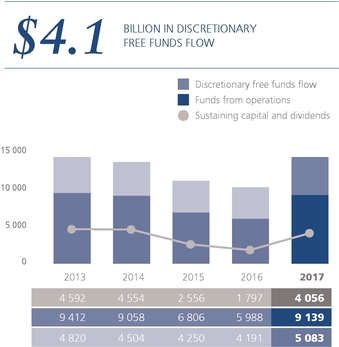
Suncor's total upstream production was 685,300 barrels of oil equivalent per day (boe/d), a 10% increase from 2016. We generated $9.1 billion in funds from operations, easily covering our sustaining capital and dividend requirement of $5.1 billion, while still leaving some $4.1 billion in discretionary free funds flow.

We also strengthened our balance sheet in 2017 through the early repayment of long-term debt. Our net debt to funds flow decreased to less than two times, while our debt to capitalization fell to 25.6%. We will continue to manage the balance sheet conservatively as a strategic asset.
We saw record Oil Sands production in 2017 while also realizing the lowest Oil Sands operations cash operating costs in a decade – $23.80 per barrel (which is less than $US18.35 per barrel), a 10% reduction from 2016.
Exploration and Production (E&P) cash operating costs declined by 14%, with average operating costs below $11.50 per barrel on the East Coast and $5.00 in the North Sea – again, that's in Canadian dollars.
The bulk of the cost savings came from productivity improvements and streamlined operations. The bottom line is: we're focused on moving the entire company towards a sustainably lower cost base, while continuing to grow production.
Diversification of cash flow is important. E&P remained a reliable and highly profitable source of low-cost oil production and cash flow. In addition, our downstream refinery utilization rates continued to exceed industry averages. In fact, in a year when many expected refining and marketing results to decline, Suncor's downstream operations generated increased earnings and funds flow.
Taken together, these results again demonstrated the value of Suncor's integrated business model. We are one of very few energy companies to operate across the value chain, including resource extraction, upgrading, refining and marketing, as well as midstream logistics. In 2017, this model continued to help us mitigate the impact of crude price differentials, generate profit to grow the company and return value to shareholders.
We've further strengthened our business through a series of strategic and counter-cyclical divestments and acquisitions.
In 2017, we completed the sale of our Petro-Canada lubricants business and sold a combined 49% interest in our East Tank Farm Development to two First Nations partners. This followed moves in 2015 and 2016 to advantageously expand investment in our core business during a lower price environment by acquiring an additional 10% working interest in Fort Hills and increasing our ownership in Syncrude to a 54% majority position.
Positive trend lines
Suncor's strong performance in 2017 is particularly encouraging in the context of what we've achieved during a very challenging time for our industry. Our growth, cash generation and balance sheet stand out when compared to industry peers.
One key to our strong performance has been our disciplined cost management over the past few years. In 2017, Suncor's total operating, selling and general expenses were below 2014 levels, even as we grew production by almost 30% over the same period.
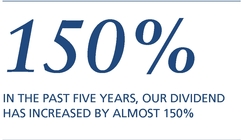
Our strong funds flow generation allowed us to continue to increase returns to shareholders. Suncor's annual dividend increased for the 15th consecutive year in 2017; in the past five years alone, our dividend has increased by almost 150%. We also repurchased and cancelled approximately 2% of outstanding shares in 2017.
Suncor's position on dividends and share repurchases remains clear and consistent. We are committed to a competitive, sustainable dividend that will grow in line with the structural growth of our free funds flow – and we will continue to return cash to shareholders through opportunistic repurchases, acting when market conditions are favourable.
Managing profitable growth
In a period when many companies in our sector were forced to shelve growth plans
2017 ANNUAL REPORT Suncor Energy Inc. 5
because of low oil prices, Suncor completed two major growth projects – Fort Hills and
Hebron.
At Fort Hills, we conducted carefully staged test runs in 2017 to de-risk production ramp up. By the end of 2018, we expect to achieve 90% of the planned production capacity of 194,000 barrels per day (bbls/d). One of the best oil sands mining assets in the region, Fort Hills is poised to generate substantial profitability and shareholder returns for decades to come.
Production also commenced ahead of schedule at Hebron, off Canada's east coast. At peak capacity, Hebron is expected to produce more than 30,000 bbls/d of low-cost oil net to Suncor.
Syncrude: setbacks and synergies
The road towards operational excellence comes with its share of bends and curves. Planned and unplanned outages at Syncrude reduced Suncor's share of production by over 100,000 bbls/d in the second quarter of 2017.
This outage only furthered our collective resolve to continue working together with the operator and the other owners to continue to improve the reliability of the Syncrude assets. These efforts are already paying off with stronger performance at the asset in the latter two quarters of the year. I'm confident we can achieve our targets of driving utilization rates above 90% and Syncrude cash operating costs below $30 per barrel by 2020.
One of the reasons for acquiring a majority interest in Syncrude was to tap into synergies of core assets in close geographic proximity and apply our oil sands expertise to improve reliability, drive down costs and add value for our shareholders. I'm firmly convinced we will do just that.
Market access
Suncor welcomed the approval of new key pipeline expansions in 2017. We continue to support other safe and environmentally sound pipeline options to move Canadian oil and refined products around the world.
Pipelines are critical infrastructure and while Suncor currently has adequate pipeline capacity for our production, including Fort Hills volumes, we believe market access is in the national interest. In a resource-based economy like Canada's, we need to ensure we are getting full value for our production to enable investment in jobs, education, health care and improving our environmental performance.

LOOKING AHEAD: AN OIL SANDS ADVANTAGE
I've been interested to read recent market commentary suggesting investors increasingly want companies to live within their means and focus on returns rather than just growth. This is an approach Suncor embraced during the high oil price environment of 2011 to 2014, when others were making unsustainable spending decisions and leveraging up. We believed it prudent to prepare financially for the inevitable downturn in prices and the profitable growth opportunities that would emerge.
What's been reinforced in the intervening years is that strong capital discipline and cost management actually enable sustainable and profitable growth, rather than limit it. With both Fort Hills and Hebron now in production, we are planning to reduce capital spending for 2018 by as much as $1.0 billion as compared to 2017, while still increasing production by more than 10%.
Suncor's 2018 capital spending program is largely focused on sustaining capital, given major planned maintenance and the need to invest in safe, reliable and efficient operations. But going forward, we also have a wealth of growth opportunities, many organic in nature. These range from near-term integration projects at our oil sands assets and step-out production opportunities in the offshore, to greenfield developments like the Lewis and Meadow Creek in situ projects and Rosebank in the U.K. North Sea.
We know the main focus for the next phase of growth will be our in situ sites. Suncor was the first energy company to receive approval for multiple in situ developments under a streamlined trial regulatory submission process that reduces delays and provides greater certainty for applicants and stakeholders alike. We are now better positioned to reliably grow production while meeting or exceeding the environmental standards set by regulators.
It's important to note that new and future growth projects promise to be more competitive, both in terms of economics and environmental performance. For example, on a well-to-tank basis, the greenhouse gas (GHG) emissions intensity of production at Fort Hills is expected to be about 4% lower than the North American average. Similarly, next-generation in situ technologies have the potential to not only reduce costs, but also dramatically lower the carbon footprint of in situ production.
We've already seen what taking costs out of the business and improving operational reliability can achieve. Suncor is now at a point where we can generate sufficient funds from operations at a US$40 to $45 per barrel oil price to cover our sustaining capital and our dividend. There aren't many companies globally that can make that claim.
Put that together with step-change improvements in environmental performance and you can see the outlines of what I'd call an oil sands advantage – a low-decline, long-life reserve base that, far from generating marginal barrels, is globally competitive on both cost and carbon.
To fully realize that advantage, we will need to maintain an unwavering focus on what we can control, including capital discipline, cost management, operational excellence and sustainability.
6 2017 ANNUAL REPORT Suncor Energy Inc.

SUSTAINABILITY: THE TIE THAT BINDS
Suncor has been an industry leader in sustainability for two decades. Going forward, our commitment to continually improve our environmental, social and economic performance will be more critical than ever. As the world transitions to a low-carbon economy, we intend to be a progressive, cost-efficient and carbon-competitive energy provider of choice.
Climate Change
Climate change is one of the defining challenges of our time and, as a company, we are moving forward on several fronts – both internally and externally – to tackle this challenge head-on.
Suncor is pursuing an ambitious sustainability goal to reduce the GHG emissions intensity of our oil and petroleum production by 30% by 2030. We believe this target, together with our ongoing commitment to technology and innovation, puts us on the path to ultimately bending the curve on our absolute GHG emissions as well.

In 2017, we released our first stand-alone climate report, representing a transparent disclosure on why we believe our strategy is resilient through a range of forward-looking scenarios – all of them transitioning to a lower carbon future.
Suncor continues to support climate change policy that encourages improved performance while preserving the competitiveness of the Canadian energy sector. We also continue to work collaboratively with organizations like the Carbon Pricing Leadership Coalition, Ecofiscal Commission and Energy Futures Lab to support an effective and efficient transition to a lower-carbon economy.
Technology
Throughout the recent oil price downturn, Suncor continued to invest approximately $200 million annually on technology development and, in 2017, we also invested almost $350 million on development and deployment of new technology. That's because technology is key to achieving our climate change strategies as well as other environmental and cost-reduction goals.

Our technology strategy includes investments in next-generation in situ extraction processes that could dramatically reduce water and energy requirements, costs and GHG emissions. We're currently evaluating the potential to advance these in situ technologies at commercial scale. In 2018, we're also preparing to deploy new commercially ready technology designed to advance tailings reclamation.
Suncor continues to collaborate with peer companies and external partners through organizations like Canada's Oil Sands Innovation Alliance (COSIA) and Evok Innovations on clean technology solutions that will help us thrive in tomorrow's economy. One example is Evok-funded HARBO Technologies which is the world's smallest and lightest containment system for marine oil spills. The system can be stored onboard vessels and if needed rapidly deploy boom material to prevent marine oil spills from spreading.
Aboriginal Partnerships
Suncor's socially-focused sustainability goal targets the increased participation of Canada's Aboriginal Peoples in resource development. It's about changing the way we think and act – and working with Aboriginal Peoples to create opportunities for economic and social reconciliation.
We took a significant step forward in 2017 when the Fort McKay and Mikisew Cree First Nations completed an acquisition of a 49% partnership interest in Suncor's East Tank Farm Development – the largest business investment to date by a First Nation entity in Canada. 2017 also saw Suncor purchase a 41% equity interest in PetroNor, a Quebec-based petroleum products distributor owned and operated by the James Bay Cree.
Recognizing Suncor's efforts, the Canadian Council of Aboriginal Business (CCAB) certified the company in 2017 at gold-level status in the CCAB's Progressive Aboriginal Relations (PAR) program. While honoured by this recognition, we also know there is much more work to be done to earn the trust and support of Aboriginal Peoples and communities.
2017 ANNUAL REPORT Suncor Energy Inc. 7
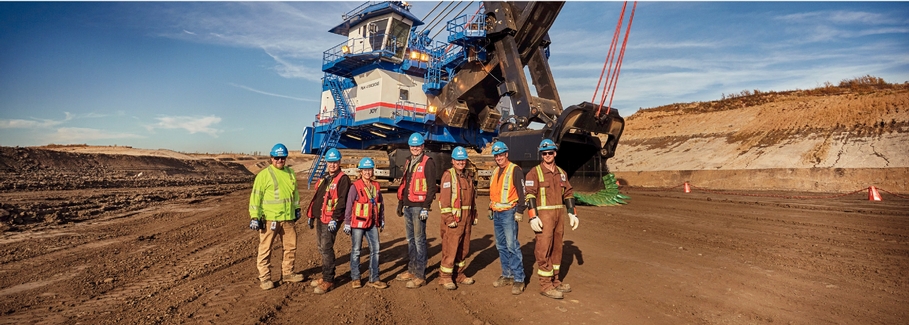
THE SUNCOR TEAM
Suncor's success through a challenging oil price cycle is rooted in the hard work, talent and ingenuity of Suncor's employees. We are also indebted to our Board of Directors, whose wise guidance keeps us strategically focused on long-term objectives.
We lost a titan in our industry in 2017 with the passing of Rick George, who served for 21 years as Suncor's chief executive officer. Rick helped transform Suncor from a struggling oil sands pioneer into Canada's largest integrated energy company. He guided the company in adopting game-changing technologies to improve environmental performance, profitability and competitiveness.
Rick was instrumental in bringing me to Suncor and I quickly came to share his passion for the oil sands. He understood that progress in this industry is about having a laser focus on tomorrow's challenges and opportunities.
Keeping with that Suncor tradition, we made two key executive leadership changes in 2017 that I believe will serve us well going forward. Mark Little, formerly President, Upstream, was appointed Chief Operating Officer. Eric Axford, formerly Executive Vice President (EVP), Business Services, became EVP and Chief Sustainability Officer. In their respective positions, Mark and Eric will help ensure Suncor continues to lead in operational excellence and sustainable energy development.
As we move forward, one value will continue to stand above all the rest – safety first. Suncor is committed to eliminating all workplace injuries, a goal reflected in our Journey to Zero safety program. While we continued to reduce lost time injuries and recordable injury frequencies across the company in 2017, we won't rest until that number reaches and remains at zero.
Regardless of where commodity prices go from here, Suncor plans to continue to allocate capital in a disciplined manner, reduce operational costs and demonstrate that we can be globally cost and increasingly carbon competitive. In so doing, we believe we will provide the increasing returns shareholders have come to expect from us while delivering the energy the world needs.
![]()
Steve Williams
President and Chief Executive Officer
8 2017 ANNUAL REPORT Suncor Energy Inc.
The following table highlights forecasts from Suncor's 2018 Full Year Outlook and actual results for the year ended December 31, 2017. For further details regarding Suncor's 2018 Full Year Outlook including certain assumptions, see www.suncor.com/guidance. See also the Advisories section of this Annual Report.
| 2017 Full year outlook October 25, 2017 | Actual year ended December 31, 2017 | 2018 Full year outlook February 7, 2018 | |||
| Oil Sands operations (bbls/d) | 420,000 – 450,000 | 429,400 | 425,000 – 455,000 | ||
| Fort Hills (bbls/d) | — | — | 50,000 – 60,000 | ||
| Syncrude (bbls/d) | 130,000 – 145,000 | 134,300 | 150,000 – 165,000 | ||
| Exploration and Production (boe/d) | 115,000 – 125,000 | 121,600 | 105,000 – 115,000 | ||
Total production (boe/d)(1) | 680,000 – 720,000 | 685,300 | 740,000 – 780,000 | ||
Oil Sands operations cash operating costs ($/bbl) | $23.00 – $26.00 | $23.80 | $23.00 – $26.00 | ||
| Fort Hills cash operating costs(2) ($/bbl) | $— | $— | $35.00 – $40.00 | ||
| Syncrude cash operating costs ($/bbl) | $42.00 – $45.00 | $44.05 | $32.50 – $35.50 | ||
| Refinery utilization(3) | 92% – 96% | 96% | 90% – 94% | ||
- (1)
- At the time of publication, production in Libya continues to be affected by political unrest and, therefore, no forward-looking production for Libya is factored into the Exploration and Production and Suncor Total Production guidance. Production ranges for Oil Sands operations, Fort Hills, Syncrude and Exploration and Production are not intended to add to equal Suncor Total Production.
- (2)
- Suncor's outlook for 2018 Fort Hills production is currently 20,000 – 40,000 bbls/d in Q1, 30,000 – 50,000 bbls/d in Q2, 60,000 – 70,000 bbls/d in Q3, and 80,000 – 90,000 bbls/d in Q4. Suncor's outlook for 2018 Fort Hills cash operating costs per barrel is $70/bbl – $80/bbl in Q1, $40/bbl – $50/bbl in Q2, $30/bbl – $40/bbl in Q3, and $20/bbl – $30/bbl in Q4.
- (3)
- Refinery utilization is based on the following crude processing capacities: Montreal – 137,000 bbls/d; Sarnia – 85,000 bbls/d; Edmonton – 142,000 bbls/d; and Commerce City – 98,000 bbls/d.
Capital Expenditures(1)
| ($ millions) | 2018 Full year outlook February 7, 2018 | % Growth capital(2) | ||
| Upstream | 3,650 – 4,050 | 30% | ||
Downstream | 800 – 850 | 0% | ||
Corporate | 50 – 100 | 0% | ||
4,500 – 5,000 | 25% | |||
- (1)
- Capital expenditures exclude capitalized interest of approximately $115 million.
- (2)
- Balance of capital expenditures represents sustaining capital. For definitions of growth and sustaining capital expenditures, see the Capital Investment Update section of the MD&A.
2017 ANNUAL REPORT Suncor Energy Inc. 9
All financial information in the preceding sections of this Annual Report is reported in Canadian dollars, unless otherwise noted. Production volumes are presented on a working-interest basis, before royalties, unless otherwise noted, except for 2016 and 2017 production from Libya, which is on an entitlement basis. References to "we", "our", "Suncor", or "the company" mean Suncor Energy Inc., its subsidiaries, partnerships and joint arrangements, unless the context requires otherwise.
FORWARD-LOOKING INFORMATION
The preceding sections of this Annual Report contain certain forward-looking information and forward-looking statements (collectively referred to herein as "forward-looking statements") within the meaning of applicable Canadian and U.S. securities laws. Forward-looking statements are based on Suncor's current expectations, estimates, projections and assumptions that were made by the company in light of information available at the time the statement was made and consider Suncor's experience and its perception of historical trends, including expectations and assumptions concerning: the accuracy of reserves and resources estimates; commodity prices and interest and foreign exchange rates; the performance of assets and equipment; capital efficiencies and cost savings; applicable laws and government policies; future production rates; the sufficiency of budgeted capital expenditures in carrying out planned activities; the availability and cost of labour, services and infrastructure; the satisfaction by third parties of their obligations to Suncor; the execution of projects; and the receipt, in a timely manner, of regulatory and third-party approvals. All statements and information that address expectations or projections about the future, and statements and information about Suncor's strategy for growth, expected and future expenditures or investment decisions, commodity prices, costs, schedules, production volumes, operating and financial results, future financing and capital activities, and the expected impact of future commitments are forward-looking statements. Some of the forward-looking statements may be identified by words like "expects", "anticipates", "will", "estimates", "plans", "scheduled", "intends", "believes", "projects", "indicates", "could", "focus", "vision", "goal", "outlook", "proposed", "target", "objective", "continue", "should", "may", "future", "promise", "forecast", "potential", "opportunity", "would" and similar expressions. Forward-looking statements in the preceding sections of this Annual Report include references to:
- •
- Suncor's strategies, including striving to be the low-cost and low-carbon competitor in our sector, the company's commitment to unlocking the full value of its resources through a continued focus on responsible development and cost discipline, and the focus on demonstrating leadership in environmental performance and social responsibility, while contributing to a strong economy;
- •
- The expectation that Suncor's Base plant tailings management plan will reduce tailings inventory and decrease the overall number of tailings ponds on-site;
- •
- Suncor's reserves and reserves life estimates;
- •
- Expectations about Fort Hills, including that 90% of the planned production capacity of 194,000 bbls/d will be achieved by the end of 2018, and that Fort Hills is poised to generate substantial profitability and shareholder returns for decades to come;
- •
- Expectations about Hebron, including that at peak capacity, it will produce more than 30,000 bbls/d of low-cost oil net to Suncor;
- •
- Expectations about Syncrude, including efforts to improve reliability, drive down costs and add value for shareholders, and targets for utilization rates and Syncrude cash operating costs by 2020;
- •
- Expectations about production growth, reductions in capital expenditures, the 2018 capital spending program, and moving the entire company towards a sustainably lower cost base;
- •
- Potential growth opportunities;
- •
- Suncor's sustainability goals, expected GHG emissions intensity of production at Fort Hills and expected benefits of new technologies;
- •
- Expectations for the oil price at which funds from operations will cover sustaining capital and the company's dividend;
- •
- Suncor's belief that its strategy is resilient through a range of forward-looking scenarios;
- •
- Expectations that Suncor's dividend will grow in line with the structural growth in free funds flow and that Suncor will continue to return cash to shareholders through opportunistic repurchases when market conditions are favourable, the intention to manage the balance sheet conservatively, and the aim to deliver competitive and sustainable returns to shareholders by focusing on capital discipline, operational excellence and long-term profitable growth;
- •
- Suncor's safety goals; and
- •
- Suncor's outlook for 2018 and beyond, including Suncor's 2018 Corporate Guidance.
10 2017 ANNUAL REPORT Suncor Energy Inc.
Forward-looking statements are not guarantees of future performance and involve a number of risks and uncertainties, some that are similar to other oil and gas companies and some that are unique to Suncor. Suncor's actual results may differ materially from those expressed or implied by its forward-looking statements, so readers are cautioned not to place undue reliance on them. The financial and operating performance of the company's reportable operating segments, specifically Oil Sands, Exploration and Production, and Refining and Marketing, may be affected by a number of factors.
Factors that affect our Oil Sands segment include, but are not limited to, volatility in the prices for crude oil and other production, and the related impacts of fluctuating light/heavy and sweet/sour crude oil differentials; changes in the demand for refinery feedstock and diesel fuel, including the possibility that refiners that process our proprietary production will be closed, experience equipment failure or other accidents; our ability to operate our Oil Sands facilities reliably in order to meet production targets; the output of newly commissioned facilities, the performance of which may be difficult to predict during initial operations; the possibility that completed maintenance activities may not improve operational performance or the output of related facilities; our dependence on pipeline capacity and other logistical constraints, which may affect our ability to distribute our products to market; our ability to finance Oil Sands growth and sustaining capital expenditures; the availability of bitumen feedstock for upgrading operations, which can be negatively affected by poor ore grade quality, unplanned mine equipment and extraction plant maintenance, tailings storage, and in situ reservoir and equipment performance, or the unavailability of third-party bitumen; changes in operating costs, including the cost of labour, natural gas and other energy sources used in oil sands processes; and our ability to complete projects, including planned maintenance events, both on time and on budget, which could be impacted by competition from other projects (including other oil sands projects) for goods and services and demands on infrastructure in Alberta's Wood Buffalo region and the surrounding area (including housing, roads and schools).
Factors that affect our Exploration and Production segment include, but are not limited to, volatility in crude oil and natural gas prices; operational risks and uncertainties associated with oil and gas activities, including unexpected formations or pressures, premature declines of reservoirs, fires, blow-outs, equipment failures and other accidents, uncontrollable flows of crude oil, natural gas or well fluids, and pollution and other environmental risks; the possibility that completed maintenance activities may not improve operational performance or the output of related facilities; adverse weather conditions, which could disrupt output from producing assets or impact drilling programs, resulting in increased costs and/or delays in bringing on new production; political, economic and socio-economic risks associated with Suncor's foreign operations, including the unpredictability of operating in Libya due to ongoing political unrest; and market demand for mineral rights and producing properties, potentially leading to losses on disposition or increased property acquisition costs.
Factors that affect our Refining and Marketing segment include, but are not limited to, fluctuations in demand and supply for refined products that impact the company's margins; market competition, including potential new market entrants; our ability to reliably operate refining and marketing facilities in order to meet production or sales targets; the possibility that completed maintenance activities may not improve operational performance or the output of related facilities; and risks and uncertainties affecting construction or planned maintenance schedules, including the availability of labour and other impacts of competing projects drawing on the same resources during the same time period.
Additional risks, uncertainties and other factors that could influence the financial and operating performance of all of Suncor's operating segments and activities include, but are not limited to, changes in general economic, market and business conditions, such as commodity prices, interest rates and currency exchange rates; fluctuations in supply and demand for Suncor's products; the successful and timely implementation of capital projects, including growth projects and regulatory projects; risks associated with the execution of Suncor's major projects and the commissioning and integration of new facilities; competitive actions of other companies, including increased competition from other oil and gas companies or from companies that provide alternative sources of energy; labour and material shortages; actions by government authorities, including the imposition or reassessment of, or changes to, taxes, fees, royalties, duties and other government-imposed compliance costs; changes to laws and government policies that could impact the company's business, including environmental (including climate change), royalty and tax laws and policies; the ability and willingness of parties with whom we have material relationships to perform their obligations to us; the unavailability of, or outages to third-party infrastructure that could cause disruptions to production or prevent the company from being able to transport its products; the occurrence of a protracted operational outage, a major safety or environmental incident, or
2017 ANNUAL REPORT Suncor Energy Inc. 11
unexpected events such as fires (including forest fires), equipment failures and other similar events affecting Suncor or other parties whose operations or assets directly or indirectly affect Suncor; the potential for security breaches of Suncor's information technology and infrastructure by malicious persons or entities, and the unavailability or failure of such systems to perform as anticipated as a result of such breaches; the risk that competing business objectives may exceed Suncor's capacity to adopt and implement change; risks and uncertainties associated with obtaining regulatory and stakeholder approval for the company's operations and exploration and development activities; the potential for disruptions to operations and construction projects as a result of Suncor's relationships with labour unions that represent employees at the company's facilities; our ability to find new oil and gas reserves that can be developed economically; the accuracy of Suncor's reserves, resources and future production estimates; market instability affecting Suncor's ability to borrow in the capital debt markets at acceptable rates or to issue other securities at acceptable prices; maintaining an optimal debt to cash flow ratio; the success of the company's risk management activities using derivatives and other financial instruments; the cost of compliance with current and future environmental laws, including climate change laws; risks relating to increased activism and public opposition to fossil fuels and oil sands; risks and uncertainties associated with closing a transaction for the purchase or sale of a business, asset or oil and gas property, including estimates of the final consideration to be paid or received; the ability of counterparties to comply with their obligations in a timely manner; risks associated with joint arrangements in which the company has an interest; the receipt of any required regulatory or other third-party approvals outside of Suncor's control and the satisfaction of any conditions to such approvals; risks associated with land claims and Aboriginal consultation requirements; risks relating to litigation; the impact of technology and risks associated with developing and implementing new technologies; and the accuracy of cost estimates, some of which are provided at the conceptual or other preliminary stage of projects and prior to commencement or conception of the detailed engineering that is needed to reduce the margin of error and increase the level of accuracy. The foregoing list of important factors is not exhaustive.
Many of these risk factors and other assumptions related to Suncor's forward-looking statements are discussed in further detail throughout the MD&A, including under the heading Risk Factors, and the company's most recent Annual Information Form/ Form 40-F dated March 1, 2018 available at www.sedar.com and www.sec.gov, which risk factors are incorporated by reference herein. Readers are also referred to the risk factors and assumptions described in other documents that Suncor files from time to time with securities regulatory authorities. Copies of these documents are available without charge from the company.
The forward-looking statements contained in this Annual Report are made as of the date of this Annual Report. Except as required by applicable securities laws, we assume no obligation to update publicly or otherwise revise any forward-looking statements or the foregoing risks and assumptions affecting such forward-looking statements, whether as a result of new information, future events or otherwise.
Suncor's corporate guidance is based on the following assumptions around oil prices: WTI, Cushing of US$55/bbl; Brent, Sullom Voe of US$58/bbl; and WCS, Hardisty of US$40/bbl. In addition, the guidance is based on the assumption of a natural gas price (AECO-C Spot) of Cdn$2.50 per gigajoule, US$/Cdn$ exchange rate of $0.80 and synthetic crude oil sales from Oil Sands operations of 290,000 to 310,000 bbls/d. Assumptions for the Oil Sands, Syncrude and Fort Hills 2018 production outlook include those relating to reliability and operational efficiency initiatives that the company expects will minimize unplanned maintenance in 2018. Assumptions for the Exploration and Production 2018 production outlook include those relating to reservoir performance, drilling results and facility reliability. Factors that could potentially impact Suncor's 2018 corporate guidance include, but are not limited to: Bitumen supply. Bitumen supply may be dependent on unplanned maintenance of mine equipment and extraction plants, bitumen ore grade quality, tailings storage and in situ reservoir performance; Third-party infrastructure. Production estimates could be negatively impacted by issues with third-party infrastructure, including pipeline or power disruptions, that may result in the apportionment of capacity, pipeline or third-party facility shutdowns, which would affect the company's ability to produce or market its crude oil; Performance of recently commissioned facilities or well pads. Production rates while new equipment is being brought into service are difficult to predict and can be impacted by unplanned maintenance; Unplanned maintenance. Production estimates could be negatively impacted if unplanned work is required at any of our mining, extraction, upgrading, in situ processing, refining, natural gas processing, pipeline, or offshore assets; Planned maintenance events. Production estimates, including production mix, could be negatively impacted if planned maintenance events are affected by unexpected events or not executed effectively. The successful execution of maintenance and start up of operations for offshore assets, in particular, may be impacted by harsh
12 2017 ANNUAL REPORT Suncor Energy Inc.
weather conditions, particularly in the winter season; Commodity prices. Declines in commodity prices may alter our production outlook and/or reduce our capital expenditure plans; Foreign operations. Suncor's foreign operations and related assets are subject to a number of political, economic and socio-economic risks; and Project Ramp Up. Production estimates for Fort Hills and estimates of Fort Hills cash operating costs could be negatively impacted by delays in or unexpected events associated with the ramp up of production from the project.
NON-GAAP FINANCIAL MEASURES
Certain financial measures used in the preceding sections of this Annual Report, namely operating earnings (loss), funds from operations, ROCE, Oil Sands operations cash operating costs, Syncrude cash operating costs, E&P cash operating costs, Fort Hills cash operating costs and discretionary free funds flow, are not prescribed by GAAP. Operating earnings (loss) for 2015, 2016 and 2017 is defined in the Advisories – Non-GAAP Financial Measures section of the MD&A and reconciled to GAAP measures in the Financial Information section of the MD&A, and for 2013 and 2014 is defined in the Advisories – Non-GAAP Financial Measures section of Suncor's management's discussion and analysis for the year ended December 31, 2015 (the 2015 MD&A) and reconciled in the Financial Information section of the 2015 MD&A. Oil Sands operations cash operating costs and Syncrude cash operating costs are defined in the Advisories – Non-GAAP Financial Measures section of the MD&A and reconciled to GAAP measures in the Segment Results and Analysis section of the MD&A. Funds from operations (previously referred to as cash flow from operations) and ROCE for 2015, 2016 and 2017 are defined and reconciled to GAAP measures in the Advisories – Non-GAAP Financial Measures section of the MD&A and for 2013 and 2014 are defined and reconciled in the Advisories – Non-GAAP Financial Measures section of the 2015 MD&A. Discretionary free funds flow (previously referred to as discretionary free cash flow) for 2015, 2016 and 2017 is defined and reconciled in the Advisories – Non-GAAP Financial Measures section of the MD&A and for 2014 is defined and reconciled in the Advisories – Non-GAAP Financial Measures section of Suncor's management discussion and analysis for the year ended December 31, 2016. E&P cash operating costs are calculated by adjusting E&P Operating, Selling and General expense for non-production costs that management believes do not relate to the production performance of E&P operations. Fort Hills cash operating costs are calculated by adjusting Fort Hills Operating, Selling and General expense for non-production costs that management believes do not relate to the production performance of Fort Hills operations, including, but not limited to, share-based compensation, research and project start-up costs. These non-GAAP financial measures are included because management uses this information to analyze business performance, leverage and liquidity and it may be useful to investors on the same basis. These non-GAAP measures do not have any standardized meaning and therefore are unlikely to be comparable to similar measures presented by other companies and should not be considered in isolation or as a substitute for measures of performance prepared in accordance with GAAP.
RESERVES
Reserves information presented herein is presented as Suncor's working interests (operating and non-operating) before deduction of royalties, and without including any royalty interests of Suncor, and is at December 31, 2017. For more information on Suncor's reserves, including definitions of proved and probable reserves, Suncor's interest, the location of the reserves and the product types reasonably expected, please see Suncor's most recent Annual Information Form dated March 1, 2018 available at www.sedar.com and www.sec.gov. Reserves data is based upon evaluations conducted by independent qualified reserves evaluators.
MEASUREMENT CONVERSIONS
Certain crude oil and natural gas liquids volumes have been converted to mcfe on the basis of one bbl to six mcf. Also, certain natural gas volumes have been converted to boe or mboe on the same basis. Refer to Advisories – Measurement Conversions section of the MD&A.
RECLAMATION
Land is considered permanently reclaimed when landform construction and contouring, clean material placement (as required), reclamation material placement and revegetation has taken place. Land cannot be listed under permanent reclamation until revegetation has occurred which is reflective of the approved Reclamation and Revegetation Plans. Suncor has reclaimed a cumulative total of 48.2 hectares of wetlands and lakes.
2017 ANNUAL REPORT Suncor Energy Inc. 13
MANAGEMENT'S DISCUSSION AND ANALYSIS March 1, 2018 | |
This Management's Discussion and Analysis (this MD&A) should be read in conjunction with Suncor's December 31, 2017 audited Consolidated Financial Statements and the accompanying notes. Additional information about Suncor filed with Canadian securities regulatory authorities and the United States Securities and Exchange Commission (SEC), including quarterly and annual reports and Suncor's Annual Information Form dated March 1, 2018 (the 2017 AIF), which is also filed with the SEC under cover of Form 40-F, is available online at www.sedar.com, www.sec.gov and our website, www.suncor.com. Information on or connected to our website, even if referred to in this MD&A, does not constitute part of this MD&A.
References to "we", "our", "Suncor", or "the company" mean Suncor Energy Inc., its subsidiaries, partnerships and joint arrangements, unless the context requires otherwise. For a list of abbreviations that may be used in this MD&A, refer to the Advisories – Common Abbreviations section of this MD&A.
14 2017 ANNUAL REPORT Suncor Energy Inc.
| MD&A – Table of Contents | ||
| 16 | Financial and Operating Summary | |
| 19 | Suncor Overview | |
| 22 | Financial Information | |
| 27 | Segment Results and Analysis | |
| 40 | Fourth Quarter 2017 Analysis | |
| 42 | Quarterly Financial Data | |
| 45 | Capital Investment Update | |
| 48 | Financial Condition and Liquidity | |
| 53 | Accounting Policies and Critical Accounting Estimates | |
| 56 | Risk Factors | |
| 65 | Other Items | |
| 67 | Advisories | |
Basis of Presentation
Unless otherwise noted, all financial information has been prepared in accordance with International Financial Reporting Standards (IFRS) as issued by the International Accounting Standards Board (IASB) and Canadian generally accepted accounting principles (GAAP) as contained within Part 1 of the Canadian Institute of Chartered Professional Accountants Handbook.
All financial information is reported in Canadian dollars, unless otherwise noted. Production volumes are presented on a working-interest basis, before royalties, unless otherwise noted.
References to Oil Sands operations exclude Suncor's interest in Syncrude operations.
Non-GAAP Financial Measures
Certain financial measures in this MD&A – namely operating earnings (loss), funds from (used in) operations, return on capital employed (ROCE), Oil Sands operations cash operating costs, Syncrude cash operating costs, refining margin, refining operating expense, discretionary free funds flow, and last-in, first-out (LIFO) – are not prescribed by GAAP. Operating earnings (loss) is defined in the Advisories – Non-GAAP Financial Measures section of this MD&A and reconciled to GAAP measures in the Financial Information and Segment Results and Analysis sections of this MD&A. Oil Sands operations cash operating costs, Syncrude cash operating costs and LIFO are defined in the Advisories – Non-GAAP Financial Measures section of this MD&A and reconciled to GAAP measures in the Segment Results and Analysis section of this MD&A. ROCE, funds from (used in) operations, discretionary free funds flow, refining margin and refining operating expense are defined and reconciled to GAAP measures in the Advisories – Non-GAAP Financial Measures section of this MD&A.
Measurement Conversions
Crude oil and natural gas liquids volumes have been converted to mcfe on the basis of one bbl to six mcf in this MD&A. Also, certain natural gas volumes have been converted to boe or mboe on the same basis. Refer to the Advisories – Measurement Conversions section of this MD&A.
Common Abbreviations
For a list of abbreviations that may be used in this MD&A, refer to the Advisories – Common Abbreviations section of this MD&A.
Risks and Forward-Looking Information
The company's financial and operational performance is potentially affected by a number of factors, including, but not limited to, the factors described in the Risk Factors section of this MD&A.
This MD&A contains forward-looking information based on Suncor's current expectations, estimates, projections and assumptions. This information is subject to a number of risks and uncertainties, including those discussed in this MD&A and Suncor's other disclosure documents, many of which are beyond the company's control. Users of this information are cautioned that actual results may differ materially. Refer to the Advisories – Forward-Looking Information section of this MD&A for information on the material risk factors and assumptions underlying our forward-looking information.
2017 ANNUAL REPORT Suncor Energy Inc. 15
1. FINANCIAL AND OPERATING SUMMARY
Financial Summary
| Year ended December 31 ($ millions, except per share amounts) | 2017 | 2016 | 2015 | ||||||
| Gross Revenues | 32 982 | 27 072 | 29 589 | ||||||
| Royalties | (931 | ) | (265 | ) | (381 | ) | |||
| Operating revenues, net of royalties | 32 051 | 26 807 | 29 208 | ||||||
| Net earnings (loss) | 4 458 | 445 | (1 995 | ) | |||||
| per common share – basic | 2.68 | 0.28 | (1.38 | ) | |||||
| per common share – diluted | 2.68 | 0.28 | (1.38 | ) | |||||
| Operating earnings (loss)(1) | 3 188 | (83 | ) | 1 465 | |||||
| per common share – basic | 1.92 | (0.05 | ) | 1.01 | |||||
| Funds from operations(1) | 9 139 | 5 988 | 6 806 | ||||||
| per common share – basic | 5.50 | 3.72 | 4.71 | ||||||
| Cash flow provided by operating activities | 8 966 | 5 680 | 6 884 | ||||||
| per common share – basic | 5.40 | 3.53 | 4.76 | ||||||
| Dividends paid on common shares | 2 124 | 1 877 | 1 648 | ||||||
| per common share – basic | 1.28 | 1.16 | 1.14 | ||||||
| Weighted average number of common shares in millions – basic | 1 661 | 1 610 | 1 446 | ||||||
| Weighted average number of common shares in millions – diluted | 1 665 | 1 612 | 1 447 | ||||||
| ROCE(1) (%) | 6.7 | 0.4 | 0.5 | ||||||
| ROCE(1), excluding major projects in progress (%) | 8.6 | 0.5 | 0.6 | ||||||
| Capital Expenditures(2) | 5 822 | 5 986 | 6 220 | ||||||
| Sustaining | 2 916 | 2 275 | 2 602 | ||||||
| Growth | 2 906 | 3 711 | 3 618 | ||||||
| Discretionary free funds flow(1) | 4 056 | 1 797 | 2 556 | ||||||
| Balance Sheet (at December 31) | |||||||||
| Total assets | 89 494 | 88 702 | 77 527 | ||||||
| Long-term debt(3) | 13 443 | 16 157 | 14 556 | ||||||
| Net debt | 12 907 | 14 414 | 11 254 | ||||||
| Total liabilities | 44 111 | 44 072 | 38 488 | ||||||
- (1)
- Non-GAAP financial measures. See the Advisories – Non-GAAP Financial Measures section of this MD&A.
- (2)
- Excludes capitalized interest.
- (3)
- Includes current portion of long-term debt.
16 2017 ANNUAL REPORT Suncor Energy Inc.
Operating Summary
| Year ended December 31 | 2017 | 2016 | 2015 | |||||
| Production Volumes (mboe/d) | ||||||||
| Oil Sands | 563.7 | 504.9 | 463.4 | |||||
| Exploration and Production | 121.6 | 117.9 | 114.4 | |||||
| Total | 685.3 | 622.8 | 577.8 | |||||
| Production Mix | ||||||||
| Crude oil and liquids / natural gas (%) | 100/0 | 99/1 | 99/1 | |||||
| Average Price Realizations(1) ($/boe) | ||||||||
| Oil Sands operations | 54.24 | 39.97 | 48.78 | |||||
| Syncrude | 66.05 | 56.38 | 59.74 | |||||
| Exploration and Production | 66.20 | 53.34 | 60.53 | |||||
| Refinery crude oil processed (mbbls/d) | 441.2 | 428.6 | 432.1 | |||||
| Refinery Utilization(2) (%) | ||||||||
| Eastern North America | 93 | 92 | 94 | |||||
| Western North America | 98 | 94 | 93 | |||||
| 96 | 93 | 94 | ||||||
- (1)
- Net of transportation costs, but before royalties.
- (2)
- Refinery utilization is the amount of crude oil run through crude distillation units, expressed as a percentage of the nameplate capacity of these units.
2017 ANNUAL REPORT Suncor Energy Inc. 17
Segment Summary
| Year ended December 31 ($ millions) | 2017 | 2016 | 2015 | ||||||
| Net earnings (loss) | |||||||||
| Oil Sands | 1 009 | (1 149 | ) | (856 | ) | ||||
| Exploration and Production | 732 | 190 | (758 | ) | |||||
| Refining and Marketing | 2 658 | 1 890 | 2 306 | ||||||
| Corporate, Energy Trading and Eliminations | 59 | (486 | ) | (2 687 | ) | ||||
| Total | 4 458 | 445 | (1 995 | ) | |||||
| Operating earnings (loss)(1) | |||||||||
| Oil Sands | 954 | (1 109 | ) | (111 | ) | ||||
| Exploration and Production | 746 | 10 | 7 | ||||||
| Refining and Marketing | 2 164 | 1 890 | 2 274 | ||||||
| Corporate, Energy Trading and Eliminations | (676 | ) | (874 | ) | (705 | ) | |||
| Total | 3 188 | (83 | ) | 1 465 | |||||
| Funds from (used in) operations(1) | |||||||||
| Oil Sands | 4 738 | 2 669 | 2 835 | ||||||
| Exploration and Production | 1 725 | 1 313 | 1 386 | ||||||
| Refining and Marketing | 2 841 | 2 606 | 2 921 | ||||||
| Corporate, Energy Trading and Eliminations | (165 | ) | (600 | ) | (336 | ) | |||
| Total | 9 139 | 5 988 | 6 806 | ||||||
| Cash flow provided by (used in) operating activities | |||||||||
| Oil Sands | 4 287 | 2 286 | 2 808 | ||||||
| Exploration and Production | 1 712 | 1 373 | 1 708 | ||||||
| Refining and Marketing | 4 404 | 3 393 | 3 227 | ||||||
| Corporate, Energy Trading and Eliminations | (1 437 | ) | (1 372 | ) | (859 | ) | |||
| Total | 8 966 | 5 680 | 6 884 | ||||||
- (1)
- Non-GAAP financial measure. See the Advisories – Non-GAAP Financial Measures section of this MD&A.
18 2017 ANNUAL REPORT Suncor Energy Inc.
Suncor is an integrated energy company headquartered in Calgary, Alberta, Canada. We are strategically focused on developing one of the world's largest petroleum resource basins – Canada's Athabasca oil sands. In addition, we explore for, acquire, develop, produce and market crude oil and natural gas in Canada and internationally; we transport and refine crude oil, and we market petroleum and petrochemical products primarily in Canada. We also conduct energy trading activities focused principally on the marketing and trading of crude oil, natural gas and byproducts. We also operate a renewable energy business as part of our overall portfolio of assets.
For a description of Suncor's business segments, refer to the Segment Results and Analysis section of this MD&A.
Suncor's Strategy
We are committed to delivering competitive and sustainable returns to shareholders by focusing on capital discipline, operational excellence and long-term profitable growth, and by leveraging our competitive advantages: an industry-leading long-life, low-decline oil sands reserves base, a highly efficient, tightly integrated downstream, a focused offshore business that provides geographic and cash flow diversification, financial strength, industry expertise and a commitment to sustainability. Key components of Suncor's strategy include:
- •
- Profitably operate and develop our reserves – Suncor's growth and development plan is focused on projects and initiatives, such as the Fort Hills and Hebron ramp ups and asset optimization with Syncrude, that are expected to provide long-term profitability for the company. The company's significant long-life reserves base and industry expertise in oil sands has laid the groundwork for achieving this growth. Suncor's economies of scale have also allowed us to focus on near-term oil sands growth through low-cost efficiency improvements and expansion projects.
- •
- Optimize value through integration – From the ground to the gas station, Suncor optimizes its profit along each step of the value chain through oil sands, offshore and downstream integration, which helps to cushion Suncor from the effects of western Canadian crude price differentials. As upstream production grows, securing access to global pricing through the company's refining operations and midstream logistics network helps to maximize profit on each upstream barrel.
- •
- Achieve industry-leading unit costs in each business segment – Through a focus on operational excellence, Suncor is aiming to get the most out of our operations. Driving down costs and a continued focus on improved productivity and reliability will help to achieve this.
- •
- Industry leader in sustainable development – Suncor is focused on triple bottom line sustainability, which means leadership and industry collaboration in environmental performance, social responsibility and creating a strong economy.
2017 Highlights
Financial results summary
- •
- In 2017, Suncor delivered its strongest financial results in more than three years, resulting from improved benchmarks for crude oil pricing and refinery crack spreads, several new production and sales records in 2017 and the sustainment of cost savings achieved between 2014 and 2016.
- •
- Annual records established in 2017 include: total upstream production of 685,300 boe/d, refinery crude throughput of 441,200 bbls/d and record wholesale and retail sales volumes in Canada.
- •
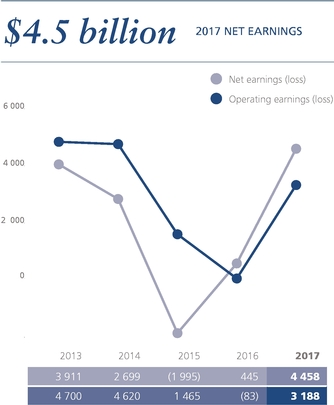
- Net earnings for 2017 were $4.458 billion, compared to $445 million in 2016.
- •
- Operating earnings(1) in 2017 were $3.188 billion, compared to an operating loss(1) of $83 million in 2016.
- •
- Funds from operations(1) for 2017 was $9.139 billion, compared to $5.988 billion in 2016. Cash flow provided by operating activities, which includes changes in non-cash working capital, for 2017 was $8.966 billion, compared to $5.680 billion in 2016.
- •
- ROCE(1) (excluding major projects in progress) improved to 8.6% for 2017, compared to 0.5% in 2016.
Production successfully achieved at both of Suncor's key growth projects, Fort Hills and Hebron, with focus now shifting to the safe and reliable production ramp up.
- •
- At Fort Hills, the mining and primary extraction assets began producing during 2017 and the first of three secondary extraction trains was successfully brought online subsequent to the end of the year. Paraffinic froth-treated bitumen is now being produced and shipped to market and Fort Hills is expected to reach 90% of production capacity by the end of 2018.
- (1)
- Non-GAAP financial measure. See the Advisories – Non-GAAP Financial Measures section of this MD&A.
2017 ANNUAL REPORT Suncor Energy Inc. 19
- •
- First oil at Hebron was achieved ahead of schedule and production continues to ramp up following favourable initial results. The peak production rate is expected to be more than 30,000 bbls/d, net to Suncor, following a ramp up phase of several years.
- •
- During the fourth quarter of 2017, the Fort Hills partners successfully resolved their commercial funding dispute and reached an agreement whereby Suncor and Teck Resources Limited (Teck) each acquired additional working interests in the Fort Hills project from Total E&P Canada Ltd. (Total). Under the terms of the agreement, which was executed on December 21, 2017, Suncor's share increased to 53.06% at the end of 2017 and, subsequent to the end of the year, increased by a further 0.49%.
Oil Sands production increased to 563,700 bbls/d in 2017, compared to 504,900 bbls/d in 2016, representing a new annual production record.
- •
- Oil Sands operations production increased to 429,400 bbls/d in 2017 combined with upgrader reliability of 91%. Production in 2016 was 374,800 bbls/d and was impacted by the forest fires in the Fort McMurray area.
- •
- Oil Sands operations cash operating costs per barrel(1) decreased to $23.80 in 2017, from $26.50 in 2016, and were the lowest in over a decade. The decrease was primarily a result of increased Oil Sands operations production, combined with the company's ability to sustain the cost reductions achieved in recent years.
- •
- Reliability at Syncrude continues to be a focus, and the company began efforts in 2017 to work with the other Syncrude owners on a framework to drive operating efficiencies, improve performance and develop regional synergies. In 2017, bitumen from MacKay River was successfully processed through the Syncrude upgrader and Syncrude intermediate production was handled by Oil Sands operations to assist in inventory management, demonstrating potential synergies between the two companies.
- •
- Subsequent to the end of the year, Suncor acquired an additional 5% interest in Syncrude from Mocal Energy Limited (Mocal) for US$730 million, or approximately $925 million, subject to closing adjustments. The transaction adds 17,500 bbls/d of SCO capacity and increases the company's ownership interest to 58.74%.
Suncor generated $2.1 billion in proceeds from the sale of non-core assets in 2017.
- •
- In 2017, Suncor closed the sale of its Petro-Canada Lubricants Inc. (lubricants) business for gross proceeds of $1.125 billion and completed the sale of its interests in both the Cedar Point and Ripley wind facilities for combined proceeds of $339 million.
- •
- In 2017, Suncor completed the sale of a combined 49% interest in the East Tank Farm Development (ETFD) to the Fort McKay and Mikisew Cree First Nations for proceeds of $503 million. This mutually beneficial agreement represents the most significant business investment ever made in Canada by First Nations and demonstrates Suncor's commitment to sustainable resource development in partnership with the community.
- •
- The proceeds from the sales of non-core assets were combined with the issuance of US$750 million of 4.00% senior unsecured notes, due in 2047, and used for the early redemption of more than $3.0 billion of long-term debt, originally due in 2018. The net decrease in long-term debt is expected to reduce future financing costs and provide additional balance sheet flexibility.
Refining and Marketing (R&M) attained several new records in 2017 and achieved 96% average refinery utilization.
- •
- Record crude throughput of 441,200 bbls/d was achieved in 2017, compared to 428,600 bbls/d in the prior year. The increase was a result of improved reliability in 2017 and allowed the company to take advantage of an improved business environment.
- •
- Strong product demand helped R&M establish new sales volume records at its Retail and Wholesale operations in Canada.
Exploration and Production (E&P) delivered strong results in 2017 and continues to evaluate low-cost development opportunities.
- •
- Production increased to 121,600 boe/d in 2017, compared to 117,900 boe/d in 2016, primarily due to production from East Coast Canada development drilling, increased production in Libya and first oil from the Hebron project later in 2017 offsetting natural declines for the U.K. and East Coast Canada assets.
- •
- Operating costs reduced by 14%, primarily as a result of continued focus on cost reduction efforts and a stronger Canadian dollar compared with the British pound that reduced expenses in the U.K.
- •
- The West White Rose Project was sanctioned during the second quarter of 2017, with first oil targeted in 2022, and the company continued to advance development work at the Oda project in Norway and pre-sanction design work on the Rosebank future development project in the U.K.
- (1)
- Non-GAAP financial measure. See the Advisories – Non-GAAP Financial Measures section of this MD&A.
20 2017 ANNUAL REPORT Suncor Energy Inc.
Suncor returned additional value to shareholders in 2017 through increased dividends and share repurchases.
- •
- Discretionary free funds flow(1), which represents funds from operations less sustaining capital and dividends, improved to $4.056 billion in 2017, compared to $1.797 billion in 2016.
- •
- The company commenced a Normal Course Issuer Bid (NCIB) in the second quarter of 2017, and repurchased $1.413 billion of its own shares for cancellation during 2017.
- •
- The company paid $2.124 billion in dividends in 2017, with a 10% increase in the dividend per share over the prior year.
- •
- Subsequent to the end of the year, Suncor's Board of Directors approved a quarterly dividend of $0.36 per common share, which represents an increase of 12.5% over the quarterly 2017 dividend, and also approved a further $2.0 billion share repurchase program, continuing to demonstrate the company's ability to generate cash flow and commitment to return cash to shareholders.
- (1)
- Non-GAAP financial measure. See the Advisories – Non-GAAP Financial Measures section of this MD&A.
2017 ANNUAL REPORT Suncor Energy Inc. 21
Net Earnings
Suncor's net earnings in 2017 were $4.458 billion, compared to $445 million in 2016. Net earnings were impacted by the same factors that influenced operating earnings, which are described below. Other items affecting net earnings in 2017 and 2016 included:
- •
- An after-tax unrealized foreign exchange gain on the revaluation of U.S. dollar denominated debt of $702 million, compared to an after-tax gain of $524 million for 2016.
- •
- In 2017, the company recorded a combined after-tax gain of $437 million related to the sale of the company's lubricants business and the company's interest in the Cedar Point Wind facility.
- •
- In 2017, the company recorded an adjustment to its deferred income taxes of $124 million related to tax reform legislation in the U.S., with the most significant impact resulting from a decrease in the corporate income tax rate from 35% to 21%. In 2016, the U.K. government enacted a decrease in the supplementary charge on oil and gas profits in the North Sea that reduced the statutory tax rate on Suncor's earnings in the U.K. from 50% to 40%, resulting in an adjustment to the company's deferred income taxes of $180 million.
- •
- The company received after-tax property damage insurance proceeds of $55 million ($76 million before tax) during 2017 related to a facility incident at Syncrude that occurred during the first quarter of 2017, which is included in the Oil Sands segment.
- •
- During 2017, the company redeemed $3.2 billion in long-term debt, comprised of notes with aggregate principal amounts of US$1.250 billion, US$600 million and $700 million, originally due in 2018. As a result of the early redemption, the company incurred an after-tax charge of $28 million, net of associated realized foreign currency hedges, in the Corporate segment. In 2016, the company recorded a $73 million after-tax charge for the early repayment of long-term debt acquired as part of the Canadian Oil Sands Limited (COS) acquisition.
- •
- In 2017, the company recognized an after-tax loss on forward interest rate swaps of $20 million in the Corporate segment due to changes in long-term interest rates; the non-cash after-tax gain on forward interest rate swaps due to an increase in long-term interest rates was $6 million in 2016.
- •
- In 2016, the company recorded after-tax derecognition charges of $40 million on certain upgrading and logistics assets in the Oil Sands segment, as well as $31 million in the Corporate segment relating to an initial investment in an undeveloped pipeline and on certain renewable energy development assets, as a result of the uncertainty of future benefits from these assets.
- •
- In 2016, $38 million in after-tax charges associated with the acquisition and integration of COS were recorded in the Corporate segment.
22 2017 ANNUAL REPORT Suncor Energy Inc.
Operating Earnings
Consolidated Operating Earnings (Loss) Reconciliation(1)
| Year ended December 31 ($ millions) | 2017 | 2016 | 2015 | |||||
| Net earnings (loss) as reported | 4 458 | 445 | (1 995 | ) | ||||
| Unrealized foreign exchange (gain) loss on U.S. dollar denominated debt | (702 | ) | (524 | ) | 1 930 | |||
| Derecognition and impairments(2) | — | 71 | 1 599 | |||||
| Gain (loss) on interest rate swaps | 20 | (6 | ) | — | ||||
| Impact of income tax adjustments on deferred income taxes(3) | (124 | ) | (180 | ) | 17 | |||
| Non-cash loss on early payment of long-term debt | 28 | 73 | — | |||||
| COS acquisition and integration costs | — | 38 | — | |||||
| Restructuring charges(4) | — | — | 57 | |||||
| Recognition of insurance proceeds(5) | (55 | ) | — | (75 | ) | |||
| Gain on significant disposals(6) | (437 | ) | — | (68 | ) | |||
| Operating earnings (loss)(1) | 3 188 | (83 | ) | 1 465 | ||||
- (1)
- Non-GAAP financial measures. See the Advisories – Non-GAAP Financial Measures section of this MD&A.
- (2)
- In 2015, the company recorded after-tax impairment charges against property, plant and equipment and exploration and evaluation assets of $359 million on White Rose, $331 million on Golden Eagle and $54 million on Terra Nova, primarily as a result of impacts of a decline in the crude oil price forecast. In addition, impairment charges of $290 million were recorded against the Joslyn mining project and $54 million on the Ballicatters well, due to uncertainty on the timing and likelihood of development plans, and $96 million in Oil Sands following a review of certain assets that no longer fit with Suncor's growth strategies, and which could not be repurposed or otherwise deployed. In 2015, as a result of shut-in production due to the continued closure of certain Libyan export terminals, escalating political unrest, and increased uncertainty with respect to the company's return to normal operations in the country, the company recorded an after-tax impairment charge of $415 million against property, plant and equipment and exploration and evaluation assets.
- (3)
- In 2015, the company recorded a $423 million deferred income tax charge related to a 2% increase in the Alberta corporate income tax rate. Also in 2015, the company recorded a $406 million deferred income tax recovery in the E&P segment related to a reduction in the U.K. tax rate from 62% to 50%.
- (4)
- In 2015, the company recorded after-tax restructuring charges of $57 million in the Corporate segment related to cost reduction initiatives.
- (5)
- In 2015, Suncor recorded after-tax insurance proceeds of $75 million in the E&P segment related to a claim on the Terra Nova asset.
- (6)
- In 2015, the company recorded an after-tax gain of $68 million in the R&M segment on the disposal of the company's share of certain assets and liabilities of Pioneer Energy.
Bridge Analysis of Consolidated Operating Earnings (Loss)($ millions)(1)
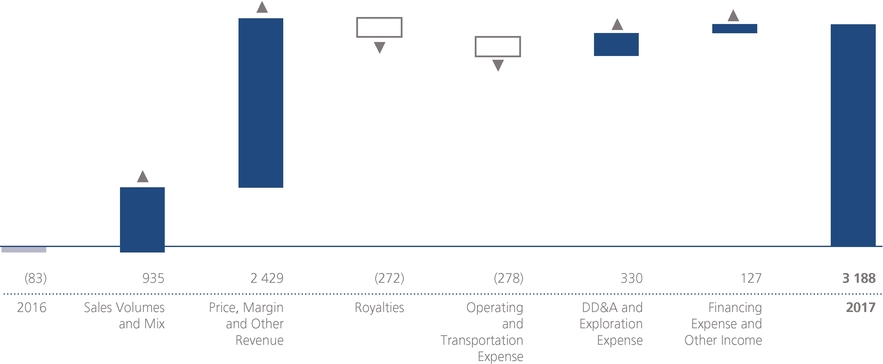
- (1)
- For an explanation of the construction of this bridge analysis, see the Advisories – Non-GAAP Financial Measures section of this MD&A.
2017 ANNUAL REPORT Suncor Energy Inc. 23
Suncor's consolidated operating earnings in 2017 were $3.188 billion, compared to an operating loss of $83 million in the prior year. The increase was primarily due to significantly improved benchmark crude pricing, favourable crack spreads, higher upstream production, lower DD&A, a decrease in exploration expense and higher sales volumes at R&M, including new annual sales records for wholesale and retail volumes in Canada. These factors were partially offset by the impact of a stronger Canadian dollar, an increase in operating expenses, which was primarily due to the acquisition of additional working interests in Syncrude in 2016 and increased maintenance costs at Syncrude, an increase in royalties and the impact of the sale of the lubricants business. Operating earnings in the prior year were significantly impacted by the production shut-in associated with the forest fires in the Fort McMurray area and the current year was significantly impacted by a facility incident which occurred at Syncrude in the first quarter of 2017.
Funds from Operations
Consolidated funds from operations for 2017 were $9.139 billion, compared to $5.988 billion in 2016, and, after removing the effect of non-cash expenses primarily related to DD&A, were impacted by the same factors as operating earnings described above. Cash flow provided by operating activities, which includes changes in non-cash working capital, was $8.966 billion in 2017, compared to $5.680 billion in 2016.
Results for 2016 compared to 2015
Net earnings in 2016 were $445 million, compared to a net loss of $1.995 billion in 2015. The decrease in net earnings was mainly due to the same factors impacting operating earnings described below, as well as the net earnings adjustments impacting 2016 and 2015, which are described in the table above.
An operating loss of $83 million was recorded in 2016, compared to operating earnings of $1.465 billion in 2015. The decrease was primarily due to lower upstream price realizations, the impact of shut-in production associated with the forest fires in the Fort McMurray area in the second quarter of 2016 and weaker benchmark crack spreads. These factors were partially offset by lower operating costs across the company's operations, a first-in, first-out (FIFO) gain in downstream operations, when compared to a FIFO loss in the prior year, higher refined product location differentials and higher E&P production. Significantly increased production from Syncrude due to the acquisition of additional working interests in 2016 combined with improved upgrader reliability in the second half of the year was offset by the additional operating expenses and DD&A associated with increased production, as well as the production shut-in due to the forest fires.
Consolidated funds from operations for 2016 were $5.988 billion, compared to $6.806 billion in 2015. Funds from operations were impacted by the same factors as operating earnings, after removing the impact of non-cash expenses primarily related to DD&A. Cash flow provided by operating activities, which includes changes in non-cash working capital, was $5.680 billion in 2016, compared to $6.884 billion in 2015.
24 2017 ANNUAL REPORT Suncor Energy Inc.
Business Environment
Commodity prices, refining crack spreads and foreign exchange rates are important factors that affect the results of Suncor's operations.
| Average for the year ended December 31 | 2017 | 2016 | 2015 | ||||
| WTI crude oil at Cushing (US$/bbl) | 50.95 | 43.35 | 48.75 | ||||
| Dated Brent Crude (US$/bbl) | 54.25 | 43.75 | 52.40 | ||||
| Dated Brent/Maya FOB price differential (US$/bbl) | 7.70 | 7.50 | 9.50 | ||||
| MSW at Edmonton (Cdn$/bbl) | 63.20 | 51.90 | 57.60 | ||||
| WCS at Hardisty (US$/bbl) | 38.95 | 29.55 | 35.25 | ||||
| Light/heavy differential for WTI at Cushing less WCS at Hardisty (US$/bbl) | 11.95 | 13.85 | 13.50 | ||||
| Condensate at Edmonton (US$/bbl) | 51.55 | 42.50 | 47.35 | ||||
| Natural gas (Alberta spot) at AECO (Cdn$/mcf) | 2.15 | 2.15 | 2.65 | ||||
| Alberta Power Pool Price (Cdn$/MWh) | 22.15 | 18.20 | 33.40 | ||||
| New York Harbor 3-2-1 crack(1) (US$/bbl) | 17.70 | 14.05 | 19.70 | ||||
| Chicago 3-2-1 crack(1) (US$/bbl) | 16.30 | 12.60 | 18.50 | ||||
| Portland 3-2-1 crack(1) (US$/bbl) | 22.15 | 16.50 | 25.15 | ||||
| Gulf Coast 3-2-1 crack(1) (US$/bbl) | 17.65 | 13.40 | 18.35 | ||||
| Exchange rate (US$/Cdn$) | 0.77 | 0.75 | 0.78 | ||||
| Exchange rate (end of period) (US$/Cdn$) | 0.80 | 0.74 | 0.72 | ||||
- (1)
- 3-2-1 crack spreads are indicators of the refining margin generated by converting three barrels of WTI into two barrels of gasoline and one barrel of diesel. The crack spreads presented here generally approximate the regions into which the company sells refined products through retail and wholesale channels.
Suncor's sweet SCO price realizations are influenced primarily by the price of WTI at Cushing and by the supply and demand of sweet SCO from Western Canada. WTI increased to US$50.95/bbl in 2017, compared to US$43.35/bbl in 2016.
Suncor also produces a specific grade of sour SCO, the price of which is influenced by various crude benchmarks, including, but not limited to, MSW at Edmonton and WCS at Hardisty, and which can also be affected by prices negotiated for spot sales. Prices for MSW at Edmonton increased to $63.20/bbl compared to $51.90/bbl in the prior year and prices for WCS at Hardisty increased to US$38.95/bbl from US$29.55/bbl in 2016.
Bitumen production that Suncor does not upgrade is blended with diluent to facilitate delivery on pipeline systems. Net bitumen price realizations are therefore influenced by both prices for Canadian heavy crude oil (WCS at Hardisty is a common reference) and prices for diluent (Condensate at Edmonton and SCO) and pipeline tolls. Bitumen price realizations can also be affected by bitumen quality and spot sales.
Suncor's price realizations for production from East Coast Canada and E&P International assets are influenced primarily by the price for Brent crude. Brent crude pricing increased over the prior year and averaged US$54.25/bbl in 2017, compared to US$43.75/bbl in 2016.
Suncor's price realizations for E&P Canada natural gas production are primarily referenced to Alberta spot at AECO. Natural gas is also used in the company's Oil Sands and Refining operations. The AECO benchmark averaged $2.15/mcf in both 2017 and 2016.
Suncor's refining margins are influenced by 3-2-1 crack spreads, which are industry indicators approximating the gross margin on a barrel of crude oil that is refined to produce gasoline and distillate, and by light/heavy and light/sour crude differentials. More complex refineries can earn greater margins by processing less expensive, heavier crudes. Crack spreads do not necessarily reflect the margins of a specific refinery. Crack spreads are based on current crude feedstock prices whereas actual refining margins are based on FIFO, where a delay exists between the time that feedstock is purchased and when it is processed and sold to a third party. Specific refinery margins are further impacted by actual crude purchase costs, refinery configuration and refined products sales markets unique to that refinery. Average market crack spreads increased in 2017 compared to 2016, resulting in a positive impact to refining margins.
Excess electricity produced in Suncor's Oil Sands business is sold to the Alberta Electric System Operator (AESO), with the proceeds netted against the Oil Sands operations cash operating costs per barrel metric. The Alberta power pool
2017 ANNUAL REPORT Suncor Energy Inc. 25
price increased to an average of $22.15/MWh in 2017 from $18.20/MWh in the prior year.
The majority of Suncor's revenues from the sale of oil and natural gas commodities are based on prices that are determined by or referenced to U.S. dollar benchmark prices. The majority of Suncor's expenditures are realized in Canadian dollars. A decrease in the value of the Canadian dollar relative to the U.S. dollar will increase the revenues received from the sale of commodities. An increase in the value of the Canadian dollar relative to the U.S. dollar will decrease revenue received from the sale of commodities. In 2017, the Canadian dollar strengthened in relation to the U.S. dollar as the average exchange rate increased to 0.77 from 0.75, which had a negative impact on price realizations for the company in 2017.
Conversely, many of Suncor's assets and liabilities, notably 65% of the company's debt, are denominated in U.S. dollars and translated to Suncor's reporting currency (Canadian dollars) at each balance sheet date. An increase in the value of the Canadian dollar relative to the U.S. dollar from the previous balance sheet date decreases the amount of Canadian dollars required to settle U.S. dollar denominated obligations.
Economic Sensitivities(1)(2)
The following table illustrates the estimated effects that changes in certain factors would have had on 2017 net earnings and funds from operations if the listed changes had occurred.
| (Estimated change, in $ millions) | Net Earnings | Funds From Operations(3) | ||||
| Crude oil +US$1.00/bbl | 195 | 195 | ||||
| Natural gas +Cdn$0.10/mcf | (20 | ) | (20 | ) | ||
| Light/heavy differential +US$1.00/bbl | 2 | 2 | ||||
| 3-2-1 crack spreads +US$1.00/bbl | 130 | 130 | ||||
| Foreign exchange +$0.01 US$/Cdn$ related to operating activities(4) | (170 | ) | (170 | ) | ||
| Foreign exchange on U.S. denominated debt +$0.01 US$/Cdn$ | 130 | — | ||||
- (1)
- Each line item in this table shows the effects of a change in that variable only, with other variables being held consistent.
- (2)
- Changes for a variable imply that all such similar variables are impacted, such that Suncor's average price realizations increase uniformly. For instance, "Crude oil +US$1.00/bbl" implies that price realizations influenced by WTI, Brent, SCO, WCS, par crude at Edmonton and condensate all increase by US$1.00/bbl.
- (3)
- Non-GAAP financial measure. See the Advisories – Non-GAAP Financial Measures section of this MD&A.
- (4)
- Excludes the foreign exchange impact on U.S. denominated debt.
26 2017 ANNUAL REPORT Suncor Energy Inc.
4. SEGMENT RESULTS AND ANALYSIS
Suncor has classified its operations into the following segments:
OIL SANDS
Suncor's Oil Sands segment, with assets located in the Athabasca oil sands of northeast Alberta, recovers bitumen from mining and in situ operations and either upgrades this production into SCO for refinery feedstock and diesel fuel, or blends the bitumen with diluent for direct sale to market. The Oil Sands segment is comprised of:
- •
- Oil Sands operations refers to Suncor's wholly owned and operated mining, extraction, upgrading, in situ and related logistics and storage assets in the Athabasca oil sands region. Oil Sands operations consist of:
- •
- Oil Sands Base operations include the Millennium and North Steepbank mining and extraction operations, integrated upgrading facilities known as Upgrader 1 and Upgrader 2, and the associated infrastructure for these assets – including utilities, cogeneration units, energy and reclamation.
- •
- In Situ operations include oil sands bitumen production from Firebag and MacKay River and supporting infrastructure, such as central processing facilities, cogeneration units, hot bitumen infrastructure, including insulated pipelines, diluent import lines and a cooling and blending facility; and associated storage assets such as Suncor's East Tank Farm (ETF) operations specific to In Situ. In Situ also includes development opportunities (with varying working interests) which may support future in situ production, including Meadow Creek (75%), Lewis (100%), OSLO (77.78%), various interests in Chard (25% to 50%), and a non-operated interest in Kirby (10%). Production is either upgraded by Oil Sands Base, or blended with diluent and marketed directly to customers.
- •
- Oil Sands ventures operations include Suncor's 53.55% interest in the Fort Hills mining project, where Suncor is the operator. The company's interest in Fort Hills increased from its previous 50.8% as a result of the agreement to resolve the commercial dispute regarding project funding among the partners. On December 21, 2017, Suncor acquired an additional 2.26% interest in accordance with the agreement, bringing Suncor's share in the project to 53.06% at December 31, 2017. On February 20, 2018, Suncor acquired an additional 0.49% interest in the Fort Hills project, in accordance with the terms of the same dispute settlement agreement. The Fort Hills project includes the mine, primary and secondary extraction facilities, and supporting infrastructure.
The ETF facility was expanded in July 2017 to support Fort Hills production. The expanded facilities that blend Fort Hills bitumen for Suncor and the other Fort Hills project partners are described as the ETFD. On November 22, 2017, the company completed the disposition of a combined 49% ownership interest in the new ETFD to the Fort McKay First Nation and the Mikisew Cree First Nation.
Oil Sands ventures operations also include Suncor's 58.74% working interest in the Syncrude oil sands mining, extraction and upgrading facilities, which increased from 53.74% subsequent to the end of 2017 due to the acquisition of an additional 5% interest from Mocal. Oil Sands ventures also includes undeveloped mining leases.
2017 ANNUAL REPORT Suncor Energy Inc. 27
EXPLORATION AND PRODUCTION
Suncor's E&P segment consists of offshore operations off the east coast of Canada and in the North Sea, and onshore assets in North America, Libya and Syria.
- •
- E&P Canada operations include Suncor's 37.675% working interest in Terra Nova, which Suncor operates. Suncor also holds non-operated interests in Hibernia (20% in the base project and 19.190% in the Hibernia Southern Extension Unit (HSEU), White Rose (27.5% in the base project and 26.125% in the extensions), and Hebron (21.034%). Suncor also holds interests in several exploration licences offshore Newfoundland and Labrador. In 2017, E&P Canada also included Suncor's working interests in natural gas properties in northeast B.C., with Suncor agreeing to exchange these assets with Canbriam Energy Inc. (Canbriam) for a 37% equity interest in Canbriam subsequent to the end of 2017. The transaction is expected to close in the first quarter of 2018.
- •
- E&P International operations include Suncor's non-operated interests in Buzzard (29.89%), Golden Eagle Area Development (26.69%), Rosebank future development project (30%) and the Oda project (30%). The first three projects are located in the U.K. sector of the North Sea, while Oda is located in the Norwegian North Sea. Suncor also holds interests in several exploration licences offshore the U.K. and Norway. Suncor owns, pursuant to Exploration and Production Sharing Agreements (EPSAs), working interests in the exploration and development of oilfields in the Sirte Basin in Libya. Some of these oilfields remain shut in due to political unrest, with the timing of a return to normal operations remaining uncertain. Suncor also owns, pursuant to a Production Sharing Contract (PSC), an interest in the Ebla gas development in Syria. Suncor's operations in Syria were suspended indefinitely in 2011, due to political unrest in the country. Subsequent to the end of year, the company entered into an agreement to acquire a 17.5% interest in the Fenja development project offshore Norway, with the transaction expected to close in the second quarter of 2018.
REFINING AND MARKETING
Suncor's R&M segment consists of two primary operations:
- •
- Refining and Supply operations refine crude oil and intermediate feedstock into a broad range of petroleum and petrochemical products. Refining and Supply consists of:
- •
- Eastern North America operations include refineries located in Montreal, Quebec and Sarnia, Ontario. Suncor previously operated a lubricants business located in Mississauga, Ontario that manufactured and blended products which were marketed worldwide. Suncor sold its lubricants business on February 1, 2017.
- •
- Western North America operations include refineries located in Edmonton, Alberta and Commerce City, Colorado.
- •
- Other Refining and Supply assets include interests in a petrochemical plant and a sulphur recovery facility in Montreal, Quebec, product pipelines and terminals in Canada and the U.S., and the St. Clair ethanol plant in Ontario.
- •
- Marketing operations sell refined petroleum products to retail, commercial and industrial customers through a combination of company-owned, Petro-Canada branded dealers in Canada and a Sunoco branded-dealer and other retail stations in Colorado, a nationwide commercial road transport network in Canada, and a bulk sales channel in Canada.
CORPORATE, ENERGY TRADING AND ELIMINATIONS
The groupingCorporate, Energy Trading and Eliminations includes the company's investments in renewable energy projects, results related to energy marketing, supply and trading activities, and other activities not directly attributable to any other operating segment.
- •
- Renewable Energy includes interests in four wind facilities in Ontario and Western Canada, including Adelaide, Chin Chute, Magrath and Sunbridge. Suncor previously held interests in the Cedar Point (50%) and Ripley (50%) wind facilities, which were both sold in 2017.
- •
- Energy Trading activities primarily involve the marketing, supply and trading of crude oil, natural gas, power and byproducts, and the use of midstream infrastructure and financial derivatives to optimize related trading strategies.
- •
- Corporate activities include stewardship of Suncor's debt and borrowing costs, expenses not allocated to the company's businesses, and the company's captive insurance activities that self-insure a portion of the company's asset base.
- •
- Intersegment revenues and expenses are removed from consolidated results inEliminations. Intersegment activity includes the sale of product between the company's segments and insurance for a portion of the company's operations by theCorporate captive insurance entity.
28 2017 ANNUAL REPORT Suncor Energy Inc.
2017 Highlights
- •
- At Fort Hills, the mining and primary extraction assets began producing during 2017 and the first of three secondary extraction trains was successfully brought online subsequent to the end of year. Paraffinic froth-treated bitumen is now being produced and shipped to market and Fort Hills is expected to reach 90% of production capacity by the end of 2018.
- •
- Production at Oil Sands operations increased to 429,400 bbls/d in 2017, compared to 374,800 bbls/d in 2016, as a result of the impact of the forest fires in the Fort McMurray region in 2016 and improved reliability in 2017, partially offset by an increase in planned maintenance in 2017. Upgrader utilization at Oil Sands operations was 91% in 2017, compared to 74% in 2016.
- •
- A continued focus on reliable operations and cost management enabled Suncor to decrease its Oil Sands operations cash operating costs per barrel by 10% to $23.80/bbl in 2017, the lowest in over a decade, compared to $26.50/bbl in the prior year.
- •
- Suncor completed the sale of a combined 49% interest in the ETFD to the Fort McKay and Mikisew Cree First Nations for proceeds of $503 million, underscoring Suncor's commitment to sustainable resource development in partnership with the community.
- •
- Subsequent to the end of the year, Suncor acquired an additional 5% interest in Syncrude from Mocal for US$730 million, approximately $925 million, subject to closing adjustments. The transaction adds 17,500 bbls/d of SCO capacity and increases the company's ownership interest to 58.74%.
Strategy and Investment Update
A large physical asset base has been established at Oil Sands operations which provides the opportunity for production growth through low-cost debottlenecks, expansions and increased reliability. In 2017, Oil Sands upgrading achieved reliability of 91% and Firebag exited the year at close to 100% utilization following the first major five-year turnaround of the expanded central facilities, which was completed mid-year.
The Fort Hills project began producing paraffinic froth-treated bitumen from secondary extraction in January 2018 and the ramp up of production to 90% of the project's nameplate capacity of 194,000 bbls/d (103,900 bbls/d, Suncor net) by the end of 2018 is progressing on schedule. Prior to producing paraffinic froth-treated bitumen, the company tested the front end of the plant in 2017 to mitigate the risk associated with the ramp up in 2018, resulting in bitumen froth production which was further processed by Oil Sands operations and included as SCO production in 2017.
Oil Sands remains focused on safe, reliable and sustainable operations, including continuing to improve upgrader reliability and the replacement of the coke-fired boilers at Oil Sands Base to enhance carbon and cost competitiveness. The company's operational excellence initiatives are aimed at improving facility utilization and workforce productivity, and are expected to achieve steady production growth while reducing operating costs.
The primary focus for both cost management and capital discipline in 2018 will be to continue efforts to sustainably reduce controllable operating costs through elimination of non-critical work and continued collaboration with suppliers and business partners. Capital discipline continues to focus on managing investment opportunities, including sustainability priorities, through a robust asset development process and realizing turnaround productivity improvements.
2017 ANNUAL REPORT Suncor Energy Inc. 29
Financial Highlights
| Year ended December 31 ($ millions) | 2017 | 2016 | 2015 | ||||||
| Gross revenues | 13 137 | 9 522 | 9 332 | ||||||
| Less: Royalties | (355 | ) | (52 | ) | (114 | ) | |||
| Operating revenues, net of royalties | 12 782 | 9 470 | 9 218 | ||||||
| Net earnings (loss) | 1 009 | (1 149 | ) | (856 | ) | ||||
| Adjusted for: | |||||||||
| Insurance Proceeds | (55 | ) | — | — | |||||
| Derecognition and impairments | — | 40 | 386 | ||||||
| Impact of income tax adjustments on deferred income taxes | — | — | 359 | ||||||
| Operating earnings (loss)(1) | 954 | (1 109 | ) | (111 | ) | ||||
| Oil Sands operations | 1 040 | (1 135 | ) | (33 | ) | ||||
| Oil Sands ventures | (86 | ) | 26 | (78 | ) | ||||
| Funds from operations(1) | 4 738 | 2 669 | 2 835 | ||||||
- (1)
- Non-GAAP financial measures. See the Advisories – Non-GAAP Financial Measures section of this MD&A.
Bridge Analysis of Operating Earnings (Loss)($ millions)(1)
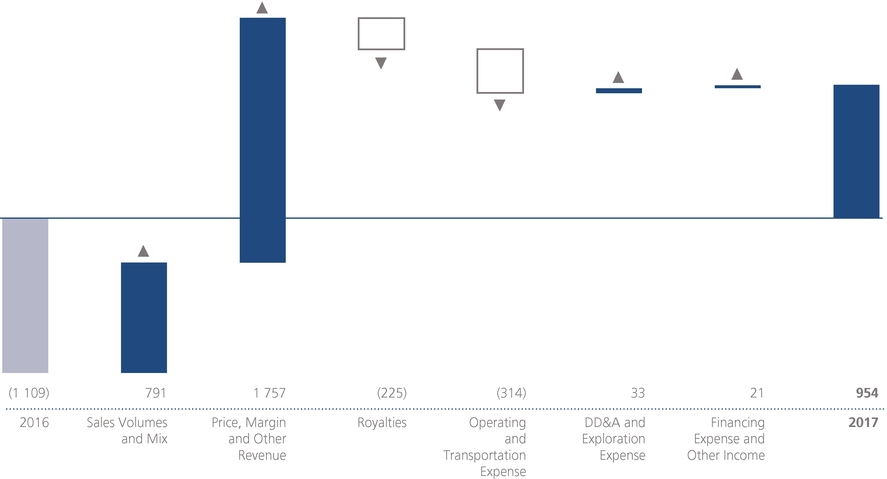
- (1)
- For an explanation of the construction of this bridge analysis, see the Advisories – Non-GAAP Financial Measures section of this MD&A.
Operating earnings in Oil Sands operations were $1.040 billion in 2017, compared to an operating loss of $1.135 billion in 2016. The increase is primarily due to the increase in benchmark crude prices and an increase in production and sales volumes due to the impact of the forest fires in the Fort McMurray area in 2016 combined with 91% upgrader reliability in 2017, partially offset by a stronger Canadian dollar and higher royalties.
Operating loss for Oil Sands ventures was $86 million in 2017, compared to operating earnings of $26 million in 2016. The decrease was primarily due to the facility incident at Syncrude in the first quarter of 2017, and the associated increase in maintenance costs, and increased royalties, partially offset by improved benchmark pricing and an overall increase in production.
Funds from operations for the Oil Sands segment were $4.738 billion in 2017, compared to $2.669 billion in 2016. The increase was due to the same cash factors that impacted operating earnings.
30 2017 ANNUAL REPORT Suncor Energy Inc.
Production Volumes(1)
| Year ended December 31 (mbbls/d) | 2017 | 2016 | 2015 | ||||
| Upgraded product (SCO) | 317.7 | 258.9 | 320.1 | ||||
| Non-upgraded bitumen | 111.7 | 115.9 | 113.5 | ||||
| Oil Sands operations | 429.4 | 374.8 | 433.6 | ||||
| Oil Sands ventures – Syncrude sweet SCO | 134.3 | 130.1 | 29.8 | ||||
| Total | 563.7 | 504.9 | 463.4 | ||||
- (1)
- Bitumen from Oil Sands Base operations is upgraded, while bitumen from In Situ operations is upgraded or sold directly to customers. Yields of SCO from Suncor's upgrading processes are approximately 79% of bitumen feedstock input.
Oil Sands operations production increased to 429,400 bbls/d in 2017 from 374,800 bbls/d in 2016, primarily due to the prior year being impacted by the forest fires in the Fort McMurray area combined with a decrease in planned upgrader maintenance in 2017, partially offset by the first turnaround of the expanded Firebag central facilities since moving to a five-year turnaround cycle, and unplanned maintenance at MacKay River. Upgrader reliability improved to 91% in 2017, compared to 74% in 2016.
Oil Sands ventures production, which includes Suncor's share of Syncrude production and sales volumes, averaged 134,300 bbls/d in 2017, compared to 130,100 bbls/d in 2016. The increase is due to additional working interests acquired partway through 2016 and the prior year being impacted by the forest fires in the Fort McMurray area, partially offset by the decrease in production associated with the facility incident in the first quarter of 2017 and an increase in planned upgrader maintenance.
Sales Volumes and Mix
| Year ended December 31 (mbbls/d) | 2017 | 2016 | 2015 | |||||
| Oil Sands operations sales volumes | ||||||||
| Sweet SCO | 107.9 | 87.3 | 107.0 | |||||
| Diesel | 27.5 | 21.2 | 31.3 | |||||
| Sour SCO | 183.6 | 153.4 | 182.5 | |||||
| Upgraded product (SCO) | 319.0 | 261.9 | 320.8 | |||||
| Non-upgraded bitumen | 110.6 | 117.4 | 107.7 | |||||
| Oil Sands operations | 429.6 | 379.3 | 428.5 | |||||
| Oil Sands ventures | 134.3 | 130.1 | 29.8 | |||||
| Total | 563.9 | 509.4 | 458.3 | |||||
Sales volumes for Oil Sands operations increased to 429,600 bbls/d in 2017, compared to 379,300 bbls/d in 2016, reflecting the same factors that led to the overall increase in production volumes.
Bitumen Production from Operations
| Year ended December 31 | 2017 | 2016 | 2015 | |||||
| Oil Sands Base | ||||||||
| Bitumen production (mbbls/d) | 305.4 | 238.0 | 307.3 | |||||
| Bitumen ore mined (thousands of tonnes/day) | 464.4 | 351.1 | 461.3 | |||||
| Bitumen ore grade quality (bbls/tonne) | 0.66 | 0.68 | 0.67 | |||||
| In Situ bitumen production (mbbls/d) | ||||||||
| Firebag | 181.5 | 180.8 | 186.9 | |||||
| MacKay River | 31.1 | 27.6 | 30.7 | |||||
| Total In Situ production | 212.6 | 208.4 | 217.6 | |||||
| Total Oil Sands operations bitumen | 518.0 | 446.4 | 524.9 | |||||
| In Situ steam-to-oil ratio | ||||||||
| Firebag | 2.7 | 2.6 | 2.6 | |||||
| MacKay River | 3.1 | 3.2 | 2.9 | |||||
Oil Sands operations bitumen production increased to 518,000 bbls/d in 2017, compared to 446,400 bbls/d in 2016. The increase was primarily due to the prior year period being impacted by the forest fires in the Fort McMurray area in the second quarter of 2016 combined with improved upgrader reliability in 2017.
Price Realizations
| Year ended December 31 Net of transportation costs, but before royalties ($/bbl) | 2017 | 2016 | 2015 | ||||||
| Oil Sands operations | |||||||||
| SCO and diesel | 61.40 | 49.77 | 56.45 | ||||||
| Bitumen | 33.60 | 18.12 | 25.92 | ||||||
| Crude sales basket (all products) | 54.24 | 39.97 | 48.78 | ||||||
| Crude sales basket, relative to WTI | (11.93 | ) | (17.83 | ) | (13.72 | ) | |||
| Oil Sands ventures | |||||||||
| Syncrude – sweet SCO | 66.05 | 56.38 | 59.74 | ||||||
| Syncrude, relative to WTI | (0.12 | ) | (1.42 | ) | (2.76 | ) | |||
Price realizations were positively impacted by the increase in WTI benchmark prices and favourable SCO and heavy crude differentials, partially offset by the stronger Canadian dollar in 2017, resulting in average price realizations for Oil Sands operations of $54.24/bbl in 2017, compared to $39.97/bbl in 2016.
2017 ANNUAL REPORT Suncor Energy Inc. 31
Suncor's average price realization for Syncrude sales increased in 2017 to $66.05/bbl, compared to $56.38/bbl in 2016, with improved WTI benchmark pricing and SCO differentials partially offset by the stronger Canadian dollar in 2017.
Royalties
Royalties were higher in 2017 relative to 2016, primarily due to higher bitumen pricing, higher production volumes and the impact of favourable royalty audit assessments realized at Oil Sands operations in the prior year.
Expenses and Other Factors
Operating expenses for 2017 were higher relative to 2016, primarily due to increased operating and maintenance costs at Syncrude, largely attributed to the facility incident in the first quarter of 2017, the company's increased working interest in Syncrude throughout 2017 as a result of the additional working interests acquired partway through 2016, and additional operating costs associated with higher production at Oil Sands operations, including an increase in natural gas consumption. See the Cash Operating Costs section below for further details.
Transportation expense was higher in 2017, when compared to 2016, primarily due to the increased sales volumes at Oil Sands operations.
DD&A expense for 2017 decreased when compared to 2016 due to a lower overall asset net book value, partially offset by a higher share of Syncrude DD&A as a result of additional working interests acquired in 2016.
Cash Operating Costs
| Year ended December 31 | 2017 | 2016 | 2015 | ||||||
| Oil Sands operations cash operating costs(1) reconciliation | |||||||||
| Operating, selling and general expense (OS&G) | 6 257 | 5 777 | 5 220 | ||||||
| Syncrude OS&G | (2 195 | ) | (1 749 | ) | (471 | ) | |||
| Non-production costs(2) | (102 | ) | (136 | ) | (97 | ) | |||
| Excess power capacity and other(3) | (232 | ) | (197 | ) | (245 | ) | |||
| Inventory changes | 1 | (63 | ) | — | |||||
| Oil Sands operations cash operating costs(1) ($ millions) | 3 729 | 3 632 | 4 407 | ||||||
| Oil Sands operations cash operating costs(1) ($/bbl) | 23.80 | 26.50 | 27.85 | ||||||
| Syncrude cash operating costs(1) reconciliation | |||||||||
| Syncrude OS&G | 2 195 | 1 749 | 471 | ||||||
| Non-production costs(2) | (37 | ) | (31 | ) | (14 | ) | |||
| Syncrude cash operating costs(1) ($ millions) | 2 158 | 1 718 | 457 | ||||||
| Syncrude cash operating costs(1) ($/bbl) | 44.05 | 35.95 | 42.00 | ||||||
- (1)
- Non-GAAP financial measures. See the Advisories – Non-GAAP Financial Measures section of this MD&A.
- (2)
- Significant non-production costs include, but are not limited to, share-based compensation expense and research expenses.
- (3)
- Excess power capacity and other includes, but is not limited to, the operational revenue impacts of excess power from cogeneration units and the natural gas expense recorded as part of a non-monetary arrangement involving a third-party processor.
Oil Sands operations cash operating costs averaged $23.80/bbl in 2017, the lowest in over a decade, compared to $26.50/bbl in 2016. The decrease was due to increased production combined with the company's ability to sustain the cost reductions achieved in recent years. Total Oil Sands operations cash operating costs increased to $3.729 billion from $3.632 billion in the prior year, primarily as a result of higher production combined with an inventory draw, compared to an inventory build in the prior year.
In 2017, non-production costs, which are excluded from Oil Sands operations cash operating costs, were lower than the prior year, primarily due to a decrease in share-based compensation which was attributed to a smaller increase in the company's share price in the current year.
Excess power capacity and other was higher than the prior year due to increased cogeneration power sales and non-monetary natural gas consumption, both attributed to increased production.
32 2017 ANNUAL REPORT Suncor Energy Inc.
Syncrude cash operating costs per barrel increased to $44.05 in 2017, compared to $35.95 in the previous year, primarily as a result of the increase in operating and maintenance costs noted above. In addition, Suncor's share of Syncrude cash operating costs increased to $2.158 billion from $1.718 billion in the previous year as a result of additional working interests acquired partway through 2016.
Planned Maintenance
Planned Upgrader 1 maintenance at Oil Sands Base and coker maintenance at Syncrude are scheduled for completion within the second quarter of 2018. Additional maintenance events at Upgrader 2 and Syncrude are scheduled to begin in the third quarter of 2018, with completion extending into the early part of the fourth quarter of 2018. The anticipated impact of these maintenance events has been reflected in the company's 2018 guidance.
EXPLORATION AND PRODUCTION
2017 Highlights
- •
- First oil at the Hebron project was successfully achieved ahead of schedule in the fourth quarter of 2017.
- •
- E&P production increased to 121,600 boe/d from 117,900 boe/d in the prior year, due to production from East Coast Canada development drilling and Libya production offsetting natural declines from U.K. and East Coast Canada assets.
- •
- Operating costs were reduced by 14%, primarily as a result of continued focus on cost reduction efforts and a stronger Canadian dollar which reduced expenses in the U.K.
- •
- The West White Rose Project was sanctioned during the second quarter of 2017. Suncor is a non-operating partner with a blended working interest of approximately 26%. First oil is targeted for 2022, with the company's share of peak production estimated to be 20,000 bbls/d.
Strategy and Investment Update
The Exploration and Production segment focuses primarily on low-cost projects that deliver significant returns, cash flow and long-term value. Suncor is currently evaluating exploration and development opportunities off the east coast of Canada, offshore Norway and in the U.K. North Sea to provide diverse and lower cost conventional production.
The Hebron project successfully achieved first oil ahead of schedule late in 2017. In 2018, drilling will continue with a focus on ramping up production to an estimated peak of more than 30,000 bbls/d, net to Suncor, after a ramp up period of several years.
The company also has ongoing development activities offshore the east coast of Canada and the U.K., intended to leverage existing facilities and infrastructure to provide incremental production and extend the productive life of existing fields. These activities are planned to continue in 2018, along with development work on the Norwegian Oda project and the Fenja development project in Norway, subject to the closing of the company's acquisition, and pre-sanction design work on the Rosebank future development project in the U.K.
Financial Highlights
| Year ended December 31 ($ millions) | 2017 | 2016 | 2015 | ||||||
| Gross revenues(1) | 3 177 | 2 432 | 2 541 | ||||||
| Less: Royalties(1) | (266 | ) | (201 | ) | (196 | ) | |||
| Operating revenues, net of royalties | 2 911 | 2 231 | 2 345 | ||||||
| Net earnings (loss) | 732 | 190 | (758 | ) | |||||
| Adjusted for: | |||||||||
| Impact of income tax rate adjustments on deferred income taxes | 14 | (180 | ) | (373 | ) | ||||
| Impairments | — | — | 1 213 | ||||||
| Insurance proceeds | — | — | (75 | ) | |||||
| Operating earnings(2) | 746 | 10 | 7 | ||||||
| E&P Canada | 159 | (58 | ) | (14 | ) | ||||
| E&P International | 587 | 68 | 21 | ||||||
| Funds from operations(2) | 1 725 | 1 313 | 1 386 | ||||||
- (1)
- Production, revenues and royalties from the company's Libya operations have been presented in the E&P section of this document on an entitlement basis and exclude an equal and offsetting gross up of revenues and royalties, which is required for presentation purposes in the company's financial statements under the working-interest basis.
- (2)
- Non-GAAP financial measures. See the Advisories – Non-GAAP Financial Measures section of this MD&A.
2017 ANNUAL REPORT Suncor Energy Inc. 33
Bridge Analysis of Operating Earnings($ millions)(1)
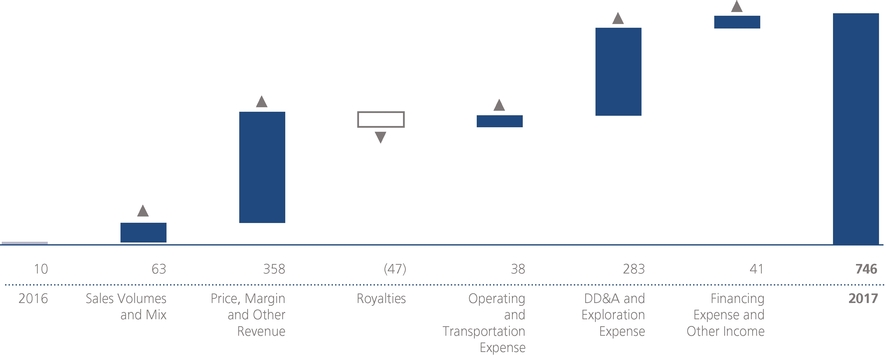
- (1)
- For an explanation of the construction of this bridge analysis, see the Advisories – Non-GAAP Financial Measures section of this MD&A.
Operating earnings were $159 million for E&P Canada in 2017, compared to an operating loss of $58 million in the prior year. The improvement was primarily due to increased price realizations, consistent with higher crude benchmarks, lower exploration charges and lower operating expenses, partially offset by increased royalties.
Operating earnings for E&P International were $587 million in 2017, compared to $68 million in 2016, with the increase primarily due to higher realized crude prices, decreased DD&A, an increase in production at Libya, and lower operating expenses.
Funds from operations were $1.725 billion in 2017, compared to $1.313 billion in 2016. The increase was largely due to the same factors that impacted operating earnings above, apart from the decrease in non-cash DD&A and exploration charges.
Production Volumes
| Year ended December 31 | 2017 | 2016 | 2015 | |||||
| E&P Canada | ||||||||
| Terra Nova (mbbls/d) | 11.5 | 12.4 | 13.5 | |||||
| Hibernia (mbbls/d) | 28.5 | 26.8 | 18.1 | |||||
| White Rose (mbbls/d) | 11.4 | 10.9 | 12.2 | |||||
| Hebron (mbbls/d) | 0.4 | — | — | |||||
| North America Onshore (mboe/d) | 1.9 | 2.8 | 3.2 | |||||
| 53.7 | 52.9 | 47.0 | ||||||
| E&P International | ||||||||
| Buzzard (mboe/d) | 43.8 | 46.0 | 49.8 | |||||
| Golden Eagle (mboe/d) | 19.6 | 18.6 | 14.8 | |||||
| United Kingdom (mboe/d) | 63.4 | 64.6 | 64.6 | |||||
| Libya (mbbls/d)(1) | 4.5 | 0.4 | 2.8 | |||||
| 67.9 | 65.0 | 67.4 | ||||||
| Total Production (mboe/d) | 121.6 | 117.9 | 114.4 | |||||
| Production Mix (liquids/gas) (%) | 97/3 | 96/4 | 96/4 | |||||
| Total Sales Volumes (mboe/d) | 120.8 | 119.3 | 110.6 | |||||
- (1)
- Effective in 2016, production volumes for Libya are presented on an entitlement basis.
E&P Canada production averaged 53,700 boe/d in 2017, compared to 52,900 boe/d in 2016, with production from development drilling at existing facilities more than offsetting natural declines.
34 2017 ANNUAL REPORT Suncor Energy Inc.
E&P International production increased to 67,900 boe/d in 2017, compared to 65,000 boe/d in 2016, due to increased production from Libya, partially offset by lower Buzzard production attributed to natural declines and a third-party pipeline outage late in the year.
Price Realizations
| Year ended December 31 Net of transportation costs, but before royalties | 2017 | 2016 | 2015 | |||||
| Exploration and Production | ||||||||
| E&P Canada – Crude oil and natural gas liquids ($/bbl) | 69.14 | 57.37 | 62.87 | |||||
| E&P Canada – Natural gas ($/mcf) | 1.77 | 1.71 | 1.78 | |||||
| E&P International ($/boe) | 65.46 | 52.07 | 61.44 | |||||
| E&P average price ($/boe) | 66.20 | 53.34 | 60.53 | |||||
Average price realizations for crude oil from E&P Canada and E&P International in 2017 were higher than 2016, consistent with the increase in benchmark prices for Brent crude in 2017, partially offset by the impact of a stronger Canadian dollar on U.S. dollar benchmarks.
Expenses and Other Factors
Operating expenses were lower in 2017, compared to 2016, primarily due to a continued focus on cost reduction initiatives and favourable foreign exchange that reduced expenses in the U.K.
Exploration expenses decreased in 2017, compared to the prior year, due to the prior year incurring charges for non-commercial wells off the east coast of Canada.
DD&A expense decreased in 2017, compared to the prior year, primarily due to lower depletion rates at Buzzard as a result of an increase in reserve estimates at the start of 2017, partially offset by higher East Coast Canada volumes.
Planned Maintenance of Operated Assets
A planned four-week maintenance event at Terra Nova has been scheduled to commence in the third quarter of 2018. The anticipated impact of this maintenance has been reflected in the company's 2018 guidance.
REFINING AND MARKETING
2017 Highlights
- •
- The Refining and Marketing segment generated $2.164 billion in operating earnings and $2.841 billion of funds from operations in 2017 and continues to be a key component of the company's integrated business model.
- •
- Refinery crude throughput was a record 441,200 bbls/d in 2017, up from 428,600 bbls/d in 2016, allowing the company to take advantage of an improved business environment. Average refinery utilization was 96% in 2017, compared to 93% in 2016.
- •
- Refined product sales increased to 530,500 bbls/d, with record wholesale and retail sales in Canada.
- •
- Suncor completed the sale of its lubricants business for gross proceeds of $1.125 billion and an after-tax gain of $354 million.
- •
- The FIFO after-tax gain was $157 million in 2017, compared to an after-tax gain of $111 million in 2016.
Strategy and Investment Update
Suncor's downstream operations are a key component of its integrated business model. The Refining and Marketing network serves to maximize Suncor's integrated returns by extending the value chain from oil sands production to the end customer. The company operates its refineries at optimal levels of utilization to provide reliable offtake and secure pricing for a portion of our oil sands production.
Suncor's Petro-Canada branded network maintained its position as a leading retailer by market share in major urban areas of Canada and as a bulk supplier of refined crude products through the wholesale channel. Suncor plans to continue to leverage the strong brand to increase non-petroleum revenues through the company's network of convenience stores and car washes.
Suncor also previously operated a lubricants business located in Mississauga, Ontario which was sold on February 1, 2017 for gross proceeds of $1.125 billion and an after-tax gain of $354 million. A long-term arrangement has been completed whereby Suncor will continue to supply the lubricants plant with feedstock from the Montreal refinery and the lubricants business will continue to use the Petro-Canada brand. Prior to the sale, the lubricants business contributed $8 million in net earnings and $11 million in funds from operations in 2017.
2017 ANNUAL REPORT Suncor Energy Inc. 35
Financial Highlights
| Year ended December 31 ($ millions) | 2017 | 2016 | 2015 | ||||||
| Operating revenues | 19 963 | 17 567 | 19 882 | ||||||
| Net earnings | 2 658 | 1 890 | 2 306 | ||||||
| Adjusted for: | |||||||||
| Impact of income tax rate adjustments on deferred taxes | (140 | ) | — | 36 | |||||
| Gain on significant disposal | (354 | ) | — | (68 | ) | ||||
| Operating earnings(1) | 2 164 | 1 890 | 2 274 | ||||||
| Refining and Supply | 1 902 | 1 527 | 1 904 | ||||||
| Marketing | 262 | 363 | 370 | ||||||
| Funds from operations(1) | 2 841 | 2 606 | 2 921 | ||||||
- (1)
- Non-GAAP financial measures. See the Advisories – Non-GAAP Financial Measures section of this MD&A.
Bridge Analysis of Operating Earnings($ millions)(1)
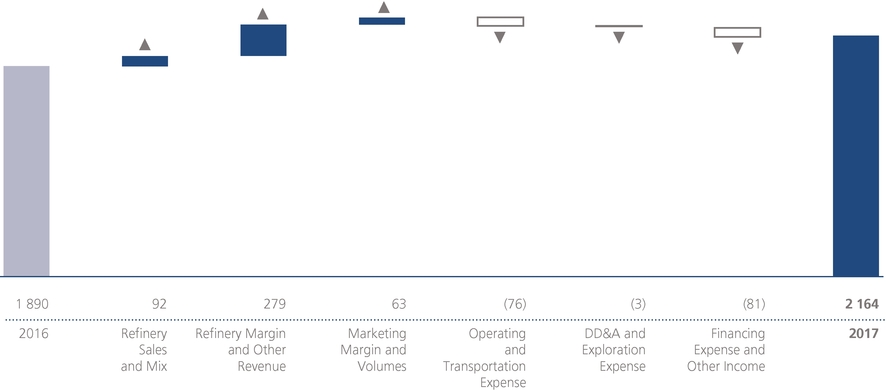
- (1)
- For an explanation of the construction of this bridge analysis, see the Advisories – Non-GAAP Financial Measures section of this MD&A.
Refining and Product Supply contributed operating earnings of $1.902 billion in 2017, compared to $1.527 billion in 2016. The increase was due to improved benchmark crack spreads in 2017, a higher FIFO gain and increased crude throughput, partially offset by the stronger Canadian dollar, the impact of the sale of the lubricants business early in 2017 and increased refinery maintenance expenses.
Marketing operating earnings of $262 million in 2017 decreased from $363 million in 2016, due primarily to the sale of the company's lubricants business early in 2017. After removing the impact of the lubricants sale, Marketing operating earnings in 2017 improved over 2016 as a result of increased refined product sales, including record wholesale and retail sales in Canada, partially offset by additional associated selling costs.
Funds from operations were $2.841 billion in 2017, compared to $2.606 billion in 2016, due primarily to the same factors that impacted operating earnings described above.
In 2017, Suncor completed the sale of its Petro-Canada lubricants business, which contributed $132 million in net earnings and $183 million in funds from operations in 2016. The impact of the lubricants sale has been reflected in Financing Expense and Other Income in the bridge analysis above.
36 2017 ANNUAL REPORT Suncor Energy Inc.
Volumes
| Year ended December 31 | 2017 | 2016 | 2015 | |||||
| Crude oil processed (mbbls/d) | ||||||||
| Eastern North America | 206.4 | 203.1 | 208.1 | |||||
| Western North America | 234.8 | 225.5 | 224.0 | |||||
| Total | 441.2 | 428.6 | 432.1 | |||||
| Refinery utilization(1)(2) (%) | ||||||||
| Eastern North America | 93 | 92 | 94 | |||||
| Western North America | 98 | 94 | 93 | |||||
| Total | 96 | 93 | 94 | |||||
| Refined Product Sales (mbbls/d) | ||||||||
| Gasoline | 242.9 | 244.3 | 246.2 | |||||
| Distillate | 199.3 | 186.1 | 198.0 | |||||
| Other | 88.3 | 91.0 | 79.1 | |||||
| Total | 530.5 | 521.4 | 523.3 | |||||
| Refining gross margin(2) ($/bbl) | 24.20 | 20.30 | 24.90 | |||||
| Refining operating expense(2) ($/bbl) | 5.05 | 5.10 | 5.10 | |||||
- (1)
- Refinery utilization is the amount of crude oil and natural gas plant liquids run through crude distillation units, expressed as a percentage of the capacity of these units.
- (2)
- Refining gross margin and refining operating expense are non-GAAP financial measures. See the Advisories – Non-GAAP Financial Measures section of this MD&A.
Refinery utilization in Eastern North America averaged 93% in 2017, compared to 92% in 2016. The increase from the prior year was primarily due to improved reliability at both the Sarnia and Montreal refineries, partially offset by the impact of a third-party power outage at the Montreal refinery during the fourth quarter of 2017.
Refinery utilization in Western North America averaged 98% in 2017, compared to 94% in 2016. The increase from the prior year was primarily due to fewer planned maintenance activities in 2017, compared to 2016.
Total refined product sales in 2017 were higher than 2016, reflecting stronger product demand in Canada.
Prices and Margins
Refining and Product Supply prices and margins were higher in 2017 compared to 2016.
- •
- Higher benchmark refining crack spreads and improved product location differentials, partially offset by the impact of the stronger Canadian dollar.
- •
- In 2017, the impact of FIFO inventory accounting, as used by the company, relative to an estimated LIFO(1) basis of accounting, had a positive impact on net earnings of approximately $157 million after-tax, compared to a positve impact of $111 million after-tax in 2016, for a favourable year-over-year impact of $46 million.
Marketing unit margins in 2017 were comparable to the prior year.
Expenses and Other Factors
Operating expenses were lower in 2017 compared to 2016, primarily due to the impact of the sale of the company's lubricants business early in 2017. After removing the impact of the sale, operating costs increased in 2017 when compared to 2016 as a result of additional selling costs associated with higher retail and wholesale sales volumes and an increase in refinery maintenance costs.
Planned Maintenance
The Edmonton refinery has a planned seven-week maintenance event, which includes a one-month full refinery turnaround, and the Commerce City refinery has a four-week turnaround event, both of which are scheduled to begin late in the first quarter of 2018 and extend into the second quarter of 2018. The Sarnia refinery has a six-week turnaround event in the second quarter of 2018. The Montreal refinery has a planned three-week maintenance event scheduled for the second quarter and a five-week maintenance event scheduled to begin in the third quarter of 2018, and the Commerce City refinery has a two-week maintenance event scheduled to begin in the fourth quarter. The anticipated impact of these maintenance events has been reflected in the company's 2018 guidance.
CORPORATE, ENERGY TRADING AND ELIMINATIONS
2017 Highlights
- •
- The early redemption of $3.2 billion in long-term debt, and US$750 million of new debt issued during the period.
- •
- The company distributed $2.124 billion in dividends in 2017, with a 10% increase in the dividend per share over the prior year.
- •
- Suncor commenced a new NCIB in the second quarter of 2017, and repurchased $1.413 billion of its own shares for cancellation.
- (1)
- The estimated impact of the LIFO method is a non-GAAP financial measure. See the Advisories – Non-GAAP Financial Measures section of this MD&A.
2017 ANNUAL REPORT Suncor Energy Inc. 37
- •
- Suncor completed the sale of its interests in the Cedar Point and Ripley wind facilities for total aggregate proceeds of $339 million and an after-tax gain of $83 million.
- •
- Subsequent to the end of the year, Suncor's Board of Directors approved a quarterly dividend of $0.36 per common share, which represents an increase of 12.5% over the quarterly 2017 dividend, and also approved a further $2.0 billion share repurchase program, continuing to demonstrate the company's ability to generate cash flow and commitment to return cash to shareholders.
Strategy and Investment Update
The Energy Trading business supports the company's production by securing market access, optimizing price realizations, managing inventory levels and managing the impacts of external market factors, such as pipeline disruptions or outages at refining customers, while generating trading earnings through established strategies. The Energy Trading business continues to evaluate additional pipeline agreements to support long-term planned production growth.
The Renewable Energy business supports Suncor's commitment to developing and supplying energy options that meet the needs of both today and tomorrow. Investment activities include development, construction and ownership of Suncor- operated and joint venture partner-operated renewable power assets across Canada. In addition to the existing assets, Suncor holds a number of sites for future wind and solar power projects that are in various stages of development.
Financial Highlights
| Year ended December 31 ($ millions) | 2017 | 2016 | 2015 | ||||||
| Net earnings (loss) | 59 | (486 | ) | (2 687 | ) | ||||
| Adjusted for: | |||||||||
| Unrealized foreign exchange (gain) loss on U.S. dollar denominated debt | (702 | ) | (524 | ) | 1 930 | ||||
| Loss (gain) on interest rate swaps | 20 | (6 | ) | — | |||||
| Non-cash loss on early payment of long-term debt | 28 | 73 | — | ||||||
| Gain on significant disposal | (83 | ) | — | — | |||||
| Impact of income tax rate adjustments on deferred income taxes | 2 | — | (5 | ) | |||||
| Derecognition and impairments | — | 31 | — | ||||||
| COS acquisition and related costs | — | 38 | — | ||||||
| Restructuring charges | — | — | 57 | ||||||
| Operating (loss) earnings(1) | (676 | ) | (874 | ) | (705 | ) | |||
| Renewable Energy | (4 | ) | 38 | 16 | |||||
| Energy Trading | (62 | ) | 4 | 36 | |||||
| Corporate | (528 | ) | (864 | ) | (799 | ) | |||
| Eliminations | (82 | ) | (52 | ) | 42 | ||||
| Funds used in operations(1) | (165 | ) | (600 | ) | (336 | ) | |||
- (1)
- Non-GAAP financial measures. See the Advisories – Non-GAAP Financial Measures section of this MD&A.
Renewable Energy
| Year ended December 31 | 2017 | 2016 | 2015 | ||||
| Power generation marketed (gigawatt hours)(1) | 255 | 478 | 440 | ||||
- (1)
- Power generated includes curtailed production for which the company was compensated.
Suncor's Renewable Energy assets recorded an operating loss of $4 million during the year, compared to operating earnings of $38 million in 2016. The decrease was due in part to lower production associated with the sale of the company's interest in the Cedar Point and Ripley wind facilities in 2017, as well as an increase in development costs during the year.
Energy Trading
Energy Trading activities reported an operating loss of $62 million in 2017, compared to operating earnings of $4 million in 2016. The decrease was primarily due to continued weak crude location differentials during 2017.
38 2017 ANNUAL REPORT Suncor Energy Inc.
Corporate
Corporate incurred an operating loss of $528 million in 2017, compared to $864 million in 2016. The improvement was primarily due to a decrease in corporate support costs, attributed to the company's continued cost reduction efforts combined with a decrease in share-based compensation expense, increased capitalized interest, a larger operational foreign exchange gain and lower interest expense as a result of debt repayments in 2017. Suncor capitalized $729 million of its borrowing costs in 2017 as part of the cost of major development assets and construction projects in progress, compared to $596 million in the prior year. The increase was driven by higher accumulated capital project balances for Fort Hills and Hebron. With the completion of both of these current growth projects, the company expects to capitalize significantly less interest in 2018.
Eliminations
Eliminations reflect the deferral or realization of profit on crude oil sales from Oil Sands and East Coast Canada to Refining and Marketing. Consolidated profits are only realized when the company sells the products produced from intersegment purchases of crude feedstock to third parties. In 2017, the company eliminated $82 million of after-tax intersegment profit, compared to $52 million in the prior year. The increase in eliminated profit in 2017 is due to an increased volume of refined product held at the refineries, in anticipation of significant turnaround activity in 2018, and the deferral of higher margins due to the increase in crude pricing.
2017 ANNUAL REPORT Suncor Energy Inc. 39
5. FOURTH QUARTER 2017 ANALYSIS
Financial and Operational Highlights
| Year ended December 31 ($ millions, except as noted) | 2017 | 2016 | |||||
| Net earnings (loss) | |||||||
| Oil Sands | 670 | 276 | |||||
| Exploration and Production | 217 | 54 | |||||
| Refining and Marketing | 886 | 524 | |||||
| Corporate, Energy Trading and Eliminations | (391 | ) | (323 | ) | |||
| Total | 1 382 | 531 | |||||
| Operating earnings (loss)(1) | |||||||
| Oil Sands | 615 | 316 | |||||
| Exploration and Production | 231 | 54 | |||||
| Refining and Marketing | 746 | 524 | |||||
| Corporate, Energy Trading and Eliminations | (282 | ) | (258 | ) | |||
| Total | 1 310 | 636 | |||||
| Funds from (used in) operations(1) | |||||||
| Oil Sands | 1 780 | 1 372 | |||||
| Exploration and Production | 431 | 385 | |||||
| Refining and Marketing | 935 | 722 | |||||
| Corporate, Energy Trading and Eliminations | (130 | ) | (114 | ) | |||
| Total | 3 016 | 2 365 | |||||
| Production volumes (mboe/d) | |||||||
| Oil Sands | 621.2 | 620.4 | |||||
| Exploration and Production | 115.2 | 118.1 | |||||
| Total | 736.4 | 738.5 | |||||
- (1)
- Non-GAAP financial measures. See the Advisories – Non-GAAP Financial Measures section of this MD&A.
Net Earnings
Suncor's consolidated net earnings for the fourth quarter of 2017 were $1.382 billion, compared to net earnings of $531 million for the prior year quarter. Net earnings were primarily affected by the same factors that influenced operating earnings described subsequently in this section of this MD&A. Other items affecting net earnings over these periods included:
- •
- The after-tax unrealized foreign exchange impact on the revaluation of U.S. dollar denominated debt was a loss of $91 million for the fourth quarter of 2017, compared to a loss of $222 million for the fourth quarter of 2016.
- •
- In the fourth quarter of 2017, Suncor recognized a net deferred tax recovery of $124 million related to a decrease in the U.S. corporate tax rate from 35% to 21%, including a $140 million recovery in the R&M segment, offset by a $14 million expense in the E&P segment and a $2 million expense in the Corporate segment.
- •
- In the fourth quarter of 2017, the company received after-tax proceeds of $55 million ($76 million before tax), recorded in the Oil Sands segment, for property damage insurance related to the facility incident at Syncrude that occurred in the first quarter of 2017.
- •
- In the fourth quarter of 2017, the company recorded an after-tax loss of $18 million in the Corporate segment, for early payment of debt.
- •
- In the fourth quarter of 2017, the company recognized an after-tax gain on forward interest rate swaps associated with issued debt of $2 million in the Corporate segment due to changes in long-term interest rates; the non-cash after-tax gain on forward interest rate swaps due to an increase in long-term interest rates was $188 million in the fourth quarter of 2016.
- •
- During the fourth quarter of 2016, the company recorded after-tax derecognition charges of $40 million on certain upgrading and logistics assets in the Oil Sands segment as a result of the uncertainty of future benefits from these assets, as well as $31 million in the Corporate segment relating to an initial investment in an undeveloped pipeline and on certain renewable energy development assets as a result of the uncertainty of future benefits from these assets.
Funds from Operations
Consolidated funds from operations was $3.016 billion for the fourth quarter of 2017, compared to $2.365 billion for the prior year quarter. Funds from operations were impacted by the same cash factors that affected operating earnings in the Segmented Analysis described below.
Segmented Analysis
Oil Sands
Oil Sands operating earnings for the fourth quarter of 2017 were $615 million, compared to earnings of $316 million in the prior year quarter. The improvement was due to higher crude price realizations, increased crude oil production and sales, and lower operating costs, partially offset by the impact of a stronger Canadian dollar and an increase in royalties, resulting from higher bitumen pricing and the prior year quarter including the impact of favourable royalty assessments.
Production volumes for Oil Sands operations were 446,800 bbls/d in the fourth quarter of 2017, compared to 433,400 bbls/d in the prior year quarter, with the increase being driven by improved mining and extraction reliability,
40 2017 ANNUAL REPORT Suncor Energy Inc.
bitumen froth production received from Fort Hills, which was processed at Oil Sands Base into SCO, and record Firebag production.
Sales volumes for Oil Sands operations increased to 461,700 bbls/d in the fourth quarter of 2017, from 420,600 bbls/d in the prior year quarter, as a result of the increase in production combined with a draw of inventory. Suncor's share of Syncrude sales was 174,400 bbls/d in the fourth quarter of 2017, compared to 187,000 bbls/d in the prior year quarter. Both quarters had strong upgrader reliability at 94% and 102%, respectively.
Exploration and Production
Exploration and Production operating earnings were $231 million in the fourth quarter of 2017, compared to $54 million in the fourth quarter of 2016. Operating earnings increased primarily due to higher crude price realizations, lower exploration expense and DD&A, and lower royalties, partially offset by lower production and a build in East Coast Canada inventory in the current year quarter compared to a draw in the prior year quarter.
Production volumes were 115,200 boe/d in the fourth quarter of 2017, compared to 118,100 boe/d in the fourth quarter of 2016. The decrease was primarily due to lower production at East Coast Canada as a result of natural declines and a third-party pipeline outage in the U.K. that impacted Buzzard, partially offset by increased production from Libya, initial production from Hebron and additional production from development drilling at existing East Coast Canada facilities.
Refining and Marketing
Refining and Marketing operating earnings were $746 million in the fourth quarter of 2017, compared to operating earnings of $524 million for the fourth quarter of 2016. The increase was primarily due to higher benchmark crack spreads, a FIFO gain of $180 million, compared to $114 million in the prior period quarter, and record wholesale sales volumes, partially offset by the impact of a stronger Canadian dollar.
Refinery crude throughput of 94% in the fourth quarter of 2017 was comparable to 93% in the prior year quarter.
Corporate, Energy Trading and Eliminations
The operating loss for Corporate, Energy Trading and Eliminations in the fourth quarter of 2017 was $282 million, compared to $258 million in the fourth quarter of 2016. The increase was due primarily to higher intersegment profit eliminations, an operating loss in the Energy Trading business, due to weaker crude locational spreads and lower Renewable Energy earnings as a result of the sale of Suncor's interest in the Cedar Point and Ripley wind facilities. These factors were partially offset by lower share-based compensation expense for the quarter, interest savings as a result of early debt repayment and increased capitalized interest.
2017 ANNUAL REPORT Suncor Energy Inc. 41
Financial Summary
| Three months ended ($ millions, unless otherwise noted) | Dec 31 2017 | Sept 30 2017 | June 30 2017 | Mar 31 2017 | Dec 31 2016 | Sept 30 2016 | June 30 2016 | Mar 31 2016 | ||||||||||||
| Total production (mboe/d) | ||||||||||||||||||||
| Oil Sands | 621.2 | 628.4 | 413.6 | 590.6 | 620.4 | 617.5 | 213.1 | 565.8 | ||||||||||||
| Exploration and Production | 115.2 | 111.5 | 125.5 | 134.5 | 118.1 | 110.6 | 117.6 | 125.6 | ||||||||||||
| 736.4 | 739.9 | 539.1 | 725.1 | 738.5 | 728.1 | 330.7 | 691.4 | |||||||||||||
| Revenues and other income | ||||||||||||||||||||
| Operating revenues, net of royalties | 9 000 | 7 986 | 7 247 | 7 818 | 7 840 | 7 409 | 5 914 | 5 644 | ||||||||||||
| Other income | 41 | 43 | 16 | 25 | 301 | (15 | ) | (58 | ) | (67 | ) | |||||||||
| 9 041 | 8 029 | 7 263 | 7 843 | 8 141 | 7 394 | 5 856 | 5 577 | |||||||||||||
| Net earnings (loss) | 1 382 | 1 289 | 435 | 1 352 | 531 | 392 | (735 | ) | 257 | |||||||||||
| per common share – basic (dollars) | 0.84 | 0.78 | 0.26 | 0.81 | 0.32 | 0.24 | (0.46 | ) | 0.17 | |||||||||||
| per common share – diluted (dollars) | 0.84 | 0.78 | 0.26 | 0.81 | 0.32 | 0.24 | (0.46 | ) | 0.17 | |||||||||||
| Operating earnings (loss)(1) | 1 310 | 867 | 199 | 812 | 636 | 346 | (565 | ) | (500 | ) | ||||||||||
| per common share – basic(1) (dollars) | 0.79 | 0.52 | 0.12 | 0.49 | 0.38 | 0.21 | (0.36 | ) | (0.33 | ) | ||||||||||
| Funds from operations(1) | 3 016 | 2 472 | 1 627 | 2 024 | 2 365 | 2 025 | 916 | 682 | ||||||||||||
| per common share – basic(1) (dollars) | 1.83 | 1.49 | 0.98 | 1.21 | 1.42 | 1.22 | 0.58 | 0.45 | ||||||||||||
| Cash flow provided by operating activities | 2 755 | 2 912 | 1 671 | 1 628 | 2 791 | 1 979 | 862 | 48 | ||||||||||||
| per common share – basic (dollars) | 1.67 | 1.75 | 1.00 | 0.98 | 1.68 | 1.19 | 0.54 | 0.03 | ||||||||||||
| ROCE(1) (%) for the twelve months ended | 6.7 | 5.5 | 4.9 | 3.5 | 0.4 | (3.9 | ) | (4.1 | ) | (1.9 | ) | |||||||||
| ROCE(1), excluding major projects in progress (%) for the twelve months ended | 8.6 | 7.0 | 6.2 | 4.4 | 0.5 | (4.6 | ) | (4.9 | ) | (2.2 | ) | |||||||||
| After-tax unrealized foreign exchange (loss) gain on U.S. dollar denominated debt | (91 | ) | 412 | 278 | 103 | (222 | ) | (112 | ) | (27 | ) | 885 | ||||||||
| Common share information (dollars) | ||||||||||||||||||||
| Dividend per common share | 0.32 | 0.32 | 0.32 | 0.32 | 0.29 | 0.29 | 0.29 | 0.29 | ||||||||||||
| Share price at the end of trading | ||||||||||||||||||||
| Toronto Stock Exchange (Cdn$) | 46.15 | 43.73 | 37.89 | 40.83 | 43.90 | 36.42 | 35.84 | 36.17 | ||||||||||||
| New York Stock Exchange (US$) | 36.72 | 35.05 | 29.20 | 30.75 | 32.69 | 27.78 | 27.73 | 27.81 | ||||||||||||
- (1)
- Non-GAAP financial measures. See the Advisories – Non-GAAP Financial Measures section of this MD&A. ROCE excludes capitalized costs related to major projects in progress. Operating earnings (loss) for each quarter are defined in the Non-GAAP Financial Measures Advisory section and reconciled to GAAP measures in the Consolidated Financial Information and Segment Results and Analysis sections of each quarterly Report to Shareholders issued by Suncor (Quarterly Reports) in respect of the relevant quarter. Funds from operations and ROCE for each quarter are defined and reconciled to GAAP measures in the Non-GAAP Financial Measures Advisory section of each Quarterly Report issued by Suncor in respect of the relevant quarter.
42 2017 ANNUAL REPORT Suncor Energy Inc.
Business Environment
| Three months ended (average for the period ended, except as noted) | Dec 31 2017 | Sept 30 2017 | June 30 2017 | Mar 31 2017 | Dec 31 2016 | Sept 30 2016 | June 30 2016 | Mar 31 2016 | |||||||||||
| WTI crude oil at Cushing | US$/bbl | 55.40 | 48.20 | 48.30 | 51.85 | 49.35 | 44.95 | 45.60 | 33.50 | ||||||||||
| Dated Brent crude | US$/bbl | 61.40 | 52.05 | 49.85 | 53.75 | 49.50 | 45.85 | 45.60 | 33.90 | ||||||||||
| Dated Brent/Maya FOB price differential | US$/bbl | 9.60 | 6.30 | 5.80 | 9.05 | 6.70 | 6.80 | 7.65 | 8.95 | ||||||||||
| MSW at Edmonton | Cdn$/bbl | 69.30 | 57.05 | 62.30 | 64.25 | 62.00 | 55.10 | 55.80 | 34.50 | ||||||||||
| WCS at Hardisty | US$/bbl | 43.10 | 38.25 | 37.20 | 37.30 | 35.00 | 31.45 | 32.30 | 19.30 | ||||||||||
| Light/heavy crude oil differential for WTI at Cushing less WCS at Hardisty | US$/bbl | 12.30 | 9.95 | 11.10 | 14.55 | 14.35 | 13.50 | 13.30 | 14.25 | ||||||||||
| Condensate at Edmonton | US$/bbl | 57.95 | 47.60 | 48.45 | 52.20 | 48.35 | 43.05 | 44.10 | 34.45 | ||||||||||
| Natural gas (Alberta spot) at AECO | Cdn$/mcf | 1.70 | 1.45 | 2.80 | 2.70 | 3.10 | 2.30 | 1.40 | 1.85 | ||||||||||
| Alberta Power Pool Price | Cdn$/MWh | 22.35 | 24.55 | 19.30 | 22.40 | 21.95 | 17.90 | 14.90 | 18.10 | ||||||||||
| New York Harbor 3-2-1 crack(1) | US$/bbl | 19.40 | 22.35 | 16.35 | 12.55 | 14.35 | 14.00 | 16.10 | 11.75 | ||||||||||
| Chicago 3-2-1 crack(1) | US$/bbl | 20.20 | 19.25 | 14.40 | 11.15 | 10.55 | 14.15 | 16.65 | 9.10 | ||||||||||
| Portland 3-2-1 crack(1) | US$/bbl | 22.10 | 26.80 | 21.25 | 18.45 | 14.95 | 18.75 | 19.30 | 13.00 | ||||||||||
| Gulf Coast 3-2-1 crack(1) | US$/bbl | 18.25 | 21.45 | 16.80 | 14.00 | 13.15 | 14.50 | 14.85 | 11.05 | ||||||||||
| Exchange rate | US$/Cdn$ | 0.79 | 0.80 | 0.74 | 0.76 | 0.75 | 0.77 | 0.78 | 0.73 | ||||||||||
| Exchange rate (end of period) | US$/Cdn$ | 0.80 | 0.80 | 0.77 | 0.75 | 0.74 | 0.76 | 0.77 | 0.77 | ||||||||||
- (1)
- 3-2-1 crack spreads are indicators of the refining margin generated by converting three barrels of WTI into two barrels of gasoline and one barrel of diesel. The crack spreads presented here generally approximate the regions into which the company sells refined products through retail and wholesale channels.
2017 ANNUAL REPORT Suncor Energy Inc. 43
Significant or Unusual Items Impacting Net Earnings
Trends in Suncor's quarterly earnings and cash flow provided by operating activities are driven primarily by production volumes, which can be significantly impacted by major maintenance events such as the planned upgrader maintenance and turnaround at Firebag that occurred in 2017, unplanned outages like those resulting from the Fort McMurray forest fires in the second quarter of 2016 and changes in non-cash working capital.
Trends in Suncor's quarterly earnings and cash flow provided by operating activities are also affected by changes in commodity prices, price differentials, refining crack spreads and foreign exchange rates, as described in the Financial Information section of this MD&A.
Suncor's consolidated net earnings for the fourth quarter of 2017 were $1.382 billion, compared to net earnings of $531 million for the prior year quarter. In addition to the impacts of changes in production volumes and business environment, net earnings over the last eight quarters were affected by the following events or significant adjustments:
- •
- The fourth quarter of 2017 included an after-tax unrealized foreign exchange loss on the revaluation of U.S. dollar denominated debt of $91 million, a net deferred tax recovery of $124 million related to a decrease in the U.S. corporate tax rate from 35% to 21%, after-tax proceeds of $55 million ($76 million before tax) in the Oil Sands segment for property damage insurance related to the facility incident at Syncrude that occurred in the first quarter of 2017, an after-tax loss of $18 million for early payment of debt and an after-tax gain on forward interest rate swaps of $2 million associated with issued debt.
- •
- The third quarter of 2017 included an unrealized after-tax foreign exchange gain of $412 million on the revaluation of U.S. dollar denominated debt and a non-cash after-tax gain of $10 million on forward interest rate swaps.
- •
- The second quarter of 2017 included an unrealized after-tax foreign exchange gain of $278 million on the revaluation of U.S. dollar denominated debt, an after-tax charge of $10 million for early payment of debt, net of associated realized foreign currency hedge gains, and a non-cash after-tax loss of $32 million on forward interest rate swaps and foreign currency derivatives.
- •
- The first quarter of 2017 included $437 million of after-tax gains on the sale of the company's lubricants business and its interest in the Cedar Point wind facility and an unrealized after-tax foreign exchange gain of $103 million on the revaluation of U.S. dollar denominated debt,
- •
- During the fourth quarter of 2016, the company recorded after-tax derecognition charges of $71 million related to certain upgrading and logistics assets, including an undeveloped pipeline and certain renewable energy development assets, as a result of the uncertainty of future benefits from these assets. The fourth quarter of 2016 also included a loss on the revaluation of U.S. dollar denominated debt of $222 million and a non-cash after-tax gain on forward interest rate swaps of $188 million.
- •
- In the third quarter of 2016, the U.K. government enacted a decrease in the supplementary charge rate on oil and gas profits in the North Sea that reduced the statutory tax rate on Suncor's earnings in the U.K. from 50% to 40%, effective January 1, 2016, resulting in a deferred income tax recovery of $180 million. The third quarter of 2016 also included an unrealized after-tax foreign exchange loss of $112 million on the revaluation of U.S. dollar denominated and a non-cash after-tax mark to market loss of $22 million on interest rate swaps.
- •
- The second quarter of 2016 included an unrealized after-tax foreign exchange loss of $27 million on the revaluation of U.S. dollar denominated debt, an after-tax charge of $73 million for early payment of debt and a non-cash after-tax loss of $70 million on forward interest rate swaps.
- •
- In the first quarter of 2016, the company incurred an after-tax charge of $38 million for the COS acquisition and integration costs, a non-cash after-tax loss of $90 million on interest rate and foreign currency derivatives and an unrealized after-tax foreign exchange gain of $885 million on the revaluation of U.S. dollar denominated debt.
44 2017 ANNUAL REPORT Suncor Energy Inc.
Capital and Exploration Expenditures by Segment
| Year ended December 31 ($ millions) | 2017 | 2016 | 2015 | |||||
| Oil Sands | 5 059 | 4 724 | 4 181 | |||||
| Exploration and Production | 824 | 1 139 | 1 459 | |||||
| Refining and Marketing | 634 | 685 | 821 | |||||
| Corporate, Energy Trading and Eliminations | 34 | 34 | 206 | |||||
| Total | 6 551 | 6 582 | 6 667 | |||||
| Less: capitalized interest on debt | (729 | ) | (596 | ) | (447 | ) | ||
| 5 822 | 5 986 | 6 220 | ||||||
Capital and Exploration Expenditures by Type(1)(2)(3)
| Year ended December 31, 2017 ($ millions) | Sustaining | Growth | Total | |||||
| Oil Sands | ||||||||
| Oil Sands Base | 1 374 | 172 | 1 546 | |||||
| In Situ | 305 | 8 | 313 | |||||
| Oil Sands Ventures | 556 | 2 096 | 2 652 | |||||
| Exploration and Production | 15 | 630 | 645 | |||||
| Refining and Marketing | 632 | — | 632 | |||||
| Corporate, Energy Trading and Eliminations | 34 | — | 34 | |||||
| 2 916 | 2 906 | 5 822 | ||||||
- (1)
- Capital expenditures in this table exclude capitalized interest on debt.
- (2)
- Growth capital expenditures include capital investments that result in i) an increase in production levels at existing Oil Sands and Refining and Marketing operations; ii) new facilities or operations that increase overall production; iii) new infrastructure and logistics that are required to support higher production levels; iv) new reserves or a positive change in the company's reserves profile in Exploration and Production operations; or v) margin improvement, by increasing revenues or reducing costs.
- (3)
- Sustaining capital expenditures include capital investments that i) ensure compliance or maintain relations with regulators and other stakeholders; ii) improve efficiency and reliability of operations or maintain productive capacity by replacing component assets at the end of their useful lives; iii) deliver existing proved developed reserves for Exploration and Production operations; or iv) maintain current production capacities at existing Oil Sands operations and Refining and Marketing operations.
In 2017, Suncor's capital expenditures totaled $5.822 billion on property, plant and equipment and exploration activities, and the company capitalized $729 million of interest in connection with major development assets and construction projects. Capital in 2017 includes expenditures of approximately $150 million related to the facility incident that occurred at Syncrude in the first quarter of 2017. In the fourth quarter of 2017, the company received an interim payment of $76 million of its anticipated property damage insurance proceeds related to the incident, and expects to receive an additional $64 million in 2018, for capital expenditures, net of recoveries, of $5.682 billion for the year.
Activity in 2017 included the following:
Oil Sands
Oil Sands Base
Oil Sands Base capital expenditures were $1.546 billion, of which $1.374 billion was directed towards sustaining activities. The focus in 2017 was on ensuring continued safe, reliable and efficient operations, with a focus on safety and environmental performance projects. Sustaining capital expenditures were primarily related to planned maintenance events throughout the year and other sustainment projects across operations.
Oil Sands Base growth capital of $172 million was primarily attributed to construction of the ETFD, which became operational in 2017 and supports market access for Fort Hills bitumen.
In Situ
In Situ capital expenditures were $313 million, of which $305 million was directed towards sustaining capital expenditures. Sustaining capital in 2017 was focused on the ongoing design and construction of well pads that are expected to maintain existing production levels at Firebag and MacKay River in future years as production from existing well pads declines.
2017 ANNUAL REPORT Suncor Energy Inc. 45
Growth capital of $8 million in 2017 was related to development of emerging properties and new technologies.
Oil Sands Ventures
Oil Sands ventures growth capital expenditures were $2.652 billion in 2017, with more than $2.0 billion spent on growth. Growth spending was primarily related to the Fort Hills mining project, where the mining and primary extraction assets began producing during 2017 and the first of three secondary extraction trains was successfully brought online subsequent to the end of year. Paraffinic froth-treated bitumen is now being produced and shipped to market and Fort Hills is expected to reach 90% of production capacity of 194,000 bbls/day by the end of 2018. With the Fort Hills project successfully commissioned, growth spending will decrease significantly in 2018.
During the fourth quarter of 2017, the Fort Hills partners resolved the commercial dispute regarding project funding and reached an agreement whereby Suncor and Teck each acquired an additional working interest in the Fort Hills project from Total. Under the terms of the agreement Suncor's share of the project increased to 53.06% and Teck's share increased to 20.89%, for approximate acquisition costs of $300 million and $120 million, respectively, and Total's share decreased to 26.05%. Working interests in the Fort Hills project may be further adjusted in accordance with the terms of the agreement and, on February 20, 2018, Suncor acquired an additional 0.49% interest in the Fort Hills project for consideration of $65 million.
Sustaining capital of $556 million in 2017 included Suncor's portion of Syncrude sustaining capital in 2017, which was primarily focused on permanent repairs following the facility incident in the first quarter of 2017, as well as other reliability and sustainment projects and sustaining activities at Fort Hills that will support the execution of the mine and tailings plan following the ramp up of production.
Subsequent to the end of the year, Suncor acquired an additional 5% interest in Syncrude from Mocal for US$730 million, or approximately $925 million, subject to closing adjustments. The transaction brings Suncor's total ownership share of Syncrude to 58.74% and adds an additional 17,500 bbls/d of SCO capacity.
Exploration and Production
Exploration and Production capital and exploration expenditures were $645 million in 2017, of which $630 million was directed towards growth and exploration. Growth spending was primarily directed to Hebron, where first oil was successfully achieved in the fourth quarter of 2017. Other E&P activity during 2017 included development drilling at Hibernia, White Rose and Terra Nova, as well as development work on the West White Rose Project, the Norwegian Oda project and pre-sanction design work on the Rosebank future development project in the U.K.
Subsequent to the end of the year, Suncor reached an agreement with Canbriam to exchange substantially all of Suncor's northeast B.C. mineral landholdings, including associated production, and consideration of $52 million for a 37% equity interest in Canbriam, a private natural gas company. The transaction is expected to close in the first quarter of 2018 and is subject to regulatory approval.
Subsequent to the end of the year, Suncor reached an agreement with Faroe Petroleum to purchase a 17.5% interest in the Fenja development project in Norway for $68 million. This mature, well defined project is awaiting regulatory approval and the transaction is expected to close in the second quarter of 2018, subject to customary closing conditions.
Refining and Marketing
Refining and Marketing capital expenditures were $632 million in 2017, all of which was directed to sustaining activities focused on planned maintenance events at the company's refineries, enhancements to retail operations and information technology upgrades.
46 2017 ANNUAL REPORT Suncor Energy Inc.
Significant Growth Projects Update(1)
| At December 31, 2017 | Working Interest (%) | Description | Cost Estimate ($ billions) | Project Spend to Date ($ billions) | First Oil Date(2) | |||||||
| Operated | ||||||||||||
| Fort Hills(3) | 53.06 | 102.8 mbbls/d | 8.4 – 8.6 | (5) | 8.7 | (5) | January 2018 | |||||
| Non-operated(4) | ||||||||||||
| Hebron | 21.03 | 31.6 mboe/d | 2.8 (+/-10% | ) | 2.4 | November 2017 | ||||||
- (1)
- The Capital Investment Update section contains forward-looking information. See the Advisories – Forward-Looking Information section of this MD&A for the material risks and assumptions underlying this forward-looking information.
- (2)
- Expenditure to complete the project may extend beyond the first oil date.
- (3)
- Cost Estimate and Project Spend to Date figures reflect the company's share of overall project cost as updated at the end of 2017 and is based on the original project scope, excluding capitalized interest.
- (4)
- Cost estimate is provided by the operator and reflects post-sanction estimates and expenditures.
- (5)
- The capital range and project spend to date include approximately $190 million related to the impact of foreign exchange due to weakness in the Canadian dollar. The working interest, description, capital range and project spend to date have been updated to reflect the 2.26% increased working interest acquired as part of the agreement with the co-owners of the project in late 2017 to resolve the commercial funding dispute. Subsequent to the end of the year, Suncor's interest in the Fort Hills project was further increased by 0.49%, in accordance with the terms of the arrangement.
The table above summarizes major growth projects that have been sanctioned for development by the company. In addition to the above significant projects, the West White Rose Project was sanctioned during the second quarter of 2017, with first oil targeted in 2022. Husky Energy Inc. is the operator and the project is expected to extend the life of the existing White Rose facilities, with the company's share of peak oil anticipated to be 20,000 bbls/d. Capital expenditures on the project were $66 million in 2017.
Other potential material growth projects have not yet received a final investment decision by the company or its Board of Directors.
Other Capital Projects
Suncor also anticipates 2018 capital expenditures to be directed to the following projects and initiatives:
Oil Sands Operations
For 2018, plans for sustaining capital will be to focus on tailings management, planned maintenance, which includes a major turnaround event in the spring at Upgrader 1 and a turnaround event at Upgrader 2 in the fall, and other investments to maintain production capacity at existing facilities, primarily related to new well pads for In Situ assets to offset natural production declines and development of an autonomous haul truck program to further improve the efficiency of mining operations.
Oil Sands Ventures
Sustaining capital expenditures in 2018 for Syncrude are expected to focus on reliability programs, planned maintenance and maintaining production capacity.
Sustaining capital expenditures in 2018 for Fort Hills will be focused on tailings management and projects to preserve production capacity, including mining equipment.
Exploration and Production
Growth capital in 2018 is expected to include development drilling at all offshore assets, development work on the Oda project and the Fenja development project, subject to the closing of the company's acquisition, as well as pre-sanction design work on the Rosebank future development project.
Refining and Marketing
The company expects that sustaining capital will focus on planned maintenance events, technological investments and routine asset replacement.
2017 ANNUAL REPORT Suncor Energy Inc. 47
8. FINANCIAL CONDITION AND LIQUIDITY
Liquidity and Capital Resources
| At December 31 ($ millions, except as noted) | 2017 | 2016 | 2015 | ||||||
| Net cash from (used in) | |||||||||
| Operating activities | 8 966 | 5 680 | 6 884 | ||||||
| Investing activities | (5 019 | ) | (7 507 | ) | (6 771 | ) | |||
| Financing activities | (4 223 | ) | 869 | (1 854 | ) | ||||
| Foreign exchange (loss) gain on cash and cash equivalents | (68 | ) | (75 | ) | 295 | ||||
| (Decrease) increase in cash and cash equivalents | (344 | ) | (1 033 | ) | (1 446 | ) | |||
| Cash and Cash equivalents, end of year | 2 672 | 3 016 | 4 049 | ||||||
| Return on Capital Employed (%)(1) | |||||||||
| Excluding major projects in progress | 8.6 | 0.5 | 0.6 | ||||||
| Including major projects in progress | 6.7 | 0.4 | 0.5 | ||||||
| Net debt to funds from operations(2) (times) | 1.4 | 2.4 | 1.7 | ||||||
| Interest coverage on long-term debt (times) | |||||||||
| Earnings basis(2)(3) | 6.5 | 0.5 | (1.8 | ) | |||||
| Funds from operations basis(2)(4) | 11.2 | 6.5 | 9.3 | ||||||
- (1)
- Non-GAAP financial measure. See the Advisories – Non-GAAP Financial Measures section of this MD&A.
- (2)
- Funds from operations and metrics that use funds from operations are non-GAAP financial measures. Please see the Advisories – Non-GAAP Financial Measures section of this MD&A.
- (3)
- Net earnings plus income taxes and interest expense, divided by the sum of interest expense and capitalized interest on debt.
- (4)
- Funds from operations plus current income taxes and interest expense, divided by the sum of interest expense and capitalized interest on debt.
Cash Flow provided by Operating Activities
Cash flow provided by operating activities was $8.966 billion in 2017, compared to $5.680 billion in 2016. The increase was primarily due to higher upstream price realizations and stronger benchmark crack spreads and refining margins, an increase in Oil Sands production and record refinery crude throughput combined with record retail and wholesale sales volumes in Canada, partially offset by an increase in non-cash working capital, as compared to a decrease in non-cash working capital in 2016.
Cash Flow used in Investment Activities
Cash flow used in investing activities was $5.019 billion in 2017 compared to $7.507 billion in 2016. The decrease was primarily due to proceeds received from the sale of the companys lubricants business and its interests in the Cedar Point and Ripley wind facilities. The prior year included the purchase of an additional 5% interest in the Syncrude project.
Cash Flow used in Financing Activities
Cash flow used in financing activities was $4.223 billion in 2017, compared to a source of cash of $869 million in 2016. The decrease was primarily related to the early repayment of long-term debt, the repurchase of the company's shares under the NCIB, partially offset by a bond issuance in the fourth quarter of 2017, an increase in short-term debt and the proceeds from the sale of a 49% interest in the ETFD, which has been treated as a financing activity due to the existence of non-discretionary distributions within the arrangement. In 2016, the source of cash provided from financing activities was due to the issuance of common shares and long-term debt and an increase in short-term debt, partially offset by the early repayment of a portion of the debt acquired in the COS acquisition.
Capital Resources
Suncor's capital resources consist primarily of cash flow provided by operating activities, cash and cash equivalents, available lines of credit and the realized proceeds from divestiture of non-core assets. Suncor's management believes the company will have the capital resources to fund its planned 2018 capital spending program of $4.5 to $5.0 billion and to meet current and future working capital requirements through cash balances and cash equivalents, cash flow provided by operating activities, available committed credit facilities, issuing commercial paper and, if needed, divesting of non-core assets and accessing capital markets. The company's cash flow provided by operating activities depends on a number of factors, including commodity prices, production and sales volumes, refining and marketing margins, operating expenses, taxes, royalties and foreign exchange rates.
The company has invested excess cash in short-term financial instruments that are presented as cash and cash equivalents.
48 2017 ANNUAL REPORT Suncor Energy Inc.
The objectives of the company's short-term investment portfolio are to ensure the preservation of capital, maintain adequate liquidity to meet Suncor's cash flow requirements and deliver competitive returns derived from the quality and diversification of investments within acceptable risk parameters. The maximum weighted average term to maturity of the short-term investment portfolio is not expected to exceed six months, and all investments will be with counterparties with investment grade debt ratings.
Available Sources of Liquidity
Cash and Cash Equivalents
Included in cash and cash equivalents of $2.672 billion at December 31, 2017 are short-term investments with weighted average terms to maturity of approximately 16 days. In 2017, the company earned approximately $32 million of interest income on this portfolio.
Financing Activities
Management of debt levels continues to be a priority for Suncor given the company's long-term growth plans and the volatility in commodity pricing. Suncor believes a phased and flexible approach to existing and future growth projects should assist the company in maintaining its ability to manage project costs and debt levels.
Suncor's interest on debt (before capitalized interest) in 2017 was $945 million, a decrease from $1.012 billion in 2016, primarily due to the early payment of more than $3.0 billion of long-term debt in the year, partially offset by the issuance of US$750 million of new debt.
Available lines of credit at December 31, 2017 decreased to $4.489 billion, compared to $7.467 billion at December 31, 2016, primarily as a result of management's decision to reduce the company's credit facility by $1.0 billion, the company's cancellation of a $950 million credit facility that was acquired through the acquisition of COS and an increase in short-term indebtedness. The decrease in the company's credit facility and the cancellation of the credit facility acquired through the acquisition of COS were executed in 2017 as the excess liquidity is no longer anticipated to be required with the Fort Hills and Hebron projects achieving first oil. The reduction will further reduce future financing expense.
A summary of total and unutilized credit facilities at December 31, 2017 is as follows:
| ($ millions) | 2017 | |||
| Fully revolving and expires in 2021 | 4 000 | |||
| Fully revolving and expires in 2020 | 2 504 | |||
| Fully revolving and expires in 2018/2019 | 1 580 | |||
| Can be terminated at any time at the option of the lenders | 140 | |||
| Total credit facilities | 8 224 | |||
| Credit facilities supporting outstanding commercial paper | (2 136 | ) | ||
| Credit facilities supporting standby letters of credit | (1 367 | ) | ||
| Total unutilized credit facilities(1) | 4 721 | |||
- (1)
- Available credit facilities for liquidity purposes were $4.489 billion at December 31, 2017 (December 31, 2016 – $7.467 billion).
Total Debt to Total Debt Plus Shareholders' Equity
Suncor is subject to financial and operating covenants related to its bank debt and public market debt. Failure to meet the terms of one or more of these covenants may constitute an Event of Default as defined in the respective debt agreements, potentially resulting in accelerated repayment of one or more of the debt obligations. The company is in compliance with its financial covenant that requires total debt to not exceed 65% of its total debt plus shareholders' equity. At December 31, 2017, total debt to total debt plus shareholders' equity was 25.6% (December 31, 2016 – 28.1%). The company is currently in compliance with all operating covenants as at December 31, 2017.
| At December 31 ($ millions, except as noted) | 2017 | 2016 | ||||
| Short-term debt | 2 136 | 1 273 | ||||
| Current portion of long-term debt | 71 | 54 | ||||
| Long-term debt | 13 372 | 16 103 | ||||
| Total debt | 15 579 | 17 430 | ||||
| Less: Cash and cash equivalents | 2 672 | 3 016 | ||||
| Net debt | 12 907 | 14 414 | ||||
| Shareholders' equity | 45 383 | 44 630 | ||||
| Total debt plus shareholders' equity | 60 962 | 62 060 | ||||
| Total debt to total debt plus shareholders' equity (%) | 25.6 | 28.1 | ||||
2017 ANNUAL REPORT Suncor Energy Inc. 49
Change in Net Debt
| ($ millions) | ||||
| Total debt – December 31, 2016 | 17 430 | |||
| Net decrease in long-term debt | (2 378 | ) | ||
| Increase in short-term debt | 981 | |||
| Foreign exchange on debt | (771 | ) | ||
| Capital leases, and other | 317 | |||
| Total Debt – December 31, 2017 | 15 579 | |||
| Less: Cash and cash equivalents – December 31, 2017 | 2 672 | |||
| Net Debt – December 31, 2017 | 12 907 | |||
At December 31, 2017, Suncor's net debt was $12.907 billion, compared to $14.414 billion at December 31, 2016. During 2017, total debt decreased by $1.851 billion, primarily due to the early repayment of more than $3.0 billion in long-term debt and unrealized foreign exchange gains on U.S. dollar denominated debt, partially offset by a bond issuance in the fourth quarter of 2017 and a net increase in the company's finance leases, which are primarily attributed to pipelines that will support Fort Hills.
For the year ended December 31, 2017, the company's net debt to funds from operations measure was 1.4 times, which is lower than management's maximum target of less than 3.0 times.
Credit Ratings
The company's credit ratings impact its cost of funds and liquidity. In particular, the company's ability to access unsecured funding markets and to engage in certain activities on a cost-effective basis is primarily dependent upon maintaining a strong credit rating. A lowering of the company's credit rating may also have potentially adverse consequences for the company's funding capacity or access to the capital markets, may affect the company's ability, and the cost, to enter into normal course derivative or hedging transactions, and may require the company to post additional collateral under certain contracts.
As at February 28, 2018, the company's long-term senior debt ratings are:
| Long-Term Senior Debt | Rating | Long-Term Outlook | |||
| Standard & Poor's | A- | Stable | |||
| Dominion Bond Rating Service | A (low | ) | Stable | ||
| Moody's Investors Service | Baa1 | Stable | |||
The company's commercial paper ratings are:
| Commercial Paper | Cdn Program Rating | U.S. Program Rating | |||
| Standard & Poor's | A-1 (low | ) | A-2 | ||
| Dominion Bond Rating Service | R-1 (low | ) | Not rated | ||
| Moody's Investors Service | Not rated | P2 | |||
Refer to the Description of Capital Structure – Credit Ratings section of Suncor's 2017 AIF for a description of credit ratings listed above.
Common Shares
Outstanding Shares
| December 31, 2017 (thousands) | |||
| Common shares | 1 640 983 | ||
| Common share options – non-exercisable | 17 363 | ||
| Common share options – exercisable | 13 747 | ||
As at February 27, 2018, the total number of common shares outstanding was 1,638,929,009 and the total number of exercisable and non-exercisable common share options outstanding was 35,103,694. Once exercisable, each outstanding common share option is convertible into one common share.
Share Repurchases
In 2017, the Toronto Stock Exchange (TSX) accepted a notice filed by Suncor of its intention to commence a new NCIB to purchase and cancel up to $2.0 billion of the company's shares beginning on May 2, 2017 and ending on May 1, 2018. In 2017, the company repurchased and cancelled 33.154 million shares at an average price of $42.61/share, for a total cost of $1.413 billion.
Subsequent to the end of the year, Suncor's Board of Directors approved a further $2.0 billion share repurchase program, continuing to demonstrate the company's ability to generate cash flow and commitment to return cash to shareholders.
Since commencing its share repurchase program in 2011, Suncor has purchased 194.5 million common shares for a total return to shareholders of $6.956 billion under this program.
50 2017 ANNUAL REPORT Suncor Energy Inc.
| At December 31 ($ millions, except as noted) | 2017 | 2016 | 2015 | 2014 | ||||||
| Share repurchase activities | ||||||||||
| Shares repurchased (thousands of common shares) | 33 154 | — | 1 230 | 42 027 | ||||||
| Weighted average repurchase price per share (dollars per share) | 42.61 | — | 34.93 | 39.76 | ||||||
| Share repurchase cost ($ millions) | 1 413 | — | 43 | 1 671 | ||||||
Contractual Obligations, Commitments, Guarantees, and Off-Balance Sheet Arrangements
In addition to the enforceable and legally binding obligations in the table below, Suncor has other obligations for goods and services that were entered into in the normal course of business, which may terminate on short notice, including commitments for the purchase of commodities for which an active, highly liquid market exists, and which are expected to be re-sold shortly after purchase.
The company does not believe it has any guarantees or off-balance sheet arrangements that have, or are reasonably likely to have, a current or future material effect on the company's financial condition or financial performance, including liquidity and capital resources.
In the normal course of business, the company is obligated to make future payments, including contractual obligations and non-cancellable commitments.
| Payment due by period | |||||||||||||||
| ($ millions) | 2018 | 2019 | 2020 | 2021 | 2022 | 2023 and beyond | Total | ||||||||
| Fixed and revolving term debt(1) | 2 839 | 970 | 681 | 2 069 | 818 | 17 954 | 25 331 | ||||||||
| Finance lease obligations | 71 | 36 | 39 | 45 | 49 | 1 079 | 1 319 | ||||||||
| Decommissioning and restoration costs(2) | 457 | 450 | 522 | 362 | 248 | 10 196 | 12 235 | ||||||||
| Operating lease agreements, pipeline capacity and energy services commitments | 2 102 | 1 657 | 1 668 | 1 529 | 1 339 | 11 049 | 19 344 | ||||||||
| Exploration work commitments | — | 115 | 138 | 157 | 87 | — | 497 | ||||||||
| Other long-term obligations(3) | 3 | 19 | 19 | 19 | 19 | — | 79 | ||||||||
| Total | 5 472 | 3 247 | 3 067 | 4 181 | 2 560 | 40 278 | 58 805 | ||||||||
- (1)
- Includes debt that is redeemable at Suncor's option and interest payments on fixed-term debt.
- (2)
- Represents the undiscounted amount of decommissioning and restoration costs.
- (3)
- Includes the Libya EPSA signature bonus and merger consent. See the Other Long-Term Liabilities note to the audited Consolidated Financial Statements.
Transactions with Related Parties
The company enters into transactions with related parties in the normal course of business. These transactions primarily include sales to associated entities in the company's Refining and Marketing segment. For more information on these transactions and for a summary of Compensation of Key Management Personnel, refer to Note 32 to the 2017 audited Consolidated Financial Statements.
Financial Instruments
Suncor periodically enters into derivative contracts for risk management purposes. The derivative contracts hedge risks related to purchases and sales of commodities, to manage exposure to interest rates and to hedge risks specific to individual transactions, such as currency risk associated with repayment of U.S. dollar denominated debt. For the year ended December 31, 2017, the pre-tax earnings impact for risk management activities was a loss of $19 million (2016 – pre-tax loss of $25 million).
The company's Energy Trading business uses crude oil, natural gas and refined products futures contracts, as well as other derivative financial instruments to optimize related trading strategies. For the year ended December 31, 2017, the pre-tax earnings impact for Energy Trading activities was a loss of $37 million (2016 – pre-tax loss of $47 million).
Gains or losses related to derivatives are recorded as Other Income in the Consolidated Statements of Comprehensive Income.
2017 ANNUAL REPORT Suncor Energy Inc. 51
| ($ millions) | Energy Trading | Risk Management | Total | |||||
| Fair value of contracts outstanding – December 31, 2015 | (18 | ) | 20 | 2 | ||||
| Cash settlements – paid (received) during the year | 29 | (13 | ) | 16 | ||||
| Unrealized losses recognized in earnings during the year | (47 | ) | (25 | ) | (72 | ) | ||
| Fair value outstanding – December 31, 2016 | (36 | ) | (18 | ) | (54 | ) | ||
| Cash settlements – (received) paid during the year | (12 | ) | 17 | 5 | ||||
| Unrealized losses recognized in earnings during the year | (37 | ) | (19 | ) | (56 | ) | ||
| Fair value outstanding – December 31, 2017 | (85 | ) | (20 | ) | (105 | ) | ||
The fair value of derivative financial instruments is recorded on the Consolidated Balance Sheet.
| Fair value of derivative contracts at December 31 ($ millions) | 2017 | 2016 | ||||
| Accounts receivable | 74 | 155 | ||||
| Accounts payable | (179 | ) | (209 | ) | ||
| (105 | ) | (54 | ) | |||
Risks Associated with Derivative Financial Instruments
Suncor may be exposed to certain losses in the event that counterparties to derivative financial instruments are unable to fulfil their obligations under these contracts. The company minimizes this risk by entering into agreements with investment grade counterparties. Risk is also minimized through regular management review of the potential exposure to and credit ratings of such counterparties. Suncor's exposure is limited to those counterparties holding derivative contracts with net positive fair values at a reporting date.
Suncor's risk management activities are subject to periodic reviews by management to determine appropriate hedging requirements based on the company's tolerance for exposure to market volatility, as well as the need for stable cash flow to finance future growth. Energy Trading activities are governed by a separate risk management group that reviews and monitors practices and policies and provides independent verification and valuation of these activities.
For further details on our derivative financial instruments, including assumptions made in the calculation of fair value, a sensitivity analysis of the effect of changes in commodity prices on our derivative financial instruments, and additional discussion of exposure to risks and mitigation activities, see the Financial Instruments and Risk Management note in the company's 2017 audited Consolidated Financial Statements.
52 2017 ANNUAL REPORT Suncor Energy Inc.
9. ACCOUNTING POLICIES AND CRITICAL ACCOUNTING ESTIMATES
Suncor's significant accounting policies are described in Note 3 to the audited Consolidated Financial Statements for the year ended December 31, 2017.
Recently Announced Accounting Pronouncements
The standards and interpretations that are issued, but not yet effective up to the date of issuance of the company's consolidated financial statements, and that may have an impact on the disclosures and financial position of the company, are disclosed below. The company intends to adopt these standards and interpretations, if applicable, when they become effective.
Revenue from Contracts with Customers
In May 2014, the IASB issued IFRS 15Revenue from Contracts with Customers. It replaces existing revenue recognition guidance and provides a single, principles-based five-step model to be applied to all contracts with customers. The company has adopted this standard on the effective date of January 1, 2018. The adoption of this standard will result in a change in presentation between Operating revenues net of royalties and the Operating, selling and general expense and Transportation expense line items; however, there will be no impact on the company's consolidated net earnings. Additional note disclosure will also be required.
Financial Instruments
In July 2014, IFRS 9 Financial Instruments was issued as a complete standard, including the requirements previously issued related to classification and measurement of financial assets and liabilities, and additional amendments to introduce a new expected loss impairment model for financial assets including credit losses. The company has adopted this standard on the effective date of January 1, 2018. IFRS 9 replaced the multiple classification and measurement models for financial assets that currently exist under IAS 39 Financial Instruments, and the basis on which financial assets are measured will determine their classification as either, at amortized cost, fair value through profit and loss, or fair value through other comprehensive income. Therefore, the adoption of this standard will result in a reclassification of financial assets currently classified as loans and receivables to financial assets at amortized cost, however there is no impact to the measurement of these financial assets. There will be no classification or measurement impact to the company's financial liabilities. Therefore, the adoption of this standard will not have any impact on the company's consolidated net earnings.
Leases
In January 2016, the IASB issued IFRS 16Leases which replaces the existing leasing standard (IAS 17Leases) and requires the recognition of most leases on the balance sheet. IFRS 16 effectively removes the classification of leases as either finance or operating leases and treats all leases as finance leases for lessees with exemptions for short-term leases where the term is twelve months or less and for leases of low-value items. The accounting treatment for lessors remains essentially unchanged, with the requirement to classify leases as either finance or operating. The company will adopt IFRS 16 on the effective date of January 1, 2019, and has selected the modified retrospective transition approach. Suncor has also elected to apply the optional exemptions for short-term and low-value leases. IFRS 16 is expected to materially increase the company's assets and liabilities, increase Depreciation, Depletion, Amortization expense, increase Financing expense and reduce Operating, Selling and General expense. Cash payments associated with operating leases are currently presented within Operating Activities, under IFRS 16 the cash flows will be allocated between Financing Activities for the repayment of the principal liability and Operating Activities for the financing expense portion. The overall impact to cash flow is unchanged. The company has a transition team to assess the impact of IFRS 16 and implement the necessary changes to accounting systems, business processes and internal controls as a result of the new standard. The transition team is currently in the process of reviewing and categorizing the company's contracts and implementing the required information systems changes; however, it is currently too early to quantify the impacts. The company will disclose additional information throughout 2018 on the progress of the transition including the estimated quantitative financial impacts.
Share-Based Payments
In June 2016, the IASB issued the final amendments to IFRS 2Share-based payments that clarify the classification and measurement of share-based payment transactions. This includes the effect of vesting and non-vesting conditions on the measurement of cash-settled share-based payments, share-based payment transactions with a net settlement feature for withholding tax obligations, and a modification to the terms and conditions of a share-based payment that changes the classification of the transaction from cash-settled to equity-settled. The amendments are to be applied prospectively and are effective for annual periods beginning on or after January 1, 2018, with earlier application permitted. The adoption of this standard will not have any impact on the company's consolidated financial statements.
Uncertainty over Income Tax Treatments
In June 2017, the IASB issued IFRIC 23Uncertainty over Income Tax Treatments. The interpretation clarifies the accounting for current and deferred tax liabilities and assets in circumstances in which there is uncertainty over income tax treatments. The interpretation requires an entity to
2017 ANNUAL REPORT Suncor Energy Inc. 53
consider whether it is probable that a taxation authority will accept an uncertain tax treatment. If the entity considers it to be not probable that a taxation authority will accept an uncertain tax provision the interpretation requires the entity to use the most likely amount or the expected value. The amendments are to be applied retrospectively and are effective for annual periods beginning on or after January 1, 2019, with earlier application permitted. The adoption of this amendment will not have any impact on the company's consolidated financial statements.
Significant Accounting Estimates and Judgments
The preparation of financial statements in accordance with IFRS requires management to make estimates and judgments that affect reported assets, liabilities, revenues, expenses, gains, losses, and disclosures of contingencies. These estimates and judgments are subject to change based on experience and new information. The financial statement areas that require significant estimates and judgments are as follows:
Oil and Gas Reserves
Measurements of depletion, depreciation, impairment and decommissioning and restoration obligations are determined in part based on the company's estimate of oil and gas reserves. The estimation of reserves is an inherently complex process and involves the exercise of professional judgment. All reserves have been evaluated at December 31, 2017 by independent qualified reserves evaluators. Oil and gas reserves estimates are based on a range of geological, technical and economic factors, including projected future rates of production, projected future commodity prices, engineering data, and the timing and amount of future expenditures, all of which are subject to uncertainty. Estimates reflect market and regulatory conditions existing at December 31, 2017, which could differ significantly from other points in time throughout the year, or future periods. Changes in market and regulatory conditions and assumptions can materially impact the estimation of net reserves.
Oil and Gas Activities
The company is required to apply judgment when designating the nature of oil and gas activities as exploration, evaluation, development or production, and when determining whether the costs of these activities shall be expensed or capitalized.
Exploration and Evaluation Costs
Certain exploration and evaluation costs are initially capitalized with the intent to establish commercially viable reserves. The company is required to make judgments about future events and circumstances and applies estimates to assess the economic viability of extracting the underlying resources. The costs are subject to technical, commercial and management review to confirm the continued intent to develop the project. Level of drilling success or changes to project economics, resource quantities, expected production techniques, production costs and required capital expenditures are important judgments when making this determination. Management uses judgment to determine when these costs are reclassified to Property, Plant and Equipment based on several factors including the existence of reserves, appropriate approvals from regulatory bodies and the company's internal project approval process.
Determination of Cash Generating Units (CGUs)
A CGU is the lowest grouping of integrated assets that generate identifiable cash inflows that are largely independent of the cash inflows of other assets or groups of assets. The allocation of assets into CGUs requires significant judgment and interpretations with respect to the integration between assets, the existence of active markets, similar exposure to market risks, shared infrastructures, and the way in which management monitors the operations.
Asset Impairment and Reversals
Management applies judgment in assessing the existence of impairment and impairment reversal indicators based on various internal and external factors.
The recoverable amount of CGUs and individual assets is determined based on the higher of fair value less costs of disposal or value-in-use calculations. The key estimates the company applies in determining the recoverable amount normally include estimated future commodity prices, expected production volumes, future operating and development costs, discount rates, tax rates, and refining margins. In determining the recoverable amount, management may also be required to make judgments regarding the likelihood of occurrence of a future event. Changes to these estimates and judgments will affect the recoverable amounts of CGUs and individual assets and may then require a material adjustment to their related carrying value.
Decommissioning and Restoration Costs
The company recognizes liabilities for the future decommissioning and restoration of Exploration and Evaluation assets and Property, Plant and Equipment. Management applies judgment in assessing the existence and extent as well as the expected method of reclamation of the company's decommissioning and restoration obligations at the end of each reporting period. Management also uses judgment to determine whether the nature of the activities performed is related to decommissioning and restoration activities or normal operating activities.
In addition, these provisions are based on estimated costs, which take into account the anticipated method and extent of restoration, technological advances, possible future use of
54 2017 ANNUAL REPORT Suncor Energy Inc.
the site, reclamation projects and processes and the water treatment facility. Actual costs are uncertain and estimates can vary as a result of changes to relevant laws and regulations related to the use of certain technologies, the emergence of new technology, operating experience, prices and closure plans. The estimated timing of future decommissioning and restoration may change due to certain factors, including reserves life. Changes to estimates related to future expected costs, discount rates, inflation assumptions and timing may have a material impact on the amounts presented.
Employee Future Benefits
The company provides benefits to employees, including pensions and other post-retirement benefits. The cost of defined benefit pension plans and other post-retirement benefits received by employees is estimated based on actuarial valuation methods that require professional judgment. Estimates typically used in determining these amounts include, as applicable, rates of employee turnover, future claim costs, discount rates, future salary and benefit levels, the return on plan assets, mortality rates and future medical costs. Changes to these estimates may have a material impact on the amounts presented.
Other Provisions
The determination of other provisions, including, but not limited to, provisions for royalty disputes, onerous contracts, litigation and constructive obligations, is a complex process that involves judgments about the outcomes of future events, the interpretation of laws and regulations, and estimates on timing and amount of expected future cash flows and discount rates.
Income Taxes
Management evaluates tax positions, annually or when circumstances require, which involves judgment and could be subject to differing interpretations of applicable tax legislation. The company recognizes a tax provision when a payment to tax authorities is considered probable. However, the results of audits and reassessments and changes in the interpretations of standards may result in changes to those positions and, potentially, a material increase or decrease in the company's assets, liabilities and net earnings.
Deferred Income Taxes
Deferred tax assets are recognized when it is considered probable that deductible temporary differences will be recovered in the foreseeable future. To the extent that future taxable income and the application of existing tax laws in each jurisdiction differ significantly from the company's estimate, the ability of the company to realize the deferred tax assets could be impacted.
Deferred tax liabilities are recognized when there are taxable temporary differences that will reverse and result in a future outflow of funds to a taxation authority. The company records a provision for the amount that is expected to be settled, which requires judgment as to the ultimate outcome. Deferred tax liabilities could be impacted by changes in the company's judgment of the likelihood of a future outflow and estimates of the expected settlement amount, timing of reversals, and the tax laws in the jurisdictions in which the company operates.
Fair Value of Financial Instruments
The fair value of a financial instrument is determined, whenever possible, based on observable market data. If not available, the company uses third-party models and valuation methodologies that utilize observable market data that includes forward commodity prices, foreign exchange rates and interest rates to estimate the fair value of financial instruments, including derivatives. In addition to market information, the company incorporates transaction-specific details that market participants would utilize in a fair value measurement, including the impact of non-performance risk.
Functional Currency
The designation of the functional currency of the company and each of its subsidiaries is a management judgment based on the composition of revenue and costs in the locations in which it operates.
Fair Value of Share-Based Compensation
The fair values of equity settled and cash settled share-based payment awards are estimated using the Black Scholes options pricing model. These estimates depend on certain assumptions, including share price, volatility, risk-free interest rate, the term of the awards, the forfeiture rate and the annual dividend yield, which, by their nature, are subject to measurement uncertainty.
2017 ANNUAL REPORT Suncor Energy Inc. 55
Suncor is committed to a proactive program of enterprise risk management intended to enable decision making through consistent identification and assessment of risks inherent to its assets, activities and operations. Some of these risks are common to operations in the oil and gas industry as a whole, while some are unique to Suncor.
Volatility of Commodity Prices
Suncor's financial performance is closely linked to prices for crude oil in the company's upstream business and prices for refined petroleum products in the company's downstream business, and, to a lesser extent, to natural gas prices in the company's upstream business, where natural gas is both an input and output of production processes. The prices for all of these commodities can be influenced by global and regional supply and demand factors, which are factors that are beyond the company's control and can result in a high degree of price volatility.
Crude oil prices are also affected by, among other things, global economic health and global economic growth (particularly in emerging markets), pipeline constraints, regional and international supply and demand imbalances, political developments, compliance or non-compliance with quotas agreed upon by Organization of Petroleum Exporting Countries (OPEC) members and other countries, decisions by OPEC not to impose quotas on its members, access to markets for crude oil, and weather. These factors impact the various types of crude oil and refined products differently and can impact differentials between light and heavy grades of crude oil (including blended bitumen), and between conventional oil and SCO.
Refined petroleum product prices and refining margins are also affected by, among other things, crude oil prices, the availability of crude oil and other feedstock, levels of refined product inventories, regional refinery availability, marketplace competitiveness, and other local market factors. Natural gas prices in North America are affected by, among other things, supply and demand, and by prices for alternative energy sources. Decreases in product margins or increases in natural gas prices could have a material adverse effect on Suncor's business, financial condition and reserves.
In addition, oil and natural gas producers in North America, and particularly in Canada, may receive discounted prices for their production relative to certain international prices, due in part to constraints on the ability to transport and sell such products to international markets. A failure to resolve such constraints may result in continued discounted or reduced commodity prices realized by oil and natural gas producers such as Suncor. Suncor's production from Oil Sands includes significant quantities of bitumen and SCO that may trade at a discount to light and medium crude oil. Bitumen and SCO are typically more expensive to produce and process. In addition, the market prices for these products may differ from the established market indices for light and medium grades of crude oil. As a result, the price received for bitumen and SCO may differ from the benchmark they are priced against. Future quality differentials are uncertain and unfavourable differentials could have a material adverse effect on Suncor's business, financial condition and reserves.
Beginning in the latter half of 2014, world oil prices declined significantly. While oil prices have moderately recovered from the low prices that were experienced during that time, due in part to quotas agreed upon by OPEC and certain non-OPEC countries, there can be no assurances that this price recovery will continue or can be sustained. Failure by OPEC and these non-OPEC countries to establish new quotas, or to meet or maintain agreed upon quotas, or increases in supply from other countries (including Canada and the U.S.), in addition to the other factors discussed above, could cause world oil prices to decrease and such decrease could be significant and also lead to greater price volatility. A prolonged period of low and/or volatile commodity prices, particularly for crude oil, could have a material adverse effect on Suncor's business, financial condition and reserves, and may also lead to the impairment of assets, or the cancellation or deferral of Suncor's growth projects.
Major Operational Incidents (Safety, Environmental and Reliability)
Each of Suncor's primary operating businesses – Oil Sands, E&P, and R&M – requires significant levels of investment in the design, operation and maintenance of facilities, and carries the additional economic risk associated with operating reliably or enduring a protracted operational outage.
The company's businesses also carry the risks associated with environmental and safety performance, which is closely scrutinized by governments, the public and the media, and could result in a suspension of or inability to obtain regulatory approvals and permits, or, in the case of a major environmental or safety incident, fines, civil suits or criminal charges against the company.
In general, Suncor's operations are subject to operational hazards and risks such as, among others, fires (including forest fires), explosions, blow-outs, power outages, severe winter climate conditions, prolonged periods of extreme cold or extreme heat, flooding, droughts and other extreme weather conditions, railcar incidents or derailments, the migration of harmful substances such as oil spills, gaseous leaks or a release of tailings into water systems, pollution and other environmental risks, and accidents, any of which can interrupt operations or cause personal injury or death, or damage to property, equipment, the environment, and
56 2017 ANNUAL REPORT Suncor Energy Inc.
information technology systems and related data and control systems.
The reliable operation of production and processing facilities at planned levels and Suncor's ability to produce higher value products can also be impacted by, among other things, failure to follow operating procedures or operate within established operating parameters, equipment failure through inadequate maintenance, unanticipated erosion or corrosion of facilities, manufacturing and engineering flaws, and labour shortage or interruption. The company is also subject to operational risks such as sabotage, terrorism, trespass, theft and malicious software or network attacks.
In addition to the foregoing factors that affect Suncor's business generally, each business unit is susceptible to additional risks due to the nature of its business, including, among others, the following:
- •
- Suncor's Oil Sands business is susceptible to loss of production, slowdowns, shutdowns or restrictions on its ability to produce higher value products, due to the failure of any one or more interdependent component systems, and other risks inherent to oil sands operations;
- •
- For Suncor's E&P businesses, there are risks and uncertainties associated with drilling for oil and natural gas, the operation and development of such properties and wells (including encountering unexpected formations, pressures, or the presence of hydrogen sulphide), premature declines of reservoirs, sour gas releases, uncontrollable flows of crude oil, natural gas or well fluids and other accidents;
- •
- E&P offshore operations occur in areas subject to hurricanes and other extreme weather conditions, such as winter storms, pack ice, icebergs and fog. The occurrence of any of these events could result in production shut-ins, the suspension of drilling operations, damage to or destruction of the equipment involved and injury or death of rig personnel. Suncor's offshore operations could also be affected by the actions of Suncor's contractors, joint venture operators and agents that could result in similar catastrophic events at their facilities, or could be indirectly affected by catastrophic events occurring at other third-party offshore operations. In either case, this could give rise to liability, damage to the company's equipment, harm to individuals, force a shutdown of facilities or operations, or result in a shortage of appropriate equipment or specialists required to perform planned operations; and
- •
- Suncor's Refining and Marketing operations are subject to all of the risks normally inherent in the operation of refineries, terminals, pipelines and other distribution facilities and service stations, including, among others, loss of production, slowdowns or shutdowns due to equipment failures, unavailability of feedstock, price and quality of feedstock or other incidents.
Although the company maintains a risk management program, which includes an insurance component, such insurance may not provide adequate coverage in all circumstances, nor are all such risks insurable. It is possible that the company's insurance coverage will not be sufficient to address the costs arising out of the allocation of liabilities and risk of loss arising from Suncor operations.
The occurrence of any of the foregoing could have a material adverse effect on Suncor's business, financial condition, reserves and results of operations.
Government/Regulatory Policy and Effectiveness
Suncor's businesses operate under federal, provincial, territorial, state and municipal laws in numerous countries. The company, including its joint arrangements, is also subject to regulation and intervention by governments in oil and gas industry matters, such as, among others, land tenure, royalties, taxes (including income taxes), government fees, production rates, environmental protection, wildlife, fish, safety performance, the reduction of greenhouse gas (GHG) and other emissions, the export of crude oil, natural gas and other products, interactions with foreign governments, the awarding or acquisition of exploration and production rights, oil sands leases or other interests, the imposition of specific drilling obligations, control over the development, reclamation and abandonment of fields and mine sites (including restrictions on production), mine financial security requirements and possibly expropriation or cancellation of contract rights. As part of ongoing operations, the company, including its joint arrangements, is also required to comply with a large number of Environment, Health and Safety (EH&S) regulations under a variety of Canadian, U.S., U.K. and other foreign, federal, provincial, territorial, state and municipal laws and regulations. Failure to comply with applicable laws and regulations may result in, among other things, the imposition of fines and penalties, production constraints, a compulsory shutdown of facilities or suspension of operations, reputational damage, delays, increased costs, denial of operating and growth permit applications, censure, liability for cleanup costs and damages, and the loss of important licences and permits.
Before proceeding with most major projects, including significant changes to existing operations, Suncor, including its joint arrangements, must obtain various federal, provincial, territorial, state and municipal permits and regulatory approvals, and must also obtain licences to operate certain assets. These processes can involve, among other things, Aboriginal and stakeholder consultation, environmental impact assessments and public hearings, and may be subject to conditions, including security deposit obligations and other commitments. Suncor's businesses can
2017 ANNUAL REPORT Suncor Energy Inc. 57
also be indirectly impacted by a third party's inability to obtain regulatory approval for a shared infrastructure project or a third-party infrastructure project on which a portion of Suncor's business depends. Compliance can also be affected by the loss of skilled staff, inadequate internal processes and compliance auditing.
Failure to obtain, comply with, satisfy the conditions of or maintain regulatory permits and approvals, or failure to obtain them on a timely basis or on satisfactory terms, could result in delays, abandonment or restructuring of projects and increased costs, all of which could have a material adverse effect on Suncor's business, financial condition, reserves and results of operations.
Changes in government policy (including, among others, trade policies affecting energy resource exports and increased regulation as a result of climate change), regulation or other laws, or the interpretation thereof, or opposition to Suncor's projects or third-party pipeline and infrastructure projects that delays or prevents necessary permits or regulatory approvals, or which makes current operations or growth projects uneconomic, could materially impact Suncor's operations, existing and planned projects, financial condition, reserves and results of operations. Obtaining necessary approvals or permits has become more difficult due to increased public opposition and consultation, including Aboriginal consultation requirements as well as increased political involvement. The federal government also issued Bill C-69,An Act to enact the Impact Assessment Act and the Canadian Energy Regulator Act, to amend the Navigation Protection Act and to make consequential amendments to other Acts(Bill C-69) in February 2018. If enacted, it will impact the manner in which large energy projects are approved, including increased Aboriginal consultation and involvement. The result of these developments could also lead to additional compliance costs and staffing and resource levels, and also increase exposure to other risks to Suncor's business, including environmental or safety non-compliance and permit approvals, all of which could have a material adverse effect on Suncor's business, financial condition, reserves and results of operations.
Carbon Risk
Public support for climate change action and receptivity to alternative/renewable energy technologies has grown in recent years. Governments in Canada and around the world have responded to these shifting societal attitudes by adopting ambitious emissions reduction targets and supporting legislation, including measures relating to carbon pricing, clean energy and fuel standards, and alternative energy incentives and mandates. There has also been increased activism and public opposition to fossil fuels, and oil sands in particular.
Existing and future laws and regulations may impose significant liabilities on a failure to comply with their requirements. Concerns over climate change and fossil fuel extraction could lead governments to enact additional or more stringent laws and regulations applicable to Suncor and other companies in the energy industry in general, and in the oil sands industry in particular.
Environmental regulation, including regulation relating to climate change, could impact the demand for, formulation or quality of the company's products, or could require increased capital expenditures, operating expenses and distribution costs, which may or may not be recoverable in the marketplace and which may result in current operations or growth projects becoming uneconomic. In addition, such regulatory changes could necessitate that Suncor develop new technologies. Such technology development could require a significant investment of capital and resources, and any delay in or failure to identify and develop such technologies could prevent Suncor, including its joint arrangements, from obtaining regulatory approvals for projects or being able to successfully compete with other companies. Increasing environmental regulation in the jurisdictions in which Suncor operates may also make it difficult for Suncor to compete with companies operating in other jurisdictions with fewer or less costly regulations. The complexity and breadth of changes in environmental regulation make it extremely difficult to predict the potential impact to Suncor.
Suncor continues to actively monitor the international and domestic efforts to address climate change. While it currently appears that GHG regulations and targets will continue to become more stringent, and while Suncor continues its efforts to reduce the intensity of its GHG emissions, the absolute GHG emissions of the company are expected to rise as it pursues a growth strategy. Increases in GHG emissions may impact the profitability of the company's projects, as Suncor will be subject to incremental levies and taxes. There is also a risk that Suncor could face litigation initiated by third parties relating to climate change. In addition, the mechanics of implementation and enforcement of theOil Sands Emissions Limit Act (Alberta) are currently under review and it is not yet possible to predict the impact on Suncor. However, such impact could be material.
These developments and further such developments in the future could adversely impact the demand for Suncor's products, the ability of Suncor to maintain and grow its production and reserves, and Suncor's reputation and could have a material adverse effect on Suncor's business, financial condition, reserves and results of operations.
58 2017 ANNUAL REPORT Suncor Energy Inc.
Environmental Compliance
Tailings Management
There are risks associated with Suncor's tailings management plans, including those of its joint arrangements. Each mine is required under the Alberta Energy Regulator'sDirective 085 – Fluid Tailings Management for Oil Sands Mining Projects to update its mine fluid tailings management plans. If those plans are not approved in the timelines anticipated or at all, or if any conditions to the approval for the plans are not satisfied, the operators' ability to implement additional fluid tailings treatment facilities could be adversely impacted, which could result in reductions in production and lower volumes of treated tailings. If the mine exceeds certain compliance levels specified in the Tailings Management Framework (TMF), the applicable company could be subject to enforcement actions, including being required to curtail production, and financial consequences, including being subject to a compliance levy or being required to post additional security under the Mine Financial Security Program. The full impact of the TMF, including the financial consequences of exceeding compliance levels, is not yet fully known, as certain associated policies and regulations are still under development. Such policies and regulations could also restrict the technologies that the company may employ for tailings management, which could adversely impact the company's business plans. There could also be risks if the company's tailings management operations, including those of its joint arrangements, fail to operate as anticipated. The occurrence of any of the foregoing could have a material adverse effect on Suncor's business, financial condition, reserves and results of operations.
Alberta's Land Use Framework (LARP)
The implementation of, and compliance with, the terms of the LARP may adversely impact Suncor's current properties and projects in northern Alberta due to, among other things, environmental limits and thresholds. The impact of the LARP on Suncor's operations may be outside of the control of the company, as Suncor's operations could be impacted as a result of restrictions imposed due to the cumulative impact of development by the other operators in the area and not solely in relation to Suncor's direct impact. The uncertainty of changes in Suncor's future development and existing operations required as a result of the LARP could have an adverse effect on Suncor's business, financial condition, reserves and results of operations.
Alberta Environment and Parks (AEP) Water Licences
Suncor currently relies on water obtained under licences from AEP to provide domestic and utility water for the company's Oil Sands business. Water licences, like all regulatory approvals, contain conditions to be met in order to maintain compliance with the licence. There can be no assurance that the licences to withdraw water will not be rescinded or that additional conditions will not be added. It is also possible that regional water management approaches may require water sharing agreements between stakeholders. In addition, the expansion of the company's projects may rely on securing licences for additional water withdrawal, and there can be no assurance that these licences will be granted or that they will be granted on terms favourable to Suncor. There is also a risk that future laws or changes to existing laws or regulations relating to water access could cause capital expenditures and operating expenses relating to water licence compliance to increase. The occurrence of any of the foregoing could have a material adverse effect on Suncor's business, financial condition, reserves and results of operations.
Species at Risk Act
Woodland caribou have been identified as Threatened under theSpecies at Risk Act (Canada). In response to the Government of Canada's Recovery Strategy for Woodland Caribou, provincial caribou range plans are being developed. Suncor has existing, planned and potential future projects within caribou ranges in Alberta. The development and implementation of range plans in these areas may have an impact on the pace and amount of development in these areas and could potentially increase costs for restoration or offsetting requirements, which could have a material adverse effect on Suncor's business, financial condition, reserves and results of operations.
Air Quality Management
A number of Canadian federal and provincial air quality regulations and frameworks are currently being developed, changed and/or implemented, which could have an impact on the company's existing and planned projects by requiring the company to invest additional capital or incur additional operating and compliance expenses, including, among other things, potentially requiring the company to retrofit equipment to meet new requirements and increase monitoring and mitigation plans. The full impact of these regulations and frameworks is not yet known; however, they could have a material adverse effect on Suncor's business, financial condition, reserves and results of operations.
Alberta Wetland Policy
Pursuant to the Alberta Wetland Policy, development in wetland areas may be required to avoid wetlands or mitigate the development's effects on wetlands. Although the full impact of the policy on Suncor is not yet fully known, certain of Suncor's operations and growth projects may be affected by aspects of the policy where avoidance is not possible and wetland reclamation or replacement may be required, which could have a material adverse effect on Suncor's business, financial condition, reserves and results of operations.
2017 ANNUAL REPORT Suncor Energy Inc. 59
Market Access
Suncor's production of bitumen is expected to grow as production ramps up at Fort Hills. The markets for bitumen blends or heavy crude are more limited than those for light crude, making them more susceptible to supply and demand changes and imbalances (whether as a result of the availability, proximity, and capacity of pipeline facilities, railcars, or otherwise). Heavy crude oil generally receives lower market prices than light crude, due principally to the lower quality and value of the refined product yield and the higher cost to transport the more viscous product on pipelines, and this price differential can be amplified due to supply and demand imbalances. A shortage of condensate to transport bitumen may cause Suncor's cost to increase due to the need to purchase alternative diluent supplies, thereby increasing the cost to transport bitumen to market and increasing Suncor's operating costs, as well as affecting Suncor's bitumen blend marketing strategy.
Market access for oil sands production may be constrained by insufficient pipeline takeaway capacity, including the lack of new pipelines due to an inability to secure required approvals and negative public perception. There is a risk that constrained market access for oil sands production, growing inland production and refinery outages will potentially create widening differentials that could impact the profitability of product sales. The occurrence of any of the foregoing could have a material adverse effect on the company's business, financial condition, reserves and results of operations.
Information Security
The efficient operation of Suncor's business is dependent on computer hardware, software and networked systems. In the ordinary course of Suncor's business, Suncor collects and stores sensitive data, including intellectual property, proprietary business information and identifiable personal information of the company's employees and retail customers. Suncor's operations are also dependent upon a large and complex information framework. Suncor relies on industry accepted security measures, controls and technology to protect Suncor's information systems and securely maintain confidential and proprietary information stored on the company's information systems, and has adopted a continuous process to identify, assess and manage threats to the company's information systems. Suncor's information security risk oversight is conducted by the Audit Committee of the Board of Directors. However, the measures, controls and technology on which the company relies may not be adequate due to the increasing volume and sophistication of cyber threats. Suncor's information technology and infrastructure, including process control systems, may be vulnerable to attacks by malicious persons or entities motivated by, among others, geopolitical, financial or activist reasons, or breached due to employee error, malfeasance or other disruptions. Any such attack or breach could compromise Suncor's networks, and the information Suncor stores could be accessed, publicly disclosed, lost, stolen or compromised. Any such attack, breach, access, disclosure or loss of information could result in legal claims or proceedings, liability under laws that protect the privacy of personal information, regulatory penalties, disruptions to Suncor's operations, decreased performance and production, increased costs, and damage to Suncor's reputation, which could have a material adverse effect on Suncor's business, financial condition and results of operations. Although the company maintains a risk management program, which includes an insurance component that may provide coverage for the operational impacts from an attack to, or breach of, Suncor's information technology and infrastructure, including process control systems, the company does not maintain stand-alone cyber insurance. Furthermore, not all cyber risks are insurable. As a result, Suncor's existing insurance may not provide adequate coverage for losses stemming from a cyber attack to, or breach of, its information technology and infrastructure.
Project Execution
There are certain risks associated with the execution of Suncor's major projects and the commissioning and integration of new facilities within its existing asset base.
Project execution risk consists of three related primary risks:
- •
- Engineering – a failure in the specification, design or technology selection;
- •
- Construction – a failure to build the project in the approved time, in accordance with design, and at the agreed cost; and
- •
- Commissioning and start-up – a failure of the facility to meet agreed performance targets, including operating costs, efficiency, yield and maintenance costs.
Project execution can also be impacted by, among other things:
- •
- Failure to comply with Suncor's Asset Development and Execution Model;
- •
- The availability, scheduling and cost of materials, equipment and qualified personnel;
- •
- The complexities associated with integrating and managing contractor staff and suppliers;
- •
- The ability to obtain the necessary environmental and other regulatory approvals;
- •
- The impact of general economic, business and market conditions and the company's ability to finance growth, including major growth projects in progress, if commodity prices were to decline and stay at low levels for an extended period;
- •
- The impact of weather conditions;
60 2017 ANNUAL REPORT Suncor Energy Inc.
- •
- Risks relating to restarting projects placed in safe mode, including increased capital costs;
- •
- The effect of changing government regulation and public expectations in relation to the impact of oil sands development on the environment;
- •
- Complexities and risks associated with constructing projects within operating environments and confined construction areas;
- •
- The complexities and uncertainties associated with identification, development and integration of new technologies into the company's existing and new assets;
- •
- Risks associated with offshore fabrication and logistics;
- •
- Risks relating to scheduling, resources and costs, including the availability and cost of materials, equipment and qualified personnel;
- •
- The accuracy of project cost estimates, as actual costs for major projects can vary from estimates, and these differences can be material;
- •
- The company's ability to complete strategic transactions; and
- •
- The commissioning and integration of new facilities within the company's existing asset base could cause delays in achieving guidance, targets and objectives.
The occurrence of any of the foregoing could have a material adverse effect on Suncor's business, financial condition, reserves and results of operations.
Cumulative Impact of Change
In order to achieve Suncor's business objectives, the company must operate efficiently, reliably and safely and, at the same time, deliver growth and sustaining projects safely, on budget and on schedule. The ability to achieve these two sets of objectives is critically important for Suncor to deliver value to shareholders and stakeholders. These ambitious business objectives compete for resources, and may negatively impact the company should there be inadequate consideration of the cumulative impacts of prior and parallel initiatives on people, processes and systems. There is also a risk that these objectives may exceed Suncor's capacity to adopt and implement change. The occurrence of any of the foregoing could have a material adverse effect on Suncor's business, financial condition and results of operations.
Joint Arrangement Risk
Suncor has entered into joint arrangements and other contractual arrangements with third parties, including arrangements where other entities operate assets in which Suncor has ownership or other interests. These joint arrangements include, among others, those with respect to Syncrude, Fort Hills, and operations in Suncor's E&P Canada and E&P International businesses. The success and timing of activities relating to assets and projects operated by others, or developed jointly with others, depend upon a number of factors that are outside of Suncor's control, including, among others, the timing and amount of capital expenditures, the timing and amount of operational and maintenance expenditures, the operator's expertise, financial resources and risk management practices, the approval of other participants, and the selection of technology.
These co-owners may have objectives and interests that do not coincide with and may conflict with Suncor's interests. Major capital decisions affecting joint arrangements may require agreement among the co-owners, while certain operational decisions may be made solely at the discretion of the operator of the applicable assets. While joint venture counterparties may generally seek consensus with respect to major decisions concerning the direction and operation of the assets and the development of projects, no assurance can be provided that the future demands or expectations of the parties relating to such assets and projects will be met satisfactorily or in a timely manner. Failure to satisfactorily meet demands or expectations by all of the parties may affect the company's participation in the operation of such assets or in the development of such projects, the company's ability to obtain or maintain necessary licences or approvals, or the timing for undertaking various activities. In addition, disputes may arise pertaining to the timing, funding and/or capital commitments with respect to projects that are being jointly developed, which could materially adversely affect the development of such projects and Suncor's business and operations.
The occurrence of any of the foregoing could have a material adverse effect on Suncor's business, financial condition, reserves and results of operations.
Financial Risks
Energy Trading and Risk Management Activities and the Exposure to Counterparties
The nature of Suncor's energy trading and risk management activities, which may make use of derivative financial instruments to hedge its commodity price and other market risks, creates exposure to significant financial risks, which include, but are not limited to, the following:
- •
- Unfavourable movements in commodity prices, interest rates or foreign exchange could result in a financial or opportunity loss to the company;
- •
- A lack of counterparties, due to market conditions or other circumstances, could leave the company unable to liquidate or offset a position, or unable to do so at or near the previous market price;
- •
- The company may not receive funds or instruments from counterparties at the expected time or at all;
- •
- The counterparty could fail to perform an obligation owed to Suncor;
2017 ANNUAL REPORT Suncor Energy Inc. 61
- •
- Loss as a result of human error or deficiency in the company's systems or controls; and
- •
- Loss as a result of contracts being unenforceable or transactions being inadequately documented.
The occurrence of any of the foregoing could have a material adverse effect on Suncor's business, financial condition and results of operations.
Exchange Rate Fluctuations
The company's 2017 audited Consolidated Financial Statements are presented in Canadian dollars. The majority of Suncor's revenues from the sale of oil and natural gas are based on prices that are determined by, or referenced to, U.S. dollar benchmark prices, while the majority of Suncor's expenditures are realized in Canadian dollars. The company also holds substantial amounts of U.S. dollar denominated debt. Suncor's results, therefore, can be affected significantly by the exchange rates between the Canadian dollar and the U.S. dollar. The company also undertakes operations administered through international subsidiaries and therefore, to a lesser extent, Suncor's results can be affected by the exchange rates between the Canadian dollar and the euro, the British pound and the Norwegian krone. These exchange rates may vary substantially and may give rise to favourable or unfavourable foreign currency exposure. A decrease in the value of the Canadian dollar relative to the U.S. dollar will increase the revenues received from the sale of commodities. An increase in the value of the Canadian dollar relative to the U.S. dollar will decrease revenue received from the sale of commodities. A decrease in the value of the Canadian dollar relative to the U.S. dollar from the previous balance sheet date increases the amount of Canadian dollars required to settle U.S. dollar denominated obligations. As at December 31, 2017, the Canadian dollar strengthened in relation to the U.S. dollar to 0.80 from 0.74 at the start of 2017. Exchange rate fluctuations could have a material adverse effect on Suncor's business, financial condition, reserves and results of operations.
Interest Rate Risk
The company is exposed to fluctuations in short-term Canadian and U.S. interest rates as Suncor maintains a portion of its debt capacity in revolving and floating rate bank facilities and commercial paper, and invests surplus cash in short-term debt instruments and money market instruments. Suncor is also exposed to interest rate risk when debt instruments are maturing and require refinancing, or when new debt capital needs to be raised. The company is also exposed to changes in interest rates on derivative instruments used to manage the debt portfolio, including hedges of prospective new debt issuances. Unfavourable changes in interest rates could have a material adverse effect on Suncor's business, financial condition, reserves and results of operations.
Issuance of Debt and Debt Covenants
Suncor expects that future capital expenditures will be financed out of cash balances and cash equivalents, cash flow provided by operating activities, available committed credit facilities, issuing commercial paper and, if needed, divesting of non-core assets and accessing capital markets. This ability is dependent on, among other factors, commodity prices, the overall state of the capital markets, and financial institutions and investor appetite for investments in the energy industry generally, and the company's securities in particular. To the extent that external sources of capital become limited or unavailable or available on unfavourable terms, the ability to make capital investments and maintain existing properties may be constrained.
If the company finances capital expenditures in whole or in part with debt, that may increase its debt levels above industry standards for oil and gas companies of similar size. Depending on future development plans, additional debt financing may be required that may not be available or, if available, may not be available on favourable terms, including higher interest rates and fees. Neither the articles of Suncor nor its bylaws limit the amount of indebtedness that may be incurred; however, Suncor is subject to covenants in its existing bank facilities and seeks to avoid an unfavourable cost of debt. The level of the company's indebtedness, from time to time, could impair its ability to obtain additional financing on a timely basis to take advantage of business opportunities that may arise and could negatively affect its credit ratings.
Suncor is required to comply with financial and operating covenants under existing credit facilities and debt securities. Covenants are reviewed based on actual and forecast results and the company has the ability to make changes to its development plans, capital structure and/or dividend policy to comply with covenants under the credit facilities. If Suncor does not comply with the covenants under its credit facilities and debt securities, there is a risk that repayment could be accelerated and/or the company's access to capital could be restricted or only be available on unfavourable terms.
Rating agencies regularly evaluate the company, including its subsidiaries. Their ratings of Suncor's long-term and short-term debt are based on a number of factors, including the company's financial strength, as well as factors not entirely within its control, including conditions affecting the oil and gas industry generally, and the wider state of the economy. Credit ratings may be important to customers or counterparties when Suncor competes in certain markets and when it seeks to engage in certain transactions, including transactions involving over the counter derivatives. There is a risk that one or more of Suncor's credit ratings could be downgraded, which could potentially limit its access to
62 2017 ANNUAL REPORT Suncor Energy Inc.
private and public credit markets and increase the company's cost of borrowing.
The occurrence of any of the foregoing could have a material adverse effect on Suncor's business, financial condition, reserves and results of operations.
Third-Party Service Providers
Suncor's businesses are reliant on the operational integrity of a large number of third-party service providers, including input and output commodity transport (pipelines, rail, trucking, marine) and utilities associated with various Suncor and jointly owned facilities, including electricity. A disruption in service by one of these third parties can also have a dramatic impact on Suncor's operations. Pipeline constraints that affect takeaway capacity or supply of inputs, such as hydrogen and power for example, could impact the company's ability to produce at capacity levels. Disruptions in pipeline service could adversely affect commodity prices, Suncor's price realizations, refining operations and sales volumes, or limit the company's ability to produce and deliver production. These interruptions may be caused by the inability of the pipeline to operate or by the oversupply of feedstock into the system that exceeds pipeline capacity. Short-term operational constraints on pipeline systems arising from pipeline interruption and/or increased supply of crude oil have occurred in the past and could occur in the future. There is a risk that third-party outages could impact Suncor's production or price realizations, which could have a material adverse effect on Suncor's business, financial condition and results of operations.
Royalties and Taxes
Suncor is subject to royalties and taxes imposed by governments in numerous jurisdictions.
Royalties can be impacted by changes in crude oil and natural gas pricing, production volumes, and capital and operating costs, by changes to existing legislation or PSCs, and by results of regulatory audits of prior year filings and other such events. The final determination of these events may have a material impact on the company's royalties expense.
An increase in Suncor's royalties expense, income taxes, property taxes, carbon taxes, tariffs, duties, border taxes, and other taxes and government-imposed compliance costs, could have a material adverse effect on Suncor's business, financial condition, reserves and results of operations.
Foreign Operations
The company has operations in a number of countries with different political, economic and social systems. As a result, the company's operations and related assets are subject to a number of risks and other uncertainties arising from foreign government sovereignty over the company's international operations, which may include, among other things:
- •
- Currency restrictions and restrictions on repatriation of funds;
- •
- Loss of revenue, property and equipment as a result of expropriation, nationalization, war, insurrection and geopolitical and other political risks;
- •
- Increases in taxes and government royalties;
- •
- Compliance with existing and emerging anti-corruption laws, including theForeign Corrupt Practices Act (United States), theCorruption of Foreign Public Officials Act (Canada) and the United KingdomBribery Act;
- •
- Renegotiation of contracts with government entities and quasi-government agencies;
- •
- Changes in laws and policies governing operations of foreign-based companies; and
- •
- Economic and legal sanctions (such as restrictions against countries experiencing political violence, or countries that other governments may deem to sponsor terrorism).
If a dispute arises in the company's foreign operations, the company may be subject to the exclusive jurisdiction of foreign courts or may not be able to subject foreign persons to the jurisdiction of a court in Canada or the U.S. In addition, as a result of activities in these areas and a continuing evolution of an international framework for corporate responsibility and accountability for international crimes, there is a risk the company could also be exposed to potential claims for alleged breaches of international or local law.
The impact that future potential terrorist attacks, regional hostilities or political violence may have on the oil and gas industry, and on our operations in particular, is not known at this time. This uncertainty may affect operations in unpredictable ways, including disruptions of fuel supplies and markets, particularly crude oil, and the possibility that infrastructure facilities, including pipelines, production facilities, processing plants and refineries, could be direct targets of, or collateral damage of, an act of terror, political violence or war. Suncor may be required to incur significant costs in the future to safeguard our assets against terrorist activities or to remediate potential damage to our facilities. There can be no assurance that Suncor will be successful in protecting itself against these risks and the related financial consequences.
Despite Suncor's training and policies around bribery and other forms of corruption, there is a risk that Suncor, or some of its employees or contractors, could be charged with bribery or corruption. Any of these violations could result in onerous penalties. Even allegations of such behaviour could impair Suncor's ability to work with governments or non-government organizations and could result in the formal
2017 ANNUAL REPORT Suncor Energy Inc. 63
exclusion of Suncor from a country or area, sanctions, fines, project cancellations or delays, the inability to raise or borrow capital, reputational impacts and increased investor concern.
The occurrence of any of the foregoing could have a material adverse effect on Suncor's business, financial condition, reserves and results of operations.
Technology Risk
There are risks associated with growth and other capital projects that rely largely or partly on new technologies and the incorporation of such technologies into new or existing operations, including that the results of the application of new technologies may differ from simulated, test or pilot environments. The success of projects incorporating new technologies cannot be assured. Advantages accrue to companies that can develop and adopt emerging technologies in advance of competitors. The inability to develop, implement and monitor new technologies may impact the company's ability to develop its new or existing operations in a profitable manner or comply with regulatory requirements, which could have a material adverse effect on Suncor's business, financial condition, reserves and results of operations.
Skills, Resource Shortage and Reliance on Key Personnel
The successful operation of Suncor's businesses and the company's ability to expand operations will depend upon the availability of, and competition for, skilled labour and materials supply. There is a risk that the company may have difficulty sourcing the required labour for current and future operations. The risk could manifest itself primarily through an inability to recruit new staff without a dilution of talent, to train, develop and retain high-quality and experienced staff without unacceptably high attrition, and to satisfy an employee's work/life balance and desire for competitive compensation. The labour market in Alberta has been historically tight and, while the current economic situation has partially moderated this effect, it remains a risk to be managed. The increasing age of the company's existing workforce adds further pressure. Materials may also be in short supply due to smaller labour forces in many manufacturing operations. Suncor's ability to operate safely and effectively and complete all projects on time and on budget has the potential to be significantly impacted by these risks and this impact could be material.
The company's success also depends in large measure on certain key personnel. The loss of the services of such key personnel could have a material adverse effect on the company. The contributions of the existing management team to the immediate and near-term operations of the company are likely to continue to be of central importance for the foreseeable future.
Labour Relations
Hourly employees at Suncor's Oil Sands operations facilities, all of the company's refineries, certain of the company's terminal and distribution operations, and the Terra Nova floating production storage and offloading vessel are represented by labour unions or employee associations. Approximately 38% of the company's employees were covered by collective agreements at the end of 2017. Negotiations for a new collective agreement are in progress with the Teamsters Canada union at Suncor's Burrard terminal and with Unifor at the company's ETFD. Any work interruptions involving the company's employees (including as a result of the failure to successfully negotiate new collective agreements with unions), contract trades utilized in the company's projects or operations, or any jointly owned facilities operated by another entity present a significant risk to the company and could have a material adverse effect on Suncor's business, financial condition and results of operations.
Competition
The global petroleum industry is highly competitive in many aspects, including the exploration for and the development of new sources of supply, the acquisition of crude oil and natural gas interests, and the refining, distribution and marketing of refined petroleum products. Suncor competes in virtually every aspect of its business with other energy companies. The petroleum industry also competes with other industries in supplying energy, fuel and related products to consumers. The increasing volatility of the political and social landscape at provincial, federal, territorial, state, municipal and international levels adds complexity.
For Suncor's Oil Sands business, a number of other companies have entered, or may enter, the oil sands business and begin producing bitumen and SCO, or expand their existing operations. It is difficult to assess the number, level of production and ultimate timing of all potential new projects or when existing production levels may increase. During recent years, a global focus on the oil sands through increasing industry consolidation that has created competitors with financial capacity has significantly increased the supply of bitumen, SCO and heavy crude oil in the marketplace. Although current commodity pricing has slowed certain larger projects in the short term, the impact of this level of activity on regional infrastructure, including pipelines, has placed stress on the availability and cost of all resources required to build and run new and existing oil sands operations.
For Suncor's Refining and Marketing business, management expects that fluctuations in demand for refined products, margin volatility and overall marketplace competitiveness will continue. In addition, to the extent that the company's downstream business unit participates in new product
64 2017 ANNUAL REPORT Suncor Energy Inc.
markets, it could be exposed to margin risk and volatility from either cost and/or selling price fluctuations.
There is a risk that increased competition could cause costs to increase, put further strain on existing infrastructure and cause margins for refined and unrefined products to be volatile, which could have a material adverse effect on Suncor's business, financial condition and results of operations.
Land Claims and Aboriginal Consultation
Aboriginal Peoples have claimed Aboriginal title and rights to portions of Western Canada. In addition, Aboriginal Peoples have filed claims against industry participants relating in part to land claims, which may affect the company's business.
The requirement to consult with Aboriginal Peoples in respect of oil and gas projects and related infrastructure has also increased in recent years and will further increase under Bill C-69. In addition, the Canadian federal government and the provincial government in Alberta have made a commitment to renew their relationships with the Aboriginal Peoples of Canada. The federal government has stated it now fully supports the United Nations Declaration on the Rights of Indigenous Peoples (the Declaration) without qualification and that Canada intends "nothing less than to adopt and implement the Declaration in accordance with the Canadian Constitution." Recently, the federal government announced its support of a private member's bill, Bill C-262,An Act to ensure that the laws of Canada are in harmony with the United Nations Declaration on the Rights of Indigenous Peoples, promoting the full adoption of the Declaration into Canadian law. It is anticipated that the Bill may become law in 2018. The Alberta government is also currently exploring how best to implement the principles and objectives of the Declaration in a way that is consistent with the Constitution and Alberta law. At this time, it is unclear how the Declaration will be adopted into Canadian law and the impact of the Declaration on the Crown's duty to consult with Aboriginal Peoples.
Suncor is unable to assess the effect, if any, that any such land claims, consultation requirements with Aboriginal Peoples or adoption of the Declaration into Canadian law may have on Suncor's business; however, the impact may be material.
Litigation Risk
There is a risk that Suncor or entities in which it has an interest may be subject to litigation, and claims under such litigation may be material. Various types of claims may be raised in these proceedings, including, but not limited to, environmental damage, climate change and the impacts thereof, breach of contract, product liability, antitrust, bribery and other forms of corruption, tax, patent infringement, employment matters and in relation to an attack, breach or unauthorized access to Suncor's information technology and infrastructure. Litigation is subject to uncertainty and it is possible that there could be material adverse developments in pending or future cases. Unfavourable outcomes or settlements of litigation could encourage the commencement of additional litigation. Suncor may also be subject to adverse publicity and reputational impacts associated with such matters, regardless of whether Suncor is ultimately found liable. There is a risk that the outcome of such litigation may be materially adverse to the company and/or the company may be required to incur significant expenses or devote significant resources in defence against such litigation, the success of which cannot be guaranteed.
Dividends
Suncor's payment of future dividends on its common shares will be dependent on, among other things, legislative requirements, the company's financial condition, results of operations, cash flow, need for funds to finance ongoing operations, debt covenants and other business considerations as the company's Board of Directors considers relevant. There can be no assurance that Suncor will continue to pay dividends in the future.
Other Risk Factors
A detailed discussion of additional risk factors is presented in our most recent Annual Information Form / Form 40-F, filed with the Canadian and U.S. securities regulators, respectively.
11. OTHER ITEMS
Disclosure Controls and Procedures and Internal Control Over Financial Reporting
Based on their evaluation as of December 31, 2017, Suncor's Chief Executive Officer and Chief Financial Officer concluded that the company's disclosure controls and procedures (as defined in Rules 13a-15(e) and 15d-15(e)) under the United StatesSecurities Exchange Act of 1934, as amended (the Exchange Act)), are effective to ensure that information required to be disclosed by the company in reports that are filed or submitted to Canadian and U.S. securities authorities is recorded, processed, summarized and reported within the time periods specified in Canadian and U.S. securities laws. In addition, as of December 31, 2017, there were no changes in the internal control over financial reporting (as defined in Exchange Act Rules 13a-15(f) and 15d-15(f)) that occurred
2017 ANNUAL REPORT Suncor Energy Inc. 65
during the year ended December 31, 2017 that have materially affected, or are reasonably likely to materially affect, the company's internal control over financial reporting. Management will continue to periodically evaluate the company's disclosure controls and procedures and internal control over financial reporting and will make any modifications from time to time as deemed necessary.
The effectiveness of our internal control over financial reporting as at December 31, 2017 was audited by PricewaterhouseCoopers LLP, an independent registered public accounting firm, as stated in their report, which is included in our audited Consolidated Financial Statements for the year ended December 31, 2017.
Based on their inherent limitations, disclosure controls and procedures and internal control over financial reporting may not prevent or detect misstatements, and even those controls determined to be effective can provide only reasonable assurance with respect to financial statement preparation and presentation.
Corporate Guidance
Suncor has updated its full year business environment outlook assumption as a result of the recently announced change in the U.S. corporate tax rate from 35% to 21%. There have been no other changes to the corporate guidance ranges previously issued on February 7, 2018. For further details and advisories regarding Suncor's 2018 corporate guidance, see www.suncor.com/guidance.
66 2017 ANNUAL REPORT Suncor Energy Inc.
Non-GAAP Financial Measures
Certain financial measures in this MD&A – namely operating earnings (loss), ROCE, funds from (used in) operations, discretionary free funds flow, Oil Sands operations cash operating costs, Syncrude cash operating costs, refining gross margin, refining operating expense and LIFO – are not prescribed by GAAP. These non-GAAP financial measures are included because management uses the information to analyze business performance, leverage and liquidity and it may be useful to investors on the same basis. These non-GAAP financial measures do not have any standardized meaning and, therefore, are unlikely to be comparable to similar measures presented by other companies. Therefore, these non-GAAP financial measures should not be considered in isolation or as a substitute for measures of performance prepared in accordance with GAAP. Except as otherwise indicated, these non-GAAP measures are calculated and disclosed on a consistent basis from period to period. Specific adjusting items may only be relevant in certain periods.
Operating Earnings (Loss)
Operating earnings (loss) is a non-GAAP financial measure that adjusts net earnings (loss) for significant items that are not indicative of operating performance. Management uses operating earnings (loss) to evaluate operating performance, because management believes it provides better comparability between periods. For the years ended December 31, 2017, December 31, 2016 and December 31, 2015, consolidated operating earnings (loss) are reconciled to net earnings (loss) in the Financial Information section of this MD&A and operating earnings (loss) for each segment are reconciled to net earnings (loss) in the Segment Results and Analysis section of the MD&A. Operating earnings (loss) for the three months ended December 31, 2017 and December 31, 2016 are reconciled to net earnings (loss) below.
Bridge Analyses of Operating Earnings
Throughout this MD&A, the company presents charts that illustrate the change in operating earnings from the comparative period through key variance factors. These factors are analyzed in the Operating Earnings narratives following the bridge analyses in that particular section of the MD&A. These bridge analyses are presented because management uses this presentation to analyze performance.
- •
- The factor for Sales Volumes and Mix is calculated based on sales volumes and mix for the Oil Sands and Exploration and Production segments and throughput volumes and mix for the Refining and Marketing segment.
- •
- The factor for Price, Margin and Other Revenue includes upstream price realizations before royalties, with the exception of Libya, which is net of royalties. Also included are refining and marketing margins, other operating revenues, and the net impacts of sales and purchases of third-party crude, including product purchased for use as diluent in the company's Oil Sands operations and subsequently sold as part of diluted bitumen.
- •
- The factor for Royalties excludes the impact of Libya, as royalties in Libya are taken into account in Price, Margin and Other Revenue as described above.
- •
- The factor for Operating and Transportation Expense includes project start-up costs, operating, selling and general expense, and transportation expense.
- •
- The factor for Financing Expense and Other Income includes financing expenses, other income, operational foreign exchange gains and losses, changes in gains and losses on disposal of assets that are not operating earnings adjustments, changes in statutory income tax rates, other income tax adjustments and the net impact of the sale of the lubricants business in the first quarter of 2017.
Return on Capital Employed (ROCE)
ROCE is a non-GAAP financial measure that management uses to analyze operating performance and the efficiency of Suncor's capital allocation process. Average capital employed is calculated as a twelve-month average of the capital employed balance at the beginning of the twelve-month period and the month-end capital employed balances throughout the remainder of the twelve-month period. Figures for capital employed at the beginning and end of the twelve-month period are presented to show the changes in the components of the calculation over the twelve-month period.
The company presents two ROCE calculations – one including and one excluding the impacts on capital employed of major projects in progress. Major projects in progress includes accumulated capital expenditures and capitalized interest for significant projects still under construction or in the process of being commissioned, and acquired assets that are still being
2017 ANNUAL REPORT Suncor Energy Inc. 67
evaluated. Management uses ROCE excluding the impacts of major projects in progress on capital employed to assess performance of operating assets.
| Year ended December 31 ($ millions, except as noted) | 2017 | 2016 | 2015 | |||||||||
| Adjustments to net earnings | ||||||||||||
| Net earnings (loss) attributed to common shareholders | 4 458 | 434 | (1 995 | ) | ||||||||
| Add after-tax amounts for: | ||||||||||||
| Unrealized foreign exchange (gain) loss on U.S. dollar denominated debt | (702 | ) | (524 | ) | 1 930 | |||||||
| Net interest expense | 158 | 304 | 312 | |||||||||
| A | 3 914 | 214 | 247 | |||||||||
| Capital employed – beginning of twelve-month period | ||||||||||||
| Net debt | 14 414 | 11 254 | 7 834 | |||||||||
| Shareholders' equity | 44 630 | 39 039 | 41 603 | |||||||||
| 59 044 | 50 293 | 49 437 | ||||||||||
| Capital employed – end of twelve-month period | ||||||||||||
| Net debt | 12 907 | 14 414 | 11 254 | |||||||||
| Shareholders' equity | 45 383 | 44 630 | 39 039 | |||||||||
| 58 290 | 59 044 | 50 293 | ||||||||||
| Average capital employed | B | 58 667 | 57 999 | 50 565 | ||||||||
| ROCE – including major projects in progress (%) | A/B | 6.7 | 0.4 | 0.5 | ||||||||
| Average capitalized costs related to major projects in progress | C | 12 901 | 10 147 | 7 195 | ||||||||
| ROCE – excluding major projects in progress (%) | A/(B-C) | 8.6 | 0.5 | 0.6 | ||||||||
68 2017 ANNUAL REPORT Suncor Energy Inc.
Funds from (used in) Operations and Discretionary Free Funds Flow
Funds from (used in) operations is a non-GAAP financial measure that adjusts a GAAP measure – cash flow provided by (used in) operating activities – for changes in non-cash working capital, which management uses to analyze operating performance and liquidity. Changes to non-cash working capital can include, among other factors, the timing of offshore feedstock purchases and payments for fuel and income taxes, and the timing of cash flows related to accounts receivable and accounts payable, which management believes reduces comparability between periods.
| Oil Sands | Exploration and Production | Refining and Marketing | |||||||||||||||||||
| Year ended December 31 ($ millions) | 2017 | 2016 | 2015 | 2017 | 2016 | 2015 | 2017 | 2016 | 2015 | ||||||||||||
| Net earnings (loss) | 1 009 | (1 149 | ) | (856 | ) | 732 | 190 | (758 | ) | 2 658 | 1 890 | 2 306 | |||||||||
| Adjustments for: | |||||||||||||||||||||
| Depreciation, depletion, amortization and impairment | 3 782 | 3 864 | 3 583 | 1 028 | 1 381 | 3 106 | 685 | 702 | 685 | ||||||||||||
| Deferred income taxes | 170 | (78 | ) | 172 | (113 | ) | (506 | ) | (1 235 | ) | (138 | ) | 12 | (21 | ) | ||||||
| Accretion | 195 | 208 | 144 | 45 | 53 | 50 | 7 | 7 | 7 | ||||||||||||
| Unrealized foreign exchange (gain) loss on U.S. dollar denominated debt | — | — | — | — | — | — | — | — | — | ||||||||||||
| Change in fair value of financial instruments and trading inventory | 2 | 19 | 20 | — | — | — | 9 | 27 | 60 | ||||||||||||
| Loss on debt extinguishment | — | — | — | — | — | — | — | — | — | ||||||||||||
| (Gain) loss on disposal of assets | (50 | ) | (33 | ) | 8 | — | — | (5 | ) | (354 | ) | (35 | ) | (109 | ) | ||||||
| Share-based compensation | (3 | ) | 41 | 13 | 6 | 12 | 9 | 4 | 21 | 2 | |||||||||||
| Exploration expenses | — | — | — | 41 | 204 | 255 | — | — | — | ||||||||||||
| Settlement of decommissioning and restoration liabilities | (305 | ) | (248 | ) | (277 | ) | (31 | ) | (1 | ) | (5 | ) | (17 | ) | (20 | ) | (20 | ) | |||
| Other | (62 | ) | 45 | 28 | 17 | (20 | ) | (31 | ) | (13 | ) | 2 | 11 | ||||||||
| Funds from (used in) operations | 4 738 | 2 669 | 2 835 | 1 725 | 1 313 | 1 386 | 2 841 | 2 606 | 2 921 | ||||||||||||
| (Increase) decrease in non-cash working capital | (451 | ) | (383 | ) | (27 | ) | (13 | ) | 60 | 322 | 1 563 | 787 | 306 | ||||||||
| Cash flow provided by (used in) operating activities | 4 287 | 2 286 | 2 808 | 1 712 | 1 373 | 1 708 | 4 404 | 3 393 | 3 227 | ||||||||||||
2017 ANNUAL REPORT Suncor Energy Inc. 69
| Corporate, Energy Trading and Eliminations | Total | ||||||||||||||
| Year ended December 31 ($ millions) | 2017 | 2016 | 2015 | 2017 | 2016 | 2015 | |||||||||
| Net earnings (loss) | 59 | (486 | ) | (2 687 | ) | 4 458 | 445 | (1 995 | ) | ||||||
| Adjustments for: | |||||||||||||||
| Depreciation, depletion, amortization and impairment | 106 | 170 | 126 | 5 601 | 6 117 | 7 500 | |||||||||
| Deferred income taxes | 330 | 60 | 160 | 249 | (512 | ) | (924 | ) | |||||||
| Accretion of liabilities | — | 1 | (4 | ) | 247 | 269 | 197 | ||||||||
| Unrealized foreign exchange (gain) loss on U.S. dollar denominated debt | (771 | ) | (458 | ) | 1 967 | (771 | ) | (458 | ) | 1 967 | |||||
| Change in fair value of financial instruments and trading inventory | 117 | (53 | ) | 7 | 128 | (7 | ) | 87 | |||||||
| Loss on debt extinguishment | 51 | 99 | — | 51 | 99 | — | |||||||||
| Gain on disposal of assets | (70 | ) | — | (4 | ) | (474 | ) | (68 | ) | (110 | ) | ||||
| Share-based compensation | 24 | 68 | (6 | ) | 31 | 142 | 18 | ||||||||
| Exploration expenses | — | — | — | 41 | 204 | 255 | |||||||||
| Settlement of decommissioning and restoration liabilities | — | — | — | (353 | ) | (269 | ) | (302 | ) | ||||||
| Other | (11 | ) | (1 | ) | 105 | (69 | ) | 26 | 113 | ||||||
| Funds (used in) from operations | (165 | ) | (600 | ) | (336 | ) | 9 139 | 5 988 | 6 806 | ||||||
| (Increase) decrease in non-cash working capital | (1 272 | ) | (772 | ) | (523 | ) | (173 | ) | (308 | ) | 78 | ||||
| Cash flow (used in) provided by operating activities | (1 437 | ) | (1 372 | ) | (859 | ) | 8 966 | 5 680 | 6 884 | ||||||
Discretionary free funds flow is a non-GAAP financial measure that is calculated by taking funds from operations and subtracting sustaining capital, inclusive of associated capitalized interest, and dividends. Discretionary free funds flow reflects cash available for increasing distributions to shareholders and to fund growth investments. Management uses discretionary free funds flow to measure the capacity of the company to increase returns to shareholders and grow the business. The following is a reconciliation of discretionary free funds flow for Suncor's last three years of operations.
| ($ millions) | 2017 | 2016 | 2015 | |||||
| Funds from operations | 9 139 | 5 988 | 6 806 | |||||
| Sustaining capital and dividends | (5 083 | ) | (4 191 | ) | (4 250 | ) | ||
| Discretionary free funds flow | 4 056 | 1 797 | 2 556 | |||||
Oil Sands Operations and Syncrude Cash Operating Costs
Oil Sands operations and Syncrude cash operating costs are non-GAAP financial measures. Oil Sands operations cash operating costs are calculated by adjusting Oil Sands segment OS&G expense (a GAAP measure based on sales volumes) for i) costs pertaining to Syncrude operations; ii) non-production costs that management believes do not relate to the production performance of Oil Sands operations, including, but not limited to, share-based compensation adjustments, research, and the expense recorded as part of a non-monetary arrangement involving a third-party processor; iii) revenues associated with excess capacity, including excess power generated and sold that is recorded in operating revenue; iv) project start-up costs; and v) the impacts of changes in inventory levels, such that the company is able to present cost information based on production volumes. Syncrude cash operating costs are calculated by adjusting Syncrude OS&G for non-production costs that management believes do not relate to the production performance of Syncrude operations, including, but not limited to, share-based compensation, research and project start-up costs. Oil Sands operations and Syncrude cash operating costs are reconciled in the Segment Results and Analysis – Oil Sands section of this MD&A. Management uses Oil Sands operations and Syncrude cash operating costs to measure Oil Sands operating performance.
Refining Margin and Refining Operating Expense
Refining margin and refining operating expense are non-GAAP financial measures. Refining margin is calculated by adjusting R&M segment operating revenues, other income and purchases of crude oil and products (GAAP measures) for non-refining
70 2017 ANNUAL REPORT Suncor Energy Inc.
margin pertaining to the company's supply, marketing and ethanol businesses, and the company's former lubricants business. Refinery operating expense is calculated by adjusting R&M segment OS&G for i) non-refining costs pertaining to the company's supply, marketing, ethanol and the company's former lubricants businesses; and ii) non-refining costs that management believes do not relate to the production of refined products, including, but not limited to, share-based compensation and enterprise shared service allocations. Management uses refining margin and refining operating expense to measure operating performance on a production barrel basis.
| Year ended December 31 ($ millions, except as noted) | 2017 | 2016 | 2015 | ||||||
| Refining gross margin reconciliation | |||||||||
| Gross margin, operating revenues less purchases of crude oil and products | 5 952 | 5 813 | 6 311 | ||||||
| Other income | 73 | 16 | 86 | ||||||
| Non-refining margin | (1 800 | ) | (2 403 | ) | (2 123 | ) | |||
| Refining margin | 4 225 | 3 426 | 4 274 | ||||||
| Refinery production(1) (mbbls) | 174 461 | 168 798 | 171 581 | ||||||
| Refining margin ($/bbl) | 24.20 | 20.30 | 24.90 | ||||||
| Refining operating expense reconciliation | |||||||||
| Operating, selling and general expense | 2 007 | 2 203 | 2 219 | ||||||
| Non-refining costs | (1 125 | ) | (1 343 | ) | (1 338 | ) | |||
| Refining operating expense | 882 | 860 | 881 | ||||||
| Refinery production(1) | 174 461 | 168 798 | 171 581 | ||||||
| Refining operating expense ($/bbl) | 5.05 | 5.10 | 5.10 | ||||||
- (1)
- Refinery production is the output of the refining process, and differs from crude oil processed as a result of volumetric adjustments for non-crude feedstock, volumetric gain associated with the refining process, and changes in unfinished product inventories.
Impact of First-in, First-out Inventory Valuation on Refining and Marketing Net Earnings
GAAP requires the use of a FIFO valuation methodology. For Suncor, this results in a lag between the sales prices for refined products, which reflects current market conditions, and the amount recorded as the cost of sale for the related refinery feedstock, which reflects market conditions at the time when the feedstock was purchased.
Suncor prepares and presents an estimate of the impact of using a FIFO inventory valuation methodology compared to a LIFO methodology, because management uses the information to analyze operating performance and compare itself against refining peers that are permitted to use LIFO inventory valuation under United States GAAP (U.S. GAAP).
The company's estimate is not derived from a standardized calculation and, therefore, may not be directly comparable to similar measures presented by other companies, and should not be considered in isolation or as a substitute for measures of performance prepared in accordance with GAAP or U.S. GAAP.
Measurement Conversions
Certain crude oil and natural gas liquids volumes have been converted to mcfe or mmcfe on the basis of one bbl to six mcf. Also, certain natural gas volumes have been converted to boe or mboe on the same basis. Any figure presented in mcfe, mmcfe, boe or mboe may be misleading, particularly if used in isolation. A conversion ratio of one bbl of crude oil or natural gas liquids to six mcf of natural gas is based on an energy equivalency conversion method primarily applicable at the burner tip and does not necessarily represent value equivalency at the wellhead. Given that the value ratio based on the current price of crude oil as compared to natural gas is significantly different from the energy equivalency of 6:1, conversion on a 6:1 basis may be misleading as an indication of value.
2017 ANNUAL REPORT Suncor Energy Inc. 71
Operating Earnings Reconciliations – Fourth Quarter 2017 and 2016
| Three months ended December 31 | Oil Sands | Exploration and Production | Refining and Marketing | Corporate, Energy Trading and Eliminations | Total | |||||||||||||||||
| ($ millions) | 2017 | 2016 | 2017 | 2016 | 2017 | 2016 | 2017 | 2016 | 2017 | 2016 | ||||||||||||
| Net earnings (loss) as reported | 670 | 276 | 217 | 54 | 886 | 524 | (391 | ) | (323 | ) | 1 382 | 531 | ||||||||||
| Unrealized foreign exchange loss on U.S. dollar denominated debt | — | — | — | — | — | — | 91 | 222 | 91 | 222 | ||||||||||||
| Impact of income tax rate adjustment on deferred taxes | — | — | 14 | — | (140 | ) | — | 2 | — | (124 | ) | — | ||||||||||
| Insurance proceeds | (55 | ) | — | — | — | — | — | — | — | (55 | ) | — | ||||||||||
| Loss on early repayment of long-term debt | — | — | — | — | — | — | 18 | — | 18 | — | ||||||||||||
| Derecognition and impairments | — | 40 | — | — | — | — | — | 31 | — | 71 | ||||||||||||
| Non-cash mark to market gain on interest rate swaps | — | — | — | — | — | — | (2 | ) | (188 | ) | (2 | ) | (188 | ) | ||||||||
| Operating earnings (loss) | 615 | 316 | 231 | 54 | 746 | 524 | (282 | ) | (258 | ) | 1 310 | 636 | ||||||||||
Funds from Operations Reconciliations – Fourth Quarter 2017 and 2016
| Three months ended December 31 | Oil Sands | Exploration and Production | Refining and Marketing | Corporate, Energy Trading and Eliminations | Total | ||||||||||||||||||
| ($ millions) | 2017 | 2016 | 2017 | 2016 | 2017 | 2016 | 2017 | 2016 | 2017 | 2016 | |||||||||||||
| Net earnings (loss) | 670 | 276 | 217 | 54 | 886 | 524 | (391 | ) | (323 | ) | 1 382 | 531 | |||||||||||
| Adjustments for: | |||||||||||||||||||||||
| Depreciation, depletion, amortization and impairment | 1 055 | 1 038 | 219 | 294 | 196 | 196 | 18 | 73 | 1 488 | 1 601 | |||||||||||||
| Deferred income taxes | 181 | (14 | ) | 5 | (44 | ) | (161 | ) | (3 | ) | 78 | (9 | ) | 103 | (70 | ) | |||||||
| Accretion of liabilities | 49 | 53 | 12 | 10 | 2 | 2 | — | — | 63 | 65 | |||||||||||||
| Unrealized foreign exchange loss on U.S. dollar denominated debt | — | — | — | — | — | — | 74 | 313 | 74 | 313 | |||||||||||||
| Change in fair value of financial instruments and trading inventory | 2 | — | — | — | 9 | (1 | ) | 5 | (271 | ) | 16 | (272 | ) | ||||||||||
| Gain on disposal of assets | (46 | ) | — | — | — | (2 | ) | (21 | ) | — | — | (48 | ) | (21 | ) | ||||||||
| Loss on debt extinguishment | — | — | — | — | — | — | 26 | 26 | — | ||||||||||||||
| Share-based compensation | 34 | 57 | 4 | 7 | 17 | 32 | 61 | 105 | 116 | 201 | |||||||||||||
| Exploration expenses | — | — | — | 65 | — | — | — | — | — | 65 | |||||||||||||
| Settlement of decommissioning and restoration liabilities | (76 | ) | (55 | ) | (15 | ) | (1 | ) | (7 | ) | (7 | ) | — | — | (98 | ) | (63 | ) | |||||
| Other | (89 | ) | 17 | (11 | ) | — | (5 | ) | — | (1 | ) | (2 | ) | (106 | ) | 15 | |||||||
| Funds from (used in) operations | 1 780 | 1 372 | 431 | 385 | 935 | 722 | (130 | ) | (114 | ) | 3 016 | 2 365 | |||||||||||
| (Decrease) increase in non-cash working capital | (509 | ) | 217 | 101 | 156 | 496 | 982 | (349 | ) | (929 | ) | (261 | ) | 426 | |||||||||
| Cash flow provided by (used in) operating activities | 1 271 | 1 589 | 532 | 541 | 1 431 | 1 704 | (479 | ) | (1 043 | ) | 2 755 | 2 791 | |||||||||||
72 2017 ANNUAL REPORT Suncor Energy Inc.
The following is a list of abbreviations that may be used in this MD&A:
| Measurement | ||
| bbl | barrel | |
| bbls/d | barrels per day | |
| mbbls/d | thousands of barrels per day | |
| boe | barrels of oil equivalent | |
| boe/d | barrels of oil equivalent per day | |
| mboe | thousands of barrels of oil equivalent | |
| mboe/d | thousands of barrels of oil equivalent per day | |
| mcf | thousands of cubic feet of natural gas | |
| mcfe | thousands of cubic feet of natural gas equivalent | |
| mmcf | millions of cubic feet of natural gas | |
| mmcf/d | millions of cubic feet of natural gas per day | |
| mmcfe | millions of cubic feet of natural gas equivalent | |
| mmcfe/d | millions of cubic feet of natural gas equivalent per day | |
| m3 | cubic metres | |
| MW | Megawatts | |
| MWh | Megawatt hour | |
Places and Currencies | ||
| U.S. | United States | |
| U.K. | United Kingdom | |
| B.C. | British Columbia | |
| $ or Cdn$ | Canadian dollars | |
| US$ | United States dollars | |
| £ | Pounds sterling | |
| € | Euros | |
Financial and Business Environment | ||
| DD&A | Depreciation, depletion and amortization | |
| WTI | West Texas Intermediate | |
| WCS | Western Canadian Select | |
| SCO | Synthetic crude oil | |
| MSW | Mixed Sweet Blend | |
| NYMEX | New York Mercantile Exchange | |
Forward-Looking Information
This MD&A contains certain forward-looking statements and forward-looking information (collectively, forward-looking statements) within the meaning of applicable Canadian and U.S. securities laws and other information based on Suncor's current expectations, estimates, projections and assumptions that were made by the company in light of information available at the time the statement was made and consider Suncor's experience and its perception of historical trends, including expectations and assumptions concerning: the accuracy of reserves and resources estimates; commodity prices and interest and foreign exchange rates; the performance of assets and equipment; capital efficiencies and cost savings; applicable laws and government policies; future production rates; the sufficiency of budgeted capital expenditures in carrying out planned activities; the availability and cost of labour, services and infrastructure; the satisfaction by third parties of their obligations to Suncor; the execution of projects; and the receipt, in a timely manner, of regulatory and third-party approvals. All statements and information that address expectations or projections about the future, and statements and information about Suncor's strategy for growth, expected and future expenditures or investment decisions, commodity prices, costs, schedules, production volumes, operating and financial results, future financing and capital activities, and the expected impact of future commitments are forward-looking statements. Some of the forward-looking statements may be identified by words like "expects", "anticipates", "will", "estimates", "plans", "scheduled", "intends", "believes", "projects", "indicates", "could", "focus", "vision", "goal", "outlook", "proposed", "target", "objective", "continue", "should", "may", "potential", "future", "opportunity", "would" and similar expressions.
Forward-looking statements in this MD&A include references to:
Suncor's strategy, business plans and expectations about the cost and development of projects, the performance of its assets, production volumes, and capital expenditures, including:
- •
- Suncor's strategies and commitments, including delivering competitive and sustainable returns to shareholders by focusing on capital discipline, operational excellence and long-term profitable growth, and by leveraging our competitive advantages of an industry-leading long-life, low-decline oil sands reserves base, a highly efficient, tightly integrated downstream, a focused offshore business that provides geographic and cash flow diversification, financial strength, industry expertise and a commitment to sustainability, and key components of Suncor's strategy, including profitably operating and developing our reserves, optimizing value through integration, achieving industry-leading unit costs in each business segment, and being an industry leader in sustainable development;
- •
- Expectations about the Fort Hills mining project, including the expectation that Fort Hills will reach 90% of production capacity by the end of 2018, planned nameplate capacity of 194,000 bbls/d and net capacity to Suncor, the expectation that testing of the front end of the plant in 2017 will mitigate the risk associated with the ramp up in 2018, that working interests in Fort Hills may be further adjusted, and the expectation that sustaining capital expenditures in 2018 will be focused on tailings management and projects to preserve production capacity, including mining equipment;
2017 ANNUAL REPORT Suncor Energy Inc. 73
- •
- Expectations about Hebron, including the expectation that the peak production rate will be more than 30,000 bbls/d, net to Suncor, following a ramp-up phase over the next several years, drilling plans in 2018, and the project cost estimate;
- •
- Expectations about Syncrude, including that reliability continues to be a focus, efforts with other Syncrude owners on a framework to drive operating efficiencies, improve performance and develop regional synergies, the expectation that the company will receive an additional $64 million in 2018 in property damage insurance proceeds related to the facility incident that occurred at Syncrude in the first quarter of 2017, and the expectation that sustaining capital expenditures in 2018 will focus on reliability programs, planned maintenance and maintaining production capacity;
- •
- Expectations about the West White Rose Project, including that first oil from the project is targeted in 2022, and that the company's share of peak production is estimated to be 20,000 bbls/d;
- •
- The opportunity for production growth at Oil Sands through low-cost debottlenecks, expansions and increased reliability, the focus at Oil Sands on safe, reliable and sustainable operations, including continuing to improve upgrader reliability and the replacement of the coke-fired boilers at Oil Sands Base to enhance carbon and cost competitiveness, the aim of the company's operational excellence initiatives to improve facility utilization and workforce productivity and the expectation that these initiatives will achieve steady production growth while reducing operating costs, the focus on continuing efforts to sustainably reduce controllable operating costs through elimination of non-critical work and continued collaboration with suppliers and business partners, and the focus on managing investment opportunities, including sustainability priorities, through a robust asset development process and realizing turnaround productivity improvements;
- •
- The Exploration and Production segment's focus on low-cost projects that deliver significant returns, cash flow and long-term value, and exploration and development opportunities currently being evaluated off the east coast of Canada, offshore Norway and in the U.K. North Sea to provide diverse and lower cost conventional production;
- •
- Plans for sustaining capital at Oil Sands operations, which are expected to focus on tailings management, planned maintenance, and other investments to maintain production capacity at existing facilities, primarily related to new well pads for In Situ assets to offset natural production declines and development of an autonomous haul truck program;
- •
- The expectation that well pads under construction will maintain existing production levels at Firebag and MacKay River in future years as production from existing well pads declines;
- •
- Plans to continue ongoing development activities in the east coast of Canada and U.K. leveraging existing facilities and infrastructure to provide incremental production and extend the productive life of existing fields, development work planned for 2018 on the Norwegian Oda project and the Fenja development project, pre-sanction design work on the Rosebank future development project, and planned growth capital expenditures in 2018;
- •
- The expectation that sustaining capital for Refining and Marketing will focus on planned maintenance events, technological investments and routine asset replacement;
- •
- Suncor's plan to continue to leverage the Petro-Canada brand to increase non-petroleum revenues through the company's network of convenience stores and car washes;
- •
- Potential future wind and solar power projects;
- •
- The Energy Trading business evaluating additional pipeline agreements to support long-term planned production growth; and
- •
- Expectations about the closing of the transactions with Canbriam and Faroe Petroleum and the timing thereof.
The anticipated timing, duration and impact of planned maintenance events, including:
- •
- Planned Upgrader 1 maintenance at Oil Sands Base and coker maintenance at Syncrude scheduled for completion within the second quarter of 2018, and additional maintenance events at Upgrader 2 and Syncrude scheduled to begin in the third quarter of 2018, with completion extending into the early part of the fourth quarter of 2018;
- •
- A planned four-week maintenance event at Terra Nova scheduled to commence in the third quarter of 2018; and
- •
- A planned seven-week maintenance event at the Edmonton refinery, including a one-month full refinery turnaround, and a four-week turnaround event at the Commerce City refinery, both of which are scheduled to begin late in the first quarter of 2018 and extend into the second quarter of 2018, a six-week turnaround event at the Sarnia refinery in the second quarter of 2018, a three-week maintenance event at the Montreal refinery scheduled for the second quarter, a five-week maintenance event at the Montreal Refinery scheduled to begin in the third quarter of 2018, and a two-week
74 2017 ANNUAL REPORT Suncor Energy Inc.
maintenance event at the Commerce City refinery scheduled to begin in the fourth quarter.
Also:
- •
- The expectation that the net decrease in long-term debt in 2017 will reduce future financing costs and provide additional balance sheet flexibility, and that the decrease in the company's credit facility and the cancellation of the credit facility acquired through the acquisition of COS are no longer required;
- •
- Economic sensitivities;
- •
- The expectation that the company will capitalize significantly less interest in 2018 and that growth spending at Oil Sands ventures will decrease significantly in 2018;
- •
- The company's belief that it does not have any guarantees or off-balance sheet arrangements that have, or are reasonably likely to have, a current or future material effect on the company's financial condition or financial performance, including liquidity and capital resources;
- •
- The belief that the company will have the capital resources to fund its planned 2018 capital spending program of $4.5 to $5.0 billion and to meet current and future working capital requirements through cash balances and cash equivalents, cash flow provided by operating activities, available committed credit facilities, issuing commercial paper and, if needed, divesting of non-core assets and accessing capital markets;
- •
- The objectives of the company's short-term investment portfolio and the expectation that the maximum weighted average term to maturity of the company's short-term investment portfolio will not exceed six months, and all investments will be with counterparties with investment grade debt ratings; and
- •
- Management of debt levels continuing to be a priority for Suncor given the company's long-term growth plans and the volatility in commodity pricing, and Suncor's belief that a phased and flexible approach to existing and future growth projects should assist Suncor in maintaining its ability to manage project costs and debt levels.
Forward-looking statements are not guarantees of future performance and involve a number of risks and uncertainties, some that are similar to other oil and gas companies and some that are unique to Suncor. Suncor's actual results may differ materially from those expressed or implied by its forward-looking statements, so readers are cautioned not to place undue reliance on them.
The financial and operating performance of the company's reportable operating segments, specifically Oil Sands, Exploration and Production, and Refining and Marketing, may be affected by a number of factors.
Factors that affect Suncor's Oil Sands segment include, but are not limited to, volatility in the prices for crude oil and other production, and the related impacts of fluctuating light/heavy and sweet/sour crude oil differentials; changes in the demand for refinery feedstock and diesel fuel, including the possibility that refiners that process the company's proprietary production will be closed, experience equipment failure or other accidents; Suncor's ability to operate its Oil Sands facilities reliably in order to meet production targets; the output of newly commissioned facilities, the performance of which may be difficult to predict during initial operations; the possibility that completed maintenance activities may not improve operational performance or the output of related facilities; Suncor's dependence on pipeline capacity and other logistical constraints, which may affect the company's ability to distribute products to market; Suncor's ability to finance Oil Sands growth and sustaining capital expenditures; the availability of bitumen feedstock for upgrading operations, which can be negatively affected by poor ore grade quality, unplanned mine equipment and extraction plant maintenance, tailings storage, and in situ reservoir and equipment performance, or the unavailability of third-party bitumen; changes in operating costs, including the cost of labour, natural gas and other energy sources used in oil sands processes; and the company's ability to complete projects, including planned maintenance events, both on time and on budget, which could be impacted by competition from other projects (including other oil sands projects) for goods and services and demands on infrastructure in Alberta's Wood Buffalo region and the surrounding area (including housing, roads and schools).
Factors that affect Suncor's Exploration and Production segment include, but are not limited to, volatility in crude oil and natural gas prices; operational risks and uncertainties associated with oil and gas activities, including unexpected formations or pressures, premature declines of reservoirs, fires, blow-outs, equipment failures and other accidents, uncontrollable flows of crude oil, natural gas or well fluids, and pollution and other environmental risks; the possibility that completed maintenance activities may not improve operational performance or the output of related facilities; adverse weather conditions, which could disrupt output from producing assets or impact drilling programs, resulting in increased costs and/or delays in bringing on new production; political, economic and socio-economic risks associated with Suncor's foreign operations, including the unpredictability of operating in Libya due to ongoing political unrest; and market demand for mineral rights and producing properties, potentially leading to losses on disposition or increased property acquisition costs.
2017 ANNUAL REPORT Suncor Energy Inc. 75
Factors that affect Suncor's Refining and Marketing segment include, but are not limited to, fluctuations in demand and supply for refined products that impact the company's margins; market competition, including potential new market entrants; the company's ability to reliably operate refining and marketing facilities in order to meet production or sales targets; the possibility that completed maintenance activities may not improve operational performance or the output of related facilities; and risks and uncertainties affecting construction or planned maintenance schedules, including the availability of labour and other impacts of competing projects drawing on the same resources during the same time period.
Additional risks, uncertainties and other factors that could influence the financial and operating performance of all of Suncor's operating segments and activities include, but are not limited to, changes in general economic, market and business conditions, such as commodity prices, interest rates and currency exchange rates; fluctuations in supply and demand for Suncor's products; the successful and timely implementation of capital projects, including growth projects and regulatory projects; risks associated with the execution of Suncor's major projects and the commissioning and integration of new facilities; competitive actions of other companies, including increased competition from other oil and gas companies or from companies that provide alternative sources of energy; labour and material shortages; actions by government authorities, including the imposition or reassessment of, or changes to, taxes, fees, royalties, duties and other government-imposed compliance costs; changes to laws and government policies that could impact the company's business, including environmental (including climate change), royalty and tax laws and policies; the ability and willingness of parties with whom Suncor has material relationships to perform their obligations to the company; the unavailability of, or outages to, third-party infrastructure that could cause disruptions to production or prevent the company from being able to transport its products; the occurrence of a protracted operational outage, a major safety or environmental incident, or unexpected events such as fires (including forest fires), equipment failures and other similar events affecting Suncor or other parties whose operations or assets directly or indirectly affect Suncor; the potential for security breaches of Suncor's information technology and infrastructure by malicious persons or entities, and the unavailability or failure of such systems to perform as anticipated as a result of such breaches; the risk that competing business objectives may exceed Suncor's capacity to adopt and implement change; risks and uncertainties associated with obtaining regulatory and stakeholder approval for the company's operations and exploration and development activities; the potential for disruptions to operations and construction projects as a result of Suncor's relationships with labour unions that represent employees at the company's facilities; the company's ability to find new oil and gas reserves that can be developed economically; the accuracy of Suncor's reserves, resources and future production estimates; market instability affecting Suncor's ability to borrow in the capital debt markets at acceptable rates or to issue other securities at acceptable prices; maintaining an optimal debt to cash flow ratio; the success of the company's risk management activities using derivatives and other financial instruments; the cost of compliance with current and future environmental laws, including climate change laws; risks relating to increased activism and public opposition to fossil fuels and oil sands; risks and uncertainties associated with closing a transaction for the purchase or sale of a business, asset or oil and gas property, including estimates of the final consideration to be paid or received; the ability of counterparties to comply with their obligations in a timely manner; risks associated with joint arrangements in which the company has an interest; the receipt of any required regulatory or other third-party approvals outside of Suncor's control and the satisfaction of any conditions to such approvals; risks associated with land claims and Aboriginal consultation requirements; risks relating to litigation; the impact of technology and risks associated with developing and implementing new technologies; and the accuracy of cost estimates, some of which are provided at the conceptual or other preliminary stage of projects and prior to commencement or conception of the detailed engineering that is needed to reduce the margin of error and increase the level of accuracy. The foregoing important factors are not exhaustive.
Many of these risk factors and other assumptions related to Suncor's forward-looking statements are discussed in further detail throughout this MD&A, including under the heading Risk Factors, and the company's 2017 AIF dated March 1, 2018 and Form 40-F on file with Canadian securities commissions at www.sedar.com and the United States Securities and Exchange Commission at www.sec.gov. Readers are also referred to the risk factors and assumptions described in other documents that Suncor files from time to time with securities regulatory authorities. Copies of these documents are available without charge from the company.
The forward-looking statements contained in this MD&A are made as of the date of this MD&A. Except as required by applicable securities laws, we assume no obligation to update publicly or otherwise revise any forward-looking statements or the foregoing risks and assumptions affecting such forward-looking statements, whether as a result of new information, future events or otherwise.
76 2017 ANNUAL REPORT Suncor Energy Inc.
MANAGEMENT'S STATEMENT
OF RESPONSIBILITY FOR FINANCIAL REPORTING
The management of Suncor Energy Inc. is responsible for the presentation and preparation of the accompanying consolidated financial statements of Suncor Energy Inc. and all related financial information contained in the Annual Report, including Management's Discussion and Analysis.
The consolidated financial statements have been prepared in accordance with Canadian generally accepted accounting principles applicable to publically accountable enterprises, which is within the framework of International Financial Reporting Standards as issued by the International Accounting Standards Board incorporated into the CICA Handbook Part 1. They include certain amounts that are based on estimates and judgments.
In management's opinion, the consolidated financial statements have been properly prepared within reasonable limits of materiality and within the framework of the significant accounting policies adopted by management. If alternate accounting methods exist, management has chosen those policies it deems the most appropriate in the circumstances. In discharging its responsibilities for the integrity and reliability of the financial statements, management maintains and relies upon a system of internal controls designed to ensure that transactions are properly authorized and recorded, assets are safeguarded against unauthorized use or disposition and liabilities are recognized. These controls include quality standards in hiring and training of employees, formalized policies and procedures, a corporate code of conduct and associated compliance program designed to establish and monitor conflicts of interest, the integrity of accounting records and financial information among others, and employee and management accountability for performance within appropriate and well-defined areas of responsibility.
The system of internal controls is further supported by the professional staff of an internal audit function who conduct periodic audits of the company's financial reporting.
The Audit Committee of the Board of Directors, currently composed of five independent directors, reviews the effectiveness of the company's financial reporting systems, management information systems, internal control systems and internal auditors. It recommends to the Board of Directors the external auditor to be appointed by the shareholders at each annual meeting and reviews the independence and effectiveness of their work. In addition, it reviews with management and the external auditor any significant financial reporting issues, the presentation and impact of significant risks and uncertainties, and key estimates and judgments of management that may be material for financial reporting purposes. The Audit Committee appoints the independent reserve consultants. The Audit Committee meets at least quarterly to review and approve interim financial statements prior to their release, as well as annually to review Suncor's annual financial statements and Management's Discussion and Analysis, Annual Information Form/Form 40-F, and annual reserves estimates, and recommend their approval to the Board of Directors. The internal auditors and the external auditor, PricewaterhouseCoopers LLP, have unrestricted access to the company, the Audit Committee and the Board of Directors.
 | |
Steven W. Williams | Alister Cowan |
| President and Chief Executive Officer | Executive Vice President and Chief Financial Officer |
March 1, 2018
2017 ANNUAL REPORT Suncor Energy Inc. 77
The following report is provided by management in respect of the company's internal control over financial reporting (as defined in Rule 13a-15(f) and 15d-15(f) under the U.S. Securities Exchange Act of 1934):
MANAGEMENT'S REPORT ON INTERNAL CONTROL
OVER FINANCIAL REPORTING
- 1.
- Management is responsible for establishing and maintaining adequate internal control over the company's financial reporting.
- 2.
- Management has used the Committee of Sponsoring Organizations of the Treadway Commission (COSO) framework (2013) in Internal Control – Integrated Framework to evaluate the effectiveness of the company's internal control over financial reporting.
- 3.
- Management has assessed the effectiveness of the company's internal control over financial reporting as at December 31, 2017, and has concluded that such internal control over financial reporting was effective as of that date. Additionally, based on this assessment, management determined that there were no material weaknesses in internal control over financial reporting as at December 31, 2017. Because of inherent limitations, systems of internal control over financial reporting may not prevent or detect misstatements and even those systems determined to be effective can provide only reasonable assurance with respect to financial statement preparation and presentation.
- 4.
- The effectiveness of the company's internal control over financial reporting as at December 31, 2016 has been audited by PricewaterhouseCoopers LLP, independent auditor, as stated in their report which appears herein.
| |
Steven W. Williams | Alister Cowan |
| President and Chief Executive Officer | Executive Vice President and Chief Financial Officer |
March 1, 2018
78 2017 ANNUAL REPORT Suncor Energy Inc.
REPORT OF INDEPENDENT REGISTERED PUBLIC ACCOUNTING FIRM
To the Shareholders of
Suncor Energy Inc.
Opinions on the Financial Statements and Internal Control over Financial Reporting
We have audited the accompanying Consolidated Balance Sheets of Suncor Energy Inc. and its subsidiaries, (together, the "Company") as of December 31, 2017 and 2016, and the related Consolidated Statements of Comprehensive Income, Shareholders' Equity and Cash Flows for the years then ended, including the related notes (collectively referred to as the "Consolidated Financial Statements"). We also have audited the Company's internal control over financial reporting as of December 31, 2017, based on criteria established in Internal Control – Integrated Framework (2013) issued by the Committee of Sponsoring Organizations of the Treadway Commission ("COSO").
In our opinion, the Consolidated Financial Statements referred to above present fairly, in all material respects, the financial position of the Company as of December 31, 2017 and 2016, and the results of its operations and its cash flows for each of the two years in the period ended December 31, 2017 in conformity with International Financial Reporting Standards as issued by the International Accounting Standards Board ("IFRS"). Also in our opinion, the Company maintained, in all material respects, effective internal control over financial reporting as of December 31, 2017, based on criteria established in Internal Control – Integrated Framework (2013) issued by the COSO.
Basis for Opinions
The Company's management is responsible for these Consolidated Financial Statements, for maintaining effective internal control over financial reporting, and for its assessment of the effectiveness of internal control over financial reporting, included in the accompanying Management's Report on Internal Controls over Financial Reporting. Our responsibility is to express opinions on the Company's consolidated financial statements and on the Company's internal control over financial reporting based on our audits. We are a public accounting firm registered with the Public Company Accounting Oversight Board (United States) ("PCAOB") and are required to be independent with respect to the Company in accordance with the U.S. federal securities laws and the applicable rules and regulations of the Securities and Exchange Commission and the PCAOB.
We conducted our audits in accordance with the standards of the PCAOB. Those standards require that we plan and perform the audits to obtain reasonable assurance about whether the Consolidated Financial Statements are free of material misstatement, whether due to error or fraud, and whether effective internal control over financial reporting was maintained in all material respects.
Our audits of the Consolidated Financial Statements included performing procedures to assess the risks of material misstatement of the Consolidated Financial Statements, whether due to error or fraud, and performing procedures that respond to those risks. Such procedures included examining, on a test basis, evidence regarding the amounts and disclosures in the Consolidated Financial Statements. Our audits also included evaluating the accounting principles used and significant estimates made by management, as well as evaluating the overall presentation of the Consolidated Financial Statements. Our audit of internal control over financial reporting included obtaining an understanding of internal control over financial reporting, assessing the risk that a material weakness exists, and testing and evaluating the design and operating effectiveness of internal control based on the assessed risk. Our audits also included performing such other procedures as we considered necessary in the circumstances. We believe that our audits provide a reasonable basis for our opinions.
Definition and limitations of internal control over financial reporting
A company's internal control over financial reporting is a process designed to provide reasonable assurance regarding the reliability of financial reporting and the preparation of consolidated financial statements for external purposes in accordance with generally accepted accounting principles. A company's internal control over financial reporting includes those policies and procedures that (i) pertain to the maintenance of records that, in reasonable detail, accurately and fairly reflect the transactions and dispositions of the assets of the company; (ii) provide reasonable assurance that transactions are recorded as necessary to permit preparation of consolidated financial statements in accordance with generally accepted accounting principles, and that receipts and expenditures of the company are being made only in accordance with authorizations of management and directors of the company; and (iii) provide reasonable assurance regarding prevention or timely detection
2017 ANNUAL REPORT Suncor Energy Inc. 79
of unauthorized acquisition, use, or disposition of the company's assets that could have a material effect on the consolidated financial statements.
Because of its inherent limitations, internal control over financial reporting may not prevent or detect misstatements. Also, projections of any evaluation of effectiveness to future periods are subject to the risk that controls may become inadequate because of changes in conditions, or that the degree of compliance with the policies or procedures may deteriorate.
Chartered Professional Accountants | |
| Calgary, Alberta |
March 1, 2018
We have served as the Company's auditor since 1972.
80 2017 ANNUAL REPORT Suncor Energy Inc.
CONSOLIDATED STATEMENTS OF COMPREHENSIVE INCOME
| For the years ended December 31 ($ millions) | Notes | 2017 | 2016 | |||||||
| Revenues and Other Income | ||||||||||
| Operating revenues, net of royalties | 6 | 32 051 | 26 807 | |||||||
| Other income | 9 | 125 | 161 | |||||||
| 32 176 | 26 968 | |||||||||
Expenses | ||||||||||
| Purchases of crude oil and products | 11 121 | 9 877 | ||||||||
| Operating, selling and general | 10 and 27 | 9 245 | 9 150 | |||||||
| Transportation | 1 037 | 1 072 | ||||||||
| Depreciation, depletion, amortization and impairment | 11 and 18 | 5 601 | 6 117 | |||||||
| Exploration | 104 | 289 | ||||||||
| Gain on disposal of assets | 36 and 37 | (602 | ) | (68 | ) | |||||
| Financing (income) expense | 12 | (246 | ) | 445 | ||||||
| 26 260 | 26 882 | |||||||||
| Earnings before Income Taxes | 5 916 | 86 | ||||||||
| Income Tax Expense (Recovery) | 13 | |||||||||
| Current | 1 209 | 153 | ||||||||
| Deferred | 249 | (512 | ) | |||||||
| 1 458 | (359 | ) | ||||||||
| Net Earnings | 4 458 | 445 | ||||||||
Net Earnings Attributable to: | ||||||||||
| Common Shareholders | 4 458 | 434 | ||||||||
| Non-controlling interest | 7 | — | 11 | |||||||
| 4 458 | 445 | |||||||||
Other Comprehensive (Loss) Income | ||||||||||
| Items That May be Subsequently Reclassified to Earnings: | ||||||||||
| Foreign currency translation adjustment | (198 | ) | (258 | ) | ||||||
| Items That Will Not be Reclassified to Earnings: | ||||||||||
| Actuarial gain (loss) on employee retirement benefit plans, net of income taxes | 31 | (24 | ) | |||||||
Other Comprehensive Loss | (167 | ) | (282 | ) | ||||||
Total Comprehensive Income | 4 291 | 163 | ||||||||
Per Common Share (dollars) | 14 | |||||||||
| Net earnings – basic and diluted | 2.68 | 0.28 | ||||||||
| Net earnings – attributable to common shareholders – basic and diluted | 2.68 | 0.27 | ||||||||
| Cash dividends | 1.28 | 1.16 | ||||||||
The accompanying notes are an integral part of the consolidated financial statements.
2017 ANNUAL REPORT Suncor Energy Inc. 81
| ($ millions) | Notes | December 31 2017 | December 31 2016 | ||||||
| Assets | |||||||||
| Current assets | |||||||||
| Cash and cash equivalents | 15 | 2 672 | 3 016 | ||||||
| Accounts receivable | 3 281 | 3 182 | |||||||
| Inventories | 17 | 3 468 | 3 240 | ||||||
| Income taxes receivable | 156 | 376 | |||||||
| Assets held for sale | 36 and 37 | — | 1 205 | ||||||
| Total current assets | 9 577 | 11 019 | |||||||
| Property, plant and equipment, net | 11, 18, 34, 35, 36, 37 and 38 | 73 493 | 71 259 | ||||||
| Exploration and evaluation | 19 | 2 052 | 2 038 | ||||||
| Other assets | 20 | 1 211 | 1 248 | ||||||
| Goodwill and other intangible assets | 21 | 3 061 | 3 075 | ||||||
| Deferred income taxes | 13 | 100 | 63 | ||||||
| Total assets | 89 494 | 88 702 | |||||||
Liabilities and Shareholders' Equity | |||||||||
| Current liabilities | |||||||||
| Short-term debt | 22 | 2 136 | 1 273 | ||||||
| Current portion of long-term debt | 22 | 71 | 54 | ||||||
| Accounts payable and accrued liabilities | 6 203 | 5 588 | |||||||
| Current portion of provisions | 25 | 722 | 781 | ||||||
| Income taxes payable | 425 | 224 | |||||||
| Liabilities associated with assets held for sale | 36 and 37 | — | 197 | ||||||
| Total current liabilities | 9 557 | 8 117 | |||||||
| Long-term debt | 22 | 13 372 | 16 103 | ||||||
| Other long-term liabilities | 23 and 38 | 2 412 | 2 067 | ||||||
| Provisions | 25 | 7 237 | 6 542 | ||||||
| Deferred income taxes | 13 | 11 533 | 11 243 | ||||||
| Equity | 45 383 | 44 630 | |||||||
| Total liabilities and shareholders' equity | 89 494 | 88 702 | |||||||
The accompanying notes are an integral part of the consolidated financial statements.
Approved on behalf of the Board of Directors:
 | ||
Steven W. Williams | Patricia M. Bedient | |
| Director | Director |
February 28, 2018
82 2017 ANNUAL REPORT Suncor Energy Inc.
CONSOLIDATED STATEMENTS OF CASH FLOWS
| For the years ended December 31 ($ millions) | Notes | 2017 | 2016 | ||||||
| Operating Activities | |||||||||
| Net earnings | 4 458 | 445 | |||||||
| Adjustments for: | |||||||||
| Depreciation, depletion, amortization and impairment | 5 601 | 6 117 | |||||||
| Deferred income taxes | 249 | (512 | ) | ||||||
| Accretion | 247 | 269 | |||||||
| Unrealized foreign exchange gain on U.S. dollar denominated debt | (771 | ) | (458 | ) | |||||
| Change in fair value of financial instruments and trading inventory | 128 | (7 | ) | ||||||
| Gain on disposal of assets | (474 | ) | (68 | ) | |||||
| Loss on extinguishment of long-term debt | 12 | 51 | 99 | ||||||
| Share-based compensation | 31 | 142 | |||||||
| Exploration | 41 | 204 | |||||||
| Settlement of decommissioning and restoration liabilities | (353 | ) | (269 | ) | |||||
| Other | (69 | ) | 26 | ||||||
| Increase in non-cash working capital | 16 | (173 | ) | (308 | ) | ||||
| Cash flow provided by operating activities | 8 966 | 5 680 | |||||||
Investing Activities | |||||||||
| Capital and exploration expenditures | (6 551 | ) | (6 582 | ) | |||||
| Cash acquired from Canadian Oil Sands Limited | 7 | — | 109 | ||||||
| Acquisitions | 8, 34 and 35 | (308 | ) | (1 014 | ) | ||||
| Proceeds from disposal of assets(1) | 1 611 | 229 | |||||||
| Other investments | (38 | ) | (25 | ) | |||||
| Decrease (increase) in non-cash working capital | 16 | 267 | (224 | ) | |||||
| Cash flow used in investing activities | (5 019 | ) | (7 507 | ) | |||||
Financing Activities | |||||||||
| Net change in short-term debt | 981 | 531 | |||||||
| Repayment of long-term debt | (3 283 | ) | (1 693 | ) | |||||
| Issuance of long-term debt | 22 | 905 | 993 | ||||||
| Issuance of common shares under share option plans | 228 | 133 | |||||||
| (Purchase) issuance of common shares | 26 | (1 413 | ) | 2 782 | |||||
| Proceeds from sale of non-controlling interest | 38 | 483 | — | ||||||
| Dividends paid on common shares | (2 124 | ) | (1 877 | ) | |||||
| Cash flow (used in) provided by financing activities | (4 223 | ) | 869 | ||||||
Decrease in Cash and Cash Equivalents | (276 | ) | (958 | ) | |||||
| Effect of foreign exchange on cash and cash equivalents | (68 | ) | (75 | ) | |||||
| Cash and cash equivalents at beginning of year | 3 016 | 4 049 | |||||||
| Cash and Cash Equivalents at End of Year | 2 672 | 3 016 | |||||||
Supplementary Cash Flow Information | |||||||||
| Interest paid | 941 | 992 | |||||||
| Income taxes paid (received) | 557 | (161 | ) | ||||||
- (1)
- Includes property damage insurance proceeds of $76 million for Syncrude.
The accompanying notes are an integral part of the consolidated financial statements.
2017 ANNUAL REPORT Suncor Energy Inc. 83
CONSOLIDATED STATEMENTS OF CHANGES IN EQUITY
| ($ millions) | Notes | Share Capital | Contributed Surplus | Accumulated Other Comprehensive Income | Non- Controlling Interest | Retained Earnings | Total | Number of Common Shares (thousands) | ||||||||||
At December 31, 2015 | 19 466 | 633 | 1 265 | — | 17 675 | 39 039 | 1 446 013 | |||||||||||
| Net earnings | — | — | — | 11 | 434 | 445 | — | |||||||||||
| Foreign currency translation adjustment | — | — | (258 | ) | — | — | (258 | ) | — | |||||||||
| Actuarial loss on employee retirement benefit plans, net of income taxes of $5 | — | — | — | — | (24 | ) | (24 | ) | — | |||||||||
| Total comprehensive (loss) income | — | — | (258 | ) | 11 | 410 | 163 | — | ||||||||||
| Issued under share option plans | 216 | (84 | ) | — | — | — | 132 | 3 983 | ||||||||||
| Issued for cash, net of income taxes of $26 | 26 | 2 808 | — | — | — | — | 2 808 | 82 225 | ||||||||||
| Issued for the acquisition of Canadian Oil Sands Limited | 7 | 3 154 | — | — | 1 172 | — | 4 326 | 98 814 | ||||||||||
| Equity transactions to eliminate non-controlling interest in Canadian Oil Sands Limited | 7 | 1 298 | — | — | (1 183 | ) | (115 | ) | — | 36 879 | ||||||||
| Share-based compensation | — | 39 | — | — | — | 39 | — | |||||||||||
| Dividends paid on common shares | — | — | — | — | (1 877 | ) | (1 877 | ) | — | |||||||||
| At December 31, 2016 | 26 942 | 588 | 1 007 | — | 16 093 | 44 630 | 1 667 914 | |||||||||||
| Net earnings | — | — | — | — | 4 458 | 4 458 | — | |||||||||||
| Foreign currency translation adjustment | — | — | (198 | ) | — | — | (198 | ) | — | |||||||||
| Actuarial gain on employee retirement benefit plans, net of income taxes of $19 | — | — | — | — | 31 | 31 | — | |||||||||||
| Total comprehensive (loss) income | — | — | (198 | ) | — | 4 489 | 4 291 | — | ||||||||||
| Issued under share option plans | 297 | (69 | ) | — | — | — | 228 | 6 223 | ||||||||||
| Purchase of common shares for cancellation | 26 | (536 | ) | — | — | — | (877 | ) | (1 413 | ) | (33 154 | ) | ||||||
| Change in liability for share purchase commitment | 26 | (97 | ) | — | — | — | (180 | ) | (277 | ) | — | |||||||
| Share-based compensation | — | 48 | — | — | — | 48 | — | |||||||||||
| Dividends paid on common shares | — | — | — | — | (2 124 | ) | (2 124 | ) | — | |||||||||
| At December 31, 2017 | 26 606 | 567 | 809 | — | 17 401 | 45 383 | 1 640 983 | |||||||||||
The accompanying notes are an integral part of the consolidated financial statements.
84 2017 ANNUAL REPORT Suncor Energy Inc.
NOTES TO THE CONSOLIDATED FINANCIAL STATEMENTS
1. REPORTING ENTITY AND DESCRIPTION OF THE BUSINESS
Suncor Energy Inc. (Suncor or the company) is an integrated energy company headquartered in Canada. Suncor's operations include oil sands development and upgrading, onshore and offshore oil and gas production, petroleum refining, and product marketing primarily under the Petro-Canada brand. The consolidated financial statements of the company comprise the company and its subsidiaries and the company's interests in associates and joint arrangement entities.
The address of the company's registered office is 150 – 6th Avenue S.W., Calgary, Alberta, Canada, T2P 3E3.
2. BASIS OF PREPARATION
(a) Statement of Compliance
These consolidated financial statements have been prepared in accordance with International Financial Reporting Standards (IFRS) as issued by the International Accounting Standards Board (IASB) and Canadian generally accepted accounting principles (GAAP) as contained within Part 1 of the Canadian Institute of Chartered Professional Accountants Handbook.
Suncor's accounting policies are based on IFRS issued and outstanding for all periods presented in these consolidated financial statements. These consolidated financial statements were approved by the Board of Directors on February 28, 2018.
(b) Basis of Measurement
The consolidated financial statements are prepared on a historical cost basis except as detailed in the accounting policies disclosed in note 3. The accounting policies described in note 3 have been applied consistently to all periods presented in these consolidated financial statements.
(c) Functional Currency and Presentation Currency
These consolidated financial statements are presented in Canadian dollars, which is the company's functional currency.
(d) Use of Estimates, Assumptions and Judgments
The timely preparation of financial statements requires that management make estimates and assumptions and use judgment. Accordingly, actual results may differ from estimated amounts as future confirming events occur. Significant estimates and judgments used in the preparation of the consolidated financial statements are described in note 4.
3. SUMMARY OF SIGNIFICANT ACCOUNTING POLICIES
(a) Principles of Consolidation
The company consolidates its interests in entities it controls. Control comprises the power to govern an entity's financial and operating policies to obtain benefits from its activities, and is a matter of judgment. All intercompany balances and transactions are eliminated in preparing the consolidated financial statements.
Certain of the company's activities are conducted through joint operations, and the consolidated financial statements reflect the company's proportionate share of the joint operations' assets, liabilities, revenues and expenses, on a line-by-line basis.
(b) Joint Arrangements
Joint arrangements represent arrangements in which two or more parties have joint control established by a contractual agreement. Joint control only exists when decisions about the activities that most significantly affect the returns of the investee are unanimous. Joint arrangements can be classified as either a joint operation or a joint venture. The classification of joint arrangements requires judgment. In determining the classification of its joint arrangements the company considers the contractual rights and obligations of each investor and, whether the legal structure of the joint arrangement gives the entity direct rights to the assets and obligations for the liabilities.
Where the company has rights to the assets and obligations for the liabilities of a joint arrangement, such arrangement is classified as a joint operation and the company's share of the assets, liabilities, revenues and expenses is included in the consolidated financial statements.
Where the company has rights to the net assets of an arrangement, the arrangement is classified as a joint venture and accounted for using the equity method of accounting. Under the equity method, the company's initial investment is
2017 ANNUAL REPORT Suncor Energy Inc. 85
recognized at cost and subsequently adjusted for the company's share of the joint venture's income or loss, less distributions received.
(c) Foreign Currency Translation
Functional currencies of the company's individual entities are the currency of the primary economic environment in which the entity operates. Transactions in foreign currencies are translated to the appropriate functional currency at foreign exchange rates that approximate those on the date of the transaction. Monetary assets and liabilities denominated in foreign currencies are translated to the appropriate functional currency at foreign exchange rates as at the balance sheet date. Foreign exchange differences arising on translation are recognized in net earnings. Non-monetary assets that are measured in a foreign currency at historical cost are translated using the exchange rate at the date of the transaction.
In preparing the company's consolidated financial statements, the financial statements of each entity are translated into Canadian dollars. The assets and liabilities of foreign operations are translated into Canadian dollars at exchange rates as at the balance sheet date. Revenues and expenses of foreign operations are translated into Canadian dollars using foreign exchange rates that approximate those on the date of the underlying transaction. Foreign exchange differences are recognized in Other Comprehensive Income.
If the company or any of its entities disposes of its entire interest in a foreign operation, or loses control, joint control, or significant influence over a foreign operation, the accumulated foreign currency translation gains or losses related to the foreign operation are recognized in net earnings.
(d) Revenues
Revenue from the sale of crude oil, natural gas, natural gas liquids, purchased products and refined petroleum products is recorded when title passes to the customer and collection is reasonably assured. Revenue from properties in which the company has an interest with other producers is recognized on the basis of the company's net working interest. For operations not pursuant to production sharing contracts (PSCs), crude oil and natural gas sold below or above the company's working-interest share of production results in production underlifts or overlifts, respectively. Underlifts are recorded as a receivable at market value with a corresponding increase to revenues, while overlifts are recorded as a payable at market value with a corresponding decrease to revenues. Changes in the value of underlifted or overlifted barrels are recognized in revenue when the barrels are settled. Revenue from oil and natural gas production is recorded net of royalty expense.
International operations conducted pursuant to PSCs are reflected in the consolidated financial statements based on the company's working interest. Each PSC establishes the exploration, development and operating costs the company is required to fund and establishes specific terms for the company to recover these costs and to share in the production profits. Cost recovery is generally limited to a specified percentage of production during each fiscal year (Cost Recovery Oil). Any Cost Recovery Oil remaining after costs have been recovered is referred to as Excess Petroleum and is shared between the company and the respective government. Assuming collection is reasonably assured, the company's share of Cost Recovery Oil and Excess Petroleum are reported as revenue when the sale of product to a third party occurs. Revenue also includes income taxes paid on the company's behalf by government joint venture partners.
(e) Cash and Cash Equivalents
Cash and cash equivalents consist primarily of cash in banks, term deposits, certificates of deposit and all other highly liquid investments at the time of purchase.
(f) Inventories
Inventories of crude oil and refined products, other than inventories held for trading purposes, are valued at the lower of cost, using the first-in, first-out method, and net realizable value. Costs include direct expenditures incurred in bringing an item or product to its existing condition and location. Materials and supplies are valued at the lower of average cost and net realizable value.
Inventories held for trading purposes in the company's energy trading operations are carried at fair value less costs of disposal, and any changes in fair value are recognized within Other Income.
(g) Assets Held for Sale
Assets and liabilities are classified as held for sale if their carrying amounts are expected to be recovered through a disposition rather than through continuing use. The assets or disposal groups are measured at the lower of their carrying amount and estimated fair value less costs of disposal. Impairment losses on initial classification as well as subsequent gains or losses on remeasurement are recognized in Depreciation, Depletion, Amortization and Impairment. When the assets or
86 2017 ANNUAL REPORT Suncor Energy Inc.
disposal groups are sold, the gains or losses on the sale are recognized in Gain on Disposal of Assets. Assets classified as held for sale are not depreciated, depleted or amortized.
(h) Exploration and Evaluation Assets
The costs to acquire non-producing oil and gas properties or licences to explore, drill exploratory wells and the costs to evaluate the commercial potential of underlying resources, including related borrowing costs, are initially capitalized as Exploration and Evaluation assets. Certain exploration costs, including geological, geophysical and seismic expenditures and delineation on oil sands properties, are charged to Exploration expense as incurred.
Exploration and Evaluation assets are subject to technical, commercial and management review to confirm the continued intent to develop and extract the underlying resources. If an area or exploration well is no longer considered commercially viable, the related capitalized costs are charged to Exploration expense.
When management determines with reasonable certainty that an Exploration and Evaluation asset will be developed, as evidenced by the classification of proved or probable reserves and the appropriate internal and external approvals, the asset is transferred to Property, Plant and Equipment.
(i) Property, Plant and Equipment
Property, Plant and Equipment are initially recorded at cost.
The costs to acquire developed or producing oil and gas properties, and to develop oil and gas properties, including completing geological and geophysical surveys and drilling development wells, and the costs to construct and install development infrastructure, such as wellhead equipment, well platforms, well pairs, offshore platforms and subsea structures, are capitalized as oil and gas properties within Property, Plant and Equipment.
The costs to construct, install and commission, or acquire, oil and gas production equipment, including oil sands upgraders, extraction plants, mine equipment, processing and power generation facilities, utility plants, and all renewable energy, refining, and marketing assets, are capitalized as plant and equipment within Property, Plant and Equipment.
Stripping activity required to access oil sands mining resources incurred in the initial development phase is capitalized as part of the construction cost of the mine. Stripping costs incurred in the production phase are charged to expense as they normally relate to production for the current period.
The costs of planned major inspection, overhaul and turnaround activities that maintain Property, Plant and Equipment and benefit future years of operations are capitalized. Recurring planned maintenance activities performed on shorter intervals are expensed as operating costs. Replacements outside of a major inspection, overhaul or turnaround are capitalized when it is probable that future economic benefits will be realized by the company and the associated carrying amount of the replaced component is derecognized.
Leases that transfer substantially all the benefits and risks of ownership to the company are recorded as finance lease assets within Property, Plant and Equipment. Costs for all other leases are recorded as operating expense as incurred.
Borrowing costs relating to assets that take a substantial period of time to construct are capitalized as part of the asset. Capitalization of borrowing costs ceases when the asset is in the location and condition necessary for its intended use, and is suspended when construction of an asset is ceased for extended periods.
(j) Depreciation, Depletion and Amortization
Exploration and Evaluation assets are not subject to depreciation, depletion and amortization. Once transferred to oil and gas properties within Property, Plant and Equipment and commercial production commences, these costs are depleted on a unit-of-production basis over proved developed reserves, with the exception of exploration and evaluation costs associated with oil sands mines, which are depreciated on a straight-line basis over the life of the mine, and property acquisition costs, which are depleted over proved reserves.
Capital expenditures are not depreciated or depleted until assets are substantially complete and ready for their intended use.
Costs to develop oil and gas properties other than certain oil sands mining assets, including costs of dedicated infrastructure, such as well pads and wellhead equipment, are depleted on a unit-of-production basis over proved developed reserves. A portion of these costs may not be depleted if they relate to undeveloped reserves. Costs related to offshore facilities are depleted over proved and probable reserves. Costs to develop and construct oil sands mines are depreciated on a straight-line basis over the life of the mine.
2017 ANNUAL REPORT Suncor Energy Inc. 87
Major components of Property, Plant and Equipment are depreciated on a straight-line basis over their expected useful lives.
| Oil sands upgraders, extraction plants and mine facilities | 20 to 40 years | |
| Oil sands mine equipment | 5 to 15 years | |
| Oil sands in situ processing facilities | 30 years | |
| Power generation and utility plants | 30 to 40 years | |
| Refineries and other processing plants | 20 to 40 years | |
| Marketing and other distribution assets | 10 to 40 years | |
The costs of major inspection, overhaul and turnaround activities that are capitalized are depreciated on a straight-line basis over the period to the next scheduled activity, which varies from two to five years.
Depreciation, depletion and amortization rates are reviewed annually or when events or conditions occur that impact capitalized costs, reserves or estimated service lives.
(k) Goodwill and Other Intangible Assets
The company accounts for business combinations using the acquisition method. The excess of the purchase price over the fair value of the identifiable net assets represents goodwill, and is allocated to the cash generating units (CGUs) or groups of CGUs expected to benefit from the business combination.
Other intangible assets include acquired customer lists and brand value.
Goodwill and brand value have indefinite useful lives and are not subject to amortization. Customer lists are amortized over their expected useful lives, which range from five to ten years. Expected useful lives of other intangible assets are reviewed on an annual basis.
(l) Impairment of Assets
Non-Financial Assets
Property, Plant and Equipment and Exploration and Evaluation assets are reviewed quarterly to assess whether there is any indication of impairment. Goodwill and intangible assets that have an indefinite useful life are tested for impairment annually. Exploration and Evaluation assets are also tested for impairment immediately prior to being transferred to Property, Plant and Equipment.
If any indication of impairment exists, an estimate of the asset's recoverable amount is calculated as the higher of the fair value less costs of disposal and value-in-use. In determining fair value less costs of disposal, recent market transactions are considered, if available. In the absence of such transactions, an appropriate valuation model is used. Value-in-use is assessed using the present value of the expected future cash flows of the relevant asset. If the asset does not generate cash inflows that are largely independent of those from other assets or groups of assets, the asset is tested as part of a CGU, which is the smallest identifiable group of assets that generates cash inflows that are largely independent of the cash inflows from other assets or groups of assets. An impairment loss is the amount by which the carrying amount of the individual asset or CGU exceeds its recoverable amount.
Impairments may be reversed for all CGUs and individual assets, other than goodwill, if there has been a change in the estimates and judgments used to determine the asset's recoverable amount. If such indication exists, the carrying amount of the CGU or asset is increased to its revised recoverable amount which cannot exceed the carrying amount that would have been determined, net of depletion, depreciation and amortization, had no impairment been recognized.
Impairments and impairment reversals are recognized within Depreciation, Depletion, Amortization and Impairment.
Financial Assets
At each reporting date, the company assesses whether there is evidence that financial assets that are carried at amortized cost are impaired. If a financial asset carried at amortized cost is impaired, the impairment is recognized in Operating, Selling and General expense.
88 2017 ANNUAL REPORT Suncor Energy Inc.
(m) Provisions
Provisions are recognized by the company when it has a legal or constructive obligation as a result of past events, it is probable that an outflow of economic resources will be required to settle the obligation and a reliable estimate can be made of the amount of the obligation.
Provisions are recognized for decommissioning and restoration obligations associated with the company's Exploration and Evaluation assets and Property, Plant and Equipment. Provisions for decommissioning and restoration obligations are measured at the present value of management's best estimate of the future cash flows required to settle the present obligation, using the credit-adjusted risk-free interest rate. The value of the obligation is added to the carrying amount of the associated asset and amortized over the useful life of the asset. The provision is accreted over time through Financing Expense with actual expenditures charged against the accumulated obligation. Changes in the future cash flow estimates resulting from revisions to the estimated timing or amount of undiscounted cash flows are recognized as a change in the decommissioning and restoration provision and related asset.
(n) Income Taxes
The company follows the liability method of accounting for income taxes whereby deferred income taxes are recorded for the effect of differences between the accounting and income tax basis of an asset or liability. Deferred income tax assets and liabilities are measured using enacted or substantively enacted income tax rates as at the balance sheet date that are anticipated to apply to taxable income in the years in which temporary differences are anticipated to be recovered or settled. Changes to these balances are recognized in net earnings or in Other Comprehensive Income in the period they occur. Investment tax credits are recorded as a reduction to the related expenditures.
The company recognizes the financial statement impact of a tax filing position when it is probable, based on the technical merits, that the position will be sustained upon audit. The company assesses possible outcomes and their associated probabilities. If the company determines payment is probable, it measures the tax provision at the best estimate of the amount of tax payable.
(o) Pensions and Other Post-Retirement Benefits
The company sponsors defined benefit pension plans, defined contribution pension plans and other post-retirement benefits.
The cost of pension benefits earned by employees in the defined contribution pension plan is expensed as incurred. The cost of defined benefit pension plans and other post-retirement benefits are actuarially determined using the projected unit credit method based on present pay levels and management's best estimates of demographic and financial assumptions. Pension benefits earned during the current year are recorded in Operating, Selling and General expense. Interest costs on the net unfunded obligation are recorded in Financing Expense. Any actuarial gains or losses are recognized immediately through Other Comprehensive Income and transferred directly to Retained Earnings.
The liability recognized on the balance sheet is the present value of the defined benefit obligations net of the fair value of plan assets.
(p) Share-Based Compensation Plans
Under the company's share-based compensation plans, share-based awards may be granted to executives, employees and non-employee directors. Compensation expense is recorded in Operating, Selling and General expense.
Share-based compensation awards that settle in cash or have the option to settle in cash or shares are accounted for as cash-settled plans. These are measured at fair value each reporting period using the Black-Scholes options pricing model. The expense is recognized over the vesting period, with a corresponding adjustment to liabilities. When awards are surrendered for cash, the cash settlement paid reduces the outstanding liability. When awards are exercised for common shares, consideration paid by the holder and the previously recognized liability associated with the options are recorded to Share Capital.
Stock options that give the holder the right to purchase common shares are accounted for as equity-settled plans. The expense is based on the fair value of the options at the time of grant using the Black-Scholes options pricing model and is recognized over the vesting periods of the respective options. A corresponding increase is recorded to Contributed Surplus. Consideration paid to the company on exercise of options is credited to Share Capital and the associated amount in Contributed Surplus is reclassified to Share Capital.
2017 ANNUAL REPORT Suncor Energy Inc. 89
(q) Financial Instruments
The company classifies its financial instruments into one of the following categories: fair value through profit or loss; assets available for sale; held-to-maturity investments; loans and receivables, and financial liabilities measured at amortized cost. All financial instruments are initially recognized at fair value on the balance sheet, net of any transaction costs except for financial instruments classified as fair value through profit and loss, where transaction costs are expensed as incurred. Subsequent measurement of financial instruments is based on their classification. The company classifies derivative financial instruments as fair value through profit and loss, cash and cash equivalents and accounts receivable as loans and receivables, and accounts payable and accrued liabilities, debt, and other long-term liabilities as other financial liabilities.
In circumstances where the company consolidates a subsidiary in which there are other owners with a non-controlling interest and the subsidiary has a non-discretionary obligation to distribute cash based on a predetermined formula to the non-controlling owners, the non-controlling interest is classified as a financial liability rather than equity in accordance with IAS 32 Financial Instruments: Presentation. The non-controlling interest liability is classified as an amortized cost liability and is presented within Other Long-Term Liabilities. The balance is accreted based on current period interest expense recorded using the effective interest method and decreased based on distributions made to the non-controlling owners.
The company uses derivative financial instruments, such as physical and financial contracts, either to manage certain exposures to fluctuations in interest rates, commodity prices and foreign exchange rates, as part of its overall risk management program. Earnings impacts from derivatives used to manage a particular risk are reported as part of Other Income in the related operating segment. Gains or losses from trading activities are reported in Other Income as part of the Corporate, Energy Trading and Eliminations segment.
Certain physical commodity contracts, when used for trading purposes, are deemed to be derivative financial instruments for accounting purposes. Physical commodity contracts entered into for the purpose of receipt or delivery in accordance with the company's expected purchase, sale or usage requirements are not considered to be derivative financial instruments.
Derivatives embedded in other financial instruments or other host contracts are recorded as separate derivatives when their risks and characteristics are not closely related to those of the host contract.
(r) Hedging Activities
The company may apply hedge accounting to arrangements that qualify for designated hedge accounting treatment. Documentation is prepared at the inception of a hedge relationship in order to qualify for hedge accounting. Designated hedges are assessed at each reporting date to determine if the relationship between the derivative and the underlying hedged exposure is still effective and to quantify any ineffectiveness in the relationship.
If the derivative is designated as a fair value hedge, changes in the fair value of the derivative and in the fair value of the underlying hedged item are recognized in net earnings. If the derivative is designated as a cash flow hedge, the effective portions of the changes in fair value of the derivative are initially recorded in Other Comprehensive Income and are recognized in net earnings when the hedged item is realized. Ineffective portions of changes in the fair value of cash flow hedges are recognized in net earnings immediately. Changes in the fair value of a derivative designated in a fair value or cash flow hedge are recognized in the same line item as the underlying hedged item.
(s) Share Capital
Common shares are classified as equity. Incremental costs directly attributable to the issuance of common shares are recognized as a deduction from equity, net of any tax effects. When the company repurchases its own common shares, share capital is reduced by the average carrying value of the shares repurchased. The excess of the purchase price over the average carrying value is recognized as a deduction from Retained Earnings. Shares are cancelled upon repurchase.
(t) Dividend Distributions
Dividends on common shares are recognized in the period in which the dividends are declared by the company's Board of Directors.
(u) Earnings per Share
Basic earnings per share is calculated by dividing the net earnings for the period by the weighted average number of common shares outstanding during the period.
Diluted earnings per share is calculated by adjusting the weighted average number of common shares outstanding for dilutive common shares related to the company's share-based compensation plans. The number of shares included is computed using the treasury stock method. Options with tandem stock appreciation rights or cash payment alternatives are
90 2017 ANNUAL REPORT Suncor Energy Inc.
accounted for as cash-settled plans. As these awards can be exchanged for common shares of the company, they are considered potentially dilutive and are included in the calculation of the company's diluted net earnings per share if they have a dilutive impact in the period.
(v) Emissions Obligations
Emissions obligations are measured at the weighted average cost per unit of emissions expected to be incurred in the compliance period and are recorded in the period in which the emissions occur.
Purchases of emissions rights are recognized as Other Assets on the balance sheet and are measured at historical cost. Emissions rights received by way of grant are recorded at a nominal amount.
4. SIGNIFICANT ACCOUNTING ESTIMATES AND JUDGMENTS
The preparation of financial statements in accordance with IFRS requires management to make estimates and judgments that affect reported assets, liabilities, revenues, expenses, gains, losses, and disclosures of contingencies. These estimates and judgments are subject to change based on experience and new information. The financial statement areas that require significant estimates and judgments are as follows:
Oil and Gas Reserves
Measurements of depletion, depreciation, impairment and decommissioning and restoration obligations are determined in part based on the company's estimate of oil and gas reserves. The estimation of reserves is an inherently complex process and involves the exercise of professional judgment. All reserves have been evaluated at December 31, 2017 by independent qualified reserves evaluators. Oil and gas reserves estimates are based on a range of geological, technical and economic factors, including projected future rates of production, projected future commodity prices, engineering data, and the timing and amount of future expenditures, all of which are subject to uncertainty. Estimates reflect market and regulatory conditions existing at December 31, 2017, which could differ significantly from other points in time throughout the year, or future periods. Changes in market and regulatory conditions and assumptions can materially impact the estimation of net reserves.
Oil and Gas Activities
The company is required to apply judgment when designating the nature of oil and gas activities as exploration, evaluation, development or production, and when determining whether the costs of these activities shall be expensed or capitalized.
Exploration and Evaluation Costs
Certain exploration and evaluation costs are initially capitalized with the intent to establish commercially viable reserves. The company is required to make judgments about future events and circumstances and applies estimates to assess the economic viability of extracting the underlying resources. The costs are subject to technical, commercial and management review to confirm the continued intent to develop the project. Level of drilling success or changes to project economics, resource quantities, expected production techniques, production costs and required capital expenditures are important judgments when making this determination. Management uses judgment to determine when these costs are reclassified to Property, Plant and Equipment based on several factors including the existence of reserves, appropriate approvals from regulatory bodies and the company's internal project approval process.
Determination of Cash Generating Units (CGUs)
A CGU is the lowest grouping of integrated assets that generate identifiable cash inflows that are largely independent of the cash inflows of other assets or groups of assets. The allocation of assets into CGUs requires significant judgment and interpretations with respect to the integration between assets, the existence of active markets, similar exposure to market risks, shared infrastructures, and the way in which management monitors the operations.
Asset Impairment and Reversals
Management applies judgment in assessing the existence of impairment and impairment reversal indicators based on various internal and external factors.
The recoverable amount of CGUs and individual assets is determined based on the higher of fair value less costs of disposal or value-in-use calculations. The key estimates the company applies in determining the recoverable amount normally include estimated future commodity prices, expected production volumes, future operating and development costs, discount rates, tax rates, and refining margins. In determining the recoverable amount, management may also be required to make
2017 ANNUAL REPORT Suncor Energy Inc. 91
judgments regarding the likelihood of occurrence of a future event. Changes to these estimates and judgments will affect the recoverable amounts of CGUs and individual assets and may then require a material adjustment to their related carrying value.
Decommissioning and Restoration Costs
The company recognizes liabilities for the future decommissioning and restoration of Exploration and Evaluation assets and Property, Plant and Equipment. Management applies judgment in assessing the existence and extent as well as the expected method of reclamation of the company's decommissioning and restoration obligations at the end of each reporting period. Management also uses judgment to determine whether the nature of the activities performed is related to decommissioning and restoration activities or normal operating activities.
In addition, these provisions are based on estimated costs, which take into account the anticipated method and extent of restoration, technological advances, possible future use of the site, reclamation projects and processes and the water treatment facility. Actual costs are uncertain and estimates can vary as a result of changes to relevant laws and regulations related to the use of certain technologies, the emergence of new technology, operating experience, prices and closure plans. The estimated timing of future decommissioning and restoration may change due to certain factors, including reserves life. Changes to estimates related to future expected costs, discount rates, inflation assumptions, and timing may have a material impact on the amounts presented.
Employee Future Benefits
The company provides benefits to employees, including pensions and other post-retirement benefits. The cost of defined benefit pension plans and other post-retirement benefits received by employees is estimated based on actuarial valuation methods that require professional judgment. Estimates typically used in determining these amounts include, as applicable, rates of employee turnover, future claim costs, discount rates, future salary and benefit levels, the return on plan assets, mortality rates and future medical costs. Changes to these estimates may have a material impact on the amounts presented.
Other Provisions
The determination of other provisions, including, but not limited to, provisions for royalty disputes, onerous contracts, litigation and constructive obligations, is a complex process that involves judgments about the outcomes of future events, the interpretation of laws and regulations, and estimates on timing and amount of expected future cash flows and discount rates.
Income Taxes
Management evaluates tax positions, annually or when circumstances require, which involves judgment and could be subject to differing interpretations of applicable tax legislation. The company recognizes a tax provision when a payment to tax authorities is considered probable. However, the results of audits and reassessments and changes in the interpretations of standards may result in changes to those positions and, potentially, a material increase or decrease in the company's assets, liabilities and net earnings.
Deferred Income Taxes
Deferred tax assets are recognized when it is considered probable that deductible temporary differences will be recovered in the foreseeable future. To the extent that future taxable income and the application of existing tax laws in each jurisdiction differ significantly from the company's estimate, the ability of the company to realize the deferred tax assets could be impacted.
Deferred tax liabilities are recognized when there are taxable temporary differences that will reverse and result in a future outflow of funds to a taxation authority. The company records a provision for the amount that is expected to be settled, which requires judgment as to the ultimate outcome. Deferred tax liabilities could be impacted by changes in the company's judgment of the likelihood of a future outflow and estimates of the expected settlement amount, timing of reversals, and the tax laws in the jurisdictions in which the company operates.
Fair Value of Financial Instruments
The fair value of a financial instrument is determined, whenever possible, based on observable market data. If not available, the company uses third-party models and valuation methodologies that utilize observable market data that includes forward commodity prices, foreign exchange rates and interest rates to estimate the fair value of financial instruments, including derivatives. In addition to market information, the company incorporates transaction-specific details that market participants would utilize in a fair value measurement, including the impact of non-performance risk.
92 2017 ANNUAL REPORT Suncor Energy Inc.
Functional Currency
The designation of the functional currency of the company and each of its subsidiaries is a management judgment based on the composition of revenue and costs in the locations in which it operates.
Fair Value of Share-Based Compensation
The fair values of equity-settled and cash-settled share-based payment awards are estimated using the Black-Scholes options pricing model. These estimates depend on certain assumptions, including share price, volatility, risk-free interest rate, the term of the awards, the forfeiture rate and the annual dividend yield, which, by their nature, are subject to measurement uncertainty.
5. RECENTLY ANNOUNCED ACCOUNTING PRONOUNCEMENTS
The standards, amendments and interpretations that are issued, but not yet effective up to the date of authorization of the company's consolidated financial statements, and that may have an impact on the disclosures and financial position of the company, are disclosed below. The company intends to adopt these standards, amendments and interpretations when they become effective.
Revenue from Contracts with Customers
In May 2014, the IASB issued IFRS 15 Revenue from Contracts with Customers. It replaces existing revenue recognition guidance and provides a single, principles-based five-step model to be applied to all contracts with customers. The company will retrospectively adopt this standard on the effective date of January 1, 2018. The adoption of this standard will result in a change in presentation between Operating Revenues Net of Royalties and the Operating, Selling and General expense and Transportation expense line items; however, there will be no impact on the company's consolidated net earnings. Additional note disclosure will also be required.
Financial Instruments
In July 2014, IFRS 9 Financial Instruments was issued as a complete standard, including the requirements previously issued related to classification and measurement of financial assets and liabilities, with additional amendments to introduce a new expected loss impairment model for financial assets including credit losses. The company will retrospectively adopt this standard on the effective date of January 1, 2018. IFRS 9 will replace the multiple classification and measurement models for financial assets that currently exist under IAS 39 Financial Instruments, and the basis on which financial assets are measured will determine their classification as either, at amortized cost, fair value through profit and loss, or fair value through other comprehensive income. Therefore, the adoption of this standard will result in a reclassification of financial assets currently classified as loans and receivables to financial assets at amortized cost, however there is no impact to the measurement of these financial assets. There will be no classification or measurement impact to the company's financial liabilities. Therefore, the adoption of this standard will not have any impact on the company's consolidated net earnings.
Leases
In January 2016, the IASB issued IFRS 16 Leases which replaces the existing leasing standard (IAS 17 Leases) and requires the recognition of most leases on the balance sheet. IFRS 16 effectively removes the classification of leases as either finance or operating leases and treats all leases as finance leases for lessees with exemptions for short-term leases where the term is twelve months or less and for leases of low-value items. The accounting treatment for lessors remains essentially unchanged, with the requirement to classify leases as either finance or operating. The company will adopt IFRS 16 on the effective date of January 1, 2019, and has selected the modified retrospective transition approach. Suncor has also elected to apply the optional exemptions for short-term and low-value leases. IFRS 16 is expected to materially increase the company's assets and liabilities, increase Depreciation, Depletion, Amortization expense, increase Financing Expense and reduce Operating, Selling and General expense. Cash payments associated with operating leases are currently presented within Operating Activities. Under IFRS 16 the cash flows will be allocated between Financing Activities for the repayment of the principal liability and Operating Activities for the financing expense. The overall impact to cash flow is unchanged. The company has a transition team to assess the impact of IFRS 16 and implement the necessary changes to accounting systems, business processes and internal controls as a result of the new standard. The transition team is currently in the process of reviewing and categorizing the company's contracts and implementing the required information systems changes; however, it is currently too early to quantify the impacts.
2017 ANNUAL REPORT Suncor Energy Inc. 93
In June 2016, the IASB issued the final amendments to IFRS 2 Share-based payments that clarify the classification and measurement of share-based payment transactions. This includes the effect of vesting and non-vesting conditions on the measurement of cash-settled share-based payments, share-based payment transactions with a net settlement feature for withholding tax obligations, and a modification to the terms and conditions of a share-based payment that changes the classification of the transaction from cash-settled to equity-settled. The amendments are to be applied prospectively and are effective for annual periods beginning on or after January 1, 2018, with earlier application permitted. The adoption of this standard will not have any impact on the company's consolidated financial statements.
Uncertainty over Income Tax Treatments
In June 2017, the IASB issued IFRIC 23 Uncertainty over Income Tax Treatments.The interpretation clarifies the accounting for current and deferred tax liabilities and assets in circumstances in which there is uncertainty over income tax treatments. The interpretation requires an entity to consider whether it is probable that a taxation authority will accept an uncertain tax treatment. If the entity considers it to be not probable that a taxation authority will accept an uncertain tax provision the interpretation requires the entity to use the most likely amount or the expected value. The amendments are to be applied retrospectively and are effective for annual periods beginning on or after January 1, 2019, with earlier application permitted. The adoption of this amendment will not have any impact on the company's consolidated financial statements.
6. SEGMENTED INFORMATION
The company's operating segments are reported based on the nature of their products and services and management responsibility. The following summary describes the operations in each of the segments:
- •
- Oil Sands includes the company's operations in the Athabasca oil sands in Alberta to develop and produce synthetic crude oil and related products, through the recovery and upgrading of bitumen from mining and in situ operations. This segment also includes the company's joint interest in the Fort Hills mining project, partnership in East Tank Farm blending and storage facility, as well as its ownership interest in the Syncrude oil sands mining and upgrading joint operation, located near Fort McMurray, Alberta. The individual operating segments related to mining operations, in situ, Fort Hills and Syncrude have been aggregated into one reportable segment (Oil Sands) due to the similar nature of their business activities, including the production of bitumen, and the single geographic area and regulatory environment in which they operate.
- •
- Exploration and Production includes offshore activity in East Coast Canada, with interests in the Hibernia, Terra Nova, White Rose and Hebron oilfields, the exploration and production of crude oil and natural gas at Buzzard and Golden Eagle Area Development, both in the United Kingdom (U. K.), Norway, Libya and Syria, and exploration and production of natural gas and natural gas liquids in Western Canada. Due to unrest in Syria, the company has declared force majeure under its contractual obligations, and Suncor's operations in Syria have been suspended indefinitely. Even though the political situation in Libya has improved, production remains partially shut-in and the timing of a return to normal operations continues to be uncertain.
- •
- Refining and Marketing includes the refining of crude oil products, and the distribution and marketing of these and other purchased products through retail stations located in Canada and the United States (U.S.), as well as a previously owned lubricants plant located in Eastern Canada which was sold on February 1, 2017 (note 36).
The company also reports activities not directly attributable to an operating segment under Corporate, Energy Trading and Eliminations. This includes investments in renewables projects.
Intersegment sales of crude oil and natural gas are accounted for at market values and included, for segmented reporting, in revenues of the segment making the transfer and expenses of the segment receiving the transfer. Intersegment balances are
94 2017 ANNUAL REPORT Suncor Energy Inc.
eliminated on consolidation. Intersegment profit will not be recognized until the related product has been sold to third parties.
| For the years ended December 31 | Oil Sands | Exploration and Production | Refining and Marketing | Corporate, Energy Trading and Eliminations | Total | |||||||||||||||||
| ($ millions) | 2017 | 2016 | 2017 | 2016 | 2017 | 2016 | 2017 | 2016 | 2017 | 2016 | ||||||||||||
| Revenues and Other Income | ||||||||||||||||||||||
| Gross revenues | 9 586 | 7 229 | 3 487 | 2 329 | 19 871 | 17 459 | 38 | 55 | 32 982 | 27 072 | ||||||||||||
| Intersegment revenues | 3 551 | 2 293 | — | 115 | 92 | 108 | (3 643 | ) | (2 516 | ) | — | — | ||||||||||
| Less: Royalties | (355 | ) | (52 | ) | (576 | ) | (213 | ) | — | — | — | — | (931 | ) | (265 | ) | ||||||
| Operating revenues, net of royalties | 12 782 | 9 470 | 2 911 | 2 231 | 19 963 | 17 567 | (3 605 | ) | (2 461 | ) | 32 051 | 26 807 | ||||||||||
| Other income (loss) | 86 | 26 | (14 | ) | 45 | 73 | 16 | (20 | ) | 74 | 125 | 161 | ||||||||||
| 12 868 | 9 496 | 2 897 | 2 276 | 20 036 | 17 583 | (3 625 | ) | (2 387 | ) | 32 176 | 26 968 | |||||||||||
| Expenses | ||||||||||||||||||||||
| Purchases of crude oil and products | 623 | 548 | — | — | 14 011 | 11 754 | (3 513 | ) | (2 425 | ) | 11 121 | 9 877 | ||||||||||
| Operating, selling and general | 6 257 | 5 777 | 422 | 483 | 2 007 | 2 203 | 559 | 687 | 9 245 | 9 150 | ||||||||||||
| Transportation | 690 | 666 | 86 | 86 | 312 | 366 | (51 | ) | (46 | ) | 1 037 | 1 072 | ||||||||||
| Depreciation, depletion, amortization and impairment | 3 782 | 3 864 | 1 028 | 1 381 | 685 | 702 | 106 | 170 | 5 601 | 6 117 | ||||||||||||
| Exploration | 15 | 30 | 89 | 259 | — | — | — | — | 104 | 289 | ||||||||||||
| Gain on disposal of assets | (50 | ) | (33 | ) | — | — | (455 | ) | (35 | ) | (97 | ) | — | (602 | ) | (68 | ) | |||||
| Financing expenses (income) | 180 | 234 | 36 | 82 | 15 | 10 | (477 | ) | 119 | (246 | ) | 445 | ||||||||||
| 11 497 | 11 086 | 1 661 | 2 291 | 16 575 | 15 000 | (3 473 | ) | (1 495 | ) | 26 260 | 26 882 | |||||||||||
| Earnings (Loss) before Income Taxes | 1 371 | (1 590 | ) | 1 236 | (15 | ) | 3 461 | 2 583 | (152 | ) | (892 | ) | 5 916 | 86 | ||||||||
| Income Tax Expense (Recovery) | ||||||||||||||||||||||
| Current | 192 | (363 | ) | 617 | 301 | 941 | 681 | (541 | ) | (466 | ) | 1 209 | 153 | |||||||||
| Deferred | 170 | (78 | ) | (113 | ) | (506 | ) | (138 | ) | 12 | 330 | 60 | 249 | (512 | ) | |||||||
| 362 | (441 | ) | 504 | (205 | ) | 803 | 693 | (211 | ) | (406 | ) | 1 458 | (359 | ) | ||||||||
| Net Earnings (Loss) | 1 009 | (1 149 | ) | 732 | 190 | 2 658 | 1 890 | 59 | (486 | ) | 4 458 | 445 | ||||||||||
| Capital and Exploration Expenditures | 5 059 | 4 724 | 824 | 1 139 | 634 | 685 | 34 | 34 | 6 551 | 6 582 | ||||||||||||
Geographical Information
Operating Revenues, net of Royalties
| ($ millions) | 2017 | 2016 | |||
| Canada | 25 629 | 21 555 | |||
| United States | 4 252 | 3 695 | |||
| Other foreign | 2 170 | 1 557 | |||
| 32 051 | 26 807 | ||||
2017 ANNUAL REPORT Suncor Energy Inc. 95
Non-Current Assets(1)
| ($ millions) | Dec 31 2017 | Dec 31 2016 | |||
| Canada | 76 091 | 73 704 | |||
| United States | 1 712 | 1 509 | |||
| Other foreign | 2 014 | 2 407 | |||
| 79 817 | 77 620 | ||||
- (1)
- Excludes deferred income tax assets.
7. ACQUISITION OF CANADIAN OIL SANDS LIMITED (COS)
On February 5, 2016, Suncor obtained control of Canadian Oil Sands Limited (COS) by acquiring 73% of COS' outstanding common shares in exchange for 0.28 of a Suncor share per COS share tendered. The acquisition resulted in the issuance of 98.9 million Suncor common shares, which had a fair value of $31.88 per share based on the closing price on the Toronto Stock Exchange (TSX) on the acquisition date.
COS owned a 36.74% interest in the Syncrude joint arrangement. Suncor acquired COS to benefit from operating synergies and economies of scale expected from combining the two companies' ownership interests in Syncrude.
Purchase Price Consideration
| Number of COS common shares tendered (millions) | 353.3 | ||
| Multiplied by share exchange ratio | 0.28 | ||
| Number of Suncor common shares issued (millions) | 98.9 | ||
| Share price on acquisition date | $31.88 | ||
| Fair value of consideration ($ millions) | 3 154 | ||
On February 22, 2016, and March 21, 2016, Suncor acquired the remaining outstanding 131.3 million COS shares on the same terms as the initial acquisition, resulting in the issuance of an additional 36.7 million Suncor common shares which resulted in a total acquisition price of $4.452 billion. The estimated fair values of the net assets acquired were not adjusted to reflect the changes in Suncor's share price on the subsequent transaction dates.
96 2017 ANNUAL REPORT Suncor Energy Inc.
Purchase Price Allocation
The acquisition has been accounted for as a business combination using the acquisition method whereby the net assets acquired and the liabilities assumed are recorded at fair value, except for the employee future benefit liability which is measured as the present value of the net obligation. The purchase price allocation was based on management's best estimates of fair values of COS' assets and liabilities as at February 5, 2016.
| ($ millions) | ||||
| Cash | 109 | |||
| Accounts receivable | 231 | |||
| Inventory | 135 | |||
| Other assets | 105 | |||
| Property, plant and equipment | 9 476 | |||
| Exploration and evaluation | 602 | |||
| Total assets acquired | 10 658 | |||
| Accounts payable and other liabilities | (375 | ) | ||
| Long-term debt | (2 639 | ) | ||
| Employee future benefits | (323 | ) | ||
| Decommissioning provision | (1 169 | ) | ||
| Deferred income taxes | (1 826 | ) | ||
| Total liabilities assumed | (6 332 | ) | ||
| Net assets of COS | 4 326 | |||
| Non-controlling interest | (1 172 | ) | ||
| Net assets acquired | 3 154 | |||
The fair values of cash, accounts receivable and other current assets, and accounts payable and other liabilities approximate their carrying values due to the short-term maturity of the instruments. The fair values of crude inventory and long-term debt were determined using quoted prices and rates from available pricing sources. The fair value of materials and supplies inventory approximates book value due to short-term turnover rates. The fair values of property, plant and equipment, and the decommissioning provision were determined using an expected future cash flow approach. Key assumptions used in the calculations were discount rates, future commodity prices and costs, timing of development activities, projections of oil reserves, and cost estimates to abandon and reclaim the mine and facilities.
The following table summarizes the fair value of COS debt acquired by Suncor.
| ($ millions) | February 5, 2016 | |||
| Fixed-term debt, redeemable at the option of the company | ||||
| 7.75% Notes, due 2019 (US$500) | 755 | |||
| 7.90% Notes, due 2021 (US$250) | 389 | |||
| 4.50% Notes, due 2022 (US$400) | 515 | |||
| 8.20% Notes, due 2027 (US$74) | 114 | |||
| 6.00% Notes, due 2042 (US$300) | 316 | |||
| Total Notes | 2 089 | |||
| Credit facility | 550 | |||
| Total long-term debt | 2 639 | |||
2017 ANNUAL REPORT Suncor Energy Inc. 97
During the second quarter of 2016, the company purchased US$688 million of subsidiary debt acquired through the acquisition of COS. In 2016, the company also repaid the $550 million credit facility acquired in the COS transaction, as well as an additional $50 million which was drawn on the facility subsequent to February 5, 2016.
The non-controlling interest (NCI) was initially measured at the NCI's proportionate share of the net identifiable assets acquired. The subsequent transactions on February 22, 2016, and March 21, 2016, were accounted for as equity transactions with shareholders and eliminated the NCI balance. Suncor recognized the difference between the fair value of the common shares issued and the NCI recorded at February 5, 2016 directly in equity. During the period from February 5, 2016 to March 21, 2016, when Suncor did not own 100% of the equity, net earnings of $11 million were earned that were attributable to the NCI owners.
As part of the acquisition, the company also assumed various pipeline and storage commitments of $3.0 billion undiscounted. The contract terms of these commitments range between one and 24 years, with payments that commenced in the first quarter of 2016.
Acquisition costs of $29 million have been charged to Operating, Selling and General expense in the consolidated statements of comprehensive income (loss) for the year ended December 31, 2016.
The acquisition of COS contributed $1.9 billion to gross revenues and $69 million to consolidated net loss from the acquisition date to December 31, 2016.
Had the acquisition occurred on January 1, 2016, COS would have contributed $2.1 billion to gross revenues and $105 million to consolidated net loss, which would have resulted in gross revenues of $27 billion and consolidated net income of $408 million for the year ended December 31, 2016.
8. ACQUISITION OF ADDITIONAL OWNERSHIP INTEREST IN SYNCRUDE
On June 23, 2016, Suncor completed the purchase of an additional 5% working interest in the Syncrude project from Murphy Oil Corporation's Canadian subsidiary for $946 million after purchase price adjustments. The purchase increased Suncor's share in the Syncrude project to 53.74%
The acquisition has been accounted for as a business combination using the acquisition method. The purchase price allocation was based on management's best estimates of fair values of Syncrude's assets and liabilities as at June 23, 2016.
| ($ millions) | |||
| Accounts receivable | 8 | ||
| Inventory | 19 | ||
| Property, plant and equipment | 1 330 | ||
| Exploration and evaluation | 82 | ||
| Total assets acquired | 1 439 | ||
| Accounts payable and other liabilities | (29) | ||
| Employee future benefits | (49) | ||
| Decommissioning provision | (187) | ||
| Deferred income taxes | (228) | ||
| Total liabilities assumed | (493) | ||
| Net assets acquired | 946 | ||
The fair values of accounts receivable and accounts payable approximate their carrying values due to the short-term maturity of the instruments. The fair value of crude inventory was determined using quoted prices and rates from available pricing sources. The fair value of materials and supplies inventory approximates book value due to short-term turnover rates. The fair values of property, plant and equipment, and the decommissioning provision were determined using an expected future cash flow approach. Key assumptions used in the calculations were discount rates, future commodity prices and costs, timing of development activities, projections of oil reserves, and cost estimates to abandon and reclaim the mine and facilities. All of the key assumptions were applied on a consistent basis with the COS acquisition (note 7).
98 2017 ANNUAL REPORT Suncor Energy Inc.
The additional interest in Syncrude contributed $191 million to gross revenues and $7 million to consolidated net income from the acquisition date to December 31, 2016.
Had the acquisition occurred on January 1, 2016, the additional interest would have contributed $275 million to gross revenues and $26 million to consolidated net loss, which would have resulted in gross revenues of $27 billion and consolidated net income of $412 million for the year ended December 31, 2016.
9. OTHER INCOME
Other income consists of the following:
| ($ millions) | 2017 | 2016 | |||||
| Energy trading activities | |||||||
| Unrealized (losses) recognized in earnings during the period | (37 | ) | (47 | ) | |||
| (Losses) gains on inventory valuation | (39 | ) | 62 | ||||
| Risk management activities(1) | (19 | ) | (25 | ) | |||
| Investment and interest income | 162 | 77 | |||||
| Risk mitigation and insurance proceeds(2) | 76 | 41 | |||||
| Change in value of pipeline commitments and other | (18 | ) | 53 | ||||
| 125 | 161 | ||||||
- (1)
- Includes fair value changes related to short-term derivative contracts in the Oil Sands and Refining and Marketing segments and long-term forward-starting interest rate swaps in the Corporate segment.
- (2)
- 2017 includes property damage insurance proceeds for Syncrude in the Oil Sands segment and 2016 includes property damage insurance proceeds for the Terra Nova asset in the Exploration and Production segment.
10. OPERATING, SELLING AND GENERAL
Operating, Selling and General expense consists of the following:
| ($ millions) | 2017 | 2016 | |||
| Contract services(1) | 3 551 | 3 363 | |||
| Employee costs(1) | 3 290 | 3 412 | |||
| Materials | 706 | 705 | |||
| Energy | 1 178 | 994 | |||
| Equipment rentals and leases | 279 | 267 | |||
| Travel, marketing and other | 241 | 409 | |||
| 9 245 | 9 150 | ||||
- (1)
- The company incurred $7.3 billion of contract services and employee costs for the year ended December 31, 2017 (2016 – $7.2 billion), of which $6.8 billion (2016 – $6.8 billion) was recorded in Operating, Selling and General expense and $0.5 billion was recorded as Property, Plant and Equipment (2016 – $0.4 billion). Employee costs include salaries, benefits and share-based compensation.
11. ASSET IMPAIRMENT AND DERECOGNITION
During the fourth quarter of 2016, the company recorded after-tax derecognition charges of $40 million on certain upgrading and logistics assets in the Oil Sands segment, as a result of the uncertainty of future benefits from these assets. As well, the company also recorded after-tax derecognition charges of $31 million in the Corporate segment relating to an initial investment in an undeveloped pipeline and on certain renewable energy development assets, as a result of the uncertainty of future benefits from these assets.
During the second quarter of 2016, the company recognized an impairment charge of $33 million (net of taxes of $119 million) against certain Exploration and Evaluation assets in Norway as a result of future development uncertainty.
2017 ANNUAL REPORT Suncor Energy Inc. 99
12. FINANCING (INCOME) EXPENSES
| ($ millions) | 2017 | 2016 | |||||
| Interest on debt and finance leases | 945 | 1 012 | |||||
| Capitalized interest at 5.5% (2016 – 5.7%) | (729 | ) | (597 | ) | |||
| Interest expense | 216 | 415 | |||||
| Interest on partnership liability (note 38) | 5 | — | |||||
| Interest on pension and other post-retirement benefits | 58 | 59 | |||||
| Accretion | 247 | 269 | |||||
| Foreign exchange gain on U.S. dollar denominated debt | (771 | ) | (458 | ) | |||
| Foreign exchange and other | (52 | ) | 61 | ||||
| Loss on extinguishment of long-term debt | 113 | 99 | |||||
| Realized gain on foreign currency hedges | (62 | ) | — | ||||
| (246 | ) | 445 | |||||
13. INCOME TAXES
Income Tax Expense (Recovery)
| ($ millions) | 2017 | 2016 | |||||
| Current: | |||||||
| Current year | 1 150 | 222 | |||||
| Adjustments to current income tax of prior years | 59 | (69 | ) | ||||
| Deferred: | |||||||
| Origination of temporary differences | 425 | (313 | ) | ||||
| Adjustments in respect of deferred income tax of prior years | (70 | ) | 67 | ||||
| Changes in tax rates and legislation | (106 | ) | (190 | ) | |||
| Recognition of previously unrecognized deferred tax assets | — | (76 | ) | ||||
| 1 458 | (359 | ) | |||||
100 2017 ANNUAL REPORT Suncor Energy Inc.
Reconciliation of Effective Tax Rate
The provision for income taxes reflects an effective tax rate that differs from the statutory tax rate. A reconciliation of the difference is as follows:
| ($ millions) | 2017 | 2016 | |||||
| Earnings before income tax | 5 916 | 86 | |||||
| Canadian statutory tax rate | 27.01% | 27.00% | |||||
| Statutory tax | 1 598 | 23 | |||||
| Add (deduct) the tax effect of: | |||||||
| Non-taxable component of capital gains | (90 | ) | (60 | ) | |||
| Share-based compensation and other permanent items | (1 | ) | 19 | ||||
| Assessments and adjustments | (11 | ) | (2 | ) | |||
| Impact of income tax rate and legislative changes | (106 | ) | (190 | ) | |||
| Foreign tax rate differential | 180 | (28 | ) | ||||
| Non-taxable component of dispositions | (41 | ) | — | ||||
| Tax gains for which no deferred income tax asset was recognized | (51 | ) | (50 | ) | |||
| Recognition of deferred income tax asset previously unrecognized | — | (76 | ) | ||||
| Other | (20 | ) | 5 | ||||
| 1 458 | (359 | ) | |||||
Deferred Income Tax Balances
Deferred income tax expense (recovery) and net liabilities in the company's consolidated financial statements were comprised of the following:
| Net Earnings (Loss) | Consolidated Balance Sheets(1) | |||||||||
| ($ millions) | 2017 | 2016 | Dec 31 2017 | Dec 31 2016 | ||||||
| Property, plant and equipment | 157 | (864 | ) | 14 252 | 13 864 | |||||
| Decommissioning and restoration provision | 19 | 342 | (1 910 | ) | (1 701 | ) | ||||
| Employee retirement benefit plans | (5 | ) | (23 | ) | (639 | ) | (648 | ) | ||
| Tax loss carry-forwards | — | (10 | ) | (109 | ) | (109 | ) | |||
| Partnership deferral reserve | — | (78 | ) | — | — | |||||
| Foreign exchange and other | 78 | 121 | (161 | ) | (226 | ) | ||||
| 249 | (512 | ) | 11 433 | 11 180 | ||||||
- (1)
- The current and non-current portion of the deferred income tax liability and asset are as follows:
| ($ millions) | Dec 31 2017 | Dec 31 2016 | ||||
| Deferred income tax liability expected to reverse within 12 months | 93 | 195 | ||||
| Deferred income tax asset expected to reverse within 12 months | (27 | ) | (21 | ) | ||
| Deferred income tax liability expected to reverse after 12 months | 11 440 | 11 048 | ||||
| Deferred income tax asset expected to reverse after 12 months | (73 | ) | (42 | ) | ||
| Net deferred income tax liability | 11 433 | 11 180 | ||||
2017 ANNUAL REPORT Suncor Energy Inc. 101
Change in Deferred Income Tax Balances
| ($ millions) | 2017 | 2016 | ||||
| Beginning of year | 11 180 | 9 919 | ||||
| Recognized in deferred income tax expense | 249 | (512 | ) | |||
| Recognized in other comprehensive income | 19 | (5 | ) | |||
| Recognized in equity | — | (26 | ) | |||
| Acquisition | — | 2 054 | ||||
| Foreign exchange, disposition and other | (15 | ) | (179 | ) | ||
| Reclassified to assets held for sale (notes 36 and 37) | — | (71 | ) | |||
| End of year | 11 433 | 11 180 | ||||
Deferred Tax in Shareholders' Equity
| Year ended December 31 | ||||||
| ($ millions) | 2017 | 2016 | ||||
| Deferred Tax in Other Comprehensive (Loss) Income | ||||||
| Actuarial (gain) loss on employment retirement benefit plans | (19 | ) | 5 | |||
| Deferred Tax in Equity | ||||||
| Common share issuance | — | 26 | ||||
| (19 | ) | 31 | ||||
Deferred income tax assets are recognized for tax loss carry-forwards to the extent that the realization of the related tax benefit through future tax profits is probable. Suncor has not recognized a $75 million (2016 – $125 million) deferred tax asset on $556 million (2016 – $926 million) of capital losses on foreign exchange on U.S. dollar denominated debt which can only be utilized against future capital gains.
No deferred tax liability has been recognized at December 31, 2017, on temporary differences of approximately $9.6 billion (2016 – $9.9 billion) associated with earnings retained in our investments in foreign subsidiaries, as the company is able to control the timing of the reversal of these differences. Based on current plans, repatriation of funds in excess of foreign reinvestment will not result in material additional income tax expense. Deferred distribution taxes associated with international business operations have not been recorded.
In the fourth quarter of 2017, the U.S. government enacted a decrease in the federal corporate tax rate from 35% to 21% effective January 1, 2018. As a result, the company revalued its deferred income tax balances, resulting in a deferred income tax recovery of $124 million.
In the fourth quarter of 2017, the Government of British Columbia enacted an increase to the provincial corporate income tax rate from 11% to 12%. As a result, the company revalued its deferred income tax balances, resulting in a deferred income tax expense of $18 million.
In the fourth quarter of 2016, the Government of Quebec enacted a decrease in the corporate income tax rate from 11.9% to 11.5% evenly over the next four years, effective January 1, 2017. As a result, the company revalued its deferred income tax balances, resulting in a deferred income tax recovery of $10 million.
In the third quarter of 2016, the U.K. government enacted a decrease in the supplementary charge rate on oil and gas profits in the North Sea that reduced the statutory tax rate on Suncor's earnings in the U.K. from 50% to 40%. The company revalued its deferred income tax balances, resulting in a deferred income tax recovery of $180 million.
102 2017 ANNUAL REPORT Suncor Energy Inc.
14. EARNINGS PER COMMON SHARE
| ($ millions) | 2017 | 2016 | |||||
| Net earnings | 4 458 | 445 | |||||
| Dilutive impact of accounting for awards as equity-settled(1) | (1 | ) | (1 | ) | |||
| Net earnings – diluted | 4 457 | 444 | |||||
| Net earnings attributable to common shareholders | 4 458 | 434 | |||||
| Dilutive impact of accounting for awards as equity-settled(1) | (1 | ) | (1 | ) | |||
| Net earnings – diluted attributable to common shareholders | 4 457 | 433 | |||||
(millions of common shares) | |||||||
| Weighted average number of common shares | 1 661 | 1 610 | |||||
| Dilutive securities: | |||||||
| Effect of share options | 4 | 2 | |||||
| Weighted average number of diluted common shares | 1 665 | 1 612 | |||||
(dollars per common share) | |||||||
| Basic and diluted earnings per share | 2.68 | 0.28 | |||||
| Basic and diluted earnings per share attributable to common shareholders | 2.68 | 0.27 | |||||
- (1)
- Cash payment alternatives are accounted for as cash-settled plans. As these awards can be exchanged for common shares of the company, they are considered potentially dilutive and are included in the calculation of the company's diluted net earnings per share if they have a dilutive impact in the period. Accounting for these awards as equity-settled was determined to have a dilutive impact for the year ended December 31, 2017 and December 31, 2016.
15. CASH AND CASH EQUIVALENTS
| ($ millions) | Dec 31 2017 | Dec 31 2016 | |||
| Cash | 1 184 | 1 103 | |||
| Cash equivalents | 1 488 | 1 913 | |||
| 2 672 | 3 016 | ||||
2017 ANNUAL REPORT Suncor Energy Inc. 103
16. SUPPLEMENTAL CASH FLOW INFORMATION
The decrease (increase) in non-cash working capital is comprised of:
| ($ millions) | 2017 | 2016 | |||||
| Accounts receivable | (79 | ) | (471 | ) | |||
| Inventories | (268 | ) | (218 | ) | |||
| Accounts payable and accrued liabilities | 68 | 110 | |||||
| Current portion of provisions | (48 | ) | (98 | ) | |||
| Income taxes payable (net) | 421 | 145 | |||||
| 94 | (532 | ) | |||||
| Relating to: | |||||||
| Operating activities | (173 | ) | (308 | ) | |||
| Investing activities | 267 | (224 | ) | ||||
| 94 | (532 | ) | |||||
104 2017 ANNUAL REPORT Suncor Energy Inc.
Reconciliation of movements of liabilities to cash flows arising from financing activities:
| ($ millions) | Short-Term Debt | Current Portion of Long-Term Debt | Long-Term Debt | Partnership Liability | Dividends Payable | Derivative Liabilities (Assets)(1) | |||||||||
| At December 31, 2016 | 1 273 | 54 | 16 103 | — | — | 17 | |||||||||
| Changes from financing cash flows: | |||||||||||||||
| Net issuance of commercial paper | 1 065 | — | — | — | — | — | |||||||||
| Gross proceeds from issuance of long-term debt | — | — | 955 | — | — | — | |||||||||
| Debt issuance costs | — | — | (13 | ) | — | — | — | ||||||||
| Repayment of long-term debt | — | — | (2 561 | ) | — | — | — | ||||||||
| Realized foreign exchange gain | (84 | ) | — | (612 | ) | — | — | — | |||||||
| Dividends paid on common shares | — | — | — | — | (2 124 | ) | — | ||||||||
| Payments of finance lease liabilities | — | — | (58 | ) | — | — | — | ||||||||
| Net settlement of derivatives | — | — | — | — | — | 25 | |||||||||
| Proceeds from sale of non-controlling interest | — | — | — | 503 | — | — | |||||||||
| Distributions to non-controlling interest | — | — | — | (20 | ) | — | |||||||||
| Non-cash changes: | |||||||||||||||
| Dividends declared on common shares | — | — | — | — | 2 124 | — | |||||||||
| Unrealized foreign exchange gain | (118 | ) | — | (653 | ) | — | — | — | |||||||
| Deferred financing costs | — | — | (14 | ) | — | — | — | ||||||||
| New finance lease liabilities | — | — | 628 | — | — | — | |||||||||
| Unrealized fair value gain recognized in net earnings | — | — | — | — | — | (42 | ) | ||||||||
| Reclassification from long-term debt to current portion of long-term debt | — | 17 | (17 | ) | — | — | — | ||||||||
| Reclassification from a finance lease to a service arrangement(2) | — | — | (386 | ) | — | — | — | ||||||||
| At December 31, 2017 | 2 136 | 71 | 13 372 | 483 | — | — | |||||||||
- (1)
- Derivative liabilities (assets) relate to foreign exchange forward contracts and interest rate swaps the company may utilize for risk management purposes in relation to U.S. dollar denominated long-term debt.
- (2)
- Service agreements are recorded in Operating, Selling and General expense as incurred.
17. INVENTORIES
| ($ millions) | Dec 31 2017 | Dec 31 2016 | ||||
| Crude oil | 1 203 | 1 110 | ||||
| Refined products | 1 268 | 1 193 | ||||
| Materials, supplies and merchandise | 664 | 680 | ||||
| Energy trading commodity inventories | 333 | 515 | ||||
| Reclassified to assets held for sale (notes 36 and 37) | — | (258 | ) | |||
| 3 468 | 3 240 | |||||
2017 ANNUAL REPORT Suncor Energy Inc. 105
During 2017, product inventories of $11.6 billion (2016 – $10.1 billion) were recorded as an expense. There was no write-down of crude oil (2016 – $32 million) and no write-down of materials, supplies and merchandise in 2017 (2016 – $26 million). Energy trading commodity inventories are measured at fair value less costs of disposal based on Level 1 and Level 2 fair value inputs.
18. PROPERTY, PLANT AND EQUIPMENT
| ($ millions) | Oil and Gas Properties | Plant and Equipment | Total | ||||||
| Cost | |||||||||
| At December 31, 2015 | 32 635 | 61 077 | 93 712 | ||||||
| Additions | 1 428 | 5 142 | 6 570 | ||||||
| Transfers from exploration and evaluation | 65 | — | 65 | ||||||
| Acquisitions (notes 7 and 8) | 1 678 | 9 128 | 10 806 | ||||||
| Changes in decommissioning and restoration | (68 | ) | 21 | (47 | ) | ||||
| Disposals and derecognition | (166 | ) | (803 | ) | (969 | ) | |||
| Foreign exchange adjustments | (1 431 | ) | (121 | ) | (1 552 | ) | |||
| Reclassified to assets held for sale (notes 36 and 37) | — | (907 | ) | (907 | ) | ||||
| At December 31, 2016 | 34 141 | 73 537 | 107 678 | ||||||
| Additions | 1 235 | 5 875 | 7 110 | ||||||
| Acquisitions (note 35) | 25 | 310 | 335 | ||||||
| Changes in decommissioning and restoration | 821 | 22 | 843 | ||||||
| Disposals and derecognition | — | (884 | ) | (884 | ) | ||||
| Foreign exchange adjustments | (13 | ) | (256 | ) | (269 | ) | |||
| Reclassified from assets held for sale (note 37) | — | 35 | 35 | ||||||
| At December 31, 2017 | 36 209 | 78 639 | 114 848 | ||||||
Accumulated provision | |||||||||
| At December 31, 2015 | (14 442 | ) | (18 119 | ) | (32 561 | ) | |||
| Depreciation and depletion | (2 598 | ) | (3 133 | ) | (5 731 | ) | |||
| Disposals and derecognition | — | 645 | 645 | ||||||
| Foreign exchange adjustments | 978 | 55 | 1 033 | ||||||
| Reclassified to assets held for sale (notes 36 and 37) | — | 195 | 195 | ||||||
| At December 31, 2016 | (16 062 | ) | (20 357 | ) | (36 419 | ) | |||
| Depreciation and depletion | (1 916 | ) | (3 514 | ) | (5 430 | ) | |||
| Disposals and derecognition | — | 368 | 368 | ||||||
| Foreign exchange adjustments | 3 | 126 | 129 | ||||||
| Reclassified from assets held for sale (note 37) | — | (3 | ) | (3 | ) | ||||
| At December 31, 2017 | (17 975 | ) | (23 380 | ) | (41 355 | ) | |||
Net property, plant and equipment | |||||||||
| December 31, 2016 | 18 079 | 53 180 | 71 259 | ||||||
| December 31, 2017 | 18 234 | 55 259 | 73 493 | ||||||
106 2017 ANNUAL REPORT Suncor Energy Inc.
| Dec 31, 2017 | Dec 31, 2016 | ||||||||||||
| ($ millions) | Cost | Accumulated Provision | Net Book Value | Cost | Accumulated Provision | Net Book Value | |||||||
| Oil Sands | 79 625 | (22 664 | ) | 56 961 | 73 882 | (19 341 | ) | 54 541 | |||||
| Exploration and Production | 21 007 | (12 990 | ) | 8 017 | 20 058 | (12 020 | ) | 8 038 | |||||
| Refining and Marketing | 13 137 | (4 906 | ) | 8 231 | 12 741 | (4 363 | ) | 8 378 | |||||
| Corporate, Energy Trading and Eliminations | 1 079 | (795 | ) | 284 | 997 | (695 | ) | 302 | |||||
| 114 848 | (41 355 | ) | 73 493 | 107 678 | (36 419 | ) | 71 259 | ||||||
At December 31, 2017, the balance of assets under construction and not subject to depreciation or depletion was $15.9 billion (December 31, 2016 – $16.0 billion).
At December 31, 2017, Property, Plant and Equipment included finance leases with a net book value of $1.4 billion (December 31, 2016 – $1.2 billion).
19. EXPLORATION AND EVALUATION ASSETS
| ($ millions) | 2017 | 2016 | ||||
| Beginning of year | 2 038 | 1 681 | ||||
| Acquisitions and additions (notes 7, 8 and 34) | 53 | 787 | ||||
| Transfers to oil and gas assets | — | (65 | ) | |||
| Dry hole expenses | (41 | ) | (204 | ) | ||
| Impairment (note 11) | — | (152 | ) | |||
| Amortization | (1 | ) | (1 | ) | ||
| Foreign exchange adjustments | 3 | (8 | ) | |||
| End of year | 2 052 | 2 038 | ||||
20. OTHER ASSETS
| ($ millions) | Dec 31 2017 | Dec 31 2016 | |||
| Investments | 224 | 191 | |||
| Prepaids and other | 987 | 1 057 | |||
| 1 211 | 1 248 | ||||
Prepaids and other includes long-term accounts receivables related to deposits paid on Notices of Reassessments that have been received from the Canada Revenue Agency (CRA) and are unlikely to be settled within one year.
2017 ANNUAL REPORT Suncor Energy Inc. 107
21. GOODWILL AND OTHER INTANGIBLE ASSETS
| Oil Sands | Refining and Marketing | |||||||||||
| ($ millions) | Goodwill | Goodwill | Brand name | Customer lists | Total | |||||||
| At December 31, 2015 | 2 752 | 148 | 166 | 13 | 3 079 | |||||||
| Amortization | — | — | — | (4 | ) | (4 | ) | |||||
| At December 31, 2016 | 2 752 | 148 | 166 | 9 | 3 075 | |||||||
| Disposals (note 36) | — | (8 | ) | (4 | ) | (1 | ) | (13 | ) | |||
| Additions | — | — | — | 2 | 2 | |||||||
| Amortization | — | — | — | (3 | ) | (3 | ) | |||||
| At December 31, 2017 | 2 752 | 140 | 162 | 7 | 3 061 | |||||||
The company performed a goodwill impairment test at December 31, 2017 on its Oil Sands CGUs. Recoverable amounts were based on fair value less costs of disposal calculated using the present value of the CGUs' expected future cash flows. The primary sources of cash flow information are derived from business plans approved by executives of the company, which were developed based on macroeconomic factors such as forward price curves for benchmark commodities, inflation rates and industry supply-demand fundamentals. When required, the projected cash flows in the business plans have been updated to reflect current market assessments of key assumptions, including long-term forecasts of commodity prices, inflation rates, foreign exchange rates and discount rates specific to the asset (Level 3 fair value inputs).
Cash flow forecasts are also based on past experience, historical trends and third-party evaluations of the company's reserves and resources to determine production profiles and volumes, operating costs, maintenance and capital expenditures. Production profiles, reserves volumes, operating costs, maintenance and capital expenditures are consistent with the estimates approved through the company's annual reserves evaluation process and determine the duration of the underlying cash flows used in the discounted cash flow test.
Future cash flow estimates are discounted using after-tax risk-adjusted discount rates. The discount rates are calculated based on the weighted average cost of capital of a group of relevant peers that is considered to represent the rate of return that would be required by a typical market participant for similar assets. The after-tax discount rate applied to cash flow projections was 8% (2016 – 8%). The company based its cash flow projections on an average West Texas Intermediate (WTI) price of US$61.00 per barrel in 2018, US$68.60 per barrel in 2019, US$76.65 per barrel in 2020, and then escalating at an average of 4% per year from 2021 to 2023 and at an average of 2% thereafter, adjusted for applicable quality and location differentials depending on the underlying CGU. The forecast cash flow period ranged from 20 years to 50 years based on the reserves life of the respective CGU. As a result of this analysis, management did not identify impairment within any of the CGUs comprising the Oil Sands operating segment and the associated allocated goodwill.
The company also performed a goodwill impairment test of its Refining and Marketing CGUs. The recoverable amounts are based on the fair value less costs of disposal calculated using the present value of the CGUs' expected future cash flows, based primarily on the business plan and historical results adjusted for current economic conditions, and escalated using an inflation rate of 2% of revenue and operating costs. The after-tax discount rates applied to the cash flow projection were between 10% and 12% (2016 – between 10% and 15%). As a result of this analysis, no impairment was identified within the operating segment or the associated allocated goodwill.
22. DEBT AND CREDIT FACILITIES
Debt and credit facilities are comprised of the following:
Short-Term Debt
| ($ millions) | Dec 31 2017 | Dec 31 2016 | |||
| Commercial paper(1) | 2 136 | 1 273 | |||
- (1)
- The commercial paper is supported by a revolving credit facility with a syndicate of lenders. The company is authorized to issue commercial paper to a maximum of $4.0 billion having a term not to exceed 365 days. The weighted average interest rate as at December 31, 2017 was 1.56% (December 31, 2016 – 0.97%). Subsequent to year end, the maximum amount authorized to issue under commercial paper is increased to $5.0 billion
108 2017 ANNUAL REPORT Suncor Energy Inc.
Long-Term Debt
| ($ millions) | Dec 31 2017 | Dec 31 2016 | |||||
| Fixed-term debt, redeemable at the option of the company(2) | |||||||
| 6.10% Notes, due 2018 (US$1,250) | — | 1 678 | |||||
| 6.05% Notes, due 2018 (US$600) | — | 809 | |||||
| 5.80% Series 4 Medium Term Notes, due 2018 | — | 700 | |||||
| 7.75% Notes, due 2019 (US$223)(3) | 288 | 317 | |||||
| 3.10% Series 5 Medium Term Notes, due 2021 | 749 | 748 | |||||
| 9.25% Debentures, due 2021 (US$300) | 406 | 440 | |||||
| 9.40% Notes, due 2021 (US$220)(3)(4) | 298 | 325 | |||||
| 4.50% Notes, due 2022 (US$182)(3) | 212 | 225 | |||||
| 3.60% Notes, due 2024 (US$750) | 936 | 1 002 | |||||
| 3.00% Series 5 Medium Term Notes, due 2026(5) | 698 | 698 | |||||
| 7.875% Debentures, due 2026 (US$275) | 365 | 391 | |||||
| 8.20% Notes, due 2027 (US$59)(3) | 81 | 87 | |||||
| 7.00% Debentures, due 2028 (US$250) | 319 | 342 | |||||
| 7.15% Notes, due 2032 (US$500) | 626 | 670 | |||||
| 5.35% Notes, due 2033 (US$300) | 344 | 368 | |||||
| 5.95% Notes, due 2034 (US$500) | 625 | 669 | |||||
| 5.95% Notes, due 2035 (US$600) | 718 | 769 | |||||
| 5.39% Series 4 Medium Term Notes, due 2037 | 599 | 599 | |||||
| 6.50% Notes, due 2038 (US$1,150) | 1 439 | 1 540 | |||||
| 6.80% Notes, due 2038 (US$900) | 1 151 | 1 231 | |||||
| 6.85% Notes, due 2039 (US$750) | 938 | 1 004 | |||||
| 6.00% Notes, due 2042 (US$152)(3) | 140 | 151 | |||||
| 4.34% Series 5 Medium Term Notes, due 2046(6) | 300 | 300 | |||||
| 4.00% Notes, due 2047 (US$750)(7) | 936 | — | |||||
| Total unsecured long term debt | 12 168 | 15 063 | |||||
| Finance leases(8) | 1 319 | 1 134 | |||||
| Deferred financing costs | (44 | ) | (40 | ) | |||
| 13 443 | 16 157 | ||||||
| Current portion of long-term debt | |||||||
| Finance leases | (71 | ) | (54 | ) | |||
| (71 | ) | (54 | ) | ||||
| Total long-term debt | 13 372 | 16 103 | |||||
- (2)
- The value of debt includes the unamortized balance of premiums or discounts.
- (3)
- Debt acquired through the acquisition of COS (note 7).
- (4)
- Subsequent to the acquisition of COS, Moody's Investors Service downgraded COS long-term senior debt rating from Baa3 (negative outlook) to Ba3 (stable outlook). This triggered a change in the coupon rate of the note from 7.9% to 9.4%.
- (5)
- In September 2016, the company issued $700 million of senior unsecured Series 5 Medium Term notes maturing on September 14, 2026. The notes have a coupon of 3.00% and were priced at $99.751 per note for an effective yield of 3.029%. Interest is paid semi-annually.
- (6)
- In September 2016, the company issued $300 million of senior unsecured Series 5 Medium Term notes maturing on September 13, 2046. The notes have a coupon of 4.34% and were priced at $99.900 per note for an effective yield of 4.346%. Interest is paid semi-annually.
- (7)
- During the fourth quarter of 2017, the company issued US$750 million of senior unsecured notes maturing on November 15, 2047. The notes have a coupon of 4.00% and were priced at $99.498 per note for an effective yield of 4.029%. Interest is paid semi-annually.
- (8)
- Interest rates range from 2.9% to 16.5% and maturity dates range from 2027 to 2062.
2017 ANNUAL REPORT Suncor Energy Inc. 109
During the fourth quarter of 2017, the company redeemed its US$600 million (book value of $771 million) senior unsecured notes with a coupon of 6.05% originally scheduled to mature on May 15, 2018 for US$614 million ($788 million), including US$3 million ($4 million) of accrued interest. The company also redeemed its $700 million senior unsecured Series 4 Medium Term notes with a coupon of 5.80% originally scheduled to mature on May 22, 2018 for $715 million, including $3 million of accrued interest. The company realized an overall debt extinguishment loss of $26 million ($18 million after-tax).
During the second quarter of 2017, the company redeemed its US$1.250 billion (book value of $1.700 billion) senior unsecured notes originally scheduled to mature on June 1, 2018 for US$1.344 billion ($1.830 billion), including US$31 million ($42 million) of accrued interest. In conjunction with the early retirement of the notes, the company also realized gains of $62 million on foreign currency hedges resulting in an overall debt extinguishment loss of $25 million ($10 million after-tax).
During the second quarter of 2016, the company purchased US$688 million (book value of $864 million) of subsidiary debt acquired through the acquisition of COS for US$751 million ($973 million) including US$8 million ($10 million) of accrued interest, resulting in a debt extinguishment loss of $99 million ($73 million after-tax). The company also repaid approximately $600 million of the credit facility acquired in the COS transaction.
Scheduled Debt Repayments
Scheduled principal repayments as at December 31, 2017 for finance leases, short-term debt and long-term debt are as follows:
| ($ millions) | Repayment | ||
| 2018 | 2 207 | ||
| 2019 | 313 | ||
| 2020 | 39 | ||
| 2021 | 1 444 | ||
| 2022 | 272 | ||
| Thereafter | 11 371 | ||
| 15 646 | |||
Credit Facilities
A summary of available and unutilized credit facilities is as follows:
| ($ millions) | 2017 | |||
| Fully revolving and expires in 2021 | 4 000 | |||
| Fully revolving and expires in 2020 | 2 504 | |||
| Fully revolving and expires in 2018/2019 | 1 580 | |||
| Can be terminated at any time at the option of the lenders | 140 | |||
| Total credit facilities | 8 224 | |||
| Credit facilities supporting outstanding commercial paper | (2 136 | ) | ||
| Credit facilities supporting standby letters of credit(1) | (1 367 | ) | ||
| Total unutilized credit facilities(2) | 4 721 | |||
- (1)
- To reduce costs, the company supported certain credit facilities with $733 million of cash collateral as at December 31, 2017 (December 31, 2016 – $1.032 billion).
- (2)
- Available credit facilities for liquidity purposes at December 31, 2017 decreased to $4.489 billion compared to $7.467 billion at December 31, 2016, as a result of a planned $1.0 billion reduction in the company's credit facility, the company's cancellation of a $950 million credit facility that was acquired through the acquisition of COS and an increase in short-term indebtedness. The decrease in the company's credit facility and the cancellation of the credit facility were executed in 2017 as the excess liquidity is no longer anticipated to be required and the reduction will reduce future financing expense.
110 2017 ANNUAL REPORT Suncor Energy Inc.
23. OTHER LONG-TERM LIABILITIES
| ($ millions) | Dec 31 2017 | Dec 31 2016 | ||||
| Pensions and other post-retirement benefits (note 24) | 1 369 | 1 464 | ||||
| Share-based compensation plans (note 27) | 361 | 364 | ||||
| Partnership liability (note 38) | 483 | — | ||||
| Deferred revenue | 49 | 55 | ||||
| Libya Exploration and Production Sharing Agreement (EPSA) signature bonus(1) | 77 | 83 | ||||
| Other | 73 | 131 | ||||
| Reclassified to assets held for sale (notes 36 and 37) | — | (30 | ) | |||
| 2 412 | 2 067 | |||||
- (1)
- As part of the 2009 acquisition of Petro-Canada, the company assumed the remaining US$500 million obligation for a signature bonus relating to Petro-Canada's ratification of six EPSAs in Libya. At December 31, 2017, the carrying amount of the Libya EPSAs signature bonus was $79 million (December 31, 2016 – $85 million). The current portion is $2 million (December 31, 2016 – $2 million) and is recorded in Accounts Payable and Accrued Liabilities.
24. PENSIONS AND OTHER POST-RETIREMENT BENEFITS
The company's defined benefit pension plans provide pension benefits at retirement based on years of service and final average earnings (if applicable). These obligations are met through funded registered retirement plans and through unregistered supplementary pensions that are voluntarily funded through retirement compensation arrangements, and/or paid directly to recipients. The amount and timing of future funding for these plans is subject to the funding policy as approved by the Board of Directors. The company's contributions to the funded plans are deposited with independent trustees who act as custodians of the plans' assets, as well as the disbursing agents of the benefits to recipients. Plan assets are managed by a pension committee on behalf of beneficiaries. The committee retains independent managers and advisors.
Asset-liability matching studies are performed by a third-party consultant to set the asset mix by quantifying the risk-and-return characteristics of possible asset mix strategies. Investment and contribution policies are integrated within this study, and areas of focus include asset mix as well as interest rate sensitivity.
Funding of the registered retirement plans complies with applicable regulations that require actuarial valuations of the pension funds at least once every three years in Canada, or more, depending on funding status, and every year in the United States. The most recent valuations for the Canadian plans were performed as at December 31, 2016, and for the International plans were performed as at December 31, 2015. The company uses a measurement date of December 31 to value the plan assets and remeasure the accrued benefit obligation for accounting purposes.
The company's other post-retirement benefits programs are unfunded and include certain health care and life insurance benefits provided to retired employees and eligible surviving dependants.
The company reports its share of Syncrude's defined benefit and defined contribution pension plans and Syncrude's other post-retirement benefits plan.
The company also provides a number of defined contribution plans, including a U.S. 401(k) savings plan, that provide for an annual contribution of 5% to 11.5% of each participating employee's pensionable earnings.
2017 ANNUAL REPORT Suncor Energy Inc. 111
Defined Benefit Obligations and Funded Status
| Pension Benefits | Other Post-Retirement Benefits | |||||||||||
| ($ millions) | 2017 | 2016 | 2017 | 2016 | ||||||||
| Change in benefit obligation | ||||||||||||
| Benefit obligation at beginning of year | 6 280 | 4 611 | 587 | 502 | ||||||||
| Obligations acquired through acquisition of COS (note 7) | — | 1 352 | — | 73 | ||||||||
| Current service costs | 193 | 189 | 14 | 13 | ||||||||
| Plan participants' contributions | 14 | 14 | — | — | ||||||||
| Benefits paid | (294 | ) | (272 | ) | (21 | ) | (21 | ) | ||||
| Interest costs | 236 | 238 | 22 | 23 | ||||||||
| Disposal (note 36) | (69 | ) | — | (9 | ) | — | ||||||
| Foreign exchange | (2 | ) | (46 | ) | (1 | ) | (1 | ) | ||||
| Settlements | 7 | 8 | — | — | ||||||||
| Actuarial remeasurement: | ||||||||||||
| Experience loss (gain) arising on plan liabilities | 2 | 7 | (12 | ) | (5 | ) | ||||||
| Actuarial (gain) loss arising from changes in demographic assumptions | (4 | ) | 8 | (9 | ) | (1 | ) | |||||
| Actuarial loss arising from changes in financial assumptions | 354 | 171 | 26 | 4 | ||||||||
| Benefit obligation at end of year | 6 717 | 6 280 | 597 | 587 | ||||||||
Change in plan assets | ||||||||||||
| Fair value of plan assets at beginning of year | 5 356 | 4 040 | — | — | ||||||||
| Assets acquired through acquisition of COS (note 7) | — | 1 060 | — | — | ||||||||
| Employer contributions | 160 | 165 | — | — | ||||||||
| Plan participants' contributions | 14 | 14 | — | — | ||||||||
| Benefits paid | (269 | ) | (249 | ) | — | — | ||||||
| Disposal (note 36) | (71 | ) | — | — | — | |||||||
| Foreign exchange | (3 | ) | (37 | ) | — | — | ||||||
| Settlements | 7 | 8 | — | — | ||||||||
| Administrative costs | (2 | ) | (2 | ) | — | — | ||||||
| Income on plan assets | 200 | 202 | — | — | ||||||||
| Actuarial remeasurement: | ||||||||||||
| Return on plan assets greater than discount rate | 407 | 155 | — | — | ||||||||
| Fair value of plan assets at end of year | 5 799 | 5 356 | — | — | ||||||||
| Net unfunded obligation | 918 | 924 | 597 | 587 | ||||||||
Of the total net unfunded obligations as at December 31, 2017, 67% relates to Canadian pension plans and other post-retirement benefits obligation (excluding Syncrude) (December 31, 2016 – 66%). The weighted average duration of the defined benefit obligation under the Canadian pension plans and other post-retirement plans (excluding Syncrude) is 13.91 years (2016 – 14.06 years).
The net unfunded obligation is recorded in Accounts Payable and Accrued Liabilities and Other Long-Term Liabilities (note 23) in the Consolidated Balance Sheets.
112 2017 ANNUAL REPORT Suncor Energy Inc.
| Pension Benefits | Other Post-Retirement Benefits | |||||||||
| ($ millions) | 2017 | 2016 | 2017 | 2016 | ||||||
| Analysis of amount charged to earnings: | ||||||||||
| Current service costs | 193 | 189 | 14 | 13 | ||||||
| Interest costs | 36 | 36 | 22 | 23 | ||||||
| Defined benefit plans expense | 229 | 225 | 36 | 36 | ||||||
| Defined contribution plans expense | 74 | 76 | — | — | ||||||
| Total benefit plans expense charged to earnings | 303 | 301 | 36 | 36 | ||||||
Components of defined benefit costs recognized in Other Comprehensive Income:
| Pension Benefits | Other Post-Retirement Benefits | |||||||||
| ($ millions) | 2017 | 2016 | 2017 | 2016 | ||||||
| Return on plan assets (excluding amounts included in net interest expense) | (407 | ) | (155 | ) | — | — | ||||
| Experience loss (gain) arising on plan liabilities | 2 | 7 | (12 | ) | (5 | ) | ||||
| Actuarial loss arising from changes in financial assumptions | 354 | 171 | 26 | 4 | ||||||
| Actuarial (gain) loss arising from changes in demographic assumptions | (4 | ) | 8 | (9 | ) | (1 | ) | |||
| Actuarial (gain) loss recognized in other comprehensive income | (55 | ) | 31 | 5 | (2 | ) | ||||
Actuarial Assumptions
The cost of the defined benefit pension plans and other post-retirement benefits received by employees is actuarially determined using the projected unit credit method of valuation that includes employee service to date and present pay levels, as well as the projection of salaries and service to retirement.
The significant weighted average actuarial assumptions were as follows:
| Pension Benefits | Other Post-Retirement Benefits | ||||||||
| (%) | Dec 31 2017 | Dec 31 2016 | Dec 31 2017 | Dec 31 2016 | |||||
| Discount rate | 3.40 | 3.90 | 3.40 | 3.80 | |||||
| Rate of compensation increase | 3.00 | 3.20 | 3.00 | 3.00 | |||||
The discount rate assumption is based on the interest rate on high-quality bonds with maturity terms equivalent to the benefit obligations.
The defined benefit obligation reflects the best estimate of the mortality of plan participants both during and after their employment. The mortality assumption is based on a standard mortality table adjusted for actual experience over the past five years.
In order to measure the expected cost of other post-retirement benefits, it was assumed for 2017 that the health care costs would increase annually by 6.50% per person (2016 – 6.50%). This rate will remain constant until 2019 and then will decrease 0.5% annually to 5% by 2022, and remain at that level thereafter.
2017 ANNUAL REPORT Suncor Energy Inc. 113
Assumed discount rates and health care cost trend rates may have a significant effect on the amounts reported for pensions and other post-retirement benefits obligations for the company's Canadian plans. A change of these assumptions would have the following effects:
| Pension Benefits | ||||||
| ($ millions) | Increase | Decrease | ||||
| 1% change in discount rate | ||||||
| Effect on the aggregate service and interest costs | (19 | ) | 24 | |||
| Effect on the benefits obligations | (859 | ) | 1 107 | |||
| Other Post-Retirement Benefits | |||||||
| ($ millions) | Increase | Decrease | |||||
| 1% change in discount rate | |||||||
| Effect on the benefits obligations | (72 | ) | 89 | ||||
| 1% change in health care cost | |||||||
| Effect on the aggregate service and interest costs | 1 | (1 | ) | ||||
| Effect on the benefits obligations | 30 | (25 | ) | ||||
Plan Assets and Investment Objectives
The company's long-term investment objective is to secure the defined pension benefits while managing the variability and level of its contributions. The portfolio is rebalanced periodically, as required, while ensuring that the maximum fixed income content is 44% at any time. Plan assets are restricted to those permitted by legislation, where applicable. Investments are made through pooled, mutual, segregated or exchange traded funds.
The company's weighted average pension plan asset allocations, based on market values as at December 31, are as follows:
| (%) | 2017 | 2016 | ||||
| Equities, comprised of: | ||||||
| – Canada | 18 | 19 | ||||
| – United States | 19 | 23 | ||||
| – Foreign | 19 | 17 | ||||
| 56 | 59 | |||||
| Fixed income, comprised of: | ||||||
| – Canada | 39 | 39 | ||||
| Real estate, comprised of: | ||||||
| – Canada | 5 | 2 | ||||
| Total | 100 | 100 | ||||
Equity securities do not include any direct investments in Suncor shares. The fair value of equity and bond securities are based on the trading price of the underlying fund. The fair value of real estate investments is based on independent third-party appraisals.
During the year, the company made cash contributions of $160 million to its defined benefit pension plans, of which $3 million was contributed to the solvency reserve account in Alberta. The company expects to make cash contributions to its defined benefit pension plans in 2018 of $174 million.
114 2017 ANNUAL REPORT Suncor Energy Inc.
25. PROVISIONS
| ($ millions) | Decommissioning and Restoration(1) | Royalties | Other(2) | Total | ||||||
| At December 31, 2015 | 5 505 | 323 | 280 | 6 108 | ||||||
| Liabilities incurred | 279 | 93 | 53 | 425 | ||||||
| Change in discount rate | 532 | — | — | 532 | ||||||
| Changes in estimates | (824 | ) | (79 | ) | 11 | (892 | ) | |||
| Liabilities settled | (269 | ) | (30 | ) | (68 | ) | (367 | ) | ||
| Accretion | 269 | — | — | 269 | ||||||
| Asset acquisitions | 1 356 | — | — | 1 356 | ||||||
| Foreign exchange | (98 | ) | — | (1 | ) | (99 | ) | |||
| Reclassified to assets held for sale (notes 36 and 37) | (4 | ) | — | (5 | ) | (9 | ) | |||
| At December 31, 2016 | 6 746 | 307 | 270 | 7 323 | ||||||
| Less: current portion | (403 | ) | (307 | ) | (71 | ) | (781 | ) | ||
| 6 343 | — | 199 | 6 542 | |||||||
| At December 31, 2016 | 6 746 | 307 | 270 | 7 323 | ||||||
| Liabilities incurred | 494 | 29 | 34 | 557 | ||||||
| Change in discount rate | 255 | — | — | 255 | ||||||
| Changes in estimates | 92 | (89 | ) | (6 | ) | (3 | ) | |||
| Liabilities settled | (353 | ) | (7 | ) | (42 | ) | (402 | ) | ||
| Accretion | 247 | — | — | 247 | ||||||
| Asset acquisitions | 5 | — | — | 5 | ||||||
| Foreign exchange | (21 | ) | — | (2 | ) | (23 | ) | |||
| At December 31, 2017 | 7 465 | 240 | 254 | 7 959 | ||||||
| Less: current portion | (434 | ) | (240 | ) | (48 | ) | (722 | ) | ||
| 7 031 | — | 206 | 7 237 | |||||||
- (1)
- Represents decommissioning and restoration provisions associated with the retirement of Property, Plant and Equipment and Exploration and Evaluation assets. The total undiscounted amount of estimated future cash flows required to settle the obligations at December 31, 2017 was approximately $12.2 billion (December 31, 2016 – $11.7 billion). A weighted average credit-adjusted risk-free interest rate of 3.70% was used to discount the provision recognized at December 31, 2017 (December 31, 2016 – 3.90%). The credit-adjusted risk-free interest rate used reflects the expected time frame of the provisions. Payments to settle the decommissioning and restoration provisions occur on an ongoing basis and will continue over the lives of the operating assets, which can exceed 50 years.
- (2)
- Includes legal, environmental and lease inducement provisions.
Sensitivities
Changes to the discount rate would have the following impact on Decommissioning and Restoration liabilities:
| As at December 31 | 2017 | 2016 | ||||
| 1% Increase | (1 218 | ) | (1 036 | ) | ||
| 1% Decrease | 1 758 | 1 506 | ||||
2017 ANNUAL REPORT Suncor Energy Inc. 115
26. SHARE CAPITAL
Authorized
Common Shares
The company is authorized to issue an unlimited number of common shares without nominal or par value.
Preferred Shares
The company is authorized to issue an unlimited number of senior and junior preferred shares in series, without nominal or par value.
Share Issuance
On June 22, 2016, the company issued 82.2 million common shares for $35.00 per common share. Gross proceeds were approximately $2.878 billion ($2.782 billion net of fees).
Normal Course Issuer Bid
On April 26, 2017, the company announced its intention to commence a new Normal Course Issuer Bid (the 2017 NCIB) to repurchase shares through the facilities of the Toronto Stock Exchange, New York Stock Exchange and/or alternative trading platforms. Pursuant to the 2017 NCIB, the company may purchase for cancellation up to approximately $2.0 billion worth of its common shares between May 2, 2017 and May 1, 2018.
The following table summarizes the share repurchase activities during the period:
| ($ millions, except as noted) | 2017 | 2016 | ||||
| Share repurchase activities (thousands of common shares) | ||||||
| Shares repurchased | 33 154 | — | ||||
| Amounts charged to | ||||||
| Share capital | 536 | — | ||||
| Retained earnings | 877 | — | ||||
| Share repurchase cost | 1 413 | — | ||||
| Average repurchase cost per share | 42.61 | — | ||||
Under an automatic repurchase plan agreement with an independent broker, the company has recorded the following liability for share repurchases that may take place during its internal blackout period:
| ($ millions) | December 31 2017 | December 31 2016 | ||||
| Amounts charged to | ||||||
| Share capital | 97 | — | ||||
| Retained earnings | 180 | — | ||||
| Liability for share purchase commitment | 277 | — | ||||
27. SHARE-BASED COMPENSATION
Share-Based Compensation Expense
Reflected in the Consolidated Statements of Comprehensive Income within Operating, Selling and General expense are the following share-based compensation amounts:
| ($ millions) | 2017 | 2016 | |||
| Equity-settled plans | 48 | 48 | |||
| Cash-settled plans | 334 | 395 | |||
| Total share-based compensation expense | 382 | 443 | |||
116 2017 ANNUAL REPORT Suncor Energy Inc.
Liability Recognized for Share-Based Compensation
Reflected in the Consolidated Balance Sheets within accounts payable and accrued liabilities and other long-term liabilities are the following fair value amounts for the company's cash-settled plans:
| ($ millions) | 2017 | 2016 | |||
| Current Liability | 344 | 359 | |||
| Long-Term Liability (note 23) | 361 | 364 | |||
| Total Liability | 705 | 723 | |||
The intrinsic value of the vested awards at December 31, 2017 was $399 million (December 31, 2016 – $406 million).
Stock Option Plans
Suncor grants stock option awards as a form of retention and incentive compensation.
(a) Active Stock Option Plan
Stock options granted by the company on or after August 1, 2010 provide the holder with the right to purchase common shares at the grant date market price, subject to fulfilling vesting terms. This plan replaced the pre-merger stock option plan of legacy Suncor and legacy Petro-Canada. Options granted have a seven-year life, vest annually over a three-year period and are accounted for as equity-settled awards.
The weighted average fair value of options granted during the period and the weighted average assumptions used in their determination are as noted below:
| 2017 | 2016 | ||||
| Annual dividend per share | $1.28 | $1.16 | |||
| Risk-free interest rate | 1.09% | 0.55% | |||
| Expected life | 5 years | 5 years | |||
| Expected volatility | 25% | 28% | |||
| Weighted average fair value per option | $6.42 | $4.60 | |||
The expected life is based on historical stock option exercise data and current expectations. The expected volatility considers the historical volatility in the price of Suncor's common shares over a period similar to the life of the options, and is indicative of future trends.
(b) Discontinued Stock Option Plans
Executive and Key Contributor Stock Options
Options granted under these plans generally have a seven-to-ten-year life and vest over a three-year period. These plans were in place prior to August 1, 2009, at the time of the merger between Petro-Canada and Suncor, and are accounted for as equity-settled awards.
Suncor Energy Inc. Stock Options with TSARs
Options granted between August 1, 2009 and July 31, 2010, have a seven-year life and vest annually over a three-year period. Each option included a tandem stock appreciation right (TSAR), allowing the option holder the right to receive a cash payment equal to the excess of the market price of Suncor's common shares at the time of exercise over the exercise price of the option. These awards are accounted for as cash-settled. All options granted under this plan expired at December 31, 2017.
Legacy Petro-Canada Stock Options with CPAs
Options granted to executives and key employees prior to August 1, 2009, can be settled in common shares or exchanged for a cash payment alternative (CPA). Options granted have a seven-year life, vest over periods of up to four years and are accounted for as cash-settled awards. All options granted under this plan expired at December 31, 2016.
2017 ANNUAL REPORT Suncor Energy Inc. 117
The following table presents a summary of the activity related to Suncor's stock option plans:
| 2017 | 2016 | ||||||||
| Number (thousands) | Weighted Average Exercise Price ($) | Number (thousands) | Weighted Average Exercise Price ($) | ||||||
| Outstanding, beginning of year | 31 442 | 35.98 | 29 090 | 36.97 | |||||
| Granted | 7 401 | 42.04 | 8 145 | 30.26 | |||||
| Exercised for cash payment | (6 | ) | 32.00 | (1 441 | ) | 30.39 | |||
| Exercised as options for common shares | (6 223 | ) | 36.65 | (3 983 | ) | 33.36 | |||
| Forfeited/expired | (1 504 | ) | 42.21 | (369 | ) | 38.12 | |||
| Outstanding, end of year | 31 110 | 36.96 | 31 442 | 35.98 | |||||
| Exercisable, end of year | 17 363 | 36.53 | 17 821 | 37.74 | |||||
Options are exercised regularly throughout the year. Therefore, the weighted average share price during the year of $41.09 (2016 – $36.23) is representative of the weighted average share price at the date of exercise.
For the options outstanding at December 31, 2017, the exercise price ranges and weighted average remaining contractual lives are shown below:
| Outstanding | Exercisable | ||||||||||
| Exercise Prices ($) | Number (thousands) | Weighted Average Remaining Contractual Life (years) | Weighted Average exercise price ($) | Number (thousands) | Weighted Average exercise price ($) | ||||||
| 24.50-34.99 | 11 466 | 4 | 31.32 | 6 714 | 32.07 | ||||||
| 35.00-39.99 | 9 987 | 4 | 37.72 | 8 006 | 37.44 | ||||||
| 40.00-44.99 | 8 347 | 5 | 41.99 | 1 333 | 41.70 | ||||||
| 45.00-49.99 | 1 197 | 0 | 47.52 | 1 197 | 47.52 | ||||||
| 50.00-69.97 | 113 | 0 | 59.54 | 113 | 59.54 | ||||||
| Total | 31 110 | 4 | 36.96 | 17 363 | 36.53 | ||||||
Common shares authorized for issuance by the Board of Directors that remain available for the granting of future options:
| (thousands) | 2017 | 2016 | |||
| 28 972 | 10 937 | ||||
Share Unit Plans
Suncor grants share units as a form of retention and incentive compensation. Share unit plans are accounted for as cash-settled awards.
(a) Performance Share Units (PSUs)
A PSU is a time-vested award entitling employees to receive varying degrees of cash (0% – 200% of the company's share price at time of vesting) contingent upon Suncor's total shareholder return (stock price appreciation and dividend income) relative to a peer group of companies. PSUs vest approximately three years after the grant date.
(b) Restricted Share Units (RSUs)
A RSU is a time-vested award entitling employees to receive cash calculated based on an average of the company's share price leading up to vesting. RSUs vest approximately three years after the grant date.
118 2017 ANNUAL REPORT Suncor Energy Inc.
(c) Deferred Share Units (DSUs)
A DSU is redeemable for cash or a common share for a period of time after a unitholder ceases employment or Board membership. The DSU Plan is limited to executives and members of the Board of Directors. Members of the Board of Directors receive an annual grant of DSUs as part of their compensation and may elect to receive their fees in cash only or in increments of 50% or 100% allocated to DSUs. Executives may elect to receive their annual incentive bonus in cash only or in increments of 25%, 50%, 75% or 100% allocated to DSUs.
The following table presents a summary of the activity related to Suncor's share unit plans:
| (thousands) | PSU | RSU | DSU | ||||||
| Outstanding, December 31, 2015 | 2 465 | 19 104 | 1 072 | ||||||
| Granted | 1 683 | 6 194 | 186 | ||||||
| Redeemed for cash | (1 714 | ) | (6 649 | ) | (40 | ) | |||
| Forfeited/expired | (21 | ) | (491 | ) | — | ||||
| Outstanding, December 31, 2016 | 2 413 | 18 158 | 1 218 | ||||||
| Granted | 1 570 | 5 009 | 202 | ||||||
| Redeemed for cash | (1 663 | ) | (6 354 | ) | (118 | ) | |||
| Forfeited/expired | (53 | ) | (741 | ) | — | ||||
| Outstanding, December 31, 2017 | 2 267 | 16 072 | 1 302 | ||||||
Stock Appreciation Rights (SARs)
A SAR entitles the holder to receive a cash payment equal to the difference between the stated exercise price and the market price of the company's common shares on the date the SAR is exercised, and is accounted for as a cash-settled award.
(a) Suncor Energy Inc. SARs
These SARs have a seven-year life and vest annually over a three-year period.
(b) Legacy Petro-Canada SARs
This plan was discontinued on August 1, 2009. These SARs have a seven-year life and vest annually over a four-year period. All SARs granted under this plan expired at December 31, 2016.
The following table presents a summary of the activity related to Suncor's SAR plans:
| 2017 | 2016 | ||||||||
| Number (thousands) | Weighted Average Exercise Price ($) | Number (thousands) | Weighted Average Exercise Price ($) | ||||||
| Outstanding, beginning of year | 485 | 34.90 | 957 | 27.98 | |||||
| Granted | 107 | 42.05 | 142 | 30.23 | |||||
| Exercised | (176 | ) | 35.59 | (610 | ) | 23.07 | |||
| Forfeited/expired | (29 | ) | 37.32 | (4 | ) | 19.44 | |||
| Outstanding, end of year | 387 | 36.38 | 485 | 34.90 | |||||
| Exercisable, end of year | 162 | 35.39 | 240 | 36.29 | |||||
28. FINANCIAL INSTRUMENTS AND RISK MANAGEMENT
The company's financial instruments consist of cash and cash equivalents, accounts receivable, derivative contracts, substantially all accounts payable and accrued liabilities, debt, and certain portions of other assets and other long-term liabilities.
2017 ANNUAL REPORT Suncor Energy Inc. 119
Non-Derivative Financial Instruments
The fair values of cash and cash equivalents, accounts receivable, short-term debt, and accounts payable and accrued liabilities approximate their carrying values due to the short-term maturities of those instruments.
The company's long-term debt and long-term financial liabilities are recorded at amortized cost using the effective interest method. At December 31, 2017, the carrying value of fixed-term debt accounted for under amortized cost was $12.1 billion (December 31, 2016 – $15.1 billion) and the fair value at December 31, 2017 was $14.7 billion (December 31, 2016 – $17.5 billion). The estimated fair value of long-term debt is based on pricing sourced from market data, which is considered a Level 2 fair value input.
Suncor entered into a partnership with Fort McKay First Nation (FMFN) and Mikisew Cree First Nation (MCFN) where FMFN and MCFN acquired a combined 49% partnership in the East Tank Farm Development. The partnership liability is recorded at amortized cost using the effective interest method. At December 31, 2017, the carrying value of the Partnership liability accounted for under amortized cost was $483 million (note 38).
Derivative Financial Instruments
(a) Non-Designated Derivative Financial Instruments
- •
- Energy Trading Derivatives – The company's Energy Trading group uses physical and financial energy derivative contracts, including swaps, forwards and options to earn trading revenues.
- •
- Risk Management Derivatives – The company periodically enters into derivative contracts in order to manage exposure to interest rates, commodity price and foreign exchange movements and which are a component of the company's overall risk management program.
The changes in the fair value of non-designated Energy Trading and Risk Management derivatives are as follows:
| ($ millions) | Energy Trading | Risk Management | Total | ||||||
| Fair value outstanding at December 31, 2015 | (18 | ) | 20 | 2 | |||||
| Cash Settlements – paid (received) during the year | 29 | (13 | ) | 16 | |||||
| Unrealized losses recognized in earnings during the year (note 9) | (47 | ) | (25 | ) | (72 | ) | |||
| Fair value outstanding at December 31, 2016 | (36 | ) | (18 | ) | (54 | ) | |||
| Cash Settlements – (received) paid during the year | (12 | ) | 17 | 5 | |||||
| Unrealized losses recognized in earnings during the year (note 9) | (37 | ) | (19 | ) | (56 | ) | |||
| Fair value outstanding at December 31, 2017 | (85 | ) | (20 | ) | (105 | ) | |||
(b) Fair Value Hierarchy
To estimate the fair value of derivatives, the company uses quoted market prices when available, or third-party models and valuation methodologies that utilize observable market data. In addition to market information, the company incorporates transaction specific details that market participants would utilize in a fair value measurement, including the impact of non-performance risk. However, these fair value estimates may not necessarily be indicative of the amounts that could be realized or settled in a current market transaction. The company characterizes inputs used in determining fair value using a hierarchy that prioritizes inputs depending on the degree to which they are observable. The three levels of the fair value hierarchy are as follows:
- •
- Level 1 consists of instruments with a fair value determined by an unadjusted quoted price in an active market for identical assets or liabilities. An active market is characterized by readily and regularly available quoted prices where the prices are representative of actual and regularly occurring market transactions to assure liquidity.
- •
- Level 2 consists of instruments with a fair value that is determined by quoted prices in an inactive market, prices with observable inputs, or prices with insignificant non-observable inputs. The fair value of these positions is determined using observable inputs from exchanges, pricing services, third-party independent broker quotes, and published transportation tolls. The observable inputs may be adjusted using certain methods, which include extrapolation over the quoted price term and quotes for comparable assets and liabilities.
- •
- Level 3 consists of instruments with a fair value that is determined by prices with significant unobservable inputs. As at December 31, 2017, the company does not have any derivative instruments measured at fair value Level 3.
120 2017 ANNUAL REPORT Suncor Energy Inc.
In forming estimates, the company utilizes the most observable inputs available for valuation purposes. If a fair value measurement reflects inputs of different levels within the hierarchy, the measurement is categorized based upon the lowest level of input that is significant to the fair value measurement.
The following table presents the company's derivative financial instrument assets and liabilities and assets available for sale measured at fair value for each hierarchy level as at December 31, 2017 and 2016.
| ($ millions) | Level 1 | Level 2 | Level 3 | Total Fair Value | |||||||
| Accounts receivable | 46 | 109 | — | 155 | |||||||
| Accounts payable | (100 | ) | (109 | ) | — | (209 | ) | ||||
| Balance at December 31, 2016 | (54 | ) | — | — | (54 | ) | |||||
| Accounts receivable | 21 | 53 | — | 74 | |||||||
| Accounts payable | (74 | ) | (105 | ) | — | (179 | ) | ||||
| Balance at December 31, 2017 | (53 | ) | (52 | ) | — | (105 | ) | ||||
During the year ended December 31, 2017, there were no transfers between Level 1 and Level 2 fair value measurements.
Offsetting Financial Assets and Liabilities
The company enters into arrangements that allow for offsetting of derivative financial instruments and accounts receivable (payable), which are presented on a net basis on the balance sheet, as shown in the table below as at December 31, 2017 and 2016.
Financial Assets
| ($ millions) | Gross Assets | Gross Liabilities Offset | Net Amounts Presented | ||||
| Derivatives | 1 765 | (1 610 | ) | 155 | |||
| Accounts receivable | 2 058 | (946 | ) | 1 112 | |||
| Balance at December 31, 2016 | 3 823 | (2 556 | ) | 1 267 | |||
| Derivatives | 1 126 | (1 052 | ) | 74 | |||
| Accounts receivable | 2 405 | (1 252 | ) | 1 153 | |||
| Balance at December 31, 2017 | 3 531 | (2 304 | ) | 1 227 | |||
Financial Liabilities
| ($ millions) | Gross Liabilities | Gross Assets Offset | Net Amounts Presented | |||||
| Derivatives | (1 819 | ) | 1 610 | (209 | ) | |||
| Accounts payable | (1 975 | ) | 946 | (1 029 | ) | |||
| Balance at December 31, 2016 | (3 794 | ) | 2 556 | (1 238 | ) | |||
| Derivatives | (1 231 | ) | 1 052 | (179 | ) | |||
| Accounts payable | (2 270 | ) | 1 252 | (1 018 | ) | |||
| Balance at December 31, 2017 | (3 501 | ) | 2 304 | (1 197 | ) | |||
Risk Management
The company is exposed to a number of different risks arising from financial instruments. These risk factors include market risks, comprising commodity price risk, foreign currency risk and interest rate risk, as well as liquidity risk and credit risk.
The company maintains a formal governance process to manage its financial risks. The company's Commodity Risk Management Committee (CRMC) is charged with the oversight of the company's trading and credit risk management activities. Trading activities are defined as activities intended to manage risk associated with open price exposure of specific
2017 ANNUAL REPORT Suncor Energy Inc. 121
volumes in transit or storage, enhance the company's operations, and enhance profitability through informed market calls, market diversification, economies of scale, improved transportation access, and leverage of assets, both physical and contractual. The CRMC, acting under the authority of the company's Board of Directors, meets regularly to monitor limits on risk exposures, review policy compliance and validate risk-related methodologies and procedures.
The nature of the risks faced by the company and its policies for managing such risks remains unchanged from December 31, 2016.
1) Market Risk
Market risk is the risk or uncertainty arising from market price movements and their impact on the future performance of the business. The market price movements that could adversely affect the value of the company's financial assets, liabilities and expected future cash flows include commodity price risk, foreign currency exchange risk and interest rate risk.
(a) Commodity Price Risk
Suncor's financial performance is closely linked to crude oil prices (including pricing differentials for various product types) and, to a lesser extent, natural gas and refined product prices. The company may reduce its exposure to commodity price risk through a number of strategies. These strategies include entering into option contracts to limit exposure to changes in crude oil prices during transportation.
An increase of US$10.00 per barrel of crude oil as at December 31, 2017 would decrease pre-tax earnings for the company's outstanding derivative financial instruments by approximately $196 million (2016 – $112 million).
(b) Foreign Currency Exchange Risk
The company is exposed to foreign currency exchange risk on revenues, capital expenditures, or financial instruments that are denominated in a currency other than the company's functional currency (Canadian dollars). As crude oil is priced in U.S. dollars, fluctuations in US$/Cdn$ exchange rates may have a significant impact on revenues. This exposure is partially offset through the issuance of U.S. dollar denominated debt. A 1% strengthening in the Cdn$ relative to the US$ as at December 31, 2017 would increase earnings related to the company's debt by approximately $142 million (2016 – $129 million).
(c) Interest Rate Risk
The company is exposed to interest rate risk as changes in interest rates may affect future cash flows and the fair values of its financial instruments. The primary exposure is related to its revolving-term debt of commercial paper and future debt issuances.
To manage the company's exposure to interest rate volatility, the company may periodically enter into interest rate swap contracts to fix the interest rate of future debt issuances. As at December 31, 2017, the company had no outstanding forward starting swaps, as all the positions were settled during the year. The weighted average interest rate on total debt for the year ended December 31, 2017 was 5.7% (2016 – 6.2%).
The company's net earnings are sensitive to changes in interest rates on the floating rate portion of the company's debt, which are offset by cash balances. To the extent interest expense is not capitalized, if interest rates applicable to floating rate instruments increased by 1%, it is estimated that the company's pre-tax earnings would increase by approximately $6 million (2016 – $17 million). This assumes that the amount and mix of fixed and floating rate debt remains unchanged from December 31, 2017 and the company's cash balance, which it regularly invests in short-term financial instruments, exceeds the balance of floating rate debt. The proportion of floating interest rate exposure at December 31, 2017 was 14.9% of total debt outstanding (2016 – 7.8%).
2) Liquidity Risk
Liquidity risk is the risk that Suncor will not be able to meet its financial obligations when due. The company mitigates this risk by forecasting spending requirements as well as cash flow from operating activities, and maintaining sufficient cash, credit facilities, and debt shelf prospectuses to meet these requirements. Suncor's cash and cash equivalents and total credit facilities at December 31, 2017 were $2.7 billion and $8.2 billion, respectively. Of Suncor's $8.2 billion in total credit facilities, $4.7 billion were available at December 31, 2017. In addition, Suncor has $2.0 billion of unused capacity under a Canadian debt shelf prospectus and an unused capacity of US$2.25 billion under a U.S. debt shelf prospectus.
Surplus cash is invested into a range of short-dated money market securities. Investments are only permitted in high credit quality government or corporate securities. Diversification of these investments is managed through counterparty credit limits.
122 2017 ANNUAL REPORT Suncor Energy Inc.
The following table shows the timing of cash outflows related to trade and other payables and debt.
| December 31, 2016 | |||||||
| ($ millions) | Trade and Other Payables(1) | Gross Derivative Liabilities(2) | Debt(3) | ||||
| Within one year | 5 379 | 1 819 | 2 325 | ||||
| 1 to 3 years | 28 | — | 5 238 | ||||
| 3 to 5 years | 14 | — | 3 031 | ||||
| Over 5 years | 43 | — | 19 934 | ||||
| 5 464 | 1 819 | 30 528 | |||||
| December 31, 2017 | |||||||
| ($ millions) | Trade and Other Payables(1) | Gross Derivative Liabilities(2) | Debt(3) | ||||
| Within one year | 6 024 | 1 231 | 3 027 | ||||
| 1 to 3 years | 38 | — | 1 949 | ||||
| 3 to 5 years | 38 | — | 3 184 | ||||
| Over 5 years | — | — | 20 160 | ||||
| 6 100 | 1 231 | 28 320 | |||||
- (1)
- Trade and other payables exclude net derivative liabilities of $179 million (2016 – $209 million)
- (2)
- Gross derivative liabilities of $1 231 million (2016 – $1 819 million) are offset by gross derivative assets of $1 052 million (2016 – $1 610 million), resulting in a net amount of $179 million (2016 – $209 million).
- (3)
- Debt includes short-term debt, long-term debt, finance leases and interest payments on fixed-term debt and commercial paper.
3) Credit Risk
Credit risk is the risk that a customer or counterparty will fail to perform an obligation or fail to pay amounts due causing a financial loss. The company's credit policy is designed to ensure there is a standard credit practice throughout the company to measure and monitor credit risk. The policy outlines delegation of authority, the due diligence process required to approve a new customer or counterparty and the maximum amount of credit exposure per single entity. Before transactions begin with a new customer or counterparty, its creditworthiness is assessed, a credit rating and a maximum credit limit are assigned. The assessment process is outlined in the credit policy and considers both quantitative and qualitative factors. The company constantly monitors the exposure to any single customer or counterparty along with the financial position of the customer or counterparty. If it is deemed that a customer or counterparty has become materially weaker, the company will work to reduce the credit exposure and lower the assigned credit limit. Regular reports are generated to monitor credit risk and the Credit Committee meets quarterly to ensure compliance with the credit policy and review the exposures.
A substantial portion of the company's accounts receivable are with customers in the oil and gas industry and are subject to normal industry credit risk. At December 31, 2017, substantially all of the company's trade receivables were current.
The company may be exposed to certain losses in the event that counterparties to derivative financial instruments are unable to meet the terms of the contracts. The company's exposure is limited to those counterparties holding derivative contracts owing to the company at the reporting date. At December 31, 2017, the company's exposure was $1 126 million (December 31, 2016 – $1 765 million).
29. CAPITAL STRUCTURE FINANCIAL POLICIES
The company's primary capital management strategy is to maintain a conservative balance sheet, which supports a solid investment grade credit rating profile. This objective affords the company the financial flexibility and access to the capital it requires to execute on its growth objectives.
The company's capital is primarily monitored by reviewing the ratios of net debt to funds from operations(1) and total debt to total debt plus shareholders' equity.
2017 ANNUAL REPORT Suncor Energy Inc. 123
Net debt to funds from operations is calculated as short-term debt plus total long-term debt less cash and cash equivalents divided by funds from operations for the year then ended.
Total debt to total debt plus shareholders' equity is calculated as short-term debt plus total long-term debt divided by short-term debt plus total long-term debt plus shareholders' equity. This financial covenant under the company's various banking and debt agreements shall not be greater than 65%.
The company's financial covenant is reviewed regularly and controls are in place to maintain compliance with the covenant. The company complied with financial covenants for the years ended December 31, 2017 and 2016. The company's financial measures, as set out in the following schedule, were unchanged from 2016. The company believes that achieving its capital target helps to provide the company access to capital at a reasonable cost by maintaining solid investment grade credit ratings. The company operates in a fluctuating business environment and ratios may periodically fall outside of management's targets. The company addresses these fluctuations by capital expenditure reductions and sales of non-core assets to ensure net debt achieves management's targets.
| ($ millions) | Capital Measure Target | December 31, 2017 | December 31, 2016 | ||||||
| Components of ratios | |||||||||
| Short-term debt | 2 136 | 1 273 | |||||||
| Current portion of long-term debt | 71 | 54 | |||||||
| Long-term debt | 13 372 | 16 103 | |||||||
| Total debt | 15 579 | 17 430 | |||||||
| Less: Cash and cash equivalents | 2 672 | 3 016 | |||||||
| Net debt | 12 907 | 14 414 | |||||||
| Shareholders' equity | 45 383 | 44 630 | |||||||
| Total capitalization (total debt plus shareholders' equity) | 60 962 | 62 060 | |||||||
| Funds from operations(1) | 9 139 | 5 988 | |||||||
| Net debt to funds from operations | <3.0 times | 1.4 | 2.4 | ||||||
| Total debt to total debt plus shareholders' equity | 26% | 28% | |||||||
- (1)
- Funds from operations is calculated as cash flow from operating activities before changes in non-cash working capital, and is a non-GAAP financial measure.
124 2017 ANNUAL REPORT Suncor Energy Inc.
30. JOINT ARRANGEMENTS
Joint Operations
The company's material joint operations as at December 31 are set out below:
| Material Joint Operations | Principal Activity | Country of Incorporation and Principal Place of Business | Ownership % 2017 | Ownership % 2016 | ||||||
| Oil Sands | ||||||||||
| Operated by Suncor: | ||||||||||
| Fort Hills Energy Limited Partnership | Oil sands development | Canada | 53.06 | 50.80 | ||||||
| Non-operated: | ||||||||||
| Syncrude | Oil sands development | Canada | 53.74 | 53.74 | ||||||
| Exploration and Production | ||||||||||
| Operated by Suncor: | ||||||||||
| Terra Nova | Oil and gas production | Canada | 37.68 | 37.68 | ||||||
| Non-operated: | ||||||||||
| White Rose and the White Rose Extensions | Oil and gas production | Canada | 26.13-27.50 | 26.13-27.50 | ||||||
| Hibernia and the Hibernia South Extension Unit | Oil and gas production | Canada | 19.19-20.00 | 19.13-20.00 | ||||||
| Hebron | Oil and gas production | Canada | 21.03 | 21.03 | ||||||
| Harouge Oil Operations | Oil and gas production | Libya | 49.00 | 49.00 | ||||||
| Buzzard | Oil and gas production | United Kingdom | 29.89 | 29.89 | ||||||
| Golden Eagle Area Development | Oil and gas production | United Kingdom | 26.69 | 26.69 | ||||||
| North Sea Rosebank Project | Oil and gas production | United Kingdom | 30.00 | 30.00 | ||||||
| Oda | Oil and gas production | Norway | 30.00 | 30.00 | ||||||
Joint Ventures and Associates
The company does not have any joint ventures or associates that are considered individually material. Summarized aggregate financial information of the joint ventures and associates, which are all included in the company's Refining and Marketing operations, are shown below:
| Joint ventures | Associates | |||||||||
| ($ millions) | 2017 | 2016 | 2017 | 2016 | ||||||
| Net earnings (loss) | 1 | 1 | (3 | ) | (3 | ) | ||||
| Other comprehensive income | — | — | — | — | ||||||
| Total comprehensive income (loss) | 1 | 1 | (3 | ) | (3 | ) | ||||
| Carrying amount as at December 31 | 51 | 45 | 89 | 93 | ||||||
2017 ANNUAL REPORT Suncor Energy Inc. 125
31. SUBSIDIARIES
Material subsidiaries, each of which is wholly owned, either directly or indirectly, by the company as at December 31, 2017, are shown below:
| Material Subsidiaries | Principal Activity | ||
| Canadian Operations | |||
Suncor Energy Oil Sands Limited Partnership | This partnership holds most of the company's Oil Sands operations assets. | ||
| Suncor Energy Ventures Corporation | A subsidiary which indirectly owns a 36.74% ownership in the Syncrude joint operation previously owned by COS. | ||
| Suncor Energy Ventures Partnership | A subsidiary which owns a 17% ownership in the Syncrude joint operation. | ||
| Suncor Energy Products Partnership | This partnership holds substantially all of the company's Canadian refining and marketing assets. | ||
| Suncor Energy Marketing Inc. | Through this subsidiary, production from the upstream Canadian businesses is marketed. This subsidiary also administers Suncor's energy trading activities and power business, markets certain third-party products, procures crude oil feedstock and natural gas for its downstream business, and procures and markets natural gas liquids (NGLs) and liquefied petroleum gas (LPG) for its downstream business. | ||
| U.S. Operations | |||
Suncor Energy (U.S.A.) Marketing Inc. | A subsidiary that procures and markets third-party crude oil, in addition to procuring crude oil feedstock for the company's refining operations. | ||
| Suncor Energy (U.S.A.) Inc. | A subsidiary through which the company's U.S. refining and marketing operations are conducted. | ||
| International Operations | |||
Suncor Energy UK Limited | A subsidiary through which the majority of the company's North Sea operations are conducted. | ||
The table does not include wholly owned subsidiaries that are immediate holding companies of the operating subsidiaries. For certain foreign operations of the company, there are restrictions on the sale or transfer of production licences, which would require approval of the applicable foreign government.
32. RELATED PARTY DISCLOSURES
Related Party Transactions
The company enters into transactions with related parties in the normal course of business, which includes purchases of feedstock, distribution of refined products, and sale of refined products and byproducts. These transactions are with joint ventures and associated entities in the company's Refining and Marketing operations, including pipeline, refined product and
126 2017 ANNUAL REPORT Suncor Energy Inc.
petrochemical companies. A summary of the significant related party transactions as at and for the year ended December 31, 2017 and 2016 are as follows:
| ($ millions) | 2017 | 2016 | |||
| Sales(1) | 590 | 667 | |||
| Purchases | 223 | 152 | |||
| Accounts receivable | 44 | 61 | |||
| Accounts payable and accrued liabilities | 28 | 42 | |||
- (1)
- Includes sales to Parachem Chemicals Inc. of $301 million (2016 – $219 million) and UPI Inc. of nil (2016 – $226 million). The company's remaining interest in UPI Inc. was sold during the fourth quarter of 2016 and is no longer a related party. Sales to UPI Inc. up to the closing date of October 31, 2016 have been included.
Compensation of Key Management Personnel
Compensation of the company's Board of Directors and members of the Executive Leadership Team for the years ended December 31 is as follows:
| ($ millions) | 2017 | 2016 | |||
| Salaries and other short-term benefits | 12 | 13 | |||
| Pension and other post-retirement benefits | 5 | 5 | |||
| Share-based compensation | 49 | 74 | |||
| 66 | 92 | ||||
33. COMMITMENTS, CONTINGENCIES AND GUARANTEES
(a) Commitments
Future payments under the company's commitments, including service arrangements for pipeline transportation agreements and for various premises, service stations and other property and equipment, are as follows:
| Payment due by period | ||||||||||||||||
| ($ millions) | 2018 | 2019 | 2020 | 2021 | 2022 | 2023 and beyond | Total | |||||||||
| Commitments | ||||||||||||||||
| Product transportation and storage | 1 108 | 976 | 983 | 993 | 905 | 9 603 | 14 568 | |||||||||
| Energy services | 199 | 160 | 204 | 141 | 143 | 353 | 1 200 | |||||||||
| Exploration work commitments | — | 115 | 138 | 157 | 87 | — | 497 | |||||||||
| Other | 356 | 191 | 190 | 143 | 83 | 406 | 1 369 | |||||||||
| Operating leases | 439 | 330 | 291 | 252 | 208 | 687 | 2 207 | |||||||||
| 2 102 | 1 772 | 1 806 | 1 686 | 1 426 | 11 049 | 19 841 | ||||||||||
Significant operating leases expire at various dates through 2028. For the year ended December 31, 2017, operating lease expense was $400 million (2016 – $699 million).
In addition to the commitments in the above table, the company has other obligations for goods and services and raw materials entered into in the normal course of business, which may terminate on short notice. Such obligations include commodity purchase obligations which are transacted at market prices. The company has also entered into a pipeline commitment of $8.2 billion with a contract term of 20 years, which is awaiting regulatory approval. In the event regulatory approval is not obtained, the company has not committed to reimbursing certain costs to the service provider.
2017 ANNUAL REPORT Suncor Energy Inc. 127
(b) Contingencies
Legal and Environmental Contingent Liabilities
The company is defendant and plaintiff in a number of legal actions that arise in the normal course of business. The company believes that any liabilities that might arise pertaining to such matters would not have a material effect on its consolidated financial position.
The company may also have environmental contingent liabilities, beyond decommissioning and restoration liabilities (recognized in note 25), which are reviewed individually and are reflected in the company's consolidated financial statements if material and more likely than not to be incurred. These contingent environmental liabilities primarily relate to the mitigation of contamination at sites where the company has had operations. For any unrecognized environmental contingencies, the company believes that any liabilities that might arise pertaining to such matters would not have a material effect on its consolidated financial position.
Costs attributable to these commitments and contingencies are expected to be incurred over an extended period of time and to be funded from the company's cash flow from operating activities. Although the ultimate impact of these matters on net earnings cannot be determined at this time, the impact is not expected to be material.
Operational Risk
The company also has exposure to some operational risks, which is reduced by maintaining an insurance program.
The company carries property damage and business interruption insurance with varying coverage limits and deductible amounts based on the asset. As of December 31, 2017, Suncor's insurance program included coverage of up to US$1.3 billion for oil sands risks, up to US$0.95 billion for offshore risks and up to US$1.3 billion for refining risks. These limits are all net of deductible amounts or waiting periods and may be subject to certain price and daily volume limits. The company also has primary property insurance for up to US$400 million; also net of the deductible that covers all of Suncor's physical assets. As part of its normal course of operations, Suncor also carries risk mitigation instruments in the aggregate amount of US$300 million on certain foreign operations.
(c) Guarantees
At December 31, 2017, the company provides loan guarantees to certain retail licensees and wholesale marketers. Suncor's maximum potential amount payable under these loan guarantees is $125 million.
The company has also agreed to indemnify holders of all notes and debentures and the company's credit facility lenders (see note 22) for added costs relating to withholding taxes. Similar indemnity terms apply to certain facility and equipment leases. There is no limit to the maximum amount payable under these indemnification agreements. The company is unable to determine the maximum potential amount payable as government regulations and legislation are subject to change without notice. Under these agreements, the company has the option to redeem or terminate these contracts if additional costs are incurred.
The company also has guaranteed its working-interest share of certain joint venture undertakings related to transportation services agreements entered into with third parties. The guaranteed amount is limited to the company's share in the joint arrangement. As at December 31, 2017, the probability is remote that these guarantee commitments will impact the company.
34. ROSEBANK ACQUISITION
On October 6, 2016, Suncor completed the purchase of a 30% interest in the U.K. North Sea Rosebank project from OMV (U.K.) Limited (OMV) for an initial payment of US$50 million to OMV. In the event the co-venturers approve the Rosebank project final investment decision and Suncor elects to participate, Suncor could pay additional consideration of up to US$165 million. As the additional consideration is dependent on Suncor approval of the final investment decision, no amount has been recognized at December 31, 2017.
35. FORT HILLS
On December 21, 2017, the Fort Hills partners resolved their commercial dispute and reached an agreement in which Suncor acquired an additional 2.26% interest in the project for consideration of $308 million. Teck Resources Ltd. (Teck) also acquired
128 2017 ANNUAL REPORT Suncor Energy Inc.
an additional 0.89% interest in the project as a result of the agreement. Suncor's share in the project has increased to 53.06% and Teck's share has increased to 20.89% with Total E&P Canada Ltd. (Total) share decreasing to 26.05%.
The company has updated its commodity price, capital cost and operating cost assumptions for its Fort Hills project. As a result, the company performed an impairment test on its share of the project as at December 31, 2017. The impairment test was performed using a fair value less cost of disposal methodology, and no impairment was noted. An expected cash flow approach was used based on 2017 year end reserves data and long-range planning assumptions reviewed and approved by management, with the following assumptions (Level 3 fair value inputs):
- •
- WCS price forecasts of $56.40/bbl in 2018, $63.60/bbl in 2019, $65.60/bbl in 2020, $67.50/bbl in 2021, $71.60/bbl in 2022, $75.00/bbl in 2023 and beyond, (expressed in real dollars), adjusted for asset specific location and quality differentials;
- •
- risk-adjusted discount rate of 7.25% (after-tax);
- •
- production of approximately 100,800 bbls/d, net to Suncor, following a twelve-month ramp-up period starting in the first quarter of 2018; and
- •
- operating costs averaging approximately $21.95/bbl over the life of the project (expressed in real dollars).
Based on the above assumptions, the estimated recoverable amount in respect of the company's interest in Fort Hills exceeds the carrying value. The recoverable amount is sensitive to changes in the key assumptions. Future changes in these assumptions, individually or in combination, could result in the recoverable amount being less than the carrying value and require an impairment adjustment. A 5% decrease in the assumed realized prices would decrease the recoverable amount by approximately $1.1 billion. A 1% increase in the discount rate would decrease the recoverable amount by approximately $1.6 billion and a 5% increase in the estimated future operating costs would decrease the recoverable amount by $0.5 billion (sensitivities are after-tax).
The carrying value of the company's share of the Fort Hills project at December 31, 2017 was $11.8 billion, which includes capitalized interest, capital leases and amounts allocated to the project at the time of the company's merger with Petro-Canada in 2009.
36. SALE OF LUBRICANTS BUSINESS
On February 1, 2017, the company completed the previously announced sale of its lubricants business for proceeds of $1.1 billion before closing adjustments and other closing costs. The sale of this business resulted in an after-tax gain of $354 million, including a current tax expense of $101 million and a deferred tax recovery of $11 million, in the Refining and Marketing segment.
The table below details the assets and liabilities of the lubricants business that were held for sale as at December 31, 2016:
| ($ millions) | ||||
| Assets | ||||
| Accounts receivable | 209 | |||
| Prepaids | 3 | |||
| Inventories | 258 | |||
| Property, plant and equipment, net | 428 | |||
| Total assets | 898 | |||
| Liabilities | ||||
| Accounts payable and accrued liabilities | 72 | |||
| Income taxes payable | 3 | |||
| Pension liability | 20 | |||
| Deferred income taxes | 71 | |||
| Total liabilities | 166 | |||
2017 ANNUAL REPORT Suncor Energy Inc. 129
37. SALE OF CEDAR POINT
The company sold its interest in the Cedar Point wind facility in southwest Ontario for proceeds of $291 million before closing adjustments and other closing costs, with an effective date of January 1, 2017. The disposition resulted in an after-tax gain of $83 million, including a current tax expense of $29 million and a deferred tax recovery of $15 million, in the Corporate, Energy Trading and Eliminations segment.
The table below details the assets and liabilities of the renewable energy business that were held for sale as at December 31, 2016:
| ($ millions) | ||||
| Assets | ||||
| Accounts receivable | 23 | |||
| Property, plant and equipment, net | 284 | |||
| Total assets | 307 | |||
| Liabilities | ||||
| Accounts payable and accrued liabilities | 12 | |||
| Other long-term liabilities | 10 | |||
| Provisions | 9 | |||
| Total liabilities | 31 | |||
38. EAST TANK FARM DEVELOPMENT PARTNERSHIP (ETFD)
The ETFD consists of bitumen storage, blending and cooling facilities and connectivity to third party pipelines and began operations on July 14, 2017. ETFD will be solely responsible for moving the product of the Fort Hills joint operation to market. On November 22, 2017, the company completed the previously announced disposition of a 49% ownership interest in the ETFD to the Fort McKay First Nation and the Mikisew Cree First Nation for gross proceeds of $503 million. Suncor retained a 51% ownership interest and remains as operator of the assets. The assets are held by a newly formed limited partnership, which has a non-discretionary obligation to distribute the variable monthly residual cash in ETFD to the partners. Therefore, the company has recorded a liability within Other Long-Term Liabilities to reflect the 49% non-controlling interest of the third parties. As a result, the company will continue to consolidate 100% of the results of the Partnership. During the year ended December 31, 2017 the company paid $25 million in distributions to the partners, of which $5 million was allocated to interest expense and $20 million to the principal.
39. SUSPENDED EXPLORATORY WELL COSTS
| ($ millions) | 2017 | 2016 | ||||
| Beginning of year | — | 212 | ||||
| Additions | — | 209 | ||||
| Transfers to oil and gas assets | — | (65 | ) | |||
| Capitalized exploratory well costs charged to expense | — | (356 | ) | |||
| End of year | — | — | ||||
At December 31, 2017 and December 31, 2016, there were no suspended capitalized costs for exploratory wells. During 2016, one well was transferred to oil and gas assets as the project received sanction, and the remaining wells were impaired to a zero carrying value due to uncertainty around plans for future development.
130 2017 ANNUAL REPORT Suncor Energy Inc.
40. SUBSEQUENT EVENTS
On February 7, 2018, Suncor reached an agreement with Canbriam Energy Inc. (Canbriam) to exchange all of Suncor's northeast British Columbia mineral landholdings, including production, and consideration of $52 million for a 37% equity interest in Canbriam, a private natural gas company. The transaction is subject to regulatory approval and is expected to close in the first quarter of 2018.
On February 12, 2018 Suncor announced that it had entered into a purchase and sale agreement with Mocal Energy Limited (Mocal) to acquire Mocal's 5% interest in the Syncrude oil sands mining and upgrading joint arrangement for US$730 million ($925 million), subject to closing adjustments. The transaction has an effective date of January 1, 2018 and closed on February 23, 2018. Upon completion of the transaction, Suncor's working interest in Syncrude increased to 58.74%.
On February 20, 2018, Suncor acquired an additional 0.49% interest in the Fort Hills project for consideration of $65 million. The additional interest is an outcome of the commercial dispute settlement agreement reached among the Fort Hills partners on December 21, 2017. Teck also acquired an additional 0.19% interest in the project. Suncor's share in the project has increased to 53.55% and Teck's share has increased to 21.08% with Total's share decreasing to 25.37%. Working interests in the Fort Hills project may continue to be adjusted in accordance with the terms of the agreement.
On February 12, 2018, Suncor reached an agreement with Faroe Petroleum to purchase a 17.5% interest in the Fenja project in Norway for US$54.5 million ($68 million). This mature, well-defined project is awaiting regulatory approval and the transaction is expected to close in the second quarter of 2018, subject to customary closing conditions.
2017 ANNUAL REPORT Suncor Energy Inc. 131
SUPPLEMENTAL FINANCIAL AND OPERATING INFORMATION
QUARTERLY FINANCIAL SUMMARY
(unaudited)
| For the Quarter Ended | For the Quarter Ended | |||||||||||||||||||||
| ($ millions except per share amounts) | Mar 31 2017 | June 30 2017 | Sept 30 2017 | Dec 31 2017 | Total Year 2017 | Mar 31 2016 | June 30 2016 | Sept 30 2016 | Dec 31 2016 | Total Year 2016 | ||||||||||||
| Revenues and other income | 7 843 | 7 263 | 8 029 | 9 041 | 32 176 | 5 577 | 5 856 | 7 394 | 8 141 | 26 968 | ||||||||||||
| Net earnings (loss) | ||||||||||||||||||||||
| Oil Sands | 302 | (277 | ) | 314 | 670 | 1 009 | (524 | ) | (1 063 | ) | 162 | 276 | (1 149 | ) | ||||||||
| Exploration and Production | 172 | 182 | 161 | 217 | 732 | (34 | ) | 26 | 144 | 54 | 190 | |||||||||||
| Refining and Marketing | 829 | 346 | 597 | 886 | 2 658 | 241 | 689 | 436 | 524 | 1 890 | ||||||||||||
| Corporate, Energy Trading and Eliminations | 49 | 184 | 217 | (391 | ) | 59 | 574 | (387 | ) | (350 | ) | (323 | ) | (486 | ) | |||||||
| 1 352 | 435 | 1 289 | 1 382 | 4 458 | 257 | (735 | ) | 392 | 531 | 445 | ||||||||||||
| Operating earnings (loss)(A) | ||||||||||||||||||||||
| Oil Sands | 302 | (277 | ) | 314 | 615 | 954 | (524 | ) | (1 063 | ) | 162 | 316 | (1 109 | ) | ||||||||
| Exploration and Production | 172 | 182 | 161 | 231 | 746 | (34 | ) | 26 | (36 | ) | 54 | 10 | ||||||||||
| Refining and Marketing | 475 | 346 | 597 | 746 | 2 164 | 241 | 689 | 436 | 524 | 1 890 | ||||||||||||
| Corporate, Energy Trading and Eliminations | (137 | ) | (52 | ) | (205 | ) | (282 | ) | (676 | ) | (183 | ) | (217 | ) | (216 | ) | (258 | ) | (874 | ) | ||
| 812 | 199 | 867 | 1 310 | 3 188 | (500 | ) | (565 | ) | 346 | 636 | (83 | ) | ||||||||||
| Funds from (used in) operations(A) | ||||||||||||||||||||||
| Oil Sands | 1 109 | 573 | 1 276 | 1 780 | 4 738 | 263 | (202 | ) | 1 236 | 1 372 | 2 669 | |||||||||||
| Exploration and Production | 481 | 438 | 375 | 431 | 1 725 | 261 | 302 | 365 | 385 | 1 313 | ||||||||||||
| Refining and Marketing | 575 | 504 | 827 | 935 | 2 841 | 404 | 885 | 595 | 722 | 2 606 | ||||||||||||
| Corporate, Energy Trading and Eliminations | (141 | ) | 112 | (6 | ) | (130 | ) | (165 | ) | (246 | ) | (69 | ) | (171 | ) | (114 | ) | (600 | ) | |||
| 2 024 | 1 627 | 2 472 | 3 016 | 9 139 | 682 | 916 | 2 025 | 2 365 | 5 988 | |||||||||||||
| Cash flow provided by (used in) operating activities | ||||||||||||||||||||||
| Oil Sands | 1 558 | 1 042 | 416 | 1 271 | 4 287 | (33 | ) | (4 | ) | 734 | 1 589 | 2 286 | ||||||||||
| Exploration and Production | 369 | 708 | 103 | 532 | 1 712 | 65 | 458 | 309 | 541 | 1 373 | ||||||||||||
| Refining and Marketing | 474 | 505 | 1 994 | 1 431 | 4 404 | 370 | 1 119 | 200 | 1 704 | 3 393 | ||||||||||||
| Corporate, Energy Trading and Eliminations | (773 | ) | (584 | ) | 399 | (479 | ) | (1 437 | ) | (354 | ) | (711 | ) | 736 | (1 043 | ) | (1 372 | ) | ||||
| 1 628 | 1 671 | 2 912 | 2 755 | 8 966 | 48 | 862 | 1 979 | 2 791 | 5 680 | |||||||||||||
| Per common share | ||||||||||||||||||||||
| Net earnings (loss) basic and diluted | 0.81 | 0.26 | 0.78 | 0.84 | 2.68 | 0.17 | (0.46 | ) | 0.24 | 0.32 | 0.28 | |||||||||||
| Net earnings (loss) attributable to common shareholders – basic and diluted | 0.81 | 0.26 | 0.78 | 0.84 | 2.68 | 0.16 | (0.46 | ) | 0.24 | 0.32 | 0.27 | |||||||||||
| Operating earnings (loss) – basic(A) | 0.49 | 0.10 | 0.52 | 0.79 | 1.92 | (0.33 | ) | (0.36 | ) | 0.21 | 0.38 | (0.05 | ) | |||||||||
| Cash dividends – basic | 0.32 | 0.32 | 0.32 | 0.32 | 1.28 | 0.29 | 0.29 | 0.29 | 0.29 | 1.16 | ||||||||||||
| Funds from operations – basic(A) | 1.21 | 0.98 | 1.49 | 1.83 | 5.50 | 0.45 | 0.58 | 1.22 | 1.42 | 3.72 | ||||||||||||
| For the Twelve Months Ended | For the Twelve Months Ended | ||||||||||||||||
| Mar 31 2017 | Jun 30 2017 | Sep 30 2017 | Dec 31 2017 | Mar 31 2016 | Jun 30 2016 | Sep 30 2016 | Dec 31 2016 | ||||||||||
| Return on capital employed(A) | |||||||||||||||||
| – excluding major projects in progress (%) | 4.4 | 6.2 | 7.0 | 8.6 | (2.2 | ) | (4.9 | ) | (4.6 | ) | 0.5 | ||||||
| – including major projects in progress (%) | 3.5 | 4.9 | 5.5 | 6.7 | (1.9 | ) | (4.1 | ) | (3.9 | ) | 0.4 | ||||||
- (A)
- Non-GAAP financial measures. See the Operating Summary Information – Non-GAAP Financial Measures section of this Annual Report.
132 2017 ANNUAL REPORT Suncor Energy Inc.
QUARTERLY OPERATING SUMMARY
(unaudited)
| For the Quarter Ended | For the Quarter Ended | |||||||||||||||||||||
| Oil Sands | Mar 31 2017 | June 30 2017 | Sept 30 2017 | Dec 31 2017 | Total Year 2017 | Mar 31 2016 | June 30 2016 | Sept 30 2016 | Dec 31 2016 | Total Year 2016 | ||||||||||||
| Total Production (mbbls/d) | 590.6 | 413.6 | 628.4 | 621.2 | 563.7 | 565.8 | 213.1 | 617.5 | 620.4 | 504.9 | ||||||||||||
Oil Sands operations | ||||||||||||||||||||||
| Production (mbbls/d) | ||||||||||||||||||||||
| Upgraded product (sweet SCO, sour SCO and diesel) | 332.8 | 288.6 | 324.4 | 324.9 | 317.7 | 322.3 | 86.4 | 301.1 | 324.5 | 258.9 | ||||||||||||
| Non-upgraded bitumen | 115.7 | 64.0 | 144.9 | 121.9 | 111.7 | 130.7 | 91.1 | 132.6 | 108.9 | 115.9 | ||||||||||||
| Oil Sands operations production | 448.5 | 352.6 | 469.3 | 446.8 | 429.4 | 453.0 | 177.5 | 433.7 | 433.4 | 374.8 | ||||||||||||
| Bitumen production (mbbls/d) | ||||||||||||||||||||||
| Mining | 311.1 | 293.1 | 328.1 | 296.7 | 305.4 | 302.0 | 66.8 | 295.1 | 284.8 | 238.0 | ||||||||||||
| In Situ – Firebag | 202.8 | 110.9 | 203.6 | 208.5 | 181.5 | 199.0 | 121.8 | 197.6 | 204.5 | 180.8 | ||||||||||||
| In Situ – MacKay River | 35.6 | 30.0 | 30.8 | 28.3 | 31.1 | 36.8 | 13.1 | 26.6 | 33.9 | 27.6 | ||||||||||||
| Total bitumen production | 549.5 | 434.0 | 562.5 | 533.5 | 518.0 | 537.8 | 201.7 | 519.3 | 523.2 | 446.4 | ||||||||||||
| Sales (mbbls/d) | ||||||||||||||||||||||
| Light sweet crude oil | 124.9 | 104.4 | 105.9 | 95.5 | 107.9 | 132.2 | 29.0 | 100.8 | 87.2 | 87.3 | ||||||||||||
| Diesel | 30.3 | 29.6 | 30.4 | 21.1 | 27.5 | 24.8 | 3.4 | 27.9 | 28.4 | 21.2 | ||||||||||||
| Light sour crude oil | 176.4 | 160.1 | 183.2 | 214.4 | 183.6 | 172.7 | 76.3 | 162.5 | 201.5 | 153.4 | ||||||||||||
| Upgraded product (SCO and diesel) | 331.6 | 294.1 | 319.5 | 331.0 | 319.0 | 329.7 | 108.7 | 291.2 | 317.1 | 261.9 | ||||||||||||
| Non-upgraded bitumen | 104.9 | 86.0 | 120.3 | 130.7 | 110.6 | 134.5 | 108.1 | 123.5 | 103.5 | 117.4 | ||||||||||||
| Sales | 436.5 | 380.1 | 439.8 | 461.7 | 429.6 | 464.2 | 216.8 | 414.7 | 420.6 | 379.3 | ||||||||||||
| Cash operating costs – Average(1)(A) ($/bbl) | ||||||||||||||||||||||
| Cash costs | 20.15 | 25.70 | 20.40 | 22.55 | 21.95 | 22.55 | 44.55 | 20.30 | 22.10 | 24.35 | ||||||||||||
| Natural gas | 2.40 | 2.10 | 1.20 | 1.65 | 1.85 | 1.70 | 2.25 | 1.85 | 2.85 | 2.15 | ||||||||||||
| 22.55 | 27.80 | 21.60 | 24.20 | 23.80 | 24.25 | 46.80 | 22.15 | 24.95 | 26.50 | |||||||||||||
| Cash operating costs – Mining bitumen production only(1)(A) ($/bbl) | ||||||||||||||||||||||
| Cash costs | 19.95 | 21.25 | 20.60 | 24.55 | 21.55 | 21.70 | 76.65 | 19.30 | 22.55 | 25.00 | ||||||||||||
| Natural gas | 0.60 | 0.60 | 0.25 | 0.45 | 0.45 | 0.50 | 1.15 | 0.50 | 0.80 | 0.60 | ||||||||||||
| 20.55 | 21.85 | 20.85 | 25.00 | 22.00 | 22.20 | 77.80 | 19.80 | 23.35 | 25.60 | |||||||||||||
| Cash operating costs – In situ bitumen production only(1)(A) ($/bbl) | ||||||||||||||||||||||
| Cash costs | 7.00 | 10.95 | 6.75 | 6.20 | 7.35 | 7.60 | 10.75 | 7.15 | 6.35 | 7.60 | ||||||||||||
| Natural gas | 4.00 | 4.00 | 2.20 | 2.65 | 3.15 | 2.80 | 2.20 | 3.30 | 4.40 | 3.30 | ||||||||||||
| 11.00 | 14.95 | 8.95 | 8.85 | 10.50 | 10.40 | 12.95 | 10.45 | 10.75 | 10.90 | |||||||||||||
Syncrude | ||||||||||||||||||||||
| Sweet SCO Production (mbbls/d) | 142.1 | 61.0 | 159.1 | 174.4 | 134.3 | 112.8 | 35.6 | 183.8 | 187.0 | 130.1 | ||||||||||||
| Bitumen production (mbbls/d) | 170.0 | 82.4 | 193.7 | 207.5 | 163.6 | 120.6 | 52.5 | 210.1 | 219.6 | 151.1 | ||||||||||||
| Intermediate sour SCO (mbbls/d)(2) | 140.9 | 61.3 | 157.1 | 177.1 | 132.9 | 109.0 | 42.8 | 179.2 | 192.6 | 131.2 | ||||||||||||
| Cash operating costs(1)(A) ($/bbl)* | ||||||||||||||||||||||
| Cash costs | 43.25 | 89.90 | 34.00 | 31.75 | 42.50 | 30.25 | 111.40 | 26.50 | 31.05 | 34.60 | ||||||||||||
| Natural gas | 1.90 | 7.90 | 1.00 | 1.05 | 1.55 | 1.10 | 2.15 | 1.15 | 1.50 | 1.35 | ||||||||||||
| 45.15 | 97.80 | 35.00 | 32.80 | 44.05 | 31.35 | 113.55 | 27.65 | 32.55 | 35.95 | |||||||||||||
- (A)
- Non-GAAP financial measures. See the Operating Metrics Reconciliation and the Operating Summary Information – Non-GAAP Financial Measures sections of this Annual Report.
See accompanying footnotes and definitions to the operating summaries.
2017 ANNUAL REPORT Suncor Energy Inc. 133
QUARTERLY OPERATING SUMMARY(continued)
(unaudited)
| For the Quarter Ended | For the Quarter Ended | ||||||||||||||||||||||
| Oil Sands Operating Netbacks(A) | Mar 31 2017 | June 30 2017 | Sept 30 2017 | Dec 31 2017 | Total Year 2017 | Mar 31 2016 | June 30 2016 | Sept 30 2016 | Dec 31 2016 | Total Year 2016 | |||||||||||||
| Bitumen ($/bbl) | |||||||||||||||||||||||
| Average price realized | 35.03 | 37.61 | 38.10 | 42.00 | 38.45 | 12.00 | 23.90 | 26.67 | 31.68 | 23.50 | |||||||||||||
| Royalties | (0.54 | ) | (0.69 | ) | (0.50 | ) | (1.02 | ) | (0.71 | ) | — | (0.24 | ) | (0.39 | ) | (0.33 | ) | (0.23 | ) | ||||
| Transportation costs | (6.57 | ) | (7.06 | ) | (3.78 | ) | (3.06 | ) | (4.85 | ) | (5.57 | ) | (5.69 | ) | (4.80 | ) | (5.52 | ) | (5.38 | ) | |||
| Net operating expenses | (9.98 | ) | (14.05 | ) | (8.26 | ) | (7.61 | ) | (9.59 | ) | (9.81 | ) | (14.65 | ) | (10.73 | ) | (9.99 | ) | (11.25 | ) | |||
| Operating netback | 17.94 | 15.81 | 25.56 | 30.31 | 23.30 | (3.38 | ) | 3.32 | 10.75 | 15.84 | 6.64 | ||||||||||||
| SCO and diesel ($/bbl) | |||||||||||||||||||||||
| Average price realized | 66.38 | 64.20 | 59.69 | 70.27 | 65.21 | 43.27 | 52.58 | 56.69 | 62.28 | 53.53 | |||||||||||||
| Royalties | (0.59 | ) | (1.19 | ) | (1.03 | ) | (1.14 | ) | (0.98 | ) | (0.57 | ) | (0.33 | ) | (0.42 | ) | 2.74 | 0.50 | |||||
| Transportation costs | (3.98 | ) | (3.72 | ) | (3.65 | ) | (3.87 | ) | (3.81 | ) | (3.83 | ) | (5.07 | ) | (2.96 | ) | (3.98 | ) | (3.76 | ) | |||
| Net operating expenses – bitumen | (21.01 | ) | (24.14 | ) | (21.66 | ) | (23.21 | ) | (22.47 | ) | (21.98 | ) | (50.90 | ) | (20.69 | ) | (22.56 | ) | (24.87 | ) | |||
| Net operating expenses – upgrading | (3.58 | ) | (4.15 | ) | (3.28 | ) | (3.40 | ) | (3.59 | ) | (5.51 | ) | (12.02 | ) | (4.34 | ) | (4.31 | ) | (5.38 | ) | |||
| Operating netback | 37.22 | 31.00 | 30.07 | 38.65 | 34.36 | 11.38 | (15.74 | ) | 28.28 | 34.17 | 20.02 | ||||||||||||
| Average Oil Sands operations ($/bbl) | |||||||||||||||||||||||
| Average price realized | 58.84 | 58.18 | 53.78 | 62.27 | 58.32 | 34.21 | 38.28 | 47.75 | 54.75 | 44.23 | |||||||||||||
| Royalties | (0.58 | ) | (1.07 | ) | (0.89 | ) | (1.11 | ) | (0.91 | ) | (0.41 | ) | (0.29 | ) | (0.41 | ) | 1.99 | 0.28 | |||||
| Transportation costs | (4.60 | ) | (4.47 | ) | (3.68 | ) | (3.64 | ) | (4.08 | ) | (4.34 | ) | (5.38 | ) | (3.51 | ) | (4.36 | ) | (4.26 | ) | |||
| Net operating expenses – bitumen and upgrading | (21.07 | ) | (25.08 | ) | (20.38 | ) | (21.23 | ) | (21.82 | ) | (22.36 | ) | (38.85 | ) | (20.77 | ) | (22.72 | ) | (24.37 | ) | |||
| Operating netback | 32.59 | 27.56 | 28.83 | 36.29 | 31.51 | 7.10 | (6.24 | ) | 23.06 | 29.66 | 15.88 | ||||||||||||
| Syncrude ($/bbl) | |||||||||||||||||||||||
| Average price realized | 66.37 | 62.27 | 60.68 | 73.64 | 66.59 | 44.93 | 59.34 | 58.62 | 64.28 | 56.91 | |||||||||||||
| Royalties | (2.96 | ) | — | (3.18 | ) | (7.94 | ) | (4.32 | ) | (0.18 | ) | (0.98 | ) | (0.26 | ) | (4.70 | ) | (1.90 | ) | ||||
| Transportation costs | (0.38 | ) | (1.83 | ) | (0.38 | ) | (0.36 | ) | (0.54 | ) | (0.86 | ) | (1.70 | ) | (0.29 | ) | (0.35 | ) | (0.53 | ) | |||
| Net operating expenses – bitumen and upgrading | (39.70 | ) | (90.72 | ) | (31.48 | ) | (28.81 | ) | (39.46 | ) | (27.75 | ) | (102.35 | ) | (25.05 | ) | (29.18 | ) | (32.05 | ) | |||
| Operating netback | 23.33 | (30.28 | ) | 25.64 | 36.53 | 22.27 | 16.14 | (45.69 | ) | 33.02 | 30.05 | 22.43 | |||||||||||
- (A)
- Non-GAAP financial measures. See the Operating Metrics Reconciliation and the Operating Summary Information – Non-GAAP Financial Measures sections of this Annual Report.
See accompanying footnotes and definitions to the operating summaries.
134 2017 ANNUAL REPORT Suncor Energy Inc.
QUARTERLY OPERATING SUMMARY(continued)
(unaudited)
| For the Quarter Ended | For the Quarter Ended | |||||||||||||||||||||||
| Exploration and Production | Mar 31 2017 | June 30 2017 | Sept 30 2017 | Dec 31 2017 | Total Year 2017 | Mar 31 2016 | June 30 2016 | Sept 30 2016 | Dec 31 2016 | Total Year 2016 | ||||||||||||||
| Total Sales Volume (mboe/d) | 136.8 | 130.3 | 112.6 | 104.8 | 120.8 | 133.4 | 120.4 | 103.1 | 120.5 | 119.3 | ||||||||||||||
| Total Production (mboe/d) | 134.5 | 125.5 | 111.5 | 115.2 | 121.6 | 125.6 | 117.6 | 110.6 | 118.1 | 117.9 | ||||||||||||||
| Production Volumes | ||||||||||||||||||||||||
| Exploration and Production Canada | ||||||||||||||||||||||||
| East Coast Canada | ||||||||||||||||||||||||
| Terra Nova (mbbls/d) | 14.7 | 11.0 | 5.8 | 14.6 | 11.5 | 12.8 | 5.4 | 14.7 | 16.7 | 12.4 | ||||||||||||||
| Hibernia (mbbls/d) | 30.3 | 30.0 | 26.6 | 27.1 | 28.5 | 24.1 | 24.6 | 28.2 | 30.1 | 26.8 | ||||||||||||||
| White Rose (mbbls/d) | 13.1 | 12.9 | 9.0 | 10.6 | 11.4 | 13.7 | 11.7 | 7.5 | 10.9 | 10.9 | ||||||||||||||
| Hebron (mbbls/d) | — | — | — | 1.8 | 0.4 | — | — | — | — | — | ||||||||||||||
| North America Onshore (mboe/d) | 2.8 | 1.8 | 1.5 | 1.4 | 1.9 | 3.0 | 2.7 | 2.7 | 2.8 | 2.8 | ||||||||||||||
| 60.9 | 55.7 | 42.9 | 55.5 | 53.7 | 53.6 | 44.4 | 53.1 | 60.5 | 52.9 | |||||||||||||||
| Exploration and Production International | ||||||||||||||||||||||||
| Buzzard (mboe/d) | 49.0 | 45.3 | 44.3 | 36.6 | 43.8 | 53.4 | 52.7 | 40.8 | 37.5 | 46.0 | ||||||||||||||
| Golden Eagle (mboe/d) | 20.2 | 20.1 | 20.5 | 17.9 | 19.6 | 18.6 | 20.5 | 16.2 | 19.0 | 18.6 | ||||||||||||||
| United Kingdom (mboe/d) | 69.2 | 65.4 | 64.8 | 54.5 | 63.4 | 72.0 | 73.2 | 57.0 | 56.5 | 64.6 | ||||||||||||||
| Libya (mbbls/d)(3) | 4.4 | 4.4 | 3.8 | 5.2 | 4.5 | — | — | 0.5 | 1.1 | 0.4 | ||||||||||||||
| 73.6 | 69.8 | 68.6 | 59.7 | 67.9 | 72.0 | 73.2 | 57.5 | 57.6 | 65.0 | |||||||||||||||
| Netbacks(A) | ||||||||||||||||||||||||
| East Coast Canada ($/bbl) | ||||||||||||||||||||||||
| Average price realized | 69.75 | 66.26 | 67.23 | 81.49 | 71.06 | 46.17 | 62.39 | 61.63 | 68.06 | 59.31 | ||||||||||||||
| Royalties | (15.94 | ) | (14.05 | ) | (13.01 | ) | (13.21 | ) | (14.26 | ) | (5.51 | ) | (11.06 | ) | (10.93 | ) | (15.07 | ) | (10.64 | ) | ||||
| Transportation costs | (1.72 | ) | (1.60 | ) | (2.13 | ) | (2.27 | ) | (1.90 | ) | (1.68 | ) | (2.05 | ) | (2.33 | ) | (1.72 | ) | (1.91 | ) | ||||
| Operating costs | (9.28 | ) | (10.58 | ) | (14.72 | ) | (11.16 | ) | (11.24 | ) | (13.72 | ) | (14.76 | ) | (13.57 | ) | (9.52 | ) | (12.67 | ) | ||||
| Operating netback | 42.81 | 40.03 | 37.37 | 54.85 | 43.66 | 25.26 | 34.52 | 34.80 | 41.75 | 34.09 | ||||||||||||||
| United Kingdom ($/boe) | ||||||||||||||||||||||||
| Average price realized | 67.55 | 63.46 | 62.99 | 76.46 | 67.25 | 43.02 | 55.43 | 56.96 | 62.63 | 53.91 | ||||||||||||||
| Transportation costs | (1.81 | ) | (1.88 | ) | (1.77 | ) | (1.80 | ) | (1.81 | ) | (1.97 | ) | (2.00 | ) | (1.69 | ) | (1.62 | ) | (1.84 | ) | ||||
| Operating costs | (3.75 | ) | (4.57 | ) | (4.51 | ) | (5.89 | ) | (4.62 | ) | (5.75 | ) | (4.68 | ) | (5.29 | ) | (7.00 | ) | (5.62 | ) | ||||
| Operating netback | 61.99 | 57.01 | 56.71 | 68.77 | 60.82 | 35.30 | 48.75 | 49.98 | 54.01 | 46.45 | ||||||||||||||
- (A)
- Non-GAAP financial measures. See the Operating Metrics Reconciliation and the Operating Summary Information – Non-GAAP Financial Measures sections of this Annual Report.
See accompanying footnotes and definitions to the operating summaries.
2017 ANNUAL REPORT Suncor Energy Inc. 135
QUARTERLY OPERATING SUMMARY(continued)
(unaudited)
| For the Quarter Ended | For the Quarter Ended | ||||||||||||||||||||||
| Refining and Marketing | Mar 31 2017 | June 30 2017 | Sept 30 2017 | Dec 31 2017 | Total Year 2017 | Mar 31 2016 | June 30 2016 | Sept 30 2016 | Dec 31 2016 | Total Year 2016 | |||||||||||||
| Refined product sales (mbbls/d) | 508.0 | 521.9 | 564.5 | 526.8 | 530.5 | 489.5 | 532.5 | 548.7 | 514.8 | 521.4 | |||||||||||||
| Crude oil processed (mbbls/d) | 429.9 | 435.5 | 466.8 | 432.4 | 441.2 | 420.9 | 400.2 | 465.6 | 427.3 | 428.6 | |||||||||||||
| Utilization of refining capacity (%) | 93 | 94 | 101 | 94 | 96 | 91 | 87 | 101 | 93 | 93 | |||||||||||||
| Refining margin(A) ($/bbl) | 22.30 | 18.85 | 23.80 | 31.75 | 24.20 | 19.10 | 21.65 | 17.75 | 23.00 | 20.30 | |||||||||||||
| Refining operating expense(A) ($/bbl) | 5.50 | 5.05 | 4.50 | 5.25 | 5.05 | 5.10 | 5.40 | 4.55 | 5.45 | 5.10 | |||||||||||||
| Eastern North America | |||||||||||||||||||||||
| Refined product sales (mbbls/d) | |||||||||||||||||||||||
| Transportation fuels | |||||||||||||||||||||||
| Gasoline | 112.8 | 114.8 | 121.2 | 121.1 | 117.5 | 107.8 | 117.8 | 119.8 | 115.5 | 115.2 | |||||||||||||
| Distillate | 82.2 | 82.9 | 92.6 | 89.2 | 86.8 | 75.5 | 71.8 | 77.8 | 79.9 | 76.3 | |||||||||||||
| Total transportation fuel sales | 195.0 | 197.7 | 213.8 | 210.3 | 204.3 | 183.3 | 189.6 | 197.6 | 195.4 | 191.5 | |||||||||||||
| Petrochemicals | 15.5 | 12.2 | 10.6 | 10.5 | 12.2 | 12.0 | 7.7 | 7.2 | 10.1 | 9.2 | |||||||||||||
| Asphalt | 12.6 | 18.0 | 20.6 | 15.8 | 16.8 | 11.9 | 15.3 | 22.9 | 16.8 | 16.7 | |||||||||||||
| Other | 34.5 | 35.5 | 32.4 | 31.4 | 33.4 | 35.4 | 39.4 | 34.6 | 34.4 | 35.9 | |||||||||||||
| Total refined product sales | 257.6 | 263.4 | 277.4 | 268.0 | 266.7 | 242.6 | 252.0 | 262.3 | 256.7 | 253.3 | |||||||||||||
| Crude oil supply and refining | |||||||||||||||||||||||
| Processed at refineries (mbbls/d) | 214.6 | 208.6 | 213.9 | 188.7 | 206.4 | 212.1 | 181.7 | 213.5 | 204.8 | 203.1 | |||||||||||||
| Utilization of refining capacity (%) | 97 | 94 | 96 | 85 | 93 | 96 | 82 | 96 | 92 | 92 | |||||||||||||
| Western North America | |||||||||||||||||||||||
| Refined product sales (mbbls/d) | |||||||||||||||||||||||
| Transportation fuels | |||||||||||||||||||||||
| Gasoline | 117.1 | 122.0 | 136.4 | 125.7 | 125.4 | 122.4 | 133.5 | 134.6 | 125.8 | 129.1 | |||||||||||||
| Distillate | 110.1 | 108.3 | 119.9 | 111.7 | 112.5 | 96.6 | 118.2 | 117.4 | 106.8 | 109.8 | |||||||||||||
| Total transportation fuel sales | 227.2 | 230.3 | 256.3 | 237.4 | 237.9 | 219.0 | 251.7 | 252.0 | 232.6 | 238.9 | |||||||||||||
| Asphalt | 9.2 | 14.6 | 16.0 | 9.3 | 12.3 | 8.7 | 11.7 | 16.9 | 9.7 | 11.8 | |||||||||||||
| Other | 14.0 | 13.6 | 14.8 | 12.1 | 13.6 | 19.2 | 17.1 | 17.5 | 15.8 | 17.4 | |||||||||||||
| Total refined product sales | 250.4 | 258.5 | 287.1 | 258.8 | 263.8 | 246.9 | 280.5 | 286.4 | 258.1 | 268.1 | |||||||||||||
| Crude oil supply and refining | |||||||||||||||||||||||
| Processed at refineries (mbbls/d) | 215.3 | 226.9 | 252.9 | 243.7 | 234.8 | 208.8 | 218.5 | 252.1 | 222.5 | 225.5 | |||||||||||||
| Utilization of refining capacity (%) | 90 | 95 | 105 | 102 | 98 | 87 | 91 | 105 | 93 | 94 | |||||||||||||
- (A)
- Non-GAAP financial measures. See the Operating Metrics Reconciliation and the Operating Summary Information – Non-GAAP Financial Measures sections of this Annual Report.
See accompanying footnotes and definitions to the operating summaries.
136 2017 ANNUAL REPORT Suncor Energy Inc.
FIVE-YEAR FINANCIAL SUMMARY
(unaudited)
| ($ millions) | 2017 | 2016 | 2015 | 2014 | 2013 | |||||||
Revenues and other income | 32 176 | 26 968 | 29 680 | 40 490 | 40 297 | |||||||
| Net earnings (loss) | ||||||||||||
| Oil Sands | 1 009 | (1 149 | ) | (856 | ) | 1 776 | 2 040 | |||||
| Exploration and Production | 732 | 190 | (758 | ) | 653 | 1 000 | ||||||
| Refining and Marketing | 2 658 | 1 890 | 2 306 | 1 767 | 2 088 | |||||||
| Corporate, Energy Trading and Eliminations | 59 | (486 | ) | (2 687 | ) | (1 497 | ) | (1 217 | ) | |||
| 4 458 | 445 | (1 995 | ) | 2 699 | 3 911 | |||||||
| Operating earnings (loss)(A) | ||||||||||||
| Oil Sands | 954 | (1 109 | ) | (111 | ) | 2 771 | 2 098 | |||||
| Exploration and Production | 746 | 10 | 7 | 857 | 1 210 | |||||||
| Refining and Marketing | 2 164 | 1 890 | 2 274 | 1 767 | 2 088 | |||||||
| Corporate, Energy Trading and Eliminations | (676 | ) | (874 | ) | (705 | ) | (775 | ) | (696 | ) | ||
| 3 188 | (83 | ) | 1 465 | 4 620 | 4 700 | |||||||
| Funds from (used in) operations(A) | ||||||||||||
| Oil Sands | 4 738 | 2 669 | 2 835 | 5 400 | 4 556 | |||||||
| Exploration and Production | 1 725 | 1 313 | 1 386 | 1 909 | 2 316 | |||||||
| Refining and Marketing | 2 841 | 2 606 | 2 921 | 2 262 | 2 694 | |||||||
| Corporate, Energy Trading and Eliminations | (165 | ) | (600 | ) | (336 | ) | (513 | ) | (154 | ) | ||
| 9 139 | 5 988 | 6 806 | 9 058 | 9 412 | ||||||||
| Cash flow provided by (used in) operating activities | ||||||||||||
| Oil Sands | 4 287 | 2 286 | 2 808 | 6 652 | 5 781 | |||||||
| Exploration and Production | 1 712 | 1 373 | 1 708 | 2 110 | 2 972 | |||||||
| Refining and Marketing | 4 404 | 3 393 | 3 227 | 1 956 | 3 178 | |||||||
| Corporate, Energy Trading and Eliminations | (1 437 | ) | (1 372 | ) | (859 | ) | (1 782 | ) | (1 831 | ) | ||
| 8 966 | 5 680 | 6 884 | 8 936 | 10 100 | ||||||||
| Capital and exploration expenditures (including capitalized interest) | ||||||||||||
| Oil Sands | 5 059 | 4 724 | 4 181 | 3 826 | 4 311 | |||||||
| Exploration and Production | 824 | 1 139 | 1 459 | 1 819 | 1 483 | |||||||
| Refining and Marketing | 634 | 685 | 821 | 1 024 | 894 | |||||||
| Corporate, Energy Trading and Eliminations | 34 | 34 | 206 | 292 | 89 | |||||||
| 6 551 | 6 582 | 6 667 | 6 961 | 6 777 | ||||||||
| Total assets | 89 494 | 88 702 | 77 527 | 79 671 | 78 315 | |||||||
| Ending capital employed | ||||||||||||
| Short-term and long-term debt, less cash and cash equivalents | 12 886 | 14 414 | 11 254 | 7 834 | 6 256 | |||||||
| Shareholders' equity | 45 383 | 44 630 | 39 039 | 41 603 | 41 180 | |||||||
| 58 269 | 59 044 | 50 293 | 49 437 | 47 436 | ||||||||
| Less capitalized costs related to major projects in progress | (12 901 | ) | (10 147 | ) | (7 195 | ) | (6 203 | ) | (6 502 | ) | ||
| 45 368 | 48 897 | 43 098 | 43 234 | 40 934 | ||||||||
| Total Suncor employees (number at year end) | 12 381 | 12 837 | 13 190 | 13 980 | 13 946 | |||||||
- (A)
- Non-GAAP financial measures. See the Operating Summary Information – Non-GAAP Financial Measures section of this Annual Report.
See accompanying footnotes and definitions to the operating summaries.
2017 ANNUAL REPORT Suncor Energy Inc. 137
FIVE-YEAR FINANCIAL SUMMARY(continued)
(unaudited)
| ($ millions) | 2017 | 2016 | 2015 | 2014 | 2013 | |||||||
| Dollars per common share | ||||||||||||
| Net earnings (loss)(A) | 2.68 | 0.28 | (1.38 | ) | 1.84 | 2.61 | ||||||
| Operating earnings (loss)(A) | 1.92 | (0.05 | ) | 1.01 | 3.15 | 3.13 | ||||||
| Cash dividends | 1.28 | 1.16 | 1.14 | 1.02 | 0.73 | |||||||
| Funds from operations(A) | 5.50 | 3.72 | 4.71 | 6.19 | 6.27 | |||||||
Ratios | ||||||||||||
| Return on capital employed (%)(A)(B) | 8.6 | 0.5 | 0.6 | 8.6 | 11.5 | |||||||
| Return on capital employed (%)(A)(C) | 6.7 | 0.4 | 0.5 | 7.5 | 9.9 | |||||||
| Debt to debt plus shareholders' equity (%)(D) | 26 | 28 | 28 | 24 | 22 | |||||||
| Net debt to funds from operations (times)(A)(E) | 1.4 | 2.4 | 1.7 | 0.9 | 0.7 | |||||||
| Interest coverage – funds from operations basis (times)(A)(F) | 11.2 | 6.5 | 9.3 | 15.5 | 16.8 | |||||||
| Interest coverage – net earnings (loss) basis (times)(G) | 6.5 | 0.5 | (1.8 | ) | 6.6 | 9.5 | ||||||
- (A)
- Non-GAAP financial measures. See the Operating Summary Information – Non-GAAP Financial Measures section of this Annual Report.
- (B)
- Net earnings (loss) adjusted for after-tax interest expense and after-tax foreign exchange loss (gain) on U.S. denominated long-term debt for the twelve-month period ended, divided by average capital employed. Average capital employed is the sum of shareholders' equity and short-term debt plus long-term debt less cash and cash equivalents, less average capitalized costs related to major projects in progress, on a weighted average basis.
- (C)
- Average capital employed including capitalized costs related to major projects in progress.
- (D)
- Short-term debt plus long-term debt, divided by the sum of short-term debt, long-term debt and shareholders' equity.
- (E)
- Short-term debt plus long-term debt less cash and cash equivalents, divided by funds from operations for the year then ended.
- (F)
- Funds from operations plus current income taxes and interest expense, divided by the sum of interest expense and capitalized interest.
- (G)
- Net earnings (loss) plus income taxes and interest expense, divided by the sum of interest expense and capitalized interest.
138 2017 ANNUAL REPORT Suncor Energy Inc.
FIVE-YEAR OPERATING SUMMARY
(unaudited)
| Oil Sands | 2017 | 2016 | 2015 | 2014 | 2013 | |||||||
| Total Production (mbbls/d) | 563.7 | 504.9 | 463.4 | 421.9 | 392.5 | |||||||
Oil Sands Operations | ||||||||||||
| Production (mbbls/d) | ||||||||||||
| Upgraded product (sweet SCO, sour SCO and diesel) | 317.7 | 258.9 | 320.1 | 289.1 | 282.6 | |||||||
| Non-upgraded bitumen | 111.7 | 115.9 | 113.5 | 101.8 | 77.9 | |||||||
| Oil Sands operations production | 429.4 | 374.8 | 433.6 | 390.9 | 360.5 | |||||||
| Bitumen production (mbbls/d) | ||||||||||||
| Mining | 305.4 | 238.0 | 307.3 | 274.4 | 269.8 | |||||||
| In Situ – Firebag | 181.5 | 180.8 | 186.9 | 172.0 | 143.4 | |||||||
| In Situ – MacKay River | 31.1 | 27.6 | 30.7 | 27.0 | 28.5 | |||||||
| Total bitumen production | 518.0 | 446.4 | 524.9 | 473.4 | 441.7 | |||||||
| Sales (mbbls/d) | ||||||||||||
| Light sweet crude oil | 107.9 | 87.3 | 107.0 | 99.7 | 91.5 | |||||||
| Diesel | 27.5 | 21.2 | 31.3 | 30.7 | 23.5 | |||||||
| Light sour crude oil | 183.6 | 153.4 | 182.5 | 158.9 | 166.0 | |||||||
| Upgraded product (SCO and diesel) | 319.0 | 261.9 | 320.8 | 289.3 | 281.0 | |||||||
| Non-upgraded bitumen | 110.6 | 117.4 | 107.7 | 101.4 | 76.0 | |||||||
| Sales | 429.6 | 379.3 | 428.5 | 390.7 | 357.0 | |||||||
| Cash operating costs – Average(1)(A) ($/bbl) | ||||||||||||
| Cash costs | 21.95 | 24.35 | 25.65 | 30.00 | 34.10 | |||||||
| Natural gas | 1.85 | 2.15 | 2.20 | 3.80 | 2.90 | |||||||
| 23.80 | 26.50 | 27.85 | 33.80 | 37.00 | ||||||||
| Cash operating costs – Mining bitumen production only(1)(A) ($/bbl) | ||||||||||||
| Cash costs | 21.55 | 25.00 | 23.20 | 27.80 | 28.80 | |||||||
| Natural gas | 0.45 | 0.60 | 0.55 | 0.80 | 0.45 | |||||||
| 22.00 | 25.60 | 23.75 | 28.60 | 29.25 | ||||||||
| Cash operating costs – In situ bitumen production only(1)(A) ($/bbl) | ||||||||||||
| Cash costs | 7.35 | 7.60 | 9.00 | 10.20 | 11.35 | |||||||
| Natural gas | 3.15 | 3.30 | 3.80 | 6.45 | 5.15 | |||||||
| 10.50 | 10.90 | 12.80 | 16.65 | 16.50 | ||||||||
Syncrude | ||||||||||||
| Sweet SCO Production (mbbls/d) | 134.3 | 130.1 | 29.8 | 31.0 | 32.0 | |||||||
| Cash operating costs(1)(A) ($/bbl)* | ||||||||||||
| Cash costs | 42.50 | 34.60 | 40.35 | 46.75 | 41.75 | |||||||
| Natural gas | 1.55 | 1.35 | 1.65 | 2.40 | 1.45 | |||||||
| 44.05 | 35.95 | 42.00 | 49.15 | 43.20 | ||||||||
- (A)
- Non-GAAP financial measures. See the Operating Metrics Reconciliation and the Operating Summary Information – Non-GAAP Financial Measures sections of this Annual Report.
See accompanying footnotes and definitions to the operating summaries.
2017 ANNUAL REPORT Suncor Energy Inc. 139
FIVE-YEAR OPERATING SUMMARY(continued)
(unaudited)
| Oil Sands Operating Netbacks(A) | 2017 | 2016 | 2015 | 2014 | 2013 | ||||||||
| Bitumen ($/bbl) | |||||||||||||
| Average price realized | 38.45 | 23.50 | 32.18 | 65.83 | 53.27 | ||||||||
| Royalties | (0.71 | ) | (0.23 | ) | (0.41 | ) | (4.52 | ) | (4.02 | ) | |||
| Transportation costs | (4.85 | ) | (5.38 | ) | (6.26 | ) | (5.27 | ) | (3.98 | ) | |||
| Net operating expenses | (9.59 | ) | (11.25 | ) | (11.76 | ) | (15.30 | ) | (16.43 | ) | |||
| Operating netback | 23.30 | 6.64 | 13.75 | 40.74 | 28.84 | ||||||||
| SCO and diesel ($/bbl) | |||||||||||||
| Average price realized | 65.21 | 53.53 | 59.81 | 98.90 | 94.04 | ||||||||
| Royalties | (0.98 | ) | 0.50 | (0.65 | ) | (7.00 | ) | (6.72 | ) | ||||
| Transportation costs | (3.81 | ) | (3.76 | ) | (3.36 | ) | (3.21 | ) | (3.54 | ) | |||
| Net operating expenses – bitumen | (22.47 | ) | (24.87 | ) | (24.91 | ) | (28.67 | ) | (29.97 | ) | |||
| Net operating expenses – upgrading | (3.59 | ) | (5.38 | ) | (5.96 | ) | (7.89 | ) | (8.64 | ) | |||
| Operating netback | 34.36 | 20.02 | 24.93 | 52.13 | 45.17 | ||||||||
| Average Oil Sands operations ($/bbl) | |||||||||||||
| Average price realized | 58.32 | 44.23 | 52.87 | 90.32 | 85.40 | ||||||||
| Royalties | (0.91 | ) | 0.28 | (0.59 | ) | (6.36 | ) | (6.15 | ) | ||||
| Transportation costs | (4.08 | ) | (4.26 | ) | (4.09 | ) | (3.75 | ) | (3.63 | ) | |||
| Net operating expenses – bitumen and upgrading | (21.82 | ) | (24.37 | ) | (26.07 | ) | (31.04 | ) | (33.91 | ) | |||
| Operating netback | 31.51 | 15.88 | 22.12 | 49.17 | 41.71 | ||||||||
| Syncrude ($/bbl) | |||||||||||||
| Average price realized | 66.59 | 56.91 | 60.28 | 96.65 | 100.06 | ||||||||
| Royalties | (4.32 | ) | (1.90 | ) | (1.89 | ) | (6.70 | ) | (4.55 | ) | |||
| Transportation costs | (0.54 | ) | (0.53 | ) | (0.54 | ) | (0.59 | ) | (0.62 | ) | |||
| Net operating expenses – bitumen and upgrading | (39.46 | ) | (32.05 | ) | (35.69 | ) | (43.12 | ) | (37.79 | ) | |||
| Operating netback | 22.27 | 22.43 | 22.16 | 46.24 | 57.10 | ||||||||
- (A)
- Non-GAAP financial measures. See the Operating Metrics Reconciliation and the Operating Summary Information – Non-GAAP Financial Measures sections of this Annual Report.
See accompanying footnotes and definitions to the operating summaries.
140 2017 ANNUAL REPORT Suncor Energy Inc.
FIVE-YEAR OPERATING SUMMARY (continued)
(unaudited)
| Exploration and Production | 2017 | 2016 | 2015 | 2014 | 2013 | ||||||||||
| Total Sales Volume (mboe/d) | 120.8 | 119.3 | 110.6 | 107.5 | 169.9 | ||||||||||
| Total Production (mboe/d) | 121.6 | 117.9 | 114.4 | 113.0 | 169.9 | ||||||||||
Production Volumes | |||||||||||||||
| Exploration and Production Canada | |||||||||||||||
| East Coast Canada | |||||||||||||||
| Terra Nova (mbbls/d) | 11.5 | 12.4 | 13.5 | 17.3 | 14.2 | ||||||||||
| Hibernia (mbbls/d) | 28.5 | 26.8 | 18.1 | 23.1 | 27.1 | ||||||||||
| White Rose (mbbls/d) | 11.4 | 10.9 | 12.2 | 14.6 | 14.9 | ||||||||||
| Hebron (mbbls/d) | 0.4 | — | — | — | — | ||||||||||
| North America Onshore (mboe/d) | 1.9 | 2.8 | 3.2 | 3.6 | 37.3 | ||||||||||
| 53.7 | 52.9 | 47.0 | 58.6 | 93.5 | |||||||||||
Exploration and Production International | |||||||||||||||
| Production (mboe/d) | |||||||||||||||
| North Sea | |||||||||||||||
| Buzzard | 43.8 | 46.0 | 49.8 | 47.1 | 55.8 | ||||||||||
| Golden Eagle | 19.6 | 18.6 | 14.8 | 0.6 | — | ||||||||||
| Other International | |||||||||||||||
| Libya(3) | 4.5 | 0.4 | 2.8 | 6.7 | 20.6 | ||||||||||
| 67.9 | 65.0 | 67.4 | 54.4 | 76.4 | |||||||||||
Netbacks(A) | |||||||||||||||
| East Coast Canada ($/bbl) | |||||||||||||||
| Average price realized | 71.06 | 59.31 | 65.12 | 108.21 | 114.25 | ||||||||||
| Royalties | (14.26 | ) | (10.64 | ) | (12.49 | ) | (25.97 | ) | (28.16 | ) | |||||
| Transportation costs | (1.90 | ) | (1.91 | ) | (2.18 | ) | (1.97 | ) | (1.86 | ) | |||||
| Operating costs | (11.24 | ) | (12.67 | ) | (14.15 | ) | (13.11 | ) | (11.21 | ) | |||||
| Operating netback | 43.66 | 34.09 | 36.30 | 67.16 | 73.02 | ||||||||||
| United Kingdom ($/boe) | |||||||||||||||
| Average price realized | 67.25 | 53.91 | 63.85 | 106.96 | 109.95 | ||||||||||
| Transportation costs | (1.81 | ) | (1.84 | ) | (2.41 | ) | (2.84 | ) | (2.51 | ) | |||||
| Operating costs | (4.62 | ) | (5.62 | ) | (6.29 | ) | (6.42 | ) | (5.94 | ) | |||||
| Operating netback | 60.82 | 46.45 | 55.15 | 97.70 | 101.50 | ||||||||||
- (A)
- Non-GAAP financial measures. See the Operating Metrics Reconciliation and the Operating Summary Information – Non-GAAP Financial Measures sections of this Annual Report.
See accompanying footnotes and definitions to the operating summaries.
2017 ANNUAL REPORT Suncor Energy Inc. 141
FIVE-YEAR OPERATING SUMMARY (continued)
(unaudited)
| Refining and Marketing | 2017 | 2016 | 2015 | 2014 | 2013 | ||||||||
| Refined product sales (mbbls/d) | 530.5 | 521.4 | 523.3 | 531.7 | 542.9 | ||||||||
| Crude oil processed (mbbls/d) | 441.2 | 428.6 | 432.1 | 427.5 | 431.3 | ||||||||
| Utilization of refining capacity (%)** | 96 | 93 | 94 | 93 | 94 | ||||||||
| Refining margin ($/bbl)(A) | 24.20 | 20.30 | 24.90 | 23.80 | 23.65 | ||||||||
| Refining operating expense ($/bbl)(A) | 5.05 | 5.10 | 5.10 | 6.00 | 5.30 | ||||||||
Eastern North America | |||||||||||||
| Refined product sales (mbbls/d) | |||||||||||||
| Transportation fuels | |||||||||||||
| Gasoline | 117.5 | 115.2 | 118.9 | 120.6 | 116.0 | ||||||||
| Distillate | 86.8 | 76.3 | 91.1 | 81.9 | 89.1 | ||||||||
| Total transportation fuel sales | 204.3 | 191.5 | 210.0 | 202.5 | 205.1 | ||||||||
| Petrochemicals | 12.2 | 9.2 | 10.8 | 12.1 | 12.6 | ||||||||
| Asphalt | 16.8 | 16.7 | 13.1 | 13.6 | 16.2 | ||||||||
| Other | 33.4 | 35.9 | 28.9 | 32.5 | 28.3 | ||||||||
| Total refined product sales | 266.7 | 253.3 | 262.8 | 260.7 | 262.2 | ||||||||
| Crude oil supply and refining | |||||||||||||
| Processed at refineries (mbbls/d) | 206.4 | 203.1 | 208.1 | 199.2 | 201.7 | ||||||||
| Utilization of refining capacity (%) | 93 | 92 | 94 | 90 | 91 | ||||||||
Western North America | |||||||||||||
| Refined product sales (mbbls/d) | |||||||||||||
| Transportation fuels | |||||||||||||
| Gasoline | 125.4 | 129.1 | 127.3 | 122.8 | 131.4 | ||||||||
| Distillate | 112.5 | 109.8 | 106.9 | 117.8 | 120.7 | ||||||||
| Total transportation fuel sales | 237.9 | 238.9 | 234.2 | 240.6 | 252.1 | ||||||||
| Asphalt | 12.3 | 11.8 | 11.9 | 10.6 | 11.8 | ||||||||
| Other | 13.6 | 17.4 | 14.4 | 19.8 | 16.8 | ||||||||
| Total refined product sales | 263.8 | 268.1 | 260.5 | 271.0 | 280.7 | ||||||||
| Crude oil supply and refining | |||||||||||||
| Processed at refineries (mbbls/d) | 234.8 | 225.5 | 224.0 | 228.3 | 229.6 | ||||||||
| Utilization of refining capacity (%)** | 98 | 94 | 93 | 95 | 96 | ||||||||
| Retail outlets(B) | 1 749 | 1 731 | 1 768 | 1 773 | 1 767 | ||||||||
- (A)
- Non-GAAP financial measures. See the Operating Metrics Reconciliation and the Operating Summary Information – Non-GAAP Financial Measures sections of this Annual Report.
- (B)
- The comparative period has been revised to reflect current period presentation, which includes Shell®, Exxon® and Mobil® branded sites for which Suncor has exclusive product supply agreements.
See accompanying footnotes and definitions to the operating summaries.
142 2017 ANNUAL REPORT Suncor Energy Inc.
OPERATING METRICS RECONCILIATION
(unaudited)
Oil Sands Netbacks
($ millions except per barrel amounts)
| For the quarter ended December 31, 2017 | Bitumen | SCO and Diesel | Oil Sands Operations | Syncrude | Other(4) | Oil Sands Segment | |||||||||
| Operating revenues | 710 | 2 209 | 2 919 | 1 196 | 1 | 4 116 | |||||||||
| Other (loss) income | (10 | ) | (8 | ) | (18 | ) | 79 | — | 61 | ||||||
| Purchases of crude oil and products | (179 | ) | (38 | ) | (217 | ) | (14 | ) | (2 | ) | (233 | ) | |||
| Gross realization adjustment(5) | (17 | ) | (22 | ) | (39 | ) | (79 | ) | |||||||
| Gross realizations | 504 | 2 141 | 2 645 | 1 182 | |||||||||||
| Royalties | (12 | ) | (35 | ) | (47 | ) | (128 | ) | — | (175 | ) | ||||
| Transportation | (39 | ) | (118 | ) | (157 | ) | (12 | ) | — | (169 | ) | ||||
| Transportation adjustment(6) | 3 | — | 3 | 6 | |||||||||||
| Net transportation expenses | (36 | ) | (118 | ) | (154 | ) | (6 | ) | |||||||
| Operating, selling and general (OS&G) | (119 | ) | (958 | ) | (1 077 | ) | (536 | ) | (3 | ) | (1 616 | ) | |||
| OS&G adjustment(7) | 27 | 148 | 175 | 74 | |||||||||||
| Net operating expenses | (92 | ) | (810 | ) | (902 | ) | (462 | ) | |||||||
| Gross profit | 364 | 1 178 | 1 542 | 586 | |||||||||||
| Sales volumes (mbbls) | 12 019 | 30 454 | 42 473 | 16 049 | |||||||||||
| Operating netback per barrel | 30.31 | 38.65 | 36.29 | 36.53 | |||||||||||
| For the quarter ended September 30, 2017 | Bitumen | SCO and Diesel | Oil Sands Operations | Syncrude | Other(4) | Oil Sands Segment | |||||||||
| Operating revenues | 543 | 1 787 | 2 330 | 901 | 2 | 3 233 | |||||||||
| Other (loss) income | (5 | ) | (2 | ) | (7 | ) | 1 | — | (6 | ) | |||||
| Purchases of crude oil and products | (103 | ) | (18 | ) | (121 | ) | (12 | ) | (2 | ) | (135 | ) | |||
| Gross realization adjustment(5) | (14 | ) | (13 | ) | (27 | ) | (1 | ) | |||||||
| Gross realizations | 421 | 1 754 | 2 175 | 889 | |||||||||||
| Royalties | (5 | ) | (30 | ) | (35 | ) | (47 | ) | — | (82 | ) | ||||
| Transportation | (46 | ) | (107 | ) | (153 | ) | (11 | ) | — | (164 | ) | ||||
| Transportation adjustment(6) | 4 | — | 4 | 6 | |||||||||||
| Net transportation expenses | (42 | ) | (107 | ) | (149 | ) | (5 | ) | |||||||
| OS&G | (115 | ) | (870 | ) | (985 | ) | (525 | ) | (3 | ) | (1 513 | ) | |||
| OS&G adjustment(7) | 24 | 137 | 161 | 63 | |||||||||||
| Net operating expenses | (91 | ) | (733 | ) | (824 | ) | (462 | ) | |||||||
| Gross profit | 283 | 884 | 1 167 | 375 | |||||||||||
| Sales volumes (mbbls) | 11 075 | 29 390 | 40 465 | 14 636 | |||||||||||
| Operating netback per barrel | 25.56 | 30.07 | 28.83 | 25.64 | |||||||||||
See accompanying footnotes and definitions to the operating summaries.
2017 ANNUAL REPORT Suncor Energy Inc. 143
OPERATING METRICS RECONCILIATION(continued)
(unaudited)
Oil Sands Netbacks
($ millions except per barrel amounts)
| For the quarter ended June 30, 2017 | Bitumen | SCO and Diesel | Oil Sands Operations | Syncrude | Other(4) | Oil Sands Segment | |||||||||
| Operating revenues | 377 | 1 758 | 2 135 | 361 | 2 | 2 498 | |||||||||
| Other income (loss) | 12 | (1 | ) | 11 | — | 6 | 17 | ||||||||
| Purchases of crude oil and products | (101 | ) | (21 | ) | (122 | ) | (15 | ) | (2 | ) | (139 | ) | |||
| Gross realization adjustment(5) | 6 | (18 | ) | (12 | ) | — | |||||||||
| Gross realizations | 294 | 1 718 | 2 012 | 346 | |||||||||||
| Royalties | (5 | ) | (32 | ) | (37 | ) | — | — | (37 | ) | |||||
| Transportation | (55 | ) | (100 | ) | (155 | ) | (13 | ) | — | (168 | ) | ||||
| Transportation adjustment(6) | — | — | — | 3 | |||||||||||
| Net transportation expenses | (55 | ) | (100 | ) | (155 | ) | (10 | ) | |||||||
| OS&G | (126 | ) | (900 | ) | (1 026 | ) | (551 | ) | 2 | (1 575 | ) | ||||
| OS&G adjustment(7) | 16 | 143 | 159 | 47 | |||||||||||
| Net operating expenses | (110 | ) | (757 | ) | (867 | ) | (504 | ) | |||||||
| Gross profit | 124 | 829 | 953 | (168 | ) | ||||||||||
| Sales volumes (mbbls) | 7 827 | 26 764 | 34 590 | 5 549 | |||||||||||
| Operating netback per barrel | 15.81 | 31.00 | 27.56 | (30.28 | ) | ||||||||||
| For the quarter ended March 31, 2017 | Bitumen | SCO and Diesel | Oil Sands Operations | Syncrude | Other(4) | Oil Sands Segment | |||||||||
| Operating revenues | 400 | 2 022 | 2 422 | 868 | — | 3 290 | |||||||||
| Other income | 9 | 3 | 12 | 2 | — | 14 | |||||||||
| Purchases of crude oil and products | (75 | ) | (22 | ) | (97 | ) | (19 | ) | — | (116 | ) | ||||
| Gross realization adjustment(5) | (4 | ) | (22 | ) | (26 | ) | (2 | ) | |||||||
| Gross realizations | 330 | 1 981 | 2 311 | 849 | |||||||||||
| Royalties | (5 | ) | (18 | ) | (23 | ) | (38 | ) | — | (61 | ) | ||||
| Transportation | (62 | ) | (118 | ) | (180 | ) | (9 | ) | — | (189 | ) | ||||
| Transportation adjustment(6) | — | — | — | 4 | |||||||||||
| Net transportation expenses | (62 | ) | (118 | ) | (180 | ) | (5 | ) | |||||||
| OS&G | (123 | ) | (875 | ) | (998 | ) | (583 | ) | 28 | (1 553 | ) | ||||
| OS&G adjustment(7) | 29 | 141 | 170 | 76 | |||||||||||
| Net operating expenses | (94 | ) | (734 | ) | (828 | ) | (507 | ) | |||||||
| Gross profit | 169 | 1 111 | 1 280 | 299 | |||||||||||
| Sales volumes (mbbls) | 9 444 | 29 844 | 39 288 | 12 788 | |||||||||||
| Operating netback per barrel | 17.94 | 37.22 | 32.59 | 23.33 | |||||||||||
See accompanying footnotes and definitions to the operating summaries.
144 2017 ANNUAL REPORT Suncor Energy Inc.
OPERATING METRICS RECONCILIATION(continued)
(unaudited)
Oil Sands Netbacks
($ millions except per barrel amounts)
| For the quarter ended December 31, 2016 | Bitumen | SCO and Diesel | Oil Sands Operations | Syncrude | Other(4) | Oil Sands Segment | |||||||||
| Operating revenues | 375 | 1 865 | 2 240 | 1 116 | — | 3 356 | |||||||||
| Other (loss) income | (4 | ) | (5 | ) | (9 | ) | 17 | — | 8 | ||||||
| Purchases of crude oil and products | (62 | ) | (20 | ) | (82 | ) | (19 | ) | — | (101 | ) | ||||
| Gross realization adjustment(5) | (7 | ) | (25 | ) | (32 | ) | (8 | ) | |||||||
| Gross realizations | 302 | 1 815 | 2 117 | 1 106 | |||||||||||
| Royalties | (3 | ) | 80 | 77 | (81 | ) | — | (4 | ) | ||||||
| Transportation | (52 | ) | (116 | ) | (168 | ) | (9 | ) | — | (177 | ) | ||||
| Transportation adjustment(6) | — | — | — | 3 | |||||||||||
| Net transportation expenses | (52 | ) | (116 | ) | (168 | ) | (6 | ) | |||||||
| OS&G | (121 | ) | (935 | ) | (1 056 | ) | (577 | ) | (1 | ) | (1 634 | ) | |||
| OS&G adjustment(7) | 25 | 152 | 177 | 75 | |||||||||||
| Net operating expenses | (96 | ) | (783 | ) | (879 | ) | (502 | ) | |||||||
| Gross profit | 151 | 996 | 1 147 | 517 | |||||||||||
| Sales volumes (mbbls) | 9 525 | 29 176 | 38 701 | 17 205 | |||||||||||
| Operating netback per barrel | 15.84 | 34.17 | 29.66 | 30.05 | |||||||||||
| For the quarter ended September 30, 2016 | Bitumen | SCO and Diesel | Oil Sands Operations | Syncrude | Other(1) | Oil Sands Segment | |||||||||
| Operating revenues | 406 | 1 562 | 1 968 | 999 | — | 2 967 | |||||||||
| Other income | 3 | — | 3 | — | — | 3 | |||||||||
| Purchases of crude oil and products | (95 | ) | (24 | ) | (119 | ) | (16 | ) | — | (135 | ) | ||||
| Gross realization adjustment(5) | (11 | ) | (19 | ) | (30 | ) | 8 | ||||||||
| Gross realizations | 303 | 1 519 | 1 822 | 991 | |||||||||||
| Royalties | (5 | ) | (11 | ) | (16 | ) | (4 | ) | — | (20 | ) | ||||
| Transportation | (55 | ) | (90 | ) | (145 | ) | (14 | ) | — | (159 | ) | ||||
| Transportation adjustment(6) | — | 11 | 11 | 9 | |||||||||||
| Net transportation expenses | (55 | ) | (79 | ) | (134 | ) | (5 | ) | |||||||
| OS&G | (145 | ) | (803 | ) | (948 | ) | (474 | ) | 2 | (1 420 | ) | ||||
| OS&G adjustment(7) | 24 | 132 | 156 | 50 | |||||||||||
| Net operating expenses | (121 | ) | (671 | ) | (792 | ) | (424 | ) | |||||||
| Gross profit | 122 | 758 | 880 | 558 | |||||||||||
| Sales volumes (mbbls) | 11 368 | 26 786 | 38 154 | 16 906 | |||||||||||
| Operating netback per barrel | 10.75 | 28.28 | 23.06 | 33.02 | |||||||||||
See accompanying footnotes and definitions to the operating summaries.
2017 ANNUAL REPORT Suncor Energy Inc. 145
OPERATING METRICS RECONCILIATION(continued)
(unaudited)
Oil Sands Netbacks
($ millions except per barrel amounts)
| For the quarter ended June 30, 2016 | Bitumen | SCO and Diesel | Oil Sands Operations | Syncrude | Other(4) | Oil Sands Segment | |||||||||
| Operating revenues | 427 | 523 | 950 | 210 | — | 1 160 | |||||||||
| Other (loss) income | (19 | ) | 1 | (18 | ) | — | — | (18 | ) | ||||||
| Purchases of crude oil and products | (164 | ) | (2 | ) | (166 | ) | (6 | ) | — | (172 | ) | ||||
| Gross realization adjustment(5) | (8 | ) | (2 | ) | (10 | ) | (12 | ) | |||||||
| Gross realizations | 236 | 520 | 756 | 192 | |||||||||||
| Royalties | (2 | ) | (4 | ) | (6 | ) | (3 | ) | — | (9 | ) | ||||
| Transportation | (56 | ) | (64 | ) | (120 | ) | (26 | ) | — | (146 | ) | ||||
| Transportation adjustment(6) | — | 14 | 14 | 21 | |||||||||||
| Net transportation expenses | (56 | ) | (50 | ) | (106 | ) | (5 | ) | |||||||
| OS&G | (175 | ) | (753 | ) | (928 | ) | (364 | ) | 4 | (1 288 | ) | ||||
| OS&G adjustment(7) | 30 | 131 | 161 | 32 | |||||||||||
| Net operating expenses | (145 | ) | (622 | ) | (767 | ) | (332 | ) | |||||||
| Gross profit (loss) | 33 | (156 | ) | (123 | ) | (148 | ) | ||||||||
| Sales volumes (mbbls) | 9 839 | 9 891 | 19 730 | 3 235 | |||||||||||
| Operating netback per barrel | 3.32 | (15.74 | ) | (6.24 | ) | (45.69 | ) | ||||||||
| For the quarter ended March 31, 2016 | Bitumen | SCO and Diesel | Oil Sands Operations | Syncrude | Other(4) | Oil Sands Segment | |||||||||
| Operating revenues | 226 | 1 331 | 1 557 | 482 | — | 2 039 | |||||||||
| Other income | 26 | 6 | 32 | — | 1 | 33 | |||||||||
| Purchases of crude oil and products | (110 | ) | (14 | ) | (124 | ) | (16 | ) | — | (140 | ) | ||||
| Gross realization adjustment(5) | 4 | (24 | ) | (20 | ) | (5 | ) | ||||||||
| Gross realizations | 146 | 1 299 | 1 445 | 461 | |||||||||||
| Royalties | — | (17 | ) | (17 | ) | (2 | ) | — | (19 | ) | |||||
| Transportation | (68 | ) | (115 | ) | (183 | ) | (1 | ) | — | (184 | ) | ||||
| Transportation adjustment(6) | — | — | — | (8 | ) | ||||||||||
| Net transportation expenses | (68 | ) | (115 | ) | (183 | ) | (9 | ) | |||||||
| OS&G | (153 | ) | (978 | ) | (1 131 | ) | (334 | ) | 30 | (1 435 | ) | ||||
| OS&G adjustment(7) | 33 | 153 | 186 | 50 | |||||||||||
| Net operating expenses | (120 | ) | (825 | ) | (945 | ) | (284 | ) | |||||||
| Gross (loss) profit | (42 | ) | 342 | 300 | 166 | ||||||||||
| Sales volumes (mbbls) | 12 241 | 29 999 | 42 240 | 10 268 | |||||||||||
| Operating netback per barrel | (3.38 | ) | 11.38 | 7.10 | 16.14 | ||||||||||
See accompanying footnotes and definitions to the operating summaries.
146 2017 ANNUAL REPORT Suncor Energy Inc.
OPERATING METRICS RECONCILIATION(continued)
(unaudited)
Oil Sands Netbacks
($ millions except per barrel amounts)
| For the year ended December 31, 2017 | Bitumen | SCO and Diesel | Oil Sands Operations | Syncrude | Other(4) | Oil Sands Segment | |||||||||
| Operating revenues | 2 031 | 7 777 | 9 808 | 3 325 | 4 | 13 137 | |||||||||
| Other income (loss) | 9 | (9 | ) | — | 82 | 4 | 86 | ||||||||
| Purchases of crude oil and products | (458 | ) | (99 | ) | (557 | ) | (61 | ) | (5 | ) | (623 | ) | |||
| Gross realization adjustment(5) | (31 | ) | (76 | ) | (107 | ) | (82 | ) | |||||||
| Gross realizations | 1 551 | 7 593 | 9 144 | 3 264 | |||||||||||
| Royalties | (28 | ) | (115 | ) | (143 | ) | (212 | ) | — | (355 | ) | ||||
| Transportation | (202 | ) | (443 | ) | (645 | ) | (45 | ) | — | (690 | ) | ||||
| Transportation adjustment(6) | 7 | — | 7 | 18 | |||||||||||
| Net transportation expenses | (195 | ) | (443 | ) | (638 | ) | (27 | ) | |||||||
| OS&G | (484 | ) | (3 604 | ) | (4 088 | ) | (2 196 | ) | 27 | (6 257 | ) | ||||
| OS&G adjustment(7) | 96 | 569 | 665 | 262 | |||||||||||
| Net operating expenses | (388 | ) | (3 035 | ) | (3 423 | ) | (1 934 | ) | |||||||
| Gross profit | 940 | 4 000 | 4 940 | 1 091 | |||||||||||
| Sales volumes (mbbls) | 40 365 | 116 451 | 156 816 | 49 022 | |||||||||||
| Operating netback per barrel | 23.30 | 34.36 | 31.51 | 22.27 | |||||||||||
| For the year ended December 31, 2016 | Bitumen | SCO and Diesel | Oil Sands Operations | Syncrude | Other(4) | Oil Sands Segment | |||||||||
| Operating revenues | 1 434 | 5 281 | 6 715 | 2 807 | — | 9 522 | |||||||||
| Other income | 6 | 2 | 8 | 17 | 1 | 26 | |||||||||
| Purchases of crude oil and products | (408 | ) | (83 | ) | (491 | ) | (57 | ) | — | (548 | ) | ||||
| Gross realization adjustment(5) | (22 | ) | (70 | ) | (92 | ) | (57 | ) | |||||||
| Gross realizations | 1 010 | 5 130 | 6 140 | 2 710 | |||||||||||
| Royalties | (10 | ) | 48 | 38 | (90 | ) | — | (52 | ) | ||||||
| Transportation | (231 | ) | (385 | ) | (616 | ) | (50 | ) | — | (666 | ) | ||||
| Transportation adjustment(6) | — | 25 | 25 | 25 | |||||||||||
| Net transportation expenses | (231 | ) | (360 | ) | (591 | ) | (25 | ) | |||||||
| OS&G | (595 | ) | (3 468 | ) | (4 063 | ) | (1 749 | ) | 35 | (5 777 | ) | ||||
| OS&G adjustment(7) | 112 | 568 | 680 | 223 | |||||||||||
| Net operating expenses | (483 | ) | (2 900 | ) | (3 383 | ) | (1 526 | ) | |||||||
| Gross profit | 286 | 1 918 | 2 204 | 1 069 | |||||||||||
| Sales volumes (mbbls) | 42 973 | 95 852 | 138 825 | 47 614 | |||||||||||
| Operating netback per barrel | 6.64 | 20.02 | 15.88 | 22.43 | |||||||||||
See accompanying footnotes and definitions to the operating summaries.
2017 ANNUAL REPORT Suncor Energy Inc. 147
OPERATING METRICS RECONCILIATION(continued)
(unaudited)
Oil Sands Netbacks
($ millions except per barrel amounts)
| For the year ended December 31, 2015 | Bitumen | SCO and Diesel | Oil Sands Operations | Syncrude | Other(4) | Oil Sands Segment | |||||||||
| Operating revenues | 1 480 | 7 179 | 8 659 | 673 | — | 9 332 | |||||||||
| Other income | 49 | 96 | 145 | — | 1 | 146 | |||||||||
| Purchases of crude oil and products | (228 | ) | (75 | ) | (303 | ) | (16 | ) | — | (319 | ) | ||||
| Gross realization adjustment(5) | (36 | ) | (197 | ) | (233 | ) | 5 | ||||||||
| Gross realizations | 1 265 | 7 003 | 8 268 | 662 | |||||||||||
| Royalties | (16 | ) | (77 | ) | (93 | ) | (21 | ) | — | (114 | ) | ||||
| Transportation | (246 | ) | (393 | ) | (639 | ) | (6 | ) | — | (645 | ) | ||||
| OS&G | (577 | ) | (4 195 | ) | (4 772 | ) | (471 | ) | 23 | (5 220 | ) | ||||
| OS&G adjustment(7) | 115 | 580 | 695 | 77 | |||||||||||
| Net operating expenses | (462 | ) | (3 615 | ) | (4 077 | ) | (394 | ) | |||||||
| Gross profit | 541 | 2 918 | 3 459 | 241 | |||||||||||
| Sales volumes (mbbls) | 39 297 | 117 094 | 156 391 | 10 875 | |||||||||||
| Operating netback per barrel | 13.75 | 24.93 | 22.12 | 22.16 | |||||||||||
| For the year ended December 31, 2014 | Bitumen | SCO and Diesel | Oil Sands Operations | Syncrude | Other(4) | Oil Sands Segment | |||||||||
| Operating revenues | 2 753 | 10 686 | 13 439 | 1 122 | — | 14 561 | |||||||||
| Other income | 92 | 23 | 115 | — | — | 115 | |||||||||
| Purchases of crude oil and products | (334 | ) | (94 | ) | (428 | ) | (29 | ) | — | (457 | ) | ||||
| Gross realization adjustment(5) | (76 | ) | (173 | ) | (249 | ) | — | ||||||||
| Gross realizations | 2 435 | 10 442 | 12 877 | 1 093 | |||||||||||
| Royalties | (167 | ) | (739 | ) | (906 | ) | (76 | ) | — | (982 | ) | ||||
| Transportation | (195 | ) | (339 | ) | (534 | ) | (7 | ) | — | (541 | ) | ||||
| OS&G | (688 | ) | (4 626 | ) | (5 314 | ) | (564 | ) | (62 | ) | (5 940 | ) | |||
| OS&G adjustment(7) | 122 | 766 | 888 | 77 | |||||||||||
| Net operating expenses | (566 | ) | (3 860 | ) | (4 426 | ) | (487 | ) | |||||||
| Gross profit | 1 507 | 5 504 | 7 011 | 523 | |||||||||||
| Sales volumes (mbbls) | 36 994 | 105 588 | 142 582 | 11 302 | |||||||||||
| Operating netback per barrel | 40.74 | 52.13 | 49.17 | 46.24 | |||||||||||
See accompanying footnotes and definitions to the operating summaries.
148 2017 ANNUAL REPORT Suncor Energy Inc.
OPERATING METRICS RECONCILIATION(continued)
(unaudited)
Oil Sands Netbacks
($ millions except per barrel amounts)
| For the year ended December 31, 2013 | Bitumen | SCO and Diesel | Oil Sands Operations | Syncrude | Other(4) | Oil Sands Segment(8) | |||||||||
| (restated) | |||||||||||||||
| Operating revenues | 1 785 | 10 115 | 11 900 | 1 189 | — | 13 089 | |||||||||
| Other income | — | 52 | 52 | 12 | — | 64 | |||||||||
| Purchases of crude oil and products | (309 | ) | (202 | ) | (511 | ) | (18 | ) | — | (529 | ) | ||||
| Gross realization adjustment(5) | — | (287 | ) | (287 | ) | (12 | ) | ||||||||
| Gross realizations | 1 476 | 9 678 | 11 154 | 1 171 | |||||||||||
| Royalties | (111 | ) | (692 | ) | (803 | ) | (53 | ) | (3 | ) | (859 | ) | |||
| Transportation | (110 | ) | (365 | ) | (475 | ) | (7 | ) | — | (482 | ) | ||||
| OS&G | (511 | ) | (4 700 | ) | (5 211 | ) | (517 | ) | (40 | ) | (5 768 | ) | |||
| OS&G adjustment(7) | 55 | 727 | 782 | 74 | |||||||||||
| Net operating expenses | (456 | ) | (3 973 | ) | (4 429 | ) | (443 | ) | |||||||
| Gross profit | 799 | 4 648 | 5 447 | 668 | |||||||||||
| Sales volumes (mbbls) | 27 704 | 102 924 | 130 628 | 11 695 | |||||||||||
| Operating netback per barrel | 28.84 | 45.17 | 41.71 | 57.10 | |||||||||||
Syncrude Cash Operating Costs
($ millions except per barrel amounts)
| For the Quarter Ended | ||||||||||||||||||
| Mar 31 2017 | June 30 2017 | Sept 30 2017 | Dec 31 2017 | Mar 31 2016 | June 30 2016 | Sept 30 2016 | Dec 31 2016 | |||||||||||
| Syncrude OS&G | 583 | 551 | 525 | 536 | 334 | 364 | 474 | 577 | ||||||||||
| Non-production costs(9) | (6 | ) | (8 | ) | (13 | ) | (10 | ) | (12 | ) | 3 | (7 | ) | (17 | ) | |||
| Syncrude cash operating costs | 577 | 543 | 512 | 526 | 322 | 367 | 467 | 560 | ||||||||||
| Syncrude sales volumes (mbbls) | 12 788 | 5 549 | 14 636 | 16 049 | 10 268 | 3 235 | 16 906 | 17 205 | ||||||||||
| Syncrude cash operating costs ($/bbl) | 45.15 | 97.80 | 35.00 | 32.80 | 31.35 | 113.55 | 27.65 | 32.55 | ||||||||||
| For the Year Ended | ||||||||||||||||||
| 2017 | 2016 | 2015 | 2014 | 2013 | ||||||||||||||
| Syncrude OS&G | 2 195 | 1 749 | 471 | 564 | 517 | |||||||||||||
| Non-production costs(9) | (37 | ) | (31 | ) | (14 | ) | (9 | ) | (12 | ) | ||||||||
| Syncrude cash operating costs | 2 158 | 1 718 | 457 | 555 | 505 | |||||||||||||
| Syncrude sales volumes (mbbls) | 49 022 | 47 614 | 10 876 | 11 302 | 11 695 | |||||||||||||
| Syncrude cash operating costs ($/bbl) | 44.05 | 35.95 | 42.00 | 49.15 | 43.20 | |||||||||||||
See accompanying footnotes and definitions to the operating summaries.
2017 ANNUAL REPORT Suncor Energy Inc. 149
OPERATING METRICS RECONCILIATION(continued)
(unaudited)
Exploration and Production Netbacks
($ millions except per barrel amounts)
| For the quarter ended December 31, 2017 | For the quarter ended December 31, 2016 | |||||||||||||||||
| United Kingdom | East Coast Canada | Other(10) | E&P Segment | United Kingdom | East Coast Canada | Other(10) | E&P Segment | |||||||||||
| Operating revenues | 383 | 328 | 238 | 949 | 325 | 374 | 43 | 742 | ||||||||||
| Royalties | — | (53 | ) | (147 | ) | (200 | ) | — | (83 | ) | (12 | ) | (95 | ) | ||||
| Transportation | (9 | ) | (9 | ) | (2 | ) | (20 | ) | (9 | ) | (10 | ) | (2 | ) | (21 | ) | ||
| OS&G | (36 | ) | (55 | ) | (10 | ) | (101 | ) | (38 | ) | (63 | ) | (14 | ) | (115 | ) | ||
| Non-production costs(11) | 7 | 10 | 3 | 11 | ||||||||||||||
| Gross realizations | 345 | 221 | 281 | 229 | ||||||||||||||
| Sales volumes (mboe) | 5 011 | 4 023 | 5 193 | 5 495 | ||||||||||||||
| Operating netback per barrel | 68.77 | 54.85 | 54.01 | 41.75 | ||||||||||||||
| For the quarter ended September 30, 2017 | For the quarter ended September 30, 2016 | |||||||||||||||||
| United Kingdom | East Coast Canada | Other(10) | E&P Segment | United Kingdom | East Coast Canada | Other(10) | E&P Segment | |||||||||||
| Operating revenues | 375 | 263 | 128 | 766 | 300 | 246 | 1 | 547 | ||||||||||
| Royalties | — | (51 | ) | (81 | ) | (132 | ) | — | (44 | ) | — | (44 | ) | |||||
| Transportation | (11 | ) | (8 | ) | (2 | ) | (21 | ) | (9 | ) | (9 | ) | (2 | ) | (20 | ) | ||
| OS&G | (31 | ) | (68 | ) | (10 | ) | (109 | ) | (33 | ) | (62 | ) | (12 | ) | (107 | ) | ||
| Non-production costs(11) | 5 | 10 | 4 | 8 | ||||||||||||||
| Gross realizations | 338 | 146 | 262 | 139 | ||||||||||||||
| Sales volumes (mboe) | 5 963 | 3 906 | 5 247 | 3 987 | ||||||||||||||
| Operating netback per barrel | 56.71 | 37.37 | 49.98 | 34.80 | ||||||||||||||
| For the quarter ended June 30, 2017 | For the quarter ended June 30, 2016 | |||||||||||||||||
| United Kingdom | East Coast Canada | Other(10) | E&P Segment | United Kingdom | East Coast Canada | Other(10) | E&P Segment | |||||||||||
| Operating revenues | 378 | 354 | 120 | 852 | 370 | 253 | 1 | 624 | ||||||||||
| Royalties | — | (75 | ) | (46 | ) | (121 | ) | — | (45 | ) | — | (45 | ) | |||||
| Transportation | (11 | ) | (9 | ) | (2 | ) | (22 | ) | (13 | ) | (8 | ) | (1 | ) | (22 | ) | ||
| OS&G | (31 | ) | (65 | ) | (15 | ) | (111 | ) | (37 | ) | (68 | ) | (11 | ) | (116 | ) | ||
| Non-production costs(11) | 4 | 9 | 5 | 8 | ||||||||||||||
| Gross realizations | 340 | 214 | 325 | 140 | ||||||||||||||
| Sales volumes (mboe) | 5 954 | 5 345 | 6 661 | 4 052 | ||||||||||||||
| Operating netback per barrel | 57.01 | 40.03 | 48.75 | 34.52 | ||||||||||||||
See accompanying footnotes and definitions to the operating summaries.
150 2017 ANNUAL REPORT Suncor Energy Inc.
OPERATING METRICS RECONCILIATION(continued)
(unaudited)
Exploration and Production Netbacks
($ millions except per barrel amounts)
| For the quarter ended March 31, 2017 | For the quarter ended March 31, 2016 | |||||||||||||||||
| United Kingdom | East Coast Canada | Other(10) | E&P Segment | United Kingdom | East Coast Canada | Other(10) | E&P Segment | |||||||||||
| Operating revenues | 421 | 379 | 120 | 920 | 281 | 246 | 4 | 531 | ||||||||||
| Royalties | — | (87 | ) | (36 | ) | (123 | ) | — | (29 | ) | — | (29 | ) | |||||
| Transportation | (11 | ) | (9 | ) | (3 | ) | (23 | ) | (13 | ) | (9 | ) | (1 | ) | (23 | ) | ||
| OS&G | (28 | ) | (60 | ) | (13 | ) | (101 | ) | (43 | ) | (85 | ) | (17 | ) | (145 | ) | ||
| Non-production costs(11) | 4 | 10 | 6 | 12 | ||||||||||||||
| Gross realizations | 386 | 233 | 231 | 135 | ||||||||||||||
| Sales volumes (mboe) | 6 228 | 5 432 | 6 552 | 5 315 | ||||||||||||||
| Operating netback per barrel | 61.99 | 42.81 | 35.30 | 25.26 | ||||||||||||||
| For the year ended December 31, 2017 | United Kingdom | East Coast Canada | Other(10) | E&P Segment | ||||||
| Operating revenues | 1 557 | 1 323 | 607 | 3 487 | ||||||
| Royalties | — | (266 | ) | (310 | ) | (576 | ) | |||
| Transportation | (42 | ) | (35 | ) | (9 | ) | (86 | ) | ||
| OS&G | (127 | ) | (248 | ) | (47 | ) | (422 | ) | ||
| Non-production costs(11) | 20 | 39 | ||||||||
| Gross realizations | 1 408 | 813 | ||||||||
| Sales volumes (mboe) | 23 157 | 18 623 | ||||||||
| Operating netback per barrel | 60.82 | 43.66 | ||||||||
| For the year ended December 31, 2016 | United Kingdom | East Coast Canada | Other(10) | E&P Segment | ||||||
| Operating revenues | 1 276 | 1 119 | 49 | 2 444 | ||||||
| Royalties | — | (201 | ) | (12 | ) | (213 | ) | |||
| Transportation | (44 | ) | (36 | ) | (6 | ) | (86 | ) | ||
| OS&G | (151 | ) | (278 | ) | (54 | ) | (483 | ) | ||
| Non-production costs(11) | 18 | 39 | ||||||||
| Gross realizations | 1 099 | 643 | ||||||||
| Sales volumes (mboe) | 23 653 | 18 849 | ||||||||
| Operating netback per barrel | 46.45 | 34.09 | ||||||||
See accompanying footnotes and definitions to the operating summaries.
2017 ANNUAL REPORT Suncor Energy Inc. 151
OPERATING METRICS RECONCILIATION(continued)
(unaudited)
Exploration and Production Netbacks
($ millions except per barrel amounts)
| For the year ended December 31, 2015 | United Kingdom | East Coast Canada | Other(10) | E&P Segment | ||||||
| Operating revenues | 1 505 | 1 019 | 88 | 2 612 | ||||||
| Royalties | — | (195 | ) | (72 | ) | (267 | ) | |||
| Transportation | (57 | ) | (34 | ) | (7 | ) | (98 | ) | ||
| OS&G | (175 | ) | (258 | ) | (69 | ) | (502 | ) | ||
| Non-production costs(11) | 27 | 36 | ||||||||
| Gross realizations | 1 300 | 568 | ||||||||
| Sales volumes (mboe) | 23 580 | 15 643 | ||||||||
| Operating netback per barrel | 55.15 | 36.30 | ||||||||
| For the year ended December 31, 2014 | United Kingdom | East Coast Canada | Other(10) | E&P Segment | ||||||
| Operating revenues | 1 814 | 2 151 | 750 | 4 715 | ||||||
| Royalties | — | (516 | ) | (156 | ) | (672 | ) | |||
| Transportation | (48 | ) | (39 | ) | (3 | ) | (90 | ) | ||
| OS&G | (119 | ) | (297 | ) | (142 | ) | (558 | ) | ||
| Non-production costs(11) | 10 | 36 | ||||||||
| Gross realizations | 1 657 | 1 335 | ||||||||
| Sales volumes (mboe) | 16 954 | 19 875 | ||||||||
| Operating netback per barrel | 97.70 | 67.16 | ||||||||
| For the year ended December 31, 2013 | United Kingdom | East Coast Canada | Other(10) | E&P Segment | ||||||
| Operating revenues | 2 240 | 2 343 | 1 780 | 6 363 | ||||||
| Royalties | — | (578 | ) | (568 | ) | (1 146 | ) | |||
| Transportation | (51 | ) | (38 | ) | (38 | ) | (127 | ) | ||
| OS&G | (137 | ) | (269 | ) | (270 | ) | (676 | ) | ||
| Non-production costs(11) | 16 | 39 | ||||||||
| Gross realizations | 2 068 | 1 497 | ||||||||
| Sales volumes (mboe) | 20 379 | 20 506 | ||||||||
| Operating netback per barrel | 101.50 | 73.02 | ||||||||
See accompanying footnotes and definitions to the operating summaries.
152 2017 ANNUAL REPORT Suncor Energy Inc.
OPERATING METRICS RECONCILIATION(continued)
(unaudited)
Refining and Marketing
($ millions except per barrel amounts)
| For the quarter ended | ||||||||||||||||||
| Mar 31 2017 | June 30 2017 | Sept 30 2017 | Dec 31 2017 | Mar 31 2016 | June 30 2016 | Sept 30 2016 | Dec 31 2016 | |||||||||||
Gross margin(12) | 1 401 | 1 160 | 1 520 | 1 871 | 1 135 | 1 721 | 1 377 | 1 580 | ||||||||||
| Other income (loss) | 19 | 19 | 48 | (13 | ) | 11 | 2 | 13 | (10 | ) | ||||||||
| Non-refining margin(13) | (495 | ) | (375 | ) | (463 | ) | (467 | ) | (355 | ) | (884 | ) | (572 | ) | (592 | ) | ||
| Refining margin(A) | 925 | 804 | 1 105 | 1 391 | 791 | 839 | 818 | 978 | ||||||||||
| Refinery production (mbbls)(14)(A) | 41 540 | 42 629 | 46 491 | 43 801 | 41 415 | 38 754 | 46 119 | 42 510 | ||||||||||
| Refining margin($/bbl) | 22.30 | 18.85 | 23.80 | 31.75 | 19.10 | 21.65 | 17.75 | 23.00 | ||||||||||
OS&G | 517 | 464 | 481 | 545 | 542 | 526 | 549 | 586 | ||||||||||
| Non-refining costs(15) | (288 | ) | (249 | ) | (272 | ) | (316 | ) | (332 | ) | (317 | ) | (339 | ) | (355 | ) | ||
| Net operating expenses | 229 | 215 | 209 | 229 | 210 | 209 | 210 | 231 | ||||||||||
| Refinery production (mbbls)(14) | 41 540 | 42 629 | 46 491 | 43 801 | 41 415 | 38 754 | 46 119 | 42 510 | ||||||||||
| Refining operating expense($/bbl) | 5.50 | 5.05 | 4.50 | 5.25 | 5.10 | 5.40 | 4.55 | 5.45 | ||||||||||
| For the year ended | ||||||||||||
| 2017 | 2016 | 2015 | 2014 | 2013 | ||||||||
| (Restated) | (Restated) | (Restated) | (Restated) | |||||||||
Gross margin(12) | 5 952 | 5 813 | 6 311 | 5 663 | 5 945 | |||||||
| Other income | 73 | 16 | 86 | 184 | 67 | |||||||
| Non-refining margin(13) | (1 800 | ) | (2 403 | ) | (2 123 | ) | (1 835 | ) | (1 996 | ) | ||
| Refining margin | 4 225 | 3 426 | 4 274 | 4 012 | 4 016 | |||||||
| Refinery production (mbbls)(14) | 174 461 | 168 798 | 171 581 | 168 536 | 169 885 | |||||||
| Refining margin ($/bbl) | 24.20 | 20.30 | 24.90 | 23.80 | 23.65 | |||||||
OS&G | 2 007 | 2 203 | 2 219 | 2 495 | 2 344 | |||||||
| Non-refining costs(15) | (1 125 | ) | (1 343 | ) | (1 338 | ) | (1 490 | ) | (1 443 | ) | ||
| Refining operating expense | 882 | 860 | 881 | 1 005 | 901 | |||||||
| Refinery production (mbbls)(14) | 174 461 | 168 798 | 171 581 | 168 536 | 169 885 | |||||||
| Refining operating expense ($/bbl) | 5.05 | 5.10 | 5.10 | 6.00 | 5.30 | |||||||
See accompanying footnotes and definitions to the operating summaries.
2017 ANNUAL REPORT Suncor Energy Inc. 153
Non-GAAP Financial Measures
Certain financial measures in this Supplemental Financial and Operating Information – namely operating earnings (loss), funds from (used in) operations (previously referred to as cash flow from (used in) operations), return on capital employed (ROCE), Oil Sands operations cash operating costs (previously referred to as Oil Sands cash operating costs), Syncrude cash operating costs, refining margin, refining operating expense and netbacks – are not prescribed by GAAP. Suncor includes these financial measures because investors may use this information to analyze business performance, leverage and liquidity. These non-GAAP financial measures do not have any standardized meaning and, therefore, are unlikely to be comparable to similar measures presented by other companies. This information should not be considered in isolation or as a substitute for measures of performance prepared in accordance with GAAP.
Operating earnings (loss) and Oil Sands operations cash operating costs for each quarter in 2017 and 2016 are defined in the Non-GAAP Financial Measures Advisory section and reconciled to GAAP measures in the Consolidated Financial Information and Segment Results and Analysis sections in each respective quarterly Report to Shareholders issued by Suncor in respect of the relevant quarter (Quarterly Reports). Funds from (used in) operations and ROCE for each quarter in 2017 and 2016 are defined and reconciled to GAAP measures in the Non-GAAP Financial Measures Advisory section of each respective Quarterly Report. Operating earnings (loss), funds from (used in) operations, ROCE and Oil Sands operations cash operating costs for the years ended December 31, 2014 and 2013 are defined and reconciled in Suncor's Management's Discussion and Analysis for the year ended December 31, 2015 and for the years ended December 31, 2017, 2016 and 2015 are defined and reconciled in Suncor's Management's Discussion and Analysis for the year ended December 31, 2017, which is contained in this Annual Report (the 2017 MD&A). Refining margin and refining operating expense for each quarter in 2017 and 2016 and for the years ended December 31, 2017, 2016, 2015, 2014 and 2013 are defined in the 2017 MD&A and reconciled to GAAP measures in the Operating Metrics Reconciliation section of this Supplemental Financial and Operating Information. Netbacks for each quarter in 2017 and 2016 and for the years ended December 31, 2017, 2016, 2015, 2014 and 2013 are defined below and are reconciled to GAAP measures in the Operating Metrics Reconciliation section of this Supplemental Financial and Operating Information. Syncrude cash operating costs for each quarter in 2017 and 2016 and for the years ended December 31, 2017, 2016, 2015, 2014 and 2013 are defined in the 2017 MD&A and reconciled to GAAP measures in the Operating Metrics Reconciliation section of this Supplemental Financial and Operating Information. The remainder of the non-GAAP financial measures not otherwise mentioned in this paragraph are defined and reconciled in the 2017 MD&A.
Oil Sands Netbacks
Oil Sands operating netbacks are a non-GAAP measure, presented on a crude product and sales barrel basis, and are derived from the Oil Sands segmented statement of net earnings (loss), after adjusting for items not directly attributable to the revenues and costs associated with production and delivery. Management uses Oil Sands operating netbacks to measure crude product profitability on a sales barrel basis and they may be useful to investors for the same reason.
Exploration and Production (E&P) Netbacks
E&P netbacks are a non-GAAP measure, presented on an asset location and sales barrel basis, and are derived from the E&P segmented statement of net earnings (loss), after adjusting for items not directly attributable to the costs associated with production and delivery. Management uses E&P operating netbacks to measure asset profitability by location on a sales barrel basis and they may be useful to investors for the same reason.
Definitions
- (1)
- Cash operating costs – Include cash costs that are defined as operating, selling and general expenses (excluding inventory changes and non-production costs), and are net of operating revenues associated with excess power from cogeneration units. Oil Sands operations cash operating costs are presented on a production basis by adjusting for inventory impacts, while Syncrude production volumes are equal to sales volumes.
- (2)
- Syncrude's capacity to upgrade bitumen to an intermediary sour SCO is 350,000 bbls/d.
- (3)
- Effective 2016, Libyan production volumes reflect the company's entitlement share of production sold in the period.
- (4)
- Reflects non-producing Oil Sands assets and enterprise shared service allocations and recoveries.
- (5)
- Reflects the impact of items not directly attributed to revenues received from the sale of proprietary crude and net non-proprietary activity at its deemed point of sale.
- (6)
- Reflects adjustments for expenses or credits not directly related to the transportation of the crude product to its deemed point of sale. For Oil Sands operations bitumen and SCO, the point of sale is at the final customer, whereas Syncrude sweet SCO is deemed to be sold into the sweet synthetic crude oil pool in Edmonton, Alberta. Expenses or credits adjusted out of the netback transportation line include, but are not limited to, costs associated with the sale of non-proprietary product on pipelines with unutilized capacity under minimum volume commitment agreements.
- (7)
- Reflects adjustments for general and administrative costs not directly attributed to the production of each crude product type, as well as the revenues associated with excess power from cogeneration units.
- (8)
- Restated to reflect natural gas purchases for hydrogen being reclassified from operating, selling and general expenses to purchases of crude oil and products, which is consistent with the presentation for 2014, 2015, 2016 and 2017.
- (9)
- Reflects adjustments for operating, selling and general expenses not directly attributable to Syncrude production.
- (10)
- Reflects other E&P assets, such as North America Onshore, Norway and Libya for which netbacks are not provided.
- (11)
- Reflects adjustments for general and administrative costs not directly attributed to production.
- (12)
- Operating revenues less purchases of crude oil and products.
- (13)
- Reflects the gross margin associated with the company's supply, marketing and ethanol businesses, as well as a previously owned lubricants business.
- (14)
- Refinery production is the output of the refining process, and differs from crude oil processed as a result of volumetric adjustments for non-crude feedstock, volumetric gain associated with the refining process, and changes in unfinished product inventories.
- (15)
- Reflects operating, selling and general costs associated with the company's supply, marketing, lubricants (previously owned) and ethanol businesses, as well as certain general and administrative costs not directly attributable to refinery production.
154 2017 ANNUAL REPORT Suncor Energy Inc.
Explanatory Notes
- *
- Users are cautioned that the Syncrude cash operating costs per barrel measure may not be fully comparable to similar information calculated by other entities (including Suncor's Oil Sands operations cash operating costs per barrel, which excludes Syncrude) due to differing operations of each company as well as their respective accounting policy choices.
- **
- As of January 1, 2014, the Edmonton refinery's nameplate capacity increased to 142 mbbls/d. Effective January 1, 2013, the Edmonton refinery's nameplate capacity increased to 140 mbbls/d. Effective January 1, 2012, the Montreal and the Commerce City refineries' nameplate capacities increased to 137 mbbls/d and 98 mbbls/d, respectively. Comparative utilization percentages have not been restated.
Abbreviations
| bbl | – barrel |
| bbls/d | – barrels of oil per day |
| mbbls | – thousands of barrels |
| mbbls/d | – thousands of barrels per day |
| boe | – barrels of oil equivalent |
| boe/d | – barrels of oil equivalent per day |
| mboe | – thousands of barrels of oil equivalent |
| mboe/d | – thousands of barrels of oil equivalent per day |
| m3/d | – cubic metres per day |
| SCO | – synthetic crude oil |
Metric Conversion
Crude oil, refined products, etc. 1m3 (cubic metre) = approx. 6.29 barrels
2017 ANNUAL REPORT Suncor Energy Inc. 155
SHARE TRADING INFORMATION
(unaudited)
Common shares are listed on the Toronto Stock Exchange and New York Stock Exchange under the symbol SU.
| For the Quarter Ended | For the Quarter Ended | |||||||||||||||||
| Mar 31 2017 | June 30 2017 | Sept 30 2017 | Dec 31 2017 | Mar 31 2016 | June 30 2016 | Sept 30 2016 | Dec 31 2016 | |||||||||||
| Share ownership | ||||||||||||||||||
| Average number outstanding, weighted monthly (thousands)(a) | 1 668 710 | 1 667 968 | 1 659 027 | 1 649 587 | 1 516 134 | 1 590 221 | 1 664 475 | 1 666 118 | ||||||||||
| Share price (dollars) | ||||||||||||||||||
| Toronto Stock Exchange | ||||||||||||||||||
| High | 44.90 | 44.19 | 43.88 | 46.66 | 36.84 | 37.47 | 37.27 | 44.67 | ||||||||||
| Low | 39.65 | 37.72 | 36.09 | 41.88 | 27.32 | 32.69 | 33.76 | 36.03 | ||||||||||
| Close | 40.83 | 37.89 | 43.73 | 46.15 | 36.17 | 35.84 | 36.42 | 43.90 | ||||||||||
| New York Stock Exchange – US$ | ||||||||||||||||||
| High | 33.47 | 32.48 | 35.16 | 36.92 | 28.32 | 29.90 | 28.76 | 33.79 | ||||||||||
| Low | 29.39 | 28.46 | 27.96 | 32.83 | 18.71 | 25.31 | 25.70 | 27.30 | ||||||||||
| Close | 30.75 | 29.20 | 35.03 | 36.72 | 27.45 | 27.39 | 27.81 | 32.83 | ||||||||||
| Shares traded (thousands) | ||||||||||||||||||
| Toronto Stock Exchange | 182 999 | 165 718 | 155 540 | 152 378 | 256 448 | 248 668 | 169 070 | 193 390 | ||||||||||
| New York Stock Exchange | 231 032 | 187 434 | 192 368 | 189 857 | 319 310 | 296 021 | 249 605 | 203 593 | ||||||||||
| Per common share information (dollars) | ||||||||||||||||||
| Net earnings (loss) attributable to common shareholders | 0.81 | 0.26 | 0.78 | 0.84 | 0.16 | (0.46 | ) | 0.24 | 0.32 | |||||||||
| Dividend per common share | 0.32 | 0.32 | 0.32 | 0.32 | 0.29 | 0.29 | 0.29 | 0.29 | ||||||||||
- (a)
- The company had approximately XX registered holders of record of common shares as at January 31, 2018.
Information for Security Holders Outside Canada
Cash dividends paid to shareholders resident in countries other than Canada (non-Canadian shareholders) are subject to Canadian withholding tax. The statutory rate of Canadian withholding tax on dividends is 25%, subject to reduction under an applicable tax treaty between Canada and another country. For example, under the tax treaty between Canada and the United States, the withholding tax rate is generally reduced to 15% on dividends paid to residents of the United States that are eligible for the benefit of that tax treaty. The Canada Revenue Agency has released forms, applicable after 2012, for non-Canadian shareholders to evidence entitlement to a reduced withholding tax rate under a tax treaty. The agents responsible for withholding tax on dividends will generally need to have a duly completed form from a non-Canadian shareholder on file by a particular dividend record date in order for such agents to withhold tax at an applicable treaty-reduced rate, rather than the full statutory rate of 25%. Non-Canadian shareholders are encouraged to contact their broker (or other applicable agent) regarding the completion and delivery of these forms.
As shareholders are responsible to ensure compliance with Canadian Tax laws and regulations, shareholders are strongly encouraged to seek professional tax and legal counsel with respect to any and all tax matters.
156 2017 ANNUAL REPORT Suncor Energy Inc.
LEADERSHIP AND BOARD MEMBERS AS AT DECEMBER 31, 2017
| Leadership |
| Steve Williams President and Chief Executive Officer |
Mark Little Chief Operating Officer |
Eric Axford Executive Vice President and Chief Sustainability Officer |
Alister Cowan Executive Vice President and Chief Financial Officer |
Paul Gardner Senior Vice President, Human Resources |
Mike MacSween Executive Vice President, Upstream |
Janice Odegaard Senior Vice President, General Counsel and Corporate Secretary |
Steve Reynish Executive Vice President, Strategy & Operations Services |
Kris Smith Executive Vice President, Downstream |
| Board of Directors |
| Michael Wilson Chair of the Board Bragg Creek, Alberta |
Steve Williams President and Chief Executive Officer Suncor Energy Inc. Calgary, Alberta |
Patricia Bedient(1)(4) Chair, Audit Committee Sammamish, Washington |
Mel Benson(3)(4) Calgary, Alberta |
Jacynthe Côté(1)(4) Candiac, Quebec |
Dominic D'Alessandro(1)(2) Chair, Governance Committee Toronto, Ontario |
John Gass(2)(3) Chair, Human Resources and Compensation Committee Palm Coast, Florida |
John Huff(3)(4) Houston, Texas |
Maureen McCaw(1)(2) Edmonton, Alberta |
Mike O'Brien(1)(2) Canmore, Alberta |
Eira Thomas(3)(4) Chair, EH&S and Sustainable Development Committee West Vancouver, British Columbia |
- (1)
- Audit committee member
- (2)
- Governance committee member
- (3)
- Human resources and compensation committee member
- (4)
- Environment, health, safety and sustainable development committee member
2017 ANNUAL REPORT Suncor Energy Inc. 157
| | ||
 | Suncor Energy Inc. 150 - 6 Avenue S.W., Calgary, Alberta, Canada T2P 3E3 T: 403-296-8000 Suncor.com | |
| |
EXHIBIT 99.1 Suncor Energy Inc. 2017 Annual Report to Shareholders for the period ended December 31, 2017