Management's Discussion and Analysis for the third quarter ended September 30, 2018
MANAGEMENT'S DISCUSSION AND ANALYSIS
October 31, 2018
Suncor is an integrated energy company headquartered in Calgary, Alberta, Canada. We are strategically focused on developing one of the world's largest petroleum resource basins – Canada's Athabasca oil sands. In addition, we explore for, acquire, develop, produce and market crude oil and natural gas in Canada and internationally; we transport and refine crude oil, and we market petroleum and petrochemical products primarily in Canada. We also conduct energy trading activities focused principally on the marketing and trading of crude oil, natural gas and byproducts. We also operate a renewable energy business as part of our overall portfolio of assets.
For a description of Suncor's segments, refer to Suncor's Management's Discussion and Analysis for the year ended December 31, 2017, dated March 1, 2018 (the 2017 annual MD&A).
This Management's Discussion and Analysis (MD&A) should be read in conjunction with Suncor's unaudited interim Consolidated Financial Statements for the three and nine months ended September 30, 2018, Suncor's audited Consolidated Financial Statements for the year ended December 31, 2017 and the 2017 annual MD&A.
Additional information about Suncor filed with Canadian securities regulatory authorities and the United States Securities and Exchange Commission (SEC), including quarterly and annual reports and Suncor's Annual Information Form dated March 1, 2018 (the 2017 AIF), which is also filed with the SEC under cover of Form 40-F, is available online at www.sedar.com, www.sec.gov and our website www.suncor.com. Information contained in or otherwise accessible through our website does not form part of this MD&A, and is not incorporated into this MD&A by reference.
References to "we", "our", "Suncor", or "the company" mean Suncor Energy Inc., and the company's subsidiaries and interests in associates and jointly controlled entities, unless the context otherwise requires.
Table of Contents
Basis of Presentation
Unless otherwise noted, all financial information has been prepared in accordance with Canadian generally accepted accounting principles (GAAP), specifically International Accounting Standard (IAS) 34Interim Financial Reporting as issued by the International Accounting Standards Board, which is within the framework of International Financial Reporting Standards (IFRS).
Effective January 1, 2018, the company adopted IFRS 15Revenue from Contracts with Customers (IFRS 15), which sets out new guidelines for the recognition of revenue. As a result, certain comparative figures presented in this MD&A pertaining to Suncor's 2017 results have been restated in accordance with the new standard with no impact to overall net earnings or operating earnings.
All financial information is reported in Canadian dollars, unless otherwise noted. Production volumes are presented on a working-interest basis, before royalties, except for Libya, which is on an entitlement basis. Certain prior year amounts in the Consolidated Statements of Comprehensive Income have been reclassified to conform to the current year's presentation.
References to Oil Sands operations exclude Suncor's interest in Fort Hills and Syncrude.
| | | 2018 THIRD QUARTER Suncor Energy Inc. 5 |
Non-GAAP Financial Measures
Certain financial measures in this MD&A – namely operating earnings (loss), funds from (used in) operations, return on capital employed (ROCE), Oil Sands operations cash operating costs, Fort Hills cash operating costs, Syncrude cash operating costs, In Situ cash operating costs, refining margin, refining operating expense, discretionary free funds flow, and last-in, first-out (LIFO) – are not prescribed by GAAP. Operating earnings (loss) is defined in the Non-GAAP Financial Measures Advisory section of this MD&A and reconciled to the most directly comparable GAAP measures in the Consolidated Financial Information and Segment Results and Analysis sections of this MD&A. Oil Sands operations cash operating costs, Fort Hills cash operating costs, Syncrude cash operating costs and LIFO are defined in the Non-GAAP Financial Measures Advisory section of this MD&A and reconciled to the most directly comparable GAAP measures in the Segment Results and Analysis section of this MD&A. Funds from (used in) operations, ROCE, discretionary free funds flow, In Situ cash operating costs, refining margin and refining operating expense are defined and reconciled to the most directly comparable GAAP measures in the Non-GAAP Financial Measures Advisory section of this MD&A.
Risk Factors and Forward-Looking Information
The company's financial and operational performance is potentially affected by a number of factors, including, but not limited to, the factors described within the Forward-Looking Information section of this MD&A. This MD&A contains forward-looking information based on Suncor's current expectations, estimates, projections and assumptions. This information is provided to assist readers in understanding the company's future plans and expectations and may not be appropriate for other purposes. Refer to the Forward-Looking Information section of this MD&A for information on the material risk factors and assumptions underlying our forward-looking information contained in this MD&A.
Measurement Conversions
Certain crude oil and natural gas liquids volumes have been converted to mcfe on the basis of one bbl to six mcf. Also, certain natural gas volumes have been converted to boe or mboe on the same basis. Any figure presented in mcfe, boe or mboe may be misleading, particularly if used in isolation. A conversion ratio of one bbl of crude oil or natural gas liquids to six mcf of natural gas is based on an energy equivalency conversion method primarily applicable at the burner tip and does not represent a value equivalency at the wellhead. Given that the value ratio based on the current price of crude oil as compared to natural gas is significantly different from the energy equivalency of 6:1, conversion on a 6:1 basis may be misleading as an indication of value.
Common Abbreviations
For a list of abbreviations that may be used in this MD&A, refer to the Common Abbreviations section of this MD&A.
| 6 2018 THIRD QUARTER Suncor Energy Inc. | | |
- •
- Third quarter financial results
- •
- Net earnings were $1.812 billion in the third quarter of 2018, compared to $1.289 billion in the prior year quarter. Net earnings for the third quarter of 2018 included an after-tax gain on the sale of the company's interest in the Joslyn Oil Sands mining project of $60 million and an unrealized after-tax foreign exchange gain of $195 million on the revaluation of U.S. dollar denominated debt. Net earnings in the prior year quarter included an unrealized after-tax foreign exchange gain of $412 million on the revaluation of U.S. dollar denominated debt and a non-cash mark to market after-tax gain of $10 million on interest rate swaps and foreign currency derivatives.
- •
- Suncor recorded third quarter 2018 operating earnings(1) of $1.557 billion, compared to $867 million in the prior year quarter, as a result of improved crude oil pricing and increased refinery margins, the addition of sales from the Fort Hills and Hebron projects and record Oil Sands operations production, despite planned upgrader maintenance which began in September. These factors were partially offset by lower Syncrude production, the addition of operating costs at Fort Hills and Hebron and at Syncrude for the additional 5% interest acquired earlier in the year, a decrease in capitalized borrowing costs, higher DD&A and impairment charges, and planned offshore asset maintenance. The decrease in production at Syncrude was due to the impact of the power disruption that occurred late in the second quarter of 2018 and the staged return to service of the asset. Production at Syncrude has returned to normal operating rates following accelerated planned maintenance and the restart of the third and final coker.
- •
- Funds from operations(1) were $3.139 billion in the third quarter of 2018, compared to $2.472 billion in the third quarter of 2017, and were primarily impacted by the same factors as operating earnings described above, excluding the impact of higher non-cash DD&A and impairment charges. Cash flow provided by operating activities, which includes changes in non-cash working capital, was $4.370 billion for the third quarter of 2018, compared to $2.912 billion for the third quarter of 2017, and was positively impacted by an inflow of cash associated with a larger reduction in the company's non-cash working capital balances than the prior year quarter. The reduction in the company's working capital balance was due to lower accounts receivable, an increase in taxes payable on improved earnings, an overall draw of inventory, and higher accounts payable and accrued liabilities.
- •
- Oil Sands operations achieved a new quarterly production record of 476,100 bbls/d. Strong operational reliability and record In Situ production drove the increase in production and resulted in Oil Sands operations cash operating costs(1) of $22.00/bbl, including In Situ cash operating costs(1) of $8.05/bbl.
- •
- Record Refining and Marketing (R&M) financial results. Improved refinery margins and 99% refinery utilization helped contribute $1.119 billion in funds from operations and $939 million in operating earnings, both of which are new quarterly records.
- •
- Fort Hills continues to progress ahead of the original schedule. During the third quarter the company focused on mine development and optimization to allow for reliable and sustained production of approximately 90% of nameplate capacity during the fourth quarter of 2018.
- •
- Continued strong ramp up of Hebron production. The third production well came online in the third quarter of 2018, contributing to total production of 14,400 bbls/d, net to the company. Drilling of the fourth production well at Hebron began in September.
- •
- Suncor, along with it partners, sanctioned Buzzard Phase 2 during the third quarter of 2018. First oil is anticipated in early 2021.
- •
- Significant reduction in total debt. During the third quarter of 2018, the company reduced total debt by $1.2 billion.
- •
- Suncor continued to return value to shareholders. The company returned $582 million to shareholders through dividends and repurchased $889 million of shares during the third quarter of 2018.
- •
- Suncor's Board of Directors approved an increase to the share repurchase program from $2.15 billion to $3.0 billion, reinforcing the company's ongoing ability to generate cash flow and return value to shareholders.
- (1)
- Operating earnings, funds from operations, Oil Sands operations cash operating costs and In Situ cash operating costs are non-GAAP financial measures. See the Non-GAAP Financial Measures Advisory section of this MD&A.
| | | 2018 THIRD QUARTER Suncor Energy Inc. 7 |
3. CONSOLIDATED FINANCIAL INFORMATION
Financial Highlights
| Three months ended September 30 | Nine months ended September 30 | |||||||||
($ millions) | 2018 | 2017 | 2018 | 2017 | ||||||
| | | | | | | | | | | |
Net earnings (loss) | ||||||||||
| | ||||||||||
Oil Sands | 796 | 314 | 1 246 | 339 | ||||||
| | ||||||||||
Exploration and Production | 217 | 161 | 923 | 515 | ||||||
| | ||||||||||
Refining and Marketing | 939 | 597 | 2 430 | 1 772 | ||||||
| | ||||||||||
Corporate, Energy Trading and Eliminations | (140 | ) | 217 | (1 026 | ) | 450 | ||||
| | | | | | | | | | | |
Total | 1 812 | 1 289 | 3 573 | 3 076 | ||||||
| | | | | | | | | | | |
Operating earnings (loss)(1) | ||||||||||
| | ||||||||||
Oil Sands | 736 | 314 | 1 186 | 339 | ||||||
| | ||||||||||
Exploration and Production | 217 | 161 | 790 | 515 | ||||||
| | ||||||||||
Refining and Marketing | 939 | 597 | 2 430 | 1 418 | ||||||
| | ||||||||||
Corporate, Energy Trading and Eliminations | (335 | ) | (205 | ) | (674 | ) | (394 | ) | ||
| | | | | | | | | | | |
Total | 1 557 | 867 | 3 732 | 1 878 | ||||||
| | | | | | | | | | | |
Funds from (used in) operations(1) | ||||||||||
| | ||||||||||
Oil Sands | 1 844 | 1 276 | 4 269 | 2 958 | ||||||
| | ||||||||||
Exploration and Production | 455 | 375 | 1 502 | 1 294 | ||||||
| | ||||||||||
Refining and Marketing | 1 119 | 827 | 2 968 | 1 906 | ||||||
| | ||||||||||
Corporate, Energy Trading and Eliminations | (279 | ) | (6 | ) | (574 | ) | (35 | ) | ||
| | | | | | | | | | | |
Total | 3 139 | 2 472 | 8 165 | 6 123 | ||||||
| | | | | | | | | | | |
Capital and exploration expenditures(2) | ||||||||||
| | ||||||||||
Sustaining | 906 | 816 | 3 100 | 2 109 | ||||||
| | ||||||||||
Growth | 274 | 697 | 1 031 | 2 269 | ||||||
| | | | | | | | | | | |
Total | 1 180 | 1 513 | 4 131 | 4 378 | ||||||
| | | | | | | | | | | |
| Three months ended September 30 | Twelve months ended September 30 | |||||||||
($ millions) | 2018 | 2017 | 2018 | 2017 | ||||||
| | | | | | | | | | | |
Discretionary free funds flow(1) | 1 639 | 1 116 | 4 940 | 3 759 | ||||||
| | | | | | | | | | | |
- (1)
- Non-GAAP financial measures. See the Non-GAAP Financial Measures Advisory section of this MD&A.
- (2)
- Excludes capitalized interest.
| 8 2018 THIRD QUARTER Suncor Energy Inc. | | |
Operating Highlights
| Three months ended September 30 | Nine months ended September 30 | |||||||||
| 2018 | 2017 | 2018 | 2017 | |||||||
| | | | | | | | | | | |
Production volumes by segment | ||||||||||
| | ||||||||||
Oil Sands (mbbls/d) | 651.7 | 628.4 | 591.0 | 544.3 | ||||||
| | ||||||||||
Exploration and Production (mboe/d) | 92.1 | 111.5 | 107.9 | 123.8 | ||||||
| | | | | | | | | | | |
Total (mboe/d) | 743.8 | 739.9 | 698.9 | 668.1 | ||||||
| | | | | | | | | | | |
Production mix | ||||||||||
| | ||||||||||
Crude oil and liquids / natural gas (%) | 100/0 | 100/0 | 100/0 | 99/1 | ||||||
| | | | | | | | | | | |
Refinery utilization (%) | 99 | 101 | 91 | 96 | ||||||
| | ||||||||||
Refinery crude oil processed (mbbls/d) | 457.2 | 466.8 | 418.3 | 444.2 | ||||||
| | | | | | | | | | | |
Net Earnings
Suncor's consolidated net earnings for the third quarter of 2018 were $1.812 billion, compared to net earnings of $1.289 billion for the prior year quarter. Net earnings were primarily affected by the same factors that influenced operating earnings described subsequently in this section of this MD&A.
Other items affecting net earnings over these periods included:
- •
- The after-tax unrealized foreign exchange impact on the revaluation of U.S. dollar denominated debt was a gain of $195 million for the third quarter of 2018, compared to a gain of $412 million for the third quarter of 2017.
- •
- The third quarter of 2018 included an after-tax gain of $60 million on the sale of the company's interest in the Joslyn Oil Sands mining project.
- •
- The third quarter of 2017 included a $10 million non-cash mark to market after-tax gain on interest rate swaps and foreign currency derivatives.
Operating Earnings Reconciliation(1)
| Three months ended September 30 | Nine months ended September 30 | |||||||||
($ millions) | 2018 | 2017 | 2018 | 2017 | ||||||
| | | | | | | | | | | |
Net earnings | 1 812 | 1 289 | 3 573 | 3 076 | ||||||
| | ||||||||||
Unrealized foreign exchange (gain) loss on U.S. dollar denominated debt | (195 | ) | (412 | ) | 352 | (793 | ) | |||
| | ||||||||||
Non-cash mark to market (gain) loss on interest rate swaps and foreign currency derivatives(2) | — | (10 | ) | — | 22 | |||||
| | ||||||||||
Loss on early payment of long-term debt(3) | — | — | — | 10 | ||||||
| | ||||||||||
Gain on significant disposal(4) | (60 | ) | — | (193 | ) | (437 | ) | |||
| | | | | | | | | | | |
Operating earnings(1) | 1 557 | 867 | 3 732 | 1 878 | ||||||
| | | | | | | | | | | |
- (1)
- Operating earnings is a non-GAAP financial measure. All reconciling items are presented on an after-tax basis. See the Non-GAAP Financial Measures Advisory section of this MD&A.
- (2)
- Non-cash mark to market (gain) loss on interest rate swaps and foreign currency derivatives resulting from changes in long-term interest rates and foreign exchange rates in the Corporate segment.
- (3)
- Charges associated with the early repayment of debt, net of associated realized foreign currency hedge gains, in the Corporate segment.
- (4)
- The third quarter of 2018 included an after-tax gain of $60 million on the sale of the company's interest in the Joslyn Oil Sands mining project. The first quarter of 2018 included a non-cash after-tax gain of $133 million in the Exploration and Production (E&P) segment related to the asset exchange with Canbriam Energy Inc. (Canbriam) for the company's mineral landholdings in northeast British Columbia in the first quarter of 2018. The first quarter of 2017 included a $354 million after-tax gain in the R&M segment related to the sale of the company's lubricants business, combined with an after-tax gain of $83 million in the Corporate segment related to the sale of the company's interest in the Cedar Point wind facility.
| | | 2018 THIRD QUARTER Suncor Energy Inc. 9 |
Bridge Analysis of Operating Earnings($ millions)(1)
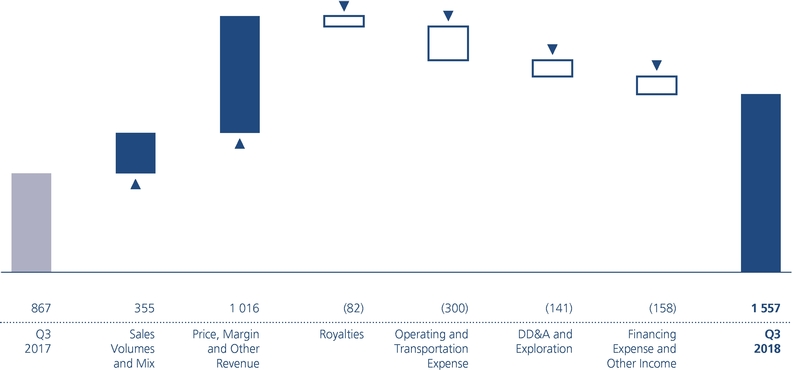
- (1)
- For an explanation of this bridge analysis, see the Non-GAAP Financial Measures Advisory section of this MD&A.
Suncor's consolidated operating earnings for the third quarter of 2018 were $1.557 billion, compared to $867 million in the prior year quarter. The increase is attributed to improved crude oil pricing and increased refinery margins, the addition of production from the Fort Hills and Hebron projects and record Oil Sands operations production, despite planned upgrader maintenance which began towards the end of the quarter. These factors were partially offset by lower Syncrude production, the addition of operating costs at Fort Hills and Hebron and at Syncrude for the additional 5% interest acquired earlier in the year, a decrease in capitalized borrowing costs, higher DD&A and impairment charges, and planned offshore asset maintenance. The decrease in production at Syncrude was due to the impact of the power disruption that occurred late in the second quarter of 2018 and the staged return to service of the asset. Production at Syncrude has returned to normal operating rates following accelerated planned maintenance and the restart of the third and final coker.
After-Tax Share-Based Compensation Expense by Segment
| Three months ended September 30 | Nine months ended September 30 | |||||||||
($ millions) | 2018 | 2017 | 2018 | 2017 | ||||||
| | | | | | | | | | | |
Oil Sands | 8 | 31 | 63 | 52 | ||||||
| | ||||||||||
Exploration and Production | 1 | 4 | 6 | 7 | ||||||
| | ||||||||||
Refining and Marketing | 4 | 15 | 32 | 27 | ||||||
| | ||||||||||
Corporate, Energy Trading and Eliminations | 19 | 53 | 130 | 108 | ||||||
| | | | | | | | | | | |
Total share-based compensation expense | 32 | 103 | 231 | 194 | ||||||
| | | | | | | | | | | |
The after-tax share-based compensation expense decreased to $32 million during the third quarter of 2018, as a result of the decrease in the company's share price during the quarter, compared to $103 million during the prior year quarter, which had an increasing share price.
| 10 2018 THIRD QUARTER Suncor Energy Inc. | | |
Business Environment
Commodity prices, refining crack spreads and foreign exchange rates are important factors that affect the results of Suncor's operations.
| Average for the three months ended September 30 | Average for the nine months ended September 30 | |||||||||||
| 2018 | 2017 | 2018 | 2017 | |||||||||
| | | | | | | | | | | | | |
WTI crude oil at Cushing | US$/bbl | 69.50 | 48.20 | 66.80 | 49.45 | |||||||
| | ||||||||||||
Dated Brent crude | US$/bbl | 75.25 | 52.05 | 72.15 | 51.90 | |||||||
| | ||||||||||||
Dated Brent/Maya crude oil FOB price differential | US$/bbl | 9.15 | 6.30 | 10.75 | 7.05 | |||||||
| | ||||||||||||
MSW at Edmonton | Cdn$/bbl | 81.40 | 57.05 | 77.85 | 61.20 | |||||||
| | ||||||||||||
WCS at Hardisty | US$/bbl | 47.35 | 38.25 | 44.90 | 37.60 | |||||||
| | ||||||||||||
Light/heavy differential for WTI at Cushing less WCS at Hardisty | US$/bbl | 22.15 | 9.95 | 21.90 | 11.90 | |||||||
| | ||||||||||||
Condensate at Edmonton | US$/bbl | 66.80 | 47.60 | 66.30 | 49.45 | |||||||
| | ||||||||||||
Natural gas (Alberta spot) at AECO | Cdn$/mcf | 1.20 | 1.45 | 1.50 | 2.30 | |||||||
| | ||||||||||||
Alberta Power Pool Price | Cdn$/MWh | 54.45 | 24.55 | 48.40 | 22.05 | |||||||
| | ||||||||||||
New York Harbor 3-2-1 crack(1) | US$/bbl | 19.65 | 22.35 | 18.65 | 17.05 | |||||||
| | ||||||||||||
Chicago 3-2-1 crack(1) | US$/bbl | 19.05 | 19.25 | 16.75 | 14.90 | |||||||
| | ||||||||||||
Portland 3-2-1 crack(1) | US$/bbl | 21.40 | 26.80 | 23.20 | 22.15 | |||||||
| | ||||||||||||
Gulf Coast 3-2-1 crack(1) | US$/bbl | 18.85 | 21.45 | 18.20 | 17.40 | |||||||
| | ||||||||||||
Exchange rate | US$/Cdn$ | 0.77 | 0.80 | 0.78 | 0.77 | |||||||
| | ||||||||||||
Exchange rate (end of period) | US$/Cdn$ | 0.77 | 0.80 | 0.77 | 0.80 | |||||||
| | | | | | | | | | | | | |
- (1)
- 3-2-1 crack spreads are indicators of the refining margin generated by converting three barrels of WTI into two barrels of gasoline and one barrel of diesel. The crack spreads presented here generally approximate the regions into which the company sells refined products through retail and wholesale channels.
Suncor's sweet SCO price realizations are influenced primarily by the price of WTI at Cushing and by the supply and demand for sweet SCO from Western Canada. Price realizations in the third quarter of 2018 for sweet SCO were favourably impacted by a higher WTI price of US$69.50/bbl, compared to US$48.20/bbl in the prior year quarter, partially offset by the impact of widening SCO differentials towards the end of the quarter. Suncor also produces sour SCO, the price of which is influenced by various crude benchmarks, including, but not limited to, MSW at Edmonton and WCS at Hardisty, and which can also be affected by prices negotiated for spot sales. Prices for MSW at Edmonton increased to $81.40/bbl compared to $57.05/bbl in the prior year quarter, and prices for WCS at Hardisty increased to US$47.35/bbl in the third quarter of 2018, from US$38.25/bbl in the prior year quarter, which was less than the increase in WTI as a result of the continued impact of wider western Canadian heavy crude differentials due to takeaway constraints in the Alberta crude market.
Bitumen production that Suncor does not upgrade is blended with diluent or SCO to facilitate delivery on pipeline systems. Net bitumen price realizations are, therefore, influenced by both prices for Canadian heavy crude oil (WCS at Hardisty is a common reference), prices for diluent (Condensate at Edmonton) and SCO. Bitumen price realizations can also be affected by bitumen quality and spot sales.
Suncor's price realizations for production from East Coast Canada and International assets are influenced primarily by the price for Brent crude, which was US$75.25/bbl in the third quarter of 2018, compared to US$52.05/bbl in the prior year quarter.
Natural gas used in Suncor's Oil Sands and Refining operations is primarily referenced to Alberta spot prices at AECO. The average AECO benchmark decreased to $1.20/mcf in the third quarter of 2018, from $1.45/mcf in the prior year quarter.
Suncor's refining margins are primarily influenced by 3-2-1 benchmark crack spreads, which are industry indicators approximating the gross margin on a barrel of crude oil that is refined to produce gasoline and distillates, and crude differentials. More complex refineries can earn greater refining margin by processing less expensive, heavier crudes, or lighter
| | | 2018 THIRD QUARTER Suncor Energy Inc. 11 |
crudes discounted relative to the WTI benchmark. Crude differentials in Alberta have widened in the third quarter of 2018, resulting in lower refinery feedstock costs for the majority of the company's refineries and improved refining margins. Crack spreads do not necessarily reflect the margins of a specific refinery. Crack spreads are based on current crude feedstock prices whereas actual earnings are based on first-in, first-out (FIFO) inventory accounting, where a delay exists between the time that feedstock is purchased and when it is processed and sold to a third party. A FIFO loss normally reflects a declining price environment for crude oil and finished products, whereas FIFO gains reflect an increasing price environment for crude oil and finished products. Specific refinery margins are further impacted by actual crude purchase costs, refinery configuration, production mix and realized prices for refined products sales in markets unique to each refinery.
Excess electricity produced in Suncor's Oil Sands operations is sold to the Alberta Electric System Operator, with the proceeds netted against the Oil Sands operations cash operating cost per barrel metric. The Alberta power pool price increased to an average of $54.45/MWh in the third quarter of 2018, compared to $24.55/MWh in the prior year quarter.
The majority of Suncor's revenues from the sale of oil and natural gas commodities are based on prices that are determined by or referenced to U.S. dollar benchmark prices, while the majority of Suncor's expenditures are realized in Canadian dollars. The Canadian dollar weakened in relation to the U.S. dollar during the third quarter of 2018, as the average exchange rate decreased to US$0.77 per one Canadian dollar from US$0.80 per one Canadian dollar in the prior year quarter. This rate decrease had a positive impact on price realizations for the company during the third quarter of 2018 when compared to the prior year quarter.
Suncor also has assets and liabilities, including approximately 65% of the company's debt, which are denominated in U.S. dollars and translated to Suncor's reporting currency (Canadian dollars) at each balance sheet date. A decrease in the value of the Canadian dollar, relative to the U.S. dollar, from the previous balance sheet date increases the amount of Canadian dollars required to settle U.S. dollar denominated obligations, while an increase in the value of the Canadian dollar, relative to the U.S. dollar, decreases the amount of Canadian dollars required to settle U.S. dollar denominated obligations.
| 12 2018 THIRD QUARTER Suncor Energy Inc. | | |
4. SEGMENT RESULTS AND ANALYSIS
OIL SANDS
Financial Highlights
| Three months ended September 30 | Nine months ended September 30 | |||||||||
($ millions) | 2018 | 2017 | 2018 | 2017 | ||||||
| | | | | | | | | | | |
Gross revenues(1) | 4 815 | 3 268 | 12 594 | 9 126 | ||||||
| | ||||||||||
Less: Royalties | (161 | ) | (82 | ) | (331 | ) | (180 | ) | ||
| | | | | | | | | | | |
Operating revenues, net of royalties | 4 654 | 3 186 | 12 263 | 8 946 | ||||||
| | | | | | | | | | | |
Net earnings | 796 | 314 | 1 246 | 339 | ||||||
| | | | | | | | | | | |
Adjusted for: | ||||||||||
| | ||||||||||
Gain on significant disposal(2) | (60 | ) | — | (60 | ) | — | ||||
| | | | | | | | | | | |
Operating Earnings(3) | 736 | 314 | 1 186 | 339 | ||||||
| | | | | | | | | | | |
Funds from operations(3) | 1 844 | 1 276 | 4 269 | 2 958 | ||||||
| | | | | | | | | | | |
- (1)
- The three- and nine-month periods ended September 30, 2017 have been restated in accordance with the new IFRS 15 revenue requirements, with no impact to net earnings or operating earnings. For further information on the restatements associated with IFRS 15, refer to note 3 in Suncor's Consolidated Financial Statements for the three- and nine-month periods ended September 30, 2018.
- (2)
- The third quarter of 2018 included an after-tax gain of $60 million on the sale of the company's interest in the Joslyn Oil Sands mining project.
- (3)
- Non-GAAP financial measures. See the Non-GAAP Financial Measures Advisory section of this MD&A.
Bridge Analysis of Operating Earnings($ millions)(1)
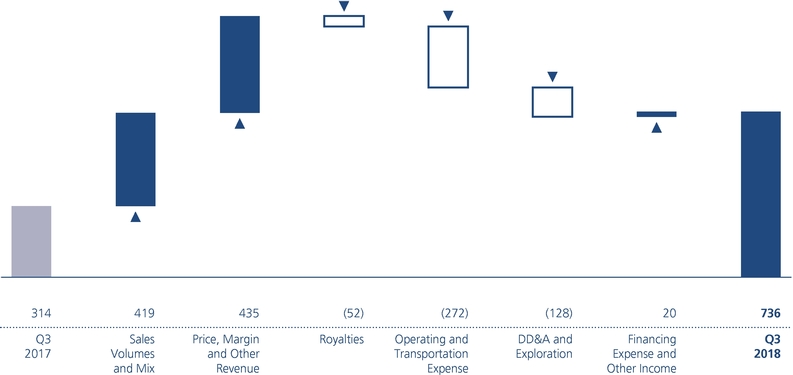
- (1)
- For an explanation of this bridge analysis, see the Non-GAAP Financial Measures Advisory section of this MD&A.
The Oil Sands segment had operating earnings of $736 million in the third quarter of 2018, compared to $314 million in the prior year quarter. The increase was due to higher crude price realizations, the addition of production from Fort Hills, improved upgrader reliability and higher production at In Situ, partially offset by lower Syncrude production, the addition of operating costs at Fort Hills, an increase in DD&A and impairment charges, and higher operating costs at Syncrude. Production at Syncrude was lower than the prior year quarter due to the power disruption that occurred late in the second quarter and the asset's staged return to service combined with the acceleration of planned maintenance originally scheduled for the fourth quarter of 2018.
| | | 2018 THIRD QUARTER Suncor Energy Inc. 13 |
Production Volumes(1)
| Three months ended September 30 | Nine months ended September 30 | |||||||||
(mbbls/d) | 2018 | 2017 | 2018 | 2017 | ||||||
| | | | | | | | | | | |
Upgraded product (SCO and diesel) | 338.5 | 330.8 | 291.1 | 321.8 | ||||||
| | ||||||||||
Internally consumed diesel(2) | (8.4 | ) | (6.4 | ) | (8.4 | ) | (6.5 | ) | ||
| | | | | | | | | | | |
Total Oil Sands operations upgraded product | 330.1 | 324.4 | 282.7 | 315.3 | ||||||
| | ||||||||||
In Situ non-upgraded bitumen | 146.0 | 144.9 | 130.9 | 108.2 | ||||||
| | | | | | | | | | | |
Total Oil Sands operations production | 476.1 | 469.3 | 413.6 | 423.5 | ||||||
| | ||||||||||
Fort Hills bitumen | 69.4 | — | 56.9 | — | ||||||
| | ||||||||||
Internally upgraded bitumen from froth | — | — | (1.7 | ) | — | |||||
| | | | | | | | | | | |
Total Fort Hills bitumen production | 69.4 | — | 55.2 | — | ||||||
| | ||||||||||
Syncrude (sweet SCO and diesel) | 107.6 | 159.2 | 124.3 | 121.8 | ||||||
| | ||||||||||
Internally consumed diesel(2) | (1.4 | ) | (0.1 | ) | (2.1 | ) | (1.0 | ) | ||
| | | | | | | | | | | |
Total Syncrude production | 106.2 | 159.1 | 122.2 | 120.8 | ||||||
| | | | | | | | | | | |
Total Oil Sands production | 651.7 | 628.4 | 591.0 | 544.3 | ||||||
| | | | | | | | | | | |
- (1)
- Bitumen production from Oil Sands Base operations is upgraded, while bitumen production from In Situ operations is either upgraded or sold directly to customers, including Suncor's own refineries, with SCO and diesel yields of approximately 79% of bitumen feedstock input. Fort Hills finished bitumen is sold directly to customers and bitumen froth from Fort Hills can be sent to Oil Sands Base for further processing into SCO. All of the bitumen produced at Syncrude is upgraded to sweet SCO and a small amount of diesel, at an approximate yield of 85%.
- (2)
- Both Oil Sands operations and Syncrude produce diesel which is internally consumed in mining operations, and Fort Hills uses internally produced diesel from Oil Sands Base within its mining operations. Of the 8,400 bbls/d of internally consumed diesel at Oil Sands operations in the third quarter of 2018, 6,300 bbls/d was consumed at Oil Sands Base and 2,100 bbls/d was consumed at Fort Hills. Oil Sands operations utilization rates are calculated net of Oil Sands Base internally consumed diesel, but inclusive of diesel consumed internally at Fort Hills. Syncrude utilization rates are calculated using intermediate sour production.
Oil Sands operations production was 476,100 bbls/d in the third quarter of 2018, compared to 469,300 bbls/d in the prior year quarter, and represents a new quarterly production record. The increase was due to strong operational reliability and record In Situ production. Upgrader utilization was 95% in the third quarter of 2018, compared to 93% in the prior year period, despite the start of planned maintenance at Upgrader 2 in September that has subsequently been completed. Improved upgrader utilization resulted in a favourable product mix, with the company producing and selling an increased proportion of higher value sweet SCO and diesel in the third quarter of 2018. The third quarter of 2017 was impacted by both planned and unplanned maintenance.
Fort Hills produced an average of 69,400 bbls/d of bitumen in the third quarter of 2018, net to Suncor, and is expected to produce at approximately 90% of nameplate capacity in the fourth quarter of 2018.
Sales Volumes
| Three months ended September 30 | Nine months ended September 30 | |||||||||
(mbbls/d) | 2018 | 2017 | 2018 | 2017 | ||||||
| | | | | | | | | | | |
Oil Sands operations sales volumes | ||||||||||
| | ||||||||||
Sweet SCO | 129.5 | 105.9 | 91.3 | 111.7 | ||||||
| | ||||||||||
Diesel | 34.7 | 30.4 | 29.2 | 30.1 | ||||||
| | ||||||||||
Sour SCO | 162.8 | 183.2 | 166.6 | 173.2 | ||||||
| | | | | | | | | | | |
Upgraded product | 327.0 | 319.5 | 287.1 | 315.0 | ||||||
| | ||||||||||
In Situ non-upgraded bitumen | 131.4 | 120.3 | 121.2 | 103.8 | ||||||
| | | | | | | | | | | |
Oil Sands operations | 458.4 | 439.8 | 408.3 | 418.8 | ||||||
| | ||||||||||
Fort Hills bitumen | 61.6 | — | 44.8 | — | ||||||
| | ||||||||||
Syncrude | 106.2 | 159.1 | 122.2 | 120.8 | ||||||
| | | | | | | | | | | |
Total | 626.2 | 598.9 | 575.3 | 539.6 | ||||||
| | | | | | | | | | | |
| 14 2018 THIRD QUARTER Suncor Energy Inc. | | |
Sales volumes for Oil Sands operations increased to 458,400 bbls/d in the third quarter of 2018, from 439,800 bbls/d in the prior year quarter, consistent with the increase in production, partially offset by a build of inventory.
Bitumen sales at Fort Hills averaged 61,600 bbls/d, net to Suncor, in the third quarter of 2018 and reflect a small build of inventory.
Suncor's share of Syncrude production and sales was 106,200 bbls/d in the third quarter of 2018, compared to 159,100 bbls/d in the prior year quarter. The decrease was primarily due to the power disruption that occurred late in the second quarter and the staged return to service of the asset, partially offset by the acquisition of an additional 5% working interest in Syncrude earlier in the year. In order to help mitigate the impact of the power outage to overall production in 2018, planned maintenance originally scheduled for the fourth quarter of 2018 and 2019 was advanced to coincide with the return to service. Production at Syncrude has returned to normal operating rates following accelerated planned maintenance and the restart of the third and final coker.
Bitumen Production
| Three months ended September 30 | Nine months ended September 30 | |||||||||
| 2018 | 2017 | 2018 | 2017 | |||||||
| | | | | | | | | | | |
Oil Sands Base | ||||||||||
| | ||||||||||
Bitumen production (mbbls/d) | 323.4 | 328.1 | 252.2 | 308.3 | ||||||
| | ||||||||||
Bitumen ore mined (thousands of tonnes per day) | 449.6 | 490.0 | 366.5 | 469.3 | ||||||
| | ||||||||||
Bitumen ore grade quality (bbls/tonne) | 0.72 | 0.67 | 0.69 | 0.66 | ||||||
| | | | | | | | | | | |
In Situ | ||||||||||
| | ||||||||||
Bitumen production – Firebag (mbbls/d) | 211.0 | 203.6 | 206.2 | 172.5 | ||||||
| | ||||||||||
Steam-to-oil ratio – Firebag | 2.7 | 2.7 | 2.6 | 2.7 | ||||||
| | | | | | | | | | | |
Bitumen production – MacKay River (mbbls/d) | 37.1 | 30.8 | 35.6 | 32.1 | ||||||
| | ||||||||||
Steam-to-oil ratio – MacKay River | 2.8 | 3.0 | 2.9 | 3.1 | ||||||
| | | | | | | | | | | |
Total In Situ bitumen production (mbbls/d) | 248.1 | 234.4 | 241.8 | 204.6 | ||||||
| | | | | | | | | | | |
Total Oil Sands operations bitumen production (mbbls/d) | 571.5 | 562.5 | 494.0 | 512.9 | ||||||
| | | | | | | | | | | |
Fort Hills | ||||||||||
| | ||||||||||
Bitumen production (mbbls/d) | 69.4 | — | 56.9 | — | ||||||
| | ||||||||||
Bitumen ore mined (thousands of tonnes per day) | 114.1 | — | 91.2 | — | ||||||
| | ||||||||||
Bitumen ore grade quality (bbls/tonne) | 0.61 | — | 0.62 | — | ||||||
| | | | | | | | | | | |
Syncrude | ||||||||||
| | ||||||||||
Bitumen production (mbbls/d) | 130.9 | 193.7 | 148.8 | 148.8 | ||||||
| | ||||||||||
Bitumen ore mined (thousands of tonnes per day) | 213.3 | 290.9 | 241.5 | 228.5 | ||||||
| | ||||||||||
Bitumen ore grade quality (bbls/tonne) | 0.61 | 0.67 | 0.62 | 0.65 | ||||||
| | | | | | | | | | | |
Total Oil Sands bitumen production | 771.8 | 756.2 | 699.7 | 661.7 | ||||||
| | | | | | | | | | | |
Bitumen production at Oil Sands operations increased in the third quarter of 2018 to 571,500 bbls/d, compared with 562,500 bbls/d in the prior year quarter. The increase was primarily due to continued strong In Situ production, where both Firebag and MacKay River achieved new quarterly production records and higher Oil Sands Base mine ore grade quality.
Bitumen production at Fort Hills in the third quarter of 2018 was 69,400 bbls/d, net to Suncor, following the successful start of operations in the first quarter of 2018 and subsequent commissioning of the second and third extraction trains.
Bitumen production at Syncrude in the third quarter of 2018 decreased to 130,900 bbls/d, net to Suncor, from 193,700 bbls/d in the prior year quarter. The decrease was primarily due to the impact of the power disruption late in the second quarter of 2018, partially offset by a 5% increase in Suncor's working interest acquired earlier in 2018.
| | | 2018 THIRD QUARTER Suncor Energy Inc. 15 |
Price Realizations(1)
Net of transportation costs, but before royalties | Three months ended September 30 | Nine months ended September 30 | ||||||||
($/bbl) | 2018 | 2017 | 2018 | 2017 | ||||||
| | | | | | | | | | | |
Oil Sands operations | ||||||||||
| | ||||||||||
SCO and diesel | 82.95 | 56.11 | 78.06 | 59.64 | ||||||
| | ||||||||||
Bitumen | 36.62 | 34.79 | 35.65 | 30.81 | ||||||
| | ||||||||||
Crude sales basket (all products) | 69.67 | 50.28 | 65.47 | 52.49 | ||||||
| | ||||||||||
Crude sales basket, relative to WTI | (20.59 | ) | (9.97 | ) | (20.17 | ) | (11.73 | ) | ||
| | | | | | | | | | | |
Fort Hills bitumen | 53.43 | — | 51.44 | — | ||||||
| | | | | | | | | | | |
Syncrude – sweet SCO | 88.80 | 60.30 | 83.12 | 62.54 | ||||||
| | ||||||||||
Syncrude, relative to WTI | (1.46 | ) | 0.05 | (2.52 | ) | (1.68 | ) | |||
| | | | | | | | | | | |
- (1)
- Price realizations for the third quarter of 2017 have been restated in accordance with the new IFRS 15 revenue requirements, with no impact to net earnings or operating earnings, as well as the removal of the impact of risk management activities. For further information on the restatements associated with IFRS 15, refer to note 3 in Suncor's Consolidated Financial Statements for the three- and nine-month periods ended September 30, 2018.
Average price realizations at Oil Sands operations increased to $69.67/bbl in the third quarter of 2018 from $50.28/bbl in the prior year quarter, due to higher WTI benchmark prices, the impact of a weaker Canadian dollar and an increase in sweet SCO sales associated with a favourable production mix. This was partially offset by wider heavy crude oil and SCO differentials resulting from transportation constraints impacting the industry's ability to export production from Alberta.
Average price realizations for Fort Hills bitumen were $53.43/bbl in the third quarter of 2018 and were higher than In Situ bitumen realizations due to a higher proportion of sales in the U.S. Gulf Coast, where Suncor was able to utilize its logistics network to access favourable pricing in the U.S. market, combined with the improved quality associated with paraffinic froth-treated bitumen produced at Fort Hills.
Average price realizations at Syncrude increased to $88.80/bbl in the third quarter of 2018 from $60.30/bbl in the prior year quarter due to the increase in the WTI benchmark price and the impact of a weaker Canadian dollar, partially offset by wider SCO differentials.
Royalties
Royalties for the Oil Sands segment were higher in the third quarter of 2018 compared to the prior year quarter, primarily due to higher benchmark pricing combined with the increase in bitumen production.
Expenses and Other Factors
Oil Sands operating and transportation expenses for the third quarter of 2018 increased when compared to the prior year quarter. See the reconciliation in the Cash Operating Costs section below for further details regarding cash operating costs and a breakdown of non-production costs by asset.
At Oil Sands operations, operating costs increased as a result of an increase in maintenance expenses, which was primarily associated with the Upgrader 2 turnaround, partially offset by lower natural gas prices and a decrease in share-based compensation expense.
Suncor's share of Syncrude operating costs was higher than the prior year quarter, primarily due to the addition of the 5% working interest acquired earlier in the year and an increase in maintenance costs, partially offset by lower natural gas prices. The increase in maintenance costs was attributable to the return to service following the power disruption late in the second quarter of 2018 and the acceleration of planned maintenance.
At Fort Hills, operating costs reflect the acceleration of mining activity and the forward preparation of ore inventory in support of reaching target operating rates in the fourth quarter of 2018. In addition, operating costs at Fort Hills included the completion of planned extraction plant maintenance originally scheduled for the fourth quarter of 2018, which was advanced to coincide with the ramp up of mining operations.
Oil Sands transportation costs increased primarily as a result of the addition of sales volumes from Fort Hills, as well as increased sales at Oil Sands operations.
| 16 2018 THIRD QUARTER Suncor Energy Inc. | | |
DD&A and impairment expenses for the third quarter of 2018 were higher than the prior year period due to a write-down of certain assets no longer being utilized by the company, the addition of DD&A from Fort Hills and an increased share of Syncrude DD&A with the acquisition of an additional 5% working interest in the first quarter of 2018.
Cash Operating Costs
| Three months ended September 30 | Nine months ended September 30 | |||||||||
($ millions, except as noted) | 2018 | 2017 | 2018 | 2017 | ||||||
| | | | | | | | | | | |
Oil Sands Operating, selling and general expense (OS&G) | 1 854 | 1 513 | 5 574 | 4 641 | ||||||
| | | | | | | | | | | |
Oil Sands operations cash operating costs(1) reconciliation | ||||||||||
| | ||||||||||
Oil Sands operations OS&G | 1 005 | 988 | 3 128 | 2 982 | ||||||
| | ||||||||||
Non-production costs(2) | (14 | ) | (36 | ) | (91 | ) | (68 | ) | ||
| | ||||||||||
Excess power capacity and other(3) | (50 | ) | (58 | ) | (157 | ) | (180 | ) | ||
| | ||||||||||
Inventory changes | 28 | 37 | 11 | 1 | ||||||
| | | | | | | | | | | |
Oil Sands operations cash operating costs(1) | 969 | 931 | 2 891 | 2 735 | ||||||
| | ||||||||||
Oil Sands operations cash operating costs ($/bbl)(1) | 22.00 | 21.60 | 25.50 | 23.65 | ||||||
| | | | | | | | | | | |
Fort Hills cash operating costs(1) reconciliation | ||||||||||
| | ||||||||||
Fort Hills OS&G | 214 | — | 541 | — | ||||||
| | ||||||||||
Non-production costs(2) | (26 | ) | — | (96 | ) | — | ||||
| | ||||||||||
Inventory changes | 26 | — | 98 | — | ||||||
| | | | | | | | | | | |
Fort Hills cash operating costs(1) | 214 | — | 543 | — | ||||||
| | ||||||||||
Fort Hills cash operating costs ($/bbl)(1) | 33.45 | — | 34.90 | — | ||||||
| | | | | | | | | | | |
Syncrude cash operating costs(1) reconciliation | ||||||||||
| | ||||||||||
Syncrude OS&G | 635 | 525 | 1 904 | 1 659 | ||||||
| | ||||||||||
Non-production costs(2) | (11 | ) | (13 | ) | (26 | ) | (27 | ) | ||
| | | | | | | | | | | |
Syncrude cash operating costs(1) | 624 | 512 | 1 878 | 1 632 | ||||||
| | ||||||||||
Syncrude cash operating costs ($/bbl)(1) | 63.85 | 35.00 | 56.25 | 49.50 | ||||||
| | | | | | | | | | | |
- (1)
- Non-GAAP financial measures. See the Non-GAAP Financial Measures Advisory section of this MD&A.
- (2)
- Significant non-production costs include, but are not limited to, share-based compensation expense and research expenses. Non-production costs at Fort Hills also include, but are not limited to, project start-up costs, excess power revenue from cogeneration units while the project ramps up to sustained target production rates and an adjustment to reflect internally produced diesel from Oil Sands operations at the cost of production.
- (3)
- Oil Sands operations excess power capacity and other includes, but is not limited to, the operational revenue impacts of excess power from a cogeneration unit and the natural gas expense recorded as part of a non-monetary arrangement involving a third-party processor.
Oil Sands operations cash operating costs per barrel(1) were $22.00 in the third quarter of 2018, and were comparable to $21.60 in the prior year quarter, with improved upgrader reliability and lower natural gas prices partially offsetting higher planned maintenance costs. Total Oil Sands operations cash operating costs increased to $969 million from $931 million in the prior year quarter.
In the third quarter of 2018, non-production costs, which are excluded from Oil Sands operations cash operating costs, were lower than the prior year quarter, primarily due to a decrease in share-based compensation expense.
Excess power capacity and other costs at Oil Sands operations for the third quarter of 2018 were comparable to the prior year quarter.
Inventory changes at Oil Sands operations in the third quarter of 2018 were lower compared to the third quarter of 2017 due to a smaller build of inventory.
Fort Hills cash operating costs per barrel(1) averaged $33.45 in the third quarter of 2018, and include increased mine development costs to catch mine production capability up to the accelerated ramp up schedule achieved by the extraction plant. In addition, planned extraction plant maintenance was advanced from the fourth quarter of 2018 to coincide with the ramp up of mining operations. Suncor anticipates annualized Fort Hills cash operating costs to remain within the full year guidance range.
- (1)
- Non-GAAP financial measures. See the Non-GAAP Financial Measures Advisory section of this MD&A.
| | | 2018 THIRD QUARTER Suncor Energy Inc. 17 |
Syncrude cash operating costs per barrel(1) were $63.85 in the third quarter of 2018, compared to $35.00 in the prior year quarter, with the increase attributable to lower production and increased operating costs associated with unplanned maintenance and the acceleration of planned maintenance during the return to service. Suncor's share of Syncrude cash operating costs increased to $624 million, from $512 million in the third quarter of 2017, due in part to the acquisition of an additional 5% working interest in Syncrude in the first quarter of 2018.
Results for the First Nine Months of 2018
Oil Sands segment net earnings for the first nine months of 2018 were $1.246 billion, compared to $339 million for the same period in 2017 and were influenced by the same factors noted in operating earnings below, in addition to an after-tax gain on the sale of the company's interest in the Joslyn Oil Sands mining project of $60 million in the third quarter of 2018.
Oil Sands segment operating earnings for the first nine months of 2018 were $1.186 billion, compared to $339 million for the same period in 2017. Operating earnings improved as a result of higher crude price realizations, increased production volumes, primarily due to the start of production at Fort Hills, and lower natural gas costs, partially offset by the addition of Fort Hills operating costs in 2018, increased DD&A and impairment charges, higher maintenance costs and additional operating costs associated with an increased working interest in Syncrude.
Funds from operations for the first nine months of 2018 were $4.269 billion for the segment, compared to $2.958 billion in the prior year period, with the increase primarily due to the same factors that influenced operating earnings noted above, apart from the increase in DD&A and impairment charges.
Oil Sands operations cash operating costs per barrel averaged $25.50 for the first nine months of 2018, an increase from an average of $23.65/bbl for the first nine months of 2017. The increase was largely driven by lower production volumes and higher maintenance costs, primarily associated with the first planned turnaround of Upgrader 1 since moving to a five-year cycle, partially offset by lower natural gas prices.
Fort Hills cash operating costs per barrel averaged $34.90 for the first nine months of 2018.
Syncrude cash operating costs per barrel averaged $56.25 for the first nine months of 2018, an increase compared to $49.50 in the first nine months of 2017 due to a decrease in production and higher operating and maintenance costs associated with the power disruption. These factors were partially offset by lower natural gas prices.
Planned Maintenance Update
Maintenance at Upgrader 2, which commenced in the third quarter of 2018, was completed subsequent to the end of the quarter. The impact of this event has been reflected in the company's 2018 guidance.
- (1)
- Non-GAAP financial measure. Refer to the Non-GAAP Financial Measures Advisory section of this MD&A.
| 18 2018 THIRD QUARTER Suncor Energy Inc. | | |
EXPLORATION AND PRODUCTION
Financial Highlights
| Three months ended September 30 | Nine months ended September 30 | |||||||||
($ millions) | 2018 | 2017 | 2018 | 2017 | ||||||
| | | | | | | | | | | |
Gross revenues(1) | 875 | 685 | 2 823 | 2 376 | ||||||
| | ||||||||||
Less: Royalties(1) | (91 | ) | (51 | ) | (238 | ) | (214 | ) | ||
| | | | | | | | | | | |
Operating revenues, net of royalties | 784 | 634 | 2 585 | 2 162 | ||||||
| | | | | | | | | | | |
Net earnings | 217 | 161 | 923 | 515 | ||||||
| | ||||||||||
Adjusted for: | ||||||||||
| | ||||||||||
Non-cash gain on asset exchange(2) | — | — | (133 | ) | — | |||||
| | | | | | | | | | | |
Operating Earnings(3) | 217 | 161 | 790 | 515 | ||||||
| | | | | | | | | | | |
Funds from operations(3) | 455 | 375 | 1 502 | 1 294 | ||||||
| | | | | | | | | | | |
- (1)
- Production, revenues and royalties from the company's Libya operations have been presented in the E&P section of this MD&A on an entitlement basis and exclude an equal and offsetting gross up of revenues and royalties, which is required for presentation purposes in the company's financial statements under the working-interest basis.
- (2)
- After-tax gain of $133 million related to the asset exchange with Canbriam for the company's mineral landholdings in northeast British Columbia in the first quarter of 2018.
- (3)
- Non-GAAP financial measures. See the Non-GAAP Financial Measures Advisory section of this MD&A.
Bridge Analysis of Operating Earnings($ millions)(1)
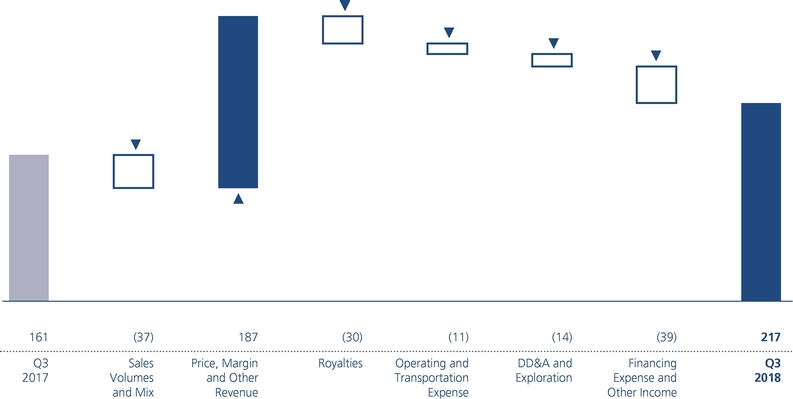
- (1)
- For an explanation of this bridge analysis, see the Non-GAAP Financial Measures Advisory section of this MD&A.
Operating earnings for the E&P segment in the third quarter of 2018 increased to $217 million, from $161 million in the prior year quarter, as a result of higher crude price realizations, partially offset by lower overall production, increased royalties, and higher DD&A and operating costs with the addition of Hebron.
| | | 2018 THIRD QUARTER Suncor Energy Inc. 19 |
Production Volumes
| Three months ended September 30 | Nine months ended September 30 | |||||||||
| 2018 | 2017 | 2018 | 2017 | |||||||
| | | | | | | | | | | |
E&P Canada | ||||||||||
| | ||||||||||
Terra Nova (mbbls/d) | 8.6 | 5.8 | 12.5 | 10.5 | ||||||
| | ||||||||||
Hibernia (mbbls/d) | 17.9 | 26.6 | 23.2 | 28.9 | ||||||
| | ||||||||||
White Rose (mbbls/d) | 8.0 | 9.0 | 7.6 | 11.7 | ||||||
| | ||||||||||
Hebron (mbbls/d) | 14.4 | — | 12.1 | — | ||||||
| | ||||||||||
North America Onshore (mboe/d) | — | 1.5 | 0.7 | 2.0 | ||||||
| | | | | | | | | | | |
| 48.9 | 42.9 | 56.1 | 53.1 | |||||||
| | ||||||||||
E&P International | ||||||||||
| | ||||||||||
Buzzard (mboe/d) | 29.6 | 44.3 | 36.4 | 46.2 | ||||||
| | ||||||||||
Golden Eagle (mboe/d) | 12.0 | 20.5 | 12.9 | 20.3 | ||||||
| | | | | | | | | | | |
United Kingdom (mboe/d) | 41.6 | 64.8 | 49.3 | 66.5 | ||||||
| | ||||||||||
Libya (mbbls/d) | 1.6 | 3.8 | 2.5 | 4.2 | ||||||
| | | | | | | | | | | |
| 43.2 | 68.6 | 51.8 | 70.7 | |||||||
| | | | | | | | | | | |
Total Production (mboe/d) | 92.1 | 111.5 | 107.9 | 123.8 | ||||||
| | ||||||||||
Production mix (liquids/gas) (%) | 99/1 | 98/2 | 99/1 | 97/3 | ||||||
| | | | | | | | | | | |
Total Sales Volumes (mboe/d) | 96.5 | 112.6 | 109.4 | 126.5 | ||||||
| | | | | | | | | | | |
E&P Canada production averaged 48,900 boe/d in the third quarter of 2018, compared to 42,900 boe/d in the prior year period. The increase was primarily due to the addition of production from Hebron and new production resulting from development drilling at existing East Coast assets, partially offset by the impact of planned maintenance at Hibernia and natural declines.
E&P International production decreased to 43,200 boe/d in the third quarter of 2018, compared to 68,600 boe/d in the prior year quarter, reflecting natural declines at both Buzzard and Golden Eagle and planned maintenance at Buzzard.
E&P sales volumes decreased to 96,500 boe/d in the third quarter of 2018, compared to 112,600 boe/d in the prior year quarter, due to the decrease in production, partially offset by a larger draw of inventory in East Coast Canada in the third quarter of 2018.
Price Realizations
| Three months ended September 30 | Nine months ended September 30 | |||||||||
Net of transportation costs, but before royalties | 2018 | 2017 | 2018 | 2017 | ||||||
| | | | | | | | | | | |
Exploration and Production | ||||||||||
| | ||||||||||
E&P Canada – Crude oil and natural gas liquids ($/bbl) | 97.22 | 65.06 | 91.28 | 66.00 | ||||||
| | ||||||||||
E&P Canada – Natural gas ($/mcfe) | — | 0.60 | 1.94 | 2.08 | ||||||
| | ||||||||||
E&P International ($/boe) | 92.24 | 60.88 | 88.01 | 62.89 | ||||||
| | | | | | | | | | | |
Price realizations from E&P Canada and E&P International were higher in the third quarter of 2018, compared to the prior year quarter, primarily due to an increase in benchmark Brent crude pricing and the impact of a weaker Canadian dollar.
| 20 2018 THIRD QUARTER Suncor Energy Inc. | | |
Royalties
E&P royalties in the third quarter of 2018 were higher than the prior year quarter due to higher crude realizations.
Expenses and Other Factors
Operating and transportation expenses for the third quarter of 2018 increased compared to the prior year quarter, primarily due to additional operating costs at Hebron, which began producing in the fourth quarter of 2017, and increased costs at Terra Nova and Hibernia related to planned maintenance activities, partially offset by lower operating costs in the U.K.
DD&A expense in the third quarter of 2018 was higher compared to the third quarter of 2017, primarily due to the addition of DD&A from the Hebron project, partially offset by lower U.K. production.
Results for the First Nine Months of 2018
Net earnings for E&P for the first nine months of 2018 were $923 million, compared to $515 million in the first nine months of 2017 and were influenced by the same factors noted in operating earnings below, in addition to an after-tax gain of $133 million related to the asset exchange with Canbriam for the company's mineral landholdings in northeast British Columbia in the first quarter of 2018.
Operating earnings for E&P for the first nine months of 2018 were $790 million, compared to $515 million in the first nine months of 2017. The increase was primarily due to higher crude price realizations, lower DD&A and lower exploration expense, partially offset by lower production, the addition of operating costs at Hebron and higher royalties.
Funds from operations were $1.502 billion for the first nine months of 2018, compared to $1.294 billion for the first nine months of 2017. The increase was primarily driven by the same factors influencing operating earnings, excluding exploration and non-cash DD&A items.
Planned Maintenance Update for Operated Assets
There are no significant maintenance events scheduled for the fourth quarter of 2018.
| | | 2018 THIRD QUARTER Suncor Energy Inc. 21 |
REFINING AND MARKETING
Financial Highlights
| Three months ended September 30 | Nine months ended September 30 | |||||||||
($ millions) | 2018 | 2017 | 2018 | 2017 | ||||||
| | | | | | | | | | | |
Operating revenues(1) | 6 737 | 5 076 | 18 073 | 14 342 | ||||||
| | | | | | | | | | | |
Net earnings | 939 | 597 | 2 430 | 1 772 | ||||||
| | ||||||||||
Adjusted for: | ||||||||||
| | ||||||||||
Gain on significant disposal(2) | — | — | — | (354 | ) | |||||
| | | | | | | | | | | |
Operating Earnings(3) | 939 | 597 | 2 430 | 1 418 | ||||||
| | | | | | | | | | | |
Funds from operations(3) | 1 119 | 827 | 2 968 | 1 906 | ||||||
| | | | | | | | | | | |
- (1)
- The three- and nine-month periods ended September 30, 2017 have been restated in accordance with the new IFRS 15 revenue requirements, with no impact to net earnings or operating earnings. For further information on the restatements associated with IFRS 15, refer to note 3 in Suncor's Consolidated Financial Statements for the three- and nine-month periods ended September 30, 2018.
- (2)
- After-tax gain related to the sale of the company's Petro-Canada lubricants business during the first quarter of 2017.
- (3)
- Non-GAAP financial measures. See the Non-GAAP Financial Measures Advisory section of this MD&A.
Bridge Analysis of Operating Earnings($ millions)(1)
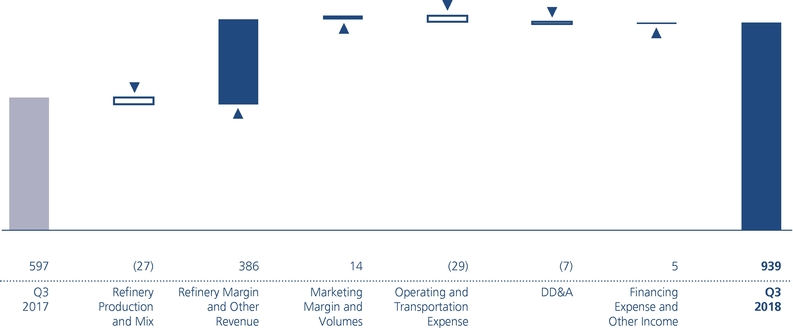
- (1)
- For an explanation of this bridge analysis, see the Non-GAAP Financial Measures Advisory section of this MD&A.
R&M operating earnings in the third quarter of 2018 represent a new quarterly record at $939 million, compared to $597 million in the prior year quarter. The increase is due to improved refining margins resulting from wider crude differentials (partially offsetting the impact in Oil Sands) and favourable product location differentials, as well as stronger sales volumes attributable to strong product demand. These factors were partially offset by an increase in operating costs.
| 22 2018 THIRD QUARTER Suncor Energy Inc. | | |
Volumes
| Three months ended September 30 | Nine months ended September 30 | |||||||||
| 2018 | 2017 | 2018 | 2017 | |||||||
| | | | | | | | | | | |
Crude oil processed (mbbls/d) | ||||||||||
| | ||||||||||
Eastern North America | 211.6 | 213.9 | 203.8 | 212.3 | ||||||
| | ||||||||||
Western North America | 245.6 | 252.9 | 214.5 | 231.9 | ||||||
| | | | | | | | | | | |
Total | 457.2 | 466.8 | 418.3 | 444.2 | ||||||
| | | | | | | | | | | |
Refinery utilization(1) (%) | ||||||||||
| | ||||||||||
Eastern North America | 95 | 96 | 92 | 96 | ||||||
| | ||||||||||
Western North America | 102 | 105 | 89 | 97 | ||||||
| | | | | | | | | | | |
Total | 99 | 101 | 91 | 96 | ||||||
| | | | | | | | | | | |
Refined product sales (mbbls/d) | ||||||||||
| | ||||||||||
Gasoline | 261.0 | 257.6 | 245.7 | 241.6 | ||||||
| | ||||||||||
Distillate | 217.7 | 212.5 | 201.3 | 198.7 | ||||||
| | ||||||||||
Other | 86.8 | 94.4 | 79.3 | 91.4 | ||||||
| | | | | | | | | | | |
Total | 565.5 | 564.5 | 526.3 | 531.7 | ||||||
| | | | | | | | | | | |
Refining margin(2) ($/bbl) | 34.45 | 24.25 | 31.05 | 21.90 | ||||||
| | ||||||||||
Refining operating expense(2) ($/bbl) | 5.00 | 4.50 | 5.30 | 5.00 | ||||||
| | | | | | | | | | | |
- (1)
- Refinery utilization is the amount of crude oil and natural gas plant liquids run through crude distillation units, expressed as a percentage of the capacity of these units.
- (2)
- Non-GAAP financial measures. See the Non-GAAP Financial Measures Advisory section of this MD&A. Refining margins have been presented on a LIFO basis as management uses this basis to assess performance, with the prior period restated to reflect this change.
Refinery crude throughput in the third quarter of 2018 was 457,200 bbls/d, compared to 466,800 bbls/d in the prior year quarter. Both periods achieved high utilization rates at 99% and 101%, respectively, with the third quarter of 2018 reflecting the impact of planned refinery maintenance at Montreal.
Total refined products sales of 565,500 bbls/d were comparable to 564,500 bbls/d in the prior year quarter.
Prices and Margin
Realized refined product gross margins were higher in the third quarter of 2018, compared to the prior year quarter, and were impacted primarily by the following factors:
- •
- A favourable business environment, driven by wider crude differentials, improved product location differentials, stronger distillate crack spreads and the impact of a weaker Canadian dollar.
- •
- In the third quarter of 2018, the impact of the FIFO method of inventory valuation, as used by the company, relative to an estimated LIFO(1) method, had a negative impact on operating earnings of $23 million after-tax, compared to a negative impact of $27 million after-tax in the prior year quarter, for a favourable quarter-over-quarter impact of $4 million.
Marketing gross margins in the third quarter of 2018 were higher than in the prior year quarter, primarily due to higher wholesale sales as well as stronger wholesale unit margins.
Expenses and Other Factors
Operating expenses in the third quarter of 2018 were higher than the prior year quarter due to an increase in support services, transportation and additional retail variable selling costs, partially offset by lower natural gas input prices.
- (1)
- The estimated impact of the LIFO method is a non-GAAP financial measure. See the Non-GAAP Financial Measures Advisory section of this MD&A.
| | | 2018 THIRD QUARTER Suncor Energy Inc. 23 |
Results for the First Nine Months of 2018
Net earnings for R&M in the first nine months of 2018 were $2.430 billion, compared to $1.772 billion in the first nine months of 2017, and were influenced by the same factors noted in operating earnings below, in addition to an after-tax gain related to the sale of the company's Petro-Canada lubricants business in the first quarter of 2017.
Operating earnings for R&M in the first nine months of 2018 were $2.430 billion, compared to $1.418 billion in the first nine months of 2017, with the increase attributable to favourable crude differentials, improved product location differentials, higher distillate cracks spreads, and a FIFO gain, partially offset by lower crude throughput. For the first nine months of 2018, the impact of the FIFO method of inventory valuation, as used by the company, relative to an estimated LIFO method, had a positive impact to operating earnings and funds from operations of $181 million after-tax, compared to a negative impact of $22 million after-tax in the first nine months of 2017.
Funds from operations were $2.968 billion in the first nine months of 2018, compared to $1.906 billion in the first nine months of 2017, and increased primarily due to the same factors that influenced operating earnings described above.
Suncor completed the sale of its Petro-Canada lubricants business during the first quarter of 2017, which contributed $8 million in net earnings and $11 million in funds from operations for the first nine months of 2017.
Planned Maintenance
The company has completed all major planned refinery maintenance for 2018 and there are no major events scheduled for the fourth quarter of 2018.
CORPORATE, ENERGY TRADING AND ELIMINATIONS
Financial Highlights
| Three months ended September 30 | Nine months ended September 30 | |||||||||
($ millions) | 2018 | 2017 | 2018 | 2017 | ||||||
| | | | | | | | | | | |
Net (loss) earnings | (140 | ) | 217 | (1 026 | ) | 450 | ||||
| | | | | | | | | | | |
Adjusted for: | ||||||||||
| | ||||||||||
Unrealized foreign exchange (gain) loss on U.S. dollar denominated debt | (195 | ) | (412 | ) | 352 | (793 | ) | |||
| | ||||||||||
Non-cash mark to market (gain) loss on interest rate swaps and foreign currency derivatives(1) | — | (10 | ) | — | 22 | |||||
| | ||||||||||
Non-cash loss on early payment of long-term debt(2) | — | — | — | 10 | ||||||
| | ||||||||||
Gain on significant disposal(3) | — | — | — | (83 | ) | |||||
| | | | | | | | | | | |
Operating (loss) earnings(4) | (335 | ) | (205 | ) | (674 | ) | (394 | ) | ||
| | ||||||||||
Renewable Energy | (1 | ) | (2 | ) | — | (3 | ) | |||
| | ||||||||||
Energy Trading | 24 | (32 | ) | 37 | (47 | ) | ||||
| | ||||||||||
Corporate | (277 | ) | (129 | ) | (698 | ) | (344 | ) | ||
| | ||||||||||
Eliminations | (81 | ) | (42 | ) | (13 | ) | — | |||
| | | | | | | | | | | |
Funds (used in) from operations(4) | (279 | ) | (6 | ) | (574 | ) | (35 | ) | ||
| | | | | | | | | | | |
- (1)
- Non-cash mark to market (gain) loss on interest rate swaps and foreign currency derivatives resulting from changes in long-term interest rates and foreign exchange rates.
- (2)
- Charges associated with the early repayment of debt, net of associated realized foreign currency hedge gains.
- (3)
- After-tax gain of $83 million related to the sale of the company's interest in the Cedar Point wind facility.
- (4)
- Non-GAAP financial measures. See the Non-GAAP Financial Measures Advisory section of this MD&A.
| 24 2018 THIRD QUARTER Suncor Energy Inc. | | |
Renewable Energy
| Three months ended September 30 | Nine months ended September 30 | |||||||||
| 2018 | 2017 | 2018 | 2017 | |||||||
| | | | | | | | | | | |
Power generation marketed (gigawatt hours)(1) | 29 | 32 | 128 | 195 | ||||||
| | | | | | | | | | | |
- (1)
- Power generated includes curtailed production for which the company was compensated.
Renewable Energy had a $1 million operating loss in the third quarter of 2018, comparable to an operating loss of $2 million in the prior year quarter.
Energy Trading
Operating earnings for Energy Trading were $24 million in the third quarter of 2018, compared to an operating loss of $32 million in the third quarter of 2017, due to favourable crude location spreads.
Corporate
The Corporate operating loss was $277 million for the third quarter of 2018, compared to an operating loss of $129 million for the prior year quarter, with the increased loss attributable to a significant decrease in capitalized interest following the commissioning of the company's major growth projects, as well as the prior year quarter including favourable tax recoveries and reassessments. These factors were partially offset by lower non-cash share-based compensation expense and a smaller operational foreign exchange loss than the prior year quarter. Suncor capitalized $26 million of its borrowing costs in the third quarter of 2018 as part of the cost of major development assets and construction projects in progress, compared to $182 million in the prior year quarter, as a result of commissioning the company's Fort Hills and Hebron growth projects.
Eliminations
Eliminations reflect the deferral or realization of profit on crude oil sales from Oil Sands to Suncor's refineries. Consolidated profits are only realized when the refined products produced from internal purchases of crude feedstock have been sold to third parties. During the third quarter of 2018, the company eliminated $81 million of after-tax intersegment profit, compared to $42 million of after-tax intersegment profit eliminated in the prior year quarter. The increase in the elimination is primarily due to an increase in the proportion of Oil Sands intercompany inventory volumes at the company's refineries in the third quarter of 2018 following the completion of spring maintenance in the second quarter of 2018.
Corporate, Energy Trading and Eliminations funds used in operations for the third quarter of 2018 were $279 million, compared to $6 million in the prior year period. In addition to the cash factors noted in operating earnings above, the increase in funds used in operations was due to the prior year quarter being favourably impacted by current tax recoveries associated with the early repayment of debt.
Results for the First Nine Months of 2018
The net loss for Corporate, Energy Trading and Eliminations for the first nine months of 2018 was $1.026 billion, compared to net earnings of $450 million in the first nine months of 2017. In addition to the factors noted below in operating loss, the first nine months of 2018 included a $352 million unrealized after-tax foreign exchange loss on the revaluation of U.S. dollar denominated debt. The first nine months of 2017 included an unrealized after-tax foreign exchange gain on the revaluation of U.S. dollar denominated debt of $793 million, a non-cash mark to market loss on interest rate swaps and foreign currency derivatives of $22 million, a $10 million after-tax loss associated with the early repayment of debt, net of associated realized foreign currency hedge gains, and an after-tax gain of $83 million related to the sale of the company's interest in the Cedar Point wind facility.
The operating loss for Corporate, Energy Trading and Eliminations for the first nine months of 2018 was $674 million, compared to an operating loss of $394 million in the first nine months of 2017. The increased loss is attributed to lower capitalized interest, an increase in non-cash share-based compensation expense and lower operational foreign exchange gains, partially offset by a lower amount of intersegment profit eliminated. The company capitalized $128 million of its borrowing costs in the first nine months of 2018, compared with $552 million in the first nine months of 2017, with the decrease a result of the commissioning of the company's major growth projects.
Corporate, Energy Trading and Eliminations funds used in operations for the first nine months of 2018 were $574 million, compared to $35 million in the prior year period. In addition to the cash factors noted above in operating earnings, funds from operations in the first nine months of the prior year were favourably impacted by tax recoveries associated with the early repayment of debt.
| | | 2018 THIRD QUARTER Suncor Energy Inc. 25 |
Capital and Exploration Expenditures by Segment
| Three months ended September 30 | Nine months ended September 30 | |||||||||
($ millions) | 2018 | 2017 | 2018 | 2017 | ||||||
| | | | | | | | | | | |
Oil Sands | 770 | 1 340 | 2 883 | 3 899 | ||||||
| | ||||||||||
Exploration and Production | 245 | 189 | 661 | 631 | ||||||
| | ||||||||||
Refining and Marketing | 180 | 159 | 667 | 385 | ||||||
| | ||||||||||
Corporate, Energy Trading and Eliminations | 11 | 7 | 48 | 15 | ||||||
| | | | | | | | | | | |
Total capital and exploration expenditures | 1 206 | 1 695 | 4 259 | 4 930 | ||||||
| | ||||||||||
Less: capitalized interest on debt | (26 | ) | (182 | ) | (128 | ) | (552 | ) | ||
| | | | | | | | | | | |
| 1 180 | 1 513 | 4 131 | 4 378 | |||||||
| | | | | | | | | | | |
Capital and Exploration Expenditures by Type(1)
| Three months ended September 30, 2018 | Nine months ended September 30, 2018 | |||||||||||||
($ millions) | Sustaining(2) | Growth(3) | Total | Sustaining(2) | Growth(3) | Total | ||||||||
| | | | | | | | | | | | | | | |
Oil Sands | ||||||||||||||
| | ||||||||||||||
Oil Sands Base | 411 | 8 | 419 | 1 454 | 28 | 1 482 | ||||||||
| | ||||||||||||||
In Situ | 85 | 4 | 89 | 270 | 20 | 290 | ||||||||
| | ||||||||||||||
Fort Hills | 60 | 27 | 87 | 159 | 350 | 509 | ||||||||
| | ||||||||||||||
Syncrude | 162 | — | 162 | 497 | 3 | 500 | ||||||||
| | ||||||||||||||
Exploration and Production | — | 235 | 235 | 8 | 630 | 638 | ||||||||
| | ||||||||||||||
Refining and Marketing | 179 | — | 179 | 666 | — | 666 | ||||||||
| | ||||||||||||||
Corporate, Energy Trading and Eliminations | 9 | — | 9 | 46 | — | 46 | ||||||||
| | | | | | | | | | | | | | | |
| 906 | 274 | 1 180 | 3 100 | 1 031 | 4 131 | |||||||||
| | | | | | | | | | | | | | | |
- (1)
- Capital expenditures in this table exclude capitalized interest on debt.
- (2)
- Sustaining capital expenditures include capital investments that i) ensure compliance or maintain relations with regulators and other stakeholders; ii) improve efficiency and reliability of operations or maintain productive capacity by replacing component assets at the end of their useful lives; iii) deliver existing proved developed reserves for E&P operations; or iv) maintain current production capacities at existing Oil Sands and R&M operations.
- (3)
- Growth capital expenditures include capital investments that result in i) an increase in production levels at existing Oil Sands and R&M operations; ii) new facilities or operations that increase overall production; iii) new infrastructure that is required to support higher production levels; iv) new reserves or a positive change in the company's reserves profile in E&P operations; or v) margin improvement by increasing revenues or reducing costs.
In the third quarter of 2018, total capital and exploration expenditures were $1.180 billion (excluding capitalized interest), compared to $1.513 billion in the prior year period, with the decrease driven primarily by the commissioning of the company's significant growth projects, Fort Hills and Hebron, partially offset by increased sustaining capital expenditures related to an increase in planned maintenance activities.
Activity in the third quarter of 2018 is summarized by business unit below.
Oil Sands
Oil Sands Base
Oil Sands Base capital and exploration expenditures were $419 million in the third quarter of 2018, the majority of which was focused on sustaining activities related to the company's planned maintenance program, which included commencement of a turnaround at Upgrader 2, the continued development of tailings infrastructure, and other reliability and sustainment projects across the operations.
| 26 2018 THIRD QUARTER Suncor Energy Inc. | | |
In Situ
In Situ capital and exploration expenditures were $89 million in the third quarter of 2018, and were primarily directed towards sustaining activities, including well pad construction that is expected to maintain existing production levels at Firebag and MacKay River.
Fort Hills
Capital expenditures at Fort Hills were $87 million in the third quarter of 2018, of which $27 million was related to growth spending focused on ramping up to target production rates. Sustaining capital activities focused on mine and tailings development to support future production.
Syncrude
Syncrude capital and exploration expenditures were $162 million in the third quarter of 2018, the majority of which was for sustaining capital expenditures focused on maintaining existing assets, including capital related to the upgrader turnaround that was advanced into the third quarter of 2018 to coincide with the return to service following the power disruption that occurred late in the second quarter of 2018.
Exploration and Production
Capital and exploration expenditures at E&P were $235 million in the third quarter of 2018 and were focused on growth projects, including development drilling at all offshore producing assets and continued development work on the West White Rose Project, and the Norwegian Oda and Fenja projects.
The Buzzard Phase 2 project, in which Suncor is a non-operating partner with a working interest of 29.9%, was sanctioned in the third quarter of 2018 by Suncor and the other project partners. First oil from the project is anticipated in early 2021.
Refining and Marketing
R&M capital expenditures were $179 million and were primarily related to the ongoing sustainment of operations, enhancements to retail operations, information technology upgrades, and planned refinery maintenance.
Corporate, Energy Trading and Eliminations
Corporate capital expenditures were $9 million, primarily directed towards the company's information technology initiatives.
| | | 2018 THIRD QUARTER Suncor Energy Inc. 27 |
6. FINANCIAL CONDITION AND LIQUIDITY
Indicators
| Twelve months ended September 30 | ||||||
| 2018 | 2017 | |||||
| | | | | | | |
Return on Capital Employed(1) (%) | ||||||
| | ||||||
Excluding major projects in progress | 10.4 | 7.0 | ||||
| | ||||||
Including major projects in progress | 9.7 | 5.5 | ||||
| | | | | | | |
Net debt to funds from operations(2) (times) | 1.3 | 1.6 | ||||
| | | | | | | |
Interest coverage on long-term debt (times) | ||||||
| | ||||||
Earnings basis(3) | 8.3 | 5.2 | ||||
| | ||||||
Funds from operations basis(2),(4) | 14.7 | 10.2 | ||||
| | | | | | | |
- (1)
- Non-GAAP financial measure. See the Non-GAAP Financial Measures Advisory section of this MD&A.
- (2)
- Funds from operations and metrics that use funds from operations are non-GAAP financial measures. See the Non-GAAP Financial Measures Advisory section of this MD&A.
- (3)
- Equal to net earnings plus income taxes and interest expense, divided by the sum of interest expense and capitalized interest on debt.
- (4)
- Equal to funds from operations plus current income taxes and interest expense, divided by the sum of interest expense and capitalized interest on debt.
Capital Resources
Suncor's capital resources consist primarily of cash flow provided by operating activities, cash and cash equivalents, available lines of credit and proceeds received from the divestiture of non-core assets. Suncor's management believes the company will have the capital resources to fund its planned 2018 capital spending program of $5.2 – $5.5 billion and to meet current and future working capital requirements, through cash balances and cash equivalents, cash flow provided by operating activities, available committed credit facilities, issuing commercial paper and, if needed, divesting of non-core assets and accessing capital markets. The company's cash flow provided by operating activities depends on a number of factors, including commodity prices, production and sales volumes, refining and marketing margins, operating expenses, taxes, royalties and foreign exchange rates.
The company has invested cash in short-term financial instruments that are presented as cash and cash equivalents. The objectives of the company's short-term investment portfolio are to ensure the preservation of capital, maintain adequate liquidity to meet Suncor's cash flow requirements and deliver competitive returns derived from the quality and diversification of investments within acceptable risk parameters. The maximum weighted average term to maturity of the short-term investment portfolio is not expected to exceed six months, and all investments will be with counterparties with investment grade debt ratings.
Available Sources of Liquidity
Cash and cash equivalents decreased to $2.332 billion during the first nine months of 2018, from $2.672 billion at December 31, 2017, as a result of the company's decision to hold less cash following the commissioning of Fort Hills and Hebron. The company's cash balance was impacted by capital and exploration expenditures and dividend requirements, the purchase of Suncor's own shares under its normal course issuer bid (NCIB) and the acquisition of an additional 5% working interest in Syncrude in the first quarter of 2018, partially offset by cash flow provided by operating activities and an increase in short-term indebtedness.
As at September 30, 2018, the weighted average term to maturity of the company's short-term investment portfolio was approximately 12 days.
Available credit facilities for liquidity purposes at September 30, 2018 decreased to $3.709 billion, compared to $4.489 billion at December 31, 2017, which was primarily a result of the increase in short-term indebtedness noted above.
Financing Activities
Management of debt levels continues to be a priority for Suncor given the company's long-term growth plans and future expected volatility in the pricing environment. Suncor believes a phased and flexible approach to existing and future growth projects should assist the company in maintaining its ability to manage project costs and debt levels.
| 28 2018 THIRD QUARTER Suncor Energy Inc. | | |
Total Debt to Total Debt Plus Shareholders' Equity
Suncor is subject to financial and operating covenants related to its bank debt and public market debt. Failure to meet the terms of one or more of these covenants may constitute an "event of default" as defined in the respective debt agreements, potentially resulting in accelerated repayment of one or more of the debt obligations. The company is in compliance with its financial covenant that requires total debt to not exceed 65% of its total debt plus shareholders' equity. At September 30, 2018, total debt to total debt plus shareholders' equity was 26.7% (December 31, 2017 – 25.6%). The company continues to be in compliance with all operating covenants.
| September 30 | December 31 | |||||
($ millions, except as noted) | 2018 | 2017 | ||||
| | | | | | | |
Short-term debt | 2 989 | 2 136 | ||||
| | ||||||
Current portion of long-term debt | 334 | 71 | ||||
| | ||||||
Long-term debt | 13 354 | 13 372 | ||||
| | | | | | | |
Total debt | 16 677 | 15 579 | ||||
| | ||||||
Less: Cash and cash equivalents | 2 332 | 2 672 | ||||
| | | | | | | |
Net debt | 14 345 | 12 907 | ||||
| | ||||||
Shareholders' equity | 45 800 | 45 383 | ||||
| | | | | | | |
Total debt plus shareholders' equity | 62 477 | 60 962 | ||||
| | | | | | | |
Total debt to total debt plus shareholders' equity (%) | 26.7 | 25.6 | ||||
| | | | | | | |
Change in Debt
($ millions) | Three months ended September 30, 2018 | Nine months ended September 30, 2018 | ||||
| | | | | | | |
Total debt – beginning of period | 18 146 | 15 579 | ||||
| | ||||||
Net decrease in long-term debt | (19 | ) | (54 | ) | ||
| | ||||||
(Decrease) increase in short-term debt | (1 230 | ) | 749 | |||
| | ||||||
Foreign exchange on debt, and other | (220 | ) | 403 | |||
| | | | | | | |
Total debt – September 30, 2018 | 16 677 | 16 677 | ||||
| | ||||||
Less: Cash and cash equivalents – September 30, 2018 | 2 332 | 2 332 | ||||
| | | | | | | |
Net debt – September 30, 2018 | 14 345 | 14 345 | ||||
| | | | | | | |
The company's total debt decreased in the third quarter of 2018 due to a decrease in short-term indebtedness, as well as the impact of favourable foreign exchange rates on U.S. dollar denominated debt compared to June 30, 2018.
On a year to date basis, the company's total debt increased in 2018 due to an overall increase in short-term indebtedness combined with the unfavourable impact of foreign exchange rates on U.S. dollar denominated debt compared to December 31, 2017, partially offset by a decrease in long-term debt associated with the payments made for the company's finance lease obligations.
Subsequent to the end of the third quarter, as part of the company's commitment to debt reduction, Suncor repurchased US$83 million of 7.75% Senior Notes due in 2019 (2019 Notes). The aggregate principal amount of 2019 Notes that remain outstanding has been reduced to US$140 million as a result of the purchase.
| | | 2018 THIRD QUARTER Suncor Energy Inc. 29 |
Common Shares
Outstanding Shares
(thousands) | September 30, 2018 | |||
| | | | | |
Common shares | 1 611 116 | |||
| | ||||
Common share options – exercisable | 15 407 | |||
| | ||||
Common share options – non-exercisable | 13 561 | |||
| | | | | |
As at October 29, 2018, the total number of common shares outstanding was 1,604,590,320 and the total number of exercisable and non-exercisable common share options outstanding was 28,912,484. Once exercisable, each outstanding common share option is convertible into one common share.
Share Repurchases
Under the company's NCIB that commenced in the second quarter of 2018, the company is permitted to purchase common shares for cancellation through the facilities of the Toronto Stock Exchange (TSX), New York Stock Exchange and/or alternative trading platforms from May 4, 2018 to May 3, 2019.
During the third quarter of 2018, Suncor repurchased and cancelled 16,841,078 common shares at an average price of $52.77 per share, for $889 million, compared to the prior year quarter when the company repurchased and cancelled 7,219,782 common shares at an average price of $39.19 per share, for $282 million.
| Three months ended September 30 | Nine months ended September 30 | |||||||||
($ millions, except as noted) | 2018 | 2017 | 2018 | 2017 | ||||||
| | | | | | | | | | | |
Share repurchase activities (thousands of common shares) | 16 841 | 7 220 | 37 700 | 14 441 | ||||||
| | ||||||||||
Weighted average repurchase price per share (dollars per share) | 52.77 | 39.19 | 50.05 | 40.06 | ||||||
| | ||||||||||
Share repurchase cost | 889 | 282 | 1 887 | 578 | ||||||
| | | | | | | | | | | |
Contractual Obligations, Commitments, Guarantees, and Off-Balance Sheet Arrangements
In the normal course of business, the company is obligated to make future payments, including contractual obligations and non-cancellable commitments. Suncor has included these items in the Financial Condition and Liquidity section of the 2017 annual MD&A and has provided an update below. Suncor does not believe that it has any guarantees or off-balance sheet arrangements that have, or are reasonably likely to have, a current or future material effect on the company's financial performance or financial condition, results of operations, liquidity or capital expenditures.
During the nine months ended September 30, 2018, Suncor increased its commitments by approximately $540 million (undiscounted), which is primarily related to renewal of an oil tankage lease, a diluent storage service arrangement and additional mining equipment at Fort Hills and Oil Sands Base.
| 30 2018 THIRD QUARTER Suncor Energy Inc. | | |
Trends in Suncor's quarterly revenue, earnings and funds from operations(1) are driven primarily by production volumes, which can be significantly impacted by major maintenance events, changes in commodity prices, including widening of crude differentials, refining crack spreads, foreign exchange rates and other significant events impacting operations, such as the Syncrude power outage that occurred late in the second quarter of 2018.
Financial Summary
Three months ended | Sept 30 2018 | June 30 2018 | Mar 31 2018 | Dec 31 2017 | Sept 30 2017 | June 30 2017 | Mar 31 2017 | Dec 31 2016 | ||||||||||
| | | | | | | | | | | | | | | | | | | |
Total production (mboe/d) | ||||||||||||||||||
| | ||||||||||||||||||
Oil Sands | 651.7 | 547.6 | 571.7 | 621.2 | 628.4 | 413.6 | 590.6 | 620.4 | ||||||||||
| | ||||||||||||||||||
Exploration and Production | 92.1 | 114.1 | 117.7 | 115.2 | 111.5 | 125.5 | 134.5 | 118.1 | ||||||||||
| | | | | | | | | | | | | | | | | | | |
| 743.8 | 661.7 | 689.4 | 736.4 | 739.9 | 539.1 | 725.1 | 738.5 | |||||||||||
| | | | | | | | | | | | | | | | | | | |
Revenues and other income | ||||||||||||||||||
| | ||||||||||||||||||
Operating revenues, net of royalties | 10 847 | 10 327 | 8 807 | 8 973 | 7 963 | 7 231 | 7 787 | 7 805 | ||||||||||
| | ||||||||||||||||||
Other income (loss) | 16 | 101 | (57 | ) | 41 | 43 | 16 | 25 | 301 | |||||||||
| | | | | | | | | | | | | | | | | | | |
| 10 863 | 10 428 | 8 750 | 9 014 | 8 006 | 7 247 | 7 812 | 8 106 | |||||||||||
| | | | | | | | | | | | | | | | | | | |
Net earnings | 1 812 | 972 | 789 | 1 382 | 1 289 | 435 | 1 352 | 531 | ||||||||||
| | ||||||||||||||||||
per common share – basic (dollars) | 1.12 | 0.60 | 0.48 | 0.84 | 0.78 | 0.26 | 0.81 | 0.32 | ||||||||||
| | ||||||||||||||||||
per common share – diluted (dollars) | 1.11 | 0.59 | 0.48 | 0.84 | 0.78 | 0.26 | 0.81 | 0.32 | ||||||||||
| | | | | | | | | | | | | | | | | | | |
Operating Earnings(1) | 1 557 | 1 190 | 985 | 1 310 | 867 | 199 | 812 | 636 | ||||||||||
| | ||||||||||||||||||
per common share – basic(1) (dollars) | 0.96 | 0.73 | 0.60 | 0.79 | 0.52 | 0.12 | 0.49 | 0.38 | ||||||||||
| | | | | | | | | | | | | | | | | | | |
Funds from operations(1) | 3 139 | 2 862 | 2 164 | 3 016 | 2 472 | 1 627 | 2 024 | 2 365 | ||||||||||
| | ||||||||||||||||||
per common share – basic(1) (dollars) | 1.94 | 1.75 | 1.32 | 1.83 | 1.49 | 0.98 | 1.21 | 1.42 | ||||||||||
| | | | | | | | | | | | | | | | | | | |
Cash flow provided by operating activities | 4 370 | 2 446 | 724 | 2 755 | 2 912 | 1 671 | 1 628 | 2 791 | ||||||||||
| | ||||||||||||||||||
per common share – basic (dollars) | 2.70 | 1.50 | 0.44 | 1.67 | 1.75 | 1.00 | 0.98 | 1.68 | ||||||||||
| | | | | | | | | | | | | | | | | | | |
ROCE(1) (%) for the twelve months ended | 9.7 | 8.3 | 6.5 | 6.7 | 5.5 | 4.9 | 3.5 | 0.4 | ||||||||||
| | | | | | | | | | | | | | | | | | | |
ROCE(1), excluding major projects in progress (%) for twelve months ended | 10.4 | 9.5 | 7.8 | 8.6 | 7.0 | 6.2 | 4.4 | 0.5 | ||||||||||
| | | | | | | | | | | | | | | | | | | |
After-tax unrealized foreign exchange (loss) gain on U.S. dollar denominated debt | 195 | (218 | ) | (329 | ) | (91 | ) | 412 | 278 | 103 | (222 | ) | ||||||
| | | | | | | | | | | | | | | | | | | |
Common share information (dollars) | ||||||||||||||||||
| | ||||||||||||||||||
Dividend per common share | 0.36 | 0.36 | 0.36 | 0.32 | 0.32 | 0.32 | 0.32 | 0.29 | ||||||||||
| | ||||||||||||||||||
Share price at the end of trading | ||||||||||||||||||
| | ||||||||||||||||||
Toronto Stock Exchange (Cdn$) | 49.98 | 53.50 | 44.49 | 46.15 | 43.73 | 37.89 | 40.83 | 43.90 | ||||||||||
| | ||||||||||||||||||
New York Stock Exchange (US$) | 38.69 | 40.68 | 34.54 | 36.72 | 35.05 | 29.20 | 30.75 | 32.69 | ||||||||||
| | | | | | | | | | | | | | | | | | | |
- (1)
- Non-GAAP financial measures. See the Non-GAAP Financial Measures Advisory section of this MD&A. ROCE excludes capitalized costs related to major projects in progress.
| | | 2018 THIRD QUARTER Suncor Energy Inc. 31 |
Business Environment
Three months ended | Sept 30 2018 | June 30 2018 | Mar 31 2018 | Dec 31 2017 | Sept 30 2017 | June 30 2017 | Mar 31 2017 | Dec 31 2016 | ||||||||||||
| | | | | | | | | | | | | | | | | | | | | |
WTI crude oil at Cushing | US$/bbl | 69.50 | 67.90 | 62.90 | 55.40 | 48.20 | 48.30 | 51.85 | 49.35 | |||||||||||
| | ||||||||||||||||||||
Dated Brent crude | US$/bbl | 75.25 | 74.40 | 66.80 | 61.40 | 52.50 | 49.85 | 53.75 | 49.50 | |||||||||||
| | ||||||||||||||||||||
Dated Brent/Maya FOB price differential | US$/bbl | 9.15 | 12.40 | 7.70 | 9.60 | 6.30 | 5.80 | 9.05 | 6.70 | |||||||||||
| | ||||||||||||||||||||
MSW at Edmonton | Cdn$/bbl | 81.40 | 80.95 | 72.45 | 69.30 | 57.05 | 62.30 | 64.25 | 62.00 | |||||||||||
| | ||||||||||||||||||||
WCS at Hardisty | US$/bbl | 47.35 | 48.65 | 38.60 | 43.10 | 38.25 | 37.20 | 37.30 | 35.00 | |||||||||||
| | ||||||||||||||||||||
Light/heavy crude oil differential for WTI at Cushing less WCS at Hardisty | US$/bbl | 22.15 | 19.25 | 24.30 | 12.30 | 9.95 | 11.10 | 14.55 | 14.35 | |||||||||||
| | ||||||||||||||||||||
Condensate at Edmonton | US$/bbl | 66.80 | 68.50 | 63.15 | 57.95 | 47.60 | 48.45 | 52.20 | 48.35 | |||||||||||
| | ||||||||||||||||||||
Natural gas (Alberta spot) at AECO | Cdn$/mcf | 1.20 | 1.20 | 1.75 | 1.70 | 1.45 | 2.80 | 2.70 | 3.10 | |||||||||||
| | ||||||||||||||||||||
Alberta Power Pool Price | Cdn$/MWh | 54.45 | 56.00 | 34.95 | 22.35 | 24.55 | 19.30 | 22.40 | 21.95 | |||||||||||
| | ||||||||||||||||||||
New York Harbor 3-2-1 crack(1) | US$/bbl | 19.65 | 20.65 | 15.50 | 19.40 | 22.35 | 16.35 | 12.55 | 14.35 | |||||||||||
| | ||||||||||||||||||||
Chicago 3-2-1 crack(1) | US$/bbl | 19.05 | 18.30 | 12.85 | 20.20 | 19.25 | 14.40 | 11.15 | 10.55 | |||||||||||
| | ||||||||||||||||||||
Portland 3-2-1 crack(1) | US$/bbl | 21.40 | 27.90 | 20.35 | 22.10 | 26.80 | 21.25 | 18.45 | 14.95 | |||||||||||
| | ||||||||||||||||||||
Gulf Coast 3-2-1 crack(1) | US$/bbl | 18.85 | 20.25 | 15.55 | 18.25 | 21.45 | 16.80 | 14.00 | 13.15 | |||||||||||
| | ||||||||||||||||||||
Exchange rate | US$/Cdn$ | 0.77 | 0.77 | 0.79 | 0.79 | 0.80 | 0.74 | 0.76 | 0.75 | |||||||||||
| | ||||||||||||||||||||
Exchange rate (end of period) | US$/Cdn$ | 0.77 | 0.76 | 0.78 | 0.80 | 0.80 | 0.77 | 0.75 | 0.74 | |||||||||||
| | | | | | | | | | | | | | | | | | | | | |
- (1)
- 3-2-1 crack spreads are indicators of the refining margin generated by converting three barrels of WTI into two barrels of gasoline and one barrel of diesel. The crack spreads presented here generally approximate the regions into which the company sells refined products through retail and wholesale channels.
Significant or Unusual Items Impacting Net Earnings
In addition to the impacts of changes in production volumes and business environment, net earnings over the last eight quarters were affected by the following events or one-time adjustments:
- •
- The third quarter of 2018 included an after-tax gain of $60 million in the Oil Sands segment on the sale of the company's interest in the Joslyn Oil Sands mining project.
- •
- In the first quarter of 2018, the company recorded a non-cash after-tax gain of $133 million in the E&P segment related to the asset exchange with Canbriam for Suncor's mineral landholdings in northeast British Columbia.
- •
- In the fourth quarter of 2017, net earnings included a $124 million deferred income tax recovery related to a decrease in the U.S. corporate tax rate from 35% to 21%, after-tax insurance proceeds of $55 million related to the facility incident at Syncrude that occurred in the first quarter of 2017, an after-tax loss of $18 million related to the early repayment of long-term debt and a $2 million gain on interest rate swaps.
- •
- In the third quarter of 2017, Suncor recognized a non-cash after-tax gain on interest rate swaps of $10 million in the Corporate segment due to an increase in long-term interest rates; the non-cash after-tax loss on interest rate swaps due to a decline in long-term interest rates was $22 million in the third quarter of 2016.
- •
- In the second quarter of 2017, the company recognized a non-cash after-tax loss on interest rate swaps and foreign currency derivatives in the Corporate segment of $32 million due to a decrease in long-term interest rates and changes in foreign exchange rates.
- •
- In the second quarter of 2017, the company incurred an after-tax charge of $10 million in the Corporate segment for early payment of long-term debt, net of associated realized foreign currency hedge gains.
- •
- In the first quarter of 2017, Suncor recorded an after-tax gain of $354 million on the sale of the company's lubricants business in the R&M segment, as well as an after-tax gain of $83 million on the divestment of Suncor's interest in the Cedar Point wind facility in the Corporate segment.
| 32 2018 THIRD QUARTER Suncor Energy Inc. | | |
- •
- In the fourth quarter of 2016, the company recorded after-tax derecognition charges of $40 million on certain upgrading and logistics assets in the Oil Sands segment, as well as $31 million in the Corporate segment relating to an initial investment in an undeveloped pipeline and on certain renewable energy development assets as a result of the uncertainty of future benefits from these assets.
Accounting Policies and new IFRS Standards
Suncor's significant accounting policies and a summary of recently announced accounting standards are described in the Accounting Policies and Critical Accounting Estimates section of Suncor's 2017 annual MD&A and in Note 3 to Suncor's unaudited interim Consolidated Financial Statements for the three and nine months ended September 30, 2018.
Critical Accounting Estimates
The preparation of financial statements in accordance with GAAP requires management to make estimates, judgments and assumptions that affect reported assets, liabilities, revenues and expenses, gains and losses, and disclosures of contingencies. These estimates and assumptions are subject to change based on experience and new information. Critical accounting estimates are those that require management to make assumptions about matters that are highly uncertain at the time the estimate is made. Critical accounting estimates are also those estimates which, where a different estimate could have been used or where changes in the estimate that are reasonably likely to occur, would have a material impact on the company's financial condition, changes in financial condition or financial performance. Critical accounting estimates and judgments are reviewed annually by the Audit Committee of the Board of Directors. A detailed description of Suncor's critical accounting estimates is provided in note 4 to the audited Consolidated Financial Statements for the year ended December 31, 2017 and in the Accounting Policies and Critical Accounting Estimates section of Suncor's 2017 annual MD&A.
Financial Instruments
Suncor periodically enters into derivative contracts such as forwards, futures, swaps, options and costless collars to manage exposure to fluctuations in commodity prices and foreign exchange rates, and to optimize the company's position with respect to interest payments. The company also uses physical and financial energy derivatives to earn trading profits. For more information on Suncor's financial instruments and the related financial risk factors, see note 28 of the audited Consolidated Financial Statements for the year ended December 31, 2017, note 11 to the unaudited interim Consolidated Financial Statements for the three and nine months ended September 30, 2018, and the Financial Condition and Liquidity section of Suncor's 2017 annual MD&A.
Income Tax
In the fourth quarter of 2017, the U.S. government enacted a decrease in the federal corporate income tax rate from 35% to 21%, effective January 1, 2018. As a result, the company revalued its deferred income tax balances, resulting in a deferred income tax recovery of $124 million.
In the fourth quarter of 2017, the Government of British Columbia enacted an increase to the provincial corporate income tax rate from 11% to 12%. As a result, the company revalued its deferred income tax balances, resulting in a deferred income tax expense of $18 million.
Control Environment
Based on their evaluation as at September 30, 2018, Suncor's Chief Executive Officer and Chief Financial Officer concluded that the company's disclosure controls and procedures (as defined in Rules 13a-15(e) and 15d-15(e) under the United States Securities Exchange Act of 1934, as amended (the Exchange Act)), are effective to ensure that information required to be disclosed by the company in reports that are filed or submitted to Canadian and U.S. securities authorities is recorded, processed, summarized and reported within the time periods specified in Canadian and U.S. securities laws. In addition, as at September 30, 2018, there were no changes in the internal control over financial reporting (as defined in Exchange Act Rules 13a-15(f) and 15d-15(f)) that occurred during the three-month period ended September 30, 2018 that have materially affected, or are reasonably likely to materially affect, the company's internal control over financial reporting. Management will continue to periodically evaluate the company's disclosure controls and procedures and internal control over financial reporting and will make any modifications from time to time as deemed necessary.
Based on their inherent limitations, disclosure controls and procedures and internal control over financial reporting may not prevent or detect misstatements, and even those controls determined to be effective can provide only reasonable assurance with respect to financial statement preparation and presentation.
| | | 2018 THIRD QUARTER Suncor Energy Inc. 33 |
Corporate Guidance
Suncor has updated its previously issued 2018 corporate guidance, as set forth in Suncor's press release dated October 31, 2018, which is also available on www.sedar.com.
9. NON-GAAP FINANCIAL MEASURES ADVISORY
Certain financial measures in this MD&A – namely operating earnings (loss), ROCE, funds from (used in) operations, discretionary free funds flow, Oil Sands operations cash operating costs, Fort Hills cash operating costs, Syncrude cash operating costs, In Situ cash operating costs, refining margin, refining operating expense and LIFO – are not prescribed by GAAP. These non-GAAP financial measures are included because management uses the information to analyze business performance, leverage and liquidity, and it may be useful to investors on the same basis. These non-GAAP financial measures do not have any standardized meaning and, therefore, are unlikely to be comparable to similar measures presented by other companies. Therefore, these non-GAAP financial measures should not be considered in isolation or as a substitute for measures of performance prepared in accordance with GAAP. Except as otherwise indicated, these non-GAAP financial measures are calculated and disclosed on a consistent basis from period to period. Specific adjusting items may only be relevant in certain periods.
Operating Earnings (Loss)
Operating earnings (loss) is a non-GAAP financial measure that adjusts net earnings (loss) for significant items that are not indicative of operating performance. Management uses operating earnings (loss) to evaluate operating performance because management believes it provides better comparability between periods. Operating earnings (loss) are reconciled to net earnings (loss) in the Consolidated Financial Information and Segment Results and Analysis sections of this MD&A.
Bridge Analyses of Operating Earnings
Throughout this MD&A, the company presents charts that illustrate the change in operating earnings from the comparative period through key variance factors. These factors are analyzed in the Operating Earnings narratives following the bridge analyses in particular sections of this MD&A. These bridge analyses are presented because management uses this presentation to evaluate performance.
- •
- The factor for Sales Volumes and Mix is calculated based on sales volumes and mix for the Oil Sands and E&P segments and throughput volumes and mix for the R&M segment.
- •
- The factor for Price, Margin and Other Revenue includes upstream price realizations before royalties, with the exception of Libya, which is net of royalties. Also included are refining and marketing margins, other operating revenue, and the net impacts of sales and purchases of third-party crude, including product purchased for use as diluent in the company's Oil Sands operations and subsequently sold as part of diluted bitumen.
- •
- The factor for Royalties excludes the impact of Libya, as royalties in Libya are taken into account in Price, Margin and Other Revenue as described above.
- •
- The factor for Operating and Transportation Expense includes project start-up costs, operating, selling and general expense, and transportation expense.
- •
- The factor for Financing Expense and Other includes financing expenses, other income, operational foreign exchange gains and losses, changes in gains and losses on disposal of assets that are not operating earnings adjustments, changes in statutory income tax rates and other income tax adjustments.
Return on Capital Employed (ROCE)
ROCE is a non-GAAP financial measure that management uses to analyze operating performance and the efficiency of Suncor's capital allocation process. Average capital employed is calculated as a twelve-month average of the capital employed balance at the beginning of the twelve-month period and the month-end capital employed balances throughout the remainder of the twelve-month period. Figures for capital employed at the beginning and end of the twelve-month period are presented to show the changes in the components of the calculation over the twelve-month period.
The company presents two ROCE calculations – one including and one excluding the impacts on capital employed of major projects in progress. Major projects in progress includes accumulated capital expenditures and capitalized interest for significant projects still under construction or in the process of being commissioned, and acquired assets that are still being
| 34 2018 THIRD QUARTER Suncor Energy Inc. | | |
evaluated. Management uses ROCE excluding the impacts of major projects in progress on capital employed to assess performance of operating assets.
For the twelve months ended September 30 | 2018 | 2017 | ||||||
| | | | | | | | | |
Adjustments to net earnings | ||||||||
| | ||||||||
Net earnings | 4 955 | 3 607 | ||||||
| | ||||||||
(Deduct) add after-tax amounts for: | ||||||||
| | ||||||||
Unrealized foreign exchange loss (gain) on U.S. dollar denominated debt | 443 | (568 | ) | |||||
| | ||||||||
Net interest expense | 445 | 181 | ||||||
| | | | | | | | | |
| A | 5 843 | 3 220 | ||||||
| | | | | | | | | |
Capital employed – beginning of twelve-month period | ||||||||
| | ||||||||
Net debt | 13 090 | 14 729 | ||||||
| | ||||||||
Shareholders' equity | 45 378 | 43 976 | ||||||
| | | | | | | | | |
| 58 468 | 58 705 | |||||||
| | | | | | | | | |
Capital employed – end of twelve-month period | ||||||||
| | ||||||||
Net debt | 14 345 | 13 090 | ||||||
| | ||||||||
Shareholders' equity | 45 800 | 45 378 | ||||||
| | | | | | | | | |
| 60 145 | 58 468 | |||||||
| | | | | | | | | |
Average capital employed | B | 60 146 | 58 726 | |||||
| | | | | | | | | |
ROCE – including major projects in progress (%) | A/B | 9.7 | 5.5 | |||||
| | | | | | | | | |
Average capitalized costs related to major projects in progress | C | 4 150 | 12 778 | |||||
| | | | | | | | | |
ROCE – excluding major projects in progress (%) | A/(B–C) | 10.4 | 7.0 | |||||
| | | | | | | | | |
Funds From (Used In) Operations
Funds from (used in) operations is a non-GAAP financial measure that adjusts a GAAP measure – cash flow provided by (used in) operating activities – for changes in non-cash working capital, which management uses to analyze operating performance and liquidity. Changes to non-cash working capital can include, among other factors, the timing of offshore feedstock purchases and payments for commodity and income taxes, the timing of cash flows related to accounts receivable and accounts payable, and changes in inventory which management believes reduces comparability between periods.
Funds from (used in) operations for each quarter are separately defined and reconciled to the consolidated GAAP measure in the Non-GAAP Financial Measures Advisory section of each respective MD&A or quarterly report to shareholders, as applicable, for the related quarter.
| | | 2018 THIRD QUARTER Suncor Energy Inc. 35 |
| Three months ended September 30 | Oil Sands | Exploration and Production | Refining and Marketing | Corporate, Energy Trading and Eliminations | Total | |||||||||||||||||||||||||||
| ($ millions) | 2018 | 2017 | 2018 | 2017 | 2018 | 2017 | 2018 | 2017 | 2018 | 2017 | ||||||||||||||||||||||
| | | | | | | | | | | | | | | | | | | | | | | | | | | | | | | | | |
Net earnings (loss) | 796 | 314 | 217 | 161 | 939 | 597 | (140 | ) | 217 | 1 812 | 1 289 | |||||||||||||||||||||
| | ||||||||||||||||||||||||||||||||
Adjustments for: | ||||||||||||||||||||||||||||||||
| | ||||||||||||||||||||||||||||||||
Depreciation, depletion, amortization and impairment | 1 077 | 859 | 240 | 236 | 171 | 161 | 16 | 25 | 1 504 | 1 281 | ||||||||||||||||||||||
| | ||||||||||||||||||||||||||||||||
Deferred income taxes | 121 | 53 | (30 | ) | (21 | ) | 41 | 36 | 28 | 102 | 160 | 170 | ||||||||||||||||||||
| | ||||||||||||||||||||||||||||||||
Accretion | 52 | 48 | 12 | 12 | 1 | 2 | 2 | — | 67 | 62 | ||||||||||||||||||||||
| | ||||||||||||||||||||||||||||||||
Unrealized foreign exchange (gain) on U.S. dollar denominated debt | — | — | — | — | — | — | (216 | ) | (441 | ) | (216 | ) | (441 | ) | ||||||||||||||||||
| | ||||||||||||||||||||||||||||||||
Change in fair value of financial instruments and trading inventory | (5 | ) | 8 | — | — | 3 | 13 | 9 | 24 | 7 | 45 | |||||||||||||||||||||
| | ||||||||||||||||||||||||||||||||
Gain on disposal of assets | (106 | ) | (3 | ) | — | — | (1 | ) | (1 | ) | — | — | (107 | ) | (4 | ) | ||||||||||||||||
| | ||||||||||||||||||||||||||||||||
Share-based compensation | 6 | 41 | 2 | 5 | 6 | 21 | 24 | 72 | 38 | 139 | ||||||||||||||||||||||
| | ||||||||||||||||||||||||||||||||
Exploration | — | — | — | — | — | — | — | — | — | — | ||||||||||||||||||||||
| | ||||||||||||||||||||||||||||||||
Settlement of decommissioning and restoration liabilities | (99 | ) | (49 | ) | 1 | (13 | ) | (7 | ) | (4 | ) | (1 | ) | — | (106 | ) | (66 | ) | ||||||||||||||
| | ||||||||||||||||||||||||||||||||
Other | 2 | 5 | 13 | (5 | ) | (34 | ) | 2 | (1 | ) | (5 | ) | (20 | ) | (3 | ) | ||||||||||||||||
| | | | | | | | | | | | | | | | | | | | | | | | | | | | | | | | | |
Funds from (used in) operations | 1 844 | 1 276 | 455 | 375 | 1 119 | 827 | (279 | ) | (6 | ) | 3 139 | 2 472 | ||||||||||||||||||||
| | ||||||||||||||||||||||||||||||||
Decrease (increase) in non-cash working capital | 1 231 | 440 | ||||||||||||||||||||||||||||||
| | | | | | | | | | | | | | | | | | | | | | | | | | | | | | | | | |
Cash flow provided by operating activities | 4 370 | 2 912 | ||||||||||||||||||||||||||||||
| | | | | | | | | | | | | | | | | | | | | | | | | | | | | | | | | |
| 36 2018 THIRD QUARTER Suncor Energy Inc. | | |
| Nine months ended September 30 | Oil Sands | Exploration and Production | Refining and Marketing | Corporate, Energy Trading and Eliminations | Total | |||||||||||||||||||||||||||
| ($ millions) | 2018 | 2017 | 2018 | 2017 | 2018 | 2017 | 2018 | 2017 | 2018 | 2017 | ||||||||||||||||||||||
| | | | | | | | | | | | | | | | | | | | | | | | | | | | | | | | | |
Net earnings (loss) | 1 246 | 339 | 923 | 515 | 2 430 | 1 772 | (1 026 | ) | 450 | 3 573 | 3 076 | |||||||||||||||||||||
| | ||||||||||||||||||||||||||||||||
Adjustments for: | ||||||||||||||||||||||||||||||||
| | ||||||||||||||||||||||||||||||||
Depreciation, depletion, amortization and impairment | 3 005 | 2 727 | 768 | 809 | 499 | 489 | 47 | 88 | 4 319 | 4 113 | ||||||||||||||||||||||
| | ||||||||||||||||||||||||||||||||
Deferred income taxes | 262 | (11 | ) | (115 | ) | (118 | ) | 90 | 23 | 43 | 252 | 280 | 146 | |||||||||||||||||||
| | ||||||||||||||||||||||||||||||||
Accretion | 156 | 146 | 36 | 33 | 5 | 5 | 2 | — | 199 | 184 | ||||||||||||||||||||||
| | ||||||||||||||||||||||||||||||||
Unrealized foreign exchange loss (gain) on U.S. dollar denominated debt | — | — | — | — | — | — | 402 | (845 | ) | 402 | (845 | ) | ||||||||||||||||||||
| | ||||||||||||||||||||||||||||||||
Change in fair value of financial instruments and trading inventory | 13 | — | — | — | (5 | ) | — | (39 | ) | 112 | (31 | ) | 112 | |||||||||||||||||||
| | ||||||||||||||||||||||||||||||||
Gain on disposal of assets | (107 | ) | (4 | ) | (162 | ) | — | (5 | ) | (352 | ) | — | (70 | ) | (274 | ) | (426 | ) | ||||||||||||||
| | ||||||||||||||||||||||||||||||||
Loss on debt extinguishment | — | — | — | — | — | — | — | 25 | — | 25 | ||||||||||||||||||||||
| | ||||||||||||||||||||||||||||||||
Share-based compensation | (6 | ) | (37 | ) | (2 | ) | 2 | (9 | ) | (13 | ) | (12 | ) | (37 | ) | (29 | ) | (85 | ) | |||||||||||||
| | ||||||||||||||||||||||||||||||||
Exploration | — | — | — | 41 | — | — | — | — | — | 41 | ||||||||||||||||||||||
| | ||||||||||||||||||||||||||||||||
Settlement of decommissioning and restoration liabilities | (337 | ) | (229 | ) | (15 | ) | (16 | ) | (12 | ) | (10 | ) | (1 | ) | — | (365 | ) | (255 | ) | |||||||||||||
| | ||||||||||||||||||||||||||||||||
Other | 37 | 27 | 69 | 28 | (25 | ) | (8 | ) | 10 | (10 | ) | 91 | 37 | |||||||||||||||||||
| | | | | | | | | | | | | | | | | | | | | | | | | | | | | | | | | |
Funds from (used in) operations | 4 269 | 2 958 | 1 502 | 1 294 | 2 968 | 1 906 | (574 | ) | (35 | ) | 8 165 | 6 123 | ||||||||||||||||||||
| | ||||||||||||||||||||||||||||||||
(Increase) decrease in non-cash working capital | (625 | ) | 88 | |||||||||||||||||||||||||||||
| | | | | | | | | | | | | | | | | | | | | | | | | | | | | | | | | |
Cash flow provided by operating activities | 7 540 | 6 211 | ||||||||||||||||||||||||||||||
| | | | | | | | | | | | | | | | | | | | | | | | | | | | | | | | | |
Discretionary Free Funds Flow
Discretionary free funds flow is a non-GAAP financial measure that is calculated by taking funds from operations and subtracting sustaining capital, inclusive of associated capitalized interest, and dividends. Discretionary free funds flow reflects cash available for increasing distributions to shareholders and to fund growth investments. Management uses discretionary free funds flow to measure the capacity of the company to increase returns to shareholders and grow the business.
| Three months ended Sept 30 | Twelve months ended Sept 30 | |||||||||
($ millions) | 2018 | 2017 | 2018 | 2017 | ||||||
| | | | | | | | | | | |
Funds from operations | 3 139 | 2 472 | 11 181 | 8 488 | ||||||
| | ||||||||||
Sustaining capital and dividends | (1 500 | ) | (1 356 | ) | (6 241 | ) | (4 729 | ) | ||
| | | | | | | | | | | |
Discretionary free funds flow | 1 639 | 1 116 | 4 940 | 3 759 | ||||||
| | | | | | | | | | | |
Oil Sands Operations, In Situ, Fort Hills and Syncrude Cash Operating Costs
Oil Sands operations, In Situ, Syncrude and Fort Hills cash operating costs are non-GAAP financial measures. Oil Sands operations cash operating costs are calculated by adjusting Oil Sands segment OS&G expense (a GAAP measure based on sales volumes) for i) costs pertaining to Fort Hills and Syncrude operations; ii) non-production costs that management believes do not relate to the production performance of Oil Sands operations, including, but not limited to, share-based compensation adjustments, research and the expense recorded as part of a non-monetary arrangement involving a third-party processor; iii) revenues associated with excess capacity, including excess power generated and sold that is recorded in operating revenue; iv) project start-up costs; and v) the impacts of changes in inventory levels, such that the company is able to present cost information based on production volumes. To determine In Situ cash operating costs, Oil Sands operations cash operating
| | | 2018 THIRD QUARTER Suncor Energy Inc. 37 |
costs are further adjusted to remove costs pertaining to Oil Sands operations mining and upgrading. Syncrude and Fort Hills cash operating costs are calculated by adjusting Syncrude OS&G expense and Fort Hills OS&G expense, respectively, for non-production costs that management believes do not relate to the production performance of Syncrude operations or Fort Hills operations, respectively, including, but not limited to, share-based compensation, research and project start-up costs, if applicable. Oil Sands operations, Fort Hills and Syncrude cash operating costs are reconciled in the Segment Results and Analysis – Oil Sands section of this MD&A. Management uses cash operating costs to measure operating performance. Oil Sands operations cash operating costs in the third quarter of 2018 were $969 million and included $184 million related to In Situ production for In Situ cash operating costs per barrel of $8.05, based on total In Situ production of 248,100 bbls/d.
Refining Margin and Refining Operating Expense
Refining margin and refining operating expense are non-GAAP financial measures and are presented on a LIFO basis. Refining margin is calculated by adjusting R&M segment operating revenue, other income and purchases of crude oil and products (GAAP measures) for non-refining margin pertaining to the company's supply, marketing and ethanol businesses, and the company's former lubricants business, as well as removing the impact of FIFO inventory gains and losses and risk management hedging gains and losses. Refinery operating expense is calculated by adjusting R&M segment OS&G for i) non-refining costs pertaining to the company's supply, marketing and ethanol businesses, and the company's former lubricants business; and ii) non-refining costs that management believes do not relate to the production of refined products, including, but not limited to, share-based compensation and enterprise shared service allocations. Management uses refining margin and refining operating expense to measure operating performance on a production barrel basis.
| Three months ended September 30 | Nine months ended September 30 | |||||||||
($ millions, except as noted) | 2018 | 2017 | 2018 | 2017 | ||||||
| | | | | | | | | | | |
Refining margin reconciliation | ||||||||||
| | ||||||||||
Gross margin, operating revenue less purchases of crude oil and products | 1 972 | 1 456 | 5 373 | 3 886 | ||||||
| | ||||||||||
Other income (loss) | 1 | 48 | (20 | ) | 86 | |||||
| | ||||||||||
Last-in, First-out adjustment (LIFO) | — | 16 | (107 | ) | 43 | |||||
| | ||||||||||
Non-refining margin | (407 | ) | (392 | ) | (1 430 | ) | (1 152 | ) | ||
| | | | | | | | | | | |
Refining margin | 1 566 | 1 128 | 3 816 | 2 863 | ||||||
| | ||||||||||
Refinery production(1) (mbbls) | 45 465 | 46 491 | 122 993 | 130 660 | ||||||
| | | | | | | | | | | |
Refining margin ($/bbl) | 34.45 | 24.25 | 31.05 | 21.90 | ||||||
| | | | | | | | | | | |
Refining operating expense reconciliation | ||||||||||
| | ||||||||||
Operating, selling and general expense | 499 | 467 | 1 457 | 1 418 | ||||||
| | ||||||||||
Non-refining costs | (272 | ) | (258 | ) | (806 | ) | (765 | ) | ||
| | | | | | | | | | | |
Refining operating expense | 227 | 209 | 651 | 653 | ||||||
| | ||||||||||
Refinery production(1) (mbbls) | 45 465 | 46 491 | 122 993 | 130 660 | ||||||
| | | | | | | | | | | |
Refining operating expense ($/bbl) | 5.00 | 4.50 | 5.30 | 5.00 | ||||||
| | | | | | | | | | | |
- (1)
- Refinery production is the output of the refining process, and differs from crude oil processed as a result of volumetric adjustments for non-crude feedstock, volumetric gain associated with the refining process, and changes in unfinished product inventories.
Impact of First-in, First-out Inventory (FIFO) Valuation on Refining and Marketing Net Earnings
GAAP requires the use of a FIFO inventory valuation methodology. For Suncor, this results in a disconnect between the sales prices for refined products, which reflect current market conditions, and the amount recorded as the cost of sale for the related refinery feedstock, which reflects market conditions at the time the feedstock was purchased. This lag between purchase and sale can be anywhere from several weeks to several months, and is influenced by the time to receive crude after purchase (which can be several weeks for foreign offshore crude purchases), regional crude inventory levels, the completion of refining processes, transportation time to distribution channels, and regional refined product inventory levels.
Suncor prepares and presents an estimate of the impact of using a FIFO inventory valuation methodology compared to a LIFO methodology, because management uses the information to analyze operating performance and compare itself against refining peers that are permitted to use LIFO inventory valuation under United States GAAP (U.S. GAAP).
| 38 2018 THIRD QUARTER Suncor Energy Inc. | | |
The company's estimate is not derived from a standardized calculation and, therefore, may not be directly comparable to similar measures presented by other companies, and should not be considered in isolation or as a substitute for measures of performance prepared in accordance with GAAP or U.S. GAAP.
The following is a list of abbreviations that may be used in this MD&A:
| Measurement | Places and Currencies | |||||
| bbl | barrel | U.S. | United States | |||
| bbls/d | barrels per day | U.K. | United Kingdom | |||
| mbbls/d | thousands of barrels per day | |||||
| $ or Cdn$ | Canadian dollars | |||||
| boe | barrels of oil equivalent | US$ | United States dollars | |||
| boe/d | barrels of oil equivalent per day | |||||
| mboe | thousands of barrels of oil equivalent | |||||
| mboe/d | thousands of barrels of oil equivalent per day | Financial and Business Environment | ||||
| Q3 | Three months ended September 30 | |||||
| GJ | Gigajoule | DD&A | Depreciation, depletion and amortization | |||
| WTI | West Texas Intermediate | |||||
| mcf | thousands of cubic feet of natural gas | WCS | Western Canadian Select | |||
| mcfe | thousands of cubic feet of natural gas | SCO | Synthetic crude oil | |||
| equivalent | MSW | Mixed Sweet Blend | ||||
| mmcf | millions of cubic feet of natural gas | NYMEX | New York Mercantile Exchange | |||
| mmcf/d | millions of cubic feet of natural gas per day | YTD | Year to date | |||
| mmcfe | millions of cubic feet of natural gas equivalent | |||||
| mmcfe/d | millions of cubic feet of natural gas equivalent | |||||
| per day | ||||||
| MW | megawatts | |||||
| MWh | megawatts per hour | |||||
| | | 2018 THIRD QUARTER Suncor Energy Inc. 39 |
11. FORWARD-LOOKING INFORMATION
The document contains certain forward-looking information and forward-looking statements (collectively referred to herein as "forward-looking statements") within the meaning of applicable Canadian and U.S. securities laws. Forward-looking statements and other information are based on Suncor's current expectations, estimates, projections and assumptions that were made by the company in light of information available at the time the statement was made and consider Suncor's experience and its perception of historical trends, including expectations and assumptions concerning: the accuracy of reserves and resources estimates; commodity prices and interest and foreign exchange rates; the performance of assets and equipment; capital efficiencies and cost-savings; applicable laws and government policies; future production rates; the sufficiency of budgeted capital expenditures in carrying out planned activities; the availability and cost of labour, services and infrastructure; the satisfaction by third parties of their obligations to Suncor; the execution of projects; and the receipt, in a timely manner, of regulatory and third-party approvals. All statements and information that address expectations or projections about the future, and other statements and information about Suncor's strategy for growth, expected and future expenditures or investment decisions, commodity prices, costs, schedules, production volumes, operating and financial results, future financing and capital activities, and the expected impact of future commitments are forward-looking statements. Some of the forward-looking statements may be identified by words like "expects", "anticipates", "will", "estimates", "plans", "scheduled", "intends", "believes", "projects", "indicates", "could", "focus", "vision", "goal", "outlook", "proposed", "target", "objective", "continue", "should", "may", "future", "potential", "opportunity", "would", "priority" and similar expressions. Forward-looking statements in the document include references to:
- •
- The belief that Suncor's downstream integration and favourable market access position continue to significantly mitigate the impact of wider crude differentials at Oil Sands and that the company has sufficient pipeline access to move all of its Fort Hills barrels to markets in Canada and the U.S.;
- •
- Statements about Fort Hills, including the expectation that Fort Hills will produce at approximately 90% of nameplate capacity during the fourth quarter of 2018, the expectation that annualized Fort Hills cash operating costs will remain within the full year guidance range, and the focus on mine development and optimization to allow for reliable and sustained production of approximately 90% of nameplate capacity during the fourth quarter of 2018;
- •
- The expectation that Suncor's 2018 capital program will focus on improving the safety, long-term reliability and efficiency of the company's operating assets, including execution of major turnarounds, in addition to the efficient and effective ramp up at both of Suncor's major growth projects, Fort Hills and Hebron;
- •
- The expectation that the Buzzard Phase 2 project will achieve first oil production in early 2021;
- •
- Statements about Suncor's share repurchase program and Suncor's ongoing ability to generate cash flow and return value to shareholders;
- •
- Suncor's expectation that existing production levels at Firebag and MacKay River will be maintained due to an increase in well pad construction;
- •
- Suncor's planned 2018 capital spending program of $5.2 to $5.5 billion and the belief that Suncor will have the capital resources to fund the capital spending program and to meet current and future working capital requirements through cash balances and cash equivalents, cash flow provided by operating activities, available committed credit facilities, issuing commercial paper, if needed, divesting of non-core assets and accessing capital markets;
- •
- The objectives of Suncor's short-term investment portfolio and Suncor's expectation that the maximum weighted average term to maturity of the short-term investment portfolio will not exceed six months, and that all investments will be with counterparties with investment grade debt ratings;
- •
- The company's priority regarding the management of debt levels given the company's long-term growth plans and future expected volatility in the pricing environment and Suncor's belief that a phased and flexible approach to existing and future growth projects should assist Suncor in its ability to manage project costs and debt levels;
- •
- The company's belief that it does not have any guarantees or off-balance sheet arrangements that have, or are reasonably likely to have, a current or future material effect on the company's financial performance or financial condition, results of operations, liquidity or capital expenditures; and
- •
- Suncor's outlook for the current income tax expense range and business environment outlook assumptions for Brent Sullom Voe, WTI at Cushing, WCS at Hardisty and New York Harbor 3-2-1 crack.
| 40 2018 THIRD QUARTER Suncor Energy Inc. | | |
Forward-looking statements are not guarantees of future performance and involve a number of risks and uncertainties, some that are similar to other oil and gas companies and some that are unique to Suncor. Suncor's actual results may differ materially from those expressed or implied by its forward-looking statements, so readers are cautioned not to place undue reliance on them. The financial and operating performance of the company's reportable operating segments, specifically Oil Sands, E&P, and R&M, may be affected by a number of factors.
Factors that affect Suncor's Oil Sands segment include, but are not limited to, volatility in the prices for crude oil and other production, and the related impacts of fluctuating light/heavy and sweet/sour crude oil differentials; changes in the demand for refinery feedstock and diesel fuel, including the possibility that refiners that process the company's proprietary production will be closed, experience equipment failure or other accidents; Suncor's ability to operate its Oil Sands facilities reliably in order to meet production targets; the output of newly commissioned facilities, the performance of which may be difficult to predict during initial operations; the possibility that completed maintenance activities may not improve operational performance or the output of related facilities; Suncor's dependence on pipeline capacity and other logistical constraints, which may affect the company's ability to distribute products to market; Suncor's ability to finance Oil Sands growth and sustaining capital expenditures; the availability of bitumen feedstock for upgrading operations, which can be negatively affected by poor ore grade quality, unplanned mine equipment and extraction plant maintenance, tailings storage, and in situ reservoir and equipment performance, or the unavailability of third-party bitumen; changes in operating costs, including the cost of labour, natural gas and other energy sources used in oil sands processes; and the company's ability to complete projects, including planned maintenance events, both on time and on budget, which could be impacted by competition from other projects (including other oil sands projects) for goods and services and demands on infrastructure in Alberta's Wood Buffalo region and the surrounding area (including housing, roads and schools).
Factors that affect Suncor's E&P segment include, but are not limited to, volatility in crude oil and natural gas prices; operational risks and uncertainties associated with oil and gas activities, including unexpected formations or pressures, premature declines of reservoirs, fires, blow-outs, equipment failures and other accidents, uncontrollable flows of crude oil, natural gas or well fluids, and pollution and other environmental risks; the possibility that completed maintenance activities may not improve operational performance or the output of related facilities; adverse weather conditions, which could disrupt output from producing assets or impact drilling programs, resulting in increased costs and/or delays in bringing on new production; political, economic and socio-economic risks associated with Suncor's foreign operations, including the unpredictability of operating in Libya due to ongoing political unrest; and market demand for mineral rights and producing properties, potentially leading to losses on disposition or increased property acquisition costs.
Factors that affect our R&M segment include, but are not limited to, fluctuations in demand and supply for refined products that impact the company's margins; market competition, including potential new market entrants; the company's ability to reliably operate refining and marketing facilities in order to meet production or sales targets; the possibility that completed maintenance activities may not improve operational performance or the output of related facilities; and risks and uncertainties affecting construction or planned maintenance schedules, including the availability of labour and other impacts of competing projects drawing on the same resources during the same time period.
Additional risks, uncertainties and other factors that could influence the financial and operating performance of all of Suncor's operating segments and activities include, but are not limited to, changes in general economic, market and business conditions, such as commodity prices, interest rates and currency exchange rates; fluctuations in supply and demand for Suncor's products; the successful and timely implementation of capital projects, including growth projects and regulatory projects; risks associated with the execution of Suncor's major projects and the commissioning and integration of new facilities; competitive actions of other companies, including increased competition from other oil and gas companies or from companies that provide alternative sources of energy; labour and material shortages; actions by government authorities, including the imposition or reassessment of, or changes to, taxes, fees, royalties, duties and other government-imposed compliance costs; changes to laws and government policies that could impact the company's business, including environmental (including climate change), royalty and tax laws and policies; the ability and willingness of parties with whom Suncor has material relationships to perform their obligations to the company; the unavailability of, or outages to, third-party infrastructure that could cause disruptions to production or prevent the company from being able to transport its products; the occurrence of a protracted operational outage, a major safety or environmental incident, or unexpected events such as fires (including forest fires), equipment failures and other similar events affecting Suncor or other parties whose operations or assets directly or indirectly affect Suncor; the potential for security breaches of Suncor's information technology and infrastructure by malicious persons or entities, and the unavailability or failure of such systems to perform as anticipated as a result of such breaches; the risk that competing business objectives may exceed Suncor's capacity to adopt and implement change; risks and uncertainties associated with obtaining regulatory and stakeholder approval for the company's operations and exploration and development activities; the potential for disruptions to operations and construction projects as a result of Suncor's relationships with labour unions that represent employees at the company's facilities; the company's ability to find new oil and gas reserves that can be developed economically; the accuracy of Suncor's reserves, resources and future production estimates; market instability affecting Suncor's ability to borrow in the capital debt markets at acceptable rates or to
| | | 2018 THIRD QUARTER Suncor Energy Inc. 41 |
issue other securities at acceptable prices; maintaining an optimal debt to cash flow ratio; the success of the company's risk management activities using derivatives and other financial instruments; the cost of compliance with current and future environmental laws, including climate change laws; risks relating to increased activism and public opposition to fossil fuels and oil sands; risks and uncertainties associated with closing a transaction for the purchase or sale of a business, asset or oil and gas property, including estimates of the final consideration to be paid or received; the ability of counterparties to comply with their obligations in a timely manner; risks associated with joint arrangements in which the company has an interest; the receipt of any required regulatory or other third-party approvals outside of Suncor's control and the satisfaction of any conditions to such approvals; risks associated with land claims and Aboriginal consultation requirements; risks relating to litigation; the impact of technology and risks associated with developing and implementing new technologies; and the accuracy of cost estimates, some of which are provided at the conceptual or other preliminary stage of projects and prior to commencement or conception of the detailed engineering that is needed to reduce the margin of error and increase the level of accuracy. The foregoing important factors are not exhaustive.
Many of these risk factors and other assumptions related to Suncor's forward-looking statements are discussed in further detail throughout this MD&A, and in the company's 2017 annual MD&A, 2017 AIF and Form 40-F on file with Canadian securities commissions at www.sedar.com and the United States Securities and Exchange Commission at www.sec.gov. Readers are also referred to the risk factors and assumptions described in other documents that Suncor files from time to time with securities regulatory authorities. Copies of these documents are available without charge from the company.
The forward-looking statements contained in this document are made as of the date of this document. Except as required by applicable securities laws, we assume no obligation to update publicly or otherwise revise any forward-looking statements or the foregoing risks and assumptions affecting such forward-looking statements, whether as a result of new information, future events or otherwise.
| 42 2018 THIRD QUARTER Suncor Energy Inc. | | |