QuickLinks -- Click here to rapidly navigate through this document
Report to Shareholders for the fourth quarter ended December 31, 2018

REPORT TO SHAREHOLDERS FOR THE FOURTH QUARTER OF 2018
![]()
All financial figures are unaudited and presented in Canadian dollars unless noted otherwise. Production volumes are presented on a working-interest basis, before royalties, except for Libya, which is on an entitlement basis. Certain financial measures in this Report to Shareholders (this document) are not prescribed by Canadian generally accepted accounting principles (GAAP). For a description of these non-GAAP financial measures, see the Non-GAAP Financial Measures Advisory section of this document. See also the Advisories section of this document. References to Oil Sands operations exclude Suncor's interests in Fort Hills and Syncrude.
"Suncor generated funds from operations of $2 billion in the fourth quarter as our integrated downstream business and market access helped to mitigate upstream crude price volatility, including the further widening of the differentials for Canadian crude," said Steve Williams, chief executive officer. "We continued to return value to our shareholders through nearly $1.2 billion in share repurchases and $574 million in dividends paid during the quarter."
- •
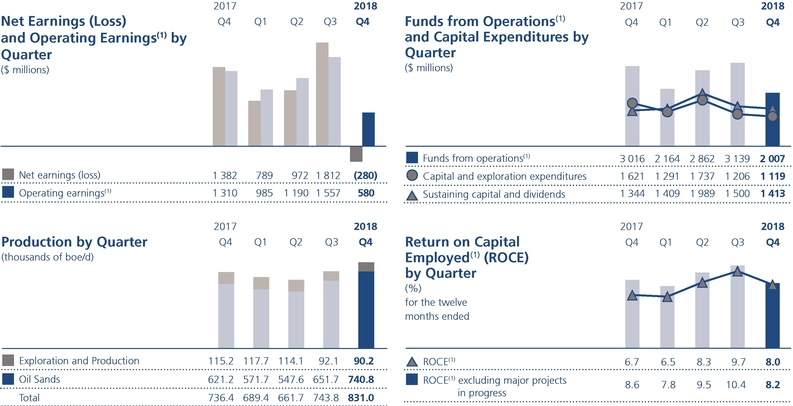
- Funds from operations(1) were $2.007 billion ($1.26 per common share) in the fourth quarter of 2018, compared to $3.016 billion ($1.83 per common share) in the prior year quarter.
- •
- Cash flow provided by operating activities, which includes changes in non-cash working capital, was $3.040 billion ($1.90 per common share), compared to $2.755 billion ($1.67 per common share) in the prior year quarter.
- •
- Operating earnings(1) were $580 million ($0.36 per common share) and the company had a net loss of $280 million ($0.18 per common share) in the fourth quarter of 2018, compared to operating earnings of $1.310 billion ($0.79 per common share) and net earnings of $1.382 billion ($0.84 per common share) in the prior year quarter.
- •
- Total Oil Sands production attained a new quarterly record of 740,800 barrels per day (bbls/d), close to 90,000 bbls/d ahead of the previous record, primarily as a result of achieving 94% plant utilization at Fort Hills and record production at Syncrude.
- •
- Refining and Marketing (R&M) delivered record quarterly crude throughput of 467,900 bbls/d, which represents refinery utilization of 101%.
- •
- Hebron production in the fourth quarter averaged 15,700 bbls/d, net to the company, and is continuing to ramp up following the completion of the fourth production well during the quarter.
- •
- The company distributed $574 million in dividends to shareholders and repurchased an additional $1.166 billion of shares in the fourth quarter of 2018. The existing $3.0 billion share repurchase program is expected to be completed by the end of February 2019.
- •
- Subsequent to the end of the quarter, Suncor's Board of Directors (the Board) approved a quarterly dividend of $0.42 per share, an increase of 17%, and also approved a further share repurchase program of up to $2.0 billion.
 |
- (1)
- Funds from operations, operating earnings and ROCE are non-GAAP financial measures. See page 5 for a reconciliation of net earnings to operating
earnings. See the Non-GAAP Financial Measures Advisory section of this document.
Financial Results
Operating Earnings
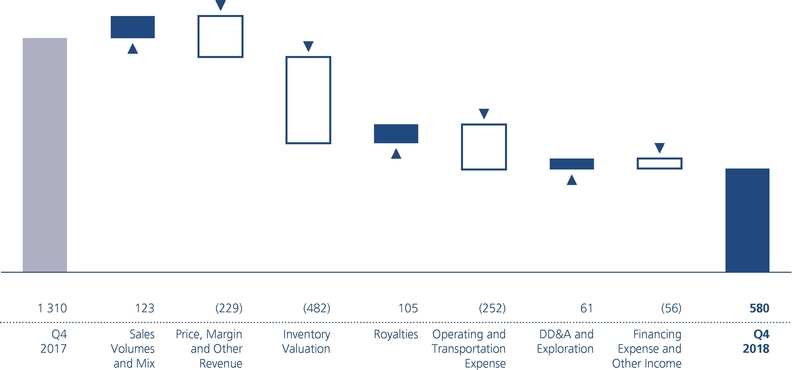
Suncor's fourth quarter 2018 operating earnings were $580 million ($0.36 per common share), compared to $1.310 billion ($0.79 per common share) in the prior year quarter. The decrease was primarily a result of unfavourable western Canadian crude oil differentials, including a substantial widening of synthetic crude oil (SCO) differentials, which resulted in the following:
- •
- A decrease in Oil Sands price realizations, partially offset by improved refining margins; and
- •
- An unfavourable first-in, first-out (FIFO) inventory valuation adjustment in R&M on declining feedstock costs, partially offset by a realization of intersegment profit on inventory in the Corporate, Energy Trading and Eliminations segment.
Other factors reducing operating earnings included the addition of operating and transportation costs for new production from growth projects and acquisitions, a decrease in Oil Sands operations SCO production, lower overall Exploration and Production (E&P) sales volumes, and a decrease in the capitalization of borrowing costs. These factors were partially offset by a recovery of share-based compensation costs (compared to an expense in the prior year quarter) and increased overall upstream production, driven by 94% plant utilization at Fort Hills, record production at Syncrude and the continued ramp up of operations at Hebron.
Bridge Analysis of Operating Earnings($ millions)(1)
- (1)
- For an explanation of this bridge analysis, see the Non-GAAP Financial Measures Advisory section of this document.
Net (Loss) Earnings
The net loss was $280 million ($0.18 per common share) in the fourth quarter of 2018, compared to net earnings of $1.382 billion ($0.84 per common share) in the prior year quarter. In addition to the factors explained in operating earnings above, net earnings for the fourth quarter of 2018 included a $637 million unrealized after-tax foreign exchange loss on the revaluation of U.S. dollar denominated debt, as well as a non-cash impairment loss on one of the company's equity investments(2). Net earnings in the prior year quarter included a net $124 million deferred income tax recovery related to a decrease in the United States (U.S.) corporate tax rate from 35% to 21%, an unrealized after-tax foreign exchange loss of $91 million on the revaluation of U.S. dollar denominated debt, after-tax property damage insurance proceeds of $55 million, an after-tax loss of $18 million for early repayment of debt and a net after-tax gain of $2 million on interest rate swaps associated with debt issued in the fourth quarter of 2017.
- (2)
- Refer to note 2 of the Operating Earnings Reconciliation on page 5 for further details on this item.
| 2 2018 FOURTH QUARTER Suncor Energy Inc. | | |
Funds From Operations and Cash Flow Provided By Operating Activities
Funds from operations were $2.007 billion ($1.26 per common share) in the fourth quarter of 2018, compared to $3.016 billion ($1.83 per common share) in the fourth quarter of 2017, and were influenced by the same factors impacting operating earnings noted above, excluding the recovery of non-cash share-based compensation, as well as unrealized gains on crude optimization activities.
Cash flow provided by operating activities was $3.040 billion ($1.90 per common share) for the fourth quarter of 2018, compared to $2.755 billion ($1.67 per common share) for the fourth quarter of 2017, with changes in non-cash working capital representing a source of cash to the company in the fourth quarter of 2018, as compared to a use of cash in the prior year period. The source of cash in the company's non-cash working capital balances was primarily due to the declining crude price environment in the fourth quarter and the associated decrease in accounts receivable balances, as well as the decline in refinery inventory value as the company replaced crude feedstock inventories purchased in the prior period with less expensive crude.
Operating Results
Suncor's total upstream production represents a new quarterly record at 831,000 barrels of oil equivalent per day (boe/d) during the fourth quarter of 2018, compared to 736,400 boe/d in the prior year quarter, with the increase primarily due to the addition of Fort Hills production, improved reliability and an additional working interest at Syncrude, and the continued ramp up of operations at Hebron.
"Fort Hills achieved plant utilization of 94% for the quarter, exceeding our accelerated target of 90%, and production from Syncrude was strong, with the assets attaining a new quarterly record," said Mark Little, president and chief operating officer. "Our refining assets continue to outperform due to continued reliability, achieving a new quarterly throughput record and allowing us to maximize the impact of strong refining margins."
Oil Sands operations production was 432,700 bbls/d in the fourth quarter of 2018, compared to 446,800 bbls/d in the prior year quarter. The decrease was primarily due to lower SCO volumes as a result of planned and unplanned maintenance at Upgrader 2, partially offset by an increased volume of non-upgraded bitumen from the company's In Situ properties, with Firebag and MacKay River continuing to achieve solid reliability. Planned maintenance at Upgrader 2, which commenced in the third quarter of 2018, was completed during the fourth quarter and the unplanned maintenance was resolved by the end of the quarter. Upgrader utilization in the fourth quarter of 2018 was 79%, compared to 93% in the prior year period, as a result of the maintenance discussed above.
Oil Sands operations cash operating costs per barrel(1) were $24.50 in the fourth quarter of 2018 and were comparable to the prior year period of $24.20, with lower overall production being offset by lower operating, selling and general expense, after adjusting for non-cash items.
Suncor's share of production from Fort Hills averaged 98,500 bbls/d for the fourth quarter of 2018, which represents 94% utilization. As a result of the increase in production, Fort Hills cash operating costs per barrel(1) decreased to $24.85 in the fourth quarter of 2018 and were $31.20 for the year.
Suncor's share of Syncrude production was a record 209,600 bbls/d in the fourth quarter of 2018, compared to 174,400 bbls/d in the prior year quarter. The increase in production was primarily due to strong reliability, as well as the additional 5% working interest in Syncrude acquired earlier in 2018. Upgrader utilization at Syncrude was 101% in the fourth quarter of 2018 compared to 94% in the prior year quarter.
Syncrude cash operating costs per barrel(1) were $31.75 in the fourth quarter of 2018, a decrease from $32.80 in the prior year quarter as a result of higher production.
Production volumes at E&P were 90,200 boe/d in the fourth quarter of 2018, compared to 115,200 boe/d in the prior year quarter. In addition to natural declines, the decrease in production was due to a temporary production interruption at the company's East Coast Canada assets as a result of a major storm system in the period, as well as an unplanned outage at Buzzard in the United Kingdom, partially offset by the addition of production from Hebron. The production interruption at the White Rose field extended into 2019, with partial production restarting at the end of January 2019.
Refinery crude throughput achieved a new quarterly record of 467,900 bbls/d and refinery utilization was 101% in the fourth quarter of 2018, compared to 432,400 bbls/d and a utilization rate of 94% in the prior year quarter. The increase was due to
- (1)
- Oil Sands operations cash operating costs, Fort Hills cash operating costs and Syncrude cash operating costs are non-GAAP financial measures. See the Non-GAAP Financial Measures Advisory section of this document.
| | | 2018 FOURTH QUARTER Suncor Energy Inc. 3 |
strong reliability at all of the company's refineries, in addition to the prior year quarter being impacted by a third-party power outage.
Strategy Update
Suncor's 2018 capital program was focused on improving the safety, long-term reliability and efficiency of the company's operating assets, including execution of major turnarounds in addition to the effective and efficient ramp up at both of Suncor's major growth projects, Fort Hills and Hebron.
The company spent $1.119 billion on capital expenditures, excluding capitalized interest, during the fourth quarter of 2018, a decrease from $1.444 billion in the prior year quarter, primarily due to the decrease in growth capital with the commissioning of Fort Hills and Hebron. Sustaining capital expenditures in the fourth quarter of 2018 were comparable to the prior year quarter.
"We remain focused on capital discipline and ensuring safe and reliable operations across our business," said Williams. "Through our integrated model and the value-driven investments we've made in our business, Suncor is well positioned to continue to grow production and cash flow, and to increase returns to shareholders across a wide range of market conditions."
Downstream integration continues to be a fundamental component of Suncor's strategy, and the overall impact of wider crude differentials in Alberta was partially mitigated by a combination of improved refining margins, driven by lower feedstock costs, and the company's favourable market access position, which allows a significant portion of bitumen sales to be moved to the U.S. Gulf Coast where higher prices are realized. However, due to the impact of the FIFO method of inventory valuation, the full benefit of lower feedstock costs at R&M has not yet been realized due to the time lag associated with processing higher value crude inventory.
Drilling activity at Hebron is ongoing, and production continues to ramp up. The fourth production well came online during the fourth quarter and contributed to increased volumes. Other E&P activity in the fourth quarter included development drilling at Hebron, Hibernia, White Rose and Buzzard, and development work on the West White Rose Project and the Norwegian Oda and Fenja projects.
Development of the Oda project has progressed ahead of schedule and first oil is now anticipated in the second quarter of 2019, as compared to the original target of the third quarter of 2019.
During the fourth quarter of 2018, Suncor and its joint venture partners reached an agreement in principle for interconnecting pipelines between Syncrude's Mildred Lake site and Suncor's Oil Sands Base plant. The lines will transfer bitumen and gas oils between the two plants providing increased operational flexibility and enabling higher reliability and utilization. The pipelines are expected to be operational by the end of 2020, subject to finalized commercial terms and regulatory approval.
Subsequent to the end of the quarter, the company received $300 million in risk mitigation proceeds for its Libyan assets (approximately $260 million after-tax). The proceeds may be subject to a provisional repayment which is dependent on the future performance and cash flows from Suncor's Libyan assets.
Following the approval from the Board in the third quarter of 2018 to increase the company's share repurchase program from $2.15 billion to $3.0 billion, the Toronto Stock Exchange accepted a notice filed by Suncor during the fourth quarter of 2018 to increase the maximum number of shares the company may purchase pursuant to its normal course issuer bid. The increase to the program reinforces the company's ongoing ability to generate cash flow and return value to shareholders. Under Suncor's expanded normal course issuer bid, the company repurchased and cancelled $1.166 billion of its own shares in the fourth quarter of 2018. Subsequent to the end of the quarter, Suncor's Board of Directors approved a further share repurchase program of up to $2.0 billion.
In the fourth quarter of 2018, Suncor continued to return value to shareholders through dividends of $574 million, and subsequent to the end of the quarter, Suncor's Board of Directors approved a quarterly dividend of $0.42 per share, which represents an increase of 17% over the prior quarter dividend.
In addition, during the fourth quarter, as part of the company's commitment to debt reduction, Suncor repurchased US$83 million of 7.75% Senior Notes due in 2019 (2019 Notes) that were acquired as part of the acquisition of Canadian Oil Sands Limited. The aggregate principal amount of 2019 Notes that remains outstanding has been reduced to US$140 million as a result of the purchase.
| 4 2018 FOURTH QUARTER Suncor Energy Inc. | | |
Operating Earnings Reconciliation(1)
| Three months ended December 31 | Twelve months ended December 31 | |||||||||
($ millions) | 2018 | 2017 | 2018 | 2017 | ||||||
| | | | | | | | | | | |
Net (loss) earnings | (280 | ) | 1 382 | 3 293 | 4 458 | |||||
| | ||||||||||
Unrealized foreign exchange loss (gain) on U.S. dollar denominated debt | 637 | 91 | 989 | (702 | ) | |||||
| | ||||||||||
Loss on equity investment and (gain) on significant disposals(2) | 223 | — | 30 | (437 | ) | |||||
| | ||||||||||
Impact of income tax rate adjustment on deferred taxes(3) | — | (124 | ) | — | (124 | ) | ||||
| | ||||||||||
Property damage insurance proceeds(4) | — | (55 | ) | — | (55 | ) | ||||
| | ||||||||||
Loss on early payment of long-term debt(5) | — | 18 | — | 28 | ||||||
| | ||||||||||
Non-cash mark to market (gain) loss on interest rate swaps and foreign currency derivatives(6) | — | (2 | ) | — | 20 | |||||
| | | | | | | | | | | |
Operating earnings(1) | 580 | 1 310 | 4 312 | 3 188 | ||||||
| | | | | | | | | | | |
- (1)
- Operating earnings is a non-GAAP financial measure. All reconciling items are presented on an after-tax basis. See the Non-GAAP Financial Measures Advisory section of this document.
- (2)
- In 2018, the company recorded a net non-cash loss of $90 million, after-tax, in the E&P segment related to an asset exchange with Canbriam Energy Inc. (Canbriam), comprised of the following: an after-tax gain of $133 million recorded in the first quarter of 2018 for the disposal of the company's mineral landholdings in northeast British Columbia in exchange for an equity stake in Canbriam and a $223 million after-tax impairment charge in the fourth quarter of 2018 following the company's assessment of forward natural gas prices and the impact on estimated future cash flows. The third quarter of 2018 included an after-tax gain of $60 million in the Oil Sands segment on the sale of the company's interest in the Joslyn Oil Sands mining project. The first quarter of 2017 included a $354 million after-tax gain in the R&M segment related to the sale of the company's lubricants business, combined with an after-tax gain of $83 million in the Corporate segment related to the sale of the company's interest in the Cedar Point wind facility.
- (3)
- In the fourth quarter of 2017, the company recorded a net adjustment to its deferred income taxes of $124 million related to tax reform legislation in the U.S., with the most significant impact resulting from a decrease in the U.S. corporate tax rate from 35% to 21%. The net deferred tax recovery of $124 million was comprised of a $140 million recovery in R&M, a $14 million expense in E&P and a $2 million expense in the company's Energy Trading business.
- (4)
- During the fourth quarter of 2017, the company received after-tax property damage insurance proceeds of $55 million ($76 million before tax) related to a facility incident at Syncrude that occurred in the first quarter of 2017.
- (5)
- Charges associated with the early repayment of debt, net of associated realized foreign currency hedge gains, in the Corporate segment.
- (6)
- Non-cash mark to market (gain) loss on interest rate swaps and foreign currency derivatives resulting from changes in long-term interest rates and foreign exchange rates in the Corporate segment.
Corporate Guidance
No changes have been made to Suncor's previously announced 2019 guidance. For further details and advisories regarding Suncor's 2019 guidance, see www.suncor.com/guidance.
Measurement Conversions
Certain natural gas volumes in this document have been converted to boe on the basis of one bbl to six mcf. See the Advisories section of this document.
| | | 2018 FOURTH QUARTER Suncor Energy Inc. 5 |
FOURTH QUARTER DISCUSSION
February 5, 2019
Suncor is an integrated energy company headquartered in Calgary, Alberta, Canada. We are strategically focused on developing one of the world's largest petroleum resource basins – Canada's Athabasca oil sands. In addition, we explore for, acquire, develop, produce and market crude oil and natural gas in Canada and internationally; we transport and refine crude oil, and we market petroleum and petrochemical products primarily in Canada. We also conduct energy trading activities focused principally on the marketing and trading of crude oil, natural gas and byproducts. We also operate a renewable energy business as part of our overall portfolio of assets.
Additional information about Suncor filed with Canadian securities regulatory authorities and the United States Securities and Exchange Commission (SEC), including quarterly and annual reports and Suncor's Annual Information Form dated March 1, 2018 (the 2017 AIF), which is also filed with the SEC under cover of Form 40-F, is available online at www.sedar.com, www.sec.gov and our website www.suncor.com. Information contained in or otherwise accessible through our website does not form part of this document, and is not incorporated into this document by reference.
References to "we", "our", "Suncor", or "the company" mean Suncor Energy Inc., and the company's subsidiaries and interests in associates and jointly controlled entities, unless the context otherwise requires.
Table of Contents
| 1. | Advisories | 6 | ||||
| 2. | Fourth Quarter Highlights | 8 | ||||
| 3. | Consolidated Financial Information | 9 | ||||
| 4. | Segment Results and Analysis | 14 | ||||
| 5. | Capital Investment Update | 26 | ||||
| 6. | Financial Condition and Liquidity | 28 | ||||
| 7. | Quarterly Financial Data | 31 | ||||
| 8. | Other Items | 32 | ||||
| 9. | Non-GAAP Financial Measures Advisory | 33 | ||||
| 10. | Common Abbreviations | 38 | ||||
| 11. | Forward-Looking Information | 39 |
1. ADVISORIES
Basis of Presentation
Unless otherwise noted, all financial information has been prepared in accordance with Canadian generally accepted accounting principles (GAAP), specifically International Accounting Standard (IAS) 34Interim Financial Reporting as issued by the International Accounting Standards Board, which is within the framework of International Financial Reporting Standards (IFRS).
Effective January 1, 2018, the company adopted IFRS 15Revenue from Contracts with Customers (IFRS 15), which sets out new guidelines for the recognition of revenue. As a result, certain comparative figures presented in this document pertaining to Suncor's 2017 results have been restated in accordance with the new standard with no impact to overall net earnings or operating earnings.
All financial information is reported in Canadian dollars, unless otherwise noted. Production volumes are presented on a working-interest basis, before royalties, except for Libya, which is on an entitlement basis. Certain prior year amounts in the Consolidated Statements of Comprehensive (Loss) Income have been reclassified to conform to the current year's presentation.
References to Oil Sands operations exclude Suncor's interests in Fort Hills and Syncrude.
| 6 2018 FOURTH QUARTER Suncor Energy Inc. | | |
Non-GAAP Financial Measures
Certain financial measures in this document – namely operating earnings (loss), funds from (used in) operations, return on capital employed (ROCE), Oil Sands operations cash operating costs, Fort Hills cash operating costs, Syncrude cash operating costs, refining margin, refining operating expense, discretionary free funds flow, and last-in, first-out (LIFO) inventory valuation methodology – are not prescribed by GAAP. Operating earnings (loss) is defined in the Non-GAAP Financial Measures Advisory section of this document and reconciled to the most directly comparable GAAP measures in the Consolidated Financial Information and Segment Results and Analysis sections of this document. Oil Sands operations cash operating costs, Fort Hills cash operating costs, Syncrude cash operating costs and LIFO are defined in the Non-GAAP Financial Measures Advisory section of this document and reconciled to the most directly comparable GAAP measures in the Segment Results and Analysis section of this document. Funds from (used in) operations, ROCE, discretionary free funds flow, refining margin and refining operating expense are defined and reconciled to the most directly comparable GAAP measures in the Non-GAAP Financial Measures Advisory section of this document.
Risk Factors and Forward-Looking Information
The company's financial and operational performance is potentially affected by a number of factors, including, but not limited to, the factors described within the Forward-Looking Information section of this document. This document contains forward-looking information based on Suncor's current expectations, estimates, projections and assumptions. This information is provided to assist readers in understanding the company's future plans and expectations and may not be appropriate for other purposes. Refer to the Forward-Looking Information section of this document for information on the material risk factors and assumptions underlying our forward-looking information contained in this document.
Measurement Conversions
Certain crude oil and natural gas liquids volumes have been converted to mcfe on the basis of one bbl to six mcf. Also, certain natural gas volumes have been converted to boe or mboe on the same basis. Any figure presented in mcfe, boe or mboe may be misleading, particularly if used in isolation. A conversion ratio of one bbl of crude oil or natural gas liquids to six mcf of natural gas is based on an energy equivalency conversion method primarily applicable at the burner tip and does not represent a value equivalency at the wellhead. Given that the value ratio based on the current price of crude oil as compared to natural gas is significantly different from the energy equivalency of 6:1, conversion on a 6:1 basis may be misleading as an indication of value.
Common Abbreviations
For a list of abbreviations that may be used in this document, refer to the Common Abbreviations section of this document.
| | | 2018 FOURTH QUARTER Suncor Energy Inc. 7 |
- •
- Fourth quarter financial results
- •
- Suncor's net loss was $280 million in the fourth quarter of 2018, compared to net earnings of $1.382 billion in the prior year quarter. In addition to the items relating to operating earnings noted below, the net loss for the fourth quarter of 2018 included a $637 million unrealized after-tax foreign exchange loss on the revaluation of U.S. dollar denominated debt, as well as a non-cash impairment loss on one of the company's equity investments(1). Net earnings in the prior year quarter included a net $124 million deferred income tax recovery related to a decrease in the U.S. corporate tax rate from 35% to 21%, an unrealized after-tax foreign exchange loss of $91 million on the revaluation of U.S. dollar denominated debt, after-tax property damage insurance proceeds of $55 million, an after-tax loss of $18 million for early repayment of debt and a net after-tax gain of $2 million on interest rate swaps associated with debt issued in the fourth quarter of 2017.
- •
- Suncor recorded fourth quarter 2018 operating earnings(2) of $580 million, compared to $1.310 billion in the prior year quarter, mainly as a result of unfavourable western Canadian crude oil differentials, including a substantial widening of SCO differentials that also led to a net unfavourable inventory valuation change on declining crude feedstock costs. Other factors reducing operating earnings included the addition of operating and transportation costs for new production from growth projects and acquisitions, a decrease in Oil Sands operations SCO production, lower overall Exploration and Production (E&P) production, and a decrease in the capitalization of borrowing costs. These factors were partially offset by increased refinery margins, a recovery of share-based compensation costs (compared to an expense in the prior year quarter) and increased overall upstream production, driven by 94% plant utilization at Fort Hills, record production at Syncrude and the continued ramp up of operations at Hebron.
- •
- Funds from operations(2) were $2.007 billion in the fourth quarter of 2018, compared to $3.016 billion in the fourth quarter of 2017, and were influenced by the same factors impacting operating earnings noted above, excluding the recovery of non-cash share-based compensation, as well as unrealized gains on crude optimization activities. Cash flow provided by operating activities, which includes changes in non-cash working capital, was $3.040 billion for the fourth quarter of 2018, compared to $2.755 billion for the fourth quarter of 2017, with changes in non-cash working capital representing a source of cash to the company in the current period, as compared to a use of cash in the prior year period. The source of cash in the company's non-cash working capital balances was primarily due to the declining crude price environment in the fourth quarter and the associated decrease in accounts receivable balances, as well as the decline in refinery inventory value as the company replaced crude feedstock inventories purchased in the prior period with less expensive crude.
- •
- Upstream production set a new quarterly record of 831,000 boe/d in the fourth quarter of 2018. The increase was driven by the successful ramp up of Fort Hills to 94% of nameplate capacity for the quarter, improved reliability at Syncrude, as well as the additional 5% working interest in Syncrude acquired earlier in the year.
- •
- Record Refining and Marketing (R&M) throughput achieved. R&M delivered record quarterly crude throughput of 467,900 bbls/d, which represents refinery utilization of 101%.
- •
- Fort Hills achieved target rates ahead of schedule, with 94% utilization for the fourth quarter. Production at Fort Hills was 98,500 bbls/d, net to Suncor, in the fourth quarter of 2018, and the increase in production resulted in Fort Hills cash operating costs per barrel(2) of $24.85.
- •
- Continued strong ramp up of Hebron production. The fourth production well came online in the fourth quarter of 2018, contributing to total production of 15,700 bbls/d, net to the company.
- •
- Suncor continued to return value to shareholders. The company returned $574 million to shareholders through dividends and repurchased $1.166 billion of its shares during the fourth quarter of 2018 under its normal course issuer bid (NCIB). The company's existing $3.0 billion share repurchase program is expected to be completed by the end of February 2019.
- •
- Subsequent to the end of the quarter, Suncor's Board of Directors approved a 17% increase to the quarterly dividend and a renewal of the share repurchase program. This increases the quarterly dividend from $0.36 to $0.42 per share and provides approval for a further $2.0 billion in share repurchases.
- (1)
- Refer to note 2 of the Operating Earnings Reconciliation on page 11 for further details.
- (2)
- Operating earnings, funds from operations and Fort Hills cash operating costs are non-GAAP financial measures. See the Non-GAAP Financial Measures Advisory section of this document.
| 8 2018 FOURTH QUARTER Suncor Energy Inc. | | |
3. CONSOLIDATED FINANCIAL INFORMATION
Financial Highlights
| Three months ended December 31 | Twelve months ended December 31 | |||||||||
($ millions) | 2018 | 2017 | 2018 | 2017 | ||||||
| | | | | | | | | | | |
Net (loss) earnings | ||||||||||
| | ||||||||||
Oil Sands | (393 | ) | 670 | 853 | 1 009 | |||||
| | ||||||||||
Exploration and Production | (115 | ) | 217 | 808 | 732 | |||||
| | ||||||||||
Refining and Marketing | 723 | 886 | 3 153 | 2 658 | ||||||
| | ||||||||||
Corporate, Energy Trading and Eliminations | (495 | ) | (391 | ) | (1 521 | ) | 59 | |||
| | | | | | | | | | | |
Total | (280 | ) | 1 382 | 3 293 | 4 458 | |||||
| | | | | | | | | | | |
Operating earnings (loss)(1) | ||||||||||
| | ||||||||||
Oil Sands | (393 | ) | 615 | 793 | 954 | |||||
| | ||||||||||
Exploration and Production | 108 | 231 | 898 | 746 | ||||||
| | ||||||||||
Refining and Marketing | 723 | 746 | 3 153 | 2 164 | ||||||
| | ||||||||||
Corporate, Energy Trading and Eliminations | 142 | (282 | ) | (532 | ) | (676 | ) | |||
| | | | | | | | | | | |
Total | 580 | 1 310 | 4 312 | 3 188 | ||||||
| | | | | | | | | | | |
Funds from (used in) operations(1) | ||||||||||
| | ||||||||||
Oil Sands | 601 | 1 780 | 4 870 | 4 738 | ||||||
| | ||||||||||
Exploration and Production | 367 | 431 | 1 869 | 1 725 | ||||||
| | ||||||||||
Refining and Marketing | 826 | 935 | 3 794 | 2 841 | ||||||
| | ||||||||||
Corporate, Energy Trading and Eliminations | 213 | (130 | ) | (361 | ) | (165 | ) | |||
| | | | | | | | | | | |
Total | 2 007 | 3 016 | 10 172 | 9 139 | ||||||
| | ||||||||||
Decrease (increase) in non-cash working capital | 1 033 | (261 | ) | 408 | (173 | ) | ||||
| | | | | | | | | | | |
Cash flow provided by operating activities | 3 040 | 2 755 | 10 580 | 8 966 | ||||||
| | | | | | | | | | | |
Capital and exploration expenditures(2) | ||||||||||
| | ||||||||||
Sustaining | 826 | 807 | 3 926 | 2 916 | ||||||
| | ||||||||||
Growth | 293 | 637 | 1 324 | 2 906 | ||||||
| | | | | | | | | | | |
Total | 1 119 | 1 444 | 5 250 | 5 822 | ||||||
| | | | | | | | | | | |
| Three months ended December 31 | Twelve months ended December 31 | |||||||||
($ millions) | 2018 | 2017 | 2018 | 2017 | ||||||
| | | | | | | | | | | |
Discretionary free funds flow(1) | 594 | 1 672 | 3 862 | 4 056 | ||||||
| | | | | | | | | | | |
- (1)
- Non-GAAP financial measures. See the Non-GAAP Financial Measures Advisory section of this document.
- (2)
- Excludes capitalized interest.
| | | 2018 FOURTH QUARTER Suncor Energy Inc. 9 |
Operating Highlights
| Three months ended December 31 | Twelve months ended December 31 | |||||||||
| 2018 | 2017 | 2018 | 2017 | |||||||
| | | | | | | | | | | |
Production volumes by segment | ||||||||||
| | ||||||||||
Oil Sands (mbbls/d) | 740.8 | 621.2 | 628.6 | 563.7 | ||||||
| | ||||||||||
Exploration and Production (mboe/d) | 90.2 | 115.2 | 103.4 | 121.6 | ||||||
| | | | | | | | | | | |
Total (mboe/d) | 831.0 | 736.4 | 732.0 | 685.3 | ||||||
| | | | | | | | | | | |
Production mix | ||||||||||
| | ||||||||||
Crude oil and liquids / natural gas (%) | 100/0 | 100/0 | 100/0 | 100/0 | ||||||
| | | | | | | | | | | |
Refinery utilization (%) | 101 | 94 | 93 | 96 | ||||||
| | ||||||||||
Refinery crude oil processed (mbbls/d) | 467.9 | 432.4 | 430.8 | 441.2 | ||||||
| | | | | | | | | | | |
Net (Loss) Earnings
Suncor's consolidated net loss for the fourth quarter of 2018 was $280 million, compared to net earnings of $1.382 billion for the prior year quarter. Net earnings were primarily affected by the same factors that influenced operating earnings described subsequently in this section of this document.
Other items affecting net earnings over these periods included:
- •
- The after-tax unrealized foreign exchange impact on the revaluation of U.S. dollar denominated debt was a loss of $637 million for the fourth quarter of 2018, compared to a loss of $91 million for the fourth quarter of 2017.
- •
- The fourth quarter of 2018 included a $223 million after-tax impairment charge in the E&P segment associated with the company's equity investment in Canbriam Energy Inc. (Canbriam). This included the reversal of a $133 million after-tax gain recorded in the first quarter of 2018, when the equity investment was acquired through an asset exchange, for a net after-tax impairment of $90 million in 2018.
- •
- In the fourth quarter of 2017, Suncor recognized a net $124 million deferred income tax recovery related to a decrease in the U.S. corporate tax rate from 35% to 21%, including a $140 million recovery in the R&M segment, offset by a $14 million expense in the E&P segment and a $2 million expense in the Corporate segment.
- •
- In the fourth quarter of 2017, Suncor received after-tax property damage insurance proceeds of $55 million ($76 million before tax) in the Oil Sands segment for property damage related to a facility incident that occurred at Syncrude in the first quarter of 2017.
- •
- In the fourth quarter of 2017, the company recorded an after-tax loss of $18 million, for early repayment of debt, in the Corporate segment.
- •
- In the fourth quarter of 2017, the company recognized an after-tax gain on forward interest rate swaps, associated with issued debt, of $2 million in the Corporate segment due to changes in long-term interest rates.
| 10 2018 FOURTH QUARTER Suncor Energy Inc. | | |
Operating Earnings Reconciliation(1)
| Three months ended December 31 | Twelve months ended December 31 | |||||||||
($ millions) | 2018 | 2017 | 2018 | 2017 | ||||||
| | | | | | | | | | | |
Net (loss) earnings | (280 | ) | 1 382 | 3 293 | 4 458 | |||||
| | ||||||||||
Unrealized foreign exchange loss (gain) on U.S. dollar denominated debt | 637 | 91 | 989 | (702 | ) | |||||
| | ||||||||||
Loss on equity investment and (gain) on significant disposals(2) | 223 | — | 30 | (437 | ) | |||||
| | ||||||||||
Impact of income tax rate adjustment on deferred taxes(3) | — | (124 | ) | — | (124 | ) | ||||
| | ||||||||||
Property damage insurance proceeds(4) | — | (55 | ) | — | (55 | ) | ||||
| | ||||||||||
Loss on early payment of long-term debt(5) | — | 18 | — | 28 | ||||||
| | ||||||||||
Non-cash mark to market (gain) loss on interest rate swaps and foreign currency derivatives(6) | — | (2 | ) | — | 20 | |||||
| | | | | | | | | | | |
Operating earnings(1) | 580 | 1 310 | 4 312 | 3 188 | ||||||
| | | | | | | | | | | |
- (1)
- Operating earnings is a non-GAAP financial measure. All reconciling items are presented on an after-tax basis. See the Non-GAAP Financial Measures Advisory section of this document.
- (2)
- In 2018, the company recorded a net non-cash loss of $90 million, after-tax, in the E&P segment related to an asset exchange with Canbriam, comprised of the following: an after-tax gain of $133 million recorded in the first quarter of 2018 for the disposal of the company's mineral landholdings in northeast British Columbia in exchange for an equity stake in Canbriam and a $223 million after-tax impairment charge in the fourth quarter of 2018 following the company's assessment of forward natural gas prices and the impact on estimated future cash flows. The third quarter of 2018 included an after-tax gain of $60 million in the Oil Sands segment on the sale of the company's interest in the Joslyn Oil Sands mining project. The first quarter of 2017 included a $354 million after-tax gain in the R&M segment related to the sale of the company's lubricants business, combined with an after-tax gain of $83 million in the Corporate segment related to the sale of the company's interest in the Cedar Point wind facility.
- (3)
- In the fourth quarter of 2017, the company recorded a net adjustment to its deferred income taxes of $124 million related to tax reform legislation in the U.S., with the most significant impact resulting from a decrease in the U.S. corporate tax rate from 35% to 21%. The net deferred tax recovery of $124 million was comprised of a $140 million recovery in R&M, a $14 million expense in E&P and a $2 million expense in the company's Energy Trading business.
- (4)
- During the fourth quarter of 2017, the company received after-tax property damage insurance proceeds of $55 million ($76 million before tax) related to a facility incident at Syncrude that occurred in the first quarter of 2017.
- (5)
- Charges associated with the early repayment of debt, net of associated realized foreign currency hedge gains, in the Corporate segment.
- (6)
- Non-cash mark to market (gain) loss on interest rate swaps and foreign currency derivatives resulting from changes in long-term interest rates and foreign exchange rates in the Corporate segment.
Bridge Analysis of Operating Earnings($ millions)(1)
- (1)
- For an explanation of this bridge analysis, see the Non-GAAP Financial Measures Advisory section of this document.
| | | 2018 FOURTH QUARTER Suncor Energy Inc. 11 |
Suncor's fourth quarter 2018 operating earnings were $580 million ($0.36 per common share), compared to $1.310 billion ($0.79 per common share) in the prior year quarter. The decrease was primarily a result of unfavourable western Canadian crude oil differentials, including a substantial widening of SCO differentials, which resulted in the following:
- •
- Decreased Oil Sands price realizations, partially offset by improved refining margins.
- •
- Unfavourable first-in, first-out (FIFO) inventory valuation adjustment in R&M on declining feedstock costs, partially offset by a realization of intersegment profit in Corporate, Energy Trading and Eliminations.
Other factors reducing operating earnings include the addition of operating and transportation costs for new production from growth projects and acquisitions, a decrease in Oil Sands operations SCO production, lower overall E&P sales volumes, and a decrease in the capitalization of borrowing costs. These factors were partially offset by a recovery of share-based compensation costs (compared to an expense in the prior year quarter) and record overall upstream production, driven by 94% plant utilization at Fort Hills, the continued ramp up of operations at Hebron and record production at Syncrude.
After-Tax Share-Based Compensation (Recovery) Expense by Segment
| Three months ended December 31 | Twelve months ended December 31 | |||||||||
($ millions) | 2018 | 2017 | 2018 | 2017 | ||||||
| | | | | | | | | | | |
Oil Sands | (15 | ) | 25 | 48 | 77 | |||||
| | ||||||||||
Exploration and Production | (2 | ) | 3 | 4 | 10 | |||||
| | ||||||||||
Refining and Marketing | (7 | ) | 12 | 25 | 39 | |||||
| | ||||||||||
Corporate, Energy Trading and Eliminations | (40 | ) | 45 | 90 | 153 | |||||
| | | | | | | | | | | |
Total share-based compensation (recovery) expense | (64 | ) | 85 | 167 | 279 | |||||
| | | | | | | | | | | |
The after-tax share-based compensation impact on results was a recovery of $64 million during the fourth quarter of 2018, compared to an expense of $85 million during the prior year quarter, as a result of the decrease in the company's share price during the quarter, compared to an increase in the share price in the prior year quarter.
Business Environment
Commodity prices, refining crack spreads and foreign exchange rates are important factors that affect the results of Suncor's operations.
| Average for the three months ended December 31 | Average for the twelve months ended December 31 | |||||||||||
| 2018 | 2017 | 2018 | 2017 | |||||||||
| | | | | | | | | | | | | |
WTI crude oil at Cushing | US$/bbl | 58.85 | 55.40 | 64.80 | 50.95 | |||||||
| | ||||||||||||
Dated Brent crude | US$/bbl | 67.80 | 61.40 | 71.05 | 54.25 | |||||||
| | ||||||||||||
Dated Brent/Maya crude oil FOB price differential | US$/bbl | 4.35 | 9.60 | 9.10 | 7.70 | |||||||
| | ||||||||||||
MSW at Edmonton | Cdn$/bbl | 42.70 | 69.30 | 69.30 | 63.20 | |||||||
| | ||||||||||||
WCS at Hardisty | US$/bbl | 19.50 | 43.10 | 38.50 | 38.95 | |||||||
| | ||||||||||||
Light/heavy differential for WTI at Cushing less WCS at Hardisty | US$/bbl | 39.35 | 12.30 | 26.30 | 11.95 | |||||||
| | ||||||||||||
Condensate at Edmonton | US$/bbl | 45.30 | 57.95 | 61.05 | 51.55 | |||||||
| | ||||||||||||
Natural gas (Alberta spot) at AECO | Cdn$/mcf | 1.60 | 1.70 | 1.50 | 2.15 | |||||||
| | ||||||||||||
Alberta Power Pool Price | Cdn$/MWh | 55.55 | 22.35 | 50.20 | 22.15 | |||||||
| | ||||||||||||
New York Harbor 3-2-1 crack(1) | US$/bbl | 16.20 | 19.40 | 18.00 | 17.70 | |||||||
| | ||||||||||||
Chicago 3-2-1 crack(1) | US$/bbl | 13.35 | 20.20 | 15.90 | 16.30 | |||||||
| | ||||||||||||
Portland 3-2-1 crack(1) | US$/bbl | 21.60 | 22.10 | 22.80 | 22.15 | |||||||
| | ||||||||||||
Gulf Coast 3-2-1 crack(1) | US$/bbl | 15.10 | 18.25 | 17.45 | 17.65 | |||||||
| | ||||||||||||
Exchange rate | US$/Cdn$ | 0.76 | 0.79 | 0.77 | 0.77 | |||||||
| | ||||||||||||
Exchange rate (end of period) | US$/Cdn$ | 0.73 | 0.80 | 0.73 | 0.80 | |||||||
| | | | | | | | | | | | | |
- (1)
- 3-2-1 crack spreads are indicators of the refining margin generated by converting three barrels of WTI into two barrels of gasoline and one barrel of diesel. The crack spreads presented here generally approximate the regions into which the company sells refined products through retail and wholesale channels.
| 12 2018 FOURTH QUARTER Suncor Energy Inc. | | |
Suncor's sweet SCO price realizations are influenced primarily by the price of WTI at Cushing and by the supply and demand for sweet SCO from Western Canada, which influences SCO differentials. Price realizations in the fourth quarter of 2018 for sweet SCO were unfavourably impacted by a substantial widening of SCO differentials, partially offset by an increase in WTI at Cushing to US$58.85/bbl in the fourth quarter of 2018, compared to US$55.40/bbl in the prior year quarter. Suncor also produces sour SCO, the price of which is influenced by various crude benchmarks, including, but not limited to, MSW at Edmonton and WCS at Hardisty, and which can also be affected by prices negotiated for spot sales. Prices for MSW at Edmonton decreased to $42.70/bbl compared to $69.30/bbl in the prior year quarter, and prices for WCS at Hardisty decreased to US$19.50/bbl in the fourth quarter of 2018, from US$43.10/bbl in the prior year quarter, despite an increase in WTI as a result of further widening of western Canadian heavy crude and SCO differentials.
Bitumen production that Suncor does not upgrade is blended with diluent or SCO to facilitate delivery on pipeline systems. Net bitumen price realizations are, therefore, influenced by both prices for Canadian heavy crude oil (WCS at Hardisty is a common reference), prices for diluent (Condensate at Edmonton) and SCO. Bitumen price realizations can also be affected by bitumen quality and spot sales. Bitumen prices in the fourth quarter of 2018 were unfavourably impacted by wider heavy differentials, resulting from limited takeaway capacity in Alberta.
Subsequent to the end of the quarter, crude differentials for SCO and heavy crude have improved from the significant discounts experienced in the fourth quarter of 2018, as a result of the Alberta government's mandatory production curtailments.
Suncor's price realizations for production from East Coast Canada and International assets are influenced primarily by the price for Brent crude, which was US$67.80/bbl in the fourth quarter of 2018, compared to US$61.40/bbl in the prior year quarter. Due to the nature of cargo shipments at the company's offshore assets, the timing of bulk cargo sales can result in price realizations that deviate from the average benchmark price over the period. This was the case at East Coast Canada in the fourth quarter of 2018, where unfavourable timing of cargo sales resulted in average realizations below the Brent crude benchmark.
The cost of natural gas used in Suncor's Oil Sands and Refining operations is primarily referenced to Alberta spot prices at AECO. The average AECO benchmark decreased to $1.60/mcf in the fourth quarter of 2018, from $1.70/mcf in the prior year quarter.
Suncor's refining margins are primarily influenced by 3-2-1 benchmark crack spreads, which are industry indicators approximating the gross margin on a barrel of crude oil that is refined to produce gasoline and distillates, and crude differentials. More complex refineries can earn greater refining margin by processing less expensive, heavier crudes, or lighter crudes discounted relative to the WTI benchmark. Crude differentials in Alberta widened considerably during the fourth quarter of 2018, resulting in lower refinery feedstock costs for the majority of the company's refineries and improved refining margins. Crack spreads do not necessarily reflect the margins at a specific refinery. Crack spreads are based on current crude feedstock prices whereas actual earnings are based on FIFO inventory accounting, where a delay exists between the time that feedstock is purchased and when it is processed and sold to a third party. A FIFO loss normally reflects a declining price environment for crude oil and finished products, whereas FIFO gains reflect an increasing price environment for crude oil and finished products. Specific refinery margins are determined by actual crude purchase costs, refinery configuration, production mix and realized prices for refined products sales in markets unique to each refinery.
Excess electricity produced in Suncor's Oil Sands operations is sold to the Alberta Electric System Operator, with the proceeds netted against the Oil Sands operations cash operating cost per barrel metric. The Alberta power pool price increased to an average of $55.55/MWh in the fourth quarter of 2018, compared to $22.35/MWh in the prior year quarter.
The majority of Suncor's revenues from the sale of oil and natural gas commodities are based on prices that are determined by or referenced to U.S. dollar benchmark prices, while the majority of Suncor's expenditures are realized in Canadian dollars. The Canadian dollar weakened in relation to the U.S. dollar during the fourth quarter of 2018, as the average exchange rate decreased to US$0.76 per one Canadian dollar from US$0.79 per one Canadian dollar in the prior year quarter. This rate decrease had a positive impact on price realizations for the company during the fourth quarter of 2018 when compared to the prior year quarter.
Suncor also has assets and liabilities, including approximately 75% of the company's debt, which are denominated in U.S. dollars and translated to Suncor's reporting currency (Canadian dollars) at each balance sheet date. A decrease in the value of the Canadian dollar, relative to the U.S. dollar, from the previous balance sheet date increases the amount of Canadian dollars required to settle U.S. dollar denominated obligations, while an increase in the value of the Canadian dollar, relative to the U.S. dollar, decreases the amount of Canadian dollars required to settle U.S. dollar denominated obligations.
| | | 2018 FOURTH QUARTER Suncor Energy Inc. 13 |
4. SEGMENT RESULTS AND ANALYSIS
OIL SANDS
Financial Highlights
| Three months ended December 31 | Twelve months ended December 31 | |||||||||
($ millions) | 2018 | 2017 | 2018 | 2017 | ||||||
| | | | | | | | | | | |
Gross revenues(1) | 3 149 | 4 148 | 15 743 | 13 274 | ||||||
| | ||||||||||
Less: Royalties | (67 | ) | (175 | ) | (398 | ) | (355 | ) | ||
| | | | | | | | | | | |
Operating revenues, net of royalties | 3 082 | 3 973 | 15 345 | 12 919 | ||||||
| | | | | | | | | | | |
Net (loss) earnings | (393 | ) | 670 | 853 | 1 009 | |||||
| | | | | | | | | | | |
Adjusted for: | ||||||||||
| | ||||||||||
Gain on significant disposal(2) | — | — | (60 | ) | — | |||||
| | ||||||||||
Property damage insurance proceeds(3) | — | (55 | ) | — | (55 | ) | ||||
| | | | | | | | | | | |
Operating (loss) earnings(4) | (393 | ) | 615 | 793 | 954 | |||||
| | | | | | | | | | | |
Funds from operations(4) | 601 | 1 780 | 4 870 | 4 738 | ||||||
| | | | | | | | | | | |
- (1)
- The three- and twelve-month periods ended December 31, 2017 have been restated in accordance with the new IFRS 15 revenue requirements, with no impact to net earnings or operating earnings. For further information on the restatements associated with IFRS 15, refer to note 3 in Suncor's unaudited interim Consolidated Financial Statements for the three- and twelve-month periods ended December 31, 2018.
- (2)
- The third quarter of 2018 included an after-tax gain of $60 million on the sale of the company's interest in the Joslyn Oil Sands mining project.
- (3)
- During the fourth quarter of 2017 the company received after-tax property damage insurance proceeds of $55 million ($76 million before tax) related to a facility incident at Syncrude which occurred in the first quarter of 2017.
- (4)
- Non-GAAP financial measures. See the Non-GAAP Financial Measures Advisory section of this document.
Bridge Analysis of Operating (Loss) Earnings($ millions)(1)
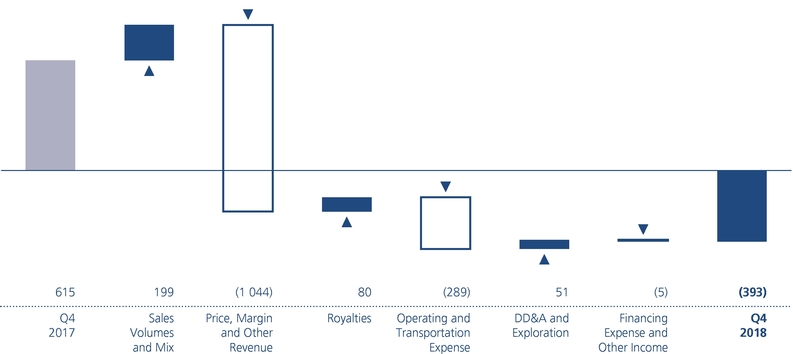
- (1)
- For an explanation of this bridge analysis, see the Non-GAAP Financial Measures Advisory section of this document.
The Oil Sands segment had an operating loss of $393 million in the fourth quarter of 2018, compared to operating earnings of $615 million in the prior year quarter. The decrease was due to lower crude price realizations across all product lines, higher operating costs associated with the addition of Fort Hills and an additional 5% working interest in Syncrude acquired earlier in the year, as well as lower sales of SCO from Oil Sands operations due to planned and unplanned maintenance at Upgrader 2. These factors were partially offset by an increase in overall sales volumes, with the addition of production from Fort Hills, increased Syncrude production and an increase in non-upgraded bitumen at Oil Sands operations.
| 14 2018 FOURTH QUARTER Suncor Energy Inc. | | |
Production Volumes(1)
| Three months ended December 31 | Twelve months ended December 31 | |||||||||
(mbbls/d) | 2018 | 2017 | 2018 | 2017 | ||||||
| | | | | | | | | | | |
Upgraded product (SCO and diesel) | 284.9 | 331.3 | 290.9 | 324.2 | ||||||
| | ||||||||||
Internally consumed diesel(2) | (11.5 | ) | (6.4 | ) | (10.6 | ) | (6.5 | ) | ||
| | | | | | | | | | | |
Total Oil Sands operations upgraded product | 273.4 | 324.9 | 280.3 | 317.7 | ||||||
| | ||||||||||
In Situ non-upgraded bitumen | 159.3 | 121.9 | 138.0 | 111.7 | ||||||
| | | | | | | | | | | |
Total Oil Sands operations production | 432.7 | 446.8 | 418.3 | 429.4 | ||||||
| | ||||||||||
Fort Hills bitumen | 98.5 | — | 67.4 | — | ||||||
| | ||||||||||
Internally upgraded bitumen from froth | — | — | (1.3 | ) | — | |||||
| | | | | | | | | | | |
Total Fort Hills bitumen production | 98.5 | — | 66.1 | — | ||||||
| | ||||||||||
Syncrude (sweet SCO and diesel) | 212.4 | 174.4 | 146.5 | 134.3 | ||||||
| | ||||||||||
Internally consumed diesel(2) | (2.8 | ) | — | (2.3 | ) | — | ||||
| | | | | | | | | | | |
Total Syncrude sweet SCO production | 209.6 | 174.4 | 144.2 | 134.3 | ||||||
| | | | | | | | | | | |
Total Oil Sands production(2) | 740.8 | 621.2 | 628.6 | 563.7 | ||||||
| | | | | | | | | | | |
- (1)
- Bitumen production from Oil Sands Base is upgraded, while bitumen production from In Situ operations is either upgraded or sold directly to customers, including Suncor's own refineries, with SCO and diesel yields of approximately 79% of bitumen feedstock input. Fort Hills finished bitumen is sold directly to customers and bitumen froth from Fort Hills can be sent to Oil Sands Base for further processing into SCO. All of the bitumen produced at Syncrude is upgraded to sweet SCO and a small amount of diesel, at an approximate yield of 85%.
- (2)
- Both Oil Sands operations and Syncrude produce diesel, which is internally consumed in mining operations, and Fort Hills uses internally produced diesel from Oil Sands Base within its mining operations. Of the 11,500 bbls/d of internally consumed diesel at Oil Sands operations in the fourth quarter of 2018, 9,300 bbls/d was consumed at Oil Sands Base and 2,200 bbls/d was consumed at Fort Hills. Oil Sands operations utilization rates are calculated net of Oil Sands Base internally consumed diesel, but inclusive of diesel consumed internally at Fort Hills. Syncrude utilization rates are calculated using intermediate sour production.
Oil Sands operations production was 432,700 bbls/d in the fourth quarter of 2018, compared to 446,800 bbls/d in the prior year quarter. The decrease was primarily due to the completion of planned maintenance at Upgrader 2 early in the fourth quarter and unplanned maintenance at Upgrader 2, which occurred late in the fourth quarter and was resolved prior to the end of the quarter, partially offset by an associated increase in non-upgraded bitumen production. Upgrader utilization was 79% in the fourth quarter of 2018, compared to 93% in the prior year period.
Fort Hills exceeded original target production rates with a utilization rate of 94% for the fourth quarter of 2018 and production of 98,500 bbls/d of bitumen net to Suncor.
Sales Volumes
| Three months ended December 31 | Twelve months ended December 31 | |||||||||
(mbbls/d) | 2018 | 2017 | 2018 | 2017 | ||||||
| | | | | | | | | | | |
Oil Sands operations sales volumes | ||||||||||
| | ||||||||||
Sweet SCO | 110.2 | 95.5 | 96.1 | 107.9 | ||||||
| | ||||||||||
Diesel | 27.6 | 21.1 | 28.8 | 27.5 | ||||||
| | ||||||||||
Sour SCO | 150.7 | 214.4 | 162.6 | 183.6 | ||||||
| | | | | | | | | | | |
Upgraded product | 288.5 | 331.0 | 287.5 | 319.0 | ||||||
| | ||||||||||
In Situ non-upgraded bitumen | 172.0 | 130.7 | 134.0 | 110.6 | ||||||
| | | | | | | | | | | |
Oil Sands operations | 460.5 | 461.7 | 421.5 | 429.6 | ||||||
| | ||||||||||
Fort Hills bitumen | 94.6 | — | 57.3 | — | ||||||
| | ||||||||||
Syncrude | 209.6 | 174.4 | 144.2 | 134.3 | ||||||
| | | | | | | | | | | |
Total | 764.7 | 636.1 | 623.0 | 563.9 | ||||||
| | | | | | | | | | | |
| | | 2018 FOURTH QUARTER Suncor Energy Inc. 15 |
Sales volumes for Oil Sands operations were 460,500 bbls/d in the fourth quarter of 2018, compared to 461,700 bbls/d in the prior year quarter, with an inventory draw in both non-upgraded bitumen and SCO offsetting the decline in overall production.
Bitumen sales at Fort Hills averaged 94,600 bbls/d, net to Suncor, in the fourth quarter of 2018, reflecting a small build of inventory as increased sales were transported to customers extending down to the U.S. Gulf Coast.
Suncor's share of Syncrude production and sales was 209,600 bbls/d in the fourth quarter of 2018, compared to 174,400 bbls/d in the prior year quarter. The increase was primarily due to stronger reliability at Syncrude, with 101% utilization achieved in the period, in addition to the acquisition of an additional 5% working interest in Syncrude in the first quarter of 2018.
Bitumen Production
| Three months ended December 31 | Twelve months ended December 31 | |||||||||
| 2018 | 2017 | 2018 | 2017 | |||||||
| | | | | | | | | | | |
Oil Sands Base | ||||||||||
| | ||||||||||
Bitumen production (mbbls/d) | 278.3 | 296.7 | 258.8 | 305.4 | ||||||
| | ||||||||||
Bitumen ore mined (thousands of tonnes per day) | 412.1 | 450.0 | 378.0 | 464.4 | ||||||
| | ||||||||||
Bitumen ore grade quality (bbls/tonne) | 0.68 | 0.66 | 0.68 | 0.66 | ||||||
| | | | | | | | | | | |
In Situ | ||||||||||
| | ||||||||||
Bitumen production – Firebag (mbbls/d) | 197.2 | 208.5 | 204.0 | 181.5 | ||||||
| | ||||||||||
Steam-to-oil ratio – Firebag | 2.7 | 2.7 | 2.7 | 2.7 | ||||||
| | | | | | | | | | | |
Bitumen production – MacKay River (mbbls/d) | 37.0 | 28.3 | 36.0 | 31.1 | ||||||
| | ||||||||||
Steam-to-oil ratio – MacKay River | 2.8 | 3.1 | 2.9 | 3.1 | ||||||
| | | | | | | | | | | |
Total In Situ bitumen production (mbbls/d) | 234.2 | 236.8 | 240.0 | 212.6 | ||||||
| | | | | | | | | | | |
Total Oil Sands operations bitumen production (mbbls/d) | 512.5 | 533.5 | 498.8 | 518.0 | ||||||
| | | | | | | | | | | |
Fort Hills | ||||||||||
| | ||||||||||
Bitumen production (mbbls/d) | 98.5 | — | 67.4 | — | ||||||
| | ||||||||||
Bitumen ore mined (thousands of tonnes per day) | 154.1 | — | 106.2 | — | ||||||
| | ||||||||||
Bitumen ore grade quality (bbls/tonne) | 0.64 | — | 0.63 | — | ||||||
| | | | | | | | | | | |
Syncrude | ||||||||||
| | ||||||||||
Bitumen production (mbbls/d) | 240.7 | 207.5 | 172.0 | 163.6 | ||||||
| | ||||||||||
Bitumen ore mined (thousands of tonnes per day) | 384.4 | 386.1 | 277.5 | 304.4 | ||||||
| | ||||||||||
Bitumen ore grade quality (bbls/tonne) | 0.63 | 0.54 | 0.62 | 0.54 | ||||||
| | | | | | | | | | | |
Total Oil Sands bitumen production | 851.7 | 741.0 | 738.2 | 681.6 | ||||||
| | | | | | | | | | | |
Bitumen production at Oil Sands operations decreased in the fourth quarter of 2018 to 512,500 bbls/d, compared with 533,500 bbls/d in the prior year quarter. The decrease was primarily due to lower Oil Sands Base bitumen production due to lower upgrader availability associated with planned and unplanned maintenance, and lower Firebag production, partially offset by strong production from MacKay River as a result of improved reliability and steam-to-oil ratio.
Bitumen production at Fort Hills in the fourth quarter of 2018 was 98,500 bbls/d, net to Suncor, following the successful start of operations in the first quarter of 2018 and subsequent ramp up.
Bitumen production at Syncrude in the fourth quarter of 2018 increased to 240,700 bbls/d, net to Suncor, from 207,500 bbls/d in the prior year quarter. The increase was primarily due to stronger reliability at the asset in addition to the 5% increase in Suncor's working interest acquired earlier in 2018.
| 16 2018 FOURTH QUARTER Suncor Energy Inc. | | |
Price Realizations(1)
Net of transportation costs, but before royalties | Three months ended December 31 | Twelve months ended December 31 | ||||||||
($/bbl) | 2018 | 2017 | 2018 | 2017 | ||||||
| | | | | | | | | | | |
Oil Sands operations | ||||||||||
| | ||||||||||
SCO and diesel | 42.44 | 66.68 | 68.97 | 61.47 | ||||||
| | ||||||||||
Bitumen | 2.43 | 39.74 | 24.70 | 33.47 | ||||||
| | ||||||||||
Crude sales basket (all products) | 27.50 | 59.05 | 54.91 | 54.26 | ||||||
| | ||||||||||
Crude sales basket, relative to WTI | (49.94 | ) | (11.08 | ) | (29.24 | ) | (11.91 | ) | ||
| | | | | | | | | | | |
Fort Hills bitumen | 20.26 | — | 38.46 | — | ||||||
| | | | | | | | | | | |
Syncrude – sweet SCO | 47.71 | 73.28 | 70.19 | 66.05 | ||||||
| | ||||||||||
Syncrude, relative to WTI | (29.73 | ) | 3.15 | (13.97 | ) | (0.12 | ) | |||
| | | | | | | | | | | |
- (1)
- Price realizations for the fourth quarter of 2017 have been restated in accordance with the new IFRS 15 revenue requirements, with no impact to net earnings or operating earnings, as well as the removal of the impact of risk management activities. For further information on the restatements associated with IFRS 15, refer to note 3 in Suncor's unaudited interim Consolidated Financial Statements for the three- and twelve-month periods ended December 31, 2018.
Average price realizations at Oil Sands operations decreased to $27.50/bbl in the fourth quarter of 2018 from $59.05/bbl in the prior year quarter, due to wider heavy crude oil and SCO differentials resulting from oversupply and takeaway constraints impacting the Alberta crude market, partially offset by the impact of a weaker Canadian dollar.
Average price realizations for Fort Hills bitumen were $20.26/bbl in the fourth quarter of 2018 and were higher than In Situ bitumen realizations due to a higher proportion of sales being made in the U.S. mid-continent and the U.S. Gulf Coast, where Suncor is able to utilize its logistics network to access favourable pricing in the U.S. market, combined with the improved quality associated with paraffinic froth-treated bitumen produced at Fort Hills.
Average price realizations at Syncrude decreased to $47.71/bbl in the fourth quarter of 2018 from $73.28/bbl in the prior year quarter due to wider SCO differentials, partially offset by the impact of a weaker Canadian dollar.
Royalties
Royalties for the Oil Sands segment were lower in the fourth quarter of 2018 compared to the prior year quarter, primarily due to the decrease in crude price realizations.
Expenses and Other Factors
Oil Sands operating and transportation expenses for the fourth quarter of 2018 increased when compared to the prior year quarter, mainly due to the start-up of Fort Hills earlier in the year, as well as the acquisition of an additional 5% working interest in Syncrude earlier in 2018. See the reconciliation in the Cash Operating Costs section below for further details regarding cash operating costs and a breakdown of non-production costs by asset.
At Oil Sands operations, operating costs increased as a result of an increase in maintenance expenses, which were primarily associated with the completion of the Upgrader 2 turnaround early in the quarter, as well as increased unplanned maintenance costs, partially offset by lower natural gas prices and a recovery of share-based compensation expense.
At Fort Hills, operating costs in the fourth quarter of 2018 continued to reflect the ramp up of operations to full production rates.
Suncor's share of Syncrude operating costs was higher than the prior year quarter, primarily due to the addition of the 5% working interest acquired earlier in the year and an increase in variable costs related to higher production volumes, partially offset by lower natural gas prices.
Oil Sands transportation costs increased primarily as a result of the addition of sales volumes from Fort Hills.
DD&A and impairment expenses for the fourth quarter of 2018 were lower than the prior year period due to lower derecognition charges and lower DD&A on a lower net book value asset base at Oil Sands operations, primarily related to a decrease in capitalized asset retirement obligation costs, more than offsetting the addition of DD&A from Fort Hills and the additional 5% Syncrude working interest acquired in the first quarter of 2018.
| | | 2018 FOURTH QUARTER Suncor Energy Inc. 17 |
Cash Operating Costs
| Three months ended December 31 | Twelve months ended December 31 | |||||||||
($ millions, except as noted) | 2018 | 2017 | 2018 | 2017 | ||||||
| | | | | | | | | | | |
Oil Sands operating, selling and general expense (OS&G) | 1 996 | 1 616 | 7 570 | 6 257 | ||||||
| | | | | | | | | | | |
Oil Sands operations cash operating costs(1) reconciliation | ||||||||||
| | ||||||||||
Oil Sands operations OS&G | 1 086 | 1 080 | 4 214 | 4 062 | ||||||
| | ||||||||||
Non-production costs(2) | (2 | ) | (34 | ) | (93 | ) | (102 | ) | ||
| | ||||||||||
Excess power capacity and other(3) | (80 | ) | (52 | ) | (237 | ) | (232 | ) | ||
| | ||||||||||
Inventory changes | (25 | ) | — | (14 | ) | 1 | ||||
| | | | | | | | | | | |
Oil Sands operations cash operating costs(1) | 979 | 994 | 3 870 | 3 729 | ||||||
| | ||||||||||
Oil Sands operations cash operating costs ($/bbl)(1) | 24.50 | 24.20 | 25.25 | 23.80 | ||||||
| | | | | | | | | | | |
Fort Hills cash operating costs(1) reconciliation | ||||||||||
| | ||||||||||
Fort Hills OS&G | 291 | — | 832 | — | ||||||
| | ||||||||||
Non-production costs(2) | (24 | ) | — | (120 | ) | — | ||||
| | ||||||||||
Inventory changes | (43 | ) | — | 55 | — | |||||
| | | | | | | | | | | |
Fort Hills cash operating costs(1) | 224 | — | 767 | — | ||||||
| | ||||||||||
Fort Hills cash operating costs ($/bbl)(1) | 24.85 | — | 31.20 | — | ||||||
| | | | | | | | | | | |
Syncrude cash operating costs(1) reconciliation | ||||||||||
| | ||||||||||
Syncrude OS&G | 619 | 536 | 2 523 | 2 195 | ||||||
| | ||||||||||
Non-production costs(2) | (7 | ) | (10 | ) | (33 | ) | (37 | ) | ||
| | | | | | | | | | | |
Syncrude cash operating costs(1) | 612 | 526 | 2 490 | 2 158 | ||||||
| | ||||||||||
Syncrude cash operating costs ($/bbl)(1) | 31.75 | 32.80 | 47.25 | 44.05 | ||||||
| | | | | | | | | | | |
- (1)
- Non-GAAP financial measures. See the Non-GAAP Financial Measures Advisory section of this document.
- (2)
- Significant non-production costs include, but are not limited to, share-based compensation expense and research expenses. Non-production costs at Fort Hills also include, but are not limited to, project start-up costs, excess power revenue from cogeneration units and an adjustment to reflect internally produced diesel from Oil Sands operations at the cost of production.
- (3)
- Oil Sands operations excess power capacity and other includes, but is not limited to, the operational revenue impacts of excess power from a cogeneration unit and the natural gas expense recorded as part of a non-monetary arrangement involving a third-party processor.
Oil Sands operations cash operating costs per barrel(1) were $24.50 in the fourth quarter of 2018, and were comparable to $24.20 in the prior year quarter, with lower production volumes being offset by lower cash operating costs. Total Oil Sands operations cash operating costs were $979 million compared to $994 million in the prior year quarter, with the decrease associated with higher power revenues.
In the fourth quarter of 2018, non-production costs, which are excluded from Oil Sands operations cash operating costs, were lower than the prior year quarter, primarily due to a recovery of share-based compensation expense.
Excess power capacity and other costs at Oil Sands operations for the fourth quarter of 2018 were higher than the prior year quarter, due mainly to an increase in excess power revenues on higher prices.
Inventory changes at Oil Sands operations in the fourth quarter of 2018 reflect a larger draw of inventory in the fourth quarter of 2018, compared to the inventory draw in the fourth quarter of 2017.
- (1)
- Non-GAAP financial measure. See the Non-GAAP Financial Measures Advisory section of this document
| 18 2018 FOURTH QUARTER Suncor Energy Inc. | | |
Fort Hills cash operating costs per barrel(1) averaged $24.85 in the fourth quarter of 2018, compared to $33.45 in the previous quarter, following the achievement of operating rates in excess of 90% of nameplate capacity. Inventory changes represented a charge to the company in the fourth quarter, despite a build of inventory, due to the decrease in inventory costs associated with higher production volumes.
Syncrude cash operating costs(1) per barrel were $31.75 in the fourth quarter of 2018, compared to $32.80 in the prior year quarter, with the decrease attributable to higher production and lower natural gas costs. Suncor's share of Syncrude cash operating costs increased to $612 million, from $526 million in the fourth quarter of 2017, as a result of the acquisition of an additional 5% working interest in Syncrude in the first quarter of 2018, in addition to an increase in variable costs associated with the increase in production.
Planned Maintenance Update
The company completed planned maintenance at Upgrader 2 early in the fourth quarter of 2018. There are no major maintenance events planned for the first quarter of 2019.
- (1)
- Non-GAAP financial measures. See the Non-GAAP Financial Measures Advisory section of this document.
| | | 2018 FOURTH QUARTER Suncor Energy Inc. 19 |
EXPLORATION AND PRODUCTION
Financial Highlights
| Three months ended December 31 | Twelve months ended December 31 | |||||||||
($ millions) | 2018 | 2017 | 2018 | 2017 | ||||||
| | | | | | | | | | | |
Gross revenues(1) | 651 | 802 | 3 474 | 3 177 | ||||||
| | ||||||||||
Less: Royalties(1) | (19 | ) | (53 | ) | (257 | ) | (266 | ) | ||
| | | | | | | | | | | |
Operating revenues, net of royalties | 632 | 749 | 3 217 | 2 911 | ||||||
| | | | | | | | | | | |
Net (loss) earnings | (115 | ) | 217 | 808 | 732 | |||||
| | ||||||||||
Adjusted for: | ||||||||||
| | ||||||||||
Non-cash gain on asset exchange and loss on equity investment(2) | 223 | — | 90 | — | ||||||
| | ||||||||||
Impact of income tax rate adjustment on deferred taxes(3) | — | 14 | — | 14 | ||||||
| | | | | | | | | | | |
Operating earnings(3) | 108 | 231 | 898 | 746 | ||||||
| | | | | | | | | | | |
Funds from operations(3) | 367 | 431 | 1 869 | 1 725 | ||||||
| | | | | | | | | | | |
- (1)
- Production, revenues and royalties from the company's Libya operations have been presented in the E&P section of this document on an entitlement basis and exclude an equal and offsetting gross up of revenues and royalties, which is required for presentation purposes in the company's financial statements under the working-interest basis.
- (2)
- The fourth quarter of 2018 included a $223 million after-tax impairment charge in the E&P segment associated with the company's equity investment in Canbriam. The first quarter of 2018 included a non-cash after-tax gain of $133 million in the E&P segment related to the asset exchange with Canbriam for the company's mineral landholdings in northeast British Columbia.
- (3)
- Non-GAAP financial measures. See the Non-GAAP Financial Measures Advisory section of this document.
Bridge Analysis of Operating Earnings($ millions)(1)
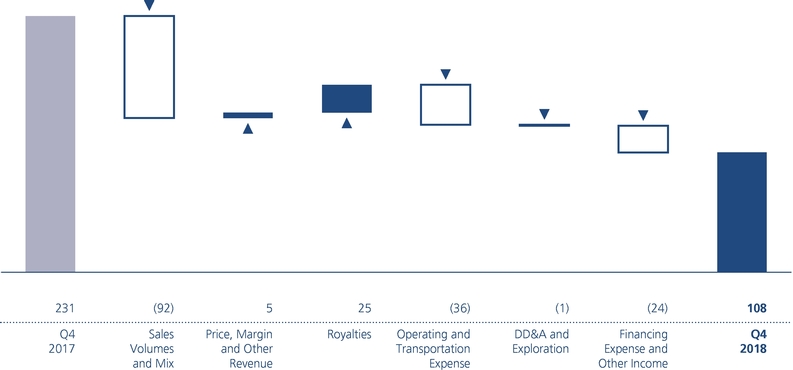
- (1)
- For an explanation of this bridge analysis, see the Non-GAAP Financial Measures Advisory section of this document.
Operating earnings for the E&P segment in the fourth quarter of 2018 decreased to $108 million, from $231 million in the prior year quarter, as a result of lower overall production and an increase in operating expenses, primarily associated with the ramp up of Hebron, partially offset by lower royalties.
| 20 2018 FOURTH QUARTER Suncor Energy Inc. | | |
Production Volumes
| Three months ended December 31 | Twelve months ended December 31 | |||||||||
| 2018 | 2017 | 2018 | 2017 | |||||||
| | | | | | | | | | | |
E&P Canada | ||||||||||
| | ||||||||||
Terra Nova (mbbls/d) | 9.5 | 14.6 | 11.7 | 11.5 | ||||||
| | ||||||||||
Hibernia (mbbls/d) | 19.0 | 27.1 | 22.1 | 28.5 | ||||||
| | ||||||||||
White Rose (mbbls/d) | 3.7 | 10.6 | 6.6 | 11.4 | ||||||
| | ||||||||||
Hebron (mbbls/d) | 15.7 | 1.8 | 13.0 | 0.4 | ||||||
| | ||||||||||
North America Onshore (mboe/d) | — | 1.4 | 0.5 | 1.9 | ||||||
| | | | | | | | | | | |
| 47.9 | 55.5 | 53.9 | 53.7 | |||||||
| | ||||||||||
E&P International | ||||||||||
| | ||||||||||
Buzzard (mboe/d) | 27.7 | 36.6 | 34.2 | 43.8 | ||||||
| | ||||||||||
Golden Eagle (mboe/d) | 10.7 | 17.9 | 12.4 | 19.6 | ||||||
| | | | | | | | | | | |
United Kingdom (mboe/d) | 38.4 | 54.5 | 46.6 | 63.4 | ||||||
| | ||||||||||
Libya (mbbls/d) | 3.9 | 5.2 | 2.9 | 4.5 | ||||||
| | | | | | | | | | | |
| 42.3 | 59.7 | 49.5 | 67.9 | |||||||
| | | | | | | | | | | |
Total Production (mboe/d) | 90.2 | 115.2 | 103.4 | 121.6 | ||||||
| | ||||||||||
Production mix (liquids/gas) (%) | 99/1 | 98/2 | 99/1 | 97/3 | ||||||
| | | | | | | | | | | |
Total Sales Volumes (mboe/d) | 83.1 | 104.8 | 102.8 | 120.8 | ||||||
| | | | | | | | | | | |
Production volumes for E&P Canada were 47,900 boe/d in the fourth quarter of 2018, compared to 55,500 boe/d in the prior year quarter. The decrease in production was due to a temporary production interruption at the company's East Coast Canada assets as a result of a major storm system during the quarter, in addition to natural declines, partially offset by the addition of production from Hebron, which averaged 15,700 bbls/d, net to the company, in the quarter. The production interruption at the White Rose field extended into 2019, with partial production restarting at the end of January 2019.
E&P International production decreased to 42,300 boe/d, from 59,700 boe/d in the prior year quarter, primarily due to an unplanned outage at Buzzard, which was resolved by the end of the fourth quarter, in addition to natural declines in the U.K.
E&P sales volumes decreased to 83,100 boe/d in the fourth quarter of 2018, compared to 104,800 boe/d in the prior year quarter, due to the decrease in production, as well as a larger inventory build at East Coast Canada associated with the timing of cargo sales.
Price Realizations
| Three months ended December 31 | Twelve months ended December 31 | |||||||||
Net of transportation costs, but before royalties | 2018 | 2017 | 2018 | 2017 | ||||||
| | | | | | | | | | | |
Exploration and Production | ||||||||||
| | ||||||||||
E&P Canada – Crude oil and natural gas liquids ($/bbl) | 73.48 | 79.19 | 87.82 | 69.14 | ||||||
| | ||||||||||
E&P Canada – Natural gas ($/mcfe) | — | 0.44 | 1.94 | 1.77 | ||||||
| | ||||||||||
E&P International ($/boe) | 82.30 | 74.49 | 86.77 | 65.46 | ||||||
| | | | | | | | | | | |
Price realizations at E&P Canada were lower in the fourth quarter of 2018 than the prior year quarter, due to unfavourable pricing windows realized on the timing of cargo sales relative to the Brent crude benchmark average in the period, which improved over the prior year quarter, partially offset by the impact of a weaker Canadian dollar.
Price realizations at E&P International were higher in the fourth quarter of 2018 than the prior year quarter, due to higher benchmark crude pricing for Brent and the impact of a weaker Canadian dollar.
| | | 2018 FOURTH QUARTER Suncor Energy Inc. 21 |
Royalties
E&P royalties in the fourth quarter of 2018 were lower than the prior year quarter due to the decrease in East Coast Canada price realizations and production.
Expenses and Other Factors
Operating and transportation expenses for the fourth quarter of 2018 increased compared to the prior year quarter, primarily due to additional operating costs at Hebron, which began producing partway through the fourth quarter of 2017, and increased costs at Terra Nova and Golden Eagle related to planned maintenance activities.
DD&A expense in the fourth quarter of 2018 was lower compared to the fourth quarter of 2017, primarily due to lower overall production, partially offset by the addition of DD&A from the Hebron project for a full quarter.
Exploration expense in the fourth quarter of 2018 increased when compared to the prior year quarter due to exploration charges for drilling at the Cassidy exploration well in the Norwegian sector of the North Sea within the Oda licence.
Planned Maintenance Update for Operated Assets
There are no significant maintenance events scheduled for the first quarter of 2019.
| 22 2018 FOURTH QUARTER Suncor Energy Inc. | | |
REFINING AND MARKETING
Financial Highlights
| Three months ended December 31 | Twelve months ended December 31 | |||||||||
($ millions) | 2018 | 2017 | 2018 | 2017 | ||||||
| | | | | | | | | | | |
Operating revenues(1) | 5 651 | 5 362 | 23 724 | 19 704 | ||||||
| | | | | | | | | | | |
Net earnings | 723 | 886 | 3 153 | 2 658 | ||||||
| | ||||||||||
Adjusted for: | ||||||||||
| | ||||||||||
Impact of income tax rate adjustment on deferred taxes(2) | — | (140 | ) | — | (140 | ) | ||||
| | ||||||||||
Gain on significant disposal(3) | — | — | — | (354 | ) | |||||
| | | | | | | | | | | |
Operating earnings(3) | 723 | 746 | 3 153 | 2 164 | ||||||
| | | | | | | | | | | |
Funds from operations(3) | 826 | 935 | 3 794 | 2 841 | ||||||
| | | | | | | | | | | |
- (1)
- The three- and twelve-month periods ended December 31, 2017 have been restated in accordance with the new IFRS 15 revenue requirements, with no impact to net earnings or operating earnings. For further information on the restatements associated with IFRS 15, refer to note 3 in Suncor's unaudited interim Consolidated Financial Statements for the three- and twelve-month periods ended December 31, 2018.
- (2)
- After-tax gain related to the sale of the company's Petro-Canada lubricants business during the first quarter of 2017.
- (3)
- Non-GAAP financial measures. See the Non-GAAP Financial Measures Advisory section of this document.
Bridge Analysis of Operating Earnings($ millions)(1)
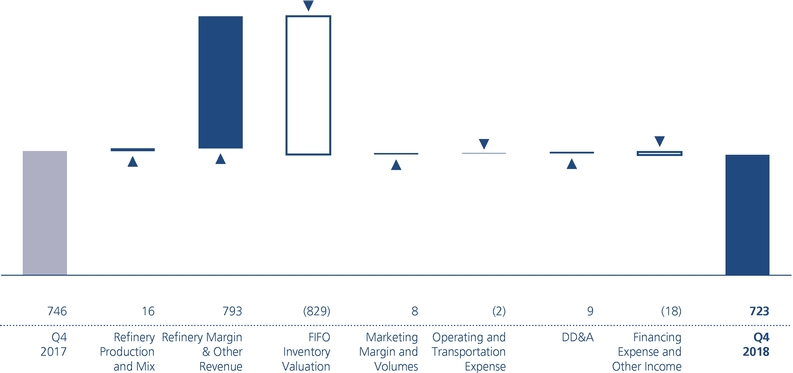
- (1)
- For an explanation of this bridge analysis, see the Non-GAAP Financial Measures Advisory section of this document.
R&M operating earnings in the fourth quarter of 2018 were $723 million, compared to $746 million in the prior year quarter. The decrease was due to a FIFO loss associated with the significant decline in crude and refined product benchmarks during the quarter, partially offset by improved refining margins, primarily attributed to wider crude differentials, as well as record crude throughput.
At the company level, the FIFO loss was partially offset by a realization of intersegment profit associated with the consumption of internal crude feedstock from the company's Oil Sands assets, for a net inventory valuation loss of $384 million in the quarter, and the favourable impact of wider crude differentials partially offsetting the decrease in Oil Sands price realizations.
| | | 2018 FOURTH QUARTER Suncor Energy Inc. 23 |
Volumes
| Three months ended December 31 | Twelve months ended December 31 | |||||||||
| 2018 | 2017 | 2018 | 2017 | |||||||
| | | | | | | | | | | |
Crude oil processed (mbbls/d) | ||||||||||
| | ||||||||||
Eastern North America | 221.0 | 188.7 | 208.1 | 206.4 | ||||||
| | ||||||||||
Western North America | 246.9 | 243.7 | 222.7 | 234.8 | ||||||
| | | | | | | | | | | |
Total | 467.9 | 432.4 | 430.8 | 441.2 | ||||||
| | | | | | | | | | | |
Refinery utilization(1) (%) | ||||||||||
| | ||||||||||
Eastern North America | 100 | 85 | 94 | 93 | ||||||
| | ||||||||||
Western North America | 103 | 102 | 93 | 98 | ||||||
| | | | | | | | | | | |
Total | 101 | 94 | 93 | 96 | ||||||
| | | | | | | | | | | |
Refined product sales (mbbls/d) | ||||||||||
| | ||||||||||
Gasoline | 245.6 | 246.8 | 245.6 | 242.9 | ||||||
| | ||||||||||
Distillate | 209.7 | 200.9 | 203.4 | 199.3 | ||||||
| | ||||||||||
Other | 75.3 | 79.1 | 78.4 | 88.3 | ||||||
| | | | | | | | | | | |
Total | 530.6 | 526.8 | 527.4 | 530.5 | ||||||
| | | | | | | | | | | |
Refining margin(2) ($/bbl) | 41.50 | 31.95 | 34.50 | 24.20 | ||||||
| | ||||||||||
Refining operating expense(2) ($/bbl) | 5.45 | 5.25 | 5.35 | 5.05 | ||||||
| | | | | | | | | | | |
- (1)
- Refinery utilization is the amount of crude oil and natural gas plant liquids run through crude distillation units, expressed as a percentage of the capacity of these units.
- (2)
- Non-GAAP financial measures. See the Non-GAAP Financial Measures Advisory section of this document.
Refinery crude throughput of 467,900 bbls/d in the fourth quarter of 2018 represents a new quarterly record, compared to 432,400 bbls/d in the prior year quarter, when the Montreal refinery was impacted by a third-party power outage. Reliability at all of the company's refineries was strong in the fourth quarter of 2018, resulting in utilization of 101%, compared to 94% in the prior year quarter.
Total refined products sales of 530,600 bbls/d in the fourth quarter of 2018 were comparable to 526,800 bbls/d in the prior year quarter, reflecting higher refinery crude throughput and strong product demand.
Prices and Margin
Realized refined product gross margins were higher in the fourth quarter of 2018, compared to the prior year quarter, and were influenced by the following factors:
- •
- An overall favourable business environment, driven by significantly wider crude differentials and the impact of a weaker Canadian dollar, partially offset by lower benchmark crack spreads.
- •
- In the fourth quarter of 2018, the impact of the FIFO method of inventory valuation, relative to an estimated LIFO(1) accounting method, had a significant impact on R&M's results due to the sharp decline in crude feedstock costs. The FIFO valuation adjustment in the period resulted in a negative adjustment to operating earnings of $649 million after-tax, compared to a favourable adjustment of $180 million after-tax in the prior year quarter, for an unfavourable quarter-over-quarter impact of $829 million. At the company level, the FIFO loss was partially offset by a realization of intersegment profit associated with the consumption of internal crude feedstock from the company's Oil Sands assets, for a net inventory valuation adjustment of $384 million.
Marketing gross margins in the fourth quarter of 2018 were higher than in the prior year quarter, primarily due to an increase in wholesale sales as well as stronger wholesale unit margins.
- (1)
- The estimated impact of the LIFO method is a non-GAAP financial measure. See the Non-GAAP Financial Measures Advisory section of this document.
| 24 2018 FOURTH QUARTER Suncor Energy Inc. | | |
Expenses and Other Factors
Operating and transportation expenses in the fourth quarter of 2018 were comparable to the prior year quarter, due to a recovery of share-based compensation expense offsetting an increase in variable commodity and maintenance costs at the company's refineries, and an increase in transportation costs associated with higher sales volumes.
Planned Maintenance
The company has completed all major planned refinery maintenance for 2018 and there are no major events scheduled for the first quarter of 2019.
CORPORATE, ENERGY TRADING AND ELIMINATIONS
Financial Highlights
| Three months ended December 31 | Twelve months ended December 31 | |||||||||
($ millions) | 2018 | 2017 | 2018 | 2017 | ||||||
| | | | | | | | | | | |
Net (loss) earnings | (495 | ) | (391 | ) | (1 521 | ) | 59 | |||
| | | | | | | | | | | |
Adjusted for: | ||||||||||
| | ||||||||||
Unrealized foreign exchange loss (gain) on U.S. dollar denominated debt | 637 | 91 | 989 | (702 | ) | |||||
| | ||||||||||
Non-cash mark to market (gain) loss on interest rate swaps and foreign currency derivatives(1) | — | (2 | ) | — | 20 | |||||
| | ||||||||||
Non-cash loss on early payment of long-term debt(2) | — | 18 | — | 28 | ||||||
| | ||||||||||
Impact of income tax rate adjustment on deferred taxes(3) | — | 2 | — | 2 | ||||||
| | ||||||||||
Gain on significant disposal(4) | — | — | — | (83 | ) | |||||
| | | | | | | | | | | |
Operating earnings (loss)(5) | 142 | (282 | ) | (532 | ) | (676 | ) | |||
| | ||||||||||
Renewable Energy | — | (1 | ) | — | (4 | ) | ||||
| | ||||||||||
Energy Trading | 55 | (15 | ) | 92 | (62 | ) | ||||
| | ||||||||||
Corporate | (178 | ) | (184 | ) | (876 | ) | (528 | ) | ||
| | ||||||||||
Intersegment Profit Realization (elimination) | 265 | (82 | ) | 252 | (82 | ) | ||||
| | | | | | | | | | | |
Funds from (used in) operations(5) | 213 | (130 | ) | (361 | ) | (165 | ) | |||
| | | | | | | | | | | |
- (1)
- Non-cash mark to market (gain) loss on interest rate swaps and foreign currency derivatives resulting from changes in long-term interest rates and foreign exchange rates.
- (2)
- Charges associated with the early repayment of debt, net of associated realized foreign currency hedge gains.
- (3)
- In the fourth quarter of 2017, the company recorded a net adjustment to its deferred income taxes of $124 million related to tax reform legislation in the U.S., with the most significant impact resulting from a decrease in the U.S. corporate tax rate from 35% to 21%. The net deferred tax recovery of $124 million was comprised of a $140 million recovery in R&M, a $14 million expense in E&P and a $2 million expense in the company's Energy Trading business.
- (4)
- After-tax gain of $83 million related to the sale of the company's interest in the Cedar Point wind facility.
- (5)
- Non-GAAP financial measure. See the Non-GAAP Financial Measures Advisory section of this document.
Renewable Energy
| Three months ended December 31 | Twelve months ended December 31 | |||||||||
| 2018 | 2017 | 2018 | 2017 | |||||||
| | | | | | | | | | | |
Power generation marketed (gigawatt hours)(1) | 55 | 60 | 183 | 255 | ||||||
| | | | | | | | | | | |
- (1)
- Power generated includes curtailed production for which the company was compensated.
Renewable Energy had no operating earnings in the fourth quarter of 2018, comparable to an operating loss of $1 million in the prior year quarter.
| | | 2018 FOURTH QUARTER Suncor Energy Inc. 25 |
Energy Trading
Operating earnings for Energy Trading were $55 million in the fourth quarter of 2018, compared to an operating loss of $15 million in the fourth quarter of 2017, due to favourable crude location spreads.
Corporate
The Corporate operating loss was $178 million for the fourth quarter of 2018, compared to an operating loss of $184 million for the prior year quarter, with the decreased loss attributable to a non-cash share-based compensation recovery and a larger operational foreign exchange gain than the prior year quarter. These factors were partially offset by a significant decrease in capitalized interest following the commissioning of the company's Fort Hills and Hebron major growth projects. Suncor capitalized $28 million of its borrowing costs in the fourth quarter of 2018 as part of the cost of major development assets and construction projects in progress, compared to $177 million in the prior year quarter.
Intersegment Profit Realization (elimination)
Eliminations reflect the deferral or realization of profit or loss on crude oil sales from Oil Sands to Suncor's refineries. Consolidated profits are only realized when the refined products produced from internal purchases of crude feedstock have been sold to third parties. During the fourth quarter of 2018, the company realized $265 million of after-tax intersegment profit, compared to an elimination of $82 million of after-tax intersegment profit in the prior year quarter. This combined with the FIFO loss in the R&M segment resulted in a net $384 million after-tax inventory valuation loss. The realization of deferred profit in the fourth quarter of 2018 was driven by the decrease in oil sands benchmark prices, as higher margin crude refinery feedstock inventory sourced internally from Oil Sands was sold and replaced by lower margin crude feedstock inventory, resulting in a net release of profit at the enterprise level.
Capital and Exploration Expenditures by Segment
| Three months ended December 31 | Twelve months ended December 31 | |||||||||
($ millions) | 2018 | 2017 | 2018 | 2017 | ||||||
| | | | | | | | | | | |
Oil Sands | 663 | 1 160 | 3 546 | 5 059 | ||||||
| | ||||||||||
Exploration and Production | 285 | 193 | 946 | 824 | ||||||
| | ||||||||||
Refining and Marketing | 189 | 249 | 856 | 634 | ||||||
| | ||||||||||
Corporate, Energy Trading and Eliminations | 10 | 19 | 58 | 34 | ||||||
| | | | | | | | | | | |
Total capital and exploration expenditures | 1 147 | 1 621 | 5 406 | 6 551 | ||||||
| | ||||||||||
Less: capitalized interest on debt | (28 | ) | (177 | ) | (156 | ) | (729 | ) | ||
| | | | | | | | | | | |
| 1 119 | 1 444 | 5 250 | 5 822 | |||||||
| | | | | | | | | | | |
Capital and Exploration Expenditures by Type(1)
| Three months ended December 31, 2018 | Twelve months ended December 31, 2018 | |||||||||||||
($ millions) | Sustaining(2) | Growth(3) | Total | Sustaining(2) | Growth(3) | Total | ||||||||
| | | | | | | | | | | | | | | |
Oil Sands | ||||||||||||||
| | ||||||||||||||
Oil Sands Base | 366 | 4 | 370 | 1 820 | 32 | 1 852 | ||||||||
| | ||||||||||||||
In Situ | 81 | 6 | 87 | 351 | 26 | 377 | ||||||||
| | ||||||||||||||
Fort Hills | 91 | 15 | 106 | 250 | 365 | 615 | ||||||||
| | ||||||||||||||
Syncrude | 86 | — | 86 | 583 | 3 | 586 | ||||||||
| | ||||||||||||||
Exploration and Production | 3 | 268 | 271 | 11 | 898 | 909 | ||||||||
| | ||||||||||||||
Refining and Marketing | 187 | — | 187 | 853 | — | 853 | ||||||||
| | ||||||||||||||
Corporate, Energy Trading and Eliminations | 12 | — | 12 | 58 | — | 58 | ||||||||
| | | | | | | | | | | | | | | |
| 826 | 293 | 1 119 | 3 926 | 1 324 | 5 250 | |||||||||
| | | | | | | | | | | | | | | |
- (1)
- Capital expenditures in this table exclude capitalized interest on debt.
| 26 2018 FOURTH QUARTER Suncor Energy Inc. | | |
- (2)
- Sustaining capital expenditures include capital investments that i) ensure compliance with regulations; ii) improve efficiency and reliability of operations or maintain productive capacity; iii) deliver existing proved developed reserves for E&P operations; or iv) maintain current production levels at existing Oil Sands and R&M operations.
- (3)
- Growth capital expenditures include capital investments that result in i) an increase in production levels at existing Oil Sands and R&M operations; ii) new facilities or operations that increase overall production; iii) new infrastructure that is required to support higher production levels; iv) new reserves or a positive change in the company's reserves profile in E&P operations; or v) margin improvement by increasing revenues or reducing costs.
In the fourth quarter of 2018, total capital and exploration expenditures were $1.119 billion (excluding capitalized interest), compared to $1.444 billion in the prior year quarter primarily due to the decrease in growth capital with the commissioning of the company's significant growth projects, Fort Hills and Hebron. Sustaining capital expenditures in the fourth quarter of 2018 were comparable to the prior year quarter.
Activity in the fourth quarter of 2018 is summarized by business unit below.
Oil Sands
Oil Sands Base
Oil Sands Base capital and exploration expenditures were $370 million in the fourth quarter of 2018, the majority of which was focused on sustaining activities related to the company's planned major maintenance program, which included completion of a turnaround at Upgrader 2, the continued development of tailings infrastructure, and other reliability and sustainment projects across the operations.
In Situ
In Situ capital and exploration expenditures were $87 million in the fourth quarter of 2018, and were primarily directed towards sustaining activities, including well pad construction that is expected to maintain existing production levels at Firebag and MacKay River.
Fort Hills
Capital expenditures at Fort Hills were $106 million in the fourth quarter of 2018, with the majority related to sustaining capital expenditures focused on mine and tailings development to support ongoing operations.
Syncrude
Syncrude capital and exploration expenditures were $86 million in the fourth quarter of 2018, the majority of which was for sustaining capital expenditures focused on maintaining existing assets.
Exploration and Production
Capital and exploration expenditures at E&P were $271 million in the fourth quarter of 2018 and were primarily focused on growth projects, including development drilling at Hebron, Hibernia, White Rose and Buzzard, and continued development work on the West White Rose Project, and the Norwegian Oda and Fenja projects. Development of the Oda project has progressed ahead of schedule and first oil is now anticipated in the second quarter of 2019, as compared to an original target of the third quarter of 2019.
Refining and Marketing
R&M capital expenditures were $187 million and were primarily related to the ongoing sustainment of operations, enhancements to retail operations and planned refinery maintenance.
Corporate, Energy Trading and Eliminations
Corporate capital expenditures were $12 million, primarily directed towards the company's information technology initiatives.
| | | 2018 FOURTH QUARTER Suncor Energy Inc. 27 |
6. FINANCIAL CONDITION AND LIQUIDITY
Indicators
| Twelve months ended December 31 | ||||||
| 2018 | 2017 | |||||
| | | | | | | |
Return on Capital Employed(1) (%) | ||||||
| | ||||||
Excluding major projects in progress | 8.2 | 8.6 | ||||
| | ||||||
Including major projects in progress | 8.0 | 6.7 | ||||
| | | | | | | |
Net debt to funds from operations(2) (times) | 1.5 | 1.4 | ||||
| | | | | | | |
Interest coverage on long-term debt (times) | ||||||
| | ||||||
Earnings basis(3) | 6.4 | 6.5 | ||||
| | ||||||
Funds from operations basis(2),(4) | 14.1 | 11.2 | ||||
| | | | | | | |
- (1)
- Non-GAAP financial measure. See the Non-GAAP Financial Measures Advisory section of this document.
- (2)
- Funds from operations and metrics that use funds from operations are non-GAAP financial measures. See the Non-GAAP Financial Measures Advisory section of this document.
- (3)
- Equal to net earnings plus income taxes and interest expense, divided by the sum of interest expense and capitalized interest on debt.
- (4)
- Equal to funds from operations plus current income taxes and interest expense, divided by the sum of interest expense and capitalized interest on debt.
Capital Resources
Suncor's capital resources consist primarily of cash flow provided by operating activities, cash and cash equivalents, available lines of credit and proceeds received from the divestiture of non-core assets. Suncor's management believes the company will have the capital resources to fund its planned 2019 capital spending program of $4.9 – $5.6 billion and to meet current and future working capital requirements, through cash and cash equivalents balances, cash flow provided by operating activities, available committed credit facilities, issuing commercial paper and, if needed, divesting of non-core assets and accessing capital markets. The company's cash flow provided by operating activities depends on a number of factors, including commodity prices, production and sales volumes, refining and marketing margins, operating expenses, taxes, royalties and foreign exchange rates.
The company has invested cash in short-term financial instruments that are presented as cash and cash equivalents. The objectives of the company's short-term investment portfolio are to ensure the preservation of capital, maintain adequate liquidity to meet Suncor's cash flow requirements and deliver competitive returns derived from the quality and diversification of investments within acceptable risk parameters. The maximum weighted average term to maturity of the short-term investment portfolio is not expected to exceed six months, and all investments will be with counterparties with investment grade debt ratings.
Available Sources of Liquidity
Cash and cash equivalents decreased to $2.221 billion at December 31, 2018, from $2.672 billion at December 31, 2017, as a result of the company's decision to hold less cash following the commissioning of Fort Hills and Hebron. The decrease in the company's cash balance was further impacted by its capital and exploration expenditures and dividend requirements, the purchase of Suncor's own shares under its NCIB and the acquisition of an additional 5% working interest in Syncrude in the first quarter of 2018, partially offset by cash flow provided by operating activities and an increase in short-term indebtedness.
As at December 31, 2018, the weighted average term to maturity of the company's short-term investment portfolio was approximately eight days.
Available credit facilities for liquidity purposes at December 31, 2018 decreased to $3.608 billion, compared to $4.489 billion at December 31, 2017, which was primarily a result of the increase in short-term indebtedness noted above.
Financing Activities
Management of debt levels continues to be a priority for Suncor given the company's long-term growth plans and future expected volatility in the pricing environment. Suncor believes a phased and flexible approach to existing and future growth projects should assist the company in maintaining its ability to manage project costs and debt levels.
| 28 2018 FOURTH QUARTER Suncor Energy Inc. | | |
Total Debt to Total Debt Plus Shareholders' Equity
Suncor is subject to financial and operating covenants related to its bank debt and public market debt. Failure to meet the terms of one or more of these covenants may constitute an "event of default" as defined in the respective debt agreements, potentially resulting in accelerated repayment of one or more of the debt obligations. The company is in compliance with its financial covenant that requires total debt to not exceed 65% of its total debt plus shareholders' equity. At December 31, 2018, total debt to total debt plus shareholders' equity was 28.3% (December 31, 2017 – 25.6%). The company continues to be in compliance with all operating covenants.
| December 31 | December 31 | |||||
($ millions, except as noted) | 2018 | 2017 | ||||
| | | | | | | |
Short-term debt | 3 231 | 2 136 | ||||
| | ||||||
Current portion of long-term debt | 229 | 71 | ||||
| | ||||||
Long-term debt | 13 890 | 13 372 | ||||
| | | | | | | |
Total debt | 17 350 | 15 579 | ||||
| | ||||||
Less: Cash and cash equivalents | 2 221 | 2 672 | ||||
| | | | | | | |
Net debt | 15 129 | 12 907 | ||||
| | ||||||
Shareholders' equity | 44 005 | 45 383 | ||||
| | | | | | | |
Total debt plus shareholders' equity | 61 355 | 60 962 | ||||
| | | | | | | |
Total debt to total debt plus shareholders' equity (%) | 28.3 | 25.6 | ||||
| | | | | | | |
Change in Debt
($ millions) | Three months ended December 31, 2018 | Twelve months ended December 31, 2018 | ||||
| | | | | | | |
Total debt – beginning of period | 16 677 | 15 579 | ||||
| | ||||||
Net decrease in long-term debt | (132 | ) | (186 | ) | ||
| | ||||||
Increase in short-term debt | 117 | 866 | ||||
| | ||||||
Foreign exchange on debt, and other | 688 | 1 091 | ||||
| | | | | | | |
Total debt – December 31, 2018 | 17 350 | 17 350 | ||||
| | ||||||
Less: Cash and cash equivalents – December 31, 2018 | 2 221 | 2 221 | ||||
| | | | | | | |
Net debt – December 31, 2018 | 15 129 | 15 129 | ||||
| | | | | | | |
The company's total debt increased in the fourth quarter of 2018 due to the impact of unfavourable foreign exchange rates on U.S. dollar denominated debt compared to September 30, 2018 and an increase in short-term indebtedness, partially offset by the early repurchase of US$83 million of 7.75% Senior Notes originally due in 2019 (2019 Notes) and principal payments made on the company's finance lease obligations during the fourth quarter of 2018.
On a year to date basis, the company's total debt increased in 2018 due to the unfavourable impact of foreign exchange rates on U.S. dollar denominated debt compared to December 31, 2017 and an overall increase in short-term indebtedness, partially offset by the early repurchase of US$83 million of 2019 Notes and a decrease in long-term debt associated with the payments made for the company's finance lease obligations.
The 2019 Notes were originally acquired with the acquisition of Canadian Oil Sands Limited in 2016 and were repurchased as part of the company's commitment to debt reduction. The aggregate principal amount of the 2019 Notes that remains outstanding has been reduced to US$140 million as a result of the purchase.
| | | 2018 FOURTH QUARTER Suncor Energy Inc. 29 |
Common Shares
Outstanding Shares
(thousands) | December 31, 2018 | |||
| | | | | |
Common shares | 1 584 484 | |||
| | ||||
Common share options – exercisable | 15 374 | |||
| | ||||
Common share options – non-exercisable | 13 561 | |||
| | | | | |
As at February 1, 2019, the total number of common shares outstanding was 1,579,892,920 and the total number of exercisable and non-exercisable common share options outstanding was 28,833,117. Once exercisable, each outstanding common share option is convertible into one common share.
Share Repurchases
Under the company's NCIB that commenced in the second quarter of 2018, the company is permitted to purchase common shares for cancellation through the facilities of the Toronto Stock Exchange (TSX), New York Stock Exchange and/or alternative trading platforms from May 4, 2018 to May 3, 2019.
During the fourth quarter of 2018, Suncor repurchased and cancelled 26,725,575 common shares at an average price of $43.61 per share, for $1.166 billion, compared to the prior year quarter when the company repurchased and cancelled 18,712,919 common shares at an average price of $44.57 per share, for $835 million.
| Three months ended December 31 | Twelve months ended December 31 | |||||||||
($ millions, except as noted) | 2018 | 2017 | 2018 | 2017 | ||||||
| | | | | | | | | | | |
Share repurchase activities (thousands of common shares) | 26 726 | 18 713 | 64 426 | 33 153 | ||||||
| | ||||||||||
Weighted average repurchase price per share (dollars per share) | 43.61 | 44.57 | 47.38 | 42.61 | ||||||
| | ||||||||||
Share repurchase cost | 1 166 | 835 | 3 053 | 1 413 | ||||||
| | | | | | | | | | | |
Following the approval by the Board of Directors to increase the NCIB to $3.0 billion in the third quarter of 2018, the TSX accepted a notice filed by Suncor of its intention to amend its NCIB effective as of November 19, 2018. The notice provided that Suncor may increase the maximum number of common shares that may be purchased for cancellation between May 4, 2018 and May 3, 2019 from approximately 3% of Suncor's issued and outstanding common shares as at April 30, 2018 to approximately 5% of Suncor's issued and outstanding common shares as at April 30, 2018.
Between May 4, 2018 and February 1, 2019, pursuant to the NCIB, Suncor has already repurchased approximately $2.82 billion of common shares on the open market. Pursuant to the NCIB (as amended), Suncor has agreed that it will not purchase more than 81,695,830 common shares, of which 59,455,123 common shares have already been purchased between May 4, 2018 and February 1, 2019. Suncor security holders may obtain a copy of the notice, without charge, by contacting the company. Subsequent to the end of the fourth quarter of 2018, Suncor's Board of Directors approved a further share repurchase program of up to $2.0 billion.
Contractual Obligations, Commitments, Guarantees, and Off-Balance Sheet Arrangements
In the normal course of business, the company is obligated to make future payments, including contractual obligations and non-cancellable commitments. Suncor has included these items in the Financial Condition and Liquidity section of Suncor's Management's Discussion and Analysis for the year ended December 31, 2017, dated March 1, 2018 (the 2017 annual MD&A) and has provided an update below. Suncor does not believe that it has any guarantees or off-balance sheet arrangements that have, or are reasonably likely to have, a current or future material effect on the company's financial performance or financial condition, results of operations, liquidity or capital expenditures.
During the twelve months ended December 31, 2018, Suncor increased its commitments by approximately $815 million (undiscounted), which is primarily related to renewal of an oil tankage lease, a diluent storage service arrangement, a long-term material supply arrangement, and additional mining equipment at Fort Hills and Oil Sands Base.
| 30 2018 FOURTH QUARTER Suncor Energy Inc. | | |
Trends in Suncor's quarterly revenue, earnings and funds from operations are driven primarily by production volumes, which can be significantly impacted by major maintenance events, changes in commodity prices, including widening of crude differentials, refining crack spreads, foreign exchange rates and other significant events impacting operations, such as the Syncrude power outage that occurred late in the second quarter of 2018.
Financial Summary
Three months ended | Dec 31 2018 | Sept 30 2018 | June 30 2018 | Mar 31 2018 | Dec 31 2017 | Sept 30 2017 | June 30 2017 | Mar 31 2017 | ||||||||||
| | | | | | | | | | | | | | | | | | | |
Total production (mboe/d) | ||||||||||||||||||
| | ||||||||||||||||||
Oil Sands | 740.8 | 651.7 | 547.6 | 571.7 | 621.2 | 628.4 | 413.6 | 590.6 | ||||||||||
| | ||||||||||||||||||
Exploration and Production | 90.2 | 92.1 | 114.1 | 117.7 | 115.2 | 111.5 | 125.5 | 134.5 | ||||||||||
| | | | | | | | | | | | | | | | | | | |
| 831.0 | 743.8 | 661.7 | 689.4 | 736.4 | 739.9 | 539.1 | 725.1 | |||||||||||
| | | | | | | | | | | | | | | | | | | |
Revenues and other income | ||||||||||||||||||
| | ||||||||||||||||||
Operating revenues, net of royalties | 8 561 | 10 847 | 10 327 | 8 807 | 9 000 | 7 963 | 7 231 | 7 787 | ||||||||||
| | ||||||||||||||||||
Other income (loss) | 384 | 16 | 101 | (57 | ) | 41 | 43 | 16 | 25 | |||||||||
| | | | | | | | | | | | | | | | | | | |
| 8 945 | 10 863 | 10 428 | 8 750 | 9 041 | 8 006 | 7 247 | 7 812 | |||||||||||
| | | | | | | | | | | | | | | | | | | |
Net (loss) earnings | (280 | ) | 1 812 | 972 | 789 | 1 382 | 1 289 | 435 | 1 352 | |||||||||
| | ||||||||||||||||||
per common share – basic (dollars) | (0.18 | ) | 1.12 | 0.60 | 0.48 | 0.84 | 0.78 | 0.26 | 0.81 | |||||||||
| | ||||||||||||||||||
per common share – diluted (dollars) | (0.18 | ) | 1.11 | 0.59 | 0.48 | 0.84 | 0.78 | 0.26 | 0.81 | |||||||||
| | | | | | | | | | | | | | | | | | | |
Operating Earnings(1) | 580 | 1 557 | 1 190 | 985 | 1 310 | 867 | 199 | 812 | ||||||||||
| | ||||||||||||||||||
per common share – basic(1) (dollars) | 0.36 | 0.96 | 0.73 | 0.60 | 0.79 | 0.52 | 0.12 | 0.49 | ||||||||||
| | | | | | | | | | | | | | | | | | | |
Funds from operations(1) | 2 007 | 3 139 | 2 862 | 2 164 | 3 016 | 2 472 | 1 627 | 2 024 | ||||||||||
| | ||||||||||||||||||
per common share – basic(1) (dollars) | 1.26 | 1.94 | 1.75 | 1.32 | 1.83 | 1.49 | 0.98 | 1.21 | ||||||||||
| | | | | | | | | | | | | | | | | | | |
Cash flow provided by operating activities | 3 040 | 4 370 | 2 446 | 724 | 2 755 | 2 912 | 1 671 | 1 628 | ||||||||||
| | ||||||||||||||||||
per common share – basic (dollars) | 1.90 | 2.70 | 1.50 | 0.44 | 1.67 | 1.75 | 1.00 | 0.98 | ||||||||||
| | | | | | | | | | | | | | | | | | | |
ROCE(1) (%) for the twelve months ended | 8.0 | 9.7 | 8.3 | 6.5 | 6.7 | 5.5 | 4.9 | 3.5 | ||||||||||
| | | | | | | | | | | | | | | | | | | |
ROCE(1), excluding major projects in progress (%) for the twelve months ended | 8.2 | 10.4 | 9.5 | 7.8 | 8.6 | 7.0 | 6.2 | 4.4 | ||||||||||
| | | | | | | | | | | | | | | | | | | |
After-tax unrealized foreign exchange (loss) gain on U.S. dollar denominated debt | (637 | ) | 195 | (218 | ) | (329 | ) | (91 | ) | 412 | 278 | 103 | ||||||
| | | | | | | | | | | | | | | | | | | |
Common share information (dollars) | ||||||||||||||||||
| | ||||||||||||||||||
Dividend per common share | 0.36 | 0.36 | 0.36 | 0.36 | 0.32 | 0.32 | 0.32 | 0.32 | ||||||||||
| | ||||||||||||||||||
Share price at the end of trading | ||||||||||||||||||
| | ||||||||||||||||||
Toronto Stock Exchange (Cdn$) | 38.13 | 49.98 | 53.50 | 44.49 | 46.15 | 43.73 | 37.89 | 40.83 | ||||||||||
| | ||||||||||||||||||
New York Stock Exchange (US$) | 27.97 | 38.69 | 40.68 | 34.54 | 36.72 | 35.05 | 29.20 | 30.75 | ||||||||||
| | | | | | | | | | | | | | | | | | | |
- (1)
- Non-GAAP financial measures. See the Non-GAAP Financial Measures Advisory section of this document.
| | | 2018 FOURTH QUARTER Suncor Energy Inc. 31 |
Business Environment
Three months ended | Dec 31 2018 | Sept 30 2018 | June 30 2018 | Mar 31 2018 | Dec 31 2017 | Sept 30 2017 | June 30 2017 | Mar 31 2017 | ||||||||||||
| | | | | | | | | | | | | | | | | | | | | |
WTI crude oil at Cushing | US$/bbl | 58.85 | 69.50 | 67.90 | 62.90 | 55.40 | 48.20 | 48.30 | 51.85 | |||||||||||
| | ||||||||||||||||||||
Dated Brent crude | US$/bbl | 67.80 | 75.25 | 74.40 | 66.80 | 61.40 | 52.50 | 49.85 | 53.75 | |||||||||||
| | ||||||||||||||||||||
Dated Brent/Maya FOB price differential | US$/bbl | 4.35 | 10.20 | 12.40 | 7.70 | 9.60 | 6.30 | 5.80 | 9.05 | |||||||||||
| | ||||||||||||||||||||
MSW at Edmonton | Cdn$/bbl | 42.70 | 82.10 | 80.95 | 72.45 | 69.30 | 57.05 | 62.30 | 64.25 | |||||||||||
| | ||||||||||||||||||||
WCS at Hardisty | US$/bbl | 19.50 | 47.35 | 48.65 | 38.60 | 43.10 | 38.25 | 37.20 | 37.30 | |||||||||||
| | ||||||||||||||||||||
Light/heavy crude oil differential for WTI at Cushing less WCS at Hardisty | US$/bbl | 39.35 | 22.15 | 19.25 | 24.30 | 12.30 | 9.95 | 11.10 | 14.55 | |||||||||||
| | ||||||||||||||||||||
Condensate at Edmonton | US$/bbl | 45.30 | 66.82 | 68.50 | 63.15 | 57.95 | 47.60 | 48.45 | 52.20 | |||||||||||
| | ||||||||||||||||||||
Natural gas (Alberta spot) at AECO | Cdn$/mcf | 1.60 | 1.19 | 1.20 | 1.77 | 1.70 | 1.45 | 2.80 | 2.70 | |||||||||||
| | ||||||||||||||||||||
Alberta Power Pool Price | Cdn$/MWh | 55.55 | 54.45 | 56.00 | 34.95 | 22.35 | 24.55 | 19.30 | 22.40 | |||||||||||
| | ||||||||||||||||||||
New York Harbor 3-2-1 crack(1) | US$/bbl | 16.20 | 19.65 | 20.65 | 15.50 | 19.40 | 22.35 | 16.35 | 12.55 | |||||||||||
| | ||||||||||||||||||||
Chicago 3-2-1 crack(1) | US$/bbl | 13.35 | 19.05 | 18.30 | 12.85 | 20.20 | 19.25 | 14.40 | 11.15 | |||||||||||
| | ||||||||||||||||||||
Portland 3-2-1 crack(1) | US$/bbl | 21.60 | 21.40 | 27.90 | 20.35 | 22.10 | 26.80 | 21.25 | 18.45 | |||||||||||
| | ||||||||||||||||||||
Gulf Coast 3-2-1 crack(1) | US$/bbl | 15.10 | 18.85 | 20.25 | 15.55 | 18.25 | 21.45 | 16.80 | 14.00 | |||||||||||
| | ||||||||||||||||||||
Exchange rate | US$/Cdn$ | 0.76 | 0.77 | 0.77 | 0.79 | 0.79 | 0.80 | 0.74 | 0.76 | |||||||||||
| | ||||||||||||||||||||
Exchange rate (end of period) | US$/Cdn$ | 0.73 | 0.77 | 0.76 | 0.78 | 0.80 | 0.80 | 0.77 | 0.75 | |||||||||||
| | | | | | | | | | | | | | | | | | | | | |
- (1)
- 3-2-1 crack spreads are indicators of the refining margin generated by converting three barrels of WTI into two barrels of gasoline and one barrel of diesel. The crack spreads presented here generally approximate the regions into which the company sells refined products through retail and wholesale channels.
Accounting Policies and new IFRS Standards
Suncor's significant accounting policies and a summary of recently announced accounting standards are described in the Accounting Policies and Critical Accounting Estimates section of Suncor's 2017 annual MD&A and in note 3 of Suncor's unaudited interim Consolidated Financial Statements for the three and twelve months ended December 31, 2018.
Critical Accounting Estimates
The preparation of financial statements in accordance with GAAP requires management to make estimates, judgments and assumptions that affect reported assets, liabilities, revenues and expenses, gains and losses, and disclosures of contingencies. These estimates and assumptions are subject to change based on experience and new information. Critical accounting estimates are those that require management to make assumptions about matters that are highly uncertain at the time the estimate is made. Critical accounting estimates are also those estimates which, where a different estimate could have been used or where changes in the estimate that are reasonably likely to occur, would have a material impact on the company's financial condition, changes in financial condition or financial performance. Critical accounting estimates and judgments are reviewed annually by the Audit Committee of the Board of Directors. A detailed description of Suncor's critical accounting estimates is provided in note 4 to the audited Consolidated Financial Statements for the year ended December 31, 2017 and in the Accounting Policies and Critical Accounting Estimates section of Suncor's 2017 annual MD&A.
Financial Instruments
Suncor periodically enters into derivative contracts such as forwards, futures, swaps, options and costless collars to manage exposure to fluctuations in commodity prices and foreign exchange rates, and to optimize the company's position with respect to interest payments. The company also uses physical and financial energy derivatives to earn trading profits. For more information on Suncor's financial instruments and the related financial risk factors, see note 28 of the audited Consolidated Financial Statements for the year ended December 31, 2017, note 11 to the unaudited interim Consolidated Financial Statements for the three and twelve months ended December 31, 2018, and the Financial Condition and Liquidity section of Suncor's 2017 annual MD&A.
| 32 2018 FOURTH QUARTER Suncor Energy Inc. | | |
Income Tax
In the fourth quarter of 2017, the U.S. government enacted a decrease in the federal corporate income tax rate from 35% to 21%, effective January 1, 2018. As a result, the company revalued its deferred income tax balances, resulting in a deferred income tax recovery of $124 million.
In the fourth quarter of 2017, the Government of British Columbia enacted an increase to the provincial corporate income tax rate from 11% to 12%. As a result, the company revalued its deferred income tax balances, resulting in a deferred income tax expense of $18 million.
9. NON-GAAP FINANCIAL MEASURES ADVISORY
Certain financial measures in this document – namely operating earnings (loss), ROCE, funds from (used in) operations, discretionary free funds flow, Oil Sands operations cash operating costs, Fort Hills cash operating costs, Syncrude cash operating costs, refining margin, refining operating expense and LIFO inventory valuation methodology – are not prescribed by GAAP. These non-GAAP financial measures are included because management uses the information to analyze business performance, leverage and liquidity, and it may be useful to investors on the same basis. These non-GAAP financial measures do not have any standardized meaning and, therefore, are unlikely to be comparable to similar measures presented by other companies. Therefore, these non-GAAP financial measures should not be considered in isolation or as a substitute for measures of performance prepared in accordance with GAAP. Except as otherwise indicated, these non-GAAP financial measures are calculated and disclosed on a consistent basis from period to period. Specific adjusting items may only be relevant in certain periods.
Operating Earnings (Loss)
Operating earnings (loss) is a non-GAAP financial measure that adjusts net earnings (loss) for significant items that are not indicative of operating performance. Management uses operating earnings (loss) to evaluate operating performance because management believes it provides better comparability between periods. Operating earnings (loss) are reconciled to net earnings (loss) in the Consolidated Financial Information and Segment Results and Analysis sections of this document.
Bridge Analyses of Operating Earnings
Throughout this document, the company presents charts that illustrate the change in operating earnings from the comparative period through key variance factors. These factors are analyzed in the Operating Earnings narratives following the bridge analyses in particular sections of this document. These bridge analyses are presented because management uses this presentation to evaluate performance.
- •
- The factor for Sales Volumes and Mix is calculated based on sales volumes and mix for the Oil Sands and E&P segments and throughput volumes and mix for the R&M segment.
- •
- The factor for Price, Margin and Other Revenue includes upstream price realizations before royalties, with the exception of Libya, which is net of royalties. Also included are refining and marketing margins, other operating revenue, and the net impacts of sales and purchases of third-party crude, including product purchased for use as diluent in the company's Oil Sands operations and subsequently sold as part of diluted bitumen.
- •
- The factor for inventory valuation includes the after-tax impact of the FIFO method of inventory valuation in the company's R&M segment, as well as the impact of the deferral or realization of profit or loss on crude oil sales from the Oil Sands segment to Suncor's refineries, as both represent inventory valuation adjustments.
- •
- The factor for Royalties excludes the impact of Libya, as royalties in Libya are taken into account in Price, Margin and Other Revenue as described above.
- •
- The factor for Operating and Transportation Expense includes project start-up costs, operating, selling and general expense, and transportation expense.
- •
- The factor for Financing Expense and Other includes financing expenses, other income, operational foreign exchange gains and losses, changes in gains and losses on disposal of assets that are not operating earnings adjustments, changes in statutory income tax rates and other income tax adjustments.
Return on Capital Employed (ROCE)
ROCE is a non-GAAP financial measure that management uses to analyze operating performance and the efficiency of Suncor's capital allocation process. Average capital employed is calculated as a twelve-month average of the capital employed balance at the beginning of the twelve-month period and the month-end capital employed balances throughout the
| | | 2018 FOURTH QUARTER Suncor Energy Inc. 33 |
remainder of the twelve-month period. Figures for capital employed at the beginning and end of the twelve-month period are presented to show the changes in the components of the calculation over the twelve-month period.
The company presents two ROCE calculations – one including and one excluding the impacts on capital employed for major projects in progress. Major projects in progress includes accumulated capital expenditures and capitalized interest for significant projects still under construction or in the process of being commissioned, and acquired assets that are still being evaluated. Management uses ROCE excluding the impacts of major projects in progress on capital employed to assess performance of operating assets.
For the twelve months ended December 31 | 2018 | 2017 | ||||||
| | | | | | | | | |
Adjustments to net earnings | ||||||||
| | ||||||||
Net earnings | 3 293 | 4 458 | ||||||
| | ||||||||
(Deduct) add after-tax amounts for: | ||||||||
| | ||||||||
Unrealized foreign exchange loss (gain) on U.S. dollar denominated debt | 989 | (702 | ) | |||||
| | ||||||||
Net interest expense | 541 | 158 | ||||||
| | | | | | | | | |
| A | 4 823 | 3 914 | ||||||
| | | | | | | | | |
Capital employed – beginning of twelve-month period | ||||||||
| | ||||||||
Net debt | 12 907 | 14 414 | ||||||
| | ||||||||
Shareholders' equity | 45 383 | 44 630 | ||||||
| | | | | | | | | |
| 58 290 | 59 044 | |||||||
| | | | | | | | | |
Capital employed – end of twelve-month period | ||||||||
| | ||||||||
Net debt | 15 129 | 12 907 | ||||||
| | ||||||||
Shareholders' equity | 44 005 | 45 383 | ||||||
| | | | | | | | | |
| 59 134 | 58 290 | |||||||
| | | | | | | | | |
Average capital employed | B | 60 347 | 58 667 | |||||
| | | | | | | | | |
ROCE – including major projects in progress (%) | A/B | 8.0 | 6.7 | |||||
| | | | | | | | | |
Average capitalized costs related to major projects in progress | C | 1 412 | 12 901 | |||||
| | | | | | | | | |
ROCE – excluding major projects in progress (%) | A/(B–C) | 8.2 | 8.6 | |||||
| | | | | | | | | |
Funds From (Used In) Operations
Funds from (used in) operations is a non-GAAP financial measure that adjusts a GAAP measure – cash flow provided by (used in) operating activities – for changes in non-cash working capital, which management uses to analyze operating performance and liquidity. Changes to non-cash working capital can be impacted by, among other factors, the timing of offshore feedstock purchases and payments for commodity and income taxes, the timing of cash flows related to accounts receivable and accounts payable, and changes in inventory which management believes reduces comparability between periods.
Funds from (used in) operations for each quarter are separately defined and reconciled to the cash flow provided by operating activities measure in the Non-GAAP Financial Measures Advisory section of each respective management's discussion and analysis or quarterly report to shareholders, as applicable, for the related quarter.
| 34 2018 FOURTH QUARTER Suncor Energy Inc. | | |
| Three months ended December 31 | Oil Sands | Exploration and Production | Refining and Marketing | Corporate, Energy Trading and Eliminations | Total | |||||||||||||||||||||||||||
| ($ millions) | 2018 | 2017 | 2018 | 2017 | 2018 | 2017 | 2018 | 2017 | 2018 | 2017 | ||||||||||||||||||||||
| | | | | | | | | | | | | | | | | | | | | | | | | | | | | | | | | |
Net (loss) earnings | (393 | ) | 670 | (115 | ) | 217 | 723 | 886 | (495 | ) | (391 | ) | (280 | ) | 1 382 | |||||||||||||||||
| | ||||||||||||||||||||||||||||||||
Adjustments for: | ||||||||||||||||||||||||||||||||
| | ||||||||||||||||||||||||||||||||
Depreciation, depletion, amortization and impairment | 1 019 | 1 055 | 199 | 219 | 184 | 196 | 17 | 18 | 1 419 | 1 488 | ||||||||||||||||||||||
| | ||||||||||||||||||||||||||||||||
Deferred income taxes | 89 | 181 | 3 | 5 | (51 | ) | (161 | ) | 119 | 78 | 160 | 103 | ||||||||||||||||||||
| | ||||||||||||||||||||||||||||||||
Accretion | 53 | 49 | 12 | 12 | 2 | 2 | — | — | 67 | 63 | ||||||||||||||||||||||
| | ||||||||||||||||||||||||||||||||
Unrealized foreign exchange loss (gain) on U.S. dollar denominated debt | — | — | — | — | — | — | 688 | 74 | 688 | 74 | ||||||||||||||||||||||
| | ||||||||||||||||||||||||||||||||
Change in fair value of financial instruments and trading inventory | (74 | ) | 2 | — | — | (15 | ) | 9 | (59 | ) | 5 | (148 | ) | 16 | ||||||||||||||||||
| | ||||||||||||||||||||||||||||||||
(Gain) loss on asset exchange and disposals of assets | (1 | ) | (46 | ) | 253 | — | (2 | ) | (2 | ) | — | — | 250 | (48 | ) | |||||||||||||||||
| | ||||||||||||||||||||||||||||||||
Loss on debt extinguishment | — | — | — | — | — | — | 3 | 26 | 3 | 26 | ||||||||||||||||||||||
| | ||||||||||||||||||||||||||||||||
Share-based compensation | (22 | ) | 34 | (3 | ) | 4 | (10 | ) | 17 | (53 | ) | 61 | (88 | ) | 116 | |||||||||||||||||
| | ||||||||||||||||||||||||||||||||
Exploration | — | — | 11 | — | — | — | — | — | 11 | — | ||||||||||||||||||||||
| | ||||||||||||||||||||||||||||||||
Settlement of decommissioning and restoration liabilities | (91 | ) | (76 | ) | (8 | ) | (15 | ) | (5 | ) | (7 | ) | — | — | (104 | ) | (98 | ) | ||||||||||||||
| | ||||||||||||||||||||||||||||||||
Other | 21 | (89 | ) | 15 | (11 | ) | — | (5 | ) | (7 | ) | (1 | ) | 29 | (106 | ) | ||||||||||||||||
| | | | | | | | | | | | | | | | | | | | | | | | | | | | | | | | | |
Funds from operations(1) | 601 | 1 780 | 367 | 431 | 826 | 935 | 213 | (130 | ) | 2 007 | 3 016 | |||||||||||||||||||||
| | ||||||||||||||||||||||||||||||||
Decrease (increase) in non-cash working capital | 1 033 | (261 | ) | |||||||||||||||||||||||||||||
| | | | | | | | | | | | | | | | | | | | | | | | | | | | | | | | | |
Cash flow provided by operating activities | 3 040 | 2 755 | ||||||||||||||||||||||||||||||
| | | | | | | | | | | | | | | | | | | | | | | | | | | | | | | | | |
| | | 2018 FOURTH QUARTER Suncor Energy Inc. 35 |
| Twelve months ended December 31 | Oil Sands | Exploration and Production | Refining and Marketing | Corporate, Energy Trading and Eliminations | Total | |||||||||||||||||||||||||||
| ($ millions) | 2018 | 2017 | 2018 | 2017 | 2018 | 2017 | 2018 | 2017 | 2018 | 2017 | ||||||||||||||||||||||
| | | | | | | | | | | | | | | | | | | | | | | | | | | | | | | | | |
Net earnings (loss) | 853 | 1 009 | 808 | 732 | 3 153 | 2 658 | (1 521 | ) | 59 | 3 293 | 4 458 | |||||||||||||||||||||
| | ||||||||||||||||||||||||||||||||
Adjustments for: | ||||||||||||||||||||||||||||||||
| | ||||||||||||||||||||||||||||||||
Depreciation, depletion, amortization and impairment | 4 024 | 3 782 | 967 | 1 028 | 683 | 685 | 64 | 106 | 5 738 | 5 601 | ||||||||||||||||||||||
| | ||||||||||||||||||||||||||||||||
Deferred income taxes | 351 | 170 | (112 | ) | (113 | ) | 39 | (138 | ) | 162 | 330 | 440 | 249 | |||||||||||||||||||
| | ||||||||||||||||||||||||||||||||
Accretion | 209 | 195 | 48 | 45 | 7 | 7 | 2 | — | 266 | 247 | ||||||||||||||||||||||
| | ||||||||||||||||||||||||||||||||
Unrealized foreign exchange loss (gain) on U.S. dollar denominated debt | — | — | — | — | — | — | 1 090 | (771 | ) | 1 090 | (771 | ) | ||||||||||||||||||||
| | ||||||||||||||||||||||||||||||||
Change in fair value of financial instruments and trading inventory | (61 | ) | 2 | — | — | (20 | ) | 9 | (98 | ) | 117 | (179 | ) | 128 | ||||||||||||||||||
| | ||||||||||||||||||||||||||||||||
(Gain) loss on asset exchange and disposals of assets | (108 | ) | (50 | ) | 91 | — | (7 | ) | (354 | ) | — | (70 | ) | (24 | ) | (474 | ) | |||||||||||||||
| | ||||||||||||||||||||||||||||||||
Loss on debt extinguishment | — | — | — | — | — | — | 3 | 51 | 3 | 51 | ||||||||||||||||||||||
| | ||||||||||||||||||||||||||||||||
Share-based compensation | (28 | ) | (3 | ) | (5 | ) | 6 | (19 | ) | 4 | (65 | ) | 24 | (117 | ) | 31 | ||||||||||||||||
| | ||||||||||||||||||||||||||||||||
Exploration | — | — | 11 | 41 | — | — | — | — | 11 | 41 | ||||||||||||||||||||||
| | ||||||||||||||||||||||||||||||||
Settlement of decommissioning and restoration liabilities | (428 | ) | (305 | ) | (23 | ) | (31 | ) | (17 | ) | (17 | ) | (1 | ) | — | (469 | ) | (353 | ) | |||||||||||||
| | ||||||||||||||||||||||||||||||||
Other | 58 | (62 | ) | 84 | 17 | (25 | ) | (13 | ) | 3 | (11 | ) | 120 | (69 | ) | |||||||||||||||||
| | | | | | | | | | | | | | | | | | | | | | | | | | | | | | | | | |
Funds from operations(1) | 4 870 | 4 738 | 1 869 | 1 725 | 3 794 | 2 841 | (361 | ) | (165 | ) | 10 172 | 9 139 | ||||||||||||||||||||
| | ||||||||||||||||||||||||||||||||
Decrease (increase) in non-cash working capital | 408 | (173 | ) | |||||||||||||||||||||||||||||
| | | | | | | | | | | | | | | | | | | | | | | | | | | | | | | | | |
Cash flow provided by operating activities | 10 580 | 8 966 | ||||||||||||||||||||||||||||||
| | | | | | | | | | | | | | | | | | | | | | | | | | | | | | | | | |
Discretionary Free Funds Flow
Discretionary free funds flow is a non-GAAP financial measure that is calculated by taking funds from operations and subtracting sustaining capital, inclusive of associated capitalized interest, and dividends. Discretionary free funds flow reflects cash available for increasing distributions to shareholders and to fund growth investments. Management uses discretionary free funds flow to measure the capacity of the company to increase returns to shareholders and to grow Suncor's business.
| Three months ended December 31 | Twelve months ended December 31 | |||||||||
($ millions) | 2018 | 2017 | 2018 | 2017 | ||||||
| | | | | | | | | | | |
Funds from operations | 2 007 | 3 016 | 10 172 | 9 139 | ||||||
| | ||||||||||
Sustaining capital and dividends | (1 413 | ) | (1 344 | ) | (6 310 | ) | (5 083 | ) | ||
| | | | | | | | | | | |
Discretionary free funds flow | 594 | 1 672 | 3 862 | 4 056 | ||||||
| | | | | | | | | | | |
Oil Sands Operations, Fort Hills and Syncrude Cash Operating Costs
Oil Sands operations, Syncrude and Fort Hills cash operating costs are non-GAAP financial measures. Oil Sands operations cash operating costs are calculated by adjusting Oil Sands segment OS&G expense (a GAAP measure based on sales volumes) for i) costs pertaining to Fort Hills and Syncrude operations; ii) non-production costs that management believes do not relate to the production performance of Oil Sands operations, including, but not limited to, share-based compensation adjustments, research and the expense recorded as part of a non-monetary arrangement involving a third-party processor; iii) revenues associated with excess capacity, including excess power generated and sold that is recorded in operating revenue; iv) project start-up costs; and v) the impacts of changes in inventory levels, such that the company is able to present cost information based on production volumes. Syncrude and Fort Hills cash operating costs are calculated by adjusting Syncrude OS&G
| 36 2018 FOURTH QUARTER Suncor Energy Inc. | | |
expense and Fort Hills OS&G expense, respectively, for non-production costs that management believes do not relate to the production performance of Syncrude operations or Fort Hills operations, respectively, including, but not limited to, share-based compensation, research and project start-up costs, if applicable. Oil Sands operations, Fort Hills and Syncrude cash operating costs are reconciled in the Segment Results and Analysis – Oil Sands section of this document. Management uses cash operating costs to measure operating performance.
Refining Margin and Refining Operating Expense
Refining margin and refining operating expense are non-GAAP financial measures. Refining margin is calculated by adjusting R&M segment operating revenue, other income and purchases of crude oil and products (all of which are GAAP measures) for non-refining margin pertaining to the company's supply, marketing and ethanol businesses, and the company's former lubricants business, as well as removing the impact of risk management gains and losses. Refinery operating expense is calculated by adjusting R&M segment OS&G for i) non-refining costs pertaining to the company's supply, marketing and ethanol businesses, and the company's former lubricants business; and ii) non-refining costs that management believes do not relate to the production of refined products, including, but not limited to, share-based compensation and enterprise shared service allocations. Management uses refining margin and refining operating expense to measure operating performance on a production barrel basis.
| Three months ended December 31 | Twelve months ended December 31 | |||||||||
($ millions, except as noted) | 2018 | 2017 | 2018 | 2017 | ||||||
| | | | | | | | | | | |
Refining margin reconciliation | ||||||||||
| | ||||||||||
Gross margin, operating revenue less purchases of crude oil and products | 1 695 | 1 807 | 7 068 | 5 692 | ||||||
| | ||||||||||
Other income (loss) | 41 | (13 | ) | 21 | 73 | |||||
| | ||||||||||
Non-refining margin | 180 | (394 | ) | (1 250 | ) | (1 546 | ) | |||
| | | | | | | | | | | |
Refining margin | 1 916 | 1 400 | 5 839 | 4 219 | ||||||
| | ||||||||||
Refinery production(1) (mbbls) | 46 145 | 43 801 | 169 138 | 174 461 | ||||||
| | | | | | | | | | | |
Refining margin ($/bbl) | 41.50 | 31.95 | 34.50 | 24.20 | ||||||
| | | | | | | | | | | |
Refining operating expense reconciliation | ||||||||||
| | ||||||||||
Operating, selling and general expense | 522 | 532 | 1 979 | 1 950 | ||||||
| | ||||||||||
Non-refining costs | (272 | ) | (303 | ) | (1 078 | ) | (1 068 | ) | ||
| | | | | | | | | | | |
Refining operating expense | 250 | 229 | 901 | 882 | ||||||
| | ||||||||||
Refinery production(1) (mbbls) | 46 145 | 43 801 | 169 138 | 174 461 | ||||||
| | | | | | | | | | | |
Refining operating expense ($/bbl) | 5.45 | 5.25 | 5.35 | 5.05 | ||||||
| | | | | | | | | | | |
- (1)
- Refinery production is the output of the refining process, and differs from crude oil processed as a result of volumetric adjustments for non-crude feedstock, volumetric gain associated with the refining process, and changes in unfinished product inventories.
Impact of First-in, First-out (FIFO) Inventory Valuation on Refining and Marketing Net Earnings
GAAP requires the use of a FIFO inventory valuation methodology. For Suncor, this results in a disconnect between the sales prices for refined products, which reflect current market conditions, and the amount recorded as the cost of sale for the related refinery feedstock, which reflects market conditions at the time the feedstock was purchased. This lag between purchase and sale can be anywhere from several weeks to several months, and is influenced by the time to receive crude after purchase (which can be several weeks for foreign offshore crude purchases), regional crude inventory levels, the completion of refining processes, transportation time to distribution channels, and regional refined product inventory levels.
Suncor prepares and presents an estimate of the impact of using a FIFO inventory valuation methodology compared to a LIFO methodology, because management uses the information to analyze operating performance and compare itself against refining peers that are permitted to use LIFO inventory valuation under United States GAAP (U.S. GAAP).
The company's estimate is not derived from a standardized calculation and, therefore, may not be directly comparable to similar measures presented by other companies, and should not be considered in isolation or as a substitute for measures of performance prepared in accordance with GAAP or U.S. GAAP.
| | | 2018 FOURTH QUARTER Suncor Energy Inc. 37 |
10. COMMON ABBREVIATIONS
The following is a list of abbreviations that may be used in this document:
| Measurement | Places and Currencies | |||||
| bbl | barrel | U.S. | United States | |||
| bbls/d | barrels per day | U.K. | United Kingdom | |||
| mbbls/d | thousands of barrels per day | |||||
| $ or Cdn$ | Canadian dollars | |||||
| boe | barrels of oil equivalent | US$ | United States dollars | |||
| boe/d | barrels of oil equivalent per day | |||||
| mboe | thousands of barrels of oil equivalent | |||||
| mboe/d | thousands of barrels of oil equivalent per day | Financial and Business Environment | ||||
| Q4 | Three months ended December 31 | |||||
| GJ | Gigajoule | DD&A | Depreciation, depletion and amortization | |||
| WTI | West Texas Intermediate | |||||
| mcf | thousands of cubic feet of natural gas | WCS | Western Canadian Select | |||
| mcfe | thousands of cubic feet of natural gas | SCO | Synthetic crude oil | |||
| equivalent | MSW | Mixed Sweet Blend | ||||
| mmcf | millions of cubic feet of natural gas | NYMEX | New York Mercantile Exchange | |||
| mmcf/d | millions of cubic feet of natural gas per day | YTD | Year to date | |||
| mmcfe | millions of cubic feet of natural gas equivalent | |||||
| mmcfe/d | millions of cubic feet of natural gas equivalent | |||||
| per day | ||||||
| MW | megawatts | |||||
| MWh | megawatts per hour | |||||
| 38 2018 FOURTH QUARTER Suncor Energy Inc. | | |
11. FORWARD-LOOKING INFORMATION
The document contains certain forward-looking information and forward-looking statements (collectively referred to herein as "forward-looking statements") within the meaning of applicable Canadian and U.S. securities laws. Forward-looking statements and other information are based on Suncor's current expectations, estimates, projections and assumptions that were made by the company in light of information available at the time the statement was made and consider Suncor's experience and its perception of historical trends, including expectations and assumptions concerning: the accuracy of reserves and resources estimates; commodity prices and interest and foreign exchange rates; the performance of assets and equipment; capital efficiencies and cost-savings; applicable laws and government policies; future production rates; the sufficiency of budgeted capital expenditures in carrying out planned activities; the availability and cost of labour, services and infrastructure; the satisfaction by third parties of their obligations to Suncor; the execution of projects; and the receipt, in a timely manner, of regulatory and third-party approvals. All statements and information that address expectations or projections about the future, and other statements and information about Suncor's strategy for growth, expected and future expenditures or investment decisions, commodity prices, costs, schedules, production volumes, operating and financial results, future financing and capital activities, and the expected impact of future commitments are forward-looking statements. Some of the forward-looking statements may be identified by words like "expects", "anticipates", "will", "estimates", "plans", "scheduled", "intends", "believes", "projects", "indicates", "could", "focus", "vision", "goal", "outlook", "proposed", "target", "objective", "continue", "should", "may", "future", "potential", "opportunity", "would", "priority", "strategy" and similar expressions. Forward-looking statements in the document include references to:
- •
- Suncor's focus on capital discipline and ensuring safe and reliable operations across the business, and the belief that through the company's integrated model and the value-driven investments made in its business, Suncor is well positioned to continue to grow production and cash flow, and to increase returns to shareholders across a wide range of market conditions;
- •
- Downstream integration continuing to be a fundamental component of Suncor's strategy;
- •
- Expectations for the Oda project, including that first oil is anticipated in the second quarter of 2019;
- •
- Expectations for the proposed interconnecting pipelines between Syncrude's Mildred Lake site and Suncor's Oil Sands Base plant, including that the lines will transfer bitumen and gas oils between the two plants providing increased operational flexibility and enabling higher reliability and utilization, and that the pipelines are expected to be operational by the end of 2020, subject to finalized commercial terms and regulatory approval;
- •
- Statements about Suncor's share repurchase program, including the expectation that the existing $3.0 billion share repurchase program will be completed by the end of February 2019, and Suncor's ongoing ability to generate cash flow and return value to shareholders;
- •
- Statements with respect to planned maintenance events;
- •
- Suncor's expectation that existing production levels at Firebag and MacKay River will be maintained due to well pad construction;
- •
- Suncor's planned 2019 capital spending program of $4.9 to $5.6 billion and the belief that Suncor will have the capital resources to fund the capital spending program and to meet current and future working capital requirements through cash and cash equivalents balances, cash flow provided by operating activities, available committed credit facilities, issuing commercial paper and, if needed, divesting of non-core assets and accessing capital markets;
- •
- The objectives of Suncor's short-term investment portfolio and Suncor's expectation that the maximum weighted average term to maturity of the short-term investment portfolio will not exceed six months, and that all investments will be with counterparties with investment grade debt ratings;
- •
- The company's priority regarding the management of debt levels given the company's long-term growth plans and future expected volatility in the pricing environment and Suncor's belief that a phased and flexible approach to existing and future growth projects should assist Suncor in maintaining its ability to manage project costs and debt levels;
- •
- The company's commitment to debt reduction; and
- •
- The company's belief that it does not have any guarantees or off-balance sheet arrangements that have, or are reasonably likely to have, a current or future material effect on the company's financial performance or financial condition, results of operations, liquidity or capital expenditures.
Forward-looking statements are not guarantees of future performance and involve a number of risks and uncertainties, some that are similar to other oil and gas companies and some that are unique to Suncor. Suncor's actual results may differ materially from those expressed or implied by its forward-looking statements, so readers are cautioned not to place undue reliance on them. The financial and
| | | 2018 FOURTH QUARTER Suncor Energy Inc. 39 |
operating performance of the company's reportable operating segments, specifically Oil Sands, E&P, and R&M, may be affected by a number of factors.
Factors that affect Suncor's Oil Sands segment include, but are not limited to, volatility in the prices for crude oil and other production, and the related impacts of fluctuating light/heavy and sweet/sour crude oil differentials; changes in the demand for refinery feedstock and diesel fuel, including the possibility that refiners that process the company's proprietary production will be closed, experience equipment failure or other accidents; Suncor's ability to operate its Oil Sands facilities reliably in order to meet production targets; the output of newly commissioned facilities, the performance of which may be difficult to predict during initial operations; the possibility that completed maintenance activities may not improve operational performance or the output of related facilities; Suncor's dependence on pipeline capacity and other logistical constraints, which may affect the company's ability to distribute products to market; Suncor's ability to finance Oil Sands growth and sustaining capital expenditures; the availability of bitumen feedstock for upgrading operations, which can be negatively affected by poor ore grade quality, unplanned mine equipment and extraction plant maintenance, tailings storage, and in situ reservoir and equipment performance, or the unavailability of third-party bitumen; changes in operating costs, including the cost of labour, natural gas and other energy sources used in oil sands processes; and the company's ability to complete projects, including planned maintenance events, both on time and on budget, which could be impacted by competition from other projects (including other oil sands projects) for goods and services and demands on infrastructure in Alberta's Wood Buffalo region and the surrounding area (including housing, roads and schools).
Factors that affect Suncor's E&P segment include, but are not limited to, volatility in crude oil and natural gas prices; operational risks and uncertainties associated with oil and gas activities, including unexpected formations or pressures, premature declines of reservoirs, fires, blow-outs, equipment failures and other accidents, uncontrollable flows of crude oil, natural gas or well fluids, and pollution and other environmental risks; the possibility that completed maintenance activities may not improve operational performance or the output of related facilities; adverse weather conditions, which could disrupt output from producing assets or impact drilling programs, resulting in increased costs and/or delays in bringing on new production; political, economic and socio-economic risks associated with Suncor's foreign operations, including the unpredictability of operating in Libya due to ongoing political unrest; and market demand for mineral rights and producing properties, potentially leading to losses on disposition or increased property acquisition costs.
Factors that affect our R&M segment include, but are not limited to, fluctuations in demand and supply for refined products that impact the company's margins; market competition, including potential new market entrants; the company's ability to reliably operate refining and marketing facilities in order to meet production or sales targets; the possibility that completed maintenance activities may not improve operational performance or the output of related facilities; and risks and uncertainties affecting construction or planned maintenance schedules, including the availability of labour and other impacts of competing projects drawing on the same resources during the same time period.
Additional risks, uncertainties and other factors that could influence the financial and operating performance of all of Suncor's operating segments and activities include, but are not limited to, changes in general economic, market and business conditions, such as commodity prices, interest rates and currency exchange rates; fluctuations in supply and demand for Suncor's products; the successful and timely implementation of capital projects, including growth projects and regulatory projects; risks associated with the execution of Suncor's major projects and the commissioning and integration of new facilities; competitive actions of other companies, including increased competition from other oil and gas companies or from companies that provide alternative sources of energy; labour and material shortages; actions by government authorities, including the imposition or reassessment of, or changes to, taxes, fees, royalties, duties and other government-imposed compliance costs; changes to laws and government policies that could impact the company's business, including environmental (including climate change), royalty and tax laws and policies; the ability and willingness of parties with whom Suncor has material relationships to perform their obligations to the company; the unavailability of, or outages to, third-party infrastructure that could cause disruptions to production or prevent the company from being able to transport its products; the occurrence of a protracted operational outage, a major safety or environmental incident, or unexpected events such as fires (including forest fires), equipment failures and other similar events affecting Suncor or other parties whose operations or assets directly or indirectly affect Suncor; the potential for security breaches of Suncor's information technology and infrastructure by malicious persons or entities, and the unavailability or failure of such systems to perform as anticipated as a result of such breaches; the risk that competing business objectives may exceed Suncor's capacity to adopt and implement change; risks and uncertainties associated with obtaining regulatory and stakeholder approval for the company's operations and exploration and development activities; the potential for disruptions to operations and construction projects as a result of Suncor's relationships with labour unions that represent employees at the company's facilities; the company's ability to find new oil and gas reserves that can be developed economically; the accuracy of Suncor's reserves, resources and future production estimates; market instability affecting Suncor's ability to borrow in the capital debt markets at acceptable rates or to issue other securities at acceptable prices; maintaining an optimal debt to cash flow ratio; the success of the company's risk management activities using derivatives and other financial instruments; the cost of compliance with current and future environmental laws, including climate change laws; risks relating to increased activism and public opposition to fossil fuels and oil sands; risks and uncertainties
| 40 2018 FOURTH QUARTER Suncor Energy Inc. | | |
associated with closing a transaction for the purchase or sale of a business, asset or oil and gas property, including estimates of the final consideration to be paid or received; the ability of counterparties to comply with their obligations in a timely manner; risks associated with joint arrangements in which the company has an interest; the receipt of any required regulatory or other third-party approvals outside of Suncor's control and the satisfaction of any conditions to such approvals; risks associated with land claims and Aboriginal consultation requirements; risks relating to litigation; the impact of technology and risks associated with developing and implementing new technologies; and the accuracy of cost estimates, some of which are provided at the conceptual or other preliminary stage of projects and prior to commencement or conception of the detailed engineering that is needed to reduce the margin of error and increase the level of accuracy. The foregoing important factors are not exhaustive.
Many of these risk factors and other assumptions related to Suncor's forward-looking statements are discussed in further detail throughout this document, and in the company's 2017 annual MD&A, Annual Information Form dated March 1, 2018 and Form 40-F on file with Canadian securities commissions at www.sedar.com and the United States Securities and Exchange Commission at www.sec.gov. Readers are also referred to the risk factors and assumptions described in other documents that Suncor files from time to time with securities regulatory authorities. Copies of these documents are available without charge from the company.
The forward-looking statements contained in this document are made as of the date of this document. Except as required by applicable securities laws, we assume no obligation to update publicly or otherwise revise any forward-looking statements or the foregoing risks and assumptions affecting such forward-looking statements, whether as a result of new information, future events or otherwise.
| | | 2018 FOURTH QUARTER Suncor Energy Inc. 41 |
CONSOLIDATED STATEMENTS OF COMPREHENSIVE (LOSS) INCOME
(unaudited)
| Three months ended December 31 | Twelve months ended December 31 | |||||||||
($ millions) | 2018 | 2017 | 2018 | 2017 | ||||||
| | | | | | | | | | | |
| (restated – note 3) | (restated – note 3) | |||||||||
Revenues and Other Income | ||||||||||
| | ||||||||||
Operating revenues, net of royalties (note 4) | 8 561 | 8 973 | 38 542 | 31 954 | ||||||
| | ||||||||||
Other income (note 5) | 384 | 41 | 444 | 125 | ||||||
| | | | | | | | | | | |
| 8 945 | 9 014 | 38 986 | 32 079 | |||||||
| | | | | | | | | | | |
Expenses | ||||||||||
| | ||||||||||
Purchases of crude oil and products | 3 329 | 2 773 | 14 133 | 11 121 | ||||||
| | ||||||||||
Operating, selling and general | 2 696 | 2 422 | 10 573 | 9 188 | ||||||
| | ||||||||||
Transportation | 362 | 242 | 1 319 | 997 | ||||||
| | ||||||||||
Depreciation, depletion, amortization and impairment | 1 419 | 1 488 | 5 738 | 5 601 | ||||||
| | ||||||||||
Exploration | 49 | 26 | 122 | 104 | ||||||
| | ||||||||||
Loss (gain) on asset exchange and disposals (notes 13, 14 and 18) | 250 | (47 | ) | (24 | ) | (602 | ) | |||
| | ||||||||||
Financing expenses (income) (note 7) | 952 | 225 | 2 142 | (246 | ) | |||||
| | | | | | | | | | | |
| 9 057 | 7 129 | 34 003 | 26 163 | |||||||
| | | | | | | | | | | |
(Loss) Earnings before Income Taxes | (112 | ) | 1 885 | 4 983 | 5 916 | |||||
| | | | | | | | | | | |
Income Tax Expense | ||||||||||
| | ||||||||||
Current | 8 | 400 | 1 250 | 1 209 | ||||||
| | ||||||||||
Deferred | 160 | 103 | 440 | 249 | ||||||
| | | | | | | | | | | |
| 168 | 503 | 1 690 | 1 458 | |||||||
| | | | | | | | | | | |
Net (Loss) Earnings | (280 | ) | 1 382 | 3 293 | 4 458 | |||||
| | | | | | | | | | | |
Other Comprehensive Income (Loss) | ||||||||||
| | ||||||||||
Items That May be Subsequently Reclassified to Earnings: | ||||||||||
| | ||||||||||
Foreign currency translation adjustment | 168 | 8 | 267 | (198 | ) | |||||
| | ||||||||||
Items That Will Not be Reclassified to Earnings: | ||||||||||
| | ||||||||||
Actuarial (loss) gain on employee retirement benefit plans, net of income taxes | (109 | ) | (22 | ) | 103 | 31 | ||||
| | | | | | | | | | | |
Other Comprehensive Income (Loss) | 59 | (14 | ) | 370 | (167 | ) | ||||
| | | | | | | | | | | |
Total Comprehensive (Loss) Income | (221 | ) | 1 368 | 3 663 | 4 291 | |||||
| | | | | | | | | | | |
Per Common Share (dollars) (note 9) | ||||||||||
| | ||||||||||
Net (loss) earnings – basic | (0.18 | ) | 0.84 | 2.03 | 2.68 | |||||
| | ||||||||||
Net (loss) earnings – diluted | (0.18 | ) | 0.84 | 2.02 | 2.68 | |||||
| | ||||||||||
Cash dividends | 0.36 | 0.32 | 1.44 | 1.28 | ||||||
| | | | | | | | | | |
See accompanying notes to the interim consolidated financial statements. | ||||||||||
| 42 2018 FOURTH QUARTER Suncor Energy Inc. | | |
CONSOLIDATED BALANCE SHEETS
(unaudited)
($ millions) | December 31 2018 | December 31 2017 | ||||
| | | | | | |
Assets | ||||||
| | ||||||
Current assets | ||||||
| | ||||||
Cash and cash equivalents | 2 221 | 2 672 | ||||
| | ||||||
Accounts receivable | 3 206 | 3 281 | ||||
| | ||||||
Inventories | 3 159 | 3 468 | ||||
| | ||||||
Income taxes receivable | 114 | 156 | ||||
| | | | | | | |
Total current assets | 8 700 | 9 577 | ||||
| | ||||||
Property, plant and equipment, net | 74 245 | 73 493 | ||||
| | ||||||
Exploration and evaluation | 2 319 | 2 052 | ||||
| | ||||||
Other assets (note 18) | 1 126 | 1 211 | ||||
| | ||||||
Goodwill and other intangible assets | 3 061 | 3 061 | ||||
| | ||||||
Deferred income taxes | 128 | 100 | ||||
| | | | | | | |
Total assets | 89 579 | 89 494 | ||||
| | | | | | | |
Liabilities and Shareholders' Equity | ||||||
| | ||||||
Current liabilities | ||||||
| | ||||||
Short-term debt | 3 231 | 2 136 | ||||
| | ||||||
Current portion of long-term debt | 229 | 71 | ||||
| | ||||||
Accounts payable and accrued liabilities | 5 647 | 6 203 | ||||
| | ||||||
Current portion of provisions | 667 | 722 | ||||
| | ||||||
Income taxes payable | 535 | 425 | ||||
| | | | | | | |
Total current liabilities | 10 309 | 9 557 | ||||
| | ||||||
Long-term debt | 13 890 | 13 372 | ||||
| | ||||||
Other long-term liabilities (notes 11 and 15) | 2 346 | 2 412 | ||||
| | ||||||
Provisions (note 12) | 6 984 | 7 237 | ||||
| | ||||||
Deferred income taxes | 12 045 | 11 533 | ||||
| | ||||||
Equity | 44 005 | 45 383 | ||||
| | | | | | | |
Total liabilities and shareholders' equity | 89 579 | 89 494 | ||||
| | | | | | |
See accompanying notes to the interim consolidated financial statements. | ||||||
| | | 2018 FOURTH QUARTER Suncor Energy Inc. 43 |
CONSOLIDATED STATEMENTS OF CASH FLOWS
(unaudited)
| Three months ended December 31 | Twelve months ended December 31 | |||||||||
($ millions) | 2018 | 2017 | 2018 | 2017 | ||||||
| | | | | | | | | | |
Operating Activities | ||||||||||
| | ||||||||||
Net (Loss) Earnings | (280 | ) | 1 382 | 3 293 | 4 458 | |||||
| | ||||||||||
Adjustments for: | ||||||||||
| | ||||||||||
Depreciation, depletion, amortization and impairment | 1 419 | 1 488 | 5 738 | 5 601 | ||||||
| | ||||||||||
Deferred income tax expense | 160 | 103 | 440 | 249 | ||||||
| | ||||||||||
Accretion | 67 | 63 | 266 | 247 | ||||||
| | ||||||||||
Unrealized foreign exchange loss (gain) on U.S. dollar denominated debt | 688 | 74 | 1 090 | (771 | ) | |||||
| | ||||||||||
Change in fair value of financial instruments and trading inventory | (148 | ) | 16 | (179 | ) | 128 | ||||
| | ||||||||||
Loss (gain) on asset exchange and disposals (notes 13, 14 and 18) | 250 | (48 | ) | (24 | ) | (474 | ) | |||
| | ||||||||||
Loss on extinguishment of long-term debt (note 7) | 3 | 26 | 3 | 51 | ||||||
| | ||||||||||
Share-based compensation | (88 | ) | 116 | (117 | ) | 31 | ||||
| | ||||||||||
Exploration | 11 | — | 11 | 41 | ||||||
| | ||||||||||
Settlement of decommissioning and restoration liabilities | (104 | ) | (98 | ) | (469 | ) | (353 | ) | ||
| | ||||||||||
Other | 29 | (106 | ) | 120 | (69 | ) | ||||
| | ||||||||||
Decrease (increase) in non-cash working capital | 1 033 | (261 | ) | 408 | (173 | ) | ||||
| | | | | | | | | | | |
Cash flow provided by operating activities | 3 040 | 2 755 | 10 580 | 8 966 | ||||||
| | | | | | | | | | | |
Investing Activities | ||||||||||
| | ||||||||||
Capital and exploration expenditures | (1 147 | ) | (1 621 | ) | (5 406 | ) | (6 551 | ) | ||
| | ||||||||||
Acquisitions (notes 16, 17 and 18) | (25 | ) | (308 | ) | (1 230 | ) | (308 | ) | ||
| | ||||||||||
Proceeds from disposal of assets (notes 13, 14 and 18) | 32 | 80 | 84 | 1 611 | ||||||
| | ||||||||||
Other investments (note 18) | (54 | ) | (24 | ) | (170 | ) | (38 | ) | ||
| | ||||||||||
(Increase) decrease in non-cash working capital | (265 | ) | 339 | 25 | 267 | |||||
| | | | | | | | | | | |
Cash flow used in investing activities | (1 459 | ) | (1 534 | ) | (6 697 | ) | (5 019 | ) | ||
| | | | | | | | | | | |
Financing Activities | ||||||||||
| | ||||||||||
Net increase in short-term debt | 117 | 56 | 866 | 981 | ||||||
| | ||||||||||
Net decrease in long-term debt | (132 | ) | (1 515 | ) | (186 | ) | (3 283 | ) | ||
| | ||||||||||
Issuance of long-term debt (note 7) | — | 905 | — | 905 | ||||||
| | ||||||||||
Issuance of common shares under share option plans | 4 | 123 | 286 | 228 | ||||||
| | ||||||||||
Purchase of common shares (note 10) | (1 166 | ) | (835 | ) | (3 053 | ) | (1 413 | ) | ||
| | ||||||||||
(Distributions) and proceeds from sale, relating to non-controlling interest | (2 | ) | 483 | (6 | ) | 483 | ||||
| | ||||||||||
Dividends paid on common shares | (574 | ) | (526 | ) | (2 333 | ) | (2 124 | ) | ||
| | | | | | | | | | | |
Cash flow used in financing activities | (1 753 | ) | (1 309 | ) | (4 426 | ) | (4 223 | ) | ||
| | | | | | | | | | | |
Decrease in Cash and Cash Equivalents | (172 | ) | (88 | ) | (543 | ) | (276 | ) | ||
| | ||||||||||
Effect of foreign exchange on cash and cash equivalents | 61 | 3 | 92 | (68 | ) | |||||
| | ||||||||||
Cash and cash equivalents at beginning of period | 2 332 | 2 757 | 2 672 | 3 016 | ||||||
| | | | | | | | | | | |
Cash and Cash Equivalents at End of Period | 2 221 | 2 672 | 2 221 | 2 672 | ||||||
| | | | | | | | | | | |
Supplementary Cash Flow Information | ||||||||||
| | ||||||||||
Interest paid | 299 | 332 | 800 | 941 | ||||||
| | ||||||||||
Income taxes (received) paid | (17 | ) | 283 | 645 | 557 | |||||
| | | | | | | | | | |
See accompanying notes to the interim consolidated financial statements. | ||||||||||
| 44 2018 FOURTH QUARTER Suncor Energy Inc. | | |
CONSOLIDATED STATEMENTS OF CHANGES IN EQUITY
(unaudited)
($ millions) | Share Capital | Contributed Surplus | Accumulated Other Comprehensive Income | Retained Earnings | Total | Number of Common Shares (thousands) | ||||||||
| | | | | | | | | | | | | | |
At December 31, 2016 | 26 942 | 588 | 1 007 | 16 093 | 44 630 | 1 667 914 | ||||||||
| | | | | | | | | | | | | | | |
Net earnings | — | — | — | 4 458 | 4 458 | — | ||||||||
| | | | ||||||||||||
Foreign currency translation adjustment | — | — | (198 | ) | — | (198 | ) | — | ||||||
| | | | ||||||||||||
Actuarial gain on employee retirement benefit plans, net of income taxes of $19 | — | — | — | 31 | 31 | — | ||||||||
| | | | | | | | | | | | | | | |
Total comprehensive (loss) income | — | — | (198 | ) | 4 489 | 4 291 | — | |||||||
| | | | ||||||||||||
Issued under share option plans | 297 | (69 | ) | — | — | 228 | 6 223 | |||||||
| | | | ||||||||||||
Purchase of common shares for cancellation (note 10) | (536 | ) | — | — | (877 | ) | (1 413 | ) | (33 154 | ) | ||||
| | | | ||||||||||||
Change in liability for share purchase commitment | (97 | ) | — | — | (180 | ) | (277 | ) | — | |||||
| | | | ||||||||||||
Share-based compensation | — | 48 | — | — | 48 | — | ||||||||
| | | | ||||||||||||
Dividends paid on common shares | — | — | — | (2 124 | ) | (2 124 | ) | — | ||||||
| | | | | | | | | | | | | | | |
At December 31, 2017 | 26 606 | 567 | 809 | 17 401 | 45 383 | 1 640 983 | ||||||||
| | | | | | | | | | | | | | | |
Net earnings | — | — | — | 3 293 | 3 293 | — | ||||||||
| | | | ||||||||||||
Foreign currency translation adjustment | — | — | 267 | — | 267 | — | ||||||||
| | | | ||||||||||||
Actuarial gain on employee retirement benefit plans, net of income taxes of $39 | — | — | — | 103 | 103 | — | ||||||||
| | | | | | | | | | | | | | | |
Total comprehensive income | — | — | 267 | 3 396 | 3 663 | — | ||||||||
| | | | ||||||||||||
Issued under share option plans | 358 | (73 | ) | — | — | 285 | 7 927 | |||||||
| | | | ||||||||||||
Purchase of common shares for cancellation (note 10) | (1 040 | ) | — | — | (2 013 | ) | (3 053 | ) | (64 426 | ) | ||||
| | | | ||||||||||||
Change in liability for share purchase commitment (note 10) | (14 | ) | — | — | 28 | 14 | — | |||||||
| | | | ||||||||||||
Share-based compensation | — | 46 | — | — | 46 | — | ||||||||
| | | | ||||||||||||
Dividends paid on common shares | — | — | — | (2 333 | ) | (2 333 | ) | — | ||||||
| | | | | | | | | | | | | | | |
At December 31, 2018 | 25 910 | 540 | 1 076 | 16 479 | 44 005 | 1 584 484 | ||||||||
| | | | | | | | | | | | | | | |
See accompanying notes to the interim consolidated financial statements. | ||||||||||||||
| | | 2018 FOURTH QUARTER Suncor Energy Inc. 45 |
NOTES TO THE CONSOLIDATED FINANCIAL STATEMENTS
(unaudited)
1. REPORTING ENTITY AND DESCRIPTION OF THE BUSINESS
Suncor Energy Inc. (Suncor or the company) is an integrated energy company headquartered in Canada. Suncor's operations include oil sands development and upgrading, offshore oil and gas production, petroleum refining, and product marketing, primarily under the Petro-Canada brand.
The address of the company's registered office is 150 – 6th Avenue S.W., Calgary, Alberta, Canada, T2P 3E3.
2. BASIS OF PREPARATION
(a) Statement of Compliance
These condensed interim consolidated financial statements have been prepared in accordance with International Financial Reporting Standards (IFRS), specifically International Accounting Standard (IAS) 34Interim Financial Reporting as issued by the International Accounting Standards Board (IASB). They are condensed as they do not include all of the information required for full annual financial statements, and they should be read in conjunction with the consolidated financial statements of the company for the year ended December 31, 2017.
(b) Basis of Measurement
The consolidated financial statements are prepared on a historical cost basis except as detailed in the accounting policies disclosed in the company's consolidated financial statements for the year ended December 31, 2017 and for the adoption of the new accounting pronouncements described in note 3.
(c) Functional Currency and Presentation Currency
These consolidated financial statements are presented in Canadian dollars, which is the company's functional currency.
(d) Use of Estimates, Assumptions and Judgments
The timely preparation of financial statements requires that management make estimates and assumptions and use judgment. Accordingly, actual results may differ from estimated amounts as future confirming events occur. Significant estimates and judgment used in the preparation of the financial statements are described in the company's consolidated financial statements for the year ended December 31, 2017.
(e) Income taxes
The company recognizes the impacts of income tax rate changes in earnings in the period that the applicable rate change is substantively enacted.
3. NEW IFRS STANDARDS
(a) Adoption of New IFRS Standards
Impact of the application of IFRS 9
Effective January 1, 2018, the company adopted IFRS 9Financial Instruments (IFRS 9) which replaces the multiple classification and measurement models for financial assets under IAS 39Financial Instruments (IAS 39) with a new model that has two measurement categories: amortized cost and fair value through profit or loss (FVTPL). This determination is made at initial recognition. For financial liabilities, the new standard retains most of the IAS 39 requirements; however, the main change arises in cases where the company chooses to designate a financial liability as FVTPL. In these situations, the portion of the fair value change related to the company's own credit risk is recognized in other comprehensive income rather than net earnings. As a result of adopting IFRS 9, the company's financial assets classified as loans and receivables at December 31, 2017 have been reclassified to financial assets at amortized cost; however, there is no impact to the measurement of these financial assets. There were no changes to the classifications of the company's financial liabilities. The classification and measurement guidance was adopted retrospectively in accordance with the transitional provisions of IFRS 9.
The company also adopted the new hedge accounting guidance in IFRS 9. The new hedge accounting guidance replaces strict quantitative tests of effectiveness with less restrictive assessments of how well the hedging instrument accomplishes the
| 46 2018 FOURTH QUARTER Suncor Energy Inc. | | |
company's risk management objectives for financial and non-financial risk exposures. IFRS 9 also allows the company to hedge risk components of non-financial items which meet certain measurability or identifiable characteristics. The company does not apply hedge accounting to any of its derivative instruments at this time.
After adoption of IFRS 9, the company's accounting policies are substantially the same as at December 31, 2017 and there is no impact on net earnings, except for the change in financial asset categories as discussed above.
Impact of the application of IFRS 15
On January 1, 2018, the company adopted IFRS 15 Revenue from Contracts with Customers (IFRS 15) using the retrospective method, which sets out guidelines for the recognition of revenue.
IFRS 15 replaces IAS 18 Revenue and presents a new single model for recognition of revenue from contracts with customers. The model features a contract-based five-step analysis of transactions to determine the nature of an entity's performance obligation related to whether, how much, and when revenue is recognized.
Under IFRS 15, the revenue from the sale of commodities and other operating revenue the company earns represent contractual arrangements with customers. The company recognizes revenue when title of the product is transferred to the buyer and collection is reasonably assured in accordance with specified contract terms. All operating revenue is generally earned at a point in time and is based on the consideration that the company expects to receive for the transfer of the goods to the customers.
The company has reviewed its sources of revenue and major contracts with customers using the guidance found in IFRS 15 and determined there are no material changes to the timing and measurement of the company's revenue in the reporting period, as compared to the provisions of the previous standard. In accordance with the new standard, the company assessed its principal versus agent requirements and the impact was a decrease in revenue, with a corresponding decrease to Operating, Selling and General expense and a decrease in Transportation expense, resulting in no impact on the company's consolidated net earnings.
Adjustments to Consolidated Statements of Comprehensive Income
($ millions, decrease) | For the three months ended December 31 2017 | For the twelve months ended December 31 2017 | ||||
| | | | | | | |
| IFRS 15 | ||||||
Revenues and Other Income | ||||||
| | ||||||
Operating revenues, net of royalties | (27 | ) | (97 | ) | ||
| | ||||||
Expenses | ||||||
| | ||||||
Operating, selling and general | (13 | ) | (57 | ) | ||
| | ||||||
Transportation | (14 | ) | (40 | ) | ||
| | | | | | | |
Net Earnings | — | — | ||||
| | | | | | | |
Total Comprehensive Income | — | — | ||||
| | | | | | |
(b) Recently Announced Accounting Pronouncements Update
IFRS 16Leases
In January 2016, the IASB issued IFRS 16Leases (IFRS 16) which replaces the existing leasing standard IAS 17Leases (IAS 17) and requires the recognition of leases on the balance sheet, with optional exemptions for short-term leases where the term is twelve months or less and for leases of low-value items. IFRS 16 effectively removes the classification of leases as either finance or operating leases and treats all leases as finance leases for lessees. The accounting treatment for lessors remains essentially unchanged, with the requirement to classify leases as either finance or operating.
The company will adopt the standard on the effective date of January 1, 2019 and has selected the modified retrospective transition approach. The company has also elected to apply the optional exemption for short-term leases. The company has completed the implementation of an information technology solution, including uploading of data for identified leases into its leasing system. All contracts have been reviewed, new business processes are developed and internal controls have been implemented.
| | | 2018 FOURTH QUARTER Suncor Energy Inc. 47 |
IFRS 16 will have an impact on the following components of the consolidated financial statements of the company:
Consolidated Balance Sheets: IFRS 16 requires the recognition of lease liabilities and right-of-use (ROU) assets for all leases except for the optional exemptions for short-term leases. The company will recognize the lease liability at the present value of the remaining lease payments discounted using the company's incremental borrowing rate upon adoption of the new standard. Upon transition, the company will measure the ROU assets equal to the lease liability, adjusted by the amount of any prepaid payments or onerous contracts recognized in the December 31, 2018 consolidated financial statements. The company will recognize additional ROU assets and lease liabilities of approximately $1.8 billion, subject to finalization of reviews, as of January 1, 2019.
Consolidated Statements of Comprehensive Income: Adoption of IFRS 16 will result in an increase to Depreciation, Depletion and Amortization expense due to the recognition of ROU assets, an increase to Financing expense from the unwinding of the discounted value of the lease liabilities and a decrease to Operating, Selling and General expense, Purchases of Crude Oil and Products expense, and Transportation expense. Based on the company's leases at January 1, 2019, this standard will not have a material impact on consolidated net earnings.
Consolidated Statements of Cash Flows: Due to the change in the presentation of former operating lease expenses, Cash flow from operating activities will increase due to the decrease in Operating, Selling and General expense, Purchases of Crude Oil and Products expense, and Transportation expense, partially offset by increased Financing expense, which represents an operating activity for the company. Cash flow from financing activities will decrease due to the addition of principal payments for former operating leases. The overall impact to cash flow for the company will be unchanged.
| 48 2018 FOURTH QUARTER Suncor Energy Inc. | | |
4. SEGMENTED INFORMATION
The company's operating segments are reported based on the nature of their products and services and management responsibility.
Intersegment sales of crude oil and natural gas are accounted for at market values and are included, for segmented reporting, in revenues of the segment making the transfer and expenses of the segment receiving the transfer. Intersegment amounts are eliminated on consolidation.
| Three months ended December 31 | Oil Sands | Exploration and Production | Refining and Marketing | Corporate, Energy Trading and Eliminations | Total | |||||||||||||||||||||||||||
| ($ millions) | 2018 | 2017 | 2018 | 2017 | 2018 | 2017 | 2018 | 2017 | 2018 | 2017 | ||||||||||||||||||||||
| | | | | | | | | | | | | | | | | | | | | | | | | | | | | | | | | |
| (restated – note 3) | (restated – note 3) | (restated – note 3) | (restated – note 3) | |||||||||||||||||||||||||||||
| | | | | | | | | | | | | | | | | | | | | | | | | | | | | | | | | |
Revenues and Other Income | ||||||||||||||||||||||||||||||||
| | ||||||||||||||||||||||||||||||||
Gross revenues | 2 368 | 3 059 | 771 | 949 | 5 618 | 5 325 | 10 | 15 | 8 767 | 9 348 | ||||||||||||||||||||||
| | ||||||||||||||||||||||||||||||||
Intersegment revenues | 781 | 1 089 | — | — | 33 | 37 | (814 | ) | (1 126 | ) | — | — | ||||||||||||||||||||
| | ||||||||||||||||||||||||||||||||
Less: Royalties | (67 | ) | (175 | ) | (139 | ) | (200 | ) | — | — | — | — | (206 | ) | (375 | ) | ||||||||||||||||
| | | | | | | | | | | | | | | | | | | | | | | | | | | | | | | | | |
Operating revenues, net of royalties | 3 082 | 3 973 | 632 | 749 | 5 651 | 5 362 | (804 | ) | (1 111 | ) | 8 561 | 8 973 | ||||||||||||||||||||
| | ||||||||||||||||||||||||||||||||
Other income (loss) | 280 | 61 | (3 | ) | 8 | 41 | (13 | ) | 66 | (15 | ) | 384 | 41 | |||||||||||||||||||
| | | | | | | | | | | | | | | | | | | | | | | | | | | | | | | | | |
| 3 362 | 4 034 | 629 | 757 | 5 692 | 5 349 | (738 | ) | (1 126 | ) | 8 945 | 9 014 | |||||||||||||||||||||
| | | | | | | | | | | | | | | | | | | | | | | | | | | | | | | | | |
Expenses | ||||||||||||||||||||||||||||||||
| | ||||||||||||||||||||||||||||||||
Purchases of crude oil and products | 515 | 233 | — | — | 3 956 | 3 555 | (1 142 | ) | (1 015 | ) | 3 329 | 2 773 | ||||||||||||||||||||
| | ||||||||||||||||||||||||||||||||
Operating, selling and general | 1 996 | 1 616 | 154 | 101 | 522 | 532 | 24 | 173 | 2 696 | 2 422 | ||||||||||||||||||||||
| | ||||||||||||||||||||||||||||||||
Transportation | 319 | 201 | 19 | 20 | 41 | 29 | (17 | ) | (8 | ) | 362 | 242 | ||||||||||||||||||||
| | ||||||||||||||||||||||||||||||||
Depreciation, depletion, amortization and impairment | 1 019 | 1 055 | 199 | 219 | 184 | 196 | 17 | 18 | 1 419 | 1 488 | ||||||||||||||||||||||
| | ||||||||||||||||||||||||||||||||
Exploration | 14 | 6 | 35 | 20 | — | — | — | — | 49 | 26 | ||||||||||||||||||||||
| | ||||||||||||||||||||||||||||||||
(Gain) loss on asset exchange and disposals of assets | (1 | ) | (46 | ) | 253 | — | (2 | ) | (1 | ) | — | — | 250 | (47 | ) | |||||||||||||||||
| | ||||||||||||||||||||||||||||||||
Financing expenses (income) | 102 | 55 | 17 | 14 | (2 | ) | 3 | 835 | 153 | 952 | 225 | |||||||||||||||||||||
| | | | | | | | | | | | | | | | | | | | | | | | | | | | | | | | | |
| 3 964 | 3 120 | 677 | 374 | 4 699 | 4 314 | (283 | ) | (679 | ) | 9 057 | 7 129 | |||||||||||||||||||||
| | | | | | | | | | | | | | | | | | | | | | | | | | | | | | | | | |
(Loss) earnings before Income Taxes | (602 | ) | 914 | (48 | ) | 383 | 993 | 1 035 | (455 | ) | (447 | ) | (112 | ) | 1 885 | |||||||||||||||||
| | ||||||||||||||||||||||||||||||||
Income Tax (Recovery) Expense | ||||||||||||||||||||||||||||||||
| | ||||||||||||||||||||||||||||||||
Current | (298 | ) | 63 | 64 | 161 | 321 | 310 | (79 | ) | (134 | ) | 8 | 400 | |||||||||||||||||||
| | ||||||||||||||||||||||||||||||||
Deferred | 89 | 181 | 3 | 5 | (51 | ) | (161 | ) | 119 | 78 | 160 | 103 | ||||||||||||||||||||
| | | | | | | | | | | | | | | | | | | | | | | | | | | | | | | | | |
| (209 | ) | 244 | 67 | 166 | 270 | 149 | 40 | (56 | ) | 168 | 503 | |||||||||||||||||||||
| | | | | | | | | | | | | | | | | | | | | | | | | | | | | | | | | |
Net (Loss) Earnings | (393 | ) | 670 | (115 | ) | 217 | 723 | 886 | (495 | ) | (391 | ) | (280 | ) | 1 382 | |||||||||||||||||
| | | | | | | | | | | | | | | | | | | | | | | | | | | | | | | | | |
Capital and Exploration Expenditures | 663 | 1 160 | 285 | 193 | 189 | 249 | 10 | 19 | 1 147 | 1 621 | ||||||||||||||||||||||
| | | | | | | | | | | | | | | | | | | | | | | | | | | | | | | | | |
| | | 2018 FOURTH QUARTER Suncor Energy Inc. 49 |
| Twelve months ended December 31 | Oil Sands | Exploration and Production | Refining and Marketing | Corporate, Energy Trading and Eliminations | Total | |||||||||||||||||||||||||||
| ($ millions) | 2018 | 2017 | 2018 | 2017 | 2018 | 2017 | 2018 | 2017 | 2018 | 2017 | ||||||||||||||||||||||
| | | | | | | | | | | | | | | | | | | | | | | | | | | | | | | | | |
| (restated – note 3) | (restated – note 3) | (restated – note 3) | (restated – note 3) | |||||||||||||||||||||||||||||
| | | | | | | | | | | | | | | | | | | | | | | | | | | | | | | | | |
Revenues and Other Income | ||||||||||||||||||||||||||||||||
| | ||||||||||||||||||||||||||||||||
Gross revenues | 12 039 | 9 723 | 3 869 | 3 487 | 23 655 | 19 612 | 29 | 63 | 39 592 | 32 885 | ||||||||||||||||||||||
| | ||||||||||||||||||||||||||||||||
Intersegment revenues | 3 704 | 3 551 | — | — | 69 | 92 | (3 773 | ) | (3 643 | ) | — | — | ||||||||||||||||||||
| | ||||||||||||||||||||||||||||||||
Less: Royalties | (398 | ) | (355 | ) | (652 | ) | (576 | ) | — | — | — | — | (1 050 | ) | (931 | ) | ||||||||||||||||
| | | | | | | | | | | | | | | | | | | | | | | | | | | | | | | | | |
Operating revenues, net of royalties | 15 345 | 12 919 | 3 217 | 2 911 | 23 724 | 19 704 | (3 744 | ) | (3 580 | ) | 38 542 | 31 954 | ||||||||||||||||||||
| | ||||||||||||||||||||||||||||||||
Other income (loss) | 288 | 86 | (71 | ) | (14 | ) | 21 | 73 | 206 | (20 | ) | 444 | 125 | |||||||||||||||||||
| | | | | | | | | | | | | | | | | | | | | | | | | | | | | | | | | |
| 15 633 | 13 005 | 3 146 | 2 897 | 23 745 | 19 777 | (3 538 | ) | (3 600 | ) | 38 986 | 32 079 | |||||||||||||||||||||
| | | | | | | | | | | | | | | | | | | | | | | | | | | | | | | | | |
Expenses | ||||||||||||||||||||||||||||||||
| | ||||||||||||||||||||||||||||||||
Purchases of crude oil and products | 1 563 | 623 | — | — | 16 656 | 14 011 | (4 086 | ) | (3 513 | ) | 14 133 | 11 121 | ||||||||||||||||||||
| | ||||||||||||||||||||||||||||||||
Operating, selling and general | 7 570 | 6 257 | 503 | 422 | 1 979 | 1 950 | 521 | 559 | 10 573 | 9 188 | ||||||||||||||||||||||
| | ||||||||||||||||||||||||||||||||
Transportation | 1 144 | 827 | 85 | 86 | 137 | 110 | (47 | ) | (26 | ) | 1 319 | 997 | ||||||||||||||||||||
| | ||||||||||||||||||||||||||||||||
Depreciation, depletion, amortization and impairment | 4 024 | 3 782 | 967 | 1 028 | 683 | 685 | 64 | 106 | 5 738 | 5 601 | ||||||||||||||||||||||
| | ||||||||||||||||||||||||||||||||
Exploration | 44 | 15 | 78 | 89 | — | — | — | — | 122 | 104 | ||||||||||||||||||||||
| | ||||||||||||||||||||||||||||||||
(Gain) loss on asset exchange and disposals of assets | (108 | ) | (50 | ) | 91 | — | (7 | ) | (455 | ) | — | (97 | ) | (24 | ) | (602 | ) | |||||||||||||||
| | ||||||||||||||||||||||||||||||||
Financing expenses (income) | 320 | 180 | 46 | 36 | 7 | 15 | 1 769 | (477 | ) | 2 142 | (246 | ) | ||||||||||||||||||||
| | | | | | | | | | | | | | | | | | | | | | | | | | | | | | | | | |
| 14 557 | 11 634 | 1 770 | 1 661 | 19 455 | 16 316 | (1 779 | ) | (3 448 | ) | 34 003 | 26 163 | |||||||||||||||||||||
| | | | | | | | | | | | | | | | | | | | | | | | | | | | | | | | | |
Earnings (Loss) before Income Taxes | 1 076 | 1 371 | 1 376 | 1 236 | 4 290 | 3 461 | (1 759 | ) | (152 | ) | 4 983 | 5 916 | ||||||||||||||||||||
| | ||||||||||||||||||||||||||||||||
Income Tax Expense (Recovery) | ||||||||||||||||||||||||||||||||
| | ||||||||||||||||||||||||||||||||
Current | (128 | ) | 192 | 680 | 617 | 1 098 | 941 | (400 | ) | (541 | ) | 1 250 | 1 209 | |||||||||||||||||||
| | ||||||||||||||||||||||||||||||||
Deferred | 351 | 170 | (112 | ) | (113 | ) | 39 | (138 | ) | 162 | 330 | 440 | 249 | |||||||||||||||||||
| | | | | | | | | | | | | | | | | | | | | | | | | | | | | | | | | |
| 223 | 362 | 568 | 504 | 1 137 | 803 | (238 | ) | (211 | ) | 1 690 | 1 458 | |||||||||||||||||||||
| | | | | | | | | | | | | | | | | | | | | | | | | | | | | | | | | |
Net Earnings (Loss) | 853 | 1 009 | 808 | 732 | 3 153 | 2 658 | (1 521 | ) | 59 | 3 293 | 4 458 | |||||||||||||||||||||
| | | | | | | | | | | | | | | | | | | | | | | | | | | | | | | | | |
Capital and Exploration Expenditures | 3 546 | 5 059 | 946 | 824 | 856 | 634 | 58 | 34 | 5 406 | 6 551 | ||||||||||||||||||||||
| | | | | | | | | | | | | | | | | | | | | | | | | | | | | | | | | |
| 50 2018 FOURTH QUARTER Suncor Energy Inc. | | |
Disaggregation of Revenue from Contracts with Customers and Intersegment Revenue
The company derives revenue from the transfer of goods mainly at a point in time in the following major commodities, revenue streams and geographical regions:
For the three months ended December 31 | 2018 | 2017 | ||||||||||||
($ millions) | North America | International | Total | North America | International | Total | ||||||||
| | | | | | | | | | | | | | |
Oil Sands | ||||||||||||||
| | ||||||||||||||
SCO and diesel | 2 236 | — | 2 236 | 3 438 | — | 3 438 | ||||||||
| | ||||||||||||||
Bitumen | 913 | — | 913 | 710 | — | 710 | ||||||||
| | | | | | | | | | | | | | | |
| 3 149 | — | 3 149 | 4 148 | — | 4 148 | |||||||||
| | | | | | | | | | | | | | | |
Exploration and Production | ||||||||||||||
| | ||||||||||||||
Crude oil and natural gas liquids | 287 | 481 | 768 | 328 | 616 | 944 | ||||||||
| | ||||||||||||||
Natural gas | — | 3 | 3 | 1 | 4 | 5 | ||||||||
| | | | | | | | | | | | | | | |
| 287 | 484 | 771 | 329 | 620 | 949 | |||||||||
| | | | | | | | | | | | | | | |
Refining and Marketing | ||||||||||||||
| | ||||||||||||||
Gasoline | 2 391 | — | 2 391 | 2 443 | — | 2 443 | ||||||||
| | ||||||||||||||
Distillate | 2 478 | — | 2 478 | 2 276 | — | 2 276 | ||||||||
| | ||||||||||||||
Other | 782 | — | 782 | 643 | — | 643 | ||||||||
| | | | | | | | | | | | | | | |
| 5 651 | — | 5 651 | 5 362 | — | 5 362 | |||||||||
| | | | | | | | | | | | | | | |
Corporate, Energy Trading and Eliminations | ||||||||||||||
| | | | | | | | | | | | | | | |
| (804 | ) | — | (804 | ) | (1 111 | ) | — | (1 111 | ) | |||||
| | | | | | | | | | | | | | | |
Total Revenue from Contracts with Customers | 8 283 | 484 | 8 767 | 8 728 | 620 | 9 348 | ||||||||
| | | | | | | | | | | | | | |
For the twelve months ended December 31 | 2018 | 2017 | ||||||||||||
($ millions) | North America | International | Total | North America | International | Total | ||||||||
| | | | | | | | | | | | | | |
Oil Sands | ||||||||||||||
| | ||||||||||||||
SCO and diesel | 11 659 | — | 11 659 | 11 244 | — | 11 244 | ||||||||
| | ||||||||||||||
Bitumen | 4 084 | — | 4 084 | 2 030 | — | 2 030 | ||||||||
| | | | | | | | | | | | | | | |
| 15 743 | — | 15 743 | 13 274 | — | 13 274 | |||||||||
| | | | | | | | | | | | | | | |
Exploration and Production | ||||||||||||||
| | ||||||||||||||
Crude oil and natural gas liquids | 1 741 | 2 112 | 3 853 | 1 326 | 2 133 | 3 459 | ||||||||
| | ||||||||||||||
Natural gas | 3 | 13 | 16 | 10 | 18 | 28 | ||||||||
| | | | | | | | | | | | | | | |
| 1 744 | 2 125 | 3 869 | 1 336 | 2 151 | 3 487 | |||||||||
| | | | | | | | | | | | | | | |
Refining and Marketing | ||||||||||||||
| | ||||||||||||||
Gasoline | 10 819 | — | 10 819 | 9 075 | — | 9 075 | ||||||||
| | ||||||||||||||
Distillate | 9 698 | — | 9 698 | 7 800 | — | 7 800 | ||||||||
| | ||||||||||||||
Other | 3 207 | — | 3 207 | 2 829 | — | 2 829 | ||||||||
| | | | | | | | | | | | | | | |
| 23 724 | — | 23 724 | 19 704 | — | 19 704 | |||||||||
| | | | | | | | | | | | | | | |
Corporate, Energy Trading and Eliminations | ||||||||||||||
| | | | | | | | | | | | | | | |
| (3 744 | ) | — | (3 744 | ) | (3 580 | ) | — | (3 580 | ) | |||||
| | | | | | | | | | | | | | | |
Total Revenue from Contracts with Customers | 37 467 | 2 125 | 39 592 | 30 734 | 2 151 | 32 885 | ||||||||
| | | | | | | | | | | | | | |
| | | 2018 FOURTH QUARTER Suncor Energy Inc. 51 |
5. OTHER INCOME
Other income consists of the following:
| Three months ended December 31 | Twelve months ended December 31 | |||||||||
($ millions) | 2018 | 2017 | 2018 | 2017 | ||||||
| | | | | | | | | | |
Energy trading activities | ||||||||||
| | ||||||||||
Unrealized gains (losses) recognized in earnings | 38 | (19 | ) | 129 | (37 | ) | ||||
| | ||||||||||
Gains (losses) on inventory valuation | 24 | 7 | 13 | (39 | ) | |||||
| | ||||||||||
Risk management activities(1) | 216 | (51 | ) | 126 | (19 | ) | ||||
| | ||||||||||
Investment and interest income | 19 | 22 | 34 | 162 | ||||||
| | ||||||||||
Insurance proceeds(2) | 87 | 76 | 120 | 76 | ||||||
| | ||||||||||
Change in value of pipeline commitments and other | — | 6 | 22 | (18 | ) | |||||
| | | | | | | | | | | |
| 384 | 41 | 444 | 125 | |||||||
| | | | | | | | | | |
- (1)
- Includes fair value changes related to short-term derivative contracts in the Oil Sands and Refining and Marketing segments.
- (2)
- 2018 includes business interruption and property damage insurance proceeds for Syncrude and 2017 includes property damage insurance proceeds for Syncrude, in each case within Oil Sands segment.
6. SHARE-BASED COMPENSATION
The following table summarizes the share-based compensation expense (recovery) recorded for all plans within Operating, Selling and General expense:
| Three months ended December 31 | Twelve months ended December 31 | |||||||||
($ millions) | 2018 | 2017 | 2018 | 2017 | ||||||
| | | | | | | | | | |
Equity-settled plans | 8 | 7 | 46 | 48 | ||||||
| | ||||||||||
Cash-settled plans | (96 | ) | 110 | 181 | 334 | |||||
| | | | | | | | | | | |
| (88 | ) | 117 | 227 | 382 | ||||||
| | | | | | | | | | |
7. FINANCING EXPENSES (INCOME)
| Three months ended December 31 | Twelve months ended December 31 | |||||||||
($ millions) | 2018 | 2017 | 2018 | 2017 | ||||||
| | | | | | | | | | |
Interest on debt | 224 | 241 | 897 | 945 | ||||||
| | ||||||||||
Capitalized interest | (28 | ) | (177 | ) | (156 | ) | (729 | ) | ||
| | | | | | | | | | | |
Interest expense | 196 | 64 | 741 | 216 | ||||||
| | ||||||||||
Interest on partnership liability (note 15) | 14 | 5 | 56 | 5 | ||||||
| | ||||||||||
Interest on pension and other post-retirement benefits | 13 | 14 | 56 | 58 | ||||||
| | ||||||||||
Accretion | 67 | 63 | 266 | 247 | ||||||
| | ||||||||||
Foreign exchange loss (gain) on U.S. dollar denominated debt | 688 | 74 | 1 090 | (771 | ) | |||||
| | ||||||||||
Foreign exchange and other | (29 | ) | (21 | ) | (70 | ) | (52 | ) | ||
| | ||||||||||
Loss on extinguishment of long-term debt | 3 | 26 | 3 | 113 | ||||||
| | ||||||||||
Realized gain on foreign currency hedges | — | — | — | (62 | ) | |||||
| | | | | | | | | | | |
| 952 | 225 | 2 142 | (246 | ) | ||||||
| | | | | | | | | | |
| 52 2018 FOURTH QUARTER Suncor Energy Inc. | | |
During the fourth quarter of 2018, the company completed an early partial retirement of US$83 million (book value of $109 million) of subsidiary debt acquired through the acquisition of Canadian Oil Sands Limited (COS) with a coupon of 7.75%, originally scheduled to mature on May 15, 2019, for US$88 million ($116 million). The early retirement payment included US$3 million ($4 million) of accrued interest, resulting in a debt extinguishment loss of $3 million ($2 million after-tax).
During the fourth quarter of 2017, the company completed an early retirement of its US$600 million (book value of $771 million) senior unsecured notes with a coupon of 6.05% originally scheduled to mature on May 15, 2018 for US$614 million ($788 million), including US$3 million ($4 million) of accrued interest. The company also completed an early retirement of its $700 million senior unsecured Series 4 Medium Term notes with a coupon of 5.80% originally scheduled to mature on May 22, 2018 for $715 million, including $3 million of accrued interest. The company realized an overall debt extinguishment loss of $26 million ($18 million after-tax).
During the fourth quarter of 2017, the company issued US$750 million of senior unsecured notes maturing on November 15, 2047. The notes have a coupon of 4.00% and were priced at $99.498 per note for an effective yield of 4.029%.
During the second quarter of 2017, the company completed an early retirement of its US$1.250 billion (book value of $1.700 billion) long-term notes originally scheduled to mature on June 1, 2018 for US$1.344 billion ($1.830 billion), including US$31 million ($42 million) of accrued interest. In conjunction with the early retirement of the notes, the company also realized gains of $62 million on foreign currency hedges resulting in an overall debt extinguishment loss of $25 million ($10 million after-tax).
8. INCOME TAXES
In the fourth quarter of 2017, the U.S. government enacted a decrease in the U.S. federal corporate tax rate from 35% to 21%, effective January 1, 2018. As a result, the company revalued its deferred income tax balances, resulting in a deferred income tax recovery of $124 million recognized in the fourth quarter of 2017.
In the fourth quarter of 2017, the Government of British Columbia enacted an increase to the provincial corporate income tax rate from 11% to 12%. As a result, the company revalued its deferred income tax balances, resulting in a deferred income tax expense of $18 million.
9. (LOSS) EARNINGS PER COMMON SHARE
| Three months ended December 31 | Twelve months ended December 31 | |||||||||
($ millions) | 2018 | 2017 | 2018 | 2017 | ||||||
| | | | | | | | | | |
Net (loss) earnings | (280 | ) | 1 382 | 3 293 | 4 458 | |||||
| | ||||||||||
Dilutive impact of accounting for awards as equity-settled(1) | — | — | — | (1 | ) | |||||
| | | | | | | | | | | |
Net (loss) earnings – diluted | (280 | ) | 1 382 | 3 293 | 4 457 | |||||
| | | | | | | | | | |
(millions of common shares) | ||||||||||
| | | | | | | | | | |
Weighted average number of common shares | 1 599 | 1 650 | 1 623 | 1 661 | ||||||
| | ||||||||||
Dilutive securities: | ||||||||||
| | ||||||||||
Effect of share options | 4 | 5 | 6 | 4 | ||||||
| | | | | | | | | | | |
Weighted average number of diluted common shares | 1 603 | 1 655 | 1 629 | 1 665 | ||||||
| | | | | | | | | | |
(dollars per common share) | ||||||||||
| | | | | | | | | | |
Basic (loss) earnings per share | (0.18 | ) | 0.84 | 2.03 | 2.68 | |||||
| | ||||||||||
Diluted (loss) earnings per share | (0.18 | ) | 0.84 | 2.02 | 2.68 | |||||
| | | | | | | | | | |
- (1)
- Cash payment alternatives are accounted for as cash-settled plans. As these awards can be exchanged for common shares of the company, they are considered potentially dilutive and are included in the calculation of the company's diluted net earnings per share if they have a dilutive impact in the period. Accounting for these awards as equity-settled was determined to have a dilutive impact for the twelve months ended December 31, 2017.
| | | 2018 FOURTH QUARTER Suncor Energy Inc. 53 |
10. NORMAL COURSE ISSUER BID
On April 26, 2017, the company announced its intention to commence a normal course issuer bid (the 2017 NCIB) to repurchase common shares through the facilities of the Toronto Stock Exchange (TSX), New York Stock Exchange and/or alternative trading platforms. Pursuant to the 2017 NCIB, the company was permitted to purchase for cancellation up to approximately $2.0 billion worth of its common shares between May 2, 2017 and May 1, 2018.
On May 1, 2018, the company announced its intention to renew the 2017 NCIB (the 2018 NCIB) to continue to repurchase shares through the facilities of the TSX, New York Stock Exchange and/or alternative trading platforms. Pursuant to the 2018 NCIB, the company was permitted to purchase for cancellation up to 52,285,330 of its common shares between May 4, 2018 and May 3, 2019. On November 14, 2018, Suncor announced an amendment to the 2018 NCIB, effective as of November 19, 2018, which allows the company to increase the maximum number of aggregate common shares that may be repurchased between May 4, 2018 and May 3, 2019 to 81,695,830.
During the fourth quarter of 2018, the company repurchased 26.7 million common shares under the 2018 NCIB at an average price of $43.61 per share, for a total repurchase cost of $1.166 billion.
The following table summarizes the share repurchase activities during the period:
| Three months ended December 31 | Twelve months ended December 31 | |||||||||
($ millions, except as noted) | 2018 | 2017 | 2018 | 2017 | ||||||
| | | | | | | | | | |
Share repurchase activities (thousands of common shares) | ||||||||||
| | ||||||||||
Shares repurchased | 26 726 | 18 713 | 64 426 | 33 154 | ||||||
| | | | | | | | | | | |
Amounts charged to | ||||||||||
| | ||||||||||
Share capital | 431 | 303 | 1 040 | 536 | ||||||
| | ||||||||||
Retained earnings | 735 | 532 | 2 013 | 877 | ||||||
| | | | | | | | | | | |
Share repurchase cost | 1 166 | 835 | 3 053 | 1 413 | ||||||
| | | | | | | | | | |
Under an automatic repurchase plan agreement with an independent broker, the company recorded the following liability for share repurchases that could have taken place during its internal blackout period:
($ millions) | December 31 2018 | December 31 2017 | ||||
| | | | | | |
Amounts charged to | ||||||
| | ||||||
Share capital | 111 | 97 | ||||
| | ||||||
Retained earnings | 152 | 180 | ||||
| | | | | | | |
Liability for share purchase commitment | 263 | 277 | ||||
| | | | | | |
11. FINANCIAL INSTRUMENTS
Derivative Financial Instruments
(a) Non-Designated Derivative Financial Instruments
The following table presents the company's non-designated Energy Trading and Risk Management derivatives measured at fair value as at December 31, 2018:
($ millions) | Energy Trading | Risk Management | Total | |||||
| | | | | | | | |
Fair value outstanding at December 31, 2017 | (85 | ) | (20 | ) | (105 | ) | ||
| | ||||||||
Cash Settlements – received during the year | (43 | ) | (47 | ) | (90 | ) | ||
| | ||||||||
Unrealized gains recognized in earnings during the year (note 5) | 129 | 126 | 255 | |||||
| | | | | | | | | |
Fair value outstanding at December 31, 2018 | 1 | 59 | 60 | |||||
| | | | | | | | |
| 54 2018 FOURTH QUARTER Suncor Energy Inc. | | |
(b) Fair Value Hierarchy
The following table presents the company's financial instruments measured at fair value for each hierarchy level as at December 31, 2018:
($ millions) | Level 1 | Level 2 | Level 3 | Total Fair Value | ||||||
| | | | | | | | | | |
Accounts receivable | 63 | 152 | — | 215 | ||||||
| | ||||||||||
Accounts payable | (43 | ) | (112 | ) | — | (155 | ) | |||
| | | | | | | | | | | |
| 20 | 40 | — | 60 | |||||||
| | | | | | | | | | |
During the fourth quarter of 2018, there were no transfers between Level 1 and Level 2 fair value measurements and no transfers in or out of Level 3 fair value measurements.
Non-Derivative Financial Instruments
At December 31, 2018, the carrying value of fixed-term debt accounted for under amortized cost was $12.9 billion (December 31, 2017 – $12.1 billion) and the fair value was $14.2 billion (December 31, 2017 – $14.7 billion). The estimated fair value of long-term debt is based on pricing sourced from market data.
Suncor entered into a partnership with Fort McKay First Nation (FMFN) and Mikisew Cree First Nation (MCFN) in 2017 where FMFN and MCFN acquired a combined 49% partnership interest in the East Tank Farm Development. The partnership liability is recorded at amortized cost using the effective interest method. At December 31, 2018, the carrying value of the partnership liability accounted for under amortized cost was $477 million (December 31, 2017 – $483 million), with interest on the partnership liability partially offsetting distributions in the period.
12. PROVISIONS
Suncor's decommissioning and restoration provision decreased by $226 million for the twelve months ended December 31, 2018. The decrease was primarily due to an increase in the credit-adjusted risk-free interest rate to 4.20% (December 31, 2017 – 3.70%), the disposal of the company's mineral landholdings in northeast British Columbia (B.C.), and liabilities settled. This decrease was partially offset by the acquisition of Mocal Energy Limited's 5% interest in Syncrude and additional disturbances in the year.
13. SALE OF LUBRICANTS BUSINESS
On February 1, 2017, the company completed the previously announced sale of its lubricants business for proceeds of $1.1 billion before closing adjustments and other closing costs. The sale of this business resulted in an after-tax gain of $354 million, including a current tax expense of $101 million and a deferred tax recovery of $11 million, in the Refining and Marketing segment.
14. SALE OF CEDAR POINT
The company sold its interest in the Cedar Point wind facility in southwest Ontario for proceeds of $291 million before closing adjustments and other closing costs, with an effective date of January 1, 2017. The disposition resulted in an after-tax gain of $83 million, including a current tax expense of $29 million and a deferred tax recovery of $15 million, in the Corporate, Energy Trading and Eliminations segment.
15. EAST TANK FARM DEVELOPMENT (ETFD) PARTNERSHIP
The ETFD consists of bitumen storage, blending and cooling facilities, and connectivity to third-party pipelines and began operations on July 14, 2017. The ETFD is solely responsible for moving the product of the Fort Hills joint operation to market. On November 22, 2017, the company completed the previously announced disposition of a 49% ownership interest in the ETFD to the FMFN and MCFN for gross proceeds of $503 million. Suncor retained a 51% ownership interest and remains as
| | | 2018 FOURTH QUARTER Suncor Energy Inc. 55 |
operator of the assets. The assets are held by a newly formed limited partnership, which has a non-discretionary obligation to distribute the variable monthly residual cash in ETFD to the partners. Therefore, the company has recorded a liability within Other Long-Term Liabilities to reflect the 49% non-controlling interest of the third parties. As a result, the company will continue to consolidate 100% of the results of the partnership.
16. FORT HILLS
On December 21, 2017, the Fort Hills partners resolved their commercial dispute and reached an agreement in which Suncor acquired an additional 2.26% interest in the Fort Hills project for consideration of $308 million. Teck Resources Limited (Teck) also acquired an additional 0.89% interest in the project as a result of the agreement.
During the first quarter of 2018, Suncor acquired an additional 1.05% interest in the Fort Hills project for consideration of $145 million. The additional interest was an outcome of the commercial dispute settlement agreement reached among the Fort Hills partners in December 2017. Teck also acquired an additional 0.42% in the project. Suncor's share in the project has increased to 54.11% and Teck's has increased to 21.31%, with Total E&P Canada Ltd.'s share decreasing to 24.58%.
17. ACQUISITION OF ADDITIONAL OWNERSHIP INTEREST IN THE SYNCRUDE PROJECT
On February 23, 2018, Suncor completed the purchase of an additional 5% working interest in the Syncrude project from Mocal Energy Limited for $923 million cash. Suncor's share in the Syncrude project has increased to 58.74%.
The acquisition has been accounted for as a business combination using the acquisition method. The purchase price allocation is based on management's best estimates of fair values of Syncrude's assets and liabilities as at February 23, 2018. Adjustments to estimates may be required.
($ millions) | ||||
| | | | |
Accounts receivable | 2 | |||
| | ||||
Inventory | 15 | |||
| | ||||
Property, plant and equipment | 998 | |||
| | ||||
Exploration and evaluation | 163 | |||
| | | | | |
Total assets acquired | 1 178 | |||
| | | | | |
Accounts payable and accrued liabilities | (51 | ) | ||
| | ||||
Employee future benefits | (33 | ) | ||
| | ||||
Decommissioning provision | (169 | ) | ||
| | ||||
Deferred income taxes | (2 | ) | ||
| | | | | |
Total liabilities assumed | (255 | ) | ||
| | | | | |
Net assets acquired | 923 | |||
| | | | |
The fair values of accounts receivable and accounts payable approximate their carrying values due to the short-term maturity of the instruments. The fair value of materials and supplies inventory approximates book value due to short-term turnover rates. The fair values of property, plant and equipment, and the decommissioning provision were determined using an expected future cash flow approach. Key assumptions used in the calculations were discount rates, future commodity prices and costs, timing of development activities, projections of oil reserves, and cost estimates to abandon and reclaim the mine and facilities.
The additional working interest in Syncrude contributed $270 million to gross revenues and a $7 million net loss to consolidated net earnings (loss) from the acquisition date to December 31, 2018.
Had the acquisition occurred on January 1, 2018, the additional working interest would have contributed an additional $64 million to gross revenues and $4 million to consolidated net earnings, which would have resulted in gross revenues of $39.66 billion and consolidated net earnings of $3.30 billion for the twelve months ended December 31, 2018.
| 56 2018 FOURTH QUARTER Suncor Energy Inc. | | |
18. OTHER TRANSACTIONS
On September 29, 2018, Suncor along with the other working interest partners in the Joslyn Oil Sands Mining Project, agreed to sell 100% of their respective working interests to Canadian Natural Resources Limited for gross proceeds of $225 million, $82.7 million net to Suncor. Suncor held a 36.75% working interest in Joslyn prior to the transaction. The working interest partners received cash proceeds of $100 million ($36.8 million net to Suncor) upon closing with the remaining $125 million ($45.9 million net to Suncor) to be received in equal instalments over the next five years. As a result, Suncor has recorded a long-term receivable of $36.7 million within the Other Assets line item and the first instalment of $9.2 million is recorded within the Accounts Receivable line item. The transaction resulted in a gain of $83 million in the Oil Sands segment.
On May 31, 2018, the company completed the previously announced transaction to acquire a 17.5% interest in the Fenja development project in Norway from Faroe Petroleum Norge AS for acquisition costs of US$55 million (approximately $70 million), plus interim settlement costs of $22 million under the acquisition method. This project was sanctioned by its owners in December 2017.
On March 23, 2018, Suncor completed an exchange of its northeast B.C. mineral landholdings, including associated production, and consideration of $52 million for a 37% equity interest in Canbriam Energy Inc. (Canbriam) (a private natural gas company). The investment was initially recorded at $277 million and is accounted for using the equity method of accounting. As a result of the asset transfer at that time, Suncor originally recognized a gain of $162 million in the Exploration and Production segment after eliminating a portion of the gain against the investment value. In the fourth quarter of 2018, the company wrote down its interest in Canbriam as a result of the company's assessment of expected future commodity prices and net cash flows, for a net loss in the year of $90 million after-tax. The remaining carrying value of the company's interest in Canbriam is nil.
19. SUBSEQUENT EVENT
Subsequent to the end of the year, the company received $300 million in risk mitigation proceeds for its Libyan assets (approximately $260 million after tax). The proceeds may be subject to a provisional repayment, which is dependent on the future performance and cash flows from Suncor's Libyan assets.
| | | 2018 FOURTH QUARTER Suncor Energy Inc. 57 |
SUPPLEMENTAL FINANCIAL AND OPERATING INFORMATION
QUARTERLY FINANCIAL SUMMARY
(unaudited)
| Three months ended | Twelve months ended | |||||||||||||||
| ($ millions, except per share amounts) | Dec 31 2018 | Sep 30 2018 | Jun 30 2018 | Mar 31 2018 | Dec 31 2017 | Dec 31 2018 | Dec 31 2017 | |||||||||
| | | | | | | | | | | | | | | | | |
Revenues and other income(A) | 8 945 | 10 863 | 10 428 | 8 750 | 9 014 | 38 986 | 32 079 | |||||||||
| | | | | | | | | | | | | | | | | |
Net (loss) earnings | ||||||||||||||||
| | ||||||||||||||||
Oil Sands | (393 | ) | 796 | 368 | 82 | 670 | 853 | 1 009 | ||||||||
| | ||||||||||||||||
Exploration and Production | (115 | ) | 217 | 311 | 395 | 217 | 808 | 732 | ||||||||
| | ||||||||||||||||
Refining and Marketing | 723 | 939 | 685 | 806 | 886 | 3 153 | 2 658 | |||||||||
| | ||||||||||||||||
Corporate, Energy Trading and Eliminations | (495 | ) | (140 | ) | (392 | ) | (494 | ) | (391 | ) | (1 521 | ) | 59 | |||
| | | | | | | | | | | | | | | | | |
| (280 | ) | 1 812 | 972 | 789 | 1 382 | 3 293 | 4 458 | |||||||||
| | | | | | | | | | | | | | | | | |
Operating (loss) earnings(B) | ||||||||||||||||
| | ||||||||||||||||
Oil Sands | (393 | ) | 736 | 368 | 82 | 615 | 793 | 954 | ||||||||
| | ||||||||||||||||
Exploration and Production | 108 | 217 | 311 | 262 | 231 | 898 | 746 | |||||||||
| | ||||||||||||||||
Refining and Marketing | 723 | 939 | 685 | 806 | 746 | 3 153 | 2 164 | |||||||||
| | ||||||||||||||||
Corporate, Energy Trading and Eliminations | 142 | (335 | ) | (174 | ) | (165 | ) | (282 | ) | (532 | ) | (676 | ) | |||
| | | | | | | | | | | | | | | | | |
| 580 | 1 557 | 1 190 | 985 | 1 310 | 4 312 | 3 188 | ||||||||||
| | | | | | | | | | | | | | | | | |
Funds from (used in) operations(B) | ||||||||||||||||
| | ||||||||||||||||
Oil Sands | 601 | 1 844 | 1 446 | 979 | 1 780 | 4 870 | 4 738 | |||||||||
| | ||||||||||||||||
Exploration and Production | 367 | 455 | 545 | 502 | 431 | 1 869 | 1 725 | |||||||||
| | ||||||||||||||||
Refining and Marketing | 826 | 1 119 | 884 | 965 | 935 | 3 794 | 2 841 | |||||||||
| | ||||||||||||||||
Corporate, Energy Trading and Eliminations | 213 | (279 | ) | (13 | ) | (282 | ) | (130 | ) | (361 | ) | (165 | ) | |||
| | | | | | | | | | | | | | | | | |
Total Funds from operations | 2 007 | 3 139 | 2 862 | 2 164 | 3 016 | 10 172 | 9 139 | |||||||||
| | | | | | | | | | | | | | | | | |
Change in non-cash working capital | 1 033 | 1 231 | (416 | ) | (1 440 | ) | (261 | ) | 408 | (173 | ) | |||||
| | | | | | | | | | | | | | | | | |
Cash flow provided by operating activities | 3 040 | 4 370 | 2 446 | 724 | 2 755 | 10 580 | 8 966 | |||||||||
| | | | | | | | | | | | | | | | | |
Per common share | ||||||||||||||||
| | ||||||||||||||||
Net (loss) earnings – basic | (0.18 | ) | 1.12 | 0.60 | 0.48 | 0.84 | 2.03 | 2.68 | ||||||||
| | ||||||||||||||||
Net (loss) earnings – diluted | (0.18 | ) | 1.11 | 0.59 | 0.48 | 0.84 | 2.02 | 2.68 | ||||||||
| | ||||||||||||||||
Operating earnings – basic(B) | 0.36 | 0.96 | 0.73 | 0.60 | 0.79 | 2.65 | 1.92 | |||||||||
| | ||||||||||||||||
Cash dividends – basic | 0.36 | 0.36 | 0.36 | 0.36 | 0.32 | 1.44 | 1.28 | |||||||||
| | ||||||||||||||||
Funds from operations – basic(B) | 1.26 | 1.94 | 1.75 | 1.32 | 1.83 | 6.27 | 5.50 | |||||||||
| | ||||||||||||||||
Cash flow provided by operating activities – basic | 1.90 | 2.70 | 1.50 | 0.44 | 1.67 | 6.54 | 3.76 | |||||||||
| | | | | | | | | | | | | | | | | |
| For the twelve months ended | ||||||||||||
| Dec 31 2018 | Sep 30 2018 | Jun 30 2018 | Mar 31 2018 | Dec 31 2017 | ||||||||
| | | | | | | | | | | | | |
Return on capital employed(B) | ||||||||||||
| | ||||||||||||
– excluding major projects in progress (%) | 8.2 | 10.4 | 9.5 | 7.8 | 8.6 | |||||||
| | ||||||||||||
– including major projects in progress (%) | 8.0 | 9.7 | 8.3 | 6.5 | 6.7 | |||||||
| | | | | | | | | | | | | |
- (A)
- Prior periods have been restated due to IFRS 15 adoption; see note 3 in the interim consolidated financial statements.
- (B)
- Non-GAAP financial measures. See the Operating Summary Information – Non-GAAP Financial Measures section of this Quarterly Report.
See accompanying footnotes and definitions to the quarterly operating summaries.
| 58 2018 FOURTH QUARTER Suncor Energy Inc. | | |
QUARTERLY OPERATING SUMMARY
(unaudited)
| Three months ended | Twelve months ended | |||||||||||||||
| Oil Sands | Dec 31 2018 | Sep 30 2018 | Jun 30 2018 | Mar 31 2018 | Dec 31 2017 | Dec 31 2018 | Dec 31 2017 | |||||||||
| | | | | | | | | | | | | | | | | |
Total Production (mbbls/d) | 740.8 | 651.7 | 547.6 | 571.7 | 621.2 | 628.6 | 563.7 | |||||||||
| | | | | | | | | | | | | | | | | |
Oil Sands operations | ||||||||||||||||
| | ||||||||||||||||
Upgraded product (sweet SCO, sour SCO and diesel) | 273.4 | 330.1 | 237.9 | 279.4 | 324.9 | 280.3 | 317.7 | |||||||||
| | ||||||||||||||||
Non-upgraded bitumen | 159.3 | 146.0 | 121.0 | 125.4 | 121.9 | 138.0 | 111.7 | |||||||||
| | | | | | | | | | | | | | | | | |
Oil Sands operations production | 432.7 | 476.1 | 358.9 | 404.8 | 446.8 | 418.3 | 429.4 | |||||||||
| | | | | | | | | | | | | | | | | |
Bitumen production (mbbls/d) | ||||||||||||||||
| | ||||||||||||||||
Mining | 278.3 | 323.4 | 195.4 | 241.6 | 296.7 | 258.8 | 305.4 | |||||||||
| | ||||||||||||||||
In Situ – Firebag | 197.2 | 211.0 | 201.9 | 205.8 | 208.5 | 204.0 | 181.5 | |||||||||
| | ||||||||||||||||
In Situ – MacKay River | 37.0 | 37.1 | 34.4 | 35.1 | 28.3 | 36.0 | 31.1 | |||||||||
| | | | | | | | | | | | | | | | | |
Total bitumen production | 512.5 | 571.5 | 431.7 | 482.5 | 533.5 | 498.8 | 518.0 | |||||||||
| | | | | | | | | | | | | | | | | |
Sales (mbbls/d) | ||||||||||||||||
| | ||||||||||||||||
Light sweet crude oil | 110.2 | 129.5 | 59.6 | 84.2 | 95.5 | 96.1 | 107.9 | |||||||||
| | ||||||||||||||||
Diesel | 27.6 | 34.7 | 32.4 | 20.4 | 21.1 | 28.8 | 27.5 | |||||||||
| | ||||||||||||||||
Light sour crude oil | 150.7 | 162.8 | 159.0 | 178.2 | 214.4 | 162.6 | 183.6 | |||||||||
| | | | | | | | | | | | | | | | | |
Upgraded product (SCO and diesel) | 288.5 | 327.0 | 251.0 | 282.8 | 331.0 | 287.5 | 319.0 | |||||||||
| | ||||||||||||||||
Non-upgraded bitumen | 172.0 | 131.4 | 113.7 | 118.2 | 130.7 | 134.0 | 110.6 | |||||||||
| | | | | | | | | | | | | | | | | |
Sales | 460.5 | 458.4 | 364.7 | 401.0 | 461.7 | 421.5 | 429.6 | |||||||||
| | | | | | | | | | | | | | | | | |
Cash operating costs – Average(1)(B) ($/bbl)* | ||||||||||||||||
| | ||||||||||||||||
Cash costs | 22.80 | 21.05 | 27.45 | 25.05 | 22.55 | 23.85 | 21.95 | |||||||||
| | ||||||||||||||||
Natural gas | 1.70 | 0.95 | 1.20 | 1.80 | 1.65 | 1.40 | 1.85 | |||||||||
| | | | | | | | | | | | | | | | | |
| 24.50 | 22.00 | 28.65 | 26.85 | 24.20 | 25.25 | 23.80 | ||||||||||
| | | | | | | | | | | | | | | | | |
Cash operating costs – Mining bitumen production only(1)(B) (C) ($/bbl) | ||||||||||||||||
| | ||||||||||||||||
Cash costs | 23.65 | 20.35 | 32.15 | 26.50 | 22.70 | 25.20 | 20.00 | |||||||||
| | ||||||||||||||||
Natural gas | 0.35 | 0.15 | 0.30 | 0.65 | 0.45 | 0.35 | 0.45 | |||||||||
| | | | | | | | | | | | | | | | | |
| 24.00 | 20.50 | 32.45 | 27.15 | 23.15 | 25.55 | 20.45 | ||||||||||
| | | | | | | | | | | | | | | | | |
Cash operating costs – In Situ bitumen production only(1)(B) ($/bbl) | ||||||||||||||||
| | ||||||||||||||||
Cash costs | 5.75 | 6.20 | 6.10 | 6.55 | 6.20 | 6.15 | 7.35 | |||||||||
| | ||||||||||||||||
Natural gas | 2.55 | 1.85 | 1.80 | 3.00 | 2.65 | 2.30 | 3.15 | |||||||||
| | | | | | | | | | | | | | | | | |
| 8.30 | 8.05 | 7.90 | 9.55 | 8.85 | 8.45 | 10.50 | ||||||||||
| | | | | | | | | | | | | | | | | |
- (B)
- Non-GAAP financial measures. See the Quarterly Operating Metrics Reconciliation and the Operating Summary Information – Non-GAAP Financial Measures sections of this Quarterly Report.
- (C)
- Cash operating costs – Mining bitumen production per barrel costs have been restated.
See accompanying footnotes and definitions to the quarterly operating summaries.
| | | 2018 FOURTH QUARTER Suncor Energy Inc. 59 |
QUARTERLY OPERATING SUMMARY (continued)
(unaudited)
| Three months ended | Twelve months ended | |||||||||||||||
| Oil Sands | Dec 31 2018 | Sep 30 2018 | Jun 30 2018 | Mar 31 2018 | Dec 31 2017 | Dec 31 2018 | Dec 31 2017 | |||||||||
| | | | | | | | | | | | | | | | | |
Fort Hills | ||||||||||||||||
| | ||||||||||||||||
Bitumen production (mbbls/d) | 98.5 | 69.4 | 70.9 | 29.8 | — | 67.4 | — | |||||||||
| | ||||||||||||||||
Internally upgraded bitumen from froth (mbbls/d) | — | — | — | (5.2 | ) | — | (1.3 | ) | — | |||||||
| | | | | | | | | | | | | | | | | |
Total Fort Hills Bitumen Production | 98.5 | 69.4 | 70.9 | 24.6 | — | 66.1 | — | |||||||||
| | | | | | | | | | | | | | | | | |
Bitumen sales (mbbls/d) | 94.6 | 61.6 | 64.0 | 8.1 | — | 57.3 | — | |||||||||
| | | | | | | | | | | | | | | | | |
Cash operating costs(1)(B) ($/bbl) | ||||||||||||||||
| | ||||||||||||||||
Cash costs | 23.85 | 32.55 | 27.60 | 50.45 | — | 30.00 | — | |||||||||
| | ||||||||||||||||
Natural gas | 1.00 | 0.90 | 0.95 | 3.20 | — | 1.20 | — | |||||||||
| | | | | | | | | | | | | | | | | |
| 24.85 | 33.45 | 28.55 | 53.65 | — | 31.20 | — | ||||||||||
| | | | | | | | | | | | | | | | | |
Syncrude | ||||||||||||||||
| | ||||||||||||||||
Sweet SCO production (mbbls/d) | 209.6 | 106.2 | 117.8 | 142.3 | 174.4 | 144.2 | 134.3 | |||||||||
| | | | | | | | | | | | | | | | | |
Bitumen production (mbbls/d) | 240.7 | 130.9 | 142.7 | 173.3 | 207.5 | 172.0 | 163.6 | |||||||||
| | ||||||||||||||||
Intermediate sour SCO (mbbls/d)(2) | 206.3 | 107.2 | 119.9 | 138.2 | 177.1 | 143.0 | 132.9 | |||||||||
| | | | | | | | | | | | | | | | | |
Cash operating costs(1)(B) ($/bbl) | ||||||||||||||||
| | ||||||||||||||||
Cash costs | 30.85 | 62.80 | 53.80 | 49.25 | 31.75 | 46.15 | 42.50 | |||||||||
| | ||||||||||||||||
Natural gas | 0.90 | 1.05 | 2.45 | 1.50 | 1.05 | 1.10 | 1.55 | |||||||||
| | | | | | | | | | | | | | | | | |
| 31.75 | 63.85 | 56.25 | 50.75 | 32.80 | 47.25 | 44.05 | ||||||||||
| | | | | | | | | | | | | | | | | |
- (B)
- Non-GAAP financial measures. See the Quarterly Operating Metrics Reconciliation and the Operating Summary Information – Non-GAAP Financial Measures sections of this Quarterly Report.
See accompanying footnotes and definitions to the quarterly operating summaries.
| 60 2018 FOURTH QUARTER Suncor Energy Inc. | | |
QUARTERLY OPERATING SUMMARY (continued)
(unaudited)
| Three months ended | Twelve months ended | |||||||||||||||
| Oil Sands Operating Netbacks(A)(B)(D) | Dec 31 2018 | Sep 30 2018 | Jun 30 2018 | Mar 31 2018 | Dec 31 2017 | Dec 31 2018 | Dec 31 2017 | |||||||||
| | | | | | | | | | | | | | | | | |
Bitumen ($/bbl) | ||||||||||||||||
| | ||||||||||||||||
Average price realized | 7.96 | 42.03 | 47.08 | 33.55 | 42.80 | 30.22 | 38.32 | |||||||||
| | ||||||||||||||||
Royalties | (0.06 | ) | (3.20 | ) | (3.27 | ) | (0.90 | ) | (1.02 | ) | (1.70 | ) | (0.71 | ) | ||
| | ||||||||||||||||
Transportation costs | (5.53 | ) | (5.41 | ) | (4.24 | ) | (5.98 | ) | (3.06 | ) | (5.52 | ) | (4.85 | ) | ||
| | ||||||||||||||||
Net operating expenses | (7.61 | ) | (7.01 | ) | (7.37 | ) | (8.75 | ) | (7.61 | ) | (7.68 | ) | (9.59 | ) | ||
| | | | | | | | | | | | | | | | | |
Operating netback | (5.24 | ) | 26.41 | 32.20 | 17.92 | 31.11 | 15.32 | 23.17 | ||||||||
| | | | | | | | | | | | | | | | | |
SCO and diesel ($/bbl) | ||||||||||||||||
| | ||||||||||||||||
Average price realized | 46.07 | 86.71 | 85.06 | 74.65 | 70.55 | 73.07 | 65.28 | |||||||||
| | ||||||||||||||||
Royalties | (0.91 | ) | (2.70 | ) | (2.60 | ) | (0.56 | ) | (1.14 | ) | (1.63 | ) | (0.98 | ) | ||
| | ||||||||||||||||
Transportation costs | (3.63 | ) | (3.76 | ) | (5.06 | ) | (4.14 | ) | (3.87 | ) | (4.10 | ) | (3.81 | ) | ||
| | ||||||||||||||||
Net operating expenses – bitumen | (23.72 | ) | (20.49 | ) | (27.52 | ) | (25.33 | ) | (21.70 | ) | (24.04 | ) | (21.08 | ) | ||
| | ||||||||||||||||
Net operating expenses – upgrading | (6.49 | ) | (5.03 | ) | (8.13 | ) | (6.05 | ) | (4.90 | ) | (6.32 | ) | (4.97 | ) | ||
| | | | | | | | | | | | | | | | | |
Operating netback | 11.32 | 54.73 | 41.75 | 38.57 | 38.94 | 36.98 | 34.44 | |||||||||
| | | | | | | | | | | | | | | | | |
Average Oil Sands operations ($/bbl) | ||||||||||||||||
| | ||||||||||||||||
Average price realized | 31.84 | 73.90 | 73.21 | 62.54 | 62.69 | 59.46 | 58.34 | |||||||||
| | ||||||||||||||||
Royalties | (0.59 | ) | (2.84 | ) | (2.81 | ) | (0.66 | ) | (1.11 | ) | (1.70 | ) | (0.91 | ) | ||
| | ||||||||||||||||
Transportation costs | (4.34 | ) | (4.23 | ) | (4.80 | ) | (4.68 | ) | (3.64 | ) | (4.55 | ) | (4.08 | ) | ||
| | ||||||||||||||||
Net operating expenses – bitumen and upgrading | (21.78 | ) | (20.21 | ) | (26.83 | ) | (24.71 | ) | (21.23 | ) | (23.15 | ) | (21.82 | ) | ||
| | | | | | | | | | | | | | | | | |
Operating netback | 5.13 | 46.62 | 38.77 | 32.49 | 36.71 | 30.06 | 31.53 | |||||||||
| | | | | | | | | | | | | | | | | |
Fort Hills ($/bbl) | ||||||||||||||||
| | ||||||||||||||||
Average price realized | 30.57 | 64.33 | 60.81 | 40.58 | — | 48.48 | — | |||||||||
| | ||||||||||||||||
Royalties | (1.41 | ) | (3.07 | ) | (0.73 | ) | (1.54 | ) | — | (1.67 | ) | — | ||||
| | ||||||||||||||||
Transportation costs | (10.31 | ) | (10.90 | ) | (8.95 | ) | (8.10 | ) | — | (10.01 | ) | — | ||||
| | ||||||||||||||||
Net operating expenses – bitumen | (28.79 | ) | (30.69 | ) | (22.73 | ) | (106.07 | ) | — | (30.32 | ) | — | ||||
| | | | | | | | | | | | | | | | | |
Operating netback | (9.94 | ) | 19.67 | 28.40 | (75.13 | ) | — | 6.48 | — | |||||||
| | | | | | | | | | | | | | | | | |
Syncrude ($/bbl) | ||||||||||||||||
| | ||||||||||||||||
Average price realized | 48.07 | 89.50 | 86.73 | 77.33 | 73.64 | 70.68 | 66.59 | |||||||||
| | ||||||||||||||||
Royalties | (1.53 | ) | (2.49 | ) | (2.41 | ) | (1.57 | ) | (7.94 | ) | (1.90 | ) | (4.32 | ) | ||
| | ||||||||||||||||
Transportation costs | (0.36 | ) | (0.70 | ) | (0.57 | ) | (0.48 | ) | (0.36 | ) | (0.49 | ) | (0.54 | ) | ||
| | ||||||||||||||||
Net operating expenses – bitumen and upgrading | (28.33 | ) | (62.61 | ) | (52.27 | ) | (45.30 | ) | (28.81 | ) | (43.81 | ) | (39.46 | ) | ||
| | | | | | | | | | | | | | | | | |
Operating netback | 17.85 | 23.70 | 31.48 | 29.98 | 36.53 | 24.48 | 22.27 | |||||||||
| | | | | | | | | | | | | | | | | |
- (A)
- Prior periods have been restated due to IFRS 15 adoption (see note 3 in the interim consolidated financial statements) as well as the removal of the impact of risk management activities. In addition, 2018 Fort Hills and Syncrude operating costs have been restated.
- (B)
- Non-GAAP financial measures. See the Quarterly Operating Metrics Reconciliation and the Operating Summary Information – Non-GAAP Financial Measures sections of this Quarterly Report.
- (D)
- Netbacks are based on sales volumes.
See accompanying footnotes and definitions to the quarterly operating summaries.
| | | 2018 FOURTH QUARTER Suncor Energy Inc. 61 |
QUARTERLY OPERATING SUMMARY (continued)
(unaudited)
| Three months ended | Twelve months ended | |||||||||||||||
| Exploration and Production | Dec 31 2018 | Sep 30 2018 | Jun 30 2018 | Mar 31 2018 | Dec 31 2017 | Dec 31 2018 | Dec 31 2017 | |||||||||
| | | | | | | | | | | | | | | | | |
Total Sales Volumes (mboe/d) | 83.1 | 96.5 | 110.2 | 121.9 | 104.8 | 102.8 | 120.8 | |||||||||
| | | | | | | | | | | | | | | | | |
Total Production (mboe/d) | 90.2 | 92.1 | 114.1 | 117.7 | 115.2 | 103.4 | 121.6 | |||||||||
| | | | | | | | | | | | | | | | | |
Production Volumes | ||||||||||||||||
| | ||||||||||||||||
Exploration and Production Canada | ||||||||||||||||
| | ||||||||||||||||
East Coast Canada | ||||||||||||||||
| | ||||||||||||||||
Terra Nova (mbbls/d) | 9.5 | 8.6 | 13.6 | 15.4 | 14.6 | 11.7 | 11.5 | |||||||||
| | ||||||||||||||||
Hibernia (mbbls/d) | 19.0 | 17.9 | 25.5 | 26.1 | 27.1 | 22.1 | 28.5 | |||||||||
| | ||||||||||||||||
White Rose (mbbls/d) | 3.7 | 8.0 | 6.0 | 8.8 | 10.6 | 6.6 | 11.4 | |||||||||
| | ||||||||||||||||
Hebron (mbbls/d) | 15.7 | 14.4 | 13.5 | 8.2 | 1.8 | 13.0 | 0.4 | |||||||||
| | ||||||||||||||||
North America Onshore (mboe/d) | — | — | — | 2.0 | 1.4 | 0.5 | 1.9 | |||||||||
| | | | | | | | | | | | | | | | | |
| 47.9 | 48.9 | 58.6 | 60.5 | 55.5 | 53.9 | 53.7 | ||||||||||
| | | | | | | | | | | | | | | | | |
Exploration and Production International | ||||||||||||||||
| | ||||||||||||||||
Buzzard (mboe/d) | 27.7 | 29.6 | 39.4 | 40.4 | 36.6 | 34.2 | 43.8 | |||||||||
| | ||||||||||||||||
Golden Eagle (mboe/d) | 10.7 | 12.0 | 12.6 | 14.3 | 17.9 | 12.4 | 19.6 | |||||||||
| | | | | | | | | | | | | | | | | |
United Kingdom (mboe/d) | 38.4 | 41.6 | 52.0 | 54.7 | 54.5 | 46.6 | 63.4 | |||||||||
| | ||||||||||||||||
Libya (mbbls/d)(3) | 3.9 | 1.6 | 3.5 | 2.5 | 5.2 | 2.9 | 4.5 | |||||||||
| | | | | | | | | | | | | | | | | |
| 42.3 | 43.2 | 55.5 | 57.2 | 59.7 | 49.5 | 67.9 | ||||||||||
| | | | | | | | | | | | | | | | | |
Netbacks(B)(D) | ||||||||||||||||
| | ||||||||||||||||
East Coast Canada ($/bbl) | ||||||||||||||||
| | ||||||||||||||||
Average price realized | 76.19 | 99.50 | 97.30 | 84.63 | 81.49 | 90.04 | 71.06 | |||||||||
| | ||||||||||||||||
Royalties | (5.04 | ) | (18.75 | ) | (13.02 | ) | (14.34 | ) | (13.21 | ) | (13.31 | ) | (14.26 | ) | ||
| | ||||||||||||||||
Transportation costs | (2.71 | ) | (2.28 | ) | (2.24 | ) | (1.84 | ) | (2.27 | ) | (2.22 | ) | (1.90 | ) | ||
| | ||||||||||||||||
Operating costs | (23.71 | ) | (16.06 | ) | (11.21 | ) | (9.70 | ) | (11.16 | ) | (14.43 | ) | (11.24 | ) | ||
| | | | | | | | | | | | | | | | | |
Operating netback | 44.73 | 62.41 | 70.83 | 58.75 | 54.85 | 60.08 | 43.66 | |||||||||
| | | | | | | | | | | | | | | | | |
United Kingdom ($/boe) | ||||||||||||||||
| | ||||||||||||||||
Average price realized | 85.31 | 94.28 | 93.88 | 83.22 | 76.46 | 89.10 | 67.25 | |||||||||
| | ||||||||||||||||
Transportation costs | (2.14 | ) | (2.22 | ) | (2.20 | ) | (2.14 | ) | (1.80 | ) | (2.18 | ) | (1.81 | ) | ||
| | ||||||||||||||||
Operating costs | (8.94 | ) | (6.04 | ) | (5.39 | ) | (5.36 | ) | (5.89 | ) | (6.27 | ) | (4.62 | ) | ||
| | | | | | | | | | | | | | | | | |
Operating netback | 74.23 | 86.02 | 86.29 | 75.72 | 68.77 | 80.65 | 60.82 | |||||||||
| | | | | | | | | | | | | | | | | |
- (B)
- Non-GAAP financial measures. See the Quarterly Operating Metrics Reconciliation and the Operating Summary Information – Non-GAAP Financial Measures sections of this Quarterly Report.
- (D)
- Netbacks are based on sales volumes.
See accompanying footnotes and definitions to the quarterly operating summaries.
| 62 2018 FOURTH QUARTER Suncor Energy Inc. | | |
QUARTERLY OPERATING SUMMARY (continued)
(unaudited)
| Three months ended | Twelve months ended | |||||||||||||||
| Refining and Marketing | Dec 31 2018 | Sep 30 2018 | Jun 30 2018 | Mar 31 2018 | Dec 31 2017 | Dec 31 2018 | Dec 31 2017 | |||||||||
| | | | | | | | | | | | | | | | | |
Refined product sales (mbbls/d) | 530.6 | 565.5 | 500.0 | 512.9 | 526.8 | 527.4 | 530.5 | |||||||||
| | ||||||||||||||||
Crude oil processed (mbbls/d) | 467.9 | 457.2 | 344.1 | 453.5 | 432.4 | 430.8 | 441.2 | |||||||||
| | ||||||||||||||||
Utilization of refining capacity (%) | 101 | 99 | 74 | 98 | 94 | 93 | 96 | |||||||||
| | | | | | | | | | | | | | | | | |
Refining margin ($/bbl)(B)(E) | 41.50 | 34.45 | 30.25 | 30.50 | 31.95 | 34.50 | 24.20 | |||||||||
| | ||||||||||||||||
Refining operating expense ($/bbl)(B) | 5.45 | 5.00 | 6.25 | 4.90 | 5.25 | 5.35 | 5.05 | |||||||||
| | | | | | | | | | | | | | | | | |
Eastern North America | ||||||||||||||||
| | ||||||||||||||||
Refined product sales (mbbls/d) | ||||||||||||||||
| | ||||||||||||||||
Transportation fuels | ||||||||||||||||
| | ||||||||||||||||
Gasoline | 117.8 | 122.0 | 117.8 | 113.6 | 121.1 | 117.8 | 117.5 | |||||||||
| | ||||||||||||||||
Distillate | 100.2 | 96.7 | 93.4 | 81.8 | 89.2 | 95.8 | 86.8 | |||||||||
| | | | | | | | | | | | | | | | | |
Total transportation fuel sales | 218.0 | 218.7 | 211.2 | 195.4 | 210.3 | 213.6 | 204.3 | |||||||||
| | ||||||||||||||||
Petrochemicals | 10.3 | 9.0 | 11.8 | 14.1 | 10.5 | 11.3 | 12.2 | |||||||||
| | ||||||||||||||||
Asphalt | 15.2 | 20.5 | 13.3 | 13.1 | 15.8 | 15.5 | 16.8 | |||||||||
| | ||||||||||||||||
Other | 25.7 | 26.5 | 25.9 | 36.6 | 31.4 | 26.0 | 33.4 | |||||||||
| | | | | | | | | | | | | | | | | |
Total refined product sales | 269.2 | 274.7 | 262.2 | 259.2 | 268.0 | 266.4 | 266.7 | |||||||||
| | | | | | | | | | | | | | | | | |
Crude oil supply and refining | ||||||||||||||||
| | ||||||||||||||||
Processed at refineries (mbbls/d) | 221.0 | 211.6 | 182.0 | 217.8 | 188.7 | 208.1 | 206.4 | |||||||||
| | ||||||||||||||||
Utilization of refining capacity (%) | 100 | 95 | 82 | 98 | 85 | 94 | 93 | |||||||||
| | | | | | | | | | | | | | | | | |
Western North America | ||||||||||||||||
| | ||||||||||||||||
Refined product sales (mbbls/d) | ||||||||||||||||
| | ||||||||||||||||
Transportation fuels | ||||||||||||||||
| | ||||||||||||||||
Gasoline | 127.8 | 139.0 | 124.2 | 120.1 | 125.7 | 127.8 | 125.4 | |||||||||
| | ||||||||||||||||
Distillate | 109.5 | 121.0 | 88.3 | 109.9 | 111.7 | 107.6 | 112.5 | |||||||||
| | | | | | | | | | | | | | | | | |
Total transportation fuel sales | 237.3 | 260.0 | 212.5 | 230.0 | 237.4 | 235.4 | 237.9 | |||||||||
| | ||||||||||||||||
Asphalt | 11.3 | 16.1 | 14.3 | 11.3 | 9.3 | 13.3 | 12.3 | |||||||||
| | ||||||||||||||||
Other | 12.8 | 14.7 | 11.0 | 12.4 | 12.1 | 12.3 | 13.6 | |||||||||
| | | | | | | | | | | | | | | | | |
Total refined product sales | 261.4 | 290.8 | 237.8 | 253.7 | 258.8 | 261.0 | 263.8 | |||||||||
| | | | | | | | | | | | | | | | | |
Crude oil supply and refining | ||||||||||||||||
| | ||||||||||||||||
Processed at refineries (mbbls/d) | 246.9 | 245.6 | 162.1 | 235.7 | 243.7 | 222.7 | 234.8 | |||||||||
| | ||||||||||||||||
Utilization of refining capacity (%) | 103 | 102 | 68 | 98 | 102 | 93 | 98 | |||||||||
| | | | | | | | | | | | | | | | | |
- (B)
- Non-GAAP financial measures. See the Quarterly Operating Metrics Reconciliation and the Operating Summary Information – Non-GAAP Financial Measures sections of this Quarterly Report.
- (E)
- Refining Margins are a non-GAAP measure, and have been restated to remove the impact of risk management activity.
See accompanying footnotes and definitions to the quarterly operating summaries.
| | | 2018 FOURTH QUARTER Suncor Energy Inc. 63 |
QUARTERLY OPERATING METRICS RECONCILIATION
(unaudited)
Oil Sands Netbacks(A)(B)
($ millions, except per barrel amounts)
For the quarter ended December 31, 2018 | Bitumen | SCO and Diesel | Oil Sands Operations | Fort Hills | Syncrude | Other(4) | Oil Sands Segment | |||||||||
| | | | | | | | | | | | | | | | |
Operating revenues | 405 | 1 326 | 1 731 | 508 | 940 | (30 | ) | 3 149 | ||||||||
| | ||||||||||||||||
Other income (loss) | — | 76 | 76 | 111 | 93 | — | 280 | |||||||||
| | ||||||||||||||||
Purchases of crude oil and products | (267 | ) | (16 | ) | (283 | ) | (218 | ) | (14 | ) | — | (515 | ) | |||
| | ||||||||||||||||
Gross realization adjustment(5) | (12 | ) | (164 | ) | (176 | ) | (136 | ) | (93 | ) | ||||||
| | | | | | | | | | | | | | | | | |
Gross realizations | 126 | 1 222 | 1 348 | 265 | 926 | |||||||||||
| | ||||||||||||||||
Royalties | (1 | ) | (24 | ) | (25 | ) | (12 | ) | (30 | ) | — | (67 | ) | |||
| | ||||||||||||||||
Transportation | (88 | ) | (116 | ) | (204 | ) | (106 | ) | (9 | ) | — | (319 | ) | |||
| | ||||||||||||||||
Transportation adjustment(6) | — | 20 | 20 | 16 | 2 | |||||||||||
| | | | | | | | | | | | | | | | | |
Net transportation expenses | (88 | ) | (96 | ) | (184 | ) | (90 | ) | (7 | ) | — | |||||
| | ||||||||||||||||
Operating, selling and general (OS&G) | (167 | ) | (949 | ) | (1,116 | ) | (291 | ) | (619 | ) | 30 | (1 996 | ) | |||
| | ||||||||||||||||
OS&G adjustment(7) | 47 | 147 | 194 | 41 | 73 | |||||||||||
| | | | | | | | | | | | | | | | | |
Net operating expenses | (120 | ) | (802 | ) | (922 | ) | (250 | ) | (546 | ) | ||||||
| | | | | | | | | | | | | | | | | |
Gross (loss) profit | (83 | ) | 300 | 217 | (87 | ) | 343 | |||||||||
| | ||||||||||||||||
Sales volumes (mbbls) | 15 825 | 26 545 | 42 370 | 8 706 | 19 286 | |||||||||||
| | | | | | | | | | | | | | | | | |
Operating netback per barrel | (5.24 | ) | 11.32 | 5.13 | (9.94 | ) | 17.85 | |||||||||
| | | | | | | | | | | | | | | | |
For the quarter ended September 30, 2018 | Bitumen | SCO and Diesel | Oil Sands Operations | Fort Hills | Syncrude | Other(4) | Oil Sands Segment | |||||||||
| | | | | | | | | | | | | | | | |
Operating revenues | 729 | 2 696 | 3 425 | 532 | 884 | (26 | ) | 4 815 | ||||||||
| | ||||||||||||||||
Other (loss) income | — | (8 | ) | (8 | ) | (2 | ) | 4 | — | (6 | ) | |||||
| | ||||||||||||||||
Purchases of crude oil and products | (211 | ) | (15 | ) | (226 | ) | (143 | ) | (10 | ) | 1 | (378 | ) | |||
| | ||||||||||||||||
Gross realization adjustment(5) | (10 | ) | (63 | ) | (73 | ) | (23 | ) | (4 | ) | ||||||
| | | | | | | | | | | | | | | | | |
Gross realizations | 508 | 2 610 | 3 118 | 364 | 874 | |||||||||||
| | ||||||||||||||||
Royalties | (39 | ) | (81 | ) | (120 | ) | (17 | ) | (24 | ) | — | (161 | ) | |||
| | ||||||||||||||||
Transportation | (65 | ) | (152 | ) | (217 | ) | (78 | ) | (13 | ) | — | (308 | ) | |||
| | ||||||||||||||||
Transportation adjustment(6) | — | 39 | 39 | 17 | 6 | |||||||||||
| | | | | | | | | | | | | | | | | |
Net transportation expenses | (65 | ) | (113 | ) | (178 | ) | (61 | ) | (7 | ) | ||||||
| | ||||||||||||||||
Operating, selling and general (OS&G) | (119 | ) | (915 | ) | (1 034 | ) | (214 | ) | (635 | ) | 29 | (1 854 | ) | |||
| | ||||||||||||||||
OS&G adjustment(7) | 35 | 145 | 180 | 40 | 24 | |||||||||||
| | | | | | | | | | | | | | | | | |
Net operating expenses | (84 | ) | (770 | ) | (854 | ) | (174 | ) | (611 | ) | ||||||
| | | | | | | | | | | | | | | | | |
Gross profit | 320 | 1 646 | 1 966 | 112 | 232 | |||||||||||
| | ||||||||||||||||
Sales volumes (mbbls) | 12 092 | 30 080 | 42 172 | 5 664 | 9 769 | |||||||||||
| | | | | | | | | | | | | | | | | |
Operating netback per barrel | 26.41 | 54.73 | 46.62 | 19.67 | 23.70 | |||||||||||
| | | | | | | | | | | | | | | | |
- (A)
- Prior periods have been restated due to IFRS 15 adoption (see note 3 in the interim consolidated financial statements) as well as the removal of the impact of risk management activities. In addition, 2018 Fort Hills and Syncrude operating costs have been restated.
- (B)
- Non-GAAP financial measures. See the Operating Summary Information – Non-GAAP Financial Measures section of this Quarterly Report.
See accompanying footnotes and definitions to the quarterly operating summaries.
| 64 2018 FOURTH QUARTER Suncor Energy Inc. | | |
QUARTERLY OPERATING METRICS RECONCILIATION (continued)
(unaudited)
Oil Sands Netbacks(A)(B)
($ millions, except per barrel amounts)
For the quarter ended June 30, 2018 | Bitumen | SCO and Diesel | Oil Sands Operations | Fort Hills | Syncrude | Other(4) | Oil Sands Segment | |||||||||
| | | | | | | | | | | | | | | | |
Operating revenues | 703 | 2 020 | 2 723 | 558 | 938 | (39 | ) | 4 180 | ||||||||
| | ||||||||||||||||
Other income (loss) | 2 | (11 | ) | (9 | ) | (10 | ) | 36 | — | 17 | ||||||
| | ||||||||||||||||
Purchases of crude oil and products | (204 | ) | (13 | ) | (217 | ) | (177 | ) | (8 | ) | 2 | (400 | ) | |||
| | ||||||||||||||||
Gross realization adjustment(5) | (14 | ) | (54 | ) | (68 | ) | (16 | ) | (36 | ) | ||||||
| | | | | | | | | | | | | | | | | |
Gross realizations | 487 | 1 942 | 2 429 | 355 | 930 | |||||||||||
| | ||||||||||||||||
Royalties | (34 | ) | (60 | ) | (94 | ) | (4 | ) | (26 | ) | — | (124 | ) | |||
| | ||||||||||||||||
Transportation | (44 | ) | (148 | ) | (192 | ) | (87 | ) | (12 | ) | — | (291 | ) | |||
| | ||||||||||||||||
Transportation adjustment(6) | — | 33 | 33 | 34 | 6 | |||||||||||
| | | | | | | | | | | | | | | | | |
Net transportation expenses | (44 | ) | (115 | ) | (159 | ) | (53 | ) | (6 | ) | ||||||
| | ||||||||||||||||
OS&G | (113 | ) | (981 | ) | (1 094 | ) | (184 | ) | (608 | ) | 38 | (1 848 | ) | |||
| | ||||||||||||||||
OS&G adjustment(7) | 37 | 166 | 203 | 51 | 48 | |||||||||||
| | | | | | | | | | | | | | | | | |
Net operating expenses | (76 | ) | (815 | ) | (891 | ) | (133 | ) | (560 | ) | ||||||
| | | | | | | | | | | | | | | | | |
Gross profit | 333 | 952 | 1 285 | 165 | 338 | |||||||||||
| | ||||||||||||||||
Sales volumes (mbbls) | 10 351 | 22 838 | 33 189 | 5 828 | 10 718 | |||||||||||
| | | | | | | | | | | | | | | | | |
Operating netback per barrel | 32.20 | 41.75 | 38.77 | 28.40 | 31.48 | |||||||||||
| | | | | | | | | | | | | | | | |
For the quarter ended March 31, 2018 | Bitumen | SCO and Diesel | Oil Sands Operations | Fort Hills | Syncrude | Other(4) | Oil Sands Segment | |||||||||
| | | | | | | | | | | | | | | | |
Operating revenues | 572 | 1 960 | 2 532 | 77 | 1 003 | (13 | ) | 3 599 | ||||||||
| | ||||||||||||||||
Other (loss) income | (4 | ) | — | (4 | ) | (2 | ) | 3 | — | (3 | ) | |||||
| | ||||||||||||||||
Purchases of crude oil and products | (211 | ) | (35 | ) | (246 | ) | (17 | ) | (16 | ) | 9 | (270 | ) | |||
| | ||||||||||||||||
Gross realization adjustment(5) | — | (25 | ) | (25 | ) | (28 | ) | — | ||||||||
| | | | | | | | | | | | | | | | | |
Gross realizations | 357 | 1 900 | 2 257 | 30 | 990 | |||||||||||
| | ||||||||||||||||
Royalties | (10 | ) | (14 | ) | (24 | ) | (2 | ) | (20 | ) | — | (46 | ) | |||
| | ||||||||||||||||
Transportation | (64 | ) | (126 | ) | (190 | ) | (26 | ) | (10 | ) | — | (226 | ) | |||
| | ||||||||||||||||
Transportation adjustment(6) | — | 21 | 21 | 20 | 4 | |||||||||||
| | | | | | | | | | | | | | | | | |
Net transportation expenses | (64 | ) | (105 | ) | (169 | ) | (6 | ) | (6 | ) | ||||||
| | ||||||||||||||||
OS&G | (127 | ) | (945 | ) | (1 072 | ) | (143 | ) | (661 | ) | 4 | (1 872 | ) | |||
| | ||||||||||||||||
OS&G adjustment(7) | 34 | 146 | 180 | 66 | 81 | |||||||||||
| | | | | | | | | | | | | | | | | |
Net operating expenses | (93 | ) | (799 | ) | (892 | ) | (77 | ) | (580 | ) | ||||||
| | | | | | | | | | | | | | | | | |
Gross profit (loss) | 190 | 982 | 1 172 | (55 | ) | 384 | ||||||||||
| | ||||||||||||||||
Sales volumes (mbbls) | 10 635 | 25 453 | 36 088 | 729 | 12 810 | |||||||||||
| | | | | | | | | | | | | | | | | |
Operating netback per barrel | 17.92 | 38.57 | 32.49 | (75.13 | ) | 29.98 | ||||||||||
| | | | | | | | | | | | | | | | |
- (A)
- Prior periods have been restated due to IFRS 15 adoption (see note 3 in the interim consolidated financial statements) as well as the removal of the impact of risk management activities.
- (B)
- Non-GAAP financial measures. See the Operating Summary Information – Non-GAAP Financial Measures section of this Quarterly Report.
See accompanying footnotes and definitions to the quarterly operating summaries.
| | | 2018 FOURTH QUARTER Suncor Energy Inc. 65 |
QUARTERLY OPERATING METRICS RECONCILIATION (continued)
(unaudited)
Oil Sands Netbacks(A)(B)
($ millions, except per barrel amounts)
For the quarter ended December 31, 2017 | Bitumen | SCO and Diesel | Oil Sands Operations | Syncrude | Other(4) | Oil Sands Segment | ||||||||
| | | | | | | | | | | | | | |
Operating revenues | 710 | 2 235 | 2 945 | 1 202 | 1 | 4 148 | ||||||||
| | ||||||||||||||
Other (loss) income | (10 | ) | (8 | ) | (18 | ) | 79 | — | 61 | |||||
| | ||||||||||||||
Purchases of crude oil and products | (179 | ) | (38 | ) | (217 | ) | (14 | ) | (2 | ) | (233 | ) | ||
| | ||||||||||||||
Gross realization adjustment(5) | (7 | ) | (40 | ) | (47 | ) | (85 | ) | ||||||
| | | | | | | | | | | | | | | |
Gross realizations | 514 | 2 149 | 2 663 | 1 182 | ||||||||||
| | ||||||||||||||
Royalties | (12 | ) | (35 | ) | (47 | ) | (128 | ) | — | (175 | ) | |||
| | ||||||||||||||
Transportation | (39 | ) | (144 | ) | (183 | ) | (18 | ) | — | (201 | ) | |||
| | ||||||||||||||
Transportation adjustment(6) | 3 | 26 | 29 | 12 | ||||||||||
| | | | | | | | | | | | | | | |
Net transportation expenses | (36 | ) | (118 | ) | (154 | ) | (6 | ) | ||||||
| | ||||||||||||||
OS&G | (119 | ) | (958 | ) | (1 077 | ) | (536 | ) | (3 | ) | (1 616 | ) | ||
| | ||||||||||||||
OS&G adjustment(7) | 27 | 148 | 175 | 74 | ||||||||||
| | | | | | | | | | | | | | | |
Net operating expenses | (92 | ) | (810 | ) | (902 | ) | (462 | ) | ||||||
| | | | | | | | | | | | | | | |
Gross profit | 374 | 1 186 | 1 560 | 586 | ||||||||||
| | ||||||||||||||
Sales volumes (mbbls) | 12 019 | 30 454 | 42 473 | 16 049 | ||||||||||
| | | | | | | | | | | | | | | |
Operating netback per barrel | 31.11 | 38.94 | 36.71 | 36.53 | ||||||||||
| | | | | | | | | | | | | | |
For the year ended December 31, 2018 | Bitumen | SCO and Diesel | Oil Sands Operations | Fort Hills | Syncrude | Other(4) | Oil Sands Segment | |||||||||
| | | | | | | | | | | | | | | | |
Operating revenues | 2 409 | 8 002 | 10 411 | 1 675 | 3 765 | (108 | ) | 15 743 | ||||||||
| | ||||||||||||||||
Other (loss) income | (2 | ) | 57 | 55 | 97 | 136 | — | 288 | ||||||||
| | ||||||||||||||||
Purchases of crude oil and products | (893 | ) | (79 | ) | (972 | ) | (555 | ) | (48 | ) | 12 | (1 563 | ) | |||
| | ||||||||||||||||
Gross realization adjustment(5) | (36 | ) | (306 | ) | (342 | ) | (203 | ) | (133 | ) | ||||||
| | | | | | | | | | | | | | | | | |
Gross realizations | 1 478 | 7 674 | 9 152 | 1 014 | 3 720 | |||||||||||
| | ||||||||||||||||
Royalties | (84 | ) | (179 | ) | (263 | ) | (35 | ) | (100 | ) | — | (398 | ) | |||
| | ||||||||||||||||
Transportation | (261 | ) | (542 | ) | (803 | ) | (297 | ) | (44 | ) | — | (1 144 | ) | |||
| | ||||||||||||||||
Transportation adjustment(6) | — | 113 | 113 | 87 | 18 | |||||||||||
| | | | | | | | | | | | | | | | | |
Net transportation expenses | (261 | ) | (429 | ) | (690 | ) | (210 | ) | (26 | ) | ||||||
| | ||||||||||||||||
OS&G | (526 | ) | (3 790 | ) | (4 316 | ) | (832 | ) | (2 523 | ) | 101 | (7 570 | ) | |||
| | ||||||||||||||||
OS&G adjustment(7) | 153 | 604 | 757 | 197 | 226 | |||||||||||
| | | | | | | | | | | | | | | | | |
Net operating expenses | (373 | ) | (3 186 | ) | (3 559 | ) | (635 | ) | (2 297 | ) | ||||||
| | | | | | | | | | | | | | | | | |
Gross profit | 760 | 3 880 | 4 640 | 134 | 1 297 | |||||||||||
| | ||||||||||||||||
Sales volumes (mbbls) | 48 903 | 104 916 | 153 819 | 20 927 | 52 583 | |||||||||||
| | | | | | | | | | | | | | | | | |
Operating netback per barrel | 15.32 | 36.98 | 30.06 | 6.48 | 24.48 | |||||||||||
| | | | | | | | | | | | | | | | |
- (A)
- Prior periods have been restated due to IFRS 15 adoption (see note 3 in the interim consolidated financial statements) as well as the removal of the impact of risk management activities.
- (B)
- Non-GAAP financial measures. See the Operating Summary Information – Non-GAAP Financial Measures section of this Quarterly Report.
See accompanying footnotes and definitions to the quarterly operating summaries.
| 66 2018 FOURTH QUARTER Suncor Energy Inc. | | |
QUARTERLY OPERATING METRICS RECONCILIATION (continued)
(unaudited)
Oil Sands Netbacks(A)
($ millions, except per barrel amounts)
For the year ended December 31, 2017 | Bitumen | SCO and Diesel | Oil Sands Operations | Syncrude | Other(4) | Oil Sands Segment | ||||||||
| | | | | | | | | | | | | | |
Operating revenues | 2 031 | 7 898 | 9 929 | 3 341 | 4 | 13 274 | ||||||||
| | ||||||||||||||
Other income (loss) | 9 | (9 | ) | — | 82 | 4 | 86 | |||||||
| | ||||||||||||||
Purchases of crude oil and products | (458 | ) | (99 | ) | (557 | ) | (61 | ) | (5 | ) | (623 | ) | ||
| | ||||||||||||||
Gross realization adjustment(5) | (36 | ) | (187 | ) | (223 | ) | (98 | ) | ||||||
| | | | | | | | | | | | | | | |
Gross realizations | 1 546 | 7 603 | 9 149 | 3 264 | ||||||||||
| | ||||||||||||||
Royalties | (28 | ) | (115 | ) | (143 | ) | (212 | ) | — | (355 | ) | |||
| | ||||||||||||||
Transportation | (202 | ) | (563 | ) | (765 | ) | (62 | ) | — | (827 | ) | |||
| | ||||||||||||||
Transportation adjustment(6) | 7 | 120 | 127 | 35 | ||||||||||
| | | | | | | | | | | | | | | |
Net transportation expenses | (195 | ) | (443 | ) | (638 | ) | (27 | ) | ||||||
| | ||||||||||||||
OS&G | (484 | ) | (3 604 | ) | (4 088 | ) | (2 196 | ) | 27 | (6 257 | ) | |||
| | ||||||||||||||
OS&G adjustment(7) | 96 | 569 | 665 | 262 | ||||||||||
| | | | | | | | | | | | | | | |
Net operating expenses | (388 | ) | (3 035 | ) | (3 423 | ) | (1 934 | ) | ||||||
| | | | | | | | | | | | | | | |
Gross profit | 935 | 4 010 | 4 945 | 1 091 | ||||||||||
| | ||||||||||||||
Sales volumes (mbbls) | 40 365 | 116 451 | 156 816 | 49 022 | ||||||||||
| | | | | | | | | | | | | | | |
Operating netback per barrel | 23.17 | 34.44 | 31.53 | 22.27 | ||||||||||
| | | | | | | | | | | | | | |
Syncrude Cash Operating Costs(B)
($ millions, except per barrel amounts)
| Three months ended | Twelve months ended | |||||||||||||||
| Dec 31 2018 | Sept 30 2018 | June 30 2018 | Mar 31 2018 | Dec 31 2017 | Dec 31 2018 | Dec 31 2017 | ||||||||||
| | | | | | | | | | | | | | | | |
Syncrude OS&G | 619 | 635 | 608 | 661 | 536 | 2 523 | 2 195 | |||||||||
| | ||||||||||||||||
Non-production costs(8) | (7 | ) | (11 | ) | (5 | ) | (10 | ) | (10 | ) | (33 | ) | (37 | ) | ||
| | | | | | | | | | | | | | | | | |
Syncrude cash operating costs | 612 | 624 | 603 | 651 | 526 | 2 490 | 2 158 | |||||||||
| | ||||||||||||||||
Syncrude sales volumes (mbbls) | 19 286 | 9 769 | 10 718 | 12 810 | 16 049 | 52 583 | 49 022 | |||||||||
| | | | | | | | | | | | | | | | | |
Syncrude cash operating costs ($/bbl) | 31.75 | 63.85 | 56.25 | 50.75 | 32.80 | 47.25 | 44.05 | |||||||||
| | | | | | | | | | | | | | | | |
- (A)
- Prior periods have been restated due to IFRS 15 adoption (see note 3 in the interim consolidated financial statements) as well as the removal of the impact of risk management activities.
- (B)
- Non-GAAP financial measures. See the Operating Summary Information – Non-GAAP Financial Measures section of this Quarterly Report.
See accompanying footnotes and definitions to the quarterly operating summaries.
| | | 2018 FOURTH QUARTER Suncor Energy Inc. 67 |
QUARTERLY OPERATING METRICS RECONCILIATION (continued)
(unaudited)
Exploration and Production Netbacks(B)
($ millions, except per barrel amounts)
For the quarter ended December 31, 2018 | United Kingdom | East Coast Canada | Other(9) | E&P Segment | ||||||
| | | | | | | | | | |
Operating revenues | 301 | 286 | 184 | 771 | ||||||
| | ||||||||||
Royalties | — | (19 | ) | (120 | ) | (139 | ) | |||
| | ||||||||||
Transportation | (8 | ) | (10 | ) | (1 | ) | (19 | ) | ||
| | ||||||||||
OS&G | (39 | ) | (101 | ) | (14 | ) | (154 | ) | ||
| | ||||||||||
Non-production costs(10) | 8 | 12 | ||||||||
| | | | | | | | | | | |
Gross realizations | 262 | 168 | ||||||||
| | ||||||||||
Sales volumes (mboe) | 3 531 | 3 758 | ||||||||
| | | | | | | | | | | |
Operating netback per barrel | 74.23 | 44.73 | ||||||||
| | | | | | | | | | |
For the quarter ended September 30, 2018 | United Kingdom | East Coast Canada | Other(9) | E&P Segment | ||||||
| | | | | | | | | | |
Operating revenues | 361 | 488 | 100 | 949 | ||||||
| | ||||||||||
Royalties | — | (91 | ) | (74 | ) | (165 | ) | |||
| | ||||||||||
Transportation | (8 | ) | (12 | ) | — | (20 | ) | |||
| | ||||||||||
OS&G | (27 | ) | (90 | ) | (8 | ) | (125 | ) | ||
| | ||||||||||
Non-production costs(10) | 3 | 11 | ||||||||
| | | | | | | | | | | |
Gross realizations | 329 | 306 | ||||||||
| | ||||||||||
Sales volumes (mboe) | 3 827 | 4 905 | ||||||||
| | | | | | | | | | | |
Operating netback per barrel | 86.02 | 62.41 | ||||||||
| | | | | | | | | | |
For the quarter ended June 30, 2018 | United Kingdom | East Coast Canada | Other(9) | E&P Segment | ||||||
| | | | | | | | | | |
Operating revenues | 444 | 484 | 204 | 1 132 | ||||||
| | ||||||||||
Royalties | — | (65 | ) | (122 | ) | (187 | ) | |||
| | ||||||||||
Transportation | (10 | ) | (11 | ) | (1 | ) | (22 | ) | ||
| | ||||||||||
OS&G | (30 | ) | (69 | ) | (14 | ) | (113 | ) | ||
| | ||||||||||
Non-production costs(10) | 4 | 13 | ||||||||
| | | | | | | | | | | |
Gross realizations | 408 | 352 | ||||||||
| | ||||||||||
Sales volumes (mboe) | 4 728 | 4 973 | ||||||||
| | | | | | | | | | | |
Operating netback per barrel | 86.29 | 70.83 | ||||||||
| | | | | | | | | | |
- (B)
- Non-GAAP financial measures. See the Operating Summary Information – Non-GAAP Financial Measures section of this Quarterly Report.
See accompanying footnotes and definitions to the quarterly operating summaries.
| 68 2018 FOURTH QUARTER Suncor Energy Inc. | | |
QUARTERLY OPERATING METRICS RECONCILIATION (continued)
(unaudited)
Exploration and Production Netbacks(B)
($ millions, except per barrel amounts)
For the quarter ended March 31, 2018 | United Kingdom | East Coast Canada | Other(9) | E&P Segment | ||||||
| | | | | | | | | | |
Operating revenues | 409 | 478 | 130 | 1 017 | ||||||
| | ||||||||||
Royalties | — | (82 | ) | (79 | ) | (161 | ) | |||
| | ||||||||||
Transportation | (11 | ) | (10 | ) | (3 | ) | (24 | ) | ||
| | ||||||||||
OS&G | (32 | ) | (68 | ) | (10 | ) | (110 | ) | ||
| | ||||||||||
Non-production costs(10) | 7 | 14 | ||||||||
| | | | | | | | | | | |
Gross realizations | 373 | 332 | ||||||||
| | ||||||||||
Sales volumes (mboe) | 4 920 | 5 647 | ||||||||
| | | | | | | | | | | |
Operating netback per barrel | 75.72 | 58.75 | ||||||||
| | | | | | | | | | |
For the quarter ended December 31, 2017 | United Kingdom | East Coast Canada | Other(9) | E&P Segment | ||||||
| | | | | | | | | | |
Operating revenues | 383 | 328 | 238 | 949 | ||||||
| | ||||||||||
Royalties | — | (53 | ) | (147 | ) | (200 | ) | |||
| | ||||||||||
Transportation | (9 | ) | (9 | ) | (2 | ) | (20 | ) | ||
| | ||||||||||
OS&G | (36 | ) | (55 | ) | (10 | ) | (101 | ) | ||
| | ||||||||||
Non-production costs(10) | 7 | 10 | ||||||||
| | | | | | | | | | | |
Gross realizations | 345 | 221 | ||||||||
| | ||||||||||
Sales volumes (mboe) | 5 011 | 4 023 | ||||||||
| | | | | | | | | | | |
Operating netback per barrel | 68.77 | 54.85 | ||||||||
| | | | | | | | | | |
For the twelve months ended December 31, 2018 | United Kingdom | East Coast Canada | Other(9) | E&P Segment | ||||||
| | | | | | | | | | |
Operating revenues | 1 515 | 1 736 | 618 | 3 869 | ||||||
| | ||||||||||
Royalties | — | (257 | ) | (395 | ) | (652 | ) | |||
| | ||||||||||
Transportation | (37 | ) | (43 | ) | (5 | ) | (85 | ) | ||
| | ||||||||||
OS&G | (129 | ) | (328 | ) | (46 | ) | (503 | ) | ||
| | ||||||||||
Non-production costs(10) | 23 | 50 | ||||||||
| | | | | | | | | | | |
Gross realizations | 1 372 | 1 158 | ||||||||
| | ||||||||||
Sales volumes (mboe) | 17 006 | 19 283 | ||||||||
| | | | | | | | | | | |
Operating netback per barrel | 80.65 | 60.08 | ||||||||
| | | | | | | | | | |
- (B)
- Non-GAAP financial measures. See the Operating Summary Information – Non-GAAP Financial Measures section of this Quarterly Report.
See accompanying footnotes and definitions to the quarterly operating summaries.
| | | 2018 FOURTH QUARTER Suncor Energy Inc. 69 |
QUARTERLY OPERATING METRICS RECONCILIATION (continued)
(unaudited)
Exploration and Production Netbacks(B)
($ millions, except per barrel amounts)
For the twelve months ended December 31, 2017 | United Kingdom | East Coast Canada | Other(9) | E&P Segment | ||||||
| | | | | | | | | | |
Operating revenues | 1 557 | 1 323 | 607 | 3 487 | ||||||
| | ||||||||||
Royalties | — | (266 | ) | (310 | ) | (576 | ) | |||
| | ||||||||||
Transportation | (42 | ) | (35 | ) | (9 | ) | (86 | ) | ||
| | ||||||||||
OS&G | (127 | ) | (248 | ) | (47 | ) | (422 | ) | ||
| | ||||||||||
Non-production costs(10) | 20 | 39 | ||||||||
| | | | | | | | | | | |
Gross realizations | 1 408 | 813 | ||||||||
| | ||||||||||
Sales volumes (mboe) | 23 157 | 18 623 | ||||||||
| | | | | | | | | | | |
Operating netback per barrel | 60.82 | 43.66 | ||||||||
| | | | | | | | | | |
Refining and Marketing(A)(E)
($ millions except per barrel amounts)
| Three months ended | Twelve months ended | |||||||||||||||
| Dec 31 2018 | Sep 30 2018 | Jun 30 2018 | Mar 31 2018 | Dec 31 2017 | Dec 31 2018 | Dec 31 2017 | ||||||||||
| | | | | | | | | | | | | | | | |
Gross margin(11) | 1 695 | 1 972 | 1 628 | 1 773 | 1 807 | 7 068 | 5 692 | |||||||||
| | ||||||||||||||||
Other income (loss) | 41 | 1 | (14 | ) | (7 | ) | (13 | ) | 21 | 73 | ||||||
| | ||||||||||||||||
Non-refining margin(12) | 180 | (407 | ) | (610 | ) | (413 | ) | (394 | ) | (1 250 | ) | (1 546 | ) | |||
| | | | | | | | | | | | | | | | | |
Refining margin(E) | 1 916 | 1 566 | 1 004 | 1 353 | 1 400 | 5 839 | 4 219 | |||||||||
| | ||||||||||||||||
Refinery production (mbbls)(13) | 46 145 | 45 465 | 33 165 | 44 363 | 43 801 | 169 138 | 174 461 | |||||||||
| | | | | | | | | | | | | | | | | |
Refining margin ($/bbl)(A)(E) | 41.50 | 34.45 | 30.25 | 30.50 | 31.95 | 34.50 | 24.20 | |||||||||
| | | | | | | | | | | | | | | | | |
Last-in, first out (LIFO) adjustment | 444 | — | (96 | ) | (11 | ) | (139 | ) | 337 | (96 | ) | |||||
| | | | | | | | | | | | | | | | | |
Adjusted LIFO Refining Margin(E) | 2 360 | 1 566 | 908 | 1 342 | 1 261 | 6 176 | 4 123 | |||||||||
| | | | | | | | | | | | | | | | | |
Adjusted LIFO refining margin ($/bbl)(E) | 51.15 | 34.45 | 27.40 | 30.25 | 28.75 | 36.50 | 23.65 | |||||||||
| | | | | | | | | | | | | | | | | |
OS&G | 522 | 499 | 478 | 480 | 532 | 1 979 | 1 950 | |||||||||
| | ||||||||||||||||
Non-refining costs(14) | (272 | ) | (272 | ) | (272 | ) | (262 | ) | (303 | ) | (1 078 | ) | (1 068 | ) | ||
| | | | | | | | | | | | | | | | | |
Refining operating expense | 250 | 227 | 206 | 218 | 229 | 901 | 882 | |||||||||
| | ||||||||||||||||
Refinery production (mbbls)(13) | 46 145 | 45 465 | 33 165 | 44 363 | 43 801 | 169 138 | 174 461 | |||||||||
| | | | | | | | | | | | | | | | | |
Refining operating expense ($/bbl)(A) | 5.45 | 5.00 | 6.25 | 4.90 | 5.25 | 5.35 | 5.05 | |||||||||
| | | | | | | | | | | | | | | | |
- (A)
- Prior periods have been restated due to IFRS 15 adoption (see note 3 in the interim consolidated financial statements.
- (B)
- Non-GAAP financial measures. See the Operating Summary Information – Non-GAAP Financial Measures section of this Quarterly Report.
- (E)
- Refining margins are a non-GAAP measure, and have been restated to remove the impact of risk management activity.
See accompanying footnotes and definitions to the quarterly operating summaries.
| 70 2018 FOURTH QUARTER Suncor Energy Inc. | | |
OPERATING SUMMARY INFORMATION
Non-GAAP Financial Measures
Certain financial measures in this document – namely operating earnings (loss), funds from (used in) operations, return on capital employed (ROCE), Oil Sands operations cash operating costs, Syncrude cash operating costs, Fort Hills cash operating costs, In Situ cash operating costs, mining cash operating costs, refining margin, refining operating expense and netbacks – are not prescribed by generally accepted accounting principles (GAAP). Suncor uses this information to analyze business performance, leverage and liquidity and includes these financial measures because investors may find such measures useful on the same basis. These non-GAAP financial measures do not have any standardized meaning and, therefore, are unlikely to be comparable to similar measures presented by other companies. The additional information should not be considered in isolation or as a substitute for measures of performance prepared in accordance with GAAP.
Operating earnings (loss), Oil Sands operations cash operating costs, and Fort Hills cash operating costs are defined in the Non-GAAP Financial Measures Advisory section and reconciled to GAAP measures in the Consolidated Financial Information and Segment Results and Analysis sections of each respective quarterly Report to Shareholders issued by Suncor in respect of the relevant quarter (Quarterly Reports). Funds from (used in) operations, ROCE and In Situ cash operating costs are defined and reconciled to GAAP measures in the Non-GAAP Financial Measures Advisory section of each respective Quarterly Report. Refining margin, refining operating expense and Syncrude cash operating costs are defined in the Non-GAAP Financial Measures Advisory section and reconciled to GAAP measures in the Operating Metrics Reconciliation section of each respective Quarterly Report. Netbacks are defined below and are reconciled to GAAP measures in the Operating Metrics Reconciliation section of each respective Quarterly Report. The remainder of the non-GAAP financial measures not otherwise mentioned in this paragraph are defined and reconciled in this Quarterly Report.
Oil Sands Netbacks
Oil Sands operating netbacks are a non-GAAP measure, presented on a crude product and sales barrel basis, and are derived from the Oil Sands segmented statement of net earnings (loss), after adjusting for items not directly attributable to the revenues and costs associated with production and delivery. Management uses Oil Sands operating netbacks to measure crude product profitability on a sales barrel basis.
Exploration and Production (E&P) Netbacks
E&P netbacks are a non-GAAP measure, presented on an asset location and sales barrel basis, and are derived from the E&P segmented statement of net earnings (loss), after adjusting for items not directly attributable to the revenue and costs associated with production and delivery. Management uses E&P netbacks to measure asset profitability by location on a sales barrel basis.
Definitions
- (1)
- Cash operating costs – Include cash costs that are defined as operating, selling and general expenses (excluding inventory changes and non-production costs), and are net of operating revenues associated with excess power from cogeneration units. Oil Sands operations cash operating costs (including for In Situ and mining) and Fort Hills cash operating costs are presented on a production basis by adjusting for inventory impacts, while Syncrude production volumes are equal to sales volumes.
- (2)
- Syncrude's capacity to upgrade bitumen to an intermediary sour SCO is 350,000 bbls/d.
- (3)
- Effective 2016, Libyan production volumes reflect the company's entitlement share of production sold in the period.
- (4)
- Reflects non-producing Oil Sands assets and enterprise shared service allocations and recoveries.
- (5)
- Reflects the impact of items not directly attributed to revenues received from the sale of proprietary crude and net non-proprietary activity at its deemed point of sale.
- (6)
- Reflects adjustments for expenses or credits not directly related to the transportation of the crude product to its deemed point of sale. For Oil Sands operations bitumen and SCO and Fort Hills bitumen, the point of sale is at the final customer, whereas Syncrude sweet SCO is deemed to be sold into the sweet synthetic crude oil pool in Edmonton, Alberta. Expenses or credits adjusted out of the netback transportation line include, but are not limited to, costs associated with the sale of non-proprietary product on pipelines with unutilized capacity under minimum volume commitment agreements.
- (7)
- Reflects adjustments for general and administrative costs not directly attributed to the production of each crude product type, as well as the revenues associated with excess power from cogeneration units.
- (8)
- Reflects adjustments for operating, selling and general expenses not directly attributable to Syncrude production.
- (9)
- Reflects other E&P assets, such as North America Onshore, Norway and Libya.
- (10)
- Reflects adjustments for general and administrative costs not directly attributed to production.
- (11)
- Operating revenues less purchases of crude oil and products.
- (12)
- Reflects the gross margin associated with the company's supply, marketing, lubricants and ethanol businesses.
- (13)
- Refinery production is the output of the refining process, and differs from crude oil processed as a result of volumetric adjustments for non-crude feedstock, volumetric gain associated with the refining process, and changes in unfinished product inventories.
- (14)
- Reflects operating, selling and general costs associated with the company's supply, marketing, lubricants and ethanol businesses, as well as certain general and administrative costs not directly attributable to refinery production.
Explanatory Notes
- *
- Users are cautioned that the Oil Sands operations, Fort Hills and Syncrude cash operating costs per barrel measures may not be fully comparable to one another or to similar information calculated by other entities due to differing operations of each entity as well as other entities' respective accounting policy choices.
Abbreviations
bbl | – barrel | |
bbls/d | – barrels per day | |
mbbls | – thousands of barrels | |
mbbls/d | – thousands of barrels per day | |
boe | – barrels of oil equivalent | |
boe/d | – barrels of oil equivalent per day | |
mboe/d | – thousands of barrels of oil equivalent per day | |
m3/d | – cubic metres per day | |
SCO | – synthetic crude oil |
Metric Conversion
Crude oil, refined products, etc. 1m3 (cubic metre) = approx. 6.29 barrels
| | | 2018 FOURTH QUARTER Suncor Energy Inc. 71 |

Suncor Energy Inc.
150 - 6 Avenue S.W., Calgary, Alberta, Canada T2P 3E3
T: 403-296-8000
suncor.com
EXHIBIT 99.1