EXHIBIT 99.2
Management’s Discussion and Analysis for the fiscal year ended December 31, 2005, dated March 1, 2006
MANAGEMENT’S DISCUSSION AND ANALYSIS
March 1, 2006
This Management’s Discussion and Analysis (MD&A) contains forward-looking statements. These statements are based on certain estimates and assumptions and involve risks and uncertainties. Actual results may differ materially. See page 58 for additional information.
This MD&A should be read in conjunction with Suncor’s audited consolidated financial statements and the accompanying notes. All financial information is reported in Canadian dollars (Cdn$) and in accordance with Canadian generally accepted accounting principles (GAAP) unless noted otherwise. The financial measures cash flow from operations, return on capital employed (ROCE) and cash and total operating costs per barrel referred to in this MD&A are not prescribed by GAAP and are outlined and reconciled in Non GAAP Financial Measures on page 56.
Certain prior year amounts have been reclassified to enable comparison with the current year’s presentation.
Base operations refers to Oil Sands mining and upgrading operations.
Barrels of oil equivalent (boe) may be misleading, particularly if used in isolation. A boe conversion ratio of six thousand cubic feet (mcf) of natural gas : one barrel of crude oil is based on an energy equivalency conversion method primarily applicable at the burner tip and does not represent a value equivalency at the wellhead.
References to “we,” “our,” “us,” “Suncor” or “the company” mean Suncor Energy Inc., its subsidiaries, partnerships and joint venture investments, unless the context otherwise requires.
The tables and charts in this document form an integral part of this MD&A.
Additional information about Suncor filed with Canadian securities commissions and the United States Securities and Exchange Commission (SEC), including periodic quarterly and annual reports and the Annual Information Form (AIF) filed with the SEC under cover of Form 40-F, is available on-line at www.sedar.com, www.sec.gov and our website www.suncor.com.
In order to provide shareholders with full disclosure relating to potential future capital expenditures, we have provided cost estimates for projects that, in many cases, are still in the early stages of development. These costs are preliminary estimates only. The actual amounts are expected to differ and these differences may be material. For a further discussion of our significant capital projects and the range of cost estimates associated with an “on-budget” project, refer to note 1 under “Significant Capital Project Update” on page 26.
17
SUNCOR OVERVIEW AND STRATEGIC PRIORITIES
Suncor Energy Inc. is an integrated energy company headquartered in Calgary, Alberta. We operate four businesses:
• Oil Sands, located near Fort McMurray, Alberta, produces bitumen recovered from oil sands through mining and in-situ technology and upgrades it into refinery feedstock, diesel fuel and byproducts.
• Natural Gas (NG) produces natural gas in Western Canada, providing revenues and serving as a price hedge against the company’s internal natural gas consumption in our oil sands and downstream operations.
• Energy Marketing and Refining – Canada (EM&R) operates a 70,000 barrel per day (bpd) capacity refinery in Sarnia, Ontario and markets refined petroleum products to customers primarily in Ontario and Quebec. EM&R also manages our company-wide energy marketing and trading activities and sales of all Oil Sands and NG production. Financial results relating to the sales of Oil Sands and NG production are reported in those business segments.
• Refining and Marketing – U.S.A. (R&M) operates 90,000 bpd of refining capacity in Commerce City, Colorado as well as related pipeline assets. R&M markets refined petroleum products to customers throughout Colorado.
Suncor’s strategic priorities are:
Operational:
• Developing our oil sands resource base through mining and in-situ technology and supplementing Suncor bitumen production with third party supply.
• Expanding Oil Sands mine, in-situ, extraction and upgrading facilities to increase crude oil production.
• Integrating Oil Sands production into the North American energy market through Suncor’s refineries and the refineries of other customers to reduce vulnerability to supply and demand imbalances.
• Managing environmental and social performance to earn continued stakeholder support for our ongoing operations and growth plans.
• Maintaining a strong focus on worker, contractor and community safety.
• Pursuing new technology applications to increase production and reduce costs and environmental impacts.
Financial:
• Controlling costs through a strong focus on operational excellence, economies of scale and improved management of engineering, procurement and construction of major projects.
• Reducing risk associated with natural gas price volatility by producing natural gas volumes that offset purchases for internal consumption.
• Maintaining a strong balance sheet by controlling debt and closely managing capital cost outlays.
• Targeting opportunities that have the potential to support a minimum 15% return on capital employed (ROCE) assuming a US$35 West Texas Intermediate (WTI) crude oil price and a Cdn$/US$ exchange rate of $0.80.
18
2005 Overview
• In September we completed rebuilding portions of our Oil Sands plant that were damaged by fire on January 4, 2005. The recovery and planned maintenance work was completed on schedule and the plant was running at full capacity by the end of September.
• In October, we successfully commissioned an expansion of our Oil Sands facilities that increased production capacity to 260,000 bpd from the previous capacity of 225,000 bpd. The project was completed on schedule and on budget. Work to further expand Oil Sands production capacity to 350,000 bpd in 2008 also progressed during the year and is on schedule and on budget.
• Construction of the second stage of our Firebag in-situ operation was completed on schedule and on budget. Commercial operations are expected to commence in the first quarter of 2006.
• In 2005, we produced 190 million cubic feet per day (mmcf/d) of natural gas from our conventional upstream operations compared to 200 mmcf/d in 2004. The decline was primarily due to weather related drilling delays and unplanned maintenance. Production remained in excess of volumes purchased for use in our Oil Sands and downstream operations.
• On May 31, 2005, we acquired the Colorado Refining Company from Valero Energy Corp., which included a 30,000 bpd refinery located adjacent to our existing refinery in Commerce City, Colorado. This combined operation is now the largest refining complex in the U.S. Rocky Mountain region.
• Construction continued on modifications to our Sarnia and Commerce City refineries to meet low-sulphur fuels regulations that will take effect in 2006.
• Maintaining a strong balance sheet remains a priority. Despite the impact of costs associated with the fire recovery, and an increase in capital spending to $2.8 billion (excluding the cost of the fire rebuild and capitalized interest), net debt (including cash and cash equivalents) at December 31, 2005 was $2.9 billion (1.2 times cash flow from operations), compared to $2.2 billion (1.1 times cash flow from operations) at December 31, 2004.
• Our company-wide ROCE (excluding major projects in progress) was 20.9% compared to 19% in 2004.
19
SELECTED FINANCIAL INFORMATION
Annual Financial Data
Year ended December 31 ($ millions except per share data) |
| 2005 |
| 2004 |
| 2003 |
|
|
|
|
|
|
|
|
|
Revenues |
| 11 086 |
| 8 665 |
| 6 611 |
|
Net earnings |
| 1 245 |
| 1 088 |
| 1 087 |
|
Total assets |
| 15 351 |
| 11 841 |
| 10 540 |
|
Long-term debt |
| 3 007 |
| 2 217 |
| 2 934 |
|
Dividends on common shares |
| 102 |
| 97 |
| 81 |
|
Net earnings attributable to common shareholders per share – basic |
| 2.73 |
| 2.40 |
| 2.42 |
|
Net earnings attributable to common shareholders per share – diluted |
| 2.67 |
| 2.36 |
| 2.26 |
|
Cash dividends per share |
| 0.24 |
| 0.23 |
| 0.1925 |
|
Outstanding Share Data
As at December 31, 2005 (thousands) |
|
|
|
|
|
|
|
|
|
|
|
Number of common shares |
| 457 665 |
|
Number of common share options |
| 19 203 |
|
Number of common share options – exercisable |
| 9 361 |
|
Quarterly Financial Data
|
| 2005 |
| 2004 |
| ||||||||||||
|
| Quarter ended |
| Quarter ended |
| ||||||||||||
($ millions except per share) |
| Dec. 31 |
| Sept. 30 |
| June 30 |
| Mar. 31 |
| Dec. 31 |
| Sept. 30 |
| June 30 |
| Mar. 31 |
|
|
|
|
|
|
|
|
|
|
|
|
|
|
|
|
|
|
|
Revenues |
| 3 503 |
| 3 142 |
| 2 380 |
| 2 061 |
| 2 321 |
| 2 326 |
| 2 212 |
| 1 806 |
|
Net earnings |
| 694 |
| 341 |
| 112 |
| 98 |
| 333 |
| 337 |
| 202 |
| 216 |
|
Net earnings attributable to common shareholders per share |
|
|
|
|
|
|
|
|
|
|
|
|
|
|
|
|
|
Basic |
| 1.52 |
| 0.75 |
| 0.24 |
| 0.22 |
| 0.73 |
| 0.74 |
| 0.45 |
| 0.48 |
|
Diluted |
| 1.48 |
| 0.73 |
| 0.24 |
| 0.21 |
| 0.72 |
| 0.73 |
| 0.43 |
| 0.46 |
|
Net Earnings (1)
Year ended December 31,
($ millions)

|
| 05 |
| 04 |
| 03 |
| |
|
|
|
|
|
|
|
| |
| Oil Sands |
| 1 073 |
| 994 |
| 887 |
|
| Natural Gas |
| 155 |
| 115 |
| 120 |
|
| Energy Marketing and Refining – Canada |
| 41 |
| 80 |
| 53 |
|
| Refining and Marketing – U.S.A.(3) |
| 142 |
| 34 |
| 18 |
|
Capital Employed(1) (2)
Year ended December 31,
($ millions)

|
| 05 |
| 04 |
| 03 |
| |
|
|
|
|
|
|
|
| |
| Oil Sands |
| 4 633 |
| 4 169 |
| 4 050 |
|
| Natural Gas |
| 563 |
| 448 |
| 400 |
|
| Energy Marketing and Refining – Canada |
| 486 |
| 512 |
| 551 |
|
| Refining and Marketing – U.S.A.(3) |
| 327 |
| 232 |
| 270 |
|
Cash Flow from Operations(1)
Year ended December 31,
($ millions)

|
| 05 |
| 04 |
| 03 |
| |
|
|
|
|
|
|
|
| |
| Oil Sands |
| 1 895 |
| 1 752 |
| 1 803 |
|
| Natural Gas |
| 412 |
| 319 |
| 298 |
|
| Energy Marketing and Refining – Canada |
| 152 |
| 188 |
| 164 |
|
| Refining and Marketing – U.S.A.(3) |
| 247 |
| 59 |
| 34 |
|
(1) Excludes Corporate and Eliminations segment.
(2) Excludes major projects in progress.
(3) Refining and Marketing – U.S.A. 2003 data reflects five months of operations since acquisition on August 1, 2003. Data for 2005 includes results of the former Colorado Refining Company, acquired May 31, 2005.
20
Fluctuations in quarterly net earnings for 2005 and 2004 were due to a number of factors:
• The January 2005 fire at Oil Sands significantly reduced crude oil production to approximately 122,000 bpd for the first nine months of 2005.
• U.S. dollar denominated crude oil and natural gas prices were higher on average in 2005 compared to 2004. WTI averaged US$56.55 per barrel (bbl) in 2005 compared to US$41.40/bbl in 2004, and Henry Hub natural gas prices averaged US$8.55/mcf in 2005, compared to US$6.20/mcf in 2004.
• Cash operating costs fluctuated due to variations in Oil Sands production levels, the timing and amount of maintenance activities, and the price and volume of natural gas used for energy in Oil Sands operations.
• Commodity and refined product prices fluctuated as a result of global and regional supply and demand, as well as seasonal demand variations. In our downstream operations, seasonal fluctuations were reflected in higher demand for vehicle fuels and asphalt in summer and heating fuels in winter. Prices were also affected by decreased market supply as a result of hurricane activity in the Gulf of Mexico during the summer of 2005.
• Realized commodity prices were unfavourably impacted in 2005 and 2004 by increases in the Canadian dollar compared to the U.S. dollar, which reduced the Canadian dollar revenues earned. The stronger Canadian dollar also resulted in net foreign exchange gains on U.S. dollar denominated debt in 2005 and 2004. The higher appreciation of the Canadian dollar compared to the U.S. dollar in 2004 over 2005 resulted in higher foreign exchange gains in 2004 compared to 2005.
• A 1% reduction in the Province of Alberta’s corporate tax rates in the first quarter of 2004 increased 2004 net earnings by $53 million.
• The timing and amount of insurance receipts related to the fire at Oil Sands in January 2005.
Consolidated Financial Analysis
This analysis provides an overview of our consolidated financial results for 2005 compared to 2004. For a detailed analysis, see the various business segment analyses.
Net Earnings
Our net earnings were $1.245 billion in 2005, compared with $1.088 billion in 2004 (2003 – $1.087 billion). The increase was primarily due to higher U.S. dollar benchmark crude oil and natural gas prices, the receipt of insurance payments related to the January 2005 fire at our oil sands facility and lower hedging losses. These positive impacts were partially offset by lower Oil Sands and Natural Gas production, higher maintenance expenses, higher energy costs in our Oil Sands and downstream operations, and the impact of a stronger Canadian dollar.
Net Earnings Components (1)
Year ended December 31 ($ millions, after-tax) |
| 2005 |
| 2004 |
| 2003 |
|
|
|
|
|
|
|
|
|
Net earnings before the following items: |
| 1 114 |
| 1 242 |
| 1 021 |
|
Firebag in-situ start-up costs (2) |
| (4 | ) | (14 | ) | — |
|
Oil Sands fire accrued insurance proceeds (2) |
| 360 |
| — |
| — |
|
Oil Sands Alberta Crown royalties |
| (256 | ) | (261 | ) | (21 | ) |
Impact of income tax rate reductions on opening net future income tax liabilities |
| — |
| 53 |
| (89 | ) |
Unrealized foreign exchange gains on U.S. dollar denominated long-term debt |
| 31 |
| 68 |
| 176 |
|
Net earnings as reported |
| 1 245 |
| 1 088 |
| 1 087 |
|
(1) This table highlights some of the factors impacting Suncor’s after-tax net earnings. For comparability purposes, readers should rely on the reported net earnings that are prepared and presented in the consolidated financial statements and notes in accordance with Canadian GAAP.
(2) Before deduction of Alberta Crown royalties.
21
Industry Indicators
(Average for the year unless otherwise noted) |
| 2005 |
| 2004 |
| 2003 |
|
|
|
|
|
|
|
|
|
West Texas Intermediate (WTI) crude oil US$/barrel at Cushing |
| 56.55 |
| 41.40 |
| 31.05 |
|
Canadian 0.3% par crude oil Cdn$/barrel at Edmonton |
| 69.00 |
| 52.55 |
| 43.55 |
|
Light/heavy crude oil differential US$/barrel WTI at Cushing less Lloydminster Blend at Hardisty |
| 20.90 |
| 13.55 |
| 8.65 |
|
Natural gas US$/thousand cubic feet (mcf) at Henry Hub |
| 8.55 |
| 6.20 |
| 5.45 |
|
Natural gas (Alberta spot) Cdn$/mcf at AECO |
| 8.50 |
| 6.80 |
| 6.70 |
|
New York Harbour 3-2-1 crack US$/barrel (1) |
| 9.50 |
| 6.90 |
| 5.30 |
|
Ontario refined product demand percentage change over prior year (2) |
| 0.2 |
| 4.3 |
| 2.5 |
|
Colorado light product demand percentage change over prior year (3) |
| 3.3 |
| 7.2 |
| (2.2 | ) |
Exchange rate: Cdn$/US$ |
| 0.83 |
| 0.77 |
| 0.72 |
|
(1) New York Harbour 3-2-1 crack is an industry indicator measuring the margin on a barrel of oil for gasoline and distillate. It is calculated by taking two times the New York Harbour gasoline margin plus one times the New York Harbour distillate margin and dividing by three.
(2) Figures for 2003 and 2004 are based on published government data. The figure for 2005 is an internal estimate based on preliminary government data.
(3) Figures for 2003 and 2004 are based on public reporting by state and government agencies. The 2005 figure is based on consensus estimates by third party consultants.
Revenues were $11.1 billion in 2005, compared with $8.7 billion in 2004 (2003 – $6.6 billion). The increase was primarily due to the following:
• Average commodity prices were higher in 2005 than in 2004. A 37% increase in average U.S. dollar WTI benchmark prices increased the selling price of Oil Sands crude oil production. Offsetting this increase, average light/heavy crude oil differentials compared to the WTI benchmark index widened by approximately 54%. As a result, the net price we received on certain sour crude oil and bitumen sales did not increase by as much as the increase in WTI.
• Refined product wholesale and retail prices in both EM&R and R&M were higher due to higher crude oil and refined product prices. In addition, a 47% increase in refined product sales volumes in R&M due to the acquisition of the Colorado Refining Company in the second quarter of 2005 had a positive impact on revenue.
• Lower strategic crude oil hedging losses increased revenues by $85 million. During 2005, we sold a portion of our crude oil production at fixed prices that were lower than prevailing market prices. During 2005 we sold 36,000 bpd at a fixed price of US$23/bbl compared to 79,000 bpd in 2004 at a fixed price range of US$21/bbl to US$24/bbl. Pretax hedging losses in 2005 were $535 million compared to $620 million in 2004.
• The recognition of $572 million pretax in net insurance proceeds related to the January 2005 fire at our Oil Sands operations.
Partially offsetting these increases were the following:
• An 8% increase in the average Cdn$/US$ exchange rate resulted in lower realizations on our crude oil sales basket and our natural gas sales. Because crude oil and natural gas are primarily sold based on U.S. dollar benchmark prices, a narrowing of the exchange rate difference produced a corresponding reduction in the Canadian dollar value of our products.
• In 2005, Oil Sands sales volumes averaged 165,300 bpd, compared with 226,300 bpd in 2004 (2003 – 218,300 bpd). Decreased crude oil production as a result of the fire, and an inventory build in the fourth quarter resulted in lower sales volumes. Oil Sands sales in 2005 included 16,600 bpd of bitumen from Firebag in-situ operations (2004 – 8,400 bpd; 2003 – 6,400 bpd).
• Natural gas production averaged 190 mmcf/d in 2005 compared to 200 mmcf/d in 2004. Lower production was the result of weather related drilling delays that impacted the western Canadian industry, as well as unplanned maintenance.
Overall, higher prices, net of the impact of the higher Cdn$/US$ exchange rate, increased total revenues by approximately $2.2 billion and lower hedging losses increased revenues by approximately $85 million. These impacts were partially offset by lower sales volumes that decreased revenues by approximately $800 million.
Purchases of crude oil and crude oil products were $4.2 billion in 2005 compared with $2.9 billion in 2004 (2003 – $1.7 billion). The increase was primarily due to the following:
• Higher benchmark crude oil prices. This factor had the largest impact on product purchases for EM&R and R&M as WTI increased 37% over the prior year.
22
• Increased purchases of crude oil feedstock to utilize the additional refining capacity acquired by R&M in the second quarter of 2005. The acquisition increased our Commerce City refining capacity from 60,000 bpd to 90,000 bpd.
• Purchased volumes of crude oil and refined products decreased in EM&R. In 2004, larger amounts of refined products were purchased to meet customer demand during the maintenance shutdown that occurred in the second quarter.
• In 2004, the repurchase of crude oil originally sold to a Variable Interest Entity (VIE) in 1999 increased purchases at Oil Sands by approximately $55 million. There was no similar transaction in 2005.
Operating, selling and general expenses were $2.1 billion in 2005 compared with $1.8 billion in 2004 (2003 – $1.5 billion). The primary reasons for the increase were:
• Higher operating expenses primarily due to higher energy costs in our Oil Sands and downstream operations.
• Increased maintenance related costs at Oil Sands, primarily to ensure reliability of the upgrader that was not damaged by the fire.
• Higher stock-based compensation expenses caused by increases in our share price.
• Incremental operating costs associated with the acquisition of the Colorado Refining Company in 2005.
Transportation and other expenses were $152 million in 2005 compared to $132 million in 2004 (2003 – $135 million). In 2004, mark-to-market gains on inventory-related derivatives of $13 million in Oil Sands reduced transportation and other costs. Despite decreased production in our Oil Sands operations, transportation costs, excluding the mark-to-market gain from 2004, have remained relatively constant due to the “ship-or-pay” nature of the contracts with our shippers. Consistent with 2004, Oil Sands pipeline tolls continued to be reduced by initial shipper toll adjustments. These toll reductions are currently expected to continue until at least 2007.
Depreciation, depletion and amortization (DD&A) was $720 million in 2005, consistent with 2004 (2003 – $622 million). DD&A at Oil Sands decreased by $23 million due to lower overburden amortization as a result of lower production, partially offset by higher maintenance shutdown and catalyst amortization, and depletion incurred in in-situ operations. NG DD&A increased by $15 million, reflecting an increased proved asset base and higher amortization related to unproven lands.
Royalty expenses were $555 million in 2005 compared with $531 million in 2004 (2003 – $139 million). The increase in 2005 was primarily related to increased natural gas royalties due to higher price realizations, partially offset by lower natural gas volumes. For a discussion of Oil Sands Crown royalties, see page 27.
Taxes other than income taxes were $529 million in 2005 compared to $540 million in 2004 (2003 – $466 million). The decrease was primarily due to lower sales volumes subject to fuel excise taxes (FET) in our Oil Sands and EM&R operations, partially offset by higher sales volumes subject to FET in our R&M operations.
Financing income was $15 million in 2005 compared with expenses of $24 million in 2004 (2003 – income of $74 million). The decrease in expenses was primarily due to higher amounts of capitalized interest, lower effective interest rates and the effects of foreign exchange on U.S. dollar operating accounts, partially offset by a $45 million decrease in foreign exchange gains on our U.S. dollar denominated long-term debt. Interest expense, net of capitalized interest, was $32 million in 2005 compared to $95 million in 2004. Interest expense, net of capitalized interest, decreased primarily due to more capital projects meeting the criteria for interest capitalization.
Income tax expense was $742 million in 2005 (37% effective tax rate), compared to $530 million in 2004 (33% effective tax rate) (2003 – $718 million – 40% effective tax rate). Income tax expense in both 2004 and 2003 included the effects of adjustments to opening future income tax balances due to changes in tax rates that reduced tax expense by $53 million in 2004 and increased tax expense by $89 million in 2003. Excluding these adjustments, income tax expense in 2004 was $583 million (36% effective tax rate) and $629 million in 2003 (35% effective tax rate).
Corporate Expenses
After-tax corporate expenses were $166 million in 2005 compared to $135 million in 2004 (2003 – $9 million). The increase was due to higher stock-based compensation expenses and higher insurance related costs, partially offset by lower financing costs as discussed previously. Corporate had a net cash deficiency of $122 million in 2005, compared with $343 million in 2004 (2003 – $280 million). The reduced deficiency was primarily due to changes in working capital.
23
Consolidated Cash Flow from Operations
Cash flow from operations was $2.476 billion in 2005 compared to $2.013 billion in 2004 (2003 – $2.040 billion). The increase in cash flow from operations was primarily due to the same factors that impacted earnings, with the exception of foreign exchange gains on our U.S. dollar denominated long-term debt and future income taxes, both of which are non-cash items.
Total dividends paid during 2005 were $0.24 per share, compared with $0.23 per share in 2004. Suncor’s Board of Directors periodically reviews the dividend policy, taking into consideration the company’s capital spending profile, financial position, financing requirements, cash flow and other relevant factors. In the second quarter of 2004, the Board approved an increase in the quarterly dividend to $0.06 per share, from $0.05 per share.
Dividends
Total dividends paid during 2005 were $0.24 per share, compared with $0.23 per share in 2004. Suncor's Board of Directors periodically reviews the dividend policy, taking into consideration the company's capital spending profile, financial position, financing requirements, cash flow and other relevant factors. In the second quarter of 2004, the Board approved an increase in the quarterly dividend to $0.06 per share, from $0.05 per share.
Oil Sands Fire
On January 4, 2005, a fire at our Oil Sands operations damaged Upgrader 2, reducing production from base operations to approximately 122,000 bpd for the first nine months of the year. Repairs and scheduled maintenance were completed in September 2005, at which time operations returned to full production capacity.
We expect our property loss and business interruption (BI) insurance policies to significantly mitigate the financial impact of the fire. During 2005, we received $115 million (US$95 million) from our property loss policy and $594 million (US$500 million) in proceeds from our BI insurance policies, including $175 million (US$150 million) received in January and February 2006. The company is currently negotiating a final settlement with its business interruption insurers. Any subsequent proceeds will be recorded when unconditionally received or receivable.
For royalty purposes, BI proceeds are treated in the same manner as the revenues they replace and, accordingly, attract Alberta Crown royalties. For further discussion about Oil Sands Crown royalties, see page 27.
In the fourth quarter of 2005, we renewed our property and BI insurance programs. All of our policy limits and deductibles remain unchanged except as noted. We carry primary and excess property loss and BI coverage with a combined limit up to US$1.150 billion, net of deductible amounts. The primary property loss policy of US$250 million has a deductible of US$10 million per incident and the primary BI policy of US$200 million has a deductible per incident of the greater of US$50 million gross earnings lost (as defined in the insurance policy) or 30 days from the incident.
The excess coverage of US$700 million can be used for either property loss or BI coverage for our Oil Sands operations. For BI purposes, this excess coverage is available commencing on the later of full utilization of the primary BI coverage or 90 days from the date of the incident. Effective January 1, 2006, the excess coverage has a ceiling of US$40/bbl WTI for purposes of determining the amount of BI losses.
Liquidity and Capital Resources
At December 31, 2005, our capital resources consisted primarily of cash flow from operations and available lines of credit. Our level of earnings and cash flow from operations depends on many factors, including commodity prices, production levels, downstream margins and Cdn$/US$ exchange rates. In 2005, cash flow from operations was negatively impacted by the fire at Oil Sands.
At December 31, 2005, our net debt (short and long-term debt less cash and cash equivalents) was approximately $2.9 billion compared to $2.2 billion at December 31, 2004. Approximately $710 million of the increase in total net debt in 2005 was the result of capital spending exceeding cash from operating activities.
In 2005, we entered into a new $600 million credit facility agreement with a one year term and also renewed $200 million of our available credit and term loan facilities. Our undrawn lines of credit at December 31, 2005 were approximately $1.3 billion. Suncor’s current long-term senior debt ratings are A- by Standard & Poor’s, A(low) by Dominion Bond Rating Service and A3 by Moody’s Investors Service. All debt ratings have a stable outlook.
Interest expense on debt continues to be influenced by the composition of our debt portfolio, and we are benefiting from short-term floating interest rates continuing at low levels. To manage fixed versus floating rate exposure, we have entered into interest rate swaps with investment grade counterparties, resulting in the swapping of $600 million of fixed rate debt to variable rate borrowings.
Management of debt levels continues to be a priority given our growth plans. We believe a phased approach to existing and future growth projects should assist us in our efforts to maintain our ability to manage project costs and debt levels.
24
We believe we have the capital resources to fund our 2006 capital spending program of $3.5 billion and to meet current working capital requirements. If additional capital is required, we believe adequate additional financing is available at commercial terms and rates.
We anticipate our growth plan will be largely financed from internal cash flow, which is dependent on commodity prices, production levels and other factors, as well as debt.
After 2006, to support our growth strategy and sustain operations, we are projecting an annual capital spending program of approximately $3.5 billion. Actual spending is subject to change due to such factors as internal and external approvals and capital availability. Refer to the discussion under Risk Factors Affecting Performance on page 29 for additional factors that can have an impact on our ability to generate funds to support investing activities.
Aggregate Contractual Obligations
|
| Payments Due by Period |
| ||||||||
($ millions) |
| Total |
| 2006 |
| 2007-08 |
| 2009-10 |
| Later Years |
|
|
|
|
|
|
|
|
|
|
|
|
|
Fixed-term debt, commercial paper (1) |
| 2 977 |
| 910 |
| 401 |
| — |
| 1 666 |
|
Capital leases |
| 30 |
| 1 |
| 2 |
| 2 |
| 25 |
|
Interest payments on fixed-term debt, commercial paper and capital leases (1) |
| 2 429 |
| 157 |
| 241 |
| 223 |
| 1 808 |
|
Employee future benefits (2) |
| 457 |
| 33 |
| 74 |
| 84 |
| 266 |
|
Asset retirement obligations (3) |
| 1 221 |
| 54 |
| 101 |
| 72 |
| 994 |
|
Non-cancellable capital spending commitments (4) |
| 240 |
| 240 |
| — |
| — |
| — |
|
Operating lease agreements, pipeline capacity and energy services commitments (5) |
| 5 408 |
| 258 |
| 507 |
| 529 |
| 4 114 |
|
Total |
| 12 762 |
| 1 653 |
| 1 326 |
| 910 |
| 8 873 |
|
In addition to the enforceable and legally binding obligations quantified in the above table, we have other obligations for goods and services and raw materials entered into in the normal course of business, which may be terminated on short notice. Commodity purchase obligations for which an active, highly liquid market exists and which are expected to be re-sold shortly after purchase, are one example of excluded items.
(1) Includes $2,066 million of U.S. and Canadian dollar denominated debt that is redeemable at our option. Maturities range from 2007 to 2034. Interest rates vary from 5.95% to 7.15%. We entered into various interest rate swap transactions maturing in 2007 and 2011 that resulted in an average effective interest rate in 2005 ranging from 4.0% to 4.6% on $600 million of our medium term notes. Approximately $890 million of commercial paper with an effective interest rate of 3.2% was issued and outstanding at December 31, 2005.
(2) Represents the undiscounted expected funding by the company to its pension plans as well as benefit payments to retirees for other post-employment benefits.
(3) Represents the undiscounted amount of legal obligations associated with site restoration on the retirement of assets with determinable lives.
(4) Non-cancellable capital commitments related to capital projects totalled approximately $240 million at the end of 2005. In addition to capital projects, we spend maintenance capital to sustain our current operations. In 2006, we anticipate spending approximately $700 million at our Oil Sands operations towards sustaining capital.
(5) Includes transportation service agreements for pipeline capacity, including tankage for the shipment of crude oil from Fort McMurray to Hardisty, Alberta, as well as energy services agreements to obtain a portion of the power and steam generated by a cogeneration facility owned by a major energy company. Non-cancellable operating leases are for service stations, office space and other property and equipment.
We are subject to financial and operating covenants related to our public market and bank debt. Failure to meet the terms of one or more of these covenants may constitute an Event of Default as defined in the respective debt agreements, potentially resulting in accelerated repayment of one or more of the debt obligations.
In addition, a very limited number of our commodity purchase agreements, off-balance sheet arrangements and derivative financial instrument agreements contain provisions linked to debt ratings that may result in settlement of the outstanding transactions should our debt ratings fall below investment grade status.
At December 31, 2005, we were in compliance with all covenants and our debt ratings were investment grade with a stable outlook. For more information, see page 24.
25
Significant Capital Project Update
We spent $2.8 billion ($3.2 billion including the cost of the fire rebuild and capitalized interest) on capital investing activities in 2005 compared to $1.825 billion in 2004. A summary of the progress on our significant projects under construction is provided below. All projects listed below have received Board of Directors approval.
|
| Cost |
| Spent |
| Total Spent |
|
|
|
|
| Estimate |
| in 2005 |
| to Date |
|
|
|
Description |
| ($ millions) (1) |
| ($ millions) |
| ($ millions) |
| Status(1) |
|
|
|
|
|
|
|
|
|
|
|
Oil Sands |
|
|
|
|
|
|
|
|
|
Millennium vacuum unit |
| 425 |
| 60 |
| 450 |
| Project was completed on budget and on schedule. (2) |
|
|
|
|
|
|
|
|
|
|
|
Firebag Stage 2 |
| 515 |
| 140 |
| 540 |
| Project was completed on budget and on schedule, commissioning is underway. (2) |
|
|
|
|
|
|
|
|
|
|
|
Coker Unit (3) |
| 2 100 |
| 530 |
| 930 |
| Project is on schedule and on budget. |
|
|
|
|
|
|
|
|
|
|
|
Firebag Cogeneration and expansion |
| 400 |
| 95 |
| 120 |
| Project is on schedule and on budget. |
|
|
|
|
|
|
|
|
|
|
|
EM&R |
|
|
|
|
|
|
|
|
|
|
|
|
|
|
|
|
|
|
|
Diesel desulphurization and oil sands integration |
| 800 |
| 295 |
| 475 |
| Project is on schedule and on budget. |
|
|
|
|
|
|
|
|
|
|
|
R&M |
|
|
|
|
|
|
|
|
|
Diesel desulphurization |
| 465 | ) | 285 | ) | 420 | ) | Project cost estimate has been revised from $360 (US$300). |
|
(1) Estimating and budgeting for major capital projects is a process that involves uncertainties and that evolves in stages, each with progressively more refined data and a correspondingly narrower range of uncertainty. At very early stages, when broad engineering design specifications are developed, the level of uncertainty can result in price ranges with -30%/+50% (or similar) levels of uncertainty. As project engineering progresses, vendor bids are studied, goods and materials ordered and we move closer to the build stage, the level of uncertainty narrows. Generally, when projects receive final approval from our Board of Directors, our cost estimates have a range of uncertainty that has narrowed to the -10%/+10% or similar range. The projects noted in the above table have cost estimates within this range of uncertainty. These ranges establish an expected high and low capital cost estimate for a project. When we say that a project is “on budget”, we mean that we still expect the final project capital cost to fall within the current range of uncertainty for the project. Even at this stage, the uncertainties in the estimating process and the impact of future events, can and will cause actual results to differ, in some cases materially, from our estimates.
(2) Total project cost is subject to change until all accounts are final.
(3) Excludes costs associated with bitumen feed.
Variable Interest Entities and Guarantees and Off-balance Sheet Arrangements
At December 31, 2005, we had off-balance sheet arrangements with Variable Interest Entities (VIEs), and indemnification agreements with other third parties, as described below.
We have a securitization program in place to sell, on a revolving, fully serviced and limited recourse basis, up to $340 million of accounts receivable having a maturity of 45 days or less, to a third party. The third party is a multiple party securitization vehicle that provides funding for numerous asset pools. As at December 31, 2005, $340 million (2004 – $170 million) in outstanding accounts receivable had been sold under the program. Under the recourse provisions, we provide indemnification against credit losses for certain counterparties, for which indemnification did not exceed $58 million in 2005. A contingent liability has not been recorded for this indemnification as we believe we have no significant exposure to credit losses. Proceeds received from new securitizations and proceeds from collections reinvested in securitizations on a revolving basis for the year ended December 31, 2005, were $170 million and approximately $2,220 million, respectively. We recorded an after-tax loss of approximately $4 million on the securitization program in 2005 (2004 – $2 million; 2003 – $3 million).
In 1999, we entered into an equipment sale and leaseback arrangement with a VIE for proceeds of $30 million. The VIE’s sole asset is the equipment sold to it and leased back by Suncor. The VIE was consolidated effective January 1, 2005. The initial lease term covers a period of seven years. We have provided a residual value guarantee on the equipment of up to $7 million should we elect not to repurchase the equipment at the end of the lease term. Had we elected to terminate the lease at December 31, 2005, the total cost would have been $21 million (2004 – $25 million). Annualized equipment lease payments in 2005 were $5 million (2004 – $6 million; 2003 – $4 million).
26
We have agreed to indemnify holders of the 7.15% fixed-term U.S. dollar notes, the 5.95% fixed-term U.S. dollar notes and our credit facility lenders for added costs related to taxes, assessments or other government charges or conditions, including any required withholding amounts. Similar indemnity terms apply to the receivables securitization program, and certain facility and equipment leases.
There is no limit to the maximum amount payable under the indemnification agreements described above. We are unable to determine the maximum potential amount payable as government regulations and legislation are subject to change without notice. Under these agreements, we have the option to redeem or terminate these contracts if additional costs are incurred.
Outlook
During 2006, management will focus on the following operational priorities:
• Increase annual average Oil Sands production to 260,000 bpd at an average cash operating cost of $16.00 to $16.75 per barrel, assuming a natural gas price of US$6.75/mcf at Henry Hub.
• Increase natural gas production to an average of 205 to 210 mmcf/d. We will continue to focus on deep gas prospects.
• Advance plans for increased bitumen supply. Achieve full capacity operations from Firebag Stage 1 and a steady ramp up of production from Firebag Stage 2. On the mining side, we anticipate substantial completion of engineering for the new Steepbank mine extension and extraction facilities.
• Advance plans for increased upgrader capacity. Significant progress to take Suncor to 350,000 bpd in 2008 is anticipated with major progress on construction and vessel delivery. A regulatory hearing regarding our plans for increasing production to half a million barrels per day is anticipated, while engineering for that expansion progresses to the design specification stage.
• Advancing downstream integration plans. In 2006, we expect to complete modifications to the Commerce City and Sarnia refineries to allow low sulphur fuel production. The Commerce City refinery will undergo a major maintenance shutdown to support operational reliability and to tie in equipment that will enable it to process 10,000 to 15,000 bpd of Oil Sands sour crude blends. The Sarnia refinery will also undergo a major maintenance shutdown to support operational reliability.
• Focus on company-wide efficiency. To more seamlessly integrate operations and improve efficiency and productivity, we expect to complete the implementation of a company-wide enterprise resource planning (ERP) information and management system.
Oil Sands Crown Royalties and Cash Income Taxes
Under the current Province of Alberta oil sands royalty regime, Alberta Crown royalties for oil sands projects are payable at the rate of 25% of the difference between a project’s annual gross revenues net of related transportation costs (R), less allowable costs including allowable capital expenditures (the R-C Royalty), subject to a minimum royalty, currently at 1% of R. The Alberta government has classified Suncor’s current Oil Sands operations as two distinct “projects” for royalty purposes: Suncor’s base oil sands mining and associated upgrading operations with royalties based on upgraded product values, and the current Firebag in-situ project with royalties based on bitumen values under the government’s generic bitumen-based royalty regime for oil sands projects. Pursuant to an agreement we concluded with the Government of Alberta during the third quarter of 2005, we settled the terms and conditions of our option to transition our base operations in 2009 to the generic bitumen-based royalty regime. This option was initially granted by the government in 1997, but was subject to finalizing certain terms of transition. Should we elect to move our base operations to the bitumen-based royalty in 2009, assuming no change to the current regime, we would expect to pay a royalty in respect of our base operations of 25% of R-C, with “R” based on bitumen rather than upgraded product values, and “C” excluding substantially all of the upgrading costs. We have until late 2008 to decide if we will exercise this option.
In July 2004, we issued a statement of claim against the Crown, seeking, among other things, to overturn the government’s decision on the royalty treatment of our Firebag in-situ operations. In February 2006, we advised the Government of Alberta that we had elected not to proceed with our claim relating to the royalty treatment of Firebag.
Assuming anticipated levels of operating expenses and capital expenditures for each project remain relatively constant, and there are no changes to the current Government of Alberta oil sands royalty regime or the government’s application of the applicable rules, and no other unanticipated events occur, we believe future variability in Oil Sands royalty expense will primarily be a function of changes in annual Oil Sands revenue. On that basis, we would generally expect Alberta Crown royalty expense for Oil Sands, to range as set forth in the following chart.
27
If prices rise, we would expect the percentage to increase somewhat. For years after 2008, this percentage range may decline as anticipated new in-situ production attracts royalties based on bitumen values at 1% until project payout and if we elect to exercise the bitumen royalty option referred to in the previous paragraph.
Anticipated Royalty Expense Based on Certain Assumptions
For the Period from 2006-2013
Crown Royalty Expense (based on percentage of total Oil Sands revenue) % |
|
|
|
|
|
2006-08 |
| 10-12 |
| 12-14 |
|
2009-13 (1) |
| 5-7 |
| 6-8 |
|
WTI Price/bbl US$ |
| 40 |
| 50 |
|
Natural gas price per mcf at Henry Hub US$ |
| 6.50 |
| 7.50 |
|
|
|
|
|
|
|
Light/heavy oil differential of WTI at Cushing less Maya at the U.S. Gulf Coast US$ |
| 9.50 |
| 10.50 |
|
Cdn$/US$ exchange rate |
| 0.80 |
| 0.85 |
|
(1) Assuming we exercise our option to transition our base operations in 2009 to the generic bitumen-based royalty regime.
Based on these same economic assumptions and our current capital spending plans, and assuming continuation of the current economic circumstances including no change to the current Alberta Crown royalty regime for oil sands, we would expect the 25%
R-C royalty to apply to our existing Oil Sands base operations in future years and the 1% minimum royalty to apply to the Firebag project until the next decade.
Alberta Crown royalties are highly sensitive to, among other factors, changes in crude oil and natural gas pricing, production volumes, foreign exchange rates, and capital and operating costs for each oil sands project. In addition, all aspects of the current Alberta oil sands royalty regime, including royalty rates and the royalty base, are subject to alteration by the Government of Alberta. Accordingly, in light of these uncertainties and the potential for unanticipated events to occur, we strongly caution that it is impossible to predict even a range of annualized royalty expense as a percentage of revenues or the impact royalties may have on our financial results, and actual differences may be material. For example, our Alberta oil sands Crown royalty expense in 2006 and future years may be significantly impacted by the amount of outstanding business interruption insurance proceeds we receive, and the timing of the receipts. Therefore, the forward-looking information in the preceding paragraphs and table should not be taken as an estimate, forecast or prediction of future events or circumstances.
The timing of when the Oil Sands operations will be fully cash taxable is highly dependent on crude oil commodity prices and capital invested. Using the assumptions outlined in the table above, we anticipate that our Oil Sands and NG operations will be partially cash taxable commencing in 2007. These operations will continue to be partially cash taxable until the next decade, at which point they are expected to become fully cash taxable. In any particular year, our Oil Sands and NG operations may be subject to some cash income tax due to the sensitivity to crude oil and natural gas commodity price volatility and the timing of recognition of capital expenditures for income tax purposes.
The information in the preceding paragraphs under Oil Sands Crown Royalties and Cash Income Taxes incorporates operating and capital cost assumptions included in our current budget and long-range plan, and is not an estimate, forecast or prediction of actual future events or circumstances.
Climate Change
Our effort to reduce greenhouse gas emissions is reflected in our pursuit of greater internal energy efficiency; investment in renewable energy including wind power; carbon capture research and development; and emissions offsets.
We continue to consult with governments about the impact of the Kyoto Protocol and we plan to continue to actively manage our greenhouse gas emissions. We currently estimate that in 2010 the impact of the Kyoto Protocol on Oil Sands cash operating costs would be an increase of about $0.20 to $0.27 per barrel. This estimate assumes a reduction obligation of 15% from 2010 business-as-usual energy intensity (1) and that the maximum price for carbon credits would, as the Government of Canada indicated in 2002, be capped at $15 per tonne of carbon dioxide equivalent until 2012. Based on these assumptions, we do not currently anticipate that the cost implications of federal and provincial climate change plans will have a material impact on our business or future growth plans.
The ultimate impact of Canada’s implementation of the Kyoto Protocol, however, remains subject to numerous risks, uncertainties and unknowns. These include the outcome of discussions between the federal and provincial governments, the form, impact and effectiveness of implementing legislation, the ultimate allocation of reduction obligations among economic sectors, and other details of Canada’s implementation plan, as well as international developments. In addition, the Government of Canada has not indicated what, if any, limitations will be placed on the price of carbon
(1) Reflects the level of greenhouse gas emissions that would have occurred in the absence of energy efficiency and process improvements after 2000.
28
credits after 2012. It is not possible to predict how these and other Kyoto Protocol-related issues will ultimately be resolved.
Risk Factors Affecting Performance
Our financial and operational performance is potentially affected by a number of factors including, but not limited to, commodity prices and exchange rates, environmental regulations, stakeholder support for growth plans, extreme winter weather, regional labour issues and other issues discussed within Risk Factors for each of our business segments. A more detailed discussion of risk factors is presented in our most recent Annual Information Form/Form 40-F, filed with securities regulatory authorities.
Commodity Prices, Refined Product Margins and Exchange Rates
Our future financial performance remains closely linked to hydrocarbon commodity prices, which can be influenced by many factors including global and regional supply and demand, seasonality, worldwide political events and weather. These factors, among others, can result in a high degree of price volatility. For example, from 2003 to 2005 the monthly average price for benchmark WTI crude oil ranged from a low of US$28.10/bbl to a high of US$65.55/bbl. During the same three-year period, the natural gas Henry Hub benchmark monthly average price ranged from a low of US$4.49/mcf to a high of US$14.07/mcf. We believe commodity price volatility will continue.
Crude oil and natural gas prices are based on U.S. dollar benchmarks that result in our realized prices being influenced by the Cdn$/US$ currency exchange rate, thereby creating an element of uncertainty. Should the Canadian dollar strengthen compared to the U.S. dollar, the negative effect on net earnings would be partially offset by foreign exchange gains on our U.S. dollar denominated debt. The opposite would occur should the Canadian dollar weaken compared to the U.S. dollar. Cash flow from operations is not impacted by the effects of currency fluctuations on our U.S. dollar denominated debt.
Changes to the Cdn$/US$ exchange rate relationship can create significant volatility in foreign exchange gains or losses. On the outstanding US$1 billion in debt at the end of 2005, a $0.01 change in the Cdn$/US$ exchange rate would change earnings by approximately $11 million after-tax.
During 2005, the strengthening of the Canadian dollar against the U.S. dollar resulted in a $31 million after-tax foreign exchange gain on our U.S. dollar denominated debt.
Our U.S. capital projects are expected to be partially funded from Canadian operations. A weaker Canadian dollar would result in a higher funding requirement for these projects.
Sensitivity Analysis (1)
|
|
|
|
|
| Approximate Change in |
| |||
|
|
|
|
|
| Cash Flow from |
| After-tax |
| |
|
| 2005 |
|
|
| Operations |
| Earnings |
| |
|
| Average |
| Change |
| ($ millions) |
| ($ millions) |
| |
|
|
|
|
|
|
|
|
|
| |
Oil Sands |
|
|
|
|
|
|
|
|
| |
Price of crude oil ($/barrel) (2) |
| $ | 53.81 |
| US$1.00 |
| 39 |
| 25 |
|
Sweet/sour differential ($/barrel) |
| $ | 14.55 |
| US$1.00 |
| 25 |
| 16 |
|
Sales (bpd) |
| 165 300 |
| 1 000 |
| 12 |
| 8 |
| |
Natural Gas |
|
|
|
|
|
|
|
|
| |
Price of natural gas ($/mcf) (2) |
| $ | 8.57 |
| 0.10 |
| 5 |
| 3 |
|
Production of natural gas (mmcf/d) |
| 190 |
| 10 |
| 21 |
| 10 |
| |
Energy Marketing and Refining – Canada |
|
|
|
|
|
|
|
|
| |
Refining/wholesale margin (cpl) (2) |
| 7.6 |
| 0.1 |
| 5 |
| 3 |
| |
Refining and Marketing – U.S.A. |
|
|
|
|
|
|
|
|
| |
Refining/wholesale margin (cpl) |
| 9.0 |
| 0.1 |
| 5 |
| 3 |
| |
Consolidated |
|
|
|
|
|
|
|
|
| |
Exchange rate: Cdn$/US |
| $ | 0.83 |
| 0.01 |
| 33 |
| 9 |
|
(1) The sensitivity analysis shows the main factors affecting Suncor’s annual cash flow from operations and earnings based on actual 2005 operations. The table illustrates the potential financial impact of these factors applied to Suncor’s 2005 results. A change in any one factor could compound or offset other factors.
(2) Includes the impact of hedging activities.
29
Derivative Financial Instruments
We periodically enter into commodity-based derivative financial instruments such as forwards, futures, swaps and options to hedge against the potential adverse impact of changing market prices due to variations in underlying commodity indices. We also periodically enter into derivative financial instrument contracts such as interest rate swaps and foreign currency contracts as part of our risk management strategy to manage exposure to interest rate and foreign exchange fluctuations.
We also use energy derivatives, including physical and financial swaps, forwards and options to gain market information and to earn trading revenues. These trading activities are accounted for at fair value in our consolidated financial statements.
Derivative contracts accounted for as hedges are not recognized in the Consolidated Balance Sheets. Realized and unrealized gains or losses on these contracts, including realized gains and losses on derivative hedging contracts settled prior to maturity, are recognized in earnings and cash flows when the related sales revenues, costs, interest expense and cash flows are recognized.
Gains or losses resulting from changes in the fair value of derivative contracts that do not qualify for hedge accounting are recognized in earnings and cash flows when those changes occur.
Commodity Hedging Activities Our crude oil hedging program has been the subject of periodic management reviews to determine the continued need for hedging in light of our tolerance for exposure to market volatility as well as the need for stable cash flow to finance future growth. In the first quarter of 2004, the Board of Directors suspended the strategic crude oil hedging program. Crude oil hedges in place at the time fixed the price on 36,000 bpd of crude oil at an average price of US$23/bbl for 2005 (79,000 bpd at an average price of US$21 to US$24/bbl in 2004). These contracts expired on December 31, 2005.
To provide an element of stability to future earnings and cash flow, we resumed our strategic crude oil hedging program in the third quarter of 2005, receiving Board approval to permit us to fix a price or range of prices for a percentage of our total production of crude for specified periods of time. At December 31, 2005 we had entered into US$ WTI agreements covering 7,000 bpd of crude oil beginning January 1, 2006 and ending December 31, 2007. Prices for these barrels are fixed within a range of US$50/bbl to an average of approximately US$93/bbl WTI. We have continued to enter into crude oil hedges during the first quarter of 2006. As at March 1, 2006, crude oil hedges totalling 50,000 bpd of production were outstanding for the remainder of 2006 and 2007. Prices for these barrels are fixed within a range of US$50/bbl to an average of US$91.70/bbl. We intend to consider additional costless collars of up to 30% of our crude oil production if strategic opportunities are available.
On settlement of swap agreements, our hedging contracts result in cash receipts or payments for the difference between the derivative contract and market rates for the applicable volumes hedged during the contract term. For collars, if market rates are within the range of the hedged contract prices, the option contracts making up the collar will expire with no exchange of cash. Such cash receipts or payments offset corresponding decreases or increases in our sales revenues or crude oil purchase costs. For accounting purposes, amounts received or paid on settlement are recorded as part of the related hedged sales or purchase transactions in the Consolidated Statements of Earnings. In 2005, crude oil hedging decreased our net earnings by $337 million compared to a decrease of $397 million in 2004 (2003 – decrease of $155 million).
Crude oil hedge contracts outstanding at December 31, 2005 were as follows:
|
|
|
| Average |
| Revenue |
|
|
|
|
| Quantity |
| Price |
| Hedged |
| Hedge |
|
|
| (bpd) |
| (US$ /bbl)(a) |
| (Cdn$ millions)(b) |
| Period (c) |
|
|
|
|
|
|
|
|
|
|
|
Costless collars |
| 7 000 |
| 50.00 – 92.57 |
| 149 – 276 |
| 2006 |
|
Costless collars |
| 7 000 |
| 50.00 – 92.57 |
| 149 – 276 |
| 2007 |
|
(a) Average price of crude oil costless collars is WTI per barrel at Cushing, Oklahoma.
(b) The revenue hedged is translated to Cdn$ at the year-end exchange rate and is subject to change as the Cdn$/US$ exchange rate fluctuates during the hedge period.
(c) Original hedge term is for the full year.
30
Financial Hedging Activities We periodically enter into interest rate swap contracts as part of our strategy to manage exposure to interest rates. The interest rate swap contracts involve an exchange of floating rate and fixed rate interest payments between ourselves and investment grade counterparties. The differentials on the exchange of periodic interest payments are recognized as an adjustment to interest expense.
We have entered into various interest rate swap transactions at December 31, 2005. The swap transactions result in an average effective interest rate that is different from the stated interest rate of the related underlying long-term debt instruments.
|
| Principal Swapped |
| Swap |
| 2005 Effective |
|
Description of swap transaction |
| ($ millions) |
| Maturity |
| Interest Rate |
|
|
|
|
|
|
|
|
|
Swap of 6.70% Medium Term Notes to floating rates |
| 200 |
| 2011 |
| 4.0 | % |
Swap of 6.80% Medium Term Notes to floating rates |
| 250 |
| 2007 |
| 4.6 | % |
Swap of 6.10% Medium Term Notes to floating rates |
| 150 |
| 2007 |
| 4.0 | % |
In 2005, these interest rate swap transactions reduced pretax financing expense by $14 million compared to a pretax reduction of $17 million in 2004 (2003 – $12 million pretax).
At December 31, 2005, we had also hedged a portion of our euro exposure created by the anticipated purchase of equipment for a total of $31 million euros in 2006 and 2007.
Fair Value of Strategic Derivative Hedging Instruments
The fair value of derivative hedging instruments is the estimated amount, based on broker quotes and internal valuation models that we would receive (pay) to terminate the contracts. Such amounts, which also represent the unrecognized and unrecorded gain (loss) on the contracts, were as follows at December 31:
($ millions) |
| 2005 |
| 2004 |
|
|
|
|
|
|
|
Revenue hedge swaps and collars |
| (4 | ) | (305 | ) |
Margin hedge swaps |
| 1 |
| 5 |
|
Interest rate swaps and foreign currency forwards |
| 22 |
| 36 |
|
|
| 19 |
| (264 | ) |
We also use derivative instruments to hedge risks specific to individual transactions. The estimated fair value of these instruments was $5 million at December 31, 2005, compared to $9 million at December 31, 2004.
Energy Trading Activities Energy trading activities focus on the commodities we produce. In addition to financial derivatives used for hedging activities, we also use energy derivatives to gain market information and earn trading revenues. These energy trading activities are accounted for using the mark-to-market method, and as such, physical and financial energy contracts are recorded at fair value at each balance sheet date. During 2005, we recorded a net pretax gain of $5 million compared to a pretax gain of $11 million in 2004 (2003 – pretax loss of $3 million) related to the settlement and revaluation of financial energy trading contracts. In 2005, the settlement of physical trading activities resulted in a net pretax gain of $15 million compared to a net pretax gain of $12 million in 2004 (2003 – $2 million net pretax gain). These gains were included as energy marketing and trading activities in the Consolidated Statements of Earnings. Net of related general and administrative costs, the combination of these activities resulted in 2005 net after-tax earnings of $11 million compared to net after-tax earnings of $12 million in 2004 (2003 – $2 million after-tax loss).
The fair value of unsettled financial energy trading assets and liabilities at December 31 was as follows:
($ millions) |
| 2005 |
| 2004 |
|
|
|
|
|
|
|
Energy trading assets |
| 82 |
| 26 |
|
Energy trading liabilities |
| 70 |
| 9 |
|
Net energy trading assets |
| 12 |
| 17 |
|
The valuation of the above contracts was based on actively quoted prices and internal valuation models.
Counterparty Credit Risk We may be exposed to certain losses in the event that the counterparties to derivative financial instruments are unable to meet the terms of the contracts. Our exposure is limited to those counterparties holding derivative contracts with net positive fair values at the reporting date. We minimize this risk by entering into agreements primarily with investment grade counterparties. Risk is also minimized through regular management review of the potential exposure to and credit ratings of such counterparties.
31
At December 31, the company had exposure to credit risk with counterparties as follows:
($ millions) |
| 2005 |
| 2004 |
|
Derivative contracts not accounted for as hedges |
| 82 |
| 7 |
|
Unrecognized derivative contracts accounted for as hedges |
| 30 |
| 21 |
|
Total |
| 112 |
| 28 |
|
Environmental Regulations
Environmental laws affect nearly all aspects of our operations, imposing certain standards and controls on activities relating to oil and gas mining, in-situ and conventional exploration, development and production. Environmental laws also affect refining, distribution and marketing of petroleum products and petrochemicals and require companies engaged in those activities to obtain necessary permits to operate. Environmental assessments and approvals are required before initiating most new projects or undertaking significant changes to existing operations.
In addition to these specifically known requirements, we expect that changes to environmental laws could impose further requirements on companies operating in the energy industry. Some of the issues include the possible cumulative impacts of oil sands development in the Athabasca region; the need to reduce or stabilize various emissions; issues relating to global climate change, including the uncertainties and risks associated with Canada’s implementation of the Kyoto Protocol, and uncertainties associated with predicting emission intensity levels from our future production; and other potential impacts of government regulation in areas such as land reclamation and restoration, water quality and usage, and reformulated fuels to support lower vehicle emissions. Changes in environmental laws could have an adverse effect on us in terms of product demand, product formulation and quality, methods of production, and distribution and operating costs. The complexity of these issues makes it difficult to predict their future impact.
We anticipate capital expenditures and operating expenses could increase in the future as a result of the implementation of new and increasingly stringent environmental regulations.
Regulatory Approvals
Before proceeding with most major projects, we must obtain regulatory approvals. The regulatory approval process can involve stakeholder consultation, environmental impact assessments and public hearings, among other factors. Failure to obtain regulatory approvals, or failure to obtain them on a timely basis, could result in delays, abandonment, or restructuring of projects and increased costs, all of which could negatively impact future earnings and cash flow.
Critical Accounting Estimates
Critical accounting estimates are defined as estimates that are important to the portrayal of our financial position and operations, and require management to make judgments based on underlying assumptions about future events and their effects. These underlying assumptions are based on historical experience and other factors that management believes to be reasonable under the circumstances, and are subject to change as new events occur, as more industry experience is acquired, as additional information is obtained and as our operating environment changes. Critical accounting estimates are reviewed annually by the Audit Committee of the Board of Directors. We believe the following are the most critical accounting estimates used in the preparation of our consolidated financial statements.
Property, Plant and Equipment
We account for our Oil Sands in-situ and NG exploration and production activities using the “successful efforts” method. This policy was selected over the alternative of the full-cost method because we believe it provides more timely accounting of the success or failure of exploration and production activities.
The application of the successful efforts method of accounting requires management to determine the proper classification of activities designated as developmental or exploratory, which then determines the appropriate accounting treatment of the costs incurred. The results from a drilling program can take considerable time to analyze and the determination that commercial reserves have been discovered requires both judgment and industry experience. Where it is determined that exploratory drilling will not result in commercial production, the exploratory dry hole costs are written off and reported as part of Oil Sands and NG exploration expenses in the Consolidated Statements of Earnings. Dry hole expense can fluctuate from year to year due to such factors as the level of exploratory spending, the level of risk sharing with third parties participating in the exploratory drilling and the degree of risk in drilling in particular areas.
Properties that are assumed to be productive may, over a period of time, actually deliver oil and gas in quantities different than originally estimated because of changes in reservoir performance and/or adjustments in reserves. Such changes may require a test for the potential impairment of capitalized properties based on estimates of future cash
32
flow from the properties. Estimates of future cash flows are subject to significant management judgment concerning oil and gas prices, production quantities and operating costs. Where management assesses that a property is fully or partially impaired, the book value of the property is reduced to fair value and either completely removed (“written off”) or partially removed (“written down”) in our records and reported as part of Oil Sands and NG DD&A expenses in the Consolidated Statements of Earnings.
Our plant and equipment are depreciated on a straight-line basis over the estimated useful life of the assets. The straight-line basis reflects asset usage as a function of time rather than production levels. For example, the useful life of plant and equipment at our Oil Sands base operations and our Firebag operations are not based on recorded reserves as we have access to other undeveloped properties, and bitumen feedstock from third parties, as well as the ability to provide processing services for other producers’ bitumen. Firebag and NG property costs are depleted on a unit of production (UOP) basis. UOP amortization is used where that method better matches the asset utilization with the production associated with the asset. In each case, the expense is shown on the DD&A line in both the Consolidated Statements of Earnings and in the Schedules of Segmented Earnings.
We determine useful life based on prior experience with similar assets and, as necessary, in consultation with others who have expertise with the assets in question. However, the actual useful life of the assets may differ from our original estimate due to factors such as technological obsolescence, regulatory requirements and maintenance activity. As the majority of assets are depreciated on a straight-line basis, a 10% reduction in the useful life of plant and equipment would increase annual DD&A by approximately 10%. This impact would be reflected in all of our business segments with the majority of the impact being in Oil Sands.
Negative revisions in NG reserves estimates will result in an increase in depletion expenses.
We also continuously look at ways to further utilize technological advancements and opportunities for future growth. The classification of research and development costs as either capital or expense is dependent upon specific criteria, including production feasibility, available resources and management commitment.
Overburden
As part of the process of mining oil sands, it is necessary to remove surface material such as muskeg, glacial deposits and sand. This surface material is referred to as overburden, removal of which precedes mining of the oil sands deposits.
Accordingly, the quantity of overburden removed in a given period may not bear any relationship to the quantity of oil sands mined in the period, and as such the cash outlays can be different than the amount amortized. In 2005, the overburden amortization charge was $178 million (2004 – $225 million; 2003 – $208 million) compared with actual cash overburden spending of $287 million (2004 – $222 million; 2003 – $175 million). Oil Sands overburden amortization is reported as part of DD&A in the Consolidated Statements of Earnings. Deferred overburden costs are reported as part of “deferred charges and other” in the Consolidated Balance Sheets.
To ensure that each tonne of oil sands mined is allocated a proportionate share of overburden removal costs, we use the deferral method of accounting for overburden removal costs whereby all such costs are initially set up as a deferred charge.
To allocate the deferred overburden charges, a life of mine approach is used for each mine pit, relating the removal of all overburden (on a volume basis) to the mining of all of the oil sands ore on leases where there is regulatory approval (on a tonnage basis). By adopting this approach, an overburden “stripping ratio” is calculated that relates overburden removal costs to all proved and probable oil sands ore reserves. Over time, through a combination of increased mine areas, additional drilling activity and operational experience, we have seen our stripping ratios vary, which can increase or decrease the overburden amortization costs charged to the earnings statement. In 2005, the stripping ratio decreased by approximately 10% due to new operational information and mine plan changes. The effects of the decreased stripping ratio were offset by higher per unit overburden removal costs. The $135 million increase in the amount of overburden deferred in 2005 compared to 2004 is therefore primarily due to increased overburden volumes moved (see page 43).
Our existing policy of accounting for overburden may be revised in 2006. Refer to “Recently Issued Canadian Accounting Standards” on page 39.
Asset Retirement Obligations (ARO)
We are required to recognize a liability for the future retirement obligations associated with our property, plant and equipment. An ARO is only recognized to the extent there is a legal obligation associated with the retirement of a tangible long-lived asset that we are required to settle as a result of an existing or enacted law, statute, ordinance, written or oral contract, or by legal construction of a contract under the doctrine of promissory estoppel. The ARO is based on estimated costs, taking into account the anticipated method and extent of restoration consistent
33
with legal requirements, technological advances and the possible use of the site. Since these estimates are specific to the sites involved, there are many individual assumptions underlying our total ARO amount. These individual assumptions can be subject to change based on experience.
The ARO is measured at fair value and discounted to present value using a credit-adjusted risk-free discount rate of 5.6% (2004 – 6%). The ARO accretes over time until we settle the obligation, the effect of which is included in a separate line in the Consolidated Statements of Earnings entitled “Accretion of asset retirement obligations”. Payments to settle the obligations occur on an ongoing basis and will continue over the lives of the operating assets, which can exceed 35 years. The discount rate is adjusted as appropriate, to reflect long-term changes in market rates and outlook.
An ARO is not recognized for assets with an indeterminate useful life because the amount cannot be reasonably estimated. An ARO for these assets will be recorded in the first period in which the lives of the assets are determinable.
In connection with company reviews of Oil Sands and NG completed in the fourth quarter of 2005, we increased our estimated undiscounted total obligation to approximately $1.2 billion from the previous estimate of $1.1 billion. The increase was primarily due to a change in the Oil Sands estimate from $940 million to $1,080 million, primarily reflecting increased estimated costs related to consolidated tailings projects and increased land reclamation and reforestation costs. The majority of the costs in Oil Sands are projected to occur over a time horizon extending to approximately 2060. In 2006, these changes in the ARO estimate are anticipated to result in additional after-tax expenses of approximately $4 million. The discounted amount of our ARO liability was $543 million at December 31, 2005 compared to $476 million at December 31, 2004.
The greatest area of judgment and uncertainty with respect to our asset retirement obligations relates to our Oil Sands mining leases where there is a requirement to provide for land productivity equivalent to pre-disturbed conditions. To reclaim tailings ponds, we are using a process referred to as consolidated tailings technology. At this time, no ponds have been fully reclaimed using this technology, although work is under way. The success and time to reclaim the tailings ponds could increase or decrease the current asset retirement cost estimates. The company continues to monitor and assess other possible technologies and/or modifications to the consolidated tailings process now being used.
Reserves Estimates
We are a Canadian issuer subject to Canadian reporting requirements, including rules in connection with the reporting of our reserves. However, we have received an exemption from Canadian Securities Administrators permitting us to report our reserves in accordance with U.S. disclosure requirements. Pursuant to U.S. disclosure requirements, we disclose net proved conventional oil and gas reserves, including natural gas reserves and bitumen reserves from our Firebag in-situ leases, using constant dollar cost and pricing assumptions. As there is no recognized posted bitumen price, these assumptions are based on a posted benchmark oil price adjusted for transportation, gravity and other factors that create the difference (“differential”) in price between the posted benchmark price and Suncor’s bitumen. Both the posted benchmark price and the differential are generally determined as of a point in time, namely, December 31 (“Constant Cost and Pricing”). Reserves from our Firebag in-situ leases are reported as barrels of bitumen, using these Constant Cost and Pricing assumptions (see “Required U.S. Oil and Gas and Mining Disclosure – Proved Conventional Oil and Gas Reserves” for net proved conventional oil and gas reserves on page 36).
Pursuant to U.S. disclosure requirements, we also disclose gross and net proved and probable mining reserves. The estimates of our gross and net mining reserves are based in part on the current mine plan and estimates of extraction recovery and upgrading yields. We report mining reserves as barrels of synthetic crude oil based on a net coker, or synthetic crude oil yield from bitumen of 80%. During 2005, we reached an agreement with the Government of Alberta finalizing the terms of our option to transition to the generic bitumen-based royalty regime commencing in 2009, allowing us to prepare an estimate of our net mining reserves. The estimate of our net mining reserves reflects the relative value of Alberta Crown and freehold royalty burdens under constant December 31st bitumen pricing and assumes we will elect to transfer to a bitumen-based Crown royalty effective at the beginning of 2009 (see “Required U.S. Oil and Gas and Mining Disclosure – Proved and Probable Oil Sands Mining Reserves” for both gross and net, proved and probable mining reserves). Our Firebag in-situ leases are subject to Crown royalty based on bitumen, rather than synthetic crude oil (for a full discussion of our Oil Sands Crown royalties, see page 27).
In addition to required disclosure, our exemption issued by Canadian securities administrators permits us to provide further disclosure voluntarily. We provide this additional
34
voluntary disclosure to show aggregate proved and probable oil sands reserves, including both mining reserves and reserves from our Firebag in-situ leases. In our voluntary disclosure, we report our aggregate reserves on the following basis:
• Gross and net proved and probable mining reserves, on the same basis as disclosed pursuant to U.S. disclosure requirements (reported as barrels of synthetic crude oil based on a net coker, or synthetic crude oil yield from bitumen of 80%); and
• Gross and net proved and probable bitumen reserves from Firebag in-situ leases, evaluated based on normalized constant dollar cost and pricing assumptions. These assumptions use a posted benchmark oil price as at December 31, but apply a differential generally intended to represent a normalized annual average for the year (“Annual Average Differential Pricing”), rather than a point in time differential, in accordance with Canadian Securities Administrators Staff Notice 51-315 (“CSA Staff Notice 51-315”). Bitumen reserves estimated on this basis are subsequently converted, for aggregation purposes only, to barrels of synthetic crude oil based on a net coker or synthetic crude oil yield from bitumen of 80%.
Accordingly, our voluntary disclosures of reserves from our Firebag in-situ leases will differ from our required U.S. disclosure in four ways. Reserves from our Firebag in-situ leases under our voluntary disclosure:
• are disclosed on a gross basis as well as the required net basis under U.S. disclosure requirements;
• are converted from barrels of bitumen under U.S. disclosure requirements to barrels of synthetic crude oil for aggregation purposes only;
• are evaluated based on 2005 Annual Average Differential Pricing assumptions, in accordance with CSA Staff Notice 51-315, versus Constant Cost and Pricing assumptions pursuant to U.S. disclosure requirements; and
• include proved plus probable reserves, rather than proved reserves only under U.S. disclosure requirements.
Under the U.S. disclosure requirements described above, our Firebag in-situ reserves were determined to be entirely uneconomic at December 31, 2004. In 2005, Constant Cost and Pricing assumptions were again applied to assess economic viability of our in-situ reserves. This assessment resulted in the rebooking of proved reserves at December 31, 2005 (see “Required U.S. Oil and Gas and Mining Disclosure – Proved Conventional Oil and Gas Reserves” on page 36).
Under our voluntary disclosure, using 2005 Annual Average Differential Pricing, our Firebag in-situ reserves were also determined to be economic and accordingly, were disclosed under “Voluntary Oil Sands Reserves Disclosure – Estimated Gross and Net Proved and Probable Oil Sands Reserves Reconciliations”. Comparisons of reserve estimates under “Required U.S. Oil and Gas and Mining Disclosure” and “Voluntary Oil Sands Reserves Disclosure” will show material differences based on the pricing assumptions used, whether the reserves are reported as barrels of bitumen or barrels of synthetic crude oil, whether probable reserves are included, and whether the reserves are reported on a gross or net basis.
All of our reserves have been evaluated as at December 31, 2005 by independent petroleum consultants, GLJ Petroleum Consultants Ltd. (GLJ). In reports dated February 21, 2006 (“GLJ Oil Sands Reports”), GLJ evaluated our proved and probable reserves on our oil sands mining and Firebag in-situ leases, pursuant to both U.S. disclosure requirements using Constant Cost and Pricing assumptions, and pursuant to CSA Staff Notice 51-315, using 2005 Annual Average Differential Pricing assumptions.
Estimates in the GLJ Oil Sands Reports consider recovery from leases for which regulatory applications have been submitted and no anticipated impediment to the receipt of regulatory approval is expected. The mining reserve estimates are based on a detailed geological assessment and also consider industry practice, drill density, production capacity, extraction recoveries, upgrading yields, mine plans, operating life and regulatory constraints.
For Firebag in-situ reserve estimates, GLJ considered similar factors such as our regulatory approval, or likely impediments to the receipt of pending regulatory approval, project implementation commitments, detailed design estimates, detailed reservoir studies, demonstrated commercial success of analogous commercial projects and drill density. Our proved reserves are delineated to within 80-acre spacing with 3D seismic control (or 40-acre spacing without 3D seismic control) while our probable reserves are delineated to within a 320-acre spacing with 3D seismic control (or 160-acre spacing without 3D seismic control). The major facility expenditures to develop our proved undeveloped reserves have been approved by our Board. Plans to develop our probable undeveloped reserves in subsequent phases are under way but have not yet received final approval from our Board.
In a report dated February 21, 2006 (“GLJ NG Report”), GLJ also evaluated our proved reserves of natural gas, natural gas liquids and crude oil (other than reserves from mining leases and the Firebag in-situ reserves) as at December 31, 2005.
35
More information about the evaluation of our reserves by GLJ, as well as additional oil and gas data, is available in our most recent Annual Information Form, which is filed with the United States Securities and Exchange Commission under cover of Form 40-F.
Our reserves estimates will continue to be impacted by drilling data and operating experience, as well as technological developments and economic considerations.
Net reserves represent Suncor’s undivided percentage interest in total reserves after deducting Crown Royalties, freehold and overriding royalty interests. Reserve estimates are based on assumptions about pricing, production levels, operating costs and capital expenditures. These assumptions reflect market conditions, as required, at December 31, 2005 which could differ significantly from other points in time throughout the year, or future periods. These market conditions and assumptions can materially impact the estimation of net reserves.
Required U.S. Oil and Gas and Mining Disclosure
Proved and Probable Oil Sands Mining Reserves
|
| Proved |
| Probable |
| Proved & Probable |
| ||||||
Millions of barrels of synthetic crude oil (1) |
| Gross (2) |
| Net (3) |
| Gross (2) |
| Net (3) |
| Gross (2) |
| Net (3) |
|
|
|
|
|
|
|
|
|
|
|
|
|
|
|
December 31, 2004 |
| 939 |
| 916 |
| 847 |
| 837 |
| 1 786 |
| 1 753 |
|
Revisions of previous estimates |
| 645 |
| 575 |
| (439 | ) | (438 | ) | 206 |
| 137 |
|
Extensions and discoveries |
| — |
| — |
| 488 |
| 463 |
| 488 |
| 463 |
|
Production |
| (56 | ) | (51 | ) | — |
| — |
| (56 | ) | (51 | ) |
December 31, 2005 |
| 1 528 |
| 1 440 |
| 896 |
| 862 |
| 2 424 |
| 2 302 |
|
(1) Synthetic crude oil reserves are based upon a net coker, or synthetic crude oil yield from bitumen of 80% (2004 – 80% to 81%).
(2) Our gross mining reserves are based in part on our current mine plan and estimates of extraction recovery and upgrading yields, rather than an analysis based on constant dollar or forecast pricing and cost assumptions.
(3) Net mining reserves reflect the relative value of Crown, freehold and overriding royalty burdens under constant December 31st pricing and assumes we will elect to transfer to a bitumen-based Crown royalty effective at the beginning of 2009.
Proved Conventional Oil and Gas Reserves
The following data is provided on a net basis in accordance with the provisions of the Financial Accounting Standards Board’s Statement No. 69 (Statement 69). This statement requires disclosure of conventional oil and gas activities only, and therefore our Oil Sands mining activities are excluded, while our Firebag in-situ reserves are included.
Net Proved Reserves (1)
Crude Oil, Natural Gas Liquids and Natural Gas
|
|
|
| Natural Gas |
|
|
|
|
|
|
| Oil Sands business: |
| business: crude |
|
|
|
|
|
|
| Firebag - crude |
| oil and natural |
|
|
| Natural Gas |
|
|
| oil (millions |
| gas liquids |
| Total |
| business: natural |
|
|
| of barrels |
| (millions |
| (millions |
| gas (billions |
|
Constant Cost and Pricing as at December 31 |
| of bitumen) (2) (3) (4) |
| of barrels) |
| of barrels) |
| of cubic feet) |
|
|
|
|
|
|
|
|
|
|
|
December 31, 2004 |
| — | (3) | 8 |
| 8 |
| 446 |
|
Revisions on previous estimates (5) |
| 639 |
| — |
| 639 |
| 14 |
|
Purchases of minerals in place |
| — |
| — |
| — |
| — |
|
Extensions and discoveries |
| — |
| — |
| — |
| 40 |
|
Production |
| (7 | ) | (1 | ) | (8 | ) | (50 | ) |
Sales of minerals in place |
| — |
| — |
| — |
| (1 | ) |
December 31, 2005 |
| 632 |
| 7 |
| 639 |
| 449 |
|
(1) Our undivided percentage interest in reserves, after deducting Crown royalties, freehold royalties and overriding royalty interests. Our Firebag leases are only subject to Crown royalties.
(2) Although we are subject to Canadian disclosure rules in connection with the reporting of our reserves, we have received exemptive relief from Canadian securities administrators permitting us to report our proved reserves in accordance with U.S. disclosure practices.
(3) Estimates of proved reserves from our Firebag in-situ leases are based on Constant Costs and Pricing assumptions as at December 31. In 2004, due to unusually low year-end posted benchmark oil prices, and unusually high year-end diluent prices, our proved reserves were determined to be uneconomic. Under 2005 Constant Cost and Pricing assumptions, we have rebooked our proved reserves.
(4) We have the option of selling the bitumen production from these leases or upgrading the bitumen to synthetic crude oil. With the completion of upgrading expansion projects during 2005, all bitumen is expected to be processed into synthetic crude oil in the future.
(5) Includes total infill drilling of 23 billion cubic feet (bcf) in 2005.
36
Voluntary Oil Sands Reserves Disclosure
Oil Sands Mining and Firebag
In-situ Reserves Reconciliation
The following tables set out, on a gross and net basis, a reconciliation of our proved and probable reserves of synthetic crude oil from our Oil Sands mining leases and bitumen (converted to synthetic crude oil for comparison purposes only) from our Firebag in-situ leases, from December 31, 2004 to December 31, 2005, based on the GLJ Oil Sands Reports, in accordance with CSA Staff Notice 51-315, using 2005 Annual Average Differential Pricing assumptions.
Estimated Gross Proved and Probable Oil Sands Reserves Reconciliation
|
| Oil Sands Mining Leases (1) (2) |
| Firebag In-situ Leases (1) (3) |
| Total Mining |
| ||||||||
|
|
|
|
|
| Proved |
|
|
|
|
| Proved |
| Proved |
|
Millions of barrels of synthetic crude oil (1) |
| Proved |
| Probable |
| & Probable |
| Proved |
| Probable |
| & Probable |
| & Probable |
|
December 31, 2004 |
| 939 |
| 847 |
| 1 786 |
| 494 |
| 1 900 |
| 2 394 |
| 4 180 |
|
Revisions of previous estimates |
| 645 |
| (439 | ) | 206 |
| 73 |
| (131 | ) | (58 | ) | 148 |
|
Improved Recovery |
| — |
| — |
| — |
| — |
| 368 |
| 368 |
| 368 |
|
Extensions and discoveries |
| — |
| 488 |
| 488 |
| — |
| — |
| — |
| 488 |
|
Production |
| (56 | ) | — |
| (56 | ) | (6 | ) | — |
| (6 | ) | (62 | ) |
December 31, 2005 |
| 1 528 |
| 896 |
| 2 424 |
| 561 |
| 2 137 |
| 2 698 |
| 5 122 |
|
Estimated Net Proved and Probable Oil Sands Reserves Reconciliation
|
| Oil Sands Mining Leases (1) (2) |
| Firebag In-situ Leases (1) (3) |
| Total Mining |
| ||||||||
|
|
|
|
|
| Proved |
|
|
|
|
| Proved |
| Proved |
|
Millions of barrels of synthetic crude oil (1) |
| Proved |
| Probable |
| & Probable |
| Proved |
| Probable |
| & Probable |
| & Probable |
|
December 31, 2004 |
| 916 |
| 837 |
| 1 753 |
| 457 |
| 1 714 |
| 2 171 |
| 3 924 |
|
Revisions of previous estimates |
| 575 |
| (438 | ) | 137 |
| 105 |
| (38 | ) | 67 |
| 204 |
|
Improved Recovery |
| — |
| — |
| — |
| — |
| 353 |
| 353 |
| 353 |
|
Extensions and discoveries |
| — |
| 463 |
| 463 |
| — |
| — |
| — |
| 463 |
|
Production |
| (51 | ) | — |
| (51 | ) | (6 | ) | — |
| (6 | ) | (57 | ) |
December 31, 2005 |
| 1 440 |
| 862 |
| 2 302 |
| 556 |
| 2 029 |
| 2 585 |
| 4 887 |
|
(1) | Synthetic crude oil reserves are based on a net coker, or synthetic crude oil yield from bitumen of 80% for reserves under Oil Sands Mining and under Firebag In-situ leases. Although virtually all of our bitumen from the Oil Sands mining leases is upgraded into synthetic crude oil, we have the option of selling the bitumen produced from our Firebag in-situ leases and/or upgrading this bitumen into synthetic crude oil. Accordingly, these bitumen reserves are converted to synthetic crude oil for aggregation purposes only. | |
| ||
(2) | Our gross mining reserves are evaluated in part, based on the current mine plan and estimates of extraction recovery and upgrading yields, rather than an analysis based on constant dollar or forecast pricing assumptions. Net mining reserves reflect the relative value of Crown, freehold and overriding royalty burdens under constant December 31st pricing and assumes we will elect to transfer to a bitumen-based Crown royalty effective at the beginning of 2009. | |
| ||
(3) | Under Required U.S. Oil and Gas and Mining Disclosure, we reported proved reserves from our Firebag in-situ leases. The disclosure in the table above reports proved reserves from these leases and differs in the following four ways. Reserves from our Firebag in-situ leases under our voluntary disclosure: | |
| ||
| (a) | are disclosed on a gross basis as well as the required net basis under required U.S. disclosure requirements; |
| (b) | are converted from barrels of bitumen to barrels of synthetic crude oil in this table for aggregation purposes only; |
| (c) | are evaluated based on Annual Average Differential Pricing assumptions versus point-in-time Constant Cost and Pricing assumptions as at December 31. Accordingly, Firebag in-situ reserve estimates under “Required U.S. Oil and Gas and Mining Disclosure – Proved Conventional Oil and Gas Reserves” and Firebag in-situ proved reserve estimates in this table differ materially; and |
| (d) | include proved plus probable reserves, rather than proved reserves only under U.S. disclosure requirements. U.S. companies do not disclose probable reserves for non-mining properties. We voluntarily disclose our probable reserves for our Firebag in-situ leases as we believe this information is useful to investors, and allows us to aggregate our mining and in-situ reserves into a consolidated total for our Oil Sands business. As a result, our Firebag in-situ estimates in the above tables are not comparable to those made by U.S. companies. |
Employee Future Benefits
We provide a range of benefits to our employees and retired employees, including pensions and other post-retirement health care and life insurance benefits. The determination of obligations under our benefit plans and related expenses requires the use of actuarial valuation methods and assumptions. Assumptions typically used in determining these amounts include, as applicable, rates of employee turnover, future claim costs, discount rates, future salary and benefit levels, return on plan assets, mortality rates and future medical costs. The fair value of plan assets is determined using market values. Actuarial valuations are subject to management judgment. Management continually reviews these assumptions in light of actual experience and expectations for the future. Changes in assumptions are accounted for on a prospective basis. Employee future benefit costs are reported as part of operating, selling and general expenses
37
in our Consolidated Statements of Earnings and Schedules of Segmented Data. The accrued benefit liability is reported as part of “accrued liabilities and other” in the Consolidated Balance Sheets.
The assumed rate of return on plan assets considers the current level of expected returns on the fixed income portion of the plan assets portfolio, the historical level of risk premium associated with other asset classes in the portfolio and the expected future returns on each asset class. The discount rate assumption is based on the year-end interest rate on high-quality bonds with maturity terms equivalent to the benefit obligations. The rate of compensation increases is based on management’s judgment. The accrued benefit obligation and net periodic benefit cost for both pensions and other post-retirement benefits may differ significantly if different assumptions are used. A 1% change in the assumptions at which pension benefits and other post-retirement benefit liabilities could be effectively settled is as noted below.
|
| Rate of Return |
|
|
|
|
| Rate of |
| ||||
|
| on Plan Assets |
| Discount Rate |
| Compensation Increase |
| ||||||
|
| 1% |
| 1% |
| 1% |
| 1% |
| 1% |
| 1% | �� |
($ millions) |
| Increase |
| Decrease |
| Increase |
| Decrease |
| Increase |
| Decrease |
|
Increase (decrease) to net periodic benefit cost |
| (4 | ) | 4 |
| (15 | ) | 17 |
| 7 |
| (7 | ) |
Increase (decrease) to benefit obligation |
| — |
| — |
| (119 | ) | 140 |
| 35 |
| (33 | ) |
Health care costs comprise a significant element of our post-employment benefit obligation and is an area where there is increasing cost pressure due to an aging North American population. We have assumed a 10% annual rate of increase in the per capita cost of covered health care benefits for 2005, with an assumption that this rate will decrease by 0.5% annually, to 5% by 2015, and remain at that level thereafter.
A 1% change in the assumed health care cost trend rate would have the following effect:
|
| 1% |
| 1% |
|
($ millions) |
| Increase |
| Decrease |
|
Increase (decrease) to total of service and interest cost components of net periodic post-retirement health care benefit cost |
| 1 |
| (1 | ) |
Increase (decrease) to the health care component of the accumulated post-retirement benefit obligation |
| 13 |
| (11 | ) |
Control Environment
Based on their evaluation as of December 31, 2005, our Chief Executive Officer and Chief Financial Officer concluded that our disclosure controls and procedures (as defined in Rules 13(a)-15(e) and 15(d)-15(e) under the United States Securities Exchange Act of 1934 (the Exchange Act)) are effective to ensure that information required to be disclosed by us in reports that we file or submit under the Exchange Act is recorded, processed, summarized and reported within the time periods specified in the SEC rules and forms. In addition, other than as described below, as of December 31, 2005, there were no changes in our internal control over financial reporting that occurred during 2005 that have materially affected, or are reasonably likely to materially affect, our internal control over financial reporting. We will continue to periodically evaluate our disclosure controls and procedures and internal control over financial reporting and will make any modifications from time to time as deemed necessary.
We are in the process of implementing an enterprise resource planning (ERP) system in all of our businesses to facilitate our growth plan. The phased implementation is currently planned to be complete by the end of 2006. Implementing an ERP system on a widespread basis involves significant changes in business processes and extensive organizational training. We currently believe a phased-in approach reduces the risks associated with making these changes. We believe we are taking the necessary steps to monitor and maintain appropriate internal control over financial reporting during this transition period. These steps include deploying resources to mitigate internal control risks and performing additional verifications and testing to ensure data integrity.
In connection with the continued implementation of our ERP system, we expect there will be a significant redesign of our business processes during 2006, some of which relate to internal control over financial reporting and disclosure controls and procedures.
38
Change In Accounting Policies
Preferred Securities
On January 1, 2005, we retroactively adopted the Canadian accounting standard related to disclosure and presentation of financial instruments. Accordingly, our preferred securities, which were redeemed in March 2004, have been reclassified as long-term debt and the preferred dividends have been reclassified as financing expense. We have restated our property, plant and equipment and depreciation, depletion and amortization to reflect capitalized interest that would have been incurred and amortized had the preferred securities been classified as debt during the period in which they were outstanding. The impact of adopting this standard was an increase to property, plant and equipment of $37 million.
Consolidation of Variable Interest Entities
On January 1, 2005, we prospectively adopted Canadian Accounting Guideline 15 – “Consolidation of Variable Interest Entities” (VIE’s). Accordingly, we consolidated the VIE related to the sale of equipment as described on page 26. The impact of adopting this standard was an increase to property, plant and equipment of $14 million, an increase to materials and supplies inventory of $8 million and an increase to long-term debt of $22 million. There was no impact to net earnings.
Recently Issued Canadian Accounting Standards
Non-monetary Transactions
In 2005, the Canadian Institute of Chartered Accountants (CICA) approved Handbook Section 3831 “Non-Monetary Transactions”. Effective January 1, 2006, all non-monetary transactions must be measured at fair value (if determinable) unless the transaction lacks commercial substance, is an exchange of a product held for sale in the ordinary course of business, or is a product to be sold in the same line of business. Commercial substance exists when the company’s future cash flows are expected to change significantly as a result of a transaction. We will be required to record the effects of an existing contract at Oil Sands that exchanges off-gas produced as a by-product of the upgrading operations for natural gas. An equal amount of revenues for the sale of the off-gas and purchases of crude oil and products for the purchase of natural gas will be recorded. The amount of the gross-up will be dependent on the prevailing prices for natural gas. Currently this transaction is recorded on a net basis in purchases of crude oil and products. Retroactive adjustment is prohibited by the standard.
Overburden Removal Costs
On February 16, 2006, the Emerging Issues Committee of the CICA approved an abstract regarding the treatment of overburden costs in the mining industry effective July 1, 2006. The proposed abstract would require the capitalization of overburden removal costs when such costs represent a betterment to the mine property by facilitating access to reserves in future periods. Costs are to be treated as variable production costs and expensed as incurred when no betterment exists. We currently amortize the cost of overburden removal using stripping ratios based on a life of mine approach. We are considering expensing overburden costs as incurred on a retroactive basis effective from January 1, 2006. With the exception of the impact on 2005 net earnings, the effect of adopting the standard is not expected to be significant. Net earnings in 2005 would be reduced by approximately $87 million due to increased amounts of overburden moved during the year.
Financial Instruments/Other Comprehensive Income/Hedges
In 2005, the CICA approved Handbook Section 3855 “Financial Instruments – Recognition and Measurement”; Section 1530 – “Comprehensive Income” and Section 3865 “Hedges”. Effective January 1, 2007, these standards require the presentation of financial instruments at fair value on the balance sheet.
For specific transactions identified as hedges, changes in fair value are recognized in net earnings or other comprehensive income based on the type and effectiveness of the individual instruments. Upon adoption, our presentation will be aligned with the current U.S. GAAP reporting as outlined in note 18 to our Consolidated Financial Statements.
Other comprehensive income will represent the foreign currency translation of self-sustaining subsidiaries, the fair value gains/losses of specific financial investments (available for sale) and the effective portion of gains/losses of cash flow hedges. Presentation of other comprehensive income will require a change in the presentation of the Consolidated Statements of Earnings.
39
OIL SANDS
Located near Fort McMurray, Alberta, our Oil Sands business forms the foundation of our growth strategy and represents the most significant portion of our assets. The Oil Sands business recovers bitumen through mining and in-situ development and upgrades it into refinery feedstock, diesel fuel and byproducts. Our marketing plan also calls for sales of bitumen when production from mining and in-situ operations exceed upgrading capacity, assuming market conditions are favourable.
Oil Sands strategy focuses on:
• | Acquiring long-life leases with substantial bitumen resources in place. |
• | Sourcing low-cost bitumen supply through mining, in-situ development and third party supply agreements, and upgrading this bitumen supply into high value crude oil products that meet market demand. |
• | Increasing production capacity and improving reliability through staged expansion of Oil Sands upgrading facilities. |
• | Reducing costs through the application of technologies, economies of scale, direct management of growth projects, strategic alliances with key suppliers and continuous improvement of operations. |
• | Pursuing new technology applications to increase production, reduce costs and reduce environmental impacts. |
HIGHLIGHTS
Summary of Results
($ millions unless otherwise noted) |
| 2005 |
| 2004 |
| 2003 |
|
|
|
|
|
|
|
|
|
Revenue |
| 3 965 |
| 3 640 |
| 3 101 |
|
Production (thousands of bpd) |
| 171.3 |
| 226.5 |
| 216.6 |
|
Average sales price ($/barrel) |
| 53.81 |
| 42.28 |
| 37.19 |
|
Net earnings |
| 1 073 |
| 994 |
| 887 |
|
Cash flow from operations |
| 1 895 |
| 1 752 |
| 1 803 |
|
Total assets |
| 11 850 |
| 9 067 |
| 7 970 |
|
Cash used in investing activities |
| 1 929 |
| 1 087 |
| 1 060 |
|
Net cash surplus (deficiency) |
| (257 | ) | 737 |
| 799 |
|
ROCE (%) (1) |
| 24.3 |
| 22.9 |
| 20.8 |
|
ROCE (%) (2) |
| 17.6 |
| 18.8 |
| 17.4 |
|
(1) | Excludes capitalized costs related to major projects in progress. Return on capital employed (ROCE) for our operating segments is calculated in a manner consistent with consolidated ROCE as reconciled in Non GAAP Financial Measures. See Page 56. |
(2) | Includes capitalized costs related to major projects in progress.See page 56. |
2005 Overview
• | In September 2005, we completed rebuilding portions of our Oil Sands plant that were damaged by fire on January 4, 2005. The recovery and planned maintenance work was completed on schedule and the plant was running at full capacity by the end of September. |
|
|
• | In October, we successfully commissioned an expansion of our Oil Sands facilities by adding a vacuum unit to Upgrader 2, increasing our capacity to 260,000 barrels per day (bpd) from 225,000 bpd. Construction was completed on schedule and on budget. See page 26. |
|
|
• | Our Firebag Stage 2 in-situ project entered the start-up phase, with first oil in the fourth quarter of 2005. Commercial operations are expected to commence in the first quarter of 2006. See page 26. |
40
• | Construction continued on the estimated $2.1 billion project that, when complete in 2008, is expected to increase upgrading capacity to 350,000 bpd. The centrepiece of this expansion is the addition of a third pair of cokers to Upgrader 2. Fabrication and placement of the coke drums is complete, and the project remains on schedule and within budget projections. See page 26. |
|
|
• | An application was filed with Alberta regulators to construct and operate a third Oil Sands upgrader, designed to increase our production capacity to 500,000 to 550,000 bpd by 2012. We also filed an application with Alberta regulators requesting permission to proceed with the Steepbank mine extension. |
Analysis of Net Earnings
Net earnings were $1,073 million in 2005 compared to $994 million in 2004 (2003 – $887 million). The increase in net earnings was due primarily to high price realizations on the Oil Sands basket of products, reflecting higher benchmark WTI prices, the receipt of fire insurance proceeds and lower hedging losses. These positive factors were largely offset by widening light/heavy crude oil differentials, decreased production and sales volumes and a decrease in the sales mix of sweet crude oil and diesel fuel compared to sour crude oil and bitumen as a result of the fire.
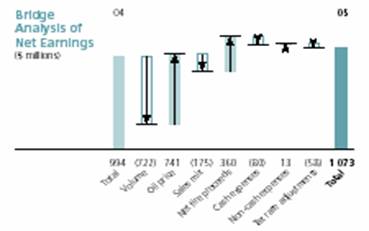
Oil Sands average production was 171,300 bpd in 2005, compared to 226,500 bpd in 2004. Sales volumes in 2005 averaged 165,300 bpd compared with 226,300 bpd in 2004. Lower sales volumes decreased 2005 net earnings by $722 million. The decrease in 2005 production and sales volumes was due largely to the effects of the January 4, 2005 fire that reduced production to an average of 122,000 bpd for the first nine months of the year. The build in inventory volumes during 2005 was primarily due to the expanded storage and production facilities that came online during the fourth quarter of 2005.
Sales volumes of higher value diesel fuel and sweet crude products decreased to 54% of total sales volumes in 2005 from 63% in 2004, reflecting the negative impact of the fire, increased bitumen sales from our in-situ operations and the start up of the vacuum unit expansion project. Starting in mid October 2005, all bitumen produced from our Firebag operations was upgraded. Prior to that, bitumen from Firebag was sold directly into the marketplace. The decrease in sweet products as a percentage of our total sales volumes decreased earnings by $175 million. As a result of the new vacuum unit, we anticipate that our sales mix of high value diesel fuel and sweet crude products in 2006 will be 56%(1) of our total sales volumes.

(1) We continue to gain experience in operating facilities that were newly commissioned in late 2005, therefore is more uncertainty in 2006 plans than in prior years.
41
Sales price realizations averaged $53.81 per barrel in 2005 (including the impact of pretax hedging losses of $535 million) compared with $42.28 per barrel in 2004 (including the impact of pretax hedging losses of $620 million). The average sales price realization was favourably impacted by stronger WTI benchmark crude oil prices as well as higher positive differentials for synthetic sweet crude oil and diesel fuel. These factors were partially offset by wider differentials on sour crude oil and bitumen blends, as well as the continued strengthening of the Canadian dollar compared to the U.S. dollar. As crude oil is sold based on U.S. dollar benchmark prices, the narrowing exchange rate decreased the Canadian dollar value of crude oil products.
The impact of the above pricing factors increased net earnings by $741 million in 2005.
Net Fire Proceeds
In 2005, we recognized $572 million in insurance proceeds, net of the write-off of damaged assets and related expenses. During 2005, we received $115 million (US$95 million) from our property loss policy and $594 million (US$500 million) in proceeds from our BI policies, including $175 million (US$150 million)received in January and February 2006. Net fire proceeds increased net earnings by $360 million. For further discussion of our insurance policies, see page 24.
Cash Expenses
Cash expenses increased to $1,325 million from $1,191 million in 2004 (2003 – $1,053 million). Expenses were higher year-over-year due to the following factors:
• | Higher natural gas costs of approximately $110 million reflecting higher natural gas prices and increased gas consumption at our in-situ operations. |
|
|
• | Higher maintenance costs related to the upgrader that was not damaged by the fire to ensure reliability. |
|
|
• | Higher production volumes at our in-situ operations. This increased cash expenses by approximately $30 million reflecting increased staffing and maintenance. In addition, 2005 was the first full year of in-situ operations. In-situ costs incurred during the first quarter of 2004 were treated as project start-up costs. |
Partially offsetting these negative factors:
• | Purchases of crude oil and products decreased to $32 million in 2005 from $75 million in 2004. Purchases in 2004 included the repurchase of crude oil originally sold to a VIE in 1999. |
|
|
• | Taxes other than income taxes decreased by $21 million as a result of lower diesel fuel excise taxes reflecting lower sales volumes as a result of the fire. |
|
|
• | We were able to redeploy some of our mining resources to overburden removal as a result of the fire. Despite decreased production volumes, mining expenses decreased only slightly as the increased deferral of overburden costs were almost entirely offset by increased costs associated with mine maintenance projects. |
Overall, increased cash expenses reduced net earnings by $80 million.
Royalties
Oil Sands Alberta Crown royalties were relatively unchanged at $406 million in 2005 compared to $407 million in 2004 (2003 – $33 million). Alberta Oil Sands Crown royalties are subject to change as policies arising from the government’s position are finalized and audits of 2005 and prior years are completed. Changes to the estimated amounts previously recorded will be reflected in our financial statements on a prospective basis and may be significant. In addition, 2004 was a transition year for Oil Sands as the remaining amount of prior years’ allowable costs carried forward of approximately $600 million were claimed in 2004 to reduce our 2004 Alberta Crown royalty obligation. No such carry forward of allowed costs existed for 2005 or subsequent years. For a further discussion on Crown royalties, see page 27.
Non-cash Expenses
Non-cash depreciation, depletion and amortization (DD&A) expense, including overburden amortization expense, decreased to $482 million from $505 million in 2004 (2003 – $459 million). The decrease was primarily due to lower overburden amortization of $47 million reflecting lower production volumes, partially offset by higher DD&A expenses from in-situ operations of $13 million. Lower non-cash expenses increased net earnings by $13 million.
42
Deferred overburden costs are amortized using stripping ratios that allocate the overburden costs to the tonnes of ore mined during the year. In 2005, Oil Sands average overburden removal stripping ratio was 0.47 cubic metres of overburden for every tonne of ore mined, compared to 0.52 cubic metres per tonne in 2004. The decreased stripping ratio year-over-year was primarily due to updated drilling results that provided more detailed information on proved reserves. Overburden amortization decreased to $178 million in 2005 compared with $225 million in 2004, primarily reflecting lower production volumes.
As a result of new Canadian and U.S. GAAP requirements, we are considering expensing overburden costs as incurred. See page 39.
Tax Adjustments
In 2004, non-cash income tax expense was reduced by $53 million relating to reductions in the Alberta provincial tax rate. Excluding the 2004 rate change, the remaining tax rate adjustment was due to a small change in the effective tax rate in 2005 compared to 2004 and other minor differences.
Cash Operating Costs
In 2005, we reported cash operating costs for upgraded production (base operations) as well as cash costs from in-situ operations. Cash operating costs for base operations increased to $1,123 million ($19.50 per barrel) in 2005 compared to $949 million ($11.95 per barrel) in 2004, primarily due to the same factors affecting cash expenses discussed previously. In addition, per barrel cash costs have increased due to the effect of the fire on production volumes.
Natural gas purchases for base operations averaged approximately 66 million cubic feet per day (mmcf/d) in 2005, consistent with the prior year. Oil Sands natural gas costs increased to $8.95 per mcf in 2005 from $6.74 per mcf in 2004, increasing cash costs by approximately $1.75 per barrel.
Net Cash Surplus (Deficiency) Analysis
Cash flow from operations was $1,895 million in 2005 compared to $1,752 million in 2004 (2003 – $1,803 million). Excluding the impact of non-cash income tax adjustments, the increase was due to the same factors that increased net earnings, offset by higher cash overburden and reclamation spending, and higher pension funding requirements.
Net working capital increased by $223 million in 2005 compared to a decrease of $72 million in 2004 (2003 – $56 million). Higher accounts receivable due to higher sales volumes and higher price realizations in the final month of 2005 compared to 2004 were only partially offset by increased accounts payable and accrued liabilities related to increased capital spending in 2005.
Cash flow used in investing activities increased to $1,929 million in 2005 from $1,087 million in 2004 (2003 – $1,060 million). During 2005, capital spending related primarily to the reconstruction of assets damaged by the fire, higher sustaining capital for extraction projects, construction of Firebag Stage 2, the Millennium vacuum unit, engineering and preliminary construction of the Millennium Coker Unit and the debottlenecking of our Steepbank extraction assets.
Combined, the above factors resulted in a net cash deficiency of $257 million in 2005, compared with a surplus of $737 million in 2004 (2003 – $799 million surplus).

43
Outlook
Our Oil Sands operations continue to be the focus of our business strategy. In 2006, we anticipate our oil sands production will average 260,000 bpd from our existing upgrading assets. Our future plans for Oil Sands remain focused on activities and investments anticipated to increase production, identify cost improvements and improve environment, health and safety performance.
For 2006, we have budgeted capital spending of approximately $2.5 billion, of which $700 million is slated for sustaining projects with the remainder earmarked for growth. This growth spending supports the goal of increasing production to 350,000 bpd in 2008, while laying the groundwork for further expansion later in the decade.
Expansion to 350,000 bpd
Work to increase production capacity to 350,000 bpd in 2008 is proceeding on schedule. During 2006, construction is planned to continue on the coker unit project, the second stage of our Firebag in-situ project will move into commercial operations and we intend to continue construction on the recently approved cogeneration facility that will provide additional steam and capacity to our in-situ operations. For an update on the progress of these significant capital projects, see page 26.
In addition to the on-going expansion of our proprietary sources of bitumen supply, incremental bitumen to feed expanded upgrading capacity is also expected to be provided under a processing agreement between Suncor and Petro-Canada, slated to take effect in 2008. Under the agreement, Oil Sands will process at least 27,000 bpd of Petro-Canada bitumen on a fee-for-service basis. Petro-Canada will retain ownership of the bitumen and resulting sour crude oil production of about 22,000 bpd. In addition, we will sell an additional 26,000 bpd of our proprietary sour crude oil production to Petro-Canada. Both the processing and sales components of the agreement are for a minimum 10-year term.
Expansion to 500,000 bpd to 550,000 bpd
In planning for expansion beyond 2008, we filed regulatory applications in 2005 to construct a third upgrader, a key step to increasing production capacity to 500,000 to 550,000 bpd in the 2010 to 2012 time frame. The preliminary cost estimate for this project of $5.9billion (1) is subject to change. This estimate does not include costs for related bitumen supply projects to feed the upgrader. Approval by regulators and Suncor’s Board of Directors is required before the project can proceed.
Mine Extension
In March 2005, we filed an application for approval to construct and operate an extension of our Steepbank mine. The proposed development would replace ore production that is expected to be depleted prior to the end of the decade. Currently, capital development costs are estimated at $350 million, and are subject to change. Approval by regulators and our Board of Directors is required before construction can proceed.
In 2005, Oil Sands filed a renewal application with regulators for a 10-year renewal of our operating licence.
(1) This cost estimate has a range of uncertainty of +50/–30%. For a discussion of this estimation process see page 26.
44
Risk Factors Affecting Performance
There are certain issues we strive to manage that may affect performance including, but not limited to, the following:
• | Final amount and timing of the settlement and payment of insurance proceeds related to fire damage and interruption of business at Oil Sands in connection with the January 2005 fire. |
|
|
• | Our ability to finance Oil Sands growth in a volatile commodity pricing environment. Also refer to “Liquidity and Capital Resources” on page 24. |
|
|
• | Our ability to complete future projects both on time and on budget. This could be impacted by competition from other projects (including other oil sands projects) for skilled people, increased demands on the Fort McMurray infrastructure (including housing, roads and schools), or higher prices for the products and services required to operate and maintain the operations. We continue to address these issues through a comprehensive recruitment and retention strategy, working with the community to determine infrastructure needs, designing Oil Sands expansion to reduce unit costs, seeking strategic alliances with service providers and maintaining a strong focus on engineering, procurement and project management. |
|
|
• | Potential changes in the demand for refinery feedstock and diesel fuel. Our strategy is to reduce the impact of this issue by entering into long-term supply agreements with major customers, expanding our customer base and offering a variety of blends of refinery feedstock to meet customer specifications. |
|
|
• | Volatility in crude oil and natural gas prices, foreign exchange rates and the light/heavy and sweet/sour crude oil differentials. These factors are difficult to predict and impossible to control. |
|
|
• | Logistical constraints and variability in market demand, which can impact crude movements. These factors can be difficult to predict and control. |
|
|
• | Our relationship with our trade unions. Work disruptions have the potential to adversely affect Oil Sands operations and growth projects. |
These factors and estimates are subject to certain risks, assumptions and uncertainties discussed on page 58 under Forward-looking Statements. Also refer to Suncor Overview, Risk Factors Affecting Performance on page 29.
45
NATURAL GAS
Our Natural Gas (NG) business primarily produces conventional natural gas in Western Canada. NG’s production serves as a price hedge that provides us with a degree of protection from volatile market prices of natural gas purchased for internal consumption in our Oil Sands and downstream operations.
NG’s strategy focuses on:
• | Building competitive operating areas. |
|
|
• | Improving base business efficiency. |
|
|
• | Developing new, low-capital business opportunities. |
NG’s long-term goal is to achieve a sustainable return on capital employed (ROCE) (1) of 12%-15% at mid-cycle prices of US$5.00 to US$5.50 per thousand cubic feet (mcf). To offset company-wide natural gas purchases, NG is targeting production increases of 3% to 5% per year.
HIGHLIGHTS
Summary of Results
Year ended December 31 |
|
|
|
|
|
|
|
($ millions unless otherwise noted) |
| 2005 |
| 2004 |
| 2003 |
|
|
|
|
|
|
|
|
|
Revenue |
| 679 |
| 567 |
| 512 |
|
Natural gas production (mmcf/d) |
| 190 |
| 200 |
| 187 |
|
Average natural gas sales price ($/mcf) |
| 8.57 |
| 6.70 |
| 6.42 |
|
Net earnings |
| 155 |
| 115 |
| 120 |
|
Cash flow from operations |
| 412 |
| 319 |
| 298 |
|
Total assets |
| 1 307 |
| 967 |
| 765 |
|
Cash used in investing activities |
| 344 |
| 251 |
| 167 |
|
Net cash surplus |
| 63 |
| 67 |
| 143 |
|
ROCE (%) (1) |
| 30.7 |
| 27.1 |
| 29.2 |
|
(1) ROCE for Suncor operating segments is calculated in a manner consistent with consolidated ROCE as reconciled in Non GAAP Financial Measures. See page 56.
2005 Overview
• | Production averaged 190 million cubic feet per day (mmcf/d) in 2005 compared to 200 mmcf/d in 2004 and company-wide purchases for internal consumption of approximately 138 mmcf/d. Production targets for 2005 were negatively impacted by unplanned maintenance and weather related drilling delays that affected the western upstream oil and gas Canadian industry. |
|
|
• | In 2005, construction of the North Cabin Pipeline that connects the Cabin Creek and Solomon fields in the Alberta Foothills to the Simonette gas plant was completed. In addition an expansion and maintenance shutdown at the Simonette gas plant was completed. |
|
|
• | During 2005 we continued the divestment of non-core properties with proceeds of $21 million received in 2005. |
|
|
• | Subsequent to year-end, we disposed of 15% of our interest in the South Rosevear gas plant for proceeds of $12 million. We currently retain a 60.4% interest and continue to operate the gas plant. |
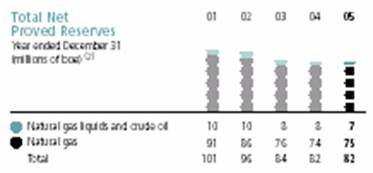
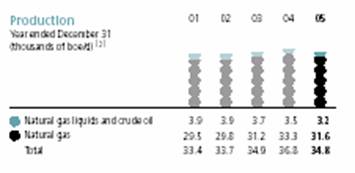
(2) For details on barrels of oil equivalent (boe), see page 17.
46
Analysis of Net Earnings
NG net earnings were $155 million in 2005, compared to $115 million in 2004 (2003 – $120 million). Higher realized natural gas and liquids prices were partially offset by lower sales volumes, higher royalty expenses, higher depreciation, depletion and amortization (DD&A), higher lifting costs, higher exploration expenses and lower divestment gains. Earnings in 2004 were negatively impacted by costs associated with the final arbitrated settlement of terminated gas marketing contracts related to Enron Corporation’s bankruptcy in December 2001.
In 2005, the average realized price for natural gas was $8.57 per mcf, compared to an average of $6.70 per mcf in 2004, reflecting higher benchmark natural gas prices. Price realizations for NG’s crude oil and natural gas liquids production were also higher in 2005 due to higher benchmark crude oil prices. The combined impact of the above pricing factors increased net earnings in 2005 by $91 million.
NG’s average natural gas production was 190 mmcf/d in 2005 compared to 200 mmcf/d in 2004. Including liquids, total 2005 production was 34,800 boe/d compared to 36,800 boe/d in 2004. The decrease in 2005 production was primarily due to unplanned maintenance issues and weather related delays in drilling during the first half of the year. Lower production volumes negatively impacted 2005 net earnings by $20 million.
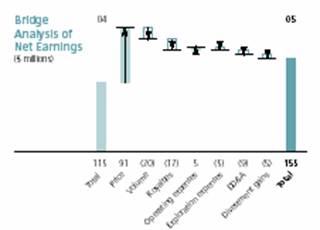
Expenses
Royalties on NG production were $149 million ($11.72 per boe) in 2005, compared to $124 million ($9.22 per boe) in 2004 (2003 – $106 million; $8.32/boe). The increase was due to higher sales price realizations, caused by higher benchmark commodity prices, partially offset by lower production.
Operating costs were $93 million in 2005 compared to $100 million in 2004 (2003 – $73 million). Total operating costs were higher in 2004 due to an arbitrated settlement of terminated gas marketing contracts related to Enron Corporation’s bankruptcy in December 2001 that reduced 2004 after-tax earnings by $12 million. Excluding the Enron settlement, operating costs were higher in 2005 due to higher lifting costs as a result of higher planned and unplanned maintenance.
Exploration expenses increased to $46 million in 2005 from $38 million in 2004 (2003 – $40 million). Higher dry hole expenses were only partially offset by lower seismic expenditures.
DD&A expense was $130 million in 2005 compared to $115 million in 2004 (2003 – $91 million). The increase was due to a higher cost base subject to depletion and a lower proved reserve base, as well as higher amortization expense related to unproven lands.
Divestment gains were $12 million in 2005 ($8 million after-tax) compared to $19 million ($13 million after-tax) in 2004 (2003 – $12 million; $8 million after-tax). Divestments in 2005 reflect sales of non-core properties, whereas 2004 divestments primarily relate to the sale of a 62.5% interest in our Simonette gas plant for proceeds of $19 million.
In total, the above noted items reduced net earnings by $31 million.
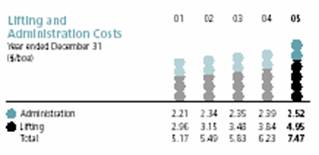
47
Net Cash Surplus Analysis
NG’s net cash surplus was $63 million in 2005 compared with $67 million in 2004 (2003 – $143 million). Cash flow from operations increased to $412 million compared with $319 million in the prior year (2003 – $298 million), largely due to higher commodity prices, partially offset by lower production and higher royalties.
Cash used in investing activities increased to $344 million compared with $251 million in 2004 (2003 – $167 million) as a result of higher drilling, exploration and facilities costs.

Outlook
NG plans to increase natural gas production to 205 to 210 mmcf/d in 2006 to offset our growing internal natural gas demands.
NG intends to continue to leverage its expertise and existing assets to bring reserves into production in Western Canada. However, increasing production may require expansion through farm-ins (1), joint ventures or additional property acquisitions, which could expand the size and number of operating areas, or involve new operating areas outside of Western Canada.
To support these goals, we have budgeted $325 million in capital spending for exploration and development in 2006.

Risk Factors Affecting Performance
There are certain issues that we strive to manage that may affect performance of the NG business including, but not limited to, the following:
• Consistently and competitively finding and developing reserves that can be brought on stream economically. Positive or negative reserve revisions arising from technical and economic factors can have a corresponding positive or negative impact on asset valuation and depletion rates.
• The impact of market demand for land and services on capital and operating costs. Market demand and the availability of opportunities also influence the cost of acquisitions and the willingness of competitors to allow farm-ins on prospects.
• Risks and uncertainties associated with obtaining regulatory approval for exploration and development activities in Canada and with our indirectly wholly owned subsidiary in the United States. These risks could add to costs or cause delays to projects.
• Risks and uncertainties associated with weather conditions, which can shorten the winter drilling season and impact the spring and summer drilling program, with increased costs or reduced production.
• The impact of market demand for labour and equipment, which in a heated exploration and development market could add to cost or cause delays to projects for NG and its competitors.
These factors and estimates are subject to certain risks, assumptions and uncertainties discussed on page 58 under Forward-looking Statements. Refer to the Suncor Overview, Risk Factors Affecting Performance on page 29.
(1) Acquisition of all or part of the operating rights from the working interest owner. The acquirer assumes all or some of the burden of development in return for an interest in the property. The assignor usually retains an overriding royalty, but may retain any type of interest.
48
ENERGY MARKETING AND REFINING – CANADA
Energy Marketing and Refining – Canada (EM&R) operates a 70,000 barrel per day (bpd) (approximately 11,100 cubic metre per day) capacity refinery in Sarnia, Ontario and markets refined products to industrial, wholesale and commercial customers primarily in Ontario and Quebec. Through our Sunoco-branded and joint venture operated service networks, we market products to retail customers in Ontario. The EM&R business also encompasses third party energy marketing and trading activities, as well as providing marketing services for the sale of crude oil and natural gas from the Oil Sands and NG operations.
EM&R’s strategy is focused on:
• Enhancing the profitability of refining operations by improving reliability and product yields and enhancing operational flexibility to process a variety of feedstock, including crude oil streams from Oil Sands operations.
• Creating downstream market opportunities to capture greater long-term value from Oil Sands production.
• Reducing costs through the application of technologies, economies of scale, direct management of growth projects, strategic alliances with key suppliers and customers and continuous improvement of operations.
• Increasing the profitability and efficiency of retail networks.
As a marketing channel for our refined products, EM&R’s Ontario retail network generated approximately 57% of EM&R’s total 2005 sales volume of 96,000 bpd. The retail networks are comprised of 275 Sunoco-branded retail service stations, 28 Sunoco-branded Fleet Fuel Cardlock sites, and two 50% retail joint venture businesses (1) that operate 149 Pioneer-branded retail service stations, 50 UPI-branded retail service stations and 14 UPI bulk distribution facilities for rural and farm fuels. Approximately 39% of EM&R’s refined product sales in 2005 were wholesale and industrial sales. Sun Petrochemicals Company (SPC), a 50% joint venture between a Suncor subsidiary and a Toledo, Ohio-based refinery, generated the remaining 4% of sales.
(1) Pioneer Group Inc., is an independent company with which we have a 50% joint venture partnership. UPI Inc. is a 50% joint venture with GROWMARK Inc., a Midwest U.S. retail farm supply and grain marketing cooperative.
HIGHLIGHTS
Summary of Results
Year ended December 31 |
| 2005 |
| 2004 |
| 2003 |
|
($ millions unless otherwise noted) |
|
|
|
|
|
|
|
Revenue |
| 4 299 |
| 3 460 |
| 2 936 |
|
Refined product sales |
|
|
|
|
|
|
|
(millions of litres) |
|
|
|
|
|
|
|
Sunoco retail gasoline |
| 1 656 |
| 1 665 |
| 1 599 |
|
Total |
| 5 570 |
| 5 643 |
| 5 477 |
|
Net earnings (loss) breakdown: |
|
|
|
|
|
|
|
Total earnings excluding energy, marketing and trading activities |
| 30 |
| 68 |
| 67 |
|
Energy marketing and trading activities |
| 11 |
| 12 |
| (2 | ) |
Tax adjustments |
| — |
| — |
| (12 | ) |
Total net earnings |
| 41 |
| 80 |
| 53 |
|
Cash flow from operations |
| 152 |
| 188 |
| 164 |
|
Cash used in investing activities |
| 436 |
| 259 |
| 135 |
|
Net cash surplus (deficiency) |
| (328 | ) | (21 | ) | 29 |
|
ROCE (%) (1) |
| 8.1 |
| 14.6 |
| 10.3 |
|
ROCE (%) (2) |
| 5.2 |
| 13.6 |
| 10.3 |
|
(1) Excludes capitalized costs related to major projects in progress. Return on capital employed (ROCE) for our operating segments is calculated in a manner consistent with consolidated ROCE as reconciled in Non GAAP Financial Measures. See Page 56.
(2) Includes capitalized costs related to major projects in progress. See page 56.
49
2005 Overview
• During 2005, construction continued on the diesel desulphurization unit at the Sarnia refinery. This project is intended to meet federal low-sulphur diesel fuel regulations that take effect in 2006. The project, estimated to cost $800 million, is also expected to enable the refinery to process approximately 40,000 bpd of Oil Sands sour crude blends in 2007. See page 26.
• In April 2005, we received final environmental approvals from federal and provincial governments for our ethanol production facility in the Sarnia region. Construction of the $120 million plant began in June 2005 and is expected to be completed in June 2006. Natural Resources Canada has contributed $19 million towards this project through their Ethanol Expansion Program.
• During March and April 2005, we completed a 24-day planned maintenance shutdown at our Sarnia refinery.
Analysis of Net Earnings
EM&R results include the impact of our third party energy marketing and trading activities that are discussed separately on page 51.
EM&R’s net earnings decreased to $41 million in 2005 from $80 million in 2004 (2003 – $53 million). This decrease was primarily due to lower refining margins, lower sales volumes, lower refinery utilization, lower mark-to-market gains on inventory related derivatives, and higher cash refinery operating costs, primarily due to higher energy costs as a result of high natural gas prices. These negative impacts were partially offset by lower third party refined product purchase volumes and higher joint venture earnings.
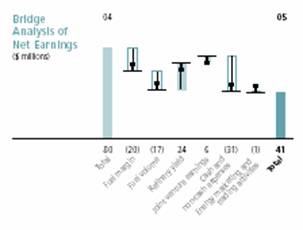
Margins
After-tax refined product margins decreased by $20 million in 2005 compared to 2004, due to lower refining margins on gasoline, chemicals, and other products such as fuel oil and propane, partially offset by increased refining margins in diesel and jet fuel. Refining margins on proprietary refined products averaged 7.6 cents per litre (cpl) in 2005, compared to 8.0 cpl in 2004. Sunoco-branded retail gasoline margins averaged 5.1 cpl in 2005, compared with 4.4 cpl in 2004. The increase was primarily due to an improved competitive pricing environment in the greater Toronto area and tight refined product supply due to hurricanes on the U.S. Gulf Coast during the summer of 2005.

Volumes
Total sales volumes averaged 96,000 bpd (15,200 cubic metres per day) in 2005, down slightly from 97,000 bpd (15,400 cubic metres per day) in 2004, resulting in a decrease in net earnings of $17 million. Higher sales volumes of heavy fuel oils and diesel were more than offset by lower sales volumes of gasoline and propane. Total gasoline sales volumes in the Sunoco-branded retail network decreased to 1,656 million litres in 2005 from 1,665 million litres in 2004. Average Sunoco-branded service station site throughput was 6.3 million litres per site in 2005 compared to 6.2 million litres per site in 2004. Site throughput is an important indicator of network efficiency. EM&R’s Ontario retail gasoline market share, including all Sunoco and joint venture operated retail sites was 19% in 2005 (2004 – 19%). Approximately 96% of EM&R’s refined products were sold to the Ontario market in 2005.
Refinery Utilization
Overall refinery utilization averaged 95% in 2005, compared with 100% in 2004. The reduction in refinery utilization was primarily due to planned and unplanned maintenance in the second and fourth quarters of 2005.
50
Product Purchase Costs
The unfavourable impacts of lower refined product margins, lower volumes and lower refinery utilization were partially offset by lower third party refined product purchase costs in 2005 compared to 2004. Refined product purchase costs were higher in 2004 as a result of higher required purchased volumes of refined products to meet customer needs primarily due to a maintenance shutdown in 2004. Reduced third party purchase costs increased 2005 net earnings by $24 million.
Cash and Non-cash Operating Expenses
Overall, cash and non-cash operating expenses increased by $31 million after-tax in 2005 compared to 2004. Cash expenses increased by $20 million after-tax in 2005, primarily, due to higher energy and maintenance costs. Non-cash expenses increased by $3 million after-tax in 2005, due to increased depreciation as a result of a higher asset base. The higher 2005 expenses also reflect the absence of a 2004 mark-to-market gain of $8 million after-tax on inventory related derivatives.
Related Party Transactions
The Pioneer, UPI and SPC joint ventures are considered to be related parties to Suncor under GAAP. EM&R supplies refined petroleum products to the Pioneer and UPI joint ventures, and petrochemical products to SPC. Suncor has a separate supply agreement with each of Pioneer, UPI and SPC.
The following table summarizes our related party transactions with Pioneer, UPI and SPC, after eliminations, for the year. These transactions are in the normal course of operations and have been conducted on the same terms as would apply with third parties.
($ millions) |
| 2005 |
| 2004 |
| 2003 |
|
|
|
|
|
|
|
|
|
Operating revenues |
|
|
|
|
|
|
|
Sales to EM&R joint ventures: |
|
|
|
|
|
|
|
Refined products |
| 327 |
| 320 |
| 301 |
|
Petrochemicals |
| 279 |
| 272 |
| 187 |
|
At December 31, 2005, amounts due from EM&R joint ventures were $22 million, compared to $17 million at December 31, 2004.
Energy Marketing and Trading Activities
Third party energy marketing and energy trading activities consist of both third party crude oil marketing and financial and physical derivatives trading activities. These activities resulted in net earnings of $11 million in 2005 compared to net earnings of $12 million in 2004 (2003 – $2 million after-tax loss).
Energy trading activities, by their nature, can result in volatile and large positive or negative fluctuations in earnings. A separate risk management function reviews and monitors practices and policies and provides independent verification and valuation of these activities. See page 31.
Net Cash Deficiency Analysis
EM&R’s net cash deficiency was $328 million in 2005 compared to a net cash deficiency of $21 million in 2004 (2003 – $29 million surplus). Cash flow from operations was $152 million in 2005 compared to $188 million in 2004 (2003 – $164 million). The decrease was due to the same factors impacting net earnings. Net working capital increased by $44 million in 2005, compared to a decrease of $50 million in 2004. The increase in net working capital is a result of decreases in taxes payable.
Cash used in investing activities was $436 million in 2005 compared to $259 million in 2004 (2003 – $135 million). The increase was primarily due to higher capital expenditures associated with the diesel desulphurization project at the Sarnia refinery, as well as increased refinery capital maintenance expenditures.

51
Outlook
In 2004, we began construction on a diesel desulphurization project at our Sarnia refinery to meet federal sulphur regulations that will be effective June 2006 and anticipated future federal sulphur regulations. Under the terms of an agreement with Shell Canada Products (Shell), the project facilities will also be used to process high-sulphur diesel from Shell’s Sarnia refinery into low-sulphur diesel on a fee-for-service basis.
The project also includes capital expenditures to expand the refinery’s throughput capacity and enable it to process approximately 40,000 bpd of Oil Sands sour crude blends. In order to facilitate this portion of the project, there is a planned 50-day maintenance shutdown scheduled for the fall of 2006. When all components are completed in 2007, we expect this project will cost a total of approximately $800 million.
Construction of an ethanol plant began in June 2005 and is expected to be completed in 2006. This facility is expected to produce ethanol at a capacity of 200 million litres per year for blending into Sunoco-branded and joint venture retail gasoline. The project is expected to cost $120 million, and is on schedule and on budget.
Including capital investment associated with diesel desulphurization and construction of the ethanol plant, EM&R expects total capital spending to be approximately $350 million in 2006.
Risk Factors Affecting Performance
There are certain issues we strive to manage that may affect the performance of the EM&R business that include, but are not limited to, the following:
• Management expects that fluctuations in demand and supply for refined products, margin and price volatility, and market competition, including potential new market entrants, will continue to impact the business environment.
• There are certain risks associated with the execution of capital projects, including the risk of cost overruns. The diesel desulphurization project must be completed prior to June 1, 2006, to ensure compliance with legislative requirements. Numerous risks and uncertainties can affect construction schedules, including the availability of labour and other impacts of competing projects drawing on the same resources during the same time period.
• Environment Canada is expected to finalize regulations reducing sulphur in off-road diesel fuel and light fuel oil to take effect later in the decade. We believe that if the regulations are finalized as currently proposed, the new facilities for reducing sulphur in on-road diesel fuel should also allow the company to meet the requirements for reducing sulphur in off-road diesel and light fuel oil.
These factors and estimates are subject to certain risks, assumptions and uncertainties discussed on page 58 under Forward-looking Statements. Refer to the Suncor Overview, Risk Factors Affecting Performance on page 29.
52
REFINING AND MARKETING – U.S.A.
R&M operates a 90,000 barrel per day (bpd) (approximately 14,300 cubic metre per day) capacity refining complex in Commerce City, Colorado and markets refined products to customers primarily in Colorado, including retail marketing through 43 Phillips
66®-branded retail stations in the Denver area. Assets also include a 100% interest in the 480-kilometre Rocky Mountain pipeline system, a 65% interest in the 140-kilometre Centennial pipeline system and a products terminal in Grand Junction, Colorado.
R&M’s strategy is focused on:
• Enhancing the profitability of refining operations by improving reliability, product yields and operational flexibility to process a variety of feedstocks, including crude oil streams from our Oil Sands operations.
• Creating additional downstream market opportunities in the United States to capture greater long-term value from Oil Sands production.
• Reducing costs through the application of technologies, economies of scale, direct management of growth projects, strategic alliances with key suppliers and customers and continuous improvement of operations.
• Increasing the profitability and efficiency of our retail network.
HIGHLIGHTS
Summary of Results
Year ended December 31 |
|
|
|
|
|
|
|
(Cdn$ millions unless otherwise noted) |
| 2005 |
| 2004 |
| 2003(1) |
|
|
|
|
|
|
|
|
|
Revenue |
| 2 621 |
| 1 495 |
| 515 |
|
Refined product sales |
|
|
|
|
|
|
|
(millions of litres) |
|
|
|
|
|
|
|
Gasoline |
| 2 517 |
| 1 627 |
| 636 |
|
Total |
| 5 004 |
| 3 504 |
| 1 384 |
|
Net earnings |
| 142 |
| 34 |
| 18 |
|
Cash flow from operations |
| 247 |
| 59 |
| 34 |
|
Investing activities |
| 408 |
| 198 |
| 300 |
|
Net cash surplus (deficiency) |
| (121 | ) | (71 | ) | (220 | ) |
ROCE (%) (2) |
| 49.4 |
| 12.2 |
| — |
|
ROCE (%) (3) |
| 28.9 |
| 11.0 |
| — |
|
(1) Reflects the results of operations since acquisition on August 1, 2003.
(2) Excludes capitalized costs related to major projects in progress. Return on capital employed (ROCE) for our operating segments is calculated in a manner consistent with consolidated ROCE as reconciled in Non GAAP Financial Measures. See Page 56. For 2003, represents five months of operations since acquisition on August 1. Therefore no annual ROCE was calculated.
(3) Includes capitalized costs related to major projects in progress. See page 56.
2005 Overview
• On May 31, 2005, R&M acquired all of the issued shares of the Colorado Refining Company, an indirect wholly-owned subsidiary of Valero Energy Corporation for total cash consideration of $62 million, including additional associated price adjustments for purchased crude oil and product inventories. The acquired company’s assets included a 30,000 bpd refinery in Commerce City, Colorado as well as a products terminal located in Grand Junction, Colorado.
53
• R&M continued construction on a project to modify the Commerce City refinery to allow it to meet regulations that take effect on June 1, 2006, requiring lower-sulphur diesel fuel. It is expected that modifications will also enable R&M to process 10,000 bpd to 15,000 bpd of Oil Sands sour crude while also increasing the refinery’s ability to process a broader slate of bitumen-based crude oil. The capital budget for this project was increased to US$390 million (approximately Cdn$465 million) from the previous estimate of US$300 million (approximately Cdn$360 million) due to labour shortages and material supply issues.
• Approximately 6% of feedstock processed at the refinery was synthetic crude oil of which approximately half was supplied from our Oil Sands operations.
Analysis of Net Earnings
R&M’s net earnings were $142 million in 2005 compared to $34 million in 2004 (2003 – $18 million). Earnings have increased due to higher refining margins, and higher average sales volumes, due in part to the acquisition of the Colorado Refining Company during 2005, as well as higher refinery utilization. The acquisition increased our U.S. refining capacity to 90,000 bpd from 60,000 bpd. These positive impacts were partially offset by higher product purchase costs and higher cash and non-cash refinery operating expenses.
Margins
Average refining margins were 9.0 cents per litre (cpl) in 2005 compared to 6.7 cpl in 2004 reflecting significantly higher gasoline and diesel margins, partially offset by lower net realizations on asphalt and other heavy product sales. Refined product margins were impacted by the reduced supply of light oil products following the hurricane activity in the Gulf of Mexico during the summer of 2005. Higher refined product margins in 2005 increased earnings by $220 million. Retail margins were 5.1 cpl in 2005, compared to 5.4 cpl in 2004 due to competitive pressures that resulted in narrowing of margins.
Volumes and Refinery Utilization
Sales volumes increased in 2005, primarily due to the acquisition of a second refinery, bringing total throughput capacity in the second half of the year to 90,000 bpd from 60,000 bpd. In addition, higher refinery utilization rates resulting from more reliable operations in 2005 resulted in an increase in net earnings of $98 million.
Refinery utilization was 98% in 2005 compared to 92% in 2004. Refinery utilization in the first half of 2004 was negatively impacted by a planned 19-day maintenance shutdown on certain refinery units, as well as operating difficulties that were rectified during the shutdown.
Partially offsetting the positive impacts of higher margins and volumes, increased product purchases reduced net earnings by $134 million. The higher volume of purchased refined products was primarily due to purchases of additional intermediate feedstock to facilitate higher refinery utilization rates, along with purchases of other finished products to meet customer demands.
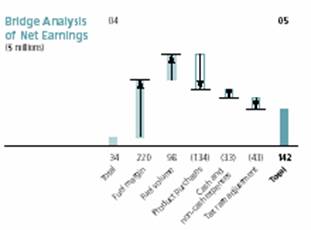
Cash and Non-cash Expenses
Increases in refinery cash expenses and non-cash depreciation, depletion and amortization were primarily due to incremental costs associated with the acquisition of the Colorado Refining Company as well as higher energy and maintenance related costs in 2005.
54
Net Cash Deficiency Analysis
R&M’s net cash deficiency of $121 million in 2005 compared to a deficiency of $71 million in 2004 (2003 – $220 million deficiency). The increase in cash flow from operations to $247 million in 2005 from $59 million in 2004 (2003 – $34 million) was impacted by the same factors that affected net earnings. Net working capital decreased $40 million in 2005, compared to a decrease of $68 million in 2004 (2003 – $46 million decrease). The decrease in 2005 was primarily due to an increase in accounts payable related to capital expenditures on the refinery modifications, partially offset by an increase in accounts receivable and inventory as a result of higher product prices.
Cash used in investing activities was $408 million in 2005, compared to $198 million in 2004 (2003 – $300 million). Investing activities in 2005 were primarily related to costs associated with the refinery modification project, as well as the $62 million acquisition of Colorado Refining Company.

Outlook
R&M estimates spending approximately $225 million (approximately US$180 million) on capital project work in 2006. In 2006, we expect to complete modifications to the 60,000 bpd refinery acquired from ConocoPhillips (Commerce City west plant) to meet low-sulphur fuels regulations and expand the facility’s capacity to process Oil Sands sour crude blends.
The refineries run a mixture of heavy and light crude oil feedstock from both Canadian and U.S. sources. In 2005, approximately 3% of R&M’s crude slate came from Oil Sands. Suncor is currently assessing plans for additional refinery modifications post-2006 in order to have the potential to integrate up to an additional 30,000 bpd of Oil Sands crude oil. Cost estimates for this project are not yet available.
During the first quarter of 2006, scheduled maintenance is planned for pipeline and refinery equipment. During this estimated 42-day maintenance period, customer requirements are expected to be met from existing inventory, third party purchases and exchanges. This maintenance shutdown was originally scheduled to occur in the fourth quarter of 2005, but was postponed due to delays on the low-sulphur diesel project.
The United Steel Workers Union (USW) represents approximately 150 employees at R&M’s Commerce City west plant. A contract extension was ratified in 2005 and will expire in January 2009. The same union represents approximately 87 employees at the east plant, acquired from Valero in May 2005. In February 2006, the east plant union voted to merge the east plant workers into the existing collective bargaining agreement at the west plant. The merged contract becomes effective in March 2006 and will expire in January 2009.
Risk Factors Affecting Performance
There are certain issues we strive to manage that may affect the performance of the R&M business including, but not limited to, the following:
• Continuing fluctuations in demand for refined products, margin and price volatility and market competitiveness, including potential new market entrants.
• Certain risks associated with the execution of the fuels desulphurization project, including ensuring construction and commissioning is completed in time to comply with June 1, 2006 legislative requirements. Numerous risks and uncertainties can affect construction schedules, including the availability of labour, materials and other impacts of competing projects drawing on the same resources during the same time period. As well, our U.S. capital projects are expected to be partially funded from Canadian operations. A weaker Canadian dollar would result in a higher funding requirement for U.S. capital programs.
These factors and estimates are subject to certain risks, assumptions and uncertainties discussed on page 58 under Forward-looking Statements. Refer to the Suncor Overview, Risk Factors Affecting Performance on page 29.
55
NON GAAP FINANCIAL MEASURES
Certain financial measures referred to in this MD&A are not prescribed by Canadian generally accepted accounting principles (GAAP). These non GAAP financial measures do not have any standardized meaning and therefore are unlikely to be comparable to similar measures presented by other companies. We include cash flow from operations (dollars and per share amounts), return on capital employed (ROCE), and cash and total operating costs per barrel data because investors may use this information to analyze operating performance, leverage and liquidity. The additional information should not be considered in isolation or as a substitute for measures of performance prepared in accordance with Canadian GAAP.
Cash Flow from Operations per Common Share
Cash flow from operations is expressed before changes in non-cash working capital. A reconciliation of net earnings to cash flow from operations is provided in the Schedules of Segmented Data, which are an integral part of our Consolidated Financial Statements.
For the year ended December 31 |
|
|
| 2005 |
| 2004 |
| 2003 |
|
|
|
|
|
|
|
|
|
|
|
Cash flow from operations ($ millions) |
| A |
| 2 476 |
| 2 013 |
| 2 040 |
|
Weighted average number of common shares outstanding (millions of shares) |
| B |
| 456 |
| 453 |
| 450 |
|
Cash flow from operations (per share) |
| A/B |
| 5.43 |
| 4.44 |
| 4.53 |
|
ROCE
For the year ended December 31 ($ millions, except ROCE) |
|
|
| 2005 |
| 2004 |
| 2003 |
|
|
|
|
|
|
|
|
|
|
|
Adjusted net earnings |
|
|
|
|
|
|
|
|
|
Net earnings |
|
|
| 1 245 |
| 1 088 |
| 1 087 |
|
Add: after-tax financing expenses (income) |
|
|
| (16 | ) | 1 |
| (85 | ) |
|
| D |
| 1 229 |
| 1 089 |
| 1 002 |
|
Capital employed – beginning of year |
|
|
|
|
|
|
|
|
|
Short-term and long-term debt, less cash and cash equivalents |
|
|
| 2 159 |
| 2 577 |
| 3 204 |
|
Shareholders’ equity |
|
|
| 4 921 |
| 3 893 |
| 2 886 |
|
|
| E |
| 7 080 |
| 6 470 |
| 6 090 |
|
Capital employed – end of year |
|
|
|
|
|
|
|
|
|
Short-term and long-term debt, less cash and cash equivalents |
|
|
| 2 891 |
| 2 159 |
| 2 577 |
|
Shareholders’ equity |
|
|
| 6 130 |
| 4 921 |
| 3 893 |
|
|
| F |
| 9 021 |
| 7 080 |
| 6 470 |
|
Average capital employed |
| (E+F)/2=G |
| 8 051 |
| 6 775 |
| 6 280 |
|
Average capitalized costs related to major projects in progress (1) |
| H |
| 2 175 |
| 1 030 |
| 817 |
|
ROCE (%) |
| D/(G-H | ) | 20.9 |
| 19.0 |
| 18.3 |
|
(1) Prior to 2004, average capital employed was calculated using a simple average of opening and closing major projects in progress. In 2004 and 2005, we have used a quarterly average.
56
Oil Sands Operating Costs — Base Operations
|
|
|
| 2005 (1) |
| 2004 (2) |
| 2003 |
| ||||||
(unaudited) |
|
|
| $ millions |
| $ /barrel |
| $ millions |
| $ /barrel |
| $ millions |
| $ /barrel |
|
|
|
|
|
|
|
|
|
|
|
|
|
|
|
|
|
Operating, selling and general expenses |
|
|
| 978 |
|
|
| 871 |
|
|
| 865 |
|
|
|
Less: natural gas costs and inventory changes |
|
|
| (169 | ) |
|
| (142 | ) |
|
| (176 | ) |
|
|
Accretion of asset retirement obligations |
|
|
| 24 |
|
|
| 21 |
|
|
| 21 |
|
|
|
Taxes other than income taxes |
|
|
| 29 |
|
|
| 28 |
|
|
| 24 |
|
|
|
Cash costs |
|
|
| 862 |
| 14.95 |
| 778 |
| 9.80 |
| 734 |
| 9.25 |
|
Natural gas |
|
|
| 216 |
| 3.75 |
| 158 |
| 2.00 |
| 169 |
| 2.15 |
|
Imported bitumen (net of other reported product purchases) |
|
|
| 2 |
| 0.05 |
| 13 |
| 0.15 |
| 4 |
| 0.05 |
|
Cash operating costs – in situ operations |
|
|
| 150 |
| 2.60 |
| — |
| — |
| — |
| — |
|
Less: Cost of in-situ production sold directly to market |
|
|
| (107 | ) | (1.85 | ) | — |
| — |
| — |
| — |
|
Total cash operating costs – base operations |
| A |
| 1 123 |
| 19.50 |
| 949 |
| 11.95 |
| 907 |
| 11.45 |
|
Start-up costs |
|
|
| 12 |
| 0.20 |
| 26 |
| 0.35 |
| 10 |
| 0.10 |
|
Add: in-situ inventory changes |
|
|
| — |
|
|
| 2 |
| — |
| — |
| — |
|
Less: pre-start-up commissioning costs |
|
|
| (5 | ) | (0.10 | ) | (4 | ) | (0.05 | ) | (10 | ) | (0.10 | ) |
In-situ (Firebag) start-up costs |
| B |
| 7 |
| 0.10 |
| 24 |
| 0.30 |
| — |
| — |
|
Total cash operating costs |
| A+B |
| 1 130 |
| 19.60 |
| 973 |
| 12.25 |
| 907 |
| 11.45 |
|
Depreciation, depletion and amortization |
|
|
| 448 |
| 7.80 |
| 484 |
| 6.10 |
| 458 |
| 5.80 |
|
Depreciation, depletion and amortization – in-situ operations |
|
|
| 34 |
| 0.60 |
| — |
| — |
| — |
| — |
|
Less: Cost of in-situ production sold directly to market |
|
|
| (24 | ) | (0.40 | ) | — |
| — |
| — |
| — |
|
Total operating costs |
|
|
| 1 588 |
| 27.60 |
| 1 457 |
| 18.35 |
| 1 365 |
| 17.25 |
|
Production (thousands of barrels per day) |
|
|
| 157.6 |
| 217.0 |
| 216.6 |
| ||||||
Oil Sands Operating Costs – Firebag In-situ Bitumen Production
|
| 2005 (1) |
| 2004 (2) |
| ||||
(unaudited) |
| $ millions |
| $ /barrel |
| $ millions |
| $ /barrel |
|
|
|
|
|
|
|
|
|
|
|
Operating, selling and general expenses |
| 150 |
|
|
| 68 |
|
|
|
Less: natural gas costs and inventory changes |
| (91 | ) |
|
| (39 | ) |
|
|
Accretion of asset retirement obligations |
| — |
|
|
| — |
|
|
|
Taxes other than income taxes |
| — |
|
|
| — |
|
|
|
Cash costs |
| 59 |
| 8.45 |
| 29 |
| 8.30 |
|
Natural gas |
| 91 |
| 13.05 |
| 39 |
| 11.20 |
|
Cash operating costs |
| 150 |
| 21.50 |
| 68 |
| 19.50 |
|
Depreciation, depletion and amortization |
| 34 |
| 4.90 |
| 21 |
| 6.00 |
|
Total operating costs |
| 184 |
| 26.40 |
| 89 |
| 25.50 |
|
Production (thousands of barrels per day) |
| 19.1 |
| 12.7 |
| ||||
(1) Production in the base operations for the year ended December 31, 2005 includes upgraded Firebag in-situ volumes of 775 bpd produced in the fourth quarter of 2005 during the Firebag Stage 2 start-up period.
(2) Production in the base operations for the year ended December 31, 2004 includes upgraded Firebag in-situ volumes of 5,900 bpd produced in the first quarter of 2004 during the Firebag Stage 1 start-up period.
57
FORWARD-LOOKING STATEMENTS
This Management’s Discussion and Analysis contains certain Forward-looking Statements that are based on our current expectations, estimates, projections and assumptions that were made in light of our experience and our perception of historical trends.
All statements that address expectations or projections about the future, including statements about our strategy for growth, expected and future expenditures, commodity prices, costs, schedules, production volumes, operating and financial results and expected impact of future commitments, are Forward-looking Statements. Some of the Forward-looking Statements may be identified by words like “expects,” “future,” “may,” “slated,” “strategy,” “anticipates,” “estimates,” “plans,” “intends,” “believes,” “projects,” “indicates,” “could,” “focus,” “vision,” “goal,” “proposed,” “target,” “objective,” “expansion” and similar expressions. These statements are not guarantees of future performance and involve a number of risks and uncertainties, some of which are similar to other oil and gas companies and some of which are unique to us. Our actual results may differ materially from those expressed or implied by our Forward-looking Statements and readers are cautioned not to place undue reliance on them.
The risks, uncertainties and other factors that could influence actual results include but are not limited to: changes in the general economic, market and business conditions; fluctuations in supply and demand for our products; commodity prices and currency exchange rates; logistical constraints to transport our product; our ability to respond to changing markets and to receive timely regulatory approvals; the successful and timely implementation of capital projects including growth projects (for example the Firebag in-situ development and Voyageur) and regulatory projects (for example, the clean fuels refinery modifications projects in our downstream businesses); the accuracy of cost estimates, some of which are provided at the conceptual or other preliminary stage of projects and prior to commencement or conception of the detailed engineering needed to reduce the margin of error or level of accuracy; the integrity and reliability of our capital assets; the cumulative impact of other resource development; future environmental laws; the accuracy of Suncor’s reserve, resource and future production estimates and its success at exploration and development drilling and related activities; the impact of weather conditions on our drilling program; the impact of material and labour shortages; the impact of market demand for land and services on capital and operating costs; the maintenance of satisfactory relationships with unions, employee associations and joint venture partners; competitive actions of other companies, including increased competition from other oil and gas companies or from companies that provide alternative sources of energy; the timing and amount of insurance proceeds received in connection with the January 2005 fire at the Oil Sands facility; uncertainties resulting from potential delays or changes in plans with respect to projects or capital expenditures; actions by governmental authorities including the imposition of taxes or changes to fees and royalties; changes in environmental and other regulations; the ability and willingness of parties with whom we have material relationships to perform their obligations; and the occurrence of unexpected events, blowouts, freeze-ups, equipment failures and other similar events affecting Suncor or other parties whose operations or assets directly or indirectly affect us. The foregoing important factors are not exhaustive. Many of these risk factors are discussed in further detail throughout this Management’s Discussion and Analysis and in our Annual Information Form/Form 40-F on file with Canadian securities commissions and the SEC. Readers are also referred to the risk factors described in other documents that we file from time to time with securities regulatory authorities. Copies of these documents are available without charge from Suncor.
58