UNITED STATES
SECURITIES AND EXCHANGE COMMISSION
Washington, D.C. 20549
FORM N-CSR
CERTIFIED SHAREHOLDER REPORT OF REGISTERED
MANAGEMENT INVESTMENT COMPANIES
Investment Company Act file number | 811-02932 |
|
Morgan Stanley High Yield Securities Inc. |
(Exact name of registrant as specified in charter) |
|
522 Fifth Avenue, New York, New York | | 10036 |
(Address of principal executive offices) | | (Zip code) |
|
Randy Takian
522 Fifth Avenue, New York, New York 10036 |
(Name and address of agent for service) |
|
Registrant’s telephone number, including area code: | 212-296-6990 | |
|
Date of fiscal year end: | August 31, 2008 | |
|
Date of reporting period: | August 31, 2008 | |
| | | | | | | | |
Item 1 - Report to Shareholders
INVESTMENT MANAGEMENT

Welcome, Shareholder:
In this report, you'll learn about how your investment in Morgan Stanley High Yield Securities Inc. performed during the annual period. We will provide an overview of the market conditions, and discuss some of the factors that affected performance during the reporting period. In addition, this report includes the Fund's financial statements and a list of Fund investments.
This material must be preceded or accompanied by a prospectus for the fund being offered.
Market forecasts provided in this report may not necessarily come to pass. There is no assurance that the Fund will achieve its investment objective. The Fund is subject to market risk, which is the possibility that market values of securities owned by the Fund will decline and, therefore, the value of the Fund's shares may be less than what you paid for them. Accordingly, you can lose money investing in this Fund. Please see the prospectus for more complete information on investment risks.
Fund Report
For the year ended August 31, 2008
| Total Return for the 12 Months Ended August 31, 2008 | |
| Class A | | Class B | | Class C | | Class I+ | | Brothers
U.S.
Corporate
High
Yield-2%
Issuer Cap
Index1 | | Lehman
Lipper
High
Current
Yield
Bond
Funds
Index2 | |
| | 1.29 | % | | | 0.21 | % | | | 0.70 | % | | | 0.95 | % | | | –0.66 | % | | | –2.00 | % | |
+ Formerly Class D shares. Renamed Class I shares effective March 31, 2008.
The performance of the Fund's four share classes varies because each has different expenses. The Fund's total returns assume the reinvestment of all distributions but do not reflect the deduction of any applicable sales charges. Such costs would lower performance. See Performance Summary for standardized performance and benchmark information.
Market Conditions
Market conditions were challenging for the high-yield market throughout most of the 12-month reporting period as the credit crisis and concerns about the economy kept volatility high and led investors to favor less risky assets. Although the pace of economic growth rose to 3.3 percent in the second quarter of 2008, after measuring just 0.9 percent in the first quarter and –0.2 percent in the last quarter of 2007, the overall economic picture remained weak. Job numbers weakened and the housing market remained in the doldrums. Accelerating food and energy prices have taken a toll on consumers as well, causing confidence to dwindle and promptin g concerns about inflation. These factors, coupled with ongoing writedowns by several financial institutions and restricted credit and liquidity, weighed heavily on investor sentiment.
The Federal Reserve (the "Fed") took several steps to help ease the pressure on the market, including a long series of reductions in the target federal funds rate, the last of which took place in April when the rate was cut to 2.0 percent. Although the slowing economy was still a concern, rising inflationary pressures prompted the Fed to maintain interest rates thereafter. The Fed's intervention briefly calmed the markets and resulted in an upsurge in high yield performance in April and May, but following the announcement of additional financial sector writedowns in June and growing recession fears, the market retreated again as high yield spreads moved wider. At the end of August, high yield spreads stood at 829 basis points over Treasuries, significantly wider than historical long-term averages. As a result, high yield bonds underperformed Treasury securities, though they still outpaced equities for the reporting year. As woul d be expected in this environment, higher-quality high yield bonds outperformed lower-quality issues. With regard to sectors, the wireless communications, healthcare and environmental sectors were the top performers in the high yield market, while finance companies, gaming and automotive turned in the worst performance. New issue volume slowed considerably, measuring approximately $50 billion in the first eight months of 2008 — only 40 percent of the volume for the same period last year.
Performance Analysis
All share classes of Morgan Stanley High Yield Securities Inc. outperformed the Lehman Brothers U.S. Corporate High Yield-2% Issuer Cap Index and the Lipper High
2
Current Yield Bond Funds Index for the 12 months ended August 31, 2008, assuming no deduction of applicable sales charges.
The Fund's defensive credit quality positioning was a major contributor to performance for the period. We maintained a higher overall credit quality within the portfolio than that of the Lehman Brothers U.S. Corporate High Yield-2% Issuer Cap Index for most of the reporting period. This positioning was beneficial as the uncertain environment led to a flight to quality that helped higher-rated securities outpace those with lower credit ratings. As high yield spreads moved to levels considerably wider than long-term averages late in the period, we began to increase the Fund's credit exposure to a more neutral position.
An overweight allocation and strong security selection in healthcare, the second best performing sector for the period, utilities, and energy were additive to returns. An underweight exposure to companies in the homebuilding industry was also beneficial as the housing slump has dampened its performance.
The Fund's holdings in mortgage securities, however, hindered performance somewhat. The Fund's exposure to the sector is relatively small, but given the ongoing decline in mortgage securities in the wake of the subprime market meltdown and the fact that these securities are not included in the Lehman Brothers U.S. Corporate High Yield-2% Issuer Cap Index, this position detracted from relative performance.
As of the end of the reporting period, the Fund's major sector overweights relative to the Lehman Brothers U.S. Corporate High Yield-2% Issuer Cap Index were in the healthcare, chemicals, and utility sectors. The Fund's major sector underweights relative to the Index were in building products/home builders, manufacturing, and aerospace/defense.
There is no guarantee that any sectors mentioned will continue to perform as discussed herein or that securities in such sectors will be held by the Fund in the future.
| TOP FIVE INDUSTRIES as of 08/31/08 | |
| Electric Utilities | | | 5.7 | % | |
| Oil & Gas Production | | | 5.0 | | |
| Hospital/Nursing Management | | | 4.9 | | |
| Cable/Satellite TV | | | 4.8 | | |
| Finance/Rental/Leasing | | | 4.5 | | |
| LONG-TERM CREDIT ANALYSIS as of 08/31/08 | |
| A/A+ | | | 2.1 | % | |
| Baa/BBB+ | | | 6.5 | | |
| Ba/BB- | | | 18.1 | | |
| B/B | | | 50.3 | | |
| Caa/CCC | | | 21.2 | | |
| Not rated | | | 1.8 | | |
Subject to change daily. Provided for informational purposes only and should not be deemed a recommendation to buy or sell the securities mentioned or securities in the sectors shown above. Top five sectors are as a percentage of net assets and long-term credit analysis are as a percentage of total long-term investments. Morgan Stanley is a full-service securities firm engaged in securities trading and brokerage activities, investment banking, research and analysis, financing and financial advisory services.
3
Investment Strategy
The Fund will normally invest at least 80 percent of its assets in fixed-income securities (including zero coupon securities) rated below Baa by Moody's Investors Service ("Moody's") or below BBB by Standard & Poor's Rating Group, a division of The McGraw-Hill Companies, Inc. ("S&P"), or in non-rated securities considered by the Fund's Investment Adviser to be appropriate investments for the Fund. Such securities may also include "Rule 144A" securities, which are subject to resale restrictions. Shareholders of the Fund will receive at least 60 days' prior notice of any changes in this policy. The Fund may also use derivative instruments as discussed in the Fund's prospectus. These derivative instruments will be counted toward the 80 percent policy discussed above to the extent they have economic characteristics similar to the securities included within that policy. Securities rated below Baa or BBB are commonly known as "junk bonds." There are no minimum quality ratings for investments, and as such the Fund may invest in securities which no longer make payments of interest or principal, including defaulted securities.
For More Information About Portfolio Holdings
Each Morgan Stanley fund provides a complete schedule of portfolio holdings in its semiannual and annual reports within 60 days of the end of the fund's second and fourth fiscal quarters. The semiannual reports and the annual reports are filed electronically with the Securities and Exchange Commission (SEC) on Form N-CSRS and Form N-CSR, respectively. Morgan Stanley also delivers the semiannual and annual reports to fund shareholders and makes these reports available on its public web site, www.morganstanley.com. Each Morgan Stanley fund also files a complete schedule of portfolio holdings with the SEC for the fund's first and third fiscal quarters on Form N-Q. Morgan Stanley does not deliver the reports for the first and third fiscal quarters to shareholders, nor are the reports posted to the Morgan Stanley public web site. You may, however, obtain the Form N-Q filings (as well as the Form N-CSR and N-CSRS filings) by access ing the SEC's web site, http://www.sec.gov. You may also review and copy them at the SEC's public reference room in Washington, DC. Information on the operation of the SEC's public reference room may be obtained by calling the SEC at (800) SEC-0330. You can also request copies of these materials, upon payment of a duplicating fee, by electronic request at the SEC's e-mail address (publicinfo@sec.gov) or by writing the public reference section of the SEC, Washington, DC 20549-0102.
Proxy Voting Policy and Procedures and Proxy Voting Record
You may obtain a copy of the Fund's Proxy Voting Policy and Procedures without charge, upon request, by calling toll free (800) 869-NEWS or by visiting the Mutual Fund Center on our Web site at www.morganstanley.com. It is also available on the Securities and Exchange Commission's Web site at http://www.sec.gov.
You may obtain information regarding how the Fund voted proxies relating to portfolio securities during the most recent twelve-month period ended June 30 without charge by visiting the Mutual Fund Center on our Web site at www.morganstanley.com. This information is also available on the Securities and Exchange Commission's Web site at http://www.sec.gov.
4
Householding Notice
To reduce printing and mailing costs, the Fund attempts to eliminate duplicate mailings to the same address. The Fund delivers a single copy of certain shareholder documents, including shareholder reports, prospectuses and proxy materials, to investors with the same last name who reside at the same address. Your participation in this program will continue for an unlimited period of time unless you instruct us otherwise. You can request multiple copies of these documents by calling (800) 869-NEWS, 8:00 a.m. to 8:00 p.m., ET. Once our Customer Service Center has received your instructions, we will begin sending individual copies for each account within 30 days.
5
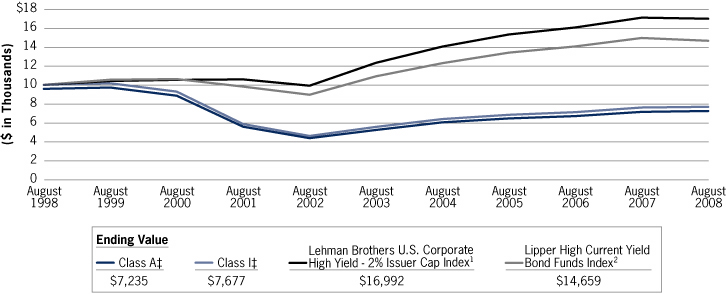
Performance Summary
Performance of $10,000 Investment—Class A and Class I
Over 10 Years
6
| Average Annual Total Returns—Period Ended August 31, 2008 | |
| Symbol | | Class A Shares*
(since 09/26/79)
HYLAX | | Class B Shares**
(since 07/28/97)
HYLBX | | Class C Shares†
(since 07/28/97)
HYLCX | | Class I Shares††
(since 09/26/79)
HYLDX | |
| 1 Year | | 1.29%3
(3.01)4 | | 0.21%3
(4.50)4 | | 0.70%3
(0.25)4 | | 0.95%3
— | |
| 5 Years | | 6.703
5.784 | | 5.933
5.624 | | 5.943
5.944 | | 6.693
— | |
| 10 Years | | (2.76)3
(3.18)4 | | (3.25)3
(3.25)4 | | (3.39)3
(3.39)4 | | (2.61)3
— | |
| Since Inception | | 4.913
4.764 | | (2.85)3
(2.85)4 | | (3.04)3
(3.04)4 | | 5.143
— | |
Performance data quoted represents past performance, which is no guarantee of future results and current performance may be lower or higher than the figures shown. For most recent month-end performance figures, please visit www.morganstanley.com/msim or speak with your Financial Advisor. Investment returns and principal value will fluctuate and fund shares, when redeemed, may be worth more or less than their original cost. The graph and table do not reflect the deduction of taxes that a shareholder would pay on fund distributions or the redemption of fund shares. Performance for Class A, Class B, Class C, and Class I shares will vary due to differences in sales charges and expenses.
Prior to July 28, 1997 the Fund offered only one class of shares. Because the distribution arrangement for Class A most closely resembled the distribution arrangement applicable prior to the implementation of multiple classes (i.e., Class A is sold with a front-end sales charge), historical performance information has been restated to reflect the actual maximum sales charge applicable to Class A (i.e., 4.25%) as compared to the 5.50% sales charge in effect prior to July 28, 1997. In addition, Class A shares are now subject to an ongoing 12b-1 fee which is reflected in the restated performance for that class.
Because all shares of the Fund held prior to July 28, 1997 were designated Class I shares (formerly Class D shares), the Fund's historical performance has been restated to reflect the absence of any sales charge.
* The maximum front-end sales charge for Class A is 4.25%.
** The maximum contingent deferred sales charge (CDSC) for Class B is 5.0%. The CDSC declines to 0% after six years. Effective April 2005, Class B shares will generally convert to Class A shares approximately eight years after the end of the calendar month in which the shares were purchased. Performance for periods greater than eight years reflects this conversion.
† The maximum contingent deferred sales charge for Class C is 1.0% for shares redeemed within one year of purchase.
†† Class I (formerly Class D) has no sales charge.
(1) The Lehman Brothers U.S. Corporate High Yield - 2% Issuer Cap Index is the 2% Issuer Cap component of the Lehman Brothers U.S. Corporate High Yield Index which covers the U.S. dollar-denominated, non-investment grade, fixed-rate, taxable corporate bond market. Securities are classified as high-yield if the middle rating of Moody's, Fitch, and S&P is Ba1/BB+/BB+ or below. The Index excludes Emerging Markets debt. The Index is unmanaged and its returns do not include any sales charges or fees. Such costs would lower performance. It is not possible to invest directly in an index.
(2) The Lipper High Current Yield Bond Funds Index is an equally weighted performance index of the largest qualifying funds (based on net assets) in the Lipper High Current Yield Bond Funds classification. The Index, which is adjusted for capital gains distributions and income dividends, is unmanaged and should not be considered an investment. There are currently 30 funds represented in this Index. The Fund was in the Lipper High Current Yield Bond Funds classification as of the date of this report.
(3) Figure shown assumes reinvestment of all distributions and does not reflect the deduction of any sales charges.
(4) Figure shown assumes reinvestment of all distributions and the deduction of the maximum applicable sales charge. See the Fund's current prospectus for complete details on fees and sales charges.
‡ Ending value assuming a complete redemption on August 31, 2008.
7
Expense Example
As a shareholder of the Fund, you incur two types of costs: (1) transaction costs, including sales charges (loads) on purchase payments and redemption fees; and (2) ongoing costs, including advisory fees; distribution and service (12b-1) fees; and other Fund expenses. This example is intended to help you understand your ongoing costs (in dollars) of investing in the Fund and to compare these costs with the ongoing costs of investing in other mutual funds.
The example is based on an investment of $1,000 invested at the beginning of the period and held for the entire period 03/01/08 – 08/31/08.
Actual Expenses
The first line of the table below provides information about actual account values and actual expenses. You may use the information in this line, together with the amount you invested, to estimate the expenses that you paid over the period. Simply divide your account value by $1,000 (for example, an $8,600 account value divided by $1,000 = 8.6), then multiply the result by the number in the first line under the heading entitled "Expenses Paid During Period" to estimate the expenses you paid on your account during this period.
Hypothetical Example for Comparison Purposes
The second line of the table below provides information about hypothetical expenses based on the Fund's actual expense ratio and an assumed rate of return of 5% per year before expenses, which is not the Fund's actual return. The hypothetical account values and expenses may not be used to estimate the actual ending account balance or expenses you paid for the period. You may use this information to compare the ongoing cost of investing in the Fund and other funds. To do so, compare this 5% hypothetical example with the 5% hypothetical examples that appear in the shareholder reports of the other funds.
Please note that the expenses shown in the table are meant to highlight your ongoing costs only and do not reflect any transactional costs, such as sales charges (loads) and redemption fees. Therefore, the second line of the table is useful in comparing ongoing costs, and will not help you determine the relative total cost of owning different funds. In addition, if these transactional costs were included, your costs would have been higher.
| | | Beginning
Account Value | | Ending
Account Value | | Expenses Paid
During Period@ | |
| | | 03/01/08 | | 08/31/08 | | 03/01/08 –
08/31/08 | |
| Class A | |
| Actual (–0.84% return) | | $ | 1,000.00 | | | $ | 991.60 | | | $ | 8.81 | | |
| Hypothetical (5% annual return before expenses) | | $ | 1,000.00 | | | $ | 1,016.29 | | | $ | 8.92 | | |
| Class B | |
| Actual (–1.10% return) | | $ | 1,000.00 | | | $ | 989.00 | | | $ | 11.30 | | |
| Hypothetical (5% annual return before expenses) | | $ | 1,000.00 | | | $ | 1,013.77 | | | $ | 11.44 | | |
| Class C | |
| Actual (–1.14% return) | | $ | 1,000.00 | | | $ | 988.60 | | | $ | 11.80 | | |
| Hypothetical (5% annual return before expenses) | | $ | 1,000.00 | | | $ | 1,013.27 | | | $ | 11.94 | | |
| Class I@@ | |
| Actual (–0.73% return) | | $ | 1,000.00 | | | $ | 992.70 | | | $ | 7.56 | | |
| Hypothetical (5% annual return before expenses) | | $ | 1,000.00 | | | $ | 1,017.55 | | | $ | 7.66 | | |
@ Expenses are equal to the Fund's annualized expense ratios of 1.76%, 2.26%, 2.36% and 1.51% for Class A, Class B, Class C and Class I shares, respectively, multiplied by the average account value over the period, multiplied by 184/366 (to reflect the one-half year period).
@@ Formerly Class D shares. Renamed Class I shares effective March 31, 2008.
8
Investment Advisory Agreement Approval
Nature, Extent and Quality of Services
The Board reviewed and considered the nature and extent of the investment advisory services provided by the Adviser (as defined herein) under the advisory agreement, including portfolio management, investment research and equity and fixed income securities trading. The Board also reviewed and considered the nature and extent of the non-advisory, administrative services provided by the Adviser under the administration agreement, including accounting, clerical, bookkeeping, compliance, business management and planning, and the provision of supplies, office space and utilities at the Adviser's expense. (The Adviser and the administrator together are referred to as the "Adviser" and the advisory and administration agreements together are referred to as the "Management Agreement.") The Board also compared the nature of the services provided by the Adviser with similar services provided by non-affiliated advisers as reported to the Bo ard by Lipper Inc. ("Lipper").
The Board reviewed and considered the qualifications of the portfolio managers, the senior administrative managers and other key personnel of the Adviser who provide the advisory and administrative services to the Fund. The Board determined that the Adviser's portfolio managers and key personnel are well qualified by education and/or training and experience to perform the services in an efficient and professional manner. The Board concluded that the nature and extent of the advisory and administrative services provided were necessary and appropriate for the conduct of the business and investment activities of the Fund. The Board also concluded that the overall quality of the advisory and administrative services was satisfactory.
Performance Relative to Comparable Funds Managed by Other Advisers
On a regular basis, the Board reviews the performance of all funds in the Morgan Stanley Fund Complex, including the Fund, compared to their peers, paying specific attention to the underperforming funds. In addition, the Board specifically reviewed the Fund's performance for the one-, three- and five-year periods ended December 31, 2007, as shown in a report provided by Lipper (the "Lipper Report"), compared to the performance of comparable funds selected by Lipper (the "performance peer group"). The Board also discussed with the Adviser the performance goals and the actual results achieved in managing the Fund. The Board concluded that the Fund's performance was competitive with that of its performance peer group.
Fees Relative to Other Proprietary Funds Managed by the Adviser with Comparable Investment Strategies
The Board reviewed the advisory and administrative fee (together, the "management fee") rate paid by the Fund under the Management Agreement. The Board noted that the management fee rate was comparable to the management fee rates charged by the Adviser to other proprietary funds it manages with investment strategies comparable to those of the Fund taking into account the scope of the services provided.
9
Fees and Expenses Relative to Comparable Funds Managed by Other Advisers
The Board reviewed the management fee rate and total expense ratio of the Fund as compared to the average management fee rate and average total expense ratio for funds, selected by Lipper (the "expense peer group"), managed by other advisers with investment strategies comparable to those of the Fund, as shown in the Lipper Report. The Board concluded that the Fund's total expense ratio, although higher than the peer group average, was acceptable as the management fee rate was competitive with that of its expense peer group.
Breakpoints and Economies of Scale
The Board reviewed the structure of the Fund's management fee schedule under the Management Agreement and noted that it includes breakpoints. The Board also reviewed the level of the Fund's management fee and noted that the fee, as a percentage of the Fund's net assets, would decrease as net assets increase because the management fee includes breakpoints. The Board concluded that the Fund's management fee would reflect economies of scale as assets increase.
Profitability of the Adviser and Affiliates
The Board considered information concerning the costs incurred and profits realized by the Adviser and affiliates during the last year from their relationship with the Fund and during the last two years from their relationship with the Morgan Stanley Fund Complex and reviewed with the Adviser the cost allocation methodology used to determine the profitability of the Adviser and affiliates. Based on its review of the information it received, the Board concluded that the profits earned by the Adviser and affiliates were not excessive in light of the advisory, administrative and other services provided to the Fund.
Fall-Out Benefits
The Board considered so-called "fall-out benefits" derived by the Adviser and affiliates from their relationship with the Fund and the Morgan Stanley Fund Complex, such as sales charges on sales of Class A shares and "float" benefits derived from handling of checks for purchases and sales of Fund shares, through a broker-dealer affiliate of the Adviser and "soft dollar" benefits (discussed in the next section). The Board also considered that, from time to time, the Adviser may, directly or indirectly, effect trades on behalf of certain Morgan Stanley Funds through various electronic communications networks or other alternative trading systems in which the Adviser's affiliates have ownership interests and/or board seats. The Board also considered that a broker-dealer affiliate of the Adviser receives from the Fund 12b-1 fees for distribution and shareholder services. The Board concluded that the fall-out benefits were relatively small and the sales charges and 12b-1 fees were competitive with those of other broker-dealers.
10
Soft Dollar Benefits
The Board considered whether the Adviser realizes any benefits from commissions paid to brokers who execute securities transactions for the Fund ("soft dollars"). The Board noted that the Fund invests only in fixed income securities, which do not generate soft dollars.
Adviser Financially Sound and Financially Capable of Meeting the Fund's Needs
The Board considered whether the Adviser is financially sound and has the resources necessary to perform its obligations under the Management Agreement. The Board concluded that the Adviser has the financial resources necessary to fulfill its obligations under the Management Agreement.
Historical Relationship Between the Fund and the Adviser
The Board also reviewed and considered the historical relationship between the Fund and the Adviser, including the organizational structure of the Adviser, the policies and procedures formulated and adopted by the Adviser for managing the Fund's operations and the Board's confidence in the competence and integrity of the senior managers and key personnel of the Adviser. The Board concluded that it is beneficial for the Fund to continue its relationship with the Adviser.
Other Factors and Current Trends
The Board considered the controls and procedures adopted and implemented by the Adviser and monitored by the Fund's Chief Compliance Officer and concluded that the conduct of business by the Adviser indicates a good faith effort on its part to adhere to high ethical standards in the conduct of the Fund's business.
General Conclusion
After considering and weighing all of the above factors, the Board concluded that it would be in the best interest of the Fund and its shareholders to approve renewal of the Management Agreement for another year.
11
Morgan Stanley High Yield Securities Inc.
Portfolio of Investments n August 31, 2008
PRINCIPAL
AMOUNT IN
THOUSANDS | |
| | COUPON
RATE | | MATURITY
DATE | | VALUE | |
| | | Corporate Bonds (95.2%) | |
| | | Advertising/Marketing Services (2.0%) | |
| $ | 3,505 | | | Idearc Inc. (l) | | | 8.00 | % | | 11/15/16 | | $ | 1,603,538 | | |
| | 660 | | | Interpublic Group of Companies, Inc. (The) | | | 6.25 | | | 11/15/14 | | | 565,950 | | |
| | 1,370 | | | Valassis Communications, Inc. | | | 8.25 | | | 03/01/15 | | | 1,147,375 | | |
| | | | 3,316,863 | | |
| | | Alternative Power Generation (0.5%) | |
| | 800 | | | NRG Energy, Inc. | | | 7.375 | | | 01/15/17 | | | 784,000 | | |
| | | Aluminum (1.1%) | |
| | 1,925 | | | Novelis, Inc. - (Canada) | | | 7.25 | | | 02/15/15 | | | 1,795,062 | | |
| | | Apparel/Footwear (0.7%) | |
| | 1,195 | | | Oxford Industries, Inc. | | | 8.875 | | | 06/01/11 | | | 1,168,112 | | |
| | | Apparel/Footwear Retail (1.0%) | |
| | 1,620 | | | Brown Shoe Co., Inc. | | | 8.75 | | | 05/01/12 | | | 1,611,900 | | |
| | | Auto Parts: O.E.M. (0.5%) | |
| | 920 | | | ArvinMeritor, Inc. (l) | | | 8.75 | | | 03/01/12 | | | 834,900 | | |
| | | Beverages: Alcoholic (0.6%) | |
| | 910 | | | Constellation Brands, Inc. | | | 7.25 | | | 05/15/17 | | | 896,350 | | |
| | | Broadcasting (1.3%) | |
| | 1,120 | | | LIN Television Corp. (l) | | | 6.50 | | | 05/15/13 | | | 924,000 | | |
| | 600 | | | Sirius XM Radio Inc | | | 9.625 | | | 08/01/13 | | | 472,500 | | |
| | 910 | | | XM Satellite Radio Holdings Inc - 144A (a) | | | 13.00 | | | 08/01/13 | | | 805,350 | | |
| | | | 2,201,850 | | |
| | | Building Products (1.7%) | |
| | 1,525 | | | Interface Inc. | | | 9.50 | | | 02/01/14 | | | 1,608,875 | | |
| | 1,950 | | | Nortek Inc. (l) | | | 8.50 | | | 09/01/14 | | | 1,199,250 | | |
| | | | 2,808,125 | | |
| | | Cable/Satellite TV (4.8%) | |
| | 1,795 | | | Cablevision Systems Corp. (Series B) | | | 7.133 | (j) | | 04/01/09 | | | 1,812,950 | | |
| | 893 | | | CCH I LLC/CCH I Cap Co. (l) | | | 11.00 | | | 10/01/15 | | | 689,843 | | |
| | 576 | | | CCH II/CCH II | | | 10.25 | | | 10/01/13 | | | 508,320 | | |
| | 445 | | | CSC Holdings Inc - 144A (a) | | | 8.50 | | | 06/15/15 | | | 449,450 | | |
| | 150 | | | DIRECTV Holdings/Finance | | | 6.375 | | | 06/15/15 | | | 142,125 | | |
| | 1,330 | | | DIRECTV Holdings/Finance - 144A (a) | | | 7.625 | | | 05/15/16 | | | 1,333,325 | | |
| | 1,360 | | | EchoStar DBS Corp. | | | 6.375 | | | 10/01/11 | | | 1,332,800 | | |
| | 1,120 | | | Intelsat Corp. - 144A (a) | | | 9.25 | | | 06/15/16 | | | 1,114,400 | | |
See Notes to Financial Statements
12
Morgan Stanley High Yield Securities Inc.
Portfolio of Investments n August 31, 2008 continued
PRINCIPAL
AMOUNT IN
THOUSANDS | |
| | COUPON
RATE | | MATURITY
DATE | | VALUE | |
| $ | 315 | | | Virgin Media Finance plc (United Kingdom) | | | 8.75 | % | | 04/15/14 | | $ | 302,400 | | |
| | 165 | | | Virgin Media Finance plc (United Kingdom) | | | 9.125 | | | 08/15/16 | | | 157,987 | | |
| | | | 7,843,600 | | |
| | | Casino/Gaming (4.3%) | |
| | 27,175 | | | Aladdin Gaming Holdings/Capital Corp. LLC
(Series B) (b) (c) (f) | | | 13.50 | | | 03/01/10 | | | 0 | | |
| | 3,465 | | | Harrah's Operating Co., Inc (l) | | | 5.375 | | | 12/15/13 | | | 1,585,238 | | |
| | 3,340 | | | Isle of Capri Casinos (l) | | | 7.00 | | | 03/01/14 | | | 2,404,800 | | |
| | 2,285 | | | Las Vegas Sands Corp. (l) | | | 6.375 | | | 02/15/15 | | | 1,839,425 | | |
| | 27,634 | | | Resort At Summerlin LP/Ras Co.
(Series B) (b) (c) (f) | | | 13.00 | | | 12/15/07 | | | 0 | | |
| | 1,670 | | | Station Casinos, Inc. (l) | | | 6.00 | | | 04/01/12 | | | 1,173,175 | | |
| | 265 | | | Station Casinos, Inc. (l) | | | 6.875 | | | 03/01/16 | | | 116,600 | | |
| | | | 7,119,238 | | |
| | | Chemicals: Agricultural (0.8%) | |
| | 1,335 | | | Terra Capital Inc. (Series B) | | | 7.00 | | | 02/01/17 | | | 1,304,962 | | |
| | | Chemicals: Major Diversified (0.8%) | |
| | 1,445 | | | Westlake Chemical Corp. (l) | | | 6.625 | | | 01/15/16 | | | 1,235,475 | | |
| | | Chemicals: Specialty (2.3%) | |
| | 710 | | | Innophos Holdings Inc. - 144A (a) | | | 9.50 | | | 04/15/12 | | | 713,550 | | |
| | 1,070 | | | Innophos, Inc. | | | 8.875 | | | 08/15/14 | | | 1,102,100 | | |
| | 1,045 | | | Koppers Holdings, Inc. | | | 9.875 | (k) | | 11/15/14 | | | 935,275 | | |
| | 915 | | | Koppers Industry Inc. | | | 9.875 | | | 10/15/13 | | | 965,325 | | |
| | | | 3,716,250 | | |
| | | Coal (1.7%) | |
| | 860 | | | Foundation PA Coal Co. | | | 7.25 | | | 08/01/14 | | | 866,450 | | |
| | 1,980 | | | Massey Energy Co. | | | 6.875 | | | 12/15/13 | | | 1,945,350 | | |
| | | | 2,811,800 | | |
| | | Containers/Packaging (4.0%) | |
| | 1,865 | | | Berry Plastics Holding Corp. (l) | | | 8.875 | | | 09/15/14 | | | 1,557,275 | | |
| | 565 | | | Berry Plastics Holdings Corp. (l) | | | 10.25 | | | 03/01/16 | | | 398,325 | | |
| | 940 | | | Graham Packaging Company Inc. | | | 8.50 | | | 10/15/12 | | | 890,650 | | |
| | 945 | | | Graham Packaging Company Inc. | | | 9.875 | | | 10/15/14 | | | 833,962 | | |
| | 2,000 | | | Graphic Packaging International Corp. (l) | | | 9.50 | | | 08/15/13 | | | 1,890,000 | | |
| | 1,020 | | | Owens-Illinois, Inc. (l) | | | 7.50 | | | 05/15/10 | | | 1,048,050 | | |
| | | | 6,618,262 | | |
| | | Data Processing Services (0.8%) | |
| | 1,315 | | | Sungard Data Systems Inc. | | | 9.125 | | | 08/15/13 | | | 1,341,300 | | |
See Notes to Financial Statements
13
Morgan Stanley High Yield Securities Inc.
Portfolio of Investments n August 31, 2008 continued
PRINCIPAL
AMOUNT IN
THOUSANDS | |
| | COUPON
RATE | | MATURITY
DATE | | VALUE | |
| | | Drugstore Chains (0.5%) | |
| $ | 1,170 | | | Rite Aid Corp. | | | 8.625 | % | | 03/01/15 | | $ | 760,500 | | |
| | | Electric Utilities (5.7%) | |
| | 415 | | | AES Corp. (The) | | | 7.75 | | | 03/01/14 | | | 415,000 | | |
| | 1,820 | | | AES Corp. (The) - 144A (a) | | | 8.00 | | | 06/01/20 | | | 1,751,750 | | |
| | 1,215 | | | Intergen NV - 144A (a) | | | 9.00 | | | 06/30/17 | | | 1,245,375 | | |
| | 965 | | | IPALCO Enterprises, Inc. | | | 8.625 | | | 11/14/11 | | | 1,008,425 | | |
| | 980 | | | Israel Electric Corporation Ltd. - 144A (a) | | | 7.25 | | | 01/15/19 | | | 991,323 | | |
| | 1,160 | | | Reliant Energy Inc. (l) | | | 7.875 | | | 06/15/17 | | | 1,125,200 | | |
| | 1,000 | | | Texas Competitive Electric
Holdings LLC - 144A (a) | | | 10.25 | | | 11/01/15 | | | 1,002,500 | | |
| | 1,870 | | | Texas Competitive Electric
Holdings LLC - 144A (a) | | | 10.25 | | | 11/01/15 | | | 1,874,675 | | |
| | | | 9,414,248 | | |
| | | Electrical Products (1.7%) | |
| | 510 | | | Baldor Electric Co. (l) | | | 8.625 | | | 02/15/17 | | | 518,925 | | |
| | 2,373 | | | Ormat Funding Corp. | | | 8.25 | | | 12/30/20 | | | 2,295,791 | | |
| | | | 2,814,716 | | |
| | | Electronic Components (0.3%) | |
| | 550 | | | NXP B.V./NXP Funding LLC | | | 7.875 | | | 10/15/14 | | | 453,750 | | |
| | | Electronic Production Equipment (0.6%) | |
| | 975 | | | KLA Instruments Corp. | | | 6.90 | | | 05/01/18 | | | 960,409 | | |
| | | Finance/Rental/Leasing (4.5%) | |
| | 3,360 | | | Capmark Financial Group Inc. | | | 5.875 | | | 05/10/12 | | | 2,169,979 | | |
| | 140 | | | Capmark Financial Group Inc. | | | 6.30 | | | 05/10/17 | | | 82,718 | | |
| | 2,450 | | | Ford Motor Credit Co. LLC (l) | | | 7.00 | | | 10/01/13 | | | 1,776,791 | | |
| | 3,605 | | | Ford Motor Credit Co. LLC | | | 7.25 | | | 10/25/11 | | | 2,763,373 | | |
| | 317 | | | Residential Capital Corp. (l) | | | 8.125 | | | 11/21/08 | | | 285,300 | | |
| | 60 | | | Residential Capital LLC - 144A (a) | | | 8.50 | | | 05/15/10 | | | 41,700 | | |
| | 873 | | | Residential Capital LLC - 144A (a) | | | 9.625 | | | 05/15/15 | | | 292,455 | | |
| | | | 7,412,316 | | |
| | | Financial Conglomerates (1.8%) | |
| | 2,780 | | | General Motors Acceptance Corp. | | | 6.875 | | | 09/15/11 | | | 1,726,138 | | |
| | 2,115 | | | General Motors Acceptance Corp. (l) | | | 6.75 | | | 12/01/14 | | | 1,149,615 | | |
| | | | 2,875,753 | | |
| | | Financial Services (0.1%) | |
| | 115 | | | Lender Processing Services, Inc. - 144A (a) | | | 8.125 | | | 07/01/16 | | | 117,444 | | |
See Notes to Financial Statements
14
Morgan Stanley High Yield Securities Inc.
Portfolio of Investments n August 31, 2008 continued
PRINCIPAL
AMOUNT IN
THOUSANDS | |
| | COUPON
RATE | | MATURITY
DATE | | VALUE | |
| | | Food Retail (1.5%) | |
| $ | 983 | | | CA FM Lease Trust - 144A (a) | | | 8.50 | % | | 07/15/17 | | $ | 1,098,042 | | |
| | 925 | | | Supervalu Inc. | | | 7.50 | | | 05/15/12 | | | 929,625 | | |
| | 505 | | | Supervalu Inc. | | | 7.50 | | | 11/15/14 | | | 502,475 | | |
| | | | 2,530,142 | | |
| | | Food: Meat/Fish/Dairy (2.5%) | |
| | 1,310 | | | Michael Foods Inc. (Series B) | | | 8.00 | | | 11/15/13 | | | 1,290,350 | | |
| | 1,945 | | | Pilgrim's Pride Corp. (l) | | | 7.625 | | | 05/01/15 | | | 1,731,050 | | |
| | 1,060 | | | Smithfield Foods Inc. | | | 7.00 | | | 08/01/11 | | | 1,012,300 | | |
| | | | 4,033,700 | | |
| | | Forest Products (0.9%) | |
| | 1,470 | | | Crown Americas, Inc. | | | 7.625 | | | 11/15/13 | | | 1,503,075 | | |
| | | Gas Distributors (1.0%) | |
| | 1,245 | | | DYNEGY Holdings Inc. | | | 7.75 | | | 06/01/19 | | | 1,154,738 | | |
| | 550 | | | Equitable Resources, Inc. | | | 6.50 | | | 04/01/18 | | | 558,218 | | |
| | | | 1,712,956 | | |
| | | Home Building (0.1%) | |
| | 170 | | | Pulte Homes, Inc. | | | 6.375 | | | 05/15/33 | | | 130,900 | | |
| | | Home Furnishings (0.9%) | |
| | 1,565 | | | Jarden Corp. (l) | | | 7.50 | | | 05/01/17 | | | 1,400,675 | | |
| | | Hospital/Nursing Management (4.9%) | |
| | 885 | | | Community Health Systems | | | 8.875 | | | 07/15/15 | | | 898,275 | | |
| | 1,200 | | | HCA, Inc. | | | 5.75 | | | 03/15/14 | | | 1,000,500 | | |
| | 390 | | | HCA, Inc | | | 6.25 | | | 02/15/13 | | | 339,300 | | |
| | 2,305 | | | HCA, Inc. (l) | | | 6.50 | | | 02/15/16 | | | 1,930,438 | | |
| | 31 | | | HCA, Inc. | | | 8.75 | | | 09/01/10 | | | 31,465 | | |
| | 210 | | | HCA, Inc. | | | 9.125 | | | 11/15/14 | | | 216,300 | | |
| | 930 | | | Sun Healthcare Group Inc. | | | 9.125 | | | 04/15/15 | | | 934,650 | | |
| | 2,125 | | | Tenet Healthcare Corp. (l) | | | 7.375 | | | 02/01/13 | | | 2,005,469 | | |
| | 615 | | | Tenet Healthcare Corp. (l) | | | 9.875 | | | 07/01/14 | | | 622,688 | | |
| | | | 7,979,085 | | |
| | | Industrial Specialties (1.7%) | |
| | 2,510 | | | Johnsondiversy, Inc. (Series B) (l) | | | 9.625 | | | 05/15/12 | | | 2,566,475 | | |
| | 213 | | | UCAR Finance, Inc. | | | 10.25 | | | 02/15/12 | | | 220,455 | | |
| | | | 2,786,930 | | |
| | | Information Technology Services (0.5%) | |
| | 960 | | | VANGENT INC | | | 9.625 | | | 02/15/15 | | | 820,800 | | |
See Notes to Financial Statements
15
Morgan Stanley High Yield Securities Inc.
Portfolio of Investments n August 31, 2008 continued
PRINCIPAL
AMOUNT IN
THOUSANDS | |
| | COUPON
RATE | | MATURITY
DATE | | VALUE | |
| | | Integrated Oil (0.2%) | |
| $ | 390 | | | Cimarex Energy Co. | | | 7.125 | % | | 05/01/17 | | $ | 382,200 | | |
| | | Major Telecommunications (1.8%) | |
| | 1,580 | | | Sprint Capital Corp. | | | 6.00 | | | 12/01/16 | | | 1,444,024 | | |
| | 1,685 | | | Sprint Capital Corp. | | | 6.90 | | | 05/01/19 | | | 1,565,695 | | |
| | | | 3,009,719 | | |
| | | Media Conglomerates (1.1%) | |
| | 2,126 | | | Canwest Media Inc. (Canada) (l) | | | 8.00 | | | 09/15/12 | | | 1,835,907 | | |
| | | Medical Specialties (1.4%) | |
| | 2,030 | | | Fisher Scientific International, Inc. | | | 6.125 | | | 07/01/15 | | | 2,027,054 | | |
| | 290 | | | Invacare Corp. | | | 9.75 | | | 02/15/15 | | | 295,075 | | |
| | | | 2,322,129 | | |
| | | Medical/Nursing Services (2.3%) | |
| | 1,370 | | | DaVita Inc. | | | 6.625 | | | 03/15/13 | | | 1,342,600 | | |
| | 230 | | | FMC Finance III SA (Luxembourg) | | | 6.875 | | | 07/15/17 | | | 221,950 | | |
| | 2,200 | | | Fresenius Medical Care Capital Trust | | | 7.875 | | | 06/15/11 | | | 2,266,000 | | |
| | | | 3,830,550 | | |
| | | Miscellaneous (0.4%) | |
| | 650 | | | Alfa MTN Invest Ltd. - 144A (a)(l) | | | 9.25 | | | 06/24/13 | | | 648,375 | | |
| | | Miscellaneous Commercial Services (0.4%) | |
| | 200 | | | Iron Mountain Inc. | | | 7.75 | | | 01/15/15 | | | 201,000 | | |
| | 465 | | | Iron Mountain Inc. | | | 8.625 | | | 04/01/13 | | | 469,650 | | |
| | | | 670,650 | | |
| | | Miscellaneous Manufacturing (0.0%) | |
| | 1,470 | | | Propex Fabrics Inc. | | | 10.00 | | | 12/01/12 | | | 22,050 | | |
| | | Motor Vehicles (0.3%) | |
| | 995 | | | General Motors Corp. (l) | | | 8.375 | | | 07/15/33 | | | 497,500 | | |
| | | Oil & Gas Pipelines (2.4%) | |
| | 230 | | | Gaz Capital Sa - 144A (a) | | | 6.51 | | | 03/07/22 | | | 195,477 | | |
| | 1,370 | | | Pacific Energy Partners/Finance | | | 7.125 | | | 06/15/14 | | | 1,374,460 | | |
| | 2,300 | | | Williams Companies, Inc. (The) (l) | | | 7.875 | | | 09/01/21 | | | 2,419,957 | | |
| | | | 3,989,894 | | |
| | | Oil & Gas Production (5.0%) | |
| | 305 | | | Chaparral Energy Inc. | | | 8.875 | | | 02/01/17 | | | 266,112 | | |
| | 1,910 | | | Chaparral Energy, Inc. | | | 8.50 | | | 12/01/15 | | | 1,671,250 | | |
| | 1,355 | | | Chesapeake Energy Corp. | | | 7.50 | | | 09/15/13 | | | 1,375,325 | | |
| | 2,245 | | | Hilcorp Energy/Finance - 144A (a) | | | 7.75 | | | 11/01/15 | | | 2,042,950 | | |
See Notes to Financial Statements
16
Morgan Stanley High Yield Securities Inc.
Portfolio of Investments n August 31, 2008 continued
PRINCIPAL
AMOUNT IN
THOUSANDS | |
| | COUPON
RATE | | MATURITY
DATE | | VALUE | |
| $ | 255 | | | Newfield Exploration Co. | | | 7.125 | % | | 05/15/18 | | $ | 241,612 | | |
| | 1,140 | | | Opti Canada Inc. | | | 8.25 | | | 12/15/14 | | | 1,144,275 | | |
| | 275 | | | Plains Exploration & Production Co. | | | 7.625 | | | 06/01/18 | | | 260,563 | | |
| | 1,175 | | | Sandridge Energy - 144A (a) | | | 8.625 | | | 04/01/15 | | | 1,139,750 | | |
| | | | 8,141,837 | | |
| | | Oilfield Services/Equipment (1.2%) | |
| | 965 | | | CIE Gener de Geophysique S.A. (France) | | | 7.50 | | | 05/15/15 | | | 965,000 | | |
| | 1,055 | | | Helix Energy Solutions - 144A (a) | | | 9.50 | | | 01/15/16 | | | 1,055,000 | | |
| | | | 2,020,000 | | |
| | | Other Consumer Services (0.3%) | |
| | 565 | | | EXPEDIA Inc. - 144A (a) | | | 8.50 | | | 07/01/16 | | | 552,287 | | |
| | | Other Transportation (1.7%) | |
| | 2,635 | | | CHC Helicopter Corp. (Canada) | | | 7.375 | | | 05/01/14 | | | 2,753,575 | | |
| | | Pharmaceuticals: Major (0.9%) | |
| | 1,505 | | | Warner Chilcott Corp. | | | 8.75 | | | 02/01/15 | | | 1,538,862 | | |
| | | Pharmaceuticals: Other (0.3%) | |
| | 465 | | | Axcan Intermediate Holdings - 144A (a) | | | 12.75 | | | 03/01/16 | | | 469,650 | | |
| | | Precious Metals (0.7%) | |
| | 1,040 | | | Freeport-McMoran C & G | | | 8.375 | | | 04/01/17 | | | 1,104,094 | | |
| | | Publishing: Books/Magazines (0.7%) | |
| | 1,536 | | | Dex Media West/Finance | | | 9.875 | | | 08/15/13 | | | 1,186,560 | | |
| | | Pulp & Paper (1.2%) | |
| | 1,560 | | | Georgia Pacific Corp. - 144A (a) | | | 7.125 | | | 01/15/17 | | | 1,454,700 | | |
| | 525 | | | Glatfelter P.H. | | | 7.125 | | | 05/01/16 | | | 518,437 | | |
| | | | 1,973,137 | | |
| | | Real Estate Development (0.5%) | |
| | 1,375 | | | Realogy Corp. (l) | | | 10.50 | | | 04/15/14 | | | 818,125 | | |
| | | Real Estate Investment Trusts (1.1%) | |
| | 1,875 | | | Host Marriott LP | | | 6.375 | | | 03/15/15 | | | 1,640,625 | | |
| | 245 | | | ProLogis | | | 6.625 | | | 05/15/18 | | | 226,087 | | |
| | | | 1,866,712 | | |
| | | Restaurants (0.7%) | |
| | 105 | | | Aramark Corp. | | | 6.301 | (j) | | 02/01/15 | | | 98,175 | | |
| | 320 | | | Aramark Corp. | | | 8.50 | | | 02/01/15 | | | 324,000 | | |
| | 750 | | | Aramark Services Inc. | | | 5.00 | | | 06/01/12 | | | 675,000 | | |
| | | | 1,097,175 | | |
See Notes to Financial Statements
17
Morgan Stanley High Yield Securities Inc.
Portfolio of Investments n August 31, 2008 continued
PRINCIPAL
AMOUNT IN
THOUSANDS | |
| | COUPON
RATE | | MATURITY
DATE | | VALUE | |
| | | Savings Banks (0.3%) | |
| $ | 900 | | | Washington Mutual Pfd - 144A (a)(l)(q) | | | 9.75 | % | | 10/29/49 | | $ | 405,435 | | |
| | | Semiconductors (0.9%) | |
| | 1,780 | | | Freescale Semiconductor (l) | | | 8.875 | | | 12/15/14 | | | 1,450,700 | | |
| | | Services to the Health Industry (2.6%) | |
| | 575 | | | Biomet, Inc. | | | 10.375 | | | 10/15/17 | | | 606,625 | | |
| | 670 | | | Medco Health Solutions, Inc. (l) | | | 7.125 | | | 03/15/18 | | | 691,942 | | |
| | 1,285 | | | National Mentor Holdings Inc. | | | 11.25 | | | 07/01/14 | | | 1,301,062 | | |
| | 1,720 | | | Omnicare Inc. (l) | | | 6.75 | | | 12/15/13 | | | 1,621,100 | | |
| | 125 | | | Omnicare Inc. (l) | | | 6.875 | | | 12/15/15 | | | 118,125 | | |
| | | | 4,338,854 | | |
| | | Specialty Stores (0.8%) | |
| | 645 | | | Sonic Automotive, Inc. | | | 8.625 | | | 08/15/13 | | | 499,875 | | |
| | 990 | | | United Auto Group, inc. | | | 7.75 | | | 12/15/16 | | | 808,087 | | |
| | | | 1,307,962 | | |
| | | Specialty Telecommunications (2.7%) | |
| | 1,395 | | | American Tower Corp. (l) | | | 7.50 | | | 05/01/12 | | | 1,429,875 | | |
| | 565 | | | Citizens Communications | | | 6.25 | | | 01/15/13 | | | 542,400 | | |
| | 945 | | | Citizens Communications | | | 7.125 | | | 03/15/19 | | | 822,150 | | |
| | 432 | | | Panamsat Corp. | | | 9.00 | | | 08/15/14 | | | 407,202 | | |
| | 633 | | | Qwest Communications International | | | 6.304 | (j) | | 02/15/09 | | | 634,583 | | |
| | 525 | | | Windstream Corp. (l) | | | 8.125 | | | 08/01/13 | | | 522,375 | | |
| | | | 4,358,585 | | |
| | | Steel (0.4%) | |
| | 665 | | | Evraz Group SA - 144A (a)(l) | | | 9.50 | | | 04/24/18 | | | 640,063 | | |
| | | Telecommunication Equipment (0.5%) | |
| | 795 | | | Nortel Networks Ltd - 144A (a) | | | 10.75 | | | 07/15/16 | | | 739,350 | | |
| | | Telecommunications (1.1%) | |
| | 6,394 | | | Exodus Communications, Inc. (b)(c)(f) | | | 11.625 | | | 07/15/10 | | | 0 | | |
| | 640 | | | Nordic Tel Company - 144A (a) (Denmark) | | | 8.875 | | | 05/01/16 | | | 619,200 | | |
| | 28,549 | | | Rhythms Netconnections, Inc. (b)(c)(f) | | | 12.75 | | | 04/15/09 | | | 0 | | |
| | 13,439 | | | Rhythms Netconnections, Inc.
(Series B) (b)(c)(f) | | | 13.50 | | | 05/15/08 | | | 0 | | |
| | 4,309 | | | Rhythms Netconnections, Inc.
(Series B) (b)(c)(f) | | | 14.00 | | | 02/15/10 | | | 0 | | |
| EUR | 530 | | | TDC AS (Denmark) | | | 6.50 | | | 04/19/12 | | | 750,323 | | |
| $ | 370 | | | U.S. West Communications Corp. | | | 5.625 | | | 11/15/08 | | | 370,925 | | |
| | | | 1,740,448 | | |
See Notes to Financial Statements
18
Morgan Stanley High Yield Securities Inc.
Portfolio of Investments n August 31, 2008 continued
PRINCIPAL
AMOUNT IN
THOUSANDS | |
| | COUPON
RATE | | MATURITY
DATE | | VALUE | |
| | | Water Utilities (0.4%) | |
| $ | 670 | | | Nalco Co. | | | 7.75 | % | | 11/15/11 | | $ | 681,725 | | |
| | | Wholesale Distributors (1.2%) | |
| | 1,930 | | | RBS Global & Rexnold Corp. | | | 9.50 | | | 08/01/14 | | | 1,891,400 | | |
| | | Wireless Telecommunications (1.6%) | |
| | 685 | | | Nextel Communications, Inc. | | | 6.875 | | | 10/31/13 | | | 563,790 | | |
| | 800 | | | VIP Finance (VIMPELCOM) - 144A (a)(l) | | | 9.125 | | | 04/30/18 | | | 757,610 | | |
| | 1,320 | | | Wind Acquisition Finance SA - 144A (a) | | | 10.75 | | | 12/01/15 | | | 1,359,600 | | |
| | | | 2,681,000 | | |
| | | | | Total Corporate Bonds
(Cost $271,800,908) | | | | | | | | | 156,081,958 | | |
| | | Government Obligation (0.7%) | |
| MXN | 10,995 | | | Mexican Fixed Rate Bonds
(Cost $1,099,938) | | | 9.50 | | | 12/18/14 | | | 1,125,403 | | |
| | | Collateralized Mortgage Obligations (0.2%) | |
| | | Finance/Rental/Leasing (0.2%) | |
| $ | 583 | | | American Home Mortgage
Assets - 2006-4 1A3 (f) | | | 2.781 | | | 10/25/46 | | | 113,907 | | |
| | 678 | | | Countrywide Alternative Loan
Trust - 2006-0A21 A3 (f) | | | 2.751 | | | 03/20/47 | | | 150,778 | | |
| | 400 | | | Master Adjustable Rate Mortgage
Trust - 2007-3 1M2 | | | 3.572 | | | 05/25/47 | | | 73,977 | | |
| | | | | Total Collateralized Mortgage Obligations
(Cost $1,405,641) | | | | | | | | | 338,662 | | |
| | | Senior Loans (0.7%) | |
| | | Finance - Commercial (0.6%) | |
| | 510 | | | First Data Corp. | | | 5.222 | | | 09/24/14 | | | 469,464 | | |
| | 71 | | | First Data Corp. | | | 5.551 | | | 09/24/14 | | | 64,985 | | |
| | 517 | | | First Data Corp. | | | 5.552 | | | 09/24/14 | | | 475,897 | | |
| | | | 1,010,346 | | |
| | | Medical Specialties (0.1%) | |
| | 199 | | | Bausch and Lomb Inc. | | | 6.051 | | | 04/26/15 | | | 192,533 | | |
| | 30 | | | Bausch and Lomb Inc. | | | 6.051 | | | 04/26/15 | | | 29,025 | | |
| | | | 221,558 | | |
| | | | | Total Senior Loans
(Cost $1,293,684) | | | | | | | | | 1,231,904 | | |
See Notes to Financial Statements
19
Morgan Stanley High Yield Securities Inc.
Portfolio of Investments n August 31, 2008 continued
NUMBER OF
SHARES | |
| | VALUE | |
| | | Common Stocks (0.1%) | |
| | | Casino/Gaming (e)(f) (0.0%) | |
| | 212,312 | | | Fitzgeralds Gaming Corp. (g) | | $ | 0 | | |
| | | Electric Utilities (0.0%) | |
| | 197 | | | PNM Resources Inc. (l) | | | 2,323 | | |
| | | Food: Specialty/Candy (d)(e)(f) (0.0%) | |
| | 13,317 | | | SFAC New Holdings Inc. (h) | | | 0 | | |
| | 2,447 | | | SFFB Holdings Inc. | | | 0 | | |
| | | | 0 | | |
| | | Restaurants (d)(e)(f) (0.1%) | |
| | 10,126 | | | American Restaurant Group Holdings, Inc. (Class A) | | | 81,008 | | |
| | | Specialty Telecommunications (d)(e) (0.0%) | |
| | 34,159 | | | Birch Telecom Inc. (i)(f) | | | 341 | | |
| | 8,510 | | | XO Holdings, Inc. (l) | | | 6,127 | | |
| | | | 6,468 | | |
| | | Telecommunications (d)(e) (0.0%) | |
| | 165 | | | Viatel Holdings Bermuda Ltd. (Bermuda) | | | 3,300 | | |
| | | Textiles (d)(e)(f) (0.0%) | |
| | 2,389,334 | | | U.S. Leather, Inc. | | | 0 | | |
| | | Wireless Telecommunications (d) (0.0%) | |
| | 5,199 | | | USA Mobility, Inc. (l) | | | 58,593 | | |
| | | Total Common Stocks
(Cost $217,202,834) | | | 151,692 | | |
| | | Convertible Preferred Stocks (0.1%) | |
| | | Finance/Rental/Leasing (0.1%) | |
| | 4,800 | | | Fannie Mae Ser 2008-1 (Cost $240,000) | | | 82,320 | | |
NUMBER OF
WARRANTS | |
| | EXPIRATION
DATE | |
| |
| | | Warrants (0.0%) | |
| | | Casino Gaming (f) (0.0%) | |
| | 319,500 | | | Aladdin Gaming Enterprises, Inc. - 144A (a) | | 03/01/10 | | | 0 | | |
| | | Specialty Telecommunications (d) (0.0%) | |
| | 17,020 | | | XO Holdings, Inc. (Series A) | | 01/16/10 | | | 511 | | |
| | 12,768 | | | XO Holdings, Inc. (Series B) | | 01/16/10 | | | 415 | | |
See Notes to Financial Statements
20
Morgan Stanley High Yield Securities Inc.
Portfolio of Investments n August 31, 2008 continued
NUMBER OF
WARRANTS | |
| | EXPIRATION
DATE | | VALUE | |
| | 12,768 | | | XO Holdings, Inc. (Series C) | | 01/16/10 | | $ | 255 | | |
| | | | 1,181 | | |
| | | Total Warrants
(Cost $15,210) | | | | | 1,181 | | |
PRINCIPAL
AMOUNT IN
THOUSANDS | |
| |
| |
| | | Short-Term Investments (25.9%) | |
| | | Securities Held as Collateral on Loaned Securities (23.7%) | |
| | | Repurchase Agreements (5.5%) | |
| $ | 2,383 | | | ABN Amro Bank N.V. (2.38%, dated 08/29/08, due 09/02/08; proceeds $2,383,708;
fully collateralized by common stock at the date of this Portfolio of Investments
as follows: Dish Network Corp.; Pfizer Inc.; valued at $2,502,234). | | | 2,383,079 | | |
| | 2,785 | | | Bank of America Securities LLC (1.95% - 2.38% dated 08/29/08, due 09/02/08;
proceeds $2,785,844; fully collateralized by U.S. Government Agency securities,
common stocks and equity units at the date of this Portfolio of Investments as follows:
Freddie Mac 5.00-5.13% due 07/15/12 - 05/01/38; Viacom Inc.; Puget Energy, Inc.;
National Fuel Gas Co.; Equitable Resources, Inc.; DreamWorks Animation
SKG, Inc.; Copano Energy LLC; Millicom International Cellular S.A.; Legg Mason Inc.;
valued at $2,883,782). | | | 2,785,153 | | |
| | 1,906 | | | Lehman Brothers Inc. (2.33%, dated 08/29/08, due 09/02/08; proceeds $1,906,956;
fully collateralized by Municipal Bond at the date of this Portfolio of Investments as
follows: Lehman Municipal Trust Receipts - Ser F2W 2.90% due 11/15/23; valued
at $1,945,003). | | | 1,906,464 | | |
| | 1,962 | | | Merrill Lynch & Co., Inc. (2.12%, dated 08/29/08, due 09/02/08; proceeds $1,962,213;
fully collateralized by U.S. Government Agency security at the date of this Portfolio of
Investments as follows: Federal National Mortgage Assoc. 5.95 due 06/07/27;
valued at $2,001,081). | | | 1,961,751 | | |
| | | | | Total Repurchase Agreements
(Cost $9,036,447) | | | 9,036,447 | | |
NUMBER OF
SHARES (000) | |
| |
| |
| | | Investment Company (m) (18.2%) | |
| | 29,838 | | | Morgan Stanley Institutional Liquidity Money Market Portfolio -
Institutional Class (n) (Cost $29,837,682) | | | 29,837,682 | | |
| | | | | Total Securities Held as Collateral on Loaned Securities
(Cost $38,874,129) | | | 38,874,129 | | |
See Notes to Financial Statements
21
Morgan Stanley High Yield Securities Inc.
Portfolio of Investments n August 31, 2008 continued
NUMBER OF
SHARES (000) | |
| |
VALUE | |
| | | Investment Company (m) (0.4%) | |
| | 644 | | | Morgan Stanley Institutional Liquidity Money Market Portfolio -
Institutional Class (n) (Cost $644,415) | | $ | 644,415 | | |
PRINCIPAL
AMOUNT IN
THOUSANDS | |
| | COUPON
RATE | | MATURITY
DATE | |
| |
| | | U.S. Government Obligations (o) (1.8%) | |
| $ | 780 | | | U.S. Treasury Bills | | | 1.52 - 1.90 | % | | | 10/09/08 | | | | 778,541 | | |
| | 2,160 | | | U.S. Treasury Bills | | | 1.55 | | | | 10/09/08 | | | | 2,156,292 | | |
| | | Total U.S. Government Obligations
(Cost $2,935,091) | | | | | | | | | 2,934,833 | | |
| | | Total Short-Term Investments
(Cost $42,453,635) | | | | | | | | | 42,453,377 | | |
| | | Total Investments (Cost $535,511,850) (p) (r) | | | | | 122.9 | % | | | 201,466,497 | | |
| | | Liabilities in Excess of Other Assets | | | | | (22.9 | ) | | | (37,527,608 | ) | |
| | | Net Assets | | | | | 100.0 | % | | $ | 163,938,889 | | |
(a) Resale is restricted to qualified institutional investors.
(b) Issuer in bankruptcy.
(c) Non-income producing security; bond in default.
(d) Acquired through exchange offer.
(e) Non-income producing security.
(f) Securities with total market value equal to $346,034 have been valued at their fair value as determined in good faith under procedures established by and under general supervision of the Fund's Directors.
(g) Resale is restricted, acquired (12/22/98) at a cost basis of $957,527.
(h) Resale is restricted, acquired (06/10/99) at a cost basis of $133.
(i) Resale is restricted, acquired (between 06/18/98 and 05/11/99) at a cost basis of $17,257,340.
(j) Floating rate security. Rate shown is the rate in effect at August 31, 2008.
(k) Currently a zero coupon bond and is scheduled to pay interest at the rate shown at a future specified date.
(l) All or a portion of this security was on loan at August 31, 2008.
(m) See Note 4 to the financial statements regarding investments in Morgan Stanley Institutional Liquidity Money Market Portfolio-Institutional Class.
(n) Includes cash in the amount of $2,441,484 designated as collateral in connection with open swap contracts.
(o) These securities have been physically segregated in connection with open futures contracts in the amount of $467,420.
(p) Securities have been designated as collateral in the amount equal to $77,950,600 in connection with open forward foreign currency, futures and swap contracts.
(q) On September 26, 2008, Washington Mutual, Inc. filed for bankruptcy.
(r) The aggregate cost for federal income tax purposes is $533,372,629. The aggregate gross unrealized appreciation is $1,687,109 and the aggregate gross unrealized depreciation is $333,593,241, resulting in net unrealized depreciation of $331,906,132.
See Notes to Financial Statements
22
Morgan Stanley High Yield Securities Inc.
Portfolio of Investments n August 31, 2008 continued
Futures Contracts Open at August 31, 2008
NUMBER OF
CONTRACTS | | LONG/SHORT | | DESCRIPTION, DELIVERY
MONTH AND YEAR | | UNDERLYING FACE
AMOUNT AT VALUE | | UNREALIZED
APPRECIATION
(DEPRECIATION) | |
| | 79 | | | Long | | U.S. Treasury Note 2 Year,
December 2008 | | $ | 16,770,219 | | | $ | 3,502 | | |
| | 5 | | | Short | | U.S. Treasury Note 5 Year,
December 2008 | | | (559,688 | ) | | | (652 | ) | |
| | 25 | | | Short | | Swap Future 10 Year,
December 2008 | | | (2,785,156 | ) | | | 1,900 | | |
| | 32 | | | Short | | Swap Future 10 Year,
September 2008 | | | (3,583,000 | ) | | | (29,067 | ) | |
| | 54 | | | Short | | U.S. Treasury Bond 20 Year,
December 2008 | | | (6,334,875 | ) | | | 7,427 | | |
| | 280 | | | Short | | U.S. Treasury Note 10 Year,
December 2008 | | | (32,340,000 | ) | | | (77,629 | ) | |
| | | | | | | Net Unrealized Depreciation | | | | | | $ | (94,519 | ) | |
Credit Default Swap Contracts Open at August 31, 2008:
SWAP COUNTERPARTY &
REFERENCE OBLIGATION | | BUY/SELL
PROTECTION | | NOTIONAL
AMOUNT
(000) | | INTEREST
RATE | | TERMINATION
DATE | | UNREALIZED
APPRECIATION
(DEPRECIATION) | |
UBS Securities
Trane Inc. | | Buy | | $ | 1,020 | | | | 0.50 | % | | March 20, 2013 | | $ | (1,520 | ) | |
Goldman Sachs International
Trane Inc. | | Buy | | | 330 | | | | 0.50 | | | March 20, 2013 | | | (492 | ) | |
UBS Securities
Trane Inc. | | Buy | | | 1,070 | | | | 0.60 | | | March 20, 2018 | | | (972 | ) | |
Goldman Sachs International
Trane Inc. | | Buy | | | 125 | | | | 0.60 | | | March 20, 2018 | | | (113 | ) | |
Lehman Brothers, Inc.***
Arrow Electronics, Inc. | | Buy | | | 510 | | | | 1.40 | | | March 20, 2013 | | | (15,671 | ) | |
Credit Suisse
Arrow Electronics, Inc. | | Buy | | | 1,480 | | | | 1.11 | | | March 20, 2013 | | | (27,614 | ) | |
Credit Suisse
Arrow Electronics, Inc. | | Buy | | | 1,160 | | | | 1.00 | | | March 20, 2015 | | | (18,627 | ) | |
Lehman Brothers, Inc.***
Arrow Electronics, Inc. | | Buy | | | 200 | | | | 1.04 | | | March 20, 2018 | | | (4,258 | ) | |
Goldman Sachs International
Avalonbay Communities Inc. | | Buy | | | 1,625 | | | | 2.20 | | | June 20, 2013 | | | (3,937 | ) | |
See Notes to Financial Statements
23
Morgan Stanley High Yield Securities Inc.
Portfolio of Investments n August 31, 2008 continued
SWAP COUNTERPARTY &
REFERENCE OBLIGATION | | BUY/SELL
PROTECTION | | NOTIONAL
AMOUNT
(000) | | INTEREST
RATE | | TERMINATION
DATE | | UNREALIZED
APPRECIATION
(DEPRECIATION) | |
Bank of America N.A.
Carnival Corp. | | Buy | | $ | 1,085 | | | | 1.57 | % | | March 20, 2018 | | $ | (9,751 | ) | |
Merrill Lynch, Inc.
Carnival Corp. | | Buy | | | 590 | | | | 1.60 | | | March 20, 2018 | | | (6,823 | ) | |
Goldman Sachs International
Coca-Cola Enterprises Inc. | | Buy | | | 1,860 | | | | 0.587 | | | March 20, 2013 | | | (10,924 | ) | |
Lehman Brothers, Inc.***
Coca-Cola Enterprises Inc. | | Buy | | | 1,660 | | | | 0.64 | | | March 20, 2013 | | | (13,399 | ) | |
Merrill Lynch, Inc.
Disney (Walt) Co. | | Buy | | | 2,710 | | | | 0.77 | | | March 20, 2013 | | | (42,975 | ) | |
Goldman Sachs International
Dow Jones Index | | Sell | | | 1,060 | | | | 1.40 | | | December 20, 2012 | | | (3,163 | ) | |
Merrill Lynch, Inc.
Dow Jones Index | | Sell | | | 1,095 | | | | 1.40 | | | December 20, 2012 | | | 17,660 | | |
Lehman Brothers, Inc.***
Dow Jones Index | | Sell | | | 6,435 | | | | 3.75 | | | December 20, 2012 | | | (252,400 | ) | |
UBS Securities
Dow Jones Index | | Sell | | | 2,595 | | | | 5.00 | | | June 20, 2013 | | | (106,112 | ) | |
Goldman Sachs International
Dow Jones Index | | Sell | | | 4,685 | | | | 5.00 | | | June 20, 2013 | | | (62,737 | ) | |
Lehman Brothers, Inc.***
Dow Jones Index | | Sell | | | 3,160 | | | | 5.00 | | | June 20, 2013 | | | (24,541 | ) | |
Citigroup Global Markets
Eaton Corp. | | Buy | | | 1,420 | | | | 0.82 | | | March 20, 2018 | | | 10,279 | | |
Goldman Sachs International
Eaton Corp. | | Buy | | | 600 | | | | 0.97 | | | March 20, 2018 | | | (2,423 | ) | |
Merrill Lynch, Inc.
Eaton Corp. | | Buy | | | 645 | | | | 0.92 | | | March 20, 2018 | | | (180 | ) | |
Bank of America N.A.
Goodrich Corp. | | Buy | | | 760 | | | | 0.70 | | | March 20, 2013 | | | (4,021 | ) | |
Bank of America N.A.
Goodrich Corp. | | Buy | | | 530 | | | | 0.82 | | | March 20, 2018 | | | (5,929 | ) | |
Lehman Brothers, Inc.***
Goodrich Corp. | | Buy | | | 430 | | | | 0.46 | | | March 20, 2018 | | | 6,998 | | |
Goldman Sachs International
Goodrich Corp. | | Buy | | | 510 | | | | 0.47 | | | March 20, 2018 | | | 7,911 | | |
J.P. Morgan Securities
Interpublic Group of Companies, Inc. (The) | | Buy | | | 570 | | | | 3.60 | | | September 20, 2013 | | | 20,331 | | |
See Notes to Financial Statements
24
Morgan Stanley High Yield Securities Inc.
Portfolio of Investments n August 31, 2008 continued
SWAP COUNTERPARTY &
REFERENCE OBLIGATION | | BUY/SELL
PROTECTION | | NOTIONAL
AMOUNT
(000) | | INTEREST
RATE | | TERMINATION
DATE | | UNREALIZED
APPRECIATION
(DEPRECIATION) | |
UBS Securities
Martin Marietta Materials, Inc. | | Buy | | $ | 430 | | | | 1.78 | % | | March 20, 2013 | | $ | 7,669 | | |
UBS Securities
Martin Marietta Materials, Inc. | | Buy | | | 290 | | | | 1.73 | | | March 20, 2018 | | | 11,015 | | |
J.P. Morgan Securities
Merrill Lynch Co. | | Buy | | | 945 | | | | 2.30 | | | March 20, 2013 | | | 33,992 | | |
J.P. Morgan Securities
Nordstrom, Inc. | | Buy | | | 280 | | | | 1.07 | | | March 20, 2018 | | | 9,921 | | |
J.P. Morgan Securities
Nordstrom, Inc. | | Buy | | | 580 | | | | 1.15 | | | March 20, 2018 | | | 17,224 | | |
J.P. Morgan Securities
Pepsi Bottling Group, Inc. | | Buy | | | 640 | | | | 0.63 | | | March 20, 2013 | | | (3,186 | ) | |
J.P. Morgan Securities
Pepsi Bottling Group, Inc. | | Buy | | | 470 | | | | 0.58 | | | March 20, 2013 | | | (1,358 | ) | |
Credit Suisse
Pactiv Corp. | | Buy | | | 1,610 | | | | 1.35 | | | March 20, 2013 | | | (12,384 | ) | |
Bank of America N.A.
Pactiv Corp. | | Buy | | | 310 | | | | 1.375 | | | March 20, 2013 | | | (2,702 | ) | |
Deutsche Bank
Pactiv Corp. | | Buy | | | 570 | | | | 1.34 | | | March 20, 2013 | | | (4,151 | ) | |
Goldman Sachs International
Prologis | | Buy | | | 510 | | | | 2.97 | | | June 20, 2013 | | | 3,592 | | |
Goldman Sachs International
Qwest Capital Funding | | Sell | | | 515 | | | | 3.25 | | | December 20, 2012 | | | (45,264 | ) | |
Goldman Sachs International
Sealed Air Corp. | | Buy | | | 315 | | | | 1.24 | | | March 20, 2018 | | | 14,481 | | |
Goldman Sachs International
Sealed Air Corp. | | Buy | | | 595 | | | | 1.08 | | | March 20, 2018 | | | 34,017 | | |
J.P. Morgan Securities
SLM Corp. | | Sell | | | 525 | | | | 4.95 | | | March 20, 2013 | | | (9,203 | ) | |
Merrill Lynch, Inc.
SLM Corp. | | Sell | | | 525 | | | | 5.00 | | | March 20, 2013 | | | (8,302 | ) | |
Goldman Sachs International
Textron Financial Corp. | | Buy | | | 670 | | | | 1.05 | | | March 20, 2013 | | | 13,025 | | |
UBS Securities
Textron Financial Corp. | | Buy | | | 125 | | | | 1.01 | | | March 20, 2013 | | | 2,718 | | |
Bank of America N.A.
Textron Financial Corp | | Buy | | | 875 | | | | 0.80 | | | March 20, 2018 | | | 44,825 | | |
See Notes to Financial Statements
25
Morgan Stanley High Yield Securities Inc.
Portfolio of Investments n August 31, 2008 continued
SWAP COUNTERPARTY &
REFERENCE OBLIGATION | | BUY/SELL
PROTECTION | | NOTIONAL
AMOUNT
(000) | | INTEREST
RATE | | TERMINATION
DATE | | UNREALIZED
APPRECIATION
(DEPRECIATION) | |
UBS Securities
Toll Brothers, Inc. | | Buy | | $ | 1,425 | | | | 2.90 | % | | March 20, 2013 | | $ | (9,290 | ) | |
Bank of America N.A.
Toll Brothers, Inc. | | Buy | | | 930 | | | | 2.90 | | | March 20, 2013 | | | (6,063 | ) | |
Deutsche Bank
Washington Mutual | | Buy | | | 955 | | | | 5.00 | | | June 20, 2013 | | | 243,281 | | |
| Net Unrealized Depreciation | | $ | (221,546 | ) | |
*** On September 15, 2008, Lehman Brothers Holdings, Inc. filed for bankruptcy. Subsequently, the Fund had effectively closed these transactions and had recorded a net payable to Lehman Brothers Holdings, Inc. regarding these contracts in the amount of $518,308.
Interest Rate Swap Contracts Open at August 31, 2008:
| COUNTERPARTY | | NOTIONAL
AMOUNT
(000) | | PAYMENTS
RECEIVED BY FUND | | PAYMENTS
MADE BY FUND | | TERMINATION
DATE | | UNREALIZED
APPRECIATION
(DEPRECIATION) | |
| Bank of America N.A. | | $ | 3,739 | | | Fixed Rate 5.550% | | Floating Rate 0.000# % | | February 22, 2018 | | $ | 72,013 | | |
| Bank of America N.A. | | | 12,510 | | | Fixed Rate 5.637 | | Floating Rate 0.000# | | March 7, 2018 | | | 278,473 | | |
| Bank of America N.A. | | | 3,600 | | | Fixed Rate 5.070 | | Floating Rate 0.000# | | April 14, 2018 | | | 3,708 | | |
| Bank of America N.A. | | | 2,865 | | | Fixed Rate 4.982 | | Floating Rate 0.000# | | April 15, 2018 | | | (6,188 | ) | |
| Bank of America N.A. | | | 17,098 | | | Fixed Rate 5.557 | | Floating Rate 0.000# | | July 24, 2023 | | | 144,478 | | |
| Bank of America N.A. | | | 13,305 | | | Floating Rate 0.000# | | Fixed Rate 5.380 | | July 24, 2018 | | | (148,484 | ) | |
| Bank of America N.A. | | | 4,671 | | | Floating Rate 0.000# | | Fixed Rate 5.957 | | February 22, 2023 | | | (93,560 | ) | |
| Bank of America N.A. | | | 16,085 | | | Floating Rate 0.000# | | Fixed Rate 6.040 | | March 7, 2023 | | | (358,535 | ) | |
| Bank of America N.A. | | | 4,610 | | | Floating Rate 0.000# | | Fixed Rate 5.470 | | April 14, 2023 | | | (28,167 | ) | |
| Bank of America N.A. | | | 3,450 | | | Floating Rate 0.000# | | Fixed Rate 5.380 | | April 15, 2023 | | | (12,317 | ) | |
| Citibank N.A. | | | 13,000 | | | Fixed Rate 5.004 | | Floating Rate 2.798# | | October 31, 2017 | | | 559,780 | | |
Deutsche Bank AG,
New York | | EUR | 8,975 | | | Fixed Rate 4.957 | | Floating Rate 0.000## | | July 24, 2018 | | | 133,248 | | |
Deutsche Bank AG,
New York | | | 17,245 | | | Fixed Rate 5.268 | | Floating Rate 0.000## | | July 3, 2023 | | | 199,358 | | |
Deutsche Bank AG,
New York | | | 2,750 | | | Fixed Rate 5.238 | | Floating Rate 0.000## | | July 9, 2023 | | | 28,442 | | |
Deutsche Bank AG,
New York | | | 2,500 | | | Fixed Rate 5.240 | | Floating Rate 0.000## | | July 10, 2023 | | | 26,004 | | |
Deutsche Bank AG,
New York | | | 13,765 | | | Floating Rate 0.000## | | Fixed Rate 4.934 | | July 1, 2018 | | | (191,439 | ) | |
Deutsche Bank AG,
New York | | | 2,195 | | | Floating Rate 0.000## | | Fixed Rate 4.861 | | July 9, 2018 | | | (22,090 | ) | |
Deutsche Bank AG,
New York | | | 1,990 | | | Floating Rate 0.000## | | Fixed Rate 4.860 | | July 10, 2018 | | | (19,881 | ) | |
See Notes to Financial Statements
26
Morgan Stanley High Yield Securities Inc.
Portfolio of Investments n August 31, 2008 continued
| COUNTERPARTY | | NOTIONAL
AMOUNT
(000) | | PAYMENTS
RECEIVED BY FUND | | PAYMENTS
MADE BY FUND | | TERMINATION
DATE | | UNREALIZED
APPRECIATION
(DEPRECIATION) | |
Deutsche Bank AG,
New York | | EUR | 11,248 | | | Floating Rate 0.000##% | | Fixed Rate 5.187 % | | July 24, 2023 | | $ | (92,408 | ) | |
JPMorgan Chase
Bank N.A. | | $ | 30,000 | | | Fixed Rate 4.902 | | Floating Rate 2.810# | | November 20, 2017 | | | 1,058,400 | | |
| Merrill Lynch & Co. | | | 3,825 | | | Fixed Rate 5.000 | | Floating Rate 0.000# | | April 15, 2018 | | | (5,814 | ) | |
| Merrill Lynch & Co. | | | 4,850 | | | Floating Rate 0.000# | | Fixed Rate 5.395 | | April 15, 2023 | | | (19,351 | ) | |
| Net Unrealized Appreciation | | $ | 1,505,670 | | |
# Floating rate represents USD-3 months LIBOR.
## Floating rate represents EUR-3 Months EURIBOR.
Forward Foreign Currency Contracts Open at August 31, 2008:
CONTRACTS
TO DELIVER | | IN EXCHANGE
FOR | | DELIVERY
DATE | | UNREALIZED
APPRECIATION | |
| EUR | 543,000 | | | $ | 843,279 | | | October 31, 2008 | | $ | 49,376 | | |
Currency Abbreviations:
EUR Euro.
MXN Mexican New Peso.
See Notes to Financial Statements
27
Morgan Stanley High Yield Securities Inc.
Financial Statements
Statement of Assets and Liabilities
August 31, 2008
| Assets: | |
| Investments in securities, at value (cost $505,029,753) (Including $37,270,440 securities loaned) | | $ | 170,984,400 | | |
| Investment in affiliate, at value (cost $30,482,097) | | | 30,482,097 | | |
| Unrealized appreciation on open forward foreign currency contracts | | | 49,376 | | |
| Unrealized appreciation on open swap contracts | | | 3,002,843 | | |
| Cash | | | 14,775 | | |
| Receivable for: | |
| Interest | | | 3,776,960 | | |
| Investments sold | | | 1,770,000 | | |
| Periodic interest on swap contracts | | | 810,920 | | |
| Variation margin | | | 95,982 | | |
| Capital stock sold | | | 1,615 | | |
| Dividends from affiliate | | | 1,556 | | |
| Prepaid expenses and other assets | | | 45,674 | | |
| Total Assets | | | 211,036,198 | | |
| Liabilities: | |
| Collateral on securities loaned at value | | | 38,874,129 | | |
| Swap contracts collateral due to brokers | | | 2,441,484 | | |
| Unrealized depreciation on open swap contracts | | | 1,718,719 | | |
| Payable for: | |
| Investments purchased | | | 1,819,686 | | |
| Capital stock redeemed | | | 224,962 | | |
| Periodic interest on swap contracts | | | 151,976 | | |
| Investment advisory fee | | | 58,348 | | |
| Transfer agent fee | | | 51,643 | | |
| Distribution fee | | | 48,693 | | |
| Administration fee | | | 11,154 | | |
| Accrued expenses and other payables | | | 502,087 | | |
| Premium received on swap contracts | | | 1,194,428 | | |
| Total Liabilities | | | 47,097,309 | | |
| Net Assets | | $ | 163,938,889 | | |
| Composition of Net Assets: | |
| Paid-in-capital | | $ | 2,407,355,814 | | |
| Net unrealized depreciation | | | (332,807,622 | ) | |
| Accumulated undistributed net investment income | | | 3,530,164 | | |
| Accumulated net realized loss | | | (1,914,139,467 | ) | |
| Net Assets | | $ | 163,938,889 | | |
| Class A Shares: | |
| Net Assets | | $ | 61,839,445 | | |
| Shares Outstanding (2,000,000,000 shares authorized, $.01 par value) | | | 37,731,170 | | |
| Net Asset Value Per Share | | $ | 1.64 | | |
Maximum Offering Price Per Share,
(net asset value plus 4.44% of net asset value) | | $ | 1.71 | | |
| Class B Shares: | |
| Net Assets | | $ | 41,721,180 | | |
| Shares Outstanding (2,000,000,000 shares authorized, $.01 par value) | | | 25,725,272 | | |
| Net Asset Value Per Share | | $ | 1.62 | | |
| Class C Shares: | |
| Net Assets | | $ | 11,842,872 | | |
| Shares Outstanding (2,000,000,000 shares authorized, $.01 par value) | | | 7,273,659 | | |
| Net Asset Value Per Share | | $ | 1.63 | | |
| Class I Shares@@: | |
| Net Assets | | $ | 48,535,392 | | |
| Shares Outstanding (2,000,000,000 shares authorized, $.01 par value) | | | 29,704,736 | | |
| Net Asset Value Per Share | | $ | 1.63 | | |
@@ Formerly Class D shares. Renamed Class I shares effective March 31, 2008.
See Notes to Financial Statements
28
Morgan Stanley High Yield Securities Inc.
Financial Statements continued
Statement of Operations
For the year ended August 31, 2008
Net Investment Income:
Income | |
| Interest | | $ | 15,520,286 | | |
| Dividends from affiliates | | | 154,216 | | |
| Income from securities loaned - net | | | 73,951 | | |
| Dividends | | | 161 | | |
| Total Income | | | 15,748,614 | | |
| Expenses | |
| Professional fees | | | 1,057,238 | | |
| Investment advisory fee | | | 796,868 | | |
| Transfer agent fees and expenses | | | 575,560 | | |
| Distribution fee (Class B shares) | | | 406,870 | | |
| Distribution fee (Class A shares) | | | 168,346 | | |
| Distribution fee (Class C shares) | | | 116,109 | | |
| Administration fee | | | 151,784 | | |
| Shareholder reports and notices | | | 100,783 | | |
| Registration fees | | | 59,724 | | |
| Other | | | 31,931 | | |
| Directors' fees and expenses | | | 18,393 | | |
| Custodian fees | | | 14,772 | | |
| Total Expenses | | | 3,498,378 | | |
| Less: rebate from Morgan Stanley affiliated cash sweep (Note 4) | | | (4,129 | ) | |
| Less: expense offset | | | (1,239 | ) | |
| Net Expenses | | | 3,493,010 | | |
| Net Investment Income | | | 12,255,604 | | |
Realized and Unrealized Gain (Loss):
Realized Gain (Loss) on: | |
| Investments | | | 2,383,447 | | |
| Futures contracts | | | (1,430,592 | ) | |
| Swap contracts | | | 457,568 | | |
| Foreign exchange transactions | | | (102,429 | ) | |
| Net Realized Gain | | | 1,307,994 | | |
| Change in Unrealized Appreciation/Depreciation on: | |
| Investments | | | (12,102,413 | ) | |
| Futures contracts | | | (94,519 | ) | |
| Swap contracts | | | 1,176,703 | | |
| Translation of other assets and liabilities denominated in foreign currencies | | | 47,264 | | |
| Net Change in Unrealized Appreciation/Depreciation | | | (10,972,965 | ) | |
| Net Loss | | | (9,664,971 | ) | |
| Net Increase | | $ | 2,590,633 | | |
See Notes to Financial Statements
29
Morgan Stanley High Yield Securities Inc.
Financial Statements continued
Statements of Changes in Net Assets
| | | FOR THE YEAR
ENDED
AUGUST 31, 2008 | | FOR THE YEAR
ENDED
AUGUST 31, 2007 | |
| Increase (Decrease) in Net Assets: | |
| Operations: | |
| Net investment income | | $ | 12,255,604 | | | $ | 15,501,672 | | |
| Net realized gain | | | 1,307,994 | | | | 4,906,322 | | |
| Net change in unrealized appreciation/depreciation | | | (10,972,965 | ) | | | (2,692,049 | ) | |
| Net Increase | | | 2,590,633 | | | | 17,715,945 | | |
| Dividends to Shareholders from Net Investment Income: | |
| Class A shares | | | (4,436,122 | ) | | | (4,803,404 | ) | |
| Class B shares | | | (3,333,056 | ) | | | (5,631,157 | ) | |
| Class C shares | | | (822,177 | ) | | | (1,057,620 | ) | |
| Class I shares@@ | | | (3,714,579 | ) | | | (4,454,336 | ) | |
| Total Dividends | | | (12,305,934 | ) | | | (15,946,517 | ) | |
| Net decrease from capital stock transactions | | | (40,565,263 | ) | | | (73,600,924 | ) | |
| Net Decrease | | | (50,280,564 | ) | | | (71,831,496 | ) | |
| Net Assets: | |
| Beginning of period | | | 214,219,453 | | | | 286,050,949 | | |
End of Period
(Including accumulated undistributed net investment income of $3,530,164
and $2,439,431, respectively) | | $ | 163,938,889 | | | $ | 214,219,453 | | |
@@ Formerly Class D shares. Renamed Class I shares effective March 31, 2008.
See Notes to Financial Statements
30
Morgan Stanley High Yield Securities Inc.
Notes to Financial Statements n August 31, 2008
1. Organization and Accounting Policies
Morgan Stanley High Yield Securities Inc. (the "Fund") is registered under the Investment Company Act of 1940, as amended, (the "Act") as a diversified, open-end management investment company. The Fund seeks as a primary objective to earn a high level of current income. As a secondary objective, the fund seeks capital appreciation but only to the extent consistent with its primary objective. The Fund was incorporated in Maryland on June 14, 1979 and commenced operations on September 26, 1979. On July 28, 1997, the Fund converted to a multiple class share structure.
The Fund offers Class A shares, Class B shares, Class C shares and Class I shares. The four classes are substantially the same except that most Class A shares are subject to a sales charge imposed at the time of purchase and some Class A shares, and most Class B shares and Class C shares are subject to a contingent deferred sales charge imposed on shares redeemed within eighteen months, six years and one year, respectively. Class I shares are not subject to a sales charge. Additionally, Class A shares, Class B shares and Class C shares incur distribution expenses. Effective March 31, 2008, Class D shares were renamed Class I shares.
The Fund will assess a 2% redemption fee, on Class A shares, Class B shares, Class C shares, and Class I shares, which is paid directly to the Fund, for shares redeemed or exchanged within thirty days of purchase, subject to certain exceptions. The redemption fee is designed to protect the Fund and its remaining shareholders from the effects of short-term trading.
The following is a summary of significant accounting policies:
A. Valuation of Investments — (1) an equity portfolio security listed or traded on the New York Stock Exchange ("NYSE") or American Stock Exchange or other exchange is valued at its latest sale price prior to the time when assets are valued; if there were no sales that day, the security is valued at the mean between the last reported bid and asked price; (2) an equity portfolio security listed or traded on the Nasdaq is valued at the Nasdaq Official Closing Price; if there were no sales that day, the security is valued at the mean between the last reported bid and asked price; (3) all other portfolio securities for which over-the-counter market quotations are readily available are valued at the mean between the last reported bid and asked price. In cases where a security is traded on more than one exchange, the security is valued on the exchange designated as the primary market; (4) for equity securities traded on foreign e xchanges, the last reported sale price or the latest bid price may be used if there were no sales on a particular day; (5) credit default/interest rate swaps are marked to market daily based upon quotations from market makers; (6) futures are valued at the latest price published by the commodities exchange on which they trade; (7) when market quotations are not readily available including circumstances under which Morgan Stanley Investment Advisors Inc. (the "Investment Adviser") determines that the latest sale price, the bid price or the mean between the last reported bid and asked price do not reflect a security's market value, portfolio securities are valued at their fair value as
31
Morgan Stanley High Yield Securities Inc.
Notes to Financial Statements n August 31, 2008 continued
determined in good faith under procedures established by and under the general supervision of the Fund's Directors. Occasionally, developments affecting the closing prices of securities and other assets may occur between the times at which valuations of such securities are determined (that is, close of the foreign market on which the securities trade) and the close of business on the NYSE. If developments occur during such periods that are expected to materially affect the value of such securities, such valuations may be adjusted to reflect the estimated fair value of such securities as of the close of the NYSE, as determined in good faith by the Fund's Directors or by the Investment Adviser using a pricing service and/or procedures approved by the Directors of the Fund; (8) certain portfolio securities may be valued by an outside pricing service approved by the Fund's Directors; (9) investments in open-end mutual funds, includi ng the Morgan Stanley Institutional Liquidity Funds, are valued at the net asset value as of the close of each business day; and (10) short-term debt securities having a maturity date of more than sixty days at time of purchase are valued on a mark-to-market basis until sixty days prior to maturity and thereafter at amortized cost based on their value on the 61st day. Short-term debt securities having a maturity date of sixty days or less at the time of purchase are valued at amortized cost.
B. Accounting for Investments — Security transactions are accounted for on the trade date (date the order to buy or sell is executed). Realized gains and losses on security transactions are determined by the identified cost method. Dividend income and other distributions are recorded on the ex-dividend date. Discounts are accreted and premiums are amortized over the life of the respective securities and are included in interest income. Interest income is accrued daily except where collection is not expected.
C. Multiple Class Allocations — Investment income, expenses (other than distribution fees), and realized and unrealized gains and losses are allocated to each class of shares based upon the relative net asset value on the date such items are recognized. Distribution fees are charged directly to the respective class.
D. Futures Contracts — A futures contract is an agreement between two parties to buy and sell financial instruments or contracts based on financial indices at a set price on a future date. Upon entering into such a contract, the Fund is required to pledge to the broker cash, U.S. Government securities or other liquid portfolio securities equal to the minimum initial margin requirements of the applicable futures exchange. Pursuant to the contract, the Fund agrees to receive from or pay to the broker an amount of cash equal to the daily fluctuation in the value of the contract. Such receipts or payments known as variation margin are recorded by the Fund as unrealized gains or losses. Upon closing of the contract, the Fund realizes a gain or loss equal to the difference between the value of the contract at the time it was opened and the value at the time it was closed.
E. Foreign Currency Translation and Forward Foreign Currency Contracts — The books and records of the Fund are maintained in U.S. dollars as follows: (1) the foreign currency market value of investment securities, other assets and liabilities and forward foreign currency contracts ("forward contracts") are
32
Morgan Stanley High Yield Securities Inc.
Notes to Financial Statements n August 31, 2008 continued
translated at the exchange rates prevailing at the end of the period; and (2) purchases, sales, income and expenses are translated at the exchange rates prevailing on the respective dates of such transactions. The resultant exchange gains and losses are recorded as realized and unrealized gain/loss on foreign exchange transactions. Pursuant to U.S. federal income tax regulations, certain foreign exchange gains/losses included in realized and unrealized gain/loss are included in or are a reduction of ordinary income for federal income tax purposes. The Fund does not isolate that portion of the results of operations arising as a result of changes in the foreign exchange rates from the changes in the market prices of the securities. Forward contracts are valued daily at the appropriate exchange rates. The resultant unrealized exchange gains and losses are recorded as unrealized foreign currency gain or loss. The Fund records realiz ed gains or losses on delivery of the currency or at the time the forward contract is extinguished (compensated) by entering into a closing transaction prior to delivery.
F. Credit Default Swaps — A credit default swap is an agreement between two parties to exchange the credit risk of an issuer. The Fund may purchase credit protection on the referenced obligation of the credit default swap ("Buy Contract"), or provide credit protection on the referenced obligation of the credit default swap ("Sale Contract"). A buyer of a credit default swap is said to buy protection by paying periodic fees in return for a contingent payment from the seller if the issuer has a credit event such as bankruptcy or a failure to pay outstanding obligations while the swap is outstanding. A seller of a credit default swap is said to sell protection and thus collects the periodic fees and profits if the credit of the issuer remains stable or improves while the swap is outstanding. If a credit event occurs, the seller pays to the buyer an agreed amount which approximates the notional amount of the swap contract as di sclosed in the table following the Portfolio of Investments. During the term of the swap agreement, the Fund receives or pays periodic fixed payments from or to the respective counterparty calculated at the agreed upon interest rate applied to the notional amount. These periodic payments are accrued daily and recorded as realized gains or losses in the Statement of Operations. In addition, upon termination of the swap contract, gains and losses are also realized. Any upfront payment received or paid by the Fund is recorded as assets/liabilities on the Fund's books. The Fund may pay or receive cash to collateralize credit default swap contracts. This cash collateral is recorded as assets/liabilities on the Fund's books. Any cash received may be invested in Morgan Stanley Institutional Liquidity Fund.
G. Interest Rate Swaps — Interest rate swaps involve the exchange of commitments to pay and receive interest based on a notional principal amount. Net periodic interest payments to be received or paid are accrued daily and are recorded as realized gains or losses in the Statement of Operations. The Fund may pay or receive cash to collateralize interest rate swap contracts. This cash collateral is recorded as assets/liabilities on the Fund's books. Any cash received may be invested in Morgan Stanley Institutional Liquidity Funds.
33
Morgan Stanley High Yield Securities Inc.
Notes to Financial Statements n August 31, 2008 continued
H. Security Lending — The Fund may lend securities to qualified financial institutions, such as broker-dealers, to earn additional income. Any increase or decrease in the fair value of the securities loaned that might occur and any interest earned or dividends declared on those securities during the term of the loan would remain in the Fund. The Fund receives cash or securities as collateral in an amount equal to or exceeding 100% of the current fair value of the loaned securities. The collateral is marked-to-market daily, by the securities lending agent, to ensure that a minimum of 100% collateral coverage is maintained.
Based on pre-established guidelines, the securities lending agent invests any cash collateral that is received in high-quality short-term investments. Securities lending income is generated from the earnings on the invested collateral and borrowing fees, less any rebates owed to the borrowers and compensation to the lending agent.
The value of loaned securities and related collateral outstanding at August 31, 2008 are $37,270,440 and $38,874,129, respectively. The Fund has the right under the lending agreement to recover the securities from the borrower.
I. Federal Income Tax Policy — It is the Fund's policy to comply with the requirements of Subchapter M of the Internal Revenue Code applicable to regulated investment companies and to distribute substantially all of its taxable income to its shareholders. Therefore, no federal income tax provision is required. The Fund files tax returns with the U.S. Internal Revenue Service, New York State and New York City. The Fund adopted the provisions of the Financial Accounting Standards Board ("FASB") Interpretation No. 48 ("FIN 48") Accounting for Uncertainty in Income Taxes on February 28, 2008. FIN 48 sets forth a minimum threshold for fina ncial statement recognition of the benefit of a tax position taken or expected to be taken in a tax return. The implementation of FIN 48 did not result in any unrecognized tax benefits in the accompanying financial statements. If applicable, the Fund recognizes interest accrued related to unrecognized tax benefits in interest expense and penalties in other expenses in the Statement of Operations. Each of the tax years in the four year period ended August 31, 2008, remains subject to examination by taxing authorities.
J. Dividends and Distributions to Shareholders — Dividends and distributions to shareholders are recorded on the ex-dividend date.
K. Use of Estimates — The preparation of financial statements in accordance with generally accepted accounting principles requires management to make estimates and assumptions that affect the reported amounts and disclosures. Actual results could differ from those estimates.
2. Investment Advisory/ Administration Agreements
Pursuant to an Investment Advisory Agreement, the Fund pays the Investment Adviser an advisory fee, accrued daily and payable monthly, by applying the following annual rates to the net assets of the Fund
34
Morgan Stanley High Yield Securities Inc.
Notes to Financial Statements n August 31, 2008 continued
determined at the close of each business day: 0.42% to the portion of the daily net assets not exceeding $500 million; 0.345% to the portion of the daily net assets exceeding $500 million but not exceeding $750 million; 0.295% to the portion of the daily net assets exceeding $750 million but not exceeding $1 billion; 0.27% to the portion of the daily net assets exceeding $1 billion but not exceeding $2 billion; 0.245% to the portion of the daily net assets exceeding $2 billion but not exceeding $3 billion; and 0.22% to the portion of the daily net assets exceeding $3 billion.
Pursuant to an Administration Agreement with Morgan Stanley Services Company Inc. (the "Administrator"), an affiliate of the Investment Adviser, the Fund pays an administration fee, accrued daily and payable monthly, by applying the annual rate of 0.08% to the Fund's daily net assets.
Under an agreement between the Administrator and State Street Bank and Trust Company ("State Street"), State Street provides certain administrative services to the Fund. For such services, the Administrator pays State Street a portion of the fee the Administrator receives from the Fund.
3. Plan of Distribution
Shares of the Fund are distributed by Morgan Stanley Distributors Inc. (the "Distributor"), an affiliate of the Investment Adviser and Administrator. The Fund has adopted a Plan of Distribution (the "Plan") pursuant to Rule 12b-1 under the Act. The Plan provides that the Fund will pay the Distributor a fee which is accrued daily and paid monthly at the following annual rates: (i) Class A — up to 0.25% of the average daily net assets of Class A shares; (ii) Class B — up to 0.75% of the average daily net assets of Class B shares; and (iii) Class C — up to 0.85% of the average daily net assets of Class C shares.
In the case of Class B shares, provided that the Plan continues in effect, any cumulative expenses incurred by the Distributor but not yet recovered may be recovered through the payment of future distribution fees from the Fund pursuant to the Plan and contingent deferred sales charges paid by investors upon redemption of Class B shares. Although there is no legal obligation for the Fund to pay expenses incurred in excess of payments made to the Distributor under the Plan and the proceeds of contingent deferred sales charges paid by investors upon redemption of shares, if for any reason the Plan is terminated, the Directors will consider at that time the manner in which to treat such expenses. The Distributor has advised the Fund that such excess amounts totaled $64,705,065 at August 31, 2008.
In the case of Class A shares and Class C shares, expenses incurred pursuant to the Plan in any calendar year in excess of 0.25% or 0.85% of the average daily net assets of Class A or Class C, respectively, will not be reimbursed by the Fund through payments in any subsequent year, except that expenses representing a gross sales credit to Morgan Stanley Financial Advisors and other authorized financial representatives at the time of sale may be reimbursed in the subsequent calendar year. For the year ended August 31, 2008, the distribution fee was accrued for Class A shares and Class C shares at the annual rate of 0.25% and 0.85%, respectively.
35
Morgan Stanley High Yield Securities Inc.
Notes to Financial Statements n August 31, 2008 continued
The Distributor has informed the Fund that for the year ended August 31, 2008, it received contingent deferred sales charges from certain redemptions of the Fund's Class A shares, Class B shares and Class C shares of $148, $120,229 and $1,130, respectively and received $13,762 in front-end sales charges from sales of the Fund's Class A shares. The respective shareholders pay such charges which are not an expense of the Fund.
4. Security Transactions and Transactions with Affiliates
The Fund invests in Morgan Stanley Institutional Liquidity Money Market Portfolio — Institutional Class, an open-end management investment company managed by an affiliate of the Investment Adviser. Investment advisory fees paid by the Fund are reduced by an amount equal to the advisory and administrative service fees paid by Morgan Stanley Institutional Liquidity Money Market Portfolio — Institutional Class with respect to assets invested by the Fund in Morgan Stanley Institutional Liquidity Money Market Portfolio — Institutional Class. For the year ended August 31, 2008, advisory fees paid were reduced by $4,129 relating to the Fund's investment in Morgan Stanley Institutional Liquidity Money Market Portfolio — Institutional Class. Income distributions earned by the Fund are recorded as dividends from affiliate in the Statement of Operations and totaled $154,216 for the year ended August 31, 2008. During the year ended August 31, 2008, cost of purchases and sales of investments in Morgan Stanley Institutional Liquidity Money Market Portfolio — Institutional Class aggregated $77,632,995 and $81,455,054, respectively.
The cost of purchases and proceeds from sales of portfolio securities, excluding short-term investments, for the year ended August 31, 2008, aggregated $49,151,801 and $81,497,877, respectively.
Morgan Stanley Trust, an affiliate of the Investment Adviser, Administrator and Distributor, is the Fund's transfer agent.
The Fund has an unfunded noncontributory defined benefit pension plan covering certain independent Directors of the Fund who will have served as independent Directors for at least five years at the time of retirement. Benefits under this plan are based on factors which include years of service and compensation. The Directors voted to close the plan to new participants and eliminate the future benefits growth due to increases to compensation after July 31, 2003. Aggregate pension costs for the year ended August 31, 2008, included in Directors' fees and expenses in the Statement of Operations amounted to $15,065. At August 31, 2008, the Fund had an accrued pension liability of $120,004 which is included in accrued expenses in the Statement of Assets and Liabilities.
The Fund has an unfunded Deferred Compensation Plan (the "Compensation Plan"), which allows each independent Director to defer payment of all, or a portion, of the fees he or she receives for serving on the Board of Directors. Each eligible Director generally may elect to have the deferred amounts
36
Morgan Stanley High Yield Securities Inc.
Notes to Financial Statements n August 31, 2008 continued
credited with a return equal to the total return on one or more of the Morgan Stanley funds that are offered as investment options under the Compensation Plan. Appreciation/depreciation and distributions received from these investments are recorded with an offsetting increase/decrease in the deferred compensation obligation and do not affect the net asset value of the Fund.
5. Purposes of and Risks Relating to Certain Financial Instruments
The Fund may purchase into forward contracts for many purposes, including to facilitate settlement of foreign currency denominated portfolio transactions or to manage foreign currency exposure associated with foreign currency denominated securities.
To hedge against adverse interest rates, the Fund may purchase and sell interest rate futures contracts ("futures contracts").
Forward and futures contracts involve elements of market risk in excess of the amount reflected in the Statement of Assets and Liabilities. The Fund bears the risk of an unfavorable change in the underlying securities or currencies. Risks may also arise upon entering into these contracts from the potential inability of the counterparties to meet the terms of their contracts.
The Fund may enter into interest rate swaps and may purchase or sell interest rate caps, floors and collars. The Fund expects to enter into these transactions primarily to manage interest rate risk, hedge portfolio positions and preserve a return or spread on a particular investment or portion of its portfolio. The Fund may also enter into these transactions to protect against any increase in the price of securities the Fund anticipates purchasing at a later date. Interest rate swap transactions are subject to market risk, risk of default by the other party to the transaction, risk of imperfect correlation and manager risk. Such risks may exceed the related amounts shown in the Statement of Assets and Liabilities.
The Fund may enter into credit default swaps for hedging purposes to add leverage to its portfolio or to gain exposure to a credit in which the Fund may otherwise invest. Credit default swaps may involve greater risks than if a fund had invested in the issuer directly. Credit default swaps are subject to general market risk, counterparty risk and credit risk. If the Fund is a buyer and no credit event occurs, it will lose its investment. In addition, if the Fund is a seller and a credit event occurs, the value of the referenced obligation received by the Fund coupled with the periodic payments previously received may be less than the maximum payout amount it pays to the buyer, resulting in a loss to the Fund.
The Fund may invest in mortgage securities. These are fixed income securities that derive their value from or represent interests in a pool of mortgages or mortgage securities. An unexpectedly high rate of defaults on the mortgages held by a mortgage pool may adversely affect the value of a mortgage-backed security and could result in losses to the Fund. The risk of such defaults is generally higher in the case of mortgage pools that include sub-prime mortgages. Sub-prime mortgages refer to loans
37
Morgan Stanley High Yield Securities Inc.
Notes to Financial Statements n August 31, 2008 continued
made to borrowers with weakened credit histories or with a lower capacity to make timely payments on their mortgages.
The Fund may lend securities to qualified financial institutions, such as broker-dealers, to earn additional income. Risks in securities lending transactions are that a borrower may not provide additional collateral when required or return the securities when due, and that the value of the short-term investments will be less than the amount of cash collateral plus any rebate that is required to be returned to the borrower.
6. Capital Stock
Transactions in capital stock were as follows:
| | | FOR THE YEAR
ENDED
AUGUST 31, 2008 | | FOR THE YEAR
ENDED
AUGUST 31, 2007 | |
| | | SHARES | | AMOUNT | | SHARES | | AMOUNT | |
| CLASS A SHARES | |
| Sold | | | 3,044,592 | | | $ | 5,197,255 | | | | 1,134,697 | | | $ | 2,039,666 | | |
| Conversion from Class B | | | 2,990,187 | | | | 5,160,101 | | | | 11,398,620 | | | | 20,162,979 | | |
| Reinvestment of dividends | | | 1,868,089 | | | | 3,179,633 | | | | 1,165,217 | | | | 2,057,013 | | |
| Redeemed | | | (11,534,672 | ) | | | (19,793,676 | ) | | | (15,733,114 | ) | | | (27,875,354 | ) | |
| Net decrease — Class A | | | (3,631,804 | ) | | | (6,256,687 | ) | | | (2,034,580 | ) | | | (3,615,696 | ) | |
| CLASS B SHARES | |
| Sold | | | 768,559 | | | | 1,306,926 | | | | 870,602 | | | | 1,533,789 | | |
| Conversion to Class A | | | (3,022,112 | ) | | | (5,160,101 | ) | | | (11,514,182 | ) | | | (20,162,979 | ) | |
| Reinvestment of dividends | | | 1,359,338 | | | | 2,293,557 | | | | 1,283,515 | | | | 2,247,697 | | |
| Redeemed | | | (12,673,541 | ) | | | (21,517,259 | ) | | | (20,890,903 | ) | | | (36,660,847 | ) | |
| Net decrease — Class B | | | (13,567,756 | ) | | | (23,076,877 | ) | | | (30,250,968 | ) | | | (53,042,340 | ) | |
| CLASS C SHARES | |
| Sold | | | 408,295 | | | | 704,150 | | | | 120,275 | | | | 210,679 | | |
| Reinvestment of dividends | | | 361,939 | | | | 612,896 | | | | 279,941 | | | | 491,601 | | |
| Redeemed | | | (2,257,404 | ) | | | (3,836,633 | ) | | | (3,115,232 | ) | | | (5,486,855 | ) | |
| Net decrease — Class C | | | (1,487,170 | ) | | | (2,519,587 | ) | | | (2,715,016 | ) | | | (4,784,575 | ) | |
| CLASS I SHARES@@ | |
| Sold | | | 227,135 | | | | 393,481 | | | | 299,341 | | | | 531,628 | | |
| Reinvestment of dividends | | | 1,633,029 | | | | 2,778,006 | | | | 1,488,251 | | | | 2,623,661 | | |
| Redeemed | | | (6,919,180 | ) | | | (11,883,599 | ) | | | (8,669,315 | ) | | | (15,313,602 | ) | |
| Net decrease — Class I@@ | | | (5,059,016 | ) | | | (8,712,112 | ) | | | (6,881,723 | ) | | | (12,158,313 | ) | |
| Net decrease in Fund | | | (23,745,746 | ) | | $ | (40,565,263 | ) | | | (41,882,287 | ) | | $ | (73,600,924 | ) | |
@@ Formerly Class D shares. Renamed Class I shares effective March 31, 2008.
38
Morgan Stanley High Yield Securities Inc.
Notes to Financial Statements n August 31, 2008 continued
7. Federal Income Tax Status
The amount of dividends and distributions from net investment income and net realized capital gains are determined in accordance with federal income tax regulations which may differ from generally accepted accounting principles. These "book/tax" differences are either considered temporary or permanent in nature. To the extent these differences are permanent in nature, such amounts are reclassified within the capital accounts based on their federal tax-basis treatment; temporary differences do not require reclassification. Dividends and distributions which exceed net investment income and net realized capital gains for tax purposes are reported as distributions of paid-in-capital.
The tax character of distributions paid was as follows:
| | | FOR THE YEAR
ENDED
AUGUST 31, 2008 | | FOR THE YEAR
ENDED
AUGUST 31, 2007 | |
| Ordinary income | | $ | 12,305,934 | | | $ | 15,946,517 | | |
| As of August 31, 2008, the tax-basis components of accumulated losses were as follows: | |
| Undistributed ordinary income | | $ | 2,929,643 | | | | |
| Undistributed long-term gains | | | — | | | | |
| Net accumulated earnings | | | 2,929,643 | | | | |
| Capital loss carryforward* | | | (1,914,345,162 | ) | | | |
| Post-October losses | | | (9,306 | ) | | | |
| Temporary differences | | | (1,368,842 | ) | | | |
| Net unrealized depreciation | | | (330,623,258 | ) | | | |
| Total accumulated losses | | $ | (2,243,416,925 | ) | | | |
*During the year ended August 31, 2008, the Fund utilized $72,054 of its net capital loss carryforward. As of August 31, 2008, the Fund had a net capital loss carryforward of $1,914,345,162, to offset future capital gains to the extent provided by regulations, which will expire according to the following schedule.
| AMOUNT | | EXPIRATION | |
| $ | 89,299,249 | | | August 31, 2009 | |
| | 245,944,739 | | | August 31, 2010 | |
| | 568,502,378 | | | August 31, 2011 | |
| | 758,434,573 | | | August 31, 2012 | |
| | 183,559,922 | | | August 31, 2013 | |
| | 46,805,231 | | | August 31, 2014 | |
| | 21,799,070 | | | August 31, 2015 | |
As of August 31, 2008, the Fund had temporary book/tax differences primarily attributable to post-October losses (foreign currency losses incurred after October 31 within the taxable year which are
39
Morgan Stanley High Yield Securities Inc.
Notes to Financial Statements n August 31, 2008 continued
deemed to arise on the first business day of the Fund's next taxable year), interest on bonds in default and book amortization of discounts on debt securities.
Permanent differences, primarily due to losses on paydowns and foreign currency, gains on swaps, tax adjustments on debt securities sold by the Fund and an expired capital loss carryforward, resulted in the following reclassifications among the Fund's components of net assets at August 31, 2008:
ACCUMULATED
UNDISTRIBUTED
NET INVESTMENT
INCOME | | ACCUMULATED
NET REALIZED
LOSS | |
PAID-IN-CAPITAL | |
| $ | 1,141,063 | | | $ | 68,643,919 | | | $ | (69,784,982 | ) | |
8. Expense Offset
The expense offset represents a reduction of the fees and expenses for interest earned on cash balances maintained by the Fund with the transfer agent.
9. Accounting Pronouncement
In September 2006, Statement of Financial Accounting Standards No. 157, Fair Value Measurements ("SFAS 157"), was issued and is effective for fiscal years beginning after November 15, 2007. SFAS 157 defines fair value, establishes a framework for measuring fair value and expands disclosures about fair value measurements. Management is currently evaluating the impact the adoption of SFAS 157 will have on the Fund's financial statement disclosures.
On March 19, 2008, FASB released Statement of Financial Accounting Standards No. 161, Disclosures about Derivative Instruments and Hedging Activities, an amendment of FASB statements No. 133 ("SFAS 161"). SFAS 161 requires qualitative disclosures about objectives and strategies for using derivatives, quantitative disclosures about fair value amounts of and gains and losses on derivative instruments, and disclosures about credit-risk-related contingent features in derivative agreements. The application of SFAS 161 is required for fiscal years beginning after November 15, 2008 and interim periods within those fiscal years. At this time, management is evaluating the implications of SFAS 161 and its impact on the financial statements has not yet been determined.
On September 12, 2008, Statement of Financial Accounting Standards No. 133-1, Disclosures about Credit Derivatives and Certain Guarantees ("SFAS 133-1") was issued and is effective for fiscal years ending after November 15, 2008. SFAS 133-1 requires a seller of credit derivatives, including credit derivatives embedded in hybrid instruments, to provide certain disclosures for each credit derivative (or group of similar credit derivatives) presented on the Statement of Assets and Liabilities. The impact on the Fund's financial statement disclosures, if any, is currently being assessed.
40
Morgan Stanley High Yield Securities Inc.
Notes to Financial Statements n August 31, 2008 continued
10. Subsequent Event
Subsequent to August 31, 2008, conditions in the worldwide debt and equity markets have deteriorated significantly. These conditions have had a negative effect on the market value of the Fund's investments since August 31, 2008.
41
Morgan Stanley High Yield Securities Inc.
Financial Highlights
Selected ratios and per share data for a share of capital stock outstanding throughout each period:
| | | FOR THE YEAR ENDED AUGUST 31, | |
| | | 2008 | | 2007 | | 2006 | | 2005 | | 2004 | |
| Class A Shares | |
| Selected Per Share Data: | |
| Net asset value, beginning of period | | $ | 1.73 | | | $ | 1.73 | | | $ | 1.79 | | | $ | 1.80 | | | $ | 1.67 | | |
| Income (loss) from investment operations: | |
| Net investment income(1) | | | 0.11 | | | | 0.11 | | | | 0.12 | | | | 0.13 | | | | 0.16 | | |
| Net realized and unrealized gain (loss) | | | (0.09 | ) | | | 0.00 | | | | (0.06 | ) | | | (0.01 | ) | | | 0.09 | | |
| Total income from investment operations | | | 0.02 | | | | 0.11 | | | | 0.06 | | | | 0.12 | | | | 0.25 | | |
| Less dividends from net investment income | | | (0.11 | ) | | | (0.11 | ) | | | (0.12 | ) | | | (0.13 | ) | | | (0.12 | ) | |
| Net asset value, end of period | | $ | 1.64 | | | $ | 1.73 | | | $ | 1.73 | | | $ | 1.79 | | | $ | 1.80 | | |
| Total Return(2) | | | 1.29 | % | | | 6.65 | % | | | 3.84 | % | | | 6.84 | % | | | 15.40 | % | |
| Ratios to Average Net Assets(3): | |
| Total expenses (before expense offset) | | | 1.73 | %(4) | | | 1.59 | %(4) | | | 1.26 | %(5) | | | 1.12 | % | | | 1.03 | % | |
| Net investment income | | | 6.57 | %(4) | | | 6.24 | %(4) | | | 6.79 | %(5) | | | 7.24 | % | | | 8.98 | % | |
| Supplemental Data: | |
| Net assets, end of period, in thousands | | $ | 61,839 | | | $ | 71,664 | | | $ | 75,099 | | | $ | 77,861 | | | $ | 21,595 | | |
| Portfolio turnover rate | | | 27 | % | | | 26 | % | | | 26 | % | | | 43 | % | | | 51 | % | |
(1) The per share amounts were computed using an average number of shares outstanding during the period.
(2) Does not reflect the deduction of sales charge. Calculated based on the net asset value as of the last business day of the period.
(3) Reflects overall Fund ratios for investment income and non-class specific expenses.
(4) Reflects rebate of certain Fund expenses in connection with the investments in Morgan Stanley Institutional Liquidity Money Market Portfolio — Institutional Class during the period. The rebate had an effect of less than 0.005%.
(5) If the Fund had borne all its expenses that were reimbursed or waived by the Investment Adviser and Administrator, the annualized expense and net investment income ratios, before expense offset, would have been as follows:
| PERIOD ENDED | | EXPENSE
RATIO | | NET INVESTMENT
INCOME RATIO | |
| August 31, 2006 | | | 1.30 | % | | | 6.75 | % | |
See Notes to Financial Statements
42
Morgan Stanley High Yield Securities Inc.
Financial Highlights continued
| | | FOR THE YEAR ENDED AUGUST 31, | |
| | | 2008 | | 2007 | | 2006 | | 2005 | | 2004 | |
| Class B Shares | |
| Selected Per Share Data: | |
| Net asset value, beginning of period | | $ | 1.72 | | | $ | 1.72 | | | $ | 1.77 | | | $ | 1.79 | | | $ | 1.67 | | |
| Income (loss) from investment operations: | |
| Net investment income(1) | | | 0.10 | | | | 0.10 | | | | 0.11 | | | | 0.12 | | | | 0.15 | | |
| Net realized and unrealized gain (loss) | | | (0.09 | ) | | | 0.01 | | | | (0.04 | ) | | | (0.02 | ) | | | 0.08 | | |
| Total income from investment operations | | | 0.01 | | | | 0.11 | | | | 0.07 | | | | 0.10 | | | | 0.23 | | |
Less dividends from net investment
income | | | (0.11 | ) | | | (0.11 | ) | | | (0.12 | ) | | | (0.12 | ) | | | (0.11 | ) | |
| Net asset value, end of period | | $ | 1.62 | | | $ | 1.72 | | | $ | 1.72 | | | $ | 1.77 | | | $ | 1.79 | | |
| Total Return(2) | | | 0.21 | % | | | 6.78 | % | | | 3.34 | % | | | 5.68 | % | | | 14.15 | % | |
| Ratios to Average Net Assets(3): | |
| Total expenses (before expense offset) | | | 2.23 | %(4) | | | 2.10 | %(4) | | | 1.77 | %(5) | | | 1.66 | % | | | 1.60 | % | |
| Net investment income | | | 6.07 | %(4) | | | 5.74 | %(4) | | | 6.28 | %(5) | | | 6.70 | % | | | 8.41 | % | |
| Supplemental Data: | |
| Net assets, end of period, in thousands | | $ | 41,721 | | | $ | 67,410 | | | $ | 119,288 | | | $ | 205,739 | | | $ | 360,513 | | |
| Portfolio turnover rate | | | 27 | % | | | 26 | % | | | 26 | % | | | 43 | % | | | 51 | % | |
(1) The per share amounts were computed using an average number of shares outstanding during the period.
(2) Does not reflect the deduction of sales charge. Calculated based on the net asset value as of the last business day of the period.
(3) Reflects overall Fund ratios for investment income and non-class specific expenses.
(4) Reflects rebate of certain Fund expenses in connection with the investments in Morgan Stanley Institutional Liquidity Money Market Portfolio — Institutional Class during the period. The rebate had an effect of less than 0.005%.
(5) If the Fund had borne all its expenses that were reimbursed or waived by the Investment Adviser and Administrator, the annualized expense and net investment income ratios, before expense offset, would have been as follows:
| PERIOD ENDED | | EXPENSE
RATIO | | NET INVESTMENT
INCOME RATIO | |
| August 31, 2006 | | | 1.81 | % | | | 6.24 | % | |
See Notes to Financial Statements
43
Morgan Stanley High Yield Securities Inc.
Financial Highlights continued
| | | FOR THE YEAR ENDED AUGUST 31, | |
| | | 2008 | | 2007 | | 2006 | | 2005 | | 2004 | |
| Class C Shares | |
| Selected Per Share Data: | |
| Net asset value, beginning of period | | $ | 1.72 | | | $ | 1.72 | | | $ | 1.78 | | | $ | 1.80 | | | $ | 1.67 | | |
| Income (loss) from investment operations: | |
| Net investment income(1) | | | 0.10 | | | | 0.10 | | | | 0.11 | | | | 0.12 | | | | 0.15 | | |
| Net realized and unrealized gain (loss) | | | (0.09 | ) | | | 0.00 | | | | (0.06 | ) | | | (0.02 | ) | | | 0.09 | | |
| Total income from investment operations | | | 0.01 | | | | 0.10 | | | | 0.05 | | | | 0.10 | | | | 0.24 | | |
| Less dividends from net investment income | | | (0.10 | ) | | | (0.10 | ) | | | (0.11 | ) | | | (0.12 | ) | | | (0.11 | ) | |
| Net asset value, end of period | | $ | 1.63 | | | $ | 1.72 | | | $ | 1.72 | | | $ | 1.78 | | | $ | 1.80 | | |
| Total Return(2) | | | 0.70 | % | | | 6.04 | % | | | 3.25 | % | | | 5.58 | % | | | 14.65 | % | |
| Ratios to Average Net Assets(3): | |
| Total expenses (before expense offset) | | | 2.33 | %(4) | | | 2.20 | %(4) | | | 1.84 | %(5) | | | 1.74 | % | | | 1.70 | % | |
| Net investment income | | | 5.97 | %(4) | | | 5.64 | %(4) | | | 6.21 | %(5) | | | 6.62 | % | | | 8.31 | % | |
| Supplemental Data: | |
| Net assets, end of period, in thousands | | $ | 11,843 | | | $ | 15,085 | | | $ | 19,753 | | | $ | 27,378 | | | $ | 37,907 | | |
| Portfolio turnover rate | | | 27 | % | | | 26 | % | | | 26 | % | | | 43 | % | | | 51 | % | |
(1) The per share amounts were computed using an average number of shares outstanding during the period.
(2) Does not reflect the deduction of sales charge. Calculated based on the net asset value as of the last business day of the period.
(3) Reflects overall Fund ratios for investment income and non-class specific expenses.
(4) Reflects rebate of certain Fund expenses in connection with the investments in Morgan Stanley Institutional Liquidity Money Market Portfolio — Institutional Class during the period. The rebate had an effect of less than 0.005%.
(5) If the Fund had borne all its expenses that were reimbursed or waived by the Investment Adviser and Administrator, the annualized expense and net investment income ratios, before expense offset, would have been as follows:
| PERIOD ENDED | | EXPENSE
RATIO | | NET INVESTMENT
INCOME RATIO | |
| August 31, 2006 | | | 1.88 | % | | | 6.17 | % | |
See Notes to Financial Statements
44
Morgan Stanley High Yield Securities Inc.
Financial Highlights continued
| | | FOR THE YEAR ENDED AUGUST 31, | |
| | | 2008 | | 2007 | | 2006 | | 2005 | | 2004 | |
| Class I Shares@@ | |
| Selected Per Share Data: | |
| Net asset value, beginning of period | | $ | 1.73 | | | $ | 1.73 | | | $ | 1.79 | | | $ | 1.80 | | | $ | 1.68 | | |
| Income (loss) from investment operations: | |
| Net investment income(1) | | | 0.12 | | | | 0.11 | | | | 0.12 | | | | 0.13 | | | | 0.16 | | |
| Net realized and unrealized gain (loss) | | | (0.10) | | | | 0.01 | | | | (0.05 | ) | | | (0.01 | ) | | | 0.08 | | |
| Total income from investment operations | | | 0.02 | | | | 0.12 | | | | 0.07 | | | | 0.12 | | | | 0.24 | | |
| Less dividends from net investment income | | | (0.12 | ) | | | (0.12 | ) | | | (0.13 | ) | | | (0.13 | ) | | | (0.12 | ) | |
| Net asset value, end of period | | $ | 1.63 | | | $ | 1.73 | | | $ | 1.73 | | | $ | 1.79 | | | $ | 1.80 | | |
| Total Return(2) | | | 0.95 | % | | | 6.92 | % | | | 4.11 | % | | | 7.04 | % | | | 14.93 | % | |
| Ratios to Average Net Assets(3): | |
| Total expenses (before expense offset) | | | 1.48 | %(4) | | | 1.35 | %(4) | | | 1.01 | %(5) | | | 0.91 | % | | | 0.85 | % | |
| Net investment income | | | 6.82 | %(4) | | | 6.48 | %(4) | | | 7.04 | %(5) | | | 7.45 | % | | | 9.16 | % | |
| Supplemental Data: | |
| Net assets, end of period, in thousands | | $ | 48,535 | | | $ | 60,060 | | | $ | 71,911 | | | $ | 124,556 | | | $ | 154,639 | | |
| Portfolio turnover rate | | | 27 | % | | | 26 | % | | | 26 | % | | | 43 | % | | | 51 | % | |
@@ Formerly Class D shares. Renamed Class I shares effective March 31, 2008.
(1) The per share amounts were computed using an average number of shares outstanding during the period.
(2) Calculated based on the net asset value as of the last business day of the period.
(3) Reflects overall Fund ratios for investment income and non-class specific expenses.
(4) Reflects rebate of certain Fund expenses in connection with the investments in Morgan Stanley Institutional Liquidity Money Market Portfolio — Institutional Class during the period. The rebate had an effect of less than 0.005%.
(5) If the Fund had borne all its expenses that were reimbursed or waived by the Investment Adviser and Administrator, the annualized expense and net investment income ratios, before expense offset, would have been as follows:
| PERIOD ENDED | | EXPENSE
RATIO | | NET INVESTMENT
INCOME RATIO | |
| August 31, 2006 | | | 1.05 | % | | | 7.00 | % | |
See Notes to Financial Statements
45
Morgan Stanley High Yield Securities Inc.
Report of Independent Registered Public Accounting Firm
To the Shareholders and Board of Directors of
Morgan Stanley High Yield Securities Inc.:
We have audited the accompanying statement of assets and liabilities of Morgan Stanley High Yield Securities Inc. (the "Fund"), including the portfolio of investments, as of August 31, 2008, and the related statements of operations for the year then ended and changes in net assets for each of the two years in the period then ended, and the financial highlights for each of the five years in the period then ended. These financial statements and financial highlights are the responsibility of the Fund's management. Our responsibility is to express an opinion on these financial statements and financial highlights based on our audits.
We conducted our audits in accordance with the standards of the Public Company Accounting Oversight Board (United States). Those standards require that we plan and perform the audit to obtain reasonable assurance about whether the financial statements and financial highlights are free of material misstatement. The Fund is not required to have, nor were we engaged to perform, an audit of its internal control over financial reporting. Our audits included consideration of internal control over financial reporting as a basis for designing audit procedures that are appropriate in the circumstances, but not for the purpose of expressing an opinion on the effectiveness of the Fund's internal control over financial reporting. Accordingly, we express no such opinion. An audit also includes examining, on a test basis, evidence supporting the amounts and disclosures in the financial statements, assessing the accounting principles used and significant estimates made by management, as well as evaluating the overall financial statement presentation. Our procedures included confirmation of securities owned as of August 31, 2008, by correspondence with the custodian and brokers; where replies were not received from brokers, we performed other auditing procedures. We believe that our audits provide a reasonable basis for our opinion.
In our opinion, the financial statements and financial highlights referred to above present fairly, in all material respects, the financial position of Morgan Stanley High Yield Securities Inc. as of August 31, 2008, the results of its operations for the year then ended, the changes in its net assets for each of the two years in the period then ended, and the financial highlights for each of the five years in the period then ended, in conformity with accounting principles generally accepted in the United States of America.
Deloitte & Touche LLP
New York, New York
October 29, 2008
46
Morgan Stanley High Yield Securities Inc.
An Important Notice Concerning Our U.S. Privacy Policy (unaudited)
We are required by federal law to provide you with a copy of our Privacy Policy annually.
The following Policy applies to current and former individual investors in Morgan Stanley Advisor funds. This Policy is not applicable to partnerships, corporations, trusts or other non-individual clients or account holders. Please note that we may amend this Policy at any time, and will inform you of any changes to this Policy as required by law.
We Respect Your Privacy
We appreciate that you have provided us with your personal financial information. We strive to maintain the privacy of such information while we help you achieve your financial objectives. This Policy describes what non-public personal information we collect about you, why we collect it, and when we may share it with others. We hope this Policy will help you understand how we collect and share non-public personal information that we gather about you. Throughout this Policy, we refer to the non-public information that personally identifies you or your accounts as "personal information."
1. What Personal Information Do We Collect About You?
To serve you better and manage our business, it is important that we collect and maintain accurate information about you. We may obtain this information from applications and other forms you submit to us, from your dealings with us, from consumer reporting agencies, from our Web sites and from third parties and other sources.
For example:
n We may collect information such as your name, address, e-mail address, telephone/fax numbers, assets, income and investment objectives through applications and other forms you submit to us.
n We may obtain information about account balances, your use of account(s) and the types of products and services you prefer to receive from us through your dealings and transactions with us and other sources.
n We may obtain information about your creditworthiness and credit history from consumer reporting agencies.
n We may collect background information from and through third-party vendors to verify representations you have made and to comply with various regulatory requirements.
n If you interact with us through our public and private Web sites, we may collect information that you provide directly through online communications (such as an e-mail address). We may also collect information about your Internet service provider, your domain name, your computer's operating system and Web browser, your use of our Web sites and your product and service
47
Morgan Stanley High Yield Securities Inc.
An Important Notice Concerning Our U.S. Privacy Policy (unaudited) continued
preferences, through the use of "cookies." "Cookies" recognize your computer each time your return to one of our sites, and help to improve our sites' content and personalize your experience on our sites by, for example, suggesting offerings that may interest you. Please consult the Terms of Use of these sites for more details on our use of cookies.
2. When Do We Disclose Personal Information We Collect About You?
To provide you with the products and services you request, to serve you better and to manage our business, we may disclose personal information we collect about you to our affiliated companies and to non-affiliated third parties as required or permitted by law.
A. Information We Disclose to Our Affiliated Companies. We do not disclose personal information that we collect about you to our affiliated companies except to enable them to provide services on our behalf or as otherwise required or permitted by law.
B. Information We Disclose to Third Parties. We do not disclose personal information that we collect about you to non-affiliated third parties except to enable them to provide services on our behalf, to perform joint marketing agreements with other financial institutions, or as otherwise required or permitted by law. For example, some instances where we may disclose information about you to nonaffiliated third parties include: for servicing and processing transactions, to offer our own products and services, to protect against fraud, for institutional risk control, to respond to judicial process or to perform services on our behalf. When we share personal information with these companies, they are required to limit their use of personal information to the particular purpose for which it was shared and they are not allowed to share personal informatio n with others except to fulfill that limited purpose.
3. How Do We Protect the Security and Confidentiality of Personal Information We Collect About You?
We maintain physical, electronic and procedural security measures to help safeguard the personal information we collect about you. We have internal policies governing the proper handling of client information. Third parties that provide support or marketing services on our behalf may also receive personal information, and we require them to adhere to confidentiality standards with respect to such information.
48
Morgan Stanley High Yield Securities Inc.
Director and Officer Information (unaudited)
Independent Directors:
Name, Age and Address of
Independent Director | | Position(s)
Held with
Registrant | | Term of
Office and
Length of
Time Served* | | Principal Occupation(s)
During Past 5 Years | | Number of
Portfolios
in Fund
Complex
Overseen by
Independent
Director** | | Other Directorships
Held by Independent Director | |
Frank L. Bowman (63)
c/o Kramer Levin Naftalis & Frankel LLP
Counsel to the Independent Directors
1177 Avenue of the Americas
New York, NY 10036 | | Director | | Since
August 2006 | | President and Chief Executive Officer, Nuclear Energy Institute (policy organization) (since February 2005); Director or Trustee of various Retail Funds and Institutional Funds (since August 2006); Chairperson of the Insurance Sub-Committee of the Insurance, Valuation and Compliance Committee (since February 2007); formerly, variously, Admiral in the U.S. Navy, Director of Naval Nuclear Propulsion Program and Deputy Administrator – Naval Reactors in the National Nuclear Security Administration at the U.S. Department of Energy (1996-2004). Honorary Knight Commander of the Most Excellent Order of the British Empire. | | | 180 | | | Director of the National Energy Foundation, the U.S. Energy Association, the American Council for Capital Formation and the Armed Services YMCA of the USA. | |
|
Michael Bozic (67)
c/o Kramer Levin Naftalis & Frankel LLP
Counsel to the Independent Directors
1177 Avenue of the Americas
New York, NY 10036 | | Director | | Since
April 1994 | | Private investor; Chairperson of the Insurance, Valuation and Compliance Committee (since October 2006); Director or Trustee of the Retail Funds (since April 1994) and Institutional Funds (since July 2003); formerly, Chairperson of the Insurance Committee (July 2006-September 2006); Vice Chairman of Kmart Corporation (December 1998-October 2000), Chairman and Chief Executive Officer of Levitz Furniture Corporation (November 1995-November 1998) and President and Chief Executive Officer of Hills Department Stores (May 1991-July 1995); variously Chairman, Chief Executive Officer, President and Chief Operating Officer (1987-1991) of the Sears Merchandise Group of Sears, Roebuck & Co. | | | 182 | | | Director of various business
organizations. | |
|
49
Morgan Stanley High Yield Securities Inc.
Director and Officer Information (unaudited) continued
Name, Age and Address of
Independent Director | | Position(s)
Held with
Registrant | | Term of
Office and
Length of
Time Served* | | Principal Occupation(s)
During Past 5 Years | | Number of
Portfolios
in Fund
Complex
Overseen by
Independent
Director** | | Other Directorships
Held by Independent Director | |
Kathleen A. Dennis (55)
c/o Kramer Levin Naftalis & Frankel LLP
Counsel to the Independent Directors
1177 Avenue of the Americas
New York, NY 10036 | | Director | | Since
August 2006 | | President, Cedarwood Associates (mutual fund and investment management) (since July 2006); Chairperson of the Money Market and Alternatives Sub-Committee of the Investment Committee (since October 2006) and Director or Trustee of various Retail Funds and Institutional Funds (since August 2006); formerly, Senior Managing Director of Victory Capital Management (1993-2006). | | | 180 | | | Director of various non-profit organizations. | |
|
Dr. Manuel H. Johnson (59)
c/o Johnson Smick Group, Inc.
888 16th Street, N.W.
Suite 740
Washington, D.C. 20006 | | Director | | Since
July 1991 | | Senior Partner, Johnson Smick International, Inc. (consulting firm); Chairperson of the Investment Committee (since October 2006) and Director or Trustee of the Retail Funds (since July 1991) and Institutional Funds (since July 2003); Co-Chairman and a founder of the Group of Seven Council (G7C) (international economic commission); formerly, Chairperson of the Audit Committee (July 1991-September 2006); Vice Chairman of the Board of Governors of the Federal Reserve System and Assistant Secretary of the U.S. Treasury. | | | 182 | | | Director of NVR, Inc. (home construction); Director of Evergreen Energy. | |
|
Joseph J. Kearns (66)
c/o Kearns & Associates LLC
PMB754
23852 Pacific Coast Highway
Malibu, CA 90265 | | Director | | Since
August 1994 | | President, Kearns & Associates LLC (investment consulting); Chairperson of the Audit Committee (since October 2006) and Director or Trustee of the Retail Funds (since July 2003) and the Institutional Funds (since August 1994); formerly, Deputy Chairperson of the Audit Committee (July 2003-September 2006) and Chairperson of the Audit Committee of the Institutional Funds (October 2001-July 2003); CFO of the J. Paul Getty Trust. | | | 183 | | | Director of Electro Rent Corporation (equipment leasing) and The Ford Family Foundation. | |
|
50
Morgan Stanley High Yield Securities Inc.
Director and Officer Information (unaudited) continued
Name, Age and Address of
Independent Director | | Position(s)
Held with
Registrant | | Term of
Office and
Length of
Time Served* | | Principal Occupation(s)
During Past 5 Years | | Number of
Portfolios
in Fund
Complex
Overseen by
Independent
Director** | | Other Directorships
Held by Independent Director | |
Michael F. Klein (49)
c/o Kramer Levin Naftalis & Frankel LLP
Counsel to the Independent Directors
1177 Avenue of the Americas
New York, NY 10036 | | Director | | Since
August 2006 | | Managing Director, Aetos Capital, LLC (since March 2000) and Co-President, Aetos Alternatives Management, LLC (since January 2004); Chairperson of the Fixed-Income Sub-Committee of the Investment Committee (since October 2006) and Director or Trustee of various Retail Funds and Institutional Funds (since August 2006); formerly, Managing Director, Morgan Stanley & Co. Inc. and Morgan Stanley Dean Witter Investment Management, President, Morgan Stanley Institutional Funds (June 1998-March 2000) and Principal, Morgan Stanley & Co. Inc. and Morgan Stanley Dean Witter Investment Management (August 1997-December 1999). | | | 180 | | | Director of certain investment funds managed or sponsored by Aetos Capital, LLC. Director of Sanitized AG and Sanitized Marketing AG (specialty chemicals). | |
|
Michael E. Nugent (72)
c/o Triumph Capital, L.P.
445 Park Avenue
New York, NY 10022 | | Chairperson of the Board and Director | | Chairperson of the Boards since July 2006 and Director since July 1991 | | General Partner, Triumph Capital, L.P. (private investment partnership); Chairperson of the Boards of the Retail Funds and Institutional Funds (since July 2006); Director or Trustee of the Retail Funds (since July 1991) and Institutional Funds (since July 2001); formerly, Chairperson of the Insurance Committee (until July 2006). | | | 182 | | | None. | |
|
51
Morgan Stanley High Yield Securities Inc.
Director and Officer Information (unaudited) continued
Name, Age and Address of
Independent Director | | Position(s)
Held with
Registrant | | Term of
Office and
Length of
Time Served* | | Principal Occupation(s)
During Past 5 Years | | Number of
Portfolios
in Fund
Complex
Overseen by
Independent
Director** | | Other Directorships
Held by Independent Director | |
W. Allen Reed (61)
c/o Kramer Levin Naftalis & Frankel LLP
Counsel to the Independent Directors
1177 Avenue of the Americas
New York, NY 10036 | | Director | | Since
August 2006 | | Chairperson of the Equity Sub-Committee of the Investment Committee (since October 2006) and Director or Trustee of various Retail Funds and Institutional Funds (since August 2006); formerly, President and CEO of General Motors Asset Management; Chairman and Chief Executive Officer of the GM Trust Bank and Corporate Vice President of General Motors Corporation (August 1994-December 2005). | | | 180 | | | Director of Temple-Inland Industries (packaging and forest products); Director of Legg Mason, Inc. and Director of the Auburn University Foundation. | |
|
Fergus Reid (76)
c/o Lumelite Plastics Corporation
85 Charles Colman Blvd.
Pawling, NY 12564 | | Director | | Since
June 1992 | | Chairman of Lumelite Plastics Corporation; Chairperson of the Governance Committee and Director or Trustee of the Retail Funds (since July 2003) and Institutional Funds (since June 1992). | | | 183 | | | Trustee and Director of certain investment companies in the JPMorgan Funds complex managed by J.P. Morgan Investment Management Inc. | |
|
52
Morgan Stanley High Yield Securities Inc.
Director and Officer Information (unaudited) continued
Interested Director:
Name, Age and Address of
Interested Trustee | | Position(s)
Held with
Registrant | | Term of
Office and
Length of
Time Served* | | Principal Occupation(s)
During Past 5 Years | | Number of
Portfolios
in Fund
Complex
Overseen by
Interested
Director** | | Other Directorships Held by
Interested Director | |
James F. Higgins (60)
c/o Morgan Stanley Trust
Harborside Financial Center
Plaza Two
Jersey City, NJ 07311 | | Director | | Since
June 2000 | | Director or Trustee of the Retail Funds (since June 2000) and Institutional Funds (since July 2003); Senior
Advisor of Morgan Stanley (since August 2000). | | | 181 | | | Director of AXA Financial, Inc. and The Equitable Life Assurance Society of the United States (financial services). | |
|
* This is the earliest date the Trustee began serving the funds advised by Morgan Stanley Investment Advisors Inc. (the "Investment Adviser") (the "Retail Funds") or the funds advised by Morgan Stanley Investment Management Inc. and Morgan Stanley AIP GP LP (the "Institutional Funds").
** The Fund Complex includes all open-end and closed-end funds (including all of their portfolios) advised by the Investment Adviser and any funds that have an investment adviser that is an affiliated person of the Investment Adviser (including, but not limited to, Morgan Stanley Investment Management Inc.).
53
Morgan Stanley High Yield Securities Inc.
Director and Officer Information (unaudited) continued
Executive Officers:
Name, Age and Address of
Executive Officer | | Position(s)
Held with
Registrant | | Term of
Office and
Length of
Time Served* | | Principal Occupation(s) During Past 5 Years | |
Randy Takian (34)
522 Fifth Avenue
New York, NY 10036 | | President and Principal Executive Officer | | President and Principal Executive Officer (since September 2008) | | President and Principal Executive Officer (since September 2008) of funds in the Fund Complex; President and Chief Executive Officer of Morgan Stanley Services Company Inc. (since September 2008). President of the Investment Adviser (since July 2008). Head of the Retail and Intermediary business within Morgan Stanley Investment Management (since July 2008). Head of Liquidity and Bank Trust business (since July 2008) and the Latin American franchise (since July 2008) at Morgan Stanley Investment Management. Managing Director, Director and/or Officer of the Investment Adviser and various entities affiliated with the Investment Adviser. Formerly Head of Strategy and Product Development for the Alternatives Group and Senior Loan Investment Management. Formerly with Bank of America (July 1996-March 2006), most recently as Head of the Strategy, Mergers and Acquisitions team for Global Wealth and Investment Management. | |
|
Kevin Klingert (46)
522 Fifth Avenue
New York, NY 10036 | | Vice President | | Since June 2008 | | Chief Operating Officer of the Global Fixed Income Group of Morgan Stanley Investment Management Inc. and the Investment Adviser (since March 2008). Head of Global Liquidity Portfolio Management and co-Head of Liquidity Credit Research of Morgan Stanley Investment Management (since December 2007). Managing Director of Morgan Stanley Investment Management Inc. and the Investment Adviser (since December 2007). Previously, Managing Director on the Management Committee and head of Municipal Portfolio Management and Liquidity at BlackRock (October 1991 to January 2007). | |
|
Dennis F. Shea (55)
522 Fifth Avenue
New York, NY 10036 | | Vice President | | Since February 2006 | | Managing Director and (since February 2006) Chief Investment Officer – Global Equity of Morgan Stanley Investment Management; Vice President of the Retail Funds and Institutional Funds (since February 2006). Formerly, Managing Director and Director of Global Equity Research at Morgan Stanley. | |
|
Amy R. Doberman (46)
522 Fifth Avenue
New York, NY 10036 | | Vice President | | Since July 2004 | | Managing Director and General Counsel, U.S. Investment Management of Morgan Stanley Investment Management (since July 2004); Vice President of the Retail Funds and Institutional Funds (since July 2004); Vice President of the Van Kampen Funds (since August 2004); Secretary (since February 2006) and Managing Director (since July 2004) of the Investment Adviser and various entities affiliated with the Investment Adviser. Formerly, Managing Director and General Counsel – Americas, UBS Global Asset Management (July 2000-July 2004). | |
|
Carsten Otto (44)
522 Fifth Avenue
New York, NY 10036 | | Chief Compliance Officer | | Since October 2004 | | Managing Director and Global Head of Compliance for Morgan Stanley Investment Management (since April 2007); and Chief Compliance Officer of the Retail Funds and Institutional Funds (since October 2004). Formerly, U.S. Director of Compliance (October 2004-April 2007) and Assistant Secretary and Assistant General Counsel of the Retail Funds. | |
|
Stefanie V. Chang Yu (41)
522 Fifth Avenue
New York, NY 10036 | | Vice President | | Since December 1997 | | Managing Director of the Investment Adviser and various entities affiliated with the Investment Adviser; Vice President of the Retail Funds (since July 2002) and Institutional Funds (since December 1997). Formerly, Secretary of various entities affiliated with the Investment Adviser. | |
|
54
Morgan Stanley High Yield Securities Inc.
Director and Officer Information (unaudited) continued
Name, Age and Address of
Executive Officer | | Position(s)
Held with
Registrant | | Term of
Office and
Length of
Time Served* | | Principal Occupation(s) During Past 5 Years | |
Francis J. Smith (43)
c/o Morgan Stanley Trust Harborside Financial Center Plaza Two
Jersey City, NJ 07311 | | Treasurer and Chief Financial Officer | | Treasurer since July 2003 and Chief Financial Officer since September 2002 | | Executive Director of the Investment Adviser and various entities affiliated with the Investment Adviser; Treasurer and Chief Financial Officer of the Retail Funds (since July 2003). Formerly, Vice President of the Retail Funds (September 2002-July 2003). | |
|
Mary E. Mullin (41)
522 Fifth Avenue
New York, NY 10036 | | Secretary | | Since June 1999 | | Executive Director of the Investment Adviser and various entities affiliated with the Investment Adviser; Secretary of the Retail Funds (since July 2003) and the Institutional Funds (since June 1999). | |
|
* This is the earliest date the Officer began serving the Retail Funds or Institutional Funds.
55
Directors
Frank L. Bowman
Michael Bozic
Kathleen A. Dennis
James F. Higgins
Dr. Manuel H. Johnson
Joseph J. Kearns
Michael F. Klein
Michael E. Nugent
W. Allen Reed
Fergus Reid
Officers
Michael E. Nugent
Chairperson of the Board
Randy Takian
President and Principal Executive Officer
Kevin Klingert
Vice President
Dennis F. Shea
Vice President
Amy R. Doberman
Vice President
Carsten Otto
Chief Compliance Officer
Stefanie V. Chang Yu
Vice President
Francis J. Smith
Treasurer and Chief Financial Officer
Mary E. Mullin
Secretary
Transfer Agent
Morgan Stanley Trust
Harborside Financial Center, Plaza Two
Jersey City, New Jersey 07311
Independent Registered Public Accounting Firm
Deloitte & Touche LLP
Two World Financial Center
New York, New York 10281
Legal Counsel
Clifford Chance US LLP
31 West 52nd Street
New York, New York 10019
Counsel to the Independent Directors
Kramer Levin Naftalis & Frankel LLP
1177 Avenue of the Americas
New York, New York 10036
Investment Adviser
Morgan Stanley Investment Advisors Inc.
522 Fifth Avenue
New York, New York 10036
This report is submitted for the general information of the shareholders of the Fund. For more detailed information about the Fund, its fees and expenses and other pertinent information, please read its Prospectus. The Fund's Statement of Additional Information contains additional information about the Fund, including its directors. It is available, without charge, by calling (800) 869-NEWS.
This report is not authorized for distribution to prospective investors in the Fund unless preceded or accompanied by an effective Prospectus. Read the Prospectus carefully before investing.
Morgan Stanley Distributors Inc., member FINRA.
© 2008 Morgan Stanley

HYLANN
IU08-05322P-Y08/08

INVESTMENT MANAGEMENT
Morgan Stanley
High Yield Securities Inc.

Annual Report
August 31, 2008
Item 2. Code of Ethics.
(a) The Fund has adopted a code of ethics (the “Code of Ethics”) that applies to its principal executive officer, principal financial officer, principal accounting officer or controller, or persons performing similar functions, regardless of whether these individuals are employed by the Fund or a third party.
(b) No information need be disclosed pursuant to this paragraph.
(c) Not applicable.
(d) Not applicable.
(e) Not applicable.
(f)
(1) The Fund’s Code of Ethics is attached hereto as Exhibit 12 A.
(2) Not applicable.
(3) Not applicable.
Item 3. Audit Committee Financial Expert.
The Fund’s Board of Trustees has determined that Joseph J. Kearns, an “independent” Trustee, is an “audit committee financial expert” serving on its audit committee. Under applicable securities laws, a person who is determined to be an audit committee financial expert will not be deemed an “expert” for any purpose, including without limitation for the purposes of Section 11 of the Securities Act of 1933, as a result of being designated or identified as an audit committee financial expert. The designation or identification of a person as an audit committee financial expert does not impose on such person any duties, obligations, or liabilities that are greater than the duties, obligations, and liabilities imposed on such person as a member of the audit committee and Board of Trustees in the absence of such designation or identification
Item 4. Principal Accountant Fees and Services.
(a)(b)(c)(d) and (g). Based on fees billed for the periods shown:
2008
| | Registrant | | Covered Entities(1) | |
Audit Fees | | $ | 53,800 | | N/A | |
| | | | | |
Non-Audit Fees | | | | | |
Audit-Related Fees | | $ | 5,788 | (2) | $ | 4,555,000 | (2) |
Tax Fees | | $ | 5,931 | (3) | $ | 747,000 | (4) |
All Other Fees | | $ | | | $ | | (5) |
Total Non-Audit Fees | | $ | 11,719 | | $ | 5,302,000 | |
| | | | | |
Total | | $ | 65,519 | | $ | 5,302,000 | |
2007
| | Registrant | | Covered Entities(1) | |
Audit Fees | | $ | 49,100 | | N/A | |
| | | | | |
Non-Audit Fees | | | | | |
Audit-Related Fees | | $ | — | (2) | $ | 5,041,000 | (2) |
Tax Fees | | $ | 6,055 | (3) | $ | 761,000 | (4) |
All Other Fees | | $ | — | | $ | | (5) |
Total Non-Audit Fees | | $ | 6,055 | | $ | 5,802,000 | |
| | | | | |
Total | | $ | 55,155 | | $ | 5,802,000 | |
N/A- Not applicable, as not required by Item 4.
(1) | Covered Entities include the Adviser (excluding sub-advisors) and any entity controlling, controlled by or under common control with the Adviser that provides ongoing services to the Registrant. |
(2) | Audit-Related Fees represent assurance and related services provided that are reasonably related to the performance of the audit of the financial statements of the Covered Entities’ and funds advised by the Adviser or its affiliates, specifically data verification and agreed-upon procedures related to asset securitizations and agreed-upon procedures engagements. |
(3) | Tax Fees represent tax compliance, tax planning and tax advice services provided in connection with the preparation and review of the Registrant’s tax returns. |
(4) | Tax Fees represent tax compliance, tax planning and tax advice services provided in connection with the review of Covered Entities’ tax returns. |
(5) | All other fees represent project management for future business applications and improving business and operational processes. |
(e)(1) The audit committee’s pre-approval policies and procedures are as follows:
APPENDIX A
AUDIT COMMITTEE
AUDIT AND NON-AUDIT SERVICES
PRE-APPROVAL POLICY AND PROCEDURES
OF THE
MORGAN STANLEY RETAIL AND INSTITUTIONAL FUNDS
AS ADOPTED AND AMENDED JULY 23, 2004,(1)
1. Statement of Principles
The Audit Committee of the Board is required to review and, in its sole discretion, pre-approve all Covered Services to be provided by the Independent Auditors to the Fund and Covered Entities in order to assure that services performed by the Independent Auditors do not impair the auditor’s independence from the Fund.
The SEC has issued rules specifying the types of services that an independent auditor may not provide to its audit client, as well as the audit committee’s administration of the engagement of the independent auditor. The SEC’s rules establish two different approaches to pre-approving services, which the SEC considers to be equally valid. Proposed services either: may be pre-approved without consideration of specific case-by-case services by the Audit Committee (“general pre-approval”); or require the specific pre-approval of the Audit Committee or its delegate (“specific pre-approval”). The Audit Committee believes that the combination of these two approaches in this Policy will result in an effective and efficient procedure to pre-approve services performed by the Independent Auditors. As set forth in this Policy, unless a type of service has received general pre-approval, it will require specific pre-approval by the Audit Committee (or by any member of the Audit Committee to which pre-approval authority has been delegated) if it is to be provided by the Independent Auditors. Any proposed services exceeding pre-approved cost levels or budgeted amounts will also require specific pre-approval by the Audit Committee.
The appendices to this Policy describe the Audit, Audit-related, Tax and All Other services that have the general pre-approval of the Audit Committee. The term of any general pre-approval is 12 months from the date of pre-approval, unless the Audit Committee considers and provides a different period and states otherwise. The Audit Committee will annually review and pre-approve the services that may be provided by the Independent Auditors without obtaining specific pre-approval from the Audit Committee. The Audit Committee will add to or subtract from the list of general pre-approved services from time to time, based on subsequent determinations.
(1) This Audit Committee Audit and Non-Audit Services Pre-Approval Policy and Procedures (the “Policy”), adopted as of the date above, supersedes and replaces all prior versions that may have been adopted from time to time.
The purpose of this Policy is to set forth the policy and procedures by which the Audit Committee intends to fulfill its responsibilities. It does not delegate the Audit Committee’s responsibilities to pre-approve services performed by the Independent Auditors to management.
The Fund’s Independent Auditors have reviewed this Policy and believes that implementation of the Policy will not adversely affect the Independent Auditors’ independence.
2. Delegation
As provided in the Act and the SEC’s rules, the Audit Committee may delegate either type of pre-approval authority to one or more of its members. The member to whom such authority is delegated must report, for informational purposes only, any pre-approval decisions to the Audit Committee at its next scheduled meeting.
3. Audit Services
The annual Audit services engagement terms and fees are subject to the specific pre-approval of the Audit Committee. Audit services include the annual financial statement audit and other procedures required to be performed by the Independent Auditors to be able to form an opinion on the Fund’s financial statements. These other procedures include information systems and procedural reviews and testing performed in order to understand and place reliance on the systems of internal control, and consultations relating to the audit. The Audit Committee will approve, if necessary, any changes in terms, conditions and fees resulting from changes in audit scope, Fund structure or other items.
In addition to the annual Audit services engagement approved by the Audit Committee, the Audit Committee may grant general pre-approval to other Audit services, which are those services that only the Independent Auditors reasonably can provide. Other Audit services may include statutory audits and services associated with SEC registration statements (on Forms N-1A, N-2, N-3, N-4, etc.), periodic reports and other documents filed with the SEC or other documents issued in connection with securities offerings.
The Audit Committee has pre-approved the Audit services in Appendix B.1. All other Audit services not listed in Appendix B.1 must be specifically pre-approved by the Audit Committee (or by any member of the Audit Committee to which pre-approval has been delegated).
4. Audit-related Services
Audit-related services are assurance and related services that are reasonably related to the performance of the audit or review of the Fund’s financial statements and, to the extent they are Covered Services, the Covered Entities or that are traditionally performed by the Independent Auditors. Because the Audit Committee believes that the provision of Audit-related services does not impair the independence of the auditor and is consistent with the SEC’s rules on auditor independence, the Audit Committee may grant general pre-approval to Audit-related services. Audit-related services include, among others, accounting consultations related to accounting, financial reporting or disclosure matters
not classified as “Audit services”; assistance with understanding and implementing new accounting and financial reporting guidance from rulemaking authorities; agreed-upon or expanded audit procedures related to accounting and/or billing records required to respond to or comply with financial, accounting or regulatory reporting matters; and assistance with internal control reporting requirements under Forms N-SAR and/or N-CSR.
The Audit Committee has pre-approved the Audit-related services in Appendix B.2. All other Audit-related services not listed in Appendix B.2 must be specifically pre-approved by the Audit Committee (or by any member of the Audit Committee to which pre-approval has been delegated).
5. Tax Services
The Audit Committee believes that the Independent Auditors can provide Tax services to the Fund and, to the extent they are Covered Services, the Covered Entities, such as tax compliance, tax planning and tax advice without impairing the auditor’s independence, and the SEC has stated that the Independent Auditors may provide such services.
Pursuant to the preceding paragraph, the Audit Committee has pre-approved the Tax Services in Appendix B.3. All Tax services in Appendix B.3 must be specifically pre-approved by the Audit Committee (or by any member of the Audit Committee to which pre-approval has been delegated).
6. All Other Services
The Audit Committee believes, based on the SEC’s rules prohibiting the Independent Auditors from providing specific non-audit services, that other types of non-audit services are permitted. Accordingly, the Audit Committee believes it may grant general pre-approval to those permissible non-audit services classified as All Other services that it believes are routine and recurring services, would not impair the independence of the auditor and are consistent with the SEC’s rules on auditor independence.
The Audit Committee has pre-approved the All Other services in Appendix B.4. Permissible All Other services not listed in Appendix B.4 must be specifically pre-approved by the Audit Committee (or by any member of the Audit Committee to which pre-approval has been delegated).
7. Pre-Approval Fee Levels or Budgeted Amounts
Pre-approval fee levels or budgeted amounts for all services to be provided by the Independent Auditors will be established annually by the Audit Committee. Any proposed services exceeding these levels or amounts will require specific pre-approval by the Audit Committee. The Audit Committee is mindful of the overall relationship of fees for audit and non-audit services in determining whether to pre-approve any such services.
8. Procedures
All requests or applications for services to be provided by the Independent Auditors that do not require specific approval by the Audit Committee will be submitted to the Fund’s Chief Financial Officer and must include a detailed description of the services to be
rendered. The Fund’s Chief Financial Officer will determine whether such services are included within the list of services that have received the general pre-approval of the Audit Committee. The Audit Committee will be informed on a timely basis of any such services rendered by the Independent Auditors. Requests or applications to provide services that require specific approval by the Audit Committee will be submitted to the Audit Committee by both the Independent Auditors and the Fund’s Chief Financial Officer, and must include a joint statement as to whether, in their view, the request or application is consistent with the SEC’s rules on auditor independence.
The Audit Committee has designated the Fund’s Chief Financial Officer to monitor the performance of all services provided by the Independent Auditors and to determine whether such services are in compliance with this Policy. The Fund’s Chief Financial Officer will report to the Audit Committee on a periodic basis on the results of its monitoring. Both the Fund’s Chief Financial Officer and management will immediately report to the chairman of the Audit Committee any breach of this Policy that comes to the attention of the Fund’s Chief Financial Officer or any member of management.
9. Additional Requirements
The Audit Committee has determined to take additional measures on an annual basis to meet its responsibility to oversee the work of the Independent Auditors and to assure the auditor’s independence from the Fund, such as reviewing a formal written statement from the Independent Auditors delineating all relationships between the Independent Auditors and the Fund, consistent with Independence Standards Board No. 1, and discussing with the Independent Auditors its methods and procedures for ensuring independence.
10. Covered Entities
Covered Entities include the Fund’s investment adviser(s) and any entity controlling, controlled by or under common control with the Fund’s investment adviser(s) that provides ongoing services to the Fund(s). Beginning with non-audit service contracts entered into on or after May 6, 2003, the Fund’s audit committee must pre-approve non-audit services provided not only to the Fund but also to the Covered Entities if the engagements relate directly to the operations and financial reporting of the Fund. This list of Covered Entities would include:
Morgan Stanley Retail Funds
Morgan Stanley Investment Advisors Inc.
Morgan Stanley & Co. Incorporated
Morgan Stanley DW Inc.
Morgan Stanley Investment Management Inc.
Morgan Stanley Investment Management Limited
Morgan Stanley Investment Management Private Limited
Morgan Stanley Asset & Investment Trust Management Co., Limited
Morgan Stanley Investment Management Company
Van Kampen Asset Management
Morgan Stanley Services Company, Inc.
Morgan Stanley Distributors Inc.
Morgan Stanley Trust FSB
Morgan Stanley Institutional Funds
Morgan Stanley Investment Management Inc.
Morgan Stanley Investment Advisors Inc.
Morgan Stanley Investment Management Limited
Morgan Stanley Investment Management Private Limited
Morgan Stanley Asset & Investment Trust Management Co., Limited
Morgan Stanley Investment Management Company
Morgan Stanley & Co. Incorporated
Morgan Stanley Distribution, Inc.
Morgan Stanley AIP GP LP
Morgan Stanley Alternative Investment Partners LP
(e)(2) Beginning with non-audit service contracts entered into on or after May 6, 2003, the audit committee also is required to pre-approve services to Covered Entities to the extent that the services are determined to have a direct impact on the operations or financial reporting of the Registrant. 100% of such services were pre-approved by the audit committee pursuant to the Audit Committee’s pre-approval policies and procedures (attached hereto).
(f) Not applicable.
(g) See table above.
(h) The audit committee of the Board of Trustees has considered whether the provision of services other than audit services performed by the auditors to the Registrant and Covered Entities is compatible with maintaining the auditors’ independence in performing audit services.
Item 5. Audit Committee of Listed Registrants.
(a) The Fund has a separately-designated standing audit committee established in accordance with Section 3(a)(58)(A) of the Exchange Act whose members are: Joseph Kearns, Michael Nugent and Allen Reed.
(b) Not applicable.
Item 6. Schedule of Investments
(a) Refer to Item 1.
(b) Not applicable.
Item 7. Disclosure of Proxy Voting Policies and Procedures for Closed-End Management Investment Companies.
Applicable only to reports filed by closed-end funds.
Item 8. Portfolio Managers of Closed-End Management Investment Companies
Applicable only to reports filed by closed-end funds.
Item 9. Closed-End Fund Repurchases
Applicable only to reports filed by closed-end funds.
Item 10. Submission of Matters to a Vote of Security Holders
Not applicable.
Item 11. Controls and Procedures
(a) The Fund’s principal executive officer and principal financial officer have concluded that the Fund’s disclosure controls and procedures are sufficient to ensure that information required to be disclosed by the Fund in this Form N-CSR was recorded, processed, summarized and reported within the time periods specified in the Securities and Exchange Commission’s rules and forms, based upon such officers’ evaluation of these controls and procedures as of a date within 90 days of the filing date of the report.
(b) There were no changes in the registrant’s internal control over financial reporting that occurred during the second fiscal quarter of the period covered by this report that has materially affected, or is reasonably likely to materially affect, the registrant’s internal control over financial reporting.
Item 12. Exhibits
(a) The Code of Ethics for Principal Executive and Senior Financial Officers is attached hereto.
(b) A separate certification for each principal executive officer and principal financial officer of the registrant are attached hereto as part of EX-99.CERT.
SIGNATURES
Pursuant to the requirements of the Securities Exchange Act of 1934 and the Investment Company Act of 1940, the registrant has duly caused this report to be signed on its behalf by the undersigned, thereunto duly authorized.
Morgan Stanley High Yield Securities Inc.
/s/ Randy Takian | |
Randy Takian |
Principal Executive Officer |
October 23, 2008 |
Pursuant to the requirements of the Securities Exchange Act of 1934 and the Investment Company Act of 1940, this report has been signed by the following persons on behalf of the registrant and in the capacities and on the dates indicated.
/s/ Randy Takian | |
Randy Takian |
Principal Executive Officer |
October 23, 2008 |
/s/ Francis Smith | |
Francis Smith |
Principal Financial Officer |
October 23, 2008 |