UNITED STATES
SECURITIES AND EXCHANGE COMMISSION
WASHINGTON, DC 20549
FORM20-F
(Mark One)
| ☐ | REGISTRATION STATEMENT PURSUANT TO SECTION 12(b) OR 12(g) OF THE SECURITIES EXCHANGE ACT OF 1934 |
OR
| ☑ | ANNUAL REPORT PURSUANT TO SECTION 13 OR 15(d) OF THE SECURITIES EXCHANGE ACT OF 1934 |
For the fiscal year endedDecember 31, 2016
OR
| ☐ | TRANSITION REPORT PURSUANT TO SECTION 13 OR 15(d) OF THE SECURITIES EXCHANGE ACT OF 1934 |
For the transitionperiod from to
OR
| ☐ | SHELL COMPANY REPORT PURSUANT TO SECTION 13 OR 15(d) OF THE SECURITIES EXCHANGE ACT OF 1934 |
Date of event requiring this shell company report
| Commission file numbers | Barclays PLC | 1-09246 | ||||
| Barclays Bank PLC | 1-10257 | |||||
BARCLAYS PLC
BARCLAYS BANK PLC
(Exact Names of Registrants as Specified in their Charter[s])
ENGLAND
(Jurisdiction of Incorporation or Organization)
1 CHURCHILL PLACE, LONDON E14 5HP, ENGLAND
(Address of Principal Executive Offices)
MARIE SMITH, +44 (0)20 7116 2907, MARIE.SMITH@BARCLAYS.COM
1 CHURCHILL PLACE, LONDON E14 5HP, ENGLAND
*(Name, Telephone,E-mail and/or Facsimile number and Address of Company Contact Person)
Securities registered or to be registered pursuant to Section 12(b) of the Act:
Barclays PLC
| Title of Each Class | Name of Each Exchange On Which Registered | |
| 25p ordinary shares | New York Stock Exchange* | |
| Title of Each Class | Name of Each Exchange On Which Registered | |
American Depositary Shares, each | New York Stock Exchange | |
4.375% Fixed Rate Subordinated Notes due | New York Stock Exchange | |
2.75% Fixed Rate Senior Notes due 2019 | New York Stock Exchange | |
2.00% Fixed Rate Senior Notes due 2018 | New York Stock Exchange | |
3.65% Fixed Rate Senior Notes due 2025 | New York Stock Exchange | |
2.875% Fixed Rate Senior Notes due 2020 | New York Stock Exchange | |
5.25% Fixed Rate Senior Notes due 2045 | New York Stock Exchange | |
3.25% Fixed Rate Senior Notes due 2021 | New York Stock Exchange | |
4.375% Fixed Rate Senior Notes due 2026 | New York Stock Exchange | |
5.20% Fixed Rate Subordinated Notes due 2026 | New York Stock Exchange | |
3.20% Fixed Rate Senior Notes due 2021 | New York Stock Exchange | |
Floating Rate Senior Notes due 2021 | New York Stock Exchange | |
Floating Rate Senior Notes due 2023 | New York Stock Exchange | |
| Title of Each Class | Name of Each Exchange On Which Registered | |
3.684% Fixed Rate Senior Notes due 2023 | New York Stock Exchange | |
4.337% Fixed Rate Senior Notes due 2028 | New York Stock Exchange | |
4.950% Fixed Rate Senior Notes due 2047 | New York Stock Exchange | |
| * | Not for trading, but in connection with the registration of American Depositary Shares, pursuant to the requirements to the Securities and Exchange Commission. |
Barclays Bank PLC
Title of Each Class
| Name of Each Exchange On Which Registered
| |
| Callable Floating Rate Notes 2035 | New York Stock Exchange | |
| Non-Cumulative Callable Dollar Preference Shares, Series 3 | New York Stock Exchange* | |
| American Depositary Shares, Series 3, each representing oneNon-Cumulative Callable Dollar Preference Share, Series 3 | New York Stock Exchange | |
| Non-Cumulative Callable Dollar Preference Shares, Series 5 | New York Stock Exchange* | |
| American Depositary Shares, Series 5, each representing oneNon-Cumulative Callable Dollar Preference Share, Series 5 | New York Stock Exchange | |
| 5.140% Lower Tier 2 Notes due October 2020 | New York Stock Exchange | |
| iPath® Bloomberg Commodity Index Total ReturnSM ETN | NYSE Arca | |
| iPath® Bloomberg Agriculture Subindex Total ReturnSM ETN | NYSE Arca | |
| iPath® Bloomberg Aluminum Subindex Total ReturnSM ETN | NYSE Arca | |
| iPath® Bloomberg Cocoa Subindex Total ReturnSM ETN | NYSE Arca | |
| iPath® Bloomberg Coffee Subindex Total ReturnSM ETN | NYSE Arca | |
| iPath® Bloomberg Copper Subindex Total ReturnSM ETN | NYSE Arca | |
| iPath® Bloomberg Cotton Subindex Total ReturnSM ETN | NYSE Arca | |
| iPath® Bloomberg Energy Subindex Total ReturnSM ETN | NYSE Arca | |
| iPath® Bloomberg Grains Subindex Total ReturnSM ETN | NYSE Arca | |
| iPath® Bloomberg Industrial Metals Subindex Total ReturnSM ETN | NYSE Arca | |
| iPath® Bloomberg Lead Subindex Total ReturnSM ETN | NYSE Arca | |
| iPath® Bloomberg Livestock Subindex Total ReturnSM ETN | NYSE Arca | |
| iPath® Bloomberg Natural Gas Subindex Total ReturnSM ETN | NYSE Arca | |
| iPath® Bloomberg Nickel Subindex Total ReturnSM ETN | NYSE Arca | |
| iPath® Bloomberg Platinum Subindex Total ReturnSM ETN | NYSE Arca | |
| iPath® Bloomberg Precious Metals Subindex Total ReturnSM ETN | NYSE Arca | |
| iPath® Bloomberg Softs Subindex Total ReturnSM ETN | NYSE Arca | |
| iPath® Bloomberg Sugar Subindex Total ReturnSM ETN | NYSE Arca | |
| iPath® Bloomberg Tin Subindex Total ReturnSM ETN | NYSE Arca | |
| iPath® S&P GSCI® Total Return Index ETN | NYSE Arca | |
| iPath® S&P GSCI® Crude Oil Total Return Index ETN | NYSE Arca | |
| iPath® CBOE S&P 500 BuyWrite IndexSM ETN | NYSE Arca | |
| iPath® MSCI India IndexSM ETN | NYSE Arca | |
| iPath® EUR/USD Exchange Rate ETN | NYSE Arca | |
| iPath® GBP/USD Exchange Rate ETN | NYSE Arca | |
| iPath® JPY/USD Exchange Rate ETN | NYSE Arca | |
| iPath® S&P 500 VIX Short-Term FuturesTM ETN | NYSE Arca | |
| iPath® S&P 500 VIXMid-Term FuturesTM ETN | NYSE Arca | |
| iPath® Inverse S&P 500 VIX Short-Term FuturesTM ETN | NYSE Arca | |
| iPath® Long Extended Russell 1000® TR Index ETN | NYSE Arca | |
| iPath® Long Extended Russell 2000® TR Index ETN | NYSE Arca | |
| iPath® Long Enhanced MSCI EAFE® TR Index ETN | NYSE Arca | |
| iPath® Long Enhanced MSCI Emerging Markets Index ETN | NYSE Arca | |
| iPath® Short Enhanced MSCI Emerging Markets Index ETN | NYSE Arca | |
| iPath® Long Extended S&P 500® TR Index ETN | NYSE Arca | |
| iPath® Global Carbon ETN | NYSE Arca | |
| iPath® Optimized Currency Carry ETN | NYSE Arca | |
| iPath® US Treasury Steepener ETN | NASDAQ | |
| iPath® US Treasury Flattener ETN | NASDAQ | |
| iPath® US Treasury2-year Bull ETN | NASDAQ | |
| iPath® US Treasury2-year Bear ETN | NASDAQ | |
| iPath® US Treasury10-year Bull ETN | NASDAQ | |
| iPath® US Treasury10-year Bear ETN | NASDAQ | |
| iPath® US Treasury Long Bond Bull ETN | NASDAQ | |
| iPath® US Treasury Long Bond Bear ETN | NASDAQ | |
| iPath® Pure Beta Broad Commodity ETN | NYSE Arca | |
| iPath® Pure Beta S&P GSCI®-Weighted ETN | NYSE Arca | |
| iPath®Pure Beta Cocoa ETN | NYSE Arca | |
| iPath® Pure Beta Coffee ETN | NYSE Arca | |
| iPath® Pure Beta Cotton ETN | NYSE Arca | |
| iPath® Pure Beta Sugar ETN | NYSE Arca | |
| iPath® Pure Beta Aluminum ETN | NYSE Arca | |
| iPath® Pure Beta Copper ETN | NYSE Arca | |
| iPath® Pure Beta Lead ETN | NYSE Arca | |
| iPath® Pure Beta Nickel ETN | NYSE Arca | |
| iPath® Pure Beta Crude Oil ETN | NYSE Arca | |
| iPath® Seasonal Natural Gas ETN | NYSE Arca | |
| iPath® Pure Beta Agriculture ETN | NYSE Arca | |
| iPath® Pure Beta Grains ETN | NYSE Arca | |
| iPath® Pure Beta Softs ETN | NYSE Arca | |
| iPath® Pure Beta Industrial Metals ETN | NYSE Arca | |
| iPath® Pure Beta Energy ETN | NYSE Arca | |
| iPath® Pure Beta Livestock ETN | NYSE Arca | |
| iPath® Pure Beta Precious Metals ETN | NYSE Arca | |
| iPath® US Treasury5-year Bull ETN | NASDAQ | |
| iPath® US Treasury5-year Bear ETN | NASDAQ | |
| iPath® S&P 500 Dynamic VIX ETN | NYSE Arca | |
| iPath® Inverse S&P 500 VIX Short-Term FuturesTM ETN (II) | NYSE Arca | |
| iPath® GEMS IndexTM ETN | NYSE Arca | |
| iPath® GEMS Asia 8 ETN | NYSE Arca | |
| iPath® Asian and Gulf Currency Revaluation ETN | NYSE Arca | |
| iPath® S&P MLP ETN | NYSE Arca | |
| iPath®Series B S&P GSCI Crude Oil Total Return Index ETN | NYSE Arca | |
| Barclays ETN+ S&P 500® VEQTOR™ ETN | NYSE Arca | |
| Barclays ETN+ Shiller CAPETM ETNs | NYSE Arca | |
| Barclays ETN+ Select MLP ETN | NYSE Arca | |
| Barclays ETN+ FI Enhanced Europe 50 ETN | NYSE Arca | |
| Barclays ETN+ FI Enhanced Global High Yield ETN | NYSE Arca | |
| Barclays ETN+ FI Enhanced Europe 50 ETN Series B | NYSE Arca | |
| Barclays Women in Leadership ETN | NYSE Arca | |
| Barclays Return on Disability ETN | NYSE Arca | |
| Barclays Inverse US Treasury Composite ETN | NASDAQ | |
| * | Not for trading, but in connection with the registration of American Depositary Shares, pursuant to the requirements to the Securities and Exchange Commission. |
Securities registered or to be registered pursuant to Section 12(g) of the Act: None
Securities for which there is a reporting obligation pursuant to Section 15(d) of the Act: None
Indicate the number of outstanding shares of each of the issuers’ classes of capital or common stock as of the close of the period covered by the annual report.
| Barclays PLC | 25p ordinary shares | 16,804,603,949 | ||||
| Barclays Bank PLC | £1 ordinary shares | 2,342,558,515 | ||||
| £1 preference shares | 1,000 | |||||
| £100 preference shares | 20,930 | |||||
| €100 preference shares | 31,856 | |||||
| $0.25 preference shares | 161,000,000 | |||||
| $100 preference shares | 58,133 |
Indicate by check mark if each registrant is a well-known seasoned issuer, as defined in Rule 405 of the Securities Act.
Yes☑ No☐
If this report is an annual or transition report, indicate by check mark if the registrants are not required to file reports pursuant to Section 13 or 15(d) of the Securities Exchange Act 1934.
Yes☐ No☑
Note—Checking the box above will not relieve any registrant required to file reports pursuant to Section 13 or 15(d) of the Securities Exchange Act of 1934 from their obligations under those Sections.
Indicate by check mark whether the registrants: (1) have filed all reports required to be filed by Section 13 or 15(d) of the Securities Exchange Act of 1934 during the preceding 12 months (or for such shorter period that the registrant was required to file such reports), and (2) have been subject to such filing requirements for the past 90 days.
Yes☑ No☐
Indicate by check mark whether the registrants have submitted electronically and posted on their corporate Web sites, if any, every Interactive Data File required to be submitted and posted pursuant to Rule 405 of RegulationS-T (§ 232.405 of this chapter) during the preceding 12 months (or for such shorter period that the registrant was required to submit and post such files).
Yes☐ No☐
Indicate by check mark whether each registrant is a large accelerated filer, an accelerated filer, or anon-accelerated filer. See definition of “accelerated filer and large accelerated filer” in Rule12b-2 of the Exchange Act. (Check one):
Barclays PLC
| Large Accelerated Filer☑ | Accelerated Filer☐ | Non-Accelerated Filer☐ |
Barclays Bank PLC
| Large Accelerated Filer☐ | Accelerated Filer☐ | Non-Accelerated Filer☑ |
*Indicate by check mark which basis of accounting the registrant has used to prepare the financial statements included in this filing:
U.S. GAAP☐
International Financial Reporting Standards as issued by the International Accounting Standards Board ☑
Other☐
*If “Other” has been checked in response to the previous question, indicate by check mark which financial statement item the registrant has elected to follow:
Item 17☐
Item 18☐
If this is an annual report, indicate by check mark whether the registrant is a shell company (as defined in Rule12b-2 of the Exchange Act).
Yes☐ No☑
(APPLICABLE ONLY TO ISSUERS INVOLVED IN BANKRUPTCY PROCEEDINGS DURING THE PAST FIVE YEARS.)
Indicate by check mark whether the registrant has filed all documents and reports required to be filed by Section 12, 13 or 15(d) of the Securities Exchange Act of 1934 subsequent to the distribution of securities under a plan confirmed by a court.
Yes☐ No☐
SEC Form20-F Cross reference information
| Form 20-F item number | Page and caption references in this document* | |||||
| 1 | Identity of Directors, Senior Management and Advisers | Not applicable | ||||
| 2 | Offer Statistics and Expected Timetable | Not applicable | ||||
| 3 | Key Information | |||||
| A. | Selected financial data | 193, 195, 321-322, 447-448 | ||||
| B. | Capitalization and indebtedness | Not applicable | ||||
| C. | Reason for the offer and use of proceeds | Not applicable | ||||
| D. | Risk factors | 86-96 | ||||
| 4 | Information on the Company | |||||
| A. | History and development of the company | 44-46, 188, 233 (note 6), 235 (note 9), 294-295 (note 36), 298-299 (note 38), 306-307 (note 44), 308-316 (note 46), 429, 465-467 | ||||
| B. | Business overview | v (Market and other data), 182-189, 197-211, 227-230, 231 (note 2) | ||||
| C. | Organizational structure | 188, 294-295 (note 36), 308-316 (note 46), 429 | ||||
| D. | Property, plants and equipment | 223, 264 (note 21), 266-267 (note 23), 269 (note 25) | ||||
| 4A | Unresolved staff comments | Not applicable | ||||
| 5 | Operating and Financial Review and Prospects | |||||
| A. | Operating results | vi-x, 107, 149-150, 182-189, 191-211, 231-316 | ||||
| B. | Liquidity and capital resources | 104-107, 121-122, 140, 152, 154-159, 161-177, 182-189, 242-244 (note 15), 281-284 (note 30), 285 (note 31), 299-301 (note 39), 304 (note 43) | ||||
| C. | Research and development, patents and licenses, etc. | 44 | ||||
| D. | Trend information | – | ||||
| E. | Off-balance sheet arrangements | 272 (note 28), 295-298 (note 37), 299-301 (note 39) | ||||
| F. | Tabular disclosure of contractual obligations | 406-407 | ||||
| G. | Safe harbor | iv-v (Forward-looking statements) | ||||
| 6 | Directors, Senior Management and Employees | |||||
| A. | Directors and senior management | 3-5, 332-336 | ||||
| B. | Compensation | 51-85, 287-288 (note 34), 289-293 (note 35), 302-304 (note 41), 426, 446 (note r) | ||||
| C. | Board practices | 6-50, 80-83 | ||||
| D. | Employees | 47, 50 (Permanent employees by region), 199, 200, 203, 207, 208, 210 | ||||
| E. | Share ownership | 51-85, 287-288 (note 34), 302-304 (note 41), 339-341 | ||||
| 7 | Major Shareholders and Related Party Transactions | |||||
| A. | Major shareholders | 45, 331-332 | ||||
| B. | Related party transactions | 210, 302-304 (note 41), 426, 446 (note r) | ||||
| C. | Interests of experts and counsel | Not applicable | ||||
| Form 20-F item number | Page and caption references in this document* | |||||
| 8 | Financial Information | |||||
| A. | Consolidated statements and other financial information | 193-195, 219-316, 428-446 | ||||
| B. | Significant changes | Not applicable | ||||
| 9 | The Offer and Listing | |||||
| A. | Offer and listing details | 321 | ||||
| B. | Plan of distribution | Not applicable | ||||
| C. | Markets | 321 | ||||
| D. | Selling shareholders | Not applicable | ||||
| E. | Dilution | Not applicable | ||||
| F. | Expenses of the issue | Not applicable | ||||
| 10 | Additional Information | |||||
| A. | Share capital | Not applicable | ||||
| B. | Memorandum and Articles of Association | 43-46, 317-319 | ||||
| C. | Material contracts | 67-68 | ||||
| D. | Exchange controls | 326 | ||||
| E. | Taxation | 323-325 | ||||
| F. | Dividends and paying assets | Not applicable | ||||
| G. | Statement by experts | Not applicable | ||||
| H. | Documents on display | 326 | ||||
| I. | Subsidiary information | 294-295 (note 36) 308-316 (note 46) | ||||
| 11 | Quantitative and Qualitative Disclosure about Market Risk | 103, 141-151, 304 (note 43), 373-379 | ||||
| 12 | Description of Securities Other than Equity Securities | |||||
| A. | Debt Securities | Not applicable | ||||
| B. | Warrants and Rights | Not applicable | ||||
| C. | Other Securities | Not applicable | ||||
| D. | American Depositary Shares | 321, 327-328 | ||||
| 13 | Defaults, Dividends Arrearages and Delinquencies | Not applicable | ||||
| 14 | Material Modifications to the Rights of Security Holders and Use of Proceeds | Not applicable | ||||
| 15 | Controls and Procedures | |||||
| A. | Disclosure controls and procedures | 332 | ||||
| B. | Management’s annual report on internal control over financial reporting | 41 | ||||
| C. | Attestation report of the registered public accounting firm | 218 | ||||
| D. | Changes in internal control over financial reporting | 41 | ||||
| 16A | Audit Committee Financial Expert | 11 | ||||
| 16B | Code of Ethics | 330 | ||||
| 16C | Principal Accountant Fees and Services | 17-19, 304 (note 42), 329 | ||||
| 16D | Exemptions from the Listing Standards for Audit Committees | Not applicable | ||||
| 16E | Purchases of Equity Securities by the Issuer and Affiliated Purchasers | 46, 284 (Share repurchase) | ||||
| 16F | Change in Registrant’s Certifying Accountant | Not applicable | ||||
| 16G | Corporate Governance | 330 | ||||
| 17 | Financial Statements | Not applicable (See Item 8) | ||||
| 18 | Financial Statements | Not applicable (See Item 8) | ||||
| 19 | Exhibits | Exhibit Index | ||||
| * | Captions have been included only in respect of pages with multiple sections on the same page in order to identify the relevant caption on that page covered by the corresponding Form20-F item number. |

Building the bank
of the future
Barclays PLC and Barclays Bank PLC 2016 Annual Report on Form 20-F |
Notes
The term Barclays or Group refers to Barclays PLC together with its subsidiaries. Unless otherwise stated, the income statement analysis compares the year ended 31 December 2016 to the corresponding 12 months of 2015 and balance sheet analysis as at 31 December 2016 with comparatives relating to 31 December 2015. The abbreviations ‘£m’ and ‘£bn’ represent millions and thousands of millions of Pounds Sterling respectively; the abbreviations ‘$m’ and ‘$bn’ represent millions and thousands of millions of US Dollars respectively; and the abbreviations ‘€m’ and ‘€bn’ represent millions and thousands of millions of Euros respectively.
Comparatives have been restated to reflect the implementation of the Group business reorganisation. These restatements were detailed in our Form6-K filed with the SEC dated 15 April 2016.
The information in this announcement, which was approved by the Board of Directors on 22 February 2017, does not comprise statutory accounts within the meaning of Section 434 of the Companies Act 2006. Statutory accounts for the year ended 31 December 2015, which included certain information required for the Joint Annual Report on Form20-F of Barclays PLC and Barclays Bank PLC to the SEC and which contained an unqualified audit report under Section 495 of the Companies Act 2006 (which did not make any statements under Section 498 of the Companies Act 2006) have been delivered to the Registrar of Companies in accordance with Section 441 of the Companies Act 2006.
Barclays is a frequent issuer in the debt capital markets and regularly meets with investors via formal road-shows and other ad hoc meetings. Consistent with its usual practice, Barclays expects that from time to time over the coming quarter it will meet with investors globally to discuss these results and other matters relating to the Group.
Certainnon-IFRS measures
Barclays management believes that thenon-International Financial Reporting Standards(non-IFRS) measures included in this document provide valuable information to readers of its financial statements because they enable the reader to identify a more consistent basis for comparing the business’ performance between financial periods, and provide more detail concerning the elements of performance which the managers of these businesses are most directly able to influence or are relevant for an assessment of the Group. They also reflect an important aspect of the way in which operating targets are defined and performance is monitored by Barclays management. However, anynon-IFRS measures in this document are not a substitute for IFRS measures and readers should consider the IFRS measures as well.
There are a number of key judgement areas, for example impairment calculations, which are based on models and which are subject to ongoing adjustment and modifications. Reported numbers reflect best estimates and judgements at the given point in time.
Notable items as set out on page 197 are considered to be significant items impacting comparability of performance and have been called out for each of the business segments.
Relevant terms that are used in this document but are not defined under applicable regulatory guidance or International Financial Reporting Standards (IFRS) are explained in the Results glossary of non-IFRS performance measures on page 212 and the glossary of terms on pages 449 to 464.
i
Keynon-IFRS measures included in this document, and the most directly comparable IFRS measures, are:
– Attributable profit/(loss) excluding notable items represents profit after tax excluding notable items less profit attributable tonon-controlling interests. The comparable IFRS measure is attributable profit. A reconciliation is presented on pages vi to vii;
– Average tangible shareholders’ equity is calculated as the average equity adjusted to remove the effect of goodwill and intangible assets. The comparable IFRS measure is average equity. A reconciliation is provided on page ix;
– Average allocated tangible equity represents the average tangible equity that is allocated to Barclays Core, and to the businesses. The comparable IFRS measure is average equity. A reconciliation is provided on page ix;
– Average tangible equity is equivalent to average tangible shareholders’ equity;
– Barclays Core results are considered to benon-IFRS because Barclays Core represents the sum of three Operating Segments, each of which is prepared in accordance with IFRS 8; “Operating Segments”: Barclays UK, Barclays International and Head Office. A reconciliation is provided on pages vi to viii;
– Basic earnings per share excluding notable items represents attributable profit excluding all notable items (page 197) divided by the basic weighted average number of shares in issue. The comparable IFRS measure is basic earnings per share. A reconciliation is provided on page 215;
– Core basic earnings per share excluding notable items represents basic earnings per share excluding notable items calculated for Barclays Core. Barclays Core represents the sum of three Operating Segments, each of which is prepared in accordance with IFRS 8, “Operating Segments”: Barclays UK, Barclays International and Head Office. The comparable IFRS measure is basic earnings per share. A reconciliation is provided on page 215;
– Cost: income ratio excluding notable items represents the ratio between total operating expenses excluding notable items and total income excluding notable items. The comparable IFRS measure is cost: income ratio. A reconciliation is provided on pages vi to viii;
– Core cost: income ratio excluding notable items represents cost: income ratio excluding notable items calculated for Barclays Core. Barclays Core represents the sum of three Operating Segments, each of which is prepared in accordance with IFRS 8, “Operating Segments”: Barclays UK, Barclays International and Head Office. The comparable IFRS measure is cost: income ratio. A reconciliation is provided on pages vi to viii;
– Total income excluding notable items represents total income excluding the impact of own credit, gain on disposal of Barclays’ share of Visa Europe Limited, revision of Education, Social Housing, and Local Authority (ESHLA) valuation methodology and gain on US Lehman acquisition assets. The comparable IFRS measure is total income. A full list of notable items is shown on page 197. A reconciliation is provided on pages vi to viii;
– Net operating income excluding notable items represents net operating income excluding the impact of own credit, gain on disposal of Barclays’ share of Visa Europe Limited, gain on US Lehman acquisition assets and revision of Education, Social Housing, and Local Authority (ESHLA) valuation methodology. The comparable IFRS measure is net operating income. A full list of notable items is shown on page 197. A reconciliation is provided on pages vi to viii;
ii
– Total operating expenses excluding notable items represents total operating expenses excluding the impact of provisions for UK customer redress, provisions for ongoing investigations and litigation including Foreign Exchange, gain on valuation of a component of the defined retirement benefit liability, impairment of goodwill and other assets relating to businesses being disposed and losses on sale relating to the Spanish, Portuguese and Italian businesses. The comparable IFRS measure is total operating expenses. A full list of notable items is shown on page 197. A reconciliation is provided on pages vi to viii;
– Profit after tax excluding notable items represents profit after tax excluding thepost-tax impact of own credit, impairment of goodwill and other assets relating to businesses being disposed, provisions for UK customer redress, gain on US Lehman acquisition assets, provisions for ongoing investigations and litigation including Foreign Exchange, losses on sale relating to the Spanish, Portuguese and Italian businesses, revision of Education, Social Housing, and Local Authority (ESHLA) valuation methodology, gain on a valuation of a component of the defined retirement benefit liability, and gain on disposal of Barclays’ share of Visa Europe Limited. The comparable IFRS measure is profit after tax. A reconciliation is provided on pages vi to viii;
– Profit before tax excluding notable items represents profit before tax excluding the impact of own credit, impairment of goodwill and other assets relating to businesses being disposed, provisions for UK customer redress, excluding gain on US Lehman acquisition assets, provisions for ongoing investigations and litigation including Foreign Exchange, losses on sale relating to the Spanish, Portuguese and Italian businesses, revision of Education, Social Housing, and Local Authority (ESHLA) valuation methodology, gain on a valuation of a component of the defined retirement benefit liability, and gain on disposal of Barclays’ share of Visa Europe Limited. The comparable IFRS measure is profit before tax. A reconciliation is provided on pages vi to viii;
Return on average allocated tangible equity represents the return on average tangible equity that is allocated to Barclays Core, and to the businesses. The comparable IFRS measure is return on equity. A reconciliation is provided on page ix;
– Attributable profit/(loss) excluding notable items represents attributable profit excluding the post-tax impact of own credit, impairment of goodwill and other assets relating to businesses being disposed, provisions for UK customer redress, gain on US Lehman acquisition assets, provisions for ongoing investigations and litigation including Foreign Exchange, losses on sale relating to the Spanish, Portuguese and Italian businesses, revision of Education, Social Housing, and Local Authority (ESHLA) valuation methodology, gain on a valuation of a component of the defined retirement benefit liability, and gain on disposal of Barclays’ share of Visa Europe Limited. The comparable IFRS measure is attributable profit. A full list of notable items is shown on page 197. A reconciliation to IFRS is presented on pages vi to viii;
iii
– Return on average tangible shareholders’ equity excluding notable items represents attributable profit excluding notable items, including an adjustment for the tax credit recorded in reserves in respect of other equity instruments, as a proportion of average shareholders’ equity excludingnon-controlling interests and other equity instruments adjusted for the deduction of intangible assets and goodwill. The comparable IFRS measure is return on equity. A reconciliation is provided on page 214;
– Return on average tangible shareholders’ equity is calculated as the return on equity adjusted to remove the effect of goodwill and intangible assets. The comparable IFRS measure is return on equity. A reconciliation is provided on page ix;
– Tangible net asset value per share is calculated by dividing shareholders equity, excludingnon-controlling interests and other equity instruments, less goodwill and intangible assets, by the number of issued ordinary shares. The components of the calculation have been included on page 215;
– Total operating expenses, excluding conduct and litigation charges, and other notable items represents total operating expenses excluding the impact of impairment of goodwill and other assets relating to businesses being disposed, provisions for UK customer redress, provisions for ongoing investigations and litigation including Foreign Exchange, and gain on a valuation of a component of the defined retirement benefit liability. The comparable IFRS measure is total operating expenses. A reconciliation is provided on pages vi to viii;
– Total operating expenses excluding conduct and litigation charges represents total operating expenses excluding the impact of provisions for UK customer redress, and provisions for ongoing investigations and litigation including Foreign Exchange. The comparable IFRS measure is total operating expenses. A reconciliation to IFRS is provided on pages vi to viii; and
– Transitional CET1 ratio according to FSA October 2012. This measure is calculated by taking into account the statement of the Financial Services Authority, the predecessor of the Prudential Regulation Authority, on CRD IV transitional provisions in October 2012, assuming such provisions were applied as at 1 January 2014. This ratio is used as the relevant measure starting 1 January 2014 for purposes of determining whether the automatic write-down trigger (specified as a Transitional CET1 ratio according to FSA October 2012 of less than 7.00%) has occurred under the terms of the Contingent Capital Notes issued by Barclays Bank PLC on November 21, 2012 (CUSIP: 06740L8C2) and April 10, 2013 (CUSIP: 06739FHK0). Please refer to page 155 for a reconciliation of this measure to CRD IV CET1 ratio.
Forward-looking statements
This document contains certain forward-looking statements within the meaning of Section 21E of the US Securities Exchange Act of 1934, as amended, and Section 27A of the US Securities Act of 1933, as amended, with respect to the Group. Barclays cautions readers that no forward-looking statement is a guarantee of future performance and that actual results or other financial condition or performance measures could differ materially from those contained in the forward-looking statements. These forward-looking statements can be identified by the fact that they do not relate only to historical or current facts. Forward-looking statements sometimes use words such as ‘may’, ‘will’, ‘seek’, ‘continue’, ‘aim’, ‘anticipate’, ‘target’, ‘projected’, ‘expect’, ‘estimate’, ‘intend’, ‘plan’, ‘goal’, ‘believe’, ‘achieve’ or other words of similar meaning. Examples of forward-looking statements include, among others, statements or guidance regarding the Group’s future financial position, income growth, assets, impairment charges, provisions, notable items, business strategy, structural reform, capital, leverage and other regulatory ratios, payment of dividends (including dividend pay-out ratios and expected payment strategies), projected levels of growth in the banking and financial markets, projected costs or savings, original and revised commitments and targets in connection with the strategic cost programme and the Group Strategy Update, rundown of assets and businesses within Barclays Non-Core, sell down of the Group’s interest in Barclays Africa Group Limited, estimates of capital expenditures and plans and objectives for future operations, projected employee numbers and other statements that are not historical fact. By their nature, forward-looking statements involve risk and uncertainty because they relate to future events and circumstances. These may be affected by changes in legislation, the development of standards and interpretations under International Financial Reporting Standards, evolving practices with regard to the interpretation and application of accounting and regulatory standards, the outcome of current and future legal proceedings and regulatory investigations, future levels of conduct provisions, future levels of notable items, the policies and actions of governmental and regulatory authorities, geopolitical risks and the impact of competition. In addition, factors including (but not limited to) the following may have an effect: capital, leverage and other regulatory rules (including with regard to the future structure of the Group) applicable to past, current and future periods; UK, US, Africa, Eurozone and global macroeconomic and business conditions; the effects of continued volatility in credit markets; market related risks such as changes in interest rates and foreign exchange rates; effects of changes in valuation of credit market exposures; changes in valuation of issued securities; volatility in capital markets; changes in credit ratings of any entities within the Group or any securities issued by such entities; the potential for one or more countries exiting the Eurozone; the implications of the results of the 23 June 2016 referendum in the United Kingdom and the disruption that may result in the UK and globally from the withdrawal of the United Kingdom from the European Union; the implementation of the strategic cost programme; and the success of future acquisitions, disposals and other strategic transactions. A number of these influences and factors are beyond the Group’s control. As a result, the Group’s actual future results, dividend payments, and capital and leverage ratios may differ materially from the plans, goals, expectations and guidance set forth in the Group’s forward-looking statements. Additional risks and factors which may impact the Group’s future financial condition and performance are identified in our filings with the SEC which are available on the SEC’s website at www.sec.gov.
Any forward-looking statements made herein speak only as of the date they are made and it should not be assumed that they have been revised or updated in the light of new information or future events. Except as required by the Prudential Regulation Authority, the Financial Conduct Authority, the London Stock Exchange plc (the LSE) or applicable law, Barclays expressly disclaims any obligation or undertaking to release publicly any updates or revisions to any forward-looking statements contained herein to reflect any change in Barclays’ expectations with regard thereto or any change in events, conditions or circumstances on which any such statement is based. The reader should, however, consult any additional disclosures that Barclays has made or may make in documents it has published or may publish via the Regulatory News Service of the LSE and/or has filed or may file with the SEC.
iv
Subject to our obligations under the applicable laws and regulations of the UK and the US in relation to disclosure and ongoing information, we undertake no obligation to update publicly or revise any forward-looking statements, whether as a result of new information, future events or otherwise.
Market and other data
This document contains information, including statistical data, about certain Barclays markets and its competitive position. Except as otherwise indicated, this information is taken or derived from Datastream and other external sources. Barclays cannot guarantee the accuracy of information taken from external sources, or that, in respect of internal estimates, a third party using different methods would obtain the same estimates as Barclays.
Uses of Internet addresses
This document contains inactive textual addresses to internet websites operated by us and third parties. Reference to such websites is made for information purposes only, and information found at such websites is not incorporated by reference into this document.
References to Pillar 3 report
This document contains references throughout to Barclays annual risk report, the Pillar 3. Reference to the aforementioned report is made for information purposes only, and information found in this report is not incorporated by reference into this document.
v
Barclays Group results reconciliation for the year ended | 31.12.16 | |||||||||||||||||||||||
| Barclays UK | Barclays International | Head Office | Barclays Core | Barclays Non-Core | Barclays Group | |||||||||||||||||||
| £m | £m | £m | £m | £m | £m | |||||||||||||||||||
Total income | 7,517 | 14,995 | 103 | 22,615 | (1,164 | ) | 21,451 | |||||||||||||||||
Own credit | - | - | (35 | ) | (35 | ) | - | (35 | ) | |||||||||||||||
Gain on disposal of Barclays’ share of Visa Europe Limited | 151 | 464 | - | 615 | - | 615 | ||||||||||||||||||
Total income excluding notable items | 7,366 | 14,531 | 138 | 22,035 | (1,164 | ) | 20,871 | |||||||||||||||||
Credit impairment charges and other provisions | (896 | ) | (1,355 | ) | - | (2,251 | ) | (122 | ) | (2,373 | ) | |||||||||||||
Net operating income/(expenses) | 6,621 | 13,640 | 103 | 20,364 | (1,286 | ) | 19,078 | |||||||||||||||||
Notable items | 151 | 464 | (35 | ) | 580 | - | 580 | |||||||||||||||||
Net operating income/(expenses) excluding notable items | 6,470 | 13,176 | 138 | 19,784 | (1,286 | ) | 18,498 | |||||||||||||||||
Operating expenses | (3,792 | ) | (9,129 | ) | (135 | ) | (13,056 | ) | (1,509 | ) | (14,565 | ) | ||||||||||||
UK bank levy | (48 | ) | (284 | ) | (2 | ) | (334 | ) | (76 | ) | (410 | ) | ||||||||||||
| Total operating expenses excluding litigation and conduct, and other notable items | (3,840 | ) | (9,413 | ) | (137 | ) | (13,390 | ) | (1,585 | ) | (14,975 | ) | ||||||||||||
Litigation and conduct | (1,042 | ) | (48 | ) | (27 | ) | (1,117 | ) | (246 | ) | (1,363 | ) | ||||||||||||
Provisions for UK customer redress | (1,000 | ) | - | - | (1,000 | ) | - | (1,000 | ) | |||||||||||||||
Litigation and conduct excluding notable items | (42 | ) | (48 | ) | (27 | ) | (117 | ) | (246 | ) | (363 | ) | ||||||||||||
Total operating expenses | (4,882 | ) | (9,461 | ) | (164 | ) | (14,507 | ) | (1,831 | ) | (16,338 | ) | ||||||||||||
Notable items | (1,000 | ) | - | - | (1,000 | ) | - | (1,000 | ) | |||||||||||||||
Total operating expenses excluding notable items | (3,882 | ) | (9,461 | ) | (164 | ) | (13,507 | ) | (1,831 | ) | (15,338 | ) | ||||||||||||
Cost: income ratio | 65% | 63% | n/a | 64% | n/a | 76% | ||||||||||||||||||
Cost: income ratio excluding notable items | 53% | 65% | n/a | 61% | n/a | 72% | ||||||||||||||||||
Other net (expenses)/income | (1 | ) | 32 | 128 | 159 | 331 | 490 | |||||||||||||||||
Profit/(loss) before tax | 1,738 | 4,211 | 67 | 6,016 | (2,786 | ) | 3,230 | |||||||||||||||||
Notable items | (849 | ) | 464 | (35 | ) | (420 | ) | - | (420 | ) | ||||||||||||||
Profit/(loss) before tax excluding notable items | 2,587 | 3,747 | 102 | 6,436 | (2,786 | ) | 3,650 | |||||||||||||||||
Attributable profit/(loss)1 | 828 | 2,412 | 110 | 3,350 | (1,916 | ) | 1,623 | |||||||||||||||||
Notable items | (857 | ) | 451 | (25 | ) | (431 | ) | - | (431 | ) | ||||||||||||||
Attributable profit/(loss) excluding notable items1 | 1,685 | 1,961 | 135 | 3,781 | (1,916 | ) | 2,054 | |||||||||||||||||
Risk weighted assets (£bn) 1 | 67.5 | 212.7 | 53.3 | 333.5 | 32.1 | 365.6 | ||||||||||||||||||
| 1 | Attributable profit in respect of the Africa Banking discontinued operation is reported at the Group level only. Allocated tangible equity, RWAs and leverage exposure are reported in Head Office within Core. |
vi
Barclays Group results reconciliation for the year ended | 31.12.15 | |||||||||||||||||||||||
| | Barclays UK | | | Barclays International | | | Head Office | | | Barclays Core |
| | Barclays Non-Core |
| | Barclays Group | | |||||||
| £m | £m | m | £m | £m | £m | |||||||||||||||||||
Total income | 7,343 | 13,747 | 338 | 21,428 | 612 | 22,040 | ||||||||||||||||||
Own credit | - | - | 430 | 430 | - | 430 | ||||||||||||||||||
Gains on US Lehman acquisition assets | - | 496 | - | 496 | - | 496 | ||||||||||||||||||
Total income excluding notable items | 7,343 | 13,251 | (92) | 20,502 | 612 | 21,114 | ||||||||||||||||||
Credit impairment charges and other provisions | (706) | (922) | - | (1,628) | (134) | (1,762) | ||||||||||||||||||
Net operating income | 6,637 | 12,825 | 338 | 19,800 | 478 | 20,278 | ||||||||||||||||||
Notable items | - | 496 | 430 | 926 | - | 926 | ||||||||||||||||||
| Net operating income/(expenses) excluding notable items | 6,637 | 12,329 | (92) | 18,874 | 478 | 19,352 | ||||||||||||||||||
Operating expenses | (3,464) | (8,029) | (272) | (11,765) | (1,958) | (13,723) | ||||||||||||||||||
| Gain on valuation of a component of the defined retirement benefit liability | 296 | 133 | - | 429 | - | 429 | ||||||||||||||||||
| Impairment of goodwill and other assets relating to businesses being disposed | (96) | (96) | ||||||||||||||||||||||
| Losses on sale relating to the Spanish, Portuguese and Italian businesses | - | - | - | - | (3) | (3) | ||||||||||||||||||
Operating expenses excluding notable items | (3,760) | (8,162) | (272) | (12,194) | (1,859) | (14,053) | ||||||||||||||||||
UK bank levy | (77) | (253) | (8) | (338) | (88) | (426) | ||||||||||||||||||
| Total operating expenses excluding litigation and conduct, and other notable items | (3,837) | (8,415) | (280) | (12,532) | (1,947) | (14,479) | ||||||||||||||||||
Litigation and conduct | (2,511) | (1,310) | (66) | (3,887) | (500) | (4,387) | ||||||||||||||||||
Provisions for UK customer redress | (2,431) | (218) | - | (2,649) | (123) | (2,772) | ||||||||||||||||||
| Provisions for ongoing investigations and litigation including Foreign Exchange | - | (984) | (52) | (1,036) | (201) | (1,237) | ||||||||||||||||||
Litigation and conduct excluding notable items | (80) | (108) | (14) | (202) | (176) | (378) | ||||||||||||||||||
Total operating expenses | (6,052) | (9,592) | (346) | (15,990) | (2,546) | (18,536) | ||||||||||||||||||
Notable items | (2,135) | (1,069) | (52) | (3,256) | (423) | (3,679) | ||||||||||||||||||
Total operating expenses excluding notable items | (3,917) | (8,523) | (294) | (12,734) | (2,123) | (14,857) | ||||||||||||||||||
Cost: income ratio | 82% | 70% | n/a | 75% | n/a | 84% | ||||||||||||||||||
Cost: income ratio excluding notable items | 53% | 64% | n/a | 62% | n/a | 70% | ||||||||||||||||||
Other net income/(expenses) | - | 45 | (106) | (61) | (535) | (596) | ||||||||||||||||||
| Losses on sale relating to the Spanish, Portuguese and Italian businesses | - | - | (112) | (112) | (465) | (577) | ||||||||||||||||||
| Other net income/(expenses) excluding notable items | - | 45 | 6 | 51 | (70) | (19) | ||||||||||||||||||
Profit/(loss) before tax | 585 | 3,278 | (114) | 3,749 | (2,603) | 1,146 | ||||||||||||||||||
Notable items | (2,135 | ) | (573 | ) | 266 | (2,442 | ) | (888 | ) | (3,330 | ) | |||||||||||||
Profit/(loss) before tax excluding notable items | 2,720 | 3,851 | (380 | ) | 6,191 | (1,715 | ) | 4,476 | ||||||||||||||||
Attributable (loss)/profit1 | (47 | ) | 1,758 | 11 | 1,722 | (2,418 | ) | (394 | ) | |||||||||||||||
Notable items | (2,008 | ) | (562 | ) | (187 | ) | (2,383 | ) | (707 | ) | (3,090 | ) | ||||||||||||
Attributable profit/(loss) excluding notable items1 | 1,961 | 2,320 | (176 | ) | 4,105 | (1,711 | ) | 2,696 | ||||||||||||||||
Average allocated tangible equity (£bn) 1 | 9.3 | 24.9 | 2.6 | 36.8 | 10.9 | 47.7 | ||||||||||||||||||
Risk weighted assets (£bn) 1 | 69.5 | 194.8 | 39.7 | 304.1 | 54.3 | 358.4 | ||||||||||||||||||
| 1 | Attributable profit in respect of the Africa Banking discontinued operation is reported at the Group level only. Allocated tangible equity, RWAs and leverage exposure are reported in Head Office within Core. |
vii
Barclays Group results reconciliation
for the year ended | 31.12.14 | |||||||||||||||||||||||
| Barclays UK | Barclays International | Head Office | Barclays Core | Barclays Non-Core | Barclays Group | |||||||||||||||||||
| £m | £m | m | £m | £m | £m | |||||||||||||||||||
Total income | 7,436 | 12,908 | 276 | 20,620 | 1,143 | 21,763 | ||||||||||||||||||
Own credit | - | - | 34 | 34 | - | 34 | ||||||||||||||||||
Revision of ESHLA valuation methodology | - | - | - | - | (935 | ) | (935 | ) | ||||||||||||||||
Gains on US Lehman acquisition assets | - | 461 | - | 461 | - | 461 | ||||||||||||||||||
Total income excluding notable items | 7,436 | 12,447 | 242 | 20,125 | 2,078 | 22,203 | ||||||||||||||||||
Credit impairment charges and other provisions | (901 | ) | (679 | ) | - | (1,580 | ) | (241 | ) | (1,821 | ) | |||||||||||||
Net operating income | 6,535 | 12,229 | 276 | 19,040 | 902 | 19,942 | ||||||||||||||||||
Notable items | - | 461 | 34 | 495 | (935 | ) | (440 | ) | ||||||||||||||||
| Net operating income/(expenses) excluding notable items | 6,535 | 11,768 | 242 | 18,545 | 1,837 | 20,382 | ||||||||||||||||||
Operating expenses | (4,108 | ) | (8,170 | ) | (70 | ) | (12,348 | ) | (2,611 | ) | (14,959 | ) | ||||||||||||
UK bank levy | (59 | ) | (248 | ) | (9 | ) | (316 | ) | (102 | ) | (418 | ) | ||||||||||||
Total operating expenses excluding litigation and conduct, and other notable items | (4,167 | ) | (8,418 | ) | (79 | ) | (12,664 | ) | (2,713 | ) | (15,377 | ) | ||||||||||||
Litigation and conduct | (1,108 | ) | (1,333 | ) | (65 | ) | (2,506 | ) | (301 | ) | (2,807 | ) | ||||||||||||
Provisions for UK customer redress | (1,067 | ) | 32 | - | (1,035 | ) | (75 | ) | (1,110 | ) | ||||||||||||||
Provisions for ongoing investigations and litigation including Foreign Exchange | - | (1,250 | ) | - | (1,250 | ) | - | (1,250 | ) | |||||||||||||||
Litigation and conduct excluding notable items | (41 | ) | (115 | ) | (65 | ) | (221 | ) | (226 | ) | (447 | ) | ||||||||||||
Total operating expenses | (5,275 | ) | (9,751 | ) | (144 | ) | (15,170 | ) | (3,014 | ) | (18,184 | ) | ||||||||||||
Notable items | (1,067 | ) | (1,218 | ) | - | (2,285 | ) | (75 | ) | (2,360 | ) | |||||||||||||
Total operating expenses excluding notable items | (4,208 | ) | (8,533 | ) | (144 | ) | (12,885 | ) | (2,939 | ) | (15,824 | ) | ||||||||||||
Cost: income ratio | 71% | 76% | n/a | 74% | n/a | 84% | ||||||||||||||||||
Cost: income ratio excluding notable items | 57% | 69% | n/a | 64% | n/a | 71% | ||||||||||||||||||
Other net (expenses)/income | - | 52 | 316 | 368 | (813 | ) | (445 | ) | ||||||||||||||||
| Losses on sale relating to the Spanish, Portuguese and Italian businesses | - | - | 315 | 315 | (761 | ) | (446 | ) | ||||||||||||||||
Other net (expenses)/income excluding notable items | - | 52 | 1 | 53 | (52 | ) | 1 | |||||||||||||||||
Profit/(loss) before tax | 1,260 | 2,530 | 448 | 4,238 | (2,925 | ) | 1,313 | |||||||||||||||||
Notable items | (1,067 | ) | (757 | ) | 349 | (1,475 | ) | (1,771 | ) | (3,246 | ) | |||||||||||||
Profit/(loss) before tax excluding notable items | 2,327 | 3,287 | 99 | 5,713 | 1,154 | 4,559 | ||||||||||||||||||
Attributable profit/(loss)1 | 852 | 926 | 374 | 2,152 | (2,659 | ) | (174 | ) | ||||||||||||||||
Notable items | (855 | ) | (808 | ) | 260 | (1,403 | ) | (1,550 | ) | (2,605 | ) | |||||||||||||
Attributable profit/(loss) excluding notable items1 | 1,707 | 1,734 | 114 | 3,555 | (1,109 | ) | 2,779 | |||||||||||||||||
Average allocated tangible equity (£bn) 1 | 9.1 | 25.0 | (2.7 | ) | 31.4 | 15.6 | 47.0 | |||||||||||||||||
Risk weighted assets (£bn) 1 | 69.3 | 201.7 | 41.8 | 312.8 | 89.1 | 401.9 | ||||||||||||||||||
| 1 | Attributable profit in respect of the Africa Banking discontinued operation is reported at the Group level only. Allocated tangible equity, RWAs and leverage exposure are reported in Head Office within Core. |
viii
| 2016 | 2015 | 2014 | ||||||||||
Average allocated equitya | £bn | £bn | £bn | |||||||||
| ||||||||||||
Barclays UK | 13.4 | 13.7 | 13.1 | |||||||||
Corporate and Investment Bank | 23.2 | 23.1 | 23.1 | |||||||||
Consumer, Cards and Payments | 5.0 | 4.0 | 4.0 | |||||||||
| ||||||||||||
Barclays International | 28.2 | 27.1 | 27.1 | |||||||||
Head Officeb | 8.0 | 3.9 | (1.3 | ) | ||||||||
| ||||||||||||
Barclays Core | 49.6 | 44.7 | 38.9 | |||||||||
BarclaysNon-Core | 7.8 | 11.2 | 16.0 | |||||||||
| ||||||||||||
Barclays Group | 57.4 | 55.9 | 54.9 | |||||||||
Effect of Goodwill and Intangibles | £bn | £bn | £bn | |||||||||
| ||||||||||||
Barclays UK | (4.5 | ) | (4.4 | ) | (3.9 | ) | ||||||
Corporate and Investment Bank | (1.4 | ) | (1.2 | ) | (1.2 | ) | ||||||
Consumer, Cards and Payments | (1.3 | ) | (1.0 | ) | (1.0 | ) | ||||||
| ||||||||||||
Barclays International | (2.7 | ) | (2.2 | ) | (2.2 | ) | ||||||
Head Officeb | (1.4 | ) | (1.3 | ) | (1.4 | ) | ||||||
| ||||||||||||
Barclays Core | (8.6 | ) | (7.9 | ) | (7.6 | ) | ||||||
BarclaysNon-Core | (0.1 | ) | (0.3 | ) | (0.3 | ) | ||||||
| ||||||||||||
Barclays Group | (8.7 | ) | (8.2 | ) | (7.9 | ) | ||||||
Average allocated tangible equityc | £bn | £bn | £bn | |||||||||
| ||||||||||||
Barclays UK | 8.9 | 9.3 | 9.1 | |||||||||
Corporate and Investment Bank | 21.9 | 21.9 | 22.0 | |||||||||
Consumer, Cards and Payments | 3.6 | 3.0 | 3.0 | |||||||||
| ||||||||||||
Barclays International | 25.5 | 24.9 | 25.0 | |||||||||
Head Officeb | 6.5 | 2.6 | (2.7 | ) | ||||||||
| ||||||||||||
Barclays Core | 41.0 | 36.8 | 31.4 | |||||||||
BarclaysNon-Core | 7.8 | 10.9 | 15.6 | |||||||||
| ||||||||||||
Barclays Group | 48.7 | 47.7 | 47.0 | |||||||||
Notes
| a | This table shows the allocation of Group average equity across IFRS and non-IFRS segments |
| b | Includes the African Banking discontinued operation |
| c | This table shows average tangible equity for the Group and for the IFRS and non-IFRS reporting segments |
ix
| 2016 | 2015 | 2014 | ||||||||||
Profit/(loss) attributable to ordinary equity holders of the parent | £m | £m | £m | |||||||||
| ||||||||||||
Barclays UK | 857 | (33 | ) | 869 | ||||||||
Corporate and Investment Bank | 1,342 | 1,180 | 421 | |||||||||
Consumer, Cards and Payments | 1,153 | 620 | 528 | |||||||||
| ||||||||||||
Barclays International | 2,495 | 1,800 | 949 | |||||||||
Head Office | 109 | 11 | 373 | |||||||||
| ||||||||||||
Barclays Core | 3,461 | 1,778 | 2,191 | |||||||||
Barclays Non-Core | (1,899 | ) | (2,405 | ) | (2,645 | ) | ||||||
Africa Banking discontinued operation | 189 | 302 | 334 | |||||||||
| ||||||||||||
Barclays Group | 1,751 | (324 | ) | (120 | ) | |||||||
| 2016 | 2015 | 2014 | ||||||||||
Average allocated equitya | £bn | £bn | £bn | |||||||||
| ||||||||||||
Barclays UK | 13.4 | 13.7 | 13.1 | |||||||||
Corporate and Investment Bank | 23.2 | 23.1 | 23.1 | |||||||||
Consumer, Cards and Payments | 5.0 | 4.0 | 4.0 | |||||||||
| ||||||||||||
Barclays International | 28.2 | 27.1 | 27.1 | |||||||||
Head Officeb | 8.0 | 3.9 | (1.3 | ) | ||||||||
| ||||||||||||
Barclays Core | 49.6 | 44.7 | 38.9 | |||||||||
Barclays Non-Core | 7.8 | 11.2 | 16.0 | |||||||||
| ||||||||||||
Barclays Group | 57.4 | 55.9 | 54.9 | |||||||||
| 2016 | 2015 | 2014 | ||||||||||
Return on average allocated equityc | % | % | % | |||||||||
| ||||||||||||
Barclays UK | 6.4% | (0.2% | ) | 6.6% | ||||||||
Corporate and Investment Bank | 5.8% | 5.1% | 1.8% | |||||||||
Consumer, Cards and Payments | 23.1% | 15.3% | 13.2% | |||||||||
Barclays International | 8.8% | 6.6% | 3.5% | |||||||||
| ||||||||||||
Barclays Core | 7.0% | 4.0% | 5.6% | |||||||||
| ||||||||||||
Barclays Group | 3.0% | (0.6% | ) | (0.2% | ) | |||||||
Notes
| a | This table shows the allocation of Group average equity across IFRS and non-IFRS reporting segments |
| b | Includes the African Banking discontinued operation |
| c | This table shows return on average equity for the Group and the return on average allocated equity for the IFRS and non-IFRS reporting segments |
x
Governance
| Our corporate governance processes and the role they play in supporting the delivery of our strategy, including reports from the Chairman and each of the Board Committee Chairmen. |
Directors’ report | Page | |||
| UK Corporate Governance | § Index to disclosures | 2 | ||
| Code | ||||
| Who we are | § Board of Directors | 3 | ||
| § Group Executive Committee | 5 | |||
§ Board diversity
| 5
| |||
| What we did in 2016 | § Chairman’s introduction | 6 | ||
| § Board Audit Committee report | 10 | |||
| § Board Risk Committee report | 20 | |||
| § Board Reputation Committee report | 25 | |||
§ Board Nominations Committee report
| 29
| |||
How we comply
| 36
| |||
Other statutory information
| 51
| |||
People
| 47 | |||
Remuneration report | 43 | |||

| Barclays PLC and Barclays Bank PLC 2016 Annual Report on Form 20-F | 1 |
Governance: Directors’ report
UK Corporate Governance Code - index to disclosures
 The purpose of corporate governance is to facilitate effective, entrepreneurial and prudent management that can deliver the long-term success of the company.
The UK Corporate Governance Code
The UK Corporate Governance Code (the Code) is not a rigid set of rules. It consists of principles (main and supporting) and provisions. The Listing Rules require companies to apply the main principles and report to shareholders on how they have done so. You can find our disclosures as follows:
| Page | ||||||||
| ||||||||
| Leadership | Every company should be headed by an effective board which is collectively responsible for the long-term success of the company. | Board of Directors | | 3 to 4 39 | ||||
| ||||||||
| There should be a clear division of responsibilities at the head of the company between the running of the board and the executive responsibility for the running of the company’s business. No one individual should have unfettered powers of decision. | Roles on the Board | 37 | ||||||
| ||||||||
| The chairman is responsible for leadership of the board and ensuring its effectiveness on all aspects of its role. | Roles on the Board | 37 | ||||||
| ||||||||
| As part of their role as members of a unitary board,non-executive directors should constructively challenge and help develop proposals on strategy. | Roles on the Board | 37 | ||||||
| ||||||||
| Effectiveness | The board and its committees should have the appropriate balance of skills, experience, independence and knowledge of the company to enable them to discharge their respective duties and responsibilities effectively. | Board of Directors | 3 to 4 | |||||
| ||||||||
| There should be a formal, rigorous and transparent procedure for the appointment of new directors to the board. | Appointment and re-election of Directors | 32 | ||||||
| ||||||||
| All directors should be able to allocate sufficient time to the company to discharge their responsibilities effectively. | Attendance time commitment | | 38 39 |
| ||||
| ||||||||
| All directors should receive an induction on joining the board and should regularly update and refresh their skills and knowledge. | Induction, training and development | 39 | ||||||
| ||||||||
| The board should be supplied in a timely manner with information in a form and of a quality appropriate to enable it to discharge its duties. | Information provided to the Board | 40 | ||||||
| ||||||||
| The board should undertake a formal and rigorous annual evaluation of its own performance and that of its committees and individual directors. | Review of Board and Board Committee effectiveness | 33 | ||||||
| ||||||||
| All directors should be submitted forre-election at regular intervals, subject to continued satisfactory performance. | Roles on the Board | | 37 32 |
| ||||
| ||||||||
| Accountability | The board should present a fair, balanced and understandable assessment of the company’s position and prospects. | Risk management going concern | | 97 to 114 32 |
| |||
| ||||||||
| The board is responsible for determining the nature and extent of the principal risks it is willing to take in achieving its strategic objectives. The board should maintain sound risk management and internal control systems. | Risk management and internal control | 40 to 41 | ||||||
| ||||||||
| The board should establish formal and transparent arrangements for considering how they should apply the corporate reporting, risk management and internal control principles, and for maintaining an appropriate relationship with the company’s auditors. | Board Audit Committee report | 10 to 19 | ||||||
| ||||||||
| Remuneration | Executive directors’ remuneration should be designed to promote the long-term success of the company. Performance-related elements should be transparent, stretching and rigorously applied. | Remuneration report | 51 to 85 | |||||
| ||||||||
| There should be a formal and transparent procedure for developing policy on executive remuneration and for fixing the remuneration packages of individual directors. No director should be involved in deciding his or her own remuneration. | Remuneration report | 51 to 85 | ||||||
| ||||||||
Relations with shareholders
| There should be a dialogue with shareholders based on the mutual understanding of objectives. The board as a whole has responsibility for ensuring that a satisfactory dialogue with shareholders takes place. | Stakeholder engagement | 41 to 42 | |||||
| ||||||||
| The board should use general meetings to communicate with investors and to encourage their participation. | Stakeholder engagement | 41 to 42 | ||||||
| ||||||||
| 2 | Barclays PLC and Barclays Bank PLC 2016 Annual Report on Form 20-F |
Governance: Directors’ report
Who we are
Board of Directors
Board of Directors
| ||||
Barclays understands the importance of having a Board containing the right balance of skills, experience and diversity and the composition of the Board is regularly reviewed by the Board Nominations Committee. The skills and experience of the current Directors and the value they bring to the Barclays Board is described below.
| ||||
 | Full biographies can be accessed online via home.barclays/investorrelations
| |||
John McFarlane Chairman
Appointed: 1 January 2015
|
Relevant skills and experience John is a senior figure in global banking and financial services circles and is in his 42nd year in the sector, including 22 years as a main board director, 10 years as a CEO and six years as a chairman. John is Chairman of Barclays PLC and Barclays Bank PLC. He is also anon-executive director of Westfield Corporation and Old Oak Holdings Limited. He is chairman of TheCityUK and a member of the Financial Services Trade and Investment Board and the European Financial Round Table. John was formerly chairman of Aviva plc, where he oversaw a transformation of the company and for a brief period he was also chairman of FirstGroup plc. He was also anon-executive director of The Royal Bank of Scotland plc, joining at the time of the UK government rescue. Prior to that for 10 years he was chief executive officer of Australia and New Zealand Banking Group Ltd, Group Executive Director of Standard Chartered plc and head of Citibank in the UK.
Other current appointments None
Committees Nom*
| |||
Jes Staley Group Chief Executive
Appointed: 1 December 2015
|
Relevant skills and experience Jes joined Barclays as Group Chief Executive on 1 December 2015. He has nearly four decades of extensive experience in banking and financial services. He worked for more than 30 years at J P Morgan, initially training as a commercial banker, later advancing to the leadership of major businesses involving equities, private banking and asset management and ultimately heading the company’s Global Investment Bank. Most recently, Jes served as Managing Partner at BlueMountain Capital. These roles have provided him with a vast experience in leadership and he brings a wealth of investment banking knowledge to Barclays’ Board.
Other current appointments None
Committees None
| |||
Sir Gerry Grimstone Deputy Chairman and Senior Independent Director
Appointed: 1 January 2016
|
Relevant skills and experience Sir Gerry brings to the Board a wealth of investment banking, financial services and commercial experience gained through his senior roles at Schroders and his various board positions. Sir Gerry has global business experience across the UK, Asia, the Middle East and the US. Sir Gerry has significant experience as anon-executive director and chairman. He is currently the chairman of Standard Life plc, independentnon-executive board member of Deloitte LLP and the leadnon-executive at the Ministry of Defence.
Other current appointments Financial Services Trade and Investment Board
Committees Nom, Rep*
|


Mike Ashley Non-executive
Appointed: 18 September 2013
|
Relevant skills and experience Mike has deep knowledge of auditing and associated regulatory issues, having worked at KPMG for over 20 years, where he was a partner. Mike was the lead engagement partner on the audits of large financial services groups including HSBC, Standard Chartered and the Bank of England. While at KPMG, Mike was Head of Quality and Risk Management for KPMG Europe LLP, responsible for the management of professional risks and quality control. He also held the role of KPMG UK’s Ethics Partner.
Other current appointments ICAEW Ethics Standards Committee; Chairman, Government Internal Audit Agency; Charity Commission
Committees Aud*, Nom, Ris, Rep
| |||
Tim Breedon Non-executive
Appointed: 1 November 2012
|
Relevant skills and experience Tim joined Barclays after a distinguished career with Legal & General, where, among other roles, he was the group chief executive until June 2012. Tim’s experience as a CEO enables him to provide challenge, advice and support to the Executive on performance and decision-making.
Tim brings to the Board extensive financial services experience, knowledge of risk management and UK and EU regulation, as well as an understanding of the key issues for investors.
Other current appointments Marie Curie Cancer Care; Chairman, Apax Global Alpha Limited; Chairman, The Northview Group
Committees Aud, Nom, Rem, Ris*
| |||
Mary Francis CBE Non-executive
Appointed: 1 October 2016
|
Relevant skills and experience Mary has extensive board-level experience across a range of industries. She is a non-executive Director of Swiss Re Group and Ensco plc and was formerly Senior Independent director of Centrica and a non-executive director of the Bank of England, Aviva and Alliance and Leicester. She held senior executive positions in the UK Treasury and Prime Minister’s Office and in the City as Director General of the Association of British Insurers. She brings to Barclays strong understanding of the interaction between public and private sectors and skills in strategic decision-making and all aspects of board governance.
Other current appointments Advisory Panel of The Institute of Business Ethics
Committees Rem, Rep
| |||
Crawford Gillies Non-executive
Appointed: 1 May 2014
|
Relevant skills and experience Crawford has extensive business and management experience, gained with Bain & Company and Standard Life plc. These roles have provided him with experience in strategic decision-making and knowledge of company strategy across various sectors and geographical locations.
Crawford has also held board and committee chairman positions during his career, notably as chairman of the remuneration committees of Standard Life plc and MITIE Group PLC.
Other current appointments SSE plc; Control Risks International; The Edrington Group Limited
Committees Aud, Nom, Rem*
|


| Barclays PLC and Barclays Bank PLC 2016 Annual Report on Form 20-F | 3 |
Governance: Directors’ report
Who we are
Board of Directors
Reuben Jeffery III Non-executive
Appointed: 16 July 2009
|
Relevant skills and experience Reuben has extensive financial services experience, particularly within investment banking and wealth management, through his role as CEO and president of Rockefeller & Co. Inc. and Rockefeller Financial Services Inc. and his former senior roles with Goldman Sachs, including as the managing partner of the Paris office. His various government roles in the US, including as chairman of the Commodity Futures Trading Commission, provides Barclays’ Board with insight into the US political and regulatory environment.
Other current appointments Advisory Board of Towerbrook Capital Partners LP; Rothschild Capital Management Limited; Financial Services Volunteer Corps; The Asia Foundation
Committees Nom, Ris
| |||
Tushar Morzaria Group Finance Director
Appointed: 15 October 2013
|
Relevant skills and experience Tushar joined Barclays in 2013 having spent the previous four years in senior management roles with JP Morgan Chase, most recently as the CFO of its Corporate & Investment Bank. Throughout his time with JP Morgan he gained strategic financial management and regulatory relations experience. Since joining the Barclays Board he has been a driving influence on the Group’s cost reduction programme and managing the Group’s capital plan, particularly in response to Structural Reform.
Other current appointments Member of the 100 Group main committee
Committees None
| |||
Dambisa Moyo Non-executive
Appointed: 1 May 2010
|
Relevant skills and experience Dambisa is an international economist and commentator on the global economy, having completed a PhD in economics. Dambisa has a background in financial services and a wide knowledge and understanding of African economic, political and social issues, in addition to her experience as a director of companies with complex, global operations. She served as anon-executive director of SABMiller Plc from 2009-2016.
Other current appointments Chevron Corporation; Barrick Gold Corporation; Seagate Technology plc
Committees Rem, Rep
| |||
Diane de Saint Victor Non-executive
Appointed: 1 March 2013
|
Relevant skills and experience Diane holds the role of general counsel and company secretary of ABB Limited, a listed pioneering technology leader in electrification products, robotics and motion, industrial automation and power grids. Diane’s legal background, combined with her knowledge of regulatory and compliance requirements bring a unique perspective to discussions of the Board and its committees.
Other current appointments American Chamber of Commerce in France
Committees Rep |


Diane Schueneman Non-executive
Appointed: 25 June 2015 |
Relevant skills and experience Diane joined Barclays after an extensive career at Merrill Lynch, holding a variety of senior roles, including responsibility for banking, brokerage services and technology provided to the company’s retail and middle market clients, and latterly for IT, operations and client services worldwide. She brings a wealth of experience in managing global, cross-discipline business operations, client services and technology in the financial services industry. Diane is a member of the board of Barclays US LLC, Barclays US intermediate holding company.
Other current appointments None
Committees Aud, Ris
| |||
Steve Thieke Non-executive
Appointed: 7 January 2014 |
Relevant skills and experience Steve has significant experience in financial services, in both investment banking with J P Morgan, where among other roles he served as the chairman of the risk management committee, and in regulation, through roles with the Federal Reserve Bank of New York and the Financial Services Authority. He also has significant board experience, having served in both executive andnon-executive director roles in his career. Steve is chairman of the board of Barclays US LLC.
Other current appointments None
Committees Ris
| |||
| Company Secretary | ||||
Claire Davies
Appointed: 1 December 2016
|
Relevant skills and experience Claire is a solicitor and a Fellow of the Institute of Chartered Secretaries and Administrators. She has substantial experience in legal, compliance and company secretarial roles gainedin-house and in professional services. She was appointed Barclays Group Company Secretary with effect from 1 December 2016, a role she has previously held at Legal & General plc and Lloyds Banking Group plc. More recently, she was Society Secretary at theCo-operative Group. She is anon-executive member of the audit and risk committee of the Department for Business, Energy & Industrial Strategy. | |||


Note
The composition of the board is shown as at 22 February 2017.
| Committee membership key | ||
| Aud | Board Audit Committee | |
| Nom | Board Nominations Committee | |
| Rem | Board Remuneration Committee | |
| Rep | Board Reputation Committee | |
| Ris | Board Risk Committee | |
| * | Committee Chairman | |
| 4 | Barclays PLC and Barclays Bank PLC 2016 Annual Report on Form 20-F |
Who we are
Group Executive Committee
Group Executive Committee
| ||||
| Biographies for Jes Staley, Group Chief Executive, and Tushar Morzaria, Group Finance Director, who are members of the Group Executive Committee, which is chaired by Jes Staley, can be found on pages 3 and 4.
| |||

| ||||||||
|
|
| ||||||||||
Paul Compton Group Chief Operating Officer
| Bob Hoyt Group General Counsel
| Tristram Roberts Group Human Resources Director
| ||||||||||
| ||||||||||||
 |
|
| ||||||||||
Mike Roemer Group Head of Compliance |
Amer Sajed CEO, Barclaycard International |
Tim Throsby President, Barclays International and Chief Executive Officer, Corporate and Investment Bank
| ||||||||||
| ||||||||||||
|
| |||||||||||
Ashok Vaswani |
CS Venkatakrishnan | |||||||||||
| CEO, Barclays UK | Chief Risk Officer | |||||||||||
| ||||||||||||
Group Executive Committee meetings are also attended on a regular basis by the Chief Internal Auditor, Sally Clark, and by anex-officio member, drawn from senior management. The currentex-officio member is Kathryn McLeland, Head of Investor Relations. | ||||||||||||


Board diversity
The Board has a balanced and diverse range of skills and experience. All Board appointments are made on merit, in the context of the diversity of skills, experience, background and gender required to be effective.
| Balance ofnon-executive Directors: executive Directors | ||||||||||
| ||||||||||
|
1 |
Chairman |
|
1 |
| |||||
| 2 | Executive Directors | 2 | ||||||||
| 3 | Non-executive Directors
| 10 | ||||||||
| ||||||||||

| Gender balance | ||||
| ||||
| Male: Female | 9:4 | |||
| ||||
| Length of tenure | ||||
| (Chairman andnon-executive Directors) | ||||
| ||||
0-3 years |
6
|
| ||
| ||||
3-6 years |
3
|
| ||
| ||||
6-9 years |
2
|
| ||
| ||||
| Geographical mix | ||||
| (Chairman andnon-executive Directors) | ||||
| ||||
UK |
6
|
| ||
| ||||
| US | 3
|  | ||
| ||||
Continental Europe | 1
|
| ||
| ||||
Other |
1
|
| ||
| ||||


Industry/background experience (Chairman andnon-executive Directors)a | ||||
| ||||
| Financial Services | 10 (91%) | |||
| Political/regulatory contacts | 11 (100%) | |||
| Current/recent Chair/CEO | 3 (27%) | |||
| Accountancy/financial | 1 (9%) | |||
| International (US) | 3 (27%) | |||
| International (Europe) | 1 (9%) | |||
| International (Rest of the World) | 3 (27%) | |||
Operations and Technology
|
| 1 (9%)
|
| |
| ||||
Note
| a | Individual Directors may fall into one or more categories |
| Barclays PLC and Barclays Bank PLC 2016 Annual Report on Form 20-F | 5 |
Governance: Directors’ report
What we did in 2016
Chairman’s introduction

Strong and effective governance… benefits companies and the UK economy more generally, by instilling public confidence and respect for the corporate sector, making the UK an attractive place to do business.
Dear Fellow Shareholders
Welcome to my 2016 corporate governance report. When I think about corporate governance, I inevitably focus on how strong and effective governance acts to provide the necessary checks and balances at the very top of companies, thus supporting better decision-making and accountability. In turn, this benefits companies and the UK economy more generally, by instilling public confidence and respect for the corporate sector and making the UK an attractive place to do business, something that has grown in importance post the EU Referendum. As a bank, gaining this confidence and respect is paramount. Our business is founded on and operates on trust – the trust of our customers and clients, our employees and the wider public. Strong and effective corporate governance has a vital role in ensuring that we earn and keep that trust.
What is the role of the Board?
I firmly believe that the role of the Board is to focus on long-term, sustainable value creation. At the heart of our strategy, which we announced in March 2016, is building on our strength as a transatlantic consumer, corporate and investment bank, with global reach. To this end, the Board has provided critical oversight of executive management in developing and delivering this strategy, creating a smaller, simplified bank capable of producing high quality returns for our shareholders on a sustainable basis.
What were the Board’s key areas of focus in 2016?
During 2016, the Board focused its activity to support management in delivery of the agreed strategy. A summary of key items considered by the Board can be found pages 8 to 9. The main areas of Board activity have been on ensuring that we have strong foundations in place by focusing on the performance of our Core businesses, and on completing the restructuring of Barclays by accelerating therun-down of theNon-Core businesses. We also took the difficult, but important, decision to sell-down our holding in Barclays Africa. Progress in these areas is enabling us to build the Barclays of the future. As part of ensuring we are well-positioned, and to meet regulatory requirements, we have aligned our business more closely with our legal entity structure and geographic locations. You can read more about the Board’s role in preparing Barclays for Structural Reform in the case study on page 9. We also had to deal with the impacts of the UK’s vote to leave the EU and held a special meeting in the days following the EU Referendum result to assess the position for Barclays. You can read more about how we prepared for the EU Referendum in the case study on page 24.
How effective is the Board?
Effective delivery of long-term, sustainable value for shareholders requires an effective Board. It is an important part of my role as Chairman to satisfy myself that the Board – both collectively and its individual members – operates effectively. Each year, we conduct a self-assessment of our performance, with the aid of an independent facilitator, and you can read a report on the outcomes of the 2016 self-assessment on pages 34 to 35. We also describe the actions we took during 2016 in response to any matters identified for improvement during the 2015 self-assessment. I hope this provides a flavour of how seriously the Board regards this important exercise.
The working relationship between the Board and executive management is, of course, critical to the effectiveness of the Board and I am pleased to report that we enjoy a healthy, constructive relationship, with an appropriate level of creative tension that helps drive productive discussions in the boardroom.
| 6 | Barclays PLC and Barclays Bank PLC 2016 Annual Report on Form 20-F |
How did the Board change in 2016?
To be effective, the Board needs the right people and, in particular, it needs to have the right balance and diversity of skills, experience and perspectives. It is important that the composition of the Board brings to bear a broad range of social perspectives and talent on decision-making and that the Board is able to connect with the demographics of Barclays’ customers and clients and employees. We have a healthynon-executive presence on the Board, which was strengthened further during 2016 with the appointments of Sir Gerry Grimstone as Deputy Chairman and Senior Independent Director and Mary Francis as anon-executive Director. Both are highly-experiencednon-executive Directors and add to the depth of experience and talent on the Board. During 2016, Wendy Lucas-Bull and Frits van Paasschen, bothnon-executive Directors, left the Board and I thank them on behalf of the Board for their service.
In early 2016, we set ourselves a new Board diversity target, which is to have 33% women on the Board by 2020. We currently have 31% women on the Board and are pleased with the progress we are making towards our target. Of course, diversity is not just about gender and although we have not set any other Board diversity targets, such as ethnicity, when it discusses and assesses Board composition and prospective candidates the Board Nominations Committee considers a number of factors before making its recommendations. Ultimately, maintaining the overall effectiveness of the Board is paramount and we maintain the position that all appointments to the Board are made on merit. More information on the Board appointments process can be found on page 32.
How does the Board ensure that high standards of business conduct are maintained?
There can be no argument that to be successful and to create long-term, sustainable value, we must maintain consumer and market trust and confidence. We need to act with transparency and integrity in every interaction we have with all of our stakeholders and this behaviour is integral to the way in which we operate. This is why as a Board we have continued to wholeheartedly support Barclays’ shared purpose and common values.The Barclays Way, which is endorsed by me, as Chairman, outlines the purpose and values that govern our way of working across our businesses globally. Of course, the challenge we have, in a large organisation such as Barclays, is to ensure that all employees do the right thing day in, day out. To address this challenge, all employees continue to be required to undertake training onThe Barclays Way annually, with the Board Reputation Committee tracking completion rates. Additionally, the Board Reputation Committee hears directly from the senior management in each business on how they are addressing any conduct and cultural matters specific to that business, thus holding senior management to account for the values and behaviours in their business. You can read more about the work of the Board Reputation Committee on pages 25 to 28.
How does the Board take account of Barclays’ wider stakeholders?
I’ve referred a number of times to the Board’s role in creating and delivering shareholder value in a long-term, sustainable way. This can only be achieved by being acutely alive to the impact that our business decisions might have on our customers, clients, employees and others and by fully understanding and appreciating the wider societal obligations that we have. These issues are important for the Board and the Board Reputation Committee fulfils a vital role on behalf of the Board by monitoring key indicators across the areas of conduct, culture, citizenship and customer complaints. This includes, for example, assessing not only the volumes of customer complaints that we receive, but also the way in which they are handled. It covers assessing the results from regular employee opinion surveys and the actions being taken to address any common issues or themes that arise across the business. It also includes oversight of the delivery of our citizenship strategy, theShared Growth Ambition, where our long-term aim is to create and grow a collection of products, services and partnerships that improve the lives of people in the communities that we serve. All of this activity can and does support the Board’s over-arching objective of delivering sustainable returns for our shareholders.
| You can read more about theShared Growth Ambition at home.barclays/citizenship |
Looking ahead
I expect 2017 to be a pivotal year for Barclays in the delivery of its strategy; a year when we will complete our restructuring and establish ourselves as a bank that is recognised for financial strength, financial transparency, operational stability, underpinned by a values-driven culture. We are incredibly focused and working hard as your Board to engender respect and trust for our Company and the profession of banking, in order to support our customers and clients, to contribute to the UK’s reputation as a place to do business and to deliver long-term value to shareholders.
|
John McFarlane |
| Chairman |
| 22 February 2017 |

| Barclays PLC and Barclays Bank PLC 2016 Annual Report on Form 20-F | 7 |
Governance: Directors’ report
Board activity in 2016
During 2016 the Board focused on a number of specific areas, outlined in the table below, in line with Barclays three strategic goals and five principal risks:
Strategic goals
 | Have strong foundations in place |
 | Accelerate the completion of restructuring |
 | Build the Barclays of the future |
Principal risks
 | Credit |
 | Market |
 | Funding |
 | Operational |
 | Conduct |
Board allocation of time (%) |
| |||||||||||||||
| ||||||||||||||||
| 2016 | 2015 | |||||||||||||||
| ||||||||||||||||
|
|
1 |
|
Strategy formulation and implementation monitoring |
|
55 |
|
|
56 |
| ||||||
| 2 | Finance (incl. capital and liquidity) | 17 | 11 | |||||||||||||
| 3 | Governance and Risk (incl. regulatory issues) | 26 | 29 | |||||||||||||
| 4 | Other (incl. compensation) | 2 | 4 | |||||||||||||
| �� | ||||||||||||||||

| Strategic Goal | Principal Risks | |||
Strategy formulation and monitoring
| ||||
§ Debated the potential impact of the EU Referendum and the contingency plans being developed. Following the result of the Referendum, discussed and assessed the implications for the UK, the banking sector and for Barclays, including a presentation from a third party on the political aspects and their potential implications | | | ||
§ Regularly debated and monitored the progress of Barclays preparations for Structural Reform – see the case study on page 9 for further details | | | ||
§ Reflected on the position of Barclays Africa in the Barclays Group and its impact on Barclays’ capital position, deciding to sell-down Barclays’ holding to a position where Barclays Africa accounting and regulatoryde-consolidation could be achieved | | | ||
§ Assessed the progress of strategy execution in each of Barclays UK, Barclays International’s investment bank and corporate business and the Cards business, via presentations from the heads of each business | | | ||
§ Monitored the progress of therun-down of BarclaysNon-Core via regular presentations from the heads of theNon-Core business | | | ||
§ Discussed regular updates from the Group Chief Executive on the progress being made against the Group’s execution priorities and received insights on stakeholder issues (including those arising from customers and clients, employees, regulators and governments) and cultural matters, including results from employee opinion surveys | | | ||
§ Debated and provided input to management on the formulation of overall Group strategy, including | | | ||
– the impact of structural change and the creation of new subsidiary legal entities in the Group | ||||
– the progress of the sell-down of Barclays Africa, including potential options, costs of separation, potential conduct risks and customer impacts | ||||
– the impact of the EU Referendum result, taking into account an assessment of possible political scenarios and the potential impacts on each of Barclays businesses in terms of capital, operations, economics, regulation, clients and customers | ||||
– a strategic approach to costs optimisation | ||||
– constraints and risks to strategy execution, covering economic assumptions; expected regulatory requirements on capital and solvency ratios at Group and subsidiary legal entity level; anticipated changes to accounting rules; investor expectations; and potential impacts for clients and customers | ||||
– potential growth opportunities, covering an assessment of the competitive landscape for Barclays UK, Barclays International and the Cards business; key trends and risks for each business in terms of economics, regulation, customers, employees and technology; near-term focus areas and potential transformational opportunities | ||||
Finance, including capital and liquidity
| ||||
§ Debated and approved the Group’s Medium Term Plan for 2016-2018 and short-term plan for 2016, with a focus on producing increased returns in future | | | ||
§ Regularly assessed financial performance of the Group and its main businesses via reports from the Group Finance Director | | | ||
§ Reviewed and approved Barclays’ financial results prior to publication, including approving final and interim dividends | | | ||
§ Discussed market and investor reaction to Barclays’ strategic and financial results announcements, with insights provided by the Head of Investor Relations | | | ||
§ Provided input, guidance and advice to senior management on the high-level shape of Barclays 2017-2019 Medium Term Plan and subsequently approved the final plan | | |
| 8 | Barclays PLC and Barclays Bank PLC 2016 Annual Report on Form 20-F |
| Strategic Goal | Principal Risks | |||
Governance and risk, including regulatory issues
| ||||
§ Debated and approved 2016 risk appetite for the Barclays Group | | | ||
§ Regularly assessed Barclays overall risk profile and emerging risk themes, hearing directly from the Chief Risk Officer and the Chairman of the Board Risk Committee | | | ||
§ Evaluated Barclays operational and technology capability, including specific updates on cyber-risk capability and the strategy for infrastructure services. Approved Barclays International’s investment bank’s IT and Data Global Strategy | | | ||
§ Approved the Group’s 2016 Recovery Plan and US Resolution Plan | | | ||
§ Held specific meetings with representatives of Barclays’ UK and US regulators to hear first-hand about regulatory expectations and their specific views on Barclays | | | ||
§ Evaluated the status of Barclays’ risk and control environment and the plans in place to enhance the risk and control framework and approved a revised Enterprise Risk Management Framework (ERMF) | | | ||
§ Considered regular updates from the Group General Counsel on the legal risks facing Barclays | | | ||
§ Heard regularly from the chairmen of the Board’s principal Board Committees on the matters discussed at Board Committee meetings | | | ||
§ Received updates from the chairman of Barclays US IHC on matters discussed at its board meetings | | | ||
§ Heard directly from representatives of the Banking Standards Board on its assessment of the culture in Barclays and the banking sector as a whole | | | ||
Other, including compensation
| ||||
§ Reviewed Barclays’ Talent Management strategy and the process for succession planning for key executive positions, hearing directly from the Group HR Director and the Chairman of the Board Nominations Committee | | | ||
§ Received and debated a presentation from the independent facilitator of the 2016 Board effectiveness review on the outcomes and potential areas of focus for improvement | | |
The above analysis reflects the ERMF that was in place during 2016.
Governance in Action – Preparing for Structural Reform
| ||||||
Law and regulation in the UK, and associated regulatory rules, require Barclays to separate its retail banking operations into a separate, independent legal entity (known as ‘ring-fencing’). Barclays has an internal Structural Reform Programme in place to implement these required changes in the UK. A new UK banking entity is being established as thering-fenced bank (Barclays UK) and will serve retail and small business customers, as well as UK wealth and credit card customers. Barclays International will continue to serve corporate, institutional and investment banking clients and will also serve international wealth and credit card customers. A Group Service Company will be established to support the revised operating entity structure.
These structural changes will have a material impact on the way in which Barclays operates in future. Consequently, the progress of the Structural Reform Programme featured heavily on the Board’s agenda during 2016, given the scale of change required and the potential material risks associated with transitioning to the new structure and with the new structure itself. The Board evaluated progress of the Structural Reform Programme at seven of the eight Board meetings held during 2016, including specifically evaluating the impact of structural change as part of the annual Group strategy Board meeting. Specific matters addressed by the Board included:
§ structural Reform design and implementation plans, including evaluating any identified risks and challenges; considering regulatory feedback on the plans and the status of actions arising from regulatory engagement; and agreeing the internal accountability framework
§ assessing the progress being made with establishing the new legal entity for Barclays UK, including any necessary regulatory licencing requirements and preparations for the ring-fence transfer scheme
§ monitoring the creation of the Group Service Company, including assessing its design, its board governance structure, its control and oversight framework and the execution milestones to be achieved
| § debating the potential implications of Structural Reform on Barclays’ pension scheme, both in terms of the potential impact on Barclays and on pension scheme members
§ conducting an assessment of the overall conduct risk considerations associated with Structural Reform, focusing on the potential impacts for clients and customers
§ evaluating the work being conducted to address sort-code migration, covering technology planning and implementation and customer impact considerations.
Separately, during 2016, Barclays’ US businesses were organised under an Intermediate Holding Company (IHC) in order to meet US legal requirements. The IHC became operational from 1 July 2016. The Board was regularly updated on progress of implementation, any risks and challenges and how they were being managed.
Board Committees have supported the Board in overseeing the implementation of Structural Reform on matters that fall directly within their remit. For example, the Board Nominations Committee determined the proposed composition of the boards of the new operating entities and is in the process of identifying and evaluating proposed candidates for appointment to those boards. It also discussed and endorsed a set of Governance Guiding Principles, which will govern the relationship between the parent company and its new operating entities. The Board Risk Committee spends time at each meeting assessing the prospective capital and liquidity impacts of Structural Reform, while the Board Audit Committee has evaluated the potential accounting implications. More information can be found in the individual Board Committee reports on the pages that follow. |
| Barclays PLC and Barclays Bank PLC 2016 Annual Report on Form 20-F | 9 |
Governance: Directors’ report
What we did in 2016
Board Audit Committee report
|
Dear Fellow Shareholders My report to you last year highlighted the significant degree of change that Barclays was facing, driven by its own strategic aims and by the demands of Structural Reform. Change has continued apace and it has been critical for the Committee to focus on ensuring the commitment to strengthening the control environment is maintained throughout this transformational period. Barclays has during 2016 put in place a significantly changed senior management team and my Committee colleagues and I are greatly encouraged by the renewed focus and vigour with which the control environment is being addressed and the sense of personal accountability that we are seeing. A significant development in the fourth quarter of 2016 was the creation of a chief controls office and the appointment of a Chief Controls Officer, which will drive forward the delivery of an enhanced programme designed to strengthen the control environment and remediate any known issues. Although the new controls office structure is in its infancy, I welcome the more strategic approach that is now being taken to embed accountability for a strong control environment into the first line of management. Such is the importance of this programme to Barclays that, for its initial phase, progress on the framework will be reported directly to the full Board. In assessing control issues for disclosure in the Annual Report, the Committee has continued to apply similar definitions to those used for assessing internal financial controls for the purposes of Sarbanes-Oxley. The conclusion we have reached is that there are no control issues that are considered to be a material weakness, which merit specific disclosure. Further details may be found in the Risk Management and Internal Control section on page 40.
Our busy agenda in 2016 continued to include our responsibilities for overseeing the performance and effectiveness of internal and external audit, the main independent assurance mechanisms that serve to protect shareholders’ interests. The Committee also continued to exercise its responsibilities for ensuring the integrity of Barclays’ published financial information by debating and challenging the judgements made by management and the assumptions and estimates on which they are based. The exercise of appropriate judgement in preparing the financial statements is critical in ensuring that Barclays reports to its shareholders in a fair, balanced and transparent way. The report that follows sets out details of the material matters considered by the Committee since my last report.
A significant change that the Committee has been overseeing is the transition to KPMG as Barclays’ statutory auditor, following the audit tender concluded in 2015. I met regularly with the PwC lead audit partner and his KPMG successor during 2016. KPMG has been shadowing the current auditor, PwC, during the 2016year-end audit and the Committee is already seeing some value from the new perspective provided by KPMG on accounting estimates and policies. You can read more about auditor transition in the case study on page 19.
The introduction in March 2016 of the UK’s Senior Managers Regime allocated to me specific prescribed responsibilities for safeguarding the independence of and overseeing the performance of the internal audit function, including the performance of the Chief Internal Auditor, in line with regulatory requirements. In practice, little has changed in the way in which I fulfil my responsibilities: I continue to hold regular meetings with the Chief Internal Auditor and members of her senior management team to ensure I am aware of current work programmes and any emerging issues and I also agree the Chief Internal Auditor’s objectives and the outcomes of her performance assessment. During 2016, the PRA undertook a review of Barclays Internal Audit (BIA) and made a number of recommendations to increase its effectiveness and the Committee’s monitoring thereof. An action plan has been developed to address these recommendations. The Committee also held a networking event with BIA during 2016, enabling Committee members to meet less formally with senior members of the BIA team.
|

 Change has continued apace and it has been critical to focus on ensuring that the commitment to strengthening the control environment is maintained throughout this transformational period.
| 10 | Barclays PLC and Barclays Bank PLC 2016 Annual Report on Form 20-F |
An additional responsibility I have assumed under the Senior Managers Regime is that of Whistleblower’s Champion, a position required by the FCA to be held at Board level. As champion, I have specific responsibility for the integrity, independence and effectiveness of the Barclays’ policies and procedures on whistleblowing, including the procedures for protecting employees who raise concerns from detrimental treatment. During 2016, I recorded a video message to all employees Group-wide, highlighting my role as Whistleblower’s Champion and raising awareness of the policies and procedures we have in place.
I continued to work closely with my fellow Board Committee chairmen during 2016, particularly with the Board Risk Committee chairman on the question of operational risk issues, which each Committee has a role in overseeing. I attended meetings of the IHC audit committee to gain a first-hand insight into the issues being addressed by that committee and have invited its chairman to attend a Committee meeting in early 2017 by way of reciprocating. I met frequently with other members of senior management, including the Group Finance Director, and continued my engagement with Barclays’ regulators both in the UK and US.
Committee performance
The Committee’s performance during 2016 was assessed as part of the independently facilitated annual Board effectiveness review. The conclusion of my Board colleagues was that the Committee is regarded as thorough and the Board takes assurance from the quality of the Committee’s work. The main area identified for improvement was to ensure that the Committee continues to strike an appropriate balance between covering issues in appropriate detail and taking a strategic approach to its oversight and supervision of management. The review also commented on the need to strengthen the depth of financial and accounting expertise on the Committee via new appointments, which is a matter that was already under consideration during 2016, and the need to ensure that the way in which the Committee works with the Board Reputation and Board Risk Committees continues to capture all significant issues effectively while minimising any overlap. I will be seeking to address each of these areas over the coming year. You can read more about the outcomes of the Board effectiveness review on pages 33 to 35.
Looking ahead
The Committee is looking forward to working with both the new Chief Controls Officer and with the new auditor, KPMG, during 2017. In addition to overseeing management’s progress on enhancing the control environment, the Committee will be focusing on some significant accounting issues, including the Group’s preparedness for the implementation of IFRS9 and the accounting implications of Structural Reform. We will also be closely monitoring the implementation of the action plan to address the recommendations arising from the PRA’s review of BIA.

Mike Ashley
Chairman, Board Audit Committee
22 February 2017
Board Audit Committee allocation of time (%) |
| |||||||||||||
| ||||||||||||||
| 2016 | 2015 | |||||||||||||
| ||||||||||||||
|
1 |
Control issues |
|
23 |
|
|
18 |
| ||||||
| 2 | Business control environment | 19 | 16 | |||||||||||
| 3 | Financial results | 36 | 27 | |||||||||||
| 4 | Internal audit matters | 11 | 7 | |||||||||||
| 5 | External audit matters (including, in 2015, external audit tender) | 6 | 26 | |||||||||||
| 6 | Other (including governance and compliance) | 4 | 6 | |||||||||||

Committee composition and meetings
The Committee is composed solely of independentnon-executive Directors, with membership designed to provide the breadth of financial expertise and commercial acumen its needs to fulfil its responsibilities. Its members as a whole have experience of the banking and financial services sector in addition to general management and commercial experience. Diane Schueneman was appointed to the Committee with effect from 18 February 2016, bringing valuable insights into operational and technology risk and controls. Diane de Saint Victor retired from the Committee at the end of May 2016. Mike Ashley is the designated financial expert on the Committee for the purposes of the US Sarbanes-Oxley Act. Although each member of the Committee has financial and/ or financial services experience, the Board has identified that the Committee could be strengthened by the appointment of an additional member with direct accounting and auditing experience. Consideration is being given to further appointments to the Committee in this regard, however, given the impact of Structural Reform, the search for suitable candidates is being addressed in the context of overall Board composition requirements. You can find more details of the experience of Committee members in their biographies on pages 3 and 4.
The Committee met 12 times in 2016 and the chart above shows how it allocated its time. Meetings are generally arranged well in advance and are usually scheduled in line with Barclays’ financial reporting timetable. Two of the meetings were arranged specifically to provide the Committee opportunity to consider particular issues relevant to the financial statements, such as the viability statement and the proposed deadline for PPI claims. Committee meetings were attended by management, including the Group Chief Executive, Group Finance Director, Chief Internal Auditor, Chief Risk Officer, Chief Operating Officer, General Counsel and Head of Compliance, as well as representatives from the businesses and other functions. In future, the Chief Controls Officer will attend meetings on a regular basis. The lead audit partner of the external auditor attended all Committee meetings and the Committee held a number of private sessions with each of the Chief Internal Auditor or the lead auditor partner, which were not attended by management. From 1 July 2016, the lead audit partner of KPMG also attended meetings as part of the statutory auditor transition process. Representatives from the PRA also attended a meeting during 2016.
| Member | Meetings attended/eligible to attend | |||
| Mike Ashley | 12/12 | |||
| Tim Breedon | 12/12 | |||
| Crawford Gillies* | 11/12 | |||
| Diane de Saint Victor (to 31 May 2016) | 8/8 | |||
| Diane Schueneman (from 18 February 2016) | 9/9 |
| * | Did not attend one meeting convened at short notice owing to a prior commitment |
Committee role and responsibilities
The Committee is responsible for:
| § | assessing the integrity of the Group’s financial reporting and satisfying itself that any significant financial judgements made by management are sound |
| § | evaluating the effectiveness of the Group’s internal controls, including internal financial controls |
| § | scrutinising the activities and performance of the internal and external auditors, including monitoring their independence and objectivity. |
 | The Committee’s terms of reference are available athome.barclays/corporategovernance |
| Barclays PLC and Barclays Bank PLC 2016 Annual Report on Form 20-F | 11 |
Governance: Directors’ report
What we did in 2016
Board Audit Committee report
The Committee’s work
The significant matters addressed by the Committee during 2016 and in evaluating Barclays’ 2016 annual report and financial statements, are described on the following pages.
Financial statement reporting issues
The Committee’s main responsibility in relation to Barclays’ financial reporting is to review with both management and the external auditor the appropriateness of Barclays’ financial statements, including quarterly results announcements and half-year and annual financial statements and supporting analyst presentations, with its primary focus being on:
| § | the quality and acceptability of accounting policies and practices |
| § | any correspondence from financial reporting regulators in relation to Barclays’ financial reporting |
| § | material areas where significant judgements have been made, along with any significant assumptions or estimates, or where significant issues have been discussed with or challenged by the external auditor |
| § | an assessment of whether the Annual Report, taken as a whole, is fair, balanced and understandable and provides the information necessary for shareholders to assess Barclays’ position and performance, business model and strategy. |
Accounting policies and practices
The Committee discussed reports from management in relation to the identification of critical accounting judgements and key sources of estimation uncertainty, significant accounting policies and the proposed disclosure of these in the 2016 Annual Report. Following discussions with both management and the external auditor, the Committee approved the critical accounting judgements, significant accounting policies and disclosures, which are set out in note 1, Significant accounting policies, to the consolidated financial statements. There were no significant changes in accounting policy during the period. During 2016, the Committee was regularly updated on Barclays’ preparations for the implementation of IFRS9 (Financial Instruments), which is effective from 1 January 2018, including the key technical decisions and interpretations required and Barclays’ proposed approach for each. The Committee also
considered the accounting implications of Structural Reform and the establishment of the ring-fenced bank. These will continue to be areas of focus in 2017.
Financial reporting regulators and Barclays
During the third quarter of 2016, Barclays received a comment letter from the Corporate Reporting Review Team (CRRT) of the Financial Reporting Council (FRC) in relation to its thematic review of tax disclosures. The comment letter covered the disclosure of uncertain tax provisions in Barclays’ 2015 annual report and financial statements. The CRRT requested and was provided with additional information in respect of Barclays’ disclosure of uncertain tax positions, including an advance copy of Barclays enhanced policy for such disclosure (see page 236), and subsequently confirmed in writing that it had closed its enquiries.*
The Committee from time to time considers comment letters from the SEC in relation to its reviews of Barclays’ annual report and other publicly filed financial statements. Such comment letters and Barclays’ responses are made publicly available by the SEC on its website, www.sec.gov, once it has closed each such review. The Committee sought to ensure that Barclays took due account of the SEC’s views in its external reporting.
Significant judgements and issues
The significant judgements and issues and actions taken by the Committee in relation to the 2016 annual report and financial statements are outlined below. The significant judgements and issues are broadly comparable in nature to prior years. Each of these matters was discussed with the external auditor during the year.
| * | The CRRT’s review was based on Barclays’ annual report and financial statements and did not benefit from detailed knowledge of Barclays’ business or the transactions entered into. The closure of the CRRT’s enquiries provides no assurance that Barclays’ annual report and accounts are correct in all material respects, as the FRC’s role is not to verify information but to ensure compliance with reporting requirements. The FRC accepts no liability for reliance on its closure letter from Barclays or any third party, including but not limited to investors and shareholders. |
Area of focus
|
Reporting issue
|
Role of the Committee
|
Conclusion/action taken
| |||
Conduct provisions (see Note 27 to the financial statements). | Barclays makes certain assumptions and estimates, analysis of which underpins provisions made for the costs of customer redress, such as for Payment Protection Insurance (PPI). | § Regularly analysed the judgements and estimates made with regard to Barclays’ provisioning for PPI claims, taking into account forecasts and assumptions made for PPI complaints and actual claims experience for Barclays and the industry as a whole.
§ Debated the potential impact on the future range of provisions arising from the FCA’s proposed timebar on claims and the expected deadline of June 2019, discussing the levels of uncertainty in the projections.
§ Discussed the potential range of outcomes that might arise from the Plevin case (the 2014 UK Supreme Court ruling in Plevin v Paragon Personal Finance Ltd) and whether any increase in provisions was required.
§ Evaluated proposed additional provisions for PPI and whether the analysis performed by management was consistent with prior periods and reflected known trend data and whether Barclays’ approach was consistent with that taken by industry peers.
§ Assessed provisions for alternative PPI (card protection and payment break plan insurance) and the claims experience compared to the range of reasonable high and low end scenarios that had been determined.
| The Committee and management continue to monitor closely any changes in customer or claims management companies’ behaviour in light of the Plevin case and the proposed FCA timebar. Over the course of 2016, having assessed actual claims experience and the potential impact of the proposed timebar and the Plevin case, the Committee agreed to recognise additional provisions of £1000m in 2016, bringing Barclays’ total cumulative provisions against the cost of PPI redress and associated processing costs to £8.4bn, of which £2.0bn is remaining. |
| 12 | Barclays PLC and Barclays Bank PLC 2016 Annual Report on Form 20-F |
| Area of focus | Reporting issue | Role of the Committee | Conclusion/action taken | |||
Legal, competition and regulatory provisions (see Notes27-29 to the financial statements). | Barclays is engaged in various legal, competition and regulatory matters. The extent of the impact on Barclays of these matters cannot always be predicted, but matters can give rise to provisioning for contingent and other liabilities depending on the relevant facts and circumstances. The level of provisioning is subject to management judgement on the basis of legal advice and is therefore an area of focus for the Committee. | § Evaluated advice on the status of current legal, competition and regulatory matters.
§ Assessed management’s judgements and estimates of the levels of provisions to be taken and the adequacy of those provisions, based on available information and evidence.
§ Considered the adequacy of disclosure, recognising that any decision to set provisions involves significant judgement.
| The Committee discussed provisions and utilisation. Having reviewed the information available to determine what was probable and could be reliably estimated, the Committee agreed that no additional provision should be made at the full year for ongoing investigations and litigation.
Further information may be found on pages 270 to 280. | |||
Valuations (see Notes14-18 to the financial statements). | Barclays exercises judgement in the valuation and disclosure of financial instruments, derivative assets and certain portfolios, particularly where quoted market prices are not available, including the Group’s Education, Social Housing and Local Authority (ESHLA) portfolio. | § Evaluated reports from Barclays’ Valuations Committee, with particular focus on the restructuring of the ESHLA portfolio and its subsequentde-recognition; a valuation disparity with a third party in respect of a specific long-dated derivative portfolio; and an assessment of the impact of negative interest rates on the valuation of derivatives.
§ Considered proposals from the Valuations Committee to revise the valuations approach for the remaining ESHLA portfolio and to revise the approach to the marking of Own Credit.
| The Committee confirmed its agreement to the restructuring andde-recognition of the ESHLA portfolio and concluded that it was ade-recognition event. It noted the lack of progress made in resolving the third-party valuation disparity, which has been outstanding for some time, and satisfied itself on the basis of the information available to it that Barclays’ valuation methodology remains appropriate. It approved a revision to the model used for valuing the remaining ESHLA portfolio recommended by the Valuations Committee. | |||
Impairment (see Note 7 to the financial statements). | Where appropriate, Barclays models potential impairment performance, allowing for certain assumptions and sensitivities, to agree allowances for credit impairment, including agreeing the timing of the recognition of any impairment and estimating the size, particularly where forbearance has been granted. | § Assessed impairment experience against forecast and whether impairment provisions were appropriate.
§ Evaluated the appropriateness and timing of the impairment taken in connection with Barclays’ exposures to the oil and gas sectors, including the impact of single name losses in the oil and commodities sectors.
§ Debated the adjustment in impairment taken in the Cards business for informal forbearance arrangements and the potential impact of changes in emergence modelling.
§ Considered a report from the Group Impairment Committee on the adequacy of loan impairment allowances as at 31 December 2016, including assessing internal and external trends, methodologies and key management judgements.
| The Committee challenged the timing of the oil and gas impairment taken in the half-year results, although confirmed that the provision was adequate. It welcomed the proposal to create a new Group Impairment Committee and enhance the role of the Group Finance function in assessing impairment provisioning. It agreed a post-model adjustment of £250m for impairment in the UK and US Cards businesses during the third quarter of 2016 and obtained clarification on the impairment policy for the Cards business. At the full year, having debated the report from the Group Impairment Committee it confirmed the adequacy of the full year impairment charge of £2.4bn. | |||
Tax (see Note 10 to the financial statements). | Barclays is subject to taxation in a number of jurisdictions globally and makes judgements with regard to provisioning for tax at risk and on the recognition and measurement of deferred tax assets. | § Evaluated the appropriateness of tax risk provisions to cover existing tax risk.
§ Debated the forecasts and assumptions supporting the recognition and valuation of deferred tax assets. | The Committee confirmed the tax risk provisions for the full year and the treatment of deferred tax assets. | |||
| Barclays PLC and Barclays Bank PLC 2016 Annual Report on Form 20-F | 13 |
Governance: Directors’ report
What we did in 2016
Board Audit Committee report
| Area of focus | Reporting issue | Role of the Committee | Conclusion/action taken | |||
Long-term viability | The Directors are required to make a statement in the Annual Report as to the long-term viability of Barclays. The Committee provides advice to the Board on the form and content of the statement, including the underlying assumptions. | § Evaluated at year end a report from management setting out the view of Barclays’ long-term viability. This report was based on Barclays Medium Term Plan (MTP) and covered forecasts for capital, liquidity and leverage, including forecast performance against regulatory targets, outcomes of the stress test of the MTP and forecast capital and liquidity performance against stress hurdle rates, funding and liquidity forecasts and an assessment of global risk themes and the Group’s risk profile.
§ Considered the viability statement in conjunction with Barclays risk statements and strategy/business model disclosures.
§ Addressed specific feedback from investors and other stakeholders on viability statements in general.
| Taking into account the assessment by the Board Risk Committee of stress testing results and risk appetite, the Committee agreed to recommend the viability statement to the Board for approval. | |||
Fair, balanced and understandable reporting (includingcountry-by-country reporting and Pillar 3 reporting). |
Barclays is required to ensure that its external reporting is fair, balanced and understandable. The Committee undertakes an assessment on behalf of the Board in order to provide the Board with assurance that it can make the statement required by the Code. |
§ Assessed, via discussion with and challenge of management, including the Group Chief Executive and Group Finance Director, whether disclosures in Barclays’ published financial statements were fair, balanced and understandable.
§ Evaluated reports from Barclays’ Disclosure Committee on its assessment of the content, accuracy and tone of the disclosures.
§ Established via reports from management that there were no indications of fraud relating to financial reporting matters.
§ Evaluated the outputs of Barclays’ internal control assessments and Sarbanes-Oxley s404 internal control process.
§ Assessed disclosure controls and procedures.
§ Confirmed that management had reported on and evidenced the basis on which representations to the external auditors were made. |
Having evaluated all of the available information and the assurances provided by management, the Committee concluded that the processes underlying the preparation of Barclays’ published financial statements, including the 2016 annual report and financial statements, were appropriate in ensuring that those statements were fair, balanced and understandable.
In assessing Barclays’ financial results statements over the course of 2016, the Committee specifically addressed and provided input to management on the disclosure and presentation of:
§ Barclays restated financial results, including the allocations to Barclays UK and Barclays International and the separation of the Cards business.
§ the sell-down of Barclays holding in Barclays Africa and its classification as held for sale.
§ guidance provided to the market on the costs of Structural Reform.
§ the Group Finance Director’s presentations to analysts.
§ alternative performance measures in view of new guidance from the European Securities & Markets Association.
§ core performance and headcount.
§ operational risk capital and guidance on capital levels.
§ the level of segmental reporting.
The Committee recommended to the Board that the 2016 annual report and financial statements are fair, balanced and understandable.
| |||
| 14 | Barclays PLC and Barclays Bank PLC 2016 Annual Report on Form 20-F |
Other significant matters
Apart from financial reporting matters the Committee has responsibility for oversight of the effectiveness of Barclays’ internal controls, the performance and effectiveness of BIA and the performance, objectivity and independence of the external auditor. The most significant matters considered during 2016 are described below:
Area of focus
|
Matter addressed
|
Role of the Committee
|
Conclusion/action taken
| |||
Internal control Read more about the Barclays’ internal control and risk management processes on pages 40 and 41 |
The effectiveness of the overall control environment, including the status of any material control issues and the progress of specific remediation plans. |
§ Evaluated and tracked the status of the most material control issues identified by management via regular reports from the Head of Operational Risk and latterly from the Chief Controls Officer.
§ Evaluated the status of specific material control issues and associated remediation plans, including in particular those relating to Security of Secret and Confidential Data; Infrastructure Access Management; Group Resilience; IT Security; Data Governance; Model Risk Management; and Unsupported Infrastructure and Applications, all of which remained open at the end of 2016.
§ Discussed lessons learned from specific control incidents and how these could be applied to Barclays’ business globally, via an enhanced lessons-learned process.
§ Debated any regulatory reports or other feedback received from regulators on Barclays’ overall control environment.
§ Assessed the status of the enhancements being made to Barclays risk and control self-assessment (RCSA) process to support disclosures in Barclays annual report.
|
The Committee requested enhancements to reporting to make clear where operational risk was outside appetite and the actions being taken. The Committee welcomed the improvements made to the lessons-learned process and proposed that the new Group Controls Committee should play a role in setting standards for lessons-learned exercises and deciding when they should be conducted. The Committee endorsed the work being taken forward, under the leadership of the Chief Controls Officer, to address any feedback from regulators on Barclays’ control environment, noting that the Board would directly oversee the progress being made to address specific regulatory feedback. The Committee also challenged management to ensure that the RCSA process was sufficiently robust in light of some specific control issues that had emerged after certain RCSAs had been completed. | |||
The effectiveness of the management control approach and control environment in each individual business, including the status of any material control issues and the progress of specific remediation plans. |
§ Assessed individual reports from Barclays UK, Barclays International, the Cards business, Barclays’ Non Core operations, Barclays International’s US investment banking operations and Barclays Africa, including questioning directly the heads of those businesses on their management control approach/culture and control environment, including any specific control issues, resilience issues, the status and progress of any remediation plans or workstreams and plans to enhance the control environment.
§ Tracked plans for implementing revised control governance structures in each business to align with changes in Barclays’ organisational structure.
§ Provided feedback on the 2016 control objectives for each member of the Group Executive Committee.
|
The Committee welcomed the decision by Barclaycard to redirect strategic investment towards enhancing its control environment and to restrict growth in new business while certain control issues, such as fraud levels in the US, were addressed. To make clear the levels of personal accountability expected, the Committee asked for the control objectives for each member of the Group Executive Committee for 2016 to be made more specific, with an emphasis on prioritising control issues. |
| Barclays PLC and Barclays Bank PLC 2016 Annual Report on Form 20-F | 15 |
Governance: Directors’ report
What we did in 2016
Board Audit Committee report
| Area of focus | Matter addressed | Role of the Committee | Conclusion/action taken | |||
| The effectiveness of the control environment in the Chief Operating Office (COO) and the status and remediation of any material control issues. | § Scrutinised on a regular basis the COO control environment, taking the opportunity to directly challenge and question functional leaders, including the Chief Operating Officer on the progress of remediation plans.
§ Debated the clarity of accountability and standards of consistency needed, given decentralisation of the business.
§ Addressed the issue of resilience and associated risk appetite, discussing in particular the impact of change on resilience initiatives.
§ Discussed the impact of the proposed sell-down of Barclays holding in Barclays Africa, including any ongoing support requirements onCOO-related material control issues. | The Committee emphasised the need for clear ownership and accountability between the business and COO for technology control issues, which has been addressed via the implementation of the new organisational management structure. In view of the volume of technology and change remediation required, the Committee tasked the Chief Operating Officer with enhancing the processes for self-identification and logging of risk and control issues. The Committee also asked the new Chief Information Officer to conduct a deep dive into Technology control issues, the outputs of which were evaluated by the Committee in the fourth quarter of 2016. The Committee welcomed the improved clarity of the plans to enhance the COO control environment and will receive further regular updates throughout 2017.
| ||||
| The adequacy of the Group’s arrangements to allow employees to raise concerns in confidence without fear of retaliation and the outcomes of any substantiated cases. | § Evaluated the results of benchmarking exercise to compare Barclays’ processes and case volumes to 40 peer companies.
§ Tracked the progress of the internal campaign to raise awareness among employees on raising concerns.
§ Monitored the trends in reported and substantiated whistleblowing cases, including any information on any instances of retaliation. | The Committee concluded that Barclays’ processes were appropriate and in line with peers. It noted that the successful internal campaign had generated an increase in the number of whistleblowing reports, all of which were investigated. Volumes of cases remain proportionate to Barclays’ size and footprint. The Committee asked management to provide additional detail in its future reports where any whistleblowing investigation was outstanding for more than six months. In future, as Barclays Whistleblowing Champion, the Chairman of the Committee will make an annual report to the Board on whistleblowing matters.
| ||||
| 16 | Barclays PLC and Barclays Bank PLC 2016 Annual Report on Form 20-F |
Area of focus
|
Matter addressed
|
Role of the Committee
|
Conclusion/action taken
| |||
Internal audit |
The performance of BIA and delivery of the internal audit plan, including scope of work performed, the level of resources and the methodology and coverage of the internal audit plan. |
§ Scrutinised and agreed internal audit plans and deliverables for 2016, including agreeing the areas of focus, such as technology, data, change, execution risk, and the resources required.
§ Monitored delivery of the agreed audit plans, including assessing internal audit resources and attrition levels and any impacts on the plan.
§ Debated audit risk appetite and issue validation.
§ Tracked the levels of unsatisfactory audits, including discussing the time taken to issue audit reports and the reasons for any delays.
§ Discussed BIA’s assessment of the management control approach and control environment in Barclays UK, Barclays International and the COO.
§ Debated with BIA the possibility of auditing culture.
§ Evaluated the outcomes from BIA’s annual self-assessment.
§ Debated feedback received from the PRA on the performance of BIA and discussed the increased regulatory expectations of BIA and the impact on internal audit plans and resources.
|
The Committee approved an increase in headcount to ensure appropriate audit coverage of technology and change and agreed an interim audit risk appetite level pending recruitment, subject to the delivery of mitigating actions assigned to the Chief Operating Officer. The Committee emphasised to management that it was not content with the number of unsatisfactory audits and considered setting a target for management. It also asked BIA to disclose in its reports the reasons for any delay in issuing audit reports, along with details of any audit work that was deferred or cancelled. In view of the additional expectations placed on BIA, the Committee requested details of internal audit vacancies, business areas and skills sets and encouraged the Chief Internal Auditor to consider internal transfers and other creative solutions to fill resourcing gaps. It agreed with BIA the action plan to address the recommendations arising from the PRA review of BIA’s performance. The Committee confirmed that it was satisfied with the outcomes of the self-assessment of BIA performance, which evidenced that the function generally conforms to the standards set by the Institute of Internal Auditors. It further confirmed that it felt able to reply on the work of BIA in discharging its own responsibilities.
| |||
External audit |
The work and performance of PwC, including the maintenance of audit quality during the period of transition to a new auditor. |
§ Met with key members of the PwC audit team to discuss the 2016 audit plan and agree areas of focus.
§ Assessed regular reports from PwC on the progress of the 2016 audit and any material issues identified, including debating with PwC whether any changes to the audit plan were needed following the UK’s vote to leave the EU.
§ Discussed PwC’s report on certain control areas and the control environment, including a specific report on controls over access to payment systems requested by the Committee.
§ Discussed the draft audit opinion ahead of 2016 year end.
|
The Committee approved the audit plan and the main areas of focus.
Read more about the Committee’s role in assessing the performance, effectiveness and independence of the external auditor and the quality of the external audit below. |
| Barclays PLC and Barclays Bank PLC 2016 Annual Report on Form 20-F | 17 |
Governance: Directors’ report
What we did in 2016
Board Audit Committee report
The Committee also covered the following matters:
§ tracked the progress of specific work being done to enhance Barclays’ financial crime controls and the deployment of a revised financial crime operating model. The Committee also assessed the Group Money Laundering Officer’s annual report and was briefed on any issues arising from the publication of the information known as the “Panama Papers”
§ assessed the status of the programme in place to ensure Barclays’ compliance with client assets regulatory requirements, including approving the annual client assets audit report and discussing the potential impact of Structural Reform on client assets
§ evaluated the outcomes of the assessment of the Committee’s performance and any areas of Committee performance that needed to be enhanced
§ reviewed and updated its terms of reference, recommending them to the Board for approval.
External auditor
PwC, and its predecessor firms, has been Barclays’ external auditor since 1896. An external audit tender was conducted in 2015, with a view to rotating the external audit firm for the 2017 audit onwards. PwC was not asked to tender. The tender process completed in summer 2015 and the Board announced in July 2015 that it had appointed KPMG as Barclays’ statutory auditor with effect from the 2017 financial year. Henry Daubeney of PwC has been Barclays’ senior statutory auditor with effect from the audit for the 2015 financial year. He will be succeeded by an audit partner from KPMG with effect from the audit for the 2017 financial year.
Assessing external auditor effectiveness, auditor objectivity and independence andnon-audit services
The Committee is responsible for assessing the effectiveness, objectivity and independence of the Group’s auditor, PwC. This responsibility was discharged throughout the year at formal Committee meetings, during private meetings with PwC and via discussions with key executive stakeholders. In addition to the matters noted above, during 2016 the Committee:
§ approved the terms of the audit engagement letter and associated fees, on behalf of the Board
§ discussed and agreed revisions to theGroup Policy on the Provision of Services by the Group Statutory Auditor andregularlyanalysed reports from management on thenon-audit services provided to Barclays. Read more aboutnon-audit services below
§ evaluated and approved revisions to theGroup Policy on Employment of Employees or Workers from the Statutory Auditorandensured compliance with the policy by regularly assessing reports from management detailing any appointments made
§ assessed the draft report to the PRA prepared by PwC regarding its detailed audit work on specific topics
§ was briefed by PwC on critical accounting estimates, where significant judgement is needed
§ assessed any potential threats to its independence self-identified and reported by PwC
§ reviewed the report on PwC issued by the FRC’s Audit Quality Review team.
PwC’s performance, independence and objectivity during 2016 were formally assessed at the beginning of 2017 by way of a questionnaire completed by key stakeholders across the Group. The questionnaire was designed to evaluate PwC’s audit process and addressed matters including the quality of planning and communication, technical knowledge, the level of scrutiny and challenge applied and PwC’s understanding of the business. The Committee was particularly interested in assessing whether audit quality was being maintained throughout the period of transition to a new auditor and that the appropriate degree of challenge and scepticism was being maintained. The results of the evaluation confirmed that both PwC and the audit process were effective. In view of the external audit tender conducted in 2015 and the decision to appoint KPMG as Barclays’ external auditor with effect from the 2017 financial year, PwC will resign as the Group’s statutory auditor at the conclusion of the 2016 audit and the Board will resolve to appoint KPMG to fill the vacancy. A resolution to appoint KPMG as auditor will be proposed at Barclays’ 2017 AGM. PwC will be available at the 2017 AGM to answer any questions.
Non-audit services
In order to safeguard the auditor’s independence and objectivity, Barclays has in place a policy setting out the circumstances in which the auditor may be engaged to provide services other than those covered by the Group audit.The Group Policy on the Provision of Services by the Group Statutory Auditor(thePolicy) applies to all Barclays’ subsidiaries and other material entities over which Barclays has significant influence. The core principle of the Policy is thatnon-audit services (other than those legally required to be carried out by the Group’s auditor) should only be performed by the auditor in certain, controlled circumstances. The Policy sets out those types of services that are strictly prohibited and those that are allowable in principle. Any service types that do not fall within either list are considered by the Committee Chairman on a case by case basis, supported by a risk assessment provided by management. Since October 2015, the Committee has also required all new engagements of KPMG fornon-audit services to be considered in light of the Policy and has maintained oversight of such services on the same basis as for PwC. In particular, KPMG was not permitted to provide anynon-audit service that might have continued beyondmid-2016 if it had potential to cause independence issues.
During 2016, the Policy was revised to reflect the FRC’s draft Ethical Standard for Auditors published in September 2015, which implemented the EU’s revised Statutory Audit Directive. The new Ethical Standard is effective from financial years commencing on or after 17 June 2016, meaning that Barclays must comply with effect from 1 January 2017. However, the Committee decided to early adopt the requirements of the new Ethical Standard from 1 July 2016, to align with the point at which KPMG started its required period of independence. In order to comply with the new Ethical Standard, significant amendments were made to the list of services that are strictly prohibited by the Policy. A number of services being undertaken by PwC or KPMG were required to be exited following adoption of the new Policy, with any exceptions being approved by the Chairman and notified to the Committee.
Under the Policy, the Committee haspre-approved all allowable services up to £100,000, or £25,000 for tax advisory services, however, all proposed work, regardless of the fees, must be sponsored by a senior executive and recorded on a centralised online system, with a detailed explanation of the clear commercial benefit arising from engaging the auditor over other potential service providers. The audit firm engagement partner must also confirm that the engagement has been approved in accordance with the auditor’s own internal ethical standards and does not pose any threat to the auditor’s independence or objectivity. All requests to engage the auditor are assessed by independent management before work can commence. Requests for allowable service types in respect of which the fees are expected to meet or exceed the above thresholds must be approved by the Chairman of the Committee before work is permitted to begin. Services where the fees are expected to be £250,000 or higher must be approved by the Committee as a whole. All expenses and disbursements must be included in the fees calculation. The thresholds were not amended when the Policy was revised in 2016.
| 18 | Barclays PLC and Barclays Bank PLC 2016 Annual Report on Form 20-F |
During 2016, all engagements where expected fees met or exceeded the above thresholds were evaluated by either the Committee Chairman or the Committee as a whole who, before confirming any approval, assured themselves that there was justifiable reason for engaging the auditor and that its independence and objectivity would not be threatened. No requests to use PwC were declined in 2016 (2015: two), with one request to use KPMG declined (2015: n/a). On a quarterly basis, the Committee scrutinised details of individually approved andpre-approved services undertaken by PwC and KPMG in order to satisfy itself that they posed no risk to independence, either in isolation or on an aggregated basis. For the purposes of the Policy, the Committee has determined that anypre-approved service of a value of under £50,000 is to be regarded as clearly trivial in terms of its impact on Barclays’ financial statements and has required the Group Financial Controller to specifically review and confirm to the Committee that anypre-approved service with a value of £50,000 - £100,000 (or up to £25,000 for tax advisory services) may be regarded as clearly trivial. The Committee undertook a review ofpre-approved services at its meeting in December 2016 and satisfied itself that suchpre-approved services were clearly trivial in the context of their impact on the financial statements.
The fees paid to PwC for the year ended 31 December 2016 amounted to £49m (2015: £43m), of which £8m (2015: £9m) was payable in respect ofnon-audit services.Non-audit services represented 20.6% of the statutory audit fee (2015: 24.2%). A breakdown of the fees paid to the auditor for statutory audit andnon-audit work can be found in Note 42 on page 304. Of the £8m ofnon-audit services provided by PwC during 2016, the significant categories of engagement, i.e. services where the fees amounted to more than £500,000, included:
§ audit-related services: additional work to facilitate the transition to KPMG as Barclays’ statutory auditor
§ transaction support: services provided in connection with the sell-down of Barclays’ holding in Barclays Africa, including acting as the reporting accountant on the circular issued to Barclays’ shareholders and providing comfort on associated documentation
§ quality assurance: performed on behalf of Barclays Africa over work conducted by Barclays in connection with the separation arrangements from Barclays.
The fees paid to KPMG fornon-audit work during 2016 were £17.3m (2015: £38m). Significant categories of engagement approved in 2016 included:
§ Audit-related services: services provided in connection with minimum regulatory requirements for audits of benchmark interest rate submissions.
The Statutory Audit Services for Large Companies Market Investigation (Mandatory Use of Competitive Tender Processes and Audit Committee Responsibilities) Order 2014 As described in this report, Barclays is in compliance with the requirements of The Statutory Audit Services for Large Companies Market Investigation (Mandatory Use of Competitive Tender Processes and Audit Committee Responsibilities) Order 2014, which relates to the frequency and governance of tenders for the appointment of the external auditor and the setting of a policy on the provision ofnon-audit services. |
Governance in Action – Statutory auditor transition
A significant activity for the Committee during 2016 has been overseeing the transition of Barclays’ statutory auditor from PwC to KPMG. Following the audit tender that concluded inmid-2015, KPMG will become Barclays statutory auditor with effect from the 2017 financial year onwards. The Committee has undertaken activity to manage the transition period to facilitate a smooth handover of responsibilities.
The Committee has overseen the steps required to enable KPMG to achieve independence by 1 July 2016. This included:
§ assigning a dedicated transition team to support operational activities, including progressing a global master services agreement and local jurisdictional agreements
§ agreeing with KPMG the overall plan to achieve independence and assessing regular reports from KPMG on the progress being made
§ monitoring the orderly termination ofnon-audit services being provided by KPMG to Barclays that would be prohibited when KPMG becomes statutory auditor
§ requiring KPMG to comply from 1 June 2016 with the provisions of the Group’s policies relating to the statutory auditor, specifically,The Group Policy on the Provision of Services by the Group Statutory AuditorandtheGroup Policy on Employment of Employees or Workers from the Statutory Auditor, and requiring management to report to the Committee on any services or appointments undertaken in line with these policies
§ accepting a formal independence letter from KPMG. This included a list of ongoingnon-audit services that are deemed permissible and which have been approved in accordance with Barclays’ policy and confirmation of KPMG’s compliance with applicable ethics and independence rules.
Once independence was achieved, the Committee oversaw the handover plan and the transition to business as usual. This included:
§ inviting the lead audit partner of KPMG to attend Committee meetings as part of the process of shadowing PwC’s 2016 audit
§ arranging for the lead audit partner of KPMG to attend meetings of the Board Reputation Committee and Board Risk Committee
§ receiving a briefing from KPMG on accounting developments, covering: Impairment and the impact of IFRS9 (Financial Instruments); Valuations; Negative interest rates; Structural Reform; IFRS15 (Revenue from contracts with customers) and IFRS16 (Leases)
§ discussing with KPMG accounting policy interpretations following KPMG’s review of Barclays’ accounting policies
§ assessing regular reports from KPMG on the progress being made with key activities, including building the Barclays’ audit team and gaining an understanding of Barclays’ key processes, systems and controls
§ reviewing the report on KPMG issued by the FRC’s Audit Quality Review team
§ scheduling a planning meeting between the Committee and KPMG for the second quarter of 2017 to discuss the audit strategy and provide input.
| |||||||
| Barclays PLC and Barclays Bank PLC 2016 Annual Report on Form 20-F | 19 |
Governance: Directors’ report
What we did in 2016
Board Risk Committee report
Dear Fellow Shareholders
The Committee’s focus during 2016 has been driven by a number of key challenges. First, Barclays has been implementing its new strategy and executing its Structural Reform Programme, which has some particular implications in terms of capital and liquidity management across Barclays’ legal entities. Second, there was continued focus on any emerging risks arising in our key markets in the UK, US and South Africa as a consequence of any macroeconomic deterioration or disruption in financial market conditions. Finally, there were the challenges presented by emerging economic and political risks, notably those associated with the EU Referendum and the subsequent vote by the UK to leave the EU.
Considerations for risk appetite for 2016 and the Medium Term Plan (MTP) included credit cycle conditions; the impact of ongoing low commodity prices; a potential slowdown in China; and the likelihood of interest rate rises. Consequently, the recommendation of the risk function, which was endorsed by the Committee, was that a conservative approach to growth should be maintained, with a focus on core products and markets. We expected continued volatility in external conditions and aimed to ensure that the Group was conservatively positioned. Headwinds developed during 2016 with the potential to have a significant first-order impact on Barclays’ businesses, including heightened economic risk in the UK post the EU Referendum; increasedgeo-political risk following the US presidential election; and the IAS19 position of Barclays’ pension scheme, which is vulnerable to market volatility. Other emerging risks with the potential to impact Barclays include interest rate and credit spread movements; UK property price stress; potential transmission impacts of any slowdown in China; and ongoing volatility in oil prices, which remain low. All of these potential risks continue to be actively managed and the risk profile and actions taken are subject to regular oversight by the Committee. In these circumstances, we were pleased with the capital and leverage performance for 2016, although impairment performance was adverse to plan, primarily as a result of one-off effects reflecting management’s review of impairment modelling in the UK and US Cards businesses.
In early 2016, Barclays appointed a new Chief Risk Officer, CS Venkatakrishnan, an appointment that was recommended to the Board by the Committee. The Committee oversaw the transition, specifically requesting information from the outgoing Chief Risk Officer on the transition plans and handover arrangements and seeking assurance from the new Chief Risk Officer that he had been provided with all of the information needed to enable him to fulfil his responsibilities. The Committee has welcomed the opportunity to work closely with the new Chief Risk Officer during 2016. We have also seen greater emphasis emerge over 2016 on the responsibilities of the first line of defence for | managing risk in their businesses, with the chief executives of each business attending Committee meetings to present directly to the Committee, with the support of their chief risk officers, on the risk profile of their business and how risk is being managed.
My own responsibilities as Chairman of the Committee werere-emphasised during 2016, with the introduction in March 2016 of the UK’s Senior Managers Regime. Under this regulatory regime, I have specific prescribed responsibilities for safeguarding the independence of and overseeing the performance of the risk function, including the performance of the Chief Risk Officer, in line with regulatory requirements. In addition to my regular meetings with the Chief Risk Officer and members of his senior management, I have led the Committee in encouraging the risk function to develop a way of assessing risk management capability, which we have also agreed will be subject to a periodic, external review. The risk function has also been encouraged to develop a way of measuring risk culture across the Group.
During 2016, I continued to liaise closely with the Chairman of the Board Audit Committee, particularly with regard to operational risk issues, where there is some degree of overlap between the remit of the two committees. I also attended a meeting of the risk committee of Barclays US IHC to gain a first-hand insight into the risk issues being addressed by management in that entity. I continued my practice of meeting regularly with other members of senior management and continued to engage with Barclays regulators in the UK and US.
Committee performance The Committee’s performance during 2016 was assessed as part of the independently facilitated annual Board effectiveness review. I am pleased to report that the conclusion of my Board colleagues was that the Committee is regarded as thorough and effective and that the Board has a high degree of confidence in the diligence and coverage of the Committee. The main area identified for improvement was to ensure that theco-operation and collaboration between the Committee and the Board Audit and Board Reputation Committees continues to capture all significant risk issues effectively. I will be working even more closely with my fellow Board Committee chairmen on this over the coming year. You can read more about the outcomes of the Board effectiveness review on pages 33 to 35.
Looking ahead 2017 will be a key year for Barclays in delivering its strategy, as it completes its restructuring and makes significant steps in implementing the new legal entity structure required under Structural Reform. I expect the Committee to focus on strategic risk, with an emphasis on promoting even greater linkages between strategy formulation and risk management, and ensuring that there is appropriate global oversight of risk across the new Group structure.
Tim Breedon Chairman, Board Risk Committee 22 February 2017 | |


| 20 | Barclays PLC and Barclays Bank PLC 2016 Annual Report on Form 20-F |
| Board Risk Committee allocation of time (%) | ||||||||||||||
| 2016 | 2015 | |||||||||||||
 | 1 | Risk profile/risk appetite (including capital and liquidity management) | 52 | 43 | ||||||||||
| 2 | Key risk issues | 26 | 31 | |||||||||||
| 3 | Internal control/risk policies | 8 | 11 | |||||||||||
| 4 | Other (including remuneration and governance issues) | 14 | 15 | |||||||||||
Committee composition and meetings
The Committee is comprised solely of independentnon-executive Directors. Details of the skills and experience of the Committee members can be found in their biographies on pages 3 and 4.
The Committee met eight times in 2016, with one of the meetings held at Barclays’ New York offices. A meeting was held specifically to consider the risk considerations arising from the outcome of the EU Referendum result, further details of which can be found on page 24. The chart above shows how the Committee allocated its time during 2016. Committee meetings were attended by management, including the Group Chief Executive, Group Finance Director, Chief Internal Auditor, Chief Risk Officer, Barclays Treasurer and General Counsel, as well as representatives from the businesses and other representatives from the risk function. Representatives from the current external auditor, PwC and, from 1 July 2016, representatives from the incoming external auditor, KPMG, also attended meetings.
| Member | Meetings attended/eligible to attend | |
| Tim Breedon | 8/8 | |
| Mike Ashley | 8/8 | |
| Reuben Jeffery* | 7/8 | |
| Diane Schueneman | 8/8 | |
| Steve Thieke | 8/8 |
| *Did | not attend one meeting owing to a prior commitment |
Committee role and responsibilities
The Committee’s main responsibilities include:
| § | recommending to the Board the total level of financial and operational risk the Group is prepared to take (risk appetite) to achieve the creation of long-term shareholder value |
| § | monitoring financial and operational risk appetite, including setting limits for individual types of risk, e.g., credit, market and funding risk |
| § | monitoring the Group’s financial and operational risk profile |
| § | ensuring that financial and operational risk is taken into account during the due diligence phase of any strategic transaction |
| § | providing input from a financial and operational risk perspective into the deliberations of the Board Remuneration Committee. |
| The Committee’s terms of reference are available athome.barclays/corporategovernance |
The Committee’s work
The significant matters addressed by the Committee during 2016 are described below:
| Area of focus | Matter addressed | Role of the Committee | Conclusion/action taken | |||
| Risk appetite and stress testing,i.e. the level of risk the Group chooses to take in pursuit of its business objectives, including testing whether the Group’s financial position and risk profile provide sufficient resilience to withstand the impact of severe economic stress. | The risk context to MTP, the financial parameters and constraints and mandate and scale limits for specific business risk exposures; the Group’s internal stress testing exercises, including scenario selection and financial constraints, stress testing themes and the results and implications of stress tests, including those run by the Bank of England (BoE). | § Assessed the risk context for the 2016 MTP, including general economic and financial conditions and how these had been reflected in planning assumptions.
§ Debated the assumptions, parameters and results of the internal stress test of the risk appetite of the 2016 MTP.
§ Discussed and agreed mandate and scale limits for market and credit risk.
§ Approved the parameters for the European Banking Authority stress test.
§ Approved the parameters for BoE stress test scenario expansion.
§ Evaluated the BoE stress test results, including updates on stress testing governance and methodology and assessing potential contingency plan actions.
§ Debated regulatory and market reaction to the BoE stress test results.
§ Considered and approved internal stress test themes and the financial constraints and scenarios for stress testing risk appetite for the 2017 MTP.
§ Regularly monitored the progress of the US IHC in preparing for the Comprehensive Capital Analysis and Review (CCAR) stress test. | The Committee recommended the proposed risk appetite for 2016 to the Board for approval, although asked management to develop a contingency plan with identified triggers and actions that could be implemented if the stress occurred. It also emphasised to management that mandate and scale limits should be set at appropriate levels, reflecting the desire to focus on conservative growth in core products and markets. The Committee approved credit and market risk limits and requested that additional limits were set for market risk in order to enhance monitoring and control. It also asked management to review limits and guidelines and develop a revised framework for single name risk management, which it subsequently considered and approved. The Committee approved the stress test results for submission to the BoE. After evaluating feedback from the BoE on the stress test, the Committee encouraged management to engage with the BoE on specific points where additional clarity on regulatory expectations was desirable. | |||
| Barclays PLC and Barclays Bank PLC 2016 Annual Report on Form 20-F | 21 |
Governance: Directors’ report
What we did in 2016
Board Risk Committee report
| Area of focus | Matter addressed | Role of the Committee | Conclusion/action taken | |||
| Capital and funding, i.e. having sufficient capital and financial resources to meet the Group’s regulatory requirements and its obligations as they fall due, to maintain its credit rating, to support growth and strategic options. | The trajectory to achieving required regulatory and internal targets and capital and leverage ratios, including the potential impact of Structural Reform and legal entity requirements. | § Debated on a regular basis, capital performance against plan, tracking the capital trajectory, any challenges and opportunities and regulatory policy developments.
§ Assessed on a regular basis liquidity performance against both internal and regulatory requirements.
§ Regularly monitored capital and funding requirements on a legal entity basis, including evaluating proposed capital and liquidity processes for Barclays UK.
§ Debated with management proposed actions to be taken to restructure the Group’s asset swaps and ESHLA portfolio in order to reduce the impact of market volatility on capital.
| The Committee supported the forecast capital and funding trajectory and the actions identified by management to manage the Group’s capital position, including the actions taken to restructure asset swaps and the ESHLA portfolio. The Committee approved the proposed capital and liquidity processes for Barclays UK for submission to the regulator. | |||
| Political and economic risk,i.e. the impact on the Group’s risk profile of political and economic developments and macroeconomic conditions. | The potential impact on the Group’s risk profile of political developments, such as the UK’s EU Referendum and the US Presidential election, political and economic risk in South Africa, and weakening macroeconomic conditions, such as disruption and volatility in financial markets. | § Closely monitored the potential impact of the UK’s EU Referendum on the Group’s risk profile and risk management –see the case study below for further details.
§ Requested an assessment of the potential impact of negative interest rates in the UK on Barclays and on UK banks generally, evaluating the potential impact on risk appetite, on customers and on Barclays’ models.
§ Continued to assess the economic and political situation in South Africa and the potential impact on the Group’s risk profile, including assessing the potential risk of a sovereign credit rating downgrade and the action taken by management to position the business appropriately.
§ Continued to assess Chinese economic metrics and the potential for the global impact of any economic slowdown in China.
§ Discussed the impact of market volatility on Barclays’ pension scheme.
§ Monitored Barclays’ exposures to certain European banks in view of potential specific stresses for individual banks and general economic and political conditions in the Eurozone.
| The Committee identified interest rate risk as a potential area of emerging risk and asked management for an assessment of Barclays’ sensitivity to changes in interest rates and inflation, which was presented to the Committee in the fourth quarter. The Committee suggested that the Board was briefed on this subject and a briefing session is planned for 2017.
The Committee satisfied itself that the actions taken to position Barclays’ business in South Africa were appropriate in the context of the identified economic and political risk. It continues to keep the potential impact of a Chinese slowdown under active review and will be updated by management in early 2017 with an assessment of the risk horizon. Given the political and economic uncertainty in Italy thatre-emerged in late 2016, the Committee asked management to renew its focus on reducing any redenomination risk arising from Barclays’ operations in Italy. | |||
| Specific sector risk, i.e. the Group’s risk profile in sectors showing signs of stress, such as the oil sector. | The Group’s exposures to the oil and commodities sectors in light of the ongoing price weakness and volatility in these sectors during 2016. | § Continued to regularly assess the Group’s exposures to the oil sector, including how the portfolio was performing and whether this was in line with expectations given the actions that had been taken to manage or restructure Barclays’ exposures.
| The Committee satisfied itself that the actions taken by management were appropriate. Given ongoing volatility in this sector it will continue to monitor the portfolio for any further signs of stress that may require additional action.
| |||
| 22 | Barclays PLC and Barclays Bank PLC 2016 Annual Report on Form 20-F |
Area of focus
|
Matter addressed
|
Role of the Committee
|
Conclusion/action taken
| |||
Credit risk, i.e. the potential for financial loss if customers fail to fulfil their contractual obligations. |
Conditions in the UK housing market, particularly in London and the South East and the Group’s risk appetite for and management of sectors such as thebuy-to-let sector, given changes in taxation; levels of UK consumer indebtedness, particularly in the context of the risk of rising interest rates; and the performance of the Cards business, particularly the US Cards business, including levels of impairment. |
§ Continued to assess conditions in the UK property market for any signs of stress.
§ Evaluated how management was tracking and responding to rising levels of consumer indebtedness.
§ Scrutinised the performance of the Cards business, including reviewing performance against risk appetite, evaluating the drivers of impairment in the UK and US businesses and assessing actions being taken to ensure that the performance of certain business segments remained within agreed risk appetite.
|
The Committee continued to encourage management to carry on with its conservative approach to UK mortgage lending, particularly in view of signs of slowdown the market post the EU Referendum. It also encouraged management to continue its close monitoring of overall levels of consumer indebtedness. The Committee challenged the credit performance of certain business segments in the US Cards business and encouraged management to complete the actions that had been identified to improve credit performance. It also emphasised to management the need to strengthen the linkages between business strategy and risk appetite.
| |||
Operational risk, i.e. costs arising from human factors, inadequate processes and systems or external events. |
The Group’s operational risk capital requirements and any material changes to the Group’s operational risk profile and performance of specific operational risks against agreed risk appetite. |
§ Tracked operational risk key indicators via regular reports from the Head of Operational Risk.
§ Evaluated the potential impact of regulatory developments on operational risk capital requirements.
§ Debated specific areas of operational risk, including fraud; transaction operations; technology; payments; and cyber-risk, evaluating the extent of any losses, the overall threat landscape, risk trends and the controls in place, in order to assess the potential impact on operational risk capital requirements.
|
The Committee focused its attention on the financial and capital impacts of operational risk, with specific attention on key risks that were outside appetite. It encouraged management to implement greater links between the control environment in each business and the operational risk capital allocated to that business. It also emphasised to management that there should be greaterco-ordination between the key risks highlighted to the Committee and the operational risk control issues escalated to the Board Audit Committee, which is being addressed via the new chief controls office.
| |||
Risk framework and governance |
The frameworks, policies and talent and tools in place to support effective risk management and oversight. |
§ Evaluated model risk and plans in place to enhance Barclays’ models and modelling capabilities.
§ Tracked the progress of significant risk management projects, including the plans in place to achieve compliance with BCBS239 risk data aggregation principles.
§ Debated any risk management matters raised by Barclays’ regulators and the actions being taken by management to respond.
§ Discussed and endorsed the revised Enterprise Risk Management Framework (ERMF) from the perspective of financial and operational risk.
§ Oversaw the transition and handover to a new Chief Risk Officer.
§ Encouraged management to find ways of assessing risk capability and risk management culture.
|
The Committee will continue to track the delivery of plans to enhance modelling and will focus on this during 2017 as part of its oversight of the model risk principal risk. The Committee encouraged management to continue to improve risk data quality, including embedding accountability for risk data quality with the business chief risk officers. The Committee will continue to track management’s response to any risk management matters raised by the Group’s regulators.
The Committee was satisfied that the handover to the new Chief Risk Officer was appropriate. The Committee welcomed the development of a risk management capability scorecard and asked for risk management capability to be evaluated by an external third party on a periodic basis, with a view to starting in 2017. It also welcomed the proposal to measure risk culture and asked for this to be fed into the Board Reputation Committee’s overall assessment of Barclays’ culture.
| |||
Remuneration |
The scope of any risk adjustments to be taken into account by the Board Remuneration Committee when making remuneration decisions for 2016. |
§ Debated the Risk function’s view of 2016 performance, making a recommendation to the Board Remuneration Committee on the financial and operational risk factors to be taken into account in remuneration decisions for 2016.
|
The Committee asked for capital and liquidity on a stressed basis to be taken into account when finalising the risk input to remuneration decisions. |
| Barclays PLC and Barclays Bank PLC 2016 Annual Report on Form 20-F | 23 |
Governance: Directors’ report
What we did in 2016
Board Risk Committee report
In addition, the Committee also covered the following matters in 2016:
§ assessed Barclays’ exposures to the leveraged finance market and general conditions in that market
§ was briefed by PwC on any risk matters associated with the 2015year-end audit, specifically impairment; the valuation of the ESHLA portfolio; and a valuation disparity with a third party
§ evaluated the outcomes of the assessment of the Committee’s performance and any areas of Committee performance that needed to be enhanced
§ reviewed and updated its terms of reference, recommending them to the Board for approval
| ||||
Governance in Action – contingency planning for the UK’s EU Referendum
| ||||
A significant external risk event in 2016 was the UK’s Referendum on its continued membership of the EU. The Board Risk Committee actively tracked this emerging risk throughout 2016, both before and after the vote.
| ||||
Pre-EU Referendum activity by the Committee included:
§ debating the UK’s potential exit from the EU, including evaluating an assessment of the potential impacts on Barclays of a leave vote and discussing the key messages for policymakers and prudential authorities on the risks
§ evaluating Barclays’ potential exposures if there were to be a vote to leave the EU, including assessing the steps taken by management to mitigate any risk (such as reducing any currency mismatches) in order to position Barclays defensively to manage the impact of any volatility on market and funding risk
§ assessing the likelihood of any operational risk issues that might arise if there was a period of market volatility following a leave vote
§ conducting an overall review of the appropriateness of Barclays’ preparations for any market dislocation
§ reporting to the Board on the Committee’s deliberations.
In addition to the activities undertaken by the Committee, Board members, including certainnon-executive Directors, participated in a Group crisis management planning exercise based on the UK voting to leave the EU. The exercise focused on Barclays’ response and communications planning in the event of a vote to leave; articulating some of the high level impact scenarios following a vote to leave; and determining the decisions and ensuing direction required from Barclays’ Crisis Leadership Team. | Post-EU Referendum activity by the Committee included:
§ convening a special meeting to discuss and evaluate the effectiveness of Barclays’ preparations, concluding that the plans developed had been executed satisfactorily
§ assessing the performance of the actions taken to manage the impact of volatility on market and funding risk
§ evaluating a revised stressed outlook, based on revised economic assumptions, and its impact on Barclays’ risk profile, deliberating the effect of the revised outlook on forecast impairment and on capital and funding, market risk and credit risk
§ considering Barclays’ exposures to European banks in anticipation of potential market disruption in the Eurozone and the actions that had been taken to limit such exposures
§ discussing with management the actions that had been taken to reduce risk appetite and limits on exposures to residential property development, highloan-to-value mortgages and buyto-let lending and other actions that had been implemented to manage risk in higher risk retail segments and corporate portfolios
§ encouraging management to consider the strategic implications of the leave vote
§ emphasising to management the need to fully and openly engage on matters of mutual concern with the UK government and regulators given the new political and economic environment
§ continuing to track the potential impact of the leave vote and the actions being taken by management to deal with any emerging signs of stress in Barclays’ portfolios
§ reporting to the Board on the Committee’s deliberations.
The full Board also met in the aftermath of the vote result to be briefed on how Barclays had performed during the period of volatility immediately following the result, including discussing Barclays’ capital and liquidity position; market conditions; communications with employees and with customers and clients; contact with regulators and the UK government; the outlook for the UK economy; share price performance and potential strategic impacts.
| |||
| Read more about Barclays’ risk management on pages 342 to 403.
| |||||||||
| 24 | Barclays PLC and Barclays Bank PLC 2016 Annual Report on Form 20-F |
Governance: Directors’ report
What we did in 2016
Board Reputation Committee report
Dear Fellow Shareholders One of the key areas of focus for the Committee during 2016 was encouraging management to develop a way of better understanding and measuring intangible areas such as behaviour and culture. Barclays has a strong and resonant purpose, Helping people achieve their ambitions in the right way, and a well understood set of values, Respect, Integrity, Service, Excellence and Stewardship. This culture is firmly endorsed from the top: achieving and sustaining a culture where all of our people demonstrate consistent behaviours and conduct, underpinned by Barclays’ values, is key to delivering high performance for all our stakeholders and, therefore, to our long-term success.
Our challenge has been how to co-ordinate the efforts to build culture across the Group and obtain assurance that progress is being made. Significant focus was given during 2016 to developing consistent measurement and reporting of culture and you can read about the Committee’s role in this important initiative in the case study on page 28. A similar approach has been taken to developing a set of indicators to allow us to measure progress across the Committee’s other areas of responsibility: conduct, complaints and citizenship.
During 2016, the Committee continued to track the exposure of Barclays, and the financial sector in general, to reputational risks. It also placed a renewed focus on the initiatives under way to build and manage Barclays’ reputation with its key stakeholders. We also continued to exercise oversight of the Barclays’ Compliance function, including approving its annual business plan, budget and resources.
Under the UK’s Senior Manager Regime, which was introduced in March 2016, I have specific responsibilities with regard to safeguarding the independence and integrity of Barclays’ Compliance function and for overseeing its performance, including that of the Head of Compliance. To this end, I regularly meet with the Head of Compliance to receive briefings on the work of Compliance and provide support when necessary. I also meet regularly with other members of senior management, including those in the Corporate Relations, Citizenship and Reputation Risk teams.
|
This is my first report as Chairman of the Board Reputation Committee and I wish to record my thanks to Sir Michael Rake, who I succeeded as Chairman on 1 January 2016, and to Wendy Lucas-Bull and Frits van Paasschen, who both stepped down from the Committee on their retirement from the Barclays Board during 2016. Mike Ashley and Mary Francis subsequently joined the Committee to ensure we have the right balance of skills and experience and appropriate cross-membership with other Board Committees.
The report on pages 26 to 28 sets out details of the material matters considered by the Committee during 2016.
Committee performance The Committee’s performance during 2016 was assessed as part of the independently facilitated annual Board effectiveness review. I can report that my fellow Board members considered that the Committee has made progress in defining its role and is performing well. The main area identified for improvement was around ensuring that Board members have greater awareness of the Committee’s mandate and core agenda. You can read more about the outcomes of the Board effectiveness review on pages 33 to 35.
Looking ahead Cultural transformation remains firmly on the Committee’s agenda and we will continue to track key indicators and measure the progress being made. This will be increasingly important as Barclays implements its Structural Reform Programme and begins to establish separate legal entities within the Group. My key objective in 2016 was to put the Committee at the centre of Barclays’ drive to be a leader in conduct, culture and reputation - matters at which we have not always excelled in the past. There is still lots to do, but I believe that the leadership and processes that we have now put in place give us a great foundation on which to build.
Sir Gerry Grimstone Chairman, Board Reputation Committee 22 February 2017 |


| Barclays PLC and Barclays Bank PLC 2016 Annual Report on Form 20-F | 25 |
Governance: Directors’ report
What we did in 2016
Board Reputation Committee report
Board Reputation Committee allocation of time (%)
| ||||||||||||||
| 2016 | 2015 | |||||||||||||
 |
|
1 |
|
Citizenship |
|
8 |
|
|
6 |
| ||||
| 2 | Reputational issues | 27 | 13 | |||||||||||
| 3 | Culture, conduct and compliance | 57 | 57 | |||||||||||
| 4 | Operational risk* | 0 | 19 | |||||||||||
| 5 | Other | 8 | 6 | |||||||||||
| * | Oversight of operational risk now falls within the remit of the Board Risk Committee |
Committee composition and meetings
The Committee comprises independentnon-executive Directors. During 2016 there were a number of changes to the membership of the Committee, which are set out in the table opposite.
The Committee met five times during 2016 with one of the meetings held at Barclays’ New York offices. The chart above shows how it allocated its time. Committee meetings were attended by representatives from management, including the Group Chief Executive, Chief Internal Auditor, Chief Risk Officer, General Counsel, Group Corporate Relations Director and Heads of Compliance, Conduct Risk and Operational Risk, as well as representatives from the businesses and other functions. Representatives from the FCA also attended a meeting during 2016.
| Member | Meetings attended/eligible to attend | |||
| Sir Gerry Grimstone (from 1 January 2016) | 5/5 | |||
| Mike Ashley (from 1 May 2016) | 4/4 | |||
| Mary Francis (from 1 November 2016) | 2/2 | |||
| Wendy Lucas-Bull (to 1 March 2016) | 0/0 | * | ||
| Dambisa Moyo | 5/5 | |||
| Diane de Saint Victor | 5/5 | |||
| Frits van Paasschen (to 28 April 2016) | 1/1 |
| * | There were no Committee meetings held prior to 1 March 2016, when Wendy Lucas-Bull left the Committee |
Committee role and responsibilities
The principal purpose of the Committee is to:
| § | support the Board in promoting its collective vision of Barclays’ purpose, values, culture and behaviours |
| § | ensure, on behalf of the Board, the efficiency of the processes for identification and management of conduct and reputational risk |
| § | oversee Barclays’ conduct in relation to its corporate and societal obligations, including setting the guidance, direction and policies for Barclays’ approach to customer and regulatory matters and Barclays’ Citizenship Strategy, including the management of Barclays’ economic, social and environmental contribution. |
| The Committee’s terms of reference are available at home.barclays/corporategovernance |
The Committee’s work
The significant matters addressed by the Committee during 2016 are described below:
| Area of focus | Matter addressed | Role of the Committee | Conclusion/action taken | |||
| Conduct risk | The risk of detriment to customers, clients, market integrity, competition or Barclays from the inappropriate supply of financial services, including instances of wilful or negligent misconduct. | § Discussed updates from management on conduct risk and requested the development of a dashboard report of conduct indicators to be presented to each meeting.
§ Monitored on a regular basis performance against agreed conduct risk indicators.
§ Debated the indicators that had been developed to measure material conduct risks and issues, including providing feedback on indicators for policy breaches.
§ Discussed with BIA its view of the management of conduct risk across the Group, with particular emphasis on maintaining focus on conduct risk through periods of change.
§ Provided input, via the Committee Chairman, to the scope of BIA’s review of the conduct risk programme.
§ Discussed directly with the senior management of Barclays International and Barclays UK their view of conduct and cultural issues in those businesses and the status of any initiatives in place to strengthen conduct and culture.
§ Confirmed with management that reviews had been undertaken to learn lessons from issues that had arisen at other banks and financial institutions, e.g. sales-based incentive schemes.
§ Tracked the levels of attestation by colleagues globally toThe Barclays Way, the Group’s code of conduct.
| The Committee requested further focus on product propositions and suitability and updates on product development and controls. In 2017, it will receive a quarterly report on new products. It provided input on the development of the dashboard, including requesting that it incorporates reports from BIA and draws on external data points where available. The Committee reiterated to management the importance of ensuring that the focus on conduct is maintained in those businesses or jurisdictions that Barclays is exiting or where it is reducing its presence. The Committee encouraged management to bring contingent workers into the scope ofThe Barclays Way training and arrangements are being made for all Committee members to complete the training themselves. | |||
The scope of any conduct risk adjustments to be taken into account by the Board Remuneration Committee when making remuneration decisions for 2016.
| § Considered the proposed adjustments to be made to the incentive pool from a conduct risk perspective. | The Committee endorsed the methodology used and the resulting adjustments proposed. | ||||
| 26 | Barclays PLC and Barclays Bank PLC 2016 Annual Report on Form 20-F |
Area of focus | Matter addressed | Role of the Committee | Conclusion/action taken | |||
| Cultural change | The progress being made on embedding of cultural change. | § Debated reports on the progress being made to effect cultural change across Barclays globally, discussing the measures being taken to define the desired culture and how it would be measured.
§ Requested that a single report of cultural indicators was developed for reporting to each meeting and monitored on a regular basis performance against the agreed indicators.
§ Discussed the status of the actions arising from the Banking Standards Board’s (BSB) 2015 assessment of Barclays, the progress of the 2016 assessment and the resulting 2016 assessment report, asking management for greaterco-ordination between the BSB’s work and internal employee surveys.
| Read more about the development of the culture measurement framework in the case study on page 28. | |||
| Complaints | Ensuring fair outcomes for customers by monitoring volumes of complaints received and the standard and quality of complaints handling processes. | § Requested the development of a dashboard report of complaints indicators to be presented to each meeting.
§ Monitored on a regular basis performance against agreed complaints indicators.
§ Discussed the way in which complaints are handled and the focus on resolving complaints at first point of contact.
§ Debated imminent industry-wide changes in the way in which reportable complaints are recorded and the potential for reputation risk.
| The Committee encouraged management to develop a way of defining and reporting on complaints in the Barclays International’s investment bank and a standard on complaint handling in that business will be issued in the first quarter of 2017. The Committee requested that additional information on the top root causes of complaints was included in future reports. | |||
| Citizenship | The status of Barclays’ Citizenship Plan 2016-2018, theShared Growth Ambition. | § Debated the targets to be set for the Shared Growth initiatives.
§ Agreed with the proposal to focus activity around the themes of access to employment, to financial and digital empowerment and to financing.
§ Assessed status updates on the progress of theShared Growth Ambition.
§ Requested the development of a dashboard report of citizenship indicators to be presented to each meeting and monitored on a regular basis performance against agreed indicators.
§ Considered and recommended to the Board for approval Barclays statement under the UK’s Modern Slavery Act, which can be found on Barclays’ website.
| The Committee provided feedback on how theShared Growth Ambition was articulated and requested additional information on the focus areas and metrics and how progress would be measured and reported. Its feedback was incorporated into the plan, which was launched in June 2016. | |||
| Reputation risk | Ensuring that Barclays anticipates, identifies and manages reputational issues that may impact it or the industry now or in the future. | § Monitored current reputation risk issues, including Barclays’ involvement in sensitive sectors such as defence or energy and fossil fuels.
§ Assessed emerging reputational issues, such as climate change and the relaxation of certain sanctions against Iran.
§ Evaluated the measures being taken to proactively build and manage Barclays’ reputation with stakeholders.
§ Assessed external opinion survey results, the trends in indicators and factors influencing the survey results, including the potential impact of the EU Referendum and government leadership changes in the UK and US.
§ Discussed the reputational risks associated with tax and how this was being managed across the Group, including the effectiveness of Barclays’ Tax Principles and Code of Conduct.
| The Committee provided feedback on the form and content of the reputation risk reports and how Barclays-specific and systemic risks might be monitored. It approved changes to Barclays’ Sanctions Policy with regard to sanctions with Iran. The Committee requested a regular report setting out a rolling12-month view of Barclays’ communications campaigns. It also requested and received an update on Barclays’ crisis management plans. It requested and received further information on Barclays’ business in low tax jurisdictions. It asked for and receives regular reports from the Tax Management Oversight Committee on the transactions it has reviewed. | |||
| Barclays PLC and Barclays Bank PLC 2016 Annual Report on Form 20-F | 27 |
Governance: Directors’ report
What we did in 2016
Board Reputation Committee Report
The Committee also covered the following matters:
§ discussed the progress of plans to develop the Barclays brand
§ endorsed the 2017 priorities for Barclays Corporate Relations team
§ assessed the revised ERMF from a conduct and reputation risk perspective and recommended it to the Board for approval
§ approved the 2016 Compliance business plan and tracked progress, including updates on resourcing and attrition levels |
§ received a report on management’s annual review of the effectiveness of compliance with the Volcker Rule (restrictions on proprietary trading and certain fund investments by banks operating in the US)
§ assessed and discussed a report on the Committee’s performance during 2015
§ approved revisions to its terms of reference and recommended them to the Board for approval.
| |||||||||||||
| Read more about Barclays’ risk management on pages 342 to 403. | |||||||||||||
Governance in Action – measuring cultural progress
A primary area of focus for the Committee in 2016 was providing challenge and support to management in its delivery of cultural change. The Group Executive Committee confirmed conduct, culture and values as one of its execution priorities for 2016, with the aim of monitoring cultural change and bringing together different cultural indicators to form a coherent and consolidated view of culture across Barclays.
Senior representatives from Compliance, Risk, HR and BIA presented to the Committee in early 2016 on the progress of implementing cultural change and proposals for developing a set of key indicators, along with clear governance structures and accountability for monitoring and sustaining cultural progress. The Committee debated and endorsed the following objectives:
§ identify the desired cultureend-state and how to measure progress towards achieving it
§ develop a cultural measurement tool that provides simple and consistent reporting relevant to all stakeholders
§ use the insights obtained to drive actions and further embed and sustain the desired values-based culture.
Ten cultural outcomes were identified, firmly linked to Barclays’ values:
|
For each desired cultural outcome, a set of internal qualitative and quantitative indicators was identified, along with external perception indicators. The indicators proposed were drawn from existing indicators used in the Group, such as the results from Your View (the employee opinion survey), results from Barrett Values Surveys of Barclays’ Executive and Senior Leadership Group, external opinion survey results, BIA reports, performance reviews and indicators relating to risk management and compliance. Assessing these indicators will ensure that ongoing efforts are focused on priority issues and challenges that may impede cultural transformation.
In debating and endorsing the proposed cultural outcomes and indicators, the Committee provided feedback to management. It discussed in particular:
§ how to embed the desired culture across middle-management and whether a targeted action plan was needed for this population
§ how structuring incentives in the right way, based on personal accountability, could help drive the right culture and behaviours
§ whether a more holistic approach was needed to performance reviews, with even more focus on rewarding how things were done, rather than what was achieved
§ that indicators based around the ‘how’ assessments from performance reviews might be incorporated as a measure of success
§ that existing indicators on audit issues and regulatory actions could be incorporated as a measure of success.
Feedback from the Committee was subsequently incorporated into the measurement tool. The Committee also requested the development of a culture dashboard, setting out quarterly performance against the agreed indicators. The first such report was made in September 2016, with a further report in December 2016, allowing the Committee to debate the results and trends and the areas identified for potential deep dive reviews or targeted action. During 2017, the Committee will continue to assess the quarterly indicators, the potential themes emerging and any specific challenges identified at a business and functional level. | |||||||||||
Value
|
Cultural outcomes
| |||||||||||
| Respect | Inclusion | Collaboration | ||||||||||
| Integrity | Speaking up | Personal accountability | ||||||||||
| Service | Customer/client centricity | Balanced short and long-term needs | ||||||||||
| Excellence | Simplicity and efficiency | High performance | ||||||||||
| Stewardship | Continuous improvement | Strong reputation | ||||||||||
| 28 | Barclays PLC and Barclays Bank PLC 2016 Annual Report on Form 20-F |
Governance: Directors’ report
What we did in 2016
Board Nominations Committee report
Dear Fellow Shareholders Following his appointment as Group Chief Executive at the end of 2015, Jes Staley has been building his Group Executive Committee. Board level consideration is required for appointments to the Group Executive Committee and throughout 2016 the Board Nominations Committee continued to embed its oversight of Group Executive Committee succession planning. The Committee was updated on Barclays’ talent and succession strategy and presented with role profiles and outputs from reviews of internal successors to Group Executive Committee roles. It is a key part of our role to be satisfied that there are proper processes in place for executive succession and at our regular meetings we discussed how potential successors are being provided with wider, relevant experience as part of their development.
Another ongoing area of focus for the Committee in 2016 was the composition of our subsidiary boards in light of the legal, regulatory and governance requirements of Structural Reform. A great deal of consideration has been given to ensuring the independence of the board and board committees of Barclays’ strategically significant subsidiaries, while allowing for collaboration between those boards and the Barclays Board. We have deliberated at length on the structure of the subsidiary boards and how they will report into and interact with our Group Board, which must continue to have appropriate oversight to ensure the effective operation of the Group and the protection of shareholder interests. During 2016, we finalised and recommended to the Board a set of Governance Guiding Principles, which document the high level expectations of the relationship that will exist between Barclays and its strategically significant subsidiaries.
The Committee regularly considered the balance of skills, experience and diversity needed on the Board during 2016. We refreshed the Board skills matrix to reflect the future strategy of the Group, identifying the attributes required to further strengthen and enhance the Board’s effectiveness. We conducted searches for newnon-executive Directors, approving the appointment of Mary Francis asnon-executive Director: Mary brings both financial services experience and significantnon-executive directorship experience to the Board. We also considered subsidiary board composition at each of our Committee meetings, with a particular focus on populating the strategically significant subsidiary boards as we continue to embed Structural Reform. It is fair to say that attracting candidates with the skills, experience and qualities we need remains a considerable task: serving on a bank board is not an undertaking that anyone considers lightly and our success in securing the right candidates has been necessarily limited by the challenges they perceive.
|
When considering Board and Board Committee composition and succession plans diversity remains at the front of our minds. We continued to receive regular updates on diversity and inclusion during 2016 and were pleased to hear that the number of women in senior leadership positions had increased for the third successive year. As a Board we met our target of 25% female representation by 2015 and are progressing towards the target we set ourselves last year of 33% female representation by 2020. Diversity is not just about gender, however, and we are always mindful of diversity in all of its forms, even where we have not set specific targets.
Certain responsibilities for me as Chairman of the Committee have been prescribed by the Senior Managers Regime that was introduced in the UK in March 2016. Under that regime, I am responsible for ensuring that the Committee remains independent and that it performs effectively, fulfilling the responsibilities expected of it by our regulators in terms of overseeing decisions around the structure, size, composition, diversity and performance of the Board. The report that follows describes how these responsibilities have been fulfilled. I would like to take this opportunity to thank my fellow Committee members for their continued support during 2016.
Committee performance The performance of the Committee was assessed as part of the annual Board effectiveness review and I am pleased to report that is was assessed to be performing effectively. An area identified for improvement was around ensuring that there are more regular reports to the Board on the status of recruitment of newnon-executive Directors, which I will address. The report on the Board effectiveness review contains more information and can be found on pages 33 to 35.
Looking ahead In 2017 we will continue to support the implementation of the new Group structure, ensuring that we have the right people in place to take Barclays forward. As appropriate, we will continue to make recommendations to the Board to ensure that we remain at the forefront of best practice corporate governance standards.
John McFarlane Chairman, Board Nominations Committee 22 February 2017 |


| Barclays PLC and Barclays Bank PLC 2016 Annual Report on Form 20-F | 29 |
Governance: Directors’ report
What we did in 2016
Board Nominations Committee report
Board Nominations Committee allocation of time (%) |
| |||||||||||||
|
2016 |
| 2015 | |||||||||||
 | 1 Corporate governance matters | 20 | 17 | |||||||||||
| 2 Board and Committee composition | 36 | 24 | ||||||||||||
| 3 Succession planning and talent | 31 | 47 | ||||||||||||
| 4 Board effectiveness | 8 | 6 | ||||||||||||
5 Other
| 5 | 6 | ||||||||||||
Committee composition and meetings
The Committee is composed solely of independentnon-executive Directors. John McFarlane, as Chairman of the Board, is also Chairman of the Committee. Mike Ashley, Tim Breedon, Crawford Gillies, and Sir Gerry Grimstone, being the Chairmen of each of the other Board Committees, and Reuben Jeffery, are also members of the Committee. Details of the skills and experience of the Committee members can be found in their biographies on pages3 and 4.
During 2016 there were seven meetings of the Committee, including one joint meeting with the Board Remuneration Committee. Three of these meetings were held at short notice to deal with specific matters. Attendance by members at Committee meetings is shown opposite and the chart above shows how the Committee allocated its time. Committee meetings were attended by the Group Chief Executive, with the Group HR Director, the Head of Talent, and the Global Head of Diversity and Inclusion attending as appropriate.
| Member |
|
Meetings attended/eligible to attend |
| |
| John McFarlane | 7/7 | |||
| Mike Ashley | 7/7 | |||
| Tim Breedon* | 4/7 | |||
| Crawford Gillies | 7/7 | |||
| Sir Gerry Grimstone* | 6/7 | |||
| Reuben Jeffery* | 6/7 |
| * | Did not attend certain meetings arranged and held at short notice owing to prior commitments |
Note
The Chairman and the Group Chief Executive excuse themselves from meetings when the Committee focuses on the matter of succession to their roles.
Committee role and responsibilities
The principal purpose of the Committee is to:
§ support and advise the Board in ensuring that the composition of the Board and its Committees is appropriate and enables them to function effectively
§ examine the skills, experience and diversity on the Board and plan succession for key Board appointments, planning ahead to deal with upcoming retirements and to fill any expected skills gaps
§ provide Board level oversight of the Group’s talent management programme and diversity and inclusion initiatives
§ agree the annual Board effectiveness review process and monitor the progress of any actions arising.
| You can find the Committee’s terms of reference at | |
| home.barclays/corporategovernance |
The Committee’s work
The significant matters addressed by the Committee during 2016 are described below:
Area of focus | Matter considered | Role of the Committee | Conclusion/action taken | |||
Board and Board Committee composition | The membership of the Board and the current and future composition of the Board and its Committees. | § Debated a forward-looking plan of the expected skills and experience needed on the Board in the context of future strategic direction.
§ Evaluated the revised Board skills matrix and, in consideration of known and expected changes to the Board, conducted a search fornon-executive Directors.
§ Reviewed the membership of Board Committees.
§ Considered and provided input to Board Committee Chairman succession plans. | The Committee approved the revised skills matrix and agreed to conduct a search for newnon-executive Directors in line with the requirements identified. It recommended the appointment of Mary Francis to the Board asnon-executive Director and she subsequently joined the Board with effect from 1 October 2016. The Committee concluded that additional accounting and auditing experience was needed in order to provide further options for succession to the Board Audit Committee chairmanship over time and a search for potential candidates continues.
Please refer to page 32 for more details of the Board’s approach to the recruitment of new Directors.
| |||
| 30 | Barclays PLC and Barclays Bank PLC 2016 Annual Report on Form 20-F | ||
| Area of focus | Matter considered | Role of the Committee | Conclusion/action taken | |||
| Executive succession planning and talent management | Group Executive Committee composition and succession following the appointment of the new Group Chief Executive in 2015.
Oversight of Group Chief Executive succession and appointments to key positions. | § Discussed updates from the Group HR Director on Group Executive Committee succession plans, including assessing emergency cover and the existing talent pipeline.
§ Considered external assessments and benchmarking of internal talent.
§ Debated approval requirements for appointments to the Group Executive Committee and other key positions across the Group.
| The Committee requested a presentation of key outputs from the Group Executive Committee offsite meeting on talent. It also asked to receive reports of the executive assessments carried out by an external facilitator. The Committee agreed the approval requirements for key positions, and subsequently approved the appointment of Tim Throsby as President of Barclays International in accordance with those requirements.
| |||
| Governance implications of Structural Reform and strategically significant subsidiary board composition | The board and board committee composition of strategically significant subsidiaries, including board size, structure and proposed interactions.
The governance principles for the relationship between Barclays and its strategically significant subsidiaries. | § Finalised Governance Guiding Principles for the Group post-Structural Reform, which set out ultimate decision-making powers, while respecting the rights and responsibilities of the boards of the strategically significant subsidiaries.
§ Debated the required structure and composition of the strategically significant subsidiary boards and board committees in light of regulatory requirements and feedback.
§ Scrutinised the proposed board skills matrix for Barclays UK.
§ Considered candidates for the positions of chairman of Barclays UK and Barclays International.
§ Considered appointments to the Board of, and the associated fees for, the US IHC board.
§ Considered appointments to the Barclays Africa board.
| The Committee endorsed and recommended the Governance Guiding Principles to the Board for approval. It agreed the structure of the strategically significant subsidiary boards and commenced a search fornon-executive directors, including for the position of chairman of Barclays UK, and agreed the process of the appointing of the chairman of Barclays International. The Committee approved the appointment of Directors to the US IHC board, including agreeing the fees to be paid to them. It also approved appointments to the Barclays Africa board. | |||
| Board effectiveness | The progress made against the actions identified in the 2015 Board effectiveness review.
The 2016 effectiveness review of the Board and its Committees. | § Discussed and agreed the proposed actions to be taken in response to the findings of the 2015 review.
§ Reassessed the status of the actions throughout the year and tracked the progress of the action plan.
§ Confirmed the process to be followed for the 2016 review.
| The Committee recommended the proposed action plan and 2016 Board objectives to the Board for approval. The Committee agreed and recommended the process for the 2016 effectiveness review, which proceeded as recommended. | |||
| Governance | Changes to the Board’s corporate governance framework following the implementation of the Senior Managers Regime in March 2016. | § Reviewed updates toCorporate Governance in Barclays and theCharter of Expectations following the implementation of the Senior Managers Regime in order to integrate the requirements into the existing corporate governance framework, applying particular focus to the updated individual role profiles.
| Approved and recommended to the Board for approval the updated corporate governance documents and role profiles for key positions on the Board. | |||
| Barclays PLC and Barclays Bank PLC 2016 Annual Report on Form 20-F | 31 |
Governance: Directors’ report
What we did in 2016
Board Nominations Committee report
In addition the Committee covered the following matters:
| § | received a presentation from the PRA on its annual review of Barclays |
| § | proposals for the 2016 Corporate Governance Report |
| § | review of the Committee’s effectiveness and its terms of reference. |
Appointment andre-election of Directors
Board and Board Committee composition is a standing item for consideration at each Committee meeting. This includes the consideration of potential newnon-executive Director appointments, both in respect of planned succession for known retirements and as a result of the ongoing review of the skills and experience needed on the Board in order for it to continue to operate effectively.
The Committee frequently considers a skills matrix for the Board, which identifies the core competencies, skills, diversity and experience required for the Board to deliver its strategic aims and govern the Group effectively. Each attribute identified in the skills matrix has a target weighting attached to it and these are regularly updated over time to reflect the needs of the Group. The Committee reviews the skills matrix when considering a new appointment to the Board, as well as reviewing the current and expected Board and Board Committee composition. This helps to determine a timeline for proposed appointments to the Board.
When recruiting a newnon-executive Director the specific skills that are needed are identified, for example, an individual with international experience, or recent history serving on a particular board committee. TheCharter of Expectationscontains the key competencies and skills expected ofnon-executive Directors, and these, in addition to other details such as expected time commitment, will be included in an individual specification. The Committee as a whole then considers curriculum vitae and references for potential candidates. Any candidates who are shortlisted will be interviewed by members of the Committee and, if applicable, key shareholders and Barclays’ regulators may be asked to provide feedback on the proposed appointment. The Board is updated on the progress of the recruitment and interview process, and any feedback from the interviews is provided to the Board alongside a recommendation for appointment.
Executive search firms Egon Zehnder, JCA Group and MWM Consulting were instructed to assist with the search fornon-executive Directors during 2016. None of these firms has any other connection to Barclays, other than to provide recruitment services. Open advertising for Board positions was not used in 2016, as the Committee believes that targeted recruitment is the optimal way of recruiting for Board positions. All of the firms used fornon-executive Director recruitment have signed up to the voluntary code of conduct for executive search firms, which include measures designed to improve gender diversity on boards.
In 2016, Barclays announced the appointment of Mary Francis asnon-executive Director and she joined the Board with effect from 1 October 2016. As previously reported, Mary has extensive board level experience across a range of industries. Wendy Lucas-Bull stood down from the Board in March 2016 following the announcement of Barclays’ intention to reduce its shareholding in Barclays Africa Group Limited, and Frits van Paasschen did not stand forre-election at the 2016 AGM.
The Directors in office at the end of 2016 were subject to an effectiveness review, as described on page 33. Based on the results of the review the Board accepted the view of the Committee that each Director proposed forre-election continues to be effective and that they each demonstrated the level of commitment required in connection with their role on the Board and the needs of the business. Diane de Saint Victor and Steve Thieke have each signalled their intention to retire from the Board at the 2017 AGM.
Diversity statement
The Board has had regard to two important publications that were issued in 2016: theHampton-Alexander Review recommendations to improve gender balance in FTSE leadership teams and theParker Review recommendations on the ethnic diversity of UK boards. The Committee reported last year that the Board had exceeded its target of 25% female Directors by the end of 2015 and had set a new target of 33% gender Board representation by 2020. This target has been formally reflected in the Board Diversity Policy, which can be found online at home.barclays/ corporategovernance. Below Board level the Group met its 2016 target of 24% female senior leaders. The Committee is mindful that the Group Executive Committee does not currently include any women, but is satisfied with the level of diversity across that Committee and with the percentage of women amongst the direct reports of Group Executive Committee members (25% at the end of 2016). To broaden the scope of the perspectives and contributions made to Group Executive Committee meetings an initiative was implemented by the Group Chief Executive during 2016 to create oneex-officio position on the Committee, with each appointee serving for a four-month rotation. The first appointee was Kathryn McLeland, Head of Investor Relations. With regard to ethnic diversity, the Board considers that Barclays is currently well-positioned in terms of representation at Board level and also at Group Executive Committee level when taking into account the Parker Review definition (being individuals of Black, East Asian, Latin American, Middle Eastern or South Asian ethno-cultural backgrounds).
During 2016, the Committee received regular updates from the Global Head of Diversity and Inclusion covering the full spectrum of Barclays’ diversity and inclusion agenda. For 2017, the Committee has requested additional information regarding social inclusion.
The Committee recognises the importance of ensuring that there is diversity of gender, ethnicity, geography and business experience on the Board, while continuing to recommend all appointments based on merit in the context of the skills and experience required. The Barclays Board female diversity target is noted in the Board skills matrix, which identifies the core competencies and skills needed for an effective Board. When executive search firms are engaged to assist with the recruitment of a new Director diversity is identified as a key factor. In addition, the external Board evaluation considered diversity when assessing the effectiveness of the Board.
 | More details on Barclays’ diversity and inclusion strategy can be found on page 48 |
| 32 | Barclays PLC and Barclays Bank PLC 2016 Annual Report on Form 20-F |
Review of Board and Board Committee effectiveness
Each year the Board conducts an externally facilitated self-assessment of the effectiveness of the Board, the Board Committees and the individual Directors. Independent Board Evaluation facilitated the effectiveness review for 2015 and was engaged to conduct the 2016 review, which built on the findings of the 2015 review, including assessing the progress of the actions that had been identified. Independent Board Evaluation is an independent external consultancy with no other connection to Barclays. In order to ensure that high quality feedback was received, Ffion Hague, the consultant, based the review onface-to-face interviews with the Directors. The Directors received an agenda prior to their interview, which focused on areas for improvement identified in the 2015 effectiveness review as well as any new issues that had emerged since that review was conducted. In addition to the interviews, Ffion Hague attended Board and Board Committee meetings as an observer, met with members of the Group Executive Committee, the Company Secretary and other members of senior management, along with seeking feedback from external stakeholders.
In December 2016, Independent Board Evaluation presented a report to the Board on the findings of the effectiveness review. In addition, the Chairman was provided with a report and feedback on the performance of each of the Directors, and the Senior Independent Director received a report on the Chairman. Board Committee chairmen received individual reports on the performance of the Board Committees.
Following consideration of the findings of the 2016 effectiveness review the Directors remain satisfied that the Board and each of the Board Committees are operating effectively. Progress relative to 2015 was good and the Board remains committed to making further changes to ensure that it is considered to be at the top of the range of effectiveness for a FTSE100 company. Following the conclusion of the review the Board Nominations Committee, with support from the Company Secretary, prepared a detailed action planning document. An overview of actions that were identified to help the Board to maintain and improve its effectiveness have been disclosed on the following pages 34 and 35, as well as an update on the actions taken following the 2015 effectiveness review.
| Barclays PLC and Barclays Bank PLC 2016 Annual Report on Form 20-F | 33 |
Governance: Directors’ report
What we did in 2016
Board Nominations Committee report
Review of Board and Board Committee Effectiveness
Board priorities
|
Leveraging Board experience in support of executives
|
Greater awareness of Board Committee work
| ||||||||
2015 findings To ensure that the Board agenda is optimised, including time for‘blue-sky’ discussion of major risks. | 2015 findings To continue to ensure that allnon-executive Directors have the opportunity to contribute to strategic debate. | 2015 findings To continue to raise awareness across all Board members of the significant issues considered by Board Committees and to continue to refine the remit and scope of the Board Reputation Committee.
| ||||||||
Actions taken in 2016 In early 2016 a set of Board objectives was agreed in order to track progress against the Board’s priorities.
Board agendas were updated to allow more time for discussion of strategic options. This was also the focus for the 2016 Board Strategy Offsite. Board dinners were used for more free-ranging discussions, with suggested topics notified to the Directors in advance. No decisions were taken or required as part of these discussions, which were used to inform the broader debate at subsequent Board meetings. | Actions taken in 2016 John McFarlane and Sir Gerry Grimstone took responsibility for ensuring that allnon-executive Directors were involved in strategic decision making.
In the course of the year, it was decided that partnering non-executive Directors with members of the Group Executive Committee would not be taken forward. However, the experience of non-executive Directors has been leveraged as appropriate, e.g. the appointments of Steve Thieke and Diane Schueneman to the board of Barclays US IHC. Non-executive Directors continue to make a valuable contribution to the Board and its Committees. | Actions taken in 2016 All Directors have access to Board Committee meeting papers and minutes, and have been reminded that they may attend Board Committee meetings whether or not they are members. Some Directors made use of this option during 2016. Board Committee Chairmen have continued to report to the Board on specific matters discussed at Board Committee meetings.
During 2016 Sir Gerry Grimstone, chairman of the Board Reputation Committee took action to define and focus its role and scope more clearly, including implementing new reporting initiatives such as the development of dashboard reports.
| ||||||||
2016 findings Create regular broad-based risk oversight sessions for the Board to allow Directors to look across the risk spectrum.
Schedule a debate on the role of the Board andnon-executive Directors and link the conclusions to revised Board objectives to help focus the Board’s agenda over the coming year. | 2016 findings The Board effectiveness review reported on positive and constructive relations between the new Board and the new management team. | 2016 findings Continue to optimise the information flow between Directors in therun-up to Structural Reform in 2018.
Consider agreeing common values for the Group and the banking subsidiary boards in the new structure.
For 2017 this finding will be renamed as ‘Optimise communication and collaboration between directors, boards and committees.’
| ||||||||
Actions to be taken in 2017 We will continue to identify opportunities for more free-ranging discussion of risk, including as part of the annual Board strategy session.
The role of the Group Board and Groupnon-executive Directors will be reviewed in the context of Structural Reform. | Actions to be taken in 2017 The Board will continue to support and challenge executive management, with particular focus on execution of strategy. | Actions to be taken in 2017 The Chairman will continue to use his meetings withnon-executive Directors ahead of Board meetings to ensure that allnon-executive Directors are briefed on current issues.
Opportunities for the Board (and, in due course, the banking subsidiary boards) to spend more time together around Board meetings will be identified.
Once the subsidiary boards are established, a common set of values will be agreed to supplement the Governance Guiding Principles that are already in place.
| ||||||||
| 34 | Barclays PLC and Barclays Bank PLC 2016 Annual Report on Form 20-F |
Improvements to the Board appointment process
|
Director induction |
Dealing more strategically with global regulation | ||||||||
2015 findings To continue to assess the skills and experience needed on the Board and to ensure that Board composition is balanced between UK and international members.
To enhance Board succession planning, particularly in respect of key roles.
| 2015 findings To enhance the Board training and induction programme, with particular focus on the training needs of Board members from outside the financial services sector. | 2015 findings To continue to provide opportunities for Board members to provide early input to thinking on major issues and decisions. | ||||||||
Actions taken in 2016 During 2016 a revised Board succession plan and updated skills matrix were presented to the Board Nominations Committee. The plan addresses immediate needs as well as longer-term requirements to take account of the tenure of non-executive Directors. The succession plan included succession to key roles and considered the optimum size of the Board. The future composition of the Board post-Structural Reform has also been considered.
In addition, the Board received updates on executive talent management and succession planning during 2016.
|
Actions taken in 2016 The Board training programme for 2016 included specific sessions aimed primarily atnon-executive Directors without a financial services background. Details of the training programme offered during 2016 can be foundon page 39. |
Actions taken in 2016 The Board’s agenda during 2016 focused more on strategic issues, including the capital and liquidity impacts of Structural Reform. For a description of the Board’s activity in 2016, including the input provided to management on the formulation of Group strategy and other significant decisions, see page 8 to 9. | ||||||||
2016 findings Continue to refine the Board skills matrix to ensure it aligns with the Group’s strategy and informs the succession plan for key Board roles. Implement more regular reporting to the Board on potentialnon-executive Directors under consideration.
|
2016 findings Continue to enhance the Director induction with a focus on providing broader governance training to anyone who has not previously served on a UK plc board. |
2016 findings Review reporting arrangements on strategy implementation and review the KPIs or dashboard reports for key initiatives.
For 2017 this finding will be renamed as ‘Optimise reporting to the Board on strategy and execution priorities.’ | ||||||||
Actions to be taken in 2017 The Board skills matrix will be kept under review, with separate skills matrices to be agreed with the respective chairmen of the banking subsidiaries. The Group Board succession plan will continue to be reviewed on a regular basis by the Board Nominations Committee and the Chairman will keep current Board members regularly updated on recruitment plans and potential candidates.
|
Actions to be taken in 2017 The Director induction programme will be reviewed and refreshed to factor in tailored governance training for new Directors. This is also being extended to directors of the new banking subsidiaries. |
Actions to be taken in 2017 The form and content of reporting to the Board will be reviewed and refreshed by management to ensure that the Board is provided with appropriate management information on strategy and execution priorities. Specific topics that the Board indicated that it wished to review have been factored into the 2017 Board agenda. | ||||||||
| Barclays PLC and Barclays Bank PLC 2016 Annual Report on Form 20-F | 35 |
Governance: Directors’ report
How we comply
Leadership
The Role of the Board
The Board of Directors is responsible for promoting the highest standards of corporate governance in Barclays. We act in a way that we consider promotes the success of Barclays for the benefit of shareholders as a whole, and are accountable to the shareholders for creating and delivering sustainable value. It is our responsibility as the Board to ensure that management not only delivers on short-term objectives, but promotes the long-term growth of Barclays. The existing corporate governance framework embeds the right culture, values and behaviours throughout the Group and supports our role in determining strategic objectives and policies.
In addition to setting strategy and overseeing its implementation we are also responsible for ensuring that management maintains an effective system of internal control. An effective system of internal control should provide assurance of effective and efficient operations, internal financial controls and compliance with law and regulation. In meeting this responsibility we consider what is appropriate for the Group’s business and reputation, the materiality of financial and other risks and the relevant costs and benefits of implementing controls.
The Board is the decision-making body for matters that, owing to their strategic, financial or reputational implications or consequences, are considered significant to the Group. A formal schedule of powers reserved to the Board ensures that our control of these key decisions is maintained. A summary of the matters reserved to the Board can be found at home.barclays/corporategovernance. It includes the approval of appointments to the Board, Barclays’ strategy, financial statements, capital expenditure and any major acquisitions, mergers or disposals.
Board Governance framework
The main Board Committees are the Board Audit Committee, the Board Nominations Committee, the Board Remuneration Committee, the Board Reputation Committee and the Board Risk Committee. Under the authority of our Articles of Association, each Board Committee has had specific responsibilities delegated to it by the Board. Further information on the role and activities of each of the Board Committees can be found in this report and in their individual terms of reference, which have been approved by the Board and are available at barclays/corporategovernance.
In addition, the Regulatory Investigations Committee was formed in 2012 and focuses on providing Board-level oversight of regulatory investigations. In 2016 the Committee met five times. John McFarlane is the Committee Chairman and the other Committee members are Mike Ashley, Sir Gerry Grimstone, Diane de Saint Victor and Jes Staley.
| 36 | Barclays PLC and Barclays Bank PLC 2016 Annual Report on Form 20-F |
Board Governance framework
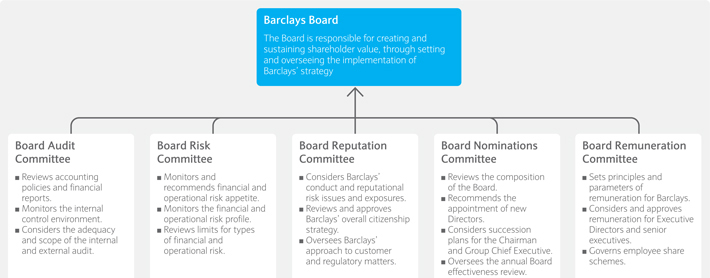
Roles on the Board
Executive andnon-executive Directors share the same duties and are subject to the same constraints but, in line with the principles of the Code, a clear division of responsibilities has been established. It is the responsibility of the Chairman to lead and manage the work of the Board, while responsibility for theday-to-day management of Barclays has been delegated to the Group Chief Executive. The Group Chief Executive is supported in this role by the Group Executive Committee. Further information on membership of the Group Executive Committee can be found on page 5.
As a Board we have set out our expectations of each Director inBarclays’ Charter of Expectations. This includes role profiles and the behaviours and competencies required for each role on the Board, namely the Chairman, Deputy Chairman, Senior Independent Director,non-executive Directors, executive Directors and Committee Chairmen. The Board Nominations Committee reviews theCharter of Expectations annually to ensure it remains relevant andup-to-date. It is published on home.barclays/corporategovernance to ensure that there is complete transparency of the standards we set for ourselves.
| Barclays PLC and Barclays Bank PLC 2016 Annual Report on Form 20-F | 37 |
Governance: Directors’ report
How we comply
Attendance
| As members of the Board of Directors we are expected to attend each Board meeting and in 2016 we attended both scheduled and additional Board meetings, as disclosed in the table below. The Chairman met privately with thenon-executive Directors ahead of each scheduled Board meeting, and if, owing to exceptional circumstances, a Director was not able to attend a Board meeting they ensured that their views were made known to the Chairman in advance of the meeting. |
Board attendance | Independent | Scheduled meetings eligible to attend | Scheduled meetings attended | % attendance | Additional meetings eligible to attend | Additional meetings attended | % attendance | |||||||
Group Chairman | ||||||||||||||
John McFarlane | On appointment | 8 | 8 | 100 | 2 | 2 | 100 | |||||||
Executive Directors | ||||||||||||||
Tushar Morzaria | Executive Director | 8 | 8 | 100 | 2 | 2 | 100 | |||||||
Jes Staley | Executive Director | 8 | 8 | 100 | 2 | 2 | 100 | |||||||
Non-executive Directors | ||||||||||||||
Mike Ashley | Independent | 8 | 8 | 100 | 2 | 1 | 50 | |||||||
Tim Breedon | Independent | 8 | 8 | 100 | 2 | 2 | 100 | |||||||
Mary Francis | Independent | 2 | 2 | 100 | 0 | 0 | n/a | |||||||
Crawford Gillies | Independent | 8 | 8 | 100 | 2 | 2 | 100 | |||||||
Sir Gerry Grimstone | Senior Independent Director | 8 | 8 | 100 | 2 | 2 | 100 | |||||||
Reuben Jeffery III† | Independent | 8 | 7 | 88 | 2 | 1 | 50 | |||||||
Dambisa Moyo | Independent | 8 | 8 | 100 | 2 | 2 | 100 | |||||||
Diane de Saint Victor† | Independent | 8 | 7 | 88 | 2 | 2 | 100 | |||||||
Diane Schueneman | Independent | 8 | 8 | 100 | 2 | 2 | 100 | |||||||
Steve Thieke | Independent | 8 | 8 | 100 | 2 | 2 | 100 | |||||||
Former Directors | ||||||||||||||
Wendy Lucas-Bull | Non-independent | 1 | 1 | 100 | 1 | 1 | 100 | |||||||
Frits van Paasschen | Independent | 3 | 3 | 100 | 1 | 1 | 100 | |||||||
Secretary | ||||||||||||||
Claire Davies | 1 | 1 | 100 | 0 | 0 | n/a | ||||||||
Former Secretary | ||||||||||||||
Lawrence Dickinson | 7 | 7 | 100 | 2 | 2 | 100 | ||||||||
† Unable to attend one scheduled meeting owing to prior commitments. | ||||||||||||||
Board Committee cross-membership | ||||||||||||||
| Board Audit Committee | Board Nominations Committee | Board Remunerations Committee | Board Reputation Committee | |||||||||||
Board Risk
| 3 | 3 | 1 | 1 | ||||||||||
Board Reputation
| 1 | 2 | 2 | |||||||||||
Board Remuneration
| 2 | 2 | ||||||||||||
Board Nominations
| 3 | |||||||||||||
| ||||||||||||||
| 38 | Barclays PLC and Barclays Bank PLC 2016 Annual Report on Form 20-F |
Effectiveness
Composition of the Board
In line with the requirements of the Code a majority of the Board are independentnon-executive Directors. The Board currently comprises a Chairman, who was independent on appointment, two executive Directors and tennon-executive Directors. We consider the independence of ournon-executive Directors annually, using the independence criteria set out in the Code and by reviewing performance against behaviours that we have identified as essential in order to be considered independent. The independence criteria can be found inCorporate Governance in Barclays at home.barclays/ corporategovernance.
The Board Nominations Committee considers Board succession planning and regularly reviews the composition of the Board and the Board Committees to ensure that there is an appropriate balance and diversity of skills, experience, independence and knowledge. The size of the Board is not fixed and may be revised from time to time to reflect the changing needs of the business and the Board Nominations Committee will consider the balance of skills and experience of current Directors when considering a proposed appointment.
Each year we carry out an effectiveness review in order to evaluate our performance as a Board, as well as the performance of each of the Board Committees and individual Directors. This annual review assesses whether each of us continues to discharge our respective duties and responsibilities effectively and is considered when deciding whether individual Directors will offer themselves for election orre-election at the AGM. More information on the 2016 Board effectiveness review can be found on page33.
Our biographies containing our relevant skills and experience, Board Committee membership and other principal appointments can be found on pages 3 and 4. Details of changes to the Board in 2016 and year to date are disclosed on page43.
The service contracts for the executive Directors and the letters of appointment for the Chairman andnon-executive Directors are available for inspection at our registered office.
Time commitment
It is expected that in order to discharge our responsibilities effectively we will each allocate sufficient time to our role on the Board. We are expected to attend, and to be well prepared for, all Board and Board Committee meetings, as well as making time to understand the business, meet with executives and regulators, and complete ongoing training. As stated in ourCharter of Expectations,time commitment is agreed with eachnon-executive Director on an individual basis. Disclosed below is the average expected time commitment for the role ofnon-executive Director and the othernon-executive positions on the Board. For these additional positions there is an expectation that, in order to effectively fulfil extra responsibilities, additional time commitment is required.
| Role | Expected time commitment | |
| Chairman | 80% of a full time position | |
| Deputy Chairman | At least 0.5 days a week | |
| Senior Independent Director | As required to fulfil the role | |
| Non-executive Director | 30 days a year (membership of one Board Committee included, increasing to 40 days a year if a member of two Board Committees) | |
| Committee Chairmen | At least 60 days a year (includingnon-executive Director time commitment) |
The Chairman must commit to expend whatever time is necessary to fulfil his duties and, while this is expected to be equivalent to 80% of a full time position, his Chairmanship of the Group and leadership of the Board has priority over other business commitments. In exceptional circumstances we are all expected to commit significantly more time to our work on the Board.
Induction
On appointment to the Board all Directors receive a comprehensive induction which is tailored to the new Director’s individual requirements. The induction schedule is designed to quickly provide the new Director with an understanding of how the Group works and the key issues that it faces. The Company Secretary consults the Chairman when designing an induction schedule, giving consideration to the particular needs of the new Director. When a Director is joining a Board Committee the schedule includes an induction to the operation of that committee.
On completion of the induction programme the Director should have sufficient knowledge and understanding of the nature of the business, and the opportunities and challenges facing Barclays, to enable them to effectively contribute to strategic discussions and oversight of the Group.
In 2016 Sir Gerry Grimstone and Mary Francis both received induction programmes on joining the Board. In line with normal practice, they met with the Company Secretary, the currentnon-executive Directors and members of the Group Executive Committee and the Senior Leadership Group. In addition, Sir Gerry Grimstone met with Sir Michael Rake, the outgoing Deputy Chairman and Senior Independent Director, and former Chairman of the Board Reputation Committee.
Training and development
In order to continue to contribute effectively to Board and Board Committee meetings we are regularly provided with the opportunity to take part in ongoing training and development. As part of our annual performance review with the Chairman we discuss any particular development needs that can be met through either formal training or meeting with a particular senior executive.
The Company Secretary organises a formal training schedule for the year, covering both Board and Board Committee training requirements, to ensure that our insight into the Group’s business and awareness of the external environment in which we operate continues after our formal induction schedules have been completed.
During 2016 we attended briefings on the following subjects:
| § | capital and liquidity (including regulatory targets and constraints) |
| § | the Federal Reserve’s CCAR exercise |
| § | group Resilience |
| § | cyber Risk |
| § | a presentation from Compliance and Regulatory Relations on the regulatory expectations of Directors and the PRA’s threshold conditions |
| § | a briefing from Finance and Risk on the impact of IFRS9 |
| § | an accounting update presented by KPMG |
| § | an update on the implementation of the Senior Managers Regime |
| § | strategic planning and crisis management plans ahead of the EU Referendum |
| § | internal briefings on Structural Reform. |
These briefing sessions were supplemented by written material, such as a briefing note on the implementation of the Market Abuse Regulation in the UK.
In addition, site visits were arranged to Barclays UK and Cards US operations, as well as the regular business visits and engagements that we may undertake. This included the attendance of our Board Audit Committee Chairman and Board Risk Committee Chairman at US IHC board committee meetings at Barclays’ offices in New York.
Conflicts of interest
In accordance with the Companies Act 2006 and the Articles of Association the Board has the authority to authorise conflicts of interest. Directors are required to declare any potential or actual conflicts of interest that could interfere with their ability to act in the best interests of the Group. The Company Secretary maintains a conflicts register, which is a record of actual and potential conflicts, together with any Board authorisation of the conflict. The authorisations are for an indefinite period but are reviewed annually by the Board Nominations Committee. The Board retains the power to vary or terminate the authorisation at any time.
| Barclays PLC and Barclays Bank PLC 2016 Annual Report on Form 20-F | 39 |
Governance: Directors’ report
How we comply
Information provided to the Board
The Role Profile for the Chairman, as set out in ourCharter of Expectations, confirms his responsibility for ensuring that membersof the Board receive accurate, timely and high-quality information. In particular, we require information about Barclays’ performance to enable us to take sound decisions, monitor effectively and provide advice to promote the success of the Company. Working in collaboration with the Chairman, the Company Secretary is responsible for ensuring good governance and consults Directors to ensure that good information flows exist and that the Board receives the information it requires in order to be effective.
Throughout the year both the executive Directors and senior executives keep the Board informed of key developments in the business through regular reports and updates. These are in addition to the presentations that the Board and Board Committees receive as part of their formal meetings. Directors are able to seek independent and professional advice at Barclays’ expense, if required, to enable Directors to fulfil their obligations as members of the Board.
Accountability
Risk management and internal control
The Directors are responsible for ensuring that management maintains an effective system of risk management and internal control and for assessing its effectiveness. Such a system is designed to identify, evaluate and manage, rather than eliminate, the risk of failure to achieve business objectives and can only provide reasonable and not absolute assurance against material misstatement or loss.
Barclays is committed to operating within a strong system of internal control that enables business to be transacted and risk taken without exposing itself to unacceptable potential losses or reputational damage. Barclays has an overarching framework that sets out the Group’s approach to internal governance,The Barclays Guide, which establishes the mechanisms and processes by which the Board directs the organisation, through setting the tone and expectations from the top, delegating its authority and assessing compliance.
A key component ofThe Barclays Guide is theEnterprise Risk Management Framework (ERMF). The purpose of the ERMF is to identify and set minimum requirements in respect of the main risks to achieving the Group’s strategic objectives and to provide reasonable assurance that internal controls are effective. The key elements of the Group’s system of internal control, which is aligned to the recommendations ofThe Committee of Sponsoring Organizations of the Treadway Commission, Internal Control – Integrated Framework (2013 COSO), are set out in the risk control frameworks relating to each of the Group’s Principal and Key Risks. As well as incorporating our internal requirements, these reflect material Group-wide legal and regulatory requirements relating to internal control and assurance.
Effectiveness of internal controls
Key controls are assessed on a regular basis for both design and operating effectiveness. Issues arising out of business risk and control assessments and other internal and external sources are examined to identify pervasive themes. Where appropriate, control issues are reported to the Board Audit Committee (BAC). In addition, regular reports are made to the BAC by management, BIA and the Finance, Compliance and Legal functions covering, in particular, financial controls, compliance and other operational controls.
Risk management and internal control framework
The ERMF is the Group’s Internal Control Framework. It is refreshed annually and has been substantially revised during 2016. The BAC receives quarterly reports relating to the effectiveness of the Control Environment covering all risks and controls including financial, operational and compliance risk.
The BAC formally reviews the system of internal control and risk management annually. Throughout the year ended 31 December 2016 and to date, the Group has operated a system of internal control that provides reasonable assurance of effective operations covering all controls, including financial and operational controls and compliance with laws and regulations. Processes are in place for identifying, evaluating and managing the principal risks facing the Group in accordance with the ‘Guidance on Risk Management, Internal Control and Related Financial and Business Reporting’ published by the Financial Reporting Council.
The review of the effectiveness of the system of risk management and internal control is achieved through a four-step approach which is centred on reviewing the effectiveness of the Barclays Guide and its component parts:
| 1. | Governance Risk & Control meetings of the Business and Functional Executive Committees monitor, review and challenge the effective operation of key risk management and control processes, including the results of audits and reviews undertaken by BIA (which include assessments of the Control Environment and Management Control Approach) and examinations and assessments undertaken by our primary regulators, on an ongoing basis as part of the system of risk management and internal control. The remediation of issues identified within the Control Environment is regularly monitored by management and the BAC. |
| 2. | Testing of the Governance Risk and Control meetings held within the Executive Committees provides assurance that the committees are effectively overseeing the Control Environment and associated risk management and internal control processes. |
| 3. | The owners of the key governance processes which compriseThe Barclays Guideundertake a review to confirm that processes have been implemented. |
| 4. | The annual review of the system of risk management and internal control brings together the results of the activities completed in steps 1 to 3 to ensure that each of the key processes has been effectively reviewed. |
Regular reports are made to the Board covering risks of Group level significance. The Board Risk Committee and the Board Reputation Committee examine reports covering the Principal Risks (Credit Risk, Market risk, Capital Risk, Liquidity Risk, Operational Risk and Conduct Risk) as well as reports on risk measurement methodologies and risk appetite. Further details of risk management procedures and potential risk factors are given in the Risk Management section on pages86 to 114.
Controls over financial reporting
A framework of disclosure controls and procedures is in place to support the approval of the Group’s financial statements. The Legal and Technical Review Committee is responsible for examining the Group’s financial reports and disclosures to ensure that they have been subject to adequate verification and comply with applicable standards and legislation. The Committee reports its conclusions to the Disclosure Committee. The Disclosure Committee examines the content and accuracy of the disclosures and reports its conclusions to the Board Audit Committee which debates its conclusions and provides further challenge. Finally, the Board scrutinises and approves results announcements and the Annual Report, and ensures that appropriate disclosures have been made. This governance process ensures that both management and the Board are given sufficient opportunity to debate and challenge the Group’s financial statements and other significant disclosures before they are made public.
| 40 | Barclays PLC and Barclays Bank PLC 2016 Annual Report on Form 20-F |
Management’s report on internal control over financial reporting
Management is responsible for establishing and maintaining adequate internal control over financial reporting. Internal control over financial reporting is a process designed under the supervision of the principal executive and principal financial officers to provide reasonable assurance regarding the reliability of financial reporting and the preparation of financial statements for external reporting purposes in accordance with International Financial Reporting Standards (IFRS) as adopted by the European Union and issued by the International Accounting Standards Board (IASB). Internal control over financial reporting includes policies and procedures that pertain to the maintenance of records that, in reasonable detail, accurately and fairly reflect transactions and dispositions of assets; provide reasonable assurances that transactions are recorded as necessary to permit preparation of financial statements in accordance with IFRS and that receipts and expenditures are being made only in accordance with authorisations of management and the respective Directors; and provide reasonable assurance regarding prevention or timely detection of unauthorised acquisition, use or disposition of assets that could have a material effect on the financial statements.
Internal control systems, no matter how well designed, have inherent limitations and may not prevent or detect misstatements. Also, projections of any evaluation of effectiveness to future periods are subject to the risk that internal controls may become inadequate because of changes in conditions, or that the degree of compliance with the policies or procedures may deteriorate.
Management has assessed Barclays PLC Group’s and Barclays Bank PLC Group’s internal control over financial reporting as of 31 December 2016. In making its assessment, management has utilised the criteria set forth by the 2013 COSO framework. Management concluded that, based on its assessment, the internal control over financial reporting was effective as of 31 December 2016. Our independent registered public accounting firm has issued a report on the Barclays PLC’s internal control over financial reporting, which is set out on page218.
The system of internal financial and operational controls is also subject to regulatory oversight in the UK and overseas. Further information on supervision by the financial services regulators is provided under Supervision and Regulation in the Risk review section on pages182 to 189.
Changes in internal control over financial reporting
There have been no changes in the Group’s internal control over financial reporting that occurred during the period covered by this report which have materially affected or are reasonably likely to materially affect the Group’s internal control over financial reporting.
Remuneration
The Board has delegated responsibility for the consideration and approval of the remuneration arrangements of the Chairman, executive Directors, other senior executives and certain Group employees to the Board Remuneration Committee. The Board as a whole, with thenon-executive Directors abstaining, considers annually the fees paid tonon-executive Directors. Information on the activities of the Board Remuneration Committee in 2016 can be found on pages 51 to 85 of the Directors’ remuneration report, which forms part of the corporate governance statement.
Stakeholder engagement
Investor engagement
The Board is committed to promoting effective channels of communication with our shareholders and upholding good corporate governance as a means of building stronger and more engaged relationships with them. Our comprehensive Investor Relations engagement with the market helps us to understand investor views about Barclays, which are communicated regularly to the Board. Our shareholder communication guidelines, which underpin all investor engagement, are available on our website at home.barclays/barclays-investor-relations.
Institutional investors
In 2016, our Investor Relations engagement with institutional investors took place throughout the year, both following our quarterly results as well as outside of the reporting cycle. This allowed the opportunity for existing and potential new investors to engage with Barclays regularly, promoting dialogue on longer-term strategic developments as well as on the recent financial performance of the Group.
The Directors, in conjunction with the senior executive team and Investor Relations, participated in varied forms of engagement, including investor meetings, seminars and conferences across many geographic locations, reflecting the diverse nature of our equity and debt institutional ownership. Divisional management also presented extensively to investors, promoting greater awareness and understanding of our operational businesses.
During 2016, discussions with investors were focused on the continued execution of our strategy, following the appointment of Jes Staley as Group Chief Executive, and the strategic update announced on 1 March 2016.
Investor meetings focused on corporate governance also took place throughout the year, with the Chairman, Senior Independent Director, other Board representatives and the Company Secretary.
We held conference calls/webcasts for our quarterly results briefings and anin-person presentation for our 2015 full year results in March 2016, all hosted by the Group Chief Executive and Group Finance Director. In addition, the Group Finance Director held a quarterly breakfast briefing for sellside analysts, with a transcript of the discussions uploaded to our website. For fixed income investors we held conference calls at our full year and half year results, hosted by our Group Finance Director and Group Treasurer.
The Investor Relations section of our website is an important communication channel that enables the effective distribution of information to the market in a clear and consistent manner. Executive management presentations, speeches and, where possible, webcast replays are uploaded to our website on a timely basis. In 2016, we also created an improved ‘About Barclays’ factsheet, allowing investors the opportunity to understand Barclays’ strategy and key financial metrics at a glance. We also continued to provide short videos summarising the key messages in our results from our Group Chief Executive and Group Finance Director.
| Barclays PLC and Barclays Bank PLC 2016 Annual Report on Form 20-F | 41 |
Governance: Directors’ report
How we comply
Private shareholders
During 2016, we continued to communicate with our private shareholders through our shareholder mailings. Shareholders can also choose to sign up to Shareview so that they receive information about Barclays and their shareholding directly by email. On a practical level, over 60,000 shareholders did not cash their Shares Not Taken Up (SNTU) cheque following the Rights Issue in September 2013. In 2016, we continued the tracing process to reunite these shareholders with their SNTU monies and any unclaimed dividends. By the end of 2016, we had returned over £1.65m to our shareholders in addition to the £2.2m returned in 2015. We also launched a Special Share Dealing Service in November 2016 aimed at shareholders with relatively small shareholdings for whom it might otherwise be uneconomical to deal. One option open to shareholders was to donate their sale proceeds to ShareGift. As a result of this initiative, more than £100,000 was donated.
Our AGM
The Board and the senior executive team continue to consider our AGM as a key date in the diary. The AGM provides us with our main opportunity to engage with shareholders, particularly our private shareholders, on the key issues facing the Group and any questions they may have. A number of Directors, including the Chairman, were available for informal discussion either before or after the meeting. All resolutions proposed at the 2016 AGM, which were considered on a poll, were passed with votes for ranging from 86% to 99.9% of the total votes cast.
The 2017 AGM will be held on wednesday 10 May 2017 at the Royal Festival Hall in London. The Notice of AGM can be found in a separate document, which is sent out at least 20 working days before the AGM and also made available at home.barclays/agm. Voting on the resolutions will again be by poll and the results will be announced via the Regulatory News Service and made available on our website on the same day. We encourage any shareholders who are unable to attend on the day to vote in advance of the meeting via home.barclays/ investorrelations/vote or through Shareview (www.shareview.co.uk).
Engagement timeline
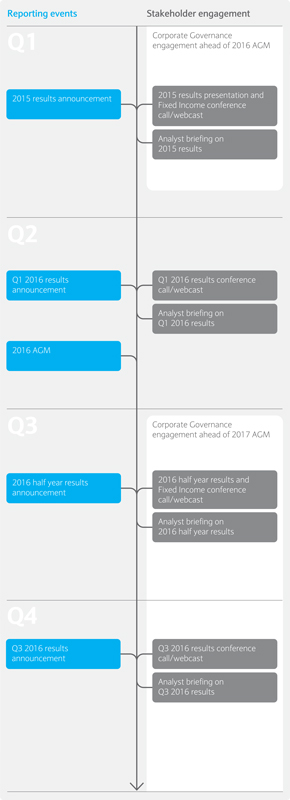
| 42 | Barclays PLC and Barclays Bank PLC 2016 Annual Report on Form 20-F |
Governance: Directors’ report
Other Statutory Information
The Directors present their report together with the audited accounts for the year ended 31 December 2016.
| ||
Other information that is relevant to the Directors’ report, and which is incorporated by reference into this report, can be located as follows:
| ||
Page | ||
| Employee involvement | 47 | |
| Policy concerning the employment of disabled persons | 49 | |
| Financial instruments | 242 | |
| Hedge accounting policy | 226 | |
| Remuneration policy, including details of the | 51 to 85 | |
| remuneration of each Director and Directors’ interests in shares | ||
| Corporate governance report | 2 to 42 | |
| Risk review | 86 to 189 | |
| Disclosures required pursuant to Listing Rule 9.8.4R can be found on the following pages: | ||
Page | ||
| Long-term incentive schemes | 63 | |
| Director emoluments | 302 | |
| Allotment for cash of equity securities | 284 | |
| Waiver of dividends | 43 | |
Profit and dividends
Statutory profit after tax for 2016 was £2,828m (2015: £623m). The final dividend for 2016 of2.0p per share will be paid on 5 April 2017 to shareholders whose names are on the Register of Members at the close of business on 3 March 2017. With the interim dividend totalling 1.0p per ordinary share, paid in September 2016, the total distribution for 2016 is3.0p (2015: 6.5p) per ordinary share. The interim and final dividends for 2016 amounted to £757m (2016: £1,081m).
The nominee companies of certain Barclays’ employee benefit trusts holding shares in Barclays in connection with the operation of the Company’s share plans have lodged evergreen dividend waivers on shares held by them that have not been allocated to employees. The total amount of dividends waived during the year ended 31 December 2016 was £2.6m (2015: £6.4m).
Board of Directors
The names of the current Directors of Barclays PLC, along with their biographical details, are set out on pages 3 and 4 and are incorporated into this report by reference. Changes to Directors during the year are set out below.
| Name | Role | Effective date of appointment/ resignation | ||
| Sir Gerald (Gerry) Grimstone | Non-executive Director | Appointed 1 January 2016 | ||
| Mary Francis | Non-executive Director | Appointed 1 October 2016 | ||
| Wendy Lucas-Bull | Non-executive Director | Retired 1 March 2016 | ||
| Frits van Paasschen | Non-executive Director | Retired 28 April 2016 |
Appointment and retirement of Directors
The appointment and retirement of Directors is governed by the Company’s Articles of Association (the Articles), the UK Corporate Governance Code (the Code), the Companies Act 2006 and related legislation.
The Articles may only be amended by a special resolution of the shareholders. The Board has the power to appoint additional Directors or to fill a casual vacancy amongst the Directors. Any such Director holds office only until the next AGM and may offer himself/herself forre-election. The Code recommends that all directors of FTSE 350 companies should be subject to annualre-election and all Directors will stand for election orre-election at the 2017 AGM with the exception of Diane de Saint Victor and Steve Thieke.
| Barclays PLC and Barclays Bank PLC 2016 Annual Report on Form 20-F | 43 |
Governance: Directors’ report
Other statutory information
Directors’ indemnities
Qualifying third party indemnity provisions (as defined by section 234 of the Companies Act 2006) were in force during the course of the financial year ended 31 December 2016 for the benefit of the then Directors and, at the date of this report, are in force for the benefit of the Directors in relation to certain losses and liabilities which they may incur (or have incurred) in connection with their duties, powers or office. In addition, the Company maintains Directors’ & Officers’ Liability Insurance which gives appropriate cover for legal action brought against its Directors.
Qualifying pension scheme indemnity provisions (as defined by section 235 of the Companies Act 2006) were in force during the course of the financial year ended 31 December 2016 for the benefit of the then Directors, and at the date of this report are in force for the benefit of directors of Barclays Pension Funds Trustees Limited as Trustee of the Barclays Bank UK Retirement Fund. The directors of the Trustee are indemnified against liability incurred in connection with the company’s activities as Trustee of the Barclays Bank UK Retirement Fund.
Similarly, qualifying pension scheme indemnities were in force during 2016 for the benefit of directors of Barclays Executive Schemes Trustees Limited as Trustee of Barclays Bank International Limited Zambia Staff Pension Fund (1965), Barclays Capital International Pension Scheme (No.1), and Barclays PLC Funded Unapproved Retirement Benefits Scheme. The directors of the Trustee are indemnified against liability incurred in connection with the company’s activities as Trustee of the schemes above.
Political donations
The Group did not give any money for political purposes in the UK, the rest of the EU or outside of the EU, nor did it make any political donations to political parties or other political organisations, or to any independent election candidates, or incur any political expenditure during the year.
In accordance with the US Federal Election Campaign Act, Barclays provides administrative support to a federal Political Action Committee (PAC) in the US funded by the voluntary political contributions of eligible employees. The PAC is not controlled by Barclays and all decisions regarding the amounts and recipients of contributions are directed by a steering committee comprising employees eligible to contribute to the PAC. Contributions to political organisations reported by the PAC during the calendar year 2016 totalled $12,500 (2015: $79,500).
Environment
Barclays focuses on addressing environmental issues where we believe we have the greatest potential to make a difference. We focus on managing our own carbon footprint and reducing our absolute carbon emissions; developing products and services to help enable the transition to alow-carbon economy, and managing the risks of climate change to our operations, clients, customers and society at large. We invest in improving the energy efficiency of our operations and offset the emissions remaining through the purchase of carbon credits. We also have a long-standing commitment to managing the environmental and social risks associated with our lending practices, which is embedded into our Credit Risk processes. A governance structure is in place to facilitate clear dialogue across the business and with suppliers around issues of potential environmental and social risk.
We have disclosed global greenhouse gas emissions that we are responsible for as set out by ‘The Companies Act 2006 (Strategic Report and Directors’ Report) Regulations 2013’. We provide fuller disclosure on (i) financing solutions for the lower carbon economy, (ii) environmental risk management and (iii) management of our carbon and environmental footprint in the Barclays Environmental, Social and Governance (ESG) Supplement available on our website at home. barclays.com/citizenship.
| | Current reporting yeara 2016 | | | Previous reporting yearb 2015 | | | Previous reporting yearc 2014 | | | Comparison yeard 2013 |
| |||||
Global GHG emissions | ||||||||||||||||
Total CO2e (tonnes)e | 678,412 | 712,916 | 830,668 | 968,781 | ||||||||||||
Scope 1 CO2e emissions (tonnes)f | 46,571 | 56,642 | 49,994 | 58,176 | ||||||||||||
Scope 2 CO2e emissions (tonnes)g | 538,783 | 520,098 | 655,426 | 723,993 | ||||||||||||
Scope 3 CO2e emissions (tonnes)h | 93,059 | 136,176 | 125,248 | 186,612 | ||||||||||||
Intensity Ratioi | ||||||||||||||||
Total full time employees (FTE) | 119,300 | 129,400 | 132,300 | 139,600 | ||||||||||||
Total CO2e per FTE (tonnes) | 5.69 | 5.51 | 6.28 | 6.94 | ||||||||||||
Scope 2 market based emissions (tonnes)j | 596,198 |
Notes
| a | 2016 Reporting Year covers Q4 2015 and Q1, 2, 3 of 2016. The carbon reporting year is not fully aligned to the financial reporting year covered by the Directors’ report. |
| b | 2015 Reporting Year covers Q4 2014 and Q1, 2, 3 of 2015. |
| c | 2014 Reporting Year covers Q4 2013 and Q1, 2, 3 of 2014. |
| d | 2013 Reporting Year covers Q4 2012 and Q1, 2, 3 of 2013. |
| e | The methodology used to calculate our CO2 e emissions is the operational control approach on reporting boundaries as defined by the World Resources Institute/ World Business Council for Sustainable Development (WRI / WBCSD) Greenhouse Gas Protocol (GHG): A Corporate Accounting and Reporting Standard, Revised Edition. Where properties are covered by Barclays consolidated financial statements but are leased to tenants who are invoiced for utilities, these emissions are not included in the Group GHG calculations. We also capture consumption from properties which are yet to be consolidated by Barclays and as such Barclays still is responsible for the utility cost. |
| f | Scope 1 covers direct combustion of fuels and company owned vehicles (from UK and South Africa only, which is the most material contributors). Fugitive emissions reported in Scope 1 for 2013 – 2016 cover emissions from Americas, Asia-Pacific and South Africa. Scope 1 fugitive emissions excludes the UK whilst we amend our governance procedures in the UK Business travel is reported in Scope 1. |
| g | Scope 2 covers emissions from electricity and steam purchased for own use. Scope 2 emissions are using location based emission factors. Please see line below for Scope 2 Market Based emissions. |
| h | Scope 3 covers indirect emissions from business travel (global flights and ground transport from the UK and South Africa). From 2014 onwards car hire data covers the USA and India. Ground transportation data (excluding Scope 1 company cars) covers only countries where this type of transport is material and data is available. |
| i | Intensity ratio calculations have been calculated using location based emission factors only. |
| j | Scope 2 Market Based emissions have been reported for 2016 only. |
Research and development
In the ordinary course of business the Group develops new products and services in each of its business divisions.
| 44 | Barclays PLC and Barclays Bank PLC 2016 Annual Report on Form 20-F |
Share capital
Share capital structure
The Company has ordinary shares in issue. The Company’s Articles also allow for the issuance of sterling, US dollar, euro and yen preference shares (preference shares). No preference shares have been issued as at 20 February 2017 (the latest practicable date for inclusion in this report). Ordinary shares therefore represent 100% of the total issued share capital as at 31 December 2016 and as at 20 February 2017 (the latest practicable date for inclusion in this report). Details of the movement in ordinary share capital during the year can be found in Note31 on page 284.
Voting
Every member who is present in person or represented at any general meeting of the Company, and who is entitled to vote, has one vote on a show of hands. Every proxy present has one vote. The proxy will have one vote for and one vote against a resolution if he/she has been instructed to vote for or against the resolution by different members or in one direction by a member while another member has permitted the proxy discretion as to how to vote. On a poll, every member who is present or represented and who is entitled to vote has one vote for every share held. In the case of joint holders, only the vote of the senior holder (as determined by order in the share register) or his proxy may be counted. If any sum payable remains unpaid in relation to a member’s shareholding, that member is not entitled to vote that share or exercise any other right in relation to a meeting of the Company unless the Board otherwise determine. If any member, or any other person appearing to be interested in any of the Company’s ordinary shares, is served with a notice under section 793 of the Companies Act 2006 and does not supply the Company with the information required in the notice, then the Board, in its absolute discretion, may direct that that member shall not be entitled to attend or vote at any meeting of the Company. The Board may further direct that if the shares of the defaulting member represent 0.25% or more of the issued shares of the relevant class, that dividends or other monies payable on those shares shall be retained by the Company until the direction ceases to have effect and that no transfer of those shares shall be registered (other than certain specified excepted transfers). A direction ceases to have effect seven days after the Company has received the information requested, or when the Company is notified that an excepted transfer of all of the relevant shares to a third party has occurred, or as the Board otherwise determines.
Transfers
Ordinary shares may be held in either certificated or uncertificated form. Certificated ordinary shares shall be transferred in writing in any usual or other form approved by the Secretary and executed by or on behalf of the transferor. Transfers of uncertificated ordinary shares shall be made in accordance with the Companies Act 2006 and CREST Regulations.
The Board is not bound to register a transfer of partly-paid ordinary shares or fully-paid shares in exceptional circumstances approved by the FCA. The Board may also decline to register an instrument of transfer of certificated ordinary shares unless it is duly stamped and deposited at the prescribed place and accompanied by the share certificate(s) and such other evidence as reasonably required by the Board to evidence right to transfer, it is in respect of one class of shares only, and it is in favour of a single transferee or not more than four joint transferees (except in the case of executors or trustees of a member).
In accordance with the provisions of Section 84 of the Small Business, Enterprise and Employment Act 2015, preference shares may only be issued in registered form. Preference shares shall be transferred in writing in any usual or other form approved by the Secretary and executed by or on behalf of the transferor. The Company’s registrar shall register such transfers of preference shares by making the appropriate entries in the register of preference shares. Each preference share shall confer, in the event of a winding up or any return of capital by reduction of capital (other than, unless otherwise provided by their terms of issue, a redemption or purchase by the Company of any of its issued shares, or a reduction of share capital), the right to receive out of the surplus assets of the Company available for distribution amongst the members and in priority to the holders of the ordinary shares and any other shares in the Company ranking junior to the relevant series of preference shares
and pari passu with any other class of preference shares (other than any class of shares then in issue ranking in priority to the relevant series of preference shares), repayment of the amount paid up or treated as paid up in respect of the nominal value of the preference share together with any premium which was paid or treated as paid when the preference share was issued in addition to an amount equal to accrued and unpaid dividends.
Variation of rights
The rights attached to any class of shares may be varied either with the consent in writing of the holders of at least 75% in nominal value of the issued shares of that class, or with the sanction of a special resolution passed at a separate meeting of the holders of the shares of that class. The rights of shares shall not (unless expressly provided by the rights attached to such shares) be deemed varied by the creation of further shares ranking equally with them or subsequent to them.
Limitations on foreign shareholders
There are no restrictions imposed by the Articles of Association or (subject to the effect of any economic sanctions that may be in force from time to time) by current UK laws which relate only tonon-residents of the UK and which limit the rights of suchnon-residents to hold or (when entitled to do so) vote the ordinary shares.
Exercisability of rights under an employee share scheme
Employee Benefit Trusts (EBTs) operate in connection with certain of the Group’s Employee Share Plans (Plans). The trustees of the EBTs may exercise all rights attached to the shares in accordance with their fiduciary duties other than as specifically restricted in the relevant Plan governing documents. The trustees of the EBTs have informed the Company that their normal policy is to abstain from voting in respect of the Barclays shares held in trust. The trustees of the Global Sharepurchase EBT and UK Sharepurchase EBTs may vote in respect of Barclays shares held in the EBTs, but only as instructed by participants in those Plans in respect of their partnership shares and (when vested) matching and dividend shares. The trustees will not otherwise vote in respect of shares held in the Sharepurchase EBTs.
Special rights
There are no persons holding securities that carry special rights with regard to the control of the Company.
Major shareholdersa
Major shareholders do not have different voting rights from those of other shareholders. Information provided to the Company by substantial shareholders pursuant to the FCA’s Disclosure Guidance and Transparency Rules are published via a Regulatory Information Service and is available on the Company’s website. As at 31 December 2016, the Company had been notified under Rule 5 of the Disclosure Guidance and Transparency Rules of the following holdings of voting rights in its shares.
| Person interested | | Number of Barclays shares |
| | % of total voting rights issued share | | ||
| The Capital Group Companies Inc.b | 1,172,090,125 | 6.98 | ||||||
| Qatar Holding LLCc | 1,017,455,690 | 5.99 | ||||||
| BlackRock, Inc.d | 922,509,972 | 5.45 | ||||||
| Norges Bank | 512,348,359 | 3.03 |
Notes
| a | Significant shareholders for the last 3 years are shown on page 331. |
| b | The percentage of voting rights detailed above was calculated at the time of the relevant disclosures made in accordance with Rule 5 of the Disclosure Guidance and Transparency Rules. |
| c | The Capital Group Companies Inc (CG) holds its shares via CG Management companies and funds. Part of the CG holding is held as American Depositary Receipts. |
| d | Qatar Holding LLC is wholly-owned by Qatar Investment Authority. |
| e | Total shown includes 3,860,531 contracts for difference to which voting rights are attached. Part of the holding is held as American Depositary Receipts. On 19 January 2017, BlackRock, Inc. disclosed by way of a Schedule 13G filed with the SEC, beneficial ownership of 1,054,988,420 ordinary shares of the Company as of 31 December 2016, representing 6.2% of that class of shares. |
| Barclays PLC and Barclays Bank PLC 2016 Annual Report on Form 20-F | 45 |
Governance: Directors’ report
Other Statutory Information
Between 31 December 2016 and 20 February 2017 (the latest practicable date for inclusion in this report) the Company was notified that Norges Bank now holds 508,175,594 Barclays shares, representing 2.996% of the total voting rights attached to issued share capital.
Powers of Directors to issue or buy back the Company’s shares
The powers of the Directors are determined by the Companies Act 2006 and the Company’s Articles. The Directors are authorised to issue and allot shares and to buy back shares subject to annual shareholder approval at the AGM. Such authorities were granted by shareholders at the 2016 AGM. It will be proposed at the 2017 AGM that the Directors be granted new authorities to allot and buy back shares.
Repurchase of shares
The Company did not repurchase any of its ordinary shares during 2016 (2015: none). As at 20 February 2017 (the latest practicable date for inclusion in this report) the Company had an unexpired authority to repurchase ordinary shares up to a maximum of 1,681m ordinary shares.
Change of control
There are no significant agreements to which the Company is a party that are affected by a change of control of the Company following a takeover bid. There are no agreements between the Company and its Directors or employees providing for compensation for loss of office or employment that occurs because of a takeover bid.
Going concern
The Group’s business activities, financial position, capital, factors likely to affect its future development and performance, and its objectives and policies in managing the financial risks to which it is exposed are discussed in the Risk Management section.
The Directors considered it appropriate to prepare the financial statements on a going concern basis.
Disclosure of information to the auditor
Each Director confirms that, so far as he/she is aware, there is no relevant audit information of which the Company’s auditors are unaware and that each of the Directors has taken all the steps that he/she ought to have taken as a Director to make himself/herself aware of any relevant audit information and to establish that the Company’s auditors are aware of that information. This confirmation is given pursuant to section 418 of the Companies Act 2006 and should be interpreted in accordance with and subject to those provisions.
Directors’ responsibilities
The following statement, which should be read in conjunction with the report of the independent registered public accounting firm set out on page218, is made with a view to distinguishing for shareholders the respective responsibilities of the Directors and of the auditors in relation to the accounts.
The Directors are required by the Companies Act 2006 to prepare accounts for each financial year and, with regards to Group accounts, in accordance with Article 4 of the IAS Regulation. The Directors have prepared Group and individual accounts in accordance with IFRS as adopted by the EU. The accounts are required by law and IFRS to present fairly the financial position and performance of the Company and the Group for that period. The Companies Act 2006 provides, in relation to such accounts, that references to accounts giving a true and fair view are references to fair presentation.
The Directors consider that, in preparing the accounts on pages 216 to 316, and the additional information contained on pages 86 to 189, the Group has used appropriate accounting policies, supported by reasonable judgements and estimates, and that all accounting standards which they consider to be applicable have been followed.
Having taken all the matters considered by the Board and brought to the attention of the Board during the year into account, the Directors are satisfied that the Annual Report and Financial Statements, taken as a whole, are fair, balanced and understandable, and provide the information necessary for shareholders to assess the Company’s position and performance, business model and strategy.
Directors’ responsibility statement
The Directors have responsibility for ensuring that the Company and the Group keep accounting records which disclose with reasonable accuracy the financial position of the Company and the Group and which enable them to ensure that the accounts comply with the Companies Act 2006.
The Directors are responsible for the maintenance and integrity of the Company’s website. Legislation in the UK governing the preparation and dissemination of financial statements may differ from legislation in other jurisdictions.
The Directors have a general responsibility for taking such steps as are reasonably open to them to safeguard the assets of the Group and to prevent and detect fraud and other irregularities.
The Directors, whose names and functions are set out on pages 3 and 4, confirm to the best of their knowledge that:
| (a) | the financial statements, prepared in accordance with the applicable set of accounting standards, give a true and fair view of the assets, liabilities, financial position and profit or loss of the Company and the undertakings included in the consolidation taken as a whole; and |
| (b) | the management report, which is incorporated in the Directors’ Report on pages 2 to 46, includes a fair review of the development and performance of the business and the position of the Company and the undertakings included in the consolidation taken as a whole, together with a description of the principal risks and uncertainties that they face. |
By order of the Board

Claire Davies
Company Secretary
22 February 2017
Registered in England.
Company No. 48839
| 46 | Barclays PLC and Barclays Bank PLC 2016 Annual Report on Form 20-F |
Governance: People
Culture and Values
We are four years into a cultural change journey at Barclays. Over this period we have defined a common set of values and embedded them across the organisation, ensuring they are recognised and understood by our employees. We recognise that fostering the right culture at Barclays is critical to our success and we have placed continued focus on the importance of a values based culture to the organisation. Early in 2016 conduct, culture and values was established as one of the strategic priorities for the year, and within that we have developed a culture measurement framework to manage and measure progress in embedding a values based culture across Barclays. This framework is anchored in our values and through quarterly indicators and insights we are able to assess what we are doing well and where we might need to focus attention and prioritise management action across our businesses and functions. The quarterly indicators and insights are presented to the Board Reputation Committee and the Group Executive Committee and shared with our senior leadership teams with a view to becoming an integral part of our regular management reporting so that we can ensure our priorities and decisions are focused in the right areas. The insights from the indicators and metrics within the culture measurement framework this year support the view that our ongoing efforts are having a positive impact in continuing to create a culture that will help us build the Barclays of the future.
Your View
Engagement of our employees is one of the key indicators of cultural health and we recognise the importance of listening to our colleagues and maintaining an open,two-way dialogue. The views of our colleagues shape the decisions we make, helping us create an environment in which colleagues want to work, and which in turn we believe will drive high performance. To ensure that we constantly review and reappraise to see what is working, in 2016, the annual Your View survey, our employee opinion survey, became a quarterly pulse survey excluding Africa, providing colleagues the opportunity on a more regular basis to say how it feels to work at Barclays. In the third quarter of the year, we surveyed 50% of all colleagues and the remaining 50% were surveyed in the fourth quarter. Starting from 2017, each quarter 25% of colleagues excluding Africa will be invited to take part in Your View.
The Your View results have continued to measure Sustainable Engagement and this year we have been provided with more regular snapshots. The quarterly results were then aggregated at the end of the year into an overall annual picture of engagement. At the end of 2016 Sustainable Engagement of our colleagues has remained stable year on year at 75%. Areas of particular strength from the annual results include: colleagues feeling safe to speak up (81% favourable, up 6% points on 2015); colleagues feeling proud of the contribution Barclays makes to the community and society (88% favourable, up 3% points on 2015) and employees feeling respected regardless of their job (83% favourable, up 4% points on 2015). In addition, the commitment and discretionary effort of employees continues to be very high with 94% saying they believe they work beyond what is required of them to help Barclays succeed. Along with the insights from the quarterly indicators within the culture measurement framework, these results evidence that we continue to make strong progress in embedding a values based culture across the bank.
Leadership and Learning
Our leadership and learning solutions are underpinned by our values and are focused on supporting our colleagues to develop critical skills and capabilities. Both the Barclays Academy and our Global Curriculum provide colleagues with development resources, through a variety of formats and content. In 2016 our employees spent an average of 40 hours each on training through formal programmes, in addition to having access to many other informal learning opportunities that are not captured through our learning management system. We continue to assess candidate alignment to our Values and Behaviours through our recruitment and promotion processes and we also ensure new joiners attend the ‘Being Barclays’ Global Induction programme, which provides anin-depth experience of the Values. All colleagues are required to attest and demonstrate their understanding of expected behaviours through the Global Code of Conduct (The Barclays Way).
This year a new event was launched, sponsored by the Group CEO, to
begin to develop the next generation of enterprise leaders who actively contribute towards rebuilding the profession of banking through their own leadership and their influence of others. By bringing together high potential senior leaders from across our businesses and functions we seek to strengthen collaboration and an enterprise wide perspective amongst our senior leaders to deliver improved solutions and products for our customers and clients.
We have continued to launch and refresh learning and leadership initiatives with particular focus on supporting the development of line managers. Examples include our Manager Excellence Programme, the iLead programme for high potential Directors, and the Senior Leadership Development programme in the Banking business. All our leadership development activities follow a common principle of leaders teaching leaders, creating opportunities for knowledge sharing across different parts of Barclays.
Early careers and apprenticeships
Barclays is committed to helping people achieve their ambitions when they enter the world of work whether they are a young person entering the workplace for the first time or an experienced professional seeking to develop new skills. Barclays Early Careers proposition includes graduate, internship and apprenticeship programmes and in 2016 we hired over 750 interns and 700 graduates. Since 2012 we have created over 3,000 apprenticeships. We provide pathways for progression from apprentice to graduate supported by recognised qualifications and, in doing so, help to create an internal talent pipeline.
The ambition in 2016 for our apprenticeship programmes was to widen accessibility and ensure our programmes are fully inclusive. We expanded our Bolder Apprenticeship Programme, targeting long-term unemployed adults over the age of 24, and we also piloted our Able to Enable Programme targeting the long-term unemployed who have a disability. These programmes along with our place on the UK Government’s Apprenticeship Delivery Board reflect our commitment to tackling societal issues and attracting diverse talent. Throughout 2016 we have continued to receive external recognition for our apprenticeship programmes.
We have transformed the way we recruit for our EMEA Internship and Graduate programmes to deliver an improved candidate experience and to ensure that we are assessing candidates against the right skills and qualities. This recruitment process helps to drive diversity and inclusion as students are able to demonstrate ability and potential throughout the process so that recruitment outcomes are based on performance and not on the basis of academic grades, universities attended and previous work experience. This year in the Americas we rolled out our first ‘Sophomore Springboard’ programme aimed at preparing a diverse range of students for an internship in their junior year. This was the first phase of a two year strategy to identify diverse talent early on.
Industrial relations
Barclays has a long-standing partnership approach to industrial relations and we value the relationships we have with over 30 trade unions, works councils and staff associations around the world. Within the UK we have a formal partnership with Unite which has been in place for over 15 years and is one of the longest standing partnerships in the UK. Throughout 2016, we have continued to have regular, constructive dialogue with employee representatives on a wide range of topics that impact our employees in order to seek their feedback prior to implementation. Regional consultation forums have also provided a platform for bringing together and engaging employee representatives on a wide range of topics that affect the interests of our employees.
Managing change
Where restructuring is necessary to support our strategy, we have consulted on proposals with our recognised trade unions or employee forums and impacted employees, prior to implementation. In line with our Values and to ensure we treat all colleagues with respect, we seek to avoid compulsory redundancies wherever possible and we try to find ways in which we can achieve this during consultation. We continue to place significant emphasis on both voluntary redundancy programmes as well as internal redeployment through our ‘Internals First’ programme. Internals First supports colleagues who have been impacted by change and provides individual support to ensure that we retain talent within
| Barclays PLC and Barclays Bank PLC 2016 Annual Report on Form 20-F | 47 |
Governance: People
Barclays. In 2016, over 1,000 colleagues registered for Internals First support and we redeployed 32% of them within Barclays. Throughout 2016, colleagues have attended Internals First careers and networking events and opted for outplacement support services. When an employee does leave Barclays as a consequence of restructuring, our commitment is to ensure that they are given the best support for the next stage in their career. To achieve this, Barclays provides a global career transition service which offers personalised advice and support for employees placed at risk of redundancy. We also hope to keep in touch with former colleagues through the Barclays Global Alumni Programme which provides a platform for current and former employees to connect with Barclays and one another through global networking events, monthlye-newsletters and access to career opportunities.
Internal Mobility
During 2016 internal mobility has been a key focus. Being able to attract and retain talented individuals, as well as provide them with the opportunity to take control of their career and development at Barclays is one of our most important ambitions. Our aim is that by supporting internal mobility across Barclays and making it simple and easy for colleagues to move internally, we are successfully retaining and developing our internal talent. To promote this and provide colleagues with opportunities to broaden their experience, the Group CEO launched ‘Apply Within’, our internal mobility programme, early in 2016. We have developed multiple tools and resources for colleagues to find new internal career opportunities and for managers to find and assess suitable internal candidates. Global careers fairs, the Barclays Mentoring Tool and enhancements to the ‘My Career’ online portal, which was launched in 2015, are part of the campaign. Thousands of colleagues have visited the ‘My Career’ portal this year to update career profiles, upload CVs and import LinkedIn profiles and our Resourcing teams have sought to match vacant roles to colleagues’ skills and aspirations. We have increased our internal recruitment percentage to 48% firm wide (excluding Africa).
Wellbeing
By actively supporting employees to be healthy and happy, we will deliver better outcomes for colleagues, for Barclays and for society. Our global wellbeing programme ‘Be Well’ launched in 2015 and has focused on health education, a Global Speaker Series, health risk identification, prevention and management as well as new leadership and management programmes to help line managers support colleagues. The insights developed this year through our wellbeing programme help to identify themes and areas to focus on in 2017.
Performance Management
Barclays approach to performance management is key to enabling the delivery of our strategy and to continue to embed a values-based culture. Colleagues align their objectives (‘what’ they will deliver) to business and team goals to support the delivery of our strategy and good customer outcomes. Behavioural expectations (‘how’ they will achieve their objectives) are set in the context of our Values. This year we have enhanced the focus on balancing the ‘what’ and the ‘how’ through the launch of our ‘Let’s talk about how’ campaign to remind colleagues that ‘how’ they achieve their objectives is just as important as ‘what’ they achieve. Both the campaign and the ‘Values in Action’ framework provide tools and resources for colleagues to bring to life the behaviours that underpin our Values and to enhance the quality of performance reviews.
Our global recognition programme provides colleagues the opportunity to recognise the outstanding achievements of those who have demonstrated our Values. We continue to see a year on year increase in the number of colleagues receiving a Values ‘Thank You’ message from a fellow colleague, with over 250,000 sent in 2016.
Colleagues are also encouraged to be involved with the company’s performance by participating in ourall-employee share plans, which have been running successfully for over 10 years.
Barclays regularly updates employees regarding the financial and economic factors affecting the company’s performance throughout the year, using a variety of communications channels. These include CEO and senior leader communications, line manager briefing packs, video
interviews and talking points which are distributed to employees every quarter to coincide with Barclays’ financial reporting calendar. They are all designed to build awareness and understanding of Barclays’ results and the broader macroeconomic environment, and to drive dialogue. We also hold a variety of events for employees to hear directly from the CEO and the Group Executive Committee and to ask them questions.
We have also recently introduced an ‘Ask the Experts’ communication which gives perspectives from across the bank on what Barclays’ results mean and how they are received by different stakeholders. Flagship campaigns are released to all employees each quarter, covering topics such as wellbeing, recognition and dynamic working to raise awareness of the tools being introduced to help them develop their careers at Barclays and to provide them with the opportunity to understand and engage in employee initiatives. Colleagues are also kept informed through regular intranet and email updates about the progress Barclays is making across activity such as Diversity and Inclusion and Performance Management.
Employees are invited to share their opinion on what it is like to work at Barclays through regular interactive events with senior leaders. These events provide employees with the opportunity to discuss their perspective on a range of areas to help senior management understand what is working well and where we need to improve. Any changes that are implemented as a result of colleague feedback are communicated through leadership briefings and engagement initiatives across each business and function.
Diversity and Inclusion
Barclays’ global Diversity and Inclusion (D&I) strategy establishes objectives, initiatives and plans across each of five core pillars: Gender, LGBT, Disability, Multicultural and Multigenerational. As an organisation we remain focussed on increasing the diversity of our employees and by continuing to foster an inclusive culture we seek to ensure that employees of all backgrounds are treated equally and have the opportunity to be successful.
In recognition of this in 2016 we have continued to develop opportunities to attract and retain a diverse pipeline of talented employees across the bank. This year we have launched new initiatives including our ‘Encore!’ Returnship Programme which offers leadership development and training opportunities to professionals who have taken a career break and are looking to re-enter the workforce. Also launched in 2016 is our Able to Enable apprenticeship initiative which targets the long-term unemployed who have a disability. Working with Remploy and by providing a bespoke, supportive selection process, which includes a 13 week development experience, we hope to provide opportunities for this population.
In June we announced enhancements to our US Leave of Absence policies for Childcare and Military Leave, supporting our commitment to creating a diverse and inclusive environment through policies that help employees successfully integrate their profession and personal lives.
Providing leadership development to ensure we are continuing to build an inclusive work environment is paramount to our diversity strategy and in 2016 our Unconscious Bias Training, previously delivered to over 8,000 senior leaders, was deployed to our junior populations with over 1,900 attending workshops to date.
We always have more to do, but are pleased when our progress towards greater inclusion is recognised. During 2016, we continued to receive national and international recognition from respected organisations such as the Business Disability Forum in the UK, Human Rights Campaign in the US and Community Business for our achievements, citing our D&I work as innovative, robust and sustainable.
Gender
Sustaining progress towards increasing female representation at all levels across Barclays remains a core focus of our talent management and leadership succession processes. Across our organisation and the financial services industry we hope to see more females in senior roles and we are determined to enable women to fulfil their career aspirations. As referenced in the Board Nominations Committee section on pages 29 to 35 we revised our Board Diversity Policy in 2015 to reflect our new target of minimum 33% female representation on our Board by 2020.
| 48 | Barclays PLC and Barclays Bank PLC 2016 Annual Report on Form 20-F |
Our Board membership currently has 31% female representation, reflecting that we are on track to meet our 2020 target.
As a founding signatory of the HM Treasury Women in Leadership Charter and supporter of the Hampton-Alexander Review we proactively set gender targets and at the end of 2016 female representation across the senior leadership population stood at 24% representing the third consecutiveyear-on-year increase and progress towards our 2018 Women in Leadership goal of 26%. In line with the recommendations from the Hampton-Alexander Review, from 2017, we will publish the combined number of women on the Group Executive Committee and in the direct reports to the Executive Committee. At the end of 2016 female representation across this population stood at 25%. We will also use the review output to inform the update of our Women in Leadership targets.
At all levels our gender pipeline has continued to strengthen thanks to extensive programmes which focus on building capability and capacity, such as our Global Women in Leadership conference with over 5,000 colleagues participating, the ‘Encore!’ Returnship Programme and the number of female graduate hires we have made increasing from 31% in 2014 to 39% in 2016. The Barclays Women’s Initiatives Network (WiN) also provides targeted development and networking opportunities such as group mentoring, careers fairs, and events helping to connect both junior and senior colleagues from across the organisation.
Recognising our efforts, we were invited to be a corporate IMPACT champion by the United Nations in their HeForShe campaign on gender equality. Internally we have asked colleagues to show their support by pledging a specific commitment that will contribute to gender parity. Since launching HeForShe, 60% of new members are male and many are now taking a more visible role as mentors and sponsors, helping to contribute towards gender diversity and greater inclusion. Staying at the vanguard of good practice requires sustained commitment and we value independent assessment that allows us to calibrate our approach. For the ninth year running, we were pleased to be included in The Times Top 50 Workplaces for Women in the UK, and for the fourth successive year to be named in ‘Working Mother’ 100 Best Companies in the US.
Female representation
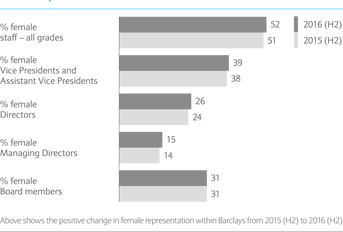
LGBT
An inclusive culture is vital for colleagues to have the freedom and choice to bring their whole selves to work. Enabling that culture, are our ‘Spectrum Allies’- colleagues who are committed to inclusion and equality. By educating others and visibly supporting equality, allies help to make LGBT colleagues, friends and family feel safer and more comfortable in leading their lives. The Spectrum Allies campaign has identified over 7,000 colleagues globally as LGBT allies in 2016.
‘#nofilter’ was the theme of Pride in London 2016, which we were proud to be the headline sponsor of for the third consecutive year. More than 1,100 colleagues, leaders, friends and family came together for Pride in London and hundreds of colleagues marched at the head of the parade in June. Events for our colleagues, customers and clients took place throughout June to celebrate Pride month, and a partnership between the BUK Marketing Team and Thomson Reuters resulted in a successful social media campaign, including over 10,000 downloads of the Pride in London smartphone application, in which Barclays’ ‘nofilter’ advert was
highlighted.
Barclays ATM messaging conveyed our advocacy for IDAHOBIT (International Day Against Homophobia, Biphobia and Transphobia) and for World Aids Day, £ for £ matching augmented colleague fundraising for organisations leading on the treatment and prevention of HIV and Aids.
Independent recognition reflects the sustained impact of our global work. Stonewall continue to name us as one of just eight ‘Star Performer’ organisations seen as leaders globally. Role-model colleagues were this year recognised in the Financial Times OUTstanding list of 100 LGBT business leaders, and in the Pride Power List. Awards simply serve to motivate us to continue to shape our culture so that colleagues really can bring their whole selves to work. Through the Your View survey we provide colleagues with the opportunity to identify as being LGBT, with 3% of colleagues identifying as being LGBT in 2016.
Disability
Our aspiration to become ‘the most accessible bank’ remains firm. Progressing our aim, this year in partnership with the Lord Mayor of the City we expanded our internal campaign, ‘This Is Me’, into the City of London to encourage other organisations to join in eliminating the stigma associated with mental health issues. Over 70 organisations have already signed up for ‘This is Me in The City’. Through our corporate accessibility portal, we have now made our learning on accessibility and inclusion available for any organisation.
We give continued to give full and fair consideration to applications from candidates who may have a disability. Our people processes ensure all colleagues can progress their careers, with comprehensive training and development including our Disability Confident eLearning, and through tailored and needs-based workplace adjustments where relevant. This year we reviewed our Workplace Adjustment process to make it simpler and easier for colleagues and our Adjustment Passport outlines colleagues’ reasonable adjustments to eliminate the need for colleagues to inform new line managers and to increase the ease of internal mobility. Employees who become disabled during their employment with us can access a full range of services and support ensuring we retain their talent.
Our efforts were recognised when Barclays achieved 98% in the Business Disability Forum’s world-renown Disability Standard – the highest ever score awarded to any organisation since the introduction of the Disability Standard in 2004.
Multigenerational
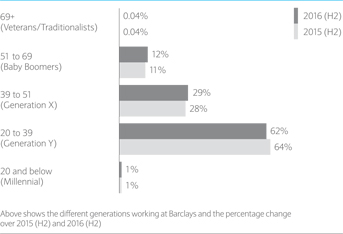
We benefit from the diverse perspectives of employees from five generations and need to ensure our workplace is inclusive for all. Dynamic Working, our signature campaign relevant to colleagues every life stage with the strapline of ‘how do your work your life’, is encouraging the integration of personal and professional responsibilities through smarter work patterns.
| Barclays PLC and Barclays Bank PLC 2016 Annual Report on Form 20-F | 49 |
Governance: People
As an example of our commitment to colleagues in different life stages, we are one of the eight founding members in the Equality and Human Rights Commissions (EHRC) Working Forward campaign that aims to make British workplaces the best they can be for pregnant women and working mothers. Our Working Families network is supporting the campaign by running integration workshops for returners from parental and adoption leave.
The Emerge network supports colleagues early in their career or new to financial services and the multigenerational composition of our workforce. This year a global reverse mentoring programme was launched with over 200 successful reverse mentoring partnerships established. Our Bolder Apprentice Programme continues to grow and our Returnship programmes, both in the UK and US, are proving to be successful.
Changing careers is also important, which is why our Armed Forces Transitioning, Employment and Rehabilitation (AFTER) programme continued to seeex-military talent join our company, or be supported to gain relevant work-ready skills. Since the programme began in 2010 AFTER has assisted over 4,000 veterans in employment transition, we have hired nearly 400ex-military talent and over £4m has been donated to military charities to assist wounded and injured personnel in employment transition. Meanwhile, our ‘LifeSkills’ programmes continue to prepare young people for their first steps into the world of work.
Working Families UK recognised Barclays for best embedded workplace flexibility through our Dynamic Working Campaign. In Singapore, we won the Most Empowering Company for Mums award by the National Trades Union Congress, while in the US we were included in the ‘100 Best Companies for Working Mothers’. In the UK, our approach to talent attraction was recognised by Working Mums as well as by Business In the Community.
Multicultural
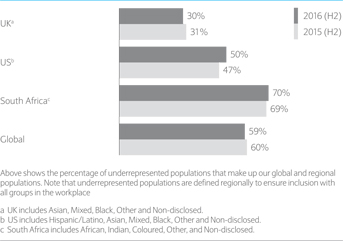
Barclays global footprint makes multicultural inclusion imperative. Fostering cross-cultural connections is enabled by Embrace our multicultural network. Through the year Embrace has partnered with leaders and engaged colleagues across our global community to host discussions to gain insight and ideas on how we can better serve our multicultural customers and clients. Embrace also helped us mark important cultural and religious calendar dates throughout 2016 such as Diwali and Eid, creating communications and events to bring to life the rich multicultural diversity of our people. Day to day, this diversity is enabled by, for example, dedicated quiet rooms in many of our larger sites for prayer and reflection, and by serving halal and kosher food in our canteens.
Barclays Apprenticeship Programme reflects our commitment to recruit a diverse workforce. Since the programme launched in 2012, we have recruited over 3,000 apprentices who are considered NEET (Not in Education, Employment or Training). 30% identify as Black, Asian and Minority Ethnic, which is 19% higher than the national apprenticeship average of 11%. In addition, 43% of our apprentices are from a disadvantaged area, as defined by the Department of Education.
Through this scheme we are making a positive impact on both youth unemployment and social mobility.
Ensuring Black, Asian and Minority Ethnic (BAME) female entrepreneurs can sustain and develop their businesses has been a shared focus via our partnership with the UK Women’s Business Council, and in 2016 we also supported the Black British Business Awards to celebrate the achievements of BAME leaders in the UK. The multicultural profile of the organisation was acknowledged externally with senior leader role models recognised in the top 100 inaugural ‘UPstanding Executive Power List’ of BAME leaders in the UK and US and in the Powerlist an annual publication of Britain’s most influential people of African and African Caribbean heritage.
Permanent Employees by region
| 2016 | 2015 | 2014 | ||||||||||
| United Kingdom | 46,400 | 49,000 | 48,600 | |||||||||
| Continental Europe | 4,700 | 7,400 | 9,900 | |||||||||
| Americas | 9,700 | 10,600 | 10,900 | |||||||||
| Africa and Middle East | 42,800 | 43,600 | 44,700 | |||||||||
| Asia Pacific | 15,700 | 18,800 | 18,200 | |||||||||
| Total | 119,300 | 129,400 | 132,300 |
| 50 | Barclays PLC and Barclays Bank PLC 2016 Annual Report on Form 20-F |
Governance: Remuneration report
Annual statement from the Chairman of the Board Remuneration Committee

Summary
“We remain focused on aligning our pay to performance and setting pay at a level which allows us to attract, retain and motivate, but is no more than necessary to ensure that we accelerate the delivery of shareholder value. The inherent tension between these important considerations continues to be a key component of the Committee’s deliberations.”
Remuneration Committee members
Chairman Crawford Gillies
Members Tim Breedon Mary Francis (from November 2016) Dambisa Moyo Steve Thieke (until March 2016)
|
Contents | ||||
| Page | ||||
Annual statement |
|
51 |
| |
| New Directors’ remuneration policy – at a glance | 53 | |||
| 2016 incentives | 55 | |||
| Remuneration policy for all employees | 57 | |||
| Directors’ remuneration policy | 60 | |||
| Annual report on Directors’ remuneration | 73 | |||
| Additional remuneration disclosures | 85 | |||
The tables marked ‘audited’ in the report have been audited by PricewaterhouseCoopers LLP |
| |||
Dear Fellow Shareholders
As Chairman of the Board Remuneration Committee, I am pleased to introduce the Remuneration report for 2016. I set out below the business context which influenced the major decisions taken by the Committee for the year. This year’s report also includes a new Directors’ remuneration policy, which has been updated for regulatory changes, and simplified where possible.
Performance and pay
We remain focused on aligning our pay to performance and setting pay at a level which allows us to attract, retain and motivate, but is no more than necessary to ensure that we accelerate the delivery of shareholder value. The inherent tension between these important considerations continues to be a key component of the Committee’s deliberations.
2016 represented a year of strong progress against our strategy. We have moved a step closer towards completing the restructuring of Barclays – a restructuring that will create a simplified bank focused on delivering long-term sustainable value for all our stakeholders. Our Core businesses are performing well, the rundown ofNon-Core businesses has accelerated and Barclays continues to explore opportunities to reduce its shareholding in BAGL to a level that would permit regulatory deconsolidation. The result will be the creation of a high performing transatlantic consumer, corporate and investment bank.
Our Core businesses delivered profit before tax up materially, 60% up compared to 2015. Excluding notable items this increase was 4%, and 10% excluding the impact of changes to our deferral arrangements (further detail overleaf). Core costs of £13.4bn exceeded guidance due to changes to the deferral arrangements. Return on Tangible Equity (RoTE) in our Core businesses has increased to 8.4% in 2016 (2015: 4.8%). Excluding notable items, Core RoTE was 9.4% (2015: 11.2%).
Non-Core has executed well against strategy, accelerating the rundown while preserving capital, delivering a £22bn reduction in Risk Weighted Assets.
Group profit before tax for 2016 is 182% up from 2015, at £3,230m, in part driven by a material reduction in costs associated with risk and conduct events in 2016. The Group’s capital position continues to strengthen with a 2016 year end CRD IV fully loaded Common Equity Tier 1 (CET1) ratio of 12.4% (2015: 11.4%).
The Committee’s deliberations on the 2016 incentive pool reflected Group performance and strategic delivery in both the Core andNon-Core businesses. We reached the decision that an overall Group incentive pool of £1,533m, down slightly from £1,544m in 2015, is appropriate notwithstanding strong 2016 delivery. This level of incentive pool also absorbs the material adverse impact of foreign exchange movements through the year, which more than offset the impact of reductions in staff numbers in the year.
The Core compensation to net income (excluding notable items) ratio decreased from 34.0% in 2015 to 32.7% in 2016 excluding the impact of the deferral changes, increasing slightly to 34.7% including the impact of these changes. At a Group level, the ratio increased to 40.2% (2015: 37.7%) driven byNon-Core as it continues to be run down.
Risk and conduct
The Committee takes risk and conduct issues very seriously and ensures that appropriate adjustments are made at both the individual level and to the incentive pool.
Individual performance management reviews assess individuals’ alignment with Barclays’ Values, which in turn impacts individual incentive decisions. Employees who exhibit Barclays’ Values, resulting in positive risk and conduct outcomes, are rewarded accordingly while those who are directly or indirectly accountable for risk and conduct issues have their remuneration adjusted downwards. This includes reductions in current year bonus and, where appropriate, reductions through the application of malus and, going forward, clawback.
| Barclays PLC and Barclays Bank PLC 2016 Annual Report on Form 20-F | 51 |
Governance: Remuneration report
Annual statement from the Chairman of the Board Remuneration Committee
Collective adjustments have also been made to the Group incentive pool for specific material risk and conduct events, and to take account of an overall assessment of a wide range of future risks including conduct,non-financial factors that can support the delivery of a strong risk management and conduct culture and other factors including reputation, impact on customers, markets and other stakeholders.
Changes to deferral arrangements
Under existing incentive deferral arrangements, there is a limited relationship betweenin-year performance costs booked and changes in the incentive pool. This is a result of high overall levels of deferral, as well as the way that the costs of those deferrals have been recognised in our accounts. The effect of this is that if we chose – for example – to reduce the incentive pool in a given year due to underperformance, there would be limited impact on costs for the year in question. This lack ofin-year flexibility on such an important cost line is not ideal. From 2016, a change in the recognition timing of deferral costs, together with a harmonisation of deferral levels across the Group will result in improvements to the Group’s operational flexibility going into 2017 and beyond.
These changes are described in further detail on page 56.
New remuneration policy for 2017
We will be seeking shareholder approval for a new Directors’ remuneration policy (DRP) at the 2017 AGM. The new policy adopts, where possible, a more simplified and transparent approach to remuneration and is more closely aligned to Barclays’ remuneration philosophy. Changes in the policy also address recent regulatory developments in particular the requirement to defer bonuses and Long Term Incentive Plan (LTIP) awards for a period of up to seven years. We have also introduced a new requirement for executive Directors to hold shares for two years post-termination.
The Committee was supportive of an even more simplified approach than that proposed, but the Committee concluded that while this alternative was attractive, there was not yet sufficient clarity on major shareholders’ expectations for us to propose such a change at the present time. The proposed changes to the DRP have been discussed with a number of our larger shareholders and institutional shareholder bodies, and overall they are broadly supportive of the changes. An ‘at a glance’ summary of the new policy can be found on pages 53 and 54 of this report and the full policy is set out on pages 60 to 72.
Key remuneration decisions for executive Directors
Based on the performance of our executive Directors against the performance measures set at the beginning of the year, the Committee approved a 2016 bonus award of £1,318,000 (60% of maximum) for Jes Staley and £854,000 (61% of maximum) for Tushar Morzaria. Further details of the Committee’s 2016 decisions for the executive Directors are set out on pages 73 and 74. 70% of Jes Staley’s annual bonus and 60% of Tushar Morzaria’s annual bonus have been deferred in shares. The period over which variable remuneration has been deferred has increased to seven years. Unvested variable remuneration is subject to malus during the vesting period. All variable remuneration awarded to the executive Directors is also subject to clawback for a period of up to 10 years.
The Committee has agreed that Jes Staley’s Fixed Pay will be unchanged for 2017 at £2,350,000 (2016: salary £1,200,000 and Role Based Pay (RBP) £1,150,000). The Committee has agreed that Tushar Morzaria’s Fixed Pay will be increased to £1,650,000 for 2017 (2016: salary £800,000 and RBP £750,000). In considering the appropriate level of Tushar Morzaria’s Total fixed pay (Fixed Pay plus Pension), the Committee took account of the time he has been in role without any increase (over three years), his strong performance and importance to the organisation, and industry market rates for the role. The Committee concluded that an increase of 5.7%, being less than the cumulative increase paid to UK employees over the same period, was warranted but agreed that the executive Directors would not be eligible for any further increase in the next three years (i.e. during the new policy period).
From 2017, Barclays is evolving from the existing Balanced Scorecard approach to one which better reflects progress towards our strategic goals. While many of the performance measures remain consistent with the Balanced Scorecard, the new Performance Measurement Framework allows for a more holistic assessment and broadens our approach to strategicnon-financial measures while retaining a balance of key financial performance measures. The framework has been incorporated into the measures for the 2017 annual bonus and LTIP with effect from the 2017 award. Financial measures will guide 60% of the maximum opportunity for the 2017 annual bonus, and 70% of the maximum opportunity for the 2017 LTIP award.
Agenda for 2017
The Committee will continue to focus on ensuring that remuneration is aligned to the delivery of our strategy and sustainable shareholder returns. The Committee will also continue to monitor the competitiveness of our remuneration in the light of recent regulatory changes by the PRA, FCA and EBA. These changes have compounded the competitive disadvantage for UK based global firms attributable to the lack of a global level regulatory ‘playing field’.
We will also continue to progress further our agenda to address pay inequality, further details on page 58, which is in line with the proposals in the Government’s Green Paper on Corporate Governance Reform. The Committee welcomes this Green Paper and supports its intent to strengthen accountability over executive pay. We have provided our views on the proposals via an industry response and will monitor developments over the coming months.
Our Remuneration report
The report has been prepared in accordance with the remuneration disclosures required by the Large andMedium-sized Companies and Groups (Accounts and Reports) (Amendment) Regulations 2013. We are seeking shareholder approval at the 2017 AGM for our new DRP, the Remuneration report (other than the part containing the DRP) and revisions to the Barclays LTIP in response to changes in regulatory requirements. Further details can be found in the 2017 AGM Notice of Meeting.
I am grateful for the feedback received from our larger shareholders on our remuneration proposals and value the insight the discussions provide. I hope you will support these resolutions at the 2017 AGM.
On behalf of the Board

Crawford Gillies
Chairman, Board Remuneration Committee
22 February 2017
| 52 | Barclays PLC and Barclays Bank PLC 2016 Annual Report on Form 20-F |
Governance: Remuneration report
New Directors’ remuneration policy – at a glance
Introduction
Barclays’ new DRP is subject to shareholder approval at the 2017 AGM on 10 May 2017 and, if approved, is intended to apply immediately, for three years to the date of the 2020 AGM.
What were the key factors taken into account when determining the new DRP?
The Committee considered the Barclays’ remuneration philosophy (adopted in 2015), regulatory developments and its experience of operating the prior DRP when designing the new DRP.
Inputs
|
Outcomes
| |||||
Alignment with Barclays’ remuneration philosophy |
§ Attract and retain talent needed to deliver Barclays’ strategy
| |||||
§ Align pay with investor interests
| ||||||
§ Reward sustainable performance
| ||||||
§ Support Barclays’ Values and culture
| ||||||
§ Align with risk appetite, risk exposure and conduct expectations
| ||||||
§ Be clear, transparent and as simple as possible
| ||||||
Regulatory developments |
§ Longer deferral periods:
| |||||
– 7 yearpro-rata, from year 3 for PRA Senior Managers (including executive Directors)
| ||||||
– Extension of clawback periods from 7 to 10 years for PRA Senior Managers (including executive Directors)
| ||||||
§ Applies for first time for 2017 performance year:
| ||||||
– Prohibition on dividend equivalents on deferred shares
| ||||||
– Increase to one year (from 6 months) holding period for awards delivered in shares
| ||||||
– Requirement that LTIP grants are based on performance over prior year as well as forward-looking performance period
| ||||||
What are the key changes to the DRP?
| ||||||
Key changes
| ||||||
Fixed pay |
§ ‘Fixed Pay’ introduced, replacing salary and RBP
| |||||
§ Fixed Pay delivered 50% in cash and 50% in shares (subject to 5 year holding period liftingpro-rata)
| ||||||
§ Fixed Pay will not change during the policy period for either of the current executive Directors
| ||||||
§ Pension allowance retained at current levels, but limited to 10% of Fixed Pay for new hires
| ||||||
Variable pay |
§ Bonus and LTIP combined for regulatory deferral purposes
| |||||
| Performance measures | § Bonus: Financial measures³ 60%
| |||||
§ LTIP: Financial measures³ 70%
| ||||||
| Delivery | § Any bonus deferral vests in equal tranches between the third and seventh anniversary of award
| |||||
§ LTIP performance is tested at end of 3 year performance period and vests in equal tranches between the third and seventh anniversary of award
| ||||||
Shareholding requirement |
§ Requirement increased to 200% of Total fixed pay (i.e. Fixed Pay plus Pension) within 5 years from their respective date of appointment (from 400% of salary to equivalent of 457% of salary for CEO)
| |||||
§ New requirement to hold shares worth 100% of Total fixed pay (orpro-rata thereof) for 2 years post-termination
| ||||||
| Employment contracts | § For new hires, asymmetry for notice periods removed i.e. 6 months from the Company and 6 months from the Director (from 12 months from the Company and 6 months from the Director)
|
| Full details of the changes to the DRP can be found on page 65. The full DRP is set out on pages 60 to 72. |
| Barclays PLC and Barclays Bank PLC 2016 Annual Report on Form 20-F | 53 |
Governance: Remuneration report
New Directors’ remuneration policy – at a glance
How will the new DRP be implemented?
The following charts illustrate how the vesting profiles of maximum total compensation for the Group CEO would change from the current policy to the new policy. All share awards are subject to additional holding periods following vesting, during which shares may not be sold or transferred.
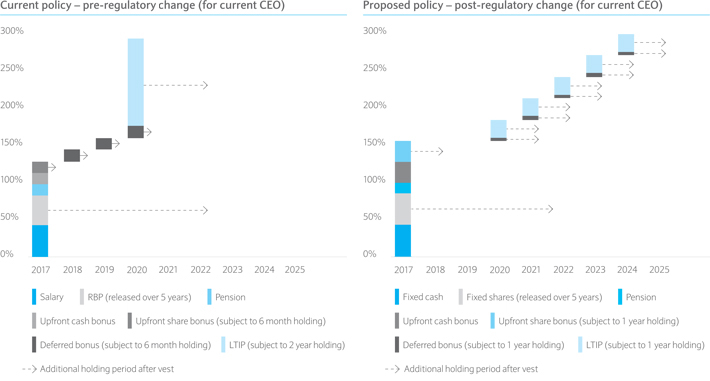
Subject to shareholder approval of the new DRP, the proposed DRP will apply from the 2017 performance year.
How will the executive Directors’ remuneration be structured in 2017?
| Total fixed pay | ||||||||
| | Fixed Pay £000 | | | Pension £000 | | |||
Jes Staley | 2,350 | 396 | ||||||
Tushar Morzaria | 1,650 | 200 |
| Annual bonus | LTIP | |||||||||||
| Maximum 80% of Total fixed pay | Maximum 120% of Total fixed pay | |||||||||||
| 2017 Performance measures and weighting: | 2017-2019 cycle performance measures and weighting: | |||||||||||
| Profit before tax excluding notable items | 22.5% | RoTE excluding notable items | 25% | |||||||||
| CET1 ratio | 22.5% | CET1 ratio as at 31.12.19 | 25% | |||||||||
| Cost:Income ratio excluding notable items | 15.0% | Cost:Income ratio excluding notable items | 20% | |||||||||
| Strategic/non-financial | 20.0% | Strategic/non-financial | 15% | |||||||||
| Personal objectives | 20.0% | Risk Scorecard | 15% | |||||||||
| 54 | Barclays PLC and Barclays Bank PLC 2016 Annual Report on Form 20-F |
Governance: Remuneration report
2016 incentives
This section provides details of how the 2016 total incentive award decisions were made.
|
2016 pay and performance headlines
The key performance considerations which the Committee took into account in making its remuneration decisions for 2016 are highlighted below:
| § | Group profit before tax was up 182% at £3,230m (2015: £1,146m) |
| § | Group CET1 ratio was up to 12.4% (2015: 11.4%) |
| § | Core profit before tax was up 60% from 2015 at £6,016m. Excluding notable items Core profit before tax was up 4% to £6,436m (2015: £6,191m), and up 10% excluding the impact of deferral changes made in 2016 |
| § | RoTE in our Core businesses increased to 8.4% in 2016 (2015: 4.8%). Excluding notable items, Core RoTE was 9.4% (2015: 11.2%) |
| § | strong execution of the rundown ofNon-Core resulting in a reduction in Risk Weighted Assets of £22bn. |
The pay outcomes and decisions can be summarised as follows:
| § | total compensation costs increased 2% to £7,445m (2015: £7,301m) including the impact of the deferral changes. Excluding this impact compensation costs were down 3% |
| § | total incentive awards granted were slightly down at £1,533m (2015: £1,544m) |
| § | the level of incentive pool absorbs the material adverse impact of foreign exchange movements through the year which more than offset the impact of reductions in staff numbers in the year |
| § | the Core compensation to net income ratio improved to (excluding notable items) 32.7% (2015: 34.0%) excluding the impact of deferral changes, increasing slightly to 34.7% including the impact of these changes |
| § | Group compensation to net income ratio (excluding notable items) was 40.2% (2015: 37.7%) driven byNon-Core income reduction as it runs down |
| § | Corporate and Investment Bank (CIB) front office incentive awards were also slightly down at £875m (2015: £884m). Excluding the impact of deferral changes made in 2016, CIB compensation to net income ratio (excluding notable items) was 39.2% (2015: 40.3%) |
| § | there has been continued strong differentiation on the basis of individual performance to allow the Group to more effectively manage compensation costs. |
2016 total incentive award decisions
The Committee’s 2016 incentives decisions took full consideration of financial andnon-financial performance and also the material repositioning of incentives undertaken since 2010. Since 2010, the Group incentive pool has declined steadily, from £3,484m in 2010 to £1,533m in 2016 – a decrease of 56% over six years.
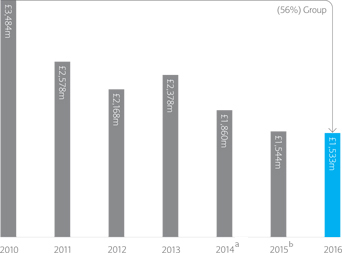
Notes
| a. | Part of the reduction in incentive pools in 2014 was due to the introduction of RBP. |
| b. | The 2015 Group incentive pool has been restated from £1,669m to reflect the treatment of Africa Banking as a discontinued operation. The 2010 – 2014 Group incentive pools have not been restated. |
| Barclays PLC and Barclays Bank PLC 2016 Annual Report on Form 20-F | 55 |
Governance: Remuneration report
2016 incentives
Total incentive awards granted – current year
| Barclays Group | ||||||||||||
| | Year ended 31.12.16 £m |
| | Year ended 31.12.15 £m |
| % change | ||||||
| Incentive awards granted | ||||||||||||
| Bonus pool | 1,459 | 1,453 | 0 | |||||||||
| Commissions and other incentivesa | 74 | 91 | 19 | |||||||||
| Total incentive awards granted | 1,533 | 1,544 | 1 | |||||||||
| Proportion of bonus pool that is deferred % | 30 | 46 | ||||||||||
| Reconciliation of incentive awards granted to income statement charge: | ||||||||||||
| Less: deferred bonuses granted but not charged in current year | (300 | ) | (665 | ) | 55 | |||||||
| Add: current year charges for deferred bonuses from previous years | 690 | 856 | 19 | |||||||||
| Otherb | (26 | ) | 26 | |||||||||
| Income statement charge for performance costsc | 1,897 | 1,761 | (8 | ) | ||||||||
| Total compensation costsd,e | 7,445 | 7,301 | (2 | ) | ||||||||
| Total compensation costs before the impact of deferral changesd,e | 7,050 | 7,301 | 3 | |||||||||
Notes
| a | Awards included in 2015 as commitments are now reflected in Bonus pool for consistency with 2016. |
| b | Difference between incentive awards granted and Income Statement charge for commissions and other incentives. |
| c | Includes the £395m impact of changes to deferral arrangements. |
| d | 2015 total compensation costs have been adjusted to exclude the impact of a £429m gain on valuation of a component of the defined benefit liability. |
| e | In addition £212m of Group compensation (2015: £236m) was capitalised as internally generated software. |
Changes to deferral arrangements
From 2016 onwards, costs in relation to deferred bonuses are expensed from the performance year in respect of which they are granted. Approximately 33% of deferred bonus costs will be taken in the year of performance, being the year prior to granting (previously 0%). This acceleration of future cost immediately improves the link betweenin-year performance costs and the size of the incentive pool.
The relationship betweenin-year performance costs and changes in the incentive pool will be further improved through a change to harmonise the deferral approach for all staff across the Group, creating internal consistency. Historically, we have applied deferral levels significantly higher than those required by our regulators for bonus payments made specifically to senior staff in our Investment Bank, making them defer 100% of incentive awards over at least three years, with nothing paid at all in the year in which the performance is delivered. This meant that any change to the Investment Bank pool in incentive awards to those staff had limited impact on thein-year performance costs recognised in our accounts. This approach also put us out of step with peer practice where deferral levels are typically lower. Our new Group deferral approach ensures that all staff will defer at least what is required by our regulators, while all of our highest paid staff will continue to defer more than is required to preserve the strong alignment to future Group performance. This change means that any change in incentive awards will now have a direct and immediate impact on performance costs for the year when the charge is made.
The alignment of deferral levels across the Group also helps from a global competitive perspective given the differences in approach being adopted by the different regulatory regimes. The differences have widened given the recent changes in the UK e.g. the increase in deferral duration to seven years for PRA Senior Managers and to five years for many other MRTs (from three years previously). Harmonising our deferral approach makes the delivery less uncompetitive outside the UK while importantly maintaining our responsibility to all our stakeholders.
Impact of deferral changes
| Barclays Group | ||||||||
Barclays Group | | Year ended 31.12.16 % |
| | Year ended 31.12.15 % |
| ||
Compensation costs as a % of net income (excluding notable items) | ||||||||
Before impact of deferral changes | 38.1 | 37.7 | ||||||
After impact of deferral changes | 40.2 | 37.7 | ||||||
Barclays Core | % | % | ||||||
Compensation costs as a % of net income (excluding notable items) | ||||||||
Before impact of deferral changes | 32.7 | 34.0 | ||||||
After impact of deferral changes | 34.7 | 34.0 | ||||||
| 56 | Barclays PLC and Barclays Bank PLC 2016 Annual Report on Form 20-F |
Governance: Remuneration report
Remuneration policy for all employees
This section sets out Barclays’ remuneration policy for all employees, explaining the philosophy underlying the structure of remuneration packages, and how this links remuneration to the achievement of sustained high performance and long-term value creation.
|
Remuneration philosophy
In October 2015, the Committee formally adopted a revised, simplified remuneration philosophy which articulates Barclays’ overarching remuneration approach and is set out below.
Barclays’ remuneration philosophy
| ||
Attract and retain talent needed to deliver Barclays’ strategy
|
Long-term success depends on the talent of our employees. This means attracting and retaining an appropriate range of talent to deliver against our strategy, and paying the right amount for that talent
| |
Align pay with investor interests
|
Ensure employees’ interests are aligned with those of investors (equity and debt holders), both in structure and the appropriate balance of returns
| |
Reward sustainable performance
|
Sustainable performance means making a positive contribution to stakeholders, in both the short and longer term, playing a valuable role in society
| |
Support Barclays’ Values and culture
|
Results must be achieved in a manner consistent with our Values. Our Values and culture should drive the way that business is conducted
| |
Align with risk appetite, risk exposure and conduct expectations
|
Designed to reward employees for achieving results in line with the Bank’s risk appetite and conduct expectations
| |
Be clear, transparent and as simple as possible
|
All employees and stakeholders should understand how we reward our employees. Remuneration structures should be as simple as possible so that everyone can understand how they work and the behaviours they reward
|
Culture and remuneration
Barclays’ remuneration philosophy links remuneration to achieving sustained high performance and creating long-term value. Our remuneration philosophy applies to all employees globally across Barclays and aims to reinforce our belief that effective performance management is critical to enabling the delivery of our business strategy in line with our Values. Employees who adhere to the Barclays’ Values and contribute to Barclays’ success are rewarded accordingly.
This is achieved by basing performance assessment on clear standards of delivery and behaviour, and starts with employees aligning their objectives (‘what’ they will deliver) to business and team goals in order to support the delivery of the business strategy and good customer outcomes. Behavioural expectations (‘how’ people will achieve their objectives) are set in the context of our Values.
Individual performance is assessed against both financial andnon-financial criteria. Other factors are also taken into consideration within the overall performance assessment, including core job responsibilities, behaviours towards risk and control, colleague and stakeholder feedback as well as input from the Risk and Compliance functions, where appropriate.
Through our performance management approach we emphasise the equal importance of both ‘what’ an individual has delivered as well as ‘how’ they have achieved this, encouraging balanced consideration of each dimension. Both of these elements are assessed and rated independently of each other. In 2016 we eliminated the requirement to have an overall rating which should allow for more robust and reflective conversations between managers and team members on the individual components of performance.
A key part of the performance management philosophy promotes ongoing quality dialogue throughout the year. This helps manage performance messages effectively and allows for more timely recognition as well as appropriate coaching and support where needed.
By linking individual performance assessment to Barclays’ strategy and our Values and, in turn, to remuneration decisions, a clear alignment between what we are striving to achieve, how we go about this, and ultimately, how we recognise this in individual financial terms is achieved.
Risk, conduct and remuneration
Another key feature of our remuneration philosophy is the alignment of remuneration with our risk appetite and with the conduct expectations of Barclays, our regulators and stakeholders. The Committee takes risk and conduct events very seriously and ensures that there are appropriate adjustments to individual remuneration and, where necessary, the incentive pool.
The Remuneration Review Panel, which reports to the Committee, supports the Committee in this process. The Panel is chaired by the Chief Risk Officer and includes senior representatives from the key control functions of Risk, Compliance, Internal Audit, Legal and HR as well as the CEOs of Barclays UK and Barclays International. It sets the policy and processes for assessing compensation adjustments for risk and conduct events.
We have robust processes for considering risk and conduct as part of individual performance management processes with outcomes reflected in individual remuneration decisions. Line managers have primary accountability for ensuring the risk and conduct issues are considered when assessing performance and making remuneration decisions. In addition, there is a secondary review by the control functions for individuals involved in significant failures of risk management, conduct issues, regulatory actions or other major incidents which impact either the Group or business to ensure these issues are also considered. When considering individual responsibility, a variety of factors are taken into account such as whether an individual was directly responsible or whether the individual, by virtue of seniority, could be deemed indirectly responsible, including staff who drive the Group’s culture and set its strategy.
| Barclays PLC and Barclays Bank PLC 2016 Annual Report on Form 20-F | 57 |
Governance: Remuneration report
Remuneration policy for all employees
Actions which may be taken where risk management and conduct falls below required standards include:
Adjustment |
Current year annual bonuses are adjusted downwards where individuals are found to be responsible (either directly or indirectly) in a risk or misconduct event.
| |
Malus |
Deferred unvested bonuses from prior years are subject to malus provisions which enable the Committee to reduce the vesting level of deferred bonuses (including to nil) at its discretion. Events which may lead the Committee to do this include, but are not limited to, employee misconduct or a material failure of risk management.
| |
Clawback |
Clawback applies to any variable remuneration awarded to a PRA Material Risk Taker (MRT) on or after 1 January 2015 in respect of years for which they are a MRT. Barclays may apply clawback if, at any time during the seven year period from the date on which variable remuneration is awarded to a MRT: (i) there is reasonable evidence of employee misbehaviour or material error, and/or (ii) the firm or the business unit suffers a material failure of risk management, taking account of the individual’s proximity to and responsibility for that incident.
Clawback may be extended to 10 years for PRA Senior Managers where there are outstanding internal or regulatory investigations at the end of the 7 year clawback period.
|
Where possible, an adjustment will be made to current year annual bonus, before the application of malus and then clawback.
In addition to reductions to individuals’ bonuses, the Committee considers and makes collective adjustments to the incentive pool for specific material risk and conduct events. In 2016, the impact of these collective adjustments, resulting from both the direct financial impact on performance and the additional adjustments applied by the Committee, is a reduction of £150m.
We have also adjusted the incentive pool to take account of an assessment of a wide range of future risks including conduct, non-financial factors that can support the delivery of a strong risk environment, control and conduct culture and other factors including reputation, impact on customers, markets and other stakeholders.
Remuneration levels
Barclays is a long-standing supporter of the Living Wage. As an accredited Living Wage employer, Barclays commits to ensure that all permanent UK employees and those UK employees of third party contractors who provide services to us at our sites, are paid at least the current London or UK Living Wage. This is a commitment which we have also extended to all our UK employed apprentices.
Barclays is also fully committed to addressing pay inequality. Barclays’ work in this area is illustrated by recent union pay deals and the repositioning of the incentive pools over recent years. Over the past few years, we have consciously redirected the bonus pool funding, providing proportionally more to junior employees.
For UK employees, average Total Compensation (fixed pay plus bonus) for Managing Directors has reduced materially since 2010 (broadly in line with the reduction in the incentive pool). Over the same period, junior populations have been protected and have seen small increases in Total Compensation despite a challenging business environment. Similarly, salaries have been consciously increased for those within lower corporate grades within the UK. The UK pay deal which was in place for the 2014-2016 period providednon-management populations (primarily outside of the Investment Bank) with a 7.5% merit increase over the three-year period. A new three-year pay deal with Unite was reached in January 2017 which commits for thenon-management population to a 7.5% merit increase over the 2017-2019 period and also commits to a minimum increase of 10% for the most junior graded employees.
Remuneration structure
The remuneration structure for employees is closely aligned with that for executive Directors, set out in detail in the DRP which is at pages 60 to 72 of this report and for which shareholder approval is being sought at the 2017 AGM. The primary exception being that the executive Directors participate in the Barclays’ LTIP.
Employees receive salary, pension and other benefits and are eligible to be considered for an annual bonus. Employees in some customer-facing businesses participate in formulaic incentive plans including plans which have good customer outcomes as the primary performance measure. The plans also recognise how results have been achieved in line with Barclays’ Values. Some senior employees also receive RBP. For executive Directors, under the new DRP, salary and RBP are replaced by Fixed Pay. Remuneration of MRTs is subject to the 2:1 maximum ratio of variable to total fixed pay. A total of 1,561 (2015: 1,523) individuals were MRTs in 2016.
The remuneration of employees engaged in control functions is determined independently from the business they support and within the parameters of the incentive pool allocated to them by the Committee.
| 58 | Barclays PLC and Barclays Bank PLC 2016 Annual Report on Form 20-F |
Fixed remuneration
Salary |
Salaries reflect individuals’ skills and experience and are reviewed annually in the context of annual performance assessment. They are increased where justified by role change, increased responsibility or a change in the appropriate market rate.
Salaries may also be increased in line with local statutory requirements and in line with union and works council commitments.
| |
Role Based Pay (RBP)
|
A small number of senior employees receive a class of fixed pay called RBP to recognise the seniority, breadth and depth of their role.
| |
Pension and benefits
|
The provision of a competitive package of benefits is important to attracting and retaining the talented staff needed to deliver Barclays’ strategy. Employees have access to a range of country-specific company-funded benefits, including pension schemes, healthcare, life assurance and Barclays’ share plans as well as other voluntary employee funded benefits. The cost of providing these benefits is defined and controlled.
|
Variable remuneration
Annual bonus |
Annual bonuses incentivise and reward the achievement of Group, business and individual objectives, and reward employees for demonstrating individual behaviours in line with Barclays’ Values.
| |
The ability to recognise performance through variable remuneration enables the Group to control its cost base flexibly and to react to events and market circumstances. Bonuses remain a key feature of remuneration practice in the highly competitive and mobile market for talent in the financial services sector. The Committee is careful to control the proportion of variable to fixed remuneration paid to individuals.
| ||
From 2016, the typical deferral structures are:
|
| For MRTs: | Fornon-MRTs: | |||||||||
Incentive award | Amount deferred | Incentive award | Amount deferred | |||||||
| < £500,000 | 40% of total award | Up to £65,000 | 0% | |||||||
| £500,000 to £1,000,000 | 60% of total award | > £65,000 | Graduated level of deferral | |||||||
| ³ £1,000,000 | 60% up to £1,000,000 100% above £1,000,000
| |||||||||
Deferred bonuses are generally delivered in equal portions as deferred cash and deferred shares subject to the rules of the deferred cash and share plans (as amended from time to time) and continued service. From 2016, deferred bonuses are subject to either a 3, 5 or 7 year deferral period in line with regulatory requirements.
| ||
Share plans |
Alignment of senior employees with shareholders is achieved through deferral of incentive pay. We also encourage wider employee shareholding through theall-employee share plans. 82% of the global employee population (excluding Africa) is eligible to participate.
|
| Barclays PLC and Barclays Bank PLC 2016 Annual Report on Form 20-F | 59 |
Governance: Remuneration report
Directors’ remuneration policy
This section sets out the proposed new Barclays’ forward-looking remuneration policy for Directors, which has evolved from the existing policy and explains each element of remuneration and how it operates. The policy described in this section is intended to apply for three years beginning on the date of the 2017 AGM, subject to shareholder approval.
The existing policy can be found on pages 100 to 110 of the 2013 Annual Report or at home.barclays/annualreport.
|
Remuneration policy for executive Directors
| Element and purpose | Operation | Maximum value and performance measures | ||
A. Fixed pay
| ||||
Fixed Pay To reward skills and experience appropriate for the breadth and depth of the role and to provide the basis for a competitive remuneration package |
Fixed Pay is determined with reference to market practice and historical market data (on which the Committee receives independent advice), and reflects the individual’s experience and role.
Executive Directors’ total compensation is benchmarked against comparable roles in the following banks: Bank of America, BNP Paribas, Citigroup, Credit Suisse, Deutsche Bank, HSBC, JP Morgan Chase & Co, Lloyds, Morgan Stanley, Standard Chartered and UBS. The Committee may amend the list of comparator companies to ensure it remains relevant to Barclays or if circumstances make this necessary (for example, as a result of takeovers or mergers).
50% of Fixed Pay is delivered in cash (paid monthly), and 50% is delivered in shares. The shares are delivered quarterly and are subject to a holding period with restrictions lifting over five years (20% each year). As the executive Directors beneficially own the shares, they will be entitled to any dividends paid on those shares.
Malus and clawback provisions do not apply to Fixed Pay.
|
Fixed Pay for executive Directors is set within the benchmark range determined by the Committee taking into account their experience and performance.
The maximum Fixed Pay is £2,350,000 for Jes Staley (Group Chief Executive) and £1,650,000 for Tushar Morzaria (Group Finance Director).
These amounts are fixed and will not change during the policy period for these individuals.
There are no performance measures. | ||
Pension To enable executive Directors to build long-term retirement savings |
Executive Directors receive an annual cash allowance in lieu of participation in a pension arrangement. |
The maximum annual cash allowance is £396,000 for Jes Staley (Group Chief Executive) and £200,000 for Tushar Morzaria (Group Finance Director).
These amounts are fixed and will not change during the policy period for these individuals.
| ||
Benefits To provide a competitive and cost effective benefits package appropriate to the role and location |
Executive Directors’ benefits provision includes, but is not restricted to, private medical cover, annual health check, life and ill health income protection, car cash allowance, and use of a Company vehicle and driver when required for business purposes.
In addition to the above, if an executive Director were to relocate, additional support would be provided for a defined and limited period of time in line with Barclays’ general employee mobility policy including, but not restricted to, the provision of temporary accommodation, tax advice, home leave related costs, payment of removal costs and relocation flights for the executive Director, spouse and children. Barclays will pay the executive Director’s tax on the relocation costs but will not tax equalise and will also not pay the tax on any other employment income.
|
The maximum value of the benefit is determined by the nature of the benefit itself and costs of provision may depend on external factors, e.g. insurance costs. |
| 60 | Barclays PLC and Barclays Bank PLC 2016 Annual Report on Form 20-F |
Remuneration policy for executive Directorscontinued
| Element and purpose | Operation | Maximum value and performance measures | ||
B. Variable pay
| ||||
Annual bonus To reward delivery of short-term financial targets set each year, the individual performance of the executive Directors in achieving those targets, and their contribution to delivering Barclays’ strategic objectives
Delivery in part in shares with a holding period increases alignment with shareholders. Deferred bonuses encourage longer term focus and retention
|
Determination of annual bonus Individual bonuses are discretionary and decisions are based on the Committee’s judgement of executive Directors’ performance in the year, measured against Group and personal objectives.
Delivery structure Annual bonuses are delivered as a combination of cash and shares, a proportion of which may be deferred and/or subject to a holding period.
Deferral proportions and vesting profiles will be structured so that, in combination with any LTIP award, the proportion of variable pay that is deferred is no less than that required by regulations.
Deferred bonuses are granted by the Committee (or an authorisedsub-committee) at its discretion, subject to the relevant plan rules as amended from time to time.
Dividend equivalents, in the form of additional shares, are payable on the vested deferred bonus shares, equal to the dividends paid or payable between the award date and the relevant release date. If dividend equivalents are not permissible under regulations, the number of deferred bonus shares to be awarded will be based on a share price discounted by reference to an expected dividend yield over the vesting period. In such circumstances, the Committee has discretion to reduce (not increase) the number of shares that vest if actual dividends paid over the period are materially lower than the original dividend assumption.
A notional discount may be applied to the deferred bonus awards for the purposes of calculating the 2:1 cap to the extent this is permitted by regulations (currently a discount is permitted on up to 25% of variable pay where the conditions for applying such a discount are met).
Operation of risk and conduct adjustment, malus and clawback Any bonus awarded will reflect appropriate consideration in relation to Group risk and conduct events. Individual bonus decisions may also reflect appropriate reductions in relation to specific risk and conduct events. Any bonus is also subject to malus and clawback provisions.
The malus provisions enable the Committee to reduce the amount of unvested bonus (including to nil) prior to the unvested bonus vesting in specified circumstances, including, but not limited to:
§ a participant deliberately misleading Barclays, the market and/or shareholders in relation to the financial performance of the Barclays Group
§ a participant causing harm to Barclays’ reputation or where his/her actions have amounted to misconduct, incompetence or negligence
§ a material restatement of the financial statements of the Barclays Group or any subsidiary, or the Group or any business unit suffering a material downturn in its financial performance
§ a material failure of risk management in the Barclays Group
§ a significant deterioration in the financial health of the Barclays Group
|
The maximum annual bonus opportunity is 80% of Total fixed pay. For these purposes Total fixed pay is Fixed Pay plus Pension.
The performance measures by which any executive Director’s bonus is assessed include financial andnon-financial measures which also include risk-related measures and personal objectives. In making its assessment of any bonus, the Committee will consider financial factors to guide at least 60% of the bonus opportunity. Any bonus is discretionary and any amount may be awarded from zero to the maximum value.
The Committee has the discretion to vary the measures and their respective weightings within each category. The measures and weightings will be disclosed annually as part of the Annual report on Directors’ remuneration. |
| Barclays PLC and Barclays Bank PLC 2016 Annual Report on Form 20-F | 61 |
Governance: Remuneration report
Directors’ remuneration policy
Remuneration policy for executive Directorscontinued
| Element and purpose | Operation | Maximum value and performance measures | ||
B. Variable pay continued
| ||||
The clawback provisions enable amounts to be recovered after they have vested (for a period of seven years from grant/ten years in specified circumstances e.g. where a relevant investigation is ongoing at the end of the initial seven year period) in circumstances where (i) a participant’s actions or omissions have amounted to misbehaviour and material error and/or (ii) Barclays or the relevant business unit has suffered a material failure of risk management.
Timing of receipt Non-deferred cash components of any bonus are paid following the performance year to which they relate, normally in March.Non-deferred share bonuses are also awarded normally in March and are subject to a holding period (after the payment of tax) in line with regulations and with release no faster than permitted by regulations (currently minimum of six months, increasing to one year for the 2017 performance year).
Deferred share bonuses are structured so that no deferred shares vest faster than permitted by regulations (currently in five equal tranches with the first vesting on or around the third anniversary of grant and the last tranche vesting on or around the seventh anniversary of grant). Vesting is also subject to the provisions of the plan rules including employment and the malus and clawback provisions (as explained above). Any shares that vest are subject to an additional holding period (after payment of tax) in line with regulations and with release no faster than permitted by regulations (currently minimum of six months, increasing to one year for the 2017 performance year).
|
| 62 | Barclays PLC and Barclays Bank PLC 2016 Annual Report on Form 20-F |
Remuneration policy for executive Directorscontinued
| Element and purpose | Operation | Maximum value and performance measures | ||
B. Variable pay continued
| ||||
Long Term Incentive Plan (LTIP) award To reward execution of Barclays’ strategy over a multi-year period
Long-term performance measurement, deferral and holding periods encourage a long-term view and align executive Directors’ interests with those of shareholders. Malus and clawback provisions discourage excessive risk-taking and inappropriate behaviours |
Determination of LTIP award LTIP awards are made by the Committee following discussion of recommendations made by the Chairman (for the Group Chief Executive’s LTIP award) and by the Group Chief Executive (for other executive Directors’ LTIP awards) based on satisfactory performance over the prior year.
Delivery structure LTIP awards are granted subject to the plan rules and are satisfied in Barclays’ shares (although they may be satisfied in other instruments as may be required by regulation).
LTIP awards are structured so that when combined with the annual bonus the proportion of variable pay that is deferred is no less than that required by regulations.
For each award, forward-looking performance measures are set at grant and there is no retesting allowed of those conditions. The Committee has, within the parameters set out opposite, the flexibility to vary the weighting of performance measures and calibration for each award prior to its grant.
The Committee has discretion, and in line with the plan rules approved by shareholders, in exceptional circumstances to amend targets, measures, or the number of awards if an event happens (for example, a major transaction) that, in the opinion of the Committee, causes the original targets or measures to be no longer appropriate or such adjustment to be reasonable. The Committee also has the discretion to reduce the vesting of any award, including to nil, if it deems that the outcome is not consistent with performance delivered.
Dividend equivalents, in the form of additional shares, are payable on the vested deferred shares, equal to the dividends paid or payable between the award date and the relevant release date. If dividend equivalents are not permissible under regulations, the number of shares to be awarded will be based on a share price discounted by reference to an expected dividend yield over the vesting period. In such circumstances, the Committee has discretion to reduce (not increase) the number of shares that vest if actual dividends paid over the period are materially lower than the original dividend assumption.
A notional discount may be applied to LTIP awards for the purposes of calculating the 2:1 cap to the extent this is permitted by regulations (currently a discount is permitted on up to 25% of variable pay where the conditions for applying such a discount are met).
Operation of malus and clawback The achievement of performance measures determines the extent to which LTIP awards will vest. Awards are also subject to malus during the vesting period and clawback for a period of seven years (10 years in specific circumstances) from the date of award which enables the Committee to reduce the vesting level of awards (including to nil). This is explained further in the annual bonus paragraphs above.
Timing of receipt Barclays LTIP awards are structured so that no award vests before the third anniversary of grant and an award vests no faster than permitted by regulations (currently in five equal tranches with the first tranche vesting on or around the third anniversary of grant and the last tranche vesting on or around the seventh anniversary of the grant date). Any shares that vest are subject to an additional holding period (after payment of tax) in line with regulations, with restrictions lifting no faster than permitted by regulations (currently minimum of six months, increasing to one year for the 2017 performance year).
|
The maximum annual LTIP award is 120% of Total fixed pay. For these purposes Total fixed pay is Fixed Pay plus Pension.
Vesting is dependent on performance measures and service.
Forward-looking performance measures will be based on financial performance and other long-term strategic measures. The Committee has discretion to change the weightings but financial measures will be at least 70% of the total opportunity. Measures and weightings will be set in advance of each grant. The threshold and maximum level of performance for each financial performance measure will be disclosed annually as part of the Annual report on Directors’ remuneration. Straight-line vesting applies between threshold and maximum for the financial measures and weightings with no more than 25% vesting at threshold performance. |
| Barclays PLC and Barclays Bank PLC 2016 Annual Report on Form 20-F | 63 |
Governance: Remuneration report
Directors’ remuneration policy
Remuneration policy for executive Directorscontinued
| Element and purpose | Operation | Maximum value and performance measures | ||
C. Other
| ||||
All employee share plans To provide an opportunity for executive Directors to voluntarily invest in the Company through UK HMRC employee tax advantaged share schemes | Executive Directors are entitled to participate in:
(i) Barclays Sharesave under which they can make monthly savings over a period of three or five years linked to the grant of an option over Barclays’ shares which can be at a discount of up to 20% on the share price set at the start.
(ii) Barclays Sharepurchase under which they can make contributions (monthly or lump sum) out ofpre-tax pay (if based in the United Kingdom) which are used to acquire Barclays’ shares. | (i) Savings between £5 and the maximum set by Barclays (which will be no more than the HMRC maximum) per month. There are no performance measures.
(ii) Contributions of between £10 and the maximum set by Barclays (which will be no more than the HMRC maximum) per tax year which Barclays may match up to HMRC maximum (current match is £600). There are no performance measures.
| ||
Previous legacy awards To honour existing awards and payments | Awards granted and/or payments agreed at a time where a previous policy, approved by shareholders, was in place, may be released and/or paid in accordance with such previous policy notwithstanding that such awards and/or payments may not be in line with the new policy described above.
| In line with existing arrangements. | ||
Shareholding requirement To further enhance the alignment of shareholders’ and executive Directors’ interests in long-term value creation | Executive Directors must build up a shareholding of 200% of Total fixed pay (i.e. Fixed Pay plus Pension) within five years from the date of appointment as executive Director. They have a reasonable period to build up to this requirement again if it is not met because of a significant share price depreciation.
Executive Directors must also continue to hold a shareholding for two years post-termination as follows:
(i) if the executive Director has been employed for more than five years: 100% of Total fixed pay; or
(ii) if the executive Director has been employed for less than five years: either
(a) grow their holding to thepro-rated requirement if thepro-rated requirement has not been met. Directors would only be allowed to sell shares to pay for tax liabilities which crystallise when deferred awards vest on or after termination; or
(b) if thepro-rated requirement has been exceeded, executive Directors would be allowed to sell shares above this requirement and also sell shares to pay for tax liabilities which crystallise when deferred awards vest on or after termination.
Shares that count towards the requirement are beneficially owned shares including any vested share awards subject only to holding periods (including vested LTIPs, vested deferred share bonuses, Fixed Pay shares, and RBP shares). Shares from unvested deferred share bonuses and unvested LTIPs do not count towards the requirement.
| Barclays’ shares worth a minimum of 200% of Total fixed pay must be held within five years plus a shareholding of 100% of Total fixed pay (orpro-rata thereof) for two years post termination. | ||
Outside appointments To encourage self-development and allow for the introduction of external insight and practice | Executive Directors may accept onenon-executive Director board appointment in another listed company.
The Chairman’s approval must be sought before accepting an appointment. Fees may be retained by the executive Director. Neither of the executive Directors currently hold an outside appointment.
| Not applicable. | ||
| 64 | Barclays PLC and Barclays Bank PLC 2016 Annual Report on Form 20-F |
Notes to the table on pages 60 to 64
Performance measures and targets
The Committee select financial performance measures which are fundamental to delivery against the Bank’s strategy and are considered to be the most important financial measures used by the executive Directors to oversee the direction of the business. Thenon-financial performance measures and sources of data are chosen to represent key indicators of sustainable performance that are robustly monitored and reported on to management. The measures are determined in consultation with major shareholders.
Financial targets are set to be stretching but achievable and are aligned to enhancing shareholder value. In respect of the LTIP, the financial measures, weightings and targets will be disclosed at the start of the relevant performance period. In respect of the annual bonus, the financial measures and weightings will be disclosed at the start of the relevant performance year. The Committee is of the opinion that the financial targets for the annual bonus are commercially sensitive in respect of the Company and that it would be detrimental to disclose details at the start of the relevant performance year. Performance against the targets will be disclosed at the end of the relevant peformance year in that year’s remuneration report, subject to commercial sensitivity no longer remaining.
The existing Balanced Scorecard has evolved into a ‘Performance Measurement’ framework which better reflects progress towards our strategic andnon-financial goals. Enhancements to the available sources of management information and reporting, ranging from internal dashboards to external third party measures, allows for a more holistic view of sustainable business performance, rather than focusing on a few narrowly defined targets. The evaluation will focus on key performance measures (many continuing from the Balanced Scorecard), with a detailed retrospective disclosure on progress throughout the period against each category, together with supporting rationale for payments.
Changes in remuneration policy for 2017
The following table provides a summary of the changes to the DRP for 2017:
| Element | Change | Rationale for change | ||||||
| Fixed Pay | § | Consolidate salary and RBP into a single ‘Fixed Pay’ element (delivered 50% in cash and 50% in shares subject to a 5 year holding period liftingpro-rata). | § | Simplicity, transparency. | ||||
§ | Fixed Pay will not change during the policy period for either of the current executive Directors. | |||||||
Pension | § | Continue pension allowance as a separate allowance: | § | Supports simplified approach to fixed pay. | ||||
– for existing executive Directors, amount unchanged but fixed for the duration of this policy | ||||||||
– for new hires, pension allowance limited to 10% of Fixed Pay. | ||||||||
| Variable pay | § | Combine annual bonus and LTIP for deferral purposes, while retaining maximum variable at 200% of Total fixed pay and 60:40 split between maximum LTIP and annual bonus. | § | Mitigates the global competitive impact of longer deferral periods and holding periods under the PRA Remuneration Rules and the EBA Guidelines on sound remuneration policies | ||||
§ | Performance measures | § | Simplicity, transparency. | |||||
– Bonus: financial performance measures at least 60%. | ||||||||
– LTIP: financial performance measures at least 70%. | ||||||||
§
| Dividends
| § | Recreates shareholder alignment lost through regulatory dividend prohibition. | |||||
– Where regulatory constraints prevent dividend alignment, use discounted share price to calculate number of shares under award. | ||||||||
– Committee has discretion to reduce the number of shares that vest if actual dividends paid are materially lower than original dividend assumption. | ||||||||
| Shareholding requirement | § | Increase requirement to 200% of Total fixed pay (i.e. Fixed Pay plus Pension) from 400% of Salary. | § | Longer and stronger shareholder alignment (equivalent to 457% of salary for CEO). | ||||
§ | Introduce shareholding requirement of 2 years post | |||||||
| termination of 100% of Total fixed pay (orpro-rata thereof). | ||||||||
| Employment contracts | § | For new hires, 6 months’ notice from the Company and 6 months’ notice from the executive Director. | §
| Remove asymmetry for notice periods.
| ||||
§ | Alignment between the employee and the | |||||||
| Company. | ||||||||
| Leavers | § | Apply eligible leaver treatment to deferred bonus and LTIP awards from 5 years (except for termination for gross misconduct). Ability to apply malus for the full vesting period maintained.
| § | Partially mitigates the global competitive impact of longer deferral periods (increasing from 3 years to 7 years) and holding periods under the PRA Remuneration Rules and the EBA Guidelines respectively.
| ||||
§ | Pro-ration of LTIP for eligible leavers retained but based on 4 year performance period, i.e. includes assessment period prior to grant. | § | Alignment to the EBA Guidelines for performance assessment prior to award. | |||||
§ |
Clawback extended to 10 years in specific circumstances. | |||||||
| Barclays PLC and Barclays Bank PLC 2016 Annual Report on Form 20-F | 65 |
Governance: Remuneration report
Directors’ remuneration policy
Differences between the remuneration policy of the executive Directors and the policy for all employees of the Barclays Group
The structure of remuneration packages for executive Directors is closely aligned with that for the broader employee population. Employees receive salary, pension and benefits and are eligible to be considered for a bonus and to participate inall-employee share plans. The broader employee population typically does not have a contractual limit on the quantum of remuneration and does not receive RBP which is paid only to some, but not all, MRTs and other senior employees. Under the new DRP, executive Directors do not receive RBP.
As with executive Directors, variable pay for the broader employee population is performance based. Variable pay for executive Directors and the broader employee population are subject to deferral requirements. Executive Directors and other MRTs are subject to deferral at a minimum rate of 40% (for variable pay of less than £500,000) or 60% (for variable pay between £500,000 and £1,000,000) or 60% up to £1,000,000 and 100% above £1,000,000 (for variable pay of more than £1,000,000). Fornon-MRTs, bonuses in excess of £65,000 are currently subject to a graduated level of deferral. The terms of deferred bonus awards for executive Directors and the wider employee population are broadly the same, in particular the vesting of all deferred bonuses (subject to service and malus conditions).
The broader employee population does not currently participate in the Barclays LTIP.
How shareholder views and broader employee pay are taken into account by the Committee in setting policy and making remuneration decisions
We recognise that remuneration is an area of particular interest to shareholders and that in setting and considering changes to remuneration it is critical that we listen to and take into account their views. Accordingly, a series of meetings are held each year with major shareholders and shareholder representative groups. The Committee Chairman attends these meetings, accompanied by senior Barclays’ employees (including the Group Reward and Performance Director and the Company Secretary). The Committee notes that shareholder views on some matters are not always unanimous, but values the insight and engagement that these interactions provide, including the expression of sometimes different views. This engagement is meaningful and helpful to the Committee in its work and contributes directly to the decisions made by the Committee. Shareholders’ feedback has been incorporated into the new DRP.
The Committee takes account of the pay and employment conditions of the broader employee base when it considers the remuneration of the executive Directors. The Committee receives and reviews analyses of summary remuneration proposals for employees across all of the Group’s businesses. When the Committee considers executive Directors’ remuneration, it therefore makes that consideration in the context of a detailed understanding of remuneration for the broader employee population to ensure consistency throughout the Group.
| 66 | Barclays PLC and Barclays Bank PLC 2016 Annual Report on Form 20-F |
Executive Directors’ policy on recruitment
Barclays operates in a highly specialised sector and many of its competitors for talent are outside of the United Kingdom. The Committee’s approach to remuneration on recruitment is to pay no more than is necessary to attract the best candidates to the role.
Approval of the remuneration packages offered on appointment to any new executive Director is a specific requirement of the Committee’s Terms of Reference. The terms of such packages must be approved by the Committee in consultation with the Chairman and (except for the terms of his own remuneration) the Group Chief Executive.
Any new executive Director’s package would include the same elements as those of the existing executive Directors, as shown below.
| Element of remuneration | Commentary | Maximum value | ||
| Fixed Pay | Determined by experience, market practice, market conditions and ability to recruit. | As determined by the Committee with reference to these factors. Fixed Pay will only exceed amounts paid to current executive Directors, as considered reasonable by the Committee, by reference to these factors.
If on appointment Fixed Pay is equal to or greater than maximum stated for the relevant role in the policy (for current executive Director), no changes are allowed over the policy period.
If on appointment Fixed Pay is at a level below the maximum stated for the relevant role in the policy (for current executive Director), the Committee retains the discretion to realign Fixed Pay over a transitional period which may mean that annual Fixed Pay increases for the new appointee are required up to such maximum amounts. | ||
| Pension | In line with policy. | 10% of Fixed Pay. | ||
| Benefits | In line with policy. | In line with policy. | ||
| Annual Bonus | In line with policy. | 80% of Total fixed pay. | ||
| Long Term Incentive Plan | In line with policy. | 120% of Total fixed pay. | ||
| Buy-out | The Committee can consider buying out forfeited bonus opportunity or incentive awards that the new executive Director has forfeited as a result of accepting the appointment with Barclays, subject to proof of forfeiture where applicable. | The value of any buy-out is not included within the maximum incentive levels above since it relates to a buy-out of forfeited bonus opportunity or incentive awards from a previous employer. | ||
| As required by the PRA Remuneration Rules, any award made to compensate for forfeited remuneration from the new executive Director’s previous employment may not be more generous than, and must mirror as far as possible the expected value, timing and form of delivery of, the terms of the forfeited remuneration and must be in the best long-term interests of Barclays. Barclays’ deferral policy shall however apply as a minimum to anybuy-out of annual bonus opportunity. | ||||
Where a senior executive is promoted to the Board, his or her existing contractual commitments agreed prior to his or her appointment may still be honoured in accordance with the terms of the relevant commitment including vesting of anypre-existing deferred bonus or long-term incentive awards.
| Barclays PLC and Barclays Bank PLC 2016 Annual Report on Form 20-F | 67 |
Governance: Remuneration report
Directors’ remuneration policy
Executive Directors policy on payment for loss of office (including or following a takeover)
The Committee’s approach to payments in the event of termination is to take account of the individual circumstances including the reason for termination, individual performance, contractual obligations and the terms of the deferred bonus plans and LTIPs in which the executive Director participates.
Provisions relating to executive Directors’ termination
| Standard provision | Policy | Details | ||
| Notice periods in executive Directors’ service contracts | For existing executive Directors. twelve months’ notice from the Company and six months’ notice from the executive Director.
For new executive Director hires, six months’ notice from the Company and six months’ notice from the executive Director. | Executive Directors may be required to work during the notice period or may be placed on garden leave or, if not required to work the full notice period, may be provided with pay in lieu of notice (subject to mitigation where relevant).
| ||
| Pay during notice period or payment in lieu of notice per service contracts | Fixed Pay payable and continuation of pension and other contractual benefits while an employee during notice period. | Fixed Pay delivered in cash is payable in phased instalments (or lump sum) and subject to mitigation if paid in instalments and executive Director obtains alternative employment during the notice period or while on garden leave.
Fixed Pay delivered in shares is delivered on the next quarterly delivery date and ispro-rated for the number of days from the start of the relevant quarter to the termination date. Where Barclays elects to terminate the employment with immediate effect by making a payment in lieu of notice, the executive Director will not receive any shares that would otherwise have been payable during the period for which the payment in lieu is made (unless required otherwise by regulations or local law).
In the event of termination for gross misconduct neither notice nor payment in lieu of notice is given.
| ||
| Treatment of annual bonus on termination | No automatic entitlement to bonus on termination, but may be considered at the Committee’s discretion,pro-rated for service, and subject to performance measures being met. No bonus would be payable in the case of gross misconduct or resignation.
| |||
| Treatment of unvested deferred bonus awards | In the case of death or if the executive Director is an ‘eligible leaver’ the executive Director would continue to be eligible to be considered for unvested portions of deferred awards, subject to the rules of the relevant plan, unless the Committee determines otherwise in exceptional circumstances. ‘Eligible leaver’ is defined as leaving due to injury, disability or ill health, retirement, redundancy, the business or company which employs the executive Director ceasing to be part of the Group or the employer terminating employment, other than in circumstances which amount to gross misconduct or dismissal for cause. In addition, the Committee will apply its discretion to treat resignation on or after the fifth anniversary of the date of grant as ‘eligible leaver’ status. Outstanding deferred bonus awards would lapse if the executive Director leaves by reason of resignation prior to fifth anniversary, is terminated for gross misconduct or cause, or is otherwise not designated an ‘eligible leaver’.
Deferred awards are subject to malus provisions which enable the Committee to reduce the vesting level of deferred bonuses (including to nil) and once vested are subject to clawback provisions (as described above).
In the event of a takeover or other major corporate event, the Committee has absolute discretion to determine whether all outstanding awards would vest early or whether they should continue in the same or revised form following the change of control. The Committee may also determine that participants may exchange existing awards for awards over shares in an acquiring company with the agreement of that company.
| In an ‘eligible leaver’ situation, deferred bonus awards may be considered for release in full on the scheduled release dates unless the Committee determines otherwise in exceptional circumstances. After release, the shares are subject to an additional holding period in line with regulations (currently minimum of six months, increasing to one year for the 2017 performance year). | ||
| 68 | Barclays PLC and Barclays Bank PLC 2016 Annual Report on Form 20-F |
Provisions relating to executive Directors’ terminationcontinued
| Standard provision | Policy | Details | ||
| Treatment of unvested awards under the LTIP | In the case of death or if the executive Director is an ‘eligible leaver’ the executive Director would continue to be entitled to be considered for an award. ‘Eligible leaver’ is defined as leaving due to injury, disability or ill health, retirement, redundancy, the business or company which employs the executive Director ceasing to be part of the Group or for any other reason if the Committee decides at its discretion. In addition, the Committee will apply its discretion to treat resignation on or after the fifth anniversary of the date of grant as ‘eligible leaver’ status. Outstanding unvested awards under the LTIP would lapse if the executive Director leaves by reason of resignation prior to fifth anniversary, is terminated for gross misconduct, or is otherwise not designated an ‘eligible leaver’.
Awards are subject to malus provisions which enable the Committee to reduce the vesting level of awards (including to nil) and once vested, awards are subject to clawback provisions (as described above).
In the event of a takeover or other major corporate event (but excluding an internal reorganisation of the Group), the Committee has absolute discretion to determine whether all outstanding awards vest subject to the achievement of any performance conditions. The Committee has discretion to apply apro-rata reduction to reflect the unexpired part of the vesting period. The Committee may also determine that participants may exchange awards for awards over shares in an acquiring company with the agreement of that company. In the event of an internal reorganisation, the Committee may determine that outstanding awards will be exchanged for equivalent awards in another company.
| In an ‘eligible leaver’ situation, awards may be considered for release on the scheduled release dates,pro-rated for time (over the whole performance period, including the assessment period prior to grant for awards granted on or after 10 May 2017) and performance, subject to the Committee’s discretion to determine otherwise in exceptional circumstances, in accordance with the plan rules, as amended from time to time. After release, the shares (net of deductions for tax) are subject to an additional holding period (currently minimum of six months, increasing to one year for the 2017 performance year). | ||
| Repatriation | Except in the case of gross misconduct or resignation, where an executive Director has been relocated at the commencement of employment, the Company may pay for the executive Director’s repatriation costs in line with Barclays’ general employee mobility policy including temporary accommodation, payment of removal costs and relocation flights for the executive Director, spouse and children. The Company will pay the executive Director’s tax on the relocation costs but will not tax equalise and will also not pay tax on his or her other income relating to the termination of employment.
| |||
| Other | Except in the case of gross misconduct or resignation, the Company may pay for the executive Director’s legal fees and tax advice relating to the termination of employment and provide outplacement services. The Company may pay the executive Director’s tax on these particular costs.
| |||
| Barclays PLC and Barclays Bank PLC 2016 Annual Report on Form 20-F | 69 |
Governance: Remuneration report
Directors’ remuneration policy
Illustrative scenarios for executive Directors’ remuneration
The charts below show the potential value of the current executive Directors’ 2017 total remuneration under the new DRP in three scenarios: ‘Minimum’ (i.e. Fixed Pay, Pension and benefits), ‘Maximum’ (i.e. Fixed Pay, Pension and benefits and the maximum variable pay that may be awarded) and‘Mid-point’ (i.e. Fixed Pay, Pension and benefits and 50% of the maximum variable pay that may be awarded). For the purposes of these charts, the value of benefits is based on an estimated annual value for 2017. The scenarios do not reflect share price movement between award and vesting.
A significant proportion of the potential remuneration of the executive Directors is variable and is therefore performance-related. It is also subject to deferral, additional holiding periods, malus and clawback.
Total remuneration opportunity:Group Chief Executive (£000) | Total remuneration opportunity:Group Finance Director (£000) | |||
|
|
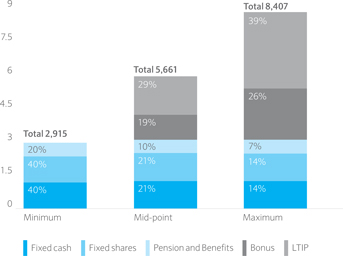
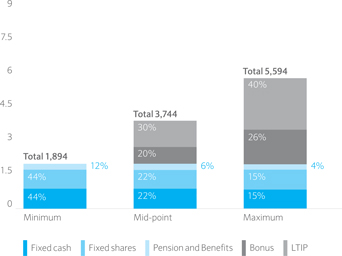
In the above illustrative scenarios, benefits include regular contractual benefits. Additional ad hoc benefits may arise, for example, overseas relocation of executive Directors, but will always be provided in line with the DRP.
| 70 | Barclays PLC and Barclays Bank PLC 2016 Annual Report on Form 20-F |
Remuneration policy fornon-executive Directors
This section provides details of the remuneration policy for the Chairman andnon-executive Directors.
Element and purpose
|
Operation
|
Maximum value
| ||
Fees Reflect individual responsibilities and membership of Board Committees and are set to attractnon-executive Directors who have relevant skills and experience to oversee the implementation of our strategy
Fees are set at a level which reflects the role, responsibilities and time commitment which are expected from the Chairman, Deputy Chairman andnon-executive Directors |
The Chairman and Deputy Chairman are paid anall-inclusive fee for all Board responsibilities. The Chairman has a minimum time commitment equivalent to at least 80% of a full-time role. The othernon-executive Directors receive a basic Board fee, with additional fees payable where individuals serve as a member or Chairman of a Committee of the Board.
Fees are reviewed each year by the Board as a whole.
£30,000 (Chairman: £100,000) after tax and national insurance contributions per annum of eachnon-executive Director’s basic fee is used to purchase Barclays’ shares which are retained on thenon-executive Director’s behalf until they retire from the Board.
Somenon-executive Directors may also receive fees as directors of subsidiary companies of Barclays PLC. In the case of certain subsidiary appointments, such additional remuneration is approved by the Board Nominations Committee.
|
Fees are reviewed against those fornon-executive Directors in companies of similar size and complexity. Other than in exceptional circumstances, fees will not increase by more than 20% above the current fee levels during this policy period (basic fees last increased in 2011). | ||
Benefits |
The Chairman is provided with private medical cover subject to the terms of the Barclays’ scheme rules from time to time, and is provided with the use of a Company vehicle and driver when required for business purposes.
Benefits which are minor in nature and in any event do not exceed a cost of £500 may be provided tonon-executive Directors in specific circumstances.
Non-executive Directors are not eligible to join Barclays’ pension plans.
| |||
Expenses |
The Chairman andnon-executive Directors are reimbursed for any reasonable and appropriate expenses incurred for business reasons. Any tax that arises on these reimbursed expenses is paid by Barclays.
| |||
Bonus and share plans |
The Chairman is required to be eligible to participate in HMRC employee tax advantaged share schemes, due to his 80% of a full-role time commitment, but has opted not to participate. The Chairman is not eligible to participate in any other Barclays’ cash, share or long-term incentive plans.
All othernon-executive Directors are not eligible to participate in Barclays’ cash, share or long-term incentive plans.
| |||
Notice and termination provisions |
Eachnon-executive Director’s appointment is for an initial six year term, renewable at Barclays’ discretion for a single term of three years thereafter and subject to annualre-election by shareholders.
Notice period Chairman: twelve months from the Company (six months from the Chairman).Non-executive Directors: six months from the Company (six months from thenon-executive Director).
Termination payment policy The Chairman’s appointment may be terminated by Barclays on 12 months’ notice or immediately in which case 12 months’ fees and contractual benefits are payable in instalments at the times they would have been received had the appointment continued, but subject to mitigation if he or she were to obtain alternative employment. There are similar termination provisions fornon-executive Directors based on 6 months’ fees. No continuing payments of fees (or benefits) are due if anon-executive Director is notre-elected by shareholders at the Barclays AGM.
| |||
In accordance with the policy table above, any new Chairman and Deputy Chairman would be paid anall-inclusive fee only and any newnon-executive Director would be paid a basic fee for their appointment as anon-executive Director, plus fees for their participation on and/or chairing of any Board committees, time apportioned in the first year as necessary. Nosign-on payments are offered tonon-executive Directors.
| Barclays PLC and Barclays Bank PLC 2016 Annual Report on Form 20-F | 71 |
Governance: Remuneration report
Directors’ remuneration policy
Service contracts and letters of appointment
All executive Directors have a service contract whereas allnon-executive Directors have a letter of appointment. Copies of the service contracts and letters of appointment respectively are available for inspection at the Company’s registered office. The dates of the current Directors’ service contracts and letters of appointment are shown in the table below.
Effective date
| ||
| Chairman | ||
| John McFarlane | 1 January 2015(non-executive Director), 24 April 2015 (Chairman) | |
| Executive Directors | ||
| Jes Staley | 1 December 2015 | |
| Tushar Morzaria | 15 October 2013 | |
| Non-executive Directors | ||
| Michael Ashley | 18 September 2013 | |
| Tim Breedon | 1 November 2012 | |
| Mary Francis | 1 October 2016 | |
| Crawford Gillies | 1 May 2014 | |
| Sir Gerry Grimstone | 1 January 2016 | |
| Reuben Jeffery III | 16 July 2009 | |
| Dambisa Moyo | 1 May 2010 | |
| Diane de Saint Victor | 1 March 2013 | |
| Diane Schueneman | 25 June 2015 | |
| Steve Thieke | 7 January 2014 |
All Directors are put forward forre-election at each AGM, unless they have indicated that they will not seekre-election at the AGM.
Discretion
In addition to the various operational discretions that the Committee can exercise in the performance of its duties (including those discretions set out in the Company’s share plans), the Committee reserves the right to make either minor or administrative amendments to the policy to benefit its operation or to make more material amendments in order to comply with new laws, regulations and/or regulatory guidance. The Committee would only exercise this right if it believed it was in the best interests of the Company to do so and where it is not possible, practicable or proportionate to seek or await shareholder approval in General Meeting.
| 72 | Barclays PLC and Barclays Bank PLC 2016 Annual Report on Form 20-F |
Governance: Remuneration report
Annual report on Directors’ remuneration
This section explains how our Directors’ remuneration policy was implemented during 2016.
|
Executive Directors
Executive Directors: Single total figure for 2016 remuneration (audited)
The following table shows a single total figure for 2016 remuneration in respect of qualifying service for each executive Director together with comparative figures for 2015.
| | Salary £000 |
| | Role Based Pay £000 |
| | Taxable benefits £000 |
| Annual bonus £000 |
| | LTIP £000 |
| | Pension £000 |
| £000 Total |
| ||||||||||||||||||||||||||||||||||||||||||||
| 2016 | 2015 | 2016 | 2015 | 2016 | 2015 | 2016 | 2015 | 2016 | 2015 | 2016 | 2015 | 2016 | 2015 | |||||||||||||||||||||||||||||||||||||||||||||||||
| Jes Staleya | 1,200 | 100 | 1,150 | 96 | 169 | 48 | 1,318 | – | – | – | 396 | 33 | 4,233 | 277 | ||||||||||||||||||||||||||||||||||||||||||||||||
| Tushar Morzaria | 800 | 800 | 750 | 750 | 44 | 82 | 854 | 701 | 1,008 | – | 200 | 200 | 3,656 | 2,533 | ||||||||||||||||||||||||||||||||||||||||||||||||
Note
| a | The 2015 figures for Jes Staley relate to the period from 1 December 2015 when he joined the Board as Group Chief Executive. |
Additional information in respect of each element of pay for the executive Directors (audited)
Salary
Jes Staley has been paid a salary of £1,200,000 per annum since his appointment to the Group Chief Executive role on 1 December 2015. Tushar Morzaria was paid a salary of £800,000 per annum as Group Finance Director.
Role Based Pay (RBP)
Executive Directors received RBP which was delivered quarterly in shares, subject to a holding period with restrictions lifting over five years (20% each year). The value shown is of shares at the date awarded.
Taxable benefits
Taxable benefits include private medical cover, life and ill health income protection, tax advice, relocation, car allowance, the use of a company vehicle and driver when required for business purposes and other benefits that are considered minor in nature.
Annual bonus
Annual bonuses are discretionary and are typically awarded in Q1 following the financial year to which they relate. The Committee considered each of the executive Directors’ performance against the financial (50% weighting) and Balanced Scorecard (35% weighting) performance measures which had been set to reflect strategic priorities for 2016. Performance against their individual personal objectives (15% weighting) is assessed on an individual basis.
2016 annual bonus outcomes
Financial (50% weighting)
The approach taken to assessing financial performance against each of the financial measures is based on a straight-line outcome between 25% for threshold performance and 100% applicable to each measure for achievement of maximum performance.
The formulaic outcome from 2016 performance against the financial measures gave a total of 29% out of 50% being payable attributable to those measures. A summary of the assessment is provided in the following table.
Financial performance measure | Weighting | Threshold 25% | Maximum 100% | 2016 Actual | 2016 Outcome | |||||
| Profit before tax (excluding notable items) | 20% | £3.45bn | £4.20bn | £3.65bn | 9% | |||||
| Costs (excluding notable items) | 10% | £14.6bn | £13.7bn | £15.3bn | 0% | |||||
| CET1 ratio | 20% | 11.1% | 11.6% | 12.4% | 20% | |||||
| Total Financial | 50% | 29% |
When reflecting upon the appropriate 2016 bonus, the Committee considered the impact of the deferral changes on the formulaic outcomes against the financial measures. In particular, the Committee noted that while the decision to accelerate the deferral charges would improve the Group’s operational flexibility going into 2017 and beyond, it would also lead to a lower 2016 bonus outcome than could have been justified absent the changes. However, on balance, the Committee felt that the overall outcomes were appropriate particularly given theon-going focus to rebalance towards improving shareholder returns.
Balanced Scorecard (35% weighting)
Progress in relation to each of the 5Cs of the Balanced Scorecard was assessed by the Committee. The Committee took a similar approach as for 2015 i.e. based on a three-point scale in relation to each measure, with 0% to 2% for ‘below’ target, 3% or 4% for a ‘met’ target, and 5% to 7% for ‘above’ target progress against a particular Balanced Scorecard component.
| Barclays PLC and Barclays Bank PLC 2016 Annual Report on Form 20-F | 73 |
Governance: Remuneration report
Annual report on Directors’ remuneration
Based on this approach to assessing performance against 2016 Balanced Scorecard milestones, the Committee agreed a 18% outcome out of a maximum of 35%. A summary of the assessment is provided in the following table.
| Balanced Scorecard – 5 Cs | Weighting | Metric | | 2016 Target |
| | 2016 Actual | | 2016 Outcome out of maximum 7% for each ‘C’ | |||||||
| Customer and Client | 7% | PCB, Barclaycard and Africa Banking weighted average ranking of RNPS v peer sets Client Franchise Risk | 4th | 4th | 4% | |||||||||||
| 6th | 5th | |||||||||||||||
| Colleague | 7% | Sustained engagement of colleagues’ score | 77-79% | 75% | 3% | |||||||||||
| % women in senior leadership | 24% | 24% | ||||||||||||||
| Citizenship | 7% | Citizenship Plan – initiatives on track or ahead | Plan targets | 8/10 | �� | 5% | ||||||||||
| Conduct | 7% | Conduct Reputation (YouGov Survey) | 5.5-5.6/10 | 5.4/10 | 2% | |||||||||||
| Companyb | 7% | Return on tangible equityc | 4.8% | 4.4% | ||||||||||||
| Cost:Income ratioc | 70% | 72% | 4% | |||||||||||||
| CET1 ratio | 11.3% | 12.4% | ||||||||||||||
| Total Balanced Scorecard | 35% | 18% |
Note
| a | Company metrics have been updated to reflect the 1 March 2016 strategy announcement. |
| b | Excluding notable items. |
| c | Cost: Income ratio expressed as total operating expenses of the Group, including Africa, divided by the total income of these businesses. |
Individual outcomes including assessment of personal objectives
Performance against each of the executive Directors’ individual personal objectives (15% weighting overall) was assessed by the Committee on an individual basis.
(i) Jes Staley
A summary of the assessment for Jes Staley against his specific performance measures is provided in the following table.
| Performance measure | Weighting | Outcome | ||||||
| Financial | See table on page 73 | 50% | 29% | |||||
| Balanced Scorecard – 5Cs | See table above | 35% | 18% | |||||
| Personal objectives | Judgemental assessment – see below | 15% | 13% | |||||
| Total | 100% | 60% | ||||||
| Final outcome approved by the Remuneration Committee | 60% | |||||||
The Committee assessed Jes Staley’s performance against his 2016 personal objectives (as set out on page 97 of the 2015 Annual Report) and concluded that Jes Staley had delivered a very strong performance throughout the year. By the end of 2016, a clear new strategy was firmly embedded and a new Core organisational structure consistent with structural reform has been implemented. The Core businesses have performed well, delivering improved profitability and cost income efficiency. At the same time significant progress has been made in exiting theNon-Core businesses. Jes Staley has demonstrated strong leadership, strengthened the management team and has instilled a more effective performance ethic and culture within the organisation. Given his strong personal performance, the Committee judged that 13% of a maximum of 15% attributable to individual objectives was appropriate.
In aggregate, the performance assessment for Jes Staley resulted in an overall formulaic outcome of 60% of maximum bonus opportunity being achieved. The resulting 2016 bonus is £1,318,000 of which 70% is deferred under the Share Value Plan and will vest in five equal tranches from the third to seventh anniversary (subject to the rules of the Share Value Plan as amended from tiem to time).
(ii) Tushar Morzaria
A summary of the assessment for Tushar Morzaria against his specific performance measures is provided in the following table.
| Performance measure | Weighting | Outcome | ||||||
| Financial | See table on page 73 | 50% | 29% | |||||
| Balanced Scorecard – 5Cs | See table above | 35% | 18% | |||||
| Personal objectives | Judgemental assessment – see below | 15% | 14% | |||||
| Total | 100% | 61% | ||||||
| Final outcome approved by the Remuneration Committee | 61% | |||||||
The Committee assessed Tushar Morzaria’s performance against his 2016 personal objectives (as set out on page 97 of the 2015 Annual Report) and concluded that Tushar Morzaria had delivered an outstanding performance in 2016. In doing so, the Committee noted the role provided by Tushar Morzaria in reshaping the business and in particular, recognised his contribution in the significant progress in exitingNon-Core, resulting in a reduction of 22bn in Risk Weighted Assets and his focus in delivering an organisation with a significantly higher CET1 ratio and lower Cost:Income ratio. In doing so, it was also noted that Tushar Morzaria has continued to develop very strong working relationships with shareholders, investors and regulators, while also improving the performance delivery within the Finance Functions. Given his exceptional personal performance during 2016, the Committee judged that 14% of a maximum 15% attributable to individual objectives was appropriate.
In aggregate, the performance assessment for Tushar Morzaria resulted in an overall formulaic outcome of 61% of maximum bonus opportunity being achieved. The resulting 2016 bonus is £854,000 of which 60% is deferred under the Share Value Plan and will vest in five equal tranches from the third to seventh anniversary (subject to the rules of the Share Value Plan as amended from time to time).
All shares (whether deferred or not) are subject to a further six month holding period from the point of release. 2016 bonuses are subject to clawback provisions and, additionally, unvested deferred 2016 bonuses are subject to malus provisions which enable the Committee to reduce the vesting level of deferred bonuses (including to nil).
| 74 | Barclays PLC and Barclays Bank PLC 2016 Annual Report on Form 20-F |
LTIP
The LTIP amount included in Tushar Morzaria’s 2016 single total figure is the value of the amount scheduled to be released in relation to the LTIP award granted in 2014 in respect of performance period 2014-2016 (by reference to Q4 average share price). As Jes Staley was not a participant in this cycle, the LTIP figure in the single figure table is zero for him. Release is dependent on, among other things, performance over the period from 1 January 2014 to 31 December 2016. Straight line vesting applied between the threshold and maximum points in respect of the RoRWA and loan loss rate measures. The performance achieved against the performance targets is as follows.
| Performance measure | Weighting | Threshold | Maximum vesting | Actual | % of award vesting | |||||||||
| Return on risk weighted assets (RoRWA) | 50% | 23% of award vests for average annual RoRWA of 1.08% | Average annual RoRWA of 1.52% | 0.33% | 0% | |||||||||
| Loan loss rate | 20% | 7% of award vests for average annual loan loss rate of 70bps | Average annual loan loss rate of 55bps or below | 50bps | 20% | |||||||||
| Balanced Scorecard | 30% | Performance against the Balanced Scorecard was assessed by the Committee to determine the percentage of the award that may vest between 0% and 30%. Each of the 5Cs in the Balanced Scorecard has equal weighting. | See below | 14% | ||||||||||
| Total | 34% | |||||||||||||
A summary of the Committee’s assessment against the Balanced Scorecard performance measure over the three year performance period is provided below.
| Category | Performance | Vesting out of maximum 6% for each ‘C’ | ||||
| Customer and Client | § | Relationship Net Promoter Score performance against peers was 4th during the period. Across key product categories, notably UK current accounts and UK credit cards, Barclays’ scores have improved with more customers advocating our brands. | 3% | |||
| § | Client Franchise Rank remained stable at 5th rank throughout the period, a positive result given the shift in strategy to focus on geographies and businesses of strength in the Investment Bank. | |||||
| Colleague | § | Continued improvement in the female representation across our senior leadership, rising from 22% in 2014 to 24% at the end of 2016. | 3% | |||
| § | Colleague engagement improved from 72% in 2014 to 75% overall in 2016, a positive result in the light of the change the organisation has undergone over the period. | |||||
| Citizenship | § | Continuing on from the successful Citizenship Plan, which closed 2015 with 10 out of 11 initiatives on or ahead of target, Barclays Group (ex Africa) exceeded objectives on all 6 initiatives in the first year of the Shared Growth Ambition. | 4% | |||
| § | Africa also delivered strong performance on investment in education and SME financing, both of which were on track for 2016. Two objectives wereoff-track due to external challenges which impacted the delivery of planned employability and financial inclusion interventions (although foundations are now established which will enable strong 2017 momentum). | |||||
| Conduct | § | Conduct reputation, as measured by the YouGov survey, remained at or below 5.4 over the period. | 1% | |||
| § | However, new conduct items and costs have reduced. | |||||
| Company | § | The CET1 ratio has strengthened significantly over the period, to 12.4% at the end of 2016. | 3% | |||
| § | However, returns excluding notable items (both RoE and RoTE) were below target through much of the period. | |||||
| Total | 14% | |||||
The LTIP award is also subject to a discretionary underpin whereby the Committee must be satisfied with the underlying financial health of the Group based on profit before tax. The Committee was satisfied that this underpin was met, and accordingly determined that the award should be considered for release to the extent of 34% of the maximum number of shares under the total award. The shares are scheduled to be released in March 2017. After release, the shares are subject to an additional two year holding period.
Pension
Executive Directors are paid cash in lieu of pension contributions. The cash allowance in 2016 was 33% of salary for Jes Staley and 25% of salary for Tushar Morzaria. No other benefits were received by the executive Directors from any Barclays pension plans.
Executive Directors: other LTIP awards
The Directors’ remuneration reporting regulations require inclusion in the single total figure of only the value of the LTIP awards whose last year of performance ends in the relevant financial year and whose vesting outcome is known. For 2016, this is the award to Tushar Morzaria under the 2014-2016 LTIP cycle and further details are set out on page 75. This section sets out other LTIP cycles in which the executive Directors participate, the outcome of which remains dependent on future performance.
| Barclays PLC and Barclays Bank PLC 2016 Annual Report on Form 20-F | 75 |
Governance: Remuneration report
Annual report on Directors’ remuneration
LTIP awards to be granted during 2017
The Committee decided to make an award under the 2017-2019 LTIP cycle to Jes Staley and Tushar Morzaria with a face value at grant of 120% of their respective Total fixed pay at 31 December 2016.
The 2017-2019 LTIP award will be subject to the following forward-looking performance measures.
| Performance measure | Weighting | Threshold | Maximum vesting | |||
| Return on tangible equity (RoTE) excluding notable items | 25% | 6.25% of award vests for average RoTE excluding notable items of 7.5% | Average RoTE excluding notable items of 9.5% | |||
CET1 ratio as at 31 December 2019 | 25% | CETI ratio must remain at or above an acceptable level for any of this element to vest. The threshold will be reviewed and set annually based on market conditions and regulatory requirements (11% on 31 December 2017) 6.25% of award vests for CET1 ratio 100 basis points above the mandatory distribution restrictions hurdle (MDRH) | CET1 ratio 200 basis points above the MDRH | |||
| Cost:Income ratio excluding notable items | 20% | 5% of award vests for average Cost:Income ratio of 63% | Average Cost:Income ratio of 58% | |||
| Risk Scorecard | 15% | The Risk Scorecard captures a range of risks and is aligned with the annual incentive risk adjustment framework agreed with the PRA. The current framework measures performance against three broad categories – Capital and Liquidity, Control Environment and Conduct – using a combination of quantitative and qualitative metrics. The framework may be updated from time to time in line with the Group’s risk strategy. Specific targets within each of the categories are deemed to be commercially sensitive. Retrospective disclosure of performance will be made in the 2019 Remuneration report. | ||||
| Strategic / Non-financial measures | 15% | § The existing Balanced Scorecard has evolved into a ‘Performance Measurement’ framework in line with the objective of delivering a simplified Barclays through the strategic actions announced in March 2016. The evaluation will focus on key performance measures (many continuing from the Balanced Scorecard), with a detailed retrospective narrative on progress throughout the period against each category. | ||||
§ Performance against theStrategic/Non-financial Measures will be assessed by the Committee to determine the percentage of the award that may vest between 0% and 15%. The measures are organised around 3 main categories: Customer & Client, Colleague and Citizenship. Each of the three main categories has equal weighting. Measures will likely include, but not be limited to, the following: | ||||||
– Customer & Client: NPS for consumer businesses, Client rankings and market shares for the Corporate and Investment Bank, complaints performance and volume of lending provided to customers and clients. | ||||||
– Colleague: Diversity and Inclusion statistics (including women in senior leadership), Employee sustainable engagement survey scores and conduct and culture measures. | ||||||
– Citizenship: Delivery against our Shared Growth Ambition, Colleague engagement in Citizenship activities and external benchmarks and surveys. | ||||||
Straight line vesting applies between the threshold and maximum points in respect of the financial measures.
The award is subject to a discretionary underpin by which the Committee must be satisfied with the underlying financial health of the Group.
Outstanding LTIP awards
(i) LTIP awards granted during 2015
The performance measures for the awards made under the 2015-2017 LTIP cycle are shown below.
| Performance measure | Weighting | Threshold | Maximum vesting | |||
| Net generated equitya | 30% | 7.5% of award vests for Net Generated Equity of £1,363m | Net Generated Equity of £1,844m | |||
| Core return on risk weighted assets (RoRWA) excluding own credit | 20% | 5% of award vests for average annual Core RoRWA of 1.34% | Average annual Core RoRWA of 1.81% | |||
| Non-Core drag on return on equity (RoE) excluding notable items | 10% | 2.5% of award vests forNon-Core drag on RoE of –4.02% | Non-Core drag on RoE of –2.97% | |||
| Loan loss rate | 10% | 2.5% of award vests for average annual loan loss rate of 70bps | Average annual loan loss rate of 55bps or below | |||
| Balanced Scorecard | 30% | Performance against the Balanced Scorecard is assessed by the Committee to determine the percentage of the award that may vest between 0% and 30%. Each of the 5Cs in the Balanced Scorecard has equal weighting. The targets within each of the 5Cs are deemed to be commercially sensitive. However, retrospective disclosure of the targets and performance against them will be made in the 2017 Remuneration report subject to commercial sensitivity no longer remaining. | ||||
Note
| a | Net generated equity is a metric which converts changes in the CET1 ratio into an absolute capital equivalent measure. For remuneration purposes, net generated equity will exclude inorganic actions such as rights issues, as determined by the Committee. |
Straight line vesting applies between the threshold and maximum points in respect of the financial and risk measures. The award is subject to a discretionary underpin by which the Committee must be satisfied with the underlying financial health of the Group.
| 76 | Barclays PLC and Barclays Bank PLC 2016 Annual Report on Form 20-F |
(ii) LTIP awards granted during 2016
An award was made to Tushar Morzaria on 14 March 2016 under the 2016-2018 LTIP cycle at a share price on the date of grant of £1.6535, in accordance with our Directors’ remuneration policy. This is the price used to calculate the face value below. Jes Staley was not eligible for a grant under the 2016-2018 LTIP cycle.
| | % of fixed pay | | | Number of shares | | | Face value at grant | | | Performance period | | |||||
| Tushar Morzaria | 120% | 1,270,033 | £2,100,000 | 2016-2018 |
The performance measures for the 2016-2018 LTIP awards are as follows:
| Performance measure | Weighting | Threshold | Maximum vesting | |||
Return on tangible equity (RoTE) excluding notable items | 25% | 6.25% of award vests for average RoTE of 7.5% | Average RoTE of 10.0% | |||
| CET1 ratio must remain at or above an acceptable level for any of this element to vest. | ||||||
| The threshold will be reviewed and set annually based on market conditions and regulatory requirements (11% on 31 December 2017) | ||||||
| CET1 ratio as at 31 December 2018 | 25% | 6.25% of award vests for CET1 ratio of 11.6% | CET1 ratio of 12.7% | |||
| Cost:Income ratio excluding notable items | 20% | 5% of award vests for average Cost:Income ratio of 66% | Average Cost:Income ratio of 58% | |||
| Risk Scorecard | 15% | Performance against the Risk Scorecard is assessed by the Committee, with input from the Group Risk function, Board Risk Committee and Board Reputation Committee as appropriate, to determine the percentage of the award that may vest between 0% and 15%. The Risk Scorecard measures performance against three broad categories – Risk Profile (including Conduct), Control Environment and Risk Capability – using a combination of quantitative and qualitative metrics. Specific targets within each of the categories are deemed to be commercially sensitive. Retrospective disclosure of performance will be made in the 2018 Remuneration report subject to commercial sensitivity no longer remaining. | ||||
| Balanced Scorecard | 15% | Performance against the Balanced Scorecard is assessed by the Committee to determine the percentage of the award that may vest between 0% and 15%. Each of the 5Cs in the Balanced Scorecard has equal weighting. Assessment will be made against progress towards the 2018 targets. | ||||
Straight line vesting applies between the threshold and maximum points in respect of the financial and risk measures. The award is subject to a discretionary underpin by which the Committee must be satisfied with the underlying financial health of the Group.
Executive Directors: Statement of implementation of remuneration policy in 2017
The executive Directors’ package for 2017, in line with the new DRP, will be implemented with effect from the 2017 AGM as follows:
| Jes Staley | Tushar Morzaria | Comments | ||||
| Fixed Pay | £2,350,000 | £1,650,000 | ‘Fixed Pay’ replaces Salary and Role Based Pay. Fixed Pay delivered 50% in cash and 50% in shares (subject to 5 year holding period lifting pro rata)
No change in ‘Fixed Pay’ from 2016 for Jes Staley
Fixed Pay has increased to £1,650k from £1,550k for Tushar Morzaria | |||
| Pension | £396,000 | £200,000 | No change from 2016 | |||
| Maximum Bonus | 80% of Total Fixed Paya | 80% of Total Fixed Paya | Total variable opportunity unchanged Bonus and LTIP combined for regulatory deferral purposes | |||
| Maximum LTIP | 120% of Total Fixed Paya | 120% of Total Fixed Paya |
Note:
| a | Total Fixed Pay is defined as Fixed Pay plus Pension |
In considering the appropriate level of Tushar Morzaria’s Total fixed pay (Fixed Pay plus Pension), the Committee took account of the time he has been in role without any increase (over three years), his strong performance and importance to the organisation, and industry market rates for the role. The Committee concluded that an increase of 5.7%, being less than the increase paid to UK employees over the same period, was warranted but agreed that the executive Directors would not be eligible for any further increase in the next three years (i.e. during the new policy period).
| Barclays PLC and Barclays Bank PLC 2016 Annual Report on Form 20-F | 77 |
Governance: Remuneration report
Annual report on Directors’ remuneration
Clawback and malus
Barclays may apply clawback if at any time during the seven year period from the date on which any variable remuneration is awarded: (i) there is reasonable evidence of individual misbehaviour or material error, and/or (ii) the firm suffers a material failure of risk management, taking account of the individual’s proximity to, and responsibility for, that incident. For variable remuneration awards granted to executive Directors in respect of 2016 onwards, the clawback period may be extended to 10 years in circumstances where the Company or a regulatory authority has commenced an investigation which could potentially lead to the application of clawback.
Malus provisions will continue to apply to unvested deferred awards.
Deferral
A 7 year deferral period (with no vesting prior to the third anniversary of award, and vesting in equal tranches between the third and seventh year) will apply to any 2017 deferred variable remuneration awarded to the executive Directors.
2017 Annual bonus performance measures
Performance measures with appropriately stretching targets have been selected to cover a range of financial andnon-financial goals that support the key strategic objectives of the Company. The performance measures and weightings are shown below.
Financial (60% weighting)
A performance target range has been set for each financial measure.
|
§ Profit before tax excluding notable items (22.5% weighting)
§ Cost:Income ratio excluding notable items (15% weighting)
§ CET1 ratio (22.5% weighting)
| |
Strategic/Non-financial (20% weighting) |
§ The existing Balanced Scorecard has evolved into a ‘Performance Measurement’ framework in line with the objective of delivering a simplified Barclays through the strategic actions announced in March 2016. Enhancements to the available sources of management information and reporting, ranging from internal dashboards to external third party measures, allows for a more holistic view of sustainable business performance, rather than focusing on a few narrowly defined targets. The evaluation will focus on key performance measures (many continuing from the Balanced Scorecard), with a detailed retrospective narrative on progress throughout the period against each category.
§ Performance against theStrategic/Non-financial Measures will be assessed by the Committee to determine the percentage of the award that may vest between 0% and 20%. The measures are organised around 3 main categories: Customer & Client, Colleague and Citizenship. Each of the three main categories has equal weighting. Measures will likely include, but not be limited to, the following:
– Customer & Client: NPS for consumer businesses, Client rankings and market shares for the Corporate and Investment Bank, complaints performance and volume of lending provided to customers and clients.
– Colleague: Diversity and Inclusion statistics (including women in senior leadership), Employee sustainable engagement survey scores and conduct and culture measures.
– Citizenship: Delivery against our Shared Growth Ambition, Colleague engagement in Citizenship activities and external benchmarks and surveys.
| |
Personal (20% weighting) |
The executive Directors have the following joint personal objectives for 2017:
§ Deliver on 2017 financial commitments including continued improvement in RoTE, the Cost:Income ratio and continuedbuild-up of our capital base (CET1 ratio)
§ ExitNon-Core and ensure successful reintegration of remaining assets / businesses into Core
§ Achieve the sell-down of Barclays Africa Group Ltd to obtain regulatory deconsolidation
§ Ensure successful implementation of the 2017 Structural Reform programme, including creation of the Service Company and establishment of subsidiary Boards for Barclays UK and Barclays InternationaI
§ Identify and implement as far as possible in 2017 a structural solution to ensure continued access to the single market in Europe
§ Manage risk and control effectively and make continued progress in resolving legacy conduct and litigation matters.
In addition, individual personal objectives for 2017 are as follows:
Jes Staley:
§ Make continued progress towards a high performing culture in line with our Values while also strengthening employee engagement
§ Improve customer and client satisfaction while reducing the number of overall complaints
§ Strengthen succession planning pipeline for Group and Business Unit/Functional Executive Committees and continue to improve percentage of women in senior leadership positions.
Tushar Morzaria:
§ Demonstrate effective management of external relationships and reputation
§ Continue to strengthen team performance, talent pipeline and employee engagement in Group Finance, Tax and Treasury.
|
Detailed calibration of the Financial and Strategic targets is commercially sensitive and it is not appropriate to disclose this information externally on a prospective basis. Disclosure of achievement will be made in the 2017 Annual Report subject to the targets no longer being commercially sensitive. The Committee may exercise its discretion to amend the formulaic outcome of assessment against the targets. Any exercise of discretion will be disclosed and explained.
| 78 | Barclays PLC and Barclays Bank PLC 2016 Annual Report on Form 20-F |
Performance graph and table
The performance graph below illustrates the performance of Barclays over the financial years from 2009 to 2016 in terms of total shareholder return compared with that of the companies comprising the FTSE 100 index. The index has been selected because it represents a cross-section of leading UK companies.
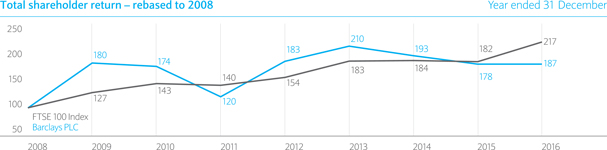
In addition, the table below provides a summary of the total remuneration of the relevant Group Chief Executive over the same period as the previous graph. For the purpose of calculating the value of the remuneration of the Group Chief Executive, data has been collated on a basis consistent with the ‘single figure’ methodology.
| Year | 2009 | 2010 | 2011 | 2012 | 2012 | 2013 | 2014 | 2015 | 2015 | 2015 | 2016 | |||||||||||||||||||||||||||||||||
| Group Chief Executive | | John Varley | | | John Varley | | | Bob Diamond | | | Bob Diamonda | | | Antony Jenkinsb | | | Antony Jenkins | | | Antony Jenkins | | | Antony Jenkinsb | | | John McFarlanec | | | Jes Staleyd | | | Jes Staley | | |||||||||||
| Group Chief Executive single figure of total remuneration £000s | 2,050 | 4,567 | 11,070e | 1,892 | 529 | 1,602 | 5,467f | 3,399 | 305 | 277 | 4,233 | |||||||||||||||||||||||||||||||||
| Annual bonus against maximum opportunity % | 0% | 100% | 80% | 0% | 0% | 0% | 57% | 48% | N/A | N/A | 60% | |||||||||||||||||||||||||||||||||
| Long-term incentive vesting against maximum opportunity % | 50% | 16% | N/Ag | 0% | N/Ag | N/Ag | 30% | 39% | N/Ag | N/Ag | N/Ag |
Notes
| a | Bob Diamond left the Board on 3 July 2012. |
| b | Antony Jenkins became Group Chief Executive on 30 August 2012 and left the Board on 16 July 2015. |
| c | John McFarlane was Executive Chairman from 17 July 2015 to 30 November 2015. His fees, which remained unchanged, have beenpro-rated for his time in the position. He was not eligible to receive a bonus or LTIP. |
| d | Jes Staley became Group Chief Executive on 1 December 2015. |
| e | This figure includes £5,745k tax equalisation as set out in the 2011 Remuneration report. Bob Diamond was tax equalised on tax above the UK rate where that could not be offset by a double tax treaty. |
| f | Antony Jenkins’ 2014 pay is higher than in earlier years since he declined a bonus in 2012 and 2013 and did not have LTIP vesting in those years. |
| g | Not a participant in a long-term incentive award which vested in the period. |
Percentage change in Group Chief Executive’s remuneration
The table below shows how the percentage change in the Group Chief Executive’s salary, benefits and bonus between 2015 and 2016 compares with the percentage change in the average of each of those components of pay for UK based employees.
| Fixed Pay | Benefits | Annual bonus | ||||||||||
| Group Chief Executivea | 0% | 118%b | N/Ac | |||||||||
| Average based on UK employeesd | 3.6% | No change | (0.1)% |
Notes
| a | The 2015 figures for the Group Chief Executive are based on the Group Chief Executive, Jes Staley, and are annualised in order to provide a meaningful comparison of the year on year change in remuneration for the Group Chief Executive and UK based employees. |
| b | The percentage increase in benefits for the Group Chief Executive arises primarily as a result of relocation provided in 2016. |
| c | The Group Chief Executive did not receive an annual bonus in 2015. |
| d | Certain populations were excluded to enable a meaningful like for like comparison. |
We have chosen UK based employees as the comparator group as it is the most representative group for pay structure comparisons.
Relative importance of spend on pay
A year on year comparison of Group compensation costs and distributions to shareholders is shown below.
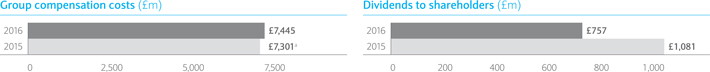
Note
| a | 2015 Group compensation costs have been adjusted to exclude the impact of £429m gain on valuation of a component of the defined benefit liability. |
| Barclays PLC and Barclays Bank PLC 2016 Annual Report on Form 20-F | 79 |
Governance: Remuneration report
Annual report on Directors’ remuneration
Chairman andnon-executive Directors
Remuneration fornon-executive Directors reflects their responsibilities and time commitment and the level of fees paid tonon-executive Directors of comparable major UK companies.
Chairman andnon-executive Directors: Single total figure for 2016 fees (audited)
| Fees | Benefits | Total | ||||||||||||||||||||||
|
| 2016 £000 |
|
| 2015 £000 |
|
| 2016 £000 |
|
| 2015 £000 |
|
| 2016 £000 |
|
| 2015 £000 |
| |||||||
| Chairman | ||||||||||||||||||||||||
| John McFarlanea | 800 | 628 | 1 | 11 | 801 | 639 | ||||||||||||||||||
| Sir David Walkerb | – | 285 | – | 6 | – | 291 | ||||||||||||||||||
| Non-executive Directors | ||||||||||||||||||||||||
| Mike Ashley | 207 | 207 | – | – | 207 | 207 | ||||||||||||||||||
| Tim Breedon | 220 | 232 | – | – | 220 | 232 | ||||||||||||||||||
| Mary Francisc | 29 | – | – | – | 29 | – | ||||||||||||||||||
| Crawford Gillies | 195 | 178 | – | – | 195 | 178 | ||||||||||||||||||
| Sir Gerry Grimstoned | 250 | – | – | – | 250 | – | ||||||||||||||||||
| Reuben Jeffery III | 120 | 135 | – | – | 120 | 135 | ||||||||||||||||||
| Wendy Lucas-Bulle | 64 | 358 | – | – | 64 | 358 | ||||||||||||||||||
| Dambisa Moyo | 135 | 152 | – | – | 135 | 152 | ||||||||||||||||||
| Frits van Paasschenf | 35 | 88 | – | – | 35 | 88 | ||||||||||||||||||
| Diane de Saint Victor | 118 | 135 | – | – | 118 | 135 | ||||||||||||||||||
| Diane Schuenemangh | 232 | 74 | – | – | 232 | 74 | ||||||||||||||||||
| Steve Thiekeh | 221 | 184 | – | – | 221 | 184 | ||||||||||||||||||
| Sir Michael Rakei | – | 250 | – | – | – | 250 | ||||||||||||||||||
| Sir John Sunderlandj | – | 60 | – | – | – | 60 | ||||||||||||||||||
| Total | 2,626 | 2,966 | 1 | 17 | 2,627 | 2,983 | ||||||||||||||||||
Non-executive Directors are reimbursed expenses that are incurred for business reasons. Any tax that arises on these reimbursed expenses is paid by Barclays.
The Chairman is provided with private medical cover and the use of a company vehicle and driver when required for business purposes.
Notes
| a | John McFarlane joined the Board as anon-executive Director with effect from 1 January 2015 and as Chairman from 24 April 2015. The 2015 total includesnon-executive Director fees of £78,000 for the period from 1 January 2015 to 24 April 2015. |
| b | Sir David Walker retired from the Board with effect from 23 April 2015. |
| c | Mary Francis joined the Board as anon-executive Director with effect from 1 October 2016. |
| d | Sir Gerry Grimstone joined the Board as anon-executive Director from 1 January 2016 and succeeded Sir Michael Rake as Senior Independent Director and Deputy Chairman with effect from 1 January 2016. |
| e | Wendy Lucas-Bull retired from the Board with effect from 1 March 2016. Figures include fees received by Wendy Lucas-Bull for her role as Chairman of Barclays Africa Group Limited. |
| f | Frits van Paasschen retired from the Board with effect from 28 April 2016. |
| g | Diane Schueneman joined the Board as anon-executive Director with effect from 25 June 2015. |
| h | Diane Schueneman and Steve Thieke both served in 2016 on the US Governance Review Board, which was an advisory board set up as the forerunner of the board of our US intermediate holding company which was established during 2016. They each subsequently joined the board of the US intermediate holding company on its formation. The 2015 figures for Diane Schueneman and Steve Thieke included fees of $37,500 and $75,000 respectively for their roles on the US Governance Review Board. The 2016 figures include fees of $138,000 and $150,000 respectively for their roles on the US Governance Review Board and the board of the US intermediate holding company. In addition, Steve Thieke waived fees of $63,000. |
| i | Sir Michael Rake retired from the Board with effect from 31 December 2015. |
| j | Sir John Sunderland retired from the Board with effect from 23 April 2015. |
Chairman andnon-executive Directors: Statement of implementation of remuneration policy in 2017
2017 fees, subject to annual review in line with policy, for the Chairman andnon-executive Directors are shown below.
|
| 1 January 2017 £000 |
|
| 1 January 2016 £000 |
|
| Percentage Increase |
| ||||
| Chairmana | 800 | 800 | 0 | |||||||||
| Deputy Chairmana | 250 | 250 | 0 | |||||||||
| Board member | 80 | 80 | 0 | |||||||||
| Additional responsibilities | ||||||||||||
| Senior Independent Director | 30 | 30 | 0 | |||||||||
| Chairman of Board Audit or Board Remuneration Committee | 70 | 70 | 0 | |||||||||
| Chairman of Board Risk Committee | 70 | 60 | 17 | |||||||||
| Chairman of Board Reputation Committee | 50 | 50 | 0 | |||||||||
| Membership of Board Audit or Board Remuneration Committee | 30 | 30 | 0 | |||||||||
| Membership of Board Reputation or Board Risk Committee | 25 | 25 | 0 | |||||||||
| Membership of Board Nominations Committee | 15 | 15 | 0 |
Notes
| a | The Chairman and Deputy Chairman do not receive any other additional responsibility fees in addition to the Chairman and Deputy Chairman fees respectively. |
| b | The basic fee payable tonon-executive Directors was last increased in May 2011. Some revisions have been made to the additional fees payable to Board Committee Chairman to reflect time commitment and responsibilities. |
| 80 | Barclays PLC and Barclays Bank PLC 2016 Annual Report on Form 20-F |
Payments to former Directors
Former Group Chief Executive: Antony Jenkins
Antony Jenkins continued to receive base salary, RBP, benefits and pension allowance until 7 July 2016 (the Termination Date). Full details of his eligibility to variable pay were disclosed in the 2015 Directors’ Remuneration report (page 101 of the 2015 Annual Report).
Former Group Finance Director: Chris Lucas
In 2016, Chris Lucas continued to be eligible to receive life assurance cover, private medical cover and payments under the Executive Income Protection Plan (EIPP). Full details of his eligibility under the EIPP were disclosed in the 2013 Directors’ Remuneration report (page 115 of the 2013 Annual Report). Chris Lucas did not receive any other payment or benefit in 2016.
Directors’ shareholdings and share interests
Executive Directors’ shareholdings and share interests (audited)
The chart below shows the value of Barclays’ shares held beneficially by Jes Staley and Tushar Morzaria as at 21 February 2017 that count towards the shareholding requirement of, as a minimum, Barclays’ shares worth four times salary. The current executive Directors have five years from their respective date of appointment to meet this requirement. At close of business on 21 February 2017, the market value of Barclays ordinary shares was £2,375m.

Interests in Barclays PLC Shares (audited)
The table below shows shares owned beneficially by all the Directors and shares over which executive Directors hold awards which are subject to either deferral terms or performance measures. The shares shown below, that are subject to performance measures, are based on the maximum number of shares that may be released.
| Unvested | | Total as at 31 December 2016 (or date of retirement from the Board, if earlier) |
| |||||||||||||||||
| Owned outright |
|
Subject to performance measures |
| | Not subject to performance measures |
| | Total as at 21 February 2017 | | |||||||||||
| Executive Directors | ||||||||||||||||||||
| Jes Staley | 4,243,848 | – | – | 4,243,848 | 4,243,848 | |||||||||||||||
| Tushar Morzaria | 1,466,204 | 3,474,246 | 578,391 | 5,518,841 | 5,518,841 | |||||||||||||||
| Chairman | ||||||||||||||||||||
| John McFarlane | 46,852 | – | – | 46,852 | 46,852 | |||||||||||||||
| Non-executive Directors | ||||||||||||||||||||
| Mike Ashley | 65,290 | – | – | 65,290 | 65,290 | |||||||||||||||
| Tim Breedon | 29,755 | – | – | 29,755 | 29,755 | |||||||||||||||
| Mary Francisa | 7,600 | – | – | 7,600 | 7,600 | |||||||||||||||
| Crawford Gillies | 70,208 | – | – | 70,208 | 70,208 | |||||||||||||||
| Sir Gerry Grimstone | 103,288 | – | – | 103,288 | 103,288 | |||||||||||||||
| Reuben Jeffery III | 200,196 | – | – | 200,196 | 200,196 | |||||||||||||||
| Wendy Lucas-Bullb | 15,672 | – | – | 15,672 | – | |||||||||||||||
| Dambisa Moyo | 51,192 | – | – | 51,192 | 51,192 | |||||||||||||||
| Frits van Paasschenc | 23,681 | – | – | 23,681 | – | |||||||||||||||
| Diane de Saint Victor | 36,691 | – | – | 36,691 | 36,691 | |||||||||||||||
| Diane Schueneman | 16,004 | – | – | 16,004 | 16,004 | |||||||||||||||
| Steve Thieke | 55,073 | – | – | 55,073 | 55,073 | |||||||||||||||
Notes
| a | Mary Francis joined the Board as anon-executive Director with effect from 1 October 2016. |
| b | Wendy Lucas-Bull retired from the Board as anon-executive Director with effect from 1 March 2016. |
| c | Frits van Paasschen retired from the Board as anon-executive Director with effect from 28 April 2016. |
| Barclays PLC and Barclays Bank PLC 2016 Annual Report on Form 20-F | 81 |
Governance: Remuneration report
Annual report on Directors’ remuneration
Barclays Board Remuneration Committee
The Board Remuneration Committee is responsible for overseeing Barclays’ remuneration as described in more detail below.
Terms of Reference
The role of the Committee is to:
| § | set the overarching principles and parameters of remuneration policy across the Group |
| § | consider and approve the remuneration arrangements of (i) the Chairman, (ii) the executive Directors, (iii) members of the Barclays Group Executive Committee and any other senior executives specified by the Committee from time to time, and (iv) all other Group employees whose total annual compensation exceeds an amount determined by the Committee from time to time (currently £2m) |
| § | exercise oversight for remuneration issues. |
The Committee considers all aspects of the design and operation of remuneration policy to ensure a coherent approach is taken in respect of all employees. In discharging this responsibility the Committee seeks to ensure that the policy assesses, among other things, the impact of pay arrangements on culture and all elements of risk management. The Committee also approves incentive pools for all major businesses and functions, regularly reviews the design and provision of retirement benefits, and considers and approves measures designed to promote the alignment of the interests of shareholders and employees. The Committee and its members work as necessary with other Board Committees, and is authorised to select and appoint its own advisers as required.
The Terms of Reference can be found at home.barclays/corporategovernance or from the Company Secretary on request.
Chairman and members
The Chairman and members of the Committee are as follows:
| § | Crawford Gillies, Committee member since 1 May 2014 and Chairman since 24 April 2015 |
| § | Tim Breedon, Committee member since 1 December 2012 |
| § | Mary Francis, Committee member since 1 November 2016 |
| § | Dambisa Moyo, Committee member since 1 September 2015. |
Former member
Steve Thieke left the Committee on 1 March 2016 having been a Committee member since 6 February 2014.
All current members are considered independent by the Board.
Remuneration Committee attendance in 2016
| | Number of meetings eligible to attend | | | Number of meetings attended | | |||
| Crawford Gillies | 9 | 9 | ||||||
| Tim Breedon | 9 | 8 | ||||||
| Mary Francis | 2 | 2 | ||||||
| Dambisa Moyo | 9 | 9 | ||||||
| Steve Thieke | 3 | 3 |
The performance of the Committee is reviewed each year as part of the Board Effectiveness Review. The December 2016 review concluded that Board members have full confidence in the effectiveness and thoroughness of the Committee. Full details of the Board Effectiveness review can be found on page 33.
Advisers to the Remuneration Committee
Until February 2016, the Committee was advised by Willis Towers Watson. The Committee is satisfied that the advice provided by Willis Towers Watson to the Committee was independent and objective. Willis Towers Watson is a signatory to, and its appointment as adviser to the Committee was conditional on adherence to, the voluntary UK Code of Conduct for executive remuneration consultants.
During the rest of 2016, the Committee decided not to engage an independent adviser but Willis Towers Watson continued to provide the Committee with market data on compensation when considering incentive levels and remuneration packages.
Fees for the Committee work were charged on a time/cost basis and Willis Towers Watson was paid a total of £48,000 (excluding VAT) in fees for its advice to the Committee in 2016 relating to the executive Directors (either exclusively or along with other employees within the Committee’s Terms of Reference).
Willis Towers Watson also provides pensions advice, advice on health and benefits provision, assistance and technology support for employee surveys and performance management, and remuneration data to the Group. Willis Towers Watson also provides pensions advice and administration services to the Barclays Bank UK Retirement Fund.
In the course of its deliberations, the Committee also considers the views of the Group Chief Executive, Group Human Resources Director and the Group Reward and Performance Director. The Group Finance Director and Chief Risk Officer provide regular updates on Group and business financial performance and the Group’s risk profile respectively.
No Barclays’ employee or Director participates in discussions with, or decisions of, the Committee relating to his or her own remuneration. No other advisers provided significant services to the Committee in the year.
| 82 | Barclays PLC and Barclays Bank PLC 2016 Annual Report on Form 20-F |
Remuneration Committee activities in 2016
The following provides a summary of the Committee’s activities during 2016 and at the January and February 2017 meetings at which 2016 remuneration decisions were finalised.
| Meeting | Fixed and variable pay issues | Governance, risk and other matters | ||||||
January 2016
|
§
|
2015 incentive funding proposals
|
§
|
Finance and Risk updates
| ||||
February 2016 (Two meetings) |
§
|
Approved executive Directors’ and senior executives’ 2016 fixed pay
|
§
|
Approved 2015 Remuneration report
| ||||
§
|
Approved 2016 executive Directors’ annual bonus performance measures
| §
| Finance and Risk updates including ex ante risk adjustment
| |||||
§
|
Approved Group fixed pay budgets for 2016
| §
| Appointment of Committee independent adviser
| |||||
§
|
Approved final 2015 incentive funding | §
| Updates on headcount and employee attrition
| |||||
§ |
Approved proposals for executive Directors’ and senior executives’ 2015 bonuses and 2016 LTIP awards for executive Directors
| §
| Consideration of the outcomes of the 2015 Committee effectiveness review
| |||||
June 2016 |
§ |
Barclays’ deferral approach |
§
|
Review of Directors’ remuneration policy
| ||||
§ |
Impact of corporate restructuring on executive Director and Group Executive Committee members’ remuneration
|
§
|
Update on Structural Reform
| |||||
July 2016 |
§ |
Review of Barclays broader remuneration philosophy | ||||||
§
|
Review of Directors’ remuneration policy
| |||||||
September 2016 (joint meeting with Nominations Committee)
|
§ |
Approved Tim Throsby’s appointment and remuneration arrangements | ||||||
October 2016
|
§
|
Review of Directors’ remuneration policy
| ||||||
November 2016 |
§ |
2016 incentive funding projections including risk adjustments |
§
§
§
§
|
Annual review of Committee Terms of Reference
Finance and Risk updates
Updates on headcount and employee attrition
2016 payround shareholder engagement planning | ||||
§ |
2017 LTIP performance measures | |||||||
December 2016 |
§ |
Initial considerations on senior executives’ 2016 bonuses and 2017 fixed pay |
§
§
§
|
Review of draft Directors’ remuneration policy
Finance and Risk updates
Updates on headcount and employee attrition
| ||||
§ |
2017 LTIP performance measures | |||||||
§
|
2016 incentive funding proposals including risk adjustments
| |||||||
January 2017 |
§ |
2016 incentive funding proposals including risk adjustments |
§
|
Finance and Risk updates
| ||||
§ |
2016 bonus proposals for senior executives | |||||||
§
|
Barclays’ deferral approach
| |||||||
February 2017 |
§ |
Approved executive Directors’ and senior executives’ 2017 fixed pay |
§
§
§ |
Approved 2016 Remuneration report
Finance and Risk updates
Updates on headcount and employee attrition | ||||
§ |
Approved 2017 executive Directors’ annual bonus performance measures | |||||||
§ |
Approved Group fixed pay budgets for 2017 | |||||||
§ |
Approved final 2016 incentive funding including risk adjustments | |||||||
§
|
Approved proposals for executive Directors’ and senior executives’ 2016 bonuses and 2017 LTIP awards for executive Directors
| |||||||
Regular items: market and stakeholder updates including PRA/FCA, US Federal Reserve and other regulatory matters; updates from Remuneration Review Panel meetings; operation of the Committee’s Control Framework on hiring, retention and termination; and LTIP performance updates.
| Barclays PLC and Barclays Bank PLC 2016 Annual Report on Form 20-F | 83 |
Governance: Remuneration report
Annual report on Directors’ remuneration
Statement of voting at Annual General Meeting
The table below shows the voting result in respect of our remuneration arrangements at the AGM held on 28 April 2016 and the last policy vote at the AGM held on 24 April 2014:
| For % of votes cast Number | Against % of votes cast Number | Withheld Number | ||||
Advisory vote on the 2015 Remuneration report |
93.60% |
6.40% | ||||
| 11,351,168,552
| 776,042,467 | 83,768,745
| ||||
Binding vote on the Directors’ remuneration policy |
93.21% |
6.79% | ||||
| 9,936,116,114
| 723,914,712
| 154,598,278
|
| 84 | Barclays PLC and Barclays Bank PLC 2016 Annual Report on Form 20-F |
Governance: Remuneration report
Additional remuneration disclosures
This section contains voluntary disclosures about levels of remuneration for our eight most highly paid senior executive officers, levels of remuneration of employees in the Barclays Group and outstanding share plan and LTIP awards for our executive Directors.
|
2016 total remuneration of the eight highest paid senior executive officers below Board level
The table below shows remuneration for the eight highest paid senior executive officers below Board level who were Key Management Personnel in 2016.
Eight highest paid senior executive officers below Board level
|
| 1 2016 £000 |
|
| 2 2016 £000 |
|
| 3 2016 £000 |
|
| 4 2016 £000 |
|
| 5 2016 £000 |
|
| 6 2016 £000 |
|
| 7 2016 £000 |
|
| 8 2016 £000 |
| |||||||||
Fixed Pay (salary and RBP) | 1,813 | 1,500 | 1,974 | 1,925 | 1,250 | 1,300 | 1,170 | 1,049 | ||||||||||||||||||||||||
Current year cash bonus | 200 | 200 | 200 | 200 | 200 | 190 | 198 | 105 | ||||||||||||||||||||||||
Current year share bonus | 200 | 200 | 200 | 200 | 200 | 190 | 198 | 105 | ||||||||||||||||||||||||
Deferred cash bonus | 2,233 | 1,125 | 813 | 825 | 375 | 285 | 297 | 158 | ||||||||||||||||||||||||
Deferred share bonus | 2,233 | 1,125 | 813 | 825 | 375 | 285 | 297 | 158 | ||||||||||||||||||||||||
Total remuneration | 6,679 | 4,150 | 4,000 | 3,975 | 2,400 | 2,250 | 2,160 | 1,575 |
Total remuneration of the employees in the Barclays Group
The table below shows the number of employees in the Barclays Group in 2015 and 2016 in bands by reference to total remuneration. Total remuneration comprises salary, RBP, other allowances, bonus and the value at award of LTIP awards.
Total remuneration of the employees in the Barclays Group
| Number of employees | ||||||||||||
| 2016 | 2015 | 2015 | ||||||||||
Remuneration band | Constant currency | Actual | ||||||||||
£0 to £25,000 | 33,989 | 38,457 | 39,720 | |||||||||
£25,001 to £50,000 | 22,927 | 25,220 | 25,153 | |||||||||
£50,001 to £100,000 | 17,063 | 18,869 | 18,885 | |||||||||
£100,001 to £250,000 | 9,098 | 10,047 | 9,210 | |||||||||
£250,001, to £500,000 | 2,093 | 2,367 | 2,181 | |||||||||
£500,001 to £1,000,000 | 771 | 879 | 740 | |||||||||
£1,000,001 to £2,500,000 | 307 | 309 | 264 | |||||||||
£2,500,001 to £5,000,000 | 46 | 51 | 50 | |||||||||
Above £5m | 11 | 9 | 5 |
Barclays is a global business. Of those employees earning above £1m in total remuneration for 2016 in the table above, 63% are based in the US, 32% in the UK, and 5% in the rest of the world.
The number of employees paid above £1m is slightly down year on year on a constant currency basis (364 in 2016 vs. 369 in 2015).
Outstanding share plan and LTIP awards (audited)
Plan | | Number of shares under award at 1 January 2016 (maximum) | | | Number of shares awarded in year | | | Market price on award date | | | Number of shares released | | | Market price on release date | | | Number of shares under award at 31 December 2016 (maximum) | | | Value of release £000 | | | End of performance period or first scheduled release date | | | Last scheduled release date | | |||||||||
Jes Staley | ||||||||||||||||||||||||||||||||||||
Share Value Plan 2015 | 896,450 | – | £2.34 | 896,450 | £1.65 | – | 1,479 | – | – | |||||||||||||||||||||||||||
Tushar Morzaria | ||||||||||||||||||||||||||||||||||||
Barclays LTIP 2014-2016 | 1,375,811 | – | £2.31 | – | – | 1,375,811 | – | 31/12/2016 | 08/03/2017 | |||||||||||||||||||||||||||
Barclays LTIP 2015-2017 | 828,402 | – | £2.54 | – | – | 828,402 | – | 31/12/2017 | 05/03/2018 | |||||||||||||||||||||||||||
Barclays LTIP 2016-2018 | – | 1,270,033 | £1.65 | – | – | 1,270,033 | – | 31/12/2018 | 04/03/2019 | |||||||||||||||||||||||||||
Share Value Plan 2013 | 322,440 | – | £2.51 | 243,616 | £1.65 | 78,824 | 402 | 17/03/2014 | 05/03/2018 | |||||||||||||||||||||||||||
Share Value Plan 2014 | 206,372 | – | £2.31 | 103,186 | £1.65 | 103,186 | 170 | 16/03/2015 | 08/03/2017 | |||||||||||||||||||||||||||
Share Value Plan 2015 | 213,017 | – | £2.54 | 71,005 | £1.65 | 142,012 | 117 | 14/03/2016 | 05/03/2018 | |||||||||||||||||||||||||||
Share Value Plan 2016 | – | 254,369 | £1.65 | – | – | 254,369 | – | 06/03/2017 | 04/03/2019 | |||||||||||||||||||||||||||
The interests shown in the table above are the maximum number of Barclays’ shares that may be received under each plan. Executive Directors do not pay for any share plan or LTIP awards. No shares lapsed during 2016.
Jes Staley received 19,846 dividend equivalent shares from SVP awards released in 2016 and Tushar Morzaria received 27,503 dividend equivalent shares from SVP awards released in 2016.
| Barclays PLC and Barclays Bank PLC 2016 Annual Report on Form 20-F | 85 |
Risk review |
| The management of risk is a critical underpinning to the execution of Barclays’ strategy. The material risks and uncertainties the Group faces across its business and portfolios are key areas of management focus. | | For a more detailed breakdown of our Risk Management approach please see pages 98 to 114. |
Material existing and emerging risks
| Annual Report | |||||
Insight into the level of risk across our business and portfolios, the material existing and emerging risks and uncertainties we face and the key areas of management focus. |
§ |
Material existing and emerging risks potentially impacting more than one Principal Risk | 89 | |||
| § | Credit risk | 91 | ||||
| § | Market risk | 93 | ||||
| § | Treasury and capital risk | 93 | ||||
| § | Operational risk | 94 | ||||
| § | Model risk | 95 | ||||
| § | Conduct risk | 95 | ||||
| § | Reputation risk | 96 | ||||
§
| Legal risk
| 96 | ||||
Risk management
| ||||||
Overview of Barclays’ approach to risk management. A detailed overview together with more specific information on policies that the Group determines to be of particular significance in the current operating environment can be found in Barclays PLC 2016 Pillar 3 Report or at Barclays.com. |
§ |
Risk management strategy | 98 | |||
| § | Credit risk management | 101 | ||||
| § | Management of credit risk mitigation techniques and counterparty credit risk | 102 | ||||
| § | Market risk management | 103 | ||||
| § | Management of securitisation exposures | n/a | ||||
| § | Treasury and capital risk management | 104 | ||||
| § | Operational risk management | 109 | ||||
| § | Model risk management | 111 | ||||
| § | Conduct risk management | 112 | ||||
| § | Reputation risk management | 113 | ||||
§
| Legal risk management
| 114 | ||||
Risk performance
| ||||||
Credit risk: |
§ |
Credit risk overview | 118 | |||
| The risk of suffering financial loss should the Group’s customers, clients or market counterparties fail to fulfil their contractual obligations. | § | Analysis of the balance sheet | 118 | |||
| § | Analysis of maximum exposure and collateral and other credit enhancement held | 119 | ||||
| § | The Group’s approach to manage and represent credit quality | 121 | ||||
| § | Analysis of the concentration of credit risk | 123 | ||||
| § | Exposure to Eurozone countries | 124 | ||||
| § | Loans and advances to customers and banks | 127 | ||||
| § | Analysis of specific portfolios and asset types | 128 | ||||
| § | Analysis of problem loans | 132 | ||||
| § | Forebearance | 134 | ||||
§
| Impairment
| 138 | ||||
Market risk: |
§ | Market risk overview and measures in the Group | 143 | |||
| The risk of a reduction to earnings or capital due to volatility of the trading book positions or an inability to hedge the banking book balance sheet. | § | Balance sheet view of trading and banking books | 144 | |||
| § | Traded market risk | 145 | ||||
| § | Business scenario stresses | 146 | ||||
| § | Review of regulatory measures | 146 | ||||
| § | Capital requirements for market risk | n/a | ||||
| § | Non-traded market risk | 147 | ||||
| § | Economic capital | 148 | ||||
| § | Foreign exchange risk | 149 | ||||
§
| Pension risk review
| 150 | ||||
Funding risk – Capital: |
§ |
Capital risk overview and regulatory minimum capital and leverage requirements | 154 | |||
| The risk that the Group is unable to maintain appropriate capital ratios. | § | Capital resources | 155 | |||
| § | Risk weighted assets | 157 | ||||
| § | Leverage ratio and exposures
| 158 | ||||
Funding risk – Liquidity: |
§ |
Liquidity risk overview and stress testing | 161 | |||
| The risk that the firm, although solvent, either does not have sufficient financial resources available to enable it to meet its obligations as they fall due, or can secure such resources only at excessive cost. | § | Liquidity pool | 163 | |||
| § | Funding structure and funding relationships | 164 | ||||
| § | Deposit funding | 165 | ||||
| § | Wholesale funding Group | 166 | ||||
| § | Term financing | 168 | ||||
| § | Encumbrance | 168 | ||||
| § | Credit ratings | 172 | ||||
| § | Liquidity management at BAGL Group | 173 | ||||
§
| Contractual maturity of financial assets and liabilities
| 173 | ||||
| 86 | Barclays PLC and Barclays Bank PLC 2016 Annual Report on Form 20-F |
Risk performance continued
| Annual Report
| |||
Operational risk: The risk of direct or indirect impacts resulting from human factors, inadequate or failed internal processes and systems or external events.
|
§ Operational risk overview § Summary of performance in the period § Operation risk profile | 179 179 179 | ||
Conduct risk: The risk that detriment is caused to our customers, clients, counterparties or Barclays and its employees because of inappropriate judgement in the execution of our business activities.
|
§ Conduct risk overview § Summary of performance § Conduct reputation measure | 181 181 181 | ||
Supervision and regulation: The Group’s operations, including its overseas offices, subsidiaries and associates, are subject to a significant body of rules and regulations that are a condition for authorisation to conduct banking and financial services business. |
§ Supervision of the Group | 182 | ||
| § Global regulatory developments | 183 | |||
| § Regulation in the EU and UK | 183 | |||
| § Regulation in the United States | 186 | |||
| § Regulatory developments in the US | 187 | |||
| § Structural reform developments | 188 | |||
| Barclays PLC and Barclays Bank PLC 2016 Annual Report on Form 20-F | 87 |
Risk review
Material existing and emerging risks
Analysis of material existing and emerging risks
This section describes the material risks to which senior management pay particular attention, which they believe could cause the future results of the Group’s operations, financial condition and prospects to differ materially from current expectations.
| For more information about the major risk policies which underlie risk exposures, see the Risk management section between pages 97 to 114. |

| 88 | Barclays PLC and Barclays Bank PLC 2016 Annual Report on Form 20-F |
Material existing and emerging risks
Material existing and emerging risks to the Group’s future performance
This section describes the material risks to which senior management pay particular attention, which they believe could cause the future results of the Group’s operations, financial condition and prospects to differ materially from current expectations. These expectations include the ability to pay dividends, maintain appropriate levels of capital and meet capital and leverage ratio targets, and achieve stated commitments. In addition, risks relating to the Group that are not currently known, or that are currently deemed immaterial, may individually or cumulatively have the potential to materially affect the future results of the Group’s operations, financial condition and prospects.
Material risks and their impact are described below in two sections: i) risks which senior management believe are likely to affect more than one Principal Risk; and ii) risks which senior management believe are likely to impact a single Principal Risk. An emerging risk is a risk that has the potential to have a significant detrimental effect on the Group’s performance, but currently the outcome and the time horizon for the crystallisation of its possible impact is more uncertain and more difficult to predict than for other risk factors that are not identified as emerging risks. A revised ERMF was approved by the Board in December 2016. This includes a revised risk taxonomy comprising eight Principal Risks (Model Risk, Reputation Risk and Legal Risk were not previously classified as Principal Risks). Additional detail on ERMF and Principal Risks may be found on pages 98.
Additional detail on the management of risks may be found in Barclays’ Approach to Managing Risk in the Barclays PLC 2016 Pillar 3 Report.
Material existing and emerging risks potentially impacting more than one Principal Risk
i) Structural reform
The UK Financial Services (Banking Reform) Act 2013 (the UK Banking Reform Act) and associated secondary legislation and regulatory rules, require all UK deposit-taking banks with over £25bn of deposits (from individuals and small businesses) to separate certain day-to-day banking activities (e.g. deposit-taking) offered to retail and smaller business customers from other wholesale and investment banking services.
Through the creation of Barclays’ ring-fenced bank, the Group will ensure that core deposits placed within the European Economic Area (EEA) are ring-fenced to meet the requirements of the legislation by 2019. The implementation of these changes involves a number of risks which include:
| § | The Group must restructure its intra-group and external capital, funding and liquidity arrangements to meet regulatory requirements and support business needs. The changes will impact the sources of funding available to the different entities, including preventing the non ring-fenced bank’s access to certain categories of deposit funding. These changes may result in higher funding costs. |
| § | The changes to the Group structure may negatively impact the assessment made by credit rating agencies and creditors. The risk profile and key risk drivers of the ring-fenced bank and the non ring-fenced bank will be specific to the activities and risk profile of each entity. As a result different Group entities are likely to be assessed differently and this may result in differences in credit ratings. Changes to the credit assessment at the Group or individual entity level, including the potential for ratings downgrades and ratings differences across entities, could impact access and cost of certain sources of funding. |
| § | Implementation of ring-fencing introduces a number of execution risks. Technology change could result in outages or operational errors. Legal challenge to the ring-fence transfer scheme may delay the transfer of assets and liabilities to the ring-fenced bank. In particular, the setup of the Group Service Company as a separate legal entity servicing both trading entities (i.e. ring-fenced bank and non ring-fenced bank) will require a number of intra-group service level agreements to be established and agreed between the Group Service Company and the trading entities and will require the Group to set up a new approach to manage, fund and deliver the activities that will be provided by this entity. Delayed delivery could increase reputational risk or result in regulatory non-compliance. Uncertain customer preference (for placement in the ring-fenced or non ring-fenced bank) may result in changes to design and implementation plans. |
| § | At the European level, structural reform regulation is still being developed as highlighted by the European Union proposal issued in November 2016 for Intermediate Holding Companies. The impact of final rules on Barclays’ businesses is still to be assessed once European regulation is finalised. Final rules will need to be considered alongside EU Referendum implications. The implementation date for these proposals will depend on the date on which any final legislation is agreed. |
| § | There is a risk that Barclays does not meet regulatory requirements across the new structure. Failure to meet these requirements may have an adverse impact on the Group’s profitability, operating flexibility, flexibility of deployment of capital and funding, return on equity, ability to pay dividends, credit ratings, and/or financial condition. |
ii) Business conditions, general economy and geopolitical issues
The Group’s performance could be adversely affected in relation to more than one Principal Risk by a weak or deteriorating global economy or political instability. These factors may also occur in one or more of the Group’s main countries of operation.
The Group offers a broad range of services including to retail, institutional and government customers, in a large number of countries. The breadth of these operations means that deterioration in the economic environment, or an increase in political instability in countries where the Group is active, or in any other systemically important economy, could adversely affect the Group’s performance and prospects.
For the Group, a deterioration of conditions in its key markets could affect performance in a number of ways including, for example: (i) deteriorating business, consumer or investor confidence leading to reduced levels of client activity, or indirectly, a material adverse impact on GDP growth in significant markets and therefore on Group performance; (ii) higher levels of default rates and impairment; (iii) mark to market losses in trading portfolios resulting from changes in factors such as credit ratings, share prices and solvency of counterparties; and (iv) lower levels of fixed asset investment and productivity growth overall.
Global growth is expected to remain modest in 2017, with low singledigit growth in advanced economies alongside a slowdown in emerging markets. This moderate economic performance, lower commodity prices and increased geopolitical tensions mean that the distribution of risks to global economic activity continues to be biased to the downside. Commodity prices, particularly oil prices, remain depressed, but could fall further if growth in demand remains weak or supply takes longer than expected to adjust. At the same time, countries with high reliance on commodity-related earnings have already experienced a tightening of financial conditions. A sustained period of low prices risks triggering further financial distress, default and contagion, for our customers, their suppliers and local communities, and resulting losses for Barclays.
Moreover, sentiment towards emerging markets as a whole continues to be driven in large part by developments in China, where there is significant concern around the ability of authorities to manage growth whilst transitioning towards services. A stronger than expected slowdown could result if authorities fail to appropriately manage the end of the investment andcredit-led boom, while the consequences from a faster slowdown would flow through both financial and trade channels into other economies, and affect commodity markets.
Whilst tightening of monetary policy by the US Federal Reserve was not as pronounced as expected during 2016, a moderate increase in activity is expected during 2017, the increasing divergence of policies between major advanced economies risks triggering further financial market volatility. Changes to interest rate expectations could ignite further volatility and US Dollar appreciation, particularly if the US Federal Reserve were to increase interest rates faster than markets currently expect. Emerging markets have already seen growth slow following increased .capital outflows, but growth may slow further if tighter US interest rate policy drives further reallocation of capital.
In several countries, reversals of capital inflows, as well as fiscal austerity, have already caused deterioration in political stability. This could be exacerbated by a renewed rise in asset price volatility or sustained pressure on government finances. In addition, geopolitical tensions in some areas of the world, including the Middle East and Eastern Europe are already acute, and are at risk of further deterioration.
In the US, the policy platform of the new administration is expected to be clarified during the early part of 2017. There is the possibility of significant changes in policy in sectors including trade, healthcare and commodities which may have an impact on associated Barclays’ portfolios. Proposed policy changes (includingtax-cuts and significant infrastructure spending) are likely to result in higher global growth,
| Barclays PLC and Barclays Bank PLC 2016 Annual Report on Form 20-F | 89 |
Risk review
Material existing and emerging risks
Material existing and emerging risks to the Group’s future performance
further reinforcing the move towards global reflation. Political change may increase uncertainty as to regulatory trends, both in the US and the EU.
In the UK, the vote in favour of leaving the EU has given rise to political uncertainty with attendant consequences for investment and confidence. See vi) EU Referendum on page 91.
iii) Change and execution risk
The Group continues to drive changes to its functional capabilities and operating environment in order to allow the business to exploit emerging and digital technologies, and improve customer experience whilst also embedding enhanced regulatory requirements, strategic realignment, and business model changes. The complexity, increasing pace, and volume of changes underway simultaneously mean there is heightened execution risk and potential for change not being delivered to plan.
Failure to adequately manage this risk could result in extended outages and disruption, financial loss, customer detriment, legal liability, potential regulatory censure and reputational damage.
iv) Risks arising from regulation of the financial services industry
The financial services industry continues to be the focus of significant regulatory change and scrutiny which may adversely affect the Group’s business, financial performance, capital and risk management strategies. For further information on regulations affecting the Group, including significant regulatory developments, please see the section on Supervision and Regulation on page 182.
a) Regulatory change
The Group, in common with much of the financial services industry, remains subject to significant levels of regulatory change and increasing scrutiny in many of the countries in which it operates (including, in particular, the UK and the US). This has led to a more intensive approach to supervision and oversight, increased expectations and enhanced requirements. As a result, regulatory risk will remain a focus for senior management and consume significant levels of business resources. Furthermore, this more intensive approach and the enhanced requirements, uncertainty and extent of international regulatory coordination as enhanced supervisory standards are developed and implemented may adversely affect the Group’s business, capital and risk management strategies and/or may result in the Group deciding to modify its legal entity structure, capital and funding structures and business mix, or to exit certain business activities altogether or not to expand in areas despite otherwise attractive potential.
b) Changes in prudential requirements, including changes to CRD IV
The Group’s results and ability to conduct its business may be negatively affected by changes or additions to supervisory and prudential expectations, including in relation to any minimum requirements for own funds and eligible liabilities, leverage or liquidity requirements, applicable buffers and/oradd-ons to such minimum requirements and RWA calculation methodologies all as may be set by international, EU or national authorities from time to time (including, for example, through changes being proposed to the CRD IV framework).
Changes to or additional supervisory and prudential expectations, either individually or in aggregate, may lead to unexpected enhanced requirements in relation to the Group’s capital, leverage, liquidity and funding ratios or alter the way such ratios are calculated. This may result in, amongst other things, a need for further management actions to meet the changed requirements, such as: increasing capital or liquidity resources, reducing leverage and risk weighted assets; modifying legal entity structure (including with regard to issuance and deployment of capital and funding for the Group); changing the Group’s business mix or exiting other businesses; and/or undertaking other actions to strengthen the Group’s position. See Treasury and Capital Risk on page 104 and Supervision and Regulation on page 184 for more information.
c) Market infrastructure reforms
Financial market infrastructure is subject to extensive and increasing regulation in many of the Group’s markets. The derivatives market has been the subject of particular focus across the G20 countries, requiring the clearing of standardised derivatives and the mandatory margining ofnon-cleared derivatives. More broadly, the recast Markets in Financial Instruments Directive in Europe (MiFID II) will fundamentally change the framework for market infrastructure, the Benchmarks Regulation will regulate the use of benchmarks in the EU, and regulation governing Central Securities Depositories will increase the requirements upon participants in the financial markets.
It is possible that these additional regulations, and the related expenses and requirements, will increase the cost of and therefore impact willingness of participation in the financial markets.
d) Recovery and resolution planning
In recent years, there has been a strong regulatory focus on ‘resolvability’ from regulators globally, and Barclays continues to work with the relevant authorities to identify and address potential impediments to the Group’s resolvability. As part of this work, the Group is required to submit formal Recovery and Resolution Plan (RRP) submissions to UK, US and South African regulators describing Barclays’ strategy for recovery and rapid and orderly resolution. These submissions are evaluated by regulators on the basis of both qualitative and quantitative metrics, the specifics of which may become more rigorous over time.
Should the relevant authorities in any jurisdiction ultimately determine that a resolution plan were not credible or would not facilitate an orderly resolution, Barclays or its subsidiaries could be made subject to more stringent capital, leverage or liquidity requirements, or restrictions on growth, activities or operations. The potential structural changes that may be required to address such a determination may negatively impact the financial or competitive position or results of operations of the Group, as well as increase the risk that the Group would be unable to maintain appropriate prudential ratios or be restricted from making intra group or external capital contributions.
e) Stress testing
The Group and certain of its members are subject to supervisory stress testing exercises in a number of jurisdictions. These exercises currently include the programmes of the BoE, the EBA, the FDIC, the FRB and the SARB. These exercises are designed to assess the resilience of banks to adverse economic or financial developments and ensure that they have robust, forward-looking capital and liquidity management processes that account for the risks associated with their business profile. Assessment by regulators is on both a quantitative and qualitative basis, the latter focusing on the Group’s or certain of its members’ business model, data provision, stress testing capability and internal management processes and controls. The stress testing requirements to which the Group and its members are subject are becoming increasingly stringent, including in the US where the newlysub-consolidated operations and the IHC will be stress-tested and examined under the FRB’s annual CCAR programme for the first time in 2017. Failure to meet requirements of regulatory stress tests, or the failure by regulators to approve the stress test results and capital plans of the Group, could result in the Group being required to enhance its capital position, limit capital distributions or position capital in specific subsidiaries. For more information on stress testing, please see Supervision and Regulation on page 184.
v) Regulatory action in the event of a bank failure
As described under ‘Supervision of the Group, Regulation in the EU and UK, Recovery and Resolution developments’ on page 183 UK resolution authorities have the right under certain circumstances to intervene in the Group pursuant to the stabilisation and resolution powers granted to them under the Banking Act and other applicable legislation.
| 90 | Barclays PLC and Barclays Bank PLC 2016 Annual Report on Form 20-F |
If any of the powers conferred on the BoE were to be exercised, or there were an increased risk of exercise, in respect of the Group or any entity within the Group, this might result in a material adverse effect on the rights or interests of shareholders and creditors including holders of debt securities and could have a material adverse effect on the market price of shares and other securities issued by the Group. Such effects could include losses of shareholdings or associated rights including, the dilution of percentage ownership of the Group’s share capital, and may result in creditors, including debt holders, losing all or a part of the value of their investment in the Group’s issued securities.
vi) EU referendum
The UK held a referendum on 23 June 2016 on whether it should remain a member of the EU. This resulted in a vote in favour of leaving the EU. The result of the referendum means that the long-term nature of the UK’s relationship with the EU is unclear and there is uncertainty as to the nature and timing of any agreement with the EU on the terms of exit. In the interim, there is a risk of uncertainty for both the UK and the EU, which could adversely affect the economy of the UK and the other economies in which we operate. The potential risks associated with an exit from the EU have been carefully considered by the Board and include:
Market risk
| § | Potential for continued market volatility (notably FX and interest rates) given political uncertainty which could affect the value of Trading Book positions. |
Credit risk
| § | Increased risk of a UK recession with lower growth, higher unemployment and falling UK house prices. This would likely negatively impact a number of Barclays’ portfolios, notably: higher Loan to Value home loans, UK unsecured lending including cards and Commercial Real Estate exposures. |
Operational risk
| § | Changes to current EU “Passporting” rights: the UK’s withdrawal from the EU may result in the loss of cross-border market access rights which would require Barclays to make alternative licensing arrangements in EU jurisdictions in which Barclays continues to operate. |
| § | Uncertainty over UK’s future approach to EU freedom of movement will impact Barclays’ access to the EU talent pool, decisions on hiring from the EU of critical roles and rights to work of current Barclaysnon-UK EU citizens located in the UK and UK citizens located in the EU. |
Legal risk
| § | The legal framework within which Barclays operates could change and become more uncertain as the UK takes steps to replace or repeal certain laws currently in force, which are based on EU legislation and regulation. Certainty of existing contracts, enforceability of legal obligations and uncertainty around the outcome of disputes may be affected until the impacts of the loss of the current jurisdictional arrangements between UK and EU courts and the universal enforceability of judgements across the EU, are fully known (including the status of existing EU case law). |
Treasury and capital risk
| § | Potential for credit spread widening and reduced investor appetite for Barclays debt issuance, which could negatively impact the cost of and/or access to funding. Potential for continued market volatility could affect interest rate risk in the banking book, as well as securities held by Barclays for liquidity purposes. |
| § | Changes in the long-term outlook for UK interest rates might also adversely affect UK Pension IAS19 liabilities. |
vii) Impairment
The introduction of the impairment requirements of IFRS 9 Financial Instruments, due to be implemented on 1 January 2018, is expected to result in higher impairment loss allowances that are recognised earlier, on a more forward looking basis and on a broader scope of financial instruments than is the case under IAS 39. Measurement will involve increased complexity, judgement and is expected to have a material financial impact and impairment charges will tend to be more volatile. Unsecured products with longer expected lives, such as revolving credit cards, are expected to be most impacted. The capital treatment on the increased reserves is the subject of ongoing discussion with regulators and across the industry, but there is potential for significant adverse impact on regulatory capital ratios. In addition, the move from incurred to expected credit losses has the potential to impact the Group’s performance under stressed economic conditions or regulatory stress tests. For more information please refer to Note 1 Significant Accounting Policies on pages 226 to 230.
Barclays has a jointly accountable risk and finance implementation and governance programme with representation from all impacted departments. During 2016, work continued on the design and build of impairment models, systems, processes, governance, controls and data collection and continues to be refined during 2017. During 2017, there is a planned parallel run which includes continued model, process and output validation, testing, calibration and analysis.
There will be three different layers of impairment committees. In addition to the existing Group and Business level committees, Legal Entity committees for Barclays UK and Barclays International will also be in place. Committees will be chaired by the Chief Risk Officer (CRO), with joint accountability by both CROs and Chief Financial Officers (CFOs) for signing off the results. The new IFRS 9 impairment committee structure, with underlying key controls, is expected to be in operation from Q2 2017. There will also be a Scenarios Management Committee to review and approve the scenario process. The scope of review will include the scenarios and scenario narratives, the core set of macroeconomic variables and any management overlays. The Scenario Management Committee will attest that the scenarios adequately account for thenon-linearity and asymmetry of the loss distribution. Reported results and key messages will be communicated to the Board Audit Committee and Risk Executive Committee, who will have oversight roles and provide challenge of key assumptions, including the basis of the scenarios adopted.
Material existing and emerging risks by Principal Risk
Credit risk
The risk of loss to the firm from the failure of clients, customers or counterparties, including sovereigns, to fully honour their obligations to the firm, including the whole and timely payment of principal, interest, collateral and other receivables.
The Group may suffer financial loss if any of its customers, clients or market counterparties fails to fulfil their contractual obligations to the Group. The Group may also suffer loss when the value of its investment in the financial instruments of an entity falls as a result of that entity’s credit rating being downgraded. In addition, the Group may incur significant unrealised gains or losses due to changes in the Group’s credit spreads or those of third parties, as these changes affect the fair value of the Group’s derivative instruments, debt securities that the Group holds or issues, and loans held at fair value.
| Barclays PLC and Barclays Bank PLC 2016 Annual Report on Form 20-F | 91 |
Risk review
Material existing and emerging risks
Material existing and emerging risks to the Group’s future performance
i) Deterioration in political and economic environment
The Group’s performance is at risk from deterioration in the political and economic environment (see also ‘Business conditions, general economy and geopolitical issues’ on pages89) which may result from a number of uncertainties, including the following:
a) Specific regions
Adverse impacts on customers’ ability to service debt and may result in result in higher impairment charges for the Group.
United Kingdom
Following the EU referendum on 23 June 2016 (see EU Referendum on page91), the UK may experience a period of political and economic uncertainty throughout the negotiation period during which exit options are hard to fully and accurately predict. The initial impact has been the depreciation of Sterling resulting in higher costs for companies exposed to imports and a more favourable environment for exporters. Rising domestic costs resulting from higher import prices may impact household incomes and the affordability of consumer loans and home loans. In turn this may affect businesses dependent on consumers for revenue. There has also been a reduction in activity in both commercial and residential real estate markets which has the potential to impact value.
United States
A significant proportion of the Group’s portfolio is located in the US, including a major credit card portfolio and a range of corporate and investment banking exposures. Stress in the US economy, weakening GDP, rising unemployment and/or an increase in interest rates could lead to increased levels of impairment.
Emerging Markets
Slower growth in China continues to affect a number of emerging economies, particularly those with high fiscal deficits and those reliant on short-term external financing and/or material reliance on commodity exports. Their vulnerability has been further impacted by the fall, and sustained volatility in oil prices, the strong US dollar and the winding down of quantitative easing policies by some central banks. The impact on the Group may vary depending on the vulnerabilities present in each country, but the impact may result in increased impairment charges through sovereign defaults, or the inability or unwillingness of clients and counterparties in that country to meet their debt obligations.
South Africa
The negative economic outlook in South Africa continues, with a challenging domestic and external economic environment and ongoing political uncertainty. Real GDP growth remains low resulting in these domestic and global factors impacting credit quality across our portfolios. In the retail sector, concerns remain over the level of consumer indebtedness and affordability, particularly as interest rates rise.
b) Interest rate rises, including as a result of slowing of monetary stimulus, could impact consumer debt affordability and corporate profitability
To the extent that central banks increase interest rates in certain developed markets, particularly in our main markets, the UK and the US, they are expected to be small and gradual in scale during 2017, albeit following differing timetables. Recent increases in interest rates occurred in the US with a 0.25% rise in December 2015 and the same rise in December 2016. Whilst further increases may support Group income, future interest rate increases, if larger or more frequent than expectations, could cause stress in the loan portfolio and underwriting activity of the Group. This would be particularly applicable tonon-investment grade lending, leading to the possibility of the Group incurring higher impairment. Higher credit losses driving an increased impairment allowance would most notably impact retail unsecured and secured portfolios as a result of a reduction in recoverability and value of the Group’s assets, coupled with a decline in collateral values.
Interest rate increases in developed markets may also negatively impact emerging economies, as capital flows to mature markets to take advantage of the higher returns and strengthening economic fundamentals.
ii) Specific sectors
The Group is subject to risks arising from changes in credit quality and recovery rate of loans and advances due from borrowers and counterparties in a specific portfolio. Any deterioration in credit quality could lead to lower recoverability and higher impairment in a specific sector. The following are areas of uncertainties to the Group’s portfolio which could have a material impact on performance.
a) UK property
With UK property representing a significant portion of the overall UK Corporate and Retail credit exposure, the Group is at risk from a fall in property prices in both the residential and commercial sectors in the UK. Strong house price growth in London and the South East of the UK, fuelled by foreign investment, strongbuy-to-let (BTL) demand and subdued housing supply, has resulted in affordability metrics becoming stretched. Average house prices as at the end of 2016 were more than 7.9 times average earnings.
However, the recent EU referendum has had a negative impact on home loan applications due to the increased uncertainty in the UK housing market, with ongoing concerns regarding the potential for falling house prices, particularly in London and the South East. Further, a weakening economy would impact the home loan portfolio as costs rise off the back of higher interest rates and customers are impacted by inflationary affordability pressures. Potential losses would likely be most pronounced in the higher Loan to Value (LTV) segments as falling house prices lead to higher impairment and negative capital impact as loss given default (LGD) rates increase.
b) Natural resources
Despite limited recovery in oil and commodities prices, the risk of losses and increased impairment is more pronounced where leverage is higher, or in sectors currently subject to strain, notably oil and gas, mining and metals and commodities. Sustained oil price depression from its recent high continues and is driven by ongoing global excess supply. The positioning of these portfolios focuses on investment grade customers or collateralised positions. Continued stress in this market does have the potential to further increase credit losses and impairment where a decline in the value of oil impacts both customer revenue and the value of our underlying collateral.
c) Large single name losses
The Group has large individual exposures to single name counterparties. The default of such counterparties could have a significant impact on the carrying value of these assets. In addition, where such counterparty risk has been mitigated by taking collateral, credit risk may remain high if the collateral held cannot be realised, or has to be liquidated at prices which are insufficient to recover the full amount of the loan or derivative exposure. Any such defaults could have a material adverse effect on the Group’s results due to, for example, increased credit losses and higher impairment charges.
d) Leverage finance underwriting
The Group takes on significantsub-investment grade underwriting exposure, including single name risk, particularly in the US and Europe. The Group is exposed to credit events and market volatility during the underwriting period. Any adverse events during this period may potentially result in loss for the Group or an increased capital requirement should there be a need to hold the exposure for an extended period.
| 92 | Barclays PLC and Barclays Bank PLC 2016 Annual Report on Form 20-F |
Market risk
The risk of loss arising from potential adverse changes in the value of the firm’s assets and liabilities from fluctuation in market variables including, but not limited to, interest rates, foreign exchange, equity prices, commodity prices, credit spreads, implied volatilities and asset correlations.
Increased uncertainty across global markets from such factors as an unexpected slowdown in global economic growth, sudden changes in monetary policy, unexpected foreign exchange volatility, especially if accompanied by a significant deterioration in the depth of marketplace liquidity (emerging risk).
The trading business model is focused on client facilitation in wholesale financial markets, ranging from underwriting of debt and equity on behalf of issuers, to acting as a market maker in exchange-traded and over the counter products, to providing risk management solutions.
The Group’s trading business is generally adversely exposed to a prolonged period of elevated asset price volatility, particularly if it negatively affects the depth of marketplace liquidity. Such a scenario could impact the Group’s ability to execute client trades and may also result in lower client flow-driven income and/or market-based losses on its existing portfolio of market risks. These can include having to absorb higher hedging costs from rebalancing risks that need to be managed dynamically as market levels and their associated volatilities change.
Treasury and capital risk
The risk that the Group may not achieve its business plans because of the availability of planned liquidity, a shortfall in capital or a mismatch in the interest rate exposures of its assets and liabilities.
The Group may not be able to achieve its business plans due to: i) being unable to maintain appropriate capital ratios; ii) being unable to meet its obligations as they fall due; iii) rating agency downgrades; iv) adverse changes in foreign exchange rates on capital ratios; v) negative interest rates; and vi) adverse movements in the pension fund.
i) Inability to maintain appropriate prudential ratios
Should the Group be unable to maintain or achieve appropriate capital ratios this could lead to: an inability to support business activity; a failure to meet regulatory capital requirements including any additional capitaladd-ons or the requirements set for regulatory stress tests; increased cost of funding due to deterioration in investor appetite or credit ratings; restrictions on distributions including the ability to meet dividend targets; and/or the need to take additional measures to strengthen the Group’s capital or leverage position. While the requirements in CRD IV are now in force in the UK, further changes to regulatory capital requirements could occur, whether as a result of (i) further changes to EU legislation (for example, expected implementation of Bank of International Settlements (BIS) regulatory update recommendations through CRD V, etc); (ii) relevant binding regulatory technical standards updates by the European Banking Authority (EBA); (iii) changes to UK legislation; (iv) changes to PRA rules; (v) additional capital requirements through Financial Policy Committee (FPC) recommendations; or (vi) changes to International Financial Reporting Standards (IFRS). Such changes, either individually and/or in aggregate, may lead to further unexpected additional requirements in relation to the Group’s regulatory capital. For example, during 2016, the European Commission proposed substantial changes to the CRD IV framework (including CRR) in line with internationally-agreed standards. These include changes to the regulatory definition of trading activity, standardised and advanced RWA calculation methodologies for market risk and new standardised RWA rules for counterparty credit risk. The proposal also includesphase-in arrangements for the regulatory capital impact of IFRS9 and the ongoing interaction of IFRS9 with the regulatory framework. The Basel Committee has continued its post-crisis work on RWA and leverage reform. Further standards are expected during the course of 2017 on RWAs for credit risk and operational risk, limitations on the use of internal models for RWA purposes and possible floors based on standardised RWAs. The implementation timeframe for these changes is not yet certain.
Additional prudential requirements may also arise from other regulatory reforms, including UK, EU and US proposals on bank structural reform and current proposals for ‘Minimum Requirement for own funds and Eligible Liabilities (MREL) under the EU Bank Recovery and Resolution Directive (BRRD). Included within these reforms are the Bank of England’s latest responses to consultation and statement of policy on MREL requirements for UK banks which were published in November 2016 and which remain subject to further changes.
Many of the expected regulatory proposals are still subject to finalisation, with calibration and timing of implementation still to be determined, and there is potential for the impacts to be different from those originally expected when in final form. Overall, it is likely that these changes in law and regulation will have an impact on the Group as they are likely, when implemented, to require changes to the legal entity structure of the Group and how businesses are capitalised and funded. Any such increased prudential requirements may also constrain the Group’s planned activities, require balance sheet reductions and could increase the Group’s costs, impact the Group’s earnings and restrict the Group’s ability to pay dividends. Moreover, if combined with a period of market dislocation or when there is significant competition for the type of funding that the Group needs, it may be more difficult and/or costly to increase the Group’s capital resources.
ii) Inability to manage liquidity and funding risk effectively
Failure to manage its liquidity and funding risk effectively may result in the Group either not having sufficient financial resources to meet its payment obligations as they fall due or, although solvent, only being able to meet these obligations at excessive cost. This could cause the Group to fail to meet regulatory liquidity standards, be unable to supportday-to-day banking activities, or no longer be a going concern.
iii) Credit rating changes and the impact on funding costs
A credit rating assesses the creditworthiness of the Group, its subsidiaries and branches, and is based on reviews of a broad range of business and financial attributes including risk management processes and procedures, capital strength, asset quality, earnings, funding, liquidity, accounting and governance. Any adverse event to one or more of these attributes may lead to a downgrade, which in turn could result in contractual outflows to meet contractual requirements on existing contracts. Furthermore, outflows related to a multiple-notch credit rating downgrade are included in the LRA stress scenarios and a portion of the liquidity pool is held against this risk. There is a risk that any potential downgrades could impact the Group’s performance should borrowing cost and liquidity change significantly versus expectations or the credit spreads of the Group be negatively affected.
For further information please refer to Credit Ratings in the Liquidity Risk Performance section on page 172.
iv) Adverse changes in foreign exchange rates on capital ratios
The Group has capital resources, risk weighted assets and leverage exposures denominated in foreign currencies. Changes in foreign currency exchange rates may adversely impact the Sterling equivalent value of these items. As a result, the Group’s regulatory capital ratios are sensitive to foreign currency movements, and any failure to appropriately manage the Group’s balance sheet to take account of foreign currency movements could result in an adverse impact on regulatory capital and leverage ratios.
| Barclays PLC and Barclays Bank PLC 2016 Annual Report on Form 20-F | 93 |
Risk review
Material existing and emerging risks
Material existing and emerging risks to the Group’s future performance
v) Negative interest rates
A fall in interest rates leading to an environment with negative nominal interest rates would adversely impact Group profitability as retail and corporate business income would decrease due to margin compression. This is because the significant reduction in asset income would not be offset by a reduction in cost in liabilities due to the presence of a floor in our customer deposit and savings rates which are typically set at positive level of rates.
vi) Adverse movements in the pension fund
Adverse movements between pension assets and liabilities for defined benefit pension schemes could contribute to a pension deficit. The liabilities discount rate is a key driver and, in accordance with International Financial Reporting Standards (IAS 19), is derived from the yields of high quality corporate bonds (deemed to be those with AA ratings) and consequently includes exposure to both risk-free yields and credit spreads. Therefore, the Group’s defined benefits scheme valuation would be adversely affected by a prolonged fall in the discount rate or a persistent low rate and/or credit spread environment. Inflation is another significant risk driver to the pension fund, as the liabilities are adversely impacted by an increase in long-term inflation expectations. However in the long term, inflation and rates risk tend to be negatively correlated and therefore partially offset each other.
Operational risk
The risk of loss to the firm from inadequate or failed processes or systems, human factors or due to external events (for example fraud) where the root cause is not due to credit or market risks.
The Group is exposed to many types of operational risk. These include: fraudulent and other internal and external criminal activities; breakdowns in processes, controls or procedures (or their inadequacy relative to the size and scope of the Group’s business); systems failures or an attempt by an external party to make a service or supporting technological infrastructure unavailable to its intended users, known as a denial of service attack; and the risk of geopolitical cyber threat activity which destabilises or destroys the Group’s information technology, or critical technological infrastructure the Group depends upon but does not control. The Group is also subject to the risk of business disruption arising from events wholly or partially beyond its control, for example natural disasters, acts of terrorism, epidemics and transport or utility failures, which may give rise to losses or reductions in service to customers and/or economic loss to the Group. All of these risks are also applicable where the Group relies on outside suppliers or vendors to provide services to it and its customers. The operational risks that the Group is exposed to could change rapidly and there is no guarantee that the Group’s processes, controls, procedures and systems are sufficient to address, or could adapt promptly to, such changing risks to avoid the risk of loss.
i) Cyber risk
The risk posed by cyber attacks is growing, with financial institutions being a primary target of increasingly capable cyber crime groups, as demonstrated by sophisticated targeted attacks against global payment networks throughout 2016. The increased maturity of online marketplaces for criminal services and stolen data has reduced barriers to entry for criminals perpetrating financial attacks which carry high reward and low risk of law enforcement prosecution.
The cyber threat increases the inherent risk to the Group’s data (whether it is held by the Group or in its supply chain), to the integrity of financial transactions of the Group, its clients, counterparties and customers, and to the availability of the Group’s services. Failure to adequately manage this risk, and to continually review and update processes, could result in increased fraud losses, inability to perform critical economic functions, customer detriment, potential regulatory censure and penalty, legal liability and reputational damage.
ii) Infrastructure and technology resilience
The failure of the Group’s and its suppliers’ technology infrastructures remain a material risk driver for the Group. The increased use of technologies to support business strategy, and customer and client demand, means any failures will be felt more immediately and with greater impact.
Failure to adequately manage resilience in our technologies, real-estate, and business and suppliers’ processes, may result in disruption to normal service which could in turn result in significant customer detriment, cost to reimburse losses incurred by our customers, potential regulatory censure or penalty, and reputational damage.
iii) Ability to hire and retain appropriately qualified employees
The Group requires a diverse mix of highly skilled and qualified colleagues to deliver its strategy and so is dependent on attracting and retaining appropriately qualified and experienced individuals. Barclays’ ability to attract and retain such talent is impacted by a range of external and internal factors.
External regulation such as the introduction of the Individual Accountability Regime and the required deferral and claw back provisions of our compensation arrangements may make Barclays a less attractive proposition relative to both our international competitors and other industries. Similarly, the impact of the planned exit of the UK from the EU could potentially have an impact on our ability to hire and retain key employees.
Failure to attract or prevent the departure of appropriately qualified employees who are dedicated to overseeing and managing current and future regulatory standards and expectations, or who have the necessary skills required to deliver the Group strategy, could negatively impact our financial performance, control environment, level of employee engagement and may result in disruption to service which could in turn lead to customer detriment and reputational damage.
iv) Tax risk
The Group is required to comply with the domestic and international tax laws and practice of all countries in which it has business operations. There is a risk that the Group could suffer losses due to additional tax charges, other financial costs or reputational damage as a result of failing to comply with such laws and practice or by failing to manage its tax affairs in an appropriate manner. The Group also faces emerging risks from domestic and international tax developments. For example, the OECD’s Base Erosion and Profit Shifting (‘BEPS’) project, and the implementation of its recommendations into domestic law in countries around the world, has the potential to significantly increase the compliance burden on the Group, as well as to increase the incidence of double taxation on the Group as a result of different countries adopting different interpretations and approaches to the BEPS recommendations.
v) Critical accounting estimates and judgements
The preparation of financial statements in accordance with IFRS requires the use of estimates. It also requires management to exercise judgement in applying relevant accounting policies. The key areas involving a higher degree of judgement or complexity, or areas where assumptions are significant to the consolidated and individual financial statements include provisions for conduct and legal, competition and regulatory matters, fair value of financial instruments, credit impairment charges for amortised cost assets, impairment and valuation of available for sale investments, and accounting for pensions and post-retirements benefits. There is a risk that if the judgement exercised, or the estimates or assumptions used, subsequently turn out to be incorrect, this could result in significant loss to the Group, beyond what was anticipated or provided for.
| 94 | Barclays PLC and Barclays Bank PLC 2016 Annual Report on Form 20-F |
As part of the assets in theNon-Core business, the Group holds a UK portfolio of generally longer-term loans to counterparties in Education, Social Housing and Local Authorities (ESHLA) sectors, which are measured on a fair value basis. The valuation of this portfolio is subject to substantial uncertainty due to the long-dated nature of the portfolios, the lack of a secondary market in the relevant loans and unobservable loan spreads. As a result of these factors, the Group may be required to revise the fair values of these portfolios to reflect, among other things, changes in valuation methodologies due to changes in industry valuation practices and as further market evidence is obtained in connection with theNon-Core assetrun-off and exit process. For further information refer to Note 18 Fair value of financial instruments of the Group’s consolidated financial statements.
The further development of standards and interpretations under IFRS could also significantly impact the financial results, condition and prospects of the Group.
vi) Outsourcing
The Group depends on suppliers for the provision of many of our services, though the Group continues to be accountable for risk arising from the actions of such suppliers. Failure to monitor and control our suppliers could potentially lead to client information, or our critical infrastructures and services, not being adequately protected.
The dependency on suppliers andsub-contracting of outsourced services introduces concentration risk where the failure of specific suppliers could have an impact on our ability to continue to provide services that are material to the Group.
Failure to adequately manage outsourcing risk could result in increased losses, inability to perform critical economic functions, customer detriment, potential regulatory censure and penalty, legal liability and reputational damage.
vii) Data quality
The quality of the data used in models across Barclays has a material impact on the accuracy and completeness of our risk and financial metrics. The evolution of complex modelling underpinning risk decisions, forecasting and capital calculations, demands greater precision in our data. Failure to manage data standards accordingly may have a material adverse effect on the quality of our risk management.
viii) Operational precision and payments
The risk of material errors in operational processes, including payments, are exacerbated during the present period of significant levels of structural and regulatory change, the evolving technology landscape, and a transition to digital channel capabilities.
Material operational or payment errors could disadvantage our customers, clients or counterparties and could result in regulatory censure and penalties, legal liability and reputational damage.
Model risk
The risk of the potential adverse consequences from financial assessments or decisions based on incorrect or misused model outputs and reports.
Barclays uses models to support a broad range of business and risk management activities, including informing business decisions and strategies, measuring and limiting risk, valuing exposures, conducting stress testing, assessing capital adequacy, supporting new business acceptance and risk/reward evaluation, managing client assets, or meeting reporting requirements.
Models are imperfect and incomplete representations of reality, and so they may be subject to errors affecting the accuracy of their outputs. Models may also be misused. Model errors or misuse may result in the Group making inappropriate business decisions and being subject to financial loss, regulatory risk, reputational risk and/or inadequate capital reporting.
Conduct risk
The risk of detriment to customers, clients, market integrity, competition or Barclays from the inappropriate supply of financial services, including instances of wilful or negligent misconduct.
Barclays is committed to ensuring that positive customer and client outcomes and protecting market integrity are integral to the way the firm operates. This includes taking reasonable steps to ensure our culture and strategy are appropriately aligned to these objectives; our products and services are reasonably designed and delivered to meet the needs of our customers and clients, as well as maintaining the fair and orderly operation of the markets in which we do business.
Certain other risks referenced herein may result in detriment to customers, clients and market integrity if not managed effectively. These include but are not limited to: cyber risk; infrastructure and technology resilience; ability to hire and retain qualified people; outsourcing; data quality; operational precision and payments; regulatory change; structural reform; change and execution risk; and the exit of the UK from the EU.
i) Execution of strategic divestment inNon-Core businesses
As Barclays executes strategic decisions to exit products, businesses or countries, the firm must consider and mitigate any potential detriment to customers, clients and market integrity. There is a risk some customers and clients may have reduced market access and a limited choice of alternative providers, or transitions to alternate providers could cause disruptions. There is also a risk the firm’s strategic divestments may impact market liquidity or result in adverse pricing movements. In connection with any country exits, there is a risk that any ongoing cross-border activities into those countries are not conducted in accordance with local laws and regulations. The crystallisation of any of these risks could cause detriment to customers, clients and market integrity, as well as regulatory sanctions, financial loss and reputational damage.
ii) Product governance and sales practices
Effective product governance, including design, approval and periodic review of products, and appropriate controls over various internal and third-party sales channels are critical to ensuring positive outcomes for customers and clients. In particular, Barclays must ensure that its remuneration practices and performance management framework are designed to prevent conflicts of interest and inappropriate sales incentives. Failure of product governance and sales controls could result in the sale of products and services that fail to meet the needs of, or are unsuitable for, customers and clients, regulatory sanctions, financial loss and reputational damage.
iii) Trading controls and benchmark submissions
Maintaining controls over trading activities and benchmark submissions is critical to ensuring the trust of our customers, clients and other market participants. These controls must be designed to ensure compliance with all applicable regulatory requirements, as well as to prevent market manipulation, unauthorised trading and inadvertent errors. A failure of these controls could result in detriment to customers and clients, disruptions to market integrity, regulatory sanctions, financial loss and reputational damage. The risk of failure could be enhanced by the changes necessary to address various new regulations, including but not limited to the Markets in Financial Instruments Directive II.
iv) Financial Crime
The management of Financial Crime remains a key area of regulatory focus. Delivering a robust control environment to ensure that the Bank effectively manages the risks of Money Laundering, Terrorist Financing, Sanctions and Bribery and Corruption protects the Bank, its customers and its employees, as well as society at large, from the negative effects of financial crime. Failure to maintain an effective control environment may lead to regulatory sanctions, financial loss and reputational damage.
| Barclays PLC and Barclays Bank PLC 2016 Annual Report on Form 20-F | 95 |
Risk review
Material existing and emerging risks
Material existing and emerging risks to the Group’s future performance
v) Data protection and privacy
The proper handling of data and protection of data privacy is critical to developing trust and sustaining long-term relationships with our customers and clients. Inadequate protection of data (including data held and managed by third party suppliers) could lead to security compromise, data loss, financial loss and other potential detriment to our customers and clients, as well as regulatory sanctions, financial loss and reputational damage. The risk of failure could be enhanced by the changes necessary to address various new regulations, including but not limited to the EU Data Protection Initiative.
vi) Regulatory focus on culture and accountability
Various regulators around the world have emphasised the importance of culture and personal accountability in helping to ensure appropriate conduct and drive positive outcomes for customers, clients and markets integrity. Regulatory changes such as the new UK Senior Managers Regime and Conduct Rules coming into effect in 2017, along with similar regulations in other jurisdictions, will require Barclays to enhance its organisational and operational governance to evidence its effective management of culture and accountability. Failure to meet these new requirements and expectations may lead to regulatory sanctions, financial loss and reputational damage.
Reputation risk
The risk that an action, transaction, investment or event will reduce trust in the firm’s integrity and competence by clients, counterparties, investors, regulators, employees or the public.
Climate change, human rights and support for the defence sector
Any one transaction, investment or event that, in the perception of key stakeholders reduces their trust in the firm’s integrity and competence, may have the potential to give rise to risk to Barclays reputation. Barclays’ association with sensitive sectors is often an area of concern for stakeholders and the following topics have been of particular interest:
Fossil fuels: As the Paris agreement on CO2 emissions comes into force, banks are coming under increased pressure from civil society, shareholders and potentially national governments regarding the management and disclosure of their climate risks and opportunities, including the activities of certain sections of their client base;
Human Trafficking: The UK Modern Slavery Act came into force in October 2015 and with the scrutiny of global business investments rising, the risks of association with human rights violations are growing within the banking sector, through the perceived indirect involvement in human rights abuses committed by clients and customers. Campaigners have been seeking to hold all parties in the value chain to account for environmental and human rights violations where they occur; and
Defence Sector: Supporting the manufacture and export of military and riot control goods and services continues to require significant review internally in order to ensure compliance with all relevant requirements and to avoid reputational damage.
Legal risk
The risk of loss or imposition of penalties, damages or fines from the failure of the firm to meet its legal obligations including regulatory or contractual requirements.
Legal disputes, regulatory investigations, fines and other sanctions relating to conduct of business and breaches of legislation and/or regulations may negatively affect the Group’s results, reputation and ability to conduct its business.
The Group conducts diverse activities in a highly regulated global market and therefore is exposed to the risk of fines and other sanctions relating to the conduct of its business. In recent years authorities have increasingly investigated past practices, pursued alleged breaches and imposed heavy penalties on financial services firms. This trend is expected to continue. A breach of applicable legislation and/or regulations could result in the Group or its staff being subject to criminal prosecution, regulatory censure, fines and other sanctions in the jurisdictions in which it operates, particularly in the UK and the US. Where clients, customers or other third parties are harmed by the
Group’s conduct, this may also give rise to legal proceedings, including class actions. Other legal disputes may also arise between the Group and third parties relating to matters such as breaches, enforcement of legal rights or obligations arising under contracts, statutes or common law. Adverse findings in any such matters may result in the Group being liable to third parties seeking damages, or may result in the Group’s rights not being enforced as intended.
Details of legal, competition and regulatory matters to which the Group is currently exposed are set out in Note 29 legal, competition and regulatory matters. In addition to matters specifically described in Note 29, the Group is engaged in various other legal proceedings in the UK and US and a number of other overseas jurisdictions which arise in the ordinary course of business. The Group is also subject to requests for information, investigations and other reviews by regulators, governmental and other public bodies in connection with business activities in which the Group is or has been engaged. The Group is keeping all relevant agencies briefed as appropriate in relation to these matters on an ongoing basis. In light of the uncertainties involved in legal, competition and regulatory matters, there can be no assurance that the outcome of a particular matter or matters will not be material to the Group’s results of operations or cash flow for a particular period, depending on, amongst other things, the amount of the loss resulting from the matter(s) and the amount of income otherwise reported for the period.
The outcome of legal, competition and regulatory matters, both those to which the Group is currently exposed and any others which may arise in the future, is difficult to predict. However, in connection with such matters the Group may incur significant expense, regardless of the ultimate outcome, and any such matters could expose the Group to any of the following: substantial monetary damages and/or fines; remediation of affected customers and clients; other penalties and injunctive relief; additional litigation; criminal prosecution in certain circumstances; the loss of any existing agreed protection from prosecution; regulatory restrictions on the Group’s business operations including the withdrawal of authorisations; increased regulatory compliance requirements; suspension of operations; public reprimands; loss of significant assets or business; a negative effect on the Group’s reputation; loss of investor confidence and/or dismissal or resignation of key individuals.
In January 2017, Barclays PLC was sentenced to serve three years of probation from the date of the sentencing order in accordance with the terms of its May 2015 plea agreement with the DOJ. During the term of probation Barclays PLC must, amongst other things, (i) commit no crime whatsoever in violation of the federal laws of the United States, (ii) implement and continue to implement a compliance programme designed to prevent and detect the conduct that gave rise to the plea agreement and (iii) strengthen its compliance and internal controls as required by relevant regulatory or enforcement agencies. Potential consequences of breaching the plea agreement include the imposition of additional terms and conditions on the Group, an extension of the agreement, or the criminal prosecution of Barclays PLC, which could, in turn, entail further financial penalties and collateral consequences and have a material adverse effect on the Group’s business, operating results or financial position.
There is also a risk that the outcome of any legal, competition or regulatory matters in which the Group is involved may give rise to changes in law or regulation as part of a wider response by relevant law makers and regulators. A decision in any matter, either against the Group or another financial institution facing similar claims, could lead to further claims against the Group.
| 96 | Barclays PLC and Barclays Bank PLC 2016 Annual Report on Form 20-F |
Risk review
Risk management
An overview of Barclays’ approach to risk management | ||
| Page | ||
| Barclays’ risk management strategy | ||
| Introduction | 98 | |
| Enterprise Risk Management Framework | 98 | |
| Principal Risks | 98 | |
| Risk Appetite for the Principals Risks | 98 | |
| Roles and responsibilities in the management of risk | 98 | |
Barclays’ Risk Culture
| 100
| |
Credit risk management | ||
| Overview | 101 | |
| Organisation and structure | 101 | |
| Roles and responsibilities | 102 | |
Credit risk mitigation
| 102
| |
Market risk management | ||
| Overview | 103 | |
| Organisation and structure | 103 | |
Roles and responsibilities
| 103
| |
Treasury and capital risk management | ||
| Overview | 104 | |
| Organisation and structure | 104 | |
| Liquidity risk | 105 | |
| Capital risk | 106 | |
Interest rate risk in the banking book
| 108 | |
Operational risk management | ||
| Overview | 109 | |
| Organisation and structure | 109 | |
Roles and responsibilities
| 110
| |
Model risk management | ||
| Overview | 111 | |
| Organisation and structure | 111 | |
Roles and responsibilities
| 111
| |
Conduct risk management | ||
| Overview | 112 | |
| Organisation and structure | 112 | |
Roles and responsibilities
| 112
| |
Reputation risk management | ||
| Overview | 113 | |
| Organisation and structure | 113 | |
Roles and responsibilities
| 113
| |
Legal risk management | ||
| Overview | 114 | |
| Organisation and structure | 114 | |
| Roles and responsibilities | 114 |
| For a more detailed breakdown on our risk review and risk management contents please see pages 86 to 87. More detailed information on how Barclays manages these risks can be found in Barclays PLC 2016 Pillar 3 Report. |

| Barclays PLC and Barclays Bank PLC 2016 Annual Report on Form 20-F | 97 |
Risk review
Risk management
Barclays’ risk management strategy
Introduction
Barclays engages in activities which entail risk taking, every day, throughout its business. This section introduces these risks, and outlines key governance arrangements for managing them. These include roles and responsibilities, frameworks, policies and standards, assurance and lessons learned processes. The Group’s approach to fostering a strong Risk Culture is also described.
Enterprise Risk Management Framework (ERMF)
The Group has clear risk management objectives and a strategy to deliver them through core risk management processes. The ERMF sets the strategic direction by defining clear standards, objectives and responsibilities for all areas of Barclays. It supports the CEO and CRO in embedding effective risk management and a strong Risk Culture.
The ERMF sets out:
| § | Principal Risks faced by the Group |
| § | Risk Appetite requirements |
| § | Roles and responsibilities for risk management |
| § | Risk Committee structure. |
A revised ERMF was approved by the Board in December 2016. This includes a revised risk taxonomy comprising eight Principal Risks. Credit, market, funding, operational and conduct risks have been aligned to this new taxonomy and the management of these risks has not materially changed. Model risk, reputation risk and legal risk are newly classified as Principal Risks in the latest version of the ERMF, reflecting the heightened importance of these risk types in the current environment. IIn 2016, Model risk was managed in accordance with dedicated policies linked to the ERMF. These policies supplemented the key risk control frameworks underlying the financial risk types and applied to all businesses and functions in which financial risks were incurred or managed. Reputation risk was considered as part of conduct risk and legal risk was included as a sub-risk type under operational risk. In this Annual Report, the Risk Management sections (pages 97 to 114) follow the new Principal Risk taxonomy of eight risks, reflecting our current approach to risk management. The Risk Performance sections (pages 116-181) follow the Principal Risk taxonomy (of five risks) which prevailed during 2016. Information on reputation risk performance in 2016 is included as part of the conduct risk section. Information on legal risk management in 2016 can be found in the Material Existing and Emerging Risks section (page 89), the Supervision and Regulation section (page 182) and Note 29 to the Financial Statements (page 280). The definition of the Three Lines of Defence and associated responsibilities were also revised. The ERMF also contains a revised governance structure, including new Group and Business Risk committees, with representation from the first and second lines of defence.
Principal Risks
The ERMF identifies Principal Risks and sets out responsibilities and risk management standards. Note that Legal, Reputation and Model risks are Principal Risks from January 2017 following Board approval in December 2016.
Financial Principal Risks:
| § | Credit risk: The risk of loss to the firm from the failure of clients, customers or counterparties, including sovereigns, to fully honour their obligations to the firm, including the whole and timely payment of principal, interest, collateral and other receivables |
| § | Market risk: The risk of loss arising from potential adverse changes in the value of the firm’s assets and liabilities from fluctuation in market variables including, but not limited to, interest rates, foreign exchange, equity prices, commodity prices, credit spreads, implied volatilities and asset correlations |
| § | Treasury and capital risk: This comprises: |
– Liquidity risk: The risk that the firm is unable to meet its contractual or contingent obligations or that it does not have the appropriate
amount, tenor and composition of funding and liquidity to support its assets
– Capital risk: The risk that the firm has an insufficient level or composition of capital to support its normal business activities and to meet its regulatory capital requirements under normal operating environments or stressed conditions (both actual and as defined for internal planning or regulatory testing purposes). This includes the risk from the firm’s pension plans
– Interest rate risk in the banking book: The risk that the firm is exposed to capital or income volatility because of a mismatch between the interest rate exposures of its(non-traded) assets and liabilities
Non-Financial Principal Risks:
| § | Operational risk: The risk of loss to the firm from inadequate or failed processes or systems, human factors or due to external events (for example fraud) where the root cause is not due to credit or market risks. |
| § | Model risk: The risk of the potential adverse consequences from financial assessments or decisions based on incorrect or misused model outputs and reports. |
| § | Reputation risk: The risk that an action, transaction, investment or event will reduce trust in the firm’s integrity and competence by clients, counterparties, investors, regulators, employees or the public. |
| § | Conduct risk: The risk of detriment to customers, clients, market integrity, competition or Barclays from the inappropriate supply of financial services, including instances of wilful or negligent misconduct. |
| § | Legal risk: The risk of loss or imposition of penalties, damages or fines from the failure of the firm to meet its legal obligations including regulatory or contractual requirements. |
Risk Appetite for the Principal Risks
Risk Appetite is defined as the level of risk which the firm is prepared to accept in the conduct of its activities. The Risk Appetite of the firm:
| § | specifies the level of risk we are willing to take and why, to enable specific risk taking activities |
| § | considers all Principal Risks individually and, where appropriate, in aggregate |
| § | communicates the acceptable level of risk for different risk types; this may be expressed in financial ornon-financial terms, and is measured and effectively monitored |
| § | describes agreed parameters for the firm’s performance under varying levels of financial stress with respect to profitability |
| § | is considered in key decision-making processes, including business planning, mergers and acquisitions, new product approvals and business change initiatives. |
Risk Appetite is approved and disseminated across legal entities and businesses, including by use of Mandate and Scale limits to enable and control specific activities that have material concentration risk implications for the firm. These limits also help reduce the likelihood and size ofone-off losses. The Risk Appetite must be formally reviewed on at least an annual frequency in conjunction with the Medium Term Planning (MTP) process and approved by the Board.
Roles and responsibilities in the management of risk – the Three Lines of Defence
All colleagues have a responsibility to contribute to the risk management of the Group. These responsibilities are set out in the “Three Lines of Defence”. In 2016 these definitions were simplified. Regardless of their function, all teams who manage processes in the firm are responsible for designing, implementing, remediating, monitoring and testing the controls for those processes.
First Line of Defence:
The First Line comprises all employees engaged in the revenue generating and client facing areas of the firm and all associated support
| 98 | Barclays PLC and Barclays Bank PLC 2016 Annual Report on Form 20-F |
functions, including Finance, Treasury, Technology and Operations, Human Resources etc. Employees in the first line are responsible for:
| § | identifying all the risks in the activities in which they are engaged, and developing appropriate policies, standards and controls to govern their activities |
| § | operating within any and all limits which the Risk and Compliance functions establish in connection with the Risk Appetite of the firm |
| § | escalating risk events to senior managers and Risk and Compliance. |
Internal controls are critical to running a cost-effective and stable business. To ensure these controls remain strong, sustainable, and efficient the new strategic position of Chief Controls Officer has been created. The Chief Controls Office will help to maintain and enhance an effective and consistent control framework across the organisation.
The First Line must establish their own policies and controls (subject to the Controls Framework of the firm), particularly with respect to operational activities, and require their colleagues to manage all controls to specified tolerances. These control-related activities are also considered First Line and are permitted so long as they are within any applicable limits established by Risk or Compliance. All activities in the first line are subject to oversight from the relevant parts of the second and third lines.
Second Line of Defence:
Employees of Risk and Compliance comprise the Second Line of Defence. The role of the Second Line is to establish the limits, rules and constraints under which first line activities shall be performed, consistent with the Risk Appetite of the firm, and to monitor the performance of the First Line against these limits and constraints.
The Second Line may not establish limits for all First Line activities, especially those related to Operational Risk. The controls for these will ordinarily be established by Controls Officers operating within the Controls Framework of the firm, under the oversight of the Second Line.
The Second Line can also undertake certain additional activities if, in the judgement of the Group CRO, this will reduce the firm’s exposure to risk.
Third Line of Defence:
Employees of Internal Audit comprise the Third Line of Defence. They provide independent assurance to the Board and Executive Management over the effectiveness of governance, risk management and control over current, systemic and evolving risks.
The Legal department does not sit in any of the three lines, but supports them all. The Legal department is, however, subject to oversight from Risk and Compliance, with respect to Operational and Conduct risks.
Roles and responsibilities in the management of risk – risk committees
Business Risk Committees consider risk matters relevant to their business, and escalate as required to the Group Risk Committee (GRC), whose Chairman in turn escalates to Board Committees and the Board.
There are five Board-level fora which review and monitor risk across the Group. These are: The main Board, the Board Risk Committee, the Board Audit Committee, the Board Reputation Committee and the Board Remuneration Committee.
The Chairman of each Committee prepares a statement each year on the committee’s activities, which is included in this report from page 6 to 28.
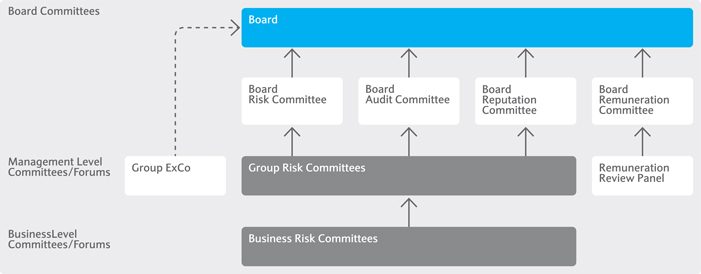
The Board
One of the Board’s (Board of Directors of Barclays PLC) responsibilities is the approval of Risk Appetite (see the Risk Management and Strategy section on page 98), which is the level of risk the Group chooses to take in pursuit of its business objectives. The Group CRO (GCRO) regularly presents a report to the Board summarising developments in the risk environment and performance trends in the key portfolios. The Board is also responsible for the ERMF. It oversees the management of the most significant risks through regular review of risk exposures. Executive management responsibilities relating to this are set out in the ERMF.
The Board Risk Committee (BRC)
The BRC monitors the Group’s risk profile against the agreed financial appetite. Where actual performance differs from expectations, the actions taken by management are reviewed to ensure that the BRC is comfortable with them. After each meeting, the Chairman of the BRC prepares a report for the next meeting of the Board. All members are independent executive directors. The Group Finance Director (GFD) and the GCRO attend each meeting as a matter of course.
The BRC also considers the Group’s risk appetite statement for operational risk and evaluates the Group’s operational risk profile and operational risk monitoring.
The BRC receives regular and comprehensive reports on risk methodologies, the effectiveness of the risk management framework, and the Group’s risk profile, including the key issues affecting each business portfolio and forward risk trends. The Committee also commissionsin-depth analyses of significant risk topics, which are presented by the CRO or senior risk managers in the businesses.
The Board Reputation Committee (RepCo)
The RepCo reviews management’s recommendations on conduct and reputational risk and the effectiveness of the processes by which the Group identifies and manages these risks. It also reviews and monitors the effectiveness of Barclays’ Citizenship strategy, including the management of Barclays’ economic, social and environmental contribution.
In addition, the Board Audit and Board Remuneration Committees receive regular risk reports to assist them in the undertaking of their
| Barclays PLC and Barclays Bank PLC 2016 Annual Report on Form 20-F | 99 |
Risk review
Risk management
Barclays’ risk management strategy
duties.
The Board Audit Committee (BAC)
The BAC receives regular reports on the effectiveness of internal control systems, quarterly reports on material control issues of significance, and quarterly papers on accounting judgements (including impairment). It also receives a quarterly review of the adequacy of impairment allowances, which it reviews relative to the risk inherent in the portfolios, the business environment, the Group’s policies and methodologies and the performance trends of peer banks. The Chairman of the BAC also sits on the BRC.
The Board Remuneration Committee (RemCo)
The RemCo receives a detailed report on risk management performance from the BRC, regular updates on the risk profile and proposals on anex-ante andex-post risk adjustments to variable remuneration. These inputs are considered in the setting of performance incentives.
Summaries of the relevant business, professional and risk management experience of the Directors of the Board are presented in the Board of Directors section on pages 3 to 4.
Barclays’ Risk Culture
Barclays defines Risk Culture as “norms, attitudes and behaviours related to risk awareness, risk taking and risk management”. At Barclays this is reflected in how we identify, escalate and manage risk matters.
Our Code of Conduct – the Barclays Way
Globally, all colleagues must attest to the “Barclays Way”, our Code of Conduct, and all frameworks, policies and standards applicable to their roles. The Code of Conduct outlines the Purpose and Values which govern our Barclays Way of working across our business globally. It constitutes a reference point covering all aspects of colleagues’ working relationships, specifically (but not exclusively) with other Barclays employees, customers and clients, governments and regulators, business partners, suppliers, competitors and the broader community.
Definition of Risk Culture and its determinants
We review our culture through the lens of four “determinants”, associated with desired outcomes:
| § | Management and governance: Consistent tone from the top; responsibilities are clear to enable identification and challenge |
| § | Motivation and incentives: The right behaviours are rewarded and modelled |
| § | Competence and effectiveness: Colleagues are enabled to identify, coordinate, escalate and address risk and control matters |
| § | Integrity: Colleagues are willing to meet their risk management responsibilities; colleagues escalate issues on a timely basis. |
Management and governance
Leaders must demonstrate through their everyday behaviours the importance of strong risk management and ensure that their teams have sufficient resource and capability to manage the risk environment.
The simplification of the Three Lines of Defence, as well as the reorganisation of business and risk committees with First and Second Lines of defence representation, promote ownership and accountabilities for risk management.
Motivation and incentives
Barclays seeks to ensure that compensation and promotion decisions take account of risk behaviours.
Management of risk and control is assessed as part of the annual performance appraisal process for all colleagues globally. Positive risk management behaviours will be rewarded and considered as part of promotion decisions, particularly to Managing Director.
Competence and effectiveness
A risk capability scorecard was developed for the Board Risk Committee to monitor and measure capability, and to identify any areas for improvement. Barclays has also appointed a Chief Risk Officer for Treasury and Capital and a Head of Model Risk Management.
Integrity
The “Being Barclays” global induction supports new colleagues in understanding how risk management culture and practices support how the Group does business and the link to Barclays’ values. The Leadership Curriculum covers building, sustaining and supporting a trustworthy organisation and is offered to colleagues globally.
The continued promotion and reinforcement of Barclays’ Values, as well as the Barclays Way was reflected in the near-perfect rate of completion of related training by employees. Messages and communications from the Chief Risk Officer emphasise the importance of early escalation of risk issues.
| 100 | Barclays PLC and Barclays Bank PLC 2016 Annual Report on Form 20-F |
Risk review
Risk management
Credit risk management
Credit risk
|
The risk of loss to the firm from the failure of clients, customers or counterparties, including sovereigns, to fully honour their obligations to the firm, including the whole and timely payment of principal, interest, collateral and other receivables.
|
Overview
The granting of credit is one of the Group’s major sources of income and, as a Principal Risk, the Group dedicates considerable resources to its control. The credit risk that the Group faces arises mainly from wholesale and retail loans and advances together with the counterparty credit risk arising from derivative contracts with clients. Other sources of credit risk arise from trading activities, including: debt securities, settlement balances with market counterparties; available for sale assets and reverse repurchase agreements.
Credit risk management objectives are to:
| § | maintain a framework of controls to ensure credit risk taking is based on sound credit risk management principles |
| § | identify, assess and measure credit risk clearly and accurately across the Group and within each separate business, from the level of individual facilities up to the total portfolio |
| § | control and plan credit risk taking in line with external stakeholder expectations and avoiding undesirable concentrations |
| § | monitor credit risk and adherence to agreed controls |
| § | ensure that risk-reward objectives are met |
| More information of the reporting of credit risk can be found in Barclays PLC 2016 Pillar 3 Report. |
Organisation and structure
Wholesale and retail portfolios are managed separately to reflect the differing nature of the assets; wholesale balances tend to be larger in value and are managed on an individual basis, while retail balances are larger in number but smaller in value and are, therefore, managed on a homogenous portfolio basis.
Credit risk management responsibilities have been structured so that decisions are taken as close as possible to the business, while ensuring robust review and challenge of performance, risk infrastructure and strategic plans. The credit risk management teams in each business are accountable to the relevant Business CRO who, in turn, reports to the Group CRO.
Board oversight and flow of risk related information
Organisation and structure
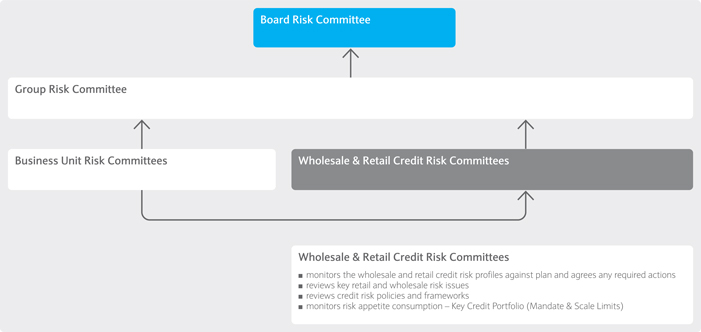
| Barclays PLC and Barclays Bank PLC 2016 Annual Report on Form 20-F | 101 |
Risk review
Risk management
Credit risk management
Roles and responsibilities
The responsibilities of the credit risk management teams in the businesses, the sanctioning team and other shared services include: sanctioning new credit agreements (principally wholesale); setting policies for approval of transactions (principally retail); setting risk appetite; monitoring risk against limits and other parameters; maintaining robust processes, data gathering, quality, storage and reporting methods for effective credit risk management; performing effective turnaround and workout scenarios for wholesale portfolios via dedicated restructuring and recoveries teams; maintaining robust collections and recovery processes/units for retail portfolios; and review and validation of credit risk measurement models.
For wholesale portfolios, credit risk approval is undertaken by experienced credit risk professionals operating within a clearly defined delegated authority framework, with only the most senior credit officers entrusted with the higher levels of delegated authority. The largest credit exposures, which are outside the Risk Sanctioning Unit or Risk Distribution Committee authority require the support of the Group Senior Credit Officer (GSCO), the Group’s most senior credit risk sanctioner. For exposures in excess of the GSCO’s authority, approval by Group CRO is required. In the wholesale portfolios, credit risk managers are organised in sanctioning teams by geography, industry and/or product.
The role of the Central Risk function is to provide Group-wide direction, oversight and challenge of credit risk-taking. Central Risk sets the Credit Risk Control Framework, which provides the structure within which credit risk is managed, together with supporting credit risk policies.
Credit risk mitigation
The Group employs a range of techniques and strategies to actively mitigate the counterparty credit risks. These can broadly be divided into three types:
| § | netting andset-off |
| § | collateral |
| § | risk transfer. |
Netting andset-off
In most jurisdictions in which the Group operates, credit risk exposures can be reduced by applying netting andset-off. In exposure terms, this credit risk mitigation technique has the largest overall impact on net exposure to derivative transactions, compared with other risk mitigation techniques.
For derivative transactions, the Group’s normal practice is to enter into standard master agreements with counterparties (e.g. ISDAs). These master agreements typically allow for netting of credit risk exposure to a counterparty resulting from derivative transactions against the obligations to the counterparty in the event of default, and so produce a lower net credit exposure. These agreements may also reduce settlement exposure (e.g. for foreign exchange transactions) by allowing payments on the same day in the same currency to beset-off against one another.
Collateral
The Group has the ability to call on collateral in the event of default of the counterparty, comprising:
| § | home loans: a fixed charge over residential property in the form of houses, flats and other dwellings |
| § | wholesale lending: a fixed charge over commercial property and other physical assets, in various forms |
| § | other retail lending: includes charges over motor vehicles and other physical assets, second lien charges over residential property, and finance lease receivables |
| § | derivatives: the Group also often seeks to enter into a margin agreement (e.g. CSA) with counterparties with which the Group has master netting agreements in place |
| § | reverse repurchase agreements: collateral typically comprises highly liquid securities which have been legally transferred to the Group subject to an agreement to return them for a fixed price |
| § | financial guarantees and similaroff-balance sheet commitments: cash collateral may be held against these arrangements. |
Risk transfer
A range of instruments including guarantees, credit insurance, credit derivatives and securitisations can be used to transfer credit risk from one counterparty to another. These mitigate credit risk in two main ways:
| § | if the risk is transferred to a counterparty which is more credit worthy than the original counterparty, then overall credit risk is reduced |
| § | where recourse to the first counterparty remains, both counterparties must default before a loss materialises. This is less likely than the default of either counterparty individually so credit risk is reduced. |
Detailed policies are in place to ensure that credit risk mitigation is appropriately recognised and recorded and more information can be found in the Barclays PLC 2016 Pillar 3 Report.
| 102 | Barclays PLC and Barclays Bank PLC 2016 Annual Report on Form 20-F |
Risk review
Risk management
Market risk management
Market risk |
The risk of loss arising from potential adverse changes in the value of the firm’s assets and liabilities from fluctuation in market variables including, but not limited to, interest rates, foreign exchange, equity prices, commodity prices, credit spreads, implied volatilities and asset correlations
|
Overview
Market risk
Market risk arises primarily as a result of client facilitation in wholesale markets, involving market making activities, risk management solutions and execution of syndications. Upon execution of a trade with a client, the Group will look to hedge against the risk of the trade moving in an adverse direction. Mismatches between client transactions and hedges result in market risk due to changes in asset prices.
Market risk in the businesses resides primarily in Barclays International, Group Treasury andNon-Core. These businesses have the mandate to incur market risk.
Market risk oversight and challenge is provided by business committees and Group committees, including the Market Risk Committee.
Roles and responsibilities
The objectives of market risk management are to:
| § | understand and control market risk by robust measurement, limit setting, reporting and oversight |
| § | facilitate business growth within a controlled and transparent risk management framework |
| § | ensure that market risk in the businesses is controlled according to the allocated appetite |
| § | support theNon-Core strategy of asset reductions by ensuring that market risk remains within agreed risk appetite. |
To ensure the above objectives are met, a well-established governance structure is in place to manage these risks consistent with the ERMF. See page 98 on risk management strategy, governance and risk culture.
The BRC recommends market risk appetite to the Board for their approval. The Market Risk Principal Risk Officer (MRPRO) is responsible for the Market Risk Control Framework and, under delegated authority from the CRO, agrees with the BCROs a limit framework within the context of the approved market risk appetite.
Across the Group, market risk oversight and challenge is provided by business committees, Group committees, including the Market Risk Committee.
The Market Risk Committee approves and makes recommendations concerning the Group-wide market risk profile. This includes overseeing the operation of the Market Risk Framework and associated standards and policies; reviewing arising market or regulatory issues, limits and utilisation; and risk appetite levels to the Board. The Committee is chaired by the MRPRO and attendees include the business heads of market risk, business aligned market risk managers and Internal Audit.
The head of each business is accountable for all market risks associated with its activities, while the head of the market risk team covering each business is responsible for implementing the risk control framework for market risk.
More information on market risk management can be found in Barclays PLC 2016 Pillar 3 Report.
Organisation and structure

| Barclays PLC and Barclays Bank PLC 2016 Annual Report on Form 20-F | 103 |
Risk review
Risk management
Treasury and capital risk management
Treasury and capital risk
The risk that the Group may not achieve its business plans because of the availability of planned liquidity, a shortfall in capital or a mismatch in the interest rate exposures of its assets and liabilities. The Treasury and Capital Risk function is an independent risk function with responsibility for oversight of the following risks:
∎ Liquidity risk:The risk that the firm is unable to meet its contractual or contingent obligations or that it does not have the appropriate amount, tenor and composition of funding and liquidity to support its assets
∎ Capital risk:The risk that the firm has an insufficient level or composition of capital to support its normal business activities and to meet its regulatory capital requirements under normal operating environments or stressed conditions (both actual and as defined for internal planning or regulatory testing purposes). This includes the risk from the firm’s pension plans
∎ Interest rate risk in the banking book: The risk that the firm is exposed to capital or income volatility because of a mismatch between the interest rate exposures of its(non-traded) assets and liabilities.
|
Overview
Barclays Treasury manages treasury and capital risk on aday-to-day basis with the Treasury Committee acting as the principal management body. To ensure effective oversight and segregation of duties and in line with the ERMF, the Treasury and Capital Risk function is responsible for oversight of key capital and liquidity risk management activities.
To ensure effective oversight and segregation of duties and in line with the ERMF, the Treasury and Capital Risk function is responsible for oversight of key capital, liquidity,non-traded market risk (NTMR) and pension risk management activities. The following describes the structure and governance associated with the risk types within the Treasury and Capital Risk function.
Organisation and structure

| 104 | Barclays PLC and Barclays Bank PLC 2016 Annual Report on Form 20-F |
Liquidity risk management
Overview
The efficient management of liquidity is essential to the Group in retaining the confidence of the financial markets and ensuring that the business is sustainable. There is a control framework in place for managing liquidity risk and this is designed to meet the following objectives:
| § | to maintain liquidity resources that are sufficient in amount and quality and a funding profile that is appropriate to meet the liquidity risk appetite as expressed by the Board |
| § | to maintain market confidence in the Group’s name. |
This is achieved via a combination of policy formation, review and governance, analysis, stress testing, limit setting and monitoring. Together, these meet internal and regulatory requirements.
Roles and responsibilities
The Treasury and Capital Risk function is responsible for the management and governance of the liquidity risk mandate defined by the Board. Treasury has the primary responsibility for managing liquidity risk within the set risk appetite.
Liquidity risk management
A control framework is in place for Liquidity Risk under which the Treasury function operates. The control framework describes liquidity risk management processes, associated policies and controls that the Group has implemented to manage liquidity risk within the Liquidity Risk Appetite (LRA) and is subject to annual review.
The Board sets the LRA over Group stress tests and is represented as the level of risk the Group chooses to take in pursuit of its business objectives and in meeting its regulatory obligations. The approved LRA is implemented in line with the control framework and policy for liquidity risk
Control framework
Barclays has a comprehensive control framework for managing the Group’s liquidity risk. It is designed to deliver the appropriate term and structure of funding consistent with the LRA set by the Board.
The control framework incorporates a range of ongoing business management tools to monitor, limit and stress test the Group’s balance sheet and contingent liabilities and a Contingency Funding Plan. Limit setting and transfer pricing are tools that are designed to control the level of liquidity risk taken and drive the appropriate mix of funds. Together, these tools reduce the likelihood that a liquidity stress event could lead to an inability to meet the Group’s obligations as they fall due.
The stress tests assess the potential contractual and contingent stress outflows under a range of scenarios, which are then used to determine the size of the liquidity pool that is immediately available to meet anticipated outflows if a stress occurs.
The Group maintains a Contingency Funding Plan which details how liquidity stress events of varying severity would be managed. Since the precise nature of any stress event cannot be known in advance, the plans are designed to be flexible to the nature and severity of the stress event and provide a menu of options that can be drawn upon as required. Barclays also maintains Recovery Plans which consider actions to generate additional liquidity in order to facilitate recovery in a severe stress.
Risk Appetite and planning
Barclays has established a LRA over Group stress tests and is represented as the level of liquidity risk the Group chooses to take in pursuit of its business objectives and in meeting its regulatory obligations.
The key expression of the liquidity risk is through stress tests. It is measured with reference to the liquidity pool compared to anticipated stressed net contractual and contingent outflows for each of five stress scenarios. Barclays has defined both internal short-term and long-term LRA stress test metrics.
The LRA for internal stress tests is approved by the Board. The LRA is reviewed on a continuous basis and is subject to formal review at least annually as part of the Individual Liquidity Adequacy Assessment Process (ILAAP).
The stress outflows are used to determine the size of the Group Liquidity Pool, which represents those resources immediately available to meet outflows in a stress. In addition to the liquidity pool, the control framework and policy provides for other management actions, including generating liquidity from other liquid assets on the Group’s balance sheet in order to meet additional stress outflows, or to preserve or restore the Liquidity Pool in the event of a liquidity stress.
Liquidity limits
Barclays manages limits on a variety of on- andoff-balance sheet exposures, a sample of which is shown in the table below. These limits serve to control the overall extent and composition of liquidity risk taken by managing exposure to the cash outflows.
Early warning indicators
Barclays monitors a range of market indicators for early signs of liquidity risk either in the market or specific to Barclays, a sample of which are shown in the table below. These are designed to immediately identify the emergence of increased liquidity risk to maximise the time available to execute appropriate mitigating actions. Early warning indicators are used as part of the assessment of whether to invoke the Group’s Contingency Funding Plan (CFP).
Contingency funding plan and recovery and resolution planning
Barclays maintains a CFP which is designed to provide a framework where a liquidity stress could be effectively managed. The CFP is proportionate to the nature, scale and complexity of the business and is tested to ensure that it is operationally robust. The CFP details the circumstances in which the plan could be invoked, including as a result of adverse movements in liquidity early warning indicators. As part of the plan, the Barclays Treasurer has established a

| Barclays PLC and Barclays Bank PLC 2016 Annual Report on Form 20-F | 105 |
Risk review
Risk management
Treasury and capital risk management
Liquidity Management Committee (LMC). On invocation of the CFP by the Executive Committee, the LMC would meet to identify the likely impact of the event on the Group and determine the appropriate response for the nature and severity of the stress.
The CFP provides a communication plan and includes management actions to respond to liquidity stresses of varying severity. This could include monetising the liquidity pool, slowing the extension of credit, increasing the tenor of funding and securitising or selling assets.
Capital risk management
Overview
Capital risk is managed through ongoing monitoring and management of the capital position, regular stress testing and a robust capital governance framework.
Organisation and structure
The management of capital risk is integral to the Group’s approach to financial stability and sustainability management, and is embedded in the way businesses and legal entities operate.
Capital risk management is underpinned by a control framework and policy. The capital management strategy, outlined in the Group and legal entity capital plans, is developed in alignment with the control framework and policy for capital risk, and is implemented consistently in order to deliver on the Group’s objectives.
The Board approves the Group capital plan, internal and regulatory stress tests, and the Group recovery plan. The Treasury Committee is responsible for monitoring and managing capital risk in line with the Group’s capital management objectives, capital plan and risk frameworks. The Board Risk Committee reviews the risk profile, and annually reviews risk appetite and the impact of stress scenarios on the Group capital plan/forecast in order to agree the Group’s projected capital adequacy.
Local management ensures compliance with an entity’s minimum regulatory capital requirements by reporting to local Asset and Liability Committees with oversight by the Group’s Treasury Committee, as required.
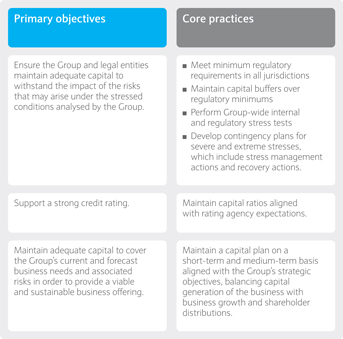
Roles and responsibilities
Treasury has the primary responsibility for managing and monitoring capital and reports to the Group Finance Director. The Treasury and Capital Risk function contains a Capital Risk Oversight team, and is an independent risk function that reports to the Group CRO and is responsible for oversight of capital risk.
Capital risk management
The Group’s capital management strategy is driven by the strategic aims of the Group and the risk appetite set by the Board. The Group’s objectives are achieved through well embedded capital management practices.
Capital planning and allocation
The Group assesses its capital requirements on multiple bases, with the Group’s capital plan set in consideration of the Group’s risk profile and appetite, strategic and performance objectives, regulatory requirements, and market and internal factors, including the results of stress testing. The capital plan is managed on atop-down andbottom-up basis through both short-term and medium-term financial planning cycles, and is developed with the objective of ensuring that the Group maintains an adequate level of capital to support its capital requirements.
The PRA determines the regulatory capital requirements for the consolidated Group. Under these regulatory frameworks, capital requirements are set in consideration of the level of risk that the firm is exposed to and the factors above, and are measured through both risk-based RWAs and leverage-based metrics. An internal assessment of the Bank’s capital adequacy is undertaken through the Internal Capital Adequacy Assessment Process (ICAAP) and is used to inform the capital requirements of the firm.
| 106 | Barclays PLC and Barclays Bank PLC 2016 Annual Report on Form 20-F |
The Group expects to meet the minimum requirements for capital and leverage both during the transition period and upon full implementation, and also holds an internal buffer sized according to the firm’s assessment of capital risk.
Through the capital planning process, capital allocations are approved by the Group Executive Committee, taking into consideration the risk appetite and strategic aims of the Group. Regulated legal entities are, at a minimum, capitalised to meet their current and forecast regulatory and business requirements.
Monitoring and reporting
Capital is managed and monitored to ensure that Barclays’ capital plans remain appropriate and that risks to the plans are considered.
Limits are in place to support alignment with the capital plan and adherence to regulatory requirements, and are monitored through appropriately governed forums. Capital risks against firm-specific and macroeconomic early warning indicators are monitored and reported to the Treasury Committee, with clear escalation channels to senior management. This enables a consistent and objective approach to monitoring the capital outlook against the capital plan, and supports the early identification when outlooks deteriorate.
Capital management information is readily available to support the Senior Management’s strategic andday-to-day business decision making.
Stress testing and risk mitigation
Internal Group-wide stress testing is undertaken to quantify and understand the impact of sensitivities on the capital plan and capital ratios arising from stressed macroeconomic conditions. Recent economic, market and peer institution stresses are used to inform the assumptions developed for internal stress tests and to assess the effectiveness of mitigation strategies.
The Group also undertakes stress tests prescribed by the BoE and EBA, and legal entities undertake stress tests prescribed by their local regulators. These stress tests inform decisions on the size and quality of the internal capital buffer required and the results are incorporated into the Group capital plan to ensure adequacy of capital under normal and severe, but plausible stressed conditions.
Actions are identified as part of the stress tests that can be taken to mitigate the risks that may arise in the event of material adverse changes in the current economic and business outlook. As an additional layer of protection, the Group Recovery Plan defines the actions and implementation strategies available to the Group to increase or preserve capital resources in the situation that a stress occurs that is more severe than anticipated.
Transferability of capital
Surplus capital held in Group entities is required to be repatriated to Barclays Bank PLC in the form of dividends and/or capital repatriation, subject to local regulatory requirements, exchange controls and tax implications. This approach provides optimal flexibility on the redeployment of capital across legal entities. Pre and post the implementation of ring-fencing, capital is managed for the Group as a whole as well as its operating subsidiaries to ensure fungibility and redeployment of capital while meeting relevant internal and regulatory targets at entity levels.
Foreign exchange risk
The Group has capital resources and RWAs denominated in foreign currencies. Changes in foreign exchange rates result in changes in the Sterling equivalent value of foreign currency denominated capital resources and RWAs. As a result, the Group’s regulatory capital ratios are sensitive to foreign currency movements.
The Group’s capital ratio management strategy is to minimise the volatility of the capital ratios caused by foreign exchange rate movements. To achieve this, the Group aims to maintain the ratio of foreign currency CET1, Tier 1 and Total capital resources to foreign currency RWAs the same as the Group’s consolidated capital ratios.
The Group’s investments in foreign currency subsidiaries and branches, to the extent that they are not hedged for foreign exchange movements, translate into GBP upon consolidation creating CET1 capital resources sensitive to foreign currency movements. Changes in the GBP value of the investments due to foreign currency movements are captured in the currency translation reserve, resulting in a movement in CET1 capital.
To create foreign currency Tier 1 and Total Capital resources additional to the CET1 capital resources, the Group issues debt capital innon-Sterling currencies, where possible. This is primarily achieved through the issuance of debt capital from Barclays PLC or Barclays Bank PLC in US Dollar and Euro, but can also be achieved by subsidiaries issuing capital in local currencies.
Pension risk
The Group maintains a number of defined benefit pension schemes for past and current employees. The ability of the pension fund to meet the projected pension payments is maintained principally through investments.
Pension risk arises because the estimated market value of the pension fund assets might decline; investment returns might reduce; or the estimated value of the pension liabilities might increase as a result of changes to the market process. The Group monitors the market risks arising from its defined benefit pension schemes and works with the Trustees to address shortfalls. In these circumstances, the Group could be required or might choose to make extra contributions to the pension fund. The Group’s main defined benefit scheme was closed to new entrants in 2012.
| Barclays PLC and Barclays Bank PLC 2016 Annual Report on Form 20-F | 107 |
Risk review
Risk management
Treasury and capital risk management
Interest rate risk in the banking book management
Overview
Banking book operations generatenon-traded market risk, primarily through interest rate risk arising from the sensitivity of net interest margins to changes in interest rates. To manage interest rate risk within its defined risk appetite, the principal banking businesses engage in internal derivative trades with Treasury. However, the businesses remain susceptible to market risk from six key sources:
| § | direct risk: the mismatch between therun-off of product balances and the associated interest rate hedge, given that the balance sheet is held static |
| § | structural risk: the impact of the rate shock on the rolling hedge replenishment rate onnon-maturity products, given that the balance sheet is held static |
| § | prepayment risk: balancerun-off may be faster or slower than expected, due to customer behaviour in response to general economic conditions or interest rates. This can lead to a mismatch between the actual balance of products and the hedges executed with Treasury based on initial expectations |
| § | recruitment risk: the volume of new business may be lower or higher than expected, requiring the business to unwindpre-hedging or execute hedging transactions with Treasury at different rates than expected |
| § | residual risk and margin compression: the business may retain a small element of interest rate risk to facilitate the day-to-day management of customer business. Additionally, in the current low interest rate environment, deposits on which the Group sets the interest rate are exposed to margin compression. This is because for any further fall in base rates the Group must absorb an increasing amount of the rate move in its margin |
| § | lag risk: the risk of being unable tore-price products immediately after a change in interest rates due to both mandatory notification periods and operational constraints in large volume mailings. This is highly prevalent in managed rates savings product (e.g. Everyday Saver) where customers must be informed in writing of any planned reduction in their savings rates. |
Non-traded market risk also arises from the Liquidity Buffer investment portfolio, which is managed to a defined risk appetite. Investments in the liquidity buffer are generally subject to available for sale accounting rules; changes in the value of these assets impact capital via the available for sale reserve.
Roles and responsibilities
The Treasury Market Risk team:
| § | provides risk management oversight and monitoring of all traded andnon-traded market risk in Treasury, which specifically includes risk management of the liquidity buffer, funding activities, asset and liability management hedging, residual interest rate risk from the hedge accounting solution and foreign exchange translation hedging |
| § | sets and monitors risk limits to ensurenon-traded market risk taken in Treasury and the customer banking book adheres to agreed risk appetite. |
The Interest Rate Risk in the Banking Book team:
| § | assesses interest rate risk in the banking book, particularly as it relates to customer banking book and Treasury |
| § | acts as review and challenge of the First Line’s risk management practices and decisions including the hedging activity performed by Treasury on behalf of the business |
| § | acts as review and challenge for the behavioural assumptions used in hedging and transfer pricing. |
| 108 | Barclays PLC and Barclays Bank PLC 2016 Annual Report on Form 20-F |
Risk review
Risk management
Operational risk management
Operational risk
The risk of loss to the firm from inadequate or failed processes or systems, human factors or due to external events (for example fraud) where the root cause is not due to credit or market risks.
|
Overview
The management of operational risk has two key objectives:
| § | minimise the impact of losses suffered, both in the normal course of business (small losses) and from extreme events (large losses) |
| § | improve the effective management of the Group and strengthen its brand and external reputation. |
The Group is committed to the management and measurement of operational risk and was granted a waiver by the FSA (now the PRA) to operate an Advanced Measurement Approach (AMA) for operational risk, which commenced in January 2008. The majority of the Group calculates regulatory capital requirements using AMA (94% of capital requirements), except for small parts of the organisation acquired since the original permission (6% of capital requirements) using the Basic Indicator Approach (BIA). The Group works to benchmark its internal operational risk management and measurement practices with peer banks and to drive the further development of advanced techniques.
The Group is committed to operating within a strong system of internal controls that enables business to be transacted and risk taken without exposing the Group to unacceptable potential losses or reputational damages. The Group has an overarching framework that sets out the approach to internal governance. This guide establishes the mechanisms and processes by which the Board directs the organisation, through setting the tone and expectations from the top, delegating authority and monitoring compliance.
Organisation and structure
Operational Risk comprises a number of specific risks defined as follow:
| § | external supplier: inadequate selection and ongoing management of external suppliers |
| § | financial reporting:reporting misstatement or omission within external financial or regulatory reporting |
| § | fraud:dishonest behaviour with the intent to make a gain or cause a loss to others |
| § | information: inadequate protection of the Group’s information in accordance with its value and sensitivity |
| § | payments process:failure in operation of payments processes |
| § | people:inadequate people capabilities, and/or performance/reward structures, and/or inappropriate behaviours |
| § | premises and security:unavailability of premises (to meet business demand) and/or safe working environments, and inadequate protection of physical assets, employees and customers against external threats |
| § | taxation:failure to comply with tax laws and practice which could lead to financial penalties, additional tax charges or reputational damages |
| § | technology (including cyber security):failure to develop and deploy secure, stable and reliable technology solutions which includes risk of loss or detriment to the Group’s business and customers as a result of actions committed or facilitated through the use of networked information systems |
| § | transaction operations:failure in the management of critical transaction processes. |
In order to ensure complete coverage of the potential adverse impacts on the Group arising from operational risk, the operational risk taxonomy extends beyond the operational risks listed above to cover areas included within conduct risk. For more information on conduct risk please see page 112.
These risks may result in financial and/ornon-financial impacts including legal/regulatory breaches or reputational damages.
Organisation and structure
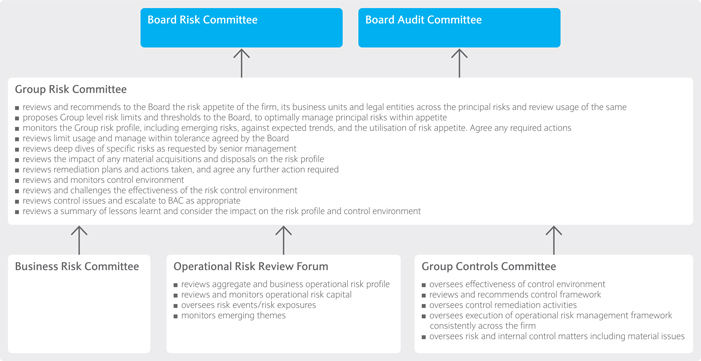
| Barclays PLC and Barclays Bank PLC 2016 Annual Report on Form 20-F | 109 |
Risk review
Risk management
Operational risk management
Roles and responsibilities
The prime responsibility for the management of operational risk and the compliance with control requirements rests with the business and functional units where the risk arises. The operational risk profile and control environment is reviewed by business management through specific meetings which cover governance, risk and control. Businesses are required to report their operational risks on both a regular and an event-driven basis. The reports include a profile of the material risks that may threaten the achievement of their objectives and the effectiveness of key controls, operational risk events and a review of scenarios.
The Group Head of Operational Risk is responsible for establishing, owning and maintaining an appropriate Group-wide Operational Risk Framework and for overseeing the portfolio of operational risk across the Group.
Operational risk management acts in a Second Line of Defence capacity, and is responsible for implementation of the framework and monitoring operational risk events and risk exposures. Key indicators (KIs) allow the Group to monitor its operational risk profile and alert management when risk levels exceed acceptable ranges or risk appetite levels and drive timely decision making and actions. Through attendance at business GRC meetings, operational risk management provides specific risk input into the issues highlighted and the overall risk profile of the business. Operational risk issues escalated from these meetings are considered through the Second Line of Defence review meetings. Depending on their nature, the outputs of these meetings are presented to the BRC or the BAC.
Risk and control self-assessments
The Group identifies and assesses all material risks within each business and evaluates the key controls in place to mitigate those risks. Managers in the businesses use self-assessment techniques to identify risks, evaluate the effectiveness of key controls in place and assess whether the risks are being effectively managed. The businesses are then able to make decisions on what action, if any, is required to reduce the level of risk to the Group. These risk assessments are monitored on a regular basis to ensure that each business continually understands the risks it faces.
| 110 | Barclays PLC and Barclays Bank PLC 2016 Annual Report on Form 20-F |
Risk review
Risk management
Model risk management
Model risk
The risk of the potential adverse consequences from financial assessment or decisions based on incorrect or misused model outputs and reports.
|
Overview
Barclays uses models to support a broad range of activities, including informing business decisions and strategies, measuring and limiting risk, valuing exposures, conducting stress testing, assessing capital adequacy, managing client assets, and meeting reporting requirements.
Because models are imperfect and incomplete representations of reality, they may be subject to errors affecting the accuracy of their output.
Model errors can result in inappropriate business decisions being made, financial loss, regulatory risk, reputational risk and/or inadequate capital reporting.
Models may also be misused, for instance applied to products that they were not intended for, or not adjusted, where fundamental changes to their environment would justifyre-evaluating their core assumptions.
Errors and misuse are the primary sources of model risk.
Robust model risk management is crucial to ensuring that model risk is assessed and managed within a defined risk appetite. Strong model risk culture, appropriate technology environment, and adequate focus on understanding and resolving model limitations are crucial components.
Organisation and structure
Barclays allocates substantial resources to identify and record models and their usage, document and monitor the performance of models, validate models and ensure that model limitations are adequately addressed.
Barclays has a dedicated Model Risk Management (MRM) function that consists of two main units: the Independent Validation Unit (IVU), responsible for model validation and approval, and Model Governance and Controls (MGC), covering model risk governance, controls and reporting, including ownership of model risk policy.
The model risk policy prescribes Group-wide, end to end requirements for the identification, measurement and management of model risk, covering model documentation, development, implementation, monitoring, annual review, independent validation and approval, change and reporting processes. The Policy is supported by global Standards covering model inventory, documentation, validation, complexity and materiality, testing and monitoring, overlays, as well as vendor models and CCAR benchmarking.
Barclays is continuously enhancing model risk management. MRM reports to the Group Chief Risk Officer and operates a global framework. Implementation of best practice standards is a central objective of the Group. Large new model development programmes are currently in motion to implement the model requirements of UK structural reform, CCAR, FRTB and IFRS9.
Roles and responsibilities
The key model risk management activities include:
| § | ensuring that models are correctly identified across all relevant areas of the firm, and recorded in the Group Models Database (GMD), the Group-wide model inventory. The heads of the relevant areas (typically, the Business Chief Risk Officers, Business Chief Executive Officers, the Treasurer, the Chief Financial Officer) annually attest to the completeness and accuracy of the model inventory. MGC undertakes regular conformance reviews on the model inventory. These activities are detailed in the Model Inventory, Workflow and Taxonomy Standard |
| § | ensuring that every model has a model owner who is accountable for the model. The model owner must sign off models prior to submission to IVU for validation. The model owner works with the relevant technical teams (model developers, implementation, monitoring, data services, regulatory) to ensure that the model presented to IVU is and remains fit for purpose, in accordance with the Model Documentation Standard, and the Model Testing, Monitoring and Annual Review Standard |
| § | ensuring that every model is subject to validation and approval by IVU, prior to being implemented and on a continual basis, in accordance with the Model Validation and Approval Standard. The level of review and challenge applied by IVU is tailored to the materiality and complexity of each model. Validation includes a review of the model assumptions, conceptual soundness, data, design, performance testing, compliance with external requirements if applicable, as well as any limitations, proposed remediation and overlays with supporting rationale. Material model changes are subject to prioritised validation and approval |
| § | specific Standards cover model risk management activities relating to CCAR benchmarking and challenger modelling, model overlays, vendor models, and model complexity and materiality. |
Organisation and structure

| Barclays PLC and Barclays Bank PLC 2016 Annual Report on Form 20-F | 111 |
Risk review
Risk management
Conduct risk management
Conduct risk
The risk of detriment to customers, clients, market integrity, competition or Barclays from the inappropriate supply of financial services, including instances of wilful or negligent misconduct.
|
Overview
The Group defines, manages and mitigates conduct risk with the goals of providing positive customer and client outcomes and protecting market integrity. This includes taking reasonable steps to ensure our culture and strategy are appropriately aligned to these goals; our products and services are reasonably designed and delivered to meet the needs of our customers and clients as well as promoting the fair and orderly operation of the markets in which we do business.
As part of the Enterprise Risk Management Framework (ERMF) refresh (page 98), Reputation risk has been designated as a Principal Risk and Financial Crime has been designated as a Risk Category under Conduct Risk.
Organisation and structure
The Group Risk Committee (GRC) is the most senior Executive body responsible for reviewing and monitoring the effectiveness of Barclays’ management of Conduct risk.
Roles and responsibilities
The Conduct Risk Principal Risk Framework (PRF) comprises a number of elements that allow the Group to manage and measure its conduct risk profile.
The PRF is implemented vertically across the Group through an organisational structure that requires all businesses to implement and operate their own conduct risk frameworks that meet the requirements within the ERMF.
The primary responsibility for managing conduct risk and compliance with control requirements sits with the business where the risk arises. The Conduct Risk Accountable Executive for each business is responsible for ensuring the implementation of, and adherence to the PRF.
The Group Chief Compliance Officer is responsible for owning and maintaining an appropriate Group-wide Conduct Risk PRF and for overseeing Group-wide conduct risk management.
Businesses are required to report their conduct risks on both a quarterly and an event-driven basis. The quarterly reports detail the conduct risks inherent within the business strategy and include forward looking horizon scanning analysis as well as backward looking evidence-based indicators from both internal and external sources. For details please refer to the Risk Review, Conduct Risk Performance section of this report on page 180.
Organisation and structure

| 112 | Barclays PLC and Barclays Bank PLC 2016 Annual Report on Form 20-F |
Risk review
Risk management
Reputation risk management
Reputation risk
The risk that an action, transaction, investment or event will reduce trust in the firm’s integrity and competence by clients, counterparties, investors, regulators, employees or the public.
|
Overview
A reduction of trust in Barclays’ integrity and competence may reduce the attractiveness of Barclays to stakeholders and could lead to negative publicity, loss of revenue, regulatory or legislative action, loss of existing and potential client business, reduced workforce morale and difficulties in recruiting talent. Ultimately it may destroy shareholder value.
With effect from 2017, Reputation risk has been redesignated as a Principal Risk within the Enterprise Risk Management Framework.
Organisation and structure
The Group Risk Committee (GRC) is the most senior Executive body responsible for reviewing and monitoring the effectiveness of Barclays’ management of Reputation risk.
Roles and responsibilities
The Chief Compliance Officer is accountable for ensuring that a Reputation Principal Risk Framework and policies are developed and that they are subject to limits, monitored, reported on and escalated, as required.
Reputation risk is by nature pervasive and can be difficult to quantify, requiring more subjective judgement than many other risks. The Reputation Principal Risk Framework sets out what is required to ensure Reputation risk is managed effectively and consistently across the bank.
The primary responsibility for identifying and managing Reputation risk and adherence to the control requirements sits with the business and support functions where the risk arises.
Each business is required to operate within established Reputation risk appetite and to submit quarterly reports to the Group Reputation Management team, highlighting their most significant current and potential Reputation risks and issues and how they are being managed. These reports are a key internal source of information for the quarterly Reputation risk reports which are prepared for the Group Risk Committee and the Board Reputation Committee.
Organisation and structure

| Barclays PLC and Barclays Bank PLC 2016 Annual Report on Form 20-F | 113 |
Risk review
Risk management
Legal risk
Legal risk
The risk of loss or imposition of penalties, damages or fines from the failure of the firm to meet its legal obligations including regulatory or contractual requirements.
|
Overview
With effect from 2017, Legal risk, which was previously a Key Risk under operational risk, has beenre-designated as a Principal Risk within the Enterprise Risk Management Framework.
The Legal Risk Framework prescribes Group-wide requirements for the identification, measurement and management of Legal risk, covering assessment, risk appetite, key indicators and governance. The Group General Counsel (GCC) is the Legal Principal Risk Officer and owns the Legal Risk Framework and the associated legal policies.
Legal risk is defined by the five respective Legal Policies:
| § | Contractual arrangements – failure to have enforceable contracts in place or for contracts to be enforceable as intended |
| § | Litigation management– failure to adequately manage litigation involving Barclays as either claimant or defendant |
| § | Intellectual property (IP)– failure to protect the Group’s IP assets or Barclays infringing IP rights of third parties |
| § | Competition/antitrust law– failure to follow competition/antitrust law or failure to manage relationships with competition and antitrust authorities |
| § | Use of law firms– failure to control instruction of an external law firm. |
Group-wide and Business/Function specific Standards may be put in place to support the implementation of the legal policies. The standards are aligned to one of the policies and are implemented by Businesses/ Functions.
Organisation and structure
The Group Risk Committee (GRC) is the most senior executive body responsible for reviewing and monitoring the effectiveness of Barclays’ management of Legal risk. Escalation paths from this forum exist to the Board of Barclays PLC.
Roles and responsibilities
The Legal Risk Framework sets out what is required to ensure Legal risk is managed effectively and consistently across the bank.
The primary responsibility for managing Legal risk and adherence to the control requirements sits with the business where the risk arises.
On behalf of the businesses, the aligned General Counsel or Legal Senior Management, will undertake Legal risk appetite assessments and provide advice and guidance on Legal risk management. The Legal risk assessment includes both quantitative and qualitative criteria including:
| § | Knowledge of Legal risk material control issues or weaknesses |
| § | Emerging risks resulting from upcoming changes in the control environment, systems, or internal organisational structures |
| § | Potential implications on Barclays of forthcoming changes in the external legal and regulatory environment and/or prevailing decisions from courts and enforcing authorities as they relate to defined legal risks. |
The Legal Principal Risk Officer is responsible for owning and maintaining an appropriate Legal Risk Framework and for overseeing Group-wide legal risk management.
Organisation and structure

| 114 | Barclays PLC and Barclays Bank PLC 2016 Annual Report on Form 20-F |
Risk review
Risk performance
Maintaining our risk profile at an acceptable and appropriate level is essential to ensure our continued performance. This section provides a review of the performance of the Group in 2016 for each of the five Principal Risks in operation throughout the year, which are credit, market, funding, operational, and conduct risk.
Please refer to the Risk Management section (pages97 to 114) for an overview of the changes to Barclays’ Principal Risk taxonomy in December 2016.
|
Page
|
| ||||||
| ||||||||
| Credit risk | 116 | |||||||
| Market risk | 141 | |||||||
| Funding risk – capital risk | 152 | |||||||
| Funding risk – liquidity risk | 159 | |||||||
| Operational risk | 178 | |||||||
| Conduct risk | 180 | |||||||
| For a more comprehensive breakdown on our Risk review and Risk management contents please see pages 86 to 87. |

| Barclays PLC and Barclays Bank PLC 2016 Annual Report on Form 20-F | 115 |
Risk review
Risk performance
Credit risk
Analysis of credit risk
Credit risk is the risk of the Group suffering financial loss should any of its customers, clients, or market counterparties fail to fulfil their contractual obligations to the Group.
This section details the Group’s credit risk profile and provides information on the Group’s exposure to loans and advances to customer and banks, maximum exposures with collateral held and net impairment charges raised in the year. It provides information on balances that are categorised as credit risk loans, balances in forbearance, as well as exposure to and performance metrics for specific portfolios and asset types.
Key metrics
Credit impairment charges in 2016 were 35% higher than 2015:
+£608m Group
Loan impairment increased reflecting a higher charge following the management review of the UK and US cards portfolio impairment modelling and a number of single name exposures.
+£555m Retail Core
Increased charges primarily due to a charge following the review of UK and US cards portfolio impairment modelling.
Underlying performance across key portfolios has remained stable and broadly within expectations
+£63m Wholesale Core
Increased charges reflecting limited range of single name exposures.
-£10m Non-Core
Decreased charges reflecting lower charges in European businesses.
– Net Loans and advances to customers and banks decreased by 2% in 2016
– The loan loss rate rose to 53bps

| 116 | Barclays PLC and Barclays Bank PLC 2016 Annual Report on Form 20-F |
| Summary of Contents | Page
| |||||
§ Credit risk overview and summary of performance § Analysis of the balance sheet § The Group’s maximum exposure and collateral and other credit enhancements held § The Group’s approach to manage and represent credit quality – Asset credit quality – Debt securities – Balance sheet credit quality
|
118 118 119
121 121 121 122 |
Credit risk represents a significant risk to the Group and mainly arises from exposure to wholesale and retail loans and advances together with the counterparty credit risk arising from derivative contracts entered into with clients.
This section provides a macro view of the Group’s credit exposures. | ||||
§ Analysis of the concentration of credit risk – Geographic concentrations – Group exposures to specific countries – Industrial concentrations |
123 123 124 125 |
The Group reviews and monitors risk concentrations in a variety of ways to ensure the continuation of a diversified portfolio operating within agreed appetites.
This sections outlines performance against key concentration risks at a macro Group level.
| ||||
§ Loans and advances to customers and banks § Analysis of specific portfolios and asset types – Secured home loans – Credit cards, overdrafts, and unsecured loans – Exposure to UK Commercial Real Estate |
127 128 128 129 131 |
In addition to Group-wide concentrations, Credit Risk monitors exposure performance across a range of specific portfolios where the risk profile is considered to be heightened.
This section provides a more detailed analysis of these exposures and notes on how certain aspects of the risk profile are mitigated on an ongoing basis.
| ||||
§ Analysis of problem loans – Age analysis of loans and advances that are past due but not impaired – Analysis of loans and advances assessed as impaired – Potential credit risk loans – Impaired loans – Forbearance |
132 132
133 132 134 134 |
The Group monitors exposures to assets where there is a heightened likelihood of default and assets where an actual default has occurred.
This section outlines the exposure to assets that have been classified as impaired analysing the exposures between business units and by key product types.
The Group, from time to time, agrees to the suspension of certain aspects of customer/client credit agreements, generally during temporary periods of financial difficulties where the Group is confident that the customer/client will be able to remedy the suspension.
During this time, customer/client assets are separately monitored to ensure that remedies are completed.
This section outlines the Group’s current exposure to assets with this treatment.
| ||||
§ Impairment – Impairment allowances – Management adjustments to models for impairment § Analysis of debt securities § Analysis of derivatives |
138 138 138 139 139 | The Group holds impairment provisions on the balance sheet as a result of the raising of a charge against profit for incurred losses in the lending book. An impairment allowance may either be identified or unidentified and individual or collective.
This section outlines the movements in allowance for impairment by asset class exposure, material management adjustments to model output, analysis of debt securities and derivatives. | ||||
| Barclays PLC and Barclays Bank PLC 2016 Annual Report on Form 20-F | 117 |
Risk review
Risk performance
Credit risk
Credit risk
Credit risk is the risk of the Group suffering financial loss if any of its customers, clients or market counterparties fails to fulfil their contractual obligations to the Group.
All disclosures in this section (pages 118 to 120) are unaudited unless otherwise stated. Disclosures for 2016 exclude BAGL balances which are now recognised as held for sale, comparative tables for 2015 include BAGL balances unless otherwise stated.
|
Overview
Credit risk represents a significant risk to the Group and mainly arises from exposure to wholesale and retail loans and advances together with the counterparty credit risk arising from derivative contracts entered into with clients. A summary of performance may be found below.
This section provides an analysis of areas of particular interest or potentially of higher risk, including: i) balance sheet, including the maximum exposure, and collateral, and loans and advances; ii) areas of concentration; iii) exposure to and performance metrics for specific portfolios and assets types, including home loans, credit cards and UK commercial real estate; iv) exposure and performance of loans on concession programmes, including forbearance; v) problem loans, including credit risk loans (CRLs); and vi) impairment, including impairment stock and management adjustments to model outputs.
Please see risk management section on pages 101 to 102 for details of governance, policies and procedures.
Summary of performance in the period
Credit impairment charges increased £0.6bn to £2.4bn including a £0.3bn charge in Q316 following the management review of the UK and US cards portfolio impairment modelling. Overall, this resulted in an 11bps increase in the loan loss rate to 53bps.
Credit Risk Loans (CRLs) remained stable at £6.5bn (2015: £6.4bn) with the Group’s CRL coverage ratio increasing to 71% (2015: 65%) mainly within retail portfolios.
Total loans and advances net of impairment decreased by £11.4bn to £449.5bn driven by a £31bn decrease due to the reclassification of BAGL balances to held for sale and £9bn from the exit of other assets inNon-Core. This was offset by lending growth of £20bn and a net £9bn increase in settlement and cash collateral balances.
Analysis of the Balance Sheet
Group’s maximum exposure and collateral and other credit enhancements held
Basis of preparation
The following tables present a reconciliation between the Group’s maximum exposure and its net exposure to credit risk; reflecting the financial effects of collateral, credit enhancements and other actions taken to mitigate the Group’s exposure.
For financial assets recognised on the balance sheet, maximum exposure to credit risk represents the balance sheet carrying value after allowance for impairment. Foroff-balance sheet guarantees, the maximum exposure is the maximum amount that the Group would have to pay if the guarantees were to be called upon. For loan commitments and other credit related commitments that are irrevocable over the life of the respective facilities, the maximum exposure is the full amount of the committed facilities.
This and subsequent analyses of credit risk include only financial assets subject to credit risk. They exclude other financial assets not subject to credit risk, mainly equity securities held for trading, as available for sale or designated at fair value, and traded commodities. Assets designated at fair value in respect of linked liabilities to customers under investment contracts have also not been included as the Group is not exposed to credit risk on these assets. Credit losses in these portfolios, if any, would lead to a reduction in the linked liabilities and not result in a loss to the Group. Foroff-balance sheet exposures certain contingent liabilities not subject to credit risk such as performance guarantees are excluded.
Both on- andoff-balance sheet exposures for 2016 exclude BAGL balances now held for sale. Comparative tables for 2015 include BAGL balances unless stated otherwise.
The Group mitigates the credit risk to which it is exposed through netting andset-off, collateral and risk transfer. Further detail on the Group’s policies to each of these forms of credit enhancement is presented in the Barclays Pillar 3 Report.
Overview
As at 31 December 2016, the Group’s net exposure to credit risk after taking into account netting andset-off, collateral and risk transfer increased 6% to £740.7bn, reflecting an increase in maximum exposure of 3% and an increase in level of mitigation held of 1%. Overall, the extent to which the Group holds mitigation against its total exposure remained stable at 47% (2015: 48%).
Of the remaining exposure left unmitigated, a significant portion relates to cash held at central banks, financial investment debt securities issued by governments, cash collateral and settlement balances, all of which are considered lower risk. Trading portfolio liability positions, which to a significant extent economically hedge trading portfolio assets but which are not held specifically for risk management purposes, are excluded from the analysis. The credit quality of counterparties to derivative, financial investments and wholesale loan assets are predominantly investment grade. Further analysis on the credit quality of assets is presented on pages 121 to 122.
Where collateral has been obtained in the event of default, the Group does not, as a rule, use such assets for its own operations and they are usually sold on a timely basis. The carrying value of assets held by the Group as at 31 December 2016, as a result of the enforcement of collateral, was £16m (2015: £69m).
| 118 | Barclays PLC and Barclays Bank PLC 2016 Annual Report on Form 20-F |
| Maximum exposure and effects of collateral and other credit enhancements (audited) | ||||||||||||||||||||||||
| Maximum | Netting | Collateral | Risk | Net | ||||||||||||||||||||
| exposure | and set-off | Cash | Non-cash | transfer | exposure | |||||||||||||||||||
| As at 31 December 2016 | £m | £m | £m | £m | £m | £m | ||||||||||||||||||
| On-balance sheet: | ||||||||||||||||||||||||
| Cash and balances at central banks | 102,353 | – | – | – | – | 102,353 | ||||||||||||||||||
| Items in the course of collection from other banks | 1,467 | – | – | – | – | 1,467 | ||||||||||||||||||
| Trading portfolio assets: | ||||||||||||||||||||||||
| Debt securities | 38,789 | – | – | – | – | 38,789 | ||||||||||||||||||
| Traded loans | 2,975 | – | – | (270 | ) | – | 2,705 | |||||||||||||||||
| Total trading portfolio assets | 41,764 | – | – | (270 | ) | – | 41,494 | |||||||||||||||||
| Financial assets designated at fair value: | ||||||||||||||||||||||||
| Loans and advances | 10,519 | – | (17 | ) | (4,107 | ) | (432 | ) | 5,963 | |||||||||||||||
| Debt securities | 70 | – | – | – | – | 70 | ||||||||||||||||||
| Reverse repurchase agreements | 63,162 | – | (688 | ) | (62,233 | ) | – | 241 | ||||||||||||||||
| Other financial assets | 262 | – | – | – | – | 262 | ||||||||||||||||||
| Total financial assets designated at fair value | 74,013 | – | (705 | ) | (66,340 | ) | (432 | ) | 6,536 | |||||||||||||||
| Derivative financial instruments | 346,626 | (273,602 | ) | (41,641 | ) | (8,282 | ) | (5,205 | ) | 17,896 | ||||||||||||||
| Loans and advances to banks | 43,251 | – | (4 | ) | (4,896 | ) | (22 | ) | 38,329 | |||||||||||||||
| Loans and advances to customers: | ||||||||||||||||||||||||
| Home loans | 144,765 | – | (184 | ) | (143,912 | ) | – | 669 | ||||||||||||||||
| Credit cards, unsecured and other retail lending | 57,808 | – | (235 | ) | (5,258 | ) | (95 | ) | 52,220 | |||||||||||||||
| Corporate loans | 190,211 | (8,622 | ) | (320 | ) | (52,029 | ) | (5,087 | ) | 124,153 | ||||||||||||||
| Total loans and advances to customers | 392,784 | (8,622 | ) | (739 | ) | (201,199 | ) | (5,182 | ) | 177,042 | ||||||||||||||
| Reverse repurchase agreements and other similar secured lending | 13,454 | – | (79 | ) | (13,242 | ) | – | 133 | ||||||||||||||||
| Financial investments - debt securities | 62,879 | – | – | (533 | ) | (1,286 | ) | 61,060 | ||||||||||||||||
| Other assets | 1,205 | – | – | – | – | 1,205 | ||||||||||||||||||
| Totalon-balance sheet | 1,079,796 | (282,224 | ) | (43,168 | ) | (294,762 | ) | (12,127 | ) | 447,515 | ||||||||||||||
| Off-balance sheet: | ||||||||||||||||||||||||
| Contingent Liabilities | 19,908 | – | (247 | ) | (1,403 | ) | (130 | ) | 18,128 | |||||||||||||||
| Documentary credits and other short-term trade-related transactions | 1,005 | – | (24 | ) | (18 | ) | (3 | ) | 960 | |||||||||||||||
| Forward starting reverse repurchase agreements | 24 | – | – | (24 | ) | – | – | |||||||||||||||||
| Standby facilities, credit lines and other commitments | 302,657 | – | (321 | ) | (26,524 | ) | (1,704 | ) | 274,108 | |||||||||||||||
| Totaloff-balance sheet | 323,594 | – | (592 | ) | (27,969 | ) | (1,837 | ) | 293,196 | |||||||||||||||
| Total | 1,403,390 | (282,224 | ) | (43,760 | ) | (322,731 | ) | (13,964 | ) | 740,711 | ||||||||||||||
| Barclays PLC and Barclays Bank PLC 2016 Annual Report on Form 20-F | 119 |
Risk review
Risk performance
Credit risk
| Maximum exposure and effects of collateral and other credit enhancements (audited) | ||||||||||||||||||||||||
| Maximum | Netting | Collateral | Risk | Net | ||||||||||||||||||||
| exposure | andset-off | Cash | Non-cash | transfer | exposure | |||||||||||||||||||
| As at 31 December 2015 | £m | £m | £m | £m | £m | £m | ||||||||||||||||||
| On-balance sheet: | ||||||||||||||||||||||||
| Cash and balances at central banks | 49,711 | – | – | – | – | 49,711 | ||||||||||||||||||
| Items in the course of collection from other banks | 1,011 | – | – | – | – | 1,011 | ||||||||||||||||||
| Trading portfolio assets: | ||||||||||||||||||||||||
| Debt securities | 45,576 | – | – | – | – | 45,576 | ||||||||||||||||||
| Traded loans | 2,474 | – | – | (607 | ) | (1 | ) | 1,866 | ||||||||||||||||
| Total trading portfolio assets | 48,050 | – | – | (607 | ) | (1 | ) | 47,442 | ||||||||||||||||
| Financial assets designated at fair value: | ||||||||||||||||||||||||
| Loans and advances | 17,913 | – | (21 | ) | (5,850 | ) | (515 | ) | 11,527 | |||||||||||||||
| Debt securities | 1,383 | – | – | – | – | 1,383 | ||||||||||||||||||
| Reverse repurchase agreements | 49,513 | – | (315 | ) | (49,027 | ) | – | 171 | ||||||||||||||||
| Other financial assets | 375 | – | – | – | – | 375 | ||||||||||||||||||
| Total financial assets designated at fair value | 69,184 | – | (336 | ) | (54,877 | ) | (515 | ) | 13,456 | |||||||||||||||
| Derivative financial instruments | 327,709 | (259,582 | ) | (34,918 | ) | (7,484 | ) | (5,529 | ) | 20,196 | ||||||||||||||
| Loans and advances to banks | 41,349 | – | (4 | ) | (4,072 | ) | (64 | ) | 37,209 | |||||||||||||||
| Loans and advances to customers: | ||||||||||||||||||||||||
| Home loans | 155,863 | – | (221 | ) | (154,355 | ) | (634 | ) | 653 | |||||||||||||||
| Credit cards, unsecured and other retail lending | 67,840 | (12 | ) | (1,076 | ) | (14,512 | ) | (1,761 | ) | 50,479 | ||||||||||||||
| Corporate loans | 175,514 | (8,399 | ) | (593 | ) | (45,788 | ) | (4,401 | ) | 116,333 | ||||||||||||||
| Total loans and advances to customers | 399,217 | (8,411 | ) | (1,890 | ) | (214,655 | ) | (6,796 | ) | 167,465 | ||||||||||||||
| Reverse repurchase agreements and other similar secured lending | 28,187 | – | (166 | ) | (27,619 | ) | – | 402 | ||||||||||||||||
| Financial investments - debt securities | 89,278 | – | – | (832 | ) | (811 | ) | 87,635 | ||||||||||||||||
| Other assets | 1,410 | – | – | – | – | 1,410 | ||||||||||||||||||
| Totalon-balance sheet | 1,055,106 | (267,993 | ) | (37,314 | ) | (310,146 | ) | (13,716 | ) | 425,937 | ||||||||||||||
| Off-balance sheet: | ||||||||||||||||||||||||
| Contingent liabilities | 20,576 | – | (604 | ) | (1,408 | ) | (104 | ) | 18,460 | |||||||||||||||
| Documentary credits and other short-term trade-related transactions | 845 | – | (33 | ) | (57 | ) | (3 | ) | 752 | |||||||||||||||
| Forward starting reverse repurchase agreements | 93 | – | – | (91 | ) | – | 2 | |||||||||||||||||
| Standby facilities, credit lines and other commitments | 281,369 | – | (313 | ) | (24,156 | ) | (662 | ) | 256,238 | |||||||||||||||
| Totaloff-balance sheet | 302,883 | – | (950 | ) | (25,712 | ) | (769 | ) | 275,452 | |||||||||||||||
| Total | 1,357,989 | (267,993 | ) | (38,264 | ) | (335,858 | ) | (14,485 | ) | 701,389 | ||||||||||||||
| 120 | Barclays PLC and Barclays Bank PLC 2016 Annual Report on Form 20-F |
The Group’s approach to management and representation of credit quality
Asset credit quality
All loans and advances are categorised as either ‘neither past due nor impaired’, ‘past due but not impaired’, or ‘past due and impaired’, which includes restructured loans. For the purposes of the disclosures in the balance sheet credit quality section below and the analysis of loans and advances and impairment section (page 138):
| § | loans neither past due nor impaired consist predominantly of wholesale and retail loans that are performing. These loans, although unimpaired may carry an unidentified impairment |
| § | a loan is considered past due and classified as Higher risk when the borrower has failed to make a payment when due under the terms of the loan contract |
| § | loans on forbearance programmes, as defined on page 134, are categorised as Higher risk |
| § | the impairment allowance includes allowances against financial assets that have been individually impaired and those subject to collective impairment. |
The Group uses the following internal measures to determine credit quality for loans that are performing:
| Default Grade | | Wholesale lending Probability of default | | | Credit Quality Description | | ||
| 1-3 | 0.0-0.05% | Strong | ||||||
| 4-5 | 0.05-0.15% | |||||||
| 6-8 | 0.15-0.30% | |||||||
| 9-11 | 0.30-0.60% | |||||||
| 12-14 | 0.60-2.15% | Satisfactory | ||||||
| 15-19 | 2.15-11.35% | |||||||
| 20 - 21 | 11.35%+ | Higher risk |
For retail clients, a range of analytical tools is used to derive the probability of default of clients at inception and on an ongoing basis.
For loans that are performing, these descriptions can be summarised as follows:
Strong:there is a very high likelihood of the asset being recovered in full.
Satisfactory:while there is a high likelihood that the asset will be recovered and therefore, of no cause for concern to the Group, the asset may not be collateralised, or may relate to retail facilities, such as credit card balances and unsecured loans, which have been classified as satisfactory, regardless of the fact that the output of internal grading models may have indicated a strong or high classification. At the lower end of this grade there are customers that are being more carefully monitored, for example, corporate customers which are indicating some evidence of deterioration, home loans with a high loan to value, and unsecured retail loans operating outside normal product guidelines.
Higher risk:there is concern over the obligor’s ability to make payments when due. However, these have not yet converted to actual delinquency. There may also be doubts over the value of collateral or security provided. However, the borrower or counterparty is continuing to make payments when due and is expected to settle all outstanding amounts of principal and interest.
Loans that are past due are monitored closely, with impairment allowances raised as appropriate and in line with the Group’s impairment policies. These loans are all considered Higher risk for the purpose of this analysis of credit quality.
Debt securities
For assets held at fair value, the carrying value on the balance sheet will include, among other things, the credit risk of the issuer. Most listed and some unlisted securities are rated by external rating agencies. The Group mainly uses external credit ratings provided by Standard & Poor’s, Fitch or Moody’s. Where such ratings are not available or are not current, the Group will use its own internal ratings for the securities.
Balance sheet credit quality
The following tables present the credit quality of Group assets exposed to credit risk.
Overview
As at 31 December 2016, the ratio of the Group’s assets classified as strong remained broadly stable at 86% (2015: 85%) of total assets exposed to credit risk.
| Barclays PLC and Barclays Bank PLC 2016 Annual Report on Form 20-F | 121 |
Risk review
Risk performance
Credit risk
Further analysis of debt securities by issuer and issuer type and netting and collateral arrangements on derivative financial instruments is presented on pages 139 and 140 respectively.
Balance sheet credit quality (audited) |
| |||||||||||||||||||||||||||||||
As at 31 December 2016 | | Strong (including investment grade) £m |
| | Satisfactory (BB+ to B) £m |
| | Higher risk (B- and below) £m |
| | Maximum exposure to credit risk £m | | | Strong (including investment grade) % |
| | Satisfactory (BB+ to B) % |
| | Higher risk (B- and below) % |
| | Maximum exposure to credit risk % |
| ||||||||
Cash and balances at central banks | 102,353 | – | – | 102,353 | 100 | – | – | 100 | ||||||||||||||||||||||||
Items in the course of collection from other banks | 1,328 | 130 | 9 | 1,467 | 91 | 9 | – | 100 | ||||||||||||||||||||||||
Trading portfolio assets: | ||||||||||||||||||||||||||||||||
Debt securities | 37,037 | 1,344 | 408 | 38,789 | 96 | 3 | 1 | 100 | ||||||||||||||||||||||||
Traded loans | 594 | 1,977 | 404 | 2,975 | 20 | 66 | 14 | 100 | ||||||||||||||||||||||||
Total trading portfolio assets | 37,631 | 3,321 | 812 | 41,764 | 90 | 8 | 2 | 100 | ||||||||||||||||||||||||
Financial assets designated at fair value: | ||||||||||||||||||||||||||||||||
Loans and advances | 9,692 | 533 | 294 | 10,519 | 92 | 5 | 3 | 100 | ||||||||||||||||||||||||
Debt securities | 59 | 11 | – | 70 | 84 | 16 | – | 100 | ||||||||||||||||||||||||
Reverse repurchase agreements | 53,151 | 9,999 | 12 | 63,162 | 84 | 16 | – | 100 | ||||||||||||||||||||||||
Other financial assets | 244 | 18 | – | 262 | 93 | 7 | – | 100 | ||||||||||||||||||||||||
Total financial assets designated at fair value | 63,146 | 10,561 | 306 | 74,013 | 85 | 14 | 1 | 100 | ||||||||||||||||||||||||
Derivative financial instruments | 330,737 | 14,963 | 926 | 346,626 | 95 | 5 | – | 100 | ||||||||||||||||||||||||
Loans and advances to banks | 39,159 | 3,830 | 262 | 43,251 | 91 | 9 | – | 100 | ||||||||||||||||||||||||
Loans and advances to customers: | ||||||||||||||||||||||||||||||||
Home loans | 136,922 | 2,589 | 5,254 | 144,765 | 95 | 1 | 4 | 100 | ||||||||||||||||||||||||
Credit cards, unsecured and other retail lending | 5,343 | 50,685 | 1,780 | 57,808 | 9 | 88 | 3 | 100 | ||||||||||||||||||||||||
Corporate loans | 140,414 | 37,170 | 12,627 | 190,211 | 74 | 19 | 7 | 100 | ||||||||||||||||||||||||
Total loans and advances to customers | 282,679 | 90,444 | 19,661 | 392,784 | 72 | 23 | 5 | 100 | ||||||||||||||||||||||||
Reverse repurchase agreements and other similar secured lending | 9,364 | 4,090 | – | 13,454 | 70 | 30 | – | 100 | ||||||||||||||||||||||||
Financial investments – debt securities | 62,842 | 30 | 7 | 62,879 | 100 | – | – | 100 | ||||||||||||||||||||||||
Other assets | 1,085 | 117 | 3 | 1,205 | 90 | 10 | – | 100 | ||||||||||||||||||||||||
Total assets | 930,324 | 127,486 | 21,986 | 1,079,796 | 86 | 12 | 2 | 100 | ||||||||||||||||||||||||
Balance sheet credit quality (audited) |
| |||||||||||||||||||||||||||||||
As at 31 December 2015 | | Strong (including investment grade) £m |
| | Satisfactory (BB+ to B) £m |
| | Higher risk (B- and below) £m |
| | Maximum exposure to credit risk £m |
| | Strong (including investment grade) % |
| | Satisfactory (BB+ to B) % |
| | Higher risk (B- and below) % |
| | Maximum exposure to credit risk % |
| ||||||||
Cash and balances at central banks | 49,711 | – | – | 49,711 | 100 | – | – | 100 | ||||||||||||||||||||||||
Items in the course of collection from other banks | 922 | 62 | 27 | 1,011 | 91 | 6 | 3 | 100 | ||||||||||||||||||||||||
Trading portfolio assets: | ||||||||||||||||||||||||||||||||
Debt securities | 43,118 | 2,217 | 241 | 45,576 | 95 | 5 | – | 100 | ||||||||||||||||||||||||
Traded loans | 329 | 1,880 | 265 | 2,474 | 13 | 76 | 11 | 100 | ||||||||||||||||||||||||
Total trading portfolio assets | 43,447 | 4,097 | 506 | 48,050 | 90 | 9 | 1 | 100 | ||||||||||||||||||||||||
Financial assets designated at fair value: | ||||||||||||||||||||||||||||||||
Loans and advances | 16,751 | 790 | 372 | 17,913 | 94 | 4 | 2 | 100 | ||||||||||||||||||||||||
Debt securities | 1,378 | 3 | 2 | 1,383 | 100 | – | – | 100 | ||||||||||||||||||||||||
Reverse repurchase agreements | 41,145 | 8,352 | 16 | 49,513 | 83 | 17 | – | 100 | ||||||||||||||||||||||||
Other financial assets | 313 | 62 | – | 375 | 83 | 17 | – | 100 | ||||||||||||||||||||||||
Total financial assets designated at fair value | 59,587 | 9,207 | 390 | 69,184 | 86 | 13 | 1 | 100 | ||||||||||||||||||||||||
Derivative financial instruments | 313,114 | 13,270 | 1,325 | 327,709 | 96 | 4 | – | 100 | ||||||||||||||||||||||||
Loans and advances to banks | 39,059 | 1,163 | 1,127 | 41,349 | 94 | 3 | 3 | 100 | ||||||||||||||||||||||||
Loans and advances to customers: | ||||||||||||||||||||||||||||||||
Home loans | 139,252 | 9,704 | 6,907 | 155,863 | 89 | 6 | 5 | 100 | ||||||||||||||||||||||||
Credit cards, unsecured and other retail lending | 12,347 | 51,294 | 4,199 | 67,840 | 18 | 76 | 6 | 100 | ||||||||||||||||||||||||
Corporate loans | 125,743 | 39,600 | 10,171 | 175,514 | 72 | 22 | 6 | 100 | ||||||||||||||||||||||||
Total loans and advances to customers | 277,342 | 100,598 | 21,277 | 399,217 | 70 | 25 | 5 | 100 | ||||||||||||||||||||||||
Reverse repurchase agreements and other similar secured lending | 23,040 | 5,147 | – | 28,187 | 82 | 18 | – | 100 | ||||||||||||||||||||||||
Financial investments – debt securities | 88,536 | 632 | 110 | 89,278 | 99 | 1 | – | 100 | ||||||||||||||||||||||||
Other assets | 1,142 | 233 | 35 | 1,410 | 81 | 17 | 2 | 100 | ||||||||||||||||||||||||
Total assets | 895,900 | 134,409 | 24,797 | 1,055,106 | 85 | 13 | 2 | 100 | ||||||||||||||||||||||||
| 122 | Barclays PLC and Barclays Bank PLC 2016 Annual Report on Form 20-F |
Analysis of the concentration of credit risk
A concentration of credit risk exists when a number of counterparties are located in a geographical region or are engaged in similar activities and have similar economic characteristics that would cause their ability to meet contractual obligations to be similarly affected by changes in economic or other conditions. The Group implements limits on concentrations in order to mitigate the risk. The analyses of credit risk concentrations presented below are based on the location of the counterparty or customer or the industry in which they are engaged. Further detail on the Group’s policies with regard to managing concentration risk is presented on page 370.
Geographic concentrations
As at 31 December 2016, the geographic concentration of the Group’s assets remained broadly consistent with 2015. Exposure is concentrated in the UK 41% (2015: 40%), in the Americas 33% (2015: 31%) and Europe 21% (2015: 20%). The decrease of £58bn in Africa and the Middle East is due to the reclassification of BAGL balances now held for sale.
Information on exposures to Eurozone countries is presented on page 124.
Credit risk concentrations by geography (audited) |
| |||||||||||||||||||||||
As at 31 December 2016 | | United Kingdom £m |
| | Europe £m |
| | Americas £m |
| | Africa and Middle East £m | | | Asia £m |
| | Total £m |
| ||||||
On-balance sheet: | ||||||||||||||||||||||||
Cash and balances at central banks | 30,485 | 40,439 | 24,859 | 77 | 6,493 | 102,353 | ||||||||||||||||||
Items in the course of collection from other banks | 969 | 498 | – | – | – | 1,467 | ||||||||||||||||||
Trading portfolio assets | 8,981 | 9,171 | 19,848 | 435 | 3,329 | 41,764 | ||||||||||||||||||
Financial assets designated at fair value | 25,821 | 10,244 | 33,181 | 733 | 4,034 | 74,013 | ||||||||||||||||||
Derivative financial instruments | 108,559 | 107,337 | 105,129 | 1,493 | 24,108 | 346,626 | ||||||||||||||||||
Loans and advances to banks | 7,458 | 12,674 | 16,894 | 1,778 | 4,447 | 43,251 | ||||||||||||||||||
Loans and advances to customers | 253,752 | 47,050 | 81,045 | 3,089 | 7,848 | 392,784 | ||||||||||||||||||
Reverse repurchase agreements and other similar secured lending | 218 | 309 | 11,439 | 92 | 1,396 | 13,454 | ||||||||||||||||||
Financial Investments - debt securities | 18,126 | 27,763 | 12,030 | 251 | 4,709 | 62,879 | ||||||||||||||||||
Other assets | 987 | – | 137 | 10 | 71 | 1,205 | ||||||||||||||||||
Totalon-balance sheet | 455,356 | �� | 255,485 | 304,562 | 7,958 | 56,435 | 1,079,796 | |||||||||||||||||
Off-balance sheet: | ||||||||||||||||||||||||
Contingent liabilities | 8,268 | 3,275 | 6,910 | 702 | 753 | 19,908 | ||||||||||||||||||
Documentary credits and other short-term trade related transactions | 915 | 9 | – | 40 | 41 | 1,005 | ||||||||||||||||||
Forward starting reverse repurchase agreements | 14 | 1 | 5 | 2 | 2 | 24 | ||||||||||||||||||
Standby facilities, credit lines and other commitments | 106,413 | 35,475 | 156,072 | 1,692 | 3,005 | 302,657 | ||||||||||||||||||
Totaloff-balance sheet | 115,610 | 38,760 | 162,987 | 2,436 | 3,801 | 323,594 | ||||||||||||||||||
Total | 570,966 | 294,245 | 467,549 | 10,394 | 60,236 | 1,403,390 | ||||||||||||||||||
Credit risk concentrations by geography (audited) |
| |||||||||||||||||||||||
As at 31 December 2015 | | United Kingdom £m |
| | Europe £m |
| | Americas £m | | | Africa and Middle East £m |
| | Asia £m |
| | Total £m |
| ||||||
On-balance sheet: | ||||||||||||||||||||||||
Cash and balances at central banks | 14,061 | 19,094 | 13,288 | 2,055 | 1,213 | 49,711 | ||||||||||||||||||
Items in the course of collection from other banks | 543 | 72 | – | 396 | – | 1,011 | ||||||||||||||||||
Trading portfolio assets | 7,150 | 10,012 | 23,641 | 2,111 | 5,136 | 48,050 | ||||||||||||||||||
Financial assets designated at fair value | 22,991 | 5,562 | 35,910 | 3,039 | 1,682 | 69,184 | ||||||||||||||||||
Derivative financial instruments | 99,658 | 103,498 | 101,592 | 3,054 | 19,907 | 327,709 | ||||||||||||||||||
Loans and advances to banks | 10,733 | 9,918 | 13,078 | 2,900 | 4,720 | 41,349 | ||||||||||||||||||
Loans and advances to customers | 239,086 | 47,372 | 69,803 | 33,461 | 9,495 | 399,217 | ||||||||||||||||||
Reverse repurchase agreements and other similar secured lending | 5,905 | 4,361 | 15,684 | 915 | 1,322 | 28,187 | ||||||||||||||||||
Financial investments - debt securities | 20,509 | 40,344 | 20,520 | 3,999 | 3,906 | 89,278 | ||||||||||||||||||
Other assets | 868 | 4 | 131 | 314 | 93 | 1,410 | ||||||||||||||||||
Totalon-balance sheet | 421,504 | 240,237 | 293,647 | 52,244 | 47,474 | 1,055,106 | ||||||||||||||||||
Off-balance sheet: | ||||||||||||||||||||||||
Contingent liabilities | 9,543 | 3,020 | 5,047 | 2,505 | 461 | 20,576 | ||||||||||||||||||
Documentary credits and other short-term trade related transactions | 594 | 58 | – | 193 | – | 845 | ||||||||||||||||||
Forward starting reverse repurchase agreements | 9 | 5 | 65 | – | 14 | 93 | ||||||||||||||||||
Standby facilities, credit lines and other commitments | 104,797 | 34,370 | 125,456 | 13,600 | 3,146 | 281,369 | ||||||||||||||||||
Totaloff-balance sheet | 114,943 | 37,453 | 130,568 | 16,298 | 3,621 | 302,883 | ||||||||||||||||||
Total | 536,447 | 277,690 | 424,215 | 68,542 | 51,095 | 1,357,989 | ||||||||||||||||||
| Barclays PLC and Barclays Bank PLC 2016 Annual Report on Form 20-F | 123 |
Risk review
Risk performance
Credit risk
Exposures to Eurozone countries
The following table shows Barclays most significant current exposure (above £4bn neton-balance sheet exposure) to Eurozone countries.
Basis of preparation
The Group presents the direct balance sheet exposure to credit and market risk by country, with the totals reflecting allowance for impairment, netting and cash collateral held where appropriate.
The net on-balance sheet exposure includes:
| § | Loans and advances held at amortised cost, net of impairment. Settlement balances and cash collateral are excluded from this analysis |
| § | Trading assets and liabilities are presented by issuer type on a net basis. Where liability positions exceed asset positions by issuer type, exposures are presented as nil |
| § | Derivative assets and liabilities are presented by counterparty type on a net basis. Cash collateral held is then added to give a net credit exposure. Where liability positions and collateral held exceed asset positions by counterparty type, exposures are presented as nil |
| § | Financial investments – debt securities principally relating to investments in government bonds and other debt securities |
| § | Other assets held for sale. Businesses held for sale with European exposures are included within the Financial institutions category |
The analysis excludes financial assets not subject to credit risk
| § | Equity securities held for trading, as financial investments or designated at fair value, and traded commodities |
| § | Reverse repurchase agreements measured at amortised cost and at fair value which are materially fully collateralised |
Gross exposure reflects total exposures before the effects of economic hedging by way of trading portfolio liabilities, derivative liabilities and cash collateral, but after taking into account impairment allowances and IFRS netting.
The Italian home loans of £9.7bn (2015: £9.5bn) are secured on residential property with average balance weighted marked to market LTVs of 61.8% (2015: 60.6%) and CRL coverage of 36% (2015: 31%). 90 days arrear and grosscharge-off rates remained stable at 1.2% (2015: 1.2%) and 0.8% (2015: 0.7%) respectively.
Net exposure by country and counterparty |
| |||||||||||||||||||||||||||||||
| | Sovereign £m |
| | Financial institutions £m |
| | Corporate £m |
| | Home loans £m |
| | Other retail lending £m |
| | Net on-balance sheet exposure £m |
| | Gross on-balance sheet exposure £m |
| | Contingent liabilities and commitments £m |
| |||||||||
As at 31 December 2016 | ||||||||||||||||||||||||||||||||
Italy | 2,668 | 299 | 763 | 9,741 | 331 | 13,802 | 18,580 | 2,835 | ||||||||||||||||||||||||
Germany | 5,250 | 3,399 | 1,379 | 8 | 2,967 | 13,003 | 47,964 | 13,362 | ||||||||||||||||||||||||
France | 3,708 | 6,886 | 1,160 | 736 | 139 | 12,629 | 41,056 | 6,565 | ||||||||||||||||||||||||
Ireland | 6 | 2,230 | 1,855 | 30 | 9 | 4,130 | 6,474 | 2,735 | ||||||||||||||||||||||||
Total | 11,632 | 12,814 | 5,157 | 10,515 | 3,446 | 43,564 | 114,074 | 25,497 | ||||||||||||||||||||||||
As at 31 December 2015 | ||||||||||||||||||||||||||||||||
Italy | 1,708 | 2,283 | 1,039 | 9,505 | 675 | 15,210 | 20,586 | 2,701 | ||||||||||||||||||||||||
Germany | 7,494 | 3,621 | 1,602 | 9 | 2,313 | 15,039 | 50,930 | 8,029 | ||||||||||||||||||||||||
France | 7,426 | 4,967 | 805 | 1,472 | 152 | 14,822 | 43,427 | 7,436 | ||||||||||||||||||||||||
Ireland | 9 | 2,824 | 1,282 | 37 | 51 | 4,203 | 7,454 | 2,673 | ||||||||||||||||||||||||
Total | 16,637 | 13,695 | 4,728 | 11,023 | 3,191 | 49,274 | 122,397 | 20,839 | ||||||||||||||||||||||||
| 124 | Barclays PLC and Barclays Bank PLC 2016 Annual Report on Form 20-F |
Industry concentrations
The concentration of the Group’s assets by industry remained broadly consistent year on year. As at 31 December 2016, total assets concentrated towards banks and other financial institutions was 43% (2015: 42%), predominantly within derivative financial instruments. The proportion of the overall balance concentrated towards governments and central banks remained stable at 14% (2015: 12%) and home loans at 11% (2015: 12%).
Credit risk concentrations by industry (audited) |
| |||||||||||||||||||||||||||||||||||||||||||||||
As at 31 December 2016 | | Banks £m |
| | Other financial insti- tutions £m |
| | Manu- facturing £m |
| | Const- ruction and property £m |
| | Govern- ment and central bank £m |
| | Energy and water £m |
| | Wholesale and retail distribu- tion and leisure £m |
| | Business and other services £m | | | Home loans £m |
| | Cards, unsecured loans and other personal lending £m |
| | Other £m |
| | Total £m |
| ||||||||||||
On-balance sheet: | ||||||||||||||||||||||||||||||||||||||||||||||||
Cash and balances at central banks | – | – | – | – | 102,353 | – | – | – | – | – | – | 102,353 | ||||||||||||||||||||||||||||||||||||
Items in the course of collection from other banks | 1,467 | – | – | – | – | – | – | – | – | – | – | 1,467 | ||||||||||||||||||||||||||||||||||||
Trading portfolio assets | 2,231 | 7,998 | 1,625 | 565 | 21,047 | 3,733 | 324 | 2,972 | 257 | – | 1,012 | 41,764 | ||||||||||||||||||||||||||||||||||||
Financial assets designated at fair value | 14,714 | 49,783 | 3 | 5,699 | 856 | 5 | 33 | 2,811 | 33 | 2 | 74 | 74,013 | ||||||||||||||||||||||||||||||||||||
Derivative financial instruments | 182,664 | 139,066 | 2,913 | 3,488 | 6,547 | 4,585 | 810 | 3,392 | – | – | 3,161 | 346,626 | ||||||||||||||||||||||||||||||||||||
Loans and advances to banks | 38,932 | – | – | – | 4,319 | – | – | – | – | – | – | 43,251 | ||||||||||||||||||||||||||||||||||||
Loans and advances to customers | – | 91,812 | 12,337 | 24,200 | 12,028 | 7,384 | 12,967 | 21,838 | 144,765 | 56,730 | 8,723 | 392,784 | ||||||||||||||||||||||||||||||||||||
Reverse repurchase agreements and other similar secured lending | 2,596 | 10,568 | – | 38 | 252 | – | – | – | – | – | – | 13,454 | ||||||||||||||||||||||||||||||||||||
Financial investments - debt securities | 12,842 | 4,877 | – | – | 44,263 | – | 43 | 807 | – | – | 47 | 62,879 | ||||||||||||||||||||||||||||||||||||
Other assets | 975 | 205 | – | – | 25 | – | – | – | – | – | – | 1,205 | ||||||||||||||||||||||||||||||||||||
Totalon-balance sheet | 256,421 | 304,309 | 16,878 | 33,990 | 191,690 | 15,707 | 14,177 | 31,820 | 145,055 | 56,732 | 13,017 | 1,079,796 | ||||||||||||||||||||||||||||||||||||
Off-balance sheet: | ||||||||||||||||||||||||||||||||||||||||||||||||
Contingent liabilities | 1,484 | 4,232 | 3,387 | 707 | 8 | 2,649 | 1,032 | 4,847 | 40 | 531 | 991 | 19,908 | ||||||||||||||||||||||||||||||||||||
Documentary credits and other short-term trade related transactions | 433 | – | 377 | – | – | – | 157 | 38 | – | – | – | 1,005 | ||||||||||||||||||||||||||||||||||||
Forward starting reverse repurchase agreements | 5 | 19 | – | – | – | – | – | – | – | – | – | 24 | ||||||||||||||||||||||||||||||||||||
Standby facilities, credit lines and other commitments | 1,016 | 29,310 | 38,829 | 11,876 | 400 | 29,699 | 14,741 | 26,359 | 9,610 | 126,708 | 14,109 | 302,657 | ||||||||||||||||||||||||||||||||||||
Totaloff-balance sheet | 2,938 | 33,561 | 42,593 | 12,583 | 408 | 32,348 | 15,930 | 31,244 | 9,650 | 127,239 | 15,100 | 323,594 | ||||||||||||||||||||||||||||||||||||
Total | 259,359 | 337,870 | 59,471 | 46,573 | 192,098 | 48,055 | 30,107 | 63,064 | 154,705 | 183,971 | 28,117 | 1,403,390 | ||||||||||||||||||||||||||||||||||||
Other risks being monitored include exposures to the oil and gas sector. Neton-balance sheet exposure to the oil and gas sector was £4.2bn (2015: £4.4bn), with contingent liabilities and commitments to this sector of £16.0bn (2015: £13.8bn). Impairment charges were £94m (2015: £106m). The ratio of the Group’s net total exposures classified as strong or satisfactory was 93% (2015: 97%) of the total net exposure to credit risk to this sector.
| Barclays PLC and Barclays Bank PLC 2016 Annual Report on Form 20-F | 125 |
Risk review
Risk performance
Credit risk
Credit risk concentrations by industry (audited) |
| |||||||||||||||||||||||||||||||||||||||||||||||
As at 31 December 2015 |
| Banks £m |
|
| Other financial insti- tutions £m |
|
| Manu- facturing £m |
|
| Const- ruction and property £m |
|
| Govern- ment and central bank £m |
|
| Energy and water £m |
|
| Wholesale and retail distribu- tion and leisure £m |
|
| Business and other services £m |
|
| Home loans £m |
|
| Cards, unsecured loans and other personal lending £m |
|
| Other £m |
|
| Total £m |
| ||||||||||||
On-balance sheet: | ||||||||||||||||||||||||||||||||||||||||||||||||
Cash and balances at central banks | – | – | – | – | 49,711 | – | – | – | – | – | – | 49,711 | ||||||||||||||||||||||||||||||||||||
Items in the course of collection from other banks | 1,011 | – | – | – | – | – | – | – | – | – | – | 1,011 | ||||||||||||||||||||||||||||||||||||
Trading portfolio assets | 1,897 | 11,826 | 970 | 538 | 25,797 | 2,554 | 315 | 2,727 | 550 | – | 876 | 48,050 | ||||||||||||||||||||||||||||||||||||
Financial assets designated at fair value | 14,015 | 35,109 | 104 | 8,642 | 7,380 | 33 | 191 | 3,402 | 229 | – | 79 | 69,184 | ||||||||||||||||||||||||||||||||||||
Derivative financial instruments | 185,782 | 114,727 | 2,701 | 2,940 | 6,113 | 4,538 | 1,063 | 5,346 | – | – | 4,499 | 327,709 | ||||||||||||||||||||||||||||||||||||
Loans and advances to banks | 36,829 | – | – | – | 4,520 | – | – | – | – | – | – | 41,349 | ||||||||||||||||||||||||||||||||||||
Loans and advances to customers | – | 80,729 | 12,297 | 23,519 | 5,940 | 7,743 | 13,830 | 25,728 | 155,863 | 60,162 | 13,406 | 399,217 | ||||||||||||||||||||||||||||||||||||
Reverse repurchase agreements and other similar secured lending | 8,676 | 18,022 | – | 1,011 | 305 | – | 35 | 138 | – | – | – | 28,187 | ||||||||||||||||||||||||||||||||||||
Financial investments - debt securities | 9,745 | 6,114 | 68 | 43 | 67,645 | 182 | 107 | 5,134 | – | – | 240 | 89,278 | ||||||||||||||||||||||||||||||||||||
Other assets | 312 | 1,077 | – | – | 20 | – | – | – | – | – | 1 | 1,410 | ||||||||||||||||||||||||||||||||||||
Totalon-balance sheet | 258,267 | 267,604 | 16,140 | 36,693 | 167,431 | 15,050 | 15,541 | 42,475 | 156,642 | 60,162 | 19,101 | 1,055,106 | ||||||||||||||||||||||||||||||||||||
Off-balance sheet: | ||||||||||||||||||||||||||||||||||||||||||||||||
Contingent liabilities | 1,152 | 4,698 | 3,142 | 958 | 9 | 3,073 | 1,301 | 4,645 | 100 | 548 | 950 | 20,576 | ||||||||||||||||||||||||||||||||||||
Documentary credits and other short-term trade related transactions | 378 | 17 | 142 | 1 | – | 3 | 129 | 50 | – | 123 | 2 | 845 | ||||||||||||||||||||||||||||||||||||
Forward starting reverse repurchase agreements | 78 | 15 | – | – | – | – | – | – | – | – | – | 93 | ||||||||||||||||||||||||||||||||||||
Standby facilities, credit lines and other commitments | 946 | 31,152 | 35,865 | 11,337 | 871 | 26,217 | 15,054 | 23,180 | 11,708 | 111,988 | 13,051 | 281,369 | ||||||||||||||||||||||||||||||||||||
Totaloff-balance sheet | 2,554 | 35,882 | 39,149 | 12,296 | 880 | 29,293 | 16,484 | 27,875 | 11,808 | 112,659 | 14,003 | 302,883 | ||||||||||||||||||||||||||||||||||||
Total | 260,821 | 303,486 | 55,289 | 48,989 | 168,311 | 44,343 | 32,025 | 70,350 | 168,450 | 172,821 | 33,104 | 1,357,989 | ||||||||||||||||||||||||||||||||||||
| 126 | Barclays PLC and Barclays Bank PLC 2016 Annual Report on Form 20-F |
As the principal source of credit risk to the Group, loans and advances to customers and banks is analysed in detail below:
Analysis of loans and advances and impairment to customers and banks |
| |||||||||||||||||||||||||||
As at 31 December 2016 | | Gross L&A £m |
| | Impairment allowance £m |
| | L&A net of impairment £m |
| | Credit risk loans £m |
| | CRLs % of gross L&A % |
| | Loan impairment chargesa £m |
| | Loan loss rates bps |
| |||||||
Barclays UK | 155,729 | 1,519 | 154,210 | 2,044 | 1.3 | 866 | 56 | |||||||||||||||||||||
Barclays International | 33,485 | 1,492 | 31,993 | 1,249 | 3.7 | 1,085 | 324 | |||||||||||||||||||||
Barclays Core | 189,214 | 3,011 | 186,203 | 3,293 | 1.7 | 1,951 | 103 | |||||||||||||||||||||
BarclaysNon-Core | 10,319 | 385 | 9,934 | 838 | 8.1 | 102 | 99 | |||||||||||||||||||||
Total Group retail | 199,533 | 3,396 | 196,137 | 4,131 | 2.1 | 2,053 | 103 | |||||||||||||||||||||
Barclays UK | 15,204 | 282 | 14,922 | 591 | 3.9 | 30 | 20 | |||||||||||||||||||||
Barclays International | 180,102 | 748 | 179,354 | 1,470 | 0.8 | 258 | 14 | |||||||||||||||||||||
Barclays Core | 199,716 | 1,030 | 198,686 | 2,061 | 1.0 | 288 | 14 | |||||||||||||||||||||
BarclaysNon-Core | 41,406 | 194 | 41,212 | 299 | 0.7 | 11 | 3 | |||||||||||||||||||||
Total Group wholesale | 241,122 | 1,224 | 239,898 | 2,360 | 1.0 | 299 | 12 | |||||||||||||||||||||
Total loans and advances at amortised cost | 440,655 | 4,620 | 436,035 | 6,491 | 1.5 | 2,352 | 53 | |||||||||||||||||||||
Traded loans | 2,975 | n/a | 2,975 | n/a | ||||||||||||||||||||||||
Loans and advances designated at fair value | 10,519 | n/a | 10,519 | n/a | ||||||||||||||||||||||||
Loans and advances held at fair value | 13,494 | n/a | 13,494 | n/a | ||||||||||||||||||||||||
Total loans and advances | 454,149 | 4,620 | 449,529 | 6,491 | ||||||||||||||||||||||||
As at 31 December 2015 | ||||||||||||||||||||||||||||
Barclays UK | 153,539 | 1,556 | 151,983 | 2,238 | 1.5 | 682 | 44 | |||||||||||||||||||||
Barclays International | 26,041 | 896 | 25,145 | 863 | 3.3 | 714 | 274 | |||||||||||||||||||||
Head Office | – | – | – | – | – | – | – | |||||||||||||||||||||
Barclays Core | 179,580 | 2,452 | 177,128 | 3,101 | 1.7 | 1,396 | 78 | |||||||||||||||||||||
BarclaysNon-Core | 12,588 | 465 | 12,123 | 936 | 7.4 | 139 | 110 | |||||||||||||||||||||
Total Group retail | 192,168 | 2,917 | 189,251 | 4,037 | 2.1 | 1,535 | 80 | |||||||||||||||||||||
Barclays UK | 16,400 | 312 | 16,088 | 636 | 3.9 | 24 | 15 | |||||||||||||||||||||
Barclays International | 159,776 | 617 | 159,159 | 1,331 | 0.8 | 201 | 13 | |||||||||||||||||||||
Head Office | 5,767 | – | 5,767 | – | – | – | – | |||||||||||||||||||||
Barclays Core | 181,943 | 929 | 181,014 | 1,967 | 1.1 | 225 | 12 | |||||||||||||||||||||
BarclaysNon-Core | 39,979 | 336 | 39,643 | 441 | 1.1 | (16 | ) | (4 | ) | |||||||||||||||||||
Total Group wholesale | 221,922 | 1,265 | 220,657 | 2,408 | 1.1 | 209 | 9 | |||||||||||||||||||||
Total loans and advances at amortised costb | 414,090 | 4,182 | 409,908 | 6,445 | 1.6 | 1,744 | 42 | |||||||||||||||||||||
BAGL loans and advances at amortised cost | 31,397 | 739 | 30,658 | 1,372 | ||||||||||||||||||||||||
Traded loans | 2,474 | n/a | 2,474 | n/a | ||||||||||||||||||||||||
Loans and advances designated at fair value | 17,913 | n/a | 17,913 | n/a | ||||||||||||||||||||||||
Loans and advances held at fair value | 20,387 | n/a | 20,387 | n/a | ||||||||||||||||||||||||
Total loans and advances | 465,874 | 4,921 | 460,953 | 7,817 | ||||||||||||||||||||||||
Total loans and advances decreased by £11.4bn to £449.5bn driven by a £31bn decrease due to the reclassification of BAGL balances to held for sale and £9bn from the exit of other assets inNon-Core. This was offset by lending of £20bn driven by volume growth and foreign currency movements due to the appreciation of average US Dollar and Euro against Sterling. There was also a net £9bn increase in settlement and cash collateral balances.
Credit risk loans (CRLs) and the ratio of CRLs to gross loans and advances excluding BAGL balances now held for sale remained stable at £6.5bn (2015: £6.4bn) and 1.5% (2015: 1.6%) respectively.
Loan impairment charges increased £0.6bn to £2.4bn primarily due to increased charges following the management review of impairment modelling for UK and US cards portfolios and the impairment of a number of single name exposures. Overall, this resulted in an 11bps increase in the loan loss rate to 53bps.
Notes
| a | Excluding impairment charges on available for sale investments and reverse repurchase agreements. |
| b | Excluding BAGL balances now held for sale. |
| Barclays PLC and Barclays Bank PLC 2016 Annual Report on Form 20-F | 127 |
Risk review
Risk performance
Credit risk
Analysis of specific portfolios and asset types
This section provides an analysis of principal portfolios and businesses in the retail and wholesale segments. In particular, home loans, credit cards, overdrafts and unsecured loans are covered for retail segments. In addition, this section details exposures to UK commercial real estate.
Secured home loans
The UK home loans portfolio comprises first lien home loans and accounts for 98%a (2015: 98%) of the Group’s Core home loan balances and 91% (2015: 90%) of the Group’s total home loan balances. Italy home loans accounts for 100% (2015: 91%) of the Group’sNon-Core home loan balances and 7% (2015: 7%) of the Group’s total home loan balances.
Home loans principal portfoliosb |
| |||||||
| Barclays UK | ||||||||
As at 31 December | 2016 | 2015 | ||||||
Gross loans and advances (£m) | 129,136 | 127,750 | ||||||
>90 day arrears, excluding recovery book (%) | 0.2 | 0.2 | ||||||
Non-performing proportion of outstanding balances (%) | 0.6 | 0.7 | ||||||
Annualised grosscharge-off rates (%) | 0.3 | 0.3 | ||||||
Recovery book proportion of outstanding balances (%) | 0.4 | 0.4 | ||||||
Recovery book impairment coverage ratio (%) | 9.1 | 10.1 | ||||||
Barclays UK: Portfolio performance remained steady reflecting the continuing low base rate environment, house price appreciation and steady economic conditions.Non-performing proportion of outstanding balances and recovery book impairment coverage reduced due to a reduction in repossession stock.
Within the UK home loans portfolio:
| § | owner-occupied interest-only home loans comprised 31% (2015: 32%) of total balances. The average balance weighted LTV on these loans reduced to 41.7% (2015: 44.7%) as house prices have improved across core regions, and >90 day arrears excluding recovery book remained steady at 0.2% (2015: 0.2%) |
| § | buy-to-let home loans comprised 9% (2015: 9%) of total balances. The average balance weighted LTV reduced to 52.6% (2015: 54.6%), and >90 day arrears excluding recovery book reduced to 0.1% (2015: 0.2%). |
Home loans principal portfolios – distribution of balances by LTVc |
| |||||||||||||||||||||||||||||||||||||||||||||||
| | Distribution of balances | | | Impairment coverage ratio |
| | Non-performing proportion of outstanding balances | | | Non-performing balances impairment coverage ratio | | | Recovery book proportion of outstanding balances | | | Recovery book impairment coverage ratio | | |||||||||||||||||||||||||||||||
As at 31 December | | 2016 % |
| | 2015 % |
| | 2016 % |
| | 2015 % |
| | 2016 % |
| | 2015 % |
| | 2016 % |
| | 2015 % |
| | 2016 % |
| | 2015 % |
| | 2016 % |
| | 2015 % |
| ||||||||||||
Barclays UK | ||||||||||||||||||||||||||||||||||||||||||||||||
<=75% | 91.8 | 92.1 | 0.1 | 0.1 | 0.6 | 0.6 | 4.2 | 4.7 | 0.4 | 0.4 | 5.9 | 6.8 | ||||||||||||||||||||||||||||||||||||
>75% and <=80% | 3.5 | 3.4 | 0.2 | 0.2 | 0.6 | 1.0 | 17.1 | 13.5 | 0.4 | 0.8 | 22.1 | 15.7 | ||||||||||||||||||||||||||||||||||||
>80% and <=85% | 2.1 | 2.1 | 0.2 | 0.3 | 0.8 | 1.0 | 20.4 | 16.7 | 0.6 | 0.7 | 25.0 | 21.4 | ||||||||||||||||||||||||||||||||||||
>85% and <=90% | 1.3 | 1.4 | 0.3 | 0.3 | 0.7 | 1.3 | 23.0 | 15.7 | 0.6 | 1.0 | 25.4 | 17.8 | ||||||||||||||||||||||||||||||||||||
>90% and <=95% | 0.8 | 0.6 | 0.4 | 0.6 | 1.1 | 1.8 | 28.3 | 25.7 | 0.8 | 1.5 | 33.7 | 28.2 | ||||||||||||||||||||||||||||||||||||
>95% and <=100% | 0.3 | 0.2 | 0.7 | 1.3 | 1.9 | 4.0 | 23.4 | 25.4 | 1.5 | 3.5 | 27.0 | 27.9 | ||||||||||||||||||||||||||||||||||||
>100% | 0.2 | 0.2 | 3.1 | 3.4 | 5.7 | 7.0 | 38.6 | 35.6 | 5.0 | 5.6 | 40.9 | 41.2 | ||||||||||||||||||||||||||||||||||||
Home loans principal portfolios – Average LTV | ||||||||
| Barclays UK | ||||||||
As at 31 December | 2016 | 2015 | ||||||
Portfolio marked to market LTV (%): | ||||||||
Balance weighted | 47.7 | 49.2 | ||||||
Valuation weighted | 35.6 | 37.3 | ||||||
Performing balances (%): | ||||||||
Balance weighted | 47.3 | 48.8 | ||||||
Valuation weighted | 35.5 | 37.3 | ||||||
Non-performing balances (%): | ||||||||
Balance weighted | 52.5 | 56.5 | ||||||
Valuation weighted | 41.7 | 45.1 | ||||||
For >100% LTVs: | ||||||||
Balances (£m) | 239 | 310 | ||||||
Marked to market collateral (£m) | 210 | 260 | ||||||
Average LTV: balance weighted (%) | 118.4 | 123.0 | ||||||
Average LTV: valuation weighted (%) | 113.1 | 118.5 | ||||||
% of balances in recovery book | 5.0 | 5.6 | ||||||
Notes
| a | Remaining balance includes Wealth portfolio. |
| b | Gross loans and advances include loans and advances to customers and banks. Risk metrics based on exposures to customers only. |
| c | Portfolio marked to market based on the most updated valuation including recovery book balances. Updated valuations reflect the application of the latest house price index available in the country as at 31 December 2016. |
| 128 | Barclays PLC and Barclays Bank PLC 2016 Annual Report on Form 20-F |
Balance weighted LTV in the UK reduced to 47.7% (2015: 49.2%) due to an increase in average house prices across core regions.
The house price appreciation resulted in a 23% reduction in home loans that have LTV >100% to £239m (2015: £310m).
Home loans principal portfolios – new lending | ||||||||
| Barclays UK | ||||||||
As at 31 December | 2016 | 2015 | ||||||
New home loan bookings (£m) | 19,885 | 18,812 | ||||||
New home loans proportion above 85% LTV (%) | 8.6 | 8.2 | ||||||
Average LTV on new home loans: balance weighted (%) | 63.4 | 63.9 | ||||||
Average LTV on new home loans: valuation weighted (%) | 54.4 | 55.0 | ||||||
Barclays UK:New lending in 2016 increased by 6%, reflecting a steady risk profile against the backdrop of heightened market activity. Average balance weighted LTV on new lending remained broadly stable at 63.4% (2015: 63.9%).
Credit cards and unsecured loans
The principal portfolios listed below accounted for 94% (2015: 92%) of the Group’s total credit cards and unsecured loans.
Credit cards and unsecured loans principal portfolios |
| |||||||||||||||||||||||
| | Gross loans and advances £m | a
| | 30 day arrears, excluding recovery book % |
| | 90 day arrears, excluding recovery book % |
| | Annualised gross charge-off rates % |
| | Recovery book proportion of outstanding balances % |
| | Recovery book impairment coverage ratio % |
| |||||||
As at 31 December 2016 | ||||||||||||||||||||||||
Barclays UK | ||||||||||||||||||||||||
UK cardsb | 17,833 | 1.9 | 0.9 | 5.5 | 3.0 | 83.8 | ||||||||||||||||||
UK personal loans | 6,076 | 2.1 | 0.9 | 3.1 | 4.7 | 77.2 | ||||||||||||||||||
Barclays International | ||||||||||||||||||||||||
US cardsb | 23,915 | 2.6 | 1.3 | 4.5 | 2.4 | 83.6 | ||||||||||||||||||
Barclays Partner Finance | 4,041 | 1.5 | 0.6 | 2.5 | 2.6 | 81.5 | ||||||||||||||||||
Germany cards | 1,812 | 2.6 | 1.0 | 3.7 | 2.7 | 79.0 | ||||||||||||||||||
As at 31 December 2015 | ||||||||||||||||||||||||
Barclays UK | ||||||||||||||||||||||||
UK cardsb | 18,502 | 2.3 | 1.2 | 5.2 | 3.6 | 82.6 | ||||||||||||||||||
UK personal loans | 5,476 | 1.9 | 0.8 | 3.0 | 7.5 | 73.9 | ||||||||||||||||||
Barclays International | ||||||||||||||||||||||||
US cardsb | 16,699 | 2.2 | 1.1 | 3.9 | 2.0 | 84.8 | ||||||||||||||||||
Barclays Partner Financec | 3,986 | 1.5 | 0.6 | 2.4 | 2.5 | 82.2 | ||||||||||||||||||
Germany cards | 1,419 | 2.3 | 1.0 | 3.8 | 2.7 | 81.2 | ||||||||||||||||||
UK cards:Gross loans and advances decreased 4% to £17.8bn primarily due to reduced loans and advances to banks. Annualised grosscharge-off rates increased due to accelerated asset sales in the latter half of the year and acceleratedcharge-off of informal arrangements stock. The recovery book impairment coverage ratio increased reflecting the impact of increased flow intocharge-off.
UK personal loans:30 day arrears increased to 2.1% (2015: 1.9%) and 90 day arrears increased to 0.9% (2015: 0.8%) partially driven by portfolio growth and an increased level of operational delinquency from new customer acquisitions. The recovery book proportion of outstanding balances reduced to 4.7% (2015: 7.5%) due to an asset sale that also resulted in an increase in the recovery book impairment coverage ratio to 77.2% (2015: 73.9%).
US cards:Gross loans and advances increased 43% to £23.9bn due to portfolio growth, new acquisitions and appreciation of USD against GBP. Increased arrears andcharge-off rate were driven by a change in portfolio mix, volume growth and the appreciation of average USD against GBP.
Barclays Partner Finance:Portfolio arrears andcharge-off rates remained broadly steady during 2016.
Germany cards:Loans and advances were 28% higher mainly due to a combination of the appreciation of EUR against GBP and portfolio growth. 90 day arrears and charge off rates remained stable, while the recovery book coverage ratio reduced slightly reflecting favourable recovery expectations.
Notes
| a | Gross loans and advances include loans and advances to customers and banks. Risk metrics based on exposures to customers. |
| b | For UK and US cards, outstanding recovery book balances for acquired portfolios recognised at fair value (which have no related impairment allowance) have been excluded from the recovery book impairment coverage ratio. Losses have been recognised where related to additional spend from acquired accounts in the period post acquisition. |
| c | 2015 figures for recovery book coverage ratio restated from 85.2% to 82.2% to reflect more granular allocation of management adjustments to the recovery book. |
| Barclays PLC and Barclays Bank PLC 2016 Annual Report on Form 20-F | 129 |
Risk review
Risk performance
Credit risk
Wholesale loans and advances at amortised cost
Analysis of wholesale loans and advances at amortised cost |
| |||||||||||||||||||||||||||
| | Gross L&A £m |
| | Impairment allowance £m |
| | L&A net of impairment £m |
| | Credit risk loans £m |
| | CRLs % of gross L&A % |
| | Loan impairment charges £m |
| | Loan loss rates bps |
| ||||||||
As at 31 December 2016 | ||||||||||||||||||||||||||||
Banks | 35,979 | – | 35,979 | – | – | – | – | |||||||||||||||||||||
Other financial institutions | 91,673 | 14 | 91,659 | 89 | 0.1 | 6 | 1 | |||||||||||||||||||||
Manufacturing | 12,373 | 130 | 12,243 | 226 | 1.8 | 37 | 30 | |||||||||||||||||||||
Construction | 3,418 | 40 | 3,378 | 58 | 1.7 | 5 | 15 | |||||||||||||||||||||
Property | 20,541 | 137 | 20,404 | 464 | 2.3 | 27 | 13 | |||||||||||||||||||||
Government and central bank | 15,847 | – | 15,847 | – | – | – | – | |||||||||||||||||||||
Energy and water | 7,569 | 181 | 7,388 | 348 | 4.6 | 102 | 135 | |||||||||||||||||||||
Wholesale and retail distribution and leisure | 12,995 | 169 | 12,826 | 258 | 2.0 | 38 | 29 | |||||||||||||||||||||
Business and other services | 21,210 | 284 | 20,926 | 331 | 1.6 | 54 | 25 | |||||||||||||||||||||
Home loansa | 5,497 | 48 | 5,449 | 190 | 3.5 | 9 | 16 | |||||||||||||||||||||
Cards, unsecured loans and other personal lendinga | 5,329 | 129 | 5,200 | 207 | 3.9 | 6 | 11 | |||||||||||||||||||||
Other | 8,691 | 92 | 8,599 | 189 | 2.2 | 15 | 17 | |||||||||||||||||||||
Total wholesale loans and advances at amortised cost | 241,122 | 1,224 | 239,898 | 2,360 | 1.0 | 299 | 12 | |||||||||||||||||||||
As at 31 December 2015 | ||||||||||||||||||||||||||||
Banks | 32,824 | – | 32,824 | – | – | – | – | |||||||||||||||||||||
Other financial institutions | 78,766 | 28 | 78,738 | 63 | 0.1 | 4 | 1 | |||||||||||||||||||||
Manufacturing | 10,107 | 114 | 9,993 | 183 | 1.8 | 17 | 17 | |||||||||||||||||||||
Construction | 3,358 | 44 | 3,314 | 54 | 1.6 | 4 | 12 | |||||||||||||||||||||
Property | 18,444 | 217 | 18,227 | 713 | 3.9 | 34 | 18 | |||||||||||||||||||||
Government and central bank | 9,686 | – | 9,686 | – | – | – | – | |||||||||||||||||||||
Energy and water | 7,370 | 120 | 7,250 | 296 | 4.0 | 101 | 137 | |||||||||||||||||||||
Wholesale and retail distribution and leisure | 12,542 | 195 | 12,347 | 287 | 2.3 | 7 | 6 | |||||||||||||||||||||
Business and other services | 23,403 | 261 | 23,142 | 341 | 1.5 | 23 | 10 | |||||||||||||||||||||
Home loansa | 5,769 | 26 | 5,743 | 159 | 2.8 | – | – | |||||||||||||||||||||
Cards, unsecured loans and other personal lendinga | 8,894 | 107 | 8,787 | 166 | 1.9 | 2 | 2 | |||||||||||||||||||||
Other | 10,759 | 153 | 10,606 | 146 | 1.4 | 17 | 16 | |||||||||||||||||||||
Total wholesale loans and advances at amortised cost | 221,922 | 1,265 | 220,657 | 2,408 | 1.1 | 209 | 9 | |||||||||||||||||||||
BAGL loans and advances at amortised cost | 13,985 | 200 | 13,785 | 513 | 3.7 | |||||||||||||||||||||||
Total wholesale loans and advances at amortised cost | 235,907 | 1,465 | 234,442 | 2,921 | 1.2 | |||||||||||||||||||||||
Excluding BAGL balances:
| § | Wholesale loans and advances increased by £19bn to £241bn (2015: £222bn) due to increased lending of £11bn driven by volume growth and foreign currency movements due to the appreciation of average US Dollar and Euro against Sterling, £8bn due to the reclassification of ESHLA loans now recognised at amortised cost and a net £9bn increase in settlement and cash collateral balances, offset by £9bn from the exit of assets inNon-Core. |
| § | CRLs remained stable at £2.4bn (2015: £2.4bn). |
| § | Loan impairment charges increased to £299m (2015: £209m) from a number of single name exposures. The loan loss rates increased to 12bps (2015: 9bps). |
Note
| a | Included in the above analysis are Wealth and Private Banking exposures measured on an individual customer exposure basis. |
| 130 | Barclays PLC and Barclays Bank PLC 2016 Annual Report on Form 20-F |
Exposure to UK commercial real estate (CRE)
The UK CRE portfolio includes property investment, development, trading and house builders but excludes social housing and contractors.
UK CRE summarya | ||||||||
As at 31 December | 2016 | 2015 | ||||||
UK CRE loans and advances (£m) | 11,227 | 10,690 | ||||||
Past due balances (£m) | 83 | 152 | ||||||
Balances past due as % of UK CRE balances (%) | 0.7 | 1.4 | ||||||
Impairment allowances (£m) | 58 | 79 | ||||||
Past due coverage ratio (%) | 69.9 | 52.0 | ||||||
Total collateral (£m) | 23,225 | 21,858 | ||||||
Twelve months ended 31 December | ||||||||
Impairment (credit)/charge (£m) | (2) | 3 | ||||||
Maturity analysis of exposure to UK CRE | ||||||||||||||||||||||||||||||||
| Contractual maturity of UK CRE loans and advances at amortised cost | ||||||||||||||||||||||||||||||||
As at 31 December | | Past due balances £m |
| | Not more than six months £m |
| | Over six months but not more than one year £m |
| | Over one year but not more than two years £m |
| | Over two years but not more than five years £m |
| | Over five years but not more than ten years £m |
| | Over ten years £m |
| | Total loans and advances £m |
| ||||||||
2016 | 83 | 774 | 668 | 1,200 | 6,318 | 700 | 1,484 | 11,227 | ||||||||||||||||||||||||
2015 | 152 | 784 | 744 | 929 | 5,678 | 852 | 1,551 | 10,690 | ||||||||||||||||||||||||
Total exposure to UK commercial real estate following the 2015 restatement rose moderately from £10.7bn to £11.2bn primarily in medium-term deals. Past due balances fell to £83m from £152m due to favourable recovery activity and a selective approach to new deals in this sector.
UK CRE LTV analysis | ||||||||||||||||
| Balances | | Balances as proportion of total |
| |||||||||||||
As at 31 December | | 2016 £m | | | 2015 £m | | | 2016 £m | | | 2015 £m | | ||||
Group | ||||||||||||||||
<=75% | 7,884 | 7,208 | 70 | 68 | ||||||||||||
>75% and <=100% | 102 | 244 | 1 | 2 | ||||||||||||
>100% and <=125% | 15 | 109 | – | 1 | ||||||||||||
>125% | 60 | 18 | 1 | – | ||||||||||||
Unassessed balancesb | 2,286 | 2,370 | 20 | 22 | ||||||||||||
Unsecured balancesc | 880 | 741 | 8 | 7 | ||||||||||||
Total | 11,227 | 10,690 | 100 | 100 | ||||||||||||
Notes
| a | Based on the most recent valuation assessment, 2015 year end numbers have been restated following closer alignment of industry classifications between corporate banking and business lending. |
| b | Corporate Banking balances under £1m. |
| c | Unsecured balances primarily relate to working capital facilities agreed to CRE companies. |
| Barclays PLC and Barclays Bank PLC 2016 Annual Report on Form 20-F | 131 |
Risk review
Risk performance
Credit risk
Analysis of problem loans
Loans that are past due or assessed as impaired within this section are reflected in the balance sheet credit quality tables on page 122 as being Higher Risk.
Age analysis of loans and advances that are past due but not impaired (audited)
The following table presents an age analysis of loans and advances that are past due but not impaired. Loans that are past due but not impaired consist predominantly of wholesale loans that are past due but individually assessed as not being impaired. These loans although individually assessed as unimpaired, may carry an unidentified impairment provision.
| Loans and advances past due but not impaired (audited) | ||||||||||||||||||||||||
| | Past due up to 1 month £m |
| | Past due 1-2 months £m |
| | Past due 2-3 months £m |
| | Past due 3-6 months £m |
| | Past due 6 months and over £m | | | Total £m |
| |||||||
As at 31 December 2016 | ||||||||||||||||||||||||
Loans and advances designated at fair value | 29 | 8 | 18 | – | 16 | 71 | ||||||||||||||||||
Home loans | 1 | – | – | 33 | 31 | 65 | ||||||||||||||||||
Credit cards, unsecured and other retail lending | 2 | – | 2 | 11 | 77 | 92 | ||||||||||||||||||
Corporate loans | 6,962 | 1,235 | 149 | 178 | 354 | 8,878 | ||||||||||||||||||
Total | 6,994 | 1,243 | 169 | 222 | 478 | 9,106 | ||||||||||||||||||
As at 31 December 2015 | ||||||||||||||||||||||||
Loans and advances designated at fair value | 70 | 14 | – | – | 209 | 293 | ||||||||||||||||||
Home loans | 22 | 8 | 6 | 24 | 80 | 140 | ||||||||||||||||||
Credit cards, unsecured and other retail lending | 288 | 14 | 15 | �� | 93 | 120 | 530 | |||||||||||||||||
Corporate loans | 5,862 | 897 | 207 | 226 | 280 | 7,472 | ||||||||||||||||||
Total | 6,242 | 933 | 228 | 343 | 689 | 8,435 | ||||||||||||||||||
Corporate loans past due up to 1 month increased £1.1bn to £7.0bn primarily driven by the appreciation of average USD against GBP.
Analysis of loans and advances assessed as impaired (audited)
The following table presents an analysis of loans and advances into those collectively or individually assessed as impaired. The table includes an age analysis for loans and advances collectively assessed as impaired.
Loans that are collectively assessed as impaired consist predominantly of retail loans that are one day or more past due for which a collective allowance is raised. Wholesale loans that are past due, individually assessed as unimpaired, but which carry an unidentified impairment provision, are excluded from this category.
Loans that are individually assessed as impaired consist predominantly of wholesale loans that are past due and for which an individual allowance has been raised.
Home loans, unsecured loans and credit card receivables that are subject to forbearance in the retail portfolios are included within the collectively assessed for impairment category. Where wholesale loans under forbearance have been impaired, these form part of individually assessed impaired loans.
Loans and advances assessed as impaired (audited) |
| |||||||||||||||||||||||||
| | Past due up to 1 month £m |
| | Past due 1-2 months £m |
| | Past due 2-3 months £m |
| | Past due 3-6 months £m |
| Past due 6 months and over £m | Total collectively assessed £m | Individually assessed for impairment £m | | Total £m |
| |||||||||
As at 31 December 2016 | ||||||||||||||||||||||||||
Home loans | 2,866 | 795 | 201 | 298 | 452 | 4,612 | 820 | 5,432 | ||||||||||||||||||
Credit cards, unsecured and other retail lending | 1,135 | 354 | 250 | 516 | 1,702 | 3,957 | 492 | 4,449 | ||||||||||||||||||
Corporate loans | 288 | 53 | 35 | 72 | 131 | 579 | 1,580 | 2,159 | ||||||||||||||||||
Total | 4,289 | 1,202 | 486 | 886 | 2,285 | 9,148 | 2,892 | 12,040 | ||||||||||||||||||
As at 31 December 2015 | ||||||||||||||||||||||||||
Home loans | 3,672 | 1,036 | 278 | 364 | 812 | 6,162 | 648 | 6,810 | ||||||||||||||||||
Credit cards, unsecured and other retail lending | 1,241 | 691 | 284 | 541 | 1,792 | 4,549 | 964 | 5,513 | ||||||||||||||||||
Corporate loans | 251 | 76 | 45 | 76 | 96 | 544 | 1,786 | 2,330 | ||||||||||||||||||
Total | 5,164 | 1,803 | 607 | 981 | 2,700 | 11,255 | 3,398 | 14,653 | ||||||||||||||||||
The decrease in loans collectively assessed as impaired to £9.1bn (2015: £11.3bn) predominantly relates to BAGL balances now held for sale.
| 132 | Barclays PLC and Barclays Bank PLC 2016 Annual Report on Form 20-F |
Potential credit risk loans (PCRLs) and coverage ratios
The Group reports potentially and actually impaired loans as PCRLs. PCRLs comprise two categories of loans: credit risk loans (CRLs) and potential problem loans (PPLs).
CRLs comprise three classes of loans:
| § | impaired loans: comprises loans where an individually identified impairment allowance has been raised. This category also includes all retail loans that have been transferred to a recovery book. See page 134 for further analysis of impaired loans |
| § | accruing past due 90 days or more: comprises loans that are 90 days or more past due with respect to principal or interest |
| § | impaired and restructured loans: comprises loans not included above where, for economic or legal reasons related to the debtor’s financial difficulties, a concession has been granted to the debtor that would not otherwise be considered. For information on restructured loans refer to disclosures on forbearance on pages 134 to 137. |
PPLs are loans that are currently complying with repayment terms but where serious doubt exists as to the ability of the borrower to continue to comply with such terms in the near future. If the credit quality of wholesale loan on a watchlist deteriorates to the highest category, or a retail loan deteriorates to delinquency cycle 2 (typically when past due 60 to 90 days), consideration is given to including it within the PPL category.
Potential credit risk loans and coverage ratios by business | ||||||||||||||||||||||||
| CRLs | PPLs | PCRLs | ||||||||||||||||||||||
As at 31 December | | 2016 £m |
| | 2015 £m |
| | 2016 £m |
| | 2015 £m |
| | 2016 £m |
| | 2015 £m |
| ||||||
Barclays UK | 2,044 | 2,238 | 310 | 382 | 2,354 | 2,620 | ||||||||||||||||||
Barclays International | 1,249 | 863 | 192 | 117 | 1,441 | 980 | ||||||||||||||||||
Barclays Core | 3,293 | 3,101 | 502 | 499 | 3,795 | 3,600 | ||||||||||||||||||
BarclaysNon-Core | 838 | 936 | 11 | 26 | 849 | 962 | ||||||||||||||||||
Total retail | 4,131 | 4,037 | 513 | 525 | 4,644 | 4,562 | ||||||||||||||||||
Barclays UK | 591 | 637 | 94 | 127 | 685 | 764 | ||||||||||||||||||
Barclays International | 1,470 | 1,330 | 1,530 | 877 | 3,000 | 2,207 | ||||||||||||||||||
Barclays Core | 2,061 | 1,967 | 1,624 | 1,004 | 3,685 | 2,971 | ||||||||||||||||||
BarclaysNon-Core | 299 | 441 | 59 | 122 | 358 | 563 | ||||||||||||||||||
Total wholesale | 2,360 | 2,408 | 1,683 | 1,126 | 4,043 | 3,534 | ||||||||||||||||||
Total retail and wholesale | 6,491 | 6,445 | 2,196 | 1,651 | 8,687 | 8,096 | ||||||||||||||||||
BAGL | – | 1,372 | – | 399 | – | 1,771 | ||||||||||||||||||
Group total | 6,491 | 7,817 | 2,196 | 2,050 | 8,687 | 9,867 | ||||||||||||||||||
| Impairment allowance | CRL coverage | PCRL coverage | ||||||||||||||||||||||
As at 31 December | | 2016 £m |
| | 2015 £m |
| | 2016 % | | | 2015 % | | | 2016 % | | | 2015 % | | ||||||
Barclays UK | 1,519 | 1,556 | 74.3 | 69.5 | 64.5 | 59.4 | ||||||||||||||||||
Barclays International | 1,492 | 897 | 119.5 | 103.9 | 103.5 | 91.5 | ||||||||||||||||||
Barclays Core | 3,011 | 2,453 | 91.4 | 79.1 | 79.3 | 68.1 | ||||||||||||||||||
BarclaysNon-Core | 385 | 464 | 45.9 | 49.6 | 45.3 | 48.2 | ||||||||||||||||||
Total retail | 3,396 | 2,917 | 82.2 | 72.3 | 73.1 | 63.9 | ||||||||||||||||||
Barclays UK | 282 | 312 | 47.7 | 49.0 | 41.2 | 40.8 | ||||||||||||||||||
Barclays International | 748 | 617 | 50.9 | 46.4 | 24.9 | 28.0 | ||||||||||||||||||
Barclays Core | 1,030 | 929 | 50.0 | 47.2 | 28.0 | 31.3 | ||||||||||||||||||
BarclaysNon-Core | 194 | 336 | 64.9 | 76.2 | 54.2 | 59.7 | ||||||||||||||||||
Total wholesale | 1,224 | 1,265 | 51.9 | 52.5 | 30.3 | 35.8 | ||||||||||||||||||
Total retail and wholesale | 4,620 | 4,182 | 71.2 | 64.9 | 53.2 | 51.7 | ||||||||||||||||||
BAGL | – | 739 | – | 53.9 | – | 41.7 | ||||||||||||||||||
Group total | 4,620 | 4,921 | 71.2 | 63.0 | 53.2 | 49.9 | ||||||||||||||||||
| § | Excluding BAGL balances, CRLs remained stable at £6.5bn (2015: £6.4bn) with the Group’s CRL coverage ratio increasing to 71% (2015: 65%) mainly within retail portfolios. |
| § | The CRL coverage ratio for retail portfolios increased to 82% (2015: 72%) primarily due to increased impairment allowances following the management review of the UK and US cards portfolio impairment modelling. |
| § | PPLs increased to £2.2bn (2015: £1.7bn) primarily within Barclays International wholesale portfolios. The increase was driven by exposures within the Corporate and Investment bank across a number of industries. |
| Barclays PLC and Barclays Bank PLC 2016 Annual Report on Form 20-F | 133 |
Risk review
Risk performance
Credit risk
Impaired loans
The following table represents an analysis of impaired loans in line with the disclosure recommended by the Enhanced Disclosure Taskforce. Impaired loans are a subcomponent of CRLs (defined on page 133) and comprise loans where an individually identified impairment allowance has been raised. This category also includes all retail loans that have been transferred to a recovery book. For the majority of products, transfer to a recovery book occurs for loans that are past due over 6 months unless a forbearance agreement is agreed. Earlier transfer points may occur depending on specific circumstances. Impaired loans may include loans that are still performing, fully collateralised loans or where indebtedness has already been written down to the expected realisable value.
| Movement in impaired loans | ||||||||||||||||||||||||||||||||
| | At beginning of year £m |
| | Classified as impaired during the year £m |
| | Transferred to not impaired during the year £m |
| | Repayments £m | | | Amounts written off £m | | | Acquisitions and disposals £m | | | Exchange and other adjustments £m | a
| | Balance at 31 December £m | | |||||||||
| 2016 | ||||||||||||||||||||||||||||||||
| Home loans | 1,337 | 308 | (150 | ) | (171 | ) | (19 | ) | – | (165 | ) | 1,140 | ||||||||||||||||||||
Credit cards, unsecured and other retail lending | 2,200 | 1,761 | (17 | ) | (136 | ) | (1,605 | ) | (92 | ) | (407 | ) | 1,704 | |||||||||||||||||||
| Corporate loans | 2,098 | 984 | (427 | ) | (220 | ) | (331 | ) | (15 | ) | (319 | ) | 1,770 | |||||||||||||||||||
| Total impaired loans | 5,635 | 3,053 | (594 | ) | (527 | ) | (1,955 | ) | (107 | ) | (891 | ) | 4,614 | |||||||||||||||||||
| 2015 | ||||||||||||||||||||||||||||||||
| Home loans | 1,503 | 602 | (192 | ) | (272 | ) | (97 | ) | – | (207 | ) | 1,337 | ||||||||||||||||||||
Credit cards, unsecured and other retail lending | 2,613 | 2,226 | (112 | ) | (269 | ) | (1,873 | ) | – | (385 | ) | 2,200 | ||||||||||||||||||||
| Corporate loans | 2,683 | 1,032 | (558 | ) | (208 | ) | (333 | ) | (43 | ) | (475 | ) | 2,098 | |||||||||||||||||||
| Total impaired loans | 6,799 | 3,860 | (862 | ) | (749 | ) | (2,303 | ) | (43 | ) | (1,067 | ) | 5,635 | |||||||||||||||||||
| Forbearance | ||||||||||||||||||||||||||||||||
Forbearance measures consist of concessions towards a debtor that is experiencing or about to experience difficulties in meeting their financial commitments (“financial difficulties”).
|
| |||||||||||||||||||||||||||||||
| Analysis of forbearance programmes | ||||||||||||||||||||||||||||||||
| Balances | Impairment allowance | Impairment coverage | ||||||||||||||||||||||||||||||
| As at 31 December | | 2016 £m |
| | 2015 £m |
| | 2016 £m |
| | 2015 £m |
| | 2016 % |
| | 2015 % |
| ||||||||||||||
| Barclays UK | 926 | 1,036 | 237 | 191 | 25.6 | 18.4 | ||||||||||||||||||||||||||
| Barclays International | 243 | 185 | 57 | 46 | 23.5 | 24.9 | ||||||||||||||||||||||||||
| Barclays Core | 1,169 | 1,221 | 294 | 237 | 25.1 | 19.4 | ||||||||||||||||||||||||||
| BarclaysNon-Core | 211 | 247 | 9 | 20 | 4.3 | 8.1 | ||||||||||||||||||||||||||
| Total retail | 1,380 | 1,468 | 303 | 257 | 22.0 | 17.5 | ||||||||||||||||||||||||||
| Barclays UK | 589 | 412 | 62 | 32 | 10.5 | 7.8 | ||||||||||||||||||||||||||
| Barclays International | 2,044 | 1,333 | 257 | 196 | 12.6 | 14.7 | ||||||||||||||||||||||||||
| Barclays Core | 2,633 | 1,745 | 319 | 228 | 12.1 | 13.1 | ||||||||||||||||||||||||||
| BarclaysNon-Core | 269 | 459 | 50 | 146 | 18.5 | 31.8 | ||||||||||||||||||||||||||
| Total wholesale | 2,902 | 2,204 | 369 | 374 | 12.7 | 17.0 | ||||||||||||||||||||||||||
| Group totalb | 4,282 | 3,672 | 672 | 631 | 15.7 | 17.2 | ||||||||||||||||||||||||||
Balances on forbearance programmes increased 17% driven by an increase in forborne loans in Barclays International.
Retail balances on forbearance programmes reduced 6% to £1.4bn and reflected a decrease in Barclays UK and BarclaysNon-Core offset by an increase in Barclays International portfolios.
| § | Barclays UK: The reduction was driven by UK cards portfolio, where balances on forbearance plans are lower due to the application of an updated entry criteria, as well as asset sales. |
| § | Barclays International: The increase in US cards forbearance was in line with portfolio growth and appreciation of the US Dollar against Sterling. |
Wholesale balances on forbearance increased by 32% to £2.9bn due to an increase in the Barclays Core portfolio where forbearance programmes increased mainly in performing segments of the corporate portfolio due to a change in methodology, extending the previously narrow scope of forbearance in relation to adjustment onnon-enforcement of convenants. This change has been applied consistently across the corporate portfolio with the increase primarily at the higher end of the corporate portfolio where there is a greater tendency for exposure to be under covenants.
Notes
| a | Exchange and other adjustments for 2016 includes the reclassification of £1,015m related to BAGL balances now held for sale offset by currency movements due to the appreciation of average US Dollar and Euro against Sterling. |
| b | Excludes BAGL balances now held for sale. |
| 134 | Barclays PLC and Barclays Bank PLC 2016 Annual Report on Form 20-F |
Retail forbearance programmes
Forbearance on the Group’s principal retail portfolios in the US and UK is presented below. The principal portfolios listed below account for 73% (2015: 76%) of total retail forbearance balances.
| Analysis of key portfolios in forbearance programmes | ||||||||||||||||||||||||||||||||||||
| Balances on forbearance programmes | Marked | Marked | Impairment | |||||||||||||||||||||||||||||||||
| Of which: | to market | to market | allowances | Total | ||||||||||||||||||||||||||||||||
| Past due of which: | LTV of | LTV of | marked | balances on | ||||||||||||||||||||||||||||||||
| forbearance | forbearance | against | forbearance | |||||||||||||||||||||||||||||||||
| % of gross | 91 or | balances: | balances: | balances on | programmes | |||||||||||||||||||||||||||||||
| loans and | 1-90 days | more days | balance | valuation | forbearance | coverage | ||||||||||||||||||||||||||||||
| Total | advances | Up-to-date | past due | past due | weighted | weighted | programmes | ratio | ||||||||||||||||||||||||||||
| £m | % | £m | £m | £m | % | % | £m | % | ||||||||||||||||||||||||||||
| As at 31 December 2016 | ||||||||||||||||||||||||||||||||||||
| Barclays UK | ||||||||||||||||||||||||||||||||||||
| UK home loans | 390 | 0.3 | 188 | 149 | 53 | 44.7 | 31.3 | 3 | 0.8 | |||||||||||||||||||||||||||
| UK cards | 337 | 1.9 | 255 | 59 | 23 | n/a | n/a | 185 | 54.9 | |||||||||||||||||||||||||||
| UK personal loans | 94 | 1.5 | 58 | 26 | 10 | n/a | n/a | 38 | 40.4 | |||||||||||||||||||||||||||
| Barclays International | ||||||||||||||||||||||||||||||||||||
| US cards | 186 | 0.8 | 139 | 35 | 12 | n/a | n/a | 38 | 20.4 | |||||||||||||||||||||||||||
| As at 31 December 2015 | ||||||||||||||||||||||||||||||||||||
| Barclays UK | ||||||||||||||||||||||||||||||||||||
| UK home loans | 445 | 0.3 | 211 | 177 | 57 | 48.0 | 34.1 | 4 | 0.8 | |||||||||||||||||||||||||||
| UK cards | 448 | 2.4 | 414 | 31 | 3 | n/a | n/a | 159 | 35.5 | |||||||||||||||||||||||||||
| UK personal loans | 85 | 1.6 | 60 | 22 | 3 | n/a | n/a | 21 | 24.6 | |||||||||||||||||||||||||||
| Barclays International | ||||||||||||||||||||||||||||||||||||
| US cards | 133 | 0.8 | 92 | 30 | 11 | n/a | n/a | 30 | 22.7 | |||||||||||||||||||||||||||
| § | UK home loans:Balances under forbearance decreased by 12% to £390m, principally due to fewer customers requiring forbearance in a stable macroeconomic environment. Total past due balances reduced by 14% to £202m in line with falling total balances under forbearance. |
| § | UK cards:Balances on forbearance plans have reduced due to an updated entry criteria, as well as asset sales. The forbearance impairment coverage ratio has increased due to implementation of updated impairment methodology. |
| § | UK personal loans:Increased forbearance coverage ratio reflects the changes in methodology to align with the impairment policy. |
| § | US cards: Balances are higher in line with portfolio growth while the balances in arrears remain stable.Past-due balances as a proportion of total balances have reduced, which reflects in the lower forbearance impairment coverage ratio. |
| Barclays PLC and Barclays Bank PLC 2016 Annual Report on Form 20-F | 135 |
Risk review
Risk performance
Credit risk
| Forbearance by type | ||||||||||||||||||||||||||||||||||
| Barclays UK | Barclays International | |||||||||||||||||||||||||||||||||
| UK home loans | UK cards | UK personal loans | US cards | |||||||||||||||||||||||||||||||
| As at 31 December | | 2016 £m |
| | 2015 £m |
| | 2016 £m |
| | 2015 £m |
| | 2016 £m |
| | 2015 £m |
| | 2016 £m |
| | 2015 £m |
| ||||||||||
| Payment concession | 96 | 103 | 45 | 21 | – | – | – | – | ||||||||||||||||||||||||||
| Interest only conversion | 84 | 94 | – | – | – | – | – | – | ||||||||||||||||||||||||||
| Term extension | 210 | 248 | – | – | 16 | 6 | – | – | ||||||||||||||||||||||||||
| Fully amortising | – | – | – | – | 65 | 79 | 97 | 69 | ||||||||||||||||||||||||||
| Repayment plana | – | – | 218 | 427 | 13 | – | 89 | 64 | ||||||||||||||||||||||||||
| Interest rate concession | – | – | 74 | – | – | – | – | – | ||||||||||||||||||||||||||
| Total | 390 | 445 | 337 | 448 | 94 | 85 | 186 | 133 | ||||||||||||||||||||||||||
| Payment concessions in UK cards increased to £45m (2015: £21m), including an additional £31m identified in second half of the year following a review of policy adherence. These balances have been appropriately provisioned. | ||||||||||||||||||||||||||||||||||
| Repayment plan balances in UK cards decreased to £218m (2015: £427m) driven by an asset sale and the continued reduction in new repayment plan volumes. Following review of policy adherence, additional interest rate concession for UK cards (£74m) and repayment plan for UK personal loans (£13m) were identified in the year. | ||||||||||||||||||||||||||||||||||
| Wholesale forbearance programmes | ||||||||||||||||||||||||||||||||||
The tables below detail balance information for wholesale forbearance cases.
|
| |||||||||||||||||||||||||||||||||
| Analysis of wholesale balances in forbearance programmesb | ||||||||||||||||||||||||||||||||||
| Balances on forbearance programmes | Impairment | |||||||||||||||||||||||||||||||||
| Of which: | allowances | Total | ||||||||||||||||||||||||||||||||
| | Total balances £m | | | % of gross loans and advances % | | | Performing balances £m | | | Impaired up-to-date balances £m | | | Balances between 1 and 90 days past due £m | | | Balances 91 days or more past due £m | | | marked against balances on forbearance programmes £m | | | balances on forbearance programmes coverage ratio % |
| |||||||||||
| As at 31 December 2016 | ||||||||||||||||||||||||||||||||||
| Barclays UK | 589 | 3.9 | 187 | 93 | 78 | 231 | 62 | 10.5 | ||||||||||||||||||||||||||
| Barclays International | 2,044 | 1.1 | 1,285 | 567 | 33 | 159 | 257 | 12.6 | ||||||||||||||||||||||||||
| Total Barclays Core | 2,633 | 1.3 | 1,472 | 660 | 111 | 390 | 319 | 12.1 | ||||||||||||||||||||||||||
| BarclaysNon-Core | 269 | 0.6 | 57 | 44 | 25 | 143 | 50 | 18.6 | ||||||||||||||||||||||||||
| Total | 2,902 | 1.2 | 1,529 | 704 | 136 | 533 | 369 | 12.7 | ||||||||||||||||||||||||||
| As at 31 December 2015 | ||||||||||||||||||||||||||||||||||
| Barclays UK | 412 | 2.5 | 153 | 48 | 30 | 181 | 32 | 7.8 | ||||||||||||||||||||||||||
| Barclays International | 1,333 | 0.8 | 614 | 423 | 61 | 235 | 196 | 14.7 | ||||||||||||||||||||||||||
| Total Barclays Core | 1,745 | 1.0 | 767 | 471 | 91 | 416 | 228 | 13.1 | ||||||||||||||||||||||||||
| BarclaysNon-Core | 459 | 1.1 | 118 | 101 | 5 | 235 | 146 | 31.8 | ||||||||||||||||||||||||||
| Total | 2,204 | 1.0 | 885 | 572 | 96 | 651 | 374 | 17.0 | ||||||||||||||||||||||||||
Notes
| a | Repayment plan represents a reduction to the minimum payment due requirements and interest rate. |
| b | 2015 figures restated due to restructuring of portfolio from Barclays International to Non-Core Figures exclude BAGL balances now held for sale. |
| 136 | Barclays PLC and Barclays Bank PLC 2016 Annual Report on Form 20-F |
| Wholesale forbearance reporting split by exposure class | ||||||||||||||||
| | Corporate £m | | | Personal and trusts £m |
| | Other £m |
| | Total £m | | |||||
| As at 31 December 2016 | ||||||||||||||||
| Restructure: reduced contractual cash flows | 32 | – | – | 32 | ||||||||||||
| Restructure: maturity date extension | 411 | 107 | – | 518 | ||||||||||||
| Restructure: changed cash flow profile (other than extension) | 346 | 1 | – | 347 | ||||||||||||
| Restructure: payment other than cash | 10 | – | – | 10 | ||||||||||||
| Change in security | 7 | – | – | 7 | ||||||||||||
| Adjustments ornon-enforcement of covenants | 1,242 | 155 | – | 1,397 | ||||||||||||
| Other (e.g. capital repayment holiday; restructure pending) | 438 | 153 | – | 591 | ||||||||||||
| Total | 2,486 | 416 | – | 2,902 | ||||||||||||
| As at 31 December 2015 | ||||||||||||||||
| Restructure: reduced contractual cash flows | 155 | – | – | 155 | ||||||||||||
| Restructure: maturity date extension | 563 | 23 | 62 | 648 | ||||||||||||
| Restructure: changed cash flow profile (other than extension) | 250 | 1 | – | 251 | ||||||||||||
| Restructure: payment other than cash | 12 | – | – | 12 | ||||||||||||
| Change in security | 7 | 1 | – | 8 | ||||||||||||
| Adjustments ornon-enforcement of covenants | 295 | 92 | – | 387 | ||||||||||||
| Other (e.g. capital repayment holiday; restructure pending) | 535 | 208 | – | 743 | ||||||||||||
| Total | 1,817 | 325 | 62 | 2,204 | ||||||||||||
| Wholesale forbearance reporting split by business unit | ||||||||||||||||
| | Barclays UK £m | | | Barclays International £m | | | Barclays Non-Core £m | | | Total £m | | |||||
| As at 31 December 2016 | ||||||||||||||||
| Restructure: reduced contractual cash flows | 3 | 29 | – | 32 | ||||||||||||
| Restructure: maturity date extension | 114 | 316 | 88 | 518 | ||||||||||||
| Restructure: changed cash flow profile (other than extension) | 180 | 164 | 3 | 347 | ||||||||||||
| Restructure: payment other than cash | – | 10 | – | 10 | ||||||||||||
| Change in security | 1 | 6 | – | 7 | ||||||||||||
| Adjustments ornon-enforcements of covenants | 132 | 1,212 | 53 | 1,397 | ||||||||||||
| Other (e.g. capital repayment holiday; restructure pending) | 159 | 307 | 125 | 591 | ||||||||||||
| Total | 589 | 2,044 | 269 | 2,902 | ||||||||||||
| As at 31 December 2015 | ||||||||||||||||
| Restructure: reduced contractual cash flows | 1 | 130 | 24 | 155 | ||||||||||||
| Restructure: maturity date extension | 77 | 287 | 284 | 648 | ||||||||||||
| Restructure: changed cash flow profile (other than extension) | 51 | 199 | 1 | 251 | ||||||||||||
| Restructure: payment other than cash | – | 12 | – | 12 | ||||||||||||
| Change in security | 1 | 7 | – | 8 | ||||||||||||
| Adjustments ornon-enforcements of covenants | 71 | 260 | 56 | 387 | ||||||||||||
| Other (e.g. capital repayment holiday; restructure pending) | 211 | 438 | 94 | 743 | ||||||||||||
| Total | 412 | 1,333 | 459 | 2,204 | ||||||||||||
| Wholesale forbearance flows in 2016 | ||||||||||||||||
| £m | ||||||||||||||||
| As at 1 January 2016 | 2,204 | |||||||||||||||
| Added to forbearance | 1,811 | |||||||||||||||
| Removed from forbearance (credit improvement) | (383 | ) | ||||||||||||||
| Fully or partially repaid and other movements | (442 | ) | ||||||||||||||
| Written off/moved to recovery book | (288 | ) | ||||||||||||||
| As at 31 December 2016 | 2,902 | |||||||||||||||
| Barclays PLC and Barclays Bank PLC 2016 Annual Report on Form 20-F | 137 |
Risk review
Risk performance
Credit risk
Impairment
Impairment allowances
Impairment allowances decreased 6% to £4,620m primarily due to the reclassification of BAGL balances now held for sale, partially offset by the impact of a management review of impairment modelling within the credit cards portfolios and increases within Barclays International due to volume growth, the appreciation of average US Dollar and Euro against Sterling and increased impairment for a number of single name exposures.
Movements in allowance for impairment by asset class (audited) |
| |||||||||||||||||||||||||||||||
| | At beginning of year £m |
| | Acquisitions and disposals £m |
| | Unwind of discount £m |
| | Exchange and other adjustmentsa £m | | | Amounts written off £m |
| | Recoveries £m |
| | Amounts charged to income statement £m |
| | Balance at 31 December £m |
| |||||||||
2016 | ||||||||||||||||||||||||||||||||
Home loans | 518 | (3 | ) | (5 | ) | (108 | ) | (23 | ) | – | 88 | 467 | ||||||||||||||||||||
Credit cards, unsecured and other retail lending | 3,394 | (2 | ) | (70 | ) | (709 | ) | (1,806 | ) | 296 | 1,957 | 3,060 | ||||||||||||||||||||
Corporate loans | 1,009 | – | – | 81 | (364 | ) | 69 | 298 | 1,093 | |||||||||||||||||||||||
Total impairment allowance | 4,921 | (5 | ) | (75 | ) | (736 | ) | (2,193 | ) | 365 | 2,343 | 4,620 | ||||||||||||||||||||
2015 | ||||||||||||||||||||||||||||||||
Home loans | 547 | – | (32 | ) | (64 | ) | (94 | ) | 7 | 154 | 518 | |||||||||||||||||||||
Credit cards, unsecured and other retail lending | 3,345 | – | (105 | ) | (170 | ) | (1,848 | ) | 301 | 1,871 | 3,394 | |||||||||||||||||||||
Corporate loans | 1,563 | – | (12 | ) | (383 | ) | (335 | ) | 92 | 84 | 1,009 | |||||||||||||||||||||
Total impairment allowance | 5,455 | – | (149 | ) | (617 | ) | (2,277 | ) | 400 | 2,109 | 4,921 | |||||||||||||||||||||
Management adjustments to models for impairment
Management adjustments to models for impairment are applied in order to factor in certain conditions or changes in policy that are not incorporated into the relevant impairment models, or to ensure that the impairment allowance reflects all known facts and circumstances at the period end. Adjustments typically increase the model derived impairment allowance. Where applicable, management adjustments are reviewed and incorporated into future model development.
Management adjustments to models of more than £10m with respect to impairment allowance in our principal portfolios are presented below.
Principal portfolios that have management adjustments greater than £10m |
| |||||||||||||||
| 2016 | 2015 | |||||||||||||||
As at 31 December | | Total management adjustments to impairment stock, including forbearance £m |
| | Proportion of total impairment stock % |
| | Total management adjustments to impairment stock, including forbearance £m |
| | Proportion of total impairment stock % |
| ||||
Barclays UK | ||||||||||||||||
UK cards | 312 | 34 | 147 | 17 | ||||||||||||
UK home loans | 70 | 69 | 68 | 67 | ||||||||||||
UK business lending | 69 | 33 | 67 | 36 | ||||||||||||
Barclays International | ||||||||||||||||
US cards | 278 | 24 | 58 | 9 | ||||||||||||
Corporate Banking | 71 | 14 | 116 | 25 | ||||||||||||
Barclays Partner Finance | 59 | 37 | 41 | 28 | ||||||||||||
Germany cards | 29 | 23 | 20 | 21 | ||||||||||||
During 2016, the models were aligned to a strengthened Retail Impairment Policy, following which adjustments were reviewed.
UK and US cards: Higher provisions held pending full implementation of newly developed and independently approved models with enhanced methodology following an impairment policy revision in Q316.
UK home loans: To capture the potential impact from an increase in the house price to earnings ratio, change in the impairment methodology and increased coverage on interest-only loans maturing in the next five years.
UK business lending: To align to impairment policy requirements, potential impact from commercial property price deterioration and the susceptibility of minimum debt service customers to interest rate rises not currently captured in models.
Corporate Banking: Reflects release against single names in the oil and gas sector.
Barclays Partner Finance: Due to increased risk in the secured motor portfolio along with adjustments on account of impairment methodology.
Germany cards: To align to impairment methodology and increased cover on forbearance programme.
Note
| a | Exchange and other adjustments for 2016 primarily includes the reclassification of £762m related to BAGL now held for sale offset by currency movements due to the appreciation of average US Dollar and Euro against Sterling. |
| 138 | Barclays PLC and Barclays Bank PLC 2016 Annual Report on Form 20-F |
Analysis of debt securities
Debt securities include government securities held as part of the Group’s treasury management portfolio for liquidity and regulatory purposes, and are for use on a continuing basis in the activities of the Group.
The following tables provide an analysis of debt securities held by the Group for trading and investment purposes by issuer type, and where the Group held government securities exceeding 10% of shareholders’ equity.
Further information on the credit quality of debt securities is presented on pages121 to122. Further disclosure on sovereign exposures in the Eurozone is presented on page124
| Debt securities | ||||||||||||||||
| 2016 | 2015 | |||||||||||||||
| As at 31 December | £m | % | £m | % | ||||||||||||
| Of which issued by: | ||||||||||||||||
| Governments and other public bodies | 64,852 | 63.7 | 96,537 | 70.9 | ||||||||||||
| Corporate and other issuers | 28,284 | 27.8 | 26,166 | 19.2 | ||||||||||||
| US agency | 6,208 | 6.1 | 8,927 | 6.6 | ||||||||||||
| Mortgage and asset backed securities | 2,372 | 2.3 | 4,009 | 2.9 | ||||||||||||
| Bank and building society certificates of deposit | 23 | 0.1 | 598 | 0.4 | ||||||||||||
| Total | 101,739 | 100.0 | 136,237 | 100.0 | ||||||||||||
| Government securities | ||||||||||||||||
| As at 31 December | | 2016 Fair value £m | | | 2015 Fair value £m | | ||||||||||
| United Kingdom | 20,145 | 22,372 | ||||||||||||||
| United States | 16,284 | 26,119 | ||||||||||||||
Analysis of derivatives (audited)
The tables below set out the fair values of the derivative assets together with the value of those assets subject to enforceable counterparty netting arrangements for which the Group holds offsetting liabilities and eligible collateral.
| Derivative assets | ||||||||||||||||||||||||
| 2016 | 2015 | |||||||||||||||||||||||
| As at 31 December | | Balance sheet assets £m |
| | Counterparty netting £m |
| | Net exposure £m | | | Balance sheet assets £m |
| | Counterparty netting £m |
| | Net exposure £m | | ||||||
| Foreign exchange | 79,744 | 59,040 | 20,704 | 54,936 | 40,301 | 14,635 | ||||||||||||||||||
| Interest rate | 228,652 | 185,723 | 42,929 | 231,426 | 190,513 | 40,913 | ||||||||||||||||||
| Credit derivatives | 16,273 | 12,891 | 3,382 | 18,181 | 14,110 | 4,071 | ||||||||||||||||||
| Equity and stock index | 17,089 | 12,603 | 4,486 | 13,799 | 8,358 | 5,441 | ||||||||||||||||||
| Commodity derivatives | 4,868 | 3,345 | 1,523 | 9,367 | 6,300 | 3,067 | ||||||||||||||||||
| Total derivative assets | 346,626 | 273,602 | 73,024 | 327,709 | 259,582 | 68,127 | ||||||||||||||||||
| Cash collateral held | 41,641 | 34,918 | ||||||||||||||||||||||
| Net exposure less collateral | 31,383 | 33,209 | ||||||||||||||||||||||
Derivative asset exposures would be £315bn (2015: £295bn) lower than reported under IFRS if netting were permitted for assets and liabilities with the same counterparty or for which the Group holds cash collateral. Similarly, derivative liabilities would be £317bn (2015: £295bn) lower reflecting counterparty netting and collateral placed. In addition,non-cash collateral of £8bn (2015: £7bn) was held in respect of derivative assets. The Group received collateral from clients in support of over the counter derivative transactions. These transactions are generally undertaken under International Swaps and Derivative Association (ISDA) agreements governed by either UK or New York law.
Exposure relating to derivatives, repurchase agreements, reverse repurchase agreements, stock borrowing and loan transactions is calculated using internal PRA approved models. These are used as the basis to assess both regulatory capital and capital appetite and are managed on a daily basis. The methodology encompasses all relevant factors to enable the current value to be calculated and the future value to be estimated, for example, current market rates, market volatility and legal documentation (including collateral rights).
| Barclays PLC and Barclays Bank PLC 2016 Annual Report on Form 20-F | 139 |
Risk review
Risk performance
Credit risk
The table below sets out the fair value and notional amounts of OTC derivative instruments by type of collateral arrangement.
Derivatives by collateral arrangement | ||||||||||||||||||||||||
| 2016 | 2015 | |||||||||||||||||||||||
| | Notional contract amount £m |
| Fair value | | Notional contract amount £m |
| Fair value | |||||||||||||||||
|
Assets |
|
|
Liabilities |
|
|
Assets |
|
|
Liabilities |
| |||||||||||||
Unilateral in favour of Barclays | ||||||||||||||||||||||||
Foreign exchange | 17,713 | 607 | (274) | 15,645 | 242 | (308) | ||||||||||||||||||
Interest rate | 6,666 | 1,017 | (60) | 4,365 | 846 | (65) | ||||||||||||||||||
Credit derivatives | 174 | 3 | (2) | 277 | 2 | (7) | ||||||||||||||||||
Equity and stock index | 390 | 3 | (147) | 303 | 4 | (146) | ||||||||||||||||||
Commodity derivatives | 753 | 33 | (26) | 905 | 150 | (30) | ||||||||||||||||||
Total unilateral in favour of Barclays | 25,696 | 1,663 | (509) | 21,495 | 1,244 | (556) | ||||||||||||||||||
Unilateral in favour of counterparty | ||||||||||||||||||||||||
Foreign exchange | 20,837 | 786 | (2,549) | 50,343 | 810 | (2,107) | ||||||||||||||||||
Interest rate | 108,915 | 3,795 | (5,979) | 121,231 | 4,436 | (6,981) | ||||||||||||||||||
Credit derivatives | 152 | 3 | (7) | 140 | 3 | (1) | ||||||||||||||||||
Equity and stock index | 1,121 | 312 | (49) | 827 | 100 | (83) | ||||||||||||||||||
Commodity derivatives | 1,231 | 67 | (66) | 74 | – | (3) | ||||||||||||||||||
Total unilateral in favour of counterparty | 132,256 | 4,963 | (8,650) | 172,615 | 5,349 | (9,175) | ||||||||||||||||||
Bilateral arrangement | ||||||||||||||||||||||||
Foreign exchange | 3,772,477 | 70,464 | (68,788) | 2,878,125 | 46,831 | (50,899) | ||||||||||||||||||
Interest rate | 7,335,641 | 187,155 | (179,650) | 7,315,345 | 197,900 | (188,293) | ||||||||||||||||||
Credit derivatives | 608,859 | 11,422 | (9,994) | 663,090 | 13,617 | (11,985) | ||||||||||||||||||
Equity and stock index | 192,448 | 6,146 | (9,692) | 144,108 | 4,991 | (8,297) | ||||||||||||||||||
Commodity derivatives | 11,766 | 1,318 | (1,442) | 36,794 | 3,164 | (3,104) | ||||||||||||||||||
Total bilateral arrangement | 11,921,191 | 276,505 | (269,566) | 11,037,462 | 266,503 | (262,578) | ||||||||||||||||||
Uncollateralised derivatives | ||||||||||||||||||||||||
Foreign exchange | 363,921 | 7,490 | (6,287) | 271,819 | 7,008 | (5,424) | ||||||||||||||||||
Interest rate | 184,362 | 5,723 | (2,459) | 193,565 | 6,091 | (2,907) | ||||||||||||||||||
Credit derivatives | 5,872 | 383 | (510) | 7,881 | 467 | (700) | ||||||||||||||||||
Equity and stock index | 13,706 | 2,558 | (3,385) | 6,672 | 2,204 | (3,075) | ||||||||||||||||||
Commodity derivatives | 16,389 | 504 | (748) | 13,347 | 1,733 | (1,667) | ||||||||||||||||||
Total uncollateralised derivatives | 584,250 | 16,658 | (13,389) | 493,284 | 17,503 | (13,773) | ||||||||||||||||||
Total OTC derivative assets/(liabilities) | 12,663,393 | 299,789 | (292,114) | 11,724,856 | 290,599 | (286,082) | ||||||||||||||||||
| 140 | Barclays PLC and Barclays Bank PLC 2016 Annual Report on Form 20-F |
Risk review
Risk performance
Market risk
Analysis of market risk
Market risk is the risk of a reduction in earnings or capital due to volatility of trading book positions or an inability to fully hedge the banking book balance sheet.
This section contains key disclosures describing the Group’s market risk profile, highlighting regulatory as well as management measures.
Key metrics
Value at Risk increased in the year due to increased volatility. The income sensitivity to falling rates has increased compared to 2015 as a result of the lower GBP rate environment and subsequent deposit repricing.
24%
Increase in management Value at Risk
-£220m
Decrease in Annual Earnings at Risk from a negative 25bps shock in interest rates (floored assumption)

| Barclays PLC and Barclays Bank PLC 2016 Annual Report on Form 20-F | 141 |
Risk review
Risk performance
Market risk
| Summary of Contents | Page
| |||||
§ Overview of Market Risk and Summary of Performance in the Period
|
143 |
Outlines key measures used to summarise the market risk profile of the bank such as Value at Risk (VaR) and Annual Earnings at Risk (AEaR). A distinction is made between management and regulatory measures.
| ||||
§ Balance sheet view of trading and banking books |
144 |
Provides a Group-wide overview of where assets and liabilities on the Group’s balance sheet are managed within regulatory traded andnon-traded books.
| ||||
Traded Market Risk § Review of Management Measures – The daily average, maximum and minimum values of management VaR – Business scenario stresses § Review of Regulatory Measures – Analysis of Regulatory VaR, SVaR, IRC and Comprehensive Risk Measure – Breakdown of the major regulatory risk measures by portfolio. |
145
146
146 146 |
The Group discloses details on management measures of market risk. Total management VaR includes all trading positions and is presented on a diversified basis by risk factor.
This section also outlines stress scenarios including macroeconomic conditions modelled as part of the Group’s risk management framework.
Group’s regulatory measures of market risk under the approved internal models approach are also disclosed.
As part of this year’s disclosure, both1-day and10-day VaR have been included.
| ||||
Non-Traded Market Risk § Overview § Net Interest Income Sensitivity – by business unit – by currency § Economic Capital by Business Unit § Analysis of Equity Sensitivity § Volatility of the available for sale portfolio in the liquidity pool § Foreign Exchange Risk – Transactional foreign currency exposure – Translational foreign exchange exposure – Functional currency of operations. § Pension Risk Review – Assets and liabilities – IAS19 position – Risk measurement |
147 147
148 148 149 149 149 149 150 150 150 151 151 |
A description of thenon-traded market risk framework is provided.
The Group discloses a sensitivity analysis onpre-tax net interest income fornon-trading financial assets and liabilities. The analysis is carried out by Business Unit and currency.
The Group measures somenon-traded market risks, in particular prepayment, recruitment and residual risk using an Economic Capital methodology.
The Group discloses the overall impact of a parallel shift in interest rates on retained earnings, available for sale and cash flow hedges.
The Group measures the volatility of the value of the available for sale instruments in the liquidity pool throughnon-traded market risk VaR.
The Group discloses the two sources of foreign exchange risk that it is exposed to.
A review focusing on the UK retirement fund, which represents majority of the Group’s total retirement benefit obligation. | ||||
| 142 | Barclays PLC and Barclays Bank PLC 2016 Annual Report on Form 20-F |
Risk review
Risk performance
Market risk
Market risk
Market risk is the risk of a reduction in earnings or capital due to volatility of the trading book positions or as a consequence of running a banking book balance sheet and liquidity funding pools.
All disclosures in this section [pages 143-151] are unaudited unless otherwise stated. Disclosures for 2016 and 2015 exclude BAGL balances held for sale unless otherwise stated.
|
Overview of market risk
This section contains key statistics describing the market risk profile of the Group, such as Value at Risk (VaR) and Annual Earnings at risk (AEaR) measures. A distinction is made between regulatory and management measures within the section. The market risk management section on pages144 to147 provides descriptions of these metrics:
| § | page144 provides a view of market risk in the context of the Group’s balance sheet |
| § | pages145 to146 cover the management of traded market risk. |
Management measures are shown from page145 and regulatory equivalent measures are shown from page146
| § | non-traded market risk, arising from our banking books, is reviewed from page147. |
Measures of market risk in the Group and accounting measures
Traded market risk measures such as VaR and balance sheet exposure measures have fundamental differences:
| § | balance sheet measures show accruals-based balances or marked to market values as at the reporting date |
| § | VaR measures also take account of current marked to market values, but in addition hedging effects between positions are considered |
| § | market risk measures are expressed in terms of changes in value or volatilities as opposed to static values. |
For these reasons, it is not possible to present direct reconciliations of traded market risk and accounting measures. The table ‘Balance sheet view of trading and banking books’, on page144, helps the reader understand the main categories of assets and liabilities subject to regulatory market risk measures.
Summary of performance in the period
Overall, the Group has maintained a steady risk profile, with key movements outlined below:
| § | measures of traded market risk, such as value at risk (VaR), increased in the year mainly due to the underlying movements to credit spreads and volatility in the cross currency markets driven by market structural changes |
| § | Annual Earnings at Risk (AEaR), is a key measure of interest rate risk volatility in the banking book (IRRBB). This sensitivity measure decreased in 2016, driven by two factors: the reduction in GBP base rate in August 2016 with the 0% model floor; and additional protection that the Group has put in place to reduce exposure to a possible further reduction in GBP base rate |
| § | pension risks are disclosed from page150 onwards. |
| Barclays PLC and Barclays Bank PLC 2016 Annual Report on Form 20-F | 143 |
Risk review
Risk performance
Market risk
Balance sheet view of trading and banking books
As defined by regulatory rules, a trading book consists of positions held for trading intent or to hedge elements of the trading book. Trading intent must be evidenced in the basis of the strategies, policies and procedures set up by the firm to manage the position or portfolio. The table below provides a Group-wide overview of where assets and liabilities on the Group’s balance sheet are managed within regulatory traded andnon-traded books.
The balance sheet split by trading book and banking books is shown on an IFRS accounting scope of consolidation. The reconciliation between the accounting and regulatory scope of consolidation is shown in the Barclays PLC 2016 Pillar 3 Report.
Balance sheet split by trading and banking books | ||||||||||||
As at 31 December 2016 | | Banking book £m | a
| | Trading book £m |
| | Total £m |
| |||
Cash and balances at central banks | 102,353 | – | 102,353 | |||||||||
Items in course of collection from other banks | 1,467 | – | 1,467 | |||||||||
Trading portfolio assets | 1,160 | 79,080 | 80,240 | |||||||||
Financial assets designated at fair value | 10,475 | 68,133 | 78,608 | |||||||||
Derivative financial instruments | 1,551 | 345,075 | 346,626 | |||||||||
Financial investments | 63,317 | – | 63,317 | |||||||||
Loans and advances to banks | 42,288 | 963 | 43,251 | |||||||||
Loans and advances to customers | 373,156 | 19,628 | 392,784 | |||||||||
Reverse repurchase agreements and other similar secured lending | 13,454 | – | 13,454 | |||||||||
Prepayments, accrued income and other assets | 2,893 | – | 2,893 | |||||||||
Investments in associates and joint ventures | 684 | – | 684 | |||||||||
Property, plant and equipment | 2,825 | – | 2,825 | |||||||||
Goodwill and intangible assets | 7,726 | – | 7,726 | |||||||||
Current tax assets | 561 | – | 561 | |||||||||
Deferred tax assets | 4,869 | – | 4,869 | |||||||||
Retirement benefit assets | 14 | – | 14 | |||||||||
Assets included in disposal groups classified as held for saleb | 64,139 | 7,315 | 71,454 | |||||||||
Total assets | 692,932 | 520,194 | 1,213,126 | |||||||||
Deposits from banks | 46,905 | 1,309 | 48,214 | |||||||||
Items in course of collection due to other banks | 636 | – | 636 | |||||||||
Customer accounts | 408,434 | 14,744 | 423,178 | |||||||||
Repurchase agreements and other similar secured borrowing | 19,760 | – | 19,760 | |||||||||
Trading portfolio liabilities | – | 34,687 | 34,687 | |||||||||
Financial liabilities designated at fair value: | 5,059 | 90,972 | 96,031 | |||||||||
Derivative financial instruments | 883 | 339,604 | 340,487 | |||||||||
Debt securities in issue | 75,932 | – | 75,932 | |||||||||
Subordinated liabilities | 23,383 | – | 23,383 | |||||||||
Accruals, deferred income and other liabilities | 8,830 | 41 | 8,871 | |||||||||
Provisions | 4,134 | – | 4,134 | |||||||||
Current tax liabilities | 737 | – | 737 | |||||||||
Deferred tax liabilities | 29 | – | 29 | |||||||||
Retirement benefit liabilities | 390 | – | 390 | |||||||||
Liabilities included in disposal groups classified as held for saleb | 60,703 | 4,589 | 65,292 | |||||||||
Total liabilities | 655,815 | 485,946 | 1,141,761 | |||||||||
Included within the trading book are assets and liabilities which are included in the market risk regulatory measures. For more information on these measures (VaR, SVaR, IRC and APR) see the risk management section on page 146.
Notes
| a | The primary risk factors for banking book assets and liabilities are interest rates and to a lesser extent, foreign exchange rates. Credit spreads and equity prices will also be factors where the Group holds debt and equity securities respectively, either as financial assets designated at fair value (see Note 15) or as available for sale (see Note 17). |
| b | Including BAGL. |
| 144 | Barclays PLC and Barclays Bank PLC 2016 Annual Report on Form 20-F |
Traded market risk review
Review of management measures
The following disclosures provide details on management measures of market risk. See the risk management section on page 89 for more detail on management measures and the differences when compared to regulatory measures.
The table below shows the total Management VaR on a diversified basis by risk factor. Total Management VaR includes all trading positions in Barclays International,Non-Core, BAGL and Head Office.
Limits are applied against each risk factor VaR as well as total Management VaR, which are then cascaded further by risk managers to each business.
| The daily average, maximum and minimum values of management VaRa | ||||||||||||||||||||||||
Management VaR (95%) (audited) | ||||||||||||||||||||||||
| 2016 | 2015 | |||||||||||||||||||||||
For the year ended 31 December | | Average £m |
| | High £m | b
| | Low £m | b
| | Average £m |
| | High £m | b
| | Low £m | b
| ||||||
Credit risk | 16 | 24 | 9 | 11 | 17 | 8 | ||||||||||||||||||
Interest rate risk | 7 | 13 | 4 | 6 | 14 | 4 | ||||||||||||||||||
Equity risk | 7 | 11 | 4 | 8 | 18 | 4 | ||||||||||||||||||
Basis risk | 5 | 9 | 3 | 3 | 4 | 2 | ||||||||||||||||||
Spread risk | 3 | 5 | 2 | 3 | 6 | 2 | ||||||||||||||||||
Foreign exchange risk | 3 | 5 | 2 | 3 | 6 | 1 | ||||||||||||||||||
Commodity risk | 2 | 4 | 1 | 2 | 3 | 1 | ||||||||||||||||||
Inflation risk | 2 | 3 | 2 | 3 | 5 | 2 | ||||||||||||||||||
Diversification effectb | (24) | n/a | n/a | (22) | n/a | n/a | ||||||||||||||||||
Total management VaR | 21 | 29 | 13 | 17 | 25 | 12 | ||||||||||||||||||
Average Credit Risk VaR increased by £5m to £16m (2015: £11m) primarily due to the underlying volatile movements to credit spreads given own credit contribution.
Average Basis VaR increased by £2m to £5m (2015: £3m) primarily due to a combination of structural changes in the cross currency markets that led to higher volatility and higher client activity in G10 cross currency basis.
Average Equity VaR decreased by £1m to £7m (2015: £8m) reflecting reduced cash portfolio activities and a more conservative risk profile maintained in the derivatives portfolio.
Average Foreign Exchange Risk VaR was stable as a result of maintaining a conservative risk profile in the derivatives portfolio.
Group Management VaRa (£m)
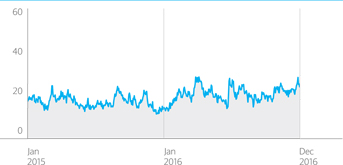
The daily VaR chart illustrates an average increasing trend in 2016. Intermittent VaR increases were due to increased client flow in periods of heightened volatility in specific markets and subsequent risk management of the position.
Notes
| a | Including BAGL. |
| b | Diversification effects recognise that forecast losses from different assets or businesses are unlikely to occur concurrently, hence the expected aggregate loss is lower than the sum of the expected losses from each area. Historic correlations between losses are taken into account in making these assessments. The high and low VaR figures reported for each category did not necessarily occur on the same day as the high and low VaR reported as a whole. Consequently a diversification effect balance for the high and low VaR figures would not be meaningful and is therefore omitted from the above table. |
| Barclays PLC and Barclays Bank PLC 2016 Annual Report on Form 20-F | 145 |
Risk review
Risk performance
Market risk
Business Scenario Stresses
As part of the Group’s risk management framework the performance of the trading business in hypothetical scenarios characterised by severe macroeconomic conditions is modelled. Up to seven global scenarios are modelled on a regular basis, for example, a sharp deterioration in liquidity, a slowdown in the global economy, terrorist attacks, global recession, and a sharp increase in economic growth.
In 2016, the scenario analyses showed that the largest market risk related impacts would be due to a severe deterioration in market liquidity and global recession.
Review of regulatory measures
The following disclosures provide details on regulatory measures of Market risk. See the Barclays Pillar 3 Report for more detail on regulatory measures and the differences when compared to management measures.
The Group’s market risk capital requirement comprises two elements:
| § | the market risk of trading book positions booked to legal entities that are measured under a PRA approved internal models approach, including Regulatory VaR, Stressed Value at Risk (SVaR), Incremental Risk Charge (IRC), and Comprehensive Risk Measure as required |
| § | trading book positions that do not meet the conditions for inclusion within the approved internal models approach. The capital requirement for these positions is calculated using standardised rules |
The table below summarises the regulatory market risk measures, under the internal models approach. See Table ‘Market risk own funds requirements’in the Barclays 2016 Pillar 3 Report for a breakdown of capital requirements by approach.
Analysis of Regulatory VaR, SVaR, IRC and Comprehensive Risk Measure | ||||||||||||||||
| | Year-end £m | | | Avg. £m | | | Max £m | | | Min £m | | |||||
As at 31 December 2016 | ||||||||||||||||
Regulatory VaR(1-day) | 33 | 26 | 34 | 18 | ||||||||||||
Regulatory VaR(10-day)a | 105 | 84 | 108 | 57 | ||||||||||||
SVaR(1-day) | 65 | 56 | 75 | 34 | ||||||||||||
SVaR(10-day)a | 205 | 178 | 236 | 109 | ||||||||||||
IRC | 154 | 155 | 238 | 112 | ||||||||||||
Comprehensive Risk Measure | 2 | 5 | 12 | 2 | ||||||||||||
As at 31 December 2015 | ||||||||||||||||
Regulatory VaR(1-day) | 26 | 28 | 46 | 20 | ||||||||||||
Regulatory VaR(10-day)a | 82 | 89 | 145 | 63 | ||||||||||||
SVaR(1-day) | 44 | 54 | 68 | 38 | ||||||||||||
SVaR(10-day)a | 139 | 171 | 215 | 120 | ||||||||||||
IRC | 129 | 142 | 254 | 59 | ||||||||||||
Comprehensive Risk Measure | 12 | 15 | 27 | 11 | ||||||||||||
Overall, there was an increase in average IRC in 2016, with no significant movements in other internal model components:
| § | Regulatory VaR/SVaR: Remained broadly stable year on year. |
| § | IRC:Increased primarily due to positional increases in the third quarter of 2016. |
| § | Comprehensive Risk Measure: Reduced as a result of further reductions in a specific legacy portfolio. |
Breakdown of the major regulatory risk measures by portfolio |
| |||||||||||||||||||||||||||
As at 31 December 2016 | | Macro £m |
| | Equities £m | | | Credit £m |
| | Barclays International Treasury £m | b
| | Banking £m | b
| | Group Treasury £m | | | Barclays Non-Core £m | | |||||||
Regulatory VaR(1-day) | 14 | 12 | 6 | 14 | 12 | 5 | 6 | |||||||||||||||||||||
Regulatory VaR(10-day) | 44 | 38 | 20 | 45 | 40 | 15 | 21 | |||||||||||||||||||||
SVaR(1-day) | 22 | 43 | 7 | 30 | 18 | 9 | 22 | |||||||||||||||||||||
SVaR(10-day) | 69 | 137 | 24 | 95 | 58 | 30 | 69 | |||||||||||||||||||||
IRC | 220 | 8 | 146 | 196 | 25 | 10 | 18 | |||||||||||||||||||||
Comprehensive Risk Measure | – | – | – | – | – | – | 2 | |||||||||||||||||||||
The table above shows the primary portfolios which drove the trading businesses’ modelled capital requirement as at 31 December 2016. The stand-alone portfolio results diversify at the total level and are not necessarily additive. Regulatory VaR, SVaR, IRC and Comprehensive Risk Measure in the prior table show the diversified results at a Group level.
Notes
| a | The 10 day VaR is based on scaling of 1 day VaR model output. More information about Regulatory and Stressed VaR methodology is available in the Barclays PLC 2016 Pillar 3 Report. |
| b | In the fourth quarter, the Client Capital Management (CCM) portfolio was split into Barclays International Treasury, Banking and Agency Derivative Services (ADS) and Financing. For the purposes of the disclosures, only material portfolios (Barclays International Treasury and Banking) have been included. |
| 146 | Barclays PLC and Barclays Bank PLC 2016 Annual Report on Form 20-F |
Non-traded market risk
Overview
Thenon-traded market risk framework covers exposures in the banking book, mostly consisting of exposures relating to accrual accounted and available for sale instruments. The potential volatility of the net interest income of the bank is measured by an Annual Earnings at Risk (AEaR) metric that is monitored regularly and reported to Senior Management and the Board Risk Committee as part of the limit monitoring framework.
Net interest income sensitivity
The table below shows a sensitivity analysis onpre-tax net interest income fornon-trading financial assets and financial liabilities, including the effect of any hedging. The sensitivity has been measured using the Annual Earnings at Risk (AEaR) methodology as described in the Barclays Pillar 3 Report. Note that this metric assumes an instantaneous parallel change to interest rate forward curves. The model floors shocked market rates at zero; changes in net interest income sensitivity are only observed where forward rates are greater than zero. The main model assumptions are: (i) one year time horizon; (ii) balance sheet is held constant; (iii) balances are adjusted for assumed behavioural profiles (i.e. considers that customers may remortgage before the contractual maturity); and (iv) behavioural assumptions are kept unchanged in all rate scenarios.
| Net interest income sensitivity (AEaR) by business unita,b (audited) | ||||||||||||||||
Barclays UK £m | Barclays International £m | Barclays Non-Core £m | Total £m | |||||||||||||
As at 31 December 2016 | ||||||||||||||||
+25bps | 5 | 16 | 1 | 22 | ||||||||||||
-25bps | (130 | ) | (90 | ) | – | (220 | ) | |||||||||
As at 31 December 2015 | ||||||||||||||||
+25bps | 16 | 21 | 5 | 42 | ||||||||||||
-25bps | (50 | ) | (41 | ) | – | (91 | ) | |||||||||
The income sensitivity to falling rates has increased compared to 2015 as a result of the lower GBP rate environment and subsequent depositre-pricing.
| Net interest income sensitivity (AEaR) by currencyc | ||||||||
| As at 31 December 2016 | | +25 basis points £m | | | -25 basis points £m | | ||
GBP | 9 | (215 | ) | |||||
USD | 3 | (5 | ) | |||||
EUR | 7 | 1 | ||||||
Other currencies | 3 | (1 | ) | |||||
Total | 22 | (220 | ) | |||||
As percentage of net interest income | 0.21% | (2.09% | ) |
Notes
| a | The investment banking part of Barclays International has been excluded. |
| b | Excludes Treasury operations, which are driven by the Group’s investments in the liquidity pool, which are risk managed using VaR measures described on page 149. Treasury’s net interest income sensitivity (AEaR) sensitivity to a +25/-25bps move is £(39)m / £36m respectively. |
| c | Includes Barclays UK, Barclays International (excluding investment banking) andNon-Core sensitivity. Treasury excluded. |
| Barclays PLC and Barclays Bank PLC 2016 Annual Report on Form 20-F | 147 |
Risk review
Risk performance
Market risk
Economic Capital by business unit
Barclays measures somenon-traded market risks using an economic capital (EC) methodology. EC is predominantly calculated using a daily VaR model scaled to a 99% confidence interval. A 99.98% confidence interval, as previously reported, is considered to be a very extreme shock i.e. a 1 in 5000 event. A 99% confidence interval is considered more appropriate and also aligns to other regulatory submissions. For more information on definitions of prepayment, recruitment and residual risk, and on how EC is used to manage market risk, see the treasury and capital risk management section on page372.
| Economic Capital by business unit | ||||||||||||||||
| | Barclays UK £m |
| | Barclays International £m | a
| | Barclays Non-Core £m | b
| | Total £m | | |||||
As at 31 December 2016 | ||||||||||||||||
Prepayment risk | 27 | 8 | – | 35 | ||||||||||||
Recruitment risk | 18 | 1 | 1 | 20 | ||||||||||||
Residual risk | 1 | 23 | 12 | 36 | ||||||||||||
Total | 46 | 32 | 13 | 91 | ||||||||||||
As at 31 December 2015 | ||||||||||||||||
Prepayment risk | 20 | 7 | – | 27 | ||||||||||||
Recruitment risk | 39 | 4 | 4 | 47 | ||||||||||||
Residual risk | 2 | 26 | 3 | 31 | ||||||||||||
Total | 61 | 37 | 7 | 105 | ||||||||||||
Total Economic Capital decreased by £14m to £91m (2015: £105m), mainly driven by recruitment risk in Barclays UK which decreased by £21m due to a reduction in market rates and volatility.
Analysis of equity sensitivity
The equity sensitivity table below measures the overall impact of a +/ - 25bps movement in interest rates on retained earnings, available for sale and cash flow hedge reserves. This data is captured using a DV01 metric which is an indicator of the shift in value for a 1 basis point movement in the yield curve.
| Analysis of equity sensitivity (audited) | ||||||||||||||||
| 2016 | 2015 | |||||||||||||||
| As at 31 December | | +25 basis points £m | | | -25 basis points £m | | | +25 basis points £m | | | -25 basis points £m |
| ||||
Net interest income | 22 | (220 | ) | 42 | (91 | ) | ||||||||||
Taxation effects on the above | (7 | ) | 66 | (13 | ) | 27 | ||||||||||
Effect on profit for the year | 15 | (154 | ) | 29 | (64 | ) | ||||||||||
As percentage of net profit after tax | 0.54% | (5.45% | ) | 4.72% | (10.22% | ) | ||||||||||
Effect on profit for the year (per above) | 15 | (154 | ) | 29 | (64 | ) | ||||||||||
Available for sale reserve | (154 | ) | 114 | (180 | ) | 248 | ||||||||||
Cash flow hedge reserve | (732 | ) | 692 | (754 | ) | 694 | ||||||||||
Taxation effects on the above | 222 | (202 | ) | 280 | (283 | ) | ||||||||||
Effect on equity | (649 | ) | 450 | (625 | ) | 595 | ||||||||||
As percentage of equity | (0.91% | ) | 0.63% | (0.95% | ) | 0.90% | ||||||||||
In relation to the net interest income sensitivity table on page147, the impact of a 25bps movement in rates is largely driven by Barclays UK.
The change in available for sale reserve sensitivities was driven by a reduction in interest rate risk in the liquidity pool during the year. Movements in the available for sale reserve would impact CRD IV fully loaded CET1 capital, however the movement in the cash flow hedge reserve would not impact CET1 capital.
Notes
| a | Residual risk for Barclays International includes Barclays Bank Delaware products to align with the NII disclosure. Prior period restated on the same basis for consistency. |
| b | Only retail exposures withinNon-Core are captured in this measure. |
| 148 | Barclays PLC and Barclays Bank PLC 2016 Annual Report on Form 20-F |
Volatility of the available for sale portfolio in the liquidity pool
Changes in value of available for sale exposures flow directly through capital via the available for sale reserve. The volatility of the value of the available for sale investments in the liquidity pool is captured and managed through a value measure rather than an earning measure, i.e. theNon-traded market risk VaR.
Although the underlying methodology to calculate thenon-traded VaR is identical to the one used in traded management VaR, the two measures are not directly comparable. Thenon-traded VaR represents the volatility to capital driven by the available for sale exposures. These exposures are in the banking book and do not meet the criteria for trading book treatment.
Volatility of the AFS portfolio in Liquidity Pool
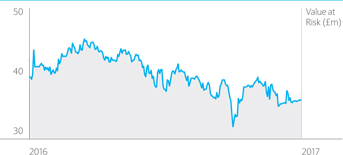
Analysis of volatility of the available for sale portfolio in the liquidity pool |
| |||||||||||||||||||||||
| 2016 | 2015 | |||||||||||||||||||||||
For the year ended 31 December | | Average £m | | | High £m | | | Low £m | | | Average £m | | | High £m | | | Low £m | | ||||||
Non-traded market Value at Risk (daily, 95%) | 40 | 46 | 32 | 42 | 49 | 37 | ||||||||||||||||||
TheNon-traded VaR is mainly driven by volatility of interest rates in developed markets in the chart above. The sharp reduction in available for sale VaR at the end of September was driven by a reduction in outright interest rate risk taken in the liquidity pool, which wasre-established in early October.
Foreign exchange risk
The Group is exposed to two sources of foreign exchange risk.
a) Transactional foreign currency exposure
Transactional foreign exchange exposures represent exposure on banking assets and liabilities, denominated in currencies other than the functional currency of the transacting entity.
The Group’s risk management policies prevent the holding of significant open positions in foreign currencies outside the trading portfolio managed by Barclays International which is monitored through VaR.
Banking book transactional foreign exchange risk outside of Barclays International is monitored on a daily basis by the Market Risk function and minimised by the businesses.
b) Translational foreign exchange exposure
The Group’s investments in overseas subsidiaries and branches create capital resources denominated in foreign currencies, principally USD, EUR and ZAR. Changes in the GBP value of the net investments due to foreign currency movements are captured in the currency translation reserve, resulting in a movement in CET1 capital.
The Group’s strategy is to minimise the volatility of the capital ratios caused by foreign exchange movements by using the CET1 capital movements to broadly match the revaluation of the Group’s foreign currency RWA exposures.
The economic hedges primarily represent the USD and EUR preference shares and Additional Tier 1 (AT1) instruments that are held as equity, accounted for at historic cost under IFRS and do not qualify as hedges for accounting purposes.
| Barclays PLC and Barclays Bank PLC 2016 Annual Report on Form 20-F | 149 |
Risk review
Risk performance
Market risk
| Functional currency of operations (audited) | ||||||||||||||||||||||||
| Foreign currency net investments £m | Borrowings which hedge the net investments £m | Derivatives which hedge the net investments £m | Structural £m | Economic hedges £m | Remaining structural currency exposures £m | |||||||||||||||||||
| As at 31 December 2016 | ||||||||||||||||||||||||
| USD | 29,460 | (12,769 | ) | – | 16,691 | (7,898 | ) | 8,793 | ||||||||||||||||
| EUR | 2,121 | (363 | ) | – | 1,758 | (2,053 | ) | (295 | ) | |||||||||||||||
| ZAR | 3,679 | – | (2,571 | ) | 1,108 | – | 1,108 | |||||||||||||||||
| JPY | 438 | (209 | ) | (224 | ) | 5 | – | 5 | ||||||||||||||||
| Other | 2,793 | – | (1,318 | ) | 1,475 | – | 1,475 | |||||||||||||||||
| Total | 38,491 | (13,341 | ) | (4,113 | ) | 21,037 | (9,951 | ) | 11,086 | |||||||||||||||
| As at 31 December 2015 | ||||||||||||||||||||||||
| USD | 24,712 | (8,839 | ) | (1,158 | ) | 14,715 | (7,008 | ) | 7,707 | |||||||||||||||
| EUR | 2,002 | (630 | ) | (14 | ) | 1,358 | (1,764 | ) | (406 | ) | ||||||||||||||
| ZAR | 3,201 | (4 | ) | (99 | ) | 3,098 | – | 3,098 | ||||||||||||||||
| JPY | 383 | (168 | ) | (205 | ) | 10 | – | 10 | ||||||||||||||||
| Other | 2,927 | – | (1,294 | ) | 1,633 | – | 1,633 | |||||||||||||||||
| Total | 33,225 | (9,641 | ) | (2,770 | ) | 20,814 | (8,772 | ) | 12,042 | |||||||||||||||
During 2016, total structural currency exposure net of hedging instruments decreased by £1.0bn to £11.1bn (2015: £12.0bn). The decrease was broadly driven by an increase in ZAR hedges following Barclays announcement to reduce the Group’s interest in BAGL. Foreign currency net investments increased by £5.3bn to £38.5bn (2015: £33.2bn) driven predominantly by the appreciation of US Dollar against Sterling. The hedges associated with these investments increased by £5.0bn to £17.5bn (2015: £12.4bn).
Pension risk review
The UK Retirement Fund (UKRF) represents approximately 96% (2015: 92%) of the Group’s total retirement benefit obligations globally. As such, this risk review section focuses exclusively on the UKRF. The UKRF is closed to new entrants, and there is no new final salary benefit being accrued. Existing active members accrue a combination of a cash balance benefit and a defined contribution element.
Pension risk arises as the estimated market value of the pension fund assets may decline, investment returns may reduce or the estimated value of the pension liabilities may increase.
See the Barclays PLC 2016 Pillar 3 Report for more information on how pension risk is managed.
Assets
The Trustee Board of the UKRF defines its overall long-term investment strategy with investments across a broad range of asset classes. This ensures an appropriate mix of return seeking assets as well as liability matching assets to better match future pension obligations. The main market risks within the asset portfolio are against interest rates and equities. The split of scheme assets is shown within Note 35. The fair value of the UKRF assets was £31.8bn as at 31 December 2016.
| 150 | Barclays PLC and Barclays Bank PLC 2016 Annual Report on Form 20-F |
Liabilities
The UKRF retirement benefit obligations are a series of future cash flows with relatively long duration. On an IAS19 basis these cash flows are sensitive to changes in the expected long-term price inflation rate (RPI) and the discount rate (AA corporate bond yield curve):
| § | An increase in long-term expected inflation corresponds to an increase in liabilities |
| § | A decrease in the discount rate corresponds to an increase in liabilities |
Pension risk is generated through the Group’s defined benefit schemes and this risk is set to reduce over time as our main defined benefit scheme is closed to new entrants. The chart below outlines the shape of the UKRF’s liability cash flow profile (as at 31 December 2016) that takes account of future inflation indexing of payments to beneficiaries, with the majority of the cash flows (approximately 83%) falling between 0 and 40 years, peaking within the 11 to 20 year band and reducing thereafter. The shape may vary depending on changes in inflation expectation and mortality.
For more detail on the UKRF’s financial and demographic assumptions see Note 35 Pensions and post retirement benefits.
| Proportion of liability cash flows | Net IAS19 Position | |
|
|
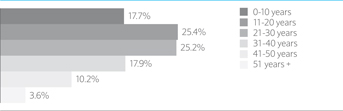
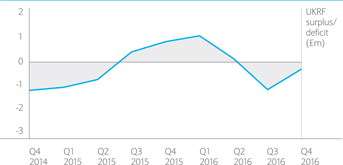
The graph above shows the UKRF’s net IAS19 pension position for eachquarter-end for the past two years. The volatility shown by the fluctuation in the net IAS19 pension position is reflective of the movements observed in the market.
In Q2 2016, the UKRF IAS19 position deteriorated as the AA discount rate moved lower, driven by both a decrease in long-dated government bond yields as well as tightening in credit spreads.
During H2 2016, this trend continued driven by the outcome of the EU Referendum in June as well as the Bank of England’s announcement on quantitative easing in August. These events drove significant market moves adversely affecting the UKRF AA discount rate. For example, the market index IBOXX £-Corp AA yield was 53bps lower between June and September.
Gilt yields reverted higher in the months following September which was also reflected in higher AA discount rate. As a result, the net IAS19 position reverted close to zero as at 31 December 2016.
Please see Note 35 for the sensitivity of the UKRF to change in key assumptions.
Risk measurement
In line with Barclays’ risk management framework, the assets and liabilities of the UKRF are modelled within a VaR framework to show the volatility of the pension positions on a total portfolio level. This ensures that the risks, diversification and liability matching characteristics of the UKRF obligations and investments are adequately captured. VaR is measured and monitored on a monthly basis. Risks are reviewed and reported regularly at forums including Market Risk Committee, Group Risk Committee, Pensions Management Group and Pension Executive Board. The VaR model takes into account the valuation of the liabilities based on an IAS19 basis (see Note 35). The Trustee receives quarterly VaR measures on a funding basis.
The pension liability is also sensitive to post-retirement mortality assumptions which are also reviewed regularly. See Note 35 for more details.
In addition, the impact of pension risk to the Group is taken into account as part of stress testing process. Stress testing is performed internally on at least an annual basis. The UKRF exposure is included as part of the regulatory stress tests.
Barclays defined benefit pension schemes affects capital in two ways:
| § | An IAS19 deficit is treated as a liability on the Group’s balance sheet. Movement in a deficit due to remeasurements, including actuarial losses, are recognised immediately through Other Comprehensive Income and as such reduces shareholders’ equity and CET1 capital. An IAS19 surplus is treated as an asset on the balance sheet and increases shareholders’ equity, however is deducted for the purposes of determining CET1 capital. |
| § | In the Group’s statutory balance sheet, an IAS19 surplus or deficit is partially offset by a deferred tax liability or asset respectively. These may or may not be recognised for calculating CET1 capital depending on the overall deferred tax position of the Group at the particular time. |
| § | Pension risk is taken into account in the Pillar 2A capital assessment undertaken by the PRA at least annually. The Pillar 2A requirement forms part of the Group’s overall regulatory minimum requirement for CET1 capital, Tier 1 capital and total capital. More detail on minimum regulatory requirements can be found in the Funding Risk – Capital section on page152. |
| Barclays PLC and Barclays Bank PLC 2016 Annual Report on Form 20-F | 151 |
Risk review
Risk performance
Funding risk – Capital
Analysis of capital risk
Capital risk is the risk that the Group has insufficient capital resources to (i) meet minimum regulatory requirements in all jurisdictions; (ii) support its credit rating; and (iii) support its business strategy.
This section details Barclays’ capital position providing information on both capital resources and capital requirements. It also provides details of the leverage ratio and exposures.
Key metrics
12.4% |
Fully loaded Common Equity Tier 1 ratio
The fully loaded CRD IV CET1 ratio increased to 12.4% (2015: 11.4%) reflecting an increase in CET1 capital of £4.5bn to £45.2bn, despite RWAs increasing by £7bn to £366bn.
The increase in CET1 capital was largely driven by profits of £2.1bn generated in the period, after absorbing the impact of notable items. Other favourable movements included the currency translation reserve as a result of the appreciation of all major currencies against Sterling.
The increase in RWAs was principally due to the appreciation of South African Rand, US Dollar and Euro against Sterling and business growth, which more than offset RWA reductions inNon-Core.
|
4.6%
Leverage ratio
The leverage ratio increased to 4.6% (2015: 4.5%) driven by a £5.8bn increase in fully loaded Tier 1 capital to £52.0bn partially offset by an increase in the leverage exposure of £97bn to £1,125bn.
Total IFRS assets increased 8% to £1,213bn from 2015 contributing to the 9% increase in the leverage exposure.
|
| 152 | Barclays PLC and Barclays Bank PLC 2016 Annual Report on Form 20-F |
Summary of Contents
| Page
| |||
§ Capital risk overview and summary of performance
§ Regulatory minimum capital and leverage requirements
– Capital
– Leverage | �� |
154 |
Capital risk is the risk that the Group has insufficient capital resources to (i) meet minimum regulatory requirements in all jurisdictions; (ii) support its credit rating; and (iii) support its business strategy.
This section details Barclays’ capital position providing information on both capital resources and capital requirements. It also provides details of the leverage ratio and exposures.
| |
§ Analysis of capital resources – Capital ratios – Capital resources – Movement in CET1 capital
| 155 | This section outlines the Group’s capital ratios, capital composition, and provides information on significant movements in CET1 capital during the year. | ||
| § Analysis of risk weighted assets | 157 | This section outlines risk weighted assets by risk type, business and macro drivers. | ||
– Risk weighted assets by risk type and business | ||||
– Movement analysis of risk weighted assets
| ||||
§ Analysis of leverage ratio and exposures – Leverage ratio and exposures
| 158 | This section outlines the Group’s leverage ratios, leverage exposure composition, and provides information on significant movements in the IFRS and leverage balance sheet. |
| Barclays PLC and Barclays Bank PLC 2016 Annual Report on Form 20-F | 153 |
Risk review
Risk performance
Funding risk – Capital
Capital risk
Capital risk is the risk that the Group has insufficient capital resources to:
– meet minimum regulatory requirements in all jurisdictions
– support its credit rating; and
– support its business strategy.
More details on monitoring and managing capital risk may be found in the Risk Management sections on pages97 to114
All disclosures in this section (pages154 to178) are unaudited unless otherwise stated. Disclosures for 2016 and 2015 include BAGL balances held for sale unless otherwise stated.
|
Overview
The fully loaded CRD IV CET1 ratio, among other metrics, is a measure of the capital strength and resilience of Barclays. Maintenance of our capital is vital in order to meet the minimum capital requirements of regulatory authorities and to fund growth within our businesses.
This section provides an overview of the Group’s: (i) regulatory minimum capital and leverage requirements; (ii) capital resources; (iii) risk weighted assets (RWAs); and (iv) leverage ratio and exposures.
Summary of performance in the period
Barclays continues to be in excess of the minimum transitional and fully loaded capital requirements and PRA capital and leverage requirements.
The fully loaded CET1 ratio increased to 12.4% (2015: 11.4%) reflecting an increase in CET1 capital of £4.5bn to £45.2bn, despite RWAs increasing by £7bn to £366bn.
The increase in CET1 capital was largely driven by profits of £2.1bn generated in the period, after absorbing the impact of notable items. Other favourable movements included the currency translation reserve as a result of the appreciation of all major currencies against Sterling.
The increase in RWAs was principally due to the appreciation of South African Rand, US Dollar and Euro against Sterling and business growth, which more than offset RWA reductions inNon-Core.
The leverage ratio increased to 4.6% (2015: 4.5%) driven by a £5.8bn increase in fully loaded Tier 1 capital to £52.0bn partially offset by an increase in the leverage exposure of £97bn to £1,125bn.
Total IFRS assets increased 8% to £1,213bn from 2015 contributing to the 9% increase in leverage exposure.
The IFRS asset increase was mainly driven by loans and advances and other assets which increased £82bn to £707bn. The increase was primarily due to the appreciation of major currencies against Sterling, an increase in liquidity pool assets, and lending growth in Barclays UK and Barclays International. This was partially offset by the rundown and exit ofNon-Core assets.
Net derivative leverage exposure, remained broadly flat as an increase in assets of £19bn to £347bn was offset by an increase in derivative liabilities resulting in regulatory derivative netting increasing £20bn to £313bn. The increase was mainly within foreign exchange derivatives driven by an increase in trade volumes and appreciation of all major currencies against Sterling.
Regulatory minimum capital and leverage requirements
Capital
Barclays’ current regulatory requirement is to meet a fully loaded CRD IV CET1 ratio comprising the required 4.5% minimum CET1 ratio and, phased in from 2016, a Combined Buffer Requirement. This currently comprises a Capital Conservation Buffer (CCB) of 2.5% and a Globally Systemically Important Institution(G-SII) buffer determined by the PRA in line with guidance from the Financial Stability Board (FSB). Both buffers are subject to phased implementation, the CCB is phased in at 25% per annum with 0.625% applicable for 2016. TheG-SII buffer for 2016 and 2017 has been set at 2% and is also phased in at 25% per annum with 0.5% applicable for 2016 and 1% for 2017. On 21 November 2016 the FSB confirmed that theG-SII buffer for 2018 will be 1.5% with 1.1% applicable for 2018 and taking full effect from 2019 onwards.
Also forming part of the Combined Buffer Requirement is a Counter-Cyclical Capital Buffer (CCyB) and a Systemic Risk Buffer (SRB). On 30 November 2016 the Financial Policy Committee (FPC) reaffirmed that it expects to maintain a CCyB of 0% on UK exposures until at least June 2017. Other national authorities also determine the appropriate CCyBs that should be applied to exposures in their jurisdiction. During 2016, CCyBs started to apply for Barclays’ exposures to other jurisdictions; however based on current exposures these are not material. No SRB has been set to date.
In addition, Barclays’ Pillar 2A requirement as per the PRA’s Individual Capital Guidance (ICG) for 2016 based on a point in time assessment was 3.9% of which 56% needs to be met in CET1 form, equating to approximately 2.2% of RWAs. The Pillar 2A requirement is subject to at least annual review and for 2017 Barclays’ Pillar 2Aadd-on will be 4.0%, with approximately 2.3% of RWAs needing to be met in CET1 form. All capital, RWA and leverage calculations reflect Barclays’ interpretation of the current rules.
The CRD IV CET1 transitional minimum capital requirement for 2016 is 7.8% including the 4.5% CET1 ratio requirement, 2.2% of Pillar 2A, a 0.625% CCB buffer, a 0.5%G-SII buffer and a 0% CCyB.
Leverage
Effective 1 January 2016, Barclays is required to disclose a leverage ratio and an average leverage ratio applicable to the Group:
| § | The leverage ratio is consistent with the December 2015 method of calculation and has been included in our disclosure. The calculation uses the end point CRR definition of Tier 1 capital for the numerator and the CRR definition of leverage exposure. The current expected minimum fully loaded requirement is 3%, but this could be impacted by the Basel Consultation on the Leverage Framework |
| § | The average leverage ratio as outlined by the PRA Supervisory Statement SS45/15 and the updated PRA rulebook is calculated as the capital measure divided by the exposure measure, where the capital and exposure measure is based on the average of the last day of each month in the quarter. The expected end point minimum requirement is 3.5% comprising of the 3% minimum requirement, a fully phased inG-SII additional leverage ratio buffer(G-SII ALRB) and a countercyclical leverage ratio buffer (CCLB). The minimum requirement is on a phased basis in line with CET1G-SII buffer which results in a minimum requirement of 3.175% at 31 December 2016. |
In August 2016, the PRA implemented the FPC’s recommendation to allow firms to exclude qualifying central bank claims from the calculation of the leverage exposure measure, as long as these are matched by deposits denominated in the same currency, subject to firms obtaining permission from the PRA. This change in reporting requirements is effective 1 April 2017, which will result in a modification to the calculation of the exposure measure for the purpose of calculating the UK leverage ratio. At 31 December 2016, Barclays’ reported leverage ratio and average leverage ratio disclosed is unaffected by this announcement as firms are required to disclose based on the existing rules.
| 154 | Barclays PLC and Barclays Bank PLC 2016 Annual Report on Form 20-F |
Capital Resources
The CRR and Capital Requirements Directive (CRD) implemented Basel III within the EU (collectively known as CRD IV) on 1 January 2014. The rules are supplemented by Regulatory Technical Standards and the PRA’s rulebook, including the implementation of transitional rules. However, rules and guidance are still subject to change as certain aspects of CRD IV are dependent on final technical standards and clarifications to be issued by the EBA and adopted by the European Commission and the PRA.
Capital ratios | ||||||
As at 31 December | 2016 | 2015 | ||||
Fully Loaded CET1a,b | 12.4% | 11.4% | ||||
PRA Transitional Tier 1c,d | 15.6% | 14.7% | ||||
PRA Transitional Total Capitalc,d | 19.6% | 18.6% | ||||
Capital resources (audited) | ||||||
As at 31 December | | 2016 £m |
| 2015 £m | ||
Shareholders’ equity (excludingnon-controlling interests) per the balance sheet | 64,873 | 59,810 | ||||
Less: other equity instruments (recognised as AT1 capital) | (6,449) | (5,305) | ||||
Adjustment to retained earnings for foreseeable dividends | (388) | (631) | ||||
Minority interests (amount allowed in consolidated CET1) | 1,825 | 950 | ||||
Other regulatory adjustments and deductions | ||||||
Additional value adjustments (PVA) | (1,571) | (1,602) | ||||
Goodwill and intangible assets | (9,054) | (8,234) | ||||
Deferred tax assets that rely on future profitability excluding temporary differences | (494) | (855) | ||||
Fair value reserves related to gains or losses on cash flow hedges | (2,104) | (1,231) | ||||
Excess of expected losses over impairment | (1,294) | (1,365) | ||||
Gains or losses on liabilities at fair value resulting from own credit | 86 | 127 | ||||
Defined benefit pension fund assets | (38) | (689) | ||||
Direct and indirect holdings by an institution of own CET1 instruments | (50) | (57) | ||||
Deferred tax assets arising from temporary differences (amount above 10% threshold) | (183) | – | ||||
Other regulatory adjustments | 45 | (177) | ||||
Fully loaded CET1 capital | 45,204 | 40,741 | ||||
Additional Tier 1 (AT1) capital | ||||||
Capital instruments and the related share premium accounts | 6,449 | 5,305 | ||||
Qualifying AT1 capital (including minority interests) issued by subsidiaries | 5,445 | 6,718 | ||||
Other regulatory adjustments and deductions | (130) | (130) | ||||
Transitional AT1 capitale | 11,764 | 11,893 | ||||
PRA transitional Tier 1 capital | 56,968 | 52,634 | ||||
Tier 2 (T2) capital | ||||||
Capital instruments and the related share premium accounts | 3,769 | 1,757 | ||||
Qualifying Tier 2 capital (including minority interests) issued by subsidiaries | 11,366 | 12,389 | ||||
Other regulatory adjustments and deductions | (257) | (253) | ||||
PRA transitional total regulatory capital | 71,846 | 66,527 | ||||
Notes
| a | The transitional regulatory adjustments to CET1 capital are no longer applicable resulting in CET1 capital on a fully loaded basis being equal to that on a transitional basis. |
| b | The CRD IV CET1 ratio (FSA October 2012 transitional statement) as applicable to Barclays’ Tier 2 Contingent Capital Notes was 13.7% based on £50.0bn of transitional CRD IV CET 1 capital and £366bn RWAs.The transitional CET1 ratio according to the FSA October 2012 transitional statement would be 13.7%. This is calculated as CET1 capital as adjusted for the transitional relief (£50.0bn), divided by CRD IV RWAs. The following transitional relief items are added back to CET1 capital: Goodwill and Intangibles (£3.6bn), Deferred tax asset (£0.2bn), Expected losses over impairment (£0.5bn), Excess minority interest (£0.2bn) and Deferred tax assets arising from temporary differences (amount above 10% threshold) (£0.2bn). |
| c | The PRA transitional capital is based on the PRA Rulebook and accompanying supervisory statements. |
| d | As at 31 December 2016, Barclays’ fully loaded Tier 1 capital was £51,993m, and the fully loaded Tier 1 ratio was 14.2%. Fully loaded total regulatory capital was £67,772m and the fully loaded total capital ratio was 18.5%. The fully loaded Tier 1 capital and total capital measures are calculated without applying the transitional provisions set out in CRD IV and assessing compliance of AT1 and Tier 2 instruments against the relevant criteria in CRD IV. |
| e | Of the £11.8bn transitional AT1 capital, fully loaded AT1 capital used for the leverage ratio comprises the £6.4bn capital instruments and related share premium accounts, £0.5bn qualifying minority interests and £0.1bn capital deductions. It excludes legacy Tier 1 capital instruments issued by subsidiaries that are subject to grandfathering. |
| Barclays PLC and Barclays Bank PLC 2016 Annual Report on Form 20-F | 155 |
Risk review
Risk performance
Funding risk – Capital
Movement in CET1 capital | ||
2016 £m | ||
Opening balance as at 1 January | 40,741 | |
Profit for the period attributable to equity holders | 2,080 | |
Own credit | (41) | |
Dividends paid and foreseen | (843) | |
Increase in retained regulatory capital generated from earnings | 1,196 | |
Net impact of share awards | 535 | |
Available for sale reserves | (391) | |
Currency translation reserves | 3,674 | |
Other reserves | (778) | |
Increase in other qualifying reserves | 3,040 | |
Retirement benefit reserve | (988) | |
Defined benefit pension fund asset deduction | 651 | |
Net impact of pensions | (337) | |
Minority interests | 875 | |
Additional value adjustments (PVA) | 31 | |
Goodwill and intangible assets | (820) | |
Deferred tax assets that rely on future profitability excluding those arising from temporary differences | 361 | |
Excess of expected loss over impairment | 71 | |
Direct and indirect holdings by an institution of own CET1 instruments | 7 | |
Deferred tax assets arising from temporary differences (amount above 10% threshold) | (183) | |
Other regulatory adjustments | 222 | |
Increase in regulatory capital due to adjustments and deductions | 564 | |
Closing balance as at 31 December | 45,204 | |
The CET1 ratio improved to 12.4% (2015: 11.4%) primarily driven by an increase in CET1 capital of £4.5bn to £45.2bn as a result of profits of £2.1bn generated in the year, after absorbing the impact of notable items. Regulatory capital generated from earnings after absorbing the impact of own credit and dividends paid and foreseen increased CET1 capital by £1.2bn. Other significant movements in the year were:
| § | a £3.0bn increase in other qualifying reserves including a £3.7bn increase in the currency translation reserves as US Dollar, Euro and South African Rand strengthened against Sterling; partially offset by a £0.4bn decrease as a result of preference share redemptions and a £0.4bn decrease in available for sale reserves; |
| § | a £0.3bn decrease, net of tax, as a result of movements relating to pensions. There was a £1.0bn decrease in the retirement benefit reserve largely due to the UKRF, which is the Group’s main pension scheme, moving from a £0.8bn surplus in December 2015 to a £27m deficit in December 2016. The decrease in reserves was partially offset by the removal of a £0.7bn capital deduction for the UKRF asset in December 2015; |
| § | a £0.9bn increase in minority interests following the sale of 12.2% of BAGL’s issued share capital was partially offset by £0.3bn higher capital deductions. |
Transitional AT1 capital remained largely flat in the period as redemptions and repurchases of £1.3bn of CRD IV end point non qualifying preference shares, tier one notes and reserve capital instruments were offset by the issuance of $1.5bn of end point qualifying AT1 capital instruments.
| 156 | Barclays PLC and Barclays Bank PLC 2016 Annual Report on Form 20-F |
Risk weighted assets
Risk weighted assets (RWAs) by risk type and business |
| |||||||||||||||||||||||||||||||||||||||
| Credit risk | Counterparty credit riska,b | Market risk | | Operational risk | | | Total RWAs |
| ||||||||||||||||||||||||||||||||
As at 31 December 2016 | | Std £m |
| | IRB £m |
| | Std £m |
| | IRB £m |
| | Settlement Risk £m |
| | CVA £m |
| | Std £m |
| | IMA £m |
| £m | £m | ||||||||||||||
Barclays UK | 5,592 | 49,591 | 47 | – | – | – | – | – | 12,293 | 67,523 | ||||||||||||||||||||||||||||||
Barclays International | 53,201 | 82,327 | 13,515 | 13,706 | 30 | 3,581 | 9,343 | 9,460 | 27,538 | 212,701 | ||||||||||||||||||||||||||||||
Head Officec | 9,048 | 27,122 | 77 | 1,157 | – | 927 | 482 | 2,323 | 12,156 | 53,292 | ||||||||||||||||||||||||||||||
Barclays Core | 67,841 | 159,040 | 13,639 | 14,863 | 30 | 4,508 | 9,825 | 11,783 | 51,987 | 333,516 | ||||||||||||||||||||||||||||||
BarclaysNon-Core | 4,714 | 9,945 | 1,043 | 6,081 | 37 | 2,235 | 477 | 2,928 | 4,673 | 32,133 | ||||||||||||||||||||||||||||||
Barclays Group | 72,555 | 168,985 | 14,682 | 20,944 | 67 | 6,743 | 10,302 | 14,711 | 56,660 | 365,649 | ||||||||||||||||||||||||||||||
As at 31 December 2015 | ||||||||||||||||||||||||||||||||||||||||
Barclays UK | 6,562 | 50,763 | 26 | – | – | – | – | – | 12,174 | 69,525 | ||||||||||||||||||||||||||||||
Barclays International | 45,892 | 77,275 | 10,463 | 11,055 | 516 | 3,406 | 8,373 | 10,196 | 27,657 | 194,833 | ||||||||||||||||||||||||||||||
Head Officec | 8,291 | 20,156 | 54 | 538 | 8 | 382 | 399 | 1,903 | 8,003 | 39,734 | ||||||||||||||||||||||||||||||
Barclays Core | 60,745 | 148,194 | 10,543 | 11,593 | 524 | 3,788 | 8,772 | 12,099 | 47,834 | 304,092 | ||||||||||||||||||||||||||||||
BarclaysNon-Core | 8,704 | 12,797 | 1,653 | 9,430 | 1 | 7,480 | 1,714 | 3,679 | 8,826 | 54,284 | ||||||||||||||||||||||||||||||
Barclays Group | 69,449 | 160,991 | 12,196 | 21,023 | 525 | 11,268 | 10,486 | 15,778 | �� | 56,660 | 358,376 | |||||||||||||||||||||||||||||
Movement analysis of risk weighted assets |
| |||||||||||||||||||||||||||||||||||||||
Risk weighted assets | | Credit risk £bn | | | Counterparty credit risk £bn | a,b
| | Market risk £bn | | | Operational risk £bn |
| | Total RWAs £bn |
| |||||||||||||||||||||||||
As at 1 January 2016 | 230.4 | 45.0 | 26.3 | 56.7 | 358.4 | |||||||||||||||||||||||||||||||||||
Book size | 0.8 | 1.2 | (0.6) | – | 1.4 | |||||||||||||||||||||||||||||||||||
Acquisitions and disposals | (6.4) | (0.2 | ) | – | – | (6.6) | ||||||||||||||||||||||||||||||||||
Book quality | (0.5) | (0.4 | ) | 0.6 | – | (0.3) | ||||||||||||||||||||||||||||||||||
Model updates | (2.9) | (2.0 | ) | (0.3) | – | (5.2) | ||||||||||||||||||||||||||||||||||
Methodology and policy | 1.1 | (1.2 | ) | (1.0) | – | (1.1) | ||||||||||||||||||||||||||||||||||
Foreign exchange movementd |
| 19.0 | – | – | – | 19.0 | ||||||||||||||||||||||||||||||||||
As at 31 December 2016 | 241.5 | 42.4 | 25.0 | 56.7 | 365.6 | |||||||||||||||||||||||||||||||||||
RWAs increased £7.2bn to £365.6bn, driven by:
| § | book size increased RWAs by £1.4bn primarily due to an increase in trading activity in Barclays International and business growth in corporate and consumer lending partially offset by securitisation transactions |
| § | acquisitions and disposals decreased RWAs by £6.6bn primarily due to the rundown ofNon-Core portfolios, including the sale of Portuguese and Italian businesses |
| § | model updates decreased RWAs by £5.2bn primarily driven by model changes in Barclays UK mortgages following formal approval |
| § | methodology and Policy decreased RWAs by £1.1bn primarily driven by the effect of collateral modelling for mismatched FX collateral on average CVA and a new treatment for sovereign exposures partly offset by modelled wholesale recalibration |
| § | foreign exchange movements increased RWAs by £19.0bn primarily driven by the appreciation of South African Rand, US Dollar and Euro against Sterling. |
Notes
| a | RWAs in relation to default fund contributions are included in counterparty credit risk. |
| b | RWAs in relation to credit valuation adjustment (CVA) are included in counterparty credit risk. |
| c | Includes Africa Banking discontinued operations. |
| d | Foreign exchange movement does not include FX for modelled counterparty risk or modelled market risk. |
| Barclays PLC and Barclays Bank PLC 2016 Annual Report on Form 20-F | 157 |
Risk review
Risk performance
Funding risk – Capital
Leverage ratio and exposures
At 31 December 2016, Barclays’ leverage ratio was 4.6% (2015: 4.5%) and the average leverage ratio was 4.3%, which exceeds the transitional minimum requirement for Barclays of 3.175% and expected end point minimum requirement of 3.5%.
The impact of the PRA rule modification to allow firms to exclude qualifying central bank claims from the calculation of the leverage exposure measure would have resulted in an average leverage ratio of 4.5% and a leverage ratio at 31 December 2016 of 5.0%.
Leverage exposure | ||||||||
| | As at 31.12.16 £bn | | | As at 31.12.15 £bn | | |||
Accounting assets | ||||||||
Derivative financial instruments | 347 | 328 | ||||||
Cash collateral | 67 | 62 | ||||||
Reverse repurchase agreements and other similar secured lending | 13 | 28 | ||||||
Financial assets designated at fair valuea | 79 | 77 | ||||||
Loans and advances and other assets | 707 | 625 | ||||||
Total IFRS assets | 1,213 | 1,120 | ||||||
Regulatory consolidation adjustments | (6) | (10) | ||||||
Derivatives adjustments | ||||||||
Derivatives netting | (313) | (293) | ||||||
Adjustments to cash collateral | (50) | (46) | ||||||
Net written credit protection | 12 | 15 | ||||||
Potential Future Exposure (PFE) on derivatives | 136 | 129 | ||||||
Total derivatives adjustments | (215) | (195) | ||||||
Securities financing transactions (SFTs) adjustments | 29 | 16 | ||||||
Regulatory deductions and other adjustments | (15) | (14) | ||||||
Weightedoff-balance sheet commitments | 119 | 111 | ||||||
Total leverage exposure | 1,125 | 1,028 | ||||||
Fully loaded CET1 capital | 45.2 | 40.7 | ||||||
Fully loaded AT1 capital | 6.8 | 5.4 | ||||||
Fully loaded Tier 1 capital | 52.0 | 46.2 | ||||||
Leverage ratio | 4.6% | 4.5% |
The leverage ratio increased to 4.6% (2015: 4.5%) primarily driven by a £5.8bn increase in fully loaded Tier 1 capital to £52.0bn (December 2015: £46.2bn), partially offset by an increase in the leverage exposure of £97bn to £1,125bn (2015: £1,028bn):
| § | the IFRS asset increase was mainly driven by loans and advances and other assets which increased £82bn to £707bn. The increase was primarily due to the appreciation of major currencies against Sterling, an increase in liquidity pool assets, and lending growth in Barclays UK and Barclays International. This was partially offset by the rundown and exit ofNon-Core assets |
| § | SFT adjustments increased by £13bn to £29bn, primarily as a result of a change in treatment of securitiespre-positioned for use against undrawn central bank lending facilities |
| § | PFE on derivatives increased by £7bn to £136bn primarily driven by the appreciation of major currencies against Sterling, partially offset by compression activity, sale of positions and maturity of trades |
| § | weightedoff-balance sheet commitments increased by £8bn to £119bn primarily driven by the appreciation of major currencies against Sterling. |
The average leverage exposure measure for Q4 2016 was £1,206bn resulting in an average leverage ratio of 4.3%. The CET1 capital held against the 0.175% transitionalG-SII ALRB was £2bn. The impact of the CCLB is currently nil.
The difference between the average leverage ratio and the leverage ratio was primarily driven by higher positions in October and November within trading portfolio assets, reverse repurchase agreements and settlements balances.
Note
| a | Included within financial assets designated at fair value are reverse repurchase agreements designated at fair value of £63bn (2015: £50bn). |
| 158 | Barclays PLC and Barclays Bank PLC 2016 Annual Report on Form 20-F |
Risk review
Risk performance
Funding risk – liquidity
Analysis of liquidity risk
Liquidity risk is the risk that a firm, although solvent, either does not have sufficient financial resources available to enable it to meet its obligations as they fall due, or can secure such resources only at excessive cost.
This section details the Group’s liquidity risk profile and provides information on the way the Group manages that risk.
Key metrics
131% LCR The Group strengthened its liquidity position during the year, increasing its surplus to internal and regulatory requirements
£12bn Term Issuance The Group maintains access to stable and diverse sources of funding across customer deposits and wholesale debt
|

| Barclays PLC and Barclays Bank PLC 2016 Annual Report on Form 20-F | 159 |
| Summary of Contents | Page
| |||||
§ Liquidity risk overview and summary of performance § Liquidity risk stress testing – Liquidity Risk appetite – Liquidity regulation – Internal and regulatory stress tests
| 161 161 161 162 163
|
The risk that the firm, although solvent, either does not have sufficient financial resources available to enable it to meet its obligations as they fall due, or can secure such resources only at excessive cost.
This section provides an overview of the Group’s liquidity risk. | ||||
§ Liquidity pool – Composition of the liquidity pool – Liquidity pool by currency – Management of the group liquidity pool – Contingent liability
|
164 164 164 164 165
|
The liquidity pool is held unencumbered and is not used to support payment or clearing requirements. The liquidity pool is intended to offset stress outflows, and comprises cash and unencumbered assets. | ||||
§ Funding structure and funding relationships – Deposit funding – Behavioural Maturity Profile – Wholesale funding – Term financing
|
165 165 166 166 168
|
The basis for sound liquidity risk management is a solid funding structure that reduces the probability of a liquidity stress leading to an inability to meet funding obligations as they fall due. | ||||
§ Encumbrance – On-balance sheet – Off-balance sheet – Repurchase agreements and reverse repurchase agreements
|
168 169 169 171
|
Asset encumbrance arises from collateral pledged against secured funding and other collateralised obligations. Barclays funds a portion of trading portfolio assets and other securities via repurchase agreements and other similar borrowing, and pledges a portion of customer loans and advances as collateral in securitisation, covered bond and other similar secured structures.
| ||||
§ Credit ratings – Contractual credit rating downgrade exposure |
172 172 |
In addition to monitoring and managing key metrics related to the financial strength of the Group, Barclays solicits independent credit ratings.
These ratings assess the creditworthiness of the Group, its subsidiaries and branches and are based on reviews of a broad range of business and financial attributes including risk management processes and procedures, capital strength, earnings, funding, asset quality, liquidity, accounting and governance.
| ||||
§ Liquidity management at BAGL Group |
173 |
Liquidity risk is managed separately at BAGL Group due to local currency, funding and regulatory requirements.
| ||||
§ Contractual maturity of financial assets and liabilities |
174 |
Provides details on the contractual maturity of all financial instruments and other assets and liabilities. |
| 160 | Barclays PLC and Barclays Bank PLC 2016 Annual Report on Form 20-F |
Risk review
Risk performance
Funding risk – liquidity
Liquidity risk
Liquidity risk is the risk that the Group, although solvent, either does not have sufficient financial resources available to meet its obligations as they fall due, or can secure such resources only at excessive cost. This also results in a firm’s inability to meet regulatory liquidity requirements. This risk is inherent in all banking operations and can be affected by a range of Group-specific and market-wide events.
All disclosures in this section (pages 161 to 177) are unaudited and exclude BAGL unless otherwise stated.
|
Overview
The Group has a comprehensive Key Risk Control Framework for managing the Group’s liquidity risk. The Liquidity Framework meets the PRA’s standards and is designed to ensure the Group maintains liquidity resources that are sufficient in amount and quality, and a funding profile that is appropriate to meet the liquidity risk appetite. The Liquidity Framework is delivered via a combination of policy formation, review and governance, analysis, stress testing, limit setting and monitoring.
Liquidity risk is managed separately at Barclays Africa Group Limited (BAGL) due to local currency and funding requirements. Unless stated otherwise, all disclosures in this section exclude BAGL and they are reported on a standalone basis. Adjusting for local requirements, BAGL liquidity risk is managed on a consistent basis to the Group.
This section provides an analysis of the Group’s: i) liquidity risk stress testing; ii) internal and regulatory stress tests; iii) liquidity pool; iv) funding structure and funding relationships; v) wholesale funding; vi) term financing; vii) encumbrance; viii) repurchase agreements; ix) credit ratings; x) liquidity management at BAGL; and xi) contractual maturity of financial assets and liabilities.
For further detail on liquidity risk governance and framework see page 384.
Summary of performance in the period
The Group continued to maintain surpluses to its internal and regulatory requirements. The liquidity pool increased to £165bn (2015: £145bn), primarily driven by the depreciation of GBP against other major currencies and net increase in retail and commercial deposits and wholesale funding to support business growth. The Liquidity Coverage Ratio (LCR) was 131% (December 2015: 133%), equivalent to a surplus of £39bn (December 2015: £37bn). Wholesale funding outstanding excluding repurchase agreements was £158bn (December 2015: £142bn). The increase was driven by the prudent management of the liquidity position, holding company issuance and depreciation of GBP against other major currencies. The Group issued £12.1bn equivalent of capital and senior unsecured debt from the holding company of which £8.6bn equivalent and £0.7bn equivalent in public and private senior unsecured debt respectively, and £2.8bn of capital instruments. In the same period £7.4bn of Barclays Bank PLC capital and senior unsecured debt was bought back or called.
Liquidity risk stress testing
Under the Liquidity Framework, the Group has established a Liquidity Risk Appetite (LRA) together with the appropriate limits for the management of the liquidity risk. This is the level of liquidity risk the Group chooses to take in pursuit of its business objectives and in meeting its regulatory obligations. The key expression of the liquidity risk is through internal stress tests. It is measured with reference to the liquidity pool compared to anticipated stressed net contractual and contingent outflows for each of three short-term stress scenarios.
Liquidity Risk Appetite
As part of the LRA, the Group runs three primary short-term liquidity stress scenarios, aligned to the PRA’s prescribed stresses:
| § | 90-day market-wide stress event |
| § | 30-day Barclays-specific stress event |
| § | combined30-day market-wide and Barclays-specific stress event. |
Under normal market conditions, the liquidity pool is managed to be at a target of at least 100% of anticipated outflows under each of these stress scenarios. The30-day Barclays-specific stress scenario results in the greatest net outflows of each of the liquidity stress tests. The combined30-day scenario assumes outflows consistent with a firm-specific stress for the first two weeks of the stress period, followed by relatively lower outflows consistent with a market-wide stress for the remainder of the stress period.
Barclays also evaluates its long-term LRA, one year stress test based on prolonged closure of capital markets.
| Barclays PLC and Barclays Bank PLC 2016 Annual Report on Form 20-F | 161 |
| Key LRA assumptions include: | ||
| For the year ended 31 December 2016 | ||
Drivers of Liquidity Risk | LRA Specific Stress – Key Assumptions | |
Wholesale Secured and Unsecured Funding Risk |
§ Zero rollover of maturing wholesale unsecured funding § Loss of repo capacity onnon-extremely liquid repos at contractual maturity date § Withdrawal of contractual buyback obligations, excess client futures margin, PB client cash and overlifts § Haircuts applied to the market value of marketable assets held in the liquidity buffer
| |
Retail and Corporate Funding Risk
|
§ Retail and Corporate deposit outflows as counterparties seek to diversify their deposit balances
| |
Intra-day Liquidity Risk
|
§ Liquidity held againstintra-day requirements for the settlement of cash and securities under a stress
| |
Intra-Group Liquidity Risk
|
§ Liquidity support for material subsidiaries. Surplus liquidity held within certain subsidiaries is not taken as a benefit to the wider Group.
| |
Cross-Currency Liquidity Risk
|
§ Currency liquidity cash flows at contractual maturity for physically settled FX forwards and cross currency swaps
| |
Off-Balance Sheet Liquidity Risk |
§ Drawdown on committed facilities based on facility and counterparty type § Collateral outflows due to a 2 notch credit rating downgrade § Increase in the Group’s initial margin requirement across all major exchanges § Variation margin outflows from collateralised risk positions § Outflow of collateral owing but not called § Loss of internal sources of funding within the Prime Brokerage synthetics business
| |
Franchise-Viability Risk
|
§ Liquidity held in order to meet outflows that arenon-contractual in nature, but are necessary in order to support the firm’s ongoing franchise (e.g. debt buybacks)
| |
Funding Concentration Risk
|
§ Liquidity held against largest wholesale funding counterparty refusing to roll
| |
Management Actions
|
§ Specifically defined actions that raise liquidity or mitigate cash outflows that would be conducted in a manner so as not to increase market volatility, whilst maintaining all core franchises
| |
Liquidity regulation
The Group monitors its position against the CRD IV Delegated Act Liquidity Coverage Ratio (LCR) and the Basel III Net Stable Funding Ratio (NSFR).
The LCR is designed to promote short-term resilience of a bank’s liquidity risk profile by ensuring that it holds sufficient High Quality Liquid Assets to survive an acute stress scenario lasting for 30 days. The NSFR has a time horizon of 12 months and has been developed to promote a sustainable maturity structure of assets and liabilities.
The CRD IV LCR became effective on 1 October 2015, with a minimum ratio requirement in the UK of 80% as at 31 December 2016; this will increase to 90% on 1 January 2017 and then to 100% on 1 January 2018. As of 31 December 2016, the Group reported a CRD IV LCR of 131% (2015: 133%).
In October 2014, the BCBS published a final standard for the NSFR with the minimum requirement to be introduced in January 2018 at 100% on an ongoing basis. On 23 November 2016 the European Commission published draft amendments to the Capital Requirements Regulation (CRR) including its proposed implementation of NSFR in the EU. This proposal makes a number of changes from Basel NSFR, particularly in the treatment of derivative and secured financing transactions. Barclays is in the process of assessing the impact of these changes on its NSFR ratio, and notes that NSFR is not proposed to be a binding regulation in the EU until two years after the European legislation is finalised. We remain above 100% well ahead of implementation timelines, based on a conservative interpretation of the Basel rule.
| 162 | Barclays PLC and Barclays Bank PLC 2016 Annual Report on Form 20-F |
Risk review
Risk performance
Funding risk – liquidity
Comparing internal and regulatory liquidity stress tests
The LRA stress scenarios and the CRD IV LCR are all broadly comparable short-term stress scenarios in which the adequacy of defined liquidity resources is assessed against contractual and contingent stress outflows. The CRD IV LCR stress tests provide an independent assessment of the Group’s liquidity risk profile.
Stress Test | Barclays LRA | CRD IV LCR | ||
Time Horizon | 30 to 90 days | 30 days | ||
Calculation | Liquid assets to net cash outflows | Liquid assets to net cash outflows |
As at 31 December 2016, the Group held eligible liquid assets in excess of 100% of stress requirements for all three short-term LRA scenarios and the CRD IV LCR requirement.
| Compliance with internal and regulatory stress tests | ||||||||
As at 31 December 2016 | | Barclays’ LRA (30 day Barclays- specific £bn |
| | CRD IV LCRb £bn |
| ||
Eligible liquidity buffer | 173 | 166 | ||||||
Net stress outflows | (144 | ) | (127 | ) | ||||
Surplus | 29 | 39 | ||||||
Liquidity pool as a percentage of anticipated net outflows as at 31 December 2016 | 120% | 131% | ||||||
Liquidity pool as a percentage of anticipated net outflows as at 31 December 2015 | 131% | 133% | ||||||
The Group plans to maintain its surplus to the internal and regulatory stress requirements at an efficient level, while considering risks to market funding conditions and its liquidity position. The continuous reassessment of these risks may lead to appropriate actions being taken with respect to sizing of the liquidity pool.
Notes
| a | Of the three stress scenarios monitored as part of the LRA, the30-day Barclays-specific scenario results in the lowest ratio at 120% (December 2015: 131%). This compares to 134% (December 2015: 144%) under the90-day market-wide scenario, and 144% (December 2015: 133%) under the30-day combined scenario. |
| b | Includes BAGL. |
| Barclays PLC and Barclays Bank PLC 2016 Annual Report on Form 20-F | 163 |
Liquidity pool
The Group liquidity pool as at 31 December 2016 was £165bn (2015: £145bn). During 2016, themonth-end liquidity pool ranged from £132bn to £175bn (2015: £142bn to £168bn), and themonth-end average balance was £153bn (2015: £155bn). The liquidity pool is held unencumbered and is not used to support payment or clearing requirements. Such requirements are treated as part of our regular business funding. The liquidity pool is intended to offset stress outflows, and comprises the following cash and unencumbered assets.
Composition of the Group liquidity pool as at 31 December 2016 |
| |||||||||||||||||||
|
Liquidity pool £bn |
| Liquidity pool of which CRD IV LCR eligible |
|
2015 Liquidity £bn |
| ||||||||||||||
| | Cash £bn |
| | Level 1 £bn |
| | Level 2A £bn |
| ||||||||||||
Cash and deposits with central banksa | 103 | 101 | – | – | 48 | |||||||||||||||
Government bondsb | ||||||||||||||||||||
AAA to AA- | 34 | – | 34 | – | ||||||||||||||||
A+ to A- | 3 | – | 3 | – | ||||||||||||||||
BBB+ to BBB- | 1 | – | 1 | – | ||||||||||||||||
Other LCR Ineligible Government bonds | 1 | – | – | – | ||||||||||||||||
Total government bonds | 39 | – | 38 | – | 75 | |||||||||||||||
Other | ||||||||||||||||||||
Government Guaranteed Issuers, PSEs and GSEs | 12 | – | 9 | 3 | ||||||||||||||||
International Organisations and MDBs | 6 | – | 7 | – | ||||||||||||||||
Covered bonds | 1 | – | 1 | – | ||||||||||||||||
Corporate bonds | – | – | – | – | ||||||||||||||||
Other | 4 | – | – | – | ||||||||||||||||
Total Other | 23 | – | 17 | 3 | 22 | |||||||||||||||
Total as at 31 December 2016 | 165 | 101 | 55 | 3 | ||||||||||||||||
Total as at 31 December 2015 | 145 | 45 | 87 | 8 | ||||||||||||||||
The Group liquidity pool is well diversified by major currencies and the Group monitors LRA stress scenarios for major currencies.
|
| |||||||||||||||||||
Liquidity pool by currency |
| |||||||||||||||||||
|
USD £bn |
|
|
EUR £bn |
|
|
GBP £bn |
|
|
Other £bn |
|
|
Total £bn |
| ||||||
Liquidity pool as at 31 December 2016 | 44 | 36 | 49 | 36 | 165 | |||||||||||||||
Liquidity pool as at 31 December 2015 | 41 | 33 | 46 | 25 | 145 | |||||||||||||||
Management of the Group liquidity pool
The composition of the liquidity pool is subject to limits set by the Board, Treasury Committee and the independent credit risk and market risk functions. In addition, the investment of the liquidity pool is monitored for concentration risk by issuer, currency and asset type. Given the incremental returns generated by these highly liquid assets, the risk and reward profile is continuously managed.
The Group manages the liquidity pool on a centralised basis. As at 31 December 2016, 91% of the liquidity pool was located in Barclays Bank PLC (2015: 94%) and was available to meet liquidity needs across the Group. The residual liquidity pool is held predominantly within Barclays Capital Inc. (BCI). The portion of the liquidity pool outside of Barclays Bank PLC is held against entity-specific stressed outflows and regulatory requirements. To the extent the use of this portion of the liquidity pool is restricted due to regulatory requirements, it is assumed to be unavailable to the rest of the Group.
Notes
| a | Of which over 98% (2015: over 97%) was placed with the Bank of England, US Federal Reserve, European Central Bank, Bank of Japan and Swiss National Bank. |
| b | Of which over 90% (2015: over 92%) are comprised of UK, US, Japanese, French, German, Danish, Swiss and Dutch securities. |
| 164 | Barclays PLC and Barclays Bank PLC 2016 Annual Report on Form 20-F |
Risk review
Risk performance
Funding risk – liquidity
Contingent liquidity
In addition to the Group liquidity pool, the Group has access to other unencumbered assets which provide a source of contingent liquidity. While these are not relied on in the Group’s LRA, a portion of these assets may be monetised in a stress to generate liquidity through use as collateral for secured funding or through outright sale.
In either a Barclays-specific or market-wide liquidity stress, liquidity available via market sources could be severely disrupted. In circumstances where market liquidity is unavailable or available only at heavily discounted prices, the Group could generate liquidity via central bank facilities. The Group maintains a significant amount of collateralpre-positioned at central banks and available to raise funding.
For more detail on the Group’s other unencumbered assets see page 168.
Funding structure and funding relationships
The basis for sound liquidity risk management is a solid funding structure that reduces the probability of a liquidity stress leading to an inability to meet funding obligations as they fall due. The Group’s overall funding strategy is to develop a diversified funding base (geographically, by type and by counterparty) and maintain access to a variety of alternative funding sources, to provide protection against unexpected fluctuations, while minimising the cost of funding.
Within this, the Group aims to align the sources and uses of funding. As such, retail and commercial customer loans and advances are largely funded by customer deposits, with the surplus funding the liquidity pool. Other assets, together with other loans and advances and unencumbered assets, are funded by long-term wholesale debt and equity.
The majority of reverse repurchase agreements are matched by repurchase agreements. The liquidity pool is predominantly funded through wholesale markets. These funding relationships are summarised below:
| Assets |
|
2016 £bn |
|
|
2015 £bn |
| Liabilities |
|
2016 £bn |
|
|
2015 £bn |
| |||||||
| Loans and advances to customersa | 326 | 336 | Customer accountsa | 374 | 374 | |||||||||||||||
| Group liquidity pool | 165 | 145 | < 1 Year wholesale funding | 70 | 54 | |||||||||||||||
| > 1 Year wholesale funding | 88 | 88 | ||||||||||||||||||
| Other assets | 185 | 135 | Equity and other liabilities | 151 | 104 | |||||||||||||||
Reverse repurchase agreements and other similar secured lendingb | 190 | 178 | Repurchase agreements and other similar secured borrowingb | 190 | 178 | |||||||||||||||
| Derivative financial instrumentsb | 347 | 326 | Derivative financial instrumentsb | 340 | 322 | |||||||||||||||
| Total assets | 1,213 | 1,120 | Total liabilities | 1,213 | 1,120 |
Deposit funding
Deposit funding (audited) |
| |||||||||||||||
| 2016 | 2015 | |||||||||||||||
Funding of loans and advances to customers As at 31 December 2016 |
|
Loans and £bn |
|
|
Customer £bn |
|
|
Loan to % |
|
|
Loan to % |
| ||||
Barclays UK | 167 | 189 | – | – | ||||||||||||
Barclays International | 98 | 152 | – | – | ||||||||||||
Non-Core | 19 | – | – | – | ||||||||||||
Total Barclays UK, Barclays International andNon-Corec | 284 | 341 | 83% | 86% | ||||||||||||
Barclays International, Head Office andNon-Cored | 109 | 82 | ||||||||||||||
Total | 393 | 423 | 93% | 95% | ||||||||||||
Total Barclays UK, Barclays International andNon-Corec are largely funded by customer deposits. The loan to deposit ratio for these businesses was 83% (2015: 86%). The customer deposits in excess of loans and advances are primarily used to fund liquidity buffer requirements for these businesses. The loan to deposit ratio for the Group was 93% (2015: 95%).
As at 31 December 2016, £139bn (2015: £129bn) of total customer deposits were insured through the UK Financial Services Compensation Scheme (FSCS) and other similar schemes. In addition to these customer deposits, there were £4bn (2015: £4bn) of other liabilities insured by governments.
Notes
| a | Excluding cash collateral and settlement balances. |
| b | Comprised of reverse repurchase agreements that provide financing to customers collateralised by highly liquid securities on a short-term basis or are used to settle short-term inventory positions and repo financing of trading portfolio assets. |
| c | Excluding investment banking businesses. |
| d | Including investment banking businesses. |
| Barclays PLC and Barclays Bank PLC 2016 Annual Report on Form 20-F | 165 |
Although, contractually, current accounts are repayable on demand and savings accounts at short notice, the Group’s broad base of customers, numerically and by depositor type, helps protect against unexpected fluctuations in balances. Such accounts form a stable funding base for the Group’s operations and liquidity needs. The Group assesses the behavioural maturity of both customer assets and liabilities to identify structural balance sheet funding gaps. Customer behaviour is determined by quantitative modelling combined with qualitative assessment taking into account for historical experience, current customer composition, and macroeconomic projections. These behavioural profiles represent our forward looking expectation of therun-off profile. The relatively low cash outflow within one year demonstrates that customer funding remains broadly matched with customer assets from a behavioural perspective.
Behavioural maturity profile | ||||||||||||||||||||||||
| | Behavioural maturity profile cash outflow/(inflow) | | ||||||||||||||||||||||
| | Loans and advances to customers £bn | | | Customer deposits £bn | | | Customer funding surplus/ (deficit) £bn | | | Not more than one year £bn |
| | Over one year but not more than five years £bn | | | More than five years £bn | | |||||||
As at 31 December 2016 | ||||||||||||||||||||||||
Barclays UK | 167 | 189 | 22 | (2 | ) | (19 | ) | 43 | ||||||||||||||||
Barclays International | 98 | 152 | 54 | 3 | 17 | 34 | ||||||||||||||||||
BarclaysNon-Core | 19 | – | (19 | ) | (1 | ) | (6 | ) | (12 | ) | ||||||||||||||
Total | 284 | 341 | 57 | – | (8 | ) | 65 | |||||||||||||||||
As at 31 December 2015 | ||||||||||||||||||||||||
Barclays UK | 166 | 176 | 10 | (4 | ) | (26 | ) | 40 | ||||||||||||||||
Barclays International | 88 | 135 | 47 | 11 | 18 | 18 | ||||||||||||||||||
Africa (discontinued) | 29 | 29 | – | 1 | – | (1 | ) | |||||||||||||||||
BarclaysNon-Core | 17 | 8 | (9 | ) | 1 | (1 | ) | (9 | ) | |||||||||||||||
Total | 300 | 348 | 48 | 9 | (9 | ) | 48 | |||||||||||||||||
Wholesale funding Group
Wholesale funding relationships are summarised below:
Assets | | 2016 £bn | | | 2015 £bn | | Liabilities | | 2016 £bn | | | 2015 £bn | | |||||||
Trading portfolio assets | 33 | 28 | Repurchase agreements | 75 | 70 | |||||||||||||||
Reverse repurchase agreements | 42 | 42 | – | – | ||||||||||||||||
Reverse repurchase agreements | 35 | 34 | Trading portfolio liabilities | 35 | 34 | |||||||||||||||
Derivative financial instruments | 347 | 326 | Derivative financial instruments | 340 | 322 | |||||||||||||||
Liquidity pool | 108 | 97 | Less than 1 year wholesale debt | 70 | 54 | |||||||||||||||
Other assetsa | 109 | 103 | Greater than 1 year wholesale debt and equity | 154 | 150 |
Repurchase agreements fund reverse repurchase agreements and trading portfolio assets. Trading portfolio liabilities are settled by the remainder of reverse repurchase agreements (see Note 19 Offsetting financial assets and financial liabilities for further detail on netting).
Derivative liabilities and assets are largely matched. A substantial proportion of balance sheet derivative positions qualify for counterparty netting and the remaining portions are largely offset once netted against cash collateral received and paid.
Wholesale debt, along with the surplus of customer deposits to loans and advances to customers, is used to fund the liquidity pool. Term wholesale debt and equity largely fund other assets.
Note
| a | Predominantly available for sale investments, financial assets designated at fair value and loans and advances to banks funded by greater than one year wholesale debt and equity and trading portfolio assets partially. |
| 166 | Barclays PLC and Barclays Bank PLC 2016 Annual Report on Form 20-F |
Risk review
Risk performance
Funding risk – liquidity
Composition of wholesale fundinga
The Group maintains access to a variety of sources of wholesale funds in major currencies, including those available from term investors across a variety of distribution channels and geographies, money markets, and repo markets. The Group has direct access to US, European and Asian capital markets through its global investment banking operations and long-term investors through its clients worldwide, and is an active participant in money markets. As a result, wholesale funding is well diversified by product, maturity, geography and major currency.
As at 31 December 2016, the Group’s total wholesale funding outstanding (excluding repurchase agreements) was £158bn (December 2015: £142bn). £70bn (December 2015: £54bn) of wholesale funding matures in less than one year, of which £22bn (December 2015: £14bn)b relates to term funding.
As at 31 December 2016, outstanding wholesale funding comprised £26bn (December 2015: £25bn) of secured funding and £132bn (December 2015: £117bn) of unsecured funding.
As the Group progresses to a Single Point of Entry resolution model, Barclays continues to issue debt capital and term senior unsecured funding from Barclays PLC, the holding company, replacing maturing debt in Barclays Bank PLC.
Maturity profile of wholesale fundingb |
| |||||||||||||||||||||||||||||||||||||||||||
| | <1 month £bn | | | 1-3 months £bn | | | 3-6 months £bn | | | 6-12 months £bn | | | <1 year £bn | | | 1-2 years £bn | | | 2-3 years £bn | | | 3-4 years £bn | | | 4-5 years £bn | | | >5 years £bn | | | Total £bn | | ||||||||||||
Barclays PLC | ||||||||||||||||||||||||||||||||||||||||||||
Senior unsecured (Public benchmark) | – | – | – | – | – | 0.9 | 1.6 | 1.1 | 4.5 | 7.9 | 16.0 | |||||||||||||||||||||||||||||||||
Senior unsecured (Privately placed) | – | – | – | – | – | 0.1 | – | – | 0.2 | 0.5 | 0.8 | |||||||||||||||||||||||||||||||||
Subordinated liabilities | – | – | – | – | – | – | – | 1.1 | – | 2.7 | 3.8 | |||||||||||||||||||||||||||||||||
Barclays Bank PLC | ||||||||||||||||||||||||||||||||||||||||||||
Deposits from banks | 9.2 | 4.3 | 1.7 | 1.1 | 16.3 | 0.2 | – | 0.3 | – | – | 16.8 | |||||||||||||||||||||||||||||||||
Certificates of deposit and commercial paper | 0.3 | 5.2 | 5.6 | 10.9 | 22.0 | 0.7 | 1.1 | 0.5 | 0.5 | 0.3 | 25.1 | |||||||||||||||||||||||||||||||||
Asset backed commercial paper | 3.7 | 3.1 | 0.7 | – | 7.5 | – | – | – | – | – | 7.5 | |||||||||||||||||||||||||||||||||
Senior unsecured (Public benchmark) | 1.7 | 0.6 | 1.6 | – | 3.9 | – | 2.7 | 0.7 | 0.7 | 1.1 | 9.1 | |||||||||||||||||||||||||||||||||
Senior unsecured (Privately placed)c | 0.6 | 1.5 | 3.6 | 3.5 | 9.2 | 7.3 | 5.5 | 3.2 | 1.6 | 10.0 | 36.8 | |||||||||||||||||||||||||||||||||
Covered bonds | – | 1.8 | 1.6 | 1.5 | 4.9 | 1.0 | 1.8 | – | 1.0 | 3.7 | 12.4 | |||||||||||||||||||||||||||||||||
Asset backed securities | – | 0.6 | 1.0 | 0.6 | 2.2 | 0.7 | 1.4 | 0.4 | – | 0.7 | 5.4 | |||||||||||||||||||||||||||||||||
Subordinated liabilities | – | – | – | 1.3 | 1.3 | 3.2 | 0.1 | 1.0 | 5.5 | 8.5 | 19.6 | |||||||||||||||||||||||||||||||||
Otherd | 1.1 | 0.2 | 0.6 | 1.1 | 3.0 | 0.2 | 0.2 | 0.3 | 0.1 | 0.7 | 4.5 | |||||||||||||||||||||||||||||||||
Total as at 31 December 2016 | 16.6 | 17.3 | 16.4 | 20.0 | 70.3 | 14.3 | 14.4 | 8.6 | 14.1 | 36.1 | 157.8 | |||||||||||||||||||||||||||||||||
Of which secured | 3.7 | 5.6 | 3.4 | 2.3 | 15.0 | 1.8 | 3.2 | 0.4 | 1.0 | 4.4 | 25.8 | |||||||||||||||||||||||||||||||||
Of which unsecured | 12.9 | 11.7 | 13.0 | 17.7 | 55.3 | 12.5 | 11.2 | 8.2 | 13.1 | 31.7 | 132.0 | |||||||||||||||||||||||||||||||||
Total as at 31 December 2015 | 15.8 | 15.3 | 8.6 | 13.8 | 53.5 | 16.5 | 12.6 | 13.7 | 8.3 | 37.3 | 141.9 | |||||||||||||||||||||||||||||||||
Of which secured | 4.2 | 3.9 | 1.6 | 0.3 | 10.0 | 5.1 | 2.4 | 2.8 | 0.5 | 4.5 | 25.3 | |||||||||||||||||||||||||||||||||
Of which unsecured | 11.6 | 11.4 | 7.0 | 13.5 | 43.5 | 11.4 | 10.2 | 10.9 | 7.8 | 32.8 | 116.6 | |||||||||||||||||||||||||||||||||
Outstanding wholesale funding includes £37.6bn (December 2015: £35.1bn) of privately placed senior unsecured notes in issue. These notes are issued through a variety of distribution channels including intermediaries and private banks. Although not a requirement, the liquidity pool exceeded wholesale funding maturing in less than one year by £95bn (December 2015: £91bn).
Notes
| a | The composition of wholesale funds comprises the balance sheet reported deposits from banks, financial liabilities at fair value, debt securities in issue and subordinated liabilities, excluding cash collateral and settlement balances and collateral swaps. Included within deposits from banks are £4.5bn of liabilities drawn in the European Central Bank’s facilities. |
| b | Term funding maturities comprise public benchmark and privately placed senior unsecured notes, covered bonds/asset-backed securities (ABS) and subordinated debt where the original maturity of the instrument was more than 1 year. |
| c | Includes structured notes of £30.8bn, £7.7bn of which matures within one year. |
| d | Primarily comprised of fair value deposits of £3.0bn and secured financing transactions of physical gold of £0.5bn. |
| Barclays PLC and Barclays Bank PLC 2016 Annual Report on Form 20-F | 167 |
Currency composition of wholesale debt
As at 31 December 2016, the proportion of wholesale funding by major currencies was as follows:
| Currency composition of wholesale funding | ||||||||||||||||
| | USD % |
| | EUR % |
| | GBP % |
| | Other % |
| |||||
| Deposits from banks | 22 | 44 | 30 | 4 | ||||||||||||
| Certificates of deposits and commercial paper | 44 | 48 | 7 | 1 | ||||||||||||
| Asset backed commercial paper | 89 | 8 | 3 | – | ||||||||||||
| Senior unsecured (public benchmark) | 51 | 25 | 16 | 8 | ||||||||||||
| Senior unsecured (privately placed) | 48 | 25 | 11 | 16 | ||||||||||||
| Covered bonds/ABS | 30 | 42 | 28 | – | ||||||||||||
| Subordinated liabilities | 53 | 28 | 19 | – | ||||||||||||
| Total as at 31 December 2016 | 48 | 32 | 16 | 4 | ||||||||||||
| Total as at 31 December 2015 | 38 | 31 | 23 | 8 |
To manage cross-currency refinancing risk the Group manages foreign exchange cash flow limits, which limit risk at specific maturities. The composition of wholesale funding is materially unchanged.
Term financing
The Group issued £12.1bn equivalent of capital and senior unsecured debt from the holding company of which £8.6bn equivalent and £0.7bn equivalent in public and private senior unsecured debt respectively, and £2.8bn of capital instruments. In the same period £7.4bn of Barclays Bank PLC capital and senior unsecured debt was bought back or called.
The Group has £21.2bn of term funding maturing in 2017 and £13.2bn in 2018.
The Group expect to continue issuing public wholesale debt in 2017 from Barclays PLC, in order to ensure compliance with new prospective loss absorbency requirements and to maintain a stable and diverse funding base by type, currency and distribution channel.
Encumbrance
Asset encumbrance arises from collateral pledged against secured funding and other collateralised obligations. Barclays funds a portion of trading portfolio assets and other securities via repurchase agreements and other similar borrowing, and pledges a portion of customer loans and advances as collateral in securitisation, covered bond and other similar secured structures. Barclays monitors the mix of secured and unsecured funding sources within the Group’s funding plan and seeks to efficiently utilise available collateral to raise secured funding and meet other collateral requirements.
Encumbered assets have been defined consistently with the Group’s reporting requirements under Article 100 of the Capital Requirements Regulation (CRR). Securities and commodities assets are considered encumbered when they have been pledged or used to secure, collateralise or credit enhance a transaction which impacts their transferability and free use. This includes external repurchase or other similar agreements with market counterparts.
Excluding assets positioned at central banks, as at 31 December 2016, £168bn (December 2015: £157bn) of the Group’s assets were encumbered, primarily due to cash collateral posted, firm financing of trading portfolio assets and other securities and funding secured against loans and advances to customers.
Assets may also be encumbered under secured funding arrangements with central banks. In advance of such encumbrance, assets are often positioned with central banks to facilitate efficient future draw down. £63bn (December 2015: £88bn) ofon-balance sheet assets were positioned at the central banks, consisting of encumbered assets and collateralpre-positioned and available for use in secured financing transactions.
£277bn (December 2015: £212bn) of on andoff-balance sheet assets not positioned at the central bank were identified as readily available and available for use in secured financing transactions. Additionally, they include cash and securities held in the Group liquidity pool as well as unencumbered assets which provide a source of contingent liquidity. While these additional assets are not relied upon in the Group’s LRA, a portion of these assets may be monetised to generate liquidity through use as collateral for secured funding or through outright sale. Loans and advances to customers are only classified as readily available if they are already in a form, such that, they can be used to raise funding without further management actions. This includes excess collateral already in secured funding vehicles.
£231bn (December 2015: £208bn) of assets not positioned at the central bank were identified as available as collateral. These assets are not subject to any restrictions on their ability to secure funding, to be offered as collateral, or to be sold to reduce potential future funding requirements, but are not immediately available in the normal course of business in their current form. They primarily consist of loans and advances which would be suitable for use in secured funding structures but are conservatively classified as not readily available because they are not in transferable form.
Not available as collateral consists of assets that cannot be pledged or used as security for funding due to restrictions that prevent their pledge or use as security for funding in the normal course of business.
Derivatives and reverse repo assets relate specifically to derivatives, reverse repurchase agreements and other similar secured lending. These are shown separately as theseon-balance sheet assets cannot be pledged. However, these assets can give rise to the receipt ofnon-cash assets which are heldoff-balance sheet, and can be used to raise secured funding or meet additional funding requirements.
In addition, £406bn (December 2015: £265bn) of the total £466bn (December 2015: £306bn) securities accepted as collateral, and heldoff-balance sheet, wereon-pledged, the significant majority of which related to matched-book activity where reverse repurchase agreements are matched by repurchase agreements entered into to facilitate client activity. The remainder relates primarily to reverse repurchases used to settle trading portfolio liabilities as well as collateral posted against derivatives margin requirements.
| 168 | Barclays PLC and Barclays Bank PLC 2016 Annual Report on Form 20-F |
Risk review
Risk performance
Funding risk – liquidity
Asset encumbrance |
| |||||||||||||||||||||||||||||||||||||||||||||
| | Assets encumbered as a result of transactions with counterparties other than central banks | | | Other assets (comprising assets encumbered at the central banks and unencumbered assets) | | |||||||||||||||||||||||||||||||||||||||||
| Assets | Assets not positioned at the central banks | |||||||||||||||||||||||||||||||||||||||||||||
On-balance sheet As at 31 December 2016 | | Assets £bn | | | As a result of covered bonds £bn |
| | As a result of securitis- £bn |
| | Other £bn |
| | Total £bn |
| | positioned at the central banks £bn | b
| | Readily available | | | Available as collateral £bn | | | Not available as collateral £bn | | | Derivatives and Reverse repos £bn |
| | Total £bn | | |||||||||||||
Cash and balances at central banks | 102.4 | – | – | – | – | – | 102.4 | – | – | – | 102.4 | |||||||||||||||||||||||||||||||||||
Trading portfolio assets | 80.2 | – | – | 51.2 | 51.2 | – | 29.0 | – | – | – | 29.0 | |||||||||||||||||||||||||||||||||||
Financial assets at fair value | 78.6 | – | – | 3.2 | 3.2 | – | 1.5 | 10.7 | – | 63.2 | 75.4 | |||||||||||||||||||||||||||||||||||
Derivative financial instruments | 346.6 | – | – | – | – | – | – | – | – | 346.6 | 346.6 | |||||||||||||||||||||||||||||||||||
Loans and advances – banksa | 20.2 | – | – | – | – | – | 10.1 | 9.0 | 1.1 | – | 20.2 | |||||||||||||||||||||||||||||||||||
Loans and advances – customersa | 325.7 | 16.5 | 6.2 | 8.0 | 30.7 | 63.0 | 23.8 | 208.2 | – | – | 295.0 | |||||||||||||||||||||||||||||||||||
Cash collateral | 68.8 | – | – | 68.8 | 68.8 | – | – | – | – | – | – | |||||||||||||||||||||||||||||||||||
Settlement balances | 21.3 | – | – | – | – | – | – | – | 21.3 | – | 21.3 | |||||||||||||||||||||||||||||||||||
Financial investments | 63.3 | – | – | 13.6 | 13.6 | – | 49.3 | 0.4 | – | – | 49.7 | |||||||||||||||||||||||||||||||||||
Reverse repurchase agreements | 13.5 | – | – | – | – | – | – | – | – | 13.5 | 13.5 | |||||||||||||||||||||||||||||||||||
Non-current assets held for sale | 6.4 | – | – | – | – | – | 1.2 | 3.1 | 2.1 | – | 6.4 | |||||||||||||||||||||||||||||||||||
Other Financial Assets | 21.0 | – | – | – | – | – | – | – | 21.0 | – | 21.0 | |||||||||||||||||||||||||||||||||||
Totalon-balance sheet | 1,148.0 | 16.5 | 6.2 | 144.8 | 167.5 | 63.0 | 217.3 | 231.4 | 45.5 | 423.3 | 980.5 | |||||||||||||||||||||||||||||||||||
| Off-balance sheet | ||||||||||||||||||||||||||||||||||||||||||||||
| | Collateral received £bn | | | Collateral received of which on- pledged £bn | | | Readily available assets £bn | | | Available as collateral £bn | | | Not available as collateral £bn | | ||||||||||||||||||||||||||||||||
| Fair value of securities accepted as collateral | 466.2 | 405.5 | 59.7 | – | 1.0 | |||||||||||||||||||||||||||||||||||||||||
| Total unencumbered collateral | – | – | 277.0 | 231.4 | 46.5 | |||||||||||||||||||||||||||||||||||||||||
Notes
| a | Excluding cash collateral and settlement balances. |
| b | Includes both encumbered and unencumbered assets. Assets within this category that have been encumbered are disclosed as assets pledged in Note 40 to the financial statements page 301. |
| Barclays PLC and Barclays Bank PLC 2016 Annual Report on Form 20-F | 169 |
Asset encumbrance | ||||||||||||||||||||||||||||||||||||||||||||||
| | Assets encumbered as a result of transactions with counterparties other than central banks |
| | Other assets (comprising assets encumbered at the central banks and unencumbered assets) |
| |||||||||||||||||||||||||||||||||||||||||
| Assets | Assets not positioned at the central banks | |||||||||||||||||||||||||||||||||||||||||||||
On-balance sheet As at 31 December 2015 | | Assets £bn | | | As a result of covered bonds £bn |
| | As a result of securitis- ations £bn |
| | Other £bn |
| | Total £bn |
| | positioned at the central banks £bn | b
| | Readily available assets £bn | | | Available as collateral £bn | | | Not available as collateral £bn | | | Derivatives and Reverse repos £bn |
| | Total £bn | | |||||||||||||
Cash and balances at central banks | 47.9 | – | – | – | – | – | 47.9 | – | – | – | 47.9 | |||||||||||||||||||||||||||||||||||
Trading portfolio assets | 74.8 | – | – | 49.1 | 49.1 | – | 25.7 | – | – | – | 25.7 | |||||||||||||||||||||||||||||||||||
Financial assets at fair value | 72.5 | – | – | 2.5 | 2.5 | – | 3.2 | 17.7 | 1.3 | 47.8 | 70.0 | |||||||||||||||||||||||||||||||||||
Derivative financial instruments | 325.5 | – | – | – | – | – | – | – | – | 325.5 | 325.5 | |||||||||||||||||||||||||||||||||||
Loans and advances – banksa | 19.6 | – | – | – | – | – | 7.9 | 10.2 | 1.5 | – | 19.6 | |||||||||||||||||||||||||||||||||||
Loans and advances – customersa | 307.3 | 16.4 | 5.9 | 8.0 | 30.3 | 86.4 | 14.8 | 175.8 | – | – | 277.0 | |||||||||||||||||||||||||||||||||||
Cash collateral | 62.6 | – | – | 62.6 | 62.6 | – | – | – | – | – | – | |||||||||||||||||||||||||||||||||||
Settlement balances | 20.4 | – | – | – | – | – | – | – | 20.4 | – | 20.4 | |||||||||||||||||||||||||||||||||||
Financial investments | 87.0 | – | – | 12.2 | 12.2 | – | 72.2 | 1.0 | 1.6 | – | 74.8 | |||||||||||||||||||||||||||||||||||
Reverse repurchase agreements | 28.2 | – | – | – | – | – | – | – | – | 28.2 | 28.2 | |||||||||||||||||||||||||||||||||||
Non-current assets held for sale | 7.3 | – | – | – | – | 1.9 | 1.2 | 3.2 | 1.0 | – | 7.3 | |||||||||||||||||||||||||||||||||||
Other Financial Assets | 19.9 | – | – | – | – | – | – | – | 19.9 | – | 19.9 | |||||||||||||||||||||||||||||||||||
Totalon-balance sheet | 1,073.0 | 16.4 | 5.9 | 134.4 | 156.7 | 88.3 | 172.9 | 207.9 | 45.7 | 401.5 | 916.3 | |||||||||||||||||||||||||||||||||||
Off-balance sheet |
| |||||||||||||||||||||||||||||||||||||||||||||
| | Collateral received £bn |
| | Collateral received of which on- pledged £bn |
| | Readily available assets £bn |
| | Available as collateral £bn |
| | Not available as collateral £bn |
| ||||||||||||||||||||||||||||||||
Fair value of securities accepted as collateral |
| 305.9 | 265.4 | 39.0 | – | 1.5 | ||||||||||||||||||||||||||||||||||||||||
Total unencumbered collateral |
| – | – | 211.9 | 207.9 | 47.2 | ||||||||||||||||||||||||||||||||||||||||
Notes
| a | Excluding cash collateral and settlement balances. |
| b | Includes both encumbered and unencumbered assets. Assets within this category that have been encumbered are disclosed as assets pledged in Note 40 to the financial statements page301. |
| 170 | Barclays PLC and Barclays Bank PLC 2016 Annual Report on Form 20-F |
Risk review
Risk performance
Funding risk – liquidity
Repurchase agreements and reverse repurchase agreements
Barclays enters into repurchase and other similar secured borrowing agreements to finance its trading portfolio assets. The majority of reverse repurchase agreements are matched by offsetting repurchase agreements entered into to facilitate client activity. The remainder are used to settle trading portfolio liabilities.
Due to the high quality of collateral provided against secured financing transactions, the liquidity risk associated with this activity is significantly lower than unsecured financing transactions. Nonetheless, Barclays manages to gross and net secured mismatch limits to limit refinancing risk under a severe stress scenario and a portion of the Group’s liquidity pool is held against stress outflows on these positions. The Group secured mismatch limits are calibrated based on market capacity, liquidity characteristics of the collateral and risk appetite.
The cash value of repurchase and reverse repurchase transactions will typically differ from the market value of the collateral against which these transactions are secured by an amount referred to as a haircut (or over-collateralisation). Typical haircut levels vary depending on the quality of the collateral that underlies these transactions. For transactions secured against extremely liquid fixed income collateral, lenders demand relatively small haircuts (typically ranging from0-2%). For transactions secured against less liquid collateral, haircuts vary by asset class (typically ranging from5-10% for corporate bonds and other less liquid collateral).
As at 31 December 2016, the significant majority of repurchase activity related to matched-book activity. The Group may face refinancing risk on the net maturity mismatch for matched-book activity.
Net matched-book activitya,b | ||||||||||||||
Negative number represents the cash value of the net repurchase agreement (net liability) | | Less than one month £bn | | | One month to three months £bn | | Over three months £bn | |||||||
As at 31 December 2016 | ||||||||||||||
Extremely Liquid Fixed Incomec | (21.8) | 11.6 | 10.7 | |||||||||||
Liquid Fixed Income | (0.4) | 0.8 | (0.7) | |||||||||||
Equities | 6.1 | (0.5) | (9.6) | |||||||||||
Less liquid Fixed Income | 0.6 | (0.2) | (1.3) | |||||||||||
Total | (15.5) | 11.7 | (0.9) | |||||||||||
As at 31 December 2015 | ||||||||||||||
Extremely Liquid Fixed Income | (12.9) | 7.3 | 5.6 | |||||||||||
Liquid Fixed Income | 0.3 | 0.6 | (0.9) | |||||||||||
Equities | 7.0 | (1.5) | (5.5) | |||||||||||
Less liquid Fixed Income | 1.6 | (0.4) | (1.2) | |||||||||||
Total | (4.0) | 6.0 | (2.0) | |||||||||||
The residual repurchase agreement activity is the firm-financing component and reflects Barclays funding of a portion of its trading portfolio assets. The primary risk related to firm-financing activity is the inability to roll-over transactions as they mature. However, 44% (2015: 50%) of firm-financing activity was secured against extremely liquid fixed income assets.
| ||||||||||||||
Firm financing repurchase agreementsa,b |
| |||||||||||||
| | Less than one month £bn | | | One month to three months £bn |
| | Over three months £bn | | Total £bn | |||||
As at 31st December 2016 | ||||||||||||||
Extremely Liquid Fixed Incomec | 28.3 | 7.1 | 1.1 | 36.5 | ||||||||||
Liquid Fixed Income | 2.8 | 0.8 | 1.2 | 4.8 | ||||||||||
Highly liquid | 13.2 | 8.9 | 14.0 | 36.1 | ||||||||||
Less liquid | 1.9 | 0.8 | 2.6 | 5.3 | ||||||||||
Total | 46.2 | 17.6 | 18.9 | 82.7 | ||||||||||
As at 31st December 2015 | ||||||||||||||
Extremely Liquid Fixed Income | 28.8 | 8.3 | 0.3 | 37.4 | ||||||||||
Liquid Fixed Income | 2.0 | 0.6 | 1.1 | 3.7 | ||||||||||
Highly liquid | 10.9 | 6.3 | 10.2 | 27.4 | ||||||||||
Less liquid | 2.7 | 1.1 | 1.9 | 5.7 | ||||||||||
Total | 44.4 | 16.3 | 13.5 | 74.2 | ||||||||||
Notes
| a | Includes collateral swaps. |
| b | Includes financing positions for prime brokerage clients which are reported as customer payables/receivables on balance sheet. |
| c | Extremely liquid fixed income is defined as very highly rated sovereigns and agencies, typically rated AA+ or better. It excludes liquid fixed income, equities and other less liquid collateral. |
| Barclays PLC and Barclays Bank PLC 2016 Annual Report on Form 20-F | 171 |
Credit ratings
In addition to monitoring and managing key metrics related to the financial strength of the Group, Barclays solicits independent credit ratings by Standard & Poor’s (S&P), Moody’s and Fitch, as well as Rating and Investment Information (R&I). These ratings assess the creditworthiness of the Group, its subsidiaries and branches and are based on reviews of a broad range of business and financial attributes including risk management processes and procedures, capital strength, earnings, funding, asset quality, liquidity, accounting and governance.
| Credit ratings | ||||||||||
| As at 31 December 2016 | Standard & Poor’s | Moody’s | Fitch | |||||||
| Barclays Bank PLC | ||||||||||
| Long-term | A- (Negative) | A1 (Negative) | A (Stable) | |||||||
| Short-term | A-2 | P-1 | F1 | |||||||
| Stand-alone ratinga | bbb+ | Baa2 | a | |||||||
| Barclays PLC | ||||||||||
| Long-term | BBB (Negative) | Baa2 (Negative) | A (Stable) | |||||||
| Short-term | A-2 | P-3 | F1 |
During the year, Barclays’ ratings outlooks for Moody’s and S&P were changed to Negative from Stable following the outcome of the EU referendum in June 2016. The rating actions were part of a wider set of actions which saw the two agencies place several UK banks on negative outlooks whilst affirming the ratings. The ratings continue to carry a stable outlook with Fitch.
In December 2016 Moody’s upgraded senior long-term ratings for both Barclays Bank PLC and Barclays PLC by one notch reflecting the continuedbuild-up of loss absorbing capacity at Barclays PLC which would provide additional protection for Barclays Bank PLC’s depositors and senior unsecured creditors, and Barclays PLC’s senior unsecured creditors in a failure scenario. The negative outlooks assigned in June remained in place as the rating agency’s assessment of Barclays’ stand-alone credit strength was unaffected by the rating action.
S&P and Fitch affirmed Barclays’ ratings in July and December 2016 respectively as part of their periodic reviews.
Barclays also solicits issuer ratings from R&I for local issuance purposes in Japan and the ratings ofA- for Barclays PLC and A for Barclays Bank PLC were affirmed in July 2016 with stable outlooks.
| Contractual credit rating downgrade exposure (incremental cash outflow) | ||||||||
| Incremental cash outflow | ||||||||
| | One-notch downgrade £bn | | | Two-notch downgrade £bn | | |||
| As at 31 December 2016 | ||||||||
| Securitisation derivatives | (2 | ) | (1 | ) | ||||
| Contingent liabilities | – | – | ||||||
| Derivatives margining | (1 | ) | – | |||||
| Liquidity facilities | (1 | ) | – | |||||
| Total contractual funding or margin requirements | (4 | ) | (1 | ) | ||||
| As at 31 December 2015 | ||||||||
| Securitisation derivatives | (2 | ) | (1 | ) | ||||
| Contingent liabilities | (1 | ) | – | |||||
| Derivatives margining | – | – | ||||||
| Liquidity facilities | (1 | ) | (1 | ) | ||||
| Total contractual funding or margin requirements | (4 | ) | (2 | ) | ||||
Note
| a | Refers to Standard & Poor’s Stand-Alone Credit Profile (SACP), Moody’s Baseline Credit Assessment (BCA) and Fitch’s Viability Rating (VR). |
| 172 | Barclays PLC and Barclays Bank PLC 2016 Annual Report on Form 20-F |
Risk review
Risk performance
Funding risk – liquidity
Liquidity management at BAGL Group (audited)
Liquidity risk is managed separately at BAGL Group due to local currency, funding and regulatory requirements.
In addition to the Group liquidity pool, as at 31 December 2016, BAGL Group held £10.6bn (2015: £6.0bn) of liquidity pool assets against BAGL-specific anticipated stressed outflows. The liquidity pool consists of central bank deposits, government bonds, treasury bills and notes, and coins. Absa Bank successfully applied for a Committed Liquidity Facility from the South African Reserve Bank, which is included in the liquidity pool from January 2016.
The BAGL loan to deposit ratio as at 31 December 2016 was 107% (2015: 102%).
Additional information on liquidity management at BAGL can be found in the Barclays Africa Group Annual Report.
Contractual maturity of financial assets and liabilities (audited)
The table below provides detail on the contractual maturity of all financial instruments and other assets and liabilities. Derivatives (other than those designated in a hedging relationship) and trading portfolio assets and liabilities are included in the ‘on demand’ column at their fair value. Liquidity risk on these items is not managed on the basis of contractual maturity since they are not held for settlement according to such maturity and will frequently be settled before contractual maturity at fair value. Derivatives designated in a hedging relationship are included according to their contractual maturity.
Financial assets designated at fair value in respect of linked liabilities to customers under investment contracts have been included in other assets and other liabilities as the Group is not exposed to liquidity risk arising from them; any request for funds from creditors would be met by simultaneously liquidating or transferring the related investment.
| Barclays PLC and Barclays Bank PLC 2016 Annual Report on Form 20-F | 173 |
Contractual maturity of financial assets and liabilities (including BAGL) (audited) |
| |||||||||||||||||||||||||||||||||||||||||||
As at 31 December 2016 | | On demand | | | Not more than three months £m |
| | Over three months but not more than six | | | Over six months but not more than nine | | | Over nine months but not more than one £m |
| | Over one year but not more than two years £m |
| | Over two years but not more than three years £m |
| | Over three years but not more than five years £m |
| | Over five years but not more than ten years £m |
| | Over ten years £m |
| | Total £m |
| |||||||||||
Assets | ||||||||||||||||||||||||||||||||||||||||||||
Cash and balances at central banks | 102,031 | 322 | – | – | – | – | – | – | – | – | 102,353 | |||||||||||||||||||||||||||||||||
Items in the course of collection from other banks | 1,467 | – | – | – | – | – | – | – | – | – | 1,467 | |||||||||||||||||||||||||||||||||
Trading portfolio assets | 80,240 | – | – | – | – | – | – | – | – | – | 80,240 | |||||||||||||||||||||||||||||||||
Financial assets designated at fair value | 15,558 | 43,270 | 5,518 | 2,376 | 2,081 | 686 | 90 | 129 | 771 | 8,129 | 78,608 | |||||||||||||||||||||||||||||||||
Derivative financial instruments | 345,625 | 5 | 400 | 5 | 2 | 14 | 168 | 175 | 123 | 109 | 346,626 | |||||||||||||||||||||||||||||||||
Loans and advances to banks | 4,858 | 34,346 | 2,753 | 480 | 133 | 412 | 236 | 20 | 13 | – | 43,251 | |||||||||||||||||||||||||||||||||
Loans and advances to customers | 26,929 | 85,993 | 7,522 | 6,310 | 8,245 | 29,326 | 25,602 | 44,776 | 48,233 | 109,848 | 392,784 | |||||||||||||||||||||||||||||||||
Reverse repurchase agreements and other similar secured lending | 7,043 | 3,678 | 892 | 144 | 905 | 792 | – | – | – | – | 13,454 | |||||||||||||||||||||||||||||||||
Available for sale financial investments | 40 | 1,015 | 3,064 | 741 | 2,666 | 10,127 | 9,031 | 15,148 | 12,768 | 8,717 | 63,317 | |||||||||||||||||||||||||||||||||
Other financial assets | – | 1,128 | – | – | – | 77 | – | – | – | – | 1,205 | |||||||||||||||||||||||||||||||||
Total financial assets | 583,791 | 169,757 | 20,149 | 10,056 | 14,032 | 41,434 | 35,127 | 60,248 | 61,908 | 126,803 | 1,123,305 | |||||||||||||||||||||||||||||||||
Other assetsa | 89,821 | |||||||||||||||||||||||||||||||||||||||||||
Total assets | 1,213,126 | |||||||||||||||||||||||||||||||||||||||||||
Liabilities | ||||||||||||||||||||||||||||||||||||||||||||
Deposits from banks | 5,906 | 39,610 | 1,120 | 672 | 351 | 193 | 13 | 328 | 21 | – | 48,214 | |||||||||||||||||||||||||||||||||
Items in the course of collection due to other banks | 636 | – | – | – | – | – | – | – | – | – | 636 | |||||||||||||||||||||||||||||||||
Customer accounts | 317,963 | 86,081 | 5,305 | 3,023 | 4,528 | 2,836 | 1,262 | 1,043 | 441 | 696 | 423,178 | |||||||||||||||||||||||||||||||||
Repurchase agreements and other similar secured borrowing | 5,480 | 9,235 | 1,934 | 917 | 1,326 | 311 | – | 83 | 474 | – | 19,760 | |||||||||||||||||||||||||||||||||
Trading portfolio liabilities | 34,687 | – | – | – | – | – | – | – | – | – | 34,687 | |||||||||||||||||||||||||||||||||
Financial liabilities designated at fair value | 15,285 | 41,583 | 3,970 | 4,112 | 1,827 | 7,540 | 5,762 | 5,773 | 3,588 | 6,591 | 96,031 | |||||||||||||||||||||||||||||||||
Derivative financial instruments | 339,646 | 4 | – | – | 2 | 10 | 34 | 46 | 75 | 670 | 340,487 | |||||||||||||||||||||||||||||||||
Debt securities in issue | 27 | 16,731 | 11,713 | 5,902 | 6,867 | 3,166 | 8,069 | 9,186 | 10,152 | 4,119 | 75,932 | |||||||||||||||||||||||||||||||||
Subordinated liabilities | – | 8 | – | – | 1,317 | 3,230 | 56 | 7,487 | 6,575 | 4,710 | 23,383 | |||||||||||||||||||||||||||||||||
Other financial liabilities | – | 3,198 | – | – | – | 1,189 | – | – | – | – | 4,387 | |||||||||||||||||||||||||||||||||
Total financial liabilities | 719,630 | 196,450 | 24,042 | 14,626 | 16,218 | 18,475 | 15,196 | 23,946 | 21,326 | 16,786 | 1,066,695 | |||||||||||||||||||||||||||||||||
Other liabilitiesa | 75,066 | |||||||||||||||||||||||||||||||||||||||||||
Total liabilities | 1,141,761 | |||||||||||||||||||||||||||||||||||||||||||
Cumulative liquidity gap | (135,839 | ) | (162,532 | ) | (166,425 | ) | (170,995 | ) | (173,181 | ) | (150,222 | ) | (130,291 | ) | (93,989 | ) | (53,407 | ) | 56,610 | 71,365 | ||||||||||||||||||||||||
Note
| a | As at 31 December 2016, other assets includes balances of £71,454m (2015: £7,364m) and other liabilities includes balances of £65,292m (2015: £5,997m) relating to amounts held for sale. Please refer to Note 44 for details. |
| 174 | Barclays PLC and Barclays Bank PLC 2016 Annual Report on Form 20-F |
Risk review
Risk performance
Funding risk – liquidity
Contractual maturity of financial assets and liabilities (including BAGL) (audited) |
| |||||||||||||||||||||||||||||||||||||||||||
As at 31 December 2015 | | On demand | | | Not more than three months £m |
| | Over three months but not than six £m |
| | Over six months but not than nine £m |
| | Over nine months but not than one £m |
| | Over one year but not more than two years £m |
| | Over two years but not more than three years £m |
| | Over three years but not more than five years £m |
| | Over five years but not more than ten years £m |
| | Over ten years £m |
| | Total £m |
| |||||||||||
Assets | ||||||||||||||||||||||||||||||||||||||||||||
Cash and balances at central banks | 49,580 | 131 | – | – | – | – | – | – | – | – | 49,711 | |||||||||||||||||||||||||||||||||
Items in the course of collection from other banks | 631 | 380 | – | – | – | – | – | – | – | – | 1,011 | |||||||||||||||||||||||||||||||||
Trading portfolio assets | 77,348 | – | – | – | – | – | – | – | – | – | 77,348 | |||||||||||||||||||||||||||||||||
Financial assets designated at fair valuea | 30,667 | 21,966 | 1,722 | 1,372 | 583 | 1,021 | 587 | 424 | 867 | 16,172 | 75,381 | |||||||||||||||||||||||||||||||||
Derivative financial instruments | 326,772 | 28 | 3 | 1 | 53 | 328 | 61 | 257 | 147 | 59 | 327,709 | |||||||||||||||||||||||||||||||||
Loans and advances to banks | 5,354 | 31,539 | 1,954 | 366 | 468 | 588 | 991 | 43 | 12 | 34 | 41,349 | |||||||||||||||||||||||||||||||||
Loans and advances to customers | 29,117 | 76,337 | 13,935 | 7,084 | 12,332 | 27,616 | 27,318 | 48,707 | 50,737 | 106,034 | 399,217 | |||||||||||||||||||||||||||||||||
Reverse repurchase agreements and other similar secured lendinga | 12,171 | 12,089 | 3,296 | 292 | 205 | 74 | 35 | 1 | 24 | – | 28,187 | |||||||||||||||||||||||||||||||||
Available for sale financial investments | 467 | 2,396 | 1,792 | 4,936 | 2,088 | 11,537 | 14,659 | 17,898 | 21,445 | 13,049 | 90,267 | |||||||||||||||||||||||||||||||||
Other financial assets | – | 1,304 | – | – | – | 100 | – | – | – | – | 1,404 | |||||||||||||||||||||||||||||||||
Total financial assets | 532,107 | 146,170 | 22,702 | 14,051 | 15,729 | 41,264 | 43,651 | 67,330 | 73,232 | 135,348 | 1,091,584 | |||||||||||||||||||||||||||||||||
Other assets | – | – | – | – | – | – | – | – | – | – | 28,428 | |||||||||||||||||||||||||||||||||
Total assets | – | – | – | – | – | – | – | – | – | – | 1,120,012 | |||||||||||||||||||||||||||||||||
Liabilities | ||||||||||||||||||||||||||||||||||||||||||||
Deposits from banks | 5,717 | 38,720 | 1,355 | 540 | 335 | 97 | 9 | 67 | 236 | 4 | 47,080 | |||||||||||||||||||||||||||||||||
Items in the course of collection due to other banks | 1,013 | – | – | – | – | – | – | – | – | – | 1,013 | |||||||||||||||||||||||||||||||||
Customer accounts | 312,921 | 80,114 | 7,605 | 4,253 | 5,304 | 2,845 | 912 | 1,654 | 622 | 2,012 | 418,242 | |||||||||||||||||||||||||||||||||
Repurchase agreements and other similar secured borrowinga | 5,729 | 11,683 | 3,479 | 1,975 | 876 | 843 | 52 | – | 398 | – | 25,035 | |||||||||||||||||||||||||||||||||
Trading portfolio liabilities | 33,967 | – | – | – | – | – | – | – | – | – | 33,967 | |||||||||||||||||||||||||||||||||
Financial liabilities designated at fair valuea | 20,051 | 32,453 | 3,152 | 3,470 | 2,317 | 6,093 | 5,458 | 7,446 | 4,139 | 5,533 | 90,112 | |||||||||||||||||||||||||||||||||
Derivative financial instruments | 323,786 | 80 | 92 | 49 | 49 | 42 | 13 | 57 | 70 | 14 | 324,252 | |||||||||||||||||||||||||||||||||
Debt securities in issue | 50 | 14,270 | 5,615 | 4,322 | 4,469 | 10,164 | 4,797 | 13,037 | 10,028 | 2,398 | 69,150 | |||||||||||||||||||||||||||||||||
Subordinated liabilities | 2 | – | – | 9 | 28 | 1,254 | 2,994 | 2,194 | 8,741 | 6,245 | 21,467 | |||||||||||||||||||||||||||||||||
Other financial liabilities | – | 2,685 | – | – | – | 1,075 | – | – | – | – | 3,760 | |||||||||||||||||||||||||||||||||
Total financial liabilities | 703,236 | 180,005 | 21,298 | 14,618 | 13,378 | 22,413 | 14,235 | 24,455 | 24,234 | 16,206 | 1,034,078 | |||||||||||||||||||||||||||||||||
Other liabilities | – | – | – | – | – | – | – | – | – | – | 20,070 | |||||||||||||||||||||||||||||||||
Total liabilities | – | – | – | – | – | – | – | – | – | – | 1,054,148 | |||||||||||||||||||||||||||||||||
Cumulative liquidity gap | (171,129 | ) | (204,964 | ) | (203,560 | ) | (204,127 | ) | (201,776 | ) | (182,925 | ) | (153,509 | ) | (110,634 | ) | (61,636 | ) | 57,506 | 65,864 | ||||||||||||||||||||||||
Expected maturity dates do not differ significantly from the contract dates, except for:
| § | trading portfolio assets and liabilities and derivative financial instruments, which may not be held to maturity as part of the Group’s trading strategies |
| § | retail deposits, which are included within customer accounts, are repayable on demand or at short notice on a contractual basis. In practice, these instruments form a stable base for the Group’s operations and liquidity needs because of the broad base of customers – both numerically and by depositor type (see Behavioural maturity profile on page 166; and |
| § | financial assets designated at fair value held in respect of linked liabilities, which are managed with the associated liabilities. |
Note
| a | The On demand and Not more than three months categories for 2015 have been adjusted by £37bn for financial assets and £25bn for financial liabilities to better reflect the contractual maturity of both Reverse repurchase agreements and Repurchase agreements measured at amortised cost and fair value. |
| Barclays PLC and Barclays Bank PLC 2016 Annual Report on Form 20-F | 175 |
Contractual maturity of financial liabilities on an undiscounted basis (audited)
The table below presents the cash flows payable by the Group under financial liabilities by remaining contractual maturities at the balance sheet date. The amounts disclosed in the table are the contractual undiscounted cash flows of all financial liabilities (i.e. nominal values).
The balances in the below table do not agree directly to the balances in the consolidated balance sheet as the table incorporates all cash flows, on an undiscounted basis, related to both principal as well as those associated with all future coupon payments.
Derivative financial instruments held for trading and trading portfolio liabilities are included in the on demand column at their fair value.
Financial liabilities designated at fair value in respect of linked liabilities under investment contracts have been excluded from this analysis as the Group is not exposed to liquidity risk arising from them.
Contractual maturity of financial liabilities – undiscounteda (including BAGL) (audited) |
| |||||||||||||||||||||||||||||||||||
| | On demand £m | | | Not more than three months £m | | | Over three months but not more than six months £m |
| | Over six months but not more than one year £m |
| | Over one year but not more than three years £m |
| | Over three years but not more than five years £m |
| | Over five years but not more than ten years £m |
| | Over ten years £m | | | Total £m |
| ||||||||||
As at 31 December 2016 | ||||||||||||||||||||||||||||||||||||
Deposits from banks | 5,906 | 39,617 | 1,122 | 1,025 | 207 | 328 | 21 | – | 48,226 | |||||||||||||||||||||||||||
Items in the course of collection due to other banks | 636 | – | – | – | – | – | – | – | 636 | |||||||||||||||||||||||||||
Customer accounts | 317,963 | 86,101 | 5,325 | 7,565 | 4,266 | 1,120 | 1,403 | 1,013 | 424,756 | |||||||||||||||||||||||||||
Repurchase agreements and other similar secured lending | 5,480 | 9,249 | 1,939 | 2,253 | 312 | 83 | 474 | – | 19,790 | |||||||||||||||||||||||||||
Trading portfolio liabilities | 34,687 | – | – | – | – | – | – | – | 34,687 | |||||||||||||||||||||||||||
Financial liabilities designated at fair value | 15,285 | 41,599 | 3,986 | 5,979 | 13,445 | 5,899 | 3,900 | 8,443 | 98,536 | |||||||||||||||||||||||||||
Derivative financial instruments | 339,646 | 4 | – | 2 | 44 | 48 | 84 | 1,086 | 340,914 | |||||||||||||||||||||||||||
Debt securities in issue | 27 | 17,126 | 11,894 | 13,285 | 12,915 | 10,505 | 12,282 | 6,054 | 84,088 | |||||||||||||||||||||||||||
Subordinated liabilities | – | 398 | 680 | 3,117 | 7,089 | 9,324 | 7,842 | 4,866 | 33,316 | |||||||||||||||||||||||||||
Other financial liabilities | – | 3,198 | – | – | 1,189 | – | – | – | 4,387 | |||||||||||||||||||||||||||
Total financial liabilities | 719,630 | 197,292 | 24,946 | 33,226 | 39,467 | 27,307 | 26,006 | 21,462 | 1,089,336 | |||||||||||||||||||||||||||
As at 31 December 2015 | ||||||||||||||||||||||||||||||||||||
Deposits from banks | 5,717 | 38,721 | 1,357 | 877 | 108 | 70 | 239 | 10 | 47,099 | |||||||||||||||||||||||||||
Items in the course of collection due to other banks | 1,013 | – | – | – | – | – | – | – | 1,013 | |||||||||||||||||||||||||||
Customer accounts | 312,921 | 80,142 | 7,640 | 9,655 | 3,858 | 1,854 | 744 | 3,087 | 419,901 | |||||||||||||||||||||||||||
Repurchase agreements and other similar secured lendingb | 5,729 | 11,686 | 3,482 | 2,853 | 898 | – | 491 | – | 25,139 | |||||||||||||||||||||||||||
Trading portfolio liabilities | 33,967 | – | – | – | – | – | – | – | 33,967 | |||||||||||||||||||||||||||
Financial liabilities designated at fair valueb | 20,051 | 32,470 | 3,165 | 5,830 | 11,851 | 7,840 | 4,690 | 8,694 | 94,591 | |||||||||||||||||||||||||||
Derivative financial instruments | 323,786 | 81 | 94 | 102 | 57 | 59 | 80 | 16 | 324,275 | |||||||||||||||||||||||||||
Debt securities in issue | 50 | 14,352 | 5,845 | 9,277 | 16,777 | 14,175 | 11,276 | 4,547 | 76,299 | |||||||||||||||||||||||||||
Subordinated liabilities | 2 | 253 | 403 | 344 | 6,057 | 3,737 | 9,969 | 6,313 | 27,078 | |||||||||||||||||||||||||||
Other financial liabilities | – | 2,685 | – | – | 1,075 | – | – | – | 3,760 | |||||||||||||||||||||||||||
Total financial liabilities | 703,236 | 180,390 | 21,986 | 28,938 | 40,681 | 27,735 | 27,489 | 22,667 | 1,053,122 | |||||||||||||||||||||||||||
Note
| a | Financial liabilities on an undiscounted basis for 2016 exclude BAGL balances now held for sale but are included for 2015. |
| b | The On demand and Not more than three months categories for 2015 have been adjusted by £25bn for financial liabilities to better reflect the contractual maturity of Repurchase agreements measured at amortised cost and fair value. |
| 176 | Barclays PLC and Barclays Bank PLC 2016 Annual Report on Form 20-F |
Risk review
Risk performance
Funding risk – liquidity
Maturity ofoff-balance sheet commitments received and given (audited)
The table below presents the maturity split of the Group’soff-balance sheet commitments received and given at the balance sheet date. The amounts disclosed in the table are the undiscounted cash flows (i.e. nominal values) on the basis of earliest opportunity at which they are available.
Maturity analysis ofoff-balance sheet commitments received |
| |||||||||||||||||||||||||||||||||||||||||||
| | On demand £m | | | Not more than three months £m | | | Over three months but not more than six months £m | | | Over six months but not more than nine months £m | | | Over nine months but not more than one year £m |
| | Over one year but not more than two years £m |
| | Over two years but not more than three years £m |
| | Over three years but not more than five years £m |
| | Over five years but not more than ten years £m |
| | Over ten years £m | | | Total £m |
| ||||||||||||
As at 31 December 2016 | ||||||||||||||||||||||||||||||||||||||||||||
Guarantees, letters of credit and credit insurance | 6,044 | 18 | 1 | 410 | 2 | 23 | 1 | 3 | – | – | 6,502 | |||||||||||||||||||||||||||||||||
Forward starting repurchase agreements | 102 | 246 | – | 1 | – | – | 18 | – | – | – | 367 | |||||||||||||||||||||||||||||||||
Totaloff-balance sheet commitments receiveda | 6,146 | 264 | 1 | 411 | 2 | 23 | 19 | 3 | – | – | 6,869 | |||||||||||||||||||||||||||||||||
As at 31 December 2015 | ||||||||||||||||||||||||||||||||||||||||||||
Guarantees, letters of credit and credit insurance | 6,329 | 138 | 4 | 5 | 32 | 84 | 12 | 97 | 4 | 17 | 6,722 | |||||||||||||||||||||||||||||||||
Forward starting repurchase agreements | – | 392 | – | 73 | – | – | – | – | – | – | 465 | |||||||||||||||||||||||||||||||||
Totaloff-balance sheet commitments receiveda | 6,329 | 530 | 4 | 78 | 32 | 84 | 12 | 97 | 4 | 17 | 7,187 | |||||||||||||||||||||||||||||||||
Maturity analysis ofoff-balance sheet commitments given (audited) |
| |||||||||||||||||||||||||||||||||||||||||||
| | On demand £m | | | Not more than three months £m | | | Over three months but not more than six months £m | | | Over six months but not more than nine months £m | | | Over nine months but not more than one year £m | | | Over one year but not more than two years £m |
| | Over two years but not more than three years £m |
| | Over three years but not more than five years £m |
| | Over five years but not more than ten years £m |
| | Over ten years £m | | | Total £m |
| ||||||||||||
As at 31 December 2016 | ||||||||||||||||||||||||||||||||||||||||||||
Contingent liabilities | 17,111 | 425 | 845 | 233 | 285 | 355 | 187 | 88 | 259 | 151 | 19,939 | |||||||||||||||||||||||||||||||||
Documentary credits and other short-term trade related transactions | 987 | 10 | 8 | – | – | – | – | – | – | – | 1,005 | |||||||||||||||||||||||||||||||||
Forward Starting reverse repurchase agreements | – | 24 | – | – | – | – | – | – | – | – | 24 | |||||||||||||||||||||||||||||||||
Standby facilities, credit lines and other commitments | 300,043 | 455 | 415 | 604 | 818 | 55 | 47 | 150 | – | 70 | 302,657 | |||||||||||||||||||||||||||||||||
Totaloff-balance sheet commitments givena | 318,141 | 914 | 1,268 | 837 | 1,103 | 410 | 234 | 238 | 259 | 221 | 323,625 | |||||||||||||||||||||||||||||||||
As at 31 December 2015 | ||||||||||||||||||||||||||||||||||||||||||||
Contingent liabilities | 17,421 | 933 | 493 | 140 | 590 | 423 | 158 | 161 | 164 | 138 | 20,621 | |||||||||||||||||||||||||||||||||
Documentary credits and other short-term trade related transactions | 617 | 30 | 10 | – | 61 | 119 | – | 8 | – | – | 845 | |||||||||||||||||||||||||||||||||
Forward Starting reverse repurchase agreements | – | 93 | – | – | – | – | – | – | – | – | 93 | |||||||||||||||||||||||||||||||||
Standby facilities, credit lines and other commitments | 274,020 | 1,152 | 1,564 | 1,116 | 1,071 | 873 | 554 | 906 | 78 | 35 | 281,369 | |||||||||||||||||||||||||||||||||
Totaloff-balance sheet commitments givena | 292,058 | 2,208 | 2,067 | 1,256 | 1,722 | 1,415 | 712 | 1,075 | 242 | 173 | 302,928 | |||||||||||||||||||||||||||||||||
Note
| a | Amounts for 2016 exclude BAGL balances now held for sale but are included for 2015. |
| Barclays PLC and Barclays Bank PLC 2016 Annual Report on Form 20-F | 177 |
Risk review
Risk performance
Operational risk
Analysis of operational risk
This section provides an analysis of the Group’s operational risk profile, including events which have had a significant impact in 2016.
Key metrics
A small reduction in the number of recorded incidents occurring during the period
91%
of the Group’s net reportable operational risk events had a loss value of £50,000 or less
65%
of events by number are due to External Fraud
| ||
 |
| 178 | Barclays PLC and Barclays Bank PLC 2016 Annual Report on Form 20-F |
Risk review
Risk performance
Operational risk
Operational risk
Operational risk is the risk of loss to the firm from inadequate or failed processes or systems, human factors or due to external events (for example fraud) where the root cause is not due to credit or market risks
All disclosures in this section are unaudited unless otherwise stated.
Overview
Operational risks are inherent in the Group’s business activities and it is not always cost effective or possible to attempt to eliminate all operational risks. The operational risk management framework is therefore focused on ensuring operational risks are identified, assessed and mitigated within the Group’s approved risk appetite. More material losses are less frequent and the Group seeks to reduce the likelihood of these in accordance with its risk appetite.
The Operational principal risk comprises the following risks: financial reporting, fraud, information, payments process, people, premises and security, supplier, tax, technology (including cyber) and transaction operations. In 2016 legal risk and financial crime risk were managed as part of operational risk.
For definitions of these risks see page 109. In order to ensure complete coverage of the potential adverse impacts on the Group arising from operational risk, the operational risk taxonomy extends beyond the operational risks listed above to cover areas included within conduct and legal risk.
This section provides an analysis of the Group’s operational risk profile, including events, those which are above the Bank’s reportable threshold, which have had a financial impact in 2016.
For more information on conduct risk events please see page 181.
Summary of performance in the period
During 2016, total operational risk losses decreased to £225.9m (2015: £283.5m) with a 4% reduction in the number of recorded events compared to prior year. The loss for the year was primarily driven by a limited number of events in execution, delivery and process management categories and external fraud.
Operational risk profile
Within operational risk, a high proportion of risk events have a low associated financial cost and a very small proportion of operational risk events will have a material impact on the financial results of the Group. In 2016, 90.8% of the Group’s net reportable operational risk events had a value of £50,000 or less (2015: 88.1%) and accounted for 23.2% (2015: 14.5%) of the Group’s total net loss impact.
The analysis below presents the Group’s operational risk events by Basel event category:
| § | Execution, delivery and process management impacts increased to £124.4m (2015: £111.8m) and accounted for 55.0% (2015: 39.4%) of overall operational risk losses. The events in this category are typical of the banking industry as a whole where high volumes of transactions are processed on a daily basis. The increases in impacts were largely driven by limited number of events with higher loss values. |
| § | External fraud (65.2%) is the category with the highest frequency of events where high volume, low value events are also consistent with industry experience, driven by debit and credit card fraud. This accounted for 25.8% of overall operational risk losses in the year from 22.2% last year. |
The Group’s operational risk profile is informed bybottom-up risk assessments undertaken by each business unit andtop-down qualitative review from the operational risk management for each risk type. External Fraud and technology are highlighted as key operational risk exposures. The operational risk profile is also informed by a number of risk themes: change, resilience and cyber security. These represent material risk to the bank but have scope which sits across multiple risk types, and therefore require a risk management approach which is integrated within relevant risk and control frameworks.
Investment continues to be made in new and enhanced fraud prevention systems and tools to combat the increasing level of fraud attempts being made and to minimise any disruption to genuine transactions. Fraud remains anindustry-wide threat and the Bank continues to work closely with external partners on various prevention initiatives. Technology, resilience and cyber security risks evolve rapidly so the Bank maintains continued focus and investment in our control environment to manage these risks, and actively partners with peers and relevant organisations to understand and disrupt threats originating outside the Bank.
For further information see Operational Risk Management section on pages 109 to 110.
Operational risk events by risk category % of total risk events by count |
|
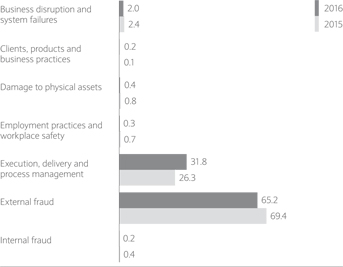
Operational risk events by risk category % of total risk events by value |
|
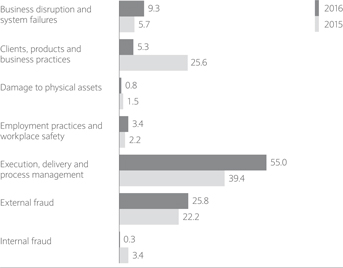
Note
| a | The data disclosed include operational risk losses for reportable events (excluding Africa) having impact of > £10,000 and exclude events that are conduct risk, aggregate and boundary events. A boundary event is an operational risk event that results in a credit risk impact. Legal risk events are also included. Due to the nature of risk events that keep evolving, prior year losses are updated. |
| Barclays PLC and Barclays Bank PLC 2016 Annual Report on Form 20-F | 179 |
Risk review
Risk performance
Conduct risk
Analysis of conduct risk
This section details Barclays’ conduct risk profile and provides information on key 2016 risk events and risk mitigation actions Barclays has taken.
Key metrics
5.4/10
|
Balanced Scorecard
The Conduct Reputation Balanced Scorecard Measure has been sustained mainly by our focus on:
| § | Operating openly and transparently |
| § | Having high quality products and services |
| § | Delivering value for money for customers and clients |

| 180 | Barclays PLC and Barclays Bank PLC 2016 Annual Report on Form 20-F |
Risk review
Risk performance
Conduct risk
Conduct risk
Conduct risk is the risk of detriment to customers, clients, market integrity, competition or Barclays from the inappropriate supply of financial services, including instances of wilful or negligent conduct
All disclosures in this sectionare unaudited unless otherwise stated.
Conduct Risk
Barclays strives to create and maintain mutually beneficial long-term relationships with our customers and clients. This means taking personal accountability for understanding their needs and providing them with products and services that meet those needs appropriately and help them manage their financial affairs.
As a transatlantic consumer, corporate and investment bank, Barclays also plays a critical role in promoting fair, open and transparent markets, as well as fostering shared growth for all. This means abiding by standards that in many cases are higher than those set by the laws and regulations that apply to our business.
Summary of performance in the period
In 2016, Barclays remained focused on the continuous improvements being made to manage risk effectively, with an emphasis on enhancing governance and management information to help ensure forward-looking risks are identified at earlier stages.
The cornerstone of our efforts is the Strengthening Personal Accountability programme, which is designed to strengthen our culture and embed our values throughout the organisation. The programme includes implementation of the UK Senior Manager, Certification and Conduct Rules, in addition to similar regulatory requirements and expectations in other jurisdictions.
The Group introduced dashboards on conduct, culture, complaints and citizenship to help the Board and senior management oversee and measure change across the organisation and take action where necessary to address issues and encourage progress. The dashboard data reflects a downward trend in conduct issues and complaints alongside an upward trend in confidence with respect to speaking up about potential conduct risks and issues.
Barclays proactively undertook ‘Lessons Learned’ assessments on issues identified in enforcement matters across the industry, including the use of performance metrics and formulaic incentives in remuneration and performance management. The Group also enhanced the role and impact of conduct issues in the remuneration process at both the individual and business level.
Businesses have continued to assess the potential customer, client and market impacts of strategic change and structural reform. As part of the 2016 Medium-Term Planning Process, material conduct risks associated with strategic and financial plans were assessed. Divestment ofNon-Core assets and businesses remains subject to a governance framework that considers the impacts on customer and client choice, market access, liquidity and other conduct risks.
The Group also continually assesses the impact of economic and geopolitical events on customers, clients and markets. In anticipation of the EU Referendum, Barclays successfully applied incident management techniques to prepare for and respond to customer and client needs and provide market liquidity.
Throughout 2016 conduct risks were raised by businesses for consideration by the Board Reputation Committee. The Board Reputation Committee reviewed the risks raised and whether management’s proposed actions were appropriate to manage the risks effectively. In addition to structural reform, strategic change, the EU Referendum and lessons learned assessments, the Board Reputation Committee reviewed
issues related to data security, cyber risk and technology resilience.
While there has been significant progress, a need for continued focus remains. Barclays must drive cultural change through all levels of the organisation and evidence consistent consideration of conduct risks in long-term, medium-term andday-to-day strategic decisions. The Group must continue to refine its conduct governance structure, particularly with respect to forward-looking management information to drive proactive decision making and address issues that persist around the general control environment and infrastructure.
The Group continued to incur significant costs in relation to litigation and conduct matters, please refer to Note 29 Legal, competition and regulatory matters and Note 27 Provisions for further detail. Costs include customer redress and remediation, as well as fines and settlements. Resolution of these matters remains a necessary and important part of delivering the Group’s strategy and an ongoing commitment to improve oversight of culture and conduct.
Reputation Risk has been managed as a Key Risk under Conduct Risk, prior to beingre-designated as a Principal Risk with effect from 2017. Barclays association with sensitive sectors is often an area of concern for stakeholders and the following topics were of particular interest during the year:
| § | Climate change and the management of climate risks is an increasingly important issue for the banking sector. There has been an increase in the level of interest in our response to climate change from a number of different stakeholder groups, largely driven by the ratification of COP21 requirements and publication of draft recommendations by the Financial Stability Board’s Taskforce on Climate-related Financial Disclosures for annual reports. We are undertaking a review of our global energy sector client portfolio, in order to develop a strategic approach that is sustainable in the long term. We expect credit appetite to fossil fuels more broadly to decrease over time due to regulatory requirements, political appetite and moves towards development of cleaner energy sources, with particular short-term focus on coal. In the meantime, we are actively pursuing opportunities in the green energy and renewable sectors. Please refer tohome.barclays/citizenship/our-reporting.html for further information. |
| § | Supporting the manufacture and export of military and riot control goods and services is a reputation risk for the financial services sector. Political and public concern in particular relates to the use of weapons against civilians in conflict situations and to support unjustified external aggression. Our Defence Policy mandates our relationship with clients in this sector and includes a number of restrictions regarding client activities. For example, it is our policy not to finance trade in, or manufacture of, nuclear, chemical, biological or other weapons of mass destruction. A formal governance structure is in place to review high risk defence relationships and trade transactions on a case by case basis, taking into account the client, types of goods, end user and country risk. |
| § | The banking sector has come under increased scrutiny for its perceived indirect involvement in human rights abuses committed by clients and customers. Barclays Group Statement on Human Rights outlines how we manage our impacts across four key areas: employees, local communities, suppliers and clients/customers, taking into account the UN Framework and Guiding Principles on business and human rights and other internationally recognised human rights standards. The UK Modern Slavery Act which came into force in October 2015 has helped raise awareness of the role business plays in managing human rights impacts. We are committed to combatting the risk of modern slavery or human trafficking in our supply chain or in any part of our business and Barclays Group Statement on Modern Slavery is available on home.barclays/content/dam/barclayspublic/docs/Citizenship/Policy-Positions/MSA2016.pdf |
Reputation Risk may also arise as a result of issues and incidents relevant to other Principal Risks, in particular othernon-financial risks e.g. Conduct or Operational Risk.
| Barclays PLC and Barclays Bank PLC 2016 Annual Report on Form 20-F | 181 |
Risk review
Supervision and regulation
Supervision of the Group
The Group’s operations, including its overseas offices, subsidiaries and associates, are subject to a significant body of rules and regulations that are a condition for authorisation to conduct banking and financial services business. These apply to business operations, impact financial returns and include reserve and reporting requirements and prudential and conduct of business regulations. These requirements are set by the relevant central banks and regulatory authorities that authorise, regulate and supervise the Group in the jurisdictions in which it operates. The requirements generally reflect global standards developed by, amongst others, the Basel Committee on Banking Supervision (BCBS), the International Organization of Securities Commissions (IOSCO) and the Financial Stability Board (FSB). They also reflect requirements imposed directly by, or derived from, EU legislation. Various bodies, such as central banks, also create voluntary Codes of Conduct which affect the way the Group does business.
Regulatory developments impact the Group globally. We focus particularly on EU, UK and US regulation due to the location of Barclays’ principal areas of business. Regulations elsewhere will affect Barclays due to the location of its branches, subsidiaries and, in some cases, clients.
The Group and certain of its members are subject to supervisory stress testing exercises in a number of jurisdictions. These exercises currently include the programmes of the Bank of England (BoE), the European Banking Authority (EBA), the Federal Deposit Insurance Corporation (FDIC), the Board of Governors of the Federal Reserve System (FRB) and the South African Reserve Bank (SARB). These exercises are designed to assess the resilience of banks to adverse economic or financial developments and ensure that they have robust, forward-looking capital planning processes that account for the risks associated with their business profile. Assessment by regulators is on both a quantitative and qualitative basis, the latter focusing on the Group’s data provision, stress testing capability and internal management processes and controls. Failure to meet requirements of regulatory stress tests, or the failure by regulators to approve the stress test results and capital plans of the Group or its members subject to these exercises, could result in the Group or certain of its members being required to enhance its capital position or limit capital distributions, to any external holders of its equity or capital or within the Group. In 2016 Barclays and certain of its subsidiaries completed stress testing pursuant to the requirements of the BoE, EBA and SARB. Barclays was not required to submit revised plans as a result of these tests. Further details of Barclays capital requirements are set out below under ‘Prudential Developments’.
Supervision in the EU
Financial regulation in the UK is to a significant degree shaped and influenced by EU legislation. This provides the structure of the European Single Market, an important feature of which is the framework for the regulation of authorised firms in the EU. This framework is designed to enable a credit institution or investment firm authorised in one EU member state to conduct banking or investment business in another member state through the establishment of branches or by the provision of services on a cross-border basis without the need for local authorisation. Barclays’ operations in Europe are authorised and regulated by a combination of both home and host regulators. The impact of the UK’s departure from the EU in this respect and, more broadly, its impact on the UK domestic regulatory framework, is yet to be determined. See the Risk Factor entitled ‘EU referendum’, which discusses the potential impact of the UK’s departure from the EU in more detail.
In the UK, the BoE has responsibility for monitoring the UK financial system as a whole. Theday-to-day regulation and supervision of the Group is divided between the Prudential Regulation Authority (PRA) and the Financial Conduct Authority (FCA).
In addition, the Financial Policy Committee (FPC) of the BoE has influence on the prudential requirements that may be imposed on the banking system through its powers of direction and recommendation.
Barclays Bank PLC is authorised and subject to solo and consolidated prudential supervision by the PRA and subject to conduct regulation and supervision by the FCA. Barclays Bank PLC’s Italian and French branches are also subject to direct supervision by the European Central Bank (ECB).
In its role as supervisor, the PRA seeks to maintain the safety and soundness of financial institutions with the aim of strengthening, but not guaranteeing, the protection of customers and the financial system. The PRA’s continuing supervision of financial institutions is conducted through a variety of regulatory tools, including the collection of information by way of prudential returns, reports obtained from skilled persons, visits to firms and regular meetings with management to discuss issues such as performance, risk management, conduct and culture and strategy.
The regulation and supervision of market conduct matters is the responsibility of the FCA. The FCA’s regulation of the UK firms in the Group is carried out through a combination of continuous assessment, regular thematic and project work based on the FCA’s sector assessments, which analyse the different areas of the market and the risks that may lie ahead.
Both the PRA and the FCA have continued to develop and apply a more assertive approach to supervision and the application of existing standards. This may include application of standards that either anticipate or go beyond requirements established by global or EU standards, whether in relation to capital, leverage and liquidity, resolvability and resolution or matters of conduct.
The FCA has retained an approach to enforcement based on credible deterrence that has seen significant growth in the size of regulatory fines. The approach appears to be trending towards a more US model of enforcement including the use of Deferred Prosecution Agreements, vigorous enforcement of criminal and regulatory breaches, heightened fines and proposed measures related to increased corporate criminal liability and the failure to prevent the facilitation of tax evasion.
The FCA has focused strongly on conduct risk and on customer outcomes and will continue to do so. This has included a focus on the design and operation of products, the behaviour of customers and the operation of markets. This may affect both the incidence of conduct costs and increase the cost of remediation. The FCA has also increasingly focused on individual accountability within firms, as illustrated by the Senior Managers’ Regime and Certification Regime detailed below.
Supervision in the US
The supervisory framework of Barclays within the US is set out below in the section entitled ‘Regulation in the United States’.
Supervision in South Africa
In South Africa, BAGLs operations are supervised and regulated by the South African Reserve Bank (SARB), the Financial Services Board (SAFSB) as well as ancillary regulators including, amongst others, the Financial Intelligence Centre. SARB oversees the banking industry and follows a risk-based approach to supervision, whilst the SAFSB overseesnon-banking financial services such as insurance and investment businesses. The National Credit Regulator regulates consumer credit and the National Consumer Commission is responsible for other aspects of consumer protection not regulated under the jurisdiction of the SAFSB. It is intended that regulatory responsibilities in South Africa will in future be divided between the SARB, which will be responsible for prudential regulation, and the SAFSB, which will be responsible for matters of market conduct. The proposed ‘twin peaks’ legislation is currently going through the consultation phase of the Parliamentary process to enact the legislation. Barclays’ and BAGL’s operations in other African countries are primarily supervised and regulated by the central banks in the jurisdictions where Barclays or BAGL (as relevant) has a banking presence. In some African countries, the conduct of Barclays’ and BAGL’s operations and thenon-banking activities are also regulated by financial market authorities.
| 182 | Barclays PLC and Barclays Bank PLC 2016 Annual Report on Form 20-F |
Risk review
Supervision and regulation
Supervision in Asia Pacific
Barclays’ operations in Asia Pacific are supervised and regulated by a broad range of national regulators including: the Japan Financial Services Agency, the Bank of Japan, the Hong Kong Monetary Authority, the Hong Kong Securities and Futures Commission, the Monetary Authority of Singapore, the Reserve Bank of India, the Securities and Exchange Board of India and the People’s Bank of China, China’s State Administration of Foreign Exchange and the China Banking Regulatory Commission. Such supervision and regulation extends to activities conducted through branches of Barclays Bank PLC in the Asia Pacific region as well as subsidiaries of the Group.
Global regulatory developments
Regulatory change continues to affect all large financial institutions. Such change emanates from: global institutions such as the G20, FSB, IOSCO and BCBS; the European Union regionally; and national regulators, especially in the UK and US. 2016 gave rise to significant political changes in these markets, which have increased the level of regulatory and supervisory uncertainty faced by the Group and the financial markets more broadly. For more information, please see the Risk Factor entitled ‘Business conditions, general economy and geopolitical issues’.
Further changes to financial services regulations impacting Barclays may affect the Group’s planned activities and could increase costs and contribute to adverse impacts on the Group’s earnings.
The programme of reform of the global regulatory framework previously agreed by G20 Heads of Government in April 2009 has continued to be taken forward throughout 2016. The G20 continues to monitor emerging risks and vulnerabilities in the financial system and has stated that it will take action to address them if necessary.
The FSB has been designated by the G20 as the body responsible forco-ordinating the delivery of the global reform programme in relation to the financial services industry. It has focused particularly on the risks posed by systemically important financial institutions. In 2011, G20 Heads of Government adopted FSB proposals to reform the regulation of global systematically important financial institutions(G-SIFIs), including global systematically important banks(G-SIBs), such as Barclays.
Regulatory developments in the financial services industry can broadly be categorised as follows: (a) prudential developments; (b) recovery and resolution developments, a key aspect of which is to ensure thatG-SIFIs are capable of being resolved without recourse to taxpayer support; (c) structural reform developments; (d) market infrastructure developments, aimed at enhancing client protection, financial stability and market integrity; and (e) conduct, culture and consumer protection developments.
Regulation in the EU and the UK
(a) Prudential developments
The ‘Basel III’ capital and liquidity standards, defined by BCBS, are implemented in EU law through CRD IV. The provisions of CRD IV either applied from, or had to be implemented in EU Member States by, 1 January 2014. In addition, the PRA has expected Barclays, in common with other major UK banks and building societies, to meet a 7% CET1 ratio at the level of the consolidated group since 1 January 2016.
G-SIBs are subject to a number of additional prudential requirements, including the requirement to hold additional loss absorbing capacity and additional capital buffers above the level required by Basel III standards. The level ofG-SIB buffer is set by the FSB according to a bank’s systemic importance and can range from 1% to 3.5% of risk-weighted assets. TheG-SIB buffer must be met with common equity.
In November 2016, the FSB published an update to its list ofG-SIBs, reducing theG-SIB buffer that Barclays is required to hold from 2% to 1.5%, effective from January 2018. The additionalG-SIB buffer began to be phased in from January 2016, from whenG-SIBs were required to meet 25% of their designated buffer. This will increase to 50% in 2017, 75% in 2018 and 100% in January 2019.G-SIBs have also been required to meet higher supervisory expectations for data aggregation capabilities since 1 January 2016. Barclays is also subject to, among other buffers, a countercyclical capital buffer (CCyB) based on rates determined by the regulatory authorities in each jurisdiction in which
Barclays maintains exposures. These rates may vary in either direction – for example, in July 2016, the FPC published a policy statement directing the PRA to reduce the UK CCyB rate from 0.5% to 0% of banks’ UK exposures with immediate effect, which was subsequently adopted by the PRA. In November 2016, the FPC reaffirmed that it expects to maintain a UK CCyB rate at 0% until at least June 2017, absent any material change in the economic outlook. The systemic risk buffer is expected to be set by the PRA for the first time in early 2019.
The BCBS maintains a number of active workstreams that will affect the Group. In January 2016, the BCBS endorsed a new market risk framework, including rules made as a result of its fundamental review of the trading book, to take effect in 2019. The BCBS also continues to focus on the consistency of risk weighting of assets and on reducing the variations of approaches to risk weightings between banks. This includes revisions to the standardised rules for credit risk, CVA volatility risk and operational risk. The BCBS is also considering whether to limit the use of internal models in certain areas (for example, removing the Advanced Measurement Approach for operational risk) and to apply capital floors based on the standardised approaches. The BCBS has also recently published final standards on the Basel III securitisation framework, interest rate risk in the banking book and minimum capital requirements for market risk. The final standards for measuring and controlling large exposures were published by the BCBS in April 2014 to take effect in 2019. In November 2016 the European Commission adopted a proposal (commonly referred to as CRD V) to begin the legislative process for introducing these standards within the EU, with legislation expected to be finalised in late 2017 or early 2018. These proposals, if implemented in their current form would, among other things, overhaul existing rules relating to standardised and advanced market risk and the rules governing the inclusion of positions in the regulatory trading book. The proposals would also enhance rules for counterparty credit risk, strengthen requirements relating to leverage and large exposures and introduce a net stable funding ratio, requiring banks to ensure that they hold reliable sources of funds in excess of their required amount of stable funding over a one year period. CRD V also proposes to require thatnon-EU parent undertakings with two or more subsidiary firms established in the EU establish an intermediate parent undertaking, authorised and established in, and subject to the supervision of, an EU Member State. This requirement would apply tonon-EU groups that have been identified asnon-EU Global Systemically Important Institutions(G-SIIs) under CRD IV (as amended) and to groups with entities in the EU with total assets of at least€30bn. If implemented as proposed, Barclays could be required to establish such a holding company in respect of its EU operations following the UK’s departure from the EU.
In January 2017, the BCBS announced that its finalisation of reforms to Basel III had been delayed. The BCBS is now expected to issue updated standards on the calculation of operational risk, the standardised framework for credit risk, restrictions on the use of internal models (including the application of RWA floors based on standardised approaches), the leverage ratio (including a leverage ratio buffer forG-SIBs) and an output floor based on a standardised approach, later in 2017. As these measures will require EU and domestic legislation to be implemented, it is not clear when they will become effective.
IFRS9 will be implemented in the European Union from 1 January 2018. In October 2016, the Basel Committee issued two documents on the treatment of accounting provisions in the regulatory framework, to take account of the future move to expected credit loss provisioning under IFRS and Financial Accounting Standards Board (FASB) standards. One paper considered transitional arrangements tophase-in the immediate capital impact of the new provisioning standards, while the other discussed more fundamental changes to the recognition of provisions in regulatory capital and changes to the risk weighting framework. The European Commission’s CRR2 proposal also proposed transitional arrangements. The regulatory capital impact of IFRS9 on the group will depend on the timing and final form of all these initiatives.
(b) Recovery and Resolution developments
An important component of the EU legislative framework is the 2014 Bank Recovery and Resolution Directive (BRRD) which establishes a framework for the recovery and resolution of EU credit institutions and investment firms. The UK implemented the BRRD through the Financial
| Barclays PLC and Barclays Bank PLC 2016 Annual Report on Form 20-F | 183 |
Services (Banking Reform) Act 2013 (the Banking Reform Act), which amended the Banking Act 2009.
Pursuant to the Banking Act, UK resolution authorities are empowered to intervene in and resolve a UK financial institution that is no longer viable. Pursuant to these laws, the BoE (in consultation with the PRA and HM Treasury as appropriate) has several stabilisation options where a banking institution is failing or likely to fail: (i) transfer some or all of the securities of the bank to a commercial purchaser; (ii) transfer some or all of the property, rights and liabilities of the bank to a ‘bridge bank’ wholly owned by the BoE or to a commercial purchaser; (iii) transfer the impaired or problem assets to an asset management vehicle to allow them to be managed over time; (iv) cancel or reduce certain liabilities of the institution or convert liabilities to equity to absorb losses and recapitalise the institution and (v) in the case of a holding company, transfer the banking institution into temporary public ownership. In addition, the BoE may apply for a court insolvency order in order to wind up or liquidate the institution or to put the institution into special administration. When exercising any of its stabilisation powers, the BoE must generally provide that shareholders bear first losses, followed by creditors in accordance with the priority of their claims under normal insolvency proceedings.
In order to enable the exercise of its stabilisation powers, the BoE may impose a temporary stay on the rights of creditors to terminate, accelerate or close out contracts, and in some cases to override events of default or termination rights that might otherwise be invoked as a result of a resolution action. In addition, the Banking Act gives the BoE the power to override, vary, or impose conditions or contractual obligations between a UK bank, its holding company and its group undertakings, in order to enable any transferee or successor bank to operate effectively after any of the resolution tools have been applied. There is also power for HM Treasury to amend the law (excluding provisions made by or under the Banking Act) for the purpose of enabling it to use the regime powers effectively, potentially with retrospective effect. The Banking Act powers apply regardless of any contractual restrictions and compensation that may be payable. In July 2016 the PRA issued final rules on ensuring operational continuity in resolution. The rules will apply from 1 January 2019 and will require banks to ensure that their operational structures facilitate effective recovery and resolution planning and the continued provision of functions critical to the economy in a resolution scenario.
In July 2016 the PRA issued final rules on ensuring operational continuity in resolution. The rules will apply from 1 January 2019 and will require banks to ensure that their operational structures facilitate effective recovery and resolution planning and the continued provision of fucntions ciritcal to the economy in a resolution scenario.
The BRRD requires EU member states to establishpre-funded resolution funds of 1% of covered deposits to be built up by 31 December 2024. The UK government uses the Bank Levy to meet this ex ante funding requirements, as well as the ex post contributions that would be required were theex-ante contributions not to cover costs or other expenses incurred by use of the resolution funds.
Separately, Financial Services Compensation Scheme (FSCS), a deposit guarantee scheme established under the EU Deposit Guarantee Schemes Directive and Investor Schemes Directive, is funded through fees levied on participant firms, including Barclays. The FSCS operates when an authorised firm is unable or is likely to be unable to meet claims made against it by its customers because of its financial circumstances. Most insured deposits made with branches of Barclays Bank PLC within the EEA are covered by the FSCS. Most claims made in respect of investment business will also be protected claims if the business was carried on from the UK or from a branch of the bank or investment firm in question in another EEA member state. Deposits covered by the FSCS are preferred in an insolvency of the bank.
In the event that the HM Treasury significantly increases the Bank Levy applicable to Barclays, or the FSCS significantly increases the fees levied on Barclays by virtue of its participation in the FSCS, the associated costs to the Group may have a material impact on the Group’s results.
The BRRD also requires competent authorities to impose a ‘Minimum Requirement for own funds and Eligible Liabilities’ (‘MREL’) on financial institutions to facilitate the effective exercise of thebail-in tool referred to above. The EU proposes that forG-SIBs, such as Barclays, MREL should be set in accordance with the FSB Total Loss Absorbing Capital (TLAC) standard, discussed further below.
In November 2015 the FSB finalised its proposals to enhance the loss-absorbing capacity ofG-SIBs to ensure that there is sufficient loss-absorbing and recapitalisation capacity available in resolution to implement an orderly resolution which minimises the impact on financial stability, ensures the continuity of critical functions and avoids exposing taxpayers to losses. To this end, the FSB has set a new minimum requirement for ‘total loss absorbing capacity’ (TLAC). The EU has proposed to implement the TLAC standard via the MREL requirement and the European Commission has proposed amendments in its CRD V proposal to achieve this. As the proposals remain in draft it is uncertain what the final requirements and timing will be. The statement of policy confirmed that the BoE will set MREL for UKG-SIBs as necessary to implement the TLAC standard and that institution or group-specific MREL requirements will depend on the preferred resolution strategy for that institution or group. The MREL will be phased in from 1 January 2019 and will be fully implemented by 1 January 2022, at which timeG-SIBs with resolution entities incorporated in the UK, including Barclays, will be required to meet a MREL equivalent to the higher of (i) two times the sum of its Pillar 1 and Pillar 2A requirements or (ii) the higher of two times its leverage ratio or 6.75% of leverage exposures. However, the PRA will review the MREL calibration by the end of 2020, including assessing the proposal for Pillar 2A recapitalisation which may drive a different 1 January 2022 MREL requirement than currently proposed. In addition, it is proposed that CET1 capital cannot be counted towards both MREL and the combined buffer requirement (CBR), meaning that the CBR will effectively be applied above both the Pillar 1 and Pillar 2A requirements relating to own funds and MREL, such that a failure to maintain sufficient other MREL resources could result in a breach of the CBR.
In October 2016, the BCBS also published its final standard on the prudential treatment of banks’ investments in TLAC instruments issued by other institutions, confirming that internationally active banks (bothG-SIBs andnon-G-SIBs) must deduct their holdings of TLAC instruments that do not otherwise qualify as regulatory capital from their own Tier 2 capital. Where the investing bank owns less than 10% of the issuing bank’s common shares, TLAC holdings are to be deducted from Tier 2 capital only to the extent that they exceed 10% of the investing bank’s common equity (or 5% fornon-regulatory capital TLAC holdings); below this threshold, holdings would instead be subjected to risk-weighting.G-SIBs may only apply risk-weighting tonon-regulatory capital TLAC holdings by the 5% threshold where those holdings are in the trading book and are sold within 20 business days.
In addition to the amendments proposed to align MREL forG-SIBs with the TLAC standard, in November 2016 the European Commission proposed a package of amendments to the BRRD, including to harmonise the priority ranking of unsecured debt instruments under national insolvency proceedings and to enhance the stabilisation tools by including a moratorium tool.
The PRA has made rules that require authorised firms to draw up recovery plans and resolution packs, as required by the BRRD. Recovery plans are designed to outline credible recovery actions that authorised firms could implement in the event of severe stress in order to restore their business to a stable and sustainable condition. The resolution pack contains detailed information on the authorised firm in question which will be used to develop resolution strategies for that firm, assess its current level of resolvability against the strategy, and to inform work on identifying barriers to the implementation of operational resolution plans. In the UK, Recovery and Resolution Planning (RRP) work is considered part of continuing supervision. Removal of potential impediments to an orderly resolution of the Group or one or more of its subsidiaries in considered as part of the BoE’s and PRA’s supervisory strategy for each firm, and the PRA can require firms to make significant changes in order to enhance resolvability. Barclays currently provides the PRA with a Recovery Plan annually and with a Resolution Pack every other year.
| 184 | Barclays PLC and Barclays Bank PLC 2016 Annual Report on Form 20-F |
Risk review
Supervision and regulation
The BoE’s preferred approach for the resolution of the Group is abail-in strategy with a single point of entry through Barclays PLC. Under such a strategy, Barclays PLC’s subsidiaries would remain operational while Barclays PLC’s eligible liabilities would be written down or converted to equity in order to recapitalise the Group and allow for the continued provision of services and operations throughout the resolution. This strategy relies on Barclays PLC having issued sufficient loss-absorbing capacity to effectbail-in and recapitalise the Group should the need arise. As a result the Group is focusing on transitioning eligible loss absorbing capital from subsidiary level to Barclays PLC level.
(c) Structural reform developments
Recent developments in banking law and regulation in the UK have included legislation designed to ring-fence the retail and smaller deposit-taking businesses of large banks. The Banking Reform Act put in place a framework for this ring-fencing and secondary legislation passed in 2014 elaborated on the operation and application of the ring-fence. Ring-fencing rules have been published by the PRA further determining how ring-fenced banks will be permitted to operate. Further rules published by the FCA set out the disclosures thatnon-ring-fenced banks are required to make to prospective customers that are individuals.
In relation to ring-fencing in the UK, FSMA, as amended by the Banking Reform Act, requires, amongst other things, the separation of the retail and smaller-business deposit-taking activities of UK banks in the UK and branches of UK banks in the European Economic Area (EEA) into a legally distinct, operationally separate and economically independent entity, which will not be permitted to undertake a range of activities (so called ring-fencing). UK ring-fenced banks and large UK building societies will be required to hold CET1 capital in excess of that required under CRD IV from 2019. This requirement will be applied by the PRA on an institution specific basis according to a framework set out by the FPC. The implications of these requirements on Barclays are discussed in more detail in the Risk Factor entitled ‘Structural Reform’.
At European level, the European Commission issued proposals recommending the mandatory separation of proprietary trading and other high-risk trading activities from banking activities in January 2014.
These proposals would apply to institutions that have been identified asG-SIIs under CRD IV and envisage, amongst other things: (i) a ban on proprietary trading in financial instruments and commodities; and (ii) rules on the economic, legal, governance, and operational links between the trading entities and other banking group entities. The legislative proposal includes a derogation in respect of the separation of trading activities (but not the ban on proprietary trading) for Member States which had adopted similar measures before the date of its publication. The legislative proposal remains under consideration by the European Parliament and the Council of the EU.
(d) Market Infrastructure developments
The European Market Infrastructure Regulation (EMIR) has introduced requirements designed to improve transparency and reduce the risks associated with the derivatives market, some of which are still to be fully implemented. EMIR requires that certain entities that enter into derivative contracts: report such transactions; clear certain over the counter (OTC) transactions where mandated to do so; and implement risk mitigation standards in respect of uncleared OTC trades. The obligation to clear derivatives only applies to certain counterparties and specified types of derivative. In October 2016 the European Commission adopted a delegated regulation relating to the exchange of collateral, one of the risk mitigation techniques under EMIR. Provisions relating to initial margin will be phased in from 6 February 2017 until 1 September 2020. Provisions relating to variation margin applied on a phased basis from 4 February 2017. EMIR has potential operational and financial impacts on the Group, including by imposing collateral requirements.
CRD IV aims to complement EMIR by applying higher capital requirements for bilateral, unclearedover-the-counter derivative trades. Lower capital requirements for cleared derivatives trades are only available if the central counterparty through which the trade is cleared is recognised as a ‘qualifying central counterparty’ (QCCP) which has been authorised or recognised under EMIR (in accordance with binding technical standards). Higher capital requirements may apply to the Group following the UK’s departure from the EU if UK CCPs are not
regarded as QCCPs.
The amended Markets in Financial Instruments Directive and Markets in Financial Instruments Regulation (collectively referred to as MiFID II) is expected to apply from 3 January 2018. MiFID II will affect many of the investment markets in which the Group operates, the instruments in which it trades and the way it transacts with market counterparties and other customers. Changes introduced by MiFID II include: the introduction of a new type of trading venue (the organised trading facility), capturingnon-equity trading that falls outside the current regime; and the expansion of the concept of, and requirements applicable to, firms which systematically trade against proprietary capital (systematic internalisers).
MiFID II also strengthens investor protections and imposes new curbs on high frequency and commodity trading. It also increasespre-and post-trade transparency and introduces a new regime for third country firms. MiFID II also includes new requirements relating tonon-discriminatory access to trading venues, central counterparties and benchmarks, and harmonised supervisory powers and sanctions across the EU.
The EU Benchmarks Regulation came into force in June 2016, with the majority of provisions intended to apply from January 2018. This Regulation applies to the administration, contribution of data to and use of benchmarks within the EU. Financial institutions within the EU will be prohibited from using benchmarks unless their administrators are authorised, registered or otherwise recognised in the EU. This may impact the ability of Barclays to use certain benchmarks.
In 2015 the European Commission launched work on establishing a Capital Markets Union (CMU) within the EU. The CMU aims to increase the availability ofnon-bank financing in the EU, deepen the single market for financial services and promote growth and financial stability. The Commission’s work on the CMU includes the development of a regulatory framework in order to enhance efficiencies in the cross-border environment for capital markets, as well as a review of existing legislation to determine instances in which such legislation should be modified. This work is likely to continue through 2017 and beyond and may result in changes to the EU regulatory framework in which the Group operates.
(e) Conduct, Culture and Consumer Protection developments
On 7 March 2016 the PRA and FCA introduced measures to increase the individual accountability of senior managers and other covered individuals in the banking sector. The new regime comprises the ‘Senior Managers Regime’, which applies to a limited number of individuals with senior management responsibilities within a firm, the ‘Certification Regime’, which is intended to assess and monitor the fitness and proprietary of a wider range of employees who could pose a risk of significant harm to the firm or its customers and conduct rules that individuals subject to either regime must comply with. From March 2017, the conduct rules will apply more widely to other staff of firms within scope of the regime.
The Financial Services Act 2010, amongst other things, requires the UK regulators to make rules about remuneration and to require regulated firms to have a remuneration policy that is consistent with effective risk management. The Banking Act also amended FSMA to allow the FCA to make rules requiring firms to operate a collective consumer redress scheme to deal with cases of widespread failure by regulated firms to meet regulatory requirements, that may have created consumer detriment.
Barclays has to comply with national data protection laws, governing the collection, use, and disclosure of personal data, in a majority of the countries in which it operates. From 25 May 2018 data protection laws throughout the EU will be replaced by a single General Data Protection Regulation (GDPR); the UK government has confirmed the UK will adopt and apply the GDPR from May 2018. The impact across Barclays will be significant, affecting not only Group entities operating and processing personal data within the EU but also those outside the EU offering goods or services to, or monitoring individuals within the EU. The GDPR contains significant penalties for data protection breaches andnon-compliance, up to 4% of Group global turnover.
| Barclays PLC and Barclays Bank PLC 2016 Annual Report on Form 20-F | 185 |
A number of recent developments have indicated a clear political and regulatory desire to make customer transactional account information more easily accessible to customers and parties providing services to them. One such example is the revised Payment Services Directive (PSD2), which came into force on 12 January 2016 and must be implemented by 13 January 2018. Shortly after the finalisation of PSD2, the Open Banking Working Group, a body established at the request of HM Treasury, issued a report outlining how an ecosystem allowing the sharing of bank and customer information could be established, operated and governed. The resulting ‘Open Banking Standard’ is intended to allow for the provision of access to public data and secure access to private data.
In August 2016, the UK Competition and Markets Authority (CMA) published the results of its market investigation into retail banking, identifying features of the market that were having an adverse effect on competition and setting out a number of measures to remedy the shortcomings. One of these remedies requires Barclays, among other banks, to help establish and fund an entity to govern open access to information about bank services, provision and service quality. Barclays expects to be required to make public information available through open application programming interfaces (APIs) through the course of 2017, with transactional information being available through an open API by January 2018 to align with the PSD2 timeframes.
EU regulation and governments have been increasingly focused on cyber security risk management for banking organisations and have proposed laws that would impose a variety of requirements on regulated Barclays entities. These requirements include minimum required security measures, enhanced reporting requirements and a variety of other cyber and information risk governance measures. When implemented, the proposals may increase technology and compliance costs for Barclays.
The UK Bribery Act 2010 introduced a new form of corporate criminal liability focussed on a company’s failure to prevent bribery on its behalf. The legislation has broad application and in certain circumstances may have extraterritorial impact as to entities, persons or activities located outside the UK, including Barclays PLC and its subsidiaries. In practice, the legislation requires Barclays to have adequate procedures to prevent bribery which, due to the extraterritorial nature of the status, makes this both complex and costly.
Regulation in the United States
Supervision in the US
Barclays’ US activities and operations are subject to umbrella supervision by the Board of Governors of the Federal Reserve System (FRB), as well as additional supervision, requirements and restrictions imposed by other federal and state regulators. Barclays PLC, Barclays Bank PLC and their US branches and subsidiaries are subject to a comprehensive regulatory framework involving numerous statutes, rules and regulations, including the International Banking Act of 1978, the Bank Holding Company Act of 1956 (BHC Act), the USA PATRIOT Act of 2001 and the Dodd Frank Wall Street Reform and Consumer Protection Act of 2010 (DFA). In some cases, US requirements may impose restrictions on Barclays’ global activities in addition to its activities in the US.
In July 2016, Barclays established a US intermediate holding company, Barclays US LLC (BUSL), which holds substantially all of Barclays’ US subsidiaries and assets (including Barclays Capital Inc. and Barclays Bank Delaware), other than Barclays’ US branches and certain other assets and subsidiaries. BUSL, Barclays PLC and Barclays Bank PLC are regulated as bank holding companies (BHCs) by the FRB, which exercises umbrella supervisory authority over and imposes a wide variety of requirements and restrictions on Barclays’ US operations, including with respect to safety and soundness. As Barclays’top-tier US bank holding company, BUSL is or will become subject to the enhanced prudential supervision requirements applicable to US bank holding companies of comparable size, including: (i) regulatory capital requirements and leverage limits; (ii) mandatory annual supervisory and annual and semi-annualcompany-run stress testing of capital levels, and annual submission of a capital plan in connection with the FRB’s annual Comprehensive Capital Analysis and Review (CCAR), resulting in an FRB objection ornon-objection to the capital plan; (iii) FRBnon-objection to any proposed capital distributions by BUSL, including to Barclays Bank PLC; (iv) additional substantive liquidity requirements,
including requirements to conduct monthly internal liquidity stress tests for BUSL (and also, separately, for Barclays Bank PLC’s US branch network), and to maintain a30-day buffer of highly liquid assets; (v) other liquidity risk management requirements, including compliance with liquidity risk management standards established by the FRB, and maintenance of an independent function to review and evaluate regularly the adequacy and effectiveness of the liquidity risk management practices of Barclays’ combined US operations; and (vi) overall risk management requirements, including a US risk committee and a US chief risk officer. BUSL will become subject to the FRB’s capital planning requirements in 2017.
The BHC Act generally restricts the activities of BHCs to banking and activities closely related to banking. In order to engage in a broader range of activities, Barclays PLC and Barclays Bank PLC have also elected to be treated as financial holding companies under the BHC Act. Financial holding companies may engage in a range of financial and related activities, directly or through subsidiaries, including underwriting, dealing and making markets in securities. In order to maintain its status as a financial holding company, a financial holding company is required to meet or exceed certain regulatory capital ratios and other requirements and be deemed ‘well capitalised’ and ‘well managed’. In addition, the financial holding company status requires Barclays Bank Delaware to maintain at least a ‘satisfactory’ rating under the Community Reinvestment Act of 1977 (CRA). Entities ceasing to meet any of these requirements are required to enter into an agreement to correct the deficiency and are allotted a period of time in which to restore capital levels or management ratings. Thenon-compliant entity will be subject to limitations on activities during any period ofnon-compliance. If the capital level or rating is not restored, thenon-compliant entity would be subjected to increasingly stringent penalties and could ultimately be closed or required to cease certain activities in the US.
In addition to general oversight by the FRB, certain of Barclays’ branches and subsidiaries are regulated by additional authorities based on the location or activities of those entities. The deposits of Barclays Bank Delaware are insured by the FDIC, which also exercises supervisory authority over the bank’s operations. Under the Federal Deposit Insurance Act Barclays PLC, Barclays Bank PLC and BUSL are required to act as a source of financial strength for Barclays Bank Delaware. This could, among other things, require these entities to inject capital into Barclays Bank Delaware if it fails to meet applicable regulatory capital requirements. The New York and Florida branches of Barclays Bank PLC are subject to extensive supervision and regulation by, as applicable, the New York State Department of Financial Services (NYSDFS) and the Florida Office of Financial Regulation. Barclays Bank Delaware, a Delaware chartered commercial bank, is subject to supervision and regulation by the Delaware Office of the State Bank Commissioner.
Barclays’ US securities broker/dealer, investment advisory and investment banking operations are also subject to ongoing supervision and regulation by the Securities and Exchange Commission (SEC), the Financial Industry Regulatory Authority (FINRA) and other government agencies and self-regulatory organisations (SROs) as part of a comprehensive scheme of regulation of all aspects of the securities and commodities business under US federal and state securities laws.
Similarly, Barclays’ US commodity futures, commodity options and swaps-related operations are subject to ongoing supervision and regulation by the Commodity Futures Trading Commission (CFTC), the National Futures Association and other SROs.
Barclays’ US retail and consumer activities, including the US credit card operations of Barclays Bank Delaware, are subject to direct supervision and regulation by the Consumer Financial Protection Bureau (CFPB), which was established by the DFA. The CFPB has the authority to examine and take enforcement action related to compliance with federal laws and regulations regarding the provision of consumer financial services and the prohibition of ‘unfair, deceptive or abusive acts and practices’.
| 186 | Barclays PLC and Barclays Bank PLC 2016 Annual Report on Form 20-F |
Risk review
Supervision and regulation
The ‘Volcker Rule’, a provision of the DFA that came into effect in July 2015, prohibits banking entities from undertaking certain ‘proprietary trading’ activities and limits the sponsorship of, and investment in, private equity funds (includingnon-conforming real estate and credit funds) and hedge funds, in each case broadly defined, by such entities. These restrictions are subject to certain exemptions, including for underwriting, market-making and risk-mitigating hedging activities as well as for transactions and investments occurring solely outside of the US. As required by the rule, Barclays has developed and implemented an extensive compliance and monitoring programme (both inside and outside of the US) addressing proprietary trading and covered fund activities. These efforts are expected to continue as the FRB and the other relevant US regulatory agencies further implement and monitor these requirements and Barclays may incur additional costs in relation to such efforts. The Volcker Rule is highly complex and its full impact will not be known with certainty until market practices and structures further develop under it.
The Bank Secrecy Act, USA PATRIOT Act 2001 and regulations thereunder contain numerous anti-money laundering and anti-terrorist financing requirements for financial institutions. In addition, Barclays is subject to the US Foreign Corrupt Practices Act, which prohibits certain payments to foreign officials, as well as rules and regulations relating to economic sanctions and embargo programs administered by the US Office of Foreign Assets Control which restrict certain business activities with certain individuals, entities, groups, countries and territories. In some cases, these regulations may impact entities, persons or activities located outside the US, including Barclays PLC and its subsidiaries. The enforcement of these regulations has been a major focus of US government policy relating to financial institutions in recent years, and failure of a financial institution to ensure compliance could have serious legal, financial and reputational consequences for the institution.
The US regulators have enhanced their focus on the promotion of cultural values as a key area for banks. The regulators view the responsibility for reforming culture as primarily sitting with the industry. In this regard regulators have increasingly focused on areas such as incentive compensation, promotion processes and measurements of success.
Title II of the DFA established the Orderly Liquidation Authority, a new regime for orderly liquidation of systemically important financial institutions, which could apply to BUSL. Specifically, when a systemically important financial institution is in default or danger of default, the FDIC may be appointed receiver under the orderly liquidation authority instead of the institution being resolved through a voluntary or involuntary proceeding under the US Bankruptcy Code. In addition, the licensing authorities of each US branch of Barclays Bank PLC and of Barclays Bank Delaware have the authority, in certain circumstances, to take possession of the business and property of the applicable Barclays entity they license or to revoke or suspend such licence. Such circumstances include violations of law, unsafe business practices and insolvency.
Under the DFA, Barclays must submit annually to the FRB and the FDIC a plan for its ‘rapid and orderly’ resolution in the event of material financial distress or failure. As required, Barclays submitted its most recent annual US resolution plan to the US regulators on 1 July 2015. Barclays’ next submission will be due on 1 July 2017 in view of the FDIC’s and FRB’s joint determination that certain foreign banking organisations’ 2016 annual resolution plan filing requirements would be satisfied by the 2017 submission.
In addition, on 3 February 2017, the President of the US issued an executive order identifying ‘core principles’ for the administration’s financial services regulatory policy and directing the US Secretary of Treasury, in consultation with the heads of other US financial regulatory agencies, to evaluate and issue a report within 120 days examining how the current regulatory framework promotes or inhibits the principles and what actions have been and are being taken to promote the principles.
Regulatory developments in the US
The DFA’s ultimate impact on the Group continues to remain uncertain and some rules are not yet fully implemented. In addition, market practices and structures may change in response to the requirements of the DFA in ways that are difficult to predict but that could impact Barclays’ business. Nonetheless, certain proposed or final regulations are particularly likely to have a significant effect on the Group, including:
(a) Regulation of derivatives markets
The DFA also established a regulatory scheme with respect toover-the-counter swaps and other derivatives, which has resulted in substantial changes in the markets for such instruments and will result in additional regulatory requirements. Among the changes mandated by the DFA is a requirement that many types of derivatives that used to be traded in the over the counter markets be traded on an exchange or swap execution facility and centrally cleared through a regulated clearing house. At present, most interest rate swaps and certain credit default swaps are subject to these requirements, but other categories of swaps will become subject to the requirements in the future. The DFA also mandates that swaps and security-based swaps entered into within the jurisdiction of U.S. regulators be reported to central data repositories and that certain of that information be made available to the public on an anonymous basis. In addition, certain participants in these markets are required to register with the CFTC as ‘swap dealers’ or ‘major swap participants’ and/or, following the compliance date for relevant SEC rules, with the SEC as ‘security-based swap dealers’ or ‘major security-based swap participants’. Such registrants are or will be subject to CFTC and SEC regulation and oversight. SEC finalised the rules governing security based swap dealer registration in 2015 but clarified that registration timing is contingent upon the finalisation of certain additional rules under Title VII of DFA, several of which are still pending. Additional SEC rules governing security-based swap transactions, including security-based swap reporting, will become effective after the security-based swap dealer registration date. Barclays Bank PLC has provisionally registered with the CFTC as a swap dealer. Entities required to register are subject to business conduct and record-keeping and reporting requirements and will be subject to capital and margin requirements in connection with transactions with certain US andnon-US counterparties. Barclays Bank PLC is also prudentially regulated as a swaps dealer so is subject to the FRB swaps rules.
The CFTC has approved certain comparability determinations that would permit substituted compliance withnon-US regulatory regimes for certain swap regulations related to business conduct requirements. The CFTC had previously stated that its transaction-level rules (such as margin and documentation requirements) would apply to certain transactions entered into between anon-US swap dealer and anon-US counterparty but has delayed the compliance date for this requirement a number of times. The most recent extension of this relief expires on 30 September 2017. In addition, the CFTC has proposed to apply transaction-level rules to certain cross-border transactions with a U.S. nexus. It is unclear whether further changes will be made to these proposed rules or when they will become effective.
In this regard, the US prudential regulators and the CFTC have imposed rules requiring the exchange of collateral in respect of OTC derivative transactions, in a similar manner to the European Commission as set out above in the section entitled ‘Market Infrastructure Developments’.
(b) Prudential developments
The FRB has proposed a number of prudential rules to implement DFA requirements, as well as its own versions of a number of international regulatory standards, including Basel large exposure rules (or single counterparty credit limits, proposed in March 2016) and temporary resolution stays for qualified financial contracts (proposed in May 2016).
In December 2016, the FRB issued final regulations for TLAC which will apply to BUSL. The FRB’s final TLAC rule, while generally following the FSB termsheet, contains a number of provisions that are more restrictive. For example, the FRB’s TLAC rule includes provisions that require BUSL (the Barclays IHC) to have (i) a specified outstanding amount of eligible long-term debt, (ii) a specified outstanding amount of TLAC (consisting of common and preferred equity regulatory capital plus long term debt), and (iii) a specified common equity buffer. In addition, the FRB’s TLAC rule would prohibit BUSL, for so long as the Group’s overall resolution plan treats BUSL as anon-resolution entity, from issuing TLAC to entities other than the Group and itsnon-US subsidiaries.
| Barclays PLC and Barclays Bank PLC 2016 Annual Report on Form 20-F | 187 |
In addition, the FRB has issued proposed regulations for net stable funding ratio (NSFR) implementation. The NSFR is one of the two BaselIII-based liquidity measures, along with the LCR, and as proposed by the FRB, would apply to US bank holding companies with more than $250bn in total assets or $10bn or more inon-balance sheet foreign exposures, including BUSL, and consolidated depositary institution subsidiaries of such banking organisations with more than $10bn in assets, including Barclays Bank Delaware. Under the proposed rule, such entities would be required to maintain a minimum level of available stable funding that equals or exceeds the amount of required stable funding over aone-year period. The proposal provides for an effective date of 1 January 2018, subject to finalisation of the rules.
If finally adopted as currently proposed, the NSFR requirement could impact Barclays liquidity and increase the funding and compliance costs for BUSL.
(c) Cybersecurity
US regulators, including the FRB, FDIC and NYSDFS, have been increasingly focused on cybersecurity risk management for banking organisations and have issued proposals for, or requested comment on, regulations that would impose a variety of new requirements on regulated Barclays entities. These requirements include, among others,
the adoption of cybersecurity policies and procedures meeting specified criteria, a set of minimum required security measures, new reporting and compliance certification requirements and a variety of other cyber and information risk governance measures. If finally implemented, the proposals may increase technology and compliance costs for Barclays.
Structural Reform
Overview
Barclays announced in March 2016 that it will be organised as two clearly defined divisions, Barclays UK and Barclays International, to simplify the Group and prepare early for UK ring-fencing requirements.
Barclays intends to achieve ring-fencing separation by setting up an operational legal entity, which will constitute the ring-fenced bank (RFB) and will be separate from Barclays Bank PLC. The Barclays UK division of Barclays Bank PLC will be transferred to RFB. Barclays Bank PLC will continue to house the Barclays International division. The two legal entities, RFB (including Barclays UK) and BBPLC (including Barclays International) will operate alongside one another together with the Group Service Company, Barclays Services Limited (BSerl), as subsidiaries of Barclays PLC within the Barclays Group.
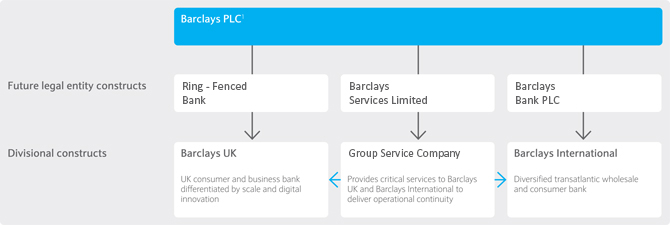
In order to achieve this target-state structure, Barclays will need to undertake a number of legal transfers, including the transfer of customer and non-customer assets, liabilities and contractual arrangements.
Barclays intends to use a court approved statutory ring-fence transfer scheme process as defined in Financial Services and Markets Act 2000 part VII section 106B (RFTS) to conduct the majority of these transfers to the RFB, as well as certain other items to BSerL. In addition to the transfers conducted through the RFTS, certain items will be transferred via alternative arrangements.
Between now and 1 January 2019, Barclays will complete the transition from the former divisional constructs to the legal entity constructs described above.
| 188 | Barclays PLC and Barclays Bank PLC 2016 Annual Report on Form 20-F |
Risk review
Supervision and regulation
Timeline
Barclays’ Structural Reform timeline, including progress to date and indicative future milestones is as follows:
| § | 2015: |
| – | The legal entity which will become the RFB was incorporated. |
| § | 2016: |
| – | Barclays’ US intermediate holding company was established. |
| – | RFB banking authorisation application was submitted to the regulators. |
| – | BSerL, which will become the Group Service Company, was transferred to be a direct subsidiary of BPLC. |
| § | 2017: |
| – | Various legal entities connected with the future Barclays UK business will be transferred to be subsidiaries of the entity which will become the RFB. |
| – | Certain assets, liabilities, and other items connected with service provision will be transferred from Barclays Bank PLC to BSerL to establish the entity as the Group Service Company. |
| – | RFTS court process will be initiated during Q4 2017 with the submission of an application to the high court followed by the directions court hearing. |
| § | 2018: |
| – | Final court hearing will be held in respect of the RFTS. |
| – | Barclays UK businesses and related items will be transferred to the RFB through the RFTS and via alternative arrangements, taking effect in H1 2018. |
| – | Additional items connected with service provision will be transferred to BSerL, also via the RFTS in H1 2018. |
| – | Immediately following completion of the RFTS, the equity ownership in the RFB will be transferred, establishing the RFB as a direct subsidiary of Barclays PLC, alongside Barclays Bank PLC and BSerL. |
| Barclays PLC and Barclays Bank PLC 2016 Annual Report on Form 20-F | 189 |
Financial review
A review of the performance of Barclays,
including the key performance indicators, and the contribution of each of our businesses’ to the overall performance of the Group.
| Financial review |
| Page
|
| |||||
§ Key performance indicators |
|
191 |
| |||||
§ Consolidated summary income statement | 193 | |||||||
§ Income statement commentary | 194 | |||||||
§ Consolidated summary balance sheet | 195 | |||||||
§ Balance sheet commentary | 196 | |||||||
§ Analysis of results by business | 197 | |||||||
§ Appendix:Non-IFRS performance measures | 212 |

| 190 | Barclays PLC and Barclays Bank PLC 2016 Annual Report on Form 20-F |
Financial review
Key performance indicators
In assessing the financial performance of the Group, management uses a range of Key Performance Indicators (KPIs) which focus on the Group’s financial strength, the delivery of sustainable returns and cost management.
Non-IFRS performance measures
Barclays management believes that thenon-IFRS performance measures included in this document provide valuable information to the readers of the financial statements as they enable the reader to identify a more consistent basis for comparing the business’ performance between financial periods, and provide more detail concerning the elements of performance which the managers of these businesses are most directly able to influence or are relevant for an assessment of the Group. They also reflect an important aspect of the way in which operating targets are defined and performance is monitored by Barclays’ management. However, anynon-IFRS performance measures in this document are not a substitute for IFRS measures and readers should consider the IFRS measures as well. Refer to pagesi to x and pages 212 to 215 for further information, reconciliations and calculations ofnon-IFRS performance measures included throughout this document, and the most directly comparable IFRS measures.
| Definition | Why is it important and how the Group performed | |||||
CRD IV fully loaded CET1 ratio Capital requirements are part of the regulatory framework governing how banks and depository institutions are supervised. Capital ratios express a bank’s capital as a percentage of its RWAs as defined by the PRA.
In the context of CRD IV, the fully loaded CET1 ratio is a measure of capital that is predominantly common equity as defined by the Capital Requirements Regulation. |
The Group’s capital management objective is to maximise shareholder value by prudently managing the level and mix of its capital to: ensure the Group and all of its subsidiaries are appropriately capitalised relative to their minimum regulatory and stressed capital requirement support the Group risk appetite, growth and strategic option wide seeking to maintain a robust credit proposition for the Group and its subsidiaries.
The Group’s CRD IV fully loaded CET1 ratio increased to 12.4% (2015: 11.4%) due to an increase in CET1 capital to £45.2bn (2015: £40.7bn), partially offset by an increase in RWAs to £366bn (2015: £358bn). The 100 bps increase reflected the Group’s ability to grow capital through profit generation.
Group target: Revisedend-state CET1 capital ratio target of 150-200bps above the minimum regulatory level providing400-450bps buffer to the Bank of England stress test systemic reference point.
| 12.4%
CRD IV fully loaded CET1 ratio
2015: 11.4% 2014: 10.3% | ||||
Return on equity RoE is calculated as profit after tax attributable to ordinary shareholders, including an adjustment for the tax credit recorded in reserves in respect of other equity instruments, as a proportion of average shareholders’ equity excludingnon-controlling interests and other equity instruments. |
This measure indicates the return generated by the management of the business based on shareholders’ equity. Achieving a target RoE demonstrates the organisation’s ability to execute its strategy and align management’s interests with the shareholders’.
RoE for the Group increased to 3.0% (2015: (0.6%)) reflecting an increase in Group attributable profit to £1,623m (2015: loss of £394m) and increased shareholders’ equity of £57.4bn (2015: £55.9bn). | 3.0%
Group RoE
2015: (0.6%) 2014: (0.2%)
| ||||
Return on average tangible shareholders’ equity RoTE is calculated as profit after tax attributable to ordinary shareholders, including an adjustment for the tax credit recorded in reserves in respect of other equity instruments, as a proportion of average shareholders’ equity excludingnon-controlling interests and other equity instruments adjusted for the deduction of intangible assets and goodwill. |
This measure indicates the return generated by the management of the business based on shareholders’ tangible equity. Achieving a target RoTE demonstrates the organisation’s ability to execute its strategy and align management’s interests with the shareholders’. RoTE lies at the heart of the Group’s capital allocation and performance management process.
RoTE for the Group increased to 3.6% (2015: (0.7%)) reflecting an increase in Group attributable profit to £1,623m (2015: loss of £394m) and increased average tangible shareholders’ equity of £49bn (2015: £48bn).
Core RoTE increased to 8.4% (2015: 4.8%) reflecting a 95% increase in attributable profit to £3,350m and a £4bn increase in average allocated tangible equity to £41bn, as capital was returned fromNon-Core. Core RoTE excluding notable items reduced to 9.4% (2015: 11.2%) with a 4% increase in profit before tax to £6,436m and an 8% reduction in attributable profit to £3,781m primarily reflecting an increase in tax, due to the introduction of a new surcharge of 8% that applies to banks’ UK profits with effect from 1 January 2016.
Group target: Group RoTE will converge with Core RoTE. | 3.6%
Group RoTE
2015: (0.7%) 2014: (0.3%) 8.4%
Core RoTE
2015: 4.8% 2014: 7.0% 9.4%
Core RoTE excluding notable items
2015: 11.2% 2014: 11.2%
|
| Barclays PLC and Barclays Bank PLC 2016 Annual Report on Form 20-F | 191 |
| Definition | Why is it important and how the Group performed | |||||
Leverage ratio The ratio is calculated as fully loaded tier 1 capital divided by leverage exposure. |
The leverage ratio isnon-risk based and is intended to act as a supplementary measure to the risk-based capital metrics such as the CET1 ratio.
The leverage ratio increased to 4.6% (2015: 4.5%), reflecting an increase in tier 1 capital to £52.0bn (2015: £46.2bn) and an increase in leverage exposure of £97bn to £1,125bn. Tier 1 capital included £6.8bn (2015: £5.4bn) of AT1 securities.
Group target: maintaining the leverage ratio above future minimum requirements
| 4.6%
Leverage ratio
2015: 4.5% 2014: 3.7% | ||||
Cost: income ratio Total operating expenses divided by total income |
This is a measure management uses to assess the productivity of the business operations. Restructuring the cost base is a key execution priority for management and includes a review of all categories of discretionary spending and an analysis of how we can run the business to ensure that costs increase at a slower rate than income.
The Group cost: income ratio reduced to 76% (2015: 84%) driven by a 12% reduction in operating expenses, partially offset by a 3% reduction in income.
The reduction in operating expenses included a £3,024m reduction in litigation and conduct charges in 2016 to £1,363m.
The Core cost: income ratio reduced to 64% (2015: 75%) reflecting the reduction in litigation and conduct charges. Excluding notable items, the Core cost: income ratio reduced to 61% in 2016 (2015: 62%).
Group target: cost: income ratio of less than 60% over time
| 76%
Cost: income ratio
2015: 84% 2014: 84% | ||||
Operating expenses Total operating expenses |
Barclays views operating expenses as a key strategic area for banks; those who actively manage costs and control them effectively will gain a strong competitive advantage.
Operating expenses for the Group were £16,338m (2015: £18,536m). This reflected lower litigation and conduct charges, increased structural reform implementation costs and the strengthening in average USD and EUR against GBP. Q416 included the impact of a decision for 2016 compensation awards, to more closely align income statement recognition with performance awards and to harmonise deferral structures across the Group. These changes resulted in a £395m income statement charge in Q416, of which £390m was in Core, resulting in Core costs being above guidance by that amount.
Refer to pages vi to viii for a reconciliation of total operating expenses excluding conduct and litigation charges, and other notable items. |
£16,338m
Group statutory
2015: £18,536m 2014: £18,184m
£14,975m
Group total operating expenses, excluding conduct and litigation charges, and other notable items
2015: £14,479m 2014: £15,377m
£14,507m
Core statutory
2015: £15,990m 2014: £15,170m
£13,390m
Core total operating expenses, excluding conduct and litigation charges, and other notable items
2015: £12,532m 2014: £12,664m
| ||||
Non-Core RWAs RWAs are a risk adjusted measure of assets. Risk weightings are established in accordance with the Basel Capital Accord as implemented by the PRA. |
BarclaysNon-Core was established as a separate unit in 2014 and groups together businesses and assets which do not fit with the strategic objectives of the Group. ReducingNon-Core RWAs will rebalance the Group to deliver higher and more sustainable returns.
Non-Core RWAs reduced by £22bn to £32bn in 2016. The 41% reduction in the year reflects strong progress in the rundown, driven by a £10bn reduction in Derivatives, a £3bn reduction in Securities and loans, a £4bn reduction in Businesses RWAs, and a £4bn reallocation to Head Office of operational risk RWAs associated with exited businesses and assets.
Target:Non-Core RWAs of c.£25bn as at 30 June 2017.
| £32bn
Non-Core
2015: £54bn 2014: £89bn |
| 192 | Barclays PLC and Barclays Bank PLC 2016 Annual Report on Form 20-F |
Financial review
Consolidated summary income statement
For the year ended 31 Decembera | | 2016 £m |
| | 2015 £m |
| | 2014 £m |
| | 2013 £m |
| | 2012 £m |
| |||||
Continuing operationsb | ||||||||||||||||||||
Net interest income | 10,537 | 10,608 | 10,086 | 9,457 | 9,442 | |||||||||||||||
Non-interest income | 10,914 | 11,432 | 11,677 | 14,587 | 11,399 | |||||||||||||||
Total income | 21,451 | 22,040 | 21,763 | 24,044 | 20,841 | |||||||||||||||
Credit impairment charges and other provisions | (2,373) | (1,762) | (1,821) | (2,601) | (2,659) | |||||||||||||||
Operating expenses | (14,565) | (13,723) | (14,959) | (16,628) | (15,256) | |||||||||||||||
UK bank levy | (410) | (426) | (418) | (462) | (311) | |||||||||||||||
Litigation and conduct | (1,363) | (4,387) | (2,807) | (2,442) | (2,912) | |||||||||||||||
Total operating expenses | (16,338) | (18,536) | (18,184) | (19,532) | (18,479) | |||||||||||||||
Other net income/(expenses) | 490 | (596) | (445) | (32) | 122 | |||||||||||||||
Profit/(loss) before tax | 3,230 | 1,146 | 1,313 | 1,879 | (175) | |||||||||||||||
Tax charge | (993) | (1,149) | (1,121) | (1,251) | (326) | |||||||||||||||
Profit/(loss) after tax in respect of continuing operations | 2,237 | (3) | 192 | 628 | (502) | |||||||||||||||
Profit after tax in respect of discontinued operationb | 591 | 626 | 653 | 669 | 683 | |||||||||||||||
Non-controlling interests in respect of continuing operations | (346) | (348) | (449) | (414) | (467) | |||||||||||||||
Non-controlling interests in respect of discontinued operationb | (402) | (324) | (320) | (343) | (339) | |||||||||||||||
Other equity holders | (457) | (345) | (250) | – | – | |||||||||||||||
Attributable profit/(loss) | 1,623 | (394) | (174) | 540 | (624) | |||||||||||||||
Selected financial statistics | ||||||||||||||||||||
Basic earnings/(loss) per sharec | 10.4p | (1.9p) | (0.7p) | 3.8p | (4.8p) | |||||||||||||||
Diluted earnings/(loss) per sharec | 10.3p | (1.9p) | (0.7p) | 3.7p | (4.8p) | |||||||||||||||
Dividends per ordinary share | 4.5p | 6.5p | 6.5p | 6.5p | 6.5p | |||||||||||||||
Dividend payout ratio | 23% | 39% | 38% | 41% | 18% | |||||||||||||||
Return on equity | 3.0% | (0.6%) | (0.2%) | 1.0% | (1.2%) | |||||||||||||||
Return on average tangible shareholders’ equityc | 3.6% | (0.7%) | (0.3%) | 1.2% | (1.4%) | |||||||||||||||
The financial information above is extracted from the published accounts. This information should be read together with the information included in the accompanying consolidated financial statements.
Notes
| a | Comparatives have been restated to reflect the implementation of the Group business reorganisation. These restatements were detailed in our announcement on 14 April 2016, accessible at home.barclays/results. |
| b | Refer to page 210 for further information on the Africa Banking discontinued operation. |
| c | The profit after tax attributable to other equity holders of £457m (2015: £345m) is offset by a tax credit recorded in reserves of £128m (2015: £70m). The net amount of £329m (2015: £275m), along with NCI is deducted from profit after tax in order to calculate earnings per share and return on average tangible shareholders’ equity. |
| Barclays PLC and Barclays Bank PLC 2016 Annual Report on Form 20-F | 193 |
Financial review
Income statement commentary
2016 compared to 2015
Profit before tax increased to £3,230m (2015: £1,146m). The Group performance reflected good operational performance in Barclays UK and Barclays International whilst being impacted by theNon-Core loss before tax of £2,786m (2015: £2,603m) driven by the accelerated rundown ofNon-Core and provisions for UK customer redress of £1,000m (2015: £2,772m). The appreciation of average USD and EUR against GBP positively impacted income and adversely affected impairment and operating expenses.
Total income decreased 3% to £21,451m asNon-Core income reduced £1,776m to a net expense of £1,164m due to the acceleration of theNon-Core rundown, while Core income increased 6% to £22,615m. Within Core, Barclays International income increased 9% to £14,995m, with growth in both CIB and Consumer, Cards and Payments, and Barclays UK income increased 2% to £7,517m.
Total income included a £615m (2015: £nil) gain on disposal of Barclays’ share of Visa Europe Limited and an own credit loss of £35m (2015: gain of £430m).
Credit impairment charges increased £611m to £2,373m including a £320m charge in Q316 following the management review of the UK and US cards portfolio impairment modelling and balance growth primarily within Consumer, Cards and Payments. This was partially offset by a reduction in credit impairment charges of 9% to £122m inNon-Core due to lower impairment charges in European businesses. This resulted in a 11bps increase in the loan loss rate to 53bps.
Total operating expenses reduced 12% to £16,338m reflecting lower litigation and conduct charges. This was partially offset by thenon-recurrence of the prior year gain of £429m on the valuation of a component of the defined retirement benefit liability and increased structural reform implementation costs. Operating expenses also included a £395m additional charge in Q416 relating to 2016 compensation awards reflecting a decision to more closely align income statement recognition with performance awards and to harmonise deferral structures across the Group.
Total operating expenses included provisions for UK customer redress of £1,000m (2015: £2,772m).
The cost: income ratio improved to 76% (2015: 84%).
Other net income of £490m (2015: expense of £596m) included gains on the sale of Barclays Risk Analytics and Index Solutions, the Asia wealth and investment management business and the Southern European cards business, partly offset by the loss on sale of the French retail business of £455m.
The effective tax rate on profit before tax decreased to 30.7% (2015: 100.3%) principally as a result of a reduction innon-deductible charges.
Profit after tax in respect of continuing operations increased to £2,237m (2015: loss of £3m). Profit after tax in relation to the Africa Banking discontinued operation decreased 6% to £591m as increased credit impairment charges and operating expenses were partially offset by income growth.
Return on shareholders’ equity was 3.0% (2015: (0.6)%).
Return on average tangible shareholders’ equity was 3.6% (2015: (0.7%)) and basic earnings per share was 10.4p (2015: (1.9p)).
2015 compared to 2014
Profit before tax decreased to £1,146m (2014: £1,313m).
Total income increased 1% to £22,040m as Core income increased 4% to £21,428m, reflecting a 6% increase to £13,747m in Barclays International and a 22% increase in Head Office to £338m, which was partially offset by a 1% decrease to £7,343m in Barclays UK.Non-Core income reduced 46% to £612m, following assets and securities rundown, business sales including the impact of the sales of the Spanish and UAE retail businesses, and fair value losses on the ESHLA portfolio of £359m (2014: £156m).
Total income included a £496m (2014: £461m) gain on the US Lehman acquisition assets and an own credit gain of £430m (2014: £34m). 2014 total income included a loss of £935m (2015: £nil) relating to a revision to the ESHLA valuation methodology.
Credit impairment charges improved 3% to £1,762m, with a loan loss rate of 42bps (2014: 42bps). This reflected lower impairments in Barclays UK due to the benign economic environment in the UK resulting in lower default rates and charges and higher recoveries in European businesses inNon-Core. This was partially offset by increased impairment charges in Consumer, Cards and Payments primarily driven by asset growth and updates to impairment model methodologies, and increased impairment charges in CIB due to impairment of a number of single name exposures.
Total operating expenses increased 2% to £18,536m due to an increase in litigation and conduct charges, and costs associated with the implementation of structural reform. This was partially offset by savings from the strategic cost programme, in addition to the continued rundown ofNon-Core.
Total operating expenses included additional provisions for UK customer redress of £2,772m (2014: £1,110m), additional provisions for ongoing investigations and litigation including Foreign Exchange of £1,237m (2014: £1,250m), a £429m (2014: £nil) gain on valuation of a component of the defined retirement benefit liability and £96m (2014: £nil) of impairment of goodwill and other assets relating to businesses being disposed.
The cost: income ratio remained stable at 84% (2014: 84%).
Other net expenses increased to £596m (2014: £445m) primarily relating to losses on sale relating to the Spanish, Portuguese and Italian businesses of £577m (2014: £446m).
The tax charge of £1,149m (2014: £1,121m) on profit before tax of £1,146m (2014: £1,313m) represented an effective tax rate of 100.3% (2014: 85.4%), impacted bynon-deductible items.
Profit after tax in respect of continuing operations decreased to a loss of £3m (2014: profit of £192m). Profit after tax in relation to the Africa Banking discontinued operation decreased 4% to £626m driven by a reduction in total income and an increase in credit impairment charges, partially offset by a reduction in operating expenses.
Return on shareholders’ equity was (0.6)% (2014: (0.2)%).
Return on average tangible shareholders’ equity was (0.7%) (2014: (0.3%)) and basic loss per share was 1.9p (2014: 0.7p).
| 194 | Barclays PLC and Barclays Bank PLC 2016 Annual Report on Form 20-F |
Financial review
Consolidated summary balance sheet
As at 31 December | | 2016 £m |
| | 2015 £m |
| | 2014 £m |
| | 2013 £m |
| | 2012 £m |
| |||||
Assets | ||||||||||||||||||||
Cash and balances at central banks | 102,353 | 49,711 | 39,695 | 45,687 | 86,191 | |||||||||||||||
Items in the course of collection from other banks | 1,467 | 1,011 | 1,210 | 1,282 | 1,473 | |||||||||||||||
Trading portfolio assets | 80,240 | 77,348 | 114,717 | 133,069 | 146,352 | |||||||||||||||
Financial assets designated at fair value | 78,608 | 76,830 | 38,300 | 38,968 | 46,629 | |||||||||||||||
Derivative financial instruments | 346,626 | 327,709 | 439,909 | 350,300 | 485,140 | |||||||||||||||
Financial investments | 63,317 | 90,267 | 86,066 | 91,756 | 75,109 | |||||||||||||||
Loans and advances to banks | 43,251 | 41,349 | 42,111 | 39,422 | 41,799 | |||||||||||||||
Loans and advances to customers | 392,784 | 399,217 | 427,767 | 434,237 | 430,601 | |||||||||||||||
Reverse repurchase agreements and other similar secured lending | 13,454 | 28,187 | 131,753 | 186,779 | 176,522 | |||||||||||||||
Assets included in disposal groups classified held for sale | 71,454 | 7,364 | – | – | – | |||||||||||||||
Other assets | 19,572 | 21,019 | 36,378 | 22,128 | 22,535 | |||||||||||||||
Total assets | 1,213,126 | 1,120,012 | 1,357,906 | 1,343,628 | 1,512,351 | |||||||||||||||
Liabilities | ||||||||||||||||||||
Deposits from banks | 48,214 | 47,080 | 58,390 | 55,615 | 77,345 | |||||||||||||||
Items in the course of collection due to other banks | 636 | 1,013 | 1,177 | 1,359 | 1,587 | |||||||||||||||
Customer accounts | 423,178 | 418,242 | 427,704 | 431,998 | 390,828 | |||||||||||||||
Trading portfolio liabilities | 34,687 | 33,967 | 45,124 | 53,464 | 44,794 | |||||||||||||||
Financial liabilities designated at fair value | 96,031 | 91,745 | 56,972 | 64,796 | 78,561 | |||||||||||||||
Derivative financial instruments | 340,487 | 324,252 | 439,320 | 347,118 | 480,987 | |||||||||||||||
Debt securities in issuea | 75,932 | 69,150 | 86,099 | 86,693 | 119,525 | |||||||||||||||
Subordinated liabilities | 23,383 | 21,467 | 21,153 | 21,695 | 24,018 | |||||||||||||||
Repurchase agreements and other similar secured borrowings | 19,760 | 25,035 | 124,479 | 196,748 | 217,178 | |||||||||||||||
Liabilities included in disposal groups classified as held for sale | 65,292 | 5,997 | – | – | – | |||||||||||||||
Other liabilities | 14,161 | 16,200 | 31,530 | 20,193 | 17,542 | |||||||||||||||
Total liabilities | 1,141,761 | 1,054,148 | 1,291,948 | 1,279,679 | 1,452,365 | |||||||||||||||
Equity | ||||||||||||||||||||
Called up share capital and share premium | 21,842 | 21,586 | 20,809 | 19,887 | 12,477 | |||||||||||||||
Other equity instruments | 6,449 | 5,305 | 4,322 | 2,063 | – | |||||||||||||||
Other reserves | 6,051 | 1,898 | 2,724 | 249 | 3,674 | |||||||||||||||
Retained earnings | 30,531 | 31,021 | 31,712 | 33,186 | 34,464 | |||||||||||||||
Total equity excludingnon-controlling interests | 64,873 | 59,810 | 59,567 | 55,385 | 50,615 | |||||||||||||||
Non-controlling interests | 6,492 | 6,054 | 6,391 | 8,564 | 9,371 | |||||||||||||||
Total equity | 71,365 | 65,864 | 65,958 | 63,949 | 59,986 | |||||||||||||||
Total liabilities and equity | 1,213,126 | 1,120,012 | 1,357,906 | 1,343,628 | 1,512,351 | |||||||||||||||
Net asset value per ordinary share | 344p | 324p | 335p | 331p | 414p | |||||||||||||||
Tangible net asset value per share | 290p | 275p | 285p | 283p | 349p | |||||||||||||||
Number of ordinary shares of Barclays PLC (in millions) | 16,963 | 16,805 | 16,498 | 16,113 | 12,243 | |||||||||||||||
Year-end US Dollar exchange rate | 1.23 | 1.48 | 1.56 | 1.65 | 1.62 | |||||||||||||||
Year-end Euro exchange rate | 1.17 | 1.36 | 1.28 | 1.20 | 1.23 | |||||||||||||||
Year-end South African Rand exchange rate | 16.78 | 23.14 | 18.03 | 17.37 | 13.74 |
| Barclays PLC and Barclays Bank PLC 2016 Annual Report on Form 20-F | 195 |
Financial review
Balance sheet commentary
Total assets
Total assets increased £93bn to £1,213bn.
Cash and balances at central banks and items in the course of collection from other banks increased £53bn to £102bn, as the cash contribution to the Group liquidity pool was increased.
Trading portfolio assets increased £3bn to £80bn primarily driven by client activity and the appreciation of USD against GBP, partially offset by reduction due to firm strategy.
Financial assets designated at fair value increased by £2bn to £79bn. During the period, reverse repurchase agreements designated at fair value have increased by £14bn as new reverse repurchase agreements in certain businesses have been designated at fair value to better align to the way the business manages the portfolio’s risk and performance. Additionally, within financial assets designated at fair value, there was a partial offset by decreases in loans and advances, equity securities, debt securities and assets held in respect of linked liabilities.
Derivative financial instrument assets increased £19bn to £347bn, consistent with the increase in derivative financial instrument liabilities. The increase was primarily due to foreign exchange derivatives mainly driven by an increase in trade volumes and appreciation of all major currencies against GBP.
Financial investments decreased £27bn to £63bn due to a decrease in government bonds held in the liquidity pool.
Total loans and advances decreased by £5bn to £436bn driven by a £31bn decrease due to the reclassification of BAGL balances to held for sale and £9bn from the exit of other assets inNon-Core. This was offset by lending growth of £20bn, a net £9bn increase in settlement and cash collateral balances, and an £8bn increase due to the reclassification of ESHLA loans now recognised at amortised cost.
Reverse repurchase agreements and other similar secured lending decreased £15bn to £13bn mainly due to maturity of trades within amortised cost. New trades are designated as fair value through profit and loss to better align to the way the business manages the portfolio’s risk and performance.
Non current assets classified as held for disposal increased £64bn to £71bn mainly due to the reclassification of BAGL to held for sale.
Total liabilities
Total liabilities increased £88bn to £1,142bn.
Customer accounts increased £5bn to £423bn mainly due to deposit growth of £38bn and an increase in settlement and cash collateral balances of £5bn offset by reclassification of £29bn of BAGL balances to held for sale and an £8bn decrease due to Non-Core disposals.
Repurchase agreements and other similar secured borrowing decreased £5bn to £20bn in line with Reverse repurchase agreements and other similar secured lending described above.
Trading portfolio liabilities increased £1bn to £35bn primarily driven by client demand and the appreciation of the USD against GBP.
Financial liabilities designated at fair value increased by £4bn to £96bn. During the period, repurchase agreements designated at fair value have increased by £5bn and debt securities at fair value by £2bn, which was partially offset due by decreases in liabilities to customer under investment contracts and deposits at fair value.
Derivative financial instrument liabilities increased £16bn to £340bn in line with the increase in derivative financial assets.
Debt Securities in issue increased by £7bn to £76bn driven primarily by an increase in liquidity requirements and currency revaluations partially offset by the reclassification of BAGL balances to held for sale.
Subordinated liabilities increased £2bn to £23bn due to issuances of dated subordinated notes and FX movements due to the appreciation of USD and EUR against GBP. These were partially offset by the redemptions of dated and undated subordinated notes, and the reclassification of BAGL balances to held for sale.
Accruals, deferred income and other liabilities decreased £2bn to £9bn mainly driven by a reduction in insurance contract liabilities.
Liabilities included in disposal groups classified as held for sale increased £59bn to £65bn mainly due to the reclassification of BAGL to held for sale.
Shareholders’ equity
Total shareholders’ equity increased by £6bn to £71bn.
Share capital and share premium increased by £0.3bn to £21.8bn due to the issuance of shares under employee share schemes and the Barclays PLC scrip dividend programme.
Other equity instruments increased by £1.1bn to £6.4bn due to issuance of equity accounted AT1 securities to investors.
As at 31 December 2016 there was a debit balance of £0.1bn (2015: £0.3bn credit) in the available for sale reserve. The decrease of £0.4bn (2015: £0.2bn decrease) was due to a £2.2bn gain from changes in fair value on Government Bonds, predominantly held in the liquidity pool which was more than offset by £1.7bn of losses from related hedging and £0.9bn of net gains transferred to net profit, mainly due to £0.6bn purchase of Visa Europe by Visa Inc. A tax charge of £28m was recognised in the period relating to these items.
The cash flow hedging reserve increased £0.8bn to £2.1bn driven by £1.6bn increase in the fair value of interest rate swaps held for hedging purposes as forward interest rates decreased, partially offset by decreases of £0.5bn due to gains recycled to the income statement and £0.3bn tax charge.
The currency translation reserve increased by £3.7bn to £3.1bn due to the appreciation of USD and EUR against GBP.
Net asset value per share increased to 344p (2015: 324p). Net tangible asset value per share increased to 290p (2015: 275p). This increase was mainly attributable to favourable movements in the currency translation reserve partially offset by pension remeasurement.
Capital and indebtedness
The capital and indebtedness tables with respect to Barclays PLC and Barclays Bank PLC that are exhibited to this Annual Report onForm 20-F as Exhibits 99.1 and 99.2, respectively, are incorporated by reference into thisForm 20-F.
| 196 | Barclays PLC and Barclays Bank PLC 2016 Annual Report on Form 20-F |
Financial review
Analysis of results by business
All disclosures in this section are unaudited unless otherwise stated.
Segmental analysis (audited)
Analysis of results by business | ||||||||||||||||||||||||
| | Barclays UK £m |
| | Barclays International £m |
| | Head Office £m |
| | Barclays Core £m |
| | Barclays Non-Core £m |
| | Group results £m |
| |||||||
For the year ended 31 December 2016 | ||||||||||||||||||||||||
Total income | 7,517 | 14,995 | 103 | 22,615 | (1,164) | 21,451 | ||||||||||||||||||
Credit impairment charges and other provisions | (896) | (1,355) | – | (2,251) | (122) | (2,373) | ||||||||||||||||||
Net operating income | 6,621 | 13,640 | 103 | 20,364 | (1,286) | 19,078 | ||||||||||||||||||
Operating expenses | (3,792) | (9,129) | (135) | (13,056) | (1,509) | (14,565) | ||||||||||||||||||
UK bank levy | (48) | (284) | (2) | (334) | (76) | (410) | ||||||||||||||||||
Litigation and conduct | (1,042) | (48) | (27) | (1,117) | (246) | (1,363) | ||||||||||||||||||
Total operating expenses | (4,882) | (9,461) | (164) | (14,507) | (1,831) | (16,338) | ||||||||||||||||||
Other net (expenses)/incomea | (1) | 32 | 128 | 159 | 331 | 490 | ||||||||||||||||||
Profit/(loss) before tax from continuing operations | 1,738 | 4,211 | 67 | 6,016 | (2,786) | 3,230 | ||||||||||||||||||
Total assets (£bn)b | 209.6 | 648.5 | 75.2 | 933.4 | 279.7 | 1,213.1 | ||||||||||||||||||
For the year ended 31 December 2015 | ||||||||||||||||||||||||
Total income | 7,343 | 13,747 | 338 | 21,428 | 612 | 22,040 | ||||||||||||||||||
Credit impairment charges and other provisions | (706) | (922) | – | (1,628) | (134) | (1,762) | ||||||||||||||||||
Net operating income | 6,637 | 12,825 | 338 | 19,800 | 478 | 20,278 | ||||||||||||||||||
Operating expenses | (3,464) | (8,029) | (272) | (11,765) | (1,958) | (13,723) | ||||||||||||||||||
UK bank levy | (77) | (253) | (8) | (338) | (88) | (426) | ||||||||||||||||||
Litigation and conduct | (2,511) | (1,310) | (66) | (3,887) | (500) | (4,387) | ||||||||||||||||||
Total operating expenses | (6,052) | (9,592) | (346) | (15,990) | (2,546) | (18,536) | ||||||||||||||||||
Other net income/(expenses)a | – | 45 | (106) | (61) | (535) | (596) | ||||||||||||||||||
Profit/(loss) before tax from continuing operations | 585 | 3,278 | (114) | 3,749 | (2,603) | 1,146 | ||||||||||||||||||
Total assets (£bn)b | 202.5 | 532.2 | 59.4 | 794.2 | 325.8 | 1,120.0 | ||||||||||||||||||
For the year ended 31 December 2014 | ||||||||||||||||||||||||
Total income | 7,436 | 12,908 | 276 | 20,620 | 1,143 | 21,763 | ||||||||||||||||||
Credit impairment charges and other provisions | (901) | (679) | – | (1,580) | (241) | (1,821) | ||||||||||||||||||
Net operating income | 6,535 | 12,229 | 276 | 19,040 | 902 | 19,942 | ||||||||||||||||||
Operating expenses | (4,108) | (8,170) | (70) | (12,348) | (2,611) | (14,959) | ||||||||||||||||||
UK bank levy | (59) | (248) | (9) | (316) | (102) | (418) | ||||||||||||||||||
Litigation and conduct | (1,108) | (1,333) | (65) | (2,506) | (301) | (2,807) | ||||||||||||||||||
Total operating expenses | (5,275) | (9,751) | (144) | (15,170) | (3,014) | (18,184) | ||||||||||||||||||
Other net income/(expenses)a | – | 52 | 316 | 368 | (813) | (445) | ||||||||||||||||||
Profit/(loss) before tax from continuing operations | 1,260 | 2,530 | 448 | 4,238 | (2,925) | 1,313 | ||||||||||||||||||
Total assets (£bn)b | 198.0 | 596.5 | 61.0 | 855.5 | 502.4 | 1,357.9 |
Notable itemsc | ||||||||||||
For the year ended 31 December | | 2016 £m |
| | 2015 £m |
| | 2014 £m |
| |||
Total income | ||||||||||||
Own credit | (35) | 430 | 34 | |||||||||
Gain on disposal of Barclays’ share of Visa Europe Limited | 615 | – | – | |||||||||
Revision of ESHLA valuation methodology | – | – | (935) | |||||||||
Gains on US Lehman acquisition assets | – | 496 | 461 | |||||||||
Litigation and conduct | ||||||||||||
Provisions for UK customer redress | (1,000) | (2,772) | (1,110) | |||||||||
Provisions for ongoing investigations and litigation including Foreign Exchange | – | (1,237) | (1,250) | |||||||||
Operating expenses | ||||||||||||
Gain on valuation of a component of the defined retirement benefit liability | – | 429 | – | |||||||||
Impairment of goodwill and other assets relating to businesses being disposed | – | (96) | – | |||||||||
Other net expenses | ||||||||||||
Losses on sale relating to the Spanish, Portuguese and Italian businesses | – | (580) | (446) | |||||||||
Total notable items | (420) | (3,330) | (3,246) |
Notes
| a | Other net (expenses)/income represents the share ofpost-tax results of associates and joint ventures, profit (or loss) on disposal of subsidiaries, associates and joint ventures, and gains on acquisitions. |
| b | Africa Banking assets held for sale are reported in Head Office within Core. |
| c | Refer to pagesi to x and pages 212 to 215 for further information, reconciliations and calculations ofnon-IFRS performance measures included throughout this document. |
| Barclays PLC and Barclays Bank PLC 2016 Annual Report on Form 20-F | 197 |
Income by geographic region (audited) | ||||||||||||
For the year ended 31 December | | 2016 £m |
| | 2015 £m |
| | 2014 £m |
| |||
Continuing operations | ||||||||||||
UK | 11,096 | 12,160 | 11,456 | |||||||||
Europe | 2,087 | 2,245 | 2,896 | |||||||||
Americas | 7,278 | 6,610 | 6,008 | |||||||||
Africa and Middle East | 419 | 387 | 627 | |||||||||
Asia | 571 | 638 | 776 | |||||||||
Total | 21,451 | 22,040 | 21,763 | |||||||||
Income from individual countries which represent more than 5% of total income (audited)a | ||||||||||||
For the year ended 31 December | | 2016 £m |
| | 2015 £m |
| | 2014 £m |
| |||
Continuing operations | ||||||||||||
UK | 11,096 | 12,160 | 11,456 | |||||||||
US | 6,876 | 6,228 | 5,866 | |||||||||
Note
| a | Total income based on counterparty location. Income from each single external customer does not amount to 10% or greater of the Group’s total income. |
| 198 | Barclays PLC and Barclays Bank PLC 2016 Annual Report on Form 20-F |
Financial review
Analysis of results by business
Barclays Core
| | 2016 £m |
| | 2015 £m |
| | 2014 £m |
| ||||
Income statement informationa | ||||||||||||
Total income | 22,615 | 21,428 | 20,620 | |||||||||
Credit impairment charges and other provisions | (2,251 | ) | (1,628 | ) | (1,580 | ) | ||||||
Net operating income | 20,364 | 19,800 | 19,040 | |||||||||
Operating expenses | (13,056 | ) | (11,765 | ) | (12,348 | ) | ||||||
UK bank levy | (334 | ) | (338 | ) | (316 | ) | ||||||
Litigation and conduct | (1,117 | ) | (3,887 | ) | (2,506 | ) | ||||||
Total operating expenses | (14,507 | ) | (15,990 | ) | (15,170 | ) | ||||||
Other net income/(expenses) | 159 | (61 | ) | 368 | ||||||||
Profit before tax | 6,016 | 3,749 | 4,238 | |||||||||
Tax charge | (1,975 | ) | (1,479 | ) | (1,590 | ) | ||||||
Profit after tax | 4,041 | 2,270 | 2,648 | |||||||||
Non-controlling interests | (297 | ) | (266 | ) | (303 | ) | ||||||
Other equity interests | (394 | ) | (282 | ) | (193 | ) | ||||||
Attributable profitb | 3,350 | 1,722 | 2,152 | |||||||||
Balance sheet information | ||||||||||||
Total assetsb | £933.4bn | £794.2bn | £855.5bn | |||||||||
Risk weighted assetsb | £333.5bn | £304.1bn | £312.8bn | |||||||||
Leverage exposureb | £1,024.0bn | £879.1bn | £917.1bn | |||||||||
Key facts | ||||||||||||
Number of employees (full time equivalent) | 73,000 | 78,000 | 75,000 | |||||||||
Performance measures | ||||||||||||
Return on equity | 7.0% | 4.0% | 5.6% | |||||||||
Average equity | £49.6bn | £44.7bn | £38.9bn | |||||||||
Return on average allocated tangible equity | 8.4% | 4.8% | 7.0% | |||||||||
Average allocated tangible equityb | £41.0bn | £36.8bn | £31.4bn | |||||||||
Cost: income ratio | 64% | 75% | 74% | |||||||||
Loan loss rate (bps) | 58 | 45 | 43 | |||||||||
Basic earnings per share contribution | 20.5p | 10.7p | 13.4p | |||||||||
Notable items | ||||||||||||
Total income | ||||||||||||
Own credit | (35 | ) | 430 | 34 | ||||||||
Gain on disposal of Barclays’ share of Visa Europe Limited | 615 | – | – | |||||||||
Gains on US Lehman acquisition assets | – | 496 | 461 | |||||||||
Litigation and conduct | ||||||||||||
Provisions for UK customer redress | (1,000 | ) | (2,649 | ) | (1,035 | ) | ||||||
Provisions for ongoing investigations and litigation including Foreign Exchange | – | (1,036 | ) | (1,250 | ) | |||||||
Operating expenses | ||||||||||||
Gain on valuation of a component of the defined retirement benefit liability | – | 429 | – | |||||||||
Other net expenses | ||||||||||||
Losses on sale relating to the Spanish, Portuguese and Italian businesses | – | (112 | ) | 315 | ||||||||
Total notable items | (420 | ) | (2,442 | ) | (1,475 | ) | ||||||
Excluding notable items, the Core return on average allocated tangible equity was 9.4% (2015: 11.2%) and the Core basic earnings per share was 23.1p (2015: 24.9p).
Notes
| a | Refer to pages i to x and pages 212 to 215 for further information, reconciliations and calculations ofnon-IFRS performance measures included throughout this document. |
| b | Attributable profit in respect of the Africa Banking discontinued operation is reported at the Group level only. Assets held for sale, risk weighted assets, leverage exposure and allocated tangible equity are reported in Head Office within Core. |
| Barclays PLC and Barclays Bank PLC 2016 Annual Report on Form 20-F | 199 |
Barclays UK
| | 2016 £m |
| | 2015 £m |
| | 2014 £m |
| ||||
Income statement informationa | ||||||||||||
Net interest income | 6,048 | 5,973 | 5,839 | |||||||||
Net fee, commission and other income | 1,469 | 1,370 | 1,597 | |||||||||
Total income | 7,517 | 7,343 | 7,436 | |||||||||
Credit impairment charges and other provisions | (896 | ) | (706 | ) | (901 | ) | ||||||
Net operating income | 6,621 | 6,637 | 6,535 | |||||||||
Operating expenses | (3,792 | ) | (3,464 | ) | (4,108 | ) | ||||||
UK bank levy | (48 | ) | (77 | ) | (59 | ) | ||||||
Litigation and conduct | (1,042 | ) | (2,511 | ) | (1,108 | ) | ||||||
Total operating expenses | (4,882 | ) | (6,052 | ) | (5,275 | ) | ||||||
Other net expenses | (1 | ) | – | – | ||||||||
Profit before tax | 1,738 | 585 | 1,260 | |||||||||
Attributable profit/(loss) | 828 | (47 | ) | 852 | ||||||||
Balance sheet information | ||||||||||||
Loans and advances to customers at amortised cost | £166.4bn | £166.1bn | £165.3bn | |||||||||
Total assets | £209.6bn | £202.5bn | £198.0bn | |||||||||
Customer deposits | £189.0bn | £176.8bn | £168.3bn | |||||||||
Risk weighted assets | £67.5bn | £69.5bn | £69.3bn | |||||||||
Key facts | ||||||||||||
Average LTV of mortgage portfoliob | 48% | 49% | 52% | |||||||||
Average LTV of new mortgage lendingb | 63% | 64% | 65% | |||||||||
Number of branches | 1,305 | 1,362 | 1,488 | |||||||||
Barclays mobile banking customers | 5.7m | 4.7m | 3.6m | |||||||||
30 day arrears rate – Barclaycard Consumer UK | 1.9% | 2.3% | 2.5% | |||||||||
Number of employees (full time equivalent) | 36,000 | 38,800 | 38,300 | |||||||||
Performance measures | ||||||||||||
Return on equity | 6.4% | (0.2)% | 6.6% | |||||||||
Average equity | £13.4bn | £13.7bn | £13.1bn | |||||||||
Return on average allocated tangible equitya | 9.6% | (0.3% | ) | 9.5% | ||||||||
Average allocated tangible equitya | £8.9bn | £9.3bn | £9.1bn | |||||||||
Cost: income ratio | 65% | 82% | 71% | |||||||||
Loan loss rate (bps) | 52 | 42 | 53 | |||||||||
Loan: deposit ratio | 88% | 94% | 98% | |||||||||
Net interest margin | 3.62% | 3.56% | n/a | |||||||||
Notable Items | ||||||||||||
Total income | ||||||||||||
Gain on disposal of Barclays’ share of Visa Europe Limited | 151 | – | – | |||||||||
Litigation and conduct | ||||||||||||
Provisions for UK customer redress | (1,000 | ) | (2,431 | ) | (1,067 | ) | ||||||
Operating expenses | ||||||||||||
Gain on valuation of a component of the defined retirement benefit liability | – | 296 | – | |||||||||
Total notable items | (849 | ) | (2,135 | ) | (1,067 | ) | ||||||
Excluding notable items, the Barclays UK return on average allocated tangible equity was 19.3% (2015: 21.1%).
Notes
| a | Refer to pagesi to x and pages 212 to 215 for further information, reconciliations and calculations ofnon-IFRS performance measures included throughout this document. |
| b | Average LTV of mortgage portfolio and new mortgage lending calculated on the balance weighted basis. |
| 200 | Barclays PLC and Barclays Bank PLC 2016 Annual Report on Form 20-F |
Financial review
Analysis of results by business
Analysis of Barclays UK | | 2016 £m |
| | 2015 £m |
| | 2014 £m |
| |||
Analysis of total income | ||||||||||||
Personal Banking | 3,891 | 3,714 | 3,788 | |||||||||
Barclaycard Consumer UK | 2,022 | 2,065 | 2,078 | |||||||||
Wealth, Entrepreneurs & Business Banking | 1,604 | 1,564 | 1,570 | |||||||||
Total income | 7,517 | 7,343 | 7,436 | |||||||||
Analysis of credit impairment charges and other provisions | ||||||||||||
Personal Banking | (183 | ) | (194 | ) | (211 | ) | ||||||
Barclaycard Consumer UK | (683 | ) | (488 | ) | (592 | ) | ||||||
Wealth, Entrepreneurs & Business Banking | (30 | ) | (24 | ) | (98 | ) | ||||||
Total credit impairment charges and other provisions | (896 | ) | (706 | ) | (901 | ) | ||||||
Analysis of loans and advances to customers at amortised cost | ||||||||||||
Personal Banking | £135.0bn | £134.0bn | £133.8bn | |||||||||
Barclaycard Consumer UK | £16.5bn | £16.2bn | £15.8bn | |||||||||
Wealth, Entrepreneurs & Business Banking | £14.9bn | £15.9bn | £15.7bn | |||||||||
Total loans and advances to customers at amortised cost | £166.4bn | £166.1bn | £165.3bn | |||||||||
Analysis of customer deposits | ||||||||||||
Personal Banking | £139.3bn | £131.0bn | £124.5bn | |||||||||
Barclaycard Consumer UK | – | – | – | |||||||||
Wealth, Entrepreneurs & Business Banking | £49.7bn | £45.8bn | £43.8bn | |||||||||
Total customer deposits | £189.0bn | £176.8bn | £168.3bn |
| Barclays PLC and Barclays Bank PLC 2016 Annual Report on Form 20-F | 201 |
2016 compared to 2015
Profit before tax increased £1,153m to £1,738m reflecting lower provisions for UK customer redress. Profit before tax excluding notable itemsa decreased 5% to £2,587m driven by an increase in credit impairment charges following the management review of the cards portfolio impairment modelling, partially offset by a reduction in total operating expenses.
Total income, including a gain on disposal of Barclays’ share of Visa Europe Limited recognised in Personal Banking and Wealth, Entrepreneurs & Business Banking (WEBB), increased 2% to £7,517m.
Total income excluding notable items was broadly in line at £7,366m (2015: £7,343m). Personal Banking income increased 1% to £3,762m driven by improved deposit margins and balance growth, partially offset by lower mortgage margins. Barclaycard Consumer UK income decreased 2% to £2,022m primarily as a result of the European Interchange Fee Regulation, which came into full effect from December 2015, offset by balance growth and gains from debt sales. WEBB income increased 1% to £1,582m reflecting improved margins and deposit growth, partially offset by reduced transactional fee income. Net interest income increased 1% to £6,048m due to balance growth and deposit pricing initiatives, partially offset by lower mortgage margins.
Net interest margin increased 6bps to 3.62% reflecting higher margins on deposits, partially offset by lower mortgage margins. Net fee, commission and other income decreased 4% to £1,318m due to the impact of the European Interchange Fee Regulation in Barclaycard Consumer UK, which came into full effect from December 2015, and reduced fee and commission income in WEBB.
Credit impairment charges increased 27% to £896m due to a £200m charge in Q316 following the management review of the cards portfolio impairment modelling. The 30 day and 90 day arrears rates on the cards portfolio improvedyear-on-year to 1.9% (2015: 2.3%) and 0.9% (2015: 1.2%) respectively.
Total operating expenses, including provisions for UK customer redress of £1,000m (2015: £2,431m), reduced 19% to £4,882m. Total operating expenses excluding notable items reduced 1% to £3,882m reflecting savings realised from strategic cost programmes, relating to restructuring of the branch network and technology improvements, offset by structural reform programme implementation costs.
The cost: income ratio was 65% (2015: 82%), RoE was 6.4% (2015: (0.2%)) and RoTE was 9.6% (2015: (0.3%))
The cost: income ratio excluding notable items was 53% (2015: 53%) and RoTE excluding notable items was 19.3% (2015: 21.1%).
Loans and advances to customers were stable at £166.4bn (December 2015: £166.1bn).
Total assets increased £7.1bn to £209.6bn primarily reflecting an increase in the allocated liquidity pool.
Customer deposits increased 7% to £189.0bn primarily driven by higher balances in Personal Banking and WEBB.
RWAs reduced £2.0bn to £67.5bn primarily driven by changes in the mortgages credit risk model.
2015 compared to 2014
Profit before tax decreased 54% to £585m. Profit before tax excluding notable items increased 17% to £2,720m driven by the continued reduction in operating expenses and lower credit impairment charges. The reduction in operating expenses was delivered through strategic cost programmes including the restructure of the branch network and technology improvements to increase automation.
Total income reduced 1% to £7,343m.
Personal Banking income decreased 2% to £3,714m due to a reduction in fee income and mortgage margin pressure, partially offset by improved deposit margins and balance growth.
Barclaycard Consumer UK income decreased 1% to £2,065m primarily due to the impact of the European Interchange Fee Regulation, partially offset by balance growth.
WEBB income remained broadly flat at £1,564m (2014: £1,570m) as balance growth was offset by margin pressure.
Net interest income increased 2% to £5,973m due to balance growth, deposit pricing initiatives and the impact of changes in the overdraft proposition in June 2014, partially offset by mortgage margin pressure. Net fee, commission and other income decreased 14% to £1,370m due to the change in the overdraft proposition and the impact of the European Interchange Fee Regulation.
Credit impairment charges decreased 22% to £706m primarily due to the benign economic environment in the UK resulting in lower default rates and charges across all businesses. The loan loss rate reduced 11bps to 42bps.
Total operating expenses increased 15% to £6,052m, including provisions for UK customer redress of £2,431m (2014: £1,067m). Total operating expenses excluding notable items reduced 7% to £3,917m reflecting savings realised from strategic cost programmes including the restructure of the branch network and technology improvements.
Loans and advances to customers remained broadly flat at £166.1bn (2014: £165.3bn).
Total assets increased 2% to £202.5bn.
Customer deposits increased 5% to £176.8bn driven by higher balances in Personal Banking and WEBB.
RWAs were broadly flat at £69.5bn (2014: £69.3bn).
Note
| a | Refer to pagesi to x and pages 212 to 215 for further information, reconciliations and calculations ofnon-IFRS performance measures included throughout this document. |
| 202 | Barclays PLC and Barclays Bank PLC 2016 Annual Report on Form 20-F |
Financial review
Analysis of results by business
Barclays International
| ||||||
| | 2016 £m |
| | 2015 £m |
| | 2014 £m |
| ||||
Income statement information | ||||||||||||
Net interest income | 4,512 | 4,324 | 3,874 | |||||||||
Net trading income | 4,580 | 3,782 | 3,533 | |||||||||
Net fee, commission and other income | 5,903 | 5,641 | 5,501 | |||||||||
Total income | 14,995 | 13,747 | 12,908 | |||||||||
Credit impairment charges and other provisions | (1,355 | ) | (922 | ) | (679 | ) | ||||||
Net operating income | 13,640 | 12,825 | 12,229 | |||||||||
Operating expenses | (9,129 | ) | (8,029 | ) | (8,170 | ) | ||||||
UK bank levy | (284 | ) | (253 | ) | (248 | ) | ||||||
Litigation and conduct | (48 | ) | (1,310 | ) | (1,333 | ) | ||||||
Total operating expenses | (9,461 | ) | (9,592 | ) | (9,751 | ) | ||||||
Other net income | 32 | 45 | 52 | |||||||||
Profit before tax | 4,211 | 3,278 | 2,530 | |||||||||
Attributable profit | 2,412 | 1,758 | 926 | |||||||||
Balance sheet information | ||||||||||||
Loans and advances to banks and customers at amortised costb | £211.3bn | £184.1bn | £193.6bn | |||||||||
Trading portfolio assets | £73.2bn | £61.9bn | £87.3bn | |||||||||
Derivative financial instrument assets | £156.2bn | £111.5bn | £149.6bn | |||||||||
Derivative financial instrument liabilities | £160.6bn | £119.0bn | £157.3bn | |||||||||
Reverse repurchase agreements and other similar secured lending | £13.4bn | £24.7bn | £62.9bn | |||||||||
Financial assets designated at fair value | £62.3bn | £46.8bn | £5.7bn | |||||||||
Total assets | £648.5bn | £532.2bn | £596.5bn | |||||||||
Customer depositsc | £216.2bn | £185.6bn | £188.2bn | |||||||||
Risk weighted assets | £212.7bn | £194.8bn | £201.7bn | |||||||||
Key facts | ||||||||||||
Number of employees (full time equivalent) | 36,900 | 39,100 | 36,600 | |||||||||
Performance measures | ||||||||||||
Return on equity | 8.8% | 6.6% | 3.5% | |||||||||
Average equity | £28.2bn | £27.1bn | £27.1bn | |||||||||
Return on average allocated tangible equitya | 9.8% | 7.2% | 3.8% | |||||||||
Average allocated tangible equitya | £25.5bn | £24.9bn | £25.0bn | |||||||||
Cost: income ratio | 63% | 70% | 76% | |||||||||
Loan loss rate (bps) | 63 | 49 | 35 | |||||||||
Loan: deposit ratio | 86% | 88% | 90% | |||||||||
Net interest margind | 3.98% | 3.80% | n/a | |||||||||
Notable items | ||||||||||||
Total income | ||||||||||||
Gains on US Lehman acquisition assets | – | 496 | 461 | |||||||||
Gain on disposal of Barclays’ share of Visa Europe Limited | 464 | – | – | |||||||||
Litigation and conduct | ||||||||||||
Provisions for UK customer redress | – | (218 | ) | 32 | ||||||||
Provisions for ongoing investigations and litigation including Foreign Exchange | – | (984 | ) | (1,250 | ) | |||||||
Operating expenses | ||||||||||||
Gain on valuation of a component of the defined retirement benefit liability | – | 133 | – | |||||||||
Total notable items | 464 | (573 | ) | (757 | ) | |||||||
Excluding notable items, the Barclays International return on average allocated tangible equity was 8.0% (2015: 9.5%).
Notes
| a | Refer to pagesi to x and pages 212 to 215 for further information, reconciliations and calculations ofnon-IFRS performance measures included throughout this document. |
| b | As at 31 December 2016 loans and advances included £185.9bn (December 2015: £162.6bn) of loans and advances to customers (including settlement balances of £19.5bn (December 2015: £18.5bn) and cash collateral of £30.1bn (December 2015: £24.8bn)), and £25.4bn (December 2015: £21.5bn) of loans and advances to banks (including settlement balances of £1.7bn (December 2015: £1.6bn) and cash collateral of £6.3bn (December 2015: £5.7bn)). Loans and advances to banks and customers in respect of Consumer, Cards and Payments were £39.7bn (December 2015: £32.1bn). |
| c | As at 31 December 2016 customer deposits included settlement balances of £16.6bn (December 2015: £16.3bn) and cash collateral of £20.8bn (December 2015: £15.9bn). |
| d | Barclays International margins have been restated to include interest earning lending within the investment banking business. |
| Barclays PLC and Barclays Bank PLC 2016 Annual Report on Form 20-F | 203 |
| Analysis of Barclays International | | 2016 £m |
| | 2015 £m |
| | 2014 £m |
| |||
Corporate and Investment Bank | ||||||||||||
Income statement information | ||||||||||||
Analysis of total income | ||||||||||||
Credit | 1,185 | 824 | 792 | |||||||||
Equities | 1,790 | 1,912 | 1,956 | |||||||||
Macro | 2,304 | 2,108 | 1,950 | |||||||||
Markets | 5,279 | 4,844 | 4,698 | |||||||||
Banking fees | 2,397 | 2,087 | 2,115 | |||||||||
Corporate lending | 1,195 | 1,361 | 1,268 | |||||||||
Transactional banking | 1,657 | 1,663 | 1,594 | |||||||||
Banking | 5,249 | 5,111 | 4,977 | |||||||||
Other | 5 | 495 | 476 | |||||||||
Total income | 10,533 | 10,450 | 10,151 | |||||||||
Credit impairment charges and other provisions | (260) | (199) | (87) | |||||||||
Total operating expenses | (7,624) | (7,929) | (8,279) | |||||||||
Profit before tax | 2,650 | 2,322 | 1,787 | |||||||||
Balance sheet information | ||||||||||||
Risk weighted assets | £178.6bn | £167.3bn | £175.1bn | |||||||||
Performance measures | ||||||||||||
Return on equity | 5.8% | 5.1% | 1.8% | |||||||||
Average equity | £23.2bn | £23.1bn | £23.1bn | |||||||||
Return on average allocated tangible equitya | 6.1% | 5.4% | 1.9% | |||||||||
Average allocated tangible equitya | £21.9bn | £21.9bn | £22.0bn | |||||||||
| ||||||||||||
| | 2016 £m |
| | 2015 £m |
| | 2014 £m |
| ||||
Consumer, Cards and Payments | ||||||||||||
Income statement information | ||||||||||||
Total income | 4,462 | 3,297 | 2,757 | |||||||||
Credit impairment charges and other provisions | (1,095) | (723) | (592) | |||||||||
Total operating expenses | (1,837) | (1,663) | (1,472) | |||||||||
Profit before tax | 1,561 | 956 | 743 | |||||||||
Balance sheet information | ||||||||||||
Loans and advances to banks and customers at amortised cost | £39.7bn | £32.1bn | £29.7bn | |||||||||
Customer deposits | £50.0bn | £41.8bn | £37.9bn | |||||||||
Risk weighted assets | £34.1bn | £27.5bn | £26.6bn | |||||||||
Key facts | ||||||||||||
30 day arrears rates - Barclaycard US | 2.6% | 2.2% | 2.1% | |||||||||
Total number of Barclaycard business clients | 355,000 | 341,000 | 340,000 | |||||||||
Value of payments processed | £296bn | £271bn | £236bn | |||||||||
Performance measures | ||||||||||||
Return on equity | 23.1% | 15.3% | 13.2% | |||||||||
Average equity | £5.0bn | £4.0bn | £4.0bn | |||||||||
Return on average allocated tangible equitya | 31.4% | 20.2% | 17.8% | |||||||||
Average allocated tangible equitya | £3.6bn | £3.0bn | £3.0bn |
Notes
| a | Refer to pagesi to x and pages 212 to 215 for further information, reconciliations and calculations of non-IFRS performance measured included throughout this document. |
| 204 | Barclays PLC and Barclays Bank PLC 2016 Annual Report on Form 20-F |
Financial review
Analysis of results by business
2016 compared to 2015
Profit before tax increased 28% to £4,211m, including the gain on disposal of Barclays’ share of Visa Europe Limited. Profit before tax excluding notable itemsa decreased 3% to £3,747m driven by an 11% increase in total operating expenses, and a 47% increase in impairment, partially offset by a 10% increase in total income.
Total income increased 9% to £14,995m including the gain on disposal of Barclays’ share of Visa Europe Limited, as well as the factors outlined below.
Total income excluding notable items increased 10% to £14,531m, including the appreciation of average USD and EUR against GBP, with Consumer, Cards and Payments income increasing 21% to £3,998m and Corporate and Investment Bank (CIB) income increasing 6% to £10,533m.
Markets income increased 9% to £5,279m. Credit income increased 44% to £1,185m driven by strong performance in fixed income flow credit, which benefitted from increased market volatility and client demand. Equities income decreased 6% to £1,790m with lower client activity in Asia and the simplification of the EMEA business, partially offset by improved performance in cash, derivatives and financing in H216. Macro income increased 9% to £2,304m driven by increased activity post the EU referendum decision and US elections.
Banking income increased 3% to £5,249m. Banking fees income increased 15% to £2,397m driven by higher debt underwriting and advisory fees, partially offset by lower equity underwriting fees. Corporate lending reduced 12% to £1,195m due to losses on fair value hedges and thenon-recurrence ofone-offwork-out gains recognised in Q215. Transactional banking was broadly flat at £1,657m (2015: £1,663m) as income from higher deposit balances was offset by margin compression.
Consumer, Cards and Payments income increased 35% to £4,462m driven by growth the gain on disposal of Barclays’ share of Visa Europe Limited, across all key businesses and the appreciation of average USD and EUR against GBP.
Credit impairment charges increased 47% to £1,355m including the appreciation of average USD and EUR against GBP. CIB credit impairment charges increased 31% to £260m driven by the impairment of a number of single name exposures. Consumer, Cards and Payments credit impairment charges increased 51% to £1,095m primarily driven by balance growth, a change in portfolio mix and a £120m charge in Q316 following a management review of the cards portfolio impairment modelling.
Total operating expenses decreased 1% to £9,461m, resulting from lower litigation and conduct charges. This decrease was mostly offset by the appreciation of average USD against GBP, an additional charge in Q416 relating to the 2016 compensation awards, higher restructuring costs, £150m of which related to reducing the real estate footprint in Q316, and higher structural reform programme implementation costs including those relating to the incorporation of the US Intermediate Holding Company (IHC) on 1 July 2016.
The cost: income ratio was 63% (2015: 70%), RoE was 8.8% (2015: 6.6%) and RoTE was 9.8% (2015: 7.2%).
The cost: income ratio excluding notable items was 65% (2015: 64%) and RoTE excluding notable items was 8.0% (2015: 9.5%).
Loans and advances to banks and customers at amortised cost increased £27.2bn to £211.3bn with CIB increasing £19.7bn to £171.7bn due to increased lending and cash collateral and the appreciation of USD and EUR against GBP. Consumer, Cards and Payments increased £7.6bn to £39.7bn driven by appreciation of USD and EUR against GBP and growth in Barclaycard US, including the acquisition of the JetBlue credit card portfolio.
Trading portfolio assets increased £11.3bn to £73.2bn due to an increase in client activity and appreciation of major currencies against GBP.
Derivative financial instrument assets and liabilities increased £44.7bn to £156.2bn and £41.6bn to £160.6bn respectively, due to the appreciation of USD and EUR against GBP and decreases in forward interest rates.
Financial assets designated at fair value increased £15.5bn to £62.3bn and reverse repurchase agreements and other similar lending decreased £11.3bn to £13.4bn. Since 2015, new reverse repurchase agreements in certain businesses have been designated at fair value to better align to the way the business manages the portfolio’s risk and performance. On a net basis reverse repos have increased by £4.2bn as a result of increased matched book trading.
Customer deposits increased £30.6bn to £216.2bn, with CIB increasing £22.6bn to £166.3bn primarily driven by increases in deposits cash collateral and the appreciation of USD and EUR against GBP. Consumer, Cards and Payments increased £8.2bn to £50.0bn driven by balance growth in Barclaycard US and Private Banking, and the appreciation of USD and EUR against GBP.
RWAs increased £17.9bn to £212.7bn, due to the appreciation of USD against GBP, and business growth, including the acquisition of the JetBlue credit card portfolio in Consumer, Cards and Payments.
Note
| a | Refer to pages i to x and pages 212 to 215 for further information, reconciliations and calculations ofnon-IFRS performance measures included throughout this document. |
| Barclays PLC and Barclays Bank PLC 2016 Annual Report on Form 20-F | 205 |
2015 compared to 2014
Profit before tax increased 30% to £3,278m. Profit before tax excluding notable itemsa increased 17% to £3,851m driven by a 6% increase in income, including the appreciation of average USD and EUR against GBP, with Consumer, Cards and Payments income increasing 20% to £3,297m and CIB income increasing 3% to £9,954m.
Markets income increased 3% to £4,844m. Credit income increased 4% to £824m driven by a higher contribution from credit flow trading and financing businesses. Equities income decreased 2% to £1,912m driven by lower client activity in EMEA equity derivatives, partially offset by higher performance in cash equities. Macro income increased 8% to £2,108m due to higher income in rates and currency products reflecting increased market volatility and client activity.
Banking income increased 3% to £5,111m. Banking fee income reduced 1% to £2,087m driven by lower equity underwriting fees, partially offset by higher financial advisory and debt underwriting fees. Corporate lending increased 7% to £1,361m driven by lower fair value losses on hedges and increased asset balances. Transactional banking income increased 4% to £1,663m primarily due to cash management income driven by higher balances with improved margins.
Consumer, Cards and Payments income increased 20% to £3,297m, driven by business growth in Barclaycard US and the appreciation of average USD against GBP.
Credit impairment charges increased to £922m (2014: £679m). Consumer, Cards and Payments credit impairment charges increased £131m to £723m primarily reflecting asset growth and updates to impairment model methodologies. CIB credit impairment charges increased £112m to £199m driven by a number of single name exposures.
Total operating expenses decreased 2% to £9,592m, resulting from a reduction in restructuring costs. Further cost savings were achieved from strategic cost programmes, including business restructuring, operational streamlining and real estate rationalisation, partially offset by the appreciation of average USD against GBP.
The cost: income ratio was 70% (2014: 76%), RoE was 6.6% (2014: 3.5%) and RoTE was 7.2% (2014: 3.8%)
Cost: income ratio excluding notable items was 64% (2014: 69%) and RoTE excluding notable items was 9.5% (2014: 7.0%).
Loans and advances to banks and customers decreased £9.5bn to £184.1bn as CIB decreased £11.8bn to £152.0bn due to a decrease in settlement and cash collateral balances, partially offset by an increase of £2.4bn in Consumer, Cards and Payments to £32.1bn reflecting growth in Barclaycard US.
Derivative financial instrument assets and liabilities decreased £38.1bn to £111.5bn and £38.3bn to £119.0bn respectively, due to net trade reduction and increases in major interest forward curves.
Trading portfolio assets decreased £25.4bn to £61.9bn driven by balance sheet deleveraging, resulting in lower securities positions.
Financial assets designated at fair value increased £41.1bn to £46.8bn and reverse repurchase agreements and other similar lending decreased £38.2bn to £24.7bn. Since 2015, new reverse repurchase agreements in certain businesses have been designated at fair value to better align to the way the business manages the portfolio’s risk and performance. On a net basis reverse repos have increased by £0.2bn as a result of increased matched book trading.
Customer deposits decreased £2.6bn to £185.6bn, with CIB decreasing £6.6bn to £143.7bn primarily driven by decreases in settlement and cash collateral balances, partially offset by an increase of £3.9bn to £41.8bn in Consumer, Cards and Payments, driven by the deposits funding strategy in Barclaycard US.
RWAs decreased £6.9bn to £194.8bn, within which CIB RWAs decreased £7.8bn to £167.3bn primarily due to a reduction in securities and derivatives, and improved RWA efficiency. This was partially offset by an increase of £0.9bn to £27.5bn in Consumer, Cards and Payments, primarily driven by the growth in the US cards business.
Note
| a | Refer to pagesi to x and pages 212 to 215 for further information, reconciliations and calculations ofnon-IFRS performance measures included throughout this document. |
| 206 | Barclays PLC and Barclays Bank PLC 2016 Annual Report on Form 20-F |
Financial review
Analysis of results by business
Head Office
|
| | 2016 £m |
| | 2015 £m |
| | 2014 £m |
| ||||
Income statement information | ||||||||||||
Net interest income | (183 | ) | (305 | ) | (216 | ) | ||||||
Net fee, comission and other income | 286 | 643 | 492 | |||||||||
Net operating income | 103 | 338 | 276 | |||||||||
Operating expenses | (135 | ) | (272 | ) | (70 | ) | ||||||
UK bank levy | (2 | ) | (8 | ) | (9 | ) | ||||||
Litigation and conduct | (27 | ) | (66 | ) | (65 | ) | ||||||
Total operating expenses | (164 | ) | (346 | ) | (144 | ) | ||||||
Other net income/(expenses) | 128 | (106 | ) | 316 | ||||||||
Profit/(loss) before tax | 67 | (114 | ) | 448 | ||||||||
Attributable profit | 110 | 11 | 374 | |||||||||
Balance sheet information | ||||||||||||
Total assetsb | £75.2bn | £59.4bn | £61.0bn | |||||||||
Risk weighted assetsb | £53.3bn | £39.7bn | £41.8bn | |||||||||
Key facts | ||||||||||||
Number of employees (full time equivalent) | 100 | 100 | 100 | |||||||||
Performance measuresa | ||||||||||||
Average allocated tangible equity | £6.5bn | £2.6bn | £(2.7bn | ) | ||||||||
Notable items | ||||||||||||
Total income | ||||||||||||
Own credit | (35 | ) | 430 | 34 | ||||||||
Litigation and conduct | ||||||||||||
Provisions for ongoing investigations and litigation including Foreign Exchange | – | (52 | ) | – | ||||||||
Other net expenses | ||||||||||||
Losses on sale relating to the Spanish business | – | (112 | ) | 315 | ||||||||
Total notable items | (35 | ) | 266 | 349 | ||||||||
2016 compared to 2015
Profit before tax was £67m (2015: loss of £114m). Profit before tax excluding notable itemsa improved from a loss of £380m to a profit of £102m.
Net operating income decreased to £103m (2015: £338m) reflecting a reduction in own credit.
Net operating income excluding notable items increased to £138m (2015: loss of £92m) primarily due to changes in net income from treasury operations.
Total operating expenses reduced to £164m (2015: £346m) reflecting reduced litigation and conduct charges and a reduction in structural reform implementation costs now allocated to the businesses.
Other net income increased to £128m (2015: (£106m)) due to the non recurrence of notable items and the recycling of the currency translation reserve on the disposal of the Southern European cards business.
Total assets increased £15.8bn to £75.2bn primarily driven by the appreciation of ZAR against GBP.
RWAs increased £13.6bn to £53.3bn primarily driven by the appreciation of ZAR against GBP and the reallocation of operational risk RWAs fromNon-Core associated with exited businesses and assets.
2015 compared to 2014
Profit before tax reduced £562m to a loss of £114m. Profit before tax excluding the impact of notable items moved from a profit of £99m in 2014 to a loss of £380m in 2015.
Net operating income increased to £338m (2015: £276m) due to an increase in own credit, partially offset by the factors outlined below.
Net operating income excluding notable items reduced to a loss of £92m (2014: income of £242m) primarily reflecting the net expense from Treasury operations and thenon-recurrence of gains in 2014, including net gains from foreign exchange recycling arising from the restructure of Group subsidiaries.
Total operating expenses excluding notable items increased £202m to £346m primarily due to costs relating to the implementation of the structural reform programme.
Total assets decreased £1.6bn to £59.4bn and RWAs decreased £2.1bn to £39.7bn primarily due to the depreciation of ZAR against GBP.
Notes
| a | Refer to pagesi to x and pages 212 to 215 for further information, reconciliations and calculations of non-IFRS performance measures included throughout this document. |
| b | Includes Africa Banking assets held for sale of £65.1bn (December 2015: £47.9bn) and risk weighted assets of £42.3bn (December 2015: £31.7bn). |
| Barclays PLC and Barclays Bank PLC 2016 Annual Report on Form 20-F | 207 |
BarclaysNon-Core
|
| | 2016 £m |
| | 2015 £m |
| | 2014 £m |
| ||||
Income statement information | ||||||||||||
Net interest income | 160 | 615 | 590 | |||||||||
Net trading income | (1,703) | (706) | (590) | |||||||||
Net fee, commission and other income | 379 | 703 | 1,143 | |||||||||
Total income | (1,164) | 612 | 1,143 | |||||||||
Credit impairment charges and other provisions | (122) | (134) | (241) | |||||||||
Net operating income | (1,286) | 478 | 902 | |||||||||
Operating expenses | (1,509) | (1,958) | (2,611) | |||||||||
UK bank levy | (76) | (88) | (102) | |||||||||
Litigation and conduct | (246) | (500) | (301) | |||||||||
Total operating expenses | (1,831) | (2,546) | (3,014) | |||||||||
Other net income/(expenses) | 331 | (535) | (813) | |||||||||
Loss before tax | (2,786) | (2,603) | (2,925) | |||||||||
Attributable loss | (1,916) | (2,418) | (2,659) | |||||||||
Balance sheet information | ||||||||||||
Loans and advances to banks and customers at amortised costb | £51.1bn | £51.8bn | £70.7bn | |||||||||
Derivative financial instrument assets | £188.7bn | £213.7bn | £288.9bn | |||||||||
Derivative financial instrument liabilities | £178.6bn | £202.1bn | £280.6bn | |||||||||
Reverse repurchase agreements and other similar secured lending | £0.1bn | £3.1bn | £50.7bn | |||||||||
Financial assets designated at fair value | £14.5bn | £21.4bn | £25.5bn | |||||||||
Total assets | £279.7bn | £325.8bn | £502.4bn | |||||||||
Customer depositsc | £12.5bn | £20.9bn | £30.8bn | |||||||||
Risk weighted assets | £32.1bn | £54.3bn | £89.1bn | |||||||||
Leverage exposure | £101.5bn | £148.7bn | £316.4bn | |||||||||
Key facts | ||||||||||||
Number of employees (full time equivalent) | 5,500 | 9,900 | 15,000 | |||||||||
Performance measures | ||||||||||||
Average equity | £7.8bn | £11.2 bn | £16.0bn | |||||||||
Average allocated tangible equitya | £7.8bn | £10.9bn | £15.6bn | |||||||||
Loan loss rate (bps) | 22 | 23 | 39 | |||||||||
Notable items | ||||||||||||
Total income | ||||||||||||
Revision of ESHLA valuation methodology | – | – | (935) | |||||||||
Litigation and conduct | ||||||||||||
Provisions for UK customer redress | – | (123) | (75) | |||||||||
Provisions for ongoing investigations and litigation including Foreign Exchange | – | (201) | – | |||||||||
Operating expenses | ||||||||||||
Impairment of goodwill and other assets relating to businesses being disposed | – | (96) | – | |||||||||
Other net expenses | ||||||||||||
Losses on sale relating to the Spanish business | – | �� | (468) | (761) | ||||||||
Total notable items | – | (888) | (1,771) | |||||||||
Analysis of total income | ||||||||||||
Businesses | 485 | 1,139 | 1,503 | |||||||||
Securities and loans | (638) | (350) | (318) | |||||||||
Derivatives | (1,011) | (177) | (42) | |||||||||
Total income | (1,164) | 612 | 1,143 |
| Notes |
| a | Refer to pagesi to x and pages 212 to 215 for further information, reconciliations and calculations ofnon-IFRS performance measures included throughout this document. |
| b | As at 31 December 2016 loans and advances included £38.5bn (December 2015: £40.4bn) of loans and advances to customers (including settlement balances of £0.1bn (December 2015: £0.3bn) and cash collateral of £17.3bn (December 2015: £19.0bn)), and £12.6bn (December 2015: £11.4bn) of loans and advances to banks (including settlement balances of £0.1bn (December 2015: £nil) and cash collateral of £12.1bn (December 2015: £10.1bn)). |
| c | As at 31December 2016 customer deposits included settlement balances of £0.1bn (December 2015: £0.2bn) and cash collateral of £11.9bn (December 2015: £12.3bn). |
| 208 | Barclays PLC and Barclays Bank PLC 2016 Annual Report on Form 20-F |
Financial review
Analysis of results by business
2016 compared to 2015
Loss before tax increased to £2,786m (2015: £2,603m). Loss before tax excluding notable itemsa increased to £2,786m (2015: £1,715m) driven by reduced income and increased losses resulting from continued progress on the rundown of Derivatives, Businesses and Securities and loans, partially offset by lower operating expenses and higher other net income primarily from business and country exits.
Total income reduced £1,776m to a net expense of £1,164m.
Businesses income reduced £654m to £485m due to the impact of lower income following the completion of the sale of a number of income generating businesses and fees paid to Head Office relating to the termination of internal hedging and funding positions no longer required.
Securities and loans income decreased £288m to a net expense of £638m primarily driven by the impact of restructuring the ESHLA portfolio, thenon-recurrence of a £91m provision release relating to a litigation matter in Q115 and portfolio rundown. Fair value losses on the ESHLA portfolio were £393m (2015: £359m).
Derivatives income reduced £834m to a net expense of £1,011m principally reflecting the costs of running down the portfolio.
Credit impairment charges improved 9% to £122m due to lower impairment charges in European businesses.
Total operating expenses improved 28% to £1,831m reflecting the non recurrence of notable items and the factors outlined below.
Total operating expenses excluding notable items improved 14% to £1,831m reflecting cost savings from ceasing certain investment banking activities in a number of countries and the completion of the sale of a number of businesses, partially offset by a c.£200m increase in restructuring charges, which totalled c.£400m.
Other net income of £331m (2015: net expense £535m) included gains on the sale of Barclays Risk Analytics and Index Solutions, the Asia wealth and investment management business and the Southern European cards business, partially offset by the loss on sale of the French retail, business of £455m.
Loans and advances to banks and customers at amortised cost decreased £0.7bn to £51.1bn due to the sale of the Asia wealth and investment management business, and the rundown and exit of historical investment bank assets, partially offset by the recognition of £8bn of ESHLA loans at amortised cost, following the restructure of LOBO loan terms.
Total assets decreased £46.1bn to £279.7bn due to lower derivative financial instrument assets which decreased £25.0bn to £188.7bn whilst derivative financial instrument liabilities decreased £23.5bn to £178.6bn mainly on continued rundown of the derivative back book.
Leverage exposure decreased £47bn to £101bn due to reduced potential future exposure on derivatives and trading portfolio assets.
RWAs reduced £22.2bn to £32.1bn despite the appreciation of USD and EUR against GBP, including a £10bn reduction in Derivatives, a £3bn reduction in Securities and loans, a £4bn reduction in Businesses RWAs, and a £4bn reallocation of operational risk RWAs to Head Office associated with business disposals and exits.
2015 compared to 2014
Loss before tax decreased to £2,603m (2014: £2,925m). Loss before tax decreased excluding notable items £561m to £1,715m driven by continued progress in the exit of Businesses, Securities and loans, and Derivative assets. RWAs reduced £34.8bn to £54.3bn including a £13bn reduction in Securities and loans, £11bn reduction in Derivatives, and Businesses reductions driven by the completion of the sales of the Spanish and UK Secured Lending businesses.
Total income reduced £531m to £612m due to the non recurrence of notable items, partially offset by the reduction in income outlined below.
Total income excluding notable items reduced £1,466m to £612m. Businesses income reduced 24% to £1,139m driven by the impact of lower income following the completion of the sale of businesses including the Spanish business, Barclays Wealth Americas and UK Secured Lending. Securities and loans income decreased 10% to a net expense of £350m primarily driven by fair value losses of £359m (2014: £156m) on the ESHLA portfolio, and the sale of businesses and portfolio rundown. Derivative income reduced £135m to an expense of £177m due to the active rundown of the portfolios.
Credit impairment charges improved 44% to £134m due to higher recoveries in Europe and the sale of the Spanish business.
Total operating expenses improved 16% to £2,546m reflecting savings from the sales of the Spanish business, Barclays Wealth Americas, and several principal investment businesses.
Loans and advances to banks and customers at amortised cost decreased 27% to £51.8bn due to the reclassification of assets on the announced sale of the Portuguese and Italian businesses to assets held for sale, and the rundown and exit of historical investment bank assets.
Derivative financial instrument assets and liabilities decreased 26% to £213.7bn and 28% to £202.1bn respectively, largely as a result of trade reduction.
Total assets decreased £176.6bn to £325.8bn due to reduced reverse repurchase agreements and other similar secured lending, and lower derivative financial instrument assets.
Leverage exposure decreased £167.7bn to £148.7bn primarily in reverse repurchase agreements, potential future exposure on derivatives and trading portfolio assets.
RWAs reduced £34.8bn to £54.3bn driven by the sale of the Spanish business, the active rundown of legacy structured and credit products, and derivative trade unwinds.
Note
| a | Refer to pagesi to x and pages 212 to 215 for further information, reconciliations and calculations ofnon-IFRS performance measures included throughout this document. |
| Barclays PLC and Barclays Bank PLC 2016 Annual Report on Form 20-F | 209 |
Discontinued Operation: Africa Banking
|
On 1 March 2016, Barclays announced its intention to sell down the Group’s interest in BAGL. This sell down is intended to be to a level which will permit deconsolidation from an accounting and regulatory perspective, subject to shareholder and regulatory approvals as required. On 5 May 2016 Barclays executed the first tranche of the sell down of the Group’s interest in BAGL with the sale of 12.2% of BAGL’s issued share capital. Following completion of the sale, Barclays’ holding represents 50.1% of BAGL’s issued share capital.
The terms of the transitional services arrangements and related separation payments have been agreed with BAGL and submitted to relevant regulators as part of a request for approval for Barclays to sell down to below a 50% holding. These proposed separation terms include contributions totalling £765m, of which £27.5m was paid in 2016, with the remainder to be paid over the period through to completion of any initial sale of Barclays’ stake in BAGL to below 50%. The majority of these funds would be used by BAGL to separate from the Barclays group, including termination of the existing Master Services Agreement, making investments in branding, operations and technology, and covering separation related expenses. In addition, Barclays will contribute an amount equivalent to 1.5% of BAGL’s market capitalisation to a new Broad-Based Black Economic Empowerment scheme, equating to approximately £130m at
the 31 December 2016 share price and ZAR exchange rate, and expects to incur some additional operating expenses in respect of delivering the separation of the businesses under the transitional services arrangements.
These proposed contributions have been taken into account in assessing whether any impairment of the BAGL disposal group was required in the Group’s balance sheet. No impairment of the BAGL disposal group was required at 31 December 2016, as the market value of BAGL less estimated costs to sell at the year-end share price and ZAR exchange rate was £8.4bn which was greater than the carrying asset value of BAGL at that date of £7.3bn, plus the proposed costs of separation referred to above.
The Africa Banking business meets the requirements for presentation as a discontinued operation. As such, these results have been presented as two lines on the face of the Group income statement, representing the profit after tax and non-controlling interest in respect of the discontinued operation. Were the fair value of BAGL, based on its quoted share price, less estimated costs to sell, to fall below the carrying amount of the net assets of BAGL including goodwill on acquisition, a resulting impairment to Barclays’ stake in BAGL would also be recognised through these lines.
| | 2016 £m |
| | 2015 £m |
| 2014 £m | ||||
Income statement information | ||||||||||
Net interest income | 2,169 | 1,950 | 1,994 | |||||||
Net fee, commission and other income | 1,577 | 1,464 | 1,532 | |||||||
Total income | 3,746 | 3,414 | 3,526 | |||||||
Credit impairment charges and other provisions | (445) | (353) | (347) | |||||||
Net operating income | 3,301 | 3,061 | 3,179 | |||||||
Operating expenses | (2,345) | (2,091) | (2,199) | |||||||
UK bank levy | (65) | (50) | (44) | |||||||
Litigation and conduct | – | – | (2) | |||||||
Total operating expenses | (2,410) | (2,141) | (2,245) | |||||||
Other net income | 6 | 7 | 10 | |||||||
Profit before tax | 897 | 927 | 944 | |||||||
Profit after tax | 591 | 626 | 653 | |||||||
Attributable profit | 189 | 302 | 334 | |||||||
Balance sheet information | £bn | £bn | £bn | |||||||
Total assetsa | 65.1 | 47.9 | 53.7 | |||||||
Risk weighted assetsa | 42.3 | 31.7 | 36.7 | |||||||
Key facts | ||||||||||
Period end – ZAR/GBP | 16.78 | 23.14 | 18.03 | |||||||
Average – ZAR/GBPb | 20.04 | 19.57 | 17.84 | |||||||
Barclays Africa Group Limited share price (ZAR) | 168.69 | 143.49 | 182.00 | |||||||
Barclays Africa Group Limited number of shares (m) | 848 | 848 | 848 | |||||||
Number of employees (full time equivalent) | 40,800 | 41,500 | 42,300 | |||||||
Notes
| a | Africa Banking assets held for sale and RWAs are reported in Head Office within Core. |
| b | The average rate is derived from daily spot rates during the year. |
| 210 | Barclays PLC and Barclays Bank PLC 2016 Annual Report on Form 20-F |
Financial review
Analysis of results by business
Margins analysis
Total Barclays UK and Barclays International net interest income increased 5% to £10.3bn due to an increase in average customer assets to £274.6bn (2015: £268.8bn) with growth in Barclays International, while Barclays UK remained stable. Net interest margin increased 11bps to 3.76% primarily due to growth in interest earning lending within the cards portfolio of Barclays International and higher margins on deposits in Barclays UK.
Group net interest income decreased to £10.5bn (2015: £10.6bn) including net structural hedge contributions of £1.5bn (2015: £1.4bn).
Net interest margin by business reflects movements in the Group’s internal funding rates which are based on the cost to the Group of alternative funding in wholesale markets. The internal funding rate prices intra-group funding and liquidity to appropriately give credit to businesses with net surplus liquidity and to charge those businesses in need of alternative funding at a rate that is driven by prevailing market rates and includes a term premium.
| Year ended 31 December 2016 | Year ended 31 December 2015 | |||||||||||||||||||||||
| | Net interest income £m |
| | Average customer assets £m | | | Net interest margin £m |
| | Net interest income £m |
| | Average customer assets £m | | | Net interest margin £m |
| |||||||
Barclays UK | 6,048 | 167,233 | 3.62 | 5,973 | 167,599 | 3.56 | ||||||||||||||||||
Barclays Internationala | 4,275 | 107,333 | 3.98 | 3,841 | 101,164 | 3.80 | ||||||||||||||||||
Total Barclays UK and Barclays International | 10,323 | 274,566 | 3.76 | 9,814 | 268,763 | 3.65 | ||||||||||||||||||
Otherb | 214 | 794 | ||||||||||||||||||||||
Total net interest income | 10,537 | 10,608 | ||||||||||||||||||||||
Notes
| a | Barclays International margins have been restated to include interest earning lending within the investment banking business. |
| b | Other includes Head Office, BarclaysNon-Core andnon-lending related investment banking balances. |
| Barclays PLC and Barclays Bank PLC 2016 Annual Report on Form 20-F | 211 |
Non-IFRS performance measures
Barclays management believes that the non-IFRS performance measures included in this document provide valuable information to the readers of the financial statements as they enable the reader to identify a more consistent basis for comparing the business’ performance between financial periods, and provide more detail concerning the elements of performance which the managers of these businesses are most directly able to influence or are relevant for an assessment of Barclays PLC and its subsidiaries (the Group). They also reflect an important aspect of the way in which operating targets are defined and performance is monitored by Barclays’ management.
Non-IFRS and IFRS performance measures may also be presented on an excluding notable items basis. Notable items are considered to be significant items impacting comparability of performance.
Any non-IFRS performance measures in this document are not a substitute for IFRS measures and readers should consider the IFRS measures as well.
Non-IFRS performance measures glossary | ||
Measure | Definition | |
Barclays Core |
Barclays Core includes Barclays UK, Barclays International and Head Office. A reconciliation of Core statutory results and results excluding notable items is included on pages vi to viii.
| |
Return on average tangible shareholders’ equity |
Statutory profit after tax attributable to ordinary shareholders, including an adjustment for the tax credit in reserves in respect of other equity instruments, as a proportion of average shareholders’ equity excludingnon-controlling interests and other equity instruments adjusted for the deduction of intangible assets and goodwill. The components of the calculation have been included on page 213.
| |
Return on average allocated tangible shareholders’ equity |
Statutory profit after tax attributable to ordinary shareholders, including an adjustment for the tax credit in reserves in respect of other equity instruments, as a proportion of average allocated tangible equity. The components of the calculation have been included on page 213.
| |
Average tangible shareholders’ equity
|
Calculated as the average of the monthly period end tangible shareholders’ equity during the period. | |
Average allocated tangible shareholders’ equity
|
Calculated as the average of the monthly period end allocated tangible shareholders’ equity during the period.
| |
Cost: income ratio |
Total operating expenses divided by total income.
| |
Basic earnings/(loss) per share contribution (Barclays Core andNon-Core)
|
The calculation is consistent with the IFRS measure and applied to the Barclays Core andNon-Core: statutory profit after tax attributable to ordinary shareholders, including an adjustment for the tax credit in reserves in respect of other equity instruments, divided by the Group basic weighted average number of shares. The components of the calculation have been included on page 215. | |
Loan loss rate
|
Is quoted in basis points and represents total loan impairment divided by gross loans and advances to customers and banks held at amortised cost at the balance sheet date. | |
Loan: deposit ratio |
Loans and advances divided by customer accounts calculated for Barclays UK, Barclays International andNon-Core, excluding investment banking businesses. This excludes particular liabilities issued by the retail businesses that have characteristics comparable to retail deposits (for example structured Certificates of Deposit and retail bonds), which are included within debt securities in issue.
| |
Notable items |
Notable items are considered to be significant items impacting comparability of performance and are shown for each of the business segments. A reconciliation between statutory results and results excluding notable items is included on pages vi to viii including relevant performance measures.
| |
Net interest margin |
Net interest income divided by the sum of average customer assets. The components of the calculation have been included on page 211.
| |
Tangible net asset value per share |
Calculated by dividing shareholders equity, excludingnon-controlling interests and other equity instruments, less goodwill and intangible assets, by the number of issued ordinary shares. The components of the calculation have been included on page 215.
| |
| 212 | Barclays PLC and Barclays Bank PLC 2016 Annual Report on Form 20-F |
Returns
Return on average allocated tangible equity is calculated as profit for the period attributable to ordinary equity holders of the parent (adjusted for the tax credit recorded in reserves in respect of interest payments on other equity instruments) divided by average allocated tangible equity for the period as appropriate, excludingnon-controlling and other equity interests for businesses. Allocated tangible equity has been calculated as 11.5% of CRD IV fully loaded risk weighted assets for each business, adjusted for CRD IV fully loaded capital deductions, excluding goodwill and intangible assets, reflecting the assumptions the Group uses for capital planning purposes. Head Office average tangible equity represents the difference between the Group’s average tangible equity and the amounts allocated to businesses.
| | Year ended 31.12.16 £m | | | Year ended 31.12.15 £m | | | Year ended 31.12.14 £m | | ||||
| Attributable profit | ||||||||||||
| Barclays UK | 828 | (47 | ) | 852 | ||||||||
| Barclays International | 2,412 | 1,758 | 926 | |||||||||
| Head Office | 110 | 11 | 374 | |||||||||
| Barclays Core | 3,350 | 1,722 | 2,152 | |||||||||
| BarclaysNon-Core | (1,916 | ) | (2,418 | ) | (2,659 | ) | ||||||
| Africa Banking discontinued operation | 189 | 302 | 334 | |||||||||
| Barclays Group | 1,623 | (394) | (174 | ) | ||||||||
| Tax credit in respect of interest payments on other equity instruments | £m | £m | £m | |||||||||
| Barclays UK | 29 | 14 | 17 | |||||||||
| Barclays International | 83 | 42 | 23 | |||||||||
| Head Office | (1 | ) | – | (1 | ) | |||||||
| Barclays Core | 111 | 56 | 39 | |||||||||
| BarclaysNon-Core | 17 | 14 | 14 | |||||||||
| Africa Banking discontinued operation | – | – | – | |||||||||
| Barclays Group | 128 | 70 | 54 | |||||||||
| Profit/(loss) attributable to ordinary equity holders of the parent | £m | £m | £m | |||||||||
| Barclays UK | 857 | (33 | ) | 869 | ||||||||
| Barclays International | 2,495 | 1,800 | 949 | |||||||||
| Head Office | 109 | 11 | 373 | |||||||||
| Barclays Core | 3,461 | 1,778 | 2,191 | |||||||||
| BarclaysNon-Core | (1,899 | ) | (2,405 | ) | (2,645 | ) | ||||||
| Africa Banking discontinued operation | 189 | 302 | 334 | |||||||||
| Barclays Group | 1,751 | (324 | ) | (120 | ) | |||||||
| Average allocated tangible equitya | £bn | £bn | £bn | |||||||||
| Barclays UK | 8.9 | 9.3 | 9.1 | |||||||||
| Barclays International | 25.5 | 24.9 | 25.0 | |||||||||
| Head Officeb | 6.5 | 2.6 | (2.7 | ) | ||||||||
| Barclays Core | 41.0 | 36.8 | 31.4 | |||||||||
| BarclaysNon-Core | 7.8 | 10.9 | 15.6 | |||||||||
| Barclays Group | 48.7 | 47.7 | 47.0 | |||||||||
| Return on average allocated tangible equitya | % | % | % | |||||||||
| Barclays UK | 9.6% | (0.3% | ) | 9.5% | ||||||||
| Barclays International | 9.8% | 7.2% | 3.8% | |||||||||
Barclays Core
|
| 8.4%
|
|
| 4.8%
|
|
| 7.0%
|
| |||
| Barclays Group | 3.6% | (0.7% | ) | (0.3% | ) | |||||||
Note
| a | Refer to pagesi to x and pages 212 to 215 for further information, reconciliations and calculations of non-IFRS performance measures included throughout this document. |
| b | Includes the Africa Banking discontinued operation. |
| Barclays PLC and Barclays Bank PLC 2016 Annual Report on Form 20-F | 213 |
Financial review
Non-IFRS performance measures
| Returns excluding notable items | ||||||||||||
| | Year ended 31.12.16 £m | | | Year ended 31.12.15 £m | | | Year ended 31.12.14 £m | | ||||
| Attributable profit excluding notable items | ||||||||||||
Barclays UK |
|
1,685 |
|
|
1,961 |
|
|
1,707 |
| |||
| Barclays International | 1,961 | 2,320 | 1,734 | |||||||||
| Head Office | 135 | (176 | ) | 114 | ||||||||
| Barclays Core | 3,781 | 4,105 | 3,555 | |||||||||
| BarclaysNon-Core | (1,916 | ) | (1,711 | ) | (1,109 | ) | ||||||
| Africa Banking discontinued operation | 189 | 302 | 334 | |||||||||
| Barclays Group | 2,054 | 2,696 | 2,780 | |||||||||
| Tax credit in respect of interest payments on other equity instruments | ||||||||||||
| Barclays UK | 29 | 14 | 17 | |||||||||
| Barclays International | 83 | 42 | 23 | |||||||||
| Head Office | (1 | ) | – | (1 | ) | |||||||
| Barclays Core | 111 | 56 | 39 | |||||||||
| BarclaysNon-Core | 17 | 14 | 14 | |||||||||
| Africa Banking discontinued operation | – | – | – | |||||||||
| Barclays Group | 128 | 70 | 54 | |||||||||
| Profit/(loss) attributable to ordinary equity holders of the parent excluding notable items | ||||||||||||
| Barclays UK | 1,714 | 1,975 | 1,724 | |||||||||
| Barclays International | 2,044 | 2,362 | 1,757 | |||||||||
| Head Office | 133 | (176) | 126 | |||||||||
| Barclays Core | 3,891 | 4,161 | 3,594 | |||||||||
| BarclaysNon-Core | (1,899 | ) | (1,697 | ) | (1,095 | ) | ||||||
| Africa Banking discontinued operation | 189 | 302 | 334 | |||||||||
| Barclays Group | 2,182 | 2,766 | 2,834 | |||||||||
| Average allocated tangible equity excluding notable itemsa | £bn | £bn | £bn | |||||||||
| Barclays UK | 8.9 | 9.3 | 9.1 | |||||||||
| Barclays International | 25.5 | 24.9 | 25.0 | |||||||||
| Head Officeb,c | 6.8 | 2.9 | (1.9 | ) | ||||||||
| Barclays Core | 41.3 | 37.2 | 32.2 | |||||||||
| BarclaysNon-Core | 7.8 | 10.9 | 15.6 | |||||||||
| Barclays Group | 49.0 | 48.1 | 47.8 | |||||||||
| Return on average allocated tangible equity excluding notable itemsa | % | % | % | |||||||||
| Barclays UK | 19.3% | 21.1% | 18.9% | |||||||||
| Barclays International | 8.0% | 9.5% | 7.0% | |||||||||
Barclays Core
|
| 9.4%
|
|
| 11.2%
|
|
| 11.2%
|
| |||
| Barclays Group | 4.4% | 5.8% | 5.9% | |||||||||
Notes
| a | Refer to pagesi to x and pages 212 to 215 for further information reconciliations and calculations of non-IFRS performance measures included throughout this document. |
| b | Includes the Africa Banking discontinued operation. |
| c | Excludes the cumulativepost-tax impact of own credit. |
| 214 | Barclays PLC and Barclays Bank PLC 2016 Annual Report on Form 20-F |
Non-IFRS performance measures
| Earnings per share | ||||||||||||
| | Year ended 31.12.16 £m | | | Year ended 31.12.15 £m | | | Year ended 31.12.14 £m | | ||||
| Profit/(loss) attributable to ordinary equity holders of the parenta | ||||||||||||
| Barclays Core | 3,461 | 1,778 | 2,191 | |||||||||
| BarclaysNon-Core | (1,899) | (2,405) | (2,645) | |||||||||
| Africa Banking discontinued operation | 189 | 302 | 334 | |||||||||
| Barclays Groupb | 1,751 | (324) | (120) | |||||||||
| £m | £m | £m | ||||||||||
| Basic weighted average number of shares | 16,860 | 16,683 | 16,329 | |||||||||
| Basic earnings per ordinary sharea.b | p | p | p | |||||||||
| Barclays Core contribution | 20.5 | 10.7 | 13.4 | |||||||||
| BarclaysNon-Core contribution | (11.3) | (14.4) | (16.2) | |||||||||
| Barclays Group | 10.4 | (1.9) | (0.7) | |||||||||
| Profit/(loss) attributable to ordinary equity holders of the parent excluding notable itemsa | £m | £m | £m | |||||||||
| Barclays Core | 3,891 | 4,161 | 3,594 | |||||||||
| BarclaysNon-Core | (1,899) | (1,697) | (1,095) | |||||||||
| Africa Banking discontinued operation | 189 | 302 | 334 | |||||||||
| Barclays Groupb | 2,182 | 2,766 | 2,834 | |||||||||
| Basic earnings per ordinary share excluding notable itemsa,b | p | p | p | |||||||||
| Barclays Core contribution | 23.1 | 24.9 | 22.0 | |||||||||
| BarclaysNon-Core contribution | (11.3) | (10.2) | (6.7) | |||||||||
| Barclays Group | 12.9 | 16.6 | 17.3 | |||||||||
| Tangible net asset value | ||||||||||||
| | Year ended 31.12.16 £m | | | Year ended 31.12.15 £m | | | Year ended 31.12.14 £m | | ||||
| Total equity excludingnon-controlling interests | 64,873 | 59,810 | 59,567 | |||||||||
| Other equity instruments | (6,449) | (5,305) | (4,322) | |||||||||
| Shareholder’s equity excluding non-controlling interests attributable to ordinary shareholders of the parent | 58,424 | 54,505 | 55,245 | |||||||||
| Goodwill and intangiblesc | (9,245) | (8,222) | (8,180) | |||||||||
| Tangible shareholders’ equity excludingnon-controlling interests attributable to ordinary shareholders of the parent | 49,179 | 46,283 | 47,023 | |||||||||
| £m | £m | £m | ||||||||||
| Shares in issue | 16,963 | 16,805 | 16,498 | |||||||||
| p | p | p | ||||||||||
| Net asset value per share | 344 | 324 | 335 | |||||||||
| Tangible net asset value per share | 290 | 275 | 285 | |||||||||
Notes
| a | Profit for the period attributable to ordinary equity holders of the parent includes the tax credit recorded in reserves in respect of interest payments on other equity instruments. The tax credit of £128m (2015: £70m) is allocated to businesses in proportion to the allocation of the payments in relation to the other equity instruments. |
| b | Includes the Africa Banking discontinued operation |
| c | 2016 includes goodwill and intangibles in relation to Africa Banking of £1,519m. |
| Barclays PLC and Barclays Bank PLC 2016 Annual Report on Form 20-F | 215 |
Financial statements
Detailed analysis of our statutory accounts, independently audited and providing
in-depth disclosure on the financial performance of the Group.
Consolidated financial statements
|
| Page
|
|
| Note
|
| ||||||
§ | Presentation of information | 217 | n/a | |||||||||
§ | Independent Registered Public Accounting Firm’s report | 218 | n/a | |||||||||
§ | Consolidated income statement | 219 | n/a | |||||||||
§ | Consolidated statement of comprehensive income | 220 | n/a | |||||||||
§ | Consolidated balance sheet | 221 | n/a | |||||||||
§ | Consolidated statement of changes in equity | 222 | n/a | |||||||||
§ | Consolidated cash flow statement | 223 | n/a | |||||||||
§ | Parent Company accounts | 224 | n/a | |||||||||
§ | Notes to the financial statements | 226 | n/a | |||||||||
§ | Significant accounting policies
| 226 | 1 | |||||||||
| Notes to the financial statements | ||||||||||||
| Performance/return | § | Segmental reporting | 231 | 2 | ||||||||
§ | Net interest income | 231 | 3 | |||||||||
§ | Net fee and commission income | 232 | 4 | |||||||||
§ | Net trading income | 232 | 5 | |||||||||
§ | Net investment income | 233 | 6 | |||||||||
§ | Credit impairment charges and other provisions | 233 | 7 | |||||||||
§ | Operating expenses | 235 | 8 | |||||||||
§ | Profit/(loss) on disposal of subsidiaries, associates and joint ventures | 235 | 9 | |||||||||
§ | Tax | 236 | 10 | |||||||||
§ | Earnings per share | 240 | 11 | |||||||||
§ | Dividends on ordinary shares
| 240 | 12 | |||||||||
| Assets and liabilities | § | Trading portfolio | 241 | 13 | ||||||||
| held at fair value | § | Financial assets designated at fair value | 241 | 14 | ||||||||
§ | Derivative financial instruments | 242 | 15 | |||||||||
§ | Financial investments | 245 | 16 | |||||||||
§ | Financial liabilities designated at fair value | 245 | 17 | |||||||||
§ | Fair value of financial instruments | 246 | 18 | |||||||||
§ | Offsetting financial assets and financial liabilities
| 263 | 19 | |||||||||
| Financial instruments | § | Loans and advances to banks and customers | 264 | 20 | ||||||||
| held at amortised cost | § | Finance leases | 264 | 21 | ||||||||
§ | Reverse repurchase and repurchase agreements including other similar lending and borrowing
| 265 | 22 | |||||||||
| Non-current assets and | § | Property, plant and equipment | 266 | 23 | ||||||||
| other investments | § | Goodwill and intangible assets | 267 | 24 | ||||||||
§ | Operating leases
| 269 | 25 | |||||||||
| Accruals, provisions, | § | Accruals, deferred income and other liabilities | 270 | 26 | ||||||||
| contingent liabilities | § | Provisions | 270 | 27 | ||||||||
| and legal proceedings | § | Contingent liabilities and commitments | 272 | 28 | ||||||||
§ | Legal, competition and regulatory matters
| 272 | 29 | |||||||||
| Capital instruments, | § | Subordinated liabilities | 281 | 30 | ||||||||
| equity and reserves | § | Ordinary shares, share premium and other equity | 284 | 31 | ||||||||
§ | Reserves | 285 | 32 | |||||||||
§ | Non-controlling interests
| 285 | 33 | |||||||||
| Employee benefits | § | Share-based payments | 287 | 34 | ||||||||
§ | Pensions and post retirement benefits
| 288 | 35 | |||||||||
| Scope of consolidation | § | Principal subsidiaries | 294 | 36 | ||||||||
§ | Structured entities | 295 | 37 | |||||||||
§ | Investments in associates and joint ventures | 298 | 38 | |||||||||
§ | Securitisations | 299 | 39 | |||||||||
§ | Assets pledged
| 301 | 40 | |||||||||
| Other disclosure matters | § | Related party transactions and Directors’ remuneration | 302 | 41 | ||||||||
§ | Auditors’ remuneration | 304 | 42 | |||||||||
§ | Financial risks, liquidity and capital management | 304 | 43 | |||||||||
§ | Assets included in disposal groups held for sale and associated liabilities | 305 | 44 | |||||||||
§ | Barclays PLC (the Parent Company) | 307 | 45 | |||||||||
§ | Related undertakings | 308 | 46 | |||||||||
| 216 | Barclays PLC and Barclays Bank PLC 2016 Annual Report on Form 20-F |
Presentation of information
Barclays approach to disclosures
The Group aims to continually enhance its disclosures and their usefulness to the readers of the financial statements in light of developing market practice and areas of focus. Consequently Barclays disclosures go beyond the minimum standards required by accounting standards and other regulatory requirements.
Barclays continue to support the recommendations and guidance made by the Enhanced Disclosure Taskforce (EDTF). The EDTF was formed by the Financial Stability Board with a remit to broaden and deepen the risk disclosures of global banks in a number of areas, including liquidity and funding, credit risk and market risk. Barclays has adopted the recommendations across the Annual Report and Pillar 3 Report.
In line with the Financial Reporting Council’s guidance on Clear and Concise reporting. Barclays has focused reporting on material items and sought to reorganise information to aid users’ understanding.
It is Barclays’ view that best in class disclosures will continue to evolve in light of ongoing market and stakeholder engagement with the banking sector. Barclays is committed to engaging with a published Code for Financial Reporting Disclosure (the Code). The Code sets out five disclosure principles together with supporting guidance which states that UK banks will:
| § | provide high quality, meaningful and decision-useful disclosures |
| § | review and enhance their financial instrument disclosures for key areas of interest |
| § | assess the applicability and relevance of good practice recommendations to their disclosures acknowledging the importance of such guidance |
| § | seek to enhance the comparability of financial statement disclosures across the UK banking sector and |
| § | clearly differentiate in their annual reports between information that is audited and information that is unaudited. |
British Bankers’ Association (BBA) Code for Financial Reporting Disclosure
Barclays has adopted the BBA Code for Financial Reporting Disclosure and has prepared the 2016 Annual Report and Accounts in compliance with the Code.
Statutory Accounts
The consolidated accounts of Barclays PLC and its subsidiaries are set out on pages 219 to 223 along with the accounts of Barclays PLC itself on pages 224 to 225. The accounting policies on pages 226 to 230 and the notes commencing on page 231 apply equally to both sets of accounts unless otherwise stated.
The financial statements have been prepared on a going concern basis, in accordance with The Companies Act 2006 as applicable to companies using IFRS.
On 1 March 2016, Barclays announced its intention to sell down the Group’s interest in BAGL. This sell down is intended to be to a level which will permit deconsolidation from an accounting and regulatory perspective, subject to shareholder and regulatory approvals as required. As the Africa Banking Business meets requirements for presentation as a discontinued operation, these results have been presented as two lines on the face of the Group income statement, representing the profit after tax andnon-controlling interest in respect of the discontinued operation.
Capital RequirementsCountry-by-Country Reporting
HM Treasury has transposed the requirements set out under CRD IV and issued the Capital RequirementsCountry-by-Country Reporting Regulations 2013. The legislation requires Barclays PLC to publish additional information in respect of the year ended 31 December 2016. This information is available on the Barclays website: barclays.com/citizenship/reports-and-publications/country-snapshot.html
| Barclays PLC and Barclays Bank PLC 2016 Annual Report on Form 20-F | 217 |
Independent Registered Public Accounting Firm’s report
Report of Independent Registered Public Accounting Firm
To The Board of Directors and Shareholders of Barclays PLC
In our opinion, the accompanying consolidated balance sheets and the related consolidated income statements, consolidated statements of comprehensive income, consolidated statements of changes in equity and consolidated cash flow statements present fairly, in all material respects, the financial position of Barclays PLC and its subsidiaries at 31 December 2016 and 31 December 2015, and the results of their operations and their cash flows for each of the three years in the period ended 31 December 2016 in conformity with International Financial Reporting Standards as issued by the International Accounting Standards Board. Also in our opinion, the Company maintained, in all material respects, effective internal control over financial reporting as of 31 December 2016, based on criteria established inInternal Control - Integrated Framework 2013 issued by the Committee of Sponsoring Organizations of the Treadway Commission (COSO). The Company’s management is responsible for these financial statements, for maintaining effective internal control over financial reporting and for its assessment of the effectiveness of internal control over financial reporting, included in management’s report on internal control over financial reporting included in the Directors’ Report appearing on page 40 of the Annual Report to Shareholders. Our responsibility is to express opinions on these financial statements and on the Company’s internal control over financial reporting based on our integrated audits. We conducted our audits in accordance with the standards of the Public Company Accounting Oversight Board (US). Those standards require that we plan and perform the audits to obtain reasonable assurance about whether the financial statements are free of material misstatement and whether effective internal control over financial reporting was maintained in all material respects. Our audits of the financial statements included examining, on a test basis, evidence supporting the amounts and disclosures in the financial statements, assessing the accounting principles used and significant estimates made by management, and evaluating the overall financial statement presentation. Our audit of internal control over financial reporting included obtaining an understanding of internal control over financial reporting, assessing the risk that a material weakness exists, and testing and evaluating the design and operating effectiveness of internal control based on the assessed risk. Our audits also included performing such other procedures as we considered necessary in the circumstances. We believe that our audits provide a reasonable basis for our opinions.
A company’s internal control over financial reporting is a process designed to provide reasonable assurance regarding the reliability of financial reporting and the preparation of financial statements for external purposes in accordance with generally accepted accounting principles. A company’s internal control over financial reporting includes those policies and procedures that (i) pertain to the maintenance of records that, in reasonable detail, accurately and fairly reflect the transactions and dispositions of the assets of the company; (ii) provide reasonable assurance that transactions are recorded as necessary to permit preparation of financial statements in accordance with generally accepted accounting principles, and that receipts and expenditures of the company are being made only in accordance with authorisations of management and directors of the company; and (iii) provide reasonable assurance regarding prevention or timely detection of unauthorised acquisition, use, or disposition of the company’s assets that could have a material effect on the financial statements.
Because of its inherent limitations, internal control over financial reporting may not prevent or detect misstatements. Also, projections of any evaluation of effectiveness to future periods are subject to the risk that controls may become inadequate because of changes in conditions, or that the degree of compliance with the policies or procedures may deteriorate.
/s/ PricewaterhouseCoopers LLP
London, United Kingdom
22 February 2017
| 218 | Barclays PLC and Barclays Bank PLC 2016 Annual Report on Form 20-F |
Consolidated financial statements
Consolidated income statement
| For the year ended 31 December | Note | | 2016 £m |
| | 2015 £m |
| | 2014 £m |
| ||||||
| Continuing operations | ||||||||||||||||
| Interest income | 3 | 14,541 | 13,953 | 14,194 | ||||||||||||
| Interest expense | 3 | (4,004 | ) | (3,345 | ) | (4,108 | ) | |||||||||
| Net interest income | 10,537 | 10,608 | 10,086 | |||||||||||||
| Fee and commission income | 4 | 8,570 | 8,470 | 8,622 | ||||||||||||
| Fee and commission expense | 4 | (1,802 | ) | (1,611 | ) | (1,500 | ) | |||||||||
| Net fee and commission income | 6,768 | 6,859 | 7,122 | |||||||||||||
| Net trading income | 5 | 2,768 | 3,426 | 3,086 | ||||||||||||
| Net investment income | 6 | 1,324 | 1,097 | 1,309 | ||||||||||||
| Other income | 54 | 50 | 160 | |||||||||||||
| Total income | 21,451 | 22,040 | 21,763 | |||||||||||||
| Credit impairment charges and other provisions | 7 | (2,373 | ) | (1,762 | ) | (1,821 | ) | |||||||||
| Net operating income | 19,078 | 20,278 | 19,942 | |||||||||||||
| Staff costs | 8 | (9,423 | ) | (8,853 | ) | (9,860 | ) | |||||||||
| Infrastructure costs | 8 | (2,998 | ) | (2,691 | ) | (2,895 | ) | |||||||||
| Administration and general expenses | 8 | (2,917 | ) | (2,983 | ) | (3,069 | ) | |||||||||
| Provision for UK customer redress | (1,000 | ) | (2,772 | ) | (1,110 | ) | ||||||||||
| Provision for ongoing investigations and litigation relating to Foreign Exchange | – | (1,237 | ) | (1,250 | ) | |||||||||||
| Operating expenses | 8 | (16,338 | ) | (18,536 | ) | (18,184 | ) | |||||||||
| Share ofpost-tax results of associates and joint ventures | 70 | 41 | 28 | |||||||||||||
| Profit/(loss) on disposal of subsidiaries, associates and joint ventures | 9 | 420 | (637 | ) | (473 | ) | ||||||||||
| Profit before tax | 3,230 | 1,146 | 1,313 | |||||||||||||
| Taxation | 10 | (993 | ) | (1,149 | ) | (1,121 | ) | |||||||||
| Profit/(loss) after tax in respect of continuing operations | 2,237 | (3 | ) | 192 | ||||||||||||
| Profit after tax in respect of discontinued operation | 591 | 626 | 653 | |||||||||||||
| Profit after tax | 2,828 | 623 | 845 | |||||||||||||
| Attributable to: | ||||||||||||||||
| Equity holders of the parent | 1,623 | (394 | ) | (174 | ) | |||||||||||
| Other equity holdersa | 457 | 345 | 250 | |||||||||||||
| Total equity holders of the parent | 2,080 | (49 | ) | 76 | ||||||||||||
| Non-controlling interests in respect of continuing operations | 33 | 346 | 348 | 449 | ||||||||||||
| Non-controlling interests in respect of discontinued operation | 33 | 402 | 324 | 320 | ||||||||||||
| Profit after tax | 2,828 | 623 | 845 | |||||||||||||
| Earnings per share | ||||||||||||||||
| Basic earnings/(loss) per ordinary share | 11 | 10.4 | (1.9 | ) | (0.7 | ) | ||||||||||
| Basic earnings/(loss) per ordinary share in respect of continuing operations | 9.3 | (3.7 | ) | (2.7 | ) | |||||||||||
| Basic earnings per ordinary share in respect of discontinued operation | 1.1 | 1.8 | 2.0 | |||||||||||||
| Diluted earnings/(loss) per share | 11 | 10.3 | (1.9 | ) | (0.7 | ) | ||||||||||
Note
| a | The profit after tax attributable to other equity holders of £457m (2015: £345m) is offset by a tax credit recorded in reserves of £128m (2015: £70m). The net amount of £329m (2015: £275m), along with NCI, is deducted from profit after tax in order to calculate earnings per share. |
| Barclays PLC and Barclays Bank PLC 2016 Annual Report on Form 20-F | 219 |
Consolidated financial statements
Consolidated statement of comprehensive income
| For the year ended 31 December | | 2016 £m | | | 2015 £m | | | 2014 £m | | |||
| Profit after tax | 2,828 | 623 | 845 | |||||||||
| Profit/(loss) after tax in respect of continuing operations | 2,237 | (3 | ) | 192 | ||||||||
| Profit after tax in respect of discontinued operation | 591 | 626 | 653 | |||||||||
| Other comprehensive income that may be recycled to profit or loss from continuing operations: | ||||||||||||
| Currency translation reserve | ||||||||||||
| Currency translation differences | 3,024 | 748 | 774 | |||||||||
| Available for sale reserve | ||||||||||||
| Net gains from changes in fair value | 2,147 | 64 | 5,339 | |||||||||
| Net losses transferred to net profit on disposal | (912 | ) | (374 | ) | (619 | ) | ||||||
| Net losses/(gains) transferred to net profit due to impairment | 20 | 17 | (31 | ) | ||||||||
| Net (gains) transferred to net profit due to fair value hedging | (1,677 | ) | (148 | ) | (4,074 | ) | ||||||
| Changes in insurance liabilities | 53 | 86 | (94 | ) | ||||||||
| Tax | (18 | ) | 126 | (103 | ) | |||||||
| Cash flow hedging reserve | ||||||||||||
| Net gains/(losses) from changes in fair value | 1,455 | (312 | ) | 2,650 | ||||||||
| Net losses transferred to net profit | (365 | ) | (238 | ) | (713 | ) | ||||||
| Tax | (292 | ) | 57 | (384 | ) | |||||||
| Other | 13 | 20 | (42 | ) | ||||||||
| Other comprehensive income that may be recycled to profit or loss | 3,448 | 46 | 2,703 | |||||||||
| Other comprehensive (loss)/income not recycled to profit or loss: | ||||||||||||
| Retirement benefit remeasurements | (1,309 | ) | 1,176 | 268 | ||||||||
| Tax | 329 | (260 | ) | (63 | ) | |||||||
| Other comprehensive income for the period | 2,468 | 962 | 2,908 | |||||||||
| Total comprehensive income for the year, net of tax from continuing operations | 4,705 | 959 | 3,100 | |||||||||
| Total comprehensive income/(loss) for the year, net of tax from discontinued operation | 2,111 | (722 | ) | 346 | ||||||||
| Total comprehensive income for the year | 6,816 | 237 | 3,446 | |||||||||
| Attributable to: | ||||||||||||
| Equity holders of the parent | 5,233 | 45 | 2,755 | |||||||||
| Non-controlling interests | 1,583 | 192 | 691 | |||||||||
| Total comprehensive income for the year | 6,816 | 237 | 3,446 | |||||||||
| 220 | Barclays PLC and Barclays Bank PLC 2016 Annual Report on Form 20-F |
Consolidated financial statements
Consolidated balance sheet
As at 31 December | Notes | | 2016 £m |
| | 2015 £m |
| | 2014 £m |
| ||||||
Assets | ||||||||||||||||
Cash and balances at central banks | 102,353 | 49,711 | 39,695 | |||||||||||||
Items in the course of collection from other banks | 1,467 | 1,011 | 1,210 | |||||||||||||
Trading portfolio assets | 13 | 80,240 | 77,348 | 114,717 | ||||||||||||
Financial assets designated at fair value | 14 | 78,608 | 76,830 | 38,300 | ||||||||||||
Derivative financial instruments | 15 | 346,626 | 327,709 | 439,909 | ||||||||||||
Financial investments | 16 | 63,317 | 90,267 | 86,066 | ||||||||||||
Loans and advances to banks | 20 | 43,251 | 41,349 | 42,111 | ||||||||||||
Loans and advances to customers | 20 | 392,784 | 399,217 | 427,767 | ||||||||||||
Reverse repurchase agreements and other similar secured lending | 22 | 13,454 | 28,187 | 131,753 | ||||||||||||
Prepayments, accrued income and other assets | 2,893 | 3,010 | 3,607 | |||||||||||||
Investments in associates and joint ventures | 38 | 684 | 573 | 711 | ||||||||||||
Property, plant and equipment | 23 | 2,825 | 3,468 | 3,786 | ||||||||||||
Goodwill and intangible assets | 24 | 7,726 | 8,222 | 8,180 | ||||||||||||
Current tax assets | 10 | 561 | 415 | 334 | ||||||||||||
Deferred tax assets | 10 | 4,869 | 4,495 | 4,130 | ||||||||||||
Retirement benefit assets | 35 | 14 | 836 | 56 | ||||||||||||
Assets included in disposal groups classified as held for sale | 44 | 71,454 | 7,364 | 15,574 | ||||||||||||
Total assets | 1,213,126 | 1,120,012 | 1,357,906 | |||||||||||||
Liabilities | ||||||||||||||||
Deposits from banks | 48,214 | 47,080 | 58,390 | |||||||||||||
Items in the course of collection due to other banks | 636 | 1,013 | 1,177 | |||||||||||||
Customer accounts | 423,178 | 418,242 | 427,704 | |||||||||||||
Repurchase agreements and other similar secured borrowing | 22 | 19,760 | 25,035 | 124,479 | ||||||||||||
Trading portfolio liabilities | 13 | 34,687 | 33,967 | 45,124 | ||||||||||||
Financial liabilities designated at fair value | 17 | 96,031 | 91,745 | 56,972 | ||||||||||||
Derivative financial instruments | 15 | 340,487 | 324,252 | 439,320 | ||||||||||||
Debt securities in issue | 75,932 | 69,150 | 86,099 | |||||||||||||
Subordinated liabilities | 30 | 23,383 | 21,467 | 21,153 | ||||||||||||
Accruals, deferred income and other liabilities | 26 | 8,871 | 10,610 | 11,423 | ||||||||||||
Provisions | 27 | 4,134 | 4,142 | 4,135 | ||||||||||||
Current tax liabilities | 10 | 737 | 903 | 1,021 | ||||||||||||
Deferred tax liabilities | 10 | 29 | 122 | 262 | ||||||||||||
Retirement benefit liabilities | 35 | 390 | 423 | 1,574 | ||||||||||||
Liabilities included in disposal groups classified as held for sale | 44 | 65,292 | 5,997 | 13,115 | ||||||||||||
Total liabilities | 1,141,761 | 1,054,148 | 1,291,948 | |||||||||||||
Total equity | ||||||||||||||||
Called up share capital and share premium | 31 | 21,842 | 21,586 | 20,809 | ||||||||||||
Other equity instruments | 31 | 6,449 | 5,305 | 4,322 | ||||||||||||
Other reserves | 32 | 6,051 | 1,898 | 2,724 | ||||||||||||
Retained earnings | 30,531 | 31,021 | 31,712 | |||||||||||||
Total equity excludingnon-controlling interests | 64,873 | 59,810 | 59,567 | |||||||||||||
Non-controlling interests | 33 | 6,492 | 6,054 | 6,391 | ||||||||||||
Total equity | 71,365 | 65,864 | 65,958 | |||||||||||||
Total liabilities and equity | 1,213,126 | 1,120,012 | 1,357,906 | |||||||||||||
The Board of Directors approved the financial statements on pages 219 to 316 on 22 February 2017.
John McFarlane
Group Chairman
James E Staley
Group Chief Executive
Tushar Morzaria
Group Finance Director
| Barclays PLC and Barclays Bank PLC 2016 Annual Report on Form 20-F | 221 |
Consolidated financial statements
Consolidated statement of changes in equity
| | Called up share capital and share premium |
| | Other equity instruments £m | | | Available for sale reserve |
| | Cash flow hedging reserve |
| | Currency translation reserve |
| | Other reserves | | | Retained earnings | | | Total equity controlling | | | Non- controlling interests |
| | Total equity | | |||||||||||
Balance as at 1 January 2016 | 21,586 | 5,305 | 317 | 1,261 | (623 | ) | 943 | 31,021 | 59,810 | 6,054 | 65,864 | |||||||||||||||||||||||||||||
Profit after tax | – | 457 | – | – | – | – | 1,434 | 1,891 | 346 | 2,237 | ||||||||||||||||||||||||||||||
Currency translation movements | – | – | – | – | 3,022 | – | – | 3,022 | 2 | 3,024 | ||||||||||||||||||||||||||||||
Available for sale investments | – | – | (387 | ) | – | – | – | – | (387 | ) | – | (387 | ) | |||||||||||||||||||||||||||
Cash flow hedges | – | – | – | 798 | – | – | – | 798 | – | 798 | ||||||||||||||||||||||||||||||
Pension remeasurement | – | – | – | – | – | – | (980 | ) | (980 | ) | – | (980 | ) | |||||||||||||||||||||||||||
Other | – | – | – | – | – | – | 12 | 12 | 1 | 13 | ||||||||||||||||||||||||||||||
Total comprehensive income net of tax from continuing operations | – | 457 | (387 | ) | 798 | 3,022 | – | 466 | 4,356 | 349 | 4,705 | |||||||||||||||||||||||||||||
Total comprehensive income net of tax from discontinued operation | – | – | (4 | ) | 46 | 652 | – | 183 | 877 | 1,234 | 2,111 | |||||||||||||||||||||||||||||
Total comprehensive (loss)/income for the year | – | 457 | (391 | ) | 844 | 3,674 | – | 649 | 5,233 | 1,583 | 6,816 | |||||||||||||||||||||||||||||
Issue of new ordinary shares | 68 | – | – | – | – | – | – | 68 | – | 68 | ||||||||||||||||||||||||||||||
Issue of shares under employee share schemes | 188 | – | – | – | – | – | 668 | 856 | – | 856 | ||||||||||||||||||||||||||||||
Issue and exchange of other equity instruments | – | 1,132 | – | – | – | – | – | 1,132 | – | 1,132 | ||||||||||||||||||||||||||||||
Other equity instruments coupons paid | – | (457 | ) | – | – | – | – | 128 | (329 | ) | – | (329 | ) | |||||||||||||||||||||||||||
Redemption of preference shares | – | – | – | – | – | – | (417 | ) | (417 | ) | (1,170 | ) | (1,587 | ) | ||||||||||||||||||||||||||
Increase in treasury shares | – | – | – | – | – | (140 | ) | – | (140 | ) | – | (140 | ) | |||||||||||||||||||||||||||
Vesting of shares under employee share schemes | – | – | – | – | – | 166 | (415 | ) | (249 | ) | – | (249 | ) | |||||||||||||||||||||||||||
Dividends paid | – | – | – | – | – | – | (757 | ) | (757 | ) | (575 | ) | (1,332 | ) | ||||||||||||||||||||||||||
Net equity impact of partial BAGL disposal | – | – | – | – | – | – | (349 | ) | (349 | ) | 601 | 252 | ||||||||||||||||||||||||||||
Other reserve movements | – | 12 | – | – | – | – | 3 | 15 | (1 | ) | 14 | |||||||||||||||||||||||||||||
Balance as at 31 December 2016 | 21,842 | 6,449 | (74 | ) | 2,105 | 3,051 | 969 | 30,531 | 64,873 | 6,492 | 71,365 | |||||||||||||||||||||||||||||
| ||||||||||||||||||||||||||||||||||||||||
Balance as at 1 January 2015 | 20,809 | 4,322 | 562 | 1,817 | (582 | ) | 927 | 31,712 | 59,567 | 6,391 | 65,958 | |||||||||||||||||||||||||||||
Profit after tax | – | 345 | – | – | – | – | (696 | ) | (351 | ) | 348 | (3 | ) | |||||||||||||||||||||||||||
Currency translation movements | – | – | – | – | 747 | – | – | 747 | 1 | 748 | ||||||||||||||||||||||||||||||
Available for sale investments | – | – | (229 | ) | – | – | – | – | (229 | ) | – | (229 | ) | |||||||||||||||||||||||||||
Cash flow hedges | – | – | – | (493 | ) | – | – | – | (493 | ) | – | (493 | ) | |||||||||||||||||||||||||||
Pension remeasurement | – | – | – | – | – | – | 916 | 916 | – | 916 | ||||||||||||||||||||||||||||||
Other | – | – | – | – | – | – | 20 | 20 | – | 20 | ||||||||||||||||||||||||||||||
Total comprehensive income net of tax from continuing operations | – | 345 | (229 | ) | (493 | ) | 747 | – | 240 | 610 | 349 | 959 | ||||||||||||||||||||||||||||
Total comprehensive income net of tax from discontinued operation | – | – | (16 | ) | (63 | ) | (788 | ) | – | 302 | (565 | ) | (157 | ) | (722 | ) | ||||||||||||||||||||||||
Total comprehensive (loss)/income for the year | – | 345 | (245 | ) | (556 | ) | (41 | ) | – | 542 | 45 | 192 | 237 | |||||||||||||||||||||||||||
Issue of new ordinary shares | 137 | – | – | – | – | – | – | 137 | – | 137 | ||||||||||||||||||||||||||||||
Issue of shares under employee share schemes | 640 | – | – | – | – | – | 571 | 1,211 | – | 1,211 | ||||||||||||||||||||||||||||||
Issue and exchange of other equity instruments | – | 995 | – | – | – | – | – | 995 | – | 995 | ||||||||||||||||||||||||||||||
Other equity instruments coupons paid | – | (345 | ) | – | – | – | – | 70 | (275 | ) | – | (275 | ) | |||||||||||||||||||||||||||
Redemption of preference shares | – | – | – | – | – | – | – | – | – | – | ||||||||||||||||||||||||||||||
Increase in treasury shares | – | – | – | – | – | (602 | ) | – | (602 | ) | – | (602 | ) | |||||||||||||||||||||||||||
Vesting of shares under employee share schemes | – | – | – | – | – | 618 | (755 | ) | (137 | ) | – | (137 | ) | |||||||||||||||||||||||||||
Dividends paid | – | – | – | – | – | – | (1,081 | ) | (1,081 | ) | (552 | ) | (1,633 | ) | ||||||||||||||||||||||||||
Other reserve movements | – | (12 | ) | – | – | – | – | (38 | ) | (50 | ) | 23 | (27 | ) | ||||||||||||||||||||||||||
Balance as at 31 December 2015 | 21,586 | 5,305 | 317 | 1,261 | (623 | ) | 943 | 31,021 | 59,810 | 6,054 | 65,864 | |||||||||||||||||||||||||||||
Balance as at 1 January 2014 | 19,887 | 2,063 | 148 | 273 | (1,142 | ) | 970 | 33,186 | 55,385 | 8,564 | 63,949 | |||||||||||||||||||||||||||||
Profit after tax | – | 250 | – | – | – | – | (507 | ) | (257 | ) | 449 | 192 | ||||||||||||||||||||||||||||
Currency translation movements | – | – | – | – | 773 | – | – | 773 | 1 | 774 | ||||||||||||||||||||||||||||||
Available for sale investments | – | – | 418 | – | – | – | – | 418 | – | 418 | ||||||||||||||||||||||||||||||
Cash flow hedges | – | – | – | 1,554 | – | – | – | 1,554 | – | 1,554 | ||||||||||||||||||||||||||||||
Pension remeasurement | – | – | – | – | – | – | 205 | 205 | – | 205 | ||||||||||||||||||||||||||||||
Other | – | – | – | – | – | – | (43 | ) | (43 | ) | 1 | (42 | ) | |||||||||||||||||||||||||||
Total comprehensive income net of tax from continuing operations | – | 250 | 418 | 1,554 | 773 | – | (345 | ) | 2,650 | 451 | 3,101 | |||||||||||||||||||||||||||||
Total comprehensive income net of tax from discontinued operation | – | – | (4 | ) | (10 | ) | (213 | ) | – | 333 | 106 | 240 | 346 | |||||||||||||||||||||||||||
Total comprehensive (loss)/income for the year | – | 250 | 414 | 1,544 | 560 | – | (12 | ) | 2,756 | 691 | 3,447 | |||||||||||||||||||||||||||||
Issue of new ordinary shares | 150 | – | – | – | – | – | – | 150 | – | 150 | ||||||||||||||||||||||||||||||
Issue of shares under employee share schemes | 772 | – | – | – | – | – | 693 | 1,465 | – | 1,465 | ||||||||||||||||||||||||||||||
Issue and exchange of other equity instruments | – | 2,263 | – | – | – | – | (155 | ) | 2,108 | (1,527 | ) | 581 | ||||||||||||||||||||||||||||
Other equity instruments coupons paid | – | (250 | ) | – | – | – | – | 54 | (196 | ) | – | (196 | ) | |||||||||||||||||||||||||||
Redemption of preference shares | – | – | – | – | – | – | (104 | ) | (104 | ) | (687 | ) | (791 | ) | ||||||||||||||||||||||||||
Increase in treasury shares | – | – | – | – | – | (909 | ) | – | (909 | ) | – | (909 | ) | |||||||||||||||||||||||||||
Vesting of shares under employee share schemes | – | – | – | – | – | 866 | (866 | ) | – | – | – | |||||||||||||||||||||||||||||
Dividends paid | – | – | – | – | – | – | (1,057 | ) | (1,057 | ) | (631 | ) | (1,688 | ) | ||||||||||||||||||||||||||
Other reserve movements | – | (4 | ) | – | – | – | – | (27 | ) | (31 | ) | (19 | ) | (50 | ) | |||||||||||||||||||||||||
Balance as at 31 December 2014 | 20,809 | 4,322 | 562 | 1,817 | (582 | ) | 927 | 31,712 | 59,567 | 6,391 | 65,958 | |||||||||||||||||||||||||||||
| 222 | Barclays PLC and Barclays Bank PLC 2016 Annual Report on Form 20-F |
Consolidated financial statements
Consolidated cash flow statement
For the year ended 31 December | | 2016 £m |
| | 2015 £m |
| | 2014 £m |
| |||
Continuing operations | ||||||||||||
Reconciliation of profit before tax to net cash flows from operating activities: | ||||||||||||
Profit before tax | 3,230 | 1,146 | 1,312 | |||||||||
Adjustment fornon-cash items: | ||||||||||||
Allowance for impairment | 2,357 | 1,752 | 1,816 | |||||||||
Depreciation, amortisation and impairment of property, plant, equipment and intangibles | 1,261 | 1,215 | 1,108 | |||||||||
Other provisions, including pensions | 1,964 | 4,241 | 3,487 | |||||||||
Net profit on disposal of investments and property, plant and equipment | (912 | ) | (374 | ) | (619 | ) | ||||||
Othernon-cash movements including exchange rate movements | (20,025 | ) | 226 | (595 | ) | |||||||
Changes in operating assets and liabilities | ||||||||||||
Net (increase)/decrease in loans and advances to banks and customers | (25,385 | ) | 22,641 | 4,079 | ||||||||
Net decrease in reverse repurchase agreements and other similar lending | 14,733 | 103,471 | 54,380 | |||||||||
Net increase/(decrease) in deposits and debt securities in issue | 49,064 | (33,120 | ) | (2,319 | ) | |||||||
Net (decrease) in repurchase agreements and other similar borrowing | (4,852 | ) | (99,602 | ) | (72,107 | ) | ||||||
Net (increase)/decrease in derivative financial instruments | (2,318 | ) | (3,315 | ) | 2,961 | |||||||
Net (increase)/decrease in trading assets | (5,577 | ) | 37,091 | 18,651 | ||||||||
Net increase/(decrease) in trading liabilities | 880 | (10,877 | ) | (8,565 | ) | |||||||
Net decrease/(increase) in financial investments | 807 | (3,064 | ) | (5,882 | ) | |||||||
Net (increase) in other assets | (2,629 | ) | (2,661 | ) | (14,642 | ) | ||||||
Net (increase)/decrease in other liabilities | (532 | ) | (1,766 | ) | 8,092 | |||||||
Corporate income tax paid | (780 | ) | (1,670 | ) | (1,552 | ) | ||||||
Net cash from operating activities | 11,286 | 15,334 | (10,395 | ) | ||||||||
Purchase of available for sale investments | (65,086 | ) | (120,061 | ) | (109,296 | ) | ||||||
Proceeds from sale or redemption of available for sale investments | 102,515 | 114,529 | 119,129 | |||||||||
Purchase of property, plant and equipment and intangibles | (1,707 | ) | (1,928 | ) | (691 | ) | ||||||
Proceeds from sale of property, plant and equipment and intangibles | 358 | 393 | 335 | |||||||||
Proceeds from part disposal of investment in BAGL | 595 | – | – | |||||||||
Other cash flows associated with investing activities | 32 | 516 | (48 | ) | ||||||||
Net cash from investing activities | 36,707 | (6,551 | ) | 8,429 | ||||||||
Dividends paid | (1,304 | ) | (1,496 | ) | (1,688 | ) | ||||||
Issuance of subordinated debt | 1,457 | 879 | 848 | |||||||||
Redemption of subordinated debt | (1,143 | ) | (556 | ) | (869 | ) | ||||||
Net issue of shares and other equity instruments | 1,400 | 1,278 | 559 | |||||||||
Repurchase of shares and other equity instruments | (1,587 | ) | – | (104 | ) | |||||||
Net purchase of treasury shares | (140 | ) | (679 | ) | (909 | ) | ||||||
Net redemption of shares issued tonon-controlling interests | – | – | (746 | ) | ||||||||
Net cash from financing activities | (1,317 | ) | (574 | ) | (2,805 | ) | ||||||
Net cash from discontinued operations | 405 | (1,821 | ) | 1,809 | ||||||||
Effect of exchange rates on cash and cash equivalents | 10,473 | 1,689 | (313 | ) | ||||||||
Net increase/(decrease) in cash and cash equivalents | 57,554 | 8,077 | (3,275 | ) | ||||||||
Cash and cash equivalents at beginning of year | 86,556 | 78,479 | 81,754 | |||||||||
Cash and cash equivalents at end of year | 144,110 | 86,556 | 78,479 | |||||||||
Cash and cash equivalents comprise: | ||||||||||||
Cash and balances at central banks | 102,353 | 49,711 | 39,695 | |||||||||
Loans and advances to banks with original maturity less than three months | 38,252 | 35,876 | 36,282 | |||||||||
Available for sale treasury and other eligible bills with original maturity less than three months | 356 | 816 | 2,322 | |||||||||
Trading portfolio assets with original maturity less than three months | – | 153 | 180 | |||||||||
Cash and cash equivalents held for sale | 3,149 | – | – | |||||||||
| 144,110 | 86,556 | 78,479 |
Interest received was £22,099m (2015: £20,376m; 2014: £21,372m) and interest paid was £8,850m (2015: £7,534m; 2014: £8,566m).
The Group is required to maintain balances with central banks and other regulatory authorities and these amounted to £4,254m (2015: £4,369m; 2014: £4,448m).
For the purposes of the cash flow statement, cash comprises cash on hand and demand deposits and cash equivalents comprise highly liquid investments that are convertible into cash with an insignificant risk of changes in value with original maturities of three months or less. Repurchase and reverse repurchase agreements are not considered to be part of cash equivalents.
| Barclays PLC and Barclays Bank PLC 2016 Annual Report on Form 20-F | 223 |
Financial statements of Barclays PLC
Parent company accounts
Income statement | ||||||||||||||||
For the year ended 31 December | Notes | | 2016 £m | | | 2015 £m | | | 2014 £m | | ||||||
Dividends received from subsidiary | 621 | 876 | 821 | |||||||||||||
Net interest income/(expense) | 5 | (7 | ) | (6 | ) | |||||||||||
Other income | 45 | 334 | 227 | 275 | ||||||||||||
Operating expenses | (26 | ) | (6 | ) | (6 | ) | ||||||||||
Profit before tax | 934 | 1,090 | 1,084 | |||||||||||||
Tax | (60 | ) | (43 | ) | (57 | ) | ||||||||||
Profit after tax | 874 | 1,047 | 1,027 | |||||||||||||
Attributable to | ||||||||||||||||
Ordinary equity holders | 417 | 702 | 777 | |||||||||||||
Other equity holders | 457 | 345 | 250 |
Profit after tax and total comprehensive income for the year was £874m (2015: £1,047m). There were no other components of total comprehensive income other than the profit after tax.
The Company has seven members of staff (2015: nil).
Balance sheet | ||||||||||||
As at 31 December | Notes | | 2016 £m | | | 2015 £m | | |||||
Assets | ||||||||||||
Investment in subsidiaries | 45 | 36,553 | 35,303 | |||||||||
Loans and advances to subsidiaries | 45 | 19,421 | 7,990 | |||||||||
Financial investments | 45 | 1,218 | – | |||||||||
Derivative financial instruments | 45 | 268 | 210 | |||||||||
Other assets | 105 | 133 | ||||||||||
Total assets | 57,565 | 43,636 | ||||||||||
Liabilities | ||||||||||||
Deposits from banks | 547 | 494 | ||||||||||
Subordinated liabilities | 45 | 3,789 | 1,766 | |||||||||
Debt securities in issue | 45 | 16,893 | 6,224 | |||||||||
Other liabilities | 14 | – | ||||||||||
Total liabilities | 21,243 | 8,484 | ||||||||||
Equity | ||||||||||||
Called up share capital | 31 | 4,241 | 4,201 | |||||||||
Share premium account | 31 | 17,601 | 17,385 | |||||||||
Other equity instruments | 31 | 6,453 | 5,321 | |||||||||
Capital redemption reserve | 420 | 394 | ||||||||||
Retained earnings | 7,607 | 7,851 | ||||||||||
Total equity | 36,322 | 35,152 | ||||||||||
Total liabilities and equity | 57,565 | 43,636 | ||||||||||
The financial statements on pages 224 to 225 and the accompanying note on page 307 were approved by the Board of Directors on 22 February 2017 and signed on its behalf by:
John McFarlane
Group Chairman
James E Staley
Group Chief Executive
Tushar Morzaria
Group Finance Director
| 224 | Barclays PLC and Barclays Bank PLC 2016 Annual Report on Form 20-F |
Statement of changes in equity | ||||||||||||||||||||||||||||
| Notes | | Called up share capital and share premium £m |
| | Other equity instruments £m |
| | Capital redemption reserve £m |
| | Available for sale reserve £m | | | Retained earnings £m | | | Total equity £m | | ||||||||||
Balance as at 1 January 2016 | 21,586 | 5,321 | 394 | – | 7,851 | 35,152 | ||||||||||||||||||||||
Profit after tax and total comprehensive income | – | 457 | – | – | 417 | 874 | ||||||||||||||||||||||
Issue of new ordinary shares | 68 | – | – | – | – | 68 | ||||||||||||||||||||||
Issue of shares under employee share schemes | 188 | – | – | – | – | 188 | ||||||||||||||||||||||
Issue of other equity instruments | – | 1,132 | – | – | – | 1,132 | ||||||||||||||||||||||
Dividends | 12 | – | – | – | – | (757 | ) | (757 | ) | |||||||||||||||||||
Other equity instruments coupons paid | – | (457 | ) | – | – | 91 | (366 | ) | ||||||||||||||||||||
Other | – | – | – | 26 | 5 | 31 | ||||||||||||||||||||||
Balance as at 31 December 2016 | 21,842 | 6,453 | 394 | 26 | 7,607 | 36,322 | ||||||||||||||||||||||
Balance as at 1 January 2015 | 20,809 | 4,326 | 394 | 8,163 | 33,692 | |||||||||||||||||||||||
Profit after tax and total comprehensive income | – | 345 | – | 702 | 1,047 | |||||||||||||||||||||||
Issue of new ordinary shares | 137 | – | – | – | 137 | |||||||||||||||||||||||
Issue of shares under employee share schemes | 640 | – | – | – | 640 | |||||||||||||||||||||||
Issue of other equity instruments | – | 995 | – | – | 995 | |||||||||||||||||||||||
Dividends | 12 | – | – | – | (1,081 | ) | (1,081 | ) | ||||||||||||||||||||
Other equity instruments coupons paid | – | (345 | ) | – | 70 | (275 | ) | |||||||||||||||||||||
Other | – | – | – | (3 | ) | (3 | ) | |||||||||||||||||||||
Balance as at 31 December 2015 | 21,586 | 5,321 | 394 | 7,851 | 35,152 | |||||||||||||||||||||||
Balance as at 1 January 2014 | 19,887 | 2,063 | 394 | 8,398 | 30,742 | |||||||||||||||||||||||
Profit after tax and total comprehensive income | – | 250 | – | 777 | 1,027 | |||||||||||||||||||||||
Issue of new ordinary shares | 150 | – | – | – | 150 | |||||||||||||||||||||||
Issue of shares under employee share schemes | 772 | – | – | – | 772 | |||||||||||||||||||||||
Issue of other equity instruments | – | 2,263 | – | – | 2,263 | |||||||||||||||||||||||
Dividends | 12 | – | – | – | (1,057 | ) | (1,057 | ) | ||||||||||||||||||||
Other equity instruments coupons paid | – | (250 | ) | – | 54 | (196 | ) | |||||||||||||||||||||
Other | – | – | – | (9 | ) | (9 | ) | |||||||||||||||||||||
Balance as at 31 December 2014 | 20,809 | �� | 4,326 | 394 | 8,163 | 33,692 | ||||||||||||||||||||||
Cash flow statement | ||||||||||||||||||||||||||||
For the year ended 31 December | | 2016 £m |
| | 2015 £m |
| | 2014 £m |
| |||||||||||||||||||
Reconciliation of profit before tax to net cash flows from operating activities: |
| |||||||||||||||||||||||||||
Profit before tax | 934 | 1,090 | 1,084 | |||||||||||||||||||||||||
Changes in operating assets and liabilities | 37 | 100 | 734 | |||||||||||||||||||||||||
Othernon-cash movements | 62 | 52 | (43 | ) | ||||||||||||||||||||||||
Corporate income tax (paid)/received | – | (27 | ) | 38 | ||||||||||||||||||||||||
Net cash generated from operating activities | 1,033 | 1,215 | 1,813 | |||||||||||||||||||||||||
Capital contribution to subsidiary | (1,250 | ) | (1,560 | ) | (3,684 | ) | ||||||||||||||||||||||
Net cash used in investing activities | (1,250 | ) | (1,560 | ) | (3,684 | ) | ||||||||||||||||||||||
Issue of shares and other equity instruments | 1,388 | 1,771 | 3,185 | |||||||||||||||||||||||||
Net (increase) in loans and advances to bank subsidiaries of the Parent | (10,942 | ) | (4,973 | ) | (2,866 | ) | ||||||||||||||||||||||
Net increase in deposits and debt securities in issue | 9,314 | 4,052 | 2,056 | |||||||||||||||||||||||||
Proceeds of borrowings and issuance of subordinated debt | 1,671 | 921 | 803 | |||||||||||||||||||||||||
Dividends paid | (757 | ) | (1,081 | ) | (1,057 | ) | ||||||||||||||||||||||
Coupons paid on AT1 instruments | (457 | ) | (345 | ) | (250 | ) | ||||||||||||||||||||||
Net cash generated from financing activities | 217 | 345 | 1,871 | |||||||||||||||||||||||||
Net increase/(decrease) in cash and cash equivalents | – | – | – | |||||||||||||||||||||||||
Cash and cash equivalents at beginning of year | – | – | – | |||||||||||||||||||||||||
Cash and cash equivalents at end of year | – | – | – | |||||||||||||||||||||||||
Net cash generated from operating activities includes: | ||||||||||||||||||||||||||||
Dividends received | 621 | 876 | 821 | |||||||||||||||||||||||||
Interest received/(paid) | 5 | (7 | ) | (6 | ) | |||||||||||||||||||||||
The Parent Company’s principal activity is to hold the investment in its wholly-owned subsidiaries, Barclays Bank PLC and Group Service Company. Dividends received are treated as operating income.
The Company was not exposed at 31 December 2016 or 2015 to significant risks arising from the financial instruments it holds, which comprised loans and advances and other assets which had no market risk or material credit risk.
| Barclays PLC and Barclays Bank PLC 2016 Annual Report on Form 20-F | 225 |
Notes to the financial statements
For the year ended 31 December 2016
This section describes Barclays’ significant policies and critical accounting estimates that relate to the financial statements and notes as a whole. If an accounting policy or a critical accounting estimate relates to a particular note, the accounting policy and/or critical accounting estimate is contained with the relevant note.
1 Significant accounting policies
1. Reporting entity These financial statements are prepared for Barclays PLC and its subsidiaries (the Barclays PLC Group or the Group) under Section 399 of the Companies Act 2006. The Group is a major global financial services provider engaged in retail banking, credit cards, wholesale banking, investment banking, wealth management and investment management services. In addition, individual financial statements have been presented for the holding company.
2. Compliance with International Financial Reporting Standards The consolidated financial statements of the Group, and the individual financial statements of Barclays PLC, have been prepared in accordance with International Financial Reporting Standards (IFRS) and interpretations (IFRICs) issued by the Interpretations Committee, as published by the International Accounting Standards Board (IASB). They are also in accordance with IFRS and IFRIC interpretations endorsed by the European Union. The principal accounting policies applied in the preparation of the consolidated and individual financial statements are set out below, and in the relevant notes to the financial statements. These policies have been consistently applied.
3. Basis of preparation The consolidated and individual financial statements have been prepared under the historical cost convention modified to include the fair valuation of investment property, and particular financial instruments, to the extent required or permitted under IFRS as set out in the relevant accounting policies. They are stated in millions of pounds Sterling (£m), the functional currency of Barclays PLC.
4. Accounting policies Barclays prepares financial statements in accordance with IFRS. The Group’s significant accounting policies relating to specific financial statement items, together with a description of the accounting estimates and judgements that were critical to preparing them, are set out under the relevant notes. Accounting policies that affect the financial statements as a whole are set out below.
(i) Consolidation Barclays applies IFRS 10Consolidated Financial Statements.
The consolidated financial statements combine the financial statements of Barclays PLC and all its subsidiaries. Subsidiaries are entities over which Barclays PLC has control. The Group has control over another entity when the Group has all of the following:
1) power over the relevant activities of the investee, for example through voting or other rights;
2) exposure to, or rights to, variable returns from its involvement with the investee; and
3) the ability to affect those returns through its power over the investee.
The assessment of control is based on the consideration of all facts and circumstances. The Group reassesses whether it controls an investee if facts and circumstances indicate that there are changes to one or more of the three elements of control.
Intra-group transactions and balances are eliminated on consolidation and consistent accounting policies are used throughout the Group for the purposes of the consolidation.
Changes in ownership interests in subsidiaries are accounted for as equity transactions if they occur after control has already been obtained and they do not result in loss of control.
As the consolidated financial statements include partnerships where the Group member is a partner, advantage has been taken of the exemption under Regulation 7 of the Partnership (Accounts) Regulations 2008 with regard to preparing and filing of individual partnership financial statements.
Details of the principal subsidiaries are given in Note 36, and a complete list of all subsidiaries is presented in Note 46.
(ii) Foreign currency translation
The Group applies IAS 21The Effects of Changes in Foreign Exchange Rates. Transactions and balances in foreign currencies are translated into Sterling at the rate ruling on the date of the transaction. Foreign currency balances are translated into Sterling at the period end exchange rates. Exchange gains and losses on such balances are taken to the income statement.
The Group’s foreign operations (including subsidiaries, joint ventures, associates and branches) based mainly outside the UK may have different functional currencies. The functional currency of an operation is the currency of the main economy to which it is exposed.
Prior to consolidation (or equity accounting) the assets and liabilities ofnon-Sterling operations are translated at the closing rate and items of income, expense and other comprehensive income are translated into Sterling at the rate on the date of the transactions. Exchange differences arising on the translation of foreign operations are included in currency translation reserves within equity. These are transferred to the income statement when the Group loses control, joint control or significant influence over the foreign operation or on partial disposal of the operation.
(iii) Financial assets and liabilities The Group applies IAS 39 Financial Instruments: Recognition and Measurement to the recognition, classification and measurement, and derecognition of financial assets and financial liabilities, the impairment of financial assets, and hedge accounting.
|
| 226 | Barclays PLC and Barclays Bank PLC 2016 Annual Report on Form 20-F |
1 Significant accounting policiescontinued
Recognition The Group recognises financial assets and liabilities when it becomes a party to the terms of the contract, which is the trade date or the settlement date.
Classification and measurement Financial assets and liabilities are initially recognised at fair value and may be held at fair value or amortised cost depending on the Group’s intention toward the assets and the nature of the assets and liabilities, mainly determined by their contractual terms.
The accounting policy for each type of financial asset or liability is included within the relevant note for the item. The Group’s policies for determining the fair values of the assets and liabilities are set out in Note 18.
Derecognition The Group derecognises a financial asset, or a portion of a financial asset, from its balance sheet where the contractual rights to cash flows from the asset have expired, or have been transferred, usually by sale, and with them either substantially all the risks and rewards of the asset or significant risks and rewards, along with the unconditional ability to sell or pledge the asset.
Financial liabilities are derecognised when the liability has been settled, has expired or has been extinguished. An exchange of an existing financial liability for a new liability with the same lender on substantially different terms – generally a difference of 10% in the present value of the cash flows or a substantive qualitative amendment – is accounted for as an extinguishment of the original financial liability and the recognition of a new financial liability.
Critical accounting estimates and judgements Transactions in which the Group transfers assets and liabilities, portions of them, or financial risks associated with them can be complex and it may not be obvious whether substantially all of the risks and rewards have been transferred. It is often necessary to perform a quantitative analysis. Such an analysis compares the Group’s exposure to variability in asset cash flows before the transfer with its retained exposure after the transfer.
A cash flow analysis of this nature may require judgement. In particular, it is necessary to estimate the asset’s expected future cash flows as well as potential variability around this expectation. The method of estimating expected future cash flows depends on the nature of the asset, with market and market-implied data used to the greatest extent possible. The potential variability around this expectation is typically determined by stressing underlying parameters to create reasonable alternative upside and downside scenarios. Probabilities are then assigned to each scenario. Stressed parameters may include default rates, loss severity, or prepayment rates.
(iv) Issued debt and equity instruments
The Group applies IAS 32Financial Instruments: Presentation, to determine whether funding is either a financial liability (debt) or equity.
Issued financial instruments or their components are classified as liabilities if the contractual arrangement results in the Group having a present obligation to either deliver cash or another financial asset, or a variable number of equity shares, to the holder of the instrument. If this is not the case, the instrument is generally an equity instrument and the proceeds included in equity, net of transaction costs. Dividends and other returns to equity holders are recognised when paid or declared by the members at the AGM and treated as a deduction from equity.
Where issued financial instruments contain both liability and equity components, these are accounted for separately. The fair value of the debt is estimated first and the balance of the proceeds is included within equity.
New and amended standards and interpretations
The accounting policies adopted are consistent with those of the previous financial year. There were no new or amended standards or interpretations that resulted in a change in accounting policy.
Future accounting developments
There have been and are expected to be a number of significant changes to the Group’s financial reporting after 2016 as a result of amended or new accounting standards that have been or will be issued by the IASB. The most significant of these are as follows:
IFRS 9 – Financial instruments
IFRS 9 Financial Instruments which will replace IAS 39 Financial Instruments: Recognition and Measurement is effective for periods beginning on or after 1 January 2018 and was endorsed by the EU in November 2016. IFRS 9, in particular the impairment requirements, will lead to significant changes in the accounting for financial instruments. Barclays does not expect to restate comparatives on initial application of IFRS 9 on 1 January 2018 but will provide detailed transitional disclosures in accordance with the amended requirements of IFRS 7.
Impairment
IFRS 9 introduces a revised impairment model which will require entities to recognise expected credit losses based on unbiased forward-looking information. This replaces the existing IAS 39 incurred loss model which only recognises impairment if there is objective evidence that a loss is already incurred and would measure the loss at the most probable outcome. The IFRS 9 impairment model will be applicable to all financial assets at amortised cost, lease receivables, debt financial assets at fair value through other comprehensive income, loan commitments and financial guarantee contracts. This contrasts to the IAS 39 impairment model which is not applicable to loan commitments and financial guarantee contracts (these were covered by IAS 37). In addition, IAS 39 requires the impairment of available for sale debt to be based on the fair value loss rather than estimated future cashflows as for amortised cost assets. Intercompany exposures, including loan commitments and financial guarantee contracts, are also in scope in the stand alone reporting entity accounts.
|
| Barclays PLC and Barclays Bank PLC 2016 Annual Report on Form 20-F | 227 |
Notes to the financial statements
For the year ended 31 December 2016
1 Significant accounting policiescontinued
The measurement of expected loss will involve increased complexity and judgement including estimation of probabilities of defaults, loss given default, a range of unbiased future economic scenarios, estimation of expected lives, estimation of exposures at default and assessing increases in credit risk.
It is expected to have a material financial impact and impairment charges will tend to be more volatile. Impairment will also be recognised earlier and the amounts will be higher. Unsecured products with longer expected lives, such as revolving credit cards, are expected to be most impacted. It will not be practical to disclose reliable financial impact estimates until the implementation programme and validation and testing is further advanced, which will be no later than the Barclays PLC Annual Report 2017.
Based on the current requirements of CRD IV, the expected increase in the accounting impairment provision would reduce CET1 capital but the impact would be partially mitigated by the ‘excess of expected losses over impairment’ included in the CET1 calculation as discussed on page 156. However, the Basel Committee on Banking Supervision (BCBS) is currently considering amending the capital rules as a result of IFRS 9 and is considering transitional rules which may mitigate or spread capital impacts from 1 January 2018 as well as permanent changes to the capital requirements. In addition, as part of its review of the Capital Requirements Regulation (CRR) the European Commission has proposed that the capital impact of IFRS 9 isphased-in over a five-year period. IFRS 9 is considered in the Group capital planning.
Key concepts and management judgements
The impairment requirements are complex and require management judgements, estimates and assumptions. Key concepts and management judgements will continue to be refined during the 2017 parallel run and as any further authoritative guidance is issued, and include:
☒ Determining a significant increase in credit risk since initial recognition
IFRS 9 requires the recognition of 12 month expected credit losses (the expected credit losses from default events that are expected within 12 months of reporting date) if credit risk has not significantly increased since initial recognition (stage 1), and lifetime expected credit losses for financial instruments for which the credit risk has increased significantly since initial recognition or which are credit impaired. Barclays expects to estimate when a significant increase in credit risk has occurred based on quantitative and qualitative assessments. Quantitative assessments will be based on changes in and/or absolute thresholds for weighted average cumulative lifetime probabilities of default, determined for each portfolio. Qualitative drivers of a significant increase in credit risk are expected to include exposures determined to be higher risk (by credit risk) and subject to closer credit risk monitoring. Exposures which are more than 30 days past due will be used as a backstop rather than a primary driver. Exposures will move back to stage 1 once they no longer meet the criteria for a significant increase in credit risk and when any cure criteria used for credit risk management are met. This is subject to a minimum of 12 months’ full performance including timely receipt of all payments over that period, for exposures that have been restructured or granted forbearance or concessions. Barclays does not expect to rely primarily on the low credit risk exemption which would assume facilities of investment grade are not significantly deteriorated. Determining the probability of default at initial recognition is expected to require management estimates, in particular for exposures issued before the effective date of IFRS 9. For certain revolving facilities such as credit cards and overdrafts, this is expected to be when the facility was first entered into which could have been significantly in the past. Exposures modified due to financial difficulty do not generally result in a substantial modification or derecognition and therefore the probability of default at initial recognition is not reset for these exposures.
☒ Forward-looking information
Credit losses are the expected cash shortfalls from what is contractually due over the expected life of the financial instrument, discounted at the original effective interest rate. Expected credit losses are the unbiased probability-weighted credit losses determined by evaluating a range of possible outcomes and considering future economic conditions. When there is anon-linear relationship between forward-looking economic scenarios and their associated credit losses, a range of forward-looking economic scenarios, currently expected to be a minimum of five, will be considered to ensure a sufficient unbiased representative sample of the complete distribution is included in determining the expected loss. Stress testing methodologies will be leveraged for forecasting economic scenarios for IFRS 9 purposes.
☒ Definition of default and credit impaired assets
The definition of default for the purpose of determining expected credit losses is expected to be aligned to the Regulatory Capital CRR Article 178 definition of default, which considers indicators that the debtor is unlikely to pay, includes exposures in forbearance and is no later than when the exposure is more than 90 days past due or 180 days past due in the case of UK mortgages. When exposures are identified as credit impaired or purchased or originated as such, IFRS 9 requires separate disclosure and interest income to be presented on a net basis rather than gross.
Credit impairment is expected to occur when the exposure has defaulted which is also anticipated to align to when an exposure is identified as individually impaired under the incurred loss model of IAS 39.Write-off polices are not expected to change from IAS 39.
☒ Expected life
Lifetime expected credit losses must be measured over the expected life. This is restricted to the maximum contractual life and takes into account expected prepayment, extension, call and similar options, except for certain revolver financial instruments that include both a drawn and an undrawn component where the entity’s contractual ability to demand repayment and cancel the undrawn commitment does not limit the entity’s exposure to credit losses to the contractual notice period, such as credit cards and overdrafts. The expected life for these revolver facilities is expected to be behavioral life. Potential future modifications of contracts are not taken into account when determining the expected life or exposure at default until they occur.
☒ Modelling techniques
Expected credit losses (ECL) are calculated by multiplying three main components, being the probability of default (PD), loss given default (LGD) and the exposure at default (EAD). The Basel ECL calculations are leveraged for IFRS 9 modelling but adjusted for key differences which include:
– BCBS requires 12 month through the economic cycle losses whereas IFRS 9 requires 12 month or lifetime point-in-time losses based on conditions at the reporting date and multiple forecasts of the future economic conditions over the expected lives; and
– IFRS 9 models do not include some of the conservative BCBS model floors and downturn assessments and require discounting to the reporting date at the original effective interest rate rather than using the cost of capital to the date of default.
Management adjustments will be made to modelled output to account for situations where known or expected risk factors and information have not been considered in the modelling process, for example forecast economic scenarios for uncertain political events.
|
| 228 | Barclays PLC and Barclays Bank PLC 2016 Annual Report on Form 20-F |
1 Significant accounting policiescontinued
Classification and measurement
IFRS 9 will require financial assets to be classified on the basis of two criteria:
1) The business model within which financial assets are managed, and;
2) Their contractual cash flow characteristics (whether the cash flows represent ‘solely payments of principal and interest’).
Financial assets will be measured at amortised cost if they are held within a business model whose objective is to hold financial assets in order to collect contractual cash flows, and their contractual cash flows represent solely payments of principal and interest.
Financial assets will be measured at fair value through other comprehensive income if they are held within a business model whose objective is achieved by both collecting contractual cash flows and selling financial assets, and their contractual cash flows represent solely payments of principal and interest.
Other financial assets are measured at fair value through profit and loss. There is an option to make an irrevocable election fornon-traded equity investments to be measured at fair value through other comprehensive income, in which case dividends are recognised in profit or loss, but gains or losses are not reclassified to profit or loss upon derecognition, and impairment is not recognised in the income statement.
The accounting for financial liabilities is largely unchanged, except for financial liabilities designated at fair value through profit and loss. Gains and losses on such financial liabilities arising from changes in Barclays’ own credit risk will be presented in other comprehensive income rather than in profit and loss. There is no subsequent reclassification of realised gains or losses on own credit to profit and loss statement.
Barclays’ Classification and Measurement implementation programme is in progress. An assessment of potential changes to financial assets based on 30 June 2016 balances is being conducted, including an assessment of business models across various portfolios, and a review of contractual cash flow features for material financial assets.
There are some classification changes expected but they are not significant from a Group perspective. The notable potential exception relates to loans with symmetric make whole or fair value prepayment options, which are currently subject to interpretation discussions at IFRS Interpretations Committee (IFRIC) and IASB as to whether their contractual cash flows represent solely payments of principal and interest, or whether they must be measured at fair value through profit or loss in their entirety. Such prepayment features are present in some fixed rate corporate and investment bank loans. The carrying value of such loans is expected to be significant on initial application of IFRS 9. If such loans are concluded to be measured at fair value through profit or loss the potential impact on opening equity and profit or loss would depend on their fair values compared to their carrying amounts, and the future changes in fair value.
Business models are determined on initial application and this may differ from the model at 30 June 2016 for certain portfolios, and contractual cash flow characteristics assessed as at 30 June 2016 may not be representative of the population on transition.
The focus of the project during 2017 will be on finalising processes, governance and controls in preparation for initial application in 2018. IFRS 9 is applied retrospectively, although comparatives are not restated, with adjustments arising from classification and measurement changes recognised in opening equity.
Hedge accounting
IFRS 9 contains revised requirements on hedge accounting, which are more closely aligned with an entity’s risk management strategies and risk management objectives. The new rules would replace the current quantitative effectiveness test with a simpler version, and requires that an economic relationship exist between the hedged item and the hedging instrument. Under the new rules, voluntary hedgede-designations would not be allowed.
Adoption of the IFRS 9 hedge accounting requirements is optional, and certain aspects of IAS 39, being the portfolio fair value hedge for interest rate risk, would continue to be available for entities (while applying IFRS 9 to the remainder of the entity’s hedge accounting relationships) until the IASB completes its accounting for dynamic risk management project.
Based on analysis performed, Barclays expects to continue applying IAS 39 hedge accounting, although it will implement the amended IFRS 7 hedge accounting disclosure requirements.
Own credit
Barclays has applied the option in IFRS 9 to recognise changes in own credit in other comprehensive income from 1 January 2017. This will have no effect on net assets, and any changes due to own credit in prior periods have not been restated. Any realised and unrealised amounts recognised in other comprehensive income will not be reclassified to the income statement in future periods.
|
| Barclays PLC and Barclays Bank PLC 2016 Annual Report on Form 20-F | 229 |
Notes to the financial statements
For the year ended 31 December 2016
1 Significant accounting policiescontinued
IFRS 15 – Revenue from Contracts with Customers
In 2014, the IASB issued IFRS 15Revenue from Contracts with Customers which will replace IAS 18Revenue and IAS 11 Construction Contracts. It applies to all contracts with customers except leases, financial instruments and insurance contracts. The standard establishes a more systematic approach for revenue measurement and recognition by introducing a five-step model governing revenue recognition. The five-step model includes:
1) identifying the contract with the customer;
2) identifying each of the performance obligations included in the contract;
3) determining the amount of consideration in the contract;
4) allocating the consideration to each of the identified performance obligations, and;
5) recognising revenue as each performance obligation is satisfied.
In April 2016, the IASB issued clarifying amendments to IFRS 15 which provide additional application guidance but did not change the underlying principles of the standard. The standard was endorsed by the EU in September 2016. Adoption of the standard on 1 January 2018 is not expected to have a significant impact. Current project implementation efforts are primarily focused on preparing and sourcing information necessary to comply with the enhanced disclosure requirements introduced by IFRS 15.
IFRS 16 – Leases
In January 2016, the IASB issued IFRS 16 Leases, which will replace IAS 17 Leases. IFRS 16 will apply to all leases with the exception of licenses of intellectual property, rights held by licensing agreement within the scope of IAS 38Intangible Assets, service concession arrangements, leases of biological assets within the scope of IAS 41Agriculture, and leases of minerals, oil, natural gas and similarnon-regenerative resources. IFRS 16 will not result in a significant change to lessor accounting; however for lessee accounting there will no longer be a distinction between operating and finance leases. Instead lessees will be required to recognise both a right of use asset and lease liability on balance sheet for all leases. As a result Barclays will observe an increase in both assets and liabilities for transactions currently accounted for as operating leases as at 1 January 2019 (the effective date of IFRS 16). A scope exemption will apply toshort-term and low-value leases. Current project implementation efforts are focused on preparing and sourcing information necessary to comply with IFRS 16 requirements. The standard has not yet been endorsed by the EU.
Critical accounting estimates and judgements
The preparation of financial statements in accordance with IFRS requires the use of estimates. It also requires management to exercise judgement in applying the accounting policies. The key areas involving a higher degree of judgement or complexity, or areas where assumptions are significant to the consolidated and individual financial statements are highlighted under the relevant note. Critical accounting estimates and judgements are disclosed in:
| ||||||
| Page | Page | |||||
Credit impairment charges and other provisions | 233 | Fair value of financial instruments | 246 | |||
Income taxes | 236 | Provisions | 270 | |||
Available for sale assets | 245 | Retirement benefit obligations | 288 | |||
Derecognition of financial assets | 299 | |||||
Other disclosures
To improve transparency and ease of reference, by concentrating related information in one place, and to reduce duplication, certain disclosures required under IFRS have been included within the Risk management section as follows:
☒ Segmental reporting on pages 197 to 210; ☒ Credit risk management, on pages 101 and 102 including exposures to selected countries; ☒ Market risk, on page 103; ☒ Funding risk – liquidity, on pages 105 and 106 ; and ☒ Funding risk – capital, on pages 106 and 107.
These are covered by the Audit opinion, where referenced as audited, included on page 218.
The accompanying notes on pages 226 to 316 form an integral part of these financial statements.
| ||||||
| 230 | Barclays PLC and Barclays Bank PLC 2016 Annual Report on Form 20-F |
Notes to the financial statements
Performance/return
The notes included in this section focus on the results and performance of the Group. Information on the income generated, expenditure incurred, segmental performance, tax, earnings per share and dividends are included here.
|
2 Segmental reporting
Presentation of segmental reporting The Group’s segmental reporting is presented in accordance with IFRS 8Operating Segments. Operating segments are reported in a manner consistent with the internal reporting provided to the Executive Committee, which is responsible for allocating resources and assessing performance of the operating segments, and has been identified as the chief operating decision maker. All transactions between business segments are conducted on an arm’s length basis, with intra-segment revenue and costs being eliminated in Head Office. Segmental income and expense excludes BAGL as it meets the requirement of a discontinued operation. Income and expenses directly associated with each segment are included in determining business segment performance.
|
During 2016 the Group’s activities have beenre-segmented into Barclays UK and Barclays International in preparation for regulatory ring fencing requirements. In addition Barclays’ interest in Barclays Africa Group Limited wasre-classified as a discontinued operation and theNon-Core segment has been enlarged. Comparatives have been updated to reflect there-segmentation.
An analysis of the Group’s performance by business segment and income by geographic segment is included on pages 197 and 198. Further details on each of the segments are provided on pages 199 to 210.
3 Net interest income
Accounting for interest income and expense The Group applies IAS 39Financial Instruments: Recognition and Measurement. Interest income on loans and advances at amortised cost, financial investments debt securities, and interest expense on financial liabilities held at amortised cost, are calculated using the effective interest method which allocates interest, and direct and incremental fees and costs, over the expected lives of the assets and liabilities.
The effective interest method requires the Group to estimate future cash flows, in some cases based on its experience of customers’ behaviour, considering all contractual terms of the financial instrument, as well as the expected lives of the assets and liabilities.
Barclays incurs certain costs to originate credit card balances with the most significant beingco-brand partner fees. To the extent these costs are attributed to revolving customer balances they are capitalised and subsequently included within the calculation of the effective interest rate. They are amortised to interest income over the period of expected repayment of the originated balance. Costs attributed to transacting customer balances are recorded within fee and commission expense when incurred. There are no other individual estimates involved in the calculation of effective interest rates that are material to the results or financial position.
|
| | 2016 £m |
| | 2015 £m |
| | 2014 £m |
| ||||
Cash and balances with central banks | 186 | 157 | 186 | |||||||||
Financial investments | 740 | 698 | 803 | |||||||||
Loans and advances to banks | 600 | 487 | 376 | |||||||||
Loans and advances to customers | 12,958 | 12,512 | 12,768 | |||||||||
Other | 57 | 99 | 61 | |||||||||
Interest incomea | 14,541 | 13,953 | 14,194 | |||||||||
Deposits from banks | (265 | ) | (128 | ) | (133 | ) | ||||||
Customer accounts | (1,514 | ) | (1,406 | ) | (2,205 | ) | ||||||
Debt securities in issue | (990 | ) | (553 | ) | (691 | ) | ||||||
Subordinated liabilities | (1,104 | ) | (1,015 | ) | (1,006 | ) | ||||||
Other | (131 | ) | (243 | ) | (73 | ) | ||||||
Interest expensea | (4,004 | ) | (3,345 | ) | (4,108 | ) | ||||||
Net interest income | 10,537 | 10,608 | 10,086 |
Costs to originate credit card balances of £480m (2015: £368m) have been amortised to interest during the period.
Interest income includes £75m (2015: £91m; 2014: £117m) accrued on impaired loans.
Other interest income principally includes interest income relating to reverse repurchase agreements. Similarly, other interest expense principally includes interest expense relating to repurchase agreements.
Included in net interest income is hedge ineffectiveness as detailed in Note 15.
2016
Net interest income remained stable at £10,537m (2015: £10,608m), driven by increased expenses from debt securities in issue partially offset by volume growth and margin improvement within Barclays International cards portfolio.
2015
Net interest income increased by £522m (5%) to £10,608m, primarily driven by lower interest expense from customer accounts.
Note
| a | Both interest income and interest expense for 2015 and 2014 have been adjusted by £442m and £605m respectively in order to better align the effect of hedge accounting relationships with the related hedged items. The following categories were restated: financial investments by £(545)m (2014: £(637)m), loans and advances to customers by £987m (2014: £1,242m). Customer accounts by £(1,783)m (2014: £(2,016)m), debt securities in issue by £784m (2014: £859m) and subordinated liabilities by £557m (2014: £552m). |
| Barclays PLC and Barclays Bank PLC 2016 Annual Report on Form 20-F | 231 |
Notes to the financial statements
Performance/return
4 Net fee and commission income
Accounting for net fee and commission income The Group applies IAS 18Revenue. Fees and commissions charged for services provided or received by the Group are recognised as the services are provided, for example on completion of the underlying transaction.
|
| | 2016 £m |
| | 2015 £m |
| | 2014 £m |
| ||||
Fee and commission income | ||||||||||||
Banking, investment management and credit related fees and commissions | 8,452 | 8,340 | 8,483 | |||||||||
Foreign exchange commission | 118 | 130 | 139 | |||||||||
Fee and commission income | 8,570 | 8,470 | 8,622 | |||||||||
Fee and commission expense | (1,802 | ) | (1,611 | ) | (1,500 | ) | ||||||
Net fee and commission income | 6,768 | 6,859 | 7,122 |
2016
Net fee and commission income decreased £91m to £6,768m. This was primarily driven by an increase in expenses in Barclays International due to higher customer reward costs and lower fees income inNon-Core due to the sale of the US and Asia wealth businesses and the closure of the equities traded securities business as well as a decrease within Barclays UK due to lower interchange fees on account of EU Interchange regulation. These movements were partially offset by an increase in income in Barclays International driven by growth in the cards portfolio and an increase in investment banking business due to higher fees income from the US loans/bonds and investment grade products coupled with higher financial advisory fees.
2015
Net fee and commission income decreased £263m to £6,859m. This was primarily driven by lower income inNon-Core due to the sale of the US Wealth and Spanish retail business and the Barclays UK business due to the launch of the revised overdraft proposition in mid 2014, which recognises the majority of the overdraft income as net interest income as opposed to fee income. The decrease in Barclays International is driven by lower equity underwriting fees partially offset by higher financial advisory and debt underwriting fees and increase in Barclaycard International, driven by growth in payment volumes.
5 Net trading income
Accounting for net trading income
In accordance with IAS 39, trading positions are held at fair value, and the resulting gains and losses are included in the income statement, together with interest and dividends arising from long and short positions and funding costs relating to trading activities.
Income arises from both the sale and purchase of trading positions, margins which are achieved through market-making and customer business and from changes in fair value caused by movements in interest and exchange rates, equity prices and other market variables.
Own credit gains/losses arise from the fair valuation of financial liabilities designated at fair value through profit or loss. See Note 17 Financial liabilities designated at fair value.
|
| | 2016 £m | | | 2015 £m | | | 2014 £m | | ||||
Trading income | 2,803 | 2,996 | 3,052 | |||||||||
Own credit (losses)/gains | (35) | 430 | 34 | |||||||||
Net trading income | 2,768 | 3,426 | 3,086 |
Included within net trading income were gains of £31m (2015: £992m gain; 2014: £1,051m loss) on financial assets designated at fair value and gains of £346m (2015: £187m loss; 2014: £65m loss) on financial liabilities designated at fair value.
2016
Net trading income decreased by 19% to £2,768m, primarily reflecting a £465m movement in own credit as the credit spreads on Barclays’ issued debt were relatively flat as compared to prior year. Trading income decreased by £193m, mainly driven by the continued disposal and running down of certain businesses and fair value reduction on the ESHLA portfolio withinNon-Core. This was partially offset by higher contributions from Fixed Income businesses that benefited from market volatility and higher client volumes during the year.
2015
Net trading income increased by 11% to £3,426m, primarily reflecting a £396m favourable variance in own credit due to widening of credit spreads on Barclays’ issued debt. Trading income decreased by £56m, mainly driven by the continued disposal and running down of certain businesses and fair value movements on the ESHLA portfolio withinNon-Core. This was partially offset by increases in various investment banking businesses within Barclays International driven by higher volatility and trading activity during the year.
| 232 | Barclays PLC and Barclays Bank PLC 2016 Annual Report on Form 20-F |
6 Net investment income
Accounting for net investment income Dividends are recognised when the right to receive the dividend has been established. Other accounting policies relating to net investment income are set out in Note 14 Financial assets designated at fair value and Note 16 Financial Investments.
|
| | 2016 £m | | | 2015 £m | | | 2014 £m | | ||||
| Net gain from disposal of available for sale investments | 912 | 385 | 622 | |||||||||
| Dividend income | 8 | 8 | 9 | |||||||||
| Net gain from financial instruments designated at fair value | 158 | 193 | 203 | |||||||||
| Other investment income | 246 | 511 | 475 | |||||||||
| Net investment income | 1,324 | 1,097 | 1,309 |
2016
Net investment income increased by 21% to £1,324m. This was largely driven by a gain of £615m on disposal of Barclays’ share of Visa Europe Limited and gains on buy-back of senior and subordinated debt issuances. These increases were partially offset by non-repeat of gains of £496m recognised in 2015 in other investment income due to the final and full legal settlement in respect of US Lehman acquisition assets.
2015
Net investment income decreased by 16% to £1,097m. This was largely driven by lower gains and fewer disposals of available for sale investments due to unfavourable market conditions. During the year a gain of £496m (2014: £461m) was recognised in other investment income due to the final and full legal settlement in respect of US Lehman acquisition assets.
7 Credit impairment charges and other provisions
Accounting for the impairment of financial assets Loans and other assets held at amortised cost In accordance with IAS 39, the Group assesses at each balance sheet date whether there is objective evidence that loan assets or available for sale financial investments (debt or equity) will not be recovered in full and, wherever necessary, recognises an impairment loss in the income statement.
An impairment loss is recognised if there is objective evidence of impairment as a result of events that have occurred and these have adversely impacted the estimated future cash flows from the assets. These events include:
☒ becoming aware of significant financial difficulty of the issuer or obligor
☒ a breach of contract, such as a default or delinquency in interest or principal payments
☒ the Group, for economic or legal reasons relating to the borrower’s financial difficulty, grants a concession that it would not otherwise consider
☒ it becomes probable that the borrower will enter bankruptcy or other financial reorganisation
☒ the disappearance of an active market for that financial asset because of financial difficulties and
☒ observable data at a portfolio level indicating that there is a measurable decrease in the estimated future cash flows, although the decrease cannot yet be ascribed to individual financial assets in the portfolio – such as adverse changes in the payment status of borrowers in the portfolio or national or local economic conditions that correlate with defaults on the assets in the portfolio.
Impairment assessments are conducted individually for significant assets, which comprise all wholesale customer loans and larger retail business loans and collectively for smaller loans and for portfolio level risks, such as country or sectoral risks. For the purposes of the assessment, loans with similar credit risk characteristics are grouped together – generally on the basis of their product type, industry, geographical location, collateral type, past due status and other factors relevant to the evaluation of expected future cash flows.
The impairment assessment includes estimating the expected future cash flows from the asset or the group of assets, which are then discounted using the original effective interest rate calculated for the asset. If this is lower than the carrying value of the asset or the portfolio, an impairment allowance is raised.
If, in a subsequent period, the amount of the impairment loss decreases, and the decrease can be related objectively to an event occurring after the impairment was recognised, the previously recognised impairment loss is reversed by adjusting the allowance account. The amount of the reversal is recognised in the income statement.
Following impairment, interest income continues to be recognised at the original effective interest rate on the restated carrying amount, representing the unwind of the discount of the expected cash flows, including the principal due onnon-accrual loans.
Uncollectable loans are written off against the related allowance for loan impairment on completion of the Group’s internal processes when all reasonably expected recoverable amounts have been collected. Subsequent recoveries of amounts previously written off are credited to the income statement.
|
| Barclays PLC and Barclays Bank PLC 2016 Annual Report on Form 20-F | 233 |
Notes to the financial statements
Performance/return
7 Credit impairment charges and other provisionscontinued
Available for sale financial assets Impairment of available for sale debt instruments Debt instruments are assessed for impairment in the same way as loans. If impairment is deemed to have occurred, the cumulative decline in the fair value of the instrument that has previously been recognised in the available for sale reserve is removed from reserves and recognised in the income statement. This may be reversed if there is evidence that the circumstances of the issuer have improved.
Impairment of available for sale equity instruments Where there has been a prolonged or significant decline in the fair value of an equity instrument below its acquisition cost, it is deemed to be impaired. The cumulative net loss that has been previously recognised directly in the available for sale reserve is removed from reserves and recognised in the income statement.
Increases in the fair value of equity instruments after impairment are recognised directly in other comprehensive income. Further declines in the fair value of equity instruments after impairment are recognised in the income statement.
Critical accounting estimates and judgements The calculation of impairment involves the use of judgement, based on the Group’s experience of managing credit risk.
Within the retail and small businesses portfolios, which comprise large numbers of small homogeneous assets with similar risk characteristics where credit scoring techniques are generally used, statistical techniques are used to calculate impairment allowances on a portfolio basis, based on historical recovery rates and assumed emergence periods. These statistical analyses use as primary inputs the extent to which accounts in the portfolio are in arrears and historical information on the eventual losses encountered from such delinquent portfolios. There are many such models in use, each tailored to a product, line of business or customer category. Judgement and knowledge is needed in selecting the statistical methods to use when the models are developed or revised. The impairment allowance reflected in the financial statements for these portfolios is therefore considered to be reasonable and supportable. The impairment charge reflected in the income statement for retail portfolios is £2,053m (2015: £1,535m; 2014: £1,549m) and amounts to 87% (2015: 88%; 2014: 83%) of the total impairment charge on loans and advances.
For individually significant assets, impairment allowances are calculated on an individual basis and all relevant considerations that have a bearing on the expected future cash flows are taken into account (for example, the business prospects for the customer, the realisable value of collateral, the Group’s position relative to other claimants, the reliability of customer information and the likely cost and duration of thework-out process). The level of the impairment allowance is the difference between the value of the discounted expected future cash flows (discounted at the loan’s original effective interest rate), and its carrying amount. Subjective judgements are made in the calculation of future cash flows. Furthermore, judgements change with time as new information becomes available or aswork-out strategies evolve, resulting in frequent revisions to the impairment allowance as individual decisions are taken. Changes in these estimates would result in a change in the allowances and have a direct impact on the impairment charge. The impairment charge reflected in the financial statements in relation to wholesale portfolios is £299m (2015: £209m; 2014: £308m) and amounts to 13% (2015: 12%; 2014: 17%) of the total impairment charge on loans and advances. Further information on impairment allowances and related credit information is set out within the Risk review.
|
| | 2016 £m | | | 2015 £m | | | 2014 £m | | ||||
New and increased impairment allowances | 3,259 | 2,641 | 2,809 | |||||||||
Releases | (551 | ) | (535 | ) | (791 | ) | ||||||
Recoveries | (365 | ) | (350 | ) | (166 | ) | ||||||
Impairment charges on loans and advances | 2,343 | 1,756 | 1,852 | |||||||||
Provision charges/(releases) for undrawn contractually committed facilities and guarantees provided | 9 | (12 | ) | 5 | ||||||||
Loan impairment | 2,352 | 1,744 | 1,857 | |||||||||
Available for sale investment | 21 | 18 | (31 | ) | ||||||||
Reverse repurchase agreements | – | – | (5 | ) | ||||||||
Credit impairment charges and other provisions | 2,373 | 1,762 | 1,821 |
2016
Loan impairment increased by 35% to £2,352m, primarily due to increased charges following the management review of impairment modelling for UK and US cards portfolios and the impairment of a number of single name exposures.
2015
Loan impairment decreased by 6% to £1,744m, reflecting lower impairment in Barclays UK andNon-Core, partially offset by increased charges in Barclays International.
| 234 | Barclays PLC and Barclays Bank PLC 2016 Annual Report on Form 20-F |
8 Operating expenses
Accounting for staff costs The Group applies IAS 19Employee benefits in its accounting for most of the components of staff costs.
Short-term employee benefits – salaries, accrued performance costs and social security are recognised over the period in which the employees provide the services to which the payments relate.
Performance costs – recognised to the extent that the Group has a present obligation to its employees that can be measured reliably and are recognised over the period of service that employees are required to work to qualify for the services.
Deferred cash and share awards are made to employees to incentivise performance over the period employees provide services. To receive payment under an award, employees must provide service over the vesting period. The period over which the expense for deferred cash and share awards is recognised is based upon the period employees consider their services contribute to the awards. For past awards, the Group considers that it is appropriate to recognise the awards over the period from the date of grant to the date that the awards vest. In relation to awards granted in 2017, the Group, taking into account the changing employee understanding surrounding those awards, considered it appropriate for expense to be recognised over four years including the financial year prior to the grant date. The impact in 2016 of the 2017 grant is an expense of £150m including social security costs.
The accounting policies for share-based payments, and pensions and other post-retirement benefits are included in Note 34 and Note 35 respectively.
|
| | 2016 £m |
| | 2015 £m |
| | 2014 £m |
| ||||
Infrastructure costs | ||||||||||||
Property and equipment | 1,180 | 1,082 | 1,281 | |||||||||
Depreciation of property, plant and equipment | 492 | 475 | 495 | |||||||||
Operating lease rentals | 561 | 411 | 512 | |||||||||
Amortisation of intangible assets | 670 | 570 | 454 | |||||||||
Impairment of property, equipment and intangible assets | 95 | 150 | 153 | |||||||||
Gain on property disposals | – | 3 | – | |||||||||
Total infrastructure costs | 2,998 | 2,691 | 2,895 | |||||||||
Administration and general costs | ||||||||||||
Consultancy, legal and professional fees | 1,105 | 1,078 | 997 | |||||||||
Subscriptions, publications, stationery and communications | 644 | 678 | 756 | |||||||||
Marketing, advertising and sponsorship | 435 | 451 | 470 | |||||||||
Travel and accommodation | 136 | 188 | 185 | |||||||||
UK bank levy | 410 | 425 | 418 | |||||||||
Goodwill impairment | – | 102 | – | |||||||||
Other administration and general expenses | 187 | 61 | 243 | |||||||||
Total administration and general costs | 2,917 | 2,983 | 3,069 | |||||||||
Staff costs | 9,423 | 8,853 | 9,860 | |||||||||
Provision for UK customer redress | 1,000 | 2,772 | 1,110 | |||||||||
Provision for ongoing investigations and litigation including Foreign Exchange | – | 1,237 | 1,250 | |||||||||
Operating expenses | 16,338 | 18,536 | 18,184 |
2016
Operating expenses decreased by 12% to £16,338m (2015: £18,536m) primarily due to lower PPI provisions and lower litigation provisions in 2016. This is partially offset by an increase in staff costs primarily due to £395m of additional charges relating to 2016 compensation costs.
2015
Operating expenses increased by 2% to £18,536m attributable to an increase in provisions for UK customer redress including PPI and an increase in impairment of goodwill partially offset by a decrease in staff costs (includes a gain on retirement benefits, refer to Note 35, of £429m) and infrastructure costs reflecting savings from strategic cost programmes.
9 Profit/(loss) on disposal of subsidiaries, associates and joint ventures
During the year, the gain on disposal of subsidiaries, associates and joint ventures was £420m (2015: loss of £637m; 2014: loss of £473m), principally relating to the sale of Barclays Risk Analytics and Index Solutions, the disposal of the Southern European card business and the sale of the private banking and wealth management services conducted through the Hong Kong and Singapore branches. These gains were partially offset with the IFRS 5 charge on an impending disposal of the French business. Please refer to Note 44Non-current assets held for sale and associated liabilities for further detail.
| Barclays PLC and Barclays Bank PLC 2016 Annual Report on Form 20-F | 235 |
Notes to the financial statements
Performance/return
10 Tax
Accounting for income taxes Barclays applies IAS 12Income Taxes in accounting for taxes on income. Income tax payable on taxable profits (Current Tax) is recognised as an expense in the period in which the profits arise. Withholding taxes are also treated as income taxes. Income tax recoverable on tax allowable losses is recognised as a current tax asset only to the extent that it is regarded as recoverable by offset against taxable profits arising in the current or prior period. Current tax is measured using tax rates and tax laws that have been enacted or substantively enacted at the balance sheet date.
Deferred tax is provided in full, using the liability method, on temporary differences arising from the differences between the tax bases of assets and liabilities and their carrying amounts in the consolidated financial statements. Deferred tax is determined using tax rates and legislation enacted or substantively enacted by the balance sheet date which are expected to apply when the deferred tax asset is realised or the deferred tax liability is settled. Deferred tax assets and liabilities are only offset when there is both a legal right toset-off and an intention to settle on a net basis.
The Group considers an uncertain tax position to exist when it considers that ultimately, in the future, the amount of profit subject to tax may be greater than the amount initially reflected in the Group’s tax returns. The Group accounts for provisions in respect of uncertain tax positions in two different ways.
A current tax provision is recognised when it is considered probable that the outcome of a review by a tax authority of an uncertain tax position will alter the amount of cash tax due to, or from, a tax authority in the future. From recognition, the current tax provision is then measured at the amount the Group ultimately expects to pay the tax authority to resolve the position.
Deferred tax provisions are adjustments made to the carrying value of deferred tax assets in respect of uncertain tax positions. A deferred tax provision is recognised when it is considered probable that the outcome of a review by a tax authority of an uncertain tax position will result in a reduction in the carrying value of the deferred tax asset. From recognition of a provision, measurement of the underlying deferred tax asset is adjusted to take into account the expected impact of resolving the uncertain tax position on the loss or temporary difference giving rise to the deferred tax asset.
The approach taken to measurement takes account of whether the uncertain tax position is a discrete position that will be reviewed by the tax authority in isolation from any other position, or one of a number of issues which are expected to be reviewed together concurrently and resolved simultaneously with a tax authority. Barclays’ measurement of provisions is based upon its best estimate of the additional profit that will become subject to tax. For a discrete position, consideration is given only to the merits of that position. Where a number of issues are expected to be reviewed and resolved together, Barclays will take into account not only the merits of its position in respect of each particular issue but also the overall level of provision relative to the aggregate of the uncertain tax positions across all the issues that are expected to be resolved at the same time. In addition, in assessing provision levels, it is assumed that tax authorities will review uncertain tax positions and that all facts will be fully and transparently disclosed.
|
| | 2016 £m |
| | 2015 £m |
| | 2014 £m |
| ||||
| Current tax charge/(credit) | ||||||||||||
| Current year | 896 | 1,605 | 1,131 | |||||||||
| Adjustments in respect of prior years | (361) | (188) | (19) | |||||||||
| 535 | 1,417 | 1,112 | ||||||||||
| Deferred tax charge/(credit) | ||||||||||||
| Current year | 393 | (346) | 75 | |||||||||
| Adjustments in respect of prior years | 65 | 78 | (66) | |||||||||
| 458 | (268) | 9 | ||||||||||
| Tax charge | 993 | 1,149 | 1,121 |
| 236 | Barclays PLC and Barclays Bank PLC 2016 Annual Report on Form 20-F |
10 Taxcontinued
The table below shows the reconciliation between the actual tax charge and the tax charge that would result from applying the standard UK corporation tax rate to the Group’s profit before tax.
| | 2016 £m | | | 2016 % |
| | 2015 £m | | | 2015 % |
| | 2014 £m | | | 2014 % |
| |||||||
Profit before tax from continuing operations | 3,230 | 1,146 | 1,313 | |||||||||||||||||||||
Tax charge based on the standard UK corporation tax rate of 20% | ||||||||||||||||||||||||
(2015: 20.25%, 2014; 21.50%) | 646 | 20.0% | 232 | 20.25% | 282 | 21.5% | ||||||||||||||||||
Impact of profits/losses earned in territories with different statutory rates to the UK (weighted average tax rate is 32.8% | ||||||||||||||||||||||||
(2015: 33.4%, 2014; 29.3%)) | 415 | 12.8% | 151 | 13.2% | 103 | 7.8% | ||||||||||||||||||
Recurring items: | ||||||||||||||||||||||||
Non-creditable taxes including withholding taxes | 277 | 8.6% | 309 | 27.0% | 329 | 25.1% | ||||||||||||||||||
Non-deductible expenses | 114 | 3.5% | 67 | 5.8% | 146 | 11.1% | ||||||||||||||||||
Impact of UK bank levy beingnon-deductible | 82 | 2.5% | 96 | 8.4% | 99 | 7.5% | ||||||||||||||||||
Other items | 58 | 1.9% | (14 | ) | (1.1% | ) | 42 | 3.3% | ||||||||||||||||
Tax adjustments in respect of share-based payments | 34 | 1.1% | 30 | 2.6% | 21 | 1.6% | ||||||||||||||||||
Impact of change in tax rates | 30 | 0.9% | 158 | 13.8% | 9 | 0.7% | ||||||||||||||||||
Adjustments in respect of prior years | (296 | ) | (9.2% | ) | (110 | ) | (9.6% | ) | (85 | ) | (6.5% | ) | ||||||||||||
Non-taxable gains and income | (199 | ) | (6.2% | ) | (197 | ) | (17.2% | ) | (212 | ) | (16.1% | ) | ||||||||||||
Changes in recognition of deferred tax and effect of unrecognised tax losses | (178 | ) | (5.5% | ) | (71 | ) | (6.2% | ) | (115 | ) | (8.8% | ) | ||||||||||||
Impact of Barclays Bank PLC’s overseas branches being taxed both locally and in the UK | (128 | ) | (4.0% | ) | (35 | ) | (3.1% | ) | (68 | ) | (5.2% | ) | ||||||||||||
Non-recurring items: | ||||||||||||||||||||||||
Non-deductible provisions for UK customer redress | 203 | 6.3% | 283 | 24.7% | – | – | ||||||||||||||||||
Non-deductible impairments and losses on divestments | 67 | 2.1% | 39 | 3.4% | 234 | 17.8% | ||||||||||||||||||
Non-deductible provisions for investigations and litigation | 48 | 1.5% | 261 | 22.8% | 387 | 29.5% | ||||||||||||||||||
Non-taxable gains and income on divestments | (180 | ) | (5.6% | ) | (50 | ) | (4.4% | ) | (51 | ) | (3.9% | ) | ||||||||||||
Total tax charge | 993 | 30.7% | 1,149 | 100.3% | 1,121 | 85.4% | ||||||||||||||||||
Factors driving the effective tax rate
The effective tax rate of 30.7% is higher than the UK corporation tax rate of 20% primarily due to profits earned outside the UK being taxed at higher local statutory tax rates. In addition the effective tax rate is affected by provisions for UK customer redress beingnon-deductible for tax purposes,non-creditable taxes andnon-deductible expenses including UK bank levy. These factors, which have each increased the effective tax rate, are partially offset by the impact ofnon-taxable gains and income, including those arising from divestments, and reductions in expected liabilities in respect of a range of issues related to a number of prior years.
Relative to the prior year, the effective tax rate on profit before tax decreased to 30.7% (2015: 100.3%). This was principally a result of a lower level ofnon-deductible provisions for investigations and litigation in 2016, as well as gains arising in 2016 on the divestment of businesses and assets, as the Group has pursued its strategy to run-downNon-Core, that were taxed at low rates.
The Group’s future tax charge will be sensitive to the geographic mix of profits earned and the tax rates in force in the jurisdictions in which we operate. In the UK, legislation to reduce the corporation tax rate to 19% from 1 April 2017 and to 17% from 1 April 2020 has been enacted. In the US, proposed tax reform measures include a reduction in the US corporate income tax rate to as low as 15%. The US rate change is a proposal only at this stage and developments are being closely monitored. In the long term, a reduction in the tax rate would enhance the returns generated by the Group’s US business. However, if enacted, such a change would have a substantialup-front negative impact on the measurement of the Group’s US deferred tax assets, although this would reverse over time and result in a lower effective tax rate as these assets are utilised.
Tax in the consolidated statement of comprehensive income
The most significant tax charge in the consolidated statement of comprehensive income relates to cash flow hedging reserve. The majority of this tax charge is on income brought into charge in the UK in 2016 and this reflects the new surcharge of 8%, that applies to banks’ UK profits, as well as the standard UK corporation tax rate of 20%. Additionally included within the ‘Other’ line is a tax credit of £21m (2015: £21m credit) relating to share-based payments.
Tax in respect of discontinued operation
Tax relating to the discontinued operation can be found in the BAGL disposal group income statement (see Note 44). The tax charge of £306m (2015: £301m) relates entirely to the profit from the ordinary activities of the discontinued operation.
| Barclays PLC and Barclays Bank PLC 2016 Annual Report on Form 20-F | 237 |
Notes to the financial statements
Performance/return
10 Tax continued
Current tax assets and liabilities
Movements on current tax assets and liabilities were as follows:
| | 2016 £m | | | 2015 £m | | |||
Assets | 415 | 334 | ||||||
Liabilities | (903 | ) | (1,021 | ) | ||||
As at 1 January | (488 | ) | (687 | ) | ||||
Income statement from continuing operations | (535 | ) | (1,417 | ) | ||||
Income statement in relation to BAGL disposal group | – | (301 | ) | |||||
Other comprehensive income | 23 | 6 | ||||||
Corporate income tax paid | 780 | 1,670 | ||||||
Other movements | 44 | 241 | ||||||
| (176 | ) | (488 | ) | |||||
Assets | 561 | 415 | ||||||
Liabilities | (737 | ) | (903 | ) | ||||
As at 31 December | (176 | ) | (488 | ) | ||||
Deferred tax assets and liabilities | ||||||||
The deferred tax amounts on the balance sheet were as follows:
| ||||||||
| | 2016 £m | | | 2015 £m | | |||
Intermediate Holding Company (IHC) – US tax group | 2,207 | 2,049 | ||||||
Barclays Bank PLC (US Branch) – US tax group | 1,766 | 1,569 | ||||||
Barclays PLC – UK tax group | 575 | 411 | ||||||
Other | 321 | 466 | ||||||
Deferred tax asset | 4,869 | 4,495 | ||||||
Deferred tax liability | (29 | ) | (122 | ) | ||||
Net deferred tax | 4,840 | 4,373 | ||||||
US deferred tax assets in the IHC and the US Branch
The deferred tax asset in the IHC of £2,207m (2015: £2,049m) includes £321m (2015: £503m) relating to tax losses and the deferred tax asset in the US Branch of £1,766m (2015: £1,569m) includes £142m (2015: £244m) relating to tax losses. Under US tax rules, losses can be carried forward and offset against profits for a period of 20 years. The losses first arose in 2011 in the IHC and 2008 in the US Branch and therefore any unused amounts may begin to expire in 2031 and 2028 respectively. The remaining US deferred tax assets relate to temporary differences for which there is no time limit on recovery. The deferred tax assets for the IHC tax losses and the US Branch losses are projected to be fully utilised by 2018.
The measurement of the US branch deferred tax assets takes into account both US and UK tax. This is because Barclays Bank PLC is subject to UK tax on its worldwide profits, including the profits of its overseas branches. The US branch deferred tax assets are valued at the difference between the US and UK tax rates.
UK tax group deferred tax asset
The deferred tax asset in the UK tax group of £575m (2015: £411m) relates entirely to temporary differences.
Other deferred tax assets
The deferred tax asset of £321m (2015: £466m) in other entities within the Group includes £40m (2015: £155m) relating to tax losses carried forward. These deferred tax assets relate to a number of different territories and their recognition is based on profit forecasts or local country law which indicate that it is probable that the losses and temporary differences will be utilised.
Of the deferred tax asset of £321m (2015: £466m), an amount of £267m (2015: £106m) relates to entities which have suffered a loss in either the current or prior year. This has been taken into account in reaching the above conclusion that these deferred tax assets will be fully recovered in the future.
| 238 | Barclays PLC and Barclays Bank PLC 2016 Annual Report on Form 20-F |
10 Taxcontinued
The table below shows movements on deferred tax assets and liabilities during the year. The amounts are different from those disclosed on the balance sheet and in the preceding table as they are presented before offsetting asset and liability balances where there is a legal right toset-off and an intention to settle on a net basis.
| | Fixed asset timing differences £m | | | Available for sale investments £m |
| | Cash flow hedges £m | | | Retirement benefit obligations £m |
| | Loan impairment allowance £m |
| | Other provisions £m | | | Tax losses carried forward £m |
| | Share-based payments and deferred com- pensation £m |
| | Other £m |
| | Total £m |
| |||||||||||
Assets | 2,008 | 28 | 5 | 95 | 157 | 261 | 902 | 623 | 1,511 | 5,590 | ||||||||||||||||||||||||||||||
Liabilities | (194 | ) | (70 | ) | (239 | ) | (144 | ) | – | – | – | – | (570 | ) | (1,217 | ) | ||||||||||||||||||||||||
At 1 January 2016 | 1,814 | (42 | ) | (234 | ) | (49 | ) | 157 | 261 | 902 | 623 | 941 | 4,373 | |||||||||||||||||||||||||||
Income statement | (358 | ) | 9 | (7 | ) | (8 | ) | 52 | 17 | (522 | ) | 15 | 344 | (458 | ) | |||||||||||||||||||||||||
Other comprehensive income | – | 49 | (61 | ) | 132 | – | – | – | 20 | (6 | ) | 134 | ||||||||||||||||||||||||||||
Other movements | 253 | 26 | (31 | ) | 16 | (58 | ) | (27 | ) | 123 | 74 | 415 | 791 | |||||||||||||||||||||||||||
| 1,709 | 42 | (333 | ) | 91 | 151 | 251 | 503 | 732 | 1,694 | 4,840 | ||||||||||||||||||||||||||||||
Assets | 1,801 | 183 | – | 91 | 151 | 251 | 503 | 732 | 2,013 | 5,725 | ||||||||||||||||||||||||||||||
Liabilities | (92 | ) | (141 | ) | (333 | ) | – | – | – | – | – | (319 | ) | (885 | ) | |||||||||||||||||||||||||
At 31 December 2016 | 1,709 | 42 | (333 | ) | 91 | 151 | 251 | 503 | 732 | 1,694 | 4,840 | |||||||||||||||||||||||||||||
Assets | 1,542 | 18 | 5 | 321 | 176 | 233 | 1,315 | 729 | 951 | 5,290 | ||||||||||||||||||||||||||||||
Liabilities | (555 | ) | (35 | ) | (464 | ) | – | – | – | – | – | (368 | ) | (1,422 | ) | |||||||||||||||||||||||||
At 1 January 2015 | 987 | (17 | ) | (459 | ) | 321 | 176 | 233 | 1,315 | 729 | 583 | 3,868 | ||||||||||||||||||||||||||||
Income statement | 779 | (13 | ) | 1 | (119 | ) | (14 | ) | 21 | (540 | ) | (126 | ) | 279 | 268 | |||||||||||||||||||||||||
Other comprehensive income | – | (14 | ) | 221 | (261 | ) | – | – | 122 | (10 | ) | (21 | ) | 37 | ||||||||||||||||||||||||||
Other movements | 48 | 2 | 3 | 10 | (5 | ) | 7 | 5 | 30 | 100 | 200 | |||||||||||||||||||||||||||||
| 1,814 | (42 | ) | (234 | ) | (49 | ) | 157 | 261 | 902 | 623 | 941 | 4,373 | ||||||||||||||||||||||||||||
Assets | 2,008 | 28 | 5 | 95 | 157 | 261 | 902 | 623 | 1,511 | 5,590 | ||||||||||||||||||||||||||||||
Liabilities | (194 | ) | (70 | ) | (239 | ) | (144 | ) | – | – | – | – | (570 | ) | (1,217 | ) | ||||||||||||||||||||||||
At 31 December 2015 | 1,814 | (42 | ) | (234 | ) | (49 | ) | 157 | 261 | 902 | 623 | 941 | 4,373 |
Other movements include the impact of changes in foreign exchange rates as well as deferred tax amounts relating to acquisitions, disposals and transfers to held for sale.
The amount of deferred tax liability expected to be settled after more than 12 months is £273m (2015: £675m). The amount of deferred tax assets expected to be recovered after more than 12 months is £5,066m (2015: £4,838m). These amounts are before offsetting asset and liability balances where there is a legal right toset-off and an intention to settle on a net basis.
Unrecognised deferred tax
Tax losses and temporary differences
Deferred tax assets have not been recognised in respect of gross deductible temporary differences of £64m (2015: £51m) and gross tax losses of £16,820m (2015: £13,456m). The increase in these losses in 2016 is largely a result of the weakening of sterling against the overseas currencies these losses are denominated in. The tax losses include capital losses of £3,138m (2015: £3,838m) and unused tax credits of £514m (2015: £452m). Of these tax losses, £394m (2015: £389m) expire within five years, £57m (2015: £13m) expire within six to ten years, £358m (2015: £124m) expire within 11 to 20 years and £16,011m (2015: £12,930m) can be carried forward indefinitely. Deferred tax assets have not been recognised in respect of these items because it is not probable that future taxable profits and gains will be available against which they can be utilised.
Group investments in subsidiaries, branches and associates
Deferred tax is not recognised in respect of the value of Group’s investments in subsidiaries, branches and associates where the Group is able to control the timing of the reversal of the temporary differences and it is probable that such differences will not reverse in the foreseeable future. The aggregate amount of these temporary differences for which deferred tax liabilities have not been recognised is £2bn (2015: £2bn).
Critical accounting estimates and judgements
The Group does not consider there to be a significant risk of a material adjustment to the carrying amount of current and deferred tax balances, including provisions for uncertain tax positions, in the next financial year. The provisions for uncertain tax positions cover a diverse range of issues and reflect legal advice from external counsel where relevant. It should be noted that only a proportion of the total uncertain tax positions will be under audit at any point in time, and could therefore be subject to challenge by a tax authority over the next year.
Deferred tax assets have been recognised based on business profit forecasts. Further detail on the recognition of deferred tax assets is provided in the deferred tax assets and liabilities section of this tax note.
| Barclays PLC and Barclays Bank PLC 2016 Annual Report on Form 20-F | 239 |
Notes to the financial statements
Performance/return
11 Earnings per share
| ||||||||||||||||||||||||
| | 2016 £m | | | 2015 £m | | | 2014 £m | | ||||||||||||||||
Profit/(loss) attributable to ordinary equity holders of the parent from continuing and discontinued operations |
| 1,623 | (394 | ) | (174 | ) | ||||||||||||||||||
Tax credit on profit after tax attributable to other equity holders |
| 128 | 70 | 54 | ||||||||||||||||||||
Total Profit/(loss) attributable to ordinary equity holders of the parent from continuing and discontinued operations |
| 1,751 | (324 | ) | (120 | ) | ||||||||||||||||||
Continuing operations |
| |||||||||||||||||||||||
Profit/(loss) attributable to ordinary equity holders of the parent from continuing operations |
| 1,434 | (696 | ) | (508 | ) | ||||||||||||||||||
Tax credit on profit after tax attributable to other equity holders |
| 128 | 70 | 54 | ||||||||||||||||||||
Profit/(loss) attributable to equity holders of the parent from continuing operations |
| 1,562 | (626 | ) | (454 | ) | ||||||||||||||||||
Discontinued operations |
| |||||||||||||||||||||||
Profit attributable to ordinary equity holders of the parent from discontinued operations |
| 189 | 302 | 334 | ||||||||||||||||||||
Dilutive impact of convertible options from discontinued operations |
| (1 | ) | – | – | |||||||||||||||||||
Profit attributable to equity holders of the parent from discontinued operations including dilutive impact on convertible options |
| 188 | 302 | 334 | ||||||||||||||||||||
Profit/(loss) attributable to equity holders of the parent from continuing and discontinued operations including dilutive impact on convertible options |
| 1,750 | (324 | ) | (120 | ) | ||||||||||||||||||
| | 2016 million | | | 2015 million | | | 2014 million | | ||||||||||||||||
Basic weighted average number of shares in issue | 16,860 | 16,687 | 16,329 | |||||||||||||||||||||
Number of potential ordinary shares | 184 | 367 | 296 | |||||||||||||||||||||
Diluted weighted average number of shares | 17,044 | 17,054 | 16,625 | |||||||||||||||||||||
| Basic earnings per share | Diluted earnings per sharea | |||||||||||||||||||||||
| | 2016 p | | | 2015 p | | | 2014 p | | | 2016 p |
| | 2015 p |
| | 2014 p |
| |||||||
Basic earnings/(loss) per ordinary share | 10.4 | (1.9 | ) | (0.7 | ) | 10.3 | (1.9 | ) | (0.7 | ) | ||||||||||||||
Basic earnings/(loss) per ordinary share from continuing operations | 9.3 | (3.7 | ) | (2.7 | ) | 9.2 | (3.7 | ) | (2.7 | ) | ||||||||||||||
Basic earnings per ordinary share from discontinued operations | 1.1 | 1.8 | 2.0 | 1.1 | 1.8 | 2.0 | ||||||||||||||||||
The calculation of basic earnings per share is based on the profit attributable to equity holders of the parent and the basic weighted average number of shares excluding treasury shares held in employee benefit trusts or held for trading. When calculating the diluted earnings per share, the weighted average number of shares in issue is adjusted for the effects of all dilutive potential ordinary shares held in respect of Barclays PLC, totalling 184m (2015: 367m) shares. In addition, the profit attributable to equity holders of the parent is adjusted for the dilutive impact of the potential conversion of outstanding options held in respect of BAGL. The decrease in the number of potential ordinary shares is due to the average share price of £1.74 (2015: £2.52) being lower than the average strike price of £1.88 (2015: £2.11). During the year the total number of share options granted under employee share schemes was 584m (2015: 533m). The schemes have strike prices ranging from £1.20 to £2.49.
Of the total number of employee share options and share awards at 31 December 2016, 93m (2015: 23m) were anti-dilutive.
The 173m increase in the basic weighted average number of shares since 31 December 2015 to 16,860m is primarily due to shares issued under employee share schemes and the Scrip Dividend Programme.
12 Dividends on ordinary shares
The Directors have approved a final dividend in respect of 2016 of 2.0p per ordinary share of 25p each which will be paid on 5 April 2017 to shareholders on the Share Register on 3 March 2017. On 31 December 2016, there were 16,963m ordinary shares in issue. The financial statements for the year ended 31 December 2016 do not reflect this dividend, which will be accounted for in shareholders’ equity as an appropriation of retained profits in the year ending 31 December 2017. The 2016 financial statements include the 2016 interim dividends of £169m (2015: £503m) and final dividend declared in relation to 2015 of £588m (2015: £578m).
Note
| a | Potential ordinary shares shall be treated as dilutive when, and only when, their conversion to ordinary shares would increase loss per share. |
| 240 | Barclays PLC and Barclays Bank PLC 2016 Annual Report on Form 20-F |
Notes to the financial statements
Assets and liabilities held at fair value
The notes included in this section focus on assets and liabilities the Group holds and recognises at fair value. Fair value refers to the price that would be received to sell an asset or the price that would be paid to transfer a liability in anarms-length transaction with a willing counterparty, which may be an observable market price or, where there is no quoted price for the instrument, may be an estimate based on available market data. Detail regarding the Group’s approach to managing market risk can be found on page 103.
13 Trading portfolio
Accounting for trading portfolio assets and liabilities In accordance with IAS 39, all assets and liabilities held for trading purposes are held at fair value with gains and losses in the changes in fair value taken to the income statement in net trading income (Note 5).
|
| Trading portfolio assets | Trading portfolio liabilities | |||||||||||||||||||||||
| | 2016 £m |
| | 2015 £m |
| | 2016 £m |
| | 2015 £m |
| |||||||||||||
Debt securities and other eligible bills |
| 38,789 | 45,576 | (26,842 | ) | (24,985 | ) | |||||||||||||||||
Equity securities |
| 38,329 | 29,055 | (7,831 | ) | (8,982 | ) | |||||||||||||||||
Traded loans |
| 2,975 | 2,474 | – | – | |||||||||||||||||||
Commodities |
| 147 | 243 | (14 | ) | – | ||||||||||||||||||
Trading portfolio assets/(liabilities) |
| 80,240 | 77,348 | (34,687 | ) | (33,967 | ) | |||||||||||||||||
14 Financial assets designated at fair value
|
| |||||||||||||||||||||||
Accounting for financial assets designated at fair value In accordance with IAS 39, financial assets may be designated at fair value, with gains and losses taken to the income statement within net trading income (Note 5) and net investment income (Note 6). The Group has the ability to make the fair value designation when holding the instruments at fair value reduces an accounting mismatch (caused by an offsetting liability or asset being held at fair value), or is managed by the Group on the basis of its fair value, or includes terms that have substantive derivative characteristics described in Note 15 Derivative financial instruments.
The details on how the fair value amounts are derived for financial assets designated at fair value are described in Note 18 Fair value of assets and liabilities.
|
| |||||||||||||||||||||||
| | 2016 £m |
| | 2015 £m |
| |||||||||||||||||||
Loans and advances |
| 10,519 | 17,913 | |||||||||||||||||||||
Debt securities |
| 70 | 1,383 | |||||||||||||||||||||
Equity securities |
| 4,558 | 6,197 | |||||||||||||||||||||
Reverse repurchase agreements |
| 63,162 | 49,513 | |||||||||||||||||||||
Customers’ assets held under investment contracts |
| 37 | 1,449 | |||||||||||||||||||||
Other financial assets |
| 262 | 375 | |||||||||||||||||||||
Financial assets designated at fair value |
| 78,608 | 76,830 | |||||||||||||||||||||
Credit risk of loans and advances designated at fair value and related credit derivatives The following table shows the maximum exposure to credit risk, the changes in fair value attributable to changes in credit risk, and the cumulative changes in fair value since initial recognition together with the amount by which related credit derivatives mitigate this risk: |
| |||||||||||||||||||||||
| | Maximum exposure as at 31 December | | | Changes in fair value during the year ended | | | Cumulative changes in fair value from inception | | ||||||||||||||||
| | 2016 £m |
| | 2015 £m |
| | 2016 £m |
| | 2015 £m |
| | 2016 £m |
| | 2015 £m |
| |||||||
Loans and advances designated at fair value, attributable to credit risk | 10,519 | 17,913 | (42 | ) | 69 | (42 | ) | (629 | ) | |||||||||||||||
Value mitigated by related credit derivatives | 339 | 417 | (2 | ) | 26 | (13 | ) | 42 | ||||||||||||||||
| Barclays PLC and Barclays Bank PLC 2016 Annual Report on Form 20-F | 241 |
Notes to the financial statements
Assets and liabilities held at fair value
15 Derivative financial instruments
Accounting for derivatives
Derivative instruments are contracts whose value is derived from one or more underlying financial instruments or indices defined in the contract. They include swaps, forward-rate agreements, futures, options and combinations of these instruments and primarily affect the Group’s net interest income, net trading income and derivative assets and liabilities. Notional amounts of the contracts are not recorded on the balance sheet.
The Group applies IAS 39. All derivative instruments are held at fair value through profit or loss. Derivatives are classified as assets when their fair value is positive or as liabilities when their fair value is negative. This includes terms included in a contract or other financial asset or liability (the host), which, had it been a stand-alone contract, would have met the definition of a derivative. If these are separated from the host i.e. when the economic characteristics of the embedded derivative are not closely related with those of the host contract and the combined instrument is not measured at fair value through profit or loss then they are accounted for in the same way as derivatives.
Hedge accounting
The Group applies hedge accounting to represent, to the maximum possible extent permitted under accounting standards, the economic effects of its interest and currency risk management strategies. Derivatives are used to hedge interest rate, exchange rate, commodity, and equity exposures and exposures to certain indices such as house price indices and retail price indices related tonon-trading positions. Where derivatives are held for risk management purposes, and when transactions meet the required criteria for documentation and hedge effectiveness, the Group applies fair value hedge accounting, cash flow hedge accounting, or hedging of a net investment in a foreign operation, as appropriate to the risks being hedged.
Fair value hedge accounting
Changes in fair value of derivatives that qualify and are designated as fair value hedges are recorded in the income statement, together with changes in the fair value of the hedged asset or liability that are attributable to the hedged risk. The fair value changes adjust the carrying value of the hedged asset or liability held at amortised cost.
If hedge relationships no longer meet the criteria for hedge accounting, hedge accounting is discontinued. For fair value hedges of interest rate risk, the fair value adjustment to the hedged item is amortised to the income statement over the period to maturity of the previously designated hedge relationship using the effective interest method. If the hedged item is sold or repaid, the unamortised fair value adjustment is recognised immediately in the income statement.
Cash flow hedge accounting
For qualifying cash flow hedges, the fair value gain or loss associated with the effective portion of the cash flow hedge is recognised initially in other comprehensive income, and then recycled to the income statement in the periods when the hedged item will affect profit or loss. Any ineffective portion of the gain or loss on the hedging instrument is recognised in the income statement immediately.
When a hedging instrument expires or is sold, or when a hedge no longer meets the criteria for hedge accounting, any cumulative gain or loss existing in equity at that time remains in equity and is recognised when the hedged item is ultimately recognised in the income statement. When a forecast transaction is no longer expected to occur, the cumulative gain or loss that was recognised in equity is immediately transferred to the income statement.
Hedges of net investments
The Group’s net investments in foreign operations, including monetary items accounted for as part of the net investment, are hedged for foreign currency risks using both derivatives and foreign currency borrowings. Hedges of net investments are accounted for similarly to cash flow hedges; the effective portion of the gain or loss on the hedging instrument is being recognised directly in other comprehensive income and the ineffective portion being recognised immediately in the income statement. The cumulative gain or loss recognised in other comprehensive income is recognised in the income statement on the disposal or partial disposal of the foreign operation, or other reductions in the Group’s investment in the operation.
Total derivatives | 2016 | 2015 | ||||||||||||||||||||||
| Notional | Fair value | Notional | Fair value | |||||||||||||||||||||
| contract | contract | |||||||||||||||||||||||
| amount | Assets | Liabilities | amount | Assets | Liabilities | |||||||||||||||||||
| £m | £m | £m | £m | £m | £m | |||||||||||||||||||
Total derivative assets/(liabilities) held for trading | 36,185,820 | 345,624 | (339,646 | ) | 29,437,102 | 326,772 | (323,788 | ) | ||||||||||||||||
Total derivative assets/(liabilities) held for risk management | 336,524 | 1,002 | (841 | ) | 316,605 | 937 | (464 | ) | ||||||||||||||||
Derivative assets/(liabilities) | 36,522,344 | 346,626 | (340,487 | ) | 29,753,707 | 327,709 | (324,252 | ) | ||||||||||||||||
The fair value of derivative assets increased by 6% to £347bn. This was mainly in foreign exchange derivatives largely due to increase in trade volumes and appreciation of all major currencies against GBP. Information on further netting of derivative financial instruments is included within Note 19 Offsetting financial assets and financial liabilities.
Trading derivatives are managed within the Group’s market risk management policies, which are outlined on page103.
The Group’s exposure to credit risk arising from derivative contracts are outlined in the Credit risk section on page 139 and 140.
| 242 | Barclays PLC and Barclays Bank PLC 2016 Annual Report on Form 20-F |
15 Derivative financial instrumentscontinued
The fair values and notional amounts of derivative instruments held for trading are set out in the following table:
Derivatives held for trading | 2016 | 2015 | ||||||||||||||||||||||
| | Notional contract amount £m |
| Fair value | | Notional contract amount £m |
| Fair value | |||||||||||||||||
| | Assets £m | | | Liabilities £m | | | Assets £m | | | Liabilities £m | | |||||||||||||
Foreign exchange derivatives | ||||||||||||||||||||||||
Forward foreign exchange | 2,308,922 | 32,442 | (30,907 | ) | 1,277,863 | 17,613 | (19,433) | |||||||||||||||||
Currency swaps | 1,086,552 | 40,083 | (40,164 | ) | 1,006,640 | 30,703 | (32,449) | |||||||||||||||||
OTC options bought and sold | 772,031 | 6,338 | (6,762 | ) | 924,832 | 6,436 | (6,771) | |||||||||||||||||
OTC derivatives | 4,167,505 | 78,863 | (77,833 | ) | 3,209,335 | 54,752 | (58,653) | |||||||||||||||||
Foreign exchange derivatives cleared by central counterparty | 43,478 | 366 | (388 | ) | 9,308 | 33 | (44) | |||||||||||||||||
Exchange traded futures and options – bought and sold | 18,813 | 31 | (27 | ) | 6,071 | 13 | (12) | |||||||||||||||||
Foreign exchange derivatives | 4,229,796 | 79,260 | (78,248 | ) | 3,224,714 | 54,798 | (58,709) | |||||||||||||||||
Interest rate derivatives | ||||||||||||||||||||||||
Interest rate swaps | 4,799,897 | 153,822 | (143,059 | ) | 4,600,472 | 159,040 | (148,475) | |||||||||||||||||
Forward-rate agreements | 296,559 | 999 | (968 | ) | 371,510 | 440 | (390) | |||||||||||||||||
OTC options bought and sold | 2,522,430 | 42,412 | (43,373 | ) | 2,634,527 | 48,995 | (49,001) | |||||||||||||||||
OTC derivatives | 7,618,886 | 197,233 | (187,400 | ) | 7,606,509 | 208,475 | (197,866) | |||||||||||||||||
Interest rate derivatives cleared by central counterpartya | 14,439,407 | 30,503 | (31,528 | ) | 11,407,745 | 21,871 | (22,603) | |||||||||||||||||
Exchange traded futures and options – bought and sold | 7,952,733 | 397 | (370 | ) | 5,470,872 | 281 | (263) | |||||||||||||||||
Interest rate derivatives | 30,011,026 | 228,133 | (219,298 | ) | 24,485,126 | 230,627 | (220,732) | |||||||||||||||||
Credit derivatives | ||||||||||||||||||||||||
OTC swaps | 615,057 | 11,811 | (10,513 | ) | 671,389 | 14,087 | (12,693) | |||||||||||||||||
Credit derivatives cleared by central counterpartya | 332,743 | 4,462 | (4,572 | ) | 277,257 | 4,094 | (3,931) | |||||||||||||||||
Credit derivatives | 947,800 | 16,273 | (15,085 | ) | 948,646 | 18,181 | (16,624) | |||||||||||||||||
Equity and stock index derivatives | ||||||||||||||||||||||||
OTC options bought and sold | 102,545 | 6,766 | (8,837 | ) | 53,645 | 5,507 | (7,746) | |||||||||||||||||
Equity swaps and forwards | 105,120 | 2,253 | (4,435 | ) | 98,264 | 1,794 | (3,855) | |||||||||||||||||
OTC derivatives | 207,665 | 9,019 | (13,272 | ) | 151,909 | 7,301 | (11,601) | |||||||||||||||||
Exchange traded futures and options – bought and sold | 585,620 | 8,070 | (8,600 | ) | 429,592 | 6,498 | (6,851) | |||||||||||||||||
Equity and stock index derivatives | 793,285 | 17,089 | (21,872 | ) | 581,501 | 13,799 | (18,452) | |||||||||||||||||
Commodity derivatives | ||||||||||||||||||||||||
OTC options bought and sold | 14,053 | 395 | (461 | ) | 21,959 | 1,402 | (1,408) | |||||||||||||||||
Commodity swaps and forwards | 16,086 | 1,528 | (1,821 | ) | 29,161 | 3,645 | (3,397) | |||||||||||||||||
OTC derivatives | 30,139 | 1,923 | (2,282 | ) | 51,120 | 5,047 | (4,805) | |||||||||||||||||
Exchange traded futures and options – bought and sold | 173,774 | 2,946 | (2,861 | ) | 145,995 | 4,320 | (4,466) | |||||||||||||||||
Commodity derivatives | 203,913 | 4,869 | (5,143 | ) | 197,115 | 9,367 | (9,271) | |||||||||||||||||
Derivative assets/(liabilities) held for trading | 36,185,820 | 345,624 | (339,646 | ) | 29,437,102 | 326,772 | (323,788) | |||||||||||||||||
Total OTC derivatives held for trading | 12,639,252 | 298,849 | (291,300 | ) | 11,690,262 | 289,662 | (285,618) | |||||||||||||||||
Total derivatives cleared by central counterparty held for trading | 14,815,628 | 35,331 | (36,488 | ) | 11,694,310 | 25,998 | (26,578) | |||||||||||||||||
Total exchange traded derivatives held for trading | 8,730,940 | 11,444 | (11,858 | ) | 6,052,530 | 11,112 | (11,592) | |||||||||||||||||
Derivative assets/(liabilities) held for trading | 36,185,820 | 345,624 | (339,646 | ) | 29,437,102 | 326,772 | (323,788) | |||||||||||||||||
Note
| a | The Chicago Mercantile Exchange (CME) changed its rulebook with effective date 3 January 2017. Under the new rules, OTC positions cleared will be settled daily by cash payments and not collateralised by these payments (known currently as variation margin). For reporting periods following the effective date, the fair value of derivatives will reflect the settlement which will reduce the fair value of the recognised derivative assets and liabilities and there will be no separate cash collateral recognised for the daily ‘variation margin’. As of 31 December 2016, the fair value of impacted derivatives assets was £20.4bn and derivative liabilities £21.5bn. |
| Barclays PLC and Barclays Bank PLC 2016 Annual Report on Form 20-F | 243 |
Notes to the financial statements
Assets and liabilities held at fair value
15 Derivative financial instrumentscontinued
The fair values and notional amounts of derivative instruments held for risk management are set out in the following table:
Derivatives held for risk management | 2016 | 2015 | ||||||||||||||||||||||||||
| Notional | Fair value | Notional | Fair value | |||||||||||||||||||||||||
| contract | contract | |||||||||||||||||||||||||||
| amount | Assets | Liabilities | amount | Assets | Liabilities | |||||||||||||||||||||||
| £m | £m | £m | £m | £m | £m | |||||||||||||||||||||||
Derivatives designated as cash flow hedges | ||||||||||||||||||||||||||||
Currency swaps | 1,357 | 453 | – | 1,357 | 133 | – | ||||||||||||||||||||||
Interest rate swaps | 5,965 | 154 | (6) | 14,198 | 162 | (115) | ||||||||||||||||||||||
Forward foreign exchange | – | – | – | 759 | 5 | – | ||||||||||||||||||||||
Interest rate derivatives cleared by central counterparty | 181,541 | 62 | (27) | 147,072 | – | – | ||||||||||||||||||||||
Derivatives designated as cash flow hedges | 188,863 | 669 | (33) | 163,386 | 300 | (115) | ||||||||||||||||||||||
Derivatives designated as fair value hedges | ||||||||||||||||||||||||||||
Interest rate swaps | 10,733 | 301 | (744) | 13,798 | 637 | (264) | ||||||||||||||||||||||
Forward foreign exchange | – | – | – | 2,527 | – | (32) | ||||||||||||||||||||||
Interest rate derivatives cleared by central counterparty | 130,842 | – | – | 134,939 | – | – | ||||||||||||||||||||||
Derivatives designated as fair value hedges | 141,575 | 301 | (744) | 151,264 | 637 | (296) | ||||||||||||||||||||||
Derivatives designated as hedges of net investments | ||||||||||||||||||||||||||||
Forward foreign exchange | 6,086 | 32 | (64) | 1,955 | – | (53) | ||||||||||||||||||||||
Derivatives designated as hedges of net investments | 6,086 | 32 | (64) | 1,955 | – | (53) | ||||||||||||||||||||||
Derivative assets/(liabilities) held for risk management | 336,524 | 1,002 | (841) | 316,605 | 937 | (464) | ||||||||||||||||||||||
Total OTC derivatives held for risk management | 24,141 | 940 | (814) | 34,594 | 937 | (464) | ||||||||||||||||||||||
Total derivatives cleared by central counterparty held for risk management | 312,383 | 62 | (27) | 282,011 | – | – | ||||||||||||||||||||||
Derivative assets/(liabilities) held for risk management | 336,524 | 1,002 | (841) | 316,605 | 937 | (464) | ||||||||||||||||||||||
The Group has hedged the following forecast cash flows, which primarily vary with interest rates. These cash flows are expected to impact the income statement in the following periods, excluding any hedge adjustments that may be applied:
|
| |||||||||||||||||||||||||||
| Up to | One to | Two to | Three to | Four to | More than | |||||||||||||||||||||||
| Total | one year | two years | three years | four years | five years | five years | ||||||||||||||||||||||
| £m | £m | £m | £m | £m | £m | £m | ||||||||||||||||||||||
2016 | ||||||||||||||||||||||||||||
Forecast receivable cash flows | 2,616 | 455 | 531 | 511 | 411 | 327 | 381 | |||||||||||||||||||||
Forecast payable cash flows | 52 | 15 | 16 | 7 | 6 | 5 | 3 | |||||||||||||||||||||
2015 | ||||||||||||||||||||||||||||
Forecast receivable cash flows | 4,952 | 555 | 816 | 875 | 813 | 633 | 1,260 | |||||||||||||||||||||
Forecast payable cash flows | 872 | 769 | 35 | 31 | 22 | 11 | 4 | |||||||||||||||||||||
The maximum length of time over which the Group hedges exposure to the variability in future cash flows for forecast transactions, excluding those forecast transactions related to the payment of variable interest on existing financial instruments is 10 years (2015: 10 years).
|
| |||||||||||||||||||||||||||
Amounts recognised in net interest income | | 2016 £m |
| | 2015 £m |
| ||||||||||||||||||||||
Gains on the hedged items attributable to the hedged risk |
| 1,787 | 552 | |||||||||||||||||||||||||
Losses on the hedging instruments | (1,741) | (485) | ||||||||||||||||||||||||||
Fair value ineffectiveness | 46 | 67 | ||||||||||||||||||||||||||
Cash flow hedging ineffectiveness | 28 | 16 | ||||||||||||||||||||||||||
Net investment hedging ineffectiveness | (3) | (2) | ||||||||||||||||||||||||||
Gains and losses transferred from the cash flow hedging reserve to the income statement included a £17m gain (2015: £36m gain) transferred to interest income; a £491m gain (2015: £267m gain) to interest expense; nil (2015: £4m loss) to net trading income; a £17m gain (2015: £17m gain) to administration and general expenses; and a £75m loss (2015: £69m loss) to taxation.
| 244 | Barclays PLC and Barclays Bank PLC 2016 Annual Report on Form 20-F |
16 Financial investments
Accounting for financial investments
Available for sale financial assets are held at fair value with gains and losses being included in other comprehensive income. The Group uses this classification for assets that are not derivatives and are not held for trading purposes or otherwise designated at fair value through profit or loss, or at amortised cost. Dividends and interest (calculated using the effective interest method) are recognised in the income statement in net interest income (Note 3) or, net investment income (Note 6). On disposal, the cumulative gain or loss recognised in other comprehensive income is also included in net investment income.
Held to maturity assets are held at amortised cost. The Group uses this classification when there is an intent and ability to hold the asset to maturity. Interest on the investments are recognised in the income statement within Net interest income (Note 3).
|
| 2016 | 2015 | |||||||
| £m | £m | |||||||
Available for sale debt securities and other eligible bills | 57,703 | 89,278 | ||||||
Available for sale equity securities | 438 | 989 | ||||||
Held to maturity debt securities | 5,176 | – | ||||||
Financial investments | 63,317 | 90,267 |
In June 2016 UK Gilts previously classified as available for sale investments, were reclassified to held to maturity in order to reflect the intention with these assets. Any previous fair value gain or loss on the asset that has been accumulated within the available for sale reserve (Note 32) is amortised to profit or loss over the remaining life of the financial asset using the effective interest method.
17 Financial liabilities designated at fair value
Accounting for liabilities designated at fair value through profit and loss
In accordance with IAS 39, financial liabilities may be designated at fair value, with gains and losses taken to the income statement within net trading income (Note 5) and net investment income (Note 6). The Group has the ability to make the fair value designation when holding the instruments at fair value reduces an accounting mismatch (caused by an offsetting liability or asset being held at fair value), or is managed by the Group on the basis of its fair value, or includes terms that have substantive derivative characteristics (Note 15 Derivative financial instruments).
The details on how the fair value amounts are derived for financial liabilities designated at fair value are described in Note 18 Fair value of assets and liabilities.
|
| 2016 | 2015 | |||||||||||||||
| Contractual | Contractual | |||||||||||||||
| amount due | amount due | |||||||||||||||
| Fair value | on maturity | Fair value | on maturity | |||||||||||||
| £m | £m | £m | £m | |||||||||||||
Debt securities | 34,985 | 37,034 | 33,177 | 36,097 | ||||||||||||
Deposits | 5,269 | 5,303 | 6,029 | 6,324 | ||||||||||||
Liabilities to customers under investment contracts | 37 | – | 1,633 | – | ||||||||||||
Repurchase agreements | 55,710 | 55,760 | 50,838 | 50,873 | ||||||||||||
Other financial liabilities | 30 | 30 | 68 | 68 | ||||||||||||
Financial liabilities designated at fair value | 96,031 | 98,127 | 91,745 | 93,362 | ||||||||||||
The cumulative own credit net loss recognised is £239m (2015: £226m).
| Barclays PLC and Barclays Bank PLC 2016 Annual Report on Form 20-F | 245 |
Notes to the financial statements
Assets and liabilities held at fair value
18 Fair value of financial instruments
Accounting for financial assets and liabilities – fair values The Group applies IAS 39. All financial instruments are initially recognised at fair value on the date of initial recognition and, depending on the classification of the asset or liability, may continue to be held at fair value either through profit or loss or other comprehensive income. The fair value of a financial instrument is the price that would be received to sell an asset or paid to transfer a liability in an orderly transaction between market participants at the measurement date.
Wherever possible, fair value is determined by reference to a quoted market price for that instrument. For many of the Group’s financial assets and liabilities, especially derivatives, quoted prices are not available and valuation models are used to estimate fair value. The models calculate the expected cash flows under the terms of each specific contract and then discount these values back to a present value. These models use as their basis independently-sourced market parameters including, for example, interest rate yield curves, equities and commodities prices, option volatilities and currency rates.
For financial liabilities measured at fair value, the carrying amount reflects the effect on fair value of changes in own credit spreads calibrated to observable market data such as in primary issuance and redemption activity for structured notes. Own credit spreads for instruments issued out of Barclays Bank PLC were previously derived from Barclays Bank PLC issued vanilla debt in the secondary market but, due to extensive bondbuy-back programmes, observations of Barclays Bank PLC secondary market bond prices have significantly decreased and no longer provide a reliable estimation for the fair value measurement.
On initial recognition, it is presumed that the transaction price is the fair value unless there is observable information available in an active market to the contrary. The best evidence of an instrument’s fair value on initial recognition is typically the transaction price. However, if fair value can be evidenced by comparison with other observable current market transactions in the same instrument, or is based on a valuation technique whose inputs include only data from observable markets, then the instrument should be recognised at the fair value derived from such observable market data.
For valuations that have made use of unobservable inputs, the difference between the model valuation and the initial transaction price (‘Day One profit’) is recognised in profit or loss either: on a straight-line basis over the term of the transaction; or where appropriate over the period until all model inputs will become observable or released in full when previously unobservable inputs become observable.
Various factors influence the availability of observable inputs and these may vary from product to product and change over time. Factors include the depth of activity in the relevant market, the type of product, whether the product is new and not widely traded in the marketplace, the maturity of market modelling and the nature of the transaction (bespoke or generic). To the extent that valuation is based on models or inputs that are not observable in the market, the determination of fair value can be more subjective, depending on the significance of the unobservable input to the overall valuation. Unobservable inputs are determined based on the best information available, for example by reference to similar assets, similar maturities or other analytical techniques.
The sensitivity of valuations used in the financial statements to possible changes in significant unobservable inputs is shown on page 256.
Critical accounting estimates and judgements The valuation of financial instruments often involves a significant degree of judgement and complexity, in particular where valuation models make use of unobservable inputs (‘Level 3’ assets and liabilities). This note provides information on these instruments, including the related unrealised gains and losses recognised in the period, a description of significant valuation techniques and unobservable inputs, and a sensitivity analysis.
|
Valuation
IFRS 13Fair Value Measurement requires an entity to classify its assets and liabilities according to a hierarchy that reflects the observability of significant market inputs. The three levels of the fair value hierarchy are defined below.
Quoted market prices – Level 1
Assets and liabilities are classified as Level 1 if their value is observable in an active market. Such instruments are valued by reference to unadjusted quoted prices for identical assets or liabilities in active markets where the quoted price is readily available, and the price represents actual and regularly occurring market transactions. An active market is one in which transactions occur with sufficient volume and frequency to provide pricing information on an ongoing basis.
Valuation technique using observable inputs – Level 2
Assets and liabilities classified as Level 2 have been valued using models whose inputs are observable either directly or indirectly. Valuations based on observable inputs include assets and liabilities such as swaps and forwards which are valued using market standard pricing techniques, and options that are commonly traded in markets where all the inputs to the market standard pricing models are observable.
Valuation technique using significant unobservable inputs – Level 3
Assets and liabilities are classified as Level 3 if their valuation incorporates significant inputs that are not based on observable market data (unobservable inputs). A valuation input is considered observable if it can be directly observed from transactions in an active market, or if there is compelling external evidence demonstrating an executable exit price. Unobservable input levels are generally determined via reference to observable inputs, historical observations or using other analytical techniques.
| 246 | Barclays PLC and Barclays Bank PLC 2016 Annual Report on Form 20-F |
18 Fair value of financial instrumentscontinued
The following table shows the Groups’ assets and liabilities that are held at fair value disaggregated by valuation technique (fair value hierarchy) and balance sheet classification:
Assets and liabilities held at fair value | ||||||||||||||||
| Valuation technique using | ||||||||||||||||
| | Quoted market prices (Level 1) £m | | | Observable inputs (Level 2) £m |
| | Significant unobservable inputs (Level 3) £m |
| | Total £m |
| |||||
As at 31 December 2016 | ||||||||||||||||
Trading portfolio assets | 41,550 | 36,625 | 2,065 | 80,240 | ||||||||||||
Financial assets designated at fair value | 4,031 | 64,630 | 9,947 | 78,608 | ||||||||||||
Derivative financial assets | 5,261 | 332,819 | 8,546 | 346,626 | ||||||||||||
Available for sale investments | 21,218 | 36,551 | 372 | 58,141 | ||||||||||||
Investment property | – | – | 81 | 81 | ||||||||||||
Assets included in disposal groups classified as held for salea | 6,754 | 8,511 | 6,009 | 21,274 | ||||||||||||
Total assets | 78,814 | 479,136 | 27,020 | 584,970 | ||||||||||||
Trading portfolio liabilities | (20,205 | ) | (14,475 | ) | (7 | ) | (34,687 | ) | ||||||||
Financial liabilities designated at fair value | (70 | ) | (95,121 | ) | (840 | ) | (96,031 | ) | ||||||||
Derivative financial liabilities | (5,051 | ) | (328,265 | ) | (7,171 | ) | (340,487 | ) | ||||||||
Liabilities included in disposal groups classified as held for salea | (397 | ) | (5,224 | ) | (6,201 | ) | (11,822 | ) | ||||||||
Total liabilities | (25,723 | ) | (443,085 | ) | (14,219 | ) | (483,027 | ) | ||||||||
As at 31 December 2015 | ||||||||||||||||
Trading portfolio assets | 36,676 | 35,725 | 4,947 | 77,348 | ||||||||||||
Financial assets designated at fair value | 6,163 | 52,909 | 17,758 | 76,830 | ||||||||||||
Derivative financial assets | 6,342 | 315,949 | 5,418 | 327,709 | ||||||||||||
Available for sale investments | 42,552 | 46,693 | 1,022 | 90,267 | ||||||||||||
Investment property | – | – | 140 | 140 | ||||||||||||
Assets included in disposal groups classified as held for salea | 26 | 8 | 7,330 | 7,364 | ||||||||||||
Total assets | 91,759 | 451,284 | 36,615 | 579,658 | ||||||||||||
Trading portfolio liabilities | (23,978 | ) | (9,989 | ) | – | (33,967 | ) | |||||||||
Financial liabilities designated at fair value | (240 | ) | (90,203 | ) | (1,302 | ) | (91,745 | ) | ||||||||
Derivative financial liabilities | (5,450 | ) | (314,033 | ) | (4,769 | ) | (324,252 | ) | ||||||||
Liabilities included in disposal groups classified as held for salea | (1,024 | ) | (802 | ) | (4,171 | ) | (5,997 | ) | ||||||||
Total liabilities | (30,692 | ) | (415,027 | ) | (10,242 | ) | (455,961 | ) | ||||||||
Note
| a | Disposal groups held for sale and measured at fair value less cost to sell are included in the fair value table. For disposal groups measured at carrying amount, the underlying financial assets and liabilities measured at fair value are included in the fair value disclosures on pages 247 to 260 and items measured at amortised cost are included on page 261.Non-financial assets (£6.6bn) and liabilities (£1.7bn) within disposal groups measured at carrying amount are excluded from these disclosures. |
| Barclays PLC and Barclays Bank PLC 2016 Annual Report on Form 20-F | 247 |
Notes to the financial statements
Assets and liabilities held at fair value
18 Fair value of financial instrumentscontinued
The following table shows the Group’s assets and liabilities that are held at fair value disaggregated by valuation technique (fair value hierarchy) and product type.
Assets and liabilities held at fair value by product type | ||||||||||||||||||||||||
| Assets | Liabilities | |||||||||||||||||||||||
| Valuation technique using | Valuation technique using | |||||||||||||||||||||||
| | Quoted market prices (Level 1) £m |
| | Observable inputs (Level 2) £m |
| | Significant unobservable inputs (Level 3) £m |
| | Quoted market prices (Level 1) £m |
| | Observable inputs (Level 2) £m |
| | Significant unobservable inputs (Level 3) £m |
| |||||||
As at 31 December 2016 | ||||||||||||||||||||||||
Interest rate derivatives | – | 222,892 | 5,759 | – | (215,213 | ) | (4,860 | ) | ||||||||||||||||
Foreign exchange derivatives | – | 79,612 | 132 | – | (78,263 | ) | (51 | ) | ||||||||||||||||
Credit derivatives | – | 14,662 | 1,611 | – | (14,844 | ) | (241 | ) | ||||||||||||||||
Equity derivatives | 4,210 | 11,842 | 1,037 | (4,058 | ) | (15,808 | ) | (2,007 | ) | |||||||||||||||
Commodity derivatives | 1,052 | 3,809 | 8 | (991 | ) | (4,138 | ) | (13 | ) | |||||||||||||||
Government and government sponsored debt | 31,203 | 49,834 | 3 | (12,761 | ) | (11,454 | ) | – | ||||||||||||||||
Corporate debt | 46 | 11,921 | 969 | (27 | ) | (1,907 | ) | (5 | ) | |||||||||||||||
Certificates of deposit, commercial paper and other money market instruments | – | 994 | – | – | (6,936 | ) | (319 | ) | ||||||||||||||||
Reverse repurchase and repurchase agreements | – | 63,162 | – | – | (55,710 | ) | – | |||||||||||||||||
Non-asset backed loans | – | 2,888 | 8,767 | – | – | – | ||||||||||||||||||
Asset backed securities | – | 1,956 | 515 | – | (256 | ) | – | |||||||||||||||||
Commercial real estate loans | – | – | 442 | – | – | – | ||||||||||||||||||
Issued debt | – | – | – | – | (31,973 | ) | (298 | ) | ||||||||||||||||
Equity cash products | 35,399 | 6,478 | 150 | (7,416 | ) | (934 | ) | (2 | ) | |||||||||||||||
Funds and fund linked products | 53 | 137 | 273 | – | (170 | ) | (37 | ) | ||||||||||||||||
Private equity investments | 23 | 110 | 856 | – | (18 | ) | (12 | ) | ||||||||||||||||
Assets and liabilities held for sale | 6,754 | 8,511 | 6,009 | (397 | ) | (5,224 | ) | (6,201 | ) | |||||||||||||||
Othera | 74 | 328 | 489 | (73 | ) | (237 | ) | (173 | ) | |||||||||||||||
Total | 78,814 | 479,136 | 27,020 | (25,723 | ) | (443,085 | ) | (14,219 | ) | |||||||||||||||
As at 31 December 2015 | ||||||||||||||||||||||||
Interest rate derivatives | – | 228,751 | 2,675 | – | (218,864 | ) | (2,247 | ) | ||||||||||||||||
Foreign exchange derivatives | 2 | 54,839 | 95 | (4 | ) | (58,594 | ) | (196 | ) | |||||||||||||||
Credit derivatives | – | 16,279 | 1,902 | – | (16,405 | ) | (219 | ) | ||||||||||||||||
Equity derivatives | 3,830 | 9,279 | 690 | (2,870 | ) | (14,037 | ) | (1,545 | ) | |||||||||||||||
Commodity derivatives | 2,510 | 6,801 | 56 | (2,576 | ) | (6,133 | ) | (562 | ) | |||||||||||||||
Government and government sponsored debt | 55,150 | 52,967 | 419 | (15,036 | ) | (5,474 | ) | (1 | ) | |||||||||||||||
Corporate debt | 352 | 11,598 | 2,895 | (234 | ) | (4,558 | ) | (15 | ) | |||||||||||||||
Certificates of deposit, commercial paper and other money market instruments | 82 | 503 | – | (5 | ) | (6,955 | ) | (382 | ) | |||||||||||||||
Reverse repurchase and repurchase agreements | – | 49,513 | – | – | (50,838 | ) | – | |||||||||||||||||
Non-asset backed loans | – | 1,931 | 16,828 | – | – | – | ||||||||||||||||||
Asset backed securities | – | 12,009 | 770 | – | (384 | ) | (37 | ) | ||||||||||||||||
Commercial real estate loans | – | – | 551 | – | – | – | ||||||||||||||||||
Issued debt | – | – | – | – | (29,695 | ) | (546 | ) | ||||||||||||||||
Equity cash products | 29,704 | 4,038 | 171 | (8,943 | ) | (221 | ) | – | ||||||||||||||||
Funds and fund linked products | – | 1,649 | 378 | – | (1,601 | ) | (148 | ) | ||||||||||||||||
Private equity investments | 7 | 283 | 1,388 | – | – | – | ||||||||||||||||||
Assets and liabilities held for sale | 26 | 8 | 7,330 | (1,024 | ) | (802 | ) | (4,171 | ) | |||||||||||||||
Othera | 96 | 836 | 467 | – | (466 | ) | (173 | ) | ||||||||||||||||
Total | 91,759 | 451,284 | 36,615 | (30,692 | ) | (415,027 | ) | (10,242 | ) | |||||||||||||||
Note
| a | Other includes asset backed loans, physical commodities and investment property. |
| 248 | Barclays PLC and Barclays Bank PLC 2016 Annual Report on Form 20-F |
18 Fair value of financial instrumentscontinued
Valuation techniques and sensitivity analysis
Sensitivity analysis is performed on products with significant unobservable inputs (Level 3) to generate a range of reasonably possible alternative valuations. The sensitivity methodologies applied take account of the nature of the valuation techniques used, as well as the availability and reliability of observable proxy and historical data and the impact of using alternative models.
Sensitivities are dynamically calculated on a monthly basis. The calculation is based on range or spread data of a reliable reference source or a scenario based on relevant market analysis alongside the impact of using alternative models. Sensitivities are calculated without reflecting the impact of any diversification in the portfolio.
The valuation techniques used for the material products within Levels 2 and 3, and observability and sensitivity analysis for products within Level 3, are described below.
Interest rate derivatives
Description: These are derivatives linked to interest rates or inflation indices. This category includes futures, interest rate and inflation swaps, swaptions, caps, floors, inflation options, balance guaranteed swaps and other exotic interest rate derivatives.
Valuation: Interest rate derivative cash flows are valued using interest rate yield curves whereby market data is used to construct the term structure of forward rates. This is then used to project and discount future cash flows based on the parameters of the trade. Instruments with optionality are valued using volatilities implied from market inputs. Exotic interest rate derivatives are valued using industry standard and bespoke models based on observable and unobservable market parameter inputs. Input parameters include interest rates, volatilities, correlations and others as appropriate. Inflation forward curves and interest rate yield curves may be extrapolated beyond observable tenors.
Balance guaranteed swaps are valued using cash flow models that calculate fair value based on loss projections, prepayment, recovery and discount rates. These parameters are determined by reference to underlying asset performance.
Observability: In general, input parameters are deemed observable up to liquid maturities which are determined separately for each parameter and underlying. Certain correlation, convexity, long dated forwards and volatility exposures are unobservable beyond liquid maturities. Unobservable market data and model inputs are set by referencing liquid market instruments and applying extrapolation techniques or inferred via another reasonable method.
Level 3 sensitivity: Sensitivity relating to unobservable valuation inputs is based on the dispersion of consensus data services where available, otherwise stress scenarios or historic data are used.
Foreign exchange derivatives
Description: These are derivatives linked to the foreign exchange (FX) market. This category includes FX forward contracts, FX swaps and FX options. The vast majority are traded as over the counter (OTC) derivatives.
Valuation: Exotic andnon-exotic derivatives are valued using industry standard and bespoke models. Input parameters include FX rates, interest rates, FX volatilities, interest rate volatilities, FX interest rate correlations and others as appropriate. Unobservable model inputs are set by referencing liquid market instruments and applying extrapolation techniques to match the appropriate risk profile.
Observability: Certain correlations, long dated forwards and volatilities are unobservable beyond liquid maturities.
Level 3 sensitivity: Sensitivity relating to unobservable valuation inputs is primarily based on the dispersion of consensus data services.
Credit derivatives
Description: These are derivatives linked to the credit spread of a referenced entity, index or basket of referenced entities or a pool of referenced assets via securitisation. This category includes single name and index credit default swaps (CDS), asset backed CDS, synthetic CDOs andNth-to-default basket swaps.
Valuation: CDS are valued using a market standard model that incorporates the credit curve as its principal input. Credit spreads are observed directly from broker data, third-party vendors or priced to proxies. Where credit spreads are unobservable, they are determined with reference to recent transactions or proxied from bond spreads on observable trades of the same issuer or other similar entities. Synthetic CDOs are valued using a model that calculates fair value based on credit spreads, recovery rates, correlations and interest rates, and is calibrated to the index tranche market.
Observability: CDS contracts referencing entities that are not actively traded are considered unobservable. The correlation input to synthetic CDO valuation is considered unobservable as it is proxied from the observable index tranche market. Where an asset backed credit derivative does not have an observable market price and the valuation is determined using a model, an instrument is considered unobservable.
Level 3 sensitivity: The sensitivity of valuations of the illiquid CDS portfolio is determined by applying a shift to each spread curve. The shift is based on the average range of pricing observed in the market for similar CDS. Synthetic CDO sensitivity is calculated using correlation levels derived from the range of contributors to a consensus bespoke service.
Equity derivatives
Description: These are derivatives linked to equity indices and single names. This category includes exchange traded and OTC equity derivatives including vanilla and exotic options.
Valuation: The valuations of OTC equity derivatives are determined using industry standard models. Input parameters include stock prices, dividends, volatilities, interest rates, equity repo curves and, for multi-asset products, correlations. Unobservable model inputs are determined by reference to liquid market instruments and applying extrapolation techniques to match the appropriate risk profile.
Observability: In general, input parameters are deemed observable up to liquid maturities which are determined separately for each parameter and underlying.
Level 3 sensitivity: Sensitivity is estimated based on the dispersion of consensus data services either directly or through proxies.
Commodity derivatives
Description: These products are exchange traded and OTC derivatives based on underlying commodities such as metals, crude oil and refined products, agricultural, power and natural gas.
| Barclays PLC and Barclays Bank PLC 2016 Annual Report on Form 20-F | 249 |
Notes to the financial statements
Assets and liabilities held at fair value
18 Fair value of financial instrumentscontinued
Valuation: The valuations of commodity swaps and options are determined using models incorporating discounting of cash flows and other industry standard modelling techniques. Valuation inputs include forward curves, volatilities implied from market observable inputs and correlations. Unobservable inputs are set with reference to similar observable products or by applying extrapolation techniques from the observable market.
Observability: Certain correlations, forward curves and volatilities for longer dated exposures are unobservable.
Level 3 sensitivity: Sensitivity is determined primarily by measuring historical variability over two years. Where historical data is unavailable or uncertainty is due to volumetric risk, sensitivity is measured by applying appropriate stress scenarios or using proxybid-offer spread levels.
Complex derivative instruments
Valuation estimates made by counterparties with respect to complex derivative instruments, for the purpose of determining the amount of collateral to be posted, often differ, sometimes significantly, from Barclays’ own estimates. In almost all cases, Barclays has been able to successfully resolve such differences or otherwise reach an accommodation with respect to collateral posting levels, including in certain cases by entering into compromise collateral arrangements. Due to the ongoing nature of collateral calls, Barclays will often be engaged in discussion with one or more counterparties in respect of such differences at any given time. Valuation estimates made by counterparties for collateral purposes are considered, like any other third-party valuation, when determining Barclays’ fair value estimates.
Government and government sponsored debt
Description: These are government bonds, supra sovereign bonds and agency bonds.
Valuation: Liquid government bonds actively traded through an exchange or clearing house are marked to the closing levels observed in these markets. Less liquid bonds are valued using observable market prices which are sourced from broker quotes, inter-dealer prices or other reliable pricing services. Where there are no observable market prices, fair value is determined by reference to yields on other bonds from the same issuer.
Observability: Where an observable market price is not available the bond is considered Level 3.
Level 3 sensitivity: Sensitivity is calculated by using the range of observable proxy prices.
Corporate debt
Description: This primarily contains corporate bonds.
Valuation: Corporate bonds are valued using observable market prices which are sourced from broker quotes, inter-dealer prices or other reliable pricing services. Where there are no observable market prices, fair value is determined by reference to either issuances or CDS spreads of the same issuer as proxy inputs to obtain discounted cash flow amounts. In the absence of observable bond or CDS spreads for the respective issuer, similar reference assets or sector averages are applied as a proxy (the appropriateness of proxies being assessed based on issuer, coupon, maturity and industry).
Observability: Where an observable market price is not available the security is considered Level 3.
Level 3 sensitivity: The sensitivity of the corporate bonds portfolio is determined by applying a shift to each underlying position driven by average ranges of external levels observed in the market for similar bonds.
Certificates of Deposit, Commercial Paper and other money market instruments
Description: These are certificates of deposit, commercial paper and other money market instruments.
Valuation: Certificates of deposit and commercial paper are valued using observable market prices which are sourced from broker quotes inter-dealer prices or other reliable pricing services. Where there are no observable market prices, fair value is determined by reference to either issuances or CDS spreads of the same issuer as proxy inputs to obtain discounted cash flow amounts. In the absence of observable bond or CDS spreads for the respective issuer, similar reference assets or sector averages are applied as a proxy (the appropriateness of proxies being assessed based on issuer, coupon, maturity and industry).
Observability: Where an observable market price is not available the instrument is considered Level 3.
Level 3 sensitivity: Sensitivity is calculated by using the range of observable proxy prices.
Reverse repurchase and repurchase agreements
Description: These include securities purchased under resale agreements, securities sold under repurchase agreements, and other similar secured lending agreements.
Valuation: Reverse repurchase and repurchase agreements are valued by discounting the expected future cash flows. The inputs to the valuation include interest rates and repo rates, which are determined based on the specific parameters of the transaction.
Observability: In general, input parameters are deemed observable up to liquid maturities, as determined based on the specific parameters of the transaction. Unobservable market data and model inputs are set by referencing liquid market instruments and applying extrapolation techniques or inferred via another reasonable method.
Level 3 sensitivity: Sensitivity relating to unobservable valuation inputs is based on the dispersion of consensus data services where available, otherwise stress scenarios or historic data are used. In general, the sensitivity of unobservable inputs is insignificant to the overall balance sheet valuation given the predominantly short-term nature of the agreements.
Non-asset backed loans
Description: This category is largely made up of fixed rate loans, primarily the ESHLA portfolio, which are valued using models that discount expected future cash flows.
Valuation: Fixed rate loans are valued using models that calculate fair value based on observable interest rates and unobservable loan spreads. Unobservable loan spreads incorporate funding costs, the level of comparable assets such as gilts, issuer credit quality and other factors.
Observability: Within this population, the unobservable input is the loan spread.
Level 3 sensitivity: The sensitivity of fixed rate loans is calculated by applying a shift to loan spreads.
| 250 | Barclays PLC and Barclays Bank PLC 2016 Annual Report on Form 20-F |
18 Fair value of financial instrumentscontinued
Asset backed securities
Description: These are securities that are linked to the cash flows of a pool of referenced assets via securitisation. This category includes residential mortgage backed securities, commercial mortgage backed securities, CDOs, collaterallised loan obligations (CLOs) and other asset backed securities.
Valuation: Where available, valuations are based on observable market prices which are sourced from broker quotes and inter-dealer prices. Otherwise, valuations are determined using industry standard discounted cash flow analysis that calculates the fair value based on valuation inputs such as constant default rate, conditional prepayment rate, loss given default and yield. These inputs are determined by reference to a number of sources including proxying to observed transactions, market indices or market research, and by assessing underlying collateral performance.
Proxying to observed transactions, indices or research requires an assessment and comparison of the relevant securities’ underlying attributes including collateral, tranche, vintage, underlying asset composition (historical losses, borrower characteristics and loan attributes such asloan-to-value ratio and geographic concentration) and credit ratings (original and current).
Observability: Where an asset backed product does not have an observable market price and the valuation is determined using a discounted cash flow analysis, the instrument is considered unobservable.
Level 3 sensitivity: The sensitivity analysis for asset backed products is based on externally sourced pricing dispersion or by stressing the inputs of discount cash flow analysis.
Commercial real estate loans
Description: This portfolio includes loans that are secured by a range of commercial property types including retail, hotel, office, multi-family and industrial properties.
Valuation: Performing loans are valued using discounted cash flow analysis which considers the characteristics of the loan such as property type, geographic location, credit quality and property performance reviews in order to determine an appropriate credit spread. Where there is significant uncertainty regarding loan performance, valuation is based on independent third-party appraisals or bids for the underlying properties. Independent third party appraisals are determined by discounted cash flow analysis. The key valuation inputs are yield and loss given default.
Observability: Since each commercial real estate loan is unique in nature and the secondary loan market is relatively illiquid, valuation inputs are generally considered unobservable.
Level 3 sensitivity: For performing loans, sensitivity is determined by stressing the credit spread for each loan. For loans which have significant uncertainty regarding loan performance, sensitivity is determined by either a range of bids or by stressing the inputs to independent third party appraisals.
Issued debt
Description: This category contains Barclays issued notes.
Valuation: Fair valued Barclays issued notes are valued using discounted cash flow techniques and industry standard models incorporating various input parameters observed for each parameter or instrument.
Observability: Barclays issued notes are generally observable. Structured notes are debt instruments containing embedded derivatives. Where either an input to the embedded derivative or the debt instrument is deemed unobservable and significant to the overall valuation of the note, the structured note is classified as Level 3.
Level 3 sensitivity: Sensitivity to the unobservable input in the embedded derivative is calculated in line with the method used for the derivative instrument concerned.
Equity cash products
Description: This category includes listed equities, Exchange Traded Funds (ETF) and preference shares.
Valuation: Valuation of equity cash products is primarily determined through market observable prices.
Observability: Prices are generally observed in the market. Where a price for an equity security is not available, the instrument is considered unobservable.
Level 3 sensitivity: Sensitivity is calculated based on a stressed valuation on the underlying asset.
Funds and fund linked products
Description: This category includes holdings in hedge funds and funds of funds.
Valuation: In general, fund holdings are valued based on the latest available valuation received from the fund administrator. In the case of illiquid fund holdings the valuation will take account of all available information in relation to the underlying fund or collection of funds and may be adjusted relative to the performance of relevant index benchmarks.
Observability: Funds are deemed unobservable where the fund is either suspended, in wind-down, has a redemption restriction that severely affects liquidity, or where the latest net asset value from the fund administrators is older than the frequency dictated by the fund offering documents.
Level 3 sensitivity: Sensitivity is calculated on an individual fund basis using a loss-based scenario approach which factors in the underlying assets of the specific fund and assumed recovery rates.
| Barclays PLC and Barclays Bank PLC 2016 Annual Report on Form 20-F | 251 |
Notes to the financial statements
Assets and liabilities held at fair value
18 Fair value of financial instrumentscontinued
Private equity investments
Description: This category includes private equity investments.
Valuation: Private equity investments are valued in accordance with the ‘International Private Equity and Venture Capital Valuation Guidelines’. These require the use of a number of individual pricing benchmarks such as the prices of recent transactions in the same or similar entities, discounted cash flow analysis and comparison with the earnings multiples of listed comparative companies. Full valuations are generally performed at leastbi-annually, with the positions reviewed periodically for material events that might impact upon fair value. The valuation of unquoted equity instruments is subjective by nature. However, the relevant methodologies are commonly applied by other market participants and have been consistently applied over time.
Observability: Unobservable inputs include earnings estimates, multiples of comparative companies, marketability discounts and discount rates.
Level 3 sensitivity: The relevant valuation models are each sensitive to a number of key assumptions, such as projected future earnings, comparator multiples, marketability discounts and discount rates. Valuation sensitivity is estimated by flexing such assumptions to reasonable alternative levels and determining the impact on the resulting valuation.
Assets and liabilities held for sale
Description: Assets and liabilities held for sale materially consist of the intention to dispose of BAGL, France, Egypt, BVP and Zimbabwe.
Valuation: Assets and liabilities held for sale are valued at the lower of carrying value and fair value less cost to sell.
Level 3 sensitivity: The disposal groups that are measured at fair value less cost to sell are valued at the agreed price less costs to sell and are not expected to display significant sensitivity. The sensitivity of the assets and liabilities measured at carrying value is explained within the relevant product descriptions.
Other
Description: Other includes asset-backed loans, physical commodities and investment property.
Assets and liabilities reclassified between Level 1 and Level 2
There were transfers of £2,340m of government bond assets during the period from Level 2 to Level 1 to reflect the market observability of these product types (2015: £537m assets and £801m liabilities of equity and foreign exchange derivatives transferred from Level 1 to Level 2).
Level 3 movement analysis
The following table summarises the movements in the Level 3 balances during the period. The table shows gains and losses and includes amounts for all financial assets and liabilities that are held at fair value transferred to, and from, Level 3 during the period. Transfers have been reflected as if they had taken place at the beginning of the year.
Assets and liabilities included in disposal groups classified as held for sale and measured at fair value less cost to sell are not included as these are measured at fair value on anon-recurring basis.
Asset and liability transfers between Level 2 and Level 3 are primarily due to i) an increase or decrease in observable market activity related to an input or ii) a change in the significance of the unobservable input, with assets and liabilities classified as Level 3 if an unobservable input is deemed significant.
During the year:
| ☒ | £2.1bn corporate bonds were transferred from Level 3 to Level 2 to reflect the market observability of the products; |
| ☒ | £8.6bn ofnon-asset backed loans were derecognised due to a substantial modification of terms on the ESHLA loans. The new restructured loans are measured on an amortised cost basis; and |
| ☒ | Market moves in the interest rate and inflation markets have resulted in an increase in the value of the Level 3 assets being reported, the gains have largely been offset through Level 2 hedges. |
| 252 | Barclays PLC and Barclays Bank PLC 2016 Annual Report on Form 20-F |
18 Fair value of financial instrumentscontinued
Analysis of movements in Level 3 assets and liabilities |
| |||||||||||||||||||||||||||||||||||||||||||
| Total gains and | ||||||||||||||||||||||||||||||||||||||||||||
| losses in the period | Total | |||||||||||||||||||||||||||||||||||||||||||
| recognised in the | gains or | |||||||||||||||||||||||||||||||||||||||||||
| As at | income statement | losses re- | Transfers | As at 31 | ||||||||||||||||||||||||||||||||||||||||
| 1 January | Settle- | Trading | Other | cognised | December | |||||||||||||||||||||||||||||||||||||||
| 2016a | Purchases | Sales | Issues | ments | income | income | in OCI | In | Out | 2016 | ||||||||||||||||||||||||||||||||||
| £m | £m | £m | £m | £m | £m | £m | £m | £m | £m | £m | ||||||||||||||||||||||||||||||||||
Government and government sponsored debt | 320 | – | (317 | ) | – | – | – | – | – | – | – | 3 | ||||||||||||||||||||||||||||||||
Corporate debt | 2,843 | 38 | (48 | ) | – | (5 | ) | 206 | – | – | 32 | (2,097 | ) | 969 | ||||||||||||||||||||||||||||||
Non-asset backed loans | 507 | 173 | (498 | ) | – | (4 | ) | (38 | ) | – | – | 18 | (7 | ) | 151 | |||||||||||||||||||||||||||||
Asset backed securities | 743 | 129 | (295 | ) | – | (171 | ) | 111 | – | – | 1 | (3 | ) | 515 | ||||||||||||||||||||||||||||||
Funds and fund linked products | 340 | – | (77 | ) | – | – | 23 | – | – | 1 | (14 | ) | 273 | |||||||||||||||||||||||||||||||
Other | 155 | 59 | (16 | ) | – | (1 | ) | (8 | ) | – | – | – | (35 | ) | 154 | |||||||||||||||||||||||||||||
Trading portfolio assets | 4,908 | 399 | (1,251 | ) | – | (181 | ) | 294 | – | – | 52 | (2,156 | ) | 2,065 | ||||||||||||||||||||||||||||||
Non-asset backed loans | 15,963 | – | – | – | (8,602 | ) | 1,155 | 100 | – | – | – | 8,616 | ||||||||||||||||||||||||||||||||
Asset backed loans | 256 | 48 | (225 | ) | – | (20 | ) | 30 | – | – | 112 | – | 201 | |||||||||||||||||||||||||||||||
Commercial real estate loans | 543 | 2,658 | (2,755 | ) | – | (12 | ) | 56 | – | – | – | (48 | ) | 442 | ||||||||||||||||||||||||||||||
Private equity investments | 457 | 38 | (51 | ) | – | (3 | ) | 16 | 120 | – | 6 | (21 | ) | 562 | ||||||||||||||||||||||||||||||
Other | 78 | – | – | – | (21 | ) | (19 | ) | 85 | – | 41 | (38 | ) | 126 | ||||||||||||||||||||||||||||||
Financial assets designated at fair value | 17,297 | 2,744 | (3,031 | ) | – | (8,658 | ) | 1,238 | 305 | – | 159 | (107 | ) | 9,947 | ||||||||||||||||||||||||||||||
Private equity investments | 877 | 15 | (254 | ) | – | (407 | ) | – | – | 63 | – | – | 294 | |||||||||||||||||||||||||||||||
Other | 44 | 53 | (14 | ) | – | (16 | ) | – | 4 | 7 | 1 | (1 | ) | 78 | ||||||||||||||||||||||||||||||
Available for sale investments | 921 | 68 | (268 | ) | – | (423 | ) | – | 4 | 70 | 1 | (1 | ) | 372 | ||||||||||||||||||||||||||||||
Investment property | 82 | – | (3 | ) | – | – | – | 2 | – | – | – | 81 | ||||||||||||||||||||||||||||||||
Trading portfolio liabilities | – | – | (9 | ) | – | – | (1 | ) | – | – | – | 3 | (7 | ) | ||||||||||||||||||||||||||||||
Certificates of deposit, commercial paper and other money market instruments | (272 | ) | – | – | (19 | ) | 48 | 2 | (7 | ) | – | (301 | ) | 230 | (319 | ) | ||||||||||||||||||||||||||||
Issued debt | (538 | ) | – | – | – | 231 | – | 9 | – | – | – | (298 | ) | |||||||||||||||||||||||||||||||
Other | (244 | ) | – | – | – | 83 | (48 | ) | (2 | ) | – | (50 | ) | 38 | (223 | ) | ||||||||||||||||||||||||||||
Financial liabilities designated at fair value | (1,054 | ) | – | – | (19 | ) | 362 | (46 | ) | – | – | (351 | ) | 268 | (840 | ) | ||||||||||||||||||||||||||||
Interest rate derivatives | 418 | 45 | 3 | – | (6 | ) | 228 | – | – | 294 | (83 | ) | 899 | |||||||||||||||||||||||||||||||
Foreign exchange derivatives | (104 | ) | – | 30 | 2 | 40 | 6 | – | – | 55 | 52 | 81 | ||||||||||||||||||||||||||||||||
Credit derivatives | 1,685 | 2 | (306 | ) | – | (119 | ) | 111 | – | – | 3 | (6 | ) | 1,370 | ||||||||||||||||||||||||||||||
Equity derivatives | (857 | ) | 196 | 7 | (83 | ) | (34 | ) | (98 | ) | – | – | (15 | ) | (86 | ) | (970 | ) | ||||||||||||||||||||||||||
Commodity derivatives | (506 | ) | – | – | – | 91 | (3 | ) | – | – | – | 413 | (5 | ) | ||||||||||||||||||||||||||||||
Net derivative financial instrumentsb | 636 | 243 | (266 | ) | (81 | ) | (28 | ) | 244 | – | – | 337 | 290 | 1,375 | ||||||||||||||||||||||||||||||
| Assets and liabilities held for sale | 424 | 126 | (166 | ) | (116 | ) | 85 | – | 172 | – | – | 49 | 574 | |||||||||||||||||||||||||||||||
Total | 23,214 | 3,580 | (4,994 | ) | (216 | ) | (8,843 | ) | 1,729 | 483 | 70 | 198 | (1,654 | ) | 13,567 | |||||||||||||||||||||||||||||
Net liabilities held for sale measured at fair value onnon-recurring basis | (766 | ) | ||||||||||||||||||||||||||||||||||||||||||
Total | 23,214 | 3,580 | (4,994 | ) | (216 | ) | (8,843 | ) | 1,729 | 483 | 70 | 198 | (1,654 | ) | 12,801 | |||||||||||||||||||||||||||||
Notes
| a | The Level 3 opening balances have been amended to exclude the asset and liabilities held for sale. |
| b | The derivative financial instruments are represented on a net basis. On a gross basis, derivative financial assets are £8,546m (2015: £5,418m) and derivative financial liabilities are £7,171m (2015: £4,769m). |
| Barclays PLC and Barclays Bank PLC 2016 Annual Report on Form 20-F | 253 |
Notes to the financial statements
Assets and liabilities held at fair value
18 Fair value of financial instrumentscontinued |
| |||||||||||||||||||||||||||||||||||||||||||
Analysis of movements in Level 3 assets and liabilities |
| |||||||||||||||||||||||||||||||||||||||||||
| Total gains and | ||||||||||||||||||||||||||||||||||||||||||||
| losses in the period | Total | |||||||||||||||||||||||||||||||||||||||||||
| recognised in the | gains or | |||||||||||||||||||||||||||||||||||||||||||
| As at | income statement | losses re- | Transfers | As at 31 | ||||||||||||||||||||||||||||||||||||||||
| 1 January | Trading | Other | cognised | December | ||||||||||||||||||||||||||||||||||||||||
| | 2015 £m |
| | Purchases £m | | | Sales £m |
| | Issues £m |
| | Settlements £m |
| | income £m |
| | income £m |
| | in OCI £m |
| | In £m |
| | Out £m |
| | 2015 £m |
| ||||||||||||
Government and government sponsored debt | 685 | 27 | (119 | ) | – | (109 | ) | (6 | ) | – | – | 2 | (160 | ) | 320 | |||||||||||||||||||||||||||||
Corporate debt | 3,026 | 62 | (64 | ) | – | (20 | ) | (47 | ) | – | – | 5 | (80 | ) | 2,882 | |||||||||||||||||||||||||||||
Non-asset backed loans | 273 | 520 | (251 | ) | – | (3 | ) | (42 | ) | – | – | 11 | (1 | ) | 507 | |||||||||||||||||||||||||||||
Asset backed securities | 1,610 | 1,365 | (1,565 | ) | – | (711 | ) | 58 | – | – | 5 | (19 | ) | 743 | ||||||||||||||||||||||||||||||
Funds and fund linked products | 589 | – | (174 | ) | – | (56 | ) | (27 | ) | – | – | 12 | (4 | ) | 340 | |||||||||||||||||||||||||||||
Other | 144 | 23 | (19 | ) | – | (9 | ) | (14 | ) | – | – | 53 | (23 | ) | 155 | |||||||||||||||||||||||||||||
Trading portfolio assets | 6,327 | 1,997 | (2,192 | ) | – | (908 | ) | (78 | ) | – | – | 88 | (287 | ) | 4,947 | |||||||||||||||||||||||||||||
Non-asset backed loans | 17,471 | 192 | (114 | ) | – | (756 | ) | (531 | ) | (6 | ) | – | – | – | 16,256 | |||||||||||||||||||||||||||||
Asset backed loans | 393 | 1,098 | (1,260 | ) | – | 2 | 8 | – | – | 15 | – | 256 | ||||||||||||||||||||||||||||||||
Commercial real estate loans | 1,179 | 3,540 | (3,878 | ) | – | (342 | ) | 49 | 1 | – | – | – | 549 | |||||||||||||||||||||||||||||||
Private equity investments | 701 | 94 | (200 | ) | – | (3 | ) | 8 | 38 | – | 4 | (132 | ) | 510 | ||||||||||||||||||||||||||||||
Other | 161 | 66 | (31 | ) | – | (3 | ) | (11 | ) | 5 | – | 26 | (26 | ) | 187 | |||||||||||||||||||||||||||||
Financial assets designated at fair value | 19,905 | 4,990 | (5,483 | ) | – | (1,102 | ) | (477 | ) | 38 | – | 45 | (158 | ) | 17,758 | |||||||||||||||||||||||||||||
Government and government sponsored debt | 327 | 14 | (36 | ) | – | – | – | – | 1 | – | (212 | ) | 94 | |||||||||||||||||||||||||||||||
Private equity investments | 425 | 29 | (89 | ) | – | – | – | 471 | 22 | – | 20 | 878 | ||||||||||||||||||||||||||||||||
Other | 561 | 36 | (2 | ) | – | (1,026 | ) | – | 78 | 397 | 27 | (21 | ) | 50 | ||||||||||||||||||||||||||||||
Available for sale investments | 1,313 | 79 | (127 | ) | – | (1,026 | ) | – | 549 | 420 | 27 | (213 | ) | 1,022 | ||||||||||||||||||||||||||||||
Investment property | 207 | 27 | (89 | ) | – | – | – | (5 | ) | – | – | – | 140 | |||||||||||||||||||||||||||||||
Trading portfolio liabilities | (349 | ) | – | – | – | – | – | – | – | – | 349 | – | ||||||||||||||||||||||||||||||||
Certificates of deposit, commercial paper and other money market instruments | (666 | ) | – | – | (216 | ) | 261 | – | 17 | – | – | 221 | (383 | ) | ||||||||||||||||||||||||||||||
Issued debt | (748 | ) | – | – | (16 | ) | 245 | (4 | ) | (8 | ) | – | (38 | ) | 4 | (565 | ) | |||||||||||||||||||||||||||
Other | (402 | ) | – | – | – | (19 | ) | (18 | ) | 75 | – | – | 10 | (354 | ) | |||||||||||||||||||||||||||||
Financial liabilities designated at fair value | (1,816 | ) | – | – | (232 | ) | 487 | (22 | ) | 84 | – | (38 | ) | 235 | (1,302 | ) | ||||||||||||||||||||||||||||
Interest rate derivatives | (105 | ) | 1 | 218 | – | (247 | ) | 203 | – | – | 243 | 117 | 430 | |||||||||||||||||||||||||||||||
Foreign exchange derivatives | (30 | ) | 14 | (1 | ) | (7 | ) | 9 | (14 | ) | – | – | (73 | ) | – | (102 | ) | |||||||||||||||||||||||||||
Credit derivatives | 1,557 | 273 | (12 | ) | – | (6 | ) | (123 | ) | – | – | (11 | ) | 7 | 1,685 | |||||||||||||||||||||||||||||
Equity derivatives | (845 | ) | 111 | (2 | ) | (290 | ) | 103 | 34 | – | – | (21 | ) | 52 | (858 | ) | ||||||||||||||||||||||||||||
Commodity derivatives | (152 | ) | – | – | – | (66 | ) | (6 | ) | – | – | (388 | ) | 106 | (506 | ) | ||||||||||||||||||||||||||||
Net derivative financial instrumentsa | 425 | 399 | 203 | (297 | ) | (207 | ) | 94 | – | – | (250 | ) | 282 | 649 | ||||||||||||||||||||||||||||||
Total | 26,012 | 7,492 | (7,688 | ) | (529 | ) | (2,756 | ) | (483 | ) | 666 | 420 | (128 | ) | 208 | 23,214 | ||||||||||||||||||||||||||||
Net assets held for sale measured at fair value onnon-recurring basis | 3,159 | |||||||||||||||||||||||||||||||||||||||||||
Total | 26,012 | 7,492 | (7,688 | ) | (529 | ) | (2,756 | ) | (483 | ) | 666 | 420 | (128 | ) | 208 | 26,373 | ||||||||||||||||||||||||||||
Note
| a | The derivative financial instruments are represented on a net basis. On a gross basis, derivative financial assets are £8,546m (2015: £5,418m) and derivative financial liabilities are £7,171m (2015: £4,769m). |
| 254 | Barclays PLC and Barclays Bank PLC 2016 Annual Report on Form 20-F |
18 Fair value of financial instrumentscontinued
Unrealised gains and losses on Level 3 financial assets and liabilities
The following table discloses the unrealised gains and losses recognised in the year arising on Level 3 financial assets and liabilities held at year end.
| Unrealised gains and losses recognised during the period on Level 3 assets and liabilities held at period end | ||||||||||||||||||||||||||||||||
| 2016 | 2015 | |||||||||||||||||||||||||||||||
| Income statement | Other | Income statement | Other | |||||||||||||||||||||||||||||
| compre- | compre- | |||||||||||||||||||||||||||||||
| Trading | Other | hensive | Trading | Other | hensive | |||||||||||||||||||||||||||
| income | income | income | Totala | income | income | income | Total | |||||||||||||||||||||||||
| As at 31 December | £m | £m | £m | £m | £m | £m | £m | £m | ||||||||||||||||||||||||
| Trading portfolio assets | 243 | – | – | 243 | (125 | ) | – | – | (125 | ) | ||||||||||||||||||||||
| Financial assets designated at fair value | 227 | 271 | – | 498 | (562 | ) | (17 | ) | – | (579 | ) | |||||||||||||||||||||
| Available for sale investments | – | 6 | 70 | 76 | – | (20 | ) | 488 | 468 | |||||||||||||||||||||||
| Investment property | – | 2 | – | 2 | – | (22 | ) | – | (22 | ) | ||||||||||||||||||||||
| Trading portfolio liabilities | (1 | ) | – | – | (1 | ) | (1 | ) | – | – | (1 | ) | ||||||||||||||||||||
| Financial liabilities designated at fair value | 96 | (6 | ) | – | 90 | (24 | ) | 76 | – | 52 | ||||||||||||||||||||||
| Net derivative financial instruments | 175 | – | – | 175 | 123 | – | – | 123 | ||||||||||||||||||||||||
| Assets and liabilities held for sale | – | 128 | – | 128 | – | – | – | – | ||||||||||||||||||||||||
| Total | 740 | 401 | 70 | 1,211 | (589 | ) | 17 | 488 | (84 | ) | ||||||||||||||||||||||
Note
| a | The £1.2bn unrealised gain on Level 3 assets (2015: £84m loss) is largely offset by losses on related Level 2 and Level 1 portfolio hedges. |
| Barclays PLC and Barclays Bank PLC 2016 Annual Report on Form 20-F | 255 |
Notes to the financial statements
Assets and liabilities held at fair value
| 18 Fair value of financial instrumentscontinued | ||||||||||||||||||||||||
| Sensitivity analysis of valuations using unobservable inputs | ||||||||||||||||||||||||
| Fair value | Favourable changes | Unfavourable changes | ||||||||||||||||||||||
| Total | Total | Income | Income | |||||||||||||||||||||
| assets | liabilities | statement | Equity | statement | Equity | |||||||||||||||||||
| £m | £m | £m | £m | £m | £m | |||||||||||||||||||
| As at 31 December 2016 | ||||||||||||||||||||||||
| Interest rate derivatives | 5,759 | (4,860 | ) | 209 | – | (249 | ) | – | ||||||||||||||||
| Foreign exchange derivatives | 132 | (51 | ) | 15 | – | (15 | ) | – | ||||||||||||||||
| Credit derivatives | 1,611 | (241 | ) | 127 | – | (133 | ) | – | ||||||||||||||||
| Equity derivatives | 1,037 | (2,007 | ) | 163 | – | (164 | ) | – | ||||||||||||||||
| Commodity derivatives | 8 | (13 | ) | 5 | – | (5 | ) | – | ||||||||||||||||
| Government and government sponsored debt | 3 | – | – | – | – | – | ||||||||||||||||||
| Corporate debt | 969 | (5 | ) | 7 | – | (2 | ) | – | ||||||||||||||||
| Certificates of deposit, commercial paper and other money market instruments | – | (319 | ) | – | – | (1 | ) | – | ||||||||||||||||
| Reverse repurchase and repurchase agreements | – | – | – | – | – | – | ||||||||||||||||||
| Non asset backed loans | 8,767 | – | 462 | – | (597 | ) | – | |||||||||||||||||
| Asset backed securities | 515 | – | 1 | – | (1 | ) | – | |||||||||||||||||
| Commercial real estate loans | 442 | – | 2 | – | (2 | ) | – | |||||||||||||||||
| Issued debt | – | (298 | ) | – | – | – | – | |||||||||||||||||
| Equity cash products | 150 | (2 | ) | 12 | 26 | (11 | ) | (26 | ) | |||||||||||||||
| Funds and fund linked products | 273 | (37 | ) | 6 | – | (6 | ) | – | ||||||||||||||||
| Private equity investments | 856 | (12 | ) | 104 | 18 | (104 | ) | (21 | ) | |||||||||||||||
| Assets and liabilities held for sale | 699 | (125 | ) | 3 | – | (3 | ) | – | ||||||||||||||||
| Othera | 489 | (173 | ) | 147 | – | (105 | ) | – | ||||||||||||||||
| Total | 21,710 | (8,143 | ) | 1,263 | 44 | (1,398 | ) | (47 | ) | |||||||||||||||
| As at 31 December 2015 | ||||||||||||||||||||||||
| Interest rate derivatives | 2,675 | (2,247 | ) | 93 | – | (103 | ) | – | ||||||||||||||||
| Foreign exchange derivatives | 95 | (196 | ) | 17 | – | (17 | ) | – | ||||||||||||||||
| Credit derivatives | 1,902 | (219 | ) | 66 | – | (96 | ) | – | ||||||||||||||||
| Equity derivatives | 690 | (1,545 | ) | 167 | – | (185 | ) | – | ||||||||||||||||
| Commodity derivatives | 56 | (562 | ) | 13 | – | (13 | ) | – | ||||||||||||||||
| Government and government sponsored debt | 419 | (1 | ) | 4 | – | (4 | ) | – | ||||||||||||||||
| Corporate debt | 2,895 | (15 | ) | 10 | 1 | (5 | ) | (1 | ) | |||||||||||||||
| Certificates of deposit, commercial paper and other money market instruments | – | (382 | ) | – | – | – | – | |||||||||||||||||
| Reverse repurchase and repurchase agreements | – | – | – | – | – | – | ||||||||||||||||||
| Non asset backed loans | 16,828 | – | 1,581 | – | (1,564 | ) | – | |||||||||||||||||
| Asset backed securities | 770 | (37 | ) | 1 | – | (1 | ) | – | ||||||||||||||||
| Commercial real estate loans | 551 | – | 24 | – | (1 | ) | – | |||||||||||||||||
| Issued debt | – | (546 | ) | – | – | – | – | |||||||||||||||||
| Equity cash products | 171 | – | – | 17 | – | (17 | ) | |||||||||||||||||
| Funds and fund linked products | 378 | (148 | ) | 1 | – | (1 | ) | – | ||||||||||||||||
| Private equity investments | 1,388 | – | 149 | 318 | (149 | ) | (53 | ) | ||||||||||||||||
| Othera | 467 | (173 | ) | 5 | – | (23 | ) | – | ||||||||||||||||
| Total | 29,285 | (6,071 | ) | 2,131 | 336 | (2,162 | ) | (71 | ) | |||||||||||||||
The effect of stressing unobservable inputs to a range of reasonably possible alternatives, alongside considering the impact of using alternative models, would be to increase fair values by up to £1.3bn (2015: £2.1bn) or to decrease fair values by up to £1.4bn (2015: £2.2bn) with substantially all the potential effect impacting profit and loss rather than reserves.
Note
| a | Other includes asset backed loans, physical commodities and investment property. |
| 256 | Barclays PLC and Barclays Bank PLC 2016 Annual Report on Form 20-F |
18 Fair value of financial instrumentscontinued
Significant unobservable inputs
The following table discloses the valuation techniques and significant unobservable inputs for assets and liabilities recognised at fair value and classified as Level 3 along with the range of values used for those significant unobservable inputs:
| | Total assets £m |
| | Total liabilities £m | | Valuation technique(s) | Significant unobservable inputs | | 2016 Range |
| | 2015 Range |
| Unitsa | ||||||||||||||||||||
| Min | Max | Min | Max | |||||||||||||||||||||||||||||||
Derivative financial instrumentsb | ||||||||||||||||||||||||||||||||||
Interest rate | 5,759 | (4,860 | ) | Discounted cash flows | Inflation forwards | (1 | ) | 8 | – | 8 | % | |||||||||||||||||||||||
derivatives | Credit spread | 25 | 1,669 | 25 | 1,563 | bps | ||||||||||||||||||||||||||||
| Option model | Inflation volatility | 35 | 207 | 36 | 197 | bp vol | ||||||||||||||||||||||||||||
| IR – IR correlation | (26 | ) | 98 | (55 | ) | 100 | % | |||||||||||||||||||||||||||
| FX – IR correlation | (15 | ) | 81 | (20 | ) | 30 | % | |||||||||||||||||||||||||||
| Interest rate volatility | 9 | 295 | 5 | 249 | bp vol | |||||||||||||||||||||||||||||
Credit derivatives | 1,611 | (241 | ) | Discounted cash flows | Credit spread | 133 | 274 | 140 | 413 | bps | ||||||||||||||||||||||||
| Correlation model | Credit correlation | 25 | 43 | 26 | 41 | % | ||||||||||||||||||||||||||||
| Credit spread | 13 | 2,317 | 10 | 9,923 | bps | |||||||||||||||||||||||||||||
| Comparable pricing | Price | 84 | 100 | 80 | 102 | points | ||||||||||||||||||||||||||||
Equity derivatives | 1,037 | (2,007 | ) | Option model | Equity volatility | 1 | 150 | – | 318 | % | ||||||||||||||||||||||||
| Equity – equity correlation | (90 | ) | 100 | (54 | ) | 100 | % | |||||||||||||||||||||||||||
| Equity – FX correlation | (80 | ) | 25 | (100 | ) | 40 | % | |||||||||||||||||||||||||||
Non-derivative financial instruments | ||||||||||||||||||||||||||||||||||
Corporate debt | 969 | (5 | ) | Discounted cash flows | Credit spread | 145 | 190 | 120 | 529 | bps | ||||||||||||||||||||||||
| Comparable pricing | Price | – | 121 | 1 | 114 | points | ||||||||||||||||||||||||||||
Non-asset backed loans | 8,767 | – | Discounted cash flows | Loan spread | 30 | 1,495 | 3 | 994 | bps | |||||||||||||||||||||||||
| Price | – | 99 | – | 100 | points | |||||||||||||||||||||||||||||
| Comparable pricing | Price | – | 100 | – | 101 | points | ||||||||||||||||||||||||||||
| Conditional | ||||||||||||||||||||||||||||||||||
Asset backed securities | 515 | – | Discounted cash flows | prepayment rate | – | – | – | 25 | % | |||||||||||||||||||||||||
| Constant default rate | – | – | – | 2 | % | |||||||||||||||||||||||||||||
| Loss given default | – | – | 30 | 100 | % | |||||||||||||||||||||||||||||
| Yield | – | – | 5 | 58 | % | |||||||||||||||||||||||||||||
| Credit spread | 70 | 150 | 157 | 1,416 | bps | |||||||||||||||||||||||||||||
Commercial real estate loans | 442 | – | Discounted cash flows | Loss given default | – | 100 | – | 100 | % | |||||||||||||||||||||||||
| Credit spread | 179 | 408 | 230 | 801 | bps | |||||||||||||||||||||||||||||
Private equity investments | 856 | (12 | ) | Discounted cash flows | Loss given default | – | – | – | 94 | % | ||||||||||||||||||||||||
EBITDA multiple |
EBITDA multiple |
|
5 |
|
|
17 |
|
|
– |
|
|
12 |
|
|
multiple |
| ||||||||||||||||||
Otherc
|
| 1,754
|
|
| (1,018
| )
| ||||||||||||||||||||||||||||
Total | 21,710 | (8,143 | ) | |||||||||||||||||||||||||||||||
Notes
| a | The units used to disclose ranges for significant unobservable inputs are percentages, points and basis points. Points are a percentage of par; for example, 100 points equals 100% of par. A basis point equals 1/100th of 1%; for example, 150 basis points equals 1.5%. |
| b | Certain derivative instruments are classified as Level 3 due to a significant unobservable credit spread input into the calculation of the Credit Valuation Adjustment for the instruments. The range of significant unobservable credit spreads is between65-874bps (2015:67-1,175bps). |
| c | Other includes the remaining Level 3 assets and liabilities. |
| Barclays PLC and Barclays Bank PLC 2016 Annual Report on Form 20-F | 257 |
Notes to the financial statements
Assets and liabilities held at fair value
18 Fair value of financial instrumentscontinued
The following section describes the significant unobservable inputs identified in the table above, and the sensitivity of fair value measurement of the instruments categorised as Level 3 assets or liabilities to increases in significant unobservable inputs. Where sensitivities are described, the inverse relationship will also generally apply.
Where reliable inter-relationships can be identified between significant unobservable inputs used in fair value measurement, a description of those
inter-relationships is included below.
Forwards
A price or rate that is applicable to a financial transaction that will take place in the future. A forward is generally based on the spot price or rate, adjusted for the cost of carry, and defines the price or rate that will be used to deliver a currency, bond, commodity or some other underlying instrument at a point in the future. A forward may also refer to the rate fixed for a future financial obligation, such as the interest rate on a loan payment. In general, a significant increase in a forward in isolation will result in a movement in fair value that is favourable for the contracted receiver of the underlying (currency, bond, commodity, etc.), but the sensitivity is dependent on the specific terms of the instrument.
Credit spread
Credit spreads typically represent the difference in yield between an instrument and a benchmark security or reference rate. Credit spreads reflect the additional yield that a market participant would demand for taking exposure to the credit risk of an instrument and form part of the yield used in a discounted cash flow calculation.
In general, a significant increase in credit spread in isolation will result in a movement in fair value that is unfavourable for the holder of a cash asset.
For a derivative instrument, a significant increase in credit spread in isolation can result in a movement in fair value that is favourable or unfavourable depending on the specific terms of the instrument.
Volatility
Volatility is a key input in the valuation of derivative products containing optionality. Volatility is a measure of the variability or uncertainty in returns for a given derivative underlying. It represents an estimate of how much a particular underlying instrument, parameter or index will change in value over time. In general, volatilities will be implied from observed option prices. For unobservable options the implied volatility may reflect additional assumptions about the nature of the underlying risk, as well as reflecting the given strike/maturity profile of a specific option contract.
In general a significant increase in volatility in isolation will result in a movement in fair value that is favourable for the holder of a simple option, but the sensitivity is dependent on the specific terms of the instrument.
There may be inter-relationships between unobservable volatilities and other unobservable inputs that can be implied from observation, e.g. when equity prices fall, implied equity volatilities generally rise but these are specific to individual markets and may vary over time.
Correlation
Correlation is a measure of the relationship between the movements of two variables i.e. how the change in one variable influences a change in the other variable. Correlation is a key input into valuation of derivative contracts with more than one underlying instrument. For example, where an option contract is written on a basket of underlying names, the volatility of the basket, and hence the fair value of the option, will depend on the correlation between the basket’s components. Credit correlation generally refers to the correlation between default processes for the separate names that make up the reference pool of a collateralised debt obligation structure.
A significant increase in correlation in isolation can result in a movement in fair value that is favourable or unfavourable depending on the specific terms of the instrument.
Comparable price
Comparable instrument prices are used in valuation by calculating an implied yield (or spread over a liquid benchmark) from the price of a comparable observable bond, then adjusting that yield (or spread) to derive a value for the unobservable bond. The adjustment to yield (or spread) should account for relevant differences in the bonds such as maturity or credit quality. Alternatively, aprice-to-price basis can be assumed between the comparable instrument and bond being valued in order to establish the value of the bond.
In general, a significant increase in comparable price in isolation will result in a movement in fair value that is favourable for the holder of a cash instrument.
For a derivative instrument, a significant increase in an input derived from a comparable price in isolation can result in a movement in fair value that is favourable or unfavourable depending on the specific terms of the instrument.
Loan spread
Loan spreads typically represent the difference in yield between an instrument and a benchmark security or reference rate. Loan spreads typically reflect funding costs, credit quality, the level of comparable assets such as gilts, and other factors, and form part of the yield used in a discounted cash flow calculation.
The ESHLA portfolio primarily consists of long dated fixed rate loans extended to counterparties in the UK Education, Social Housing and Local Authority sectors. The loans are categorised as Level 3 in the fair value hierarchy due to their illiquid nature and the significance of unobservable loan spreads to the valuation. Valuation uncertainty arises from the long dated nature of the portfolio, the lack of a secondary market in the loans and the lack of observable loan spreads. The majority of ESHLA loans are to borrowers in heavily regulated sectors that are considered extremely low credit risk, and have a history of zero defaults since inception. While the overall loan spread range is from 30bps to 1,495bps (2015: 3bps to 994bps), the vast majority of spreads are concentrated towards the bottom end of this range, with 99% of the loan notional being valued with spreads less than 200bps consistently for both years.
In general, a significant increase in loan spreads in isolation will result in a movement in fair value that is unfavourable for the holder of a loan.
| 258 | Barclays PLC and Barclays Bank PLC 2016 Annual Report on Form 20-F |
18 Fair value of financial instrumentscontinued
Conditional prepayment rate
Conditional prepayment rate is the proportion of voluntary, unscheduled repayments of loan principal by a borrower. Prepayment rates affect the weighted average life of securities by altering the timing of future projected cash flows.
A significant increase in a conditional prepayment rate in isolation can result in a movement in fair value that is favourable or unfavourable depending on the specific terms of the instrument.
Conditional prepayment rates are typically inversely correlated to credit spread, i.e. securities with high borrower credit spread typically experience lower prepayment rates and also tend to experience higher default rates.
Constant default rate
The constant default rate represents an annualised rate of default of the loan principal by the borrower.
A significant increase in a constant default rate in isolation can result in a movement in fair value that is favourable or unfavourable depending on the specific terms of the instrument.
Constant default rate and conditional prepayment rates are typically inversely correlated; fewer defaults on loans will typically mean higher credit quality and therefore more prepayments.
Loss given default (LGD)
Loss given default represents the expected loss upon liquidation of the collateral as a percentage of the balance outstanding.
In general, a significant increase in the LGD in isolation will translate to lower recovery and lower projected cash flows to pay to the securitisation, resulting in a movement in fair value that is unfavourable for the holder of the securitised product.
Yield
The rate used to discount projected cash flows in a discounted future cash flow analysis.
In general, a significant increase in yield in isolation will result in a movement in fair value that is unfavourable for the holder of a cash instrument.
EBITDA Multiple
EBITDA multiple is the ratio of the valuation of the investment to the earnings before interest, taxes, depreciation and amortisation.
In general an increase in the multiple is favourable to the holder of the investment.
Fair value adjustments
Key balance sheet valuation adjustments are quantified below:
| | 2016 £m | | | 2015 £m | | |||
Exit price adjustments derived from marketbid-offer spreads | (475 | ) | (509 | ) | ||||
Uncollateralised derivative funding | (82 | ) | (72 | ) | ||||
Derivative credit valuation adjustments: | ||||||||
– Monolinesa | – | (9 | ) | |||||
– Other derivative credit valuation adjustments | (237 | ) | (318 | ) | ||||
Derivative debit valuation adjustments | 242 | 189 |
Exit price adjustments derived from marketbid-offer spreads
The Group usesmid-market pricing where it is a market maker and has the ability to transact at, or better than, mid price (which is the case for certain equity, bond and vanilla derivative markets). For other financial assets and liabilities,bid-offer adjustments are recorded to reflect the exit level for the expected close out strategy. The methodology for determining thebid-offer adjustment for a derivative portfolio involves calculating the net risk exposure by offsetting long and short positions by strike and term in accordance with the risk management and hedging strategy.
Bid-offer levels are generally derived from market quotes such as broker data. Less liquid instruments may not have a directly observablebid-offer level. In such instances, an exit adjustment may be derived from an observablebid-offer level for a comparable liquid instrument, determined by calibrating to derivative prices, or by scenario or historical analysis.
Exit price adjustments have reduced by £34m to £475m as a result of risk reduction and spread tightening.
Note
| a | Derivative exposure to monoline insurers was exited in 2016. |
| Barclays PLC and Barclays Bank PLC 2016 Annual Report on Form 20-F | 259 |
Notes to the financial statements
Assets and liabilities held at fair value
18 Fair value of financial instruments continued
Discounting approaches for derivative instruments
Collateralised
In line with market practice, the methodology for discounting collateralised derivatives takes into account the nature and currency of the collateral that can be posted within the relevant credit support annex (CSA). This CSA-aware discounting approach recognises the ‘cheapest to deliver’ option that reflects the ability of the party posting collateral to change the currency of the collateral.
For counterparties in dispute regarding the settlement of collateral interest, where the relevant rate is currently negative, an additional fair value adjustment of £24m is held to account for the potential impact of resolving the dispute.
Uncollateralised
A fair value adjustment of £82m is applied to account for the impact of incorporating the cost of funding into the valuation of uncollateralised and partially collateralised derivative portfolios and collateralised derivatives where the terms of the agreement do not allow the rehypothecation of collateral received. This adjustment is referred to as the Funding Fair Value Adjustment (FFVA). FFVA has increased by £10m to £82m mainly as a result of material trade unwinds.
FFVA is determined by calculating the net expected exposure at a counterparty level and applying a funding rate to these exposures that reflects the market cost of funding. Barclays’ internal Treasury rates are used as an input to the calculation. The approach takes into account the probability of default of each counterparty, as well as any mandatory break clauses.
FFVA incorporates a scaling factor which is an estimate of the extent to which the cost of funding is incorporated into observed traded levels. On calibrating the scaling factor, it is with the assumption that Credit Valuation Adjustments (CVA) and Debit Valuation Adjustments (DVA) are retained as valuation components incorporated into such levels. The effect of incorporating this scaling factor at 31 December 2016 was to reduce FFVA by £246m (2015: £216m).
Uncollateralised derivative trading activity is used to determine this scaling factor. The trading history analysed includes new trades, terminations, trade restructures and novations. The FFVA balance and movement is driven by Barclays’ own cost of funding spread over LIBOR, counterparty default probabilities and recovery rates, as well as the market value of the underlying derivatives. Movements in the market value of the portfolio in scope for FFVA are mainly driven by interest rates, inflation rates and foreign exchange levels.
Barclays continues to monitor market practices and activity to ensure the approach to uncollateralised derivative valuation remains appropriate. The above approach has been in use since 2012 with no significant changes.
Derivative credit and debit valuation adjustments
CVAs and DVAs are incorporated into derivative valuations to reflect the impact on fair value of counterparty credit risk and Barclays’ own credit quality respectively. These adjustments are calculated for uncollateralised and partially collateralised derivatives across all asset classes. CVA and DVA are calculated using estimates of exposure at default, probability of default and recovery rates, at a counterparty level. Counterparties include (but are not limited to) corporates, sovereigns and sovereign agencies, supranationals and special purpose vehicles.
Exposure at default is generally based on expected exposure, estimated through the simulation of underlying risk factors. For some complex products, where this approach is not feasible, simplifying assumptions are made, either through approximating with a more vanilla structure, or using current or scenario-based mark to market as an estimate of future exposure. Where a strong CSA exists to mitigate counterparty credit risk, the exposure at default is set to zero.
Probability of default and recovery rate information is generally sourced from the CDS markets. For counterparties where this information is not available, or considered unreliable due to the nature of the exposure, alternative approaches are taken based on mapping internal counterparty ratings onto historical or market-based default and recovery information. In particular, this applies to sovereign-related names where the effect of using the recovery assumptions implied in CDS levels would imply a £95m (2015: £56m) increase in CVA.
Correlation between counterparty credit and underlying derivative risk factors may lead to a systematic bias in the valuation of counterparty credit risk, termed‘wrong-way,’ or‘right-way’, risk. This is not systematically incorporated into the CVA calculation but is adjusted where the underlying exposure is directly related to the counterparty.
CVA decreased by £90m to £237m, primarily due to reductions in the average maturity of the portfolio driven by trade unwinds, including a reduction in monoline CVA of £9m. DVA increased by £53m to £242m, primarily as a result of Barclays’ credit spreads widening.
Portfolio exemptions
The Group uses the portfolio exemption in IFRS 13 Fair Value Measurement to measure the fair value of groups of financial assets and liabilities.
Instruments are measured using the price that would be received to sell a net long position, i.e. an asset, for a particular risk exposure or to transfer a net short position, i.e. a liability, for a particular risk exposure in an orderly transaction between market participants at the balance sheet date under current market conditions. Accordingly, the Group measures the fair value of the group of financial assets and liabilities consistently with how market participants would price the net risk exposure at the measurement date.
Unrecognised gains as a result of the use of valuation models using unobservable inputs
The amount that has yet to be recognised in income that relates to the difference between the transaction price (the fair value at initial recognition) and the amount that would have arisen had valuation models using unobservable inputs been used on initial recognition, less amounts subsequently recognised, is £179m (2015: £187m). There are additions of £29m (2015: £42m) and £37m (2015: £51m) of amortisation and releases.
Third party credit enhancements
Structured and brokered certificates of deposit issued by Barclays are insured up to $250,000 per depositor by the Federal Deposit Insurance
Corporation (FDIC) in the US. The FDIC is funded by premiums that Barclays and other banks pay for deposit insurance coverage. The carrying value of these issued certificates of deposit that are designated under the IAS 39 fair value option includes this third party credit enhancement. Theon-balance sheet value of these brokered certificates of deposit amounted to £3,905m (2015: £3,729m).
| 260 | Barclays PLC and Barclays Bank PLC 2016 Annual Report on Form 20-F |
18 Fair value of financial instrumentscontinued
Comparison of carrying amounts and fair values for assets and liabilities not held at fair value
The following table summarises the fair value of financial assets and liabilities measured at amortised cost on the Group’s balance sheet:
| As at 31 December 2016 | | Carrying amount £m |
| | Fair value £m |
| | Quoted market prices (Level 1) £m |
| | Observable inputs (Level 2) £m |
| | Significant unobservable (Level 3) £m |
| |||||
| Financial assets | ||||||||||||||||||||
| Held to maturitya | 5,176 | 5,347 | 5,347 | – | – | |||||||||||||||
| Loans and advances to banks | 43,251 | 43,228 | 7,256 | 34,987 | 985 | |||||||||||||||
| Loans and advances to customers: | ||||||||||||||||||||
| – Home loans | 144,765 | 141,155 | – | – | 141,155 | |||||||||||||||
| – Credit cards, unsecured and other retail lending | 57,808 | 57,699 | 737 | 42 | 56,920 | |||||||||||||||
| – Finance lease receivablesb | 1,602 | 1,598 | ||||||||||||||||||
| – Corporate loans | 188,609 | 186,715 | – | 126,979 | 59,736 | |||||||||||||||
| Reverse repurchase agreements and other similar secured lending | 13,454 | 13,454 | – | 13,454 | – | |||||||||||||||
| Assets included in disposal groups classified as held for salec | 43,593 | 44,838 | 1,070 | 4,614 | 39,154 | |||||||||||||||
| Financial liabilities | ||||||||||||||||||||
| Deposits from banks | (48,214 | ) | (48,212 | ) | (5,256 | ) | (42,895 | ) | (61 | ) | ||||||||||
| Customer accounts: | ||||||||||||||||||||
| – Current and demand accounts | (138,204 | ) | (138,197 | ) | (127,258 | ) | (10,921 | ) | (18 | ) | ||||||||||
| – Savings accounts | (133,344 | ) | (133,370 | ) | (120,471 | ) | (12,891 | ) | (8 | ) | ||||||||||
| – Other time deposits | (151,630 | ) | (151,632 | ) | (48,853 | ) | (96,240 | ) | (6,539 | ) | ||||||||||
| Debt securities in issue | (75,932 | ) | (76,971 | ) | (196 | ) | (74,712 | ) | (2,063 | ) | ||||||||||
| Repurchase agreements and other similar secured borrowing | (19,760 | ) | (19,760 | ) | – | (19,760 | ) | – | ||||||||||||
| Subordinated liabilities | (23,383 | ) | (24,547 | ) | – | (24,547 | ) | – | ||||||||||||
| Liabilities included in disposal groups classified as held for salec | (51,775 | ) | (51,788 | ) | (22,264 | ) | (28,998 | ) | (526 | ) | ||||||||||
| As at 31 December 2015 | ||||||||||||||||||||
| Financial assets | ||||||||||||||||||||
| Loans and advances to banks | 41,349 | 41,301 | 5,933 | 34,125 | 1,243 | |||||||||||||||
| Loans and advances to customers: | ||||||||||||||||||||
| – Home loans | 155,863 | 151,431 | – | – | 151,431 | |||||||||||||||
| – Credit cards, unsecured and other retail lending | 67,840 | 67,805 | 1,148 | 284 | 66,373 | |||||||||||||||
| – Finance lease receivablesb | 4,776 | 4,730 | – | – | – | |||||||||||||||
| – Corporate loans | 170,738 | 169,697 | 585 | 129,847 | 39,265 | |||||||||||||||
| Reverse repurchase agreements and other similar secured lending | 28,187 | 28,187 | – | 28,187 | – | |||||||||||||||
| Financial liabilities | ||||||||||||||||||||
| Deposits from banks | (47,080 | ) | (47,080 | ) | (4,428 | ) | (42,652 | ) | – | |||||||||||
| Customer accounts: | ||||||||||||||||||||
| – Current and demand accounts | (147,122 | ) | (147,121 | ) | (130,439 | ) | (16,537 | ) | (145 | ) | ||||||||||
| – Savings accounts | (135,567 | ) | (135,600 | ) | (122,029 | ) | (13,537 | ) | (34 | ) | ||||||||||
| – Other time deposits | (135,553 | ) | (135,796 | ) | (43,025 | ) | (84,868 | ) | (7,903 | ) | ||||||||||
| Debt securities in issue | (69,150 | ) | (69,863 | ) | (190 | ) | (69,122 | ) | (551 | ) | ||||||||||
| Repurchase agreements and other similar secured borrowing | (25,035 | ) | (25,035 | ) | – | (25,035 | ) | – | ||||||||||||
| Subordinated liabilities | (21,467 | ) | (22,907 | ) | – | (22,907 | ) | – | ||||||||||||
Notes
| a | In June 2016 UK Gilts previously classified as available for sale were reclassified to held to maturity in order to reflect the intention with these assets. |
| b | The fair value hierarchy for finance lease receivables is not required as part of the standard. |
| c | Disposal groups held for sale and measured at fair value less cost to sell are in included in the fair value table. For disposal groups measured at carrying amount, the underlying financial assets and liabilities measured at fair value are included in the fair value disclosures on pages 247 to 260 and items measured at amortised cost are included on page 261. Non financial assets (£6.6bn) and liabilities (£1.7bn) within disposal groups measured at carrying amount are excluded from these disclosures. |
| Barclays PLC and Barclays Bank PLC 2016 Annual Report on Form 20-F | 261 |
Notes to the financial statements
Assets and liabilities held at fair value
18 Fair value of financial instrumentscontinued
The fair value is an estimate of the price that would be received to sell an asset or paid to transfer a liability in an orderly transaction between market participants at the measurement date. As a wide range of valuation techniques are available, it may not be appropriate to directly compare this fair value information to independent market sources or other financial institutions. Different valuation methodologies and assumptions can have a significant impact on fair values which are based on unobservable inputs.
Financial assets
The carrying value of financial assets held at amortised cost (including loans and advances to banks and customers, and other lending such as reverse repurchase agreements and cash collateral on securities borrowed) is determined in accordance with the relevant accounting policy in Note 20.
Loans and advances to banks
The fair value of loans and advances, for the purpose of this disclosure, is derived from discounting expected cash flows in a way that reflects the current market price for lending to issuers of similar credit quality. Where market data or credit information on the underlying borrowers is unavailable, a number of proxy/extrapolation techniques are employed to determine the appropriate discount rates.
There is minimal difference between the fair value and carrying amount due to the short-term nature of the lending, i.e. predominantly overnight deposits, and the high credit quality of counterparties.
Loans and advances to customers
The fair value of loans and advances to customers, for the purpose of this disclosure, is derived from discounting expected cash flows in a way that reflects the current market price for lending to issuers of similar credit quality.
For retail lending, i.e. Home loans and credit cards, tailored discounted cash flow models are used to estimate the fair value of different product types. For example, for home loans different models are used to estimate fair values of tracker, offset and fixed rate mortgage products. Key inputs to these models are the differentials between historic and current product margins and estimated prepayment rates.
The discount of fair value to carrying amount for home loans has reduced to 2.5% (2015: 2.8%) due to changes in product mix across the loan portfolio and movements in product margins.
The fair value of corporate loans is calculated by the use of discounted cash flow techniques where the gross loan values are discounted at a rate of difference between contractual margins and hurdle rates or spreads where Barclays charges a margin over LIBOR depending on credit quality and loss given default and years to maturity. The discount between the carrying and fair value has increased to 1.0% (2015: 0.6%).
Reverse repurchase agreements
The fair value of reverse repurchase agreements approximates carrying amount as these balances are generally short dated and fully collateralised.
Financial liabilities
The carrying value of financial liabilities held at amortised cost (including customer accounts, other deposits, repurchase agreements and cash collateral on securities lent, debt securities in issue and subordinated liabilities) is determined in accordance with the accounting policy in Note 22.
Deposits from banks and customer accounts
In many cases, the fair value disclosed approximates carrying value because the instruments are short term in nature or have interest rates that reprice frequently, such as customer accounts and other deposits and short-term debt securities.
The fair value for deposits with longer-term maturities such as time deposits, are estimated using discounted cash flows applying either market rates or current rates for deposits of similar remaining maturities. Consequently the fair value discount is minimal.
Debt securities in issue
Fair values of other debt securities in issue are based on quoted prices where available, or where the instruments are short dated, carrying amount approximates fair value. The fair value difference has increased to 1.4% (2015: 1.0%).
Repurchase agreements
The fair value of repurchase agreements approximates carrying amounts as these balances are generally short dated.
Subordinated liabilities
Fair values for dated and undated convertible andnon-convertible loan capital are based on quoted market rates for the issuer concerned or issuers with similar terms and conditions.
| 262 | Barclays PLC and Barclays Bank PLC 2016 Annual Report on Form 20-F |
19 Offsetting financial assets and financial liabilities
In accordance with IAS 32 Financial Instruments: Presentation, the Group reports financial assets and financial liabilities on a net basis on the balance sheet only if there is a legally enforceable right to set-off the recognised amounts and there is intention to settle on a net basis, or to realise the asset and settle the liability simultaneously. The following table shows the impact of netting arrangements on:
| ☒ | all financial assets and liabilities that are reported net on the balance sheet |
| ☒ | all derivative financial instruments and reverse repurchase and repurchase agreements and other similar secured lending and borrowing agreements that are subject to enforceable master netting arrangements or similar agreements, but do not qualify for balance sheet netting. |
The table identifies the amounts that have been offset in the balance sheet and also those amounts that are covered by enforceable netting arrangements (offsetting arrangements and financial collateral) but do not qualify for netting under the requirements of IAS 32 described above.
The ‘Net amounts’ presented below are not intended to represent the Group’s actual exposure to credit risk, as a variety of credit mitigation strategies are employed in addition to netting and collateral arrangements.
| Amounts subject to enforceable netting arrangements | Amounts | |||||||||||||||||||||||||||||||
| Effects of offsettingon-balance sheet | Related amounts not offseta | not | ||||||||||||||||||||||||||||||
| As at 31 December 2016 | | Gross amounts £m | | | Amounts offsetb £m |
| | Net amounts reported on the balance sheet £m |
| | Financial instruments £m | | | Financial collateral £m | | | Net amount | | | subject to enforceable mentsc £m |
| | Balance sheet totald | | ||||||||
Derivative financial assets | 353,078 | (11,934 | ) | 341,144 | (273,602 | ) | (49,923 | ) | 17,619 | 5,482 | 346,626 | |||||||||||||||||||||
Reverse repurchase agreements and other similar secured lendinge | 257,430 | (187,262 | ) | 70,168 | – | (69,932 | ) | 236 | 6,448 | 76,616 | ||||||||||||||||||||||
Total assets | 610,508 | (199,196 | ) | 411,312 | (273,602 | ) | (119,855 | ) | 17,855 | 11,930 | 423,242 | |||||||||||||||||||||
Derivative financial liabilities | (345,752 | ) | 10,962 | (334,790 | ) | 273,602 | 47,383 | (13,805 | ) | (5,697 | ) | (340,487 | ) | |||||||||||||||||||
Repurchase agreements and other similar secured borrowinge | (257,854 | ) | 187,262 | (70,592 | ) | – | 68,897 | (1,695 | ) | (4,878 | ) | (75,470 | ) | |||||||||||||||||||
Total liabilities | (603,606 | ) | 198,224 | (405,382 | ) | 273,602 | 116,280 | (15,500 | ) | (10,575 | ) | (415,957 | ) | |||||||||||||||||||
As at 31 December 2015 | ||||||||||||||||||||||||||||||||
Derivative financial assets | 328,692 | (7,685 | ) | 321,007 | (259,582 | ) | (42,402 | ) | 19,023 | 6,702 | 327,709 | |||||||||||||||||||||
Reverse repurchase agreements and other similar secured lending | 169,597 | (102,888 | ) | 66,709 | – | (66,400 | ) | 309 | 10,991 | 77,700 | ||||||||||||||||||||||
Total assets | 498,289 | (110,573 | ) | 387,716 | (259,582 | ) | (108,802 | ) | 19,332 | 17,693 | 405,409 | |||||||||||||||||||||
Derivative financial liabilities | (325,984 | ) | 7,645 | (318,339 | ) | 259,582 | 40,124 | (18,633 | ) | (5,913 | ) | (324,252 | ) | |||||||||||||||||||
Repurchase agreements and other similar secured borrowing | (171,651 | ) | 102,888 | (68,763 | ) | – | 68,202 | (561 | ) | (7,110 | ) | (75,873 | ) | |||||||||||||||||||
Total liabilities | (497,635 | ) | 110,533 | (387,102 | ) | 259,582 | 108,326 | (19,194 | ) | (13,023 | ) | (400,125 | ) | |||||||||||||||||||
Derivative assets and liabilities
The ‘Financial instruments’ column identifies financial assets and liabilities that are subject to set-off under netting agreements, such as the ISDA
Master Agreement or derivative exchange or clearing counterparty agreements, whereby all outstanding transactions with the same counterparty can be offset andclose-out netting applied across all outstanding transactions covered by the agreements if an event of default or other predetermined events occur.
Financial collateral refers to cash andnon-cash collateral obtained, typically daily or weekly, to cover the net exposure between counterparties by enabling the collateral to be realised in an event of default or if other predetermined events occur.
Repurchase and reverse repurchase agreements and other similar secured lending and borrowing
The ‘Amounts offset’ column identifies financial assets and liabilities that are subject to set off under netting agreements, such as Global Master Repurchase Agreements and Global Master Securities Lending Agreements, whereby all outstanding transactions with the same counterparty can be offset andclose-out netting applied across all outstanding transactions covered by the agreements if an event of default or other predetermined events occur.
Financial collateral typically comprises highly liquid securities which are legally transferred and can be liquidated in the event of counterparty default.
These offsetting and collateral arrangements and other credit risk mitigation strategies used by the Group are further explained in the Credit risk mitigation section on page 102.
Notes
| a | Financial collateral of £49,923m (2015: £42,402m) was received in respect of derivative assets, including £41,641m (2015: £34,918m) of cash collateral and £8,282m (2015: £7,484m) ofnon-cash collateral. Financial collateral of £47,383m (2015: £40,124m) was placed in respect of derivative liabilities, including £43,763m (2015: £35,464m) of cash collateral and £3,620m (2015: £4,660m) ofnon-cash collateral. The collateral amounts are limited to net balance sheet exposure so as to not include over-collateralisation. Of the £41,641m (2015: £34,918m) cash collateral held, £26,834m (2015: £27,732m) was included in deposits from banks and £14,807m (2015: £7,186m), was included in customer accounts. Of the £43,763m (2015: £35,464m) cash collateral placed, £17,587m (2015: £13,238m) was included in loans and advances to banks and £26,176m (2015: £22,226m) was included in loans and advances to customers. |
| b | Amounts offset for Derivative financial assets include cash collateral netted of £972m (2015: £572m). Amounts offset for Derivative liabilities did not include any cash collateral netted for December 2016 (2015: £532m). Settlements assets and liabilities have been offset amounting to £10,486m (2015: £8,886m). No other significant recognised financial assets and liabilities were offset in the balance sheet. Therefore, the only balance sheet categories necessary for inclusion in the table are those shown above. |
| c | This column includes contractual rights ofset-off that are subject to uncertainty under the laws of the relevant jurisdiction. |
| d | The balance sheet total is the sum of ‘Net amounts reported on the balance sheet’ that are subject to enforceable netting arrangements and ‘Amounts not subject to enforceable netting arrangements’. |
| e | Repurchase and Reverse Repurchase agreements include instruments at amortised cost and instruments designated at fair value through profit and loss. Reverse Repurchase agreements and other similar secured lending of £76,616m (December 2015: £77,700m) is split by fair value £63,162m (December 2015: £49,513m) and amortised cost £13,454m (December 2015: £28,187m). Repurchase agreements and other similar secured borrowing of £75,470m (December 2015: £75,873m) is split by fair value £55,710m (December 2015: £50,838m) and amortised cost £19,760m (December 2015: £25,035m). |
| Barclays PLC and Barclays Bank PLC 2016 Annual Report on Form 20-F | 263 |
Notes to the financial statements
Financial instruments held at amortised cost
The notes included in this section focus on assets that are held at amortised cost arising from the Group’s retail and wholesale lending including loans and advances, finance leases, repurchase and reverse repurchase agreements and similar secured lending. Detail regarding the Group’s capital and liquidity position can be found on pages 152 to 177.
|
20 Loans and advances to banks and customers
Accounting for financial instruments held at amortised cost Loans and advances to customers and banks, customer accounts, debt securities and most financial liabilities, are held at amortised cost. That is, the initial fair value (which is normally the amount advanced or borrowed) is adjusted for repayments and the amortisation of coupon, fees and expenses to represent the effective interest rate of the asset or liability.
In accordance with IAS 39, where the Group no longer intends to trade in financial assets it may transfer them out of the held for trading classification and measure them at amortised cost if they meet the definition of a loan. The initial value used for the purposes of establishing amortised cost is fair value on the date of the transfer.
|
| As at 31 December | | 2016 £m |
| | 2015 £m |
| ||
| Gross loans and advances to banks | 43,251 | 41,349 | ||||||
| Less: allowance for impairment | – | – | ||||||
| Loans and advances to banks | 43,251 | 41,349 | ||||||
| Gross loans and advances to customers | 397,404 | 404,138 | ||||||
| Less: allowance for impairment | (4,620 | ) | (4,921 | ) | ||||
| Loans and advances to customers | 392,784 | 399,217 | ||||||
Included within the carrying value of gross loans and advances to customers are effective interest rate adjustments of £1,028m (2015: £917m). Of the total balance deferred, £649m (2015: £424m) relate to costs, such asco-brand partner fees, incurred to originate credit card balances.
21 Finance leases
Accounting for finance leases The Group applies IAS 17 Leases in accounting for finance leases, both where it is the lessor or the lessee. A finance lease is a lease which confers substantially all the risks and rewards of the leased assets on the lessee. Where the Group is the lessor, the leased asset is not held on the balance sheet; instead a finance lease receivable is recognised representing the minimum lease payments receivable under the terms of the lease, discounted at the rate of interest implicit in the lease. Where the Group is the lessee, the leased asset is recognised in property, plant and equipment and a finance lease liability is recognised, representing the minimum lease payments payable under the lease, discounted at the rate of interest implicit in the lease.
Interest income or expense is recognised in interest receivable or payable, allocated to accounting periods to reflect a constant periodic rate of return.
|
Finance lease receivables
Finance lease receivables are included within loans and advances to customers. The Group specialises in asset-based lending and works with a broad range of international technology, industrial equipment and commercial companies to provide customised finance programmes to assist manufacturers, dealers and distributors of assets.
| 2016 | 2015 | |||||||||||||||||||||||||||||||
| | Gross investment in finance lease receivables £m | | | Future finance income £m | | | Present value of minimum lease payments receivable £m | | | Un- guaranteed residual values £m |
| | Gross investment in finance lease receivables £m | | | Future finance income £m | | | Present value of minimum lease payments receivable £m | | | Un- guaranteed residual values £m |
| |||||||||
Not more than one year | 646 | (37 | ) | 609 | 60 | 1,826 | (230 | ) | 1,596 | 117 | ||||||||||||||||||||||
Over one year but not more than five years | 986 | (57 | ) | 929 | 132 | 3,569 | (555 | ) | 3,014 | 275 | ||||||||||||||||||||||
Over five years | 73 | (4 | ) | 69 | 19 | 224 | (32 | ) | 192 | 21 | ||||||||||||||||||||||
Total | 1,705 | (98 | ) | 1,607 | 211 | 5,619 | (817 | ) | 4,802 | 413 | ||||||||||||||||||||||
The decrease in finance lease receivables is primarily driven by BAGL balances now being classified as held for sale.
The impairment allowance for uncollectable finance lease receivables amounted to £6m (2015: £56m).
Finance lease liabilities
The Group leases items of property, plant and equipment on terms that meet the definition of finance leases. Finance lease liabilities are included within Note 26 Accruals, deferred income and other liabilities.
As at 31 December 2016, the total future minimum payments under finance leases were £15m (2015: nil). The carrying amount of assets held under finance leases was £15m (2015: nil).
| 264 | Barclays PLC and Barclays Bank PLC 2016 Annual Report on Form 20-F |
22 Reverse repurchase and repurchase agreements including other similar lending and borrowing
Reverse repurchase agreements (and stock borrowing or similar transactions) are a form of secured lending whereby the Group provides a loan or cash collateral in exchange for the transfer of collateral, generally in the form of marketable securities subject to an agreement to transfer the securities back at a fixed price in the future. Repurchase agreements are where the Group obtains such loans or cash collateral, in exchange for the transfer of collateral.
Accounting for reverse repurchase and repurchase agreements including other similar lending and borrowing The Group purchases (a reverse repurchase agreement) or borrows securities subject to a commitment to resell or return them. The securities are not included in the balance sheet as the Group does not acquire the risks and rewards of ownership. Consideration paid (or cash collateral provided) is accounted for as a loan asset at amortised cost, unless it is designated at fair value through profit and loss.
The Group may also sell (a repurchase agreement) or lend securities subject to a commitment to repurchase or redeem them. The securities are retained on the balance sheet as the Group retains substantially all the risks and rewards of ownership. Consideration received (or cash collateral provided) is accounted for as a financial liability at amortised cost, unless it is designated at fair value through profit and loss.
|
| | 2016 £m | | | 2015 £m | | |||
Assets | ||||||||
Banks | 2,769 | 8,954 | ||||||
Customers | 10,685 | 19,233 | ||||||
Reverse repurchase agreements and other similar secured lending at amortised costa | 13,454 | 28,187 | ||||||
Liabilities | ||||||||
Banks | 12,820 | 13,951 | ||||||
Customers | 6,940 | 11,084 | ||||||
Repurchase agreements and other similar secured borrowing at amortised costa | 19,760 | 25,035 | ||||||
Note
| a | New reverse repurchase and repurchase agreements including other similar lending and borrowing in certain businesses have been designated at fair value following a change in accounting treatment implemented in 2015 to better align to the way the business manages the portfolio’s risk and performance (see Notes 14 and 17 for further detail). |
| Barclays PLC and Barclays Bank PLC 2016 Annual Report on Form 20-F | 265 |
Notes to the financial statements
Non-current assets and other investments
The notes included in this section focus on the Group’snon-current tangible and intangible assets and property, plant and equipment, which provide long-term future economic benefits.
|
23 Property, plant and equipment
Accounting for property, plant and equipment | ||
The Group applies IAS 16Property Plant and Equipmentand IAS 40Investment Properties.
Property, plant and equipment is stated at cost, which includes direct and incremental acquisition costs less accumulated depreciation and provisions for impairment, if required. Subsequent costs are capitalised if these result in the enhancement to the asset.
Depreciation is provided on the depreciable amount of items of property, plant and equipment on a straight-line basis over their estimated useful economic lives. Depreciation rates, methods and the residual values underlying the calculation of depreciation of items of property, plant and equipment are kept under review to take account of any change in circumstances. The Group uses the following annual rates in calculating depreciation:
| ||
| Annual rates in calculating depreciation | Depreciation rate | |
| Freehold land | Not depreciated | |
| Freehold buildings and long-leasehold property (more than 50 years to run) | 2-3.3% | |
| Leasehold property (less than 50 years to run) | Over the remaining life of the lease | |
| Costs of adaptation of freehold and leasehold property | 6-10% | |
| Equipment installed in freehold and leasehold property | 6-10% | |
| Computers and similar equipment | 17-33% | |
| Fixtures and fittings and other equipment | 9-20% | |
Where leasehold property has a remaining useful life of less than 17 years, costs of adaptation and installed equipment are depreciated over the remaining life of the lease. | ||
Investment property | ||
The Group initially recognises investment property at cost, and subsequently at fair value at each balance sheet date, reflecting market conditions at the reporting date. Gains and losses on remeasurement are included in the income statement.
| ||
| | Investment property £m | | | Property £m | | | Equipment £m | | | Leased assets £m | | | Total £m |
| ||||||
| Cost | ||||||||||||||||||||
| As at 1 January 2016 | 140 | 3,919 | 4,259 | 62 | 8,380 | |||||||||||||||
| Additions | – | 167 | 370 | – | 537 | |||||||||||||||
| Disposalsa | (6 | ) | (761 | ) | (631 | ) | – | (1,398 | ) | |||||||||||
| Change in fair value of investment properties | – | – | – | – | – | |||||||||||||||
| Exchange and other movementsb | (53 | ) | 104 | (158 | ) | (52 | ) | (159 | ) | |||||||||||
| As at 31 December 2016 | 81 | 3,429 | 3,840 | 10 | 7,360 | |||||||||||||||
| Accumulated depreciation and impairment | ||||||||||||||||||||
| As at 1 January 2016 | – | (1,697 | ) | (3,177 | ) | (38 | ) | (4,912 | ) | |||||||||||
| Depreciation charge | – | (185 | ) | (325 | ) | – | (510 | ) | ||||||||||||
| Disposalsa | – | 635 | 405 | – | 1,040 | |||||||||||||||
| Exchange and other movementsb | – | (236 | ) | 54 | 29 | (153 | ) | |||||||||||||
| As at 31 December 2016 | – | (1,483 | ) | (3,043 | ) | (9 | ) | (4,535 | ) | |||||||||||
| Net book value | 81 | 1,946 | 797 | 1 | 2,825 | |||||||||||||||
| Cost | ||||||||||||||||||||
| As at 1 January 2015 | 207 | 4,054 | 4,350 | 10 | 8,621 | |||||||||||||||
| Additions | 13 | 385 | 405 | 49 | 852 | |||||||||||||||
| Disposals | (84 | ) | (363 | ) | (232 | ) | – | (679 | ) | |||||||||||
| Change in fair value of investment properties | 10 | – | – | – | 10 | |||||||||||||||
| Exchange and other movements | (6 | ) | (157 | ) | (264 | ) | 3 | (424 | ) | |||||||||||
| As at 31 December 2015 | 140 | 3,919 | 4,259 | 62 | 8,380 | |||||||||||||||
| Accumulated depreciation and impairment | ||||||||||||||||||||
| As at 1 January 2015 | – | (1,669 | ) | (3,157 | ) | (9 | ) | (4,835 | ) | |||||||||||
| Depreciation charge | – | (181 | ) | (373 | ) | – | (554 | ) | ||||||||||||
| Disposals | – | 144 | 159 | – | 303 | |||||||||||||||
| Exchange and other movements | – | 9 | 194 | (29 | ) | 174 | ||||||||||||||
| As at 31 December 2015 | – | (1,697 | ) | (3,177 | ) | (38 | ) | (4,912 | ) | |||||||||||
| Net book value | 140 | 2,222 | 1,082 | 24 | 3,468 |
Notes
| a | Cost and depreciation disposals include £0.9bn relating to fully depreciated assets that are no longer in use. There is no impact on the net book value. |
| b | Includes property, plant and equipment relating to BAGL of £627m (cost of £1,066m less accumulated depreciation of £439m) which was reclassified to held for sale. |
| 266 | Barclays PLC and Barclays Bank PLC 2016 Annual Report on Form 20-F |
23 Property, plant and equipmentcontinued
Property rentals of £7m (2015: £9m) and £6m (2015: £9m) have been included in net investment income and other income respectively. Impairment of £19m (2015: £38m) was charged in the period.
The fair value of investment property is determined by reference to current market prices for similar properties, adjusted as necessary for condition and location, or by reference to recent transactions updated to reflect current economic conditions. Discounted cash flow techniques may be employed to calculate fair value where there have been no recent transactions, using current external market inputs such as market rents and interest rates. Valuations are carried out by management with the support of appropriately qualified independent valuers. Refer to Note 18 Fair value of financial instruments for further details.
24 Goodwill and intangible assets
Accounting for goodwill and other intangible assets Goodwill The carrying value of goodwill is determined in accordance with IFRS 3Business Combinationsand IAS 36Impairment of Assets.
Goodwill arises on the acquisition of subsidiaries, associates and joint ventures. It represents the excess of the fair value of the purchase consideration over the fair value of the Group’s share of the assets acquired and the liabilities and contingent liabilities assumed on the date of the acquisition.
Goodwill is reviewed annually for impairment, or more frequently when there are indications that impairment may have occurred. The test involves comparing the carrying value of goodwill with the present value of thepre-tax cash flows, discounted at a rate of interest that reflects the inherent risks of the cash generating unit (CGU) to which the goodwill relates, or the CGU’s fair value if this is higher.
Intangible assets Intangible assets other than goodwill are accounted for in accordance with IAS 38Intangible Assets.
Intangible assets include brands, customer lists, internally generated software, other software, licences and other contracts and core deposit intangibles. They are initially recognised when they are separable or arise from contractual or other legal rights, the cost can be measured reliably and, in the case of intangible assets not acquired in a business combination, where it is probable that future economic benefits attributable to the assets will flow from their use.
Intangible assets are stated at cost (which is, in the case of assets acquired in a business combination, the acquisition date fair value) less accumulated amortisation and provisions for impairment, if any, and are amortised over their useful lives in a manner that reflects the pattern to which they contribute to future cash flows, generally using the amortisation periods set out below:
| ||
| Annual rates in calculating amortisation | Amortisation period | |
| Goodwill | Not amortised | |
| Internally generated softwarea | 12 months to 6 years | |
| Other software | 12 months to 6 years | |
| Core deposits intangibles | 12 months to 25 years | |
| Brands | 12 months to 25 years | |
| Customer lists | 12 months to 25 years | |
| Licences and other | 12 months to 25 years | |
Intangible assets are reviewed for impairment when there are indications that impairment may have occurred. | ||
Note
| a | Exceptions to the stated rate relate to useful lives of certain core banking platforms that are assessed individually and, if appropriate, amortised over longer periods ranging from 10 to 15 years. |
| Barclays PLC and Barclays Bank PLC 2016 Annual Report on Form 20-F | 267 |
Notes to the financial statements
Non-current assets and other investments
| 24 Goodwill and intangible assetscontinued | ||||||||||||||||||||||||||||||||
| | Goodwill £m | | | Internally generated software £m | | | Other software £m | | | Core deposit intangibles £m | | | Brands £m | | | Customer lists £m |
| | Licences and other £m |
| | Total £m |
| |||||||||
| 2016 | ||||||||||||||||||||||||||||||||
| Cost | ||||||||||||||||||||||||||||||||
| As at 1 January 2016 | 5,603 | 4,112 | 542 | 146 | 86 | 1,665 | 471 | 12,625 | ||||||||||||||||||||||||
| Additions and disposals | (77 | ) | 955 | 2 | – | – | 59 | 78 | 1,017 | |||||||||||||||||||||||
| Exchange and other movementsa | (679 | ) | (140 | ) | (340 | ) | (140 | ) | (86 | ) | (16 | ) | (4 | ) | (1,405 | ) | ||||||||||||||||
| As at 31 December 2016 | 4,847 | 4,927 | 204 | 6 | – | 1,708 | 545 | 12,237 | ||||||||||||||||||||||||
| Accumulated amortisation and impairment | ||||||||||||||||||||||||||||||||
| As at 1 January 2016 | (998 | ) | (1,634 | ) | (212 | ) | (75 | ) | (86 | ) | (1,081 | ) | (317 | ) | (4,403 | ) | ||||||||||||||||
| Disposals | 77 | 46 | 1 | – | – | 14 | 12 | 150 | ||||||||||||||||||||||||
| Amortisation charge | – | (480 | ) | (36 | ) | – | – | (129 | ) | (29 | ) | (674 | ) | |||||||||||||||||||
| Impairment charge | – | (73 | ) | (1 | ) | – | – | – | (1 | ) | (75 | ) | ||||||||||||||||||||
| Exchange and other movementsa | (9 | ) | 277 | 105 | 69 | 86 | (35 | ) | (2 | ) | 491 | |||||||||||||||||||||
| As at 31 December 2016 | (930 | ) | (1,864 | ) | (143 | ) | (6 | ) | – | (1,231 | ) | (337 | ) | (4,511 | ) | |||||||||||||||||
| Net book value | 3,917 | 3,063 | 61 | – | – | 477 | 208 | 7,726 | ||||||||||||||||||||||||
| 2015 | ||||||||||||||||||||||||||||||||
| Cost | ||||||||||||||||||||||||||||||||
| As at 1 January 2015 | 6,329 | 3,240 | 482 | 186 | 112 | 1,721 | 447 | 12,517 | ||||||||||||||||||||||||
| Additions and disposals | (515 | ) | 998 | 75 | – | – | – | 18 | 576 | |||||||||||||||||||||||
| Exchange and other movements | (211 | ) | (126 | ) | (15 | ) | (40 | ) | (26 | ) | (56 | ) | 6 | (468 | ) | |||||||||||||||||
| As at 31 December 2015 | 5,603 | 4,112 | 542 | 146 | 86 | 1,665 | 471 | 12,625 | ||||||||||||||||||||||||
| Accumulated amortisation and impairment | ||||||||||||||||||||||||||||||||
| As at 1 January 2015 | (1,442 | ) | (1,257 | ) | (194 | ) | (88 | ) | (111 | ) | (962 | ) | (283 | ) | (4,337 | ) | ||||||||||||||||
| Disposals | 518 | 128 | 2 | – | – | – | 3 | 651 | ||||||||||||||||||||||||
| Amortisation charge | – | (421 | ) | (17 | ) | (6 | ) | – | (143 | ) | (30 | ) | (617 | ) | ||||||||||||||||||
| Impairment charge | (102 | ) | (101 | ) | (1 | ) | (1 | ) | – | (12 | ) | – | (217 | ) | ||||||||||||||||||
| Exchange and other movements | 28 | 17 | (2 | ) | 20 | 25 | 36 | (7 | ) | 117 | ||||||||||||||||||||||
| As at 31 December 2015 | (998 | ) | (1,634 | ) | (212 | ) | (75 | ) | (86 | ) | (1,081 | ) | (317 | ) | (4,403 | ) | ||||||||||||||||
| Net book value | 4,605 | 2,478 | 330 | 71 | – | 584 | 154 | 8,222 | ||||||||||||||||||||||||
Goodwill
Goodwill is allocated to business operations according to business segments as follows:
| | 2016 £m | | | 2015 £m | | |||
| Barclays UK | 3,556 | 3,621 | ||||||
| Barclays International | 361 | 258 | ||||||
| Africa Banking | – | 703 | ||||||
| BarclaysNon-Core | – | 23 | ||||||
| Total net book value of goodwill | 3,917 | 4,605 |
Critical accounting estimates and judgements
Goodwill
Testing goodwill for impairment involves a significant amount of judgement. This includes the identification of independent CGUs and the allocation of goodwill to these units based on which units are expected to benefit from the acquisition. The allocation is reviewed following business reorganisations. Cash flow projections necessarily take into account changes in the market in which a business operates including the level of growth, competitive activity, and the impacts of regulatory change. Determining both the expectedpre-tax cash flows and the risk-adjusted interest rate appropriate to the operating unit requires the exercise of judgement. The estimation ofpre-tax cash flows is sensitive to the periods for which detailed forecasts are available and to assumptions regarding long-term sustainable cash flows.
Other intangible assets
Determining the estimated useful lives of intangible assets (such as those arising from contractual relationships) requires an analysis of circumstances. The assessment of whether an asset is exhibiting indicators of impairment as well as the calculation of impairment, which requires the estimate of future cash flows and fair values less costs to sell, also requires the preparation of cash flow forecasts and fair values for assets that may not be regularly bought and sold.
Note
| a | Includes goodwill and intangibles relating to BAGL of £1.1bn which was reclassified to held for sale. |
| 268 | Barclays PLC and Barclays Bank PLC 2016 Annual Report on Form 20-F |
24 Goodwill and intangible assetscontinued
Impairment testing of goodwill
During 2016, the Group recognised an impairment charge of nil (2015: £102m). The impairment charge of £102m recognised in 2015 related toNon-Core and the withdrawal of the Bespoke product in Barclays International which was as a result of the recoverable amount of the goodwill relating to these businesses not being supported based on the value in use calculations.
Key assumptions
The key assumptions used for impairment testing are set out below for each significant goodwill balance. Other goodwill of £787m (2015: £1,475m) was allocated to multiple CGUs which are not considered individually significant.
Barclays UK
Goodwill relating to Woolwich in Personal Banking and Business Banking was £3,130m (2015: £3,130m) of the total Barclays UK balance. The carrying value of the CGU has been determined by using net asset value. The recoverable amount of the CGU has been determined using cash flow predictions based on financial budgets approved by management and covering a five-year period, with a terminal growth rate of 2.0% (2015: 2.4%) applied thereafter. The forecast cash flows have been discounted at apre-tax rate of 14.6% (2015: 11.4%). Based on these assumptions, the recoverable amount exceeded the carrying amount including goodwill by £4,130m (2015: £14,097m). A one percentage point change in the discount rate or terminal growth rate would increase or decrease the recoverable amount by £988m (2015: £2,775m) and £615m (2015: £2,109m) respectively. A reduction in the forecast cash flows of 10% per annum would reduce the recoverable amount by £1,293m (2015: £2,789m).
The headroom reflects the changes made to the cash generating unit (CGU) in Barclays UK as part of the business reorganisation in 2016. The reduction in headroom in 2016 reflects changes in discount rate and future cash flow projections.
25 Operating leases
Accounting for operating leases The Group applies IAS 17Leases, for operating leases. An operating lease is a lease where substantially all of the risks and rewards of the leased assets remain with the lessor. Where the Group is the lessor, lease income is recognised on a straight-line basis over the period of the lease unless another systematic basis is more appropriate. The Group holds the leased assets on balance sheet within property, plant and equipment.
Where the Group is the lessee, rentals payable are recognised as an expense in the income statement on a straight-line basis over the lease term unless another systematic basis is more appropriate.
|
Operating lease receivables
The Group acts as lessor, whereby items of plant and equipment are purchased and then leased to third parties under arrangements qualifying as operating leases. The future minimum lease payments expected to be received undernon-cancellable operating leases was nil (2015: £1m).
Operating lease commitments
The Group leases various offices, branches and other premises undernon-cancellable operating lease arrangements. With such operating lease arrangements, the asset is kept on the lessor’s balance sheet and the Group reports the future minimum lease payments as an expense over the lease term. The leases have various terms, escalation and renewal rights. There are no contingent rents payable.
Operating lease rentals of £560m (2015: £411m) have been included in administration and general expenses.
The future minimum lease payments by the Group undernon-cancellable operating leases are as follows:
| 2016 | 2015 | |||||||||||||||
| | Property £m | | | Equipment £m | | | Property £m | | | Equipment £m | | |||||
Not more than one year | 364 | – | 376 | 1 | ||||||||||||
Over one year but not more than five years | 974 | 23 | 1,127 | 11 | ||||||||||||
Over five years | 1,520 | – | 1,874 | – | ||||||||||||
Total | 2,858 | 23 | 3,377 | 12 | ||||||||||||
Total future minimum sublease payments to be received undernon-cancellable subleases was £2m (2015: £1m).
| Barclays PLC and Barclays Bank PLC 2016 Annual Report on Form 20-F | 269 |
Notes to the financial statements
Accruals, provisions, contingent liabilities and legal proceedings
The notes included in this section focus on the Group’s accruals, provisions and contingent liabilities. Provisions are recognised for present obligations arising as consequences of past events where it is probable that a transfer of economic benefit will be necessary to settle the obligation, and it can be reliably estimated. Contingent liabilities reflect potential liabilities that are not recognised on the balance sheet.
|
26 Accruals, deferred income and other liabilities
Accounting for insurance contracts The Group applies IFRS 4Insurance Contractsto its insurance contracts. An insurance contract is a contract that compensates a third party against a loss fromnon-financial risk. Some wealth management and other products, such as life assurance contracts, combine investment and insurance features; these are treated as insurance contracts when they pay benefits that are at least 5% more than they would pay if the insured event does not occur.
Insurance liabilities include current best estimates of future contractual cash flows, claims handling, and administration costs in respect of claims. Liability adequacy tests are performed at each balance sheet date to ensure the adequacy of contract liabilities. Where a deficiency is highlighted by the tests, insurance liabilities are increased with any deficiency being recognised in the income statement.
Insurance premium revenue is recognised in the income statement in the period earned, net of reinsurance premiums payable, in net premiums from insurance contracts. Increases and decreases in insurance liabilities are recognised in the income statement in net claims and benefits on insurance contracts.
|
| | 2016 £m |
| | 2015 £m |
| |||
Accruals and deferred income | 4,422 | 4,271 | ||||||
Other creditors | 4,382 | 3,770 | ||||||
Obligations under finance leases (see Note 21) | 15 | – | ||||||
Insurance contract liabilities, including unit-linked liabilities | 52 | 2,569 | ||||||
Accruals, deferred income and other liabilities | 8,871 | 10,610 |
Accruals and deferred income increased by 4% to £4.4bn mainly driven by accruals towards staff costs and administrative and general costs as at 31 December 2016.
Insurance Liabilities relating to the Group’s long-term business have decreased by £2.5bn primarily driven byNon-Core entities being classified as held for sale. Insurance contract liabilities associated with the Group’s short-term business are £52m (2015: £115m). The maximum amounts payable under all of the Group’s insurance products, ignoring the probability of insured events occurring and the contribution from investments backing the insurance policies, were £0.4bn (2015: £65bn) or £0.2bn (2015: £49bn) after reinsurance. The decrease in the maximum amounts payable is primarily due to BAGL which has been classified as held for sale in 2016.
The impact to the income statement and equity under a reasonably possible change in the assumptions used to calculate the insurance liabilities would be £2m (2015: £1m).
27 Provisions
Accounting for provisions The Group applies IAS 37Provisions, Contingent Liabilities and Contingent Assetsin accounting fornon-financial liabilities.
Provisions are recognised for present obligations arising as consequences of past events where it is more likely than not that a transfer of economic benefit will be necessary to settle the obligation, which can be reliably estimated. Provision is made for the anticipated cost of restructuring, including redundancy costs when an obligation exists; for example, when the Group has a detailed formal plan for restructuring a business and has raised valid expectations in those affected by the restructuring by announcing its main features or starting to implement the plan. Provision is made for undrawn loan commitments if it is probable that the facility will be drawn and result in the recognition of an asset at an amount less than the amount advanced.
|
| Customer Redress | ||||||||||||||||||||||||||||||||
| | Onerous contracts £m | | | Redundancy and restructuring £m | | | Undrawn contractually committed facilities and guarantees £m | | | Payment Protection Insurance £m | | | Other customer redress £m | | | Legal, competition and regulatory matters £m |
| | Sundry provisions £m | | | Total £m | | |||||||||
As at 1 January 2016 | 141 | 186 | 60 | 2,106 | 896 | 489 | 264 | 4,142 | ||||||||||||||||||||||||
Additions | 328 | 336 | 52 | 1,000 | 297 | 212 | 206 | 2,431 | ||||||||||||||||||||||||
Amounts utilised | (39 | ) | (274 | ) | (1 | ) | (1,127 | ) | (396 | ) | (254 | ) | (84 | ) | (2,175 | ) | ||||||||||||||||
Unused amounts reversed | (53 | ) | (60 | ) | (44 | ) | – | (93 | ) | (27 | ) | (36 | ) | (313 | ) | |||||||||||||||||
Exchange and other movements | 8 | 18 | – | – | 8 | 35 | (20 | ) | 49 | |||||||||||||||||||||||
As at 31 December 2016 | 385 | 206 | 67 | 1,979 | 712 | 455 | 330 | 4,134 | ||||||||||||||||||||||||
Provisions expected to be recovered or settled within no more than 12 months after 31 December 2016 were £2,045m (2015: £2,113m).
| 270 | Barclays PLC and Barclays Bank PLC 2016 Annual Report on Form 20-F |
27 Provisionscontinued
Onerous contracts
Onerous contract provisions comprise an estimate of the costs involved with fulfilling the terms and conditions of contracts where the liability is higher than the amount of economic benefit to be received.
Redundancy and restructuring
These provisions comprise the estimated cost of restructuring, including redundancy costs where an obligation exists. Additions made during the year relate to formal restructuring plans and have either been utilised, or reversed, where total costs are now expected to be lower than the original provision amount.
Undrawn contractually committed facilities and guarantees
Provisions are made if it is probable that a facility will be drawn and the resulting asset is expected to have a realisable value that is less than the amount advanced.
Customer redress
Customer redress provisions comprise the estimated cost of making redress payments to customers, clients and counterparties for losses or damages associated with inappropriate judgement in the execution of our business activities. Provisions for other customer redress include £264m (2015: £290m) in respect of historic pricing practices associated with Foreign Exchange transactions for certain customers between 2005 and 2012, and smaller provisions across the retail and corporate businesses which are likely to be utilised in the next 12 months.
Sundry provisions
This category includes provisions that do not fit into any of the other categories, such as fraud losses and dilapidation provisions.
Legal, competition and regulatory matters
The Group is engaged in various legal, competition and regulatory matters in the UK and US and a number of other overseas jurisdictions. For further information in relation to legal proceedings and discussion of the associated uncertainties, please see Note 29 Legal, competition and regulatory matters.
Critical accounting estimates and judgements
Payment Protection Insurance Redress
As at 31 December 2016, Barclays had recognised cumulative provisions totalling £8.44bn (31 December 2015: £7.44bn) against the cost of Payment Protection Insurance (PPI) redress and associated processing costs with utilisation of £6.46bn (31 December 2015: £5.33bn), leaving a residual provision of £1.98bn (31 December 2015: £2.11bn).
Through to 31 December 2016, 1.8m (31 December 2015: 1.6m) customer initiated claimsa had been received and processed. The volume of claims received during 2016 decreased 8%b from 2015. This rate of decline was slower than previously recorded but in line with expectations.
The current provision reflects the estimated costs of PPI redress primarily relating to customer initiated complaints and ongoing remediation programmes. This also includes liabilities managed by third parties arising from portfolios previously sold where Barclays remains liable.
As at 31 December 2016, the provision of £2.0bn represents Barclays’ best estimate of expected PPI redress. However, it is possible the eventual outcome may differ from the current estimate. We will continue to review the adequacy of provision level in respect of the ongoing level of complaints.
The PPI provision is calculated using a number of key assumptions which continue to involve significant management judgement and modelling:
| § | customer initiated claim volumes – claims received but not yet processed plus an estimate of future claims initiated by customers where the volume is anticipated to cease after half year 2019 |
| § | average claim redress – the expected average payment to customers for upheld claims based on the type and age of the policy/policies |
| § | processing cost per claim – the cost to Barclays of assessing and processing each valid claim. |
These assumptions remain subjective, in particular due to the uncertainty associated with future claims levels, which include complaints driven by CMC activity.
The current provision represents Barclays’ revised best estimate of all future expected costs of PPI redress.
The following table details actual data through to 31 December 2016, key forecast assumptions used in the provision calculation and a sensitivity analysis illustrating the impact on the provision if the future expected assumptions prove too high or too low.
| Assumption | | Cumulative actual to 31.12.16 | | | Future expected | | | Sensitivity analysis increase/ decrease in provision | | | Cumulative actual to 31.12.15 | | ||||
| Customer initiated claims received and processeda | 1,840k | 650k | 50k = £100m | 1,570k | ||||||||||||
| Average uphold rate per claimc | 87% | 83% | 1% = £15m | 86% | ||||||||||||
| Average redress per valid claimd | £2,137 | £1,950 | £100 = £74m | £1,808 | ||||||||||||
| Processing cost per claime | £410 | £350 | 50k = £17m | £300 |
Notes
| a | Total claims received directly by Barclays to date, including those received via CMCs but excluding those for which no PPI policy exists and excluding responses to proactive mailing. |
| b | Gross volumes received including no PPI. |
| c | Average uphold rate per customer initiated claims received directly by Barclays and proactive mailings, excluding those for which no PPI policy exists. |
| d | Average redress stated on a per policy basis for future customer initiated complaints received directly by Barclays and proactive mailings. |
| e | Processing cost per claim on an upheld complaints basis, includes direct staff costs and associated overheads. |
| Barclays PLC and Barclays Bank PLC 2016 Annual Report on Form 20-F | 271 |
Notes to the financial statements
Accruals, provisions, contingent liabilities and legal proceedings
28 Contingent liabilities and commitments
Accounting for contingent liabilities |
Contingent liabilities are possible obligations whose existence will be confirmed only by uncertain future events, and present obligations where the transfer of economic resources is uncertain or cannot be reliably measured. Contingent liabilities are not recognised on the balance sheet but are disclosed unless the outflow of economic resources is remote.
|
The following table summarises the nominal principal amount of contingent liabilities and commitments which are not recorded on balance sheet:
| 2016 | 2015 | |||||||
Contingent liabilities and commitments excluding BAGL | £m | £m | ||||||
Guarantees and letters of credit pledged as collateral security | 15,303 | 16,065 | ||||||
| Performance guarantees, acceptances and endorsements | 4,636 | 4,556 | ||||||
Contingent liabilities | 19,939 | 20,621 | ||||||
Documentary credits and other short-term trade related transactions | 1,005 | 845 | ||||||
Forward starting reverse repurchase agreements | 24 | 93 | ||||||
Standby facilities, credit lines and other commitments | 302,657 | 281,369 |
The Financial Services Compensation Scheme
The Financial Services Compensation Scheme (the FSCS) is the UK’s government-backed compensation scheme for customers of authorised institutions that are unable to pay claims. It provides compensation to depositors in the event that UK licensed deposit-taking institutions are unable to meet their claims. The FSCS raises levies on UK licensed deposit-taking institutions to meet such claims based on their share of UK deposits on 31 December of the specified years preceding the scheme year (which runs from 1 April to 31 March).
Compensation has previously been paid out by the FSCS, funded by loan facilities totalling approximately £18bn provided by HM Treasury to the FSCS in support of FSCS’s obligations to the depositors of banks declared in default. The interest rate chargeable on the loan and levied to the industry is subject to a floor equal to the higher of HM Treasury’s own cost of borrowing (typically 2024 UK Gilt yield), and GBP LIBOR with12-month maturity plus 100 basis points. The FSCS recovered £1bn capital shortfall in respect of the legacy facility from industry in three instalments across 2013, 2014 and 2015. A separate shortfall in respect of Dunfermline Building Society was levied on the industry in 2014, 2015 and fully recovered in 2016. The FSCS liability for the interest levy for 2016/17 has been recognised in 2016. Barclays has included an accrual of £55m in other liabilities as at
31 December 2016 (2015: £56m) in respect of the Barclays portion of the Interest Levy.
Further details on contingent liabilities relating to legal, competition and regulatory matters can be found in Note 29.
29 Legal, competition and regulatory matters
Barclays PLC, Barclays Bank PLC and the Group face legal, competition and regulatory challenges, many of which are beyond our control. The extent of the impact on Barclays PLC, Barclays Bank PLC and the Group of these matters cannot always be predicted but may materially impact our operations, financial results, condition and prospects. Matters arising from a set of similar circumstances can give rise to either a contingent liability or a provision, or both, depending on the relevant facts and circumstances. The Group has not disclosed an estimate of the potential financial effect on the Group of contingent liabilities where it is not currently practicable to do so.
Investigations into certain advisory services agreements and civil action
The United Kingdom (UK) Serious Fraud Office (SFO), the Financial Conduct Authority (FCA), the US Department of Justice (DOJ) and the US Securities and Exchange Commission (SEC) have been conducting investigations into certain advisory services agreements entered into by Barclays Bank PLC.
Background Information
Barclays Bank PLC entered into two advisory services agreements with Qatar Holding LLC (Qatar Holding) in June and October 2008. The FCA subsequently commenced an investigation into whether these agreements may have related to Barclays PLC’s capital raisings in June and November 2008 (the Capital Raisings). The existence of the June 2008 advisory services agreement was disclosed, but the entry into the advisory services agreement in October 2008 and the fees payable under both agreements, which amounted to a total of £322m payable over a period of five years, were not disclosed in the announcements or public documents relating to the Capital Raisings.
In September 2013, the FCA issued warning notices (the Notices) finding that while, Barclays PLC and Barclays Bank PLC believed at the time of the execution of the agreements that there should be at least some unspecified and undetermined value to be derived from them, the primary purpose of the agreements was not to obtain advisory services but to make additional payments, which would not be disclosed, for the Qatari participation in the Capital Raisings. The Notices concluded that Barclays PLC and Barclays Bank PLC were in breach of certain disclosure-related listing rules and Barclays PLC was also in breach of Listing Principle 3 (the requirement to act with integrity towards holders and potential holders of the Company’s shares). In this regard, the FCA considers that Barclays PLC and Barclays Bank PLC acted recklessly. The financial penalty provided in the Notices against the Group is £50m. Barclays PLC and Barclays Bank PLC continue to contest the findings.
The SFO has also been conducting an investigation into the agreements, and the Group continues to respond to requests for further information in that investigation, which is at an advanced stage. The FCA action has been stayed pending the resolution of the SFO investigation.
In addition, the DOJ and the SEC have been conducting investigations relating to the agreements.
In January 2016, PCP Capital Partners LLP and PCP International Finance Limited (PCP) served a claim on Barclays Bank PLC seeking damages of £721.4m plus interest and costs for fraudulent misrepresentation and deceit, arising from alleged statements made by Barclays Bank PLC to PCP in relation to the terms on which securities were to be issued to investors, including PCP, in the November 2008 capital raising. Barclays Bank PLC is defending the claim.
Claimed Amounts/Financial Impact
It is not currently practicable to provide an estimate of the financial impact of the actions described on the Group or what effect that they might have upon the Group’s operating results, cash flows or financial position in any particular period. PCP has made a claim against Barclays Bank PLC totalling £721.4m plus interest and costs. This amount does not necessarily reflect Barclays Bank PLC’s potential financial exposure if a ruling were to be made against it.
| 272 | Barclays PLC and Barclays Bank PLC 2016 Annual Report on Form 20-F |
29 Legal, competition and regulatory matterscontinued
Investigations into certain business relationships
The DOJ and SEC are undertaking an investigation into whether the Group’s relationships with third parties who assist Barclays PLC to win or retain business are compliant with the US Foreign Corrupt Practices Act. Certain regulators in other jurisdictions have also been briefed on the investigations. Separately, the Group is cooperating with the DOJ and SEC in relation to an investigation into certain of its hiring practices in Asia and elsewhere and is keeping certain regulators in other jurisdictions informed.
Claimed Amounts/Financial Impact
It is not currently practicable to provide an estimate of the financial impact of the actions described on the Group or what effect that they might have upon the Group’s operating results, cash flows or financial position in any particular period.
Alternative Trading Systems and High-Frequency Trading
The SEC, the New York State Attorney General (NYAG) and regulators in certain other jurisdictions have been investigating a range of issues associated with alternative trading systems (ATSs), including dark pools, and the activities of high-frequency traders.
Background Information
In June 2014, the NYAG filed a complaint (NYAG Complaint) against Barclays PLC and Barclays Capital Inc. (BCI) in the Supreme Court of the State of New York alleging, amongst other things, that Barclays PLC and BCI engaged in fraud and deceptive practices in connection with LX, the Group’sSEC-registered ATS. In February 2016, Barclays reached separate settlement agreements with each of the SEC and the NYAG to resolve those agencies’ claims against Barclays PLC and BCI relating to the operation of LX for $35m each.
Barclays PLC and BCI have been named in a purported class action by an institutional investor client under California law based on allegations similar to those in the NYAG Complaint. In October 2016, the federal court in California granted the motion of Barclays PLC and BCI to dismiss the entire complaint and plaintiffs have appealed the court’s decision.
Following the filing of the NYAG Complaint, Barclays PLC and BCI were also named in a shareholder securities class action along with certain of its former CEOs, and its current and a former CFO, as well as an employee in Equities Electronic Trading (Shareholder Class Action). The plaintiffs claim that investors suffered damages when their investments in Barclays American Depository Receipts declined in value as a result of the allegations in the NYAG Complaint. Barclays PLC and BCI filed a motion to dismiss the complaint, which the court granted in part and denied in part. In February 2016, the court certified the action as a class action, and Barclays has appealed that certification.
Claimed Amounts/Financial Impact
The class actions seek unspecified monetary damages and injunctive relief. It is not currently practicable to provide an estimate of the financial impact of the actions described on the Group or what effect they might have upon the Group’s operating results, cash flows or financial position in any particular period.
FERC
The US Federal Energy Regulatory Commission (FERC) has filed a civil action against Barclays Bank PLC and certain of its former traders in the US District Court in California seeking to collect a $435m civil penalty and the disgorgement of $34.9m of profits, plus interest, in connection with allegations that Barclays Bank PLC manipulated the electricity markets in and around California. A civil class action complaint was also filed in the US District Court for the Southern District of New York (SDNY) against Barclays Bank PLC asserting antitrust claims based on allegations that mirror those raised in the civil suit filed by FERC.
Background Information
In October 2012, FERC issued an Order to Show Cause and Notice of Proposed Penalties (Order and Notice) against Barclays Bank PLC and four of its former traders in relation to their power trading in the western US. In the Order and Notice, FERC asserted that Barclays Bank PLC and its former traders violated FERC’s Anti-Manipulation Rule by manipulating the electricity markets in and around California from November 2006 to December 2008, and proposed civil penalties and profit disgorgement to be paid by Barclays Bank PLC.
In October 2013, FERC filed a civil action against Barclays Bank PLC and its former traders in the US District Court in California seeking to collect the $435m civil penalty and disgorgement of $34.9m of profits, plus interest.
In June 2015, a civil class action complaint was filed in the US District Court for the SDNY against Barclays Bank PLC by Merced Irrigation District, a California utility company, asserting antitrust allegations in connection with Barclays Bank PLC’s purported manipulation of the electricity markets in and around California. The factual allegations mirror those raised in the civil action filed by FERC against Barclays Bank PLC currently pending in the US District Court in California.
In October 2015, the US District Court in California ordered that it would bifurcate its assessment of liabilities and penalties from its assessment of disgorgement. FERC has filed and Barclays Bank PLC is opposing a brief seeking summary affirmance of the penalty assessment. The court has indicated that it will either affirm the penalty assessment or require further evidence to determine this issue. Oral argument on the motion to affirm the penalty assessment occurred in February 2017.
In December 2015, Barclays Bank PLC filed a motion to dismiss the civil class action for failure to state a claim, which the SDNY in February 2016 granted in part and denied in part.
Claimed Amounts/Financial Impact
FERC has made claims against Barclays Bank PLC totalling $469.9m, plus interest, for civil penalties and profit disgorgement. The civil class action complaint refers to damages of $139.3m. These amounts do not necessarily reflect Barclays Bank PLC’s potential financial exposure if a ruling were to be made against it in either action.
Investigations into LIBOR and other Benchmarks
Regulators and law enforcement agencies, including certain competition authorities, from a number of governments have been conducting investigations relating to Barclays Bank PLC’s involvement in manipulating certain financial benchmarks, such as LIBOR and EURIBOR. Barclays Bank PLC, Barclays PLC and BCI have reached settlements with the relevant law enforcement agency or regulator in certain of the investigations, but others, including the investigations by the SFO and the prosecutors’ office in Trani, Italy remain pending.
| Barclays PLC and Barclays Bank PLC 2016 Annual Report on Form 20-F | 273 |
Notes to the financial statements
Accruals, provisions, contingent liabilities and legal proceedings
29 Legal, competition and regulatory matterscontinued
Background Information
In June 2012, Barclays Bank PLC announced that it had reached settlements with the Financial Services Authority (FSA) (as predecessor to the FCA), the US Commodity Futures Trading Commission (CFTC) and the DOJ Fraud Section(DOJ-FS) in relation to their investigations concerning certain benchmark interest rate submissions, and Barclays Bank PLC agreed to pay total penalties of £290m. The settlement with theDOJ-FS was made by entry into aNon-Prosecution Agreement (NPA) which has now expired. In addition, Barclays Bank PLC was granted conditional leniency from the DOJ Antitrust Division(DOJ-AD) in connection with potential US antitrust law violations with respect to financial instruments that reference EURIBOR. The DOJ granted final leniency to Barclays Bank PLC in May 2016.
Settlements with the US State Attorneys General and the Swiss Competition Commission
Following the settlements announced in June 2012, a group of US State Attorneys General (SAGs) commenced its own investigations into LIBOR, EURIBOR and the Tokyo Interbank Offered Rate. In August 2016, Barclays Bank PLC, BCI and 44 SAGs entered into a settlement agreement resolving the claims of those SAGs (and those of any other SAG who joined the settlement within 60 days) with respect to the matters subject to the investigations. Barclays agreed among other things to make payments totalling $100m to the SAGs in connection with the settlement.
In December 2016, a settlement in the sum of CHF29.8m was reached with the Swiss Competition Commission relating to its investigation into EURIBOR-related conduct.
Investigation by the SFO
In July 2012, the SFO announced that it had decided to investigate the LIBOR matter, in respect of which Barclays Bank PLC has received and continues to respond to requests for information. The SFO’s investigation, including in respect of Barclays Bank PLC, continues.
For a discussion of civil litigation arising in connection with these investigations see ‘LIBOR and other Benchmarks Civil Actions’.
Claimed Amounts/Financial Impact
Aside from the settlements discussed above, it is not currently practicable to provide an estimate of the financial impact of the actions described on the Group or what effect that they might have upon the Group’s operating results, cash flows or financial position in any particular period.
LIBOR and other Benchmark Civil Actions
Following the settlements of the investigations referred to above in ‘Investigations into LIBOR and other Benchmarks’, a number of individuals and corporates in a range of jurisdictions have threatened or brought civil actions against the Group in relation to LIBOR and/or other benchmarks. While several of such cases have been dismissed and certain have settled subject to approval from the court (and in the case of class actions, the right of class members toopt-out of the settlement and to seek to file their own claims), other actions remain pending and their ultimate impact is unclear.
Background Information
A number of individuals and corporates in a range of jurisdictions have threatened or brought civil actions against the Group and other banks in relation to manipulation of LIBOR and/or other benchmark rates.
USD LIBOR Cases in MDL Court
The majority of the USD LIBOR cases, which have been filed in various US jurisdictions, have been consolidated forpre-trial purposes before a single judge in the SDNY (MDL Court).
The complaints are substantially similar and allege, amongst other things, that Barclays Bank PLC and the other banks individually and collectively violated provisions of the US Sherman Antitrust Act (Antitrust Act), the Commodity Exchange Act (CEA), the US Racketeer Influenced and Corrupt Organizations Act (RICO) and various state laws by manipulating USD LIBOR rates.
The lawsuits seek unspecified damages with the exception of five lawsuits, in which the plaintiffs are seeking a combined total in excess of $1.25bn in actual damages against all defendants, including Barclays Bank PLC, plus punitive damages. Some of the lawsuits also seek trebling of damages under the Antitrust Act and RICO.
The proposed class actions purported to be brought on behalf of (amongst others) plaintiffs that (i) engaged in USD LIBOR-linkedover-the-counter transactions (OTC Class); (ii) purchased USD LIBOR-linked financial instruments on an exchange (Exchange-Based Class); (iii) purchased USD LIBOR-linked debt securities (Debt Securities Class); (iv) purchased adjustable-rate mortgages linked to USD LIBOR (Homeowner Class); or (v) issued loans linked to USD LIBOR (Lender Class).
In August 2012 the MDL Court stayed all newly filed proposed class actions and individual actions (Stayed Actions). In March 2013, August 2013 and June 2014, the MDL Court issued a series of decisions effectively dismissing the majority of claims against Barclays Bank PLC and other panel bank defendants in the three lead proposed class actions (Lead Class Actions) and three lead individual actions (Lead Individual Actions).
In July 2014, the MDL Court allowed the Stayed Actions to proceed and a number of plaintiffs filed amended complaints. The MDL Court subsequently dismissed a number of Lead Individual Action claims and all Homeowner Class and Lender Class claims. In May 2016, the appeal court reversed the MDL Court’s holding that plaintiffs in the Lead Class Actions, including the Debt Securities Class, and Lead Individual Actions had not suffered an injury under the Antitrust Act, and remanded the antitrust claims for the MDL Court’s further consideration of those claims and related issues. Following further consideration, the MDL Court dismissed the majority of antitrust claims against foreign defendants, including Barclays Bank PLC, for lack of personal jurisdiction. Certain plaintiffs have sought leave to move the MDL Court to reconsider its decision, and certain defendants, including Barclays Bank PLC, have sought leave to move to dismiss certain of the remaining antitrust claims.
In December 2014, the MDL Court granted preliminary approval for the settlement of the Exchange-Based Class claims for $20m. Final approval of the settlement is awaiting plaintiff’s submission of a plan for allocation of the settlement proceeds acceptable to the MDL Court and will be subject to the right of class members toopt-out of the settlement and to seek to file their own claims.
In November 2015, the OTC Class claims were settled for $120m. The settlement was preliminarily approved by the MDL court in December 2016, but remains subject to final court approval and the right of class members toopt-out of the settlement and to seek to file their own claims.
In November 2016, a settlement was agreed with respect to the Debt Securities Class claims. As the plaintiffs have not yet sought court approval of the settlement, the amount (which Barclays does not consider to be material to the Group) has not yet been publicly disclosed.
| 274 | Barclays PLC and Barclays Bank PLC 2016 Annual Report on Form 20-F |
29 Legal, competition and regulatory matterscontinued
EURIBOR Case in the SDNY
In February 2013, a EURIBOR-related class action was filed against Barclays PLC, Barclays Bank PLC, BCI and other EURIBOR panel banks in the SDNY. The plaintiffs asserted antitrust, CEA, RICO, and unjust enrichment claims relating to EURIBOR manipulation. In October 2015, the class action was settled for $94m subject to court approval. The settlement has been preliminarily approved by the court but remains subject to final approval and the right of class members toopt-out of the settlement and to seek to file their own claims.
Additional USD LIBOR Case in the SDNY
An additional individual action was commenced in February 2013 in the SDNY against Barclays Bank PLC and other panel bank defendants. The plaintiff alleged that the panel bank defendants conspired to increase USD LIBOR, which caused the value of bonds pledged as collateral for a loan to decrease, ultimately resulting in the sale of the bonds at a low point in the market. In April 2015, the court dismissed the action. The plaintiff’s motion to file a further amended complaint is pending.
Sterling LIBOR Case in SDNY
In May 2015, a putative class action was commenced in the SDNY against Barclays Bank PLC and other Sterling LIBOR panel banks by a plaintiff involved in exchange-traded andover-the-counter derivatives that were linked to Sterling LIBOR. The complaint alleges, among other things, that Barclays Bank PLC and other panel banks manipulated the Sterling LIBOR rate between 2005 and 2010 and, in so doing, committed CEA, Antitrust Act, and RICO violations. In early 2016, this class action was consolidated with an additional putative class action making similar allegations against Barclays Bank PLC and BCI and other Sterling LIBOR panel banks. Defendants have filed a motion to dismiss.
Complaint in the US District Court for the Central District of California
In July 2012, a putative class action complaint in the US District Court for the Central District of California was amended to include allegations related to USD LIBOR and names Barclays Bank PLC as a defendant. The amended complaint was filed on behalf of a putative class that includes holders of adjustable rate mortgages linked to USD LIBOR. In January 2015, the court granted Barclays Bank PLC’s motion for summary judgement and dismissed all of the remaining claims against Barclays Bank PLC. The dismissal was affirmed on appeal in December 2016.
Japanese Yen LIBOR Cases in SDNY
A putative class action was commenced in April 2012 in the SDNY against Barclays Bank PLC and other Japanese Yen LIBOR panel banks by a plaintiff involved in exchange-traded derivatives. The complaint also names members of the Japanese Bankers Association’s Euroyen Tokyo Interbank Offered Rate (Euroyen TIBOR) panel, of which Barclays Bank PLC is not a member. The complaint alleges, amongst other things, manipulation of the Euroyen TIBOR and Yen LIBOR rates and breaches of the CEA and Antitrust Act between 2006 and 2010. In March 2014, the court dismissed the plaintiff’s antitrust claims in full, but sustained the plaintiff’s CEA claims, which are pending. Plaintiff has amended the pleadings to extend the putative class period, and defendants have filed a partial motion to dismiss claims arising during the extended period.
In July 2015, a second putative class action concerning Yen LIBOR was filed in the SDNY against Barclays PLC, Barclays Bank PLC and BCI. The complaint alleges breaches of the Antitrust Act and RICO between 2006 and 2010 based on factual allegations that are substantially similar to those in the April 2012 class action. Defendants have filed a motion to dismiss.
SIBOR/SOR Case in the SDNY
A putative class action was commenced in July 2016 in the SDNY against Barclays PLC, Barclays Bank PLC, BCI, and other defendants, alleging manipulation of the Singapore Interbank Offered Rate (SIBOR) and Singapore Swap Offer Rate (SOR). The complaint alleges, amongst other things, manipulation of the SIBOR and SOR rates and breaches of the Antitrust Act and RICO between 2007 and 2011. Defendants filed motions to dismiss.
Non-US Benchmarks Cases
In addition to US actions, legal proceedings have been brought or threatened against the Group in connection with alleged manipulation of LIBOR and EURIBOR in a number of jurisdictions. The number of such proceedings innon-US jurisdictions, the benchmarks to which they relate, and the jurisdictions in which they may be brought have increased over time.
Claimed Amounts/Financial Impact
Aside from the settlements discussed above, it is not currently practicable to provide an estimate of the financial impact of the actions described on the Group or what effect that they might have upon the Group’s operating results, cash flows or financial position in any particular period.
Foreign Exchange Investigations
Various regulatory and enforcement authorities have been investigating a range of issues associated with Foreign Exchange sales and trading, including electronic trading. Certain of these investigations involve multiple market participants in various countries. The Group has reached settlements with the CFTC, the DOJ, the New York State Department of Financial Services (NYDFS), the Board of Governors of the Federal Reserve System (Federal Reserve) and the FCA (together, the 2015 Resolving Authorities) and the Administrative Council for Economic Defence in Brazil with respect to certain of these investigations as further described below. The South African Competition Commission (SACC) has initiated proceedings before the South African Competition Tribunal (Tribunal). Investigations by the European Commission (Commission) and the DOJ, amongst others, remain pending.
Background Information
In 2015, the Group reached settlements with the 2015 Resolving Authorities in relation to investigations into certain sales and trading practices in the Foreign Exchange market. In connection with these settlements, the Group agreed to pay total penalties of approximately $2.38bn, and to undertake certain remedial actions.
Under the plea agreement with the DOJ, in addition to a criminal fine, Barclays PLC agreed to a term of probation of three years during which Barclays PLC must, amongst other things, (i) commit no crime whatsoever in violation of the federal laws of the US, (ii) implement and continue to implement a compliance program designed to prevent and detect the conduct that gave rise to the plea agreement and (iii) strengthen its compliance and internal controls as required by relevant regulatory or enforcement agencies. In January 2017, the US District Court for the District of Connecticut accepted the plea agreement and in accordance with the agreement sentenced Barclays PLC to pay $650m as a fine and $60m for violating the NPA (which amounts are part of the $2.38bn referred to above) and to serve three years of probation from the date of the sentencing order. The Group also continues to provide relevant information to certain of the 2015 Resolving Authorities.
| Barclays PLC and Barclays Bank PLC 2016 Annual Report on Form 20-F | 275 |
Notes to the financial statements
Accruals, provisions, contingent liabilities and legal proceedings
29 Legal, competition and regulatory matterscontinued
The full text of the DOJ plea agreement, the orders of the CFTC, NYDFS and Federal Reserve, and the Final Notice issued by the FCA related to the settlements referred to above are publicly available on the 2015 Resolving Authorities’ respective websites.
In December 2016 the Group reached a settlement with the Administrative Council for Economic Defence in Brazil regarding its investigation into certain Foreign Exchange trading conduct. The Group agreed to a penalty of approximately £4.9m as part of the settlement agreement.
An investigation by the FCA into historic pricing practices by Barclays Bank PLC associated with certain Foreign Exchange transactions was discontinued in December 2016. Barclays Bank PLC has initiated a customer remediation program and is keeping the FCA informed on its progress.
The DOJ is also conducting an investigation into conduct relating to certain trading activities in connection with certain transactions during 2011 and 2012. Barclays is providing information to the DOJ and other relevant authorities reviewing this conduct.
In February 2017 the SACC referred Barclays Bank PLC, BCI and Absa Bank Limited, a subsidiary of Barclays Africa Group Limited, among other banks, to the Tribunal to be prosecuted for breaches of South African antitrust law related to Foreign Exchange trading of South African Rand. The SACC found from its investigation that, from at least 2007, the banks had engaged in various forms of collusive behaviour. Barclays was the first to bring the conduct to the attention of the SACC under its leniency programme and has cooporated with, and will continue to cooperate with, the SACC in relation to this matter. The SACC is therefore not seeking an order from the Tribunal to impose any fine on Barclays Bank PLC, BCI or Absa Bank Limited.
For a discussion of civil litigation arising in connection with these investigations see ‘Civil Actions in respect of Foreign Exchange’ below.
Claimed Amounts/Financial Impact
The provision for the customer remediation program relating to historic pricing practices by Barclays Bank PLC associated with certain Foreign Exchange transactions referred to above was £264m as of 31 December 2016 (see Provisions Note 27). Aside from the settlements discussed above it is not currently practicable to provide an estimate of any further financial impact of the actions described on the Group or what effect they might have on the Group’s operating results, cash flows or financial position in any particular period.
Civil Actions in respect of Foreign Exchange
Background Information
A number of individuals and corporates in a range of jurisdictions have threatened or brought civil actions against the Group and other banks in relation to Foreign Exchange or may do so in future. Certain of these cases have been dismissed or have been settled subject to approval from the relevant court (and in the case of class actions, the right of class members toopt-out of the settlement and to seek to file their own claims).
Consolidated FX Action
Beginning in November 2013, a number of civil actions were filed in the SDNY on behalf of proposed classes of plaintiffs alleging manipulation of Foreign Exchange markets under the Antitrust Act and New York state law and naming several international banks as defendants, including Barclays Bank PLC. In February 2014, the SDNY combined all then-pending actions alleging a class of US persons in a single consolidated action (Consolidated FX Action). In September 2015, Barclays Bank PLC and BCI settled the Consolidated FX Action for $384m. The settlement itself is subject to final court approval and the right of class members toopt-out of the settlement and to seek to file their own claims.
ERISA FX Action
Since February 2015, several other civil actions have been filed in the SDNY on behalf of proposed classes of plaintiffs purporting to allege different legal theories of injury (other than those alleged in the Consolidated FX Action) related to alleged manipulation of Foreign Exchange rates and naming several international banks as defendants, including Barclays PLC, Barclays Bank PLC and BCI. One such consolidated action asserts claims under the US Employee Retirement Income Security Act (ERISA) statute (ERISA Claims) and includes allegations of conduct that are duplicative of allegations in the other cases, as well as additional allegations about ERISA plans. The Court has ruled that the ERISA allegations concerning collusive manipulation of FX rates are covered by the settlement agreement in the Consolidated FX Action, but has not ruled on whether allegations characterised by the ERISA plaintiffs asnon-collusive manipulation of FX rates are likewise covered by the agreement. In September 2016, the Court dismissed all claims (based on both alleged collusive andnon-collusive conduct) in the ERISA Claims against Barclays and all other defendants as a matter of law. The ERISA plaintiffs have appealed this decision.
Retail Basis Action
Another action was filed in the Northern District of California (and subsequently transferred to the SDNY) against several international banks, including Barclays PLC and BCI, on behalf of a putative class of individuals that exchanged currencies on a retail basis at bank branches (Retail Basis Claims). The Court has ruled that the Retail Basis Claims are not covered by the settlement agreement in the Consolidated FX Action. Barclays has moved to dismiss the Retail Basis Claims as a matter of law.
Last Look Actions
In addition, in November 2015 and December 2015, two additional civil actions were filed in the SDNY on behalf of proposed classes of plaintiffs alleging injuries based on Barclays’ purported improper rejection of customer trades through Barclays Last Look system. In February 2016, Barclays Bank PLC and BCI settled one of the actions for $50m on a class-wide basis. (The other action was voluntarily dismissed.) Class members have the right toopt-out of the settlement and to seek to file their own claims.
ETF FX Action
In September 2016, another action was filed in the SDNY under federal, New York and California law on behalf of proposed classes of stockholders of Exchange Traded Funds and others who supposedly were indirect investors in FX Instruments. Barclays will move to dismiss this action as a matter of law or, alternatively, to enjoin the claims as covered by the settlement agreement in the Consolidated FX Action.
Canadian FX Action
Similar civil actions to the Consolidated FX Action have been filed in Canadian courts on behalf of proposed classes of plaintiffs containing similar factual allegations of manipulation of Foreign Exchange rates as in the US actions and of damages resulting from such manipulation in violation of Canadian law.
Claimed Amounts/Financial Impact
Aside from the settlements discussed above, the financial impact of the actions described on the Group or what effect that they might have upon the Group’s operating results, cash flows or financial position in any particular period is currently uncertain.
| 276 | Barclays PLC and Barclays Bank PLC 2016 Annual Report on Form 20-F |
29 Legal, competition and regulatory matterscontinued
Civil Actions in respect of ISDAFIX
Beginning in September 2014, a number of ISDAFIX related civil actions were filed in the SDNY on behalf of a proposed class of plaintiffs, alleging that Barclays Bank PLC, a number of other banks and one broker, violated the Antitrust Act and several state laws by engaging in a conspiracy to manipulate the USD ISDAFIX. Those actions, which were consolidated in February 2015, arose in connection with certain regulatory and law enforcement agencies’ investigations into historical practices with respect to ISDAFIX.
In April 2016, Barclays Bank PLC and BCI entered into a settlement agreement with plaintiffs to resolve the consolidated action for $30m, fully resolving all ISDAFIX-related claims that were or could have been brought by the class. In May 2016, the court preliminarily approved the settlement, which remains subject to final approval and to the right of class members toopt-out of the settlement and to seek to file their own claims.
Claimed Amounts/Financial Impact
Aside from the settlements discussed above, it is not currently practicable to provide an estimate of any further financial impact of the actions described on the Group or what effect that they might have upon the Group’s operating results, cash flows or financial position in any particular period.
Precious Metals Investigation
Barclays Bank PLC has been providing information to the DOJ, the CFTC and other authorities in connection with investigations into precious metals and precious metals-based financial instruments.
For a discussion of civil litigation arising in connection with these investigations see ‘Civil Actions in respect of the Gold Fix’ below.
Claimed Amounts/Financial Impact
It is not currently practicable to provide an estimate of the financial impact of the actions described on the Group or what effect that they might have upon the Group’s operating results, cash flows or financial position in any particular period.
Civil Actions in respect of the Gold Fix
Since March 2014, a number of civil complaints have been filed in US Federal Courts, each on behalf of a proposed class of plaintiffs, alleging that Barclays Bank PLC and other members of The London Gold Market Fixing Ltd. manipulated the prices of gold and gold derivative contracts in violation of the CEA, the Antitrust Act, and state antitrust and consumer protection laws. All of the complaints have been transferred to the SDNY and consolidated for pretrial purposes.
A similar civil action has been filed in Canadian courts on behalf of a proposed class of plaintiffs containing similar factual allegations of the manipulation of the prices of gold in violation of Canadian law.
Claimed Amounts/Financial Impact
It is not currently practicable to provide an estimate of the financial impact of the actions described on the Group or what effect that they might have upon the Group’s operating results, cash flows or financial position in any particular period.
US Residential and Commercial Mortgage-related Activity and Litigation
The Group’s activities within the US residential mortgage sector during the period from 2005 through 2008 included:
| § | sponsoring and underwriting of approximately $39bn of private-label securitisations; |
| § | economic underwriting exposure of approximately $34bn for other private-label securitisations; |
| § | sales of approximately $0.2bn of loans to government sponsored enterprises (GSEs); |
| § | sales of approximately $3bn of loans to others; and |
| § | sales of approximately $19.4bn of loans (net of approximately $500m of loans sold during this period and subsequently repurchased) that were originated and sold to third parties by mortgage originator affiliates of an entity that the Group acquired in 2007 (Acquired Subsidiary). |
Throughout this time period affiliates of the Group engaged in secondary market trading of US residential mortgaged-backed securities (RMBS) and US commercial mortgage-backed securities (CMBS), and such trading activity continues today.
In connection with its loan sales and certain private-label securitisations, on 31 December 2016, the Group had unresolved repurchase requests relating to loans with a principal balance of approximately $2.2bn at the time they were sold, and civil actions have been commenced by various parties alleging that the Group must repurchase a substantial number of such loans.
In addition, the Group is party to a lawsuit filed by a purchaser of RMBS asserting statutory and/or common law claims. The current outstanding face amount of RMBS related to these pending claims against the Group as of 31 December 2016 was approximately $0.1bn.
Regulatory and governmental authorities, including amongst others, the DOJ, SEC, Special Inspector General for the US Troubled Asset Relief Program (SIGTARP), the US Attorney’s Office for the District of Connecticut and the US Attorney’s Office for the Eastern District of New York (EDNY) have been conducting wide-ranging investigations into market practices involving mortgage-backed securities, and the Group is cooperating with those investigations. In December 2016, the DOJ filed a civil complaint against Barclays in the US District Court for the EDNY containing a number of allegations, including mail and wire fraud, relating to mortgage-backed securities sold between 2005 and 2007. The complaint seeks, amongst other relief, unspecified monetary penalties. Barclays is defending the complaint.
RMBS Repurchase Requests
Background Information
The Group was the sole provider of various loan-level representations and warranties (R&Ws) with respect to:
| § | approximately $5bn of Group sponsored securitisations; |
| § | approximately $0.2bn of sales of loans to GSEs; and |
| § | approximately $3bn of loans sold to others. |
| Barclays PLC and Barclays Bank PLC 2016 Annual Report on Form 20-F | 277 |
Notes to the financial statements
Accruals, provisions, contingent liabilities and legal proceedings
29 Legal, competition and regulatory matterscontinued
In addition, the Acquired Subsidiary provided R&Ws on all of the $19.4bn of loans it sold to third parties.
R&Ws on the remaining Group sponsored securitisations were primarily provided by third-party originators directly to the securitisation trusts with a Group subsidiary, such as the depositor for the securitisation, providing more limited R&Ws. There are no stated expiration provisions applicable to most R&Ws made by the Group, the Acquired Subsidiary or these third parties.
Under certain circumstances, the Group and/or the Acquired Subsidiary may be required to repurchase the related loans or make other payments related to such loans if the R&Ws are breached.
The unresolved repurchase requests received on or before 31 December 2016 associated with all R&Ws made by the Group or the Acquired Subsidiary on loans sold to GSEs and others and private-label activities had an original unpaid principal balance of approximately $2.2bn at the time of such sale.
The unresolved repurchase requests discussed above relate to civil actions that have been commenced by the trustees for certain RMBS securitisations in which the trustees allege that the Group and/or the Acquired Subsidiary must repurchase loans that violated the operative R&Ws. Such trustees and other parties making repurchase requests have also alleged that the operative R&Ws may have been violated with respect to a greater (but unspecified) amount of loans than the amount of loans previously stated in specific repurchase requests made by such trustees. Cumulative realised losses reported at 31 December 2016 on loans covered by R&Ws made by the Group or the Acquired Subsidiary are approximately $1.3bn. All of the litigation involving repurchase requests remain at early stages.
In addition, the Acquired Subsidiary is subject to a more advanced civil action seeking, among other things, indemnification for losses allegedly suffered by a loan purchaser as a result of alleged breaches of R&Ws provided by the Acquired Subsidiary in connection with loan sales to the purchaser during the period 1997 to 2007. This litigation is ongoing.
Claimed Amounts/Financial Impact
It is not currently practicable to provide an estimate of the financial impact of the actions described on the Group or what effect that they might have upon the Group’s operating results, cash flows or financial position in any particular period.
RMBS Securities Claims
Background Information
As a result of some of the RMBS activities described above, the Group has been party to a number of lawsuits filed by purchasers of RMBS sponsored and/or underwritten by the Group between 2005 and 2008. As a general matter, these lawsuits alleged, among other things, that the RMBS offering materials allegedly relied on by such purchasers contained materially false and misleading statements and/or omissions and generally demanded rescission and recovery of the consideration paid for the RMBS and recovery of monetary losses arising out of their ownership. The Group has resolved a number of these claims, and only one action currently remains pending.
Claimed Amounts/Financial Impact
Approximately $0.1bn of the original face amount of RMBS related to the remaining pending action was outstanding as at 31 December 2016. There were virtually no cumulative realised losses reported on these RMBS as at 31 December 2016. The Group does not expect that, if it were to lose the remaining pending action, any such loss to be material.
Mortgage-related actions
Numerous governmental authorities have been investigating various aspects of the mortgage-related business. The Group has responded to requests from the DOJ relating to the RMBS Working Group of the Financial Fraud Enforcement Task Force (RMBS Working Group), which was formed to investigatepre-financial crisis mortgage-related misconduct. In connection with several of the investigations by members of the RMBS Working Group, a number of financial institutions have entered into settlements involving substantial monetary payments resolving claims related to the underwriting, securitisation and sale of residential mortgage-backed securities. In December 2016, the DOJ filed a civil complaint against Barclays in the US District Court in the EDNY containing a number of allegations, including mail and wire fraud, relating to mortgage-backed securities sold between 2005 and 2007. The complaint seeks, amongst other relief, unspecified monetary penalties. Barclays is defending the complaint.
The Group has also received requests for information and subpoenas from the SEC, the US Attorney’s Office for the District of Connecticut and SIGTARP related to trading practices in the secondary market for both RMBS and CMBS. The investigation by the SEC is at an advanced stage.
Claimed Amounts/Financial Impact
It is not currently practicable to provide an estimate of the financial impact of the actions described on the Group or what effect that they might have upon the Group’s operating results, cash flows or financial position in any particular period. The cost of resolving these actions could individually or in aggregate prove to be substantial.
American Depositary Shares
Barclays PLC, Barclays Bank PLC and various former members of Barclays PLC’s Board of Directors have been named as defendants in a securities class action consolidated in the SDNY alleging misstatements and omissions in offering documents for certain American Depositary Shares issued by Barclays Bank PLC in April 2008 with an original face amount of approximately $2.5 billion (the April 2008 Offering).
Background Information
The plaintiffs have asserted claims under the Securities Act of 1933, alleging that the offering documents for the April 2008 Offering contained misstatements and omissions concerning (amongst other things) Barclays Bank PLC’s portfolio of mortgage-related (including US subprime-related) securities, Barclays Bank PLC’s exposure to mortgage and credit market risk, and Barclays Bank PLC’s financial condition. The plaintiffs have not specifically alleged the amount of their damages. In June 2016, the SDNY certified the action as a class action. Barclays has moved for summary judgement.
Claimed Amounts/Financial Impact
It is not currently practicable to provide an estimate of the financial impact of the action described on the Group or what effect that it might have upon the Group’s operating results, cash flows or financial position in any particular period.
| 278 | Barclays PLC and Barclays Bank PLC 2016 Annual Report on Form 20-F |
29 Legal, competition and regulatory matterscontinued
BDC Finance L.L.C.
BDC Finance L.L.C. (BDC) filed a complaint against Barclays Bank PLC in the NY Supreme Court alleging breach of contract in connection with a portfolio of total return swaps governed by an ISDA Master Agreement (collectively, the Agreement). Parties related to BDC have also sued Barclays Bank PLC and BCI in Connecticut State Court in connection with Barclays Bank PLC’s conduct relating to the Agreement.
Background Information
In October 2008, BDC filed a complaint in the NY Supreme Court alleging that Barclays Bank PLC breached the Agreement when it failed to transfer approximately $40m of alleged excess collateral in response to BDC’s October 2008 demand (Demand).
BDC asserts that under the Agreement Barclays Bank PLC was not entitled to dispute the Demand before transferring the alleged excess collateral and that even if the Agreement entitled Barclays Bank PLC to dispute the Demand before making the transfer, Barclays Bank PLC failed to dispute the Demand. BDC demands damages totalling $298m plus attorneys’ fees, expenses, andpre-judgement interest. Proceedings are currently pending and a trial on liability issues is currently scheduled to occur in 2017.
In September 2011, BDC’s investment advisor, BDCM Fund Adviser, L.L.C. and its parent company, Black Diamond Capital Holdings, L.L.C. also sued Barclays Bank PLC and BCI in Connecticut State Court for unspecified damages allegedly resulting from Barclays Bank PLC’s conduct relating to the Agreement, asserting claims for violation of the Connecticut Unfair Trade Practices Act and tortious interference with business and prospective business relations. The parties agreed to stay this case.
Claimed Amounts/Financial Impact
BDC has made claims against the Group totalling $298m plus attorneys’ fees, expenses, andpre-judgement interest. This amount does not necessarily reflect the Group’s potential financial exposure if a ruling were to be made against it.
Civil Actions in respect of the US Anti-Terrorism Act
In April 2015, an amended civil complaint was filed in the US Federal Court in the EDNY by a group of approximately 250 plaintiffs, alleging that Barclays Bank PLC and a number of other banks engaged in a conspiracy and violated the US Anti-Terrorism Act (ATA) by facilitating US Dollar denominated transactions for the Government of Iran and various Iranian banks, which in turn funded Hezbollah and other attacks that injured or killed the plaintiffs’ family members. Plaintiffs seek to recover for pain, suffering and mental anguish pursuant to the provisions of the ATA, which allows for the tripling of any proven damages and attorneys’ fees. Plaintiffs filed a second amended complaint in July 2016, which, among other things, added various plaintiffs, bringing the total number of plaintiffs to approximately 350. In November 2016, defendants’ filed a motion to dismiss.
In November 2016, a separate civil complaint was filed in the US Federal Court in the Southern District of Illinois by a group of approximately 90 plaintiffs, alleging claims under the ATA against Barclays Bank PLC and a number of other banks. The allegations against Barclays Bank PLC are substantially similar to those in the second amended complaint in the US Federal Court in the EDNY action. Plaintiffs filed an amended complaint in January 2017, which, among other things, added various plaintiffs, bringing the total number of plaintiffs to approximately 200.
Claimed Amounts/Financial Impact
It is not currently practicable to provide an estimate of the financial impact of the actions described on the Group or what effect that they might have upon the Group’s operating results, cash flows or financial position in any particular period.
Interest Rate Swap US Civil Action
Barclays PLC, Barclays Bank PLC, and BCI, together with other financial institutions that act as market makers for interest rate swaps (IRS), Trade Web, and ICAP, are named as defendants in several antitrust class actions consolidated in the SDNY. The complaints allege defendants conspired to prevent the development of exchanges for IRS and demand unspecified money damages, treble damages and legal fees. Plaintiffs include certain swap execution facilities, as well asbuy-side investors. Thebuy-side investors claim to represent a class that transacted infixed-for-floating IRS with defendants in the US from 1 January 2008 to the present, including, for example, US retirement and pension funds, municipalities, university endowments, corporations, insurance companies and investment funds. Defendants filed motion to dismiss.
Claimed Amounts/Financial Impact
It is not currently practicable to provide an estimate of the financial impact of the actions described on the Group or what effect it have upon the Group’s operating results, cash flows or financial position in any particular period.
Treasury Auction Securities Civil Actions
Numerous putative class action complaints have been filed in US Federal Courts against BCI and other financial institutions that have served as primary dealers in US Treasury securities. The complaints have been consolidated in the US Federal Court in New York. The complaints generally allege that defendants conspired to manipulate the US Treasury securities market in violation of US federal antitrust laws, the CEA and state common law. Some complaints also allege that defendants engaged in illegal “spoofing” of the US Treasury market.
Certain governmental authorities have been conducting investigations into activities relating to the trading of government securities in various markets and Barclays has been providing information to various authorities on an ongoing basis.
Claimed Amounts/Financial Impact
It is not currently practicable to provide an estimate of the financial impact of the actions described on the Group or what effect that they might have upon the Group’s operating results, cash flows or financial position in any particular period.
Investigation into Americas Wealth & Investment Management Advisory Business
The SEC is investigating certain practices in Barclays’ former Wealth Americas investment advisory business relating to certain due diligence failures, fee and billing practices and mutual fund fee waivers and related disclosures. Barclays has been cooperating with the investigation, which is at an advanced stage.
| Barclays PLC and Barclays Bank PLC 2016 Annual Report on Form 20-F | 279 |
Notes to the financial statements
Accruals, provisions, contingent liabilities and legal proceedings
29 Legal, competition and regulatory matterscontinued
Claimed Amounts/Financial Impact
It is not currently practicable to provide an estimate of the financial impact of the action described on the Group or what effect that it might have upon the Group’s operating results, cash flows or financial position in any particular period.
Retail Structured Products Investigation
The Group is cooperating with an enforcement investigation commenced by the FCA in connection with structured products provided to UK customers from November 2009 to the present.
Claimed Amounts/Financial Impact
It is not currently practicable to provide an estimate of the financial impact of the action described on the Group or what effect that it might have upon the Group’s operating results, cash flows or financial position in any particular period.
Investigation into suspected money laundering related to foreign exchange transactions in South African operation
Absa Bank Limited, a subsidiary of Barclays Africa Group Limited, has identified potentially fraudulent activity by certain of its customers using advance payments for imports in 2014 and 2015 to effect foreign exchange transfers from South Africa to beneficiary accounts located in East Asia, UK, Europe and the US. As a result, the Group has been conducting a review of relevant activity, processes, systems and controls. The Group is keeping relevant authorities informed as to the status of this matter and is providing information to these authorities as part of its ongoing cooperation.
Claimed Amounts/Financial Impact
It is not currently practicable to provide an estimate of the financial impact of the actions described on the Group or what effect that they might have upon the Group’s operating results, cash flows or financial position in any particular period.
Portuguese Competition Authority Investigation
The Portuguese Competition Authority is investigating whether competition law was infringed by the exchange of information about retail credit products amongst 15 banks in Portugal, including the Group, over a period of 11 years with particular reference to mortgages, consumer lending and lending to small and medium enterprises. The Group is cooperating with the investigation.
Claimed Amounts/Financial Impact
It is not currently practicable to provide an estimate of the financial impact of the action described or what effect it might have upon operating results, cash flows or the Group’s financial position in any particular period.
Credit Default Swap (CDS) Antitrust Investigations and Civil Actions
The Commission and theDOJ-AD commenced investigations into the CDS market in 2011 and 2009, respectively. In December 2015 the Commission announced its decision to close its investigations in respect of Barclays Bank PLC and 12 other banks. In July 2016 the Commission announced its decision to accept legally binding commitments relating to licensing of inputs for CDS exchange trading from each of the remaining entities subject to the investigation, ISDA and Markit Ltd., and close its investigation. TheDOJ-AD has also closed its investigation.
A related civil class action in the SDNY involving similar claims against Barclays Bank PLC, other financial institutions, Markit Ltd., and ISDA was settled for a total of US$1.864bn (including a payment of US $170m from Barclays Bank PLC). The settlement received final approval in April 2016 subject to the right of class members toopt-out of the settlement and to seek to file their own claims.
Claimed Amounts/Financial Impact
Aside from the settlement discussed above, it is not currently practicable to provide an estimate of the financial impact of the actions described on the Group or what effect that they might have upon the Group’s operating results, cash flows or financial position in any particular period.
General
The Group is engaged in various other legal, competition and regulatory matters in the UK and US and a number of other overseas jurisdictions. It is subject to legal proceedings by and against the Group which arise in the ordinary course of business from time to time, including (but not limited to) disputes in relation to contracts, securities, debt collection, consumer credit, fraud, trusts, client assets, competition, data protection, money laundering, financial crime, employment, environmental and other statutory and common law issues.
The Group is also subject to enquiries and examinations, requests for information, audits, investigations and legal and other proceedings by regulators, governmental and other public bodies in connection with (but not limited to) consumer protection measures, compliance with legislation and regulation, wholesale trading activity and other areas of banking and business activities in which the Group is or has been engaged. The Group is keeping all relevant agencies briefed as appropriate in relation to these matters and others described in this Note on an ongoing basis.
At the present time, the Group does not expect the ultimate resolution of any of these other matters to have a material adverse effect on its financial position. However, in light of the uncertainties involved in such matters and the matters specifically described in this note, there can be no assurance that the outcome of a particular matter or matters will not be material to the Group’s results of operations or cash flow for a particular period, depending on, amongst other things, the amount of the loss resulting from the matter(s) and the amount of income otherwise reported for the reporting period.
| 280 | Barclays PLC and Barclays Bank PLC 2016 Annual Report on Form 20-F |
Notes to the financial statements
Capital instruments, equity and reserves
The notes included in this section focus on the Group’s loan capital and shareholders equity including issued share capital, retained earnings, other equity balances and interests of minority shareholders in our subsidiary entities(non-controlling interests). For more information on capital management and how the Group maintains sufficient capital to meet our regulatory requirements see pages 152 to 158.
30 Subordinated liabilities
Accounting for subordinated debt
Subordinated debt is measured at amortised cost using the effective interest method under IAS 39.
Subordinated liabilities include accrued interest and comprise undated and dated loan capital as follows:
| | 2016 £m |
| | 2015 £m |
| |||||||
| Undated subordinated liabilities | 4,495 | 5,248 | ||||||||||
| Dated subordinated liabilities | 18,888 | 16,219 | ||||||||||
| Total subordinated liabilities | 23,383 | 21,467 | ||||||||||
None of the Group’s loan capital is secured.
| ||||||||||||
| Undated subordinated liabilities | ||||||||||||
| | Subordinated liabilities per balance sheet | | ||||||||||
| Initial call date | | 2016 £m |
| | 2015 £m |
| ||||||
| Barclays Bank PLC issued | ||||||||||||
| Tier One Notes (TONs) | ||||||||||||
| 6% Callable Perpetual Core Tier One Notes | 2032 | 17 | 16 | |||||||||
| 6.86% Callable Perpetual Core Tier One Notes (USD 179m) | 2032 | 232 | 626 | |||||||||
| Reserve Capital Instruments (RCIs) | ||||||||||||
| 5.926%Step-up Callable Perpetual Reserve Capital Instruments | 2016 | – | 113 | |||||||||
| 7.434%Step-up Callable Perpetual Reserve Capital Instruments (USD 117m) | 2017 | 100 | 85 | |||||||||
| 6.3688%Step-up Callable Perpetual Reserve Capital Instruments | 2019 | 37 | 38 | |||||||||
| 14%Step-up Callable Perpetual Reserve Capital Instruments | 2019 | 3,124 | 3,062 | |||||||||
| 5.3304%Step-up Callable Perpetual Reserve Capital Instruments | 2036 | 54 | 51 | |||||||||
| Undated Notes | ||||||||||||
| 6.375% Undated Subordinated Notes | 2017 | 140 | 143 | |||||||||
| 7.7% Undated Subordinated Notes (USD 99m) | 2018 | 84 | 69 | |||||||||
| 8.25% Undated Subordinated Notes | 2018 | 148 | 149 | |||||||||
| 7.125% Undated Subordinated Notes | 2020 | 193 | 195 | |||||||||
| 6.125% Undated Subordinated Notes | 2027 | 45 | 245 | |||||||||
| Junior Undated Floating Rate Notes (USD 38m) | Any interest payment date | 31 | 74 | |||||||||
| Undated Floating Rate Primary Capital Notes Series 3 | Any interest payment date | 21 | 145 | |||||||||
| Bonds | ||||||||||||
| 9.25% Perpetual Subordinated Bonds(ex-Woolwich Plc) | 2021 | 91 | 91 | |||||||||
| 9% Permanent Interest Bearing Capital Bonds | At any time | 47 | 45 | |||||||||
| Loans | ||||||||||||
| 5.03% Reverse Dual Currency Undated Subordinated Loan (JPY 8,000m) | 2028 | 54 | 42 | |||||||||
| 5% Reverse Dual Currency Undated Subordinated Loan (JPY 12,000m) | 2028 | 77 | 59 | |||||||||
| Total undated subordinated liabilities | 4,495 | 5,248 | ||||||||||
Undated loan capital
Undated loan capital is issued by the Bank and its subsidiaries for the development and expansion of the business and to strengthen the capital bases. The principal terms of the undated loan capital are described below:
Subordination
All undated loan capital ranks behind the claims against the bank of depositors and other unsecured unsubordinated creditors and holders of dated loan capital in the following order: Junior Undated Floating Rate Notes; other issues of Undated Notes, Bonds and Loans ranking pari passu with each other; followed by TONs and RCIs ranking pari passu with each other.
Interest
All undated loan capital bears a fixed rate of interest until the initial call date, with the exception of the 9% Bonds which are fixed for the life of the issue, and the Junior and Series 3 Undated Notes which are floating rate.
After the initial call date, in the event that they are not redeemed, the 6.375%, 7.125%, 6.125% Undated Notes and the 9.25% Bonds will bear interest at rates fixed periodically in advance for five-year periods based on market rates. All other undated loan capital except the two floating rate Undated Notes will bear interest, and the two floating rate Undated Notes currently bear interest, at rates fixed periodically in advance based on London interbank rates.
| Barclays PLC and Barclays Bank PLC 2016 Annual Report on Form 20-F | 281 |
Notes to the financial statements
Capital instruments, equity and reserves
30 Subordinated liabilitiescontinued
Payment of interest
The Bank is not obliged to make a payment of interest on its Undated Notes, Bonds and Loans excluding the 7.7% Undated Notes, 8.25% Undated Notes and 9.25% Bonds if, in the preceding six months, a dividend has not been declared or paid on any class of shares of Barclays PLC or, in certain cases, any class of preference shares of the Bank. The Bank is not obliged to make a payment of interest on its 9.25% Perpetual Subordinated Bonds if, in the immediately preceding 12 months’ interest period, a dividend has not been paid on any class of its share capital. Interest not so paid becomes payable in each case if such a dividend is subsequently paid or in certain other circumstances. During the year, the Bank declared and paid dividends on its ordinary shares and on all classes of preference shares.
No payment of principal or any interest may be made unless the Bank satisfies a specified solvency test.
The Bank may elect to defer any payment of interest on the 7.7% Undated Notes and 8.25% Undated Notes. Until such time as any deferred interest has been paid in full, neither the Bank nor Barclays PLC may declare or pay a dividend, subject to certain exceptions, on any of its ordinary shares, preference shares, or other share capital or satisfy any payments of interest or coupons on certain other junior obligations.
The Bank may elect to defer any payment of interest on the RCIs. Any such deferred payment of interest must be paid on the earlier of: (i) the date of redemption of the RCIs, (ii) the coupon payment date falling on or nearest to the tenth anniversary of the date of deferral of such payment, and (iii) in respect of the 14% RCIs only, substitution. Whilst such deferral is continuing, neither the Bank nor Barclays PLC may declare or pay a dividend, subject to certain exceptions, on any of its ordinary shares or preference shares.
The Bank may elect to defer any payment of interest on the TONs if it determines that it is, or such payment would result in it being, innon-compliance with capital adequacy requirements and policies of the PRA. Any such deferred payment of interest will only be payable on a redemption of the TONs. Until such time as the Bank next makes a payment of interest on the TONs, neither the Bank nor Barclays PLC may (i) declare or pay a dividend, subject to certain exceptions, on any of their respective ordinary shares or Preference Shares, or make payments of interest in respect of the Bank’s Reserve Capital Instruments and (ii) certain restrictions on the redemption, purchase or reduction of their respective share capital and certain other securities also apply.
Repayment
All undated loan capital is repayable at the option of the Bank, generally in whole, at the initial call date and on any subsequent coupon or interest payment date or in the case of the 6.375%, 7.125%, 6.125% Undated Notes and the 9.25% Bonds on any fifth anniversary after the initial call date. In addition, each issue of undated loan capital is repayable, at the option of the Bank in whole in the event of certain changes in the tax treatment of the notes, either at any time, or on an interest payment date. There are no events of default exceptnon-payment of principal or mandatory interest. Any repayments require the prior approval of the PRA.
Other
All issues of undated subordinated liabilities arenon-convertible.
| 282 | Barclays PLC and Barclays Bank PLC 2016 Annual Report on Form 20-F |
| 30 Subordinated liabilitiescontinued | ||||||||||||||||
Dated subordinated liabilities | ||||||||||||||||
| | Subordinated liabilities per balance sheet |
| ||||||||||||||
| | Initial call date | | | Maturity date | | | 2016 £m |
| | 2015 £m |
| |||||
Barclays PLC issued | ||||||||||||||||
2.625% Fixed Rate Subordinated Callable Notes (EUR 1,250m) | 2020 | 2025 | 1,084 | 918 | ||||||||||||
4.375% Fixed Rate Subordinated Notes (USD 1,250m) | 2024 | 1,054 | 883 | |||||||||||||
5.20% Fixed Rate Subordinated Notes (USD 2,050m) | 2026 | 1,590 | – | |||||||||||||
Barclays Bank PLC issued | ||||||||||||||||
6.05% Fixed Rate Subordinated Notes (USD 1,556m) | 2017 | 1,316 | 1,124 | |||||||||||||
Floating Rate Subordinated Notes (EUR 40m) | 2018 | 34 | 29 | |||||||||||||
6% Fixed Rate Subordinated Notes (EUR 1,750m) | 2018 | 1,590 | 1,377 | |||||||||||||
CMS-Linked Subordinated Notes (EUR 100m) | 2018 | 90 | 77 | |||||||||||||
CMS-Linked Subordinated Notes (EUR 135m) | 2018 | 120 | 103 | |||||||||||||
Fixed/Floating Rate Subordinated Callable Notes | 2018 | 2023 | 548 | 555 | ||||||||||||
7.75% Contingent Capital Notes (USD 1,000m) | 2018 | 2023 | 822 | 679 | ||||||||||||
Floating Rate Subordinated Notes (EUR 50m) | 2019 | 42 | 36 | |||||||||||||
5.14% Lower Tier 2 Notes (USD 1,094m) | 2020 | 956 | 808 | |||||||||||||
6% Fixed Rate Subordinated Notes (EUR 1,500m) | 2021 | 1,444 | 1,252 | |||||||||||||
9.5% Subordinated Bonds(ex-Woolwich Plc) | 2021 | 286 | 293 | |||||||||||||
Subordinated Floating Rate Notes (EUR 100m) | 2021 | 85 | 73 | |||||||||||||
10% Fixed Rate Subordinated Notes | 2021 | 2,345 | 2,317 | |||||||||||||
10.179% Fixed Rate Subordinated Notes (USD 1,521m) | 2021 | 1,285 | 1,083 | |||||||||||||
Subordinated Floating Rate Notes (EUR 50m) | 2022 | 43 | 37 | |||||||||||||
6.625% Fixed Rate Subordinated Notes (EUR 1,000m) | 2022 | 1,042 | 891 | |||||||||||||
7.625% Contingent Capital Notes (USD 3,000m) | 2022 | 2,390 | 1,984 | |||||||||||||
Subordinated Floating Rate Notes (EUR 50m) | 2023 | 43 | 37 | |||||||||||||
5.75% Fixed Rate Subordinated Notes | 2026 | 384 | 802 | |||||||||||||
5.4% Reverse Dual Currency Subordinated Loan (JPY 15,000m) | 2027 | 103 | 80 | |||||||||||||
6.33% Subordinated Notes | 2032 | 64 | 60 | |||||||||||||
Subordinated Floating Rate Notes (EUR 68m) | 2040 | 58 | 74 | |||||||||||||
Absa Bank Limited issueda | ||||||||||||||||
10.28% Subordinated Callable Notes (ZAR 600m) | 2017 | 2022 | – | 26 | ||||||||||||
Subordinated Callable Notes (ZAR 400m) | 2017 | 2022 | – | 18 | ||||||||||||
Subordinated Callable Notes (ZAR 1,805m) | 2017 | 2022 | – | 79 | ||||||||||||
Subordinated Callable Notes (ZAR 2,007m) | 2018 | 2023 | – | 88 | ||||||||||||
8.295% Subordinated Callable Notes (ZAR 1,188m) | 2018 | 2023 | – | 42 | ||||||||||||
5.50%CPI-linked Subordinated Callable Notes (ZAR 1,500m) | 2023 | 2028 | – | 86 | ||||||||||||
Barclays Africa Group Limited Issueda | ||||||||||||||||
Subordinated Callable Notes (ZAR 370m) | 2019 | 2024 | – | 16 | ||||||||||||
10.835% Subordinated Callable Notes (ZAR 130m) | 2019 | 2024 | – | 6 | ||||||||||||
Subordinated Callable Notes (ZAR 1,693m) | 2020 | 2025 | – | 74 | ||||||||||||
10.05% Subordinated Callable Notes (ZAR 807m) | 2020 | 2025 | – | 36 | ||||||||||||
11.4% Subordinated Callable Notes (ZAR 288m) | 2020 | 2025 | – | 13 | ||||||||||||
11.365% Subordinated Callable Notes (ZAR 508m) | 2020 | 2025 | – | 23 | ||||||||||||
Subordinated Callable Notes (ZAR 437m) | 2020 | 2025 | – | 19 | ||||||||||||
11.81% Subordinated Callable Notes (ZAR 737m) | 2022 | 2027 | – | 33 | ||||||||||||
Subordinated Callable Notes (ZAR 30m) | 2022 | 2027 | – | 1 | ||||||||||||
Other capital issued by Barclays Africaa | 2019 | – | 3 | |||||||||||||
Capital issued by other subsidiaries | 2017-2019 | 70 | 84 | |||||||||||||
Total dated subordinated liabilities | 18,888 | 16,219 | ||||||||||||||
Dated loan capital
Dated loan capital is issued by the Company, the Bank and respective subsidiaries for the development and expansion of their business and to strengthen their respective capital bases. The principal terms of the dated loan capital are described below:
Subordination
Dated loan capital issued by the Company ranks behind the claims against the Company of unsecured unsubordinated creditors but before the claims of the holders of its equity.
All dated loan capital issued by the Bank ranks behind the claims against the Bank of depositors and other unsecured unsubordinated creditors but before the claims of the undated loan capital and the holders of its equity. The dated loan capital issued by other subsidiaries is similarly subordinated.
Notes
| a | Instruments forming part of the BAGL group have been reclassified to Liabilities included in disposal groups classified as held for sale. For more information refer to Note 44 on page 305. |
| Barclays PLC and Barclays Bank PLC 2016 Annual Report on Form 20-F | 283 |
Notes to the financial statements
Capital instruments, equity and reserves
30 Subordinated liabilitiescontinued
Interest
Interest on the Floating Rate Notes is fixed periodically in advance, based on the related interbank or local central bank rates.
Interest on the 7.75% Contingent Capital Notes and the 2.625% Fixed Rate Subordinated Callable Notes are fixed until the call date. After the respective call dates, in the event that they are not redeemed, the interest rates will bere-set and fixed until maturity based on a market rate.
Repayment
Those Notes with a call date are repayable at the option of the issuer, on conditions governing the respective debt obligations, some in whole or in part, and some only in whole. The remaining dated loan capital outstanding at 31 December 2016 is redeemable only on maturity, subject in particular cases to provisions allowing an early redemption in the event of certain changes in tax law, or to certain changes in legislation or regulations.
Any repayments prior to maturity require, in the case of the Company and the Bank, the prior approval of the PRA, or in the case of the overseas issues, the approval of the local regulator for that jurisdiction and of the PRA in certain circumstances.
There are no committed facilities in existence at the balance sheet date which permit the refinancing of debt beyond the date of maturity.
Other
The 7.625% Contingent Capital Notes will be automatically transferred from investors to Barclays PLC (or another entity within the Group) for nil consideration in the event the Barclays PLC consolidated CRD IV Common Equity Tier 1 (CET1) ratio (FSA October 2012 transitional statement) falls below 7.0%.
The 7.75% Contingent Capital Notes will be automatically written-down and investors will lose their entire investment in the notes in the event the Barclays PLC consolidated CRD IV Common Equity Tier 1 (CET1) ratio (FSA October 2012 transitional statement) falls below 7.0%.
31 Ordinary shares, share premium, and other equity
Called up share capital, allotted and fully paid | ||||||||||||||||||||
| | Number of shares m |
| | Ordinary shares £m |
| | Share premium £m |
| | Total share capital and share premium £m |
| | Other equity instruments £m |
| ||||||
As at 1 January 2016 | 16,805 | 4,201 | 17,385 | 21,586 | 5,305 | |||||||||||||||
Issued to staff under share incentive plans | 116 | 30 | 158 | 188 | – | |||||||||||||||
Issuances relating to Scrip Dividend Programme | 42 | 10 | 58 | 68 | – | |||||||||||||||
AT1 securities issuance | – | – | – | – | 1,132 | |||||||||||||||
Other movements | – | – | – | – | 12 | |||||||||||||||
As at 31 December 2016 | 16,963 | 4,241 | 17,601 | 21,842 | 6,449 | |||||||||||||||
As at 1 January 2015 | 16,498 | 4,125 | 16,684 | 20,809 | 4,322 | |||||||||||||||
Issued to staff under share incentive plans | 253 | 63 | 577 | 640 | – | |||||||||||||||
Issuances relating to Scrip Dividend Programme | 54 | 13 | 124 | 137 | – | |||||||||||||||
AT1 securities issuance | – | – | – | – | 995 | |||||||||||||||
Other movements | – | – | – | – | (12) | |||||||||||||||
As at 31 December 2015 | 16,805 | 4,201 | 17,385 | 21,586 | 5,305 | |||||||||||||||
Called up share capital
Called up share capital comprises 16,963m (2015: 16,805m) ordinary shares of 25p each. The increase was due to the issuance of 116m (2015: 253m) shares under employee share schemes and a further 42m (2015: 54m) issued as part of the Barclays PLC Scrip Dividend Programme.
Share repurchase
At the 2016 AGM on 28 April 2016, Barclays PLC was authorised to purchase up to an aggregate of 1,681m of its ordinary shares of 25p. The authorisation is effective until the AGM in 2017 or the close of business on 30 June 2017, whichever is the earlier. No share repurchases were made during either 2016 or 2015.
Other equity instruments
Other equity instruments of £6,449m (2015: £5,305m) include AT1 securities issued by Barclays PLC. In 2016, there was one issuance of Fixed Rate Resetting Perpetual Subordinated Contingent Convertible Securities, with a principal amount of £1.1bn. In 2015, there was one issuance of Fixed Rate Resetting Perpetual Subordinated Contingent Convertible Securities, with a principal amount of £1.0bn.
The AT1 securities are perpetual securities with no fixed maturity and are structured to qualify as AT1 instruments under CRD IV.
The principal terms of the AT1 securities are described below:
| § | AT1 securities rank behind the claims against Barclays PLC of (i) unsubordinated creditors; (ii) claims which are expressed to be subordinated to the claims of unsubordinated creditors of Barclays PLC but not further or otherwise; or (iii) claims which are, or are expressed to be, junior to the claims of other creditors of Barclays PLC, whether subordinated or unsubordinated, other than claims which rank, or are expressed to rank, pari passu with, or junior to, the claims of holders of the AT1 securities. |
| § | AT1 securities bear a fixed rate of interest until the initial call date. After the initial call date, in the event that they are not redeemed, the AT1 securities will bear interest at rates fixed periodically in advance for five-year periods based on market rates. |
| § | Interest on the AT1 securities will be due and payable only at the sole discretion of Barclays PLC, and Barclays PLC has sole and absolute discretion at all times and for any reason to cancel (in whole or in part) any interest payment that would otherwise be payable on any interest payment date. |
| 284 | Barclays PLC and Barclays Bank PLC 2016 Annual Report on Form 20-F |
31 Ordinary shares, share premium, and other equitycontinued
| § | AT1 securities are undated and are repayable, at the option of Barclays PLC, in whole at the initial call date, or on any fifth anniversary after the initial call date. In addition, the AT1 securities are repayable, at the option of Barclays PLC, in whole in the event of certain changes in the tax or regulatory treatment of the securities. Any repayments require the prior consent of the PRA. |
All AT1 securities will be converted into ordinary shares of Barclays PLC, at a pre determined price, should the fully loaded CET1 ratio of the Barclays PLC Group fall below 7.0%.
32 Reserves
Currency translation reserve
The currency translation reserve represents the cumulative gains and losses on the retranslation of the Group’s net investment in foreign operations, net of the effects of hedging.
As at 31 December 2016, there was a credit balance of £3,051m (2015: £623m debit) in the currency translation reserve. The increase in the credit balance of £3,674m (2015: £41m debit) principally reflected the strengthening of all major currencies against GBP. The currency translation reserve movement associated withnon-controlling interests was a £801m credit (2015: £435m debit) reflecting the strengthening of ZAR against GBP.
During the year a £101m net gain (2015: £65m net loss) from recycling of the currency translation reserve was recognised in the income statement.
Available for sale reserve
The available for sale reserve represents the unrealised change in the fair value of available for sale investments since initial recognition.
As at 31 December 2016 there was a debit balance of £74m (2015: £317m credit) in the available for sale reserve. The decrease of £391m (2015: £245m decrease) was primarily due to a £2,192m gain from changes in fair value on Government Bonds, predominantly held in the liquidity pool which was more than offset by £1,677m of losses from related hedging and £912m of net gains transferred to net profit, mainly due to £615m gain on disposal of Barclays’ share of Visa Europe Limited. A tax charge of £28m was recognised in the period relating to these items.
Cash flow hedging reserve
The cash flow hedging reserve represents the cumulative gains and losses on effective cash flow hedging instruments that will be recycled to the income statement when the hedged transactions affect profit or loss.
As at 31 December 2016, there was a credit balance of £2,105m (2015: £1,261m credit) in the cash flow hedging reserve. The increase of £844m (2015: £556m decrease) principally reflected a £1,595m increase in the fair value of interest rate swaps held for hedging purposes as interest rate forward curves decreased, partially offset by £450m gains recycled to the income statement in line with when the hedged item affects profit or loss and tax charge of £326m. The tax charge on cash flow hedge movements represented an effective rate of tax of 27.9% (2015: 10.6%). This tax charge reflects the introduction of the new surcharge of 8%, that applies to bank’s UK profits with effect from January 2016, in addition to the standard UK corporation tax rate of 20%.
Other reserves and treasury shares
As at 31 December 2016, there was a credit balance of £969m (2015: £943m credit) in other reserves and treasury shares.
A credit balance of £1,011m (2015: £1,011m credit ) related to the excess repurchase price paid over nominal of redeemed ordinary and preference shares issues by the Group.
The treasury shares relate to Barclays PLC shares held in relation to the Group’s various share schemes. These schemes are described in Note 34 Share-based payments.
Treasury shares are deducted from shareholders’ equity within other reserves. A transfer is made to retained earnings in line with the vesting of treasury shares held for the purposes of share-based payments.
As at 31 December 2016, there was a debit balance of £42m (2015: £68m debit) in other reserves relating to treasury shares. The decrease principally reflected £166m (2015: £618m) transferred from treasury shares reflecting the vesting of deferred share-based payments, partially offset by £140m (2015: £602m) net purchases of treasury shares held for the purposes of employee share schemes.
33Non-controlling interests
| | Profit attributable to non-controlling interest | | | Equity attributable to non-controlling interest | | | Dividends paid to non-controlling interest | | ||||||||||||||||
| | 2016 £m | | | 2015 £m | | | 2016 £m | | | 2015 £m | | | 2016 £m | | | 2015 £m | | |||||||
Barclays Bank PLC issued: | ||||||||||||||||||||||||
– Preference shares | 340 | 343 | 2,698 | 3,654 | 340 | 343 | ||||||||||||||||||
– Upper Tier 2 instruments | 3 | 2 | 272 | 486 | – | – | ||||||||||||||||||
Barclays Africa Group Limited | 402 | 324 | 3,507 | 1,902 | 235 | 209 | ||||||||||||||||||
Othernon-controlling interests | 3 | 3 | 15 | 12 | – | – | ||||||||||||||||||
Total | 748 | 672 | 6,492 | 6,054 | 575 | 552 | ||||||||||||||||||
Subsidiaries of the Group that give rise to significantnon-controlling interests are Barclays Bank PLC and Barclays Africa Group Limited.
Barclays Bank PLC
Barclays PLC holds 100% of the voting rights of Barclays Bank PLC. As at 31 December 2016, Barclays Bank PLC has in issue preference shares and Upper Tier 2 instruments, representing 11% (2015: 11%) of its equity. Preference share dividends and redemption are typically at the discretion of Barclays Bank PLC. The payment of Upper Tier 2 instrument coupons and principal are typically at the discretion of Barclays Bank PLC, except for coupon payments that become compulsory where Barclays PLC has declared or paid a dividend on ordinary shares in the precedingsix-month period. Preference share and Upper Tier 2 instrument holders typically only have rights to redeem in the event of insolvency.
| Barclays PLC and Barclays Bank PLC 2016 Annual Report on Form 20-F | 285 |
Notes to the financial statements
Capital instruments, equity and reserves
33Non-controlling interestscontinued
Instrument | | 2016 £m |
| | 2015 £m |
| ||
Preference Shares: | ||||||||
6.00% non cumulative callable preference shares | 203 | 203 | ||||||
6.278% non cumulative callable preference shares | 318 | 318 | ||||||
4.75% non cumulative callable preference shares | 211 | 211 | ||||||
6.625% non cumulative callable preference shares | – | 406 | ||||||
7.1% non cumulative callable preference shares | 657 | 657 | ||||||
7.75% non cumulative callable preference shares | – | 550 | ||||||
8.125% non cumulative callable preference shares | 1,309 | 1,309 | ||||||
Total Barclays Bank PLC Preference Shares | 2,698 | 3,654 | ||||||
Barclays Africa Group Limited | 277 | 201 | ||||||
Total | 2,975 | 3,855 | ||||||
Upper Tier 2 Instruments: | ||||||||
Undated Floating Rate Primary Capital Notes Series 1 | 93 | 222 | ||||||
Undated Floating Rate Primary Capital Notes Series 2 | 179 | 264 | ||||||
Total Upper Tier 2 Instruments | 272 | 486 | ||||||
Protective rights ofnon-controlling interests
Barclays Africa Group Limited
Barclays owns 50.2% (50.1% including treasury shares) of the share capital of Barclays Africa Group Limited. Barclays PLC’s rights to access the assets of Barclays Africa and its group companies are restricted by virtue of the South African Companies Act which requires 75% shareholder approval to dispose of all or the greater part of Barclays Africa Group Limited’s assets or to complete the voluntary winding up of the entity.
Barclays Bank PLC
Barclays Bank PLC also has in issue preference shares which arenon-controlling interests to the Group. Under the terms of these instruments, Barclays PLC may not pay dividends on ordinary shares until a dividend is next paid on these instruments or the instruments are redeemed or purchased by Barclays Bank PLC. There are no restrictions on Barclays Bank PLC’s ability to remit capital to the Parent as a result of these issued instruments.
| 286 | Barclays PLC and Barclays Bank PLC 2016 Annual Report on Form 20-F |
Notes to the financial statements
Employee benefits
The notes included in this section focus on the costs and commitments associated with employing our staff.
|
34 Share-based payments
Accounting for share-based payments The Group applies IFRS 2 Share-Based Payments in accounting for employee remuneration in the form of shares.
Employee incentives include awards in the form of shares and share options, as well as offering employees the opportunity to purchase shares on favourable terms. The cost of the employee services received in respect of the shares or share options granted is recognised in the income statement over the period that employees provide services, generally the period in which the award is granted or notified and the vesting date of the shares or options. The overall cost of the award is calculated using the number of shares and options expected to vest and the fair value of the shares or options at the date of grant.
The number of shares and options expected to vest takes into account the likelihood that performance and service conditions included in the terms of the awards will be met. Failure to meet thenon-vesting condition is treated as a cancellation, resulting in an acceleration of recognition of the cost of the employee services.
The fair value of shares is the market price ruling on the grant date, in some cases adjusted to reflect restrictions on transferability. The fair value of options granted is determined using option pricing models to estimate the numbers of shares likely to vest. These take into account the exercise price of the option, the current share price, the risk-free interest rate, the expected volatility of the share price over the life of the option and other relevant factors. Market conditions that must be met in order for the award to vest are also reflected in the fair value of the award, as are any othernon-vesting conditions – such as continuing to make payments into a share based savings scheme.
|
The charge for the year arising from share-based payment schemes was as follows:
| Charge for the year | ||||||||||||
| | 2016 £m | | | 2015 £m | | | 2014 £m | | ||||
Share Value Plan | 473 | 442 | 575 | |||||||||
Others | 192 | 86 | 82 | |||||||||
Total equity settled | 665 | 528 | 657 | |||||||||
Cash settled | 1 | 4 | 5 | |||||||||
Total share based payments | 666 | 532 | 662 | |||||||||
The terms of the main current plans are as follows:
Share Value Plan (SVP)
The SVP was introduced in March 2010 and approved by shareholders (for Executive Director participation and use of new issue shares) at the AGM in April 2011. SVP awards are granted to participants in the form of a conditional right to receive Barclays PLC shares or provisional allocations of Barclays PLC shares which vest or are considered for release over a period of three years in equal annual tranches. Participants do not pay to receive an award or to receive a release of shares. The grantor may also make a dividend equivalent payment to participants on release of a SVP award. SVP awards are also made to eligible employees for recruitment purposes. All awards are subject to potential forfeiture in certain leaver scenarios. See also Note 8 for additional detail on share awards granted under SVP.
Other schemes
In addition to the SVP, the Group operates a number of other schemes including schemes operated by, and settled in, the shares of subsidiary undertakings, none of which is individually or in aggregate material in relation to the charge for the year or the dilutive effect of outstanding share options. Included within other schemes are Sharesave (both UK and overseas), the Barclays’ Long Term Incentive Plan, the Share Incentive Award and the Executive Share Award Scheme.
Share option and award plans
The weighted average fair value per award granted and weighted average share price at the date of exercise/release of shares during the year was:
| | Weighted average fair value per award granted in year |
| | Weighted average share price at exercise/ release during year |
| |||||||||||
| | 2016 £ |
| | 2015 £ |
| | 2016 £ |
| | 2015 £ |
| |||||
| SVPa | 1.66 | 2.54 | 1.66 | 2.53 | ||||||||||||
| Othersa | 0.61-1.67 | 0.49-2.54 | 1.65-1.88 | 2.37-2.67 | ||||||||||||
SVP are nil cost awards on which the performance conditions are substantially completed at the date of grant. Consequently the fair value of these awards is based on the market value at that date.
Notes
| a | Options/award granted over Barclays PLC shares. |
| Barclays PLC and Barclays Bank PLC 2016 Annual Report on Form 20-F | 287 |
Notes to the financial statements
Employee benefits
34 Share based paymentscontinued
Movements in options and awards
The movement in the number of options and awards for the major schemes and the weighted average exercise price of options was:
| SVPa,b | Othersa,c | |||||||||||||||||||||||
| Number (000s) | Number (000s) | | Weighted average ex. price (£) |
| ||||||||||||||||||||
| 2016 | 2015 | 2016 | 2015 | 2016 | 2015 | |||||||||||||||||||
Outstanding at beginning of year/acquisition date | 386,470 | 480,042 | 166,975 | 185,599 | 1.75 | 1.61 | ||||||||||||||||||
Granted in the year | 229,371 | 186,397 | 154,069 | 55,982 | 1.20 | 2.27 | ||||||||||||||||||
Exercised/released in the year | (191,623 | ) | (252,031 | ) | (60,912 | ) | (50,538 | ) | 1.39 | 1.41 | ||||||||||||||
Less: forfeited in the year | (18,202 | ) | (27,938 | ) | (47,342 | ) | (20,811 | ) | 1.95 | 1.76 | ||||||||||||||
Less: expired in the year | – | – | (7,661 | ) | (3,257 | ) | 1.83 | 2.39 | ||||||||||||||||
Outstanding at end of year | 406,016 | 386,470 | 205,129 | 166,975 | 1.38 | 1.75 | ||||||||||||||||||
Of which exercisable: | 30 | 24,435 | 26,058 | 1.78 | 1.48 | |||||||||||||||||||
Certain of the Group’s share option plans enable certain Directors and employees to subscribe for new ordinary shares of Barclays PLC. For accounting for treasury shares see Note 32 Reserves.
The weighted average contractual remaining life and number of options and awards outstanding (including those exercisable) at the balance sheet date are as follows:
| ||||||||||||||||||||||||
| 2016 | 2015 | |||||||||||||||||||||||
| | Weighted average remaining contractual life in years | | | Number of options/ awards outstanding (000s | ) | | Weighted average remaining contractual life in years | | | Number of options/ awards outstanding (000s | ) | |||||||||||||
SVPa,b | 1 | 406,016 | 1 | 386,470 | ||||||||||||||||||||
Othersa | 0-3 | 205,129 | 0-2 | 166,975 | ||||||||||||||||||||
There were no significant modifications to the share based payments arrangements in 2016 and 2015.
As at 31 December 2016, the total liability arising from cash-settled share based payments transactions was nil (2015: £13m).
Holdings of Barclays PLC shares
Various employee benefit trusts established by the Group hold shares in Barclays PLC to meet obligations under the Barclays share based payment schemes. The total number of Barclays shares held in these employee benefit trusts at 31 December 2016 was 6.6 million (2015: 5.1 million). Dividend rights have been waived on all these shares. The total market value of the shares held in trust based on the year end share price of £2.23 (2015: £2.19) was £14.7m (2015: £11.2m).
35 Pensions and post retirement benefits
Accounting for pensions and post retirement benefits The Group operates a number of pension schemes and post-employment benefit schemes.
Defined contribution schemes – the Group recognises contributions due in respect of the accounting period in the income statement. Any contributions unpaid at the balance sheet date are included as a liability.
Defined benefit schemes – the Group recognises its obligations to members of each scheme at the period end, less the fair value of the scheme assets after applying the asset ceiling test. The clarifications contained in the proposed amendments to IFRIC 14 as to when an entity has an unconditional right to benefit from a scheme surplus are not expected to have a material impact on the Group. The Trustee board do not have a substantive right to augment benefits in the UKRF, nor do they have the right to wind up the plan except in the dissolution of the Bank or termination of contributions by the Bank.
Each scheme’s obligations are calculated using the projected unit credit method. Scheme assets are stated at fair value as at the period end.
Changes in pension scheme liabilities or assets (remeasurements) that do not arise from regular pension cost, net interest on net defined benefit liabilities or assets, past service costs, settlements or contributions to the scheme, are recognised in other comprehensive income. Remeasurements comprise experience adjustments (differences between previous actuarial assumptions and what has actually occurred), the effects of changes in actuarial assumptions, return on scheme assets (excluding amounts included in the interest on the assets) and any changes in the effect of the asset ceiling restriction (excluding amounts included in the interest on the restriction).
Post-employment benefit schemes – the cost of providing health care benefits to retired employees is accrued as a liability in the financial statements over the period that the employees provide services to the Group, using a methodology similar to that for defined benefit pension schemes.
|
Notes
| a | Options/award granted over Barclays PLC shares. |
| b | Nil cost award and therefore the weighted average exercise price was nil. |
| c | The number of awards within Others at the end of the year principally relates to Sharesave (number of awards exercisable at end of year was 10,584,072). The weighted average exercise price relates to Sharesave. |
| 288 | Barclays PLC and Barclays Bank PLC 2016 Annual Report on Form 20-F |
35 Pensions and post retirement benefitscontinued
Pension schemes
UK Retirement Fund (UKRF)
The UKRF is the Group’s main scheme, representing 96% of the Group’s total retirement benefit obligations. The UKRF was closed to new entrants on 1 October 2012, and comprises 10 sections, the two most significant of which are:
| § | Afterwork, which comprises a contributory cash balance defined benefit element, and a voluntary defined contribution element. The cash balance element is accrued each year and revalued until Normal Retirement Age in line with the increase in Retail Price Index (RPI) (up to a maximum of 5% p.a.). An investment related increase of up to 2% a year may also be added at Barclays’ discretion. Between 1 October 2003 and 1 October 2012 the majority of new employees outside of the investment banking business within Barclays International were eligible to join this section. The costs ofill-health retirements and death in service benefits for Afterwork members are borne by the UKRF. The main risks that Barclays runs in relation to Afterwork are limited although additional contributions are required ifpre-retirement investment returns are not sufficient to provide for the benefits. |
| § | The 1964 Pension Scheme. Most employees recruited before July 1997 built up benefits in thisnon-contributory defined benefit scheme in respect of service up to 31 March 2010. Pensions were calculated by reference to service and pensionable salary. From 1 April 2010, members became eligible to accrue future service benefits in either Afterwork or the Pension Investment Plan (PIP), a historic defined contribution section which is now closed to future contributions. The risks that Barclays runs in relation to the 1964 section are typical of final salary pension schemes, principally that investment returns fall short of expectations, that inflation exceeds expectations, and that retirees live longer than expected. |
Barclays Pension Savings Plan (BPSP)
| § | From 1 October 2012, a new UK pension scheme, the BPSP, was established to satisfy Auto Enrolment legislation. The BPSP is a defined contribution scheme (Group Personal Pension) providing benefits for all new Barclays UK hires from 1 October 2012, investment banking business within Barclays International employees who were in PIP as at 1 October 2012, and also all UK employees who were not members of a pension scheme at that date. As a defined contribution scheme, BPSP is not subject to the same investment return, inflation or life expectancy risks for Barclays that defined benefit schemes are. Members’ benefits reflect contributions paid and the level of investment returns achieved. |
Apart from the UKRF and the BPSP, Barclays operates a number of smaller pension and long-term employee benefits and post-retirement health care plans globally, the largest of which are the US defined benefit schemes. Many of the schemes are funded, with assets backing the obligations held in separate legal vehicles such as trusts. Others are operated on an unfunded basis. The benefits provided, the approach to funding, and the legal basis of the schemes, reflect local environments.
Governance
The UKRF operates under trust law and is managed and administered on behalf of the members in accordance with the terms of the Trust Deed and Rules and all relevant legislation. The Corporate Trustee is Barclays Pension Funds Trustees Limited, a private limited company and a wholly owned subsidiary of Barclays Bank PLC. The Trustee is the legal owner of the assets of the UKRF which are held separately from the assets of the Group.
The Trustee Board comprises six Management Directors selected by Barclays, of whom three are independent Directors with no relationship with Barclays or the UKRF, plus three Member Nominated Directors selected from eligible active staff and pensioner members who apply for the role.
The BPSP is a Group Personal Pension arrangement which operates as a collection of personal pension plans. Each personal pension plan is a direct contract between the employee and the BPSP provider (Legal & General Assurance Society Limited), and is regulated by the FCA.
Similar principles of pension governance apply to the Group’s other pension schemes, depending on local legislation.
| Barclays PLC and Barclays Bank PLC 2016 Annual Report on Form 20-F | 289 |
Notes to the financial statements
Employee benefits
35 Pensions and post retirement benefitscontinued
Amounts recognised
The following tables include amounts recognised in the income statement and an analysis of benefit obligations and scheme assets for all Group defined benefit schemes. The net position is reconciled to the assets and liabilities recognised on the balance sheet. The tables include funded and unfunded post-retirement benefits.
Income statement chargea | ||||||||||||||||
| 2016 | 2015 | 2014 | ||||||||||||||
| £m | £m | £m | ||||||||||||||
Current service cost | 243 | 255 | 279 | |||||||||||||
Net finance cost | (32 | ) | 41 | 69 | ||||||||||||
Past service cost | – | (432 | ) | (1 | ) | |||||||||||
Other movements | 2 | 1 | (15 | ) | ||||||||||||
Total | 213 | (135 | ) | 332 | ||||||||||||
Past service costs includes a nil (2015: £429m; 2014: nil) gain on valuation of a component of the defined retirement benefit liability.
|
| |||||||||||||||
Balance sheet reconciliationa | 2016 | 2015 | ||||||||||||||
| Of which | Of which | |||||||||||||||
| relates to | relates to | |||||||||||||||
| Total | UKRF | Total | UKRF | |||||||||||||
| £m | £m | £m | £m | |||||||||||||
Benefit obligation at beginning of the year | (28,279 | ) | (26,027 | ) | (30,392 | ) | (27,931 | ) | ||||||||
Current service cost | (243 | ) | (220 | ) | (303 | ) | (234 | ) | ||||||||
Interest costs on scheme liabilities | (1,016 | ) | (980 | ) | (1,147 | ) | (1,010 | ) | ||||||||
Past service cost | – | – | 434 | 429 | ||||||||||||
Remeasurement (loss)/gain – financial | (7,214 | ) | (7,170 | ) | 1,161 | 1,121 | ||||||||||
Remeasurement gain/(loss) – demographic | 413 | 390 | (159 | ) | (160 | ) | ||||||||||
Remeasurement gain – experience | 525 | 490 | 609 | 611 | ||||||||||||
Employee contributions | (4 | ) | (1 | ) | (36 | ) | (2 | ) | ||||||||
Benefits paid | 1,852 | 1,800 | 1,172 | 1,021 | ||||||||||||
Exchange and other movements | 933 | (129 | ) | 382 | 128 | |||||||||||
Benefit obligation at end of the year | (33,033 | ) | (31,847 | ) | (28,279 | ) | (26,027 | ) | ||||||||
Fair value of scheme assets at beginning of the year | 28,752 | 26,829 | 28,874 | 26,827 | ||||||||||||
Interest income on scheme assets | 1,048 | 1,023 | 1,105 | 979 | ||||||||||||
Employer contribution | 720 | 634 | 689 | 586 | ||||||||||||
Remeasurement – return on scheme assets greater/(less) than discount rate | 5,009 | 5,002 | (476 | ) | (446 | ) | ||||||||||
Employee contributions | 4 | 1 | 36 | 2 | ||||||||||||
Benefits paid | (1,852 | ) | (1,800 | ) | (1,172 | ) | (1,021 | ) | ||||||||
Exchange and other movements | (1,024 | ) | 131 | (304 | ) | (98 | ) | |||||||||
Fair value of scheme assets at the end of the year | 32,657 | 31,820 | 28,752 | 26,829 | ||||||||||||
Net (deficit)/surplus | (376 | ) | (27 | ) | 473 | 802 | ||||||||||
Irrecoverable surplus (effect of asset ceiling) | – | – | (60 | ) | – | |||||||||||
Net recognised (liabilities)/assets | (376 | ) | (27 | ) | 413 | 802 | ||||||||||
Retirement benefit assets | 14 | – | 836 | 802 | ||||||||||||
Retirement benefit liabilities | (390 | ) | (27 | ) | (423 | ) | – | |||||||||
Net retirement benefit (liabilities)/assets | (376 | ) | (27 | ) | 413 | 802 | ||||||||||
Included within the benefit obligation was £979m (2015: £2,050m) relating to overseas pensions and £207m (2015: £202m) relating to other post-employment benefits.
As at 31 December 2016, the UKRF’s scheme assets were in deficit versus IAS 19 obligations by £27m (2015: surplus of £802m). The movement for the UKRF is mainly due to a decrease in discount rate to 2.62% (2015: 3.82%), and an increase in inflation rate to 3.35% (2015: 3.05%) partially offset by deficit contributions, updated mortality assumptions based on scheme experience, and higher than assumed returns on plan assets. The UKRF benefits paid of £1,800m (2015: £1,021m) included transfers out of the fund and contribution refunds of £1,029m (2015: £270m).
Where a scheme’s assets exceed its obligation, an asset is recognised to the extent that it does not exceed the present value of future contribution holidays or refunds of contributions (the “asset ceiling”). In the case of the UKRF the asset ceiling is not applied as, in certain specified circumstances such aswind-up, Barclays expects to be able to recover any surplus. The application of the asset ceiling to other plans is considered on an individual plan basis.
Critical accounting estimates and judgements
Actuarial valuation of the schemes’ obligation is dependent upon a series of assumptions, below is a summary of the main financial and demographic assumptions adopted for the UKRF.
Key UKRF financial assumptions | | 2016 % p.a. | | | 2015 % p.a. | | ||
Discount rate | 2.62 | 3.82 | ||||||
Inflation rate (RPI) | 3.35 | 3.05 |
Note
| a | Comparative information for the income statement charge has been restated to exclude discontinued operations, while balance sheet information has not been restated. Please see page 217 for more details. |
| 290 | Barclays PLC and Barclays Bank PLC 2016 Annual Report on Form 20-F |
35 Pensions and post retirement benefitscontinued
The UKRF discount rate assumption for 2016 was based on a variant of the standard Willis Towers Watson RATE Link model. This variant includes all bonds rated AA by at least one of the four major ratings agencies, and assumes that yields after year 30 are flat. The RPI inflation assumption for 2016 was set by reference to the Bank of England’s implied inflation spot curve, assuming the spot curve remains flat after the published 25 years. The inflation assumption incorporates a deduction of 20 basis points as an allowance for an inflation risk premium. The methodology used to derive the discount rate and price inflation assumption is consistent with that used at the prior year end.
The UKRF’s post-retirement mortality assumptions are based on a best estimate assumption derived from an analysis in 2016 of Barclays own post-retirement mortality experience, and taking account of recent evidence from published mortality surveys. An allowance has been made for future mortality improvements based on the 2015 core projection model published by the Continuous Mortality Investigation Bureau subject to a long-term trend of 1.25% per annum in future improvements. The table below shows how the assumed life expectancy at 60, for members of the UKRF, has varied over the past three years:
Assumed life expectancy | 2016 | 2015 | 2014 | |||||||||
Life expectancy at 60 for current pensioners (years) | ||||||||||||
– Males | 27.9 | 28.4 | 28.3 | |||||||||
– Females | 29.7 | 30.0 | 29.9 | |||||||||
Life expectancy at 60 for future pensioners currently aged 40 (years) | ||||||||||||
– Males | 29.7 | 30.2 | 30.1 | |||||||||
– Females | 31.7 | 32.0 | 31.9 |
Sensitivity analysis on actuarial assumptions
The sensitivity analysis has been calculated by valuing the UKRF liabilities using the amended assumptions shown in the table below and keeping the remaining assumptions as disclosed in the table above the same, except in the case of the inflation sensitivity where other assumptions that depend on assumed inflation have also been amended. The difference between the recalculated liability figure and that stated in the balance sheet reconciliation table above is the figure shown. The selection of these movements to illustrate the sensitivity of the defined benefit obligation to key assumptions should not be interpreted as Barclays expressing any specific view of the probability of such movements happening.
| Change in key assumptions | ||||||||
| 2016 | 2015 | |||||||
| | (Decrease)/ Increase in UKRF defined benefit obligation £bn |
| | (Decrease)/ Increase in defined benefit obligation £bn |
| |||
Discount rate | ||||||||
0.5% p.a. increase | (2.8 | ) | (2.1 | ) | ||||
0.25% p.a. increase | (1.4 | ) | (1.1 | ) | ||||
0.25% p.a. decrease | 1.5 | 1.2 | ||||||
0.5% p.a. decrease | 3.2 | 2.4 | ||||||
Assumed RPI | ||||||||
0.5% p.a. increase | 1.9 | 1.4 | ||||||
0.25% p.a. increase | 0.9 | 0.7 | ||||||
0.25% p.a. decrease | (0.9 | ) | (0.7 | ) | ||||
0.5% p.a. decrease | (2.0 | ) | (1.3 | ) | ||||
Life expectancy at 60 | ||||||||
One year increase | 1.1 | 0.9 | ||||||
One year decrease | (1.1 | ) | (0.9 | ) |
The weighted average duration of the benefit payments reflected in the defined benefit obligation for the UKRF is 20 years.
Assets
A long-term investment strategy has been set for the UKRF, with its asset allocation comprising a mixture of equities, bonds, property and other appropriate assets. This recognises that different asset classes are likely to produce different long-term returns and some asset classes may be more volatile than others. The long-term investment strategy ensures, among other aims, that investments are adequately diversified. Asset managers are permitted some flexibility to vary the asset allocation from the long-term investment strategy within control ranges agreed with the Trustee from time to time.
The UKRF also employs derivative instruments, where appropriate, to achieve a desired exposure or return, or to match assets more closely to liabilities. The value of assets shown reflects the assets held by the scheme, with any derivative holdings reflected on a fair value basis.
| Barclays PLC and Barclays Bank PLC 2016 Annual Report on Form 20-F | 291 |
Notes to the financial statements
Employee benefits
35 Pensions and post retirement benefitscontinued
The value of the assets of the schemes and their percentage in relation to total scheme assets were as follows:
Analysis of scheme assets | ||||||||||||||||
| Total | Of which relates to UKRF | |||||||||||||||
| Value | | % of total fair value of scheme assets | | Value | | % of total fair value of scheme assets | | |||||||||
| £m | % | £m | % | |||||||||||||
As at 31 December 2016 | ||||||||||||||||
Equities – quoted | 8,123 | 24.9 | 7,840 | 24.6 | ||||||||||||
Equities –non-quoted | 2,043 | 6.3 | 2,042 | 6.4 | ||||||||||||
Bonds – fixed governmenta | 1,330 | 4.1 | 1,072 | 3.4 | ||||||||||||
Bonds – index-linked governmenta | 13,173 | 40.3 | 13,165 | 41.4 | ||||||||||||
Bonds – corporate and othera | 5,222 | 16.0 | 5,054 | 15.9 | ||||||||||||
Property – commercialb | 1,630 | 5.0 | 1,622 | 5.1 | ||||||||||||
Derivativesb | 870 | 2.7 | 870 | 2.7 | ||||||||||||
Otherb | 266 | 0.7 | 155 | 0.5 | ||||||||||||
Fair value of scheme assets | 32,657 | 100.0 | 31,820 | 100.0 | ||||||||||||
As at 31 December 2015 | ||||||||||||||||
Equities – quoted | 7,764 | 27.0 | 6,947 | 25.9 | ||||||||||||
Equities –non-quoted | 1,757 | 6.1 | 1,750 | 6.5 | ||||||||||||
Bonds – fixed governmenta | 1,105 | 3.8 | 577 | 2.2 | ||||||||||||
Bonds – index-linked governmenta | 9,677 | 33.7 | 9,670 | 36.0 | ||||||||||||
Bonds – corporate and othera | 5,856 | 20.4 | 5,680 | 21.2 | ||||||||||||
Property – commercialb | 1,602 | 5.6 | 1,581 | 5.9 | ||||||||||||
Derivativesb | 183 | 0.6 | 183 | 0.7 | ||||||||||||
Otherb | 808 | 2.8 | 441 | 1.6 | ||||||||||||
Fair value of scheme assets | 28,752 | 100.0 | 26,829 | 100.0 | ||||||||||||
Included within the fair value of scheme assets were: £0.2m (2015: £5m) relating to shares in Barclays PLC, £0.1m (2015: £23m) relating to bonds issued by the Barclays PLC, nil (2015: £6m) relating to property occupied by Group companies, and nil (2015: £7m) relating to other investments. The UKRF also invests in pooled investment vehicles which may hold shares or debt issued by Barclays PLC.
The UKRF scheme assets also include £32m (2015: £36m) relating to UK private equity investments and £2,009m (2015: £1,714m) relating to overseas private equity investments. These are disclosed above within Equities –non-quoted.
Approximately 40% of the UKRF assets are invested in liability-driven investment strategies; primarily UK gilts as well as interest rate and inflation swaps. These are used to better match the assets to liabilities. The swaps are used to reduce the scheme’s inflation and duration risks against liabilities.
Notes
| a | Assets held are predominately quoted. |
| b | Assets held are predominantlynon-quoted. |
| 292 | Barclays PLC and Barclays Bank PLC 2016 Annual Report on Form 20-F |
35 Pensions and post retirement benefitscontinued
Funding
The triennial funding valuation of the UKRF is currently underway with an effective date of 30 September 2016. Contribution requirements, including any deficit recovery plans, must be agreed by 31 December 2017, and are expected to be agreed between the Bank and Trustee well in advance of this statutory deadline. In these discussions, the Bank and the Trustee are taking into account the impact of the Structural Reform Programme.
The previous triennial funding valuation at 30 September 2013 showed a deficit of £3.6bn and a funding level of 87.4%. The Bank and Trustee agreed a scheme-specific funding target, statement of funding principles, a schedule of contributions and a recovery plan to eliminate the deficit relative to the funding target. The main differences between the funding and IAS 19 assumptions are a more prudent discount rate and longevity assumptions for funding.
The recovery plan agreed as part of the 2013 actuarial valuation provided for the Bank to pay deficit contributions to the UKRF until 2021. Deficit contributions of £300m were paid in 2015 and in 2016. Under the existing recovery plan, further deficit contributions of £740m per annum are payable during 2017 to 2021, and up to £500m of the 2021 deficit contribution is payable in 2017 depending on the deficit level at that time. These deficit contributions are in addition to the regular contributions to meet the Group’s share of the cost of benefits accruing over each year.
Innon-valuation years, the Scheme Actuary prepares an annual update of the funding position. The latest annual update was carried out as at 30 September 2015 and showed a deficit of £6.0bn and a funding level of 82.7%. The contributions paid to the UKRF are agreed between Barclays and the Trustee every three years.
Defined benefit contributions paid with respect to the UKRF were as follows:
Contributions paid | ||||
| £m | ||||
2016 | 634 | |||
2015 | 586 | |||
2014 | 241 |
Included within the Group’s contributions paid were £112m (2015: nil; 2014: nil) Section 75 contributions.
The Group’s expected contribution to the UKRF in respect of defined benefits in 2017 is £1,585m (2016: £634m) including £167m Section 75 contributions. In addition, the expected contributions to UK defined contribution schemes in 2017 is £36m (2016: £49m) to the UKRF and £124m (2016: £126m) to the BPSP.
| Barclays PLC and Barclays Bank PLC 2016 Annual Report on Form 20-F | 293 |
Notes to the financial statements
Scope of consolidation
The section presents information on the Group’s investments in subsidiaries, joint ventures and associates and its interests in structured entities. Detail is also given on securitisation transactions the Group has entered into and arrangements that are held off balance sheet.
36 Principal subsidiaries
Barclays applies IFRS 10 Consolidated Financial Statements. The consolidated financial statements combine the financial statements of Barclays PLC and all its subsidiaries. Subsidiaries are entities over which the Group has control. Under IFRS 10, this is when the Group is exposed or has rights to variable returns from its involvement in the entity and has the ability to affect those returns through its power over the entity.
The Group reassesses whether it controls an entity if facts and circumstances indicate that there have been changes to its power, its rights to variable returns or its ability to use its power to affect the amount of its returns.
Intra-group transactions and balances are eliminated on consolidation and consistent accounting policies are used throughout the Group for the purposes of the consolidation. Changes in ownership interests in subsidiaries are accounted for as equity transactions if they occur after control has been obtained and they do not result in loss of control.
The significant judgements used in applying this policy are set out below.
Accounting for investment in subsidiaries In the individual financial statements of Barclays PLC, investments in subsidiaries are stated at cost less impairment.
|
Principal subsidiaries for the Group are set out below. This includes those subsidiaries that are most significant in the context of the Group’s business, results or financial position.
Company Name | Principal place of business or incorporation | Nature of business | | Percentage of voting rights held % | | | Non- controlling interests – proportion of ownership interests % |
| | Non- controlling interests – proportion of voting interests % |
| |||||
Barclays Bank PLC | England | Banking, holding company | 100 | 11 | – | |||||||||||
Barclays Capital Securities Limited | England | Securities dealing | 100 | – | – | |||||||||||
Barclays Securities Japan Limited | Japan | Securities dealing | 100 | – | – | |||||||||||
Barclays Africa Group Limited | South Africa | Banking | 50.1 | 49.9 | 49.9 | |||||||||||
Barclays Capital Inc | US | Securities dealing | 100 | – | – | |||||||||||
Barclays Bank Delaware | US | Credit card issuer | 100 | – | – |
The country of registration or incorporation is also the principal area of operation of each of the above subsidiaries.
Ownership interests are in some cases different to voting interests due to the existence ofnon-voting equity interests, such as preference shares. See Note 33Non-controlling interests for more information.
Barclays Private Clients International Limited was considered a principal subsidiary in 2015. Barclays Private Clients International Limited transferred all associated assets and liabilities to Barclays Bank PLC in October 2016.
Significant judgements and assumptions used to determine the scope of the consolidation
Determining whether the Group has control of an entity is generally straightforward based on ownership of the majority of the voting capital. However, in certain instances, this determination will involve significant judgement, particularly in the case of structured entities where voting rights are often not the determining factor in decisions over the relevant activities. This judgement may involve assessing the purpose and design of the entity. It will also often be necessary to consider whether the Group, or another involved party with power over the relevant activities, is acting as a principal in its own right or as an agent on behalf of others.
There is also often considerable judgement involved in the ongoing assessment of control over structured entities. In this regard, where market conditions have deteriorated such that the other investors’ exposures to the structure’s variable returns have been substantively eliminated, the Group may conclude that the managers of the structured entity are acting as its agent and therefore will consolidate the structured entity.
An interest in equity voting rights exceeding 50% would typically indicate that the Group has control of an entity. However, certain entities, as set out below, are excluded from consolidation because the Group does not have exposure to their variable returns.
| Percentage of voting | Equity shareholder’s | Retained profit for | ||||||
Country of registration or incorporation | Company name | rights held (%) | funds (£m) | the year (£m) | ||||
UK | Fitzroy Finance Limited | 100 | – | – | ||||
Cayman Islands | Palomino Limited | 100 | 2 | 1 |
These entities are managed by external counterparties and consequently are not controlled by the Group. Where appropriate, interests relating to these entities are included in Note 37 Structured entities.
Significant restrictions
As is typical for a Group of its size and international scope, there are restrictions on the ability of Barclays PLC to obtain distributions of capital, access the assets or repay the liabilities of members of its Group due to the statutory, regulatory and contractual requirements of its subsidiaries and due to the protective rights ofnon-controlling interests. These are considered on the next page.
| 294 | Barclays PLC and Barclays Bank PLC 2016 Annual Report on Form 20-F |
36 Principal subsidiariescontinued
Regulatory requirements
Barclays’ principal subsidiary companies have assets and liabilities before intercompany eliminations of £1,553bn (2015: £1,468bn) and £1,480bn (2015: £1,398bn) respectively. The assets and liabilities are subject to prudential regulation and regulatory capital requirements in the countries in which they are regulated. These require entities to maintain minimum capital levels which cannot be returned to the parent company, Barclays PLC on a going concern basis.
In order to meet capital requirements, subsidiaries may hold certain equity-accounted and debt-accounted issued financial instruments andnon-equity instruments such as Tier 1 and Tier 2 capital instruments and other forms of subordinated liabilities. See Note 28 Contingent liabilities and commitments, Note 30 Subordinated liabilities and Note 33Non-controlling interests for particulars of these instruments. These instruments may be subject to cancellation clauses or preference share restrictions that would limit the ability of the entity to repatriate the capital on a timely basis.
Liquidity requirements
Regulated subsidiaries of the Group are required to maintain liquidity pools to meet PRA and local regulatory requirements. The main subsidiaries affected are Barclays Bank PLC, Barclays Africa Group Limited and Barclays Capital Inc which must maintain daily compliance with the regulatory minimum. See pages 159 to 177 for further details of liquidity requirements, including those of our significant subsidiaries.
Statutory requirements
The Group’s subsidiaries are subject to statutory requirements not to make distributions of capital and unrealised profits and generally to maintain solvency. These requirements restrict the ability of subsidiaries to make remittances of dividends to Barclays PLC, the ultimate parent, except in the event of a legal capital reduction or liquidation. In most cases, the regulatory restrictions referred to above exceed the statutory restrictions.
Contractual requirements
Asset encumbrance
The Group uses its financial assets to raise finance in the form of securitisations and through the liquidity schemes of central banks. Once encumbered, the assets are not available for transfer around the Group. The assets typically affected are disclosed in Note 40 Assets Pledged.
Assets held by consolidated structured entities
£99m (2015: £80m) of assets included in the Group’s balance sheet relate to consolidated investment funds and are held to pay return and principal to the holders of units in the funds. The assets held in these funds cannot be transferred to other members of the Group.
Other restrictions
The Group is required to maintain balances with central banks and other regulatory authorities, and these amounted to £4,254m (2015: £4,369m).
Barclays Africa Group Limited assets are subject to exchange control regulation determined by the South African Reserve Bank (SARB). Special dividends and loans in lieu of dividends cannot be transferred without SARB approval.
37 Structured entities
A structured entity is an entity in which voting or similar rights are not the dominant factor in deciding control. Structured entities are generally created to achieve a narrow and well defined objective with restrictions around their ongoing activities.
Depending on the Group’s power over the activities of the entity and its exposure to and ability to influence its own returns, it may consolidate the entity. In other cases, it may sponsor or have exposure to such an entity but not consolidate it.
Consolidated structured entities
The Group has contractual arrangements which may require it to provide financial support to the following types of consolidated structured entities:
Securitisation vehicles
The Group uses securitisation as a source of financing and a means of risk transfer. Refer to Note 39 Securitisations for further detail.
The Group provides liquidity facilities to certain securitisation vehicles. At 31 December 2016, there were outstanding loan commitments to these entities totalling £152m (2015: £135m).
Commercial paper (CP) and medium-term note conduits
The Group provided £9bn (2015: £8.5bn) in undrawn contractual backstop liquidity facilities to CP conduits.
Fund management entities
Barclays has contractually guaranteed the performance of certain cash investments in a number of managed investment funds which have resulted in their consolidation. As at 31 December 2016, the notional value of the guarantee was £99m (2015: £257m). The decrease is primarily due to the closure of a number of European wealth funds during the year, as well as a reduction in fund assets.
Employee benefit and other trusts
The Group provides capital contributions to employee share trusts to enable them to meet their obligations to employees under share-based payment plans. During 2016, the Group provided undrawn liquidity facilities of £0.4bn (2015: £0.8bn) to certain trusts.
Unconsolidated Structured Entities in which the Group has an interest
An interest in a structured entity is any form of contractual ornon-contractual involvement which creates variability in returns arising from the performance of the entity for the Group. Such interests include holdings of debt or equity securities, derivatives that transfer financial risks from the entity to the Group, lending, loan commitments, financial guarantees and investment management agreements.
Interest rate swaps, foreign exchange derivatives that are not complex and which expose the Group to insignificant credit risk by being senior in the payment waterfall of a securitisation and derivatives that are determined to introduce risk or variability to a structured entity are not considered to be an interest in an entity and have been excluded from the disclosures below.
| Barclays PLC and Barclays Bank PLC 2016 Annual Report on Form 20-F | 295 |
Notes to the financial statements
Scope of consolidation
37 Structured entitiescontinued
The nature and extent of the Group’s interests in structured entities is summarised below:
| Summary of interests in unconsolidated structured entities | ||||||||||||||||||||
| | Secured financing £m | | | Short-term traded interests £m | | | Traded derivatives £m | | | Other interests £m | | | Total £m |
| ||||||
| As at 31 December 2016 | ||||||||||||||||||||
| Assets | ||||||||||||||||||||
| Trading portfolio assets | – | 8,436 | – | 516 | 8,952 | |||||||||||||||
| Financial assets designated at fair value | 22,706 | – | – | 367 | 23,073 | |||||||||||||||
| Derivative financial instruments | – | – | 4,731 | 2,130 | 6,861 | |||||||||||||||
| Available for sale investments | – | – | – | 894 | 894 | |||||||||||||||
| Loans and advances to banks | – | – | – | 4,915 | 4,915 | |||||||||||||||
| Loans and advances to customers | – | – | – | 24,142 | 24,142 | |||||||||||||||
| Reverse repurchase agreements and other similar secured lending | 6,338 | – | – | – | 6,338 | |||||||||||||||
| Other assets | – | – | – | 25 | 25 | |||||||||||||||
| Total assets | 29,044 | 8,436 | 4,731 | 32,989 | 75,200 | |||||||||||||||
| Liabilities | ||||||||||||||||||||
| Derivative financial instruments | – | – | 3,567 | 2,130 | 5,697 | |||||||||||||||
| As at 31 December 2015 | ||||||||||||||||||||
| Assets | ||||||||||||||||||||
| Trading portfolio assets | – | 8,949 | – | 1,648 | 10,597 | |||||||||||||||
| Financial assets designated at fair value | 12,382 | – | – | 353 | 12,735 | |||||||||||||||
| Derivative financial instruments | – | – | 4,427 | 1,926 | 6,353 | |||||||||||||||
| Available for sale investments | – | – | – | 1,060 | 1,060 | |||||||||||||||
| Loans and advances to banks | – | ��� | – | 4,067 | 4,067 | |||||||||||||||
| Loans and advances to customers | – | – | – | 27,700 | 27,700 | |||||||||||||||
| Reverse repurchase agreements and other similar secured lending | 7,117 | – | – | – | 7,117 | |||||||||||||||
| Other assets | – | – | – | 31 | 31 | |||||||||||||||
| Total assets | 19,499 | 8,949 | 4,427 | 36,785 | 69,660 | |||||||||||||||
| Liabilities | ||||||||||||||||||||
| Derivative financial instruments | – | – | 2,761 | 1,926 | 4,687 | |||||||||||||||
Secured financing arrangements, short term traded interests and traded derivatives are typically managed under market risk management policies described on page 143 which includes an indication of the change of risk measures compared to last year. For this reason, the total assets of these entities are not considered meaningful for the purposes of understanding the related risks and so have not been presented. Other interests include a portfolio held withinNon-Core which is being managed down, conduits and corporate lending where the interest is driven by normal customer demand.
Secured financing
The Group routinely enters into reverse repurchase contracts, stock borrowing and similar arrangements on normal commercial terms where the counterparty to the arrangement is a structured entity. Due to the nature of these arrangements, especially the transfer of collateral and ongoing margining, the Group has minimal exposure to the performance of the structured entity counterparty. A description of these transactions is included in Note 22 Reverse repurchase and repurchase agreements including other similar lending and borrowing.
Short-term traded interests
The Group buys and sells interests in structured entities as part of its trading activities, for example, retail mortgage-backed securities, collateralised debt obligations and similar interests. Such interests are typically held individually or as part of a larger portfolio for no more than 90 days. In such cases, the Group typically has no other involvement with the structured entity other than the securities it holds as part of trading activities and its maximum exposure to loss is restricted to the carrying value of the asset.
As at 31 December 2016, £6,568m (2015: £7,443m) of the Group’s £8,436m (2015: £8,949m) short-term traded interests were comprised of debt securities issued by asset securitisation vehicles.
Traded derivatives
The Group enters into a variety of derivative contracts with structured entities which reference market risk variables such as interest rates, foreign exchange rates and credit indices amongst other things. The main derivative types which are considered interests in structured entities include index-based and entity specific credit default swaps, balance guaranteed swaps, total return swaps, commodities swaps, and equity swaps. A description of the types of derivatives and the risk management practices are detailed in Note 15 Derivative financial instruments. The risk of loss may be mitigated through ongoing margining requirements as well as a right to cash flows from the structured entity which are senior in the payment waterfall. Such margining requirements are consistent with market practice for many derivative arrangements and in line with the Group’s normal credit policies.
Derivative transactions require the counterparty to provide cash or other collateral under margining agreements to mitigate counterparty credit risk. The Group is exposed to settlement risk only on these derivatives which is mitigated through daily margining. Total notionals amounted to £1,183,215m (2015: £1,117,642m).
| 296 | Barclays PLC and Barclays Bank PLC 2016 Annual Report on Form 20-F |
37 Structured entitiescontinued
Except for credit default swaps where the maximum exposure to loss is the swap notional amount, it is not possible to estimate the maximum exposure to loss in respect of derivative positions as the fair value of derivatives is subject to changes in market rates of interest, exchange rates and credit indices which by their nature are uncertain. In addition, the Group’s losses would be subject to mitigating action under its traded market risk and credit risk policies that require the counterparty to provide collateral in cash or other assets on a daily basis in most cases.
Other interests in unconsolidated structured entities
The Group’s interests in structured entities not held for the purposes of short-term trading activities are set out below, summarised by the purpose of the entities and limited to significant categories, based on maximum exposure to loss.
| Nature of interest | ||||||||||||||||||||||||||||
| | Structured credit portfolio £m | | | Multi-seller conduit programmes £m | | | Lending £m |
| | Mortgage- backed securities £m | | | Investment funds and trusts £m |
| | Others £m | | | Total £m |
| ||||||||
| As at 31 December 2016 | ||||||||||||||||||||||||||||
| Trading portfolio assets | ||||||||||||||||||||||||||||
| – Debt securities | 441 | – | – | – | – | – | 441 | |||||||||||||||||||||
| – Equity securities | – | – | – | – | – | 75 | 75 | |||||||||||||||||||||
| Financial assets designated at fair value | ||||||||||||||||||||||||||||
| – Loans and advances to customers | – | – | 260 | – | – | 4 | 264 | |||||||||||||||||||||
| – Debt securities | – | – | 50 | – | – | 48 | 98 | |||||||||||||||||||||
| – Equity securities | – | – | – | – | – | 5 | 5 | |||||||||||||||||||||
| Derivative financial instruments | – | – | – | – | – | 2,130 | 2,130 | |||||||||||||||||||||
| Available for sale investments | ||||||||||||||||||||||||||||
| – Debt securities | 535 | – | – | 357 | – | 2 | 894 | |||||||||||||||||||||
| Loans and advances to banks | – | – | 4,890 | – | – | 25 | 4,915 | |||||||||||||||||||||
| Loans and advances to customers | 637 | 6,016 | 16,754 | – | – | 735 | 24,142 | |||||||||||||||||||||
| Other assets | – | 5 | 7 | – | 13 | – | 25 | |||||||||||||||||||||
| Total on balance sheet exposures | 1,613 | 6,021 | 21,961 | 357 | 13 | 3,024 | 32,989 | |||||||||||||||||||||
| Total off balance sheet notional amounts | 681 | 2,734 | 9,873 | – | – | 1,058 | 14,346 | |||||||||||||||||||||
| Maximum exposure to loss | 2,294 | 8,755 | 31,834 | 357 | 13 | 4,082 | 47,335 | |||||||||||||||||||||
| Total assets of the entity | 22,508 | 75,535 | 492,950 | 12,213 | 18,550 | 4,621 | 626,377 | |||||||||||||||||||||
| As at 31 December 2015 | ||||||||||||||||||||||||||||
| Trading portfolio assets | ||||||||||||||||||||||||||||
| – Debt securities | 1,545 | – | – | – | – | 40 | 1,585 | |||||||||||||||||||||
| – Equity securities | – | – | – | – | – | 63 | 63 | |||||||||||||||||||||
| Financial assets designated at fair value | ||||||||||||||||||||||||||||
| – Loans and advances to customers | – | – | 247 | – | – | 6 | 253 | |||||||||||||||||||||
| – Debt securities | – | – | 41 | – | – | 57 | 98 | |||||||||||||||||||||
| – Equity securities | – | – | – | – | – | 2 | 2 | |||||||||||||||||||||
| Derivative financial instruments | – | – | – | – | – | 1,926 | 1,926 | |||||||||||||||||||||
| Available for sale investments | ||||||||||||||||||||||||||||
| – Debt securities | 537 | – | – | 515 | – | 8 | 1,060 | |||||||||||||||||||||
| Loans and advances to banks | – | – | 4,051 | – | – | 16 | 4,067 | |||||||||||||||||||||
| Loans and advances to customers | 1,599 | 5,029 | 20,571 | – | – | 501 | 27,700 | |||||||||||||||||||||
| Other assets | – | 4 | 7 | – | 20 | – | 31 | |||||||||||||||||||||
| Total on balance sheet exposures | 3,681 | 5,033 | 24,917 | 515 | 20 | 2,619 | 36,785 | |||||||||||||||||||||
| Total off balance sheet notional amounts | 708 | 3,042 | 10,225 | – | – | 1,409 | 15,384 | |||||||||||||||||||||
| Maximum exposure to loss | 4,389 | 8,075 | 35,142 | 515 | 20 | 4,028 | 52,169 | |||||||||||||||||||||
| Total assets of the entity | 36,290 | 81,355 | 376,296 | 115,351 | 21,766 | 5,084 | 636,142 | |||||||||||||||||||||
Maximum exposure to loss
Unless specified otherwise below, the Group’s maximum exposure to loss is the total of its on balance sheet positions and its off balance sheet arrangements, being loan commitments and financial guarantees. Exposure to loss is mitigated through collateral, financial guarantees, the availability of netting and credit protection held.
Structured Credit Portfolio
This comprises interests in debt securities issued by securitisation vehicles, mainly Collateralised Loan Obligations (CLOs), Collateralised Debt Obligations (CDOs), Residential and Commercial Mortgage-Backed Securitisation structures (RMBSs and CMBSs), and drawn and undrawn loan facilities to these entities. The entities are wholly debt financed through the issuance of tranches of debt securities or through direct funding, such as the loan facilities provided by the Group. As the underlying assets of the entities amortise and pay down, the debt securities issued by the entities are repaid in order of seniority. Where the entities experience significant credit deterioration, debt securities may be written off or cancelled in reverse order of seniority.
As at 31 December 2016, the £1,613m (2015: £3,681m) Group’s funded exposures comprised of £441m (2015: £1,545m) debt securities at fair value and £637m (2015: £1,599m) amortised cost loans and advances. Of which £645m (2015: £2,783m) were within investment grade, and the remainder eithernon-investment grade or not rated. The Group also had £681m (2015: £708m) of unfunded exposures in the form of undrawn liquidity commitments. Of the £2,294m (2015: £4,389m) of funded and unfunded exposures, £2,294m (2015: £4,387m) is senior in the capital structure of the entity.
| Barclays PLC and Barclays Bank PLC 2016 Annual Report on Form 20-F | 297 |
Notes to the financial statements
Scope of consolidation
37 Structured entitiescontinued
Though the Group’s funded exposures are primarily investment grade and senior in the capital structure, there are cases where the interests that are subordinate to the Group’s senior and mezzanine interests have minimal or no value, due to decreases in the fair value of the underlying collateral held by the entity.
The Group’s income from these entities comprises trading income (largely gains and losses on changes in the fair value and interest earned on bonds) on items classified as held for trading and interest income on interests classified as loans and receivables.
During 2016, the Group recorded a fair value gain of £78m (2015: £4m loss) on debt securities, impairment losses recorded on loans and advances were immaterial in both the current and prior year.
Multi-seller conduit programme
The multi-seller conduit engages in providing financing to various clients and hold whole or partial interests in pools of receivables or similar obligations. These instruments are protected from loss through over-collateralisation, seller guarantees, or other credit enhancements provided to the conduit. The Group’s off balance sheet exposure included in the table above represents liquidity facilities that are provided to the conduit for the benefit of the holders of the commercial paper issued by the conduit and will only be drawn where the conduit is unable to access the commercial paper market. If these liquidity facilities are drawn, the Group is protected from loss through over-collateralisation, seller guarantees, or other credit enhancements provided to the conduit. The Group also has overlapping exposure to the conduit that arises from the letter of credit and the programme loan. The letter of credit is an unfunded commitment that is only funded to cover credit losses up to 10% of total commitments. The programme loan, which allows the conduit to comply with US risk retention rules, is a funded exposure that is positioned pari passu with the interests of commercial paper holders. The Group earns income from fees received on the liquidity facility and letter of credit provided to the conduit, as well as from management fees. There were no impairment losses on this lending in either of the current year or the prior year.
Lending
The portfolio includes lending provided by the Group to unconsolidated structured entities in the normal course of its lending business to earn income in the form of interest and lending fees and includes loans to structured entities that are generally collateralised by property, equipment or other assets. All loans are subject to the Group’s credit sanctioning process. Collateral arrangements are specific to the circumstances of each loan with additional guarantees and collateral sought from the sponsor of the structured entity for certain arrangements. During the period the Group incurred an impairment of £24m (2015: £35m) against such facilities. The main types of lending are £2bn (2015: £3bn) of funding loans to bankruptcy remote structured entities to either invest or develop properties, £3bn (2015: £4bn) of loans to structured entities which have been created by an individual to hold one or more assets, £2bn (2015: £2bn) to entities whose operations are limited to financing or funding the acquisition of specific assets such as schools, hospitals, roads and renewable energy projects under the Private Finance Initiative (PFI), and £1bn (2015: £1bn) of funding loans to bankruptcy remote structured entities to enable them to purchase capital equipment for parent companies and are supported by government export guarantees.
Mortgage-backed securities
This represents a portfolio of floating rate notes used as an accounting hedge of interest rate risk under the Group’s structural hedging programme. All notes are investment grade. The portfolio has decreased owing to a reduced requirement for hedge accounting capacity in Sterling.
Investment funds and trusts
In the course of its fund management activities, the Group establishes pooled investment funds that comprise investments of various kinds, tailored to meet certain investors’ requirements. The Group’s interest in funds is generally restricted to a fund management fee, the value of which is typically based on the performance of the fund.
The Group acts as trustee to a number of trusts established by or on behalf of its clients. The purpose of the trusts, which meet the definition of structured entities, is to hold assets on behalf of beneficiaries. The Group’s interest in trusts is generally restricted to unpaid fees which, depending on the trust, may be fixed or based on the value of the trust assets. Barclays has no other risk exposure to the trusts.
Other
This includes £2,130m (2015: £1,926m) of derivative transactions with structured entities where the market risk is materially hedged with corresponding derivative contracts.
Assets transferred to sponsored unconsolidated structured entities
Assets transferred to sponsored unconsolidated structured entities were immaterial.
38 Investments in associates and joint ventures
Accounting for associates and joint ventures
Barclays applies IAS 28 Investments in Associates and IFRS 11 Joint Arrangements. Associates are entities in which the Group has significant influence, but not control, over the operating and financial policies. Generally the Group holds more than 20%, but less than 50%, of their voting shares. Joint ventures are arrangements where the Group has joint control and rights to the net assets of the entity.
The Group’s investments in associates and joint ventures are initially recorded at cost and increased (or decreased) each year by the Group’s share of the post acquisition profit/(loss). The Group ceases to recognise its share of the losses of equity accounted associates when its share of the net assets and amounts due from the entity have been written off in full, unless it has a contractual or constructive obligation to make good its share of the losses. In some cases, investments in these entities may be held at fair value through profit or loss, for example, those held by private equity businesses.
| 298 | Barclays PLC and Barclays Bank PLC 2016 Annual Report on Form 20-F |
38 Investments in associates and joint venturescontinued
There are no individually significant investments in joint ventures or associates held by Barclays.
| 2016 | 2015 | |||||||||||||||||||||||
| Associates | Joint ventures | Total | Associates | Joint ventures | Total | |||||||||||||||||||
| £m | £m | £m | £m | £m | £m | |||||||||||||||||||
Equity accounted | 321 | 363 | 684 | 217 | 356 | 573 | ||||||||||||||||||
Held at fair value through profit or loss | – | 484 | 484 | 77 | 475 | 552 | ||||||||||||||||||
Total | 321 | 847 | 1,168 | 294 | 831 | 1,125 | ||||||||||||||||||
Summarised financial information for the Group’s equity accounted associates and joint ventures is set out below. The amounts shown are the net income of the investees, not just the Group’s share for the year ended 31 December 2016, with the exception of certain undertakings for which the amounts are based on accounts made up to dates not earlier than three months before the balance sheet date.
|
| |||||||||||||||||||||||
| Associates | Joint ventures | |||||||||||||||||||||||
| 2016 | 2015 | 2016 | 2015 | |||||||||||||||||||||
| £m | £m | £m | £m | |||||||||||||||||||||
Profit from continuing operations | 33 | 5 | 64 | 73 | ||||||||||||||||||||
Other comprehensive expense | – | – | 19 | (24) | ||||||||||||||||||||
Total comprehensive income from continuing operations | 33 | 5 | 83 | 49 | ||||||||||||||||||||
Unrecognised shares of the losses of individually immaterial associates and joint ventures were nil (2015: nil).
The Group’s associates and joint ventures are subject to statutory requirements such that they cannot make remittances of dividends or make loan repayments to Barclays PLC without agreement from the external parties.
The Group’s share of commitments and contingencies of its associates and joint ventures comprised unutilised credit facilities provided to customers of £1,755m (2015: £1,450m). In addition, the Group has made commitments to finance or otherwise provide resources to its joint ventures and associates of £263m (2015: £177m).
39 Securitisations
Accounting for securitisations
The Group uses securitisations as a source of finance and a means of risk transfer. Such transactions generally result in the transfer of contractual cash flows from portfolios of financial assets to holders of issued debt securities.
Securitisations may, depending on the individual arrangement, result in continued recognition of the securitised assets and the recognition of the debt securities issued in the transaction; lead to partial continued recognition of the assets to the extent of the Group’s continuing involvement in those assets or result in full derecognition of the assets and the separate recognition, as assets or liabilities, of any rights and obligations created or retained in the transfer. Full derecognition occurs when the Group transfers both its contractual right to receive cash flows from the financial assets, or retains the contractual rights to receive the cash flows, but assumes a contractual obligation to pay the cash flows to another party without material delay or reinvestment, and also transfers substantially all the risks and rewards of ownership, including credit risk, prepayment risk and interest rate risk.
In the course of its normal banking activities, the Group makes transfers of financial assets, either legally (where legal rights to the cash flows from the asset are passed to the counterparty) or beneficially (where the Group retains the rights to the cash flows but assumes a responsibility to transfer them to the counterparty). Depending on the nature of the transaction, this may result in derecognition of the assets in their entirety, partial derecognition or no derecognition of the assets subject to the transfer.
A summary of the main transactions, and the assets and liabilities and the financial risks arising from these transactions, is set out below:
Transfers of financial assets that do not result in derecognition
Securitisations
The Group was party to securitisation transactions involving its residential mortgage loans, business loans and credit card balances.
In these transactions, the assets, interests in the assets, or beneficial interests in the cash flows arising from the assets, are transferred to a special purpose entity, which then issues interest bearing debt securities to third party investors.
Securitisations may, depending on the individual arrangement, result in continued recognition of the securitised assets and the recognition of the debt securities issued in the transaction. Partial continued recognition of the assets to the extent of the Group’s continuing involvement in those assets can also occur or derecognition of the assets and the separate recognition, as assets or liabilities, of any rights and obligations created or retained in the transfer.
| Barclays PLC and Barclays Bank PLC 2016 Annual Report on Form 20-F | 299 |
Notes to the financial statements
Scope of consolidation
39 Securitisationscontinued
The following table shows the carrying amount of securitised assets that have not resulted in full derecognition, together with the associated liabilities, for each category of asset on the balance sheet:
| 2016 | 2015 | |||||||||||||||||||||||||||||||
| Assets | Liabilities | Assets | Liabilities | |||||||||||||||||||||||||||||
| | Carrying amount £m |
| | Fair Value £m |
| | Carrying amount £m |
| | Fair Value £m |
| | Carrying amount £m |
| | Fair Value £m |
| | Carrying amount £m |
| | Fair Value £m |
| |||||||||
Loans and advances to customers | ||||||||||||||||||||||||||||||||
Residential mortgage loans | 125 | 120 | (107 | ) | (107 | ) | 376 | 362 | (168 | ) | (170 | ) | ||||||||||||||||||||
Credit cards, unsecured and other retail lending | 5,094 | 5,084 | (4,926 | ) | (4,931 | ) | 5,433 | 5,472 | (4,604 | ) | (4,606 | ) | ||||||||||||||||||||
Corporate loansa | – | – | – | – | 8 | 8 | (8 | ) | (8 | ) | ||||||||||||||||||||||
Total | 5,219 | 5,204 | (5,033 | ) | (5,038 | ) | 5,817 | 5,842 | (4,780 | ) | (4,784 | ) | ||||||||||||||||||||
Loans and advances to customers | ||||||||||||||||||||||||||||||||
Retained interests in corporate loansa | – | – | – | – | 42 | 42 | n/a | n/a | ||||||||||||||||||||||||
Balances included within loans and advances to customers represent securitisations where substantially all the risks and rewards of the asset have been retained by the Group.
The relationship between the transferred assets and the associated liabilities is that holders of notes may only look to cash flows from the securitised assets for payments of principal and interest due to them under the terms of their notes, although the contractual terms of their notes may be different to the maturity and interest of the transferred assets.
Retained interests in transfers of financial assets that resulted in partial derecognition are securities which represent a continuing exposure to the prepayment and credit risk in the underlying securitised assets. For the Group only, the carrying amount of the loans before transfer was nil (2015: £78m). The retained interest is initially recorded as an allocation of the original carrying amount based on the relative fair values of the portion derecognised and the portion retained.
For transfers of assets in relation to repurchase agreements, see Note 22 Reverse repurchase and repurchase agreements including other similar lending and borrowing and Note 40 Assets pledged.
Continuing involvement in financial assets that have been derecognised
In some cases, the Group may have transferred a financial asset in its entirety but may have continuing involvement in it. This arises in asset securitisations where loans and asset backed securities were derecognised as a result of the Group’s continuing involvement, mainly withinNon-Core, with CLOs, CDOs, RMBS and CMBS. Continuing involvement largely arises from providing financing into these structures in the form of retained notes, which do not bear first losses.
The table below shows the potential financial implications of such continuing involvement:
| | Continuing involvement as at 31 December 2016 |
| | Gain/(loss) from continuing involvement |
| |||||||||||||||
Type of transfer | | Carrying amount £m |
| | Fair value £m |
| | Maximum exposure to loss £m |
| | For the year ended 31 December 2016 £m |
| | Cumulative to 31 December 2016 £m |
| |||||
CLO and other assets | 10 | 10 | 10 | – | (3 | ) | ||||||||||||||
USsub-prime andAlt-A | – | – | – | – | (95 | ) | ||||||||||||||
Total | 10 | 10 | 10 | – | (98 | ) | ||||||||||||||
| | Continuing involvement as at 31 December 2015 |
| | Gain/(loss) from continuing involvement | | |||||||||||||||
Type of transfer | | Carrying amount £m |
| | Fair value £m |
| | Maximum exposure £m |
| | For the year ended 31 December 2015 £m |
| | Cumulative to 31 December 2015 £m |
| |||||
CLO and other assets | 686 | 684 | 686 | 7 | (36 | ) | ||||||||||||||
USsub-prime andAlt-A | 38 | 37 | 38 | – | (426 | ) | ||||||||||||||
Total | 724 | 721 | 724 | 7 | (462 | ) | ||||||||||||||
Note
| a | Corporate loans and retained interest in corporate loans balances as at December 2015 were attributable to BAGL which is classified as held for sale in 2016. |
| 300 | Barclays PLC and Barclays Bank PLC 2016 Annual Report on Form 20-F |
39 Securitisationscontinued
Assets which represent the Group’s continuing involvement in derecognised assets are recorded in the following line items:
Type of transfer | | Loans and advances £m |
| | Trading portfolio assets £m |
| | Total £m |
| |||
As at 31 December 2016 | ||||||||||||
CLO and other assets | – | 10 | 10 | |||||||||
USsub-prime andAlt-A | – | – | – | |||||||||
Total | – | 10 | 10 | |||||||||
As at 31 December 2015 | ||||||||||||
CLO and other assets | 327 | 359 | 686 | |||||||||
USsub-prime andAlt-A | 38 | – | 38 | |||||||||
Total | 365 | 359 | 724 |
40 Assets pledged
Assets are pledged as collateral to secure liabilities under repurchase agreements, securitisations and stock lending agreements or as security deposits relating to derivatives. Assets pledged as collateral include all assets categorised as encumbered in the disclosure on page 168, other than those held in commercial paper conduits. In these transactions, Barclays will be required to step in to provide financing itself under a liquidity facility if the vehicle cannot access the commercial paper market. The following table summarises the nature and carrying amount of the assets pledged as security against these liabilities:
| | 2016 £m |
| | 2015 £m |
| |||
Trading portfolio assets | 51,241 | 49,308 | ||||||
Financial assets at fair value | 3,195 | 2,534 | ||||||
Loans and advances to customers | 30,414 | 51,038 | ||||||
Cash collateral | 68,797 | 62,599 | ||||||
Financial Investments | 13,053 | 11,666 | ||||||
Non current assets held for sale | 117 | 1,930 | ||||||
Assets pledged | 166,817 | 179,075 |
Barclays has an additional £14bn (2015: £13bn) of loans and advances within its asset backed funding programmes that can readily be used to raise additional secured funding and are available to support future issuance.
Collateral held as security for assets
Under certain transactions, including reverse repurchase agreements and stock borrowing transactions, the Group is allowed to resell orre-pledge the collateral held. The fair value at the balance sheet date of collateral accepted andre-pledged to others was as follows:
| | 2016 £m |
| | 2015 £m |
| |||
Fair value of securities accepted as collateral | 466,975 | 308,162 | ||||||
Of which fair value of securitiesre-pledged/transferred to others | 405,582 | 266,015 |
The full disclosure as per IFRS 7 has been included in collateral and other credit enhancements see pages 119 to 120.
| Barclays PLC and Barclays Bank PLC 2016 Annual Report on Form 20-F | 301 |
Notes to the financial statements
Other disclosure matters
The notes included in this section focuses on related party transactions, Auditors’ remuneration and directors’ remuneration. Related parties include any subsidiaries, associates, joint ventures, entities under common directorships and Key Management Personnel.
41 Related party transactions and Directors’ remuneration
Related party transactions
Parties are considered to be related if one party has the ability to control the other party or exercise significant influence over the other party in making financial or operational decisions, or one other party controls both. The definition includes subsidiaries, associates, joint ventures and the Group’s pension schemes.
Subsidiaries
Transactions between Barclays PLC and its subsidiaries also meet the definition of related party transactions. Where these are eliminated on consolidation, they are not disclosed in the Group Financial Statements. Transactions between Barclays PLC and its subsidiary, Barclays Bank PLC are fully disclosed in Barclays PLC’s balance sheet and income statement. A list of the Group’s principal subsidiaries is shown in Note 36.
Associates, joint ventures and other entities
The Group provides banking services to its associates, joint ventures, the Group pension funds (principally the UK Retirement Fund) and to entities under common directorships, providing loans, overdrafts, interest andnon-interest bearing deposits and current accounts to these entities as well as other services. Group companies also provide investment management and custodian services to the Group pension schemes. The Group also provides banking services for unit trusts and investment funds managed by Group companies, which are not individually material. All of these transactions are conducted on the same terms as third-party transactions. Summarised financial information for the Group’s investments in associates and joint ventures is set out in Note 38.
Amounts included in the Group’s financial statements, in aggregate, by category of related party entity are as follows:
| | Associates £m |
| | Joint ventures £m |
| Pension funds, unit trusts and investment funds £m | ||||
For the year ended and as at 31 December 2016 | ||||||||||
Income | (20 | ) | 7 | 4 | ||||||
Impairment | (13 | ) | – | – | ||||||
Total assets | 72 | 2,244 | – | |||||||
Total liabilities | 94 | 95 | 260 | |||||||
For the year ended and as at 31 December 2015 | ||||||||||
Income | (19 | ) | 40 | 4 | ||||||
Impairment | (4 | ) | (2 | ) | – | |||||
Total assets | 36 | 1,578 | – | |||||||
Total liabilities | 158 | 133 | 184 | |||||||
For the year ended and as at 31 December 2014 | ||||||||||
Income | (5 | ) | 9 | 4 | ||||||
Impairment | – | (1 | ) | – | ||||||
Total assets | 130 | 1,558 | – | |||||||
Total liabilities | 264 | 188 | 149 |
Guarantees, pledges or commitments given in respect of these transactions in the year were £940m (2015: £881m) predominantly relating to joint ventures. No guarantees, pledges or commitments were received in the year. Derivatives transacted on behalf of the pensions funds, unit trusts and investment funds were £3m (2015: £13m).
Key Management Personnel
The Group’s Key Management Personnel, and persons connected with them, are also considered to be related parties for disclosure purposes. Key Management Personnel are defined as those persons having authority and responsibility for planning, directing and controlling the activities of Barclays PLC (directly or indirectly) and comprise the Directors of Barclays PLC and the Officers of the Group, certain direct reports of the Group Chief Executive and the heads of major business units and functions.
There were no material related party transactions with entities under common directorship where a Director or other member of Key Management Personnel (or any connected person) is also a Director or other member of Key Management Personnel (or any connected person) of Barclays.
| 302 | Barclays PLC and Barclays Bank PLC 2016 Annual Report on Form 20-F |
41 Related party transactions and Directors’ remunerationcontinued
The Group provides banking services to Directors and other Key Management Personnel and persons connected to them. Transactions during the year and the balances outstanding were as follows:
Loans outstanding | ||||||||
| 2016 | 2015 | |||||||
| £m | £m | |||||||
As at 1 January | 9.8 | 11.4 | ||||||
Loans issued during the year | 0.6 | 1.1 | ||||||
Loan repayments during the year/change of key management personnel | (1.2 | ) | (2.7 | ) | ||||
As at 31 December | 9.2 | 9.8 | ||||||
| No allowances for impairment were recognised in respect of loans to Directors or other members of Key Management Personnel (or any connected person). | ||||||||
Deposits outstanding | ||||||||
| 2016 | 2015 | |||||||
| £m | £m | |||||||
As at 1 January | 116.5 | 103.0 | ||||||
Deposits received during the year | 18.9 | 44.8 | ||||||
Deposits repaid during the year/change of key management personnel | (128.1 | ) | (31.3 | ) | ||||
As at 31 December | 7.3 | 116.5 | ||||||
Total commitments outstanding Total commitments outstanding refers to the total of any undrawn amounts on credit cards and/or overdraft facilities provided to Key Management Personnel. Total commitments outstanding as at 31 December 2016 were £0.2m (2015: £0.5m).
All loans to Directors and other Key Management Personnel (and persons connected to them), (a) were made in the ordinary course of business, (b) were made on substantially the same terms, including interest rates and collateral, as those prevailing at the same time for comparable transactions with other persons and (c) did not involve more than a normal risk of collectability or present other unfavourable features.
Remuneration of Directors and other Key Management Personnel Total remuneration awarded to Directors and other Key Management Personnel below represents the awards made to individuals that have been approved by the Board Remuneration Committee as part of the latest remuneration decisions, and is consistent with the approach adopted for disclosures set out on pages 51 to 85. Costs recognised in the income statement reflect the accounting charge for the year and are included within operating expenses. The difference between the values awarded and the recognised income statement charge principally relates to the recognition of deferred costs for prior year awards. Figures are provided for the period that individuals met the definition of Directors and other Key Management Personnel. |
| |||||||
| 2016 | 2015 | |||||||
| £m | £m | |||||||
Salaries and other short-term benefits | 31.9 | 31.3 | ||||||
Pension costs | 0.2 | 0.3 | ||||||
Other long-term benefits | 11.0 | 4.7 | ||||||
Share-based payments | 21.9 | 11.0 | ||||||
Employer social security charges on emoluments | 6.2 | 5.2 | ||||||
Costs recognised for accounting purposes | 71.2 | 52.5 | ||||||
Employer social security charges on emoluments | (6.2 | ) | (5.2 | ) | ||||
Other long-term benefits – difference between awards granted and costs recognised | (2.5 | ) | 2.5 | |||||
Share-based payments – difference between awards granted and costs recognised | (8.9 | ) | (2.3 | ) | ||||
Total remuneration awarded | 53.6 | 47.5 | ||||||
Disclosure required by the Companies Act 2006 The following information regarding Directors is presented in accordance with the Companies Act 2006: |
| |||||||
| 2016 | 2015 | |||||||
| £m | £m | |||||||
Aggregate emolumentsa | 8.1 | 7.0 | ||||||
Amounts paid under LTIPsb | – | 2.2 | ||||||
| 8.1 | 9.2 | |||||||
There were no pension contributions paid to defined contribution schemes on behalf of Directors (2015: £nil). There were no notional pension contributions to defined contribution schemes.
As at 31 December 2016, there were no Directors accruing benefits under a defined benefit scheme (2015: nil).
Notes
| a | The aggregate emoluments include amounts paid for the 2016 year. In addition, a deferred share award for 2016 will be made to James E Staley and Tushar Morzaria which will only vest subject to meeting certain conditions. The total of the deferred share awards is £1.4m for 2016 (£0.7m for 2015). |
| b | The figure of nil is shown for 2016 in “Amounts paid under LTIPs” because neither executive Director held an LTIP award that was released in 2016. The LTIP amount in the single total figure table for executive Directors’ 2016 remuneration in the Directors’ Remuneration report relates to the award that is scheduled to be released in 2017 in respect of the 2014-2016 LTIP cycle. |
| Barclays PLC and Barclays Bank PLC 2016 Annual Report on Form 20-F | 303 |
Notes to the financial statements
Other disclosure matters
41 Related party transactions and Directors’ remunerationcontinued
Directors’ and Officers’ shareholdings and options
The beneficial ownership of ordinary share capital of Barclays PLC by all Directors and Officers of Barclays PLC (involving 24 persons) at 31 December 2016 amounted to 11,464,580 (2015: 10,586,812) ordinary shares of 25p each (0.07% of the ordinary share capital outstanding).
At 31 December 2016, executive Directors and officers of Barclays PLC (involving 13 persons) held options to purchase a total of 22,527 (2015: 17,206) Barclays PLC ordinary shares of 25p each at prices ranging from 120p to 178p under Sharesave.
Advances and credit to Directors and guarantees on behalf of Directors
In accordance with Section 413 of the Companies Act 2006, the total amount of advances and credits made available in 2016 to persons who served as Directors during the year was £0.2m (2015: £0.3m). The total value of guarantees entered into on behalf of Directors during 2016 was £nil (2015:£nil).
42 Auditors’ remuneration
Auditors’ remuneration is included within consultancy, legal and professional fees in administration and general expenses and comprises:
| | Audit £m | | | Audit related £m | | | Taxation services £m | | | Other services £m | | | Total £m | | ||||||
2016 | ||||||||||||||||||||
Audit of the Group’s annual accounts | 14 | – | – | – | 14 | |||||||||||||||
Other services: | ||||||||||||||||||||
Fees payable for the Company’s associatesa | 27 | – | – | – | 27 | |||||||||||||||
Other services suppliedb | – | 3 | – | – | 3 | |||||||||||||||
Other services relating to taxation | ||||||||||||||||||||
– compliance services | – | – | – | – | – | |||||||||||||||
– advisory servicesc | – | – | – | – | – | |||||||||||||||
Other | – | 1 | – | 4 | 5 | |||||||||||||||
Total Auditors’ remuneration | 41 | 4 | – | 4 | 49 | |||||||||||||||
2015 | ||||||||||||||||||||
Audit of the Group’s annual accounts | 13 | – | – | – | 13 | |||||||||||||||
Other services: | ||||||||||||||||||||
Fees payable for the Company’s associatesa | 21 | – | – | – | 21 | |||||||||||||||
Other services suppliedb | – | 3 | – | – | 3 | |||||||||||||||
Other services relating to taxation | ||||||||||||||||||||
– compliance services | – | – | 1 | – | 1 | |||||||||||||||
– advisory servicesc | – | – | – | – | – | |||||||||||||||
Other | – | 4 | – | 1 | 5 | |||||||||||||||
Total Auditors’ remuneration | 34 | 7 | 1 | 1 | 43 | |||||||||||||||
2014 | ||||||||||||||||||||
Audit of the Group’s annual accounts | 11 | – | – | – | 11 | |||||||||||||||
Other services: | ||||||||||||||||||||
Fees payable for the Company’s associatesa | 24 | – | – | – | 24 | |||||||||||||||
Other services suppliedb | – | 4 | – | – | 4 | |||||||||||||||
Other services relating to taxation | ||||||||||||||||||||
– compliance services | – | – | 1 | – | 1 | |||||||||||||||
– advisory servicesc | – | – | – | – | – | |||||||||||||||
Other | – | 3 | – | 1 | 4 | |||||||||||||||
Total Auditors’ remuneration | 35 | 7 | 1 | 1 | 44 | |||||||||||||||
The figures shown in the above table relate to fees paid to PricewaterhouseCoopers LLP and its associates, of which the fees paid in relation to discontinued operations were £12m (2015: £10m, 2014: £10m).
Fees paid to other auditors not associated with PricewaterhouseCoopers LLP in respect of the audit of discontinued operations were £5m (2015: £4m, 2014: £4m).
43 Financial risks, liquidity and capital management
To improve transparency and ease of reference, by concentrating related information in one place, and to reduce duplication, disclosures required under IFRS relating to financial risks and capital resources have been included within the Risk management and governance section as follows:
| § | Credit risk, on pages 116 to 140; |
| § | Market risk, on pages 141 to 151; |
| § | Capital resources, on pages 152 to 158; and |
| § | Liquidity risk, on pages 159 to 177. |
Notes
| a | Comprises the fees for the statutory audit of the subsidiaries both inside and outside UK and fees for the work performed by associates of PricewaterhouseCoopers LLP in respect of the consolidated financial statements of the Company. |
| b | Comprises services in relation to statutory and regulatory filings. These include audit services for the review of the interim financial information under the Listing Rules of the UK listing authority. |
| c | Includes consultation on tax matters, tax advice relating to transactions and other tax planning and advice. |
| 304 | Barclays PLC and Barclays Bank PLC 2016 Annual Report on Form 20-F |
44 Assets included in disposal groups classified as held for sale and associated liabilities
Accounting fornon-current assets held for sale and associated liabilities
The group applies IFRS 5Non-current Assets Held for Sale and Discontinued Operations.
Non-current assets (or disposal groups) are classified as held for sale when their carrying amount is to be recovered principally through a sale transaction rather than continuing use. In order to be classified as held for sale, the asset must be available for immediate sale in its present condition subject only to terms that are usual and customary and the sale must be highly probable.Non-current assets (or disposal groups) held for sale are measured at the lower of carrying amount and fair value less cost to sell.
|
On 1 March 2016, Barclays announced its intention to reduce the Group’s 62.3% interest in BAGL. This reduction is intended to be to a level which will permit deconsolidation from an accounting and regulatory perspective for which approval was granted by shareholders at the Group’s general meeting held on 28 April 2016. On 5 May 2016 Barclays sold 12.2% of the Group’s interest in BAGL resulting in a transfer tonon-controlling interests of £601m. Following this sale, Barclays’ interest represents 50.1% of BAGL’s share capital. The BAGL disposal group includes all assets and liabilities of BAGL and its subsidiaries as well as Group balances associated with BAGL and expected contributions that will form part of the sale.
No impairment for BAGL has been recognised under IFRS 5 as at 31 December 2016. Impairment under IFRS 5 is calculated as the difference between fair value less disposal costs and the carrying value of the disposal group. The fair value is determined by reference to the quoted market price for BAGL and the foreign exchange rate for ZAR/GBP as at 31 December 2016, less the expected contributions. The fair value less disposal costs and the expected contribution exceeds the net asset value as at 31 December 2016.
Barclays continues to explore a sale through the disposal of its shares in BAGL during the course of 2017.
Assets included in disposal groups classified as held for sale | ||||||||||||||||
| | BAGL 2016 £m |
| | Other 2016 £m | | | Total 2016 £m |
| | Total 2015 £m | | |||||
Cash and balances at central banks | 2,689 | 241 | 2,930 | 21 | ||||||||||||
Items in the course of collection from other banks | 549 | 21 | 570 | 24 | ||||||||||||
Trading portfolio assets | 3,044 | 40 | 3,084 | – | ||||||||||||
Financial assets designated at fair value | 5,546 | 1,438 | 6,984 | 696 | ||||||||||||
Derivative financial instruments | 1,992 | – | 1,992 | – | ||||||||||||
Financial investments | 4,995 | 2,742 | 7,737 | 1,230 | ||||||||||||
Loans and advances to banks | 1,184 | 482 | 1,666 | 74 | ||||||||||||
Loans and advances to customers | 41,793 | 1,711 | 43,504 | 5,513 | ||||||||||||
Prepayments, accrued income and other assets | 637 | 59 | 696 | 47 | ||||||||||||
Investments in associates and joint ventures | 63 | 24 | 87 | 10 | ||||||||||||
Property, plant and equipment | 902 | 52 | 954 | 128 | ||||||||||||
Goodwill | 965 | 32 | 997 | – | ||||||||||||
Intangible assets | 554 | 16 | 570 | 43 | ||||||||||||
Current and deferred tax assets | 124 | 25 | 149 | 22 | ||||||||||||
Retirement benefit assets | 33 | – | 33 | – | ||||||||||||
Total | 65,070 | 6,883 | 71,953 | 7,808 | ||||||||||||
Balance of impairment unallocated under IFRS 5 | (499 | ) | (499 | ) | (444 | ) | ||||||||||
Total assets classified as held for sale | 65,070 | 6,384 | 71,454 | 7,364 | ||||||||||||
Liabilities included in disposal groups classified as held for sale | ||||||||||||||||
| | BAGL 2016 £m |
| | Other 2016 £m |
| | Total 2016 £m |
| | Total 2015 £m |
| |||||
Deposits from banks | 2,113 | 36 | 2,149 | – | ||||||||||||
Items in the course of collection due to banks | 350 | 23 | 373 | 74 | ||||||||||||
Customer accounts | 39,331 | 3,100 | 42,431 | 4,000 | ||||||||||||
Repurchase agreements and other similar secured borrowing | 597 | – | 597 | – | ||||||||||||
Trading portfolio liabilities | 388 | – | 388 | – | ||||||||||||
Financial liabilities designated at fair value | 3,748 | 3,577 | 7,325 | 346 | ||||||||||||
Derivative financial instruments | 1,610 | 1 | 1,611 | 3 | ||||||||||||
Debt securities in issue | 7,997 | – | 7,997 | 1,474 | ||||||||||||
Subordinated liabilities | 934 | – | 934 | – | ||||||||||||
Accruals, deferred income and other liabilities | 1,061 | 119 | 1,180 | 39 | ||||||||||||
Provisions | 52 | 51 | 103 | 34 | ||||||||||||
Current and deferred tax liabilities | 154 | 8 | 162 | (6 | ) | |||||||||||
Retirement benefit liabilities | 26 | 16 | 42 | 33 | ||||||||||||
Total liabilities classified as held for sale | 58,361 | 6,931 | 65,292 | 5,997 | ||||||||||||
Net assets/(liabilities) classified as held for salea | 6,709 | (547 | ) | 6,162 | 1,367 | |||||||||||
Expected BAGL separation payments and costsb,c | 866 | – | 866 | – | ||||||||||||
Disposal group post contribution | 7,575 | (547 | ) | 7,028 | 1,367 |
Notes
| a | The carrying value of the disposal group is stated after the elimination of internal balances between Barclays and BAGL of £595m. Internal balances have been considered in determining the carrying value of BAGL (of £7.3bn before the planned contributions in respect of BAGL) for the purposes of measuring the disposal group at the lower of carrying amount and fair value less costs to sell. |
| b | In December 2016, Barclays finalised proposals regarding planned contributions to the BAGL group relating to the reimbursement of certain expenses as well as contributions for investment to support separation activities. The cash and cash equivalents to make these planned contributions is included within the perimeter of the disposal group, also for the purposes of measuring the disposal group at the lower of carrying amount and fair value less costs to sell. The planned contributions are reported within Cash and balances at central banks in the Group’s consolidated balance sheet. |
| c | In December 2016, Barclays reimbursed BAGL for expenses incurred for an amount of £28m. This amount is excluded from the proposed overall potential reimbursement and contribution figure of £866m. |
| Barclays PLC and Barclays Bank PLC 2016 Annual Report on Form 20-F | 305 |
Notes to the financial statements
Other disclosure matters
44 Assets included in disposal groups classified as held for sale and associated liabilitiescontinued
The BAGL disposal group meets the requirements for presentation as a discontinued operation. As such, the results, which have been presented as the profit after tax andnon-controlling interest in respect of the discontinued operation on the face of the Group income statement, are analysed in the income statement below.
BAGL group income statement | ||||||||
For the year ended 31 December | | 2016 £m |
| | 2015 £m |
| ||
Net interest income | 2,169 | 1,950 | ||||||
Net fee and commission income | 1,072 | 1,033 | ||||||
Net trading income | 281 | 197 | ||||||
Net investment income | 45 | 41 | ||||||
Other income | 179 | 193 | ||||||
Total income | 3,746 | 3,414 | ||||||
Credit impairment charges and other provisions | (445 | ) | (353 | ) | ||||
Net operating income | 3,301 | 3,061 | ||||||
Staff costs | (1,186 | ) | (1,107 | ) | ||||
Administration and general expenses | (653 | ) | (545 | ) | ||||
Depreciation of property, plant and equipment | (513 | ) | (442 | ) | ||||
Amortisation of intangible assets | (58 | ) | (47 | ) | ||||
Operating expenses | (2,410 | ) | (2,141 | ) | ||||
Share ofpost-tax results of associates and joint ventures | 6 | 7 | ||||||
Profit before tax | 897 | 927 | ||||||
Taxation | (306 | ) | (301 | ) | ||||
Profit after tax | 591 | 626 | ||||||
Attributable to: | ||||||||
Equity holders of the parent | 189 | 302 | ||||||
Non-controlling interests | 402 | 324 | ||||||
Profit after tax | 591 | 626 | ||||||
Other comprehensive income relating to discontinued operations is as follows:
|
| |||||||
For the year ended 31 December | | 2016 £m | | | 2015 £m | | ||
Available for sale assets | (9 | ) | (22 | ) | ||||
Currency translation reserves | 1,451 | (1,223 | ) | |||||
Cash flow hedge reserves | 89 | (101 | ) | |||||
Other comprehensive income, net of tax from discontinued operations | 1,531 | (1,346 | ) | |||||
The cash flows attributed to the discontinued operations are as follows:
| ||||||||
For the year ended 31 December | | 2016 £m | | | 2015 £m | | ||
Net cash flows from operating activities | 1,164 | 794 | ||||||
Net cash flows from investing activities | (691 | ) | (1,883 | ) | ||||
Net cash flows from financing activities | (105 | ) | 133 | |||||
Effect of exchange rates on cash and cash equivalents | 37 | (865 | ) | |||||
Net increase/(decrease) in cash and cash equivalents | 405 | (1,821 | ) | |||||
| 306 | Barclays PLC and Barclays Bank PLC 2016 Annual Report on Form 20-F |
44 Assets included in disposal groups classified as held for sale and associated liabilitiescontinued
Other held for sale assets
Sale of the French retail business
The disposal group includes the total assets and liabilities in the French retail business with assets of £4bn. An impairment of £456m has been recognised in expectation of the loss on sale, with the sale expected to be completed in 2017.
Sale of the Egypt banking business
The disposal group includes the total assets and liabilities in Barclays Bank Egypt, with assets of £1bn. Subject to regulatory approvals, the sale is expected to be completed in Q1 2017.
Sale of Barclays Vida Y Pensiones
The majority of the disposal group have been sold during 2016. The sale of the remaining Spanish Life Insurance business, with assets of £657m, is expected to complete in 2017.
Sale of the Zimbabwe business
The disposal group includes the total assets and liabilities in the Zimbabwe business, with assets of £362m. The sale is expected to be completed in Q4 2017.
Sale of other businesses
Other disposals include £379m of assets, mainly comprised of the Italian business, with assets of £258m. The sale is expected to be completed in 2017. The remaining businesses mainly comprise of the Irish Insurance business, UK Trust and Vocalink, all of which are expected to be completed in 2017.
During the year, a number of disposal groups of held for sale assets have been disposed of. The sale of the Asia Wealth business took place in November 2016. A gain on sale of £164m has been recognised in the income statement within (loss)/profit on disposal of subsidiaries, associates and joint ventures. The sales of Barclays Risk Analytics and Index Solutions Ltd in August 2016, the Spanish and Portuguese credit card businesses in November 2016, Italian insurance business in June 2016, Italian retail banking in August 2016, Portuguese retail and insurance businesses in April 2016, the Offshore Trust business in January 2016, the sale of the designated Market Maker business in April 2016 and part of the Spanish Insurance business in November 2016 also took place this year.
45 Barclays PLC (the Parent Company)
Other income
Other income of £334m (2015: £227m) includes £457m (2015: £345m) of income received from gross coupon payments on Barclays Bank PLC issued AT1 securities.
Non-Current Assets and Liabilities
Investment in subsidiaries
The investment in subsidiary of £36,553m (2015: £35,303m) represents investments made in Barclays Bank PLC, including £6,486m (2015: £5,350m) of AT1 securities. The increase of £1,250m during the year was mainly driven by a $1.5bn AT1 issuance during the third quarter.
Loans and advances to subsidiaries, subordinated liabilities and debt securities in issue
During the period, Barclays PLC issued $2.1bn of Fixed Rate Subordinated Notes included within the subordinated liabilities balance of £3,789m (2015: £1,766m), $6.7bn of Fixed Rate Senior Notes, Yen 20bn of Fixed Rate Senior Notes,€ 2.7bn Fixed and Floating Rate Senior Notes, £1.3bn of Fixed Rate Senior Notes and AUD 0.2bn of Fixed Rate Senior Notes included within the debt securities in issue balance of £16,893m (2015: £6,224m). The proceeds raised through these transactions were used to invest in subsidiaries of Barclays Bank PLC accounted for as loans and advances to subsidiaries of £19,421m (2015: £7,990m).
Barclays PLC retains the discretion to manage the nature of its internal investments in subsidiaries according to their regulatory and business needs. As we implement our structural reform programme, Barclays PLC will invest capital and funding to Barclays Bank PLC and other group subsidiaries such as the Group Service Company, the US IHC and the UK ring-fenced bank.
Financial investments
The financial investment assets relate to loans made to subsidiaries of the Group. These instruments include a feature that allows for the loan to be written down in whole or in part by the borrower only in the event that the liabilities of the subsidiary would otherwise exceed its assets.
Derivative financial instrument
The derivative financial instrument of £268m (2015: £210m) held by the Parent Company represents Barclays PLC’s right to receive a Capital Note for no additional consideration, in the event the Barclays PLC consolidated CRD IV Common Equity Tier 1 (CET1) ratio (FSA October 2012 transitional statement) falls below 7% at which point the notes are automatically assigned by the holders to Barclays PLC.
Total equity
Called up share capital and share premium of Barclays PLC was £21,842m (2015: £21,586m). Other equity instruments of £6,453m (2015: £5,321m) comprises of AT1 securities. For further details please refer to Note 31 Ordinary share, share premium and other equity.
| Barclays PLC and Barclays Bank PLC 2016 Annual Report on Form 20-F | 307 |
Notes to the financial statements
46 Related undertakings
The Group’s corporate structure consists of a number of related undertakings, comprising subsidiaries, joint ventures, associates and significant other interests. A full list of these undertakings, the country of incorporation and the ownership of each share class is set out below. The information is provided as at 31 December 2016.
The entities are grouped by the countries in which they are incorporated. The profits earned by the activities of these entities are in some cases taxed in countries other than the country of incorporation. Barclays’ 2016 Country Snapshot provides details of where the Group carries on its business, where its profits are subject to tax and the taxes it pays in each country it operates in.
Wholly owned subsidiaries
Unless otherwise stated the undertakings below are wholly owned and consolidated by Barclays and the share capital disclosed comprises ordinary or common shares which are held by Group subsidiaries.
| Wholly owned subsidiaries | Note | |
| United Kingdom | ||
| – 1 Churchill Place, London, E14 5HP | ||
| Aequor Investments Limited | ||
| Ardencroft Investments Limited | ||
| B D & B Investments Limited | ||
| B.P.B. (Holdings) Limited | ||
| Barafor Limited | ||
| Barclay Leasing Limited | ||
| Barclays (Security Realisation) Limited | ||
| Barclays Aegis Trust | D | |
| Barclays Africa Group Holdings Limited | J, K | |
| Barclays Aldersgate Investments Limited | ||
| Barclays Asset Management Limited | ||
| Barclays Bank PLC | A, F, I | |
| Barclays BCL FI Trust | D | |
| Barclays Bedivere Trust | D | |
| Barclays BR Investments Trust | D | |
| Barclays Cantal Investments Trust | D | |
| Barclays Capital Asia Holdings Limited | ||
| Barclays Capital Finance Limited | ||
| Barclays Capital Japan Securities Holdings Limited | ||
| Barclays Capital Luxembourg S.à.r.l. Trust | D | |
| Barclays Capital Margin Financing Limited | ||
| Barclays Capital Nominees (No.2) Limited | ||
| Barclays Capital Nominees (No.3) Limited | ||
| Barclays Capital Nominees Limited | ||
| Barclays Capital Principal Investments Limited | ||
| Barclays Capital Securities Client Nominee Limited | ||
| Barclays Capital Securities Limited | F, I | |
| Barclays Capital Services Limited | A | |
| Barclays CCP Funding LLP | B | |
| Barclays Converted Investments (No.2) Limited | ||
| Barclays Converted Investments Limited | ||
| Barclays Direct Investing Nominees Limited | ||
| Barclays Directors Limited | ||
| Barclays Equity Index Investments Bare Trust | D | |
| Barclays Executive Schemes Trustees Limited | ||
| Barclays Fiduciary Services (UK) Limited | ||
| Barclays Financial Planning Nominee Company Limited | ||
| Barclays Funds Investments Limited | ||
| Barclays Global Shareplans Nominee Limited | ||
| Barclays Group Holdings Limited | ||
| Barclays Group Operations Limited | ||
| Barclays Industrial Development Limited | ||
| Barclays Industrial Investments Limited | ||
| Barclays Insurance Services Company Limited | ||
| Barclays Investment Management Limited | ||
| Barclays Lamorak Trust | D | |
| Barclays Leasing (No.9) Limited | ||
| Barclays Long Island Limited | ||
| Barclays Luxembourg GBP Holdings Trust | D | |
| Barclays Luxembourg USD Holdings Trust | D | |
| Barclays Marlist Limited | ||
| Barclays Mercantile Business Finance Limited | ||
| Barclays Mercantile Limited | ||
| Barclays Nominees (Branches) Limited | ||
| Barclays Nominees (George Yard) Limited | ||
| Barclays Nominees (K.W.S.) Limited | ||
| Barclays Nominees (Monument) Limited | ||
| Barclays Nominees (Provincial) Limited | ||
| Barclays Pelleas Trust | D | |
| Barclays Pension Funds Trustees Limited |
| Wholly owned subsidiaries | Note | |
| Barclays Private Bank | ||
| Barclays Private Banking Services Limited | ||
| Barclays Private Trust | ||
| Barclays SAMS Limited | ||
| Barclays Services (Japan) Limited | ||
| Barclays Sharedealing | ||
| Barclays Shea Limited | ||
| Barclays Singapore Global Shareplans Nominee Limited | ||
| Barclays Stockbrokers (Holdings) Limited | ||
| Barclays Stockbrokers Limited | ||
| Barclays Trust Company Limited | I, P | |
| Barclays UK and Europe PLC | ||
| Barclays Unquoted Investments Limited | ||
| Barclays Unquoted Property Investments Limited | ||
| Barclays USD Funding LLP | B | |
| Barclays Wealth Nominees Limited | ||
| Barclayshare Nominees Limited | ||
| Barcosec Limited | ||
| Barley Investments Limited | I, J, K | |
| Barometers Limited | ||
| Barsec Nominees Limited | ||
| BB Client Nominees Limited | ||
| BCLI GP Trust | D | |
| BMBF (Bluewater Investments) Limited | ||
| BMBF (No.12) Limited | ||
| BMBF (No.21) Limited | ||
| BMBF (No.24) Limited | ||
| BMBF (No.3) Limited | ||
| BMBF (No.6) Limited | ||
| BMBF (No.9) Limited | ||
| BMBF USD NO 1 Limited | ||
| BMI (No.9) Limited | ||
| BNRI ENG 2013 Limited Partnership | B | |
| BNRI ENG 2014 Limited Partnership | B | |
| BNRI ENG GP LLP | B | |
| BNRI England 2010 Limited Partnership | B | |
| BNRI England 2011 Limited Partnership | B | |
| BNRI England 2012 Limited Partnership | B | |
| Boudeuse Limited | ||
| Capel Cure Sharp Limited | ||
| Carnegie Holdings Limited | I, J, K | |
| Chapelcrest Investments Limited | ||
| Clydesdale Financial Services Limited | ||
| Cobalt Investments Limited | ||
| Condor No.1 Limited Partnership | B | |
| Condor No.2 Limited Partnership | B | |
| CP Flower Guaranteeco (UK) Limited | E | |
| CP Propco 1 Limited | ||
| CP Propco 2 Limited | ||
| CP Topco Limited | J, K | |
| CPIA England 2008 Limited Partnership | B | |
| CPIA England 2009 Limited Partnership | B | |
| CPIA England No.2 Limited Partnership | B | |
| Denham Investments Limited | ||
| DMW Realty Limited | ||
| Durlacher Nominees Limited | ||
| Eagle Financial and Leasing Services (UK) Limited | ||
| Equity Value Investments Limited Liability Partnership | B | |
| Equity Value Investments No.1 Limited | ||
| Equity Value Investments No.2 Limited | F, I | |
| Exshelfco (DZBC) | ||
| Finpart Nominees Limited |
| 308 | Barclays PLC and Barclays Bank PLC 2016 Annual Report on Form 20-F |
46 Related undertakingscontinued
| Wholly owned subsidiaries | Note | |
| – 1 Churchill Place, London, E14 5HP (continued) | ||
FIRSTPLUS Financial Group PLC | ||
| Fitzroy Finance Limited | Z | |
| Foltus Investments Limited | ||
| Gerrard (OMH) Limited | ||
| Gerrard Financial Planning Limited | ||
| Gerrard Investment Management Limited | ||
| Gerrard Management Services Limited | ||
| Gerrard Nominees Limited | ||
| Global Dynasty Natural Resource Private Equity | ||
| Limited Partnership | B | |
| Globe Nominees Limited | ||
| GM Computers Limited | ||
| Greig Middleton Holdings Limited | ||
| Greig Middleton Nominees Limited | ||
| Hawkins Funding Limited | ||
| Heraldglen Limited | G, H, I | |
| Investors In Infrastructure Limited | ||
| J.V. Estates Limited | ||
| Keepier Investments | ||
| Kirsche Investments Limited | ||
| Lindley Developments Limited | U | |
| Lombard Street Nominees Limited | ||
| Long Island Assets Limited | ||
| Maloney Investments Limited | ||
| Menlo Investments Limited | ||
| Mercantile Credit Company Limited | ||
| Mercantile Leasing Company (No.132) Limited | ||
| MK Opportunities LP | B | |
| Murray House Investment Management Limited | ||
| Naxos Investments Limited | ||
| North Colonnade Investments Limited | ||
| Northwharf Investments Limited | I, X | |
| Northwharf Nominees Limited | ||
| PIA England No.2 Limited Partnership | B | |
| Real Estate Participation Management Limited | ||
| Real Estate Participation Services Limited | ||
| Relative Value Investments UK Limited Liability Partnership | B | |
| Relative Value Trading Limited | ||
| Roder Investments No. 1 Limited | I, Y | |
| Roder Investments No. 2 Limited | I, Y | |
| Ruthenium Investments Limited | ||
| RVT CLO Investments LLP | B | |
| Scotlife Home Loans (No.3) Limited | ||
| Sharelink Nominees Limited | ||
| Solution Personal Finance Limited | ||
| Surety Trust Limited | ||
| Swan Lane Investments Limited | F, I | |
| US Real Estate Holdings No.1 Limited | ||
| US Real Estate Holdings No. 2 Limited | ||
| US Real Estate Holdings No.3 Limited | ||
| W.D. Pension Fund Limited | ||
| Wedd Jefferson (Nominees) Limited | ||
| Westferry Investments Limited | ||
| Woolwich Assured Homes Limited | ||
| Woolwich Homes (1987) Limited | E | |
| Woolwich Homes Limited | ||
| Woolwich Limited | ||
| Woolwich Plan Managers Limited | ||
| Woolwich Qualifying Employee Share Ownership Trustee Limited | ||
| Woolwich Surveying Services Limited | ||
| Zeban Nominees Limited | ||
| Barclays Financial Planning (Entered Liquidation 26 January 2017) | ||
– Hill House, 1 Little New Street, London, EC4A 3TR
| ||
| 54 Lombard Street Investments (In Liquidation) | ||
| Barclays Global Investors Finance Limited (in Liquidation) | ||
| Barclays Global Investors UK Holdings Limited (in Liquidation) | J, K | |
| Barclays Mercantile Highland Finance Limited (in Liquidation) | ||
| Barclays Physical Trading Limited (In Liquidation) | ||
| Eldfell Investments Limited (in Liquidation) | ||
| Fair and Square Limited (in Liquidation) | ||
| Mercers Debt Collections Limited (In Liquidation) | ||
| Pendle Shipping Limited (In Liquidation) |
| Wholly owned subsidiaries | Note | |
| Reflex Nominees Limited (In Liquidation) | ||
– 5 The North Colonnade, Canary Wharf, London, E14 4BB
| ||
| Barclays Bayard Investments Trust | D | |
| BBR Holdings Trust | D | |
| Barclays Capital Trading Luxembourg Trust | D | |
| Barclays Luxembourg EUR Holdings Trust | D | |
| Barclays Luxembourg Finance Index Trust | D | |
| CPIA Canada Holdings | B | |
| Leonis Investments LLP | B | |
| Preferred Liquidity Limited Partnership | B | |
– Aurora Building, 120 Bothwell Street, Glasgow, G2 7JS
| ||
| Barclays SLCSM (No.1) Limited (In Liquidation) | ||
| R.C. Grieg Nominees Limited | ||
– 50 Lothian Road, Festival Square, Edinburgh, EH3 9WJ
| ||
| BNRI PIA Scot GP Limited | ||
| BNRI Scots GP, LLP | B | |
| Pecan Aggregator LP | B | |
| – Logic House, Waterfront Business Park, Fleet Road, GU1 3SB | ||
The Logic Group Holdings Limited | J | |
| The Logic Group Enterprises Limited | ||
| Argentina | ||
– 855 Leandro N.Alem Avenue, 8th Floor, Buenos Aires
| ||
| Compañía Sudamerica S.A. | ||
– Marval, O’Farrell & Mairal, Av. Leandro N. Alem 882, Buenos Aires, C1001AAQ
| ||
| Compañia Regional del Sur S.A. | ||
| Brazil | ||
| – Av. Brigadeiro Faria Lima, No. 4.440, 12th Floor, Bairro Itaim Bibi, Sao Paulo, CEP,04538-132 | ||
Banco Barclays S.A. | ||
| Canada | ||
– 333 Bay Street, Suite 4910, Toronto ON M5H 2R2
| ||
| Barclays Capital Canada Inc | ||
| – Stikeman Elliott LLP, 199 Bay Street, 5300 Commerce Court West, Toronto ON M5L 1B9 | ||
Barclays Corporation Limited | ||
| Cayman Islands | ||
– Maples Corporate Services Limited, PO Box 309GT, Ugland House, South Church Street, Grand Cayman,KY1-1104
| ||
| Alymere Investments Limited | G, H, I | |
| Alymere Investments Two Limited (In Liquidation) | ||
| Analytical Trade UK Limited | ||
| Aquitaine Investments Limited (In Liquidation) | ||
| Barclays Capital (Cayman) Limited | ||
| Braven Investments No.1 Limited | ||
| Capton Investments Limited | ||
| Claudas Investments Limited | G, H, I | |
| Claudas Investments Two Limited | ||
| CPIA Investments No.1 Limited | V | |
| CPIA Investments No.2 Limited | F, I | |
| Cureton Investments No. 1 Limited (In Liquidation) | ||
| Cuth Investments Limited | F, I, T | |
| Furbridge Investments Limited | ||
| Hamar Investments Limited | ||
| Hurley Investments No.1 Limited | ||
| Iris Investments 1 Limited | G, H, I | |
| Mintaka Investments No. 4 Limited | ||
| OGP Leasing Limited | ||
| Pelleas Investments Limited | ||
| Pelleas Investments Two Limited | ||
| Pippin Island Investments Limited | ||
| Razzoli Investments Limited | F, I | |
| RVH Limited | F, I | |
| Zanonne Investments Limited (In Liquidation) | ||
| Zumboorok Investments Limited | ||
| – PO Box 1093, Queensgate House, Grand Cayman,KY1-1102 | ||
Blaytell Limited | ||
| Coskwo Limited | ||
| Godler Limited | ||
| Harflane Limited | ||
| Barclays PLC and Barclays Bank PLC 2016 Annual Report on Form 20-F | 309 |
Notes to the financial statements
46 Related undertakingscontinued
| Wholly owned subsidiaries | Note | |
– PO Box 1093, Queensgate House, Grand Cayman,KY1-1102continued
| ||
| Hentock Limited | ||
| Hollygrice Limited | ||
| Pilkbull Limited | ||
| Strickyard Limited | ||
| Winhall Limited | ||
| – 190 Elgin Avenue, George Town, Grand Cayman,KY1-9005 | ||
Calthorpe Investments Limited | ||
| Gallen Investments Limited | ||
| JV Assets Limited | L | |
| Palomino Limited | Z | |
| Raglan Investments Limited | ||
| Wessex Investments Limited | ||
| – Walkers Corporate Limited, Cayman Corporate Centre, | ||
| 27 Hospital Road, George Town, KY1 – 9008 | ||
Long Island Holding B Limited | ||
| China | ||
| – Room 213, Building 1, No. 1000 Chenhui Road, | ||
ZhangjiangHi-Tech Park, Shanghai
| ||
| Barclays Technology Centre (Shanghai) Company Limited | ||
| Egypt | ||
| – Star Capital AI Tower, City Stars Project, 2 Ali Rashed Street, | ||
Nasr City, Cairo
| ||
| Barclays Bank Egypt SAE | ||
| France | ||
– 183 avenue Daumesnil, Paris, 75012
| ||
| Barclays Courtage SAS | ||
| Barclays Diversification | ||
| Barclays Patrimoine S.C.S. | ||
| Barclays Vie SA | ||
| BBAIL SAS | ||
– 32 avenue George V, Paris, 75008
| ||
| Barclays France SA | ||
| Barclays Wealth Managers France SA | ||
| Germany | ||
– Bockenheimer Landstrasse38-40,D-60323 Frankfurt Am Main
| ||
| Barclays Capital Effekten GmbH | ||
| Sulm Investments GmbH (In Liquidation) | ||
| – c/o SFM Deutschland GmbH, Gruneburgweg58-62, 60322, | ||
Frankfurt am Main
| ||
| Baubecon Holding 1 GmbH (In Liquidation) | ||
| Opal 110. GmbH (In Liquidation) | ||
– Gasstrasse 4c, 22761, Hamburg, Germany
| ||
| Baban Mantel AG (In Liquidation) | ||
| Gibraltar | ||
– Suite 1, Burns House, 19 Town Range
| ||
| Frankland Properties Limited | ||
| Norfolk LP | B | |
| Ringmer Properties Limited | ||
| Saveway Properties Limited | ||
| Stowmarket Investments Limited | ||
| Townmead Properties Limited | ||
| Trefield Holdings Limited | ||
| Guernsey | ||
– P.O. Box 33, Maison Trinity, Trinity Square, St. Peter Port, GY1 4AT
| ||
| Barclays Insurance Guernsey PCC Limited | Q | |
| – PO BOX 41, Floor 2, Le Marchant House, Le Truchot, St Peter Port, | ||
GY1 3BE
| ||
| Barclays Nominees (Guernsey) Limited | ||
| Hong Kong | ||
– 42nd floor Citibank Tower, Citibank Plaza, 3 Garden Road
| ||
| Barclays Bank (Hong Kong Nominees) Limited (In Liquidation) | ||
| Barclays Capital Asia Nominees Limited (In Liquidation) | ||
– Level 41, Cheung Kong Center, 2 Queen’s Road Central
| ||
| Barclays Asia Limited | ||
| Barclays Capital Asia Limited | ||
| Wholly owned subsidiaries | Note | |
| India | ||
| – 208 Ceejay House, Shivsagar Estate, Dr A Beasant Road, Worli, | ||
Mumbai, 400 018
| ||
| Barclays Securities (India) Private Limited | ||
| Barclays Wealth Trustees (India) Private Limited | ||
– 67, Maker Tower ‘F’ 6th Floor, Cuffe Parade, Mumbai, 400 005
| ||
| Barclays Holdings India Private Limited (In Liquidation) | ||
| – DLF IT Park 8th Floor, Building 9A and B, 1/124 Shivaji Gardens, | ||
Mount Poonamallee Road, Manapakkam, Chennai, 600089
| ||
| Barclays Shared Services Private Limited | ||
| – Ground to Fourth Floor, Wing 3 – Cluster A, Eon Free Zone, MIDC | ||
Knowledge Park, Pune, 411014
| ||
| Barclays Technology Centre India Private Limited | ||
| – Level 10, Block B6, Nirlon Knowledge Park, Off Western Express | ||
Highway, Goregaon (East), Mumbai, 40063
| ||
| Barclays Investments & Loans (India) Limited | F, I | |
| Indonesia | ||
| – Barclays House, 12th Floor, Jl. Jend Sudirman Kav.22-23, Jakarta, | ||
12920
| ||
| PT Bank Barclays Indonesia (In Liquidation) | ||
– Plaza Lippo, 10th Floor, Jalan Jend, Sudirman Kav 25, Jakarta, 12920
| ||
| PT Bhadra Buana Persada (In Liquidation) | ||
| Ireland | ||
– Two Park Place, Hatch Street, Dublin 2
| ||
| Barclaycard International Payments Limited | ||
| Barclays Assurance (Dublin) Designated Activity Company | ||
| Barclays Bank Ireland Public Limited Company | ||
| Barclays Insurance (Dublin) Designated Activity Company | ||
| Barclays Ireland Nominees Limited (In Liquidation) | ||
| Isle of Man | ||
– Barclays House, Victoria Street, Douglas, IM1 2LE
| ||
| Barclays Nominees (Manx) Limited | ||
| Barclays Portfolio (IoM GP) No.2 Limited | ||
| Barclays Private Clients International Limited | J, K | |
– 2nd Floor, St Georges Court, Upper Church Street, Douglas, IM1 1EE
| ||
| Barclays Holdings (Isle of Man) Limited | ||
| Italy | ||
– Milano, Via della Moscova 18
| ||
| Barclays Private Equity S.p.A. (In Liquidation) | ||
| Japan | ||
–10-1, Roppongi6-chome,Minato-ku, Tokyo
| ||
| Barclays Funds and Advisory Japan Limited | ||
| Barclays Securities Japan Limited | ||
| Barclays Wealth Services Limited | ||
| Jersey | ||
– Third Floor, 37 Esplanade, St. Helier, JE2 3QA
| ||
| CP Newco 1 Limited | ||
| CP Newco2 Limited | J, K | |
| CP Newco3 Limited | ||
– La Motte Chambers, St Helier, JE1 1BJ
| ||
| Barclays Services Jersey Limited | ||
–39-41 Broad Street, St Helier, JE2 3RR
| ||
| Barclays Wealth Management Jersey Limited | ||
| BIFML PTC Limited | ||
– 13 Castle Street, St. Helier, JE4 5UT
| ||
| Barclays Index Finance Trust | S | |
– Lime Grove House, Green Street, St Helier, JE1 2ST
| ||
| Barbridge Limited | ||
– 13 Library Place, St Helier, JE4 8NE
| ||
| Barclays Nominees (Jersey) Limited | ||
| Barclaytrust Channel Islands Limited | ||
– Appleby Trust (Jersey) Limited, PO Box 207,13-14
| ||
| Esplanade, St Helier, JE1 1BD | ||
| MK Opportunities GP Ltd | ||
| Korea, Republic of | ||
| –A-1705 Yeouido Park Centre,28-3 Yeouido-dong, | ||
Yeongdeungpo-gu, Seoul
| ||
| Barclays Korea GP Limited | ||
| 310 | Barclays PLC and Barclays Bank PLC 2016 Annual Report on Form 20-F |
46 Related undertakingscontinued
| Wholly owned subsidiaries | Note | |
| Luxembourg | ||
– 9, allée Scheffer,L-2520
| ||
| Barclays Aegis Investments S.à r.l. | ||
| Barclays Alzin Investments S.à r.l. | ||
| Barclays Bayard Investments S.à r.l. | J, K | |
Barclays BCL Fixed Income S.à.r.l.
| ||
– 9, allée Scheffer,L-2520 (continued)
| ||
| Barclays BCLI no.1 S.à r.l | ||
| Barclays BCLI no.2 S.à r.l. | ||
| Barclays Bedivere Investments S.à r.l. | ||
| Barclays Bordang Investments S.à r.l. | ||
| Barclays BR Holdings S.à r.l. | ||
| Barclays BR Investments S.à r.l. | ||
| Barclays Cantal Investments S.�� r.l. | J | |
| Barclays Capital Luxembourg S.à r.l. | ||
| Barclays Capital Trading Luxembourg S.à r.l. | J, K | |
| Barclays Claudas Investments Partnership | B | |
| Barclays Equity Index Investments S.à r.l. | ||
| Barclays Lamorak Investments S.à r.l. | ||
| Barclays Leto Investments S.à r.l. | ||
| Barclays Luxembourg EUR Holdings S.à r.l | ||
| Barclays Luxembourg Finance S.à r.l. | ||
| Barclays Luxembourg GBP Holdings S.à r.l. | ||
| Barclays Luxembourg Holdings S.à r.l. | I, AA | |
| Barclays Luxembourg Holdings SSC | B | |
| Barclays Luxembourg USD Holdings S.à r.l. | J, K | |
| Barclays Pelleas Investments Partnership | B | |
| Barclays Pelleas Investments S.à r.l. | G, I | |
| Barclays US Investments S.à r.l. | J, K | |
| Blossom Finance General Partnership | B | |
–68-70 Boulevard de la Petrusse,L-2320
| ||
| Adler Toy Holding Sarl | ||
| Malaysia | ||
– Unit30-01, Level 30, Tower A, Vertical Business Suite, Avenue 3,
| ||
| Barclays Capital Markets Malaysia Sdn Bhd. (In Liquidation) | F, I | |
| Mauritius | ||
| – C/O Rogers Capital Corporate Services, St. Louis Business Centre, | ||
Cnr Desroches & St. Louis Streets, Port Louis
| ||
| Barclays Capital Mauritius Limited | ||
| Barclays Capital Securities Mauritius Limited | ||
– Fifth Floor, Ebene Esplanade, 24 Cybercity, Ebene
| ||
| Barclays (H&B) Mauritius Limited | ||
| Barclays Mauritius Overseas Holdings Limited | ||
| Mexico | ||
– Paseo de la Reforma 505, 41 Floor, Torre Mayor, Col.
| ||
| Barclays Bank Mexico, S.A. | K, M | |
| Barclays Capital Casa de Bolsa, S.A. de C.V. | K, M | |
| Grupo Financiero Barclays Mexico, S.A. de C.V. | K, M | |
| Servicios Barclays, S.A. de C.V. | ||
| Monaco | ||
– 31 Avenue de la Costa, BP 339
| ||
| Barclays Wealth Asset Management (Monaco) S.A.M | ||
| Netherlands | ||
– Strawinskylaan 3105, 1077 ZX, Amsterdam
| ||
| Barclays SLCSM Funding B.V. | ||
– De Boelelaan 7, 1083 Hj Amsterdam
| ||
| Chewdef BidCo BV. (In Liquidation) | ||
| Nigeria | ||
– Southgate House, Udi Street, Osborne Estate, Ikoyi, Lagos
| ||
| Barclays Group Representative Office (NIG) Limited | ||
| Philippines | ||
– 21/F, Philamlife Tower, 8767 Paseo de Roxas, Makati City, 1226
| ||
| Meridian(SPV-AMC) Corporation | ||
| Wholly owned subsidiaries | Note | |
| Russian Federation | ||
– Four Winds Plaza, 1st Tverskaya-Yamskaya Str , Moscow 21, 125047
| ||
| Limited Liability Company Barclays Capital (In Liquidation) | ||
| Saudi Arabia | ||
– 18th Floor Al Faisaliah Tower , Riyadh, 11311
| ||
| Barclays Saudi Arabia (In Liquidation) | ||
| Singapore | ||
| – 10 Marina Boulevard,#24-01 Marina Bay Financial Centre, Tower 2, | ||
018983
| ||
| Barclays Bank (Singapore Nominees) Pte Ltd | ||
| Barclays Bank (South East Asia) Nominees Pte Ltd | ||
| Barclays Capital Futures (Singapore) Private Limited | ||
| Barclays Capital Holdings (Singapore) Private Limited | ||
| Barclays Merchant Bank (Singapore) Ltd. | ||
| Spain | ||
– Plaza De Colon 1, 28046, Madrid
| ||
| Barclays Tenedora De Immuebles SL. | ||
| Barclays Vida Y Pensiones, Compania De Seguros, S.A | Z | |
| The Logic Group Enterprises S.L | ||
| Switzerland | ||
– Chemin de Grange Canal18-20, PO Box 3941, 1211, Geneva
| ||
| Barclays Bank (Suisse) S.A. | ||
| BPB Holdings SA | ||
| Taiwan | ||
– 11/F, 106Xin-Yi Road, Sec. 5, Taipei 110
| ||
| Barclays Capital Securities Taiwan Limited (In Liquidation) | ||
| Thailand | ||
| – 87, M Thai Tower All Seasons Place, 23rd Floor, Wireless Road, | ||
Lumpini, Phatumwan, Bangkok, 10330
| ||
| Barclays Capital (Thailand) Ltd. (In Liquidation) | ||
United States | ||
| – Corporation Trust Company, Corporation Trust Center, | ||
1209 Orange Street, Wilmington DE 19801
| ||
| Archstone Equity Holdings Inc | ||
| Barclays BWA, Inc. | ||
| Barclays Capital Commodities Corporation | ||
| Barclays Capital Derivatives Funding LLC | C | |
| Barclays Capital Energy Inc. | ||
| Barclays Capital Real Estate Finance Inc. | ||
| Barclays Capital Real Estate Holdings Inc. | ||
| Barclays Capital Real Estate Inc. | ||
| Barclays Commercial Mortgage Securities LLC | C | |
| Barclays Delaware Holdings LLC | F, I | |
| Barclays Electronic Commerce Holdings Inc. | ||
| Barclays Financial LLC | C | |
| Barclays Group US Inc. | ||
| Barclays Investment Holdings LLC | ||
| Barclays Oversight Management Inc. | ||
| Barclays Receivables LLC | C | |
| Barclays Services Corporation | ||
| Barclays US CCP Funding LLC | C | |
| Barclays US Funding LLC | C | |
| Barclays US LLC | G, I | |
| BCAP LLC | C | |
| BNRI Acquisition No.4 LLC | C | |
| BNRI Acquisition No.5, LP | B | |
| CPIA Acquisition No.3 LLC | C | |
| CPIA Equity No. 1 Inc. | ||
| Crescent Real Estate Member LLC | C | |
| Gracechurch Services Corporation | ||
| Long Island Holding A LLC | C | |
| LTDL Holdings LLC | C | |
| Marbury Holdings LLC | ||
| Persica Holdings LLC | C | |
| Persica Lease LLC | C | |
| Persica LL LLC | C | |
| Persica Property LLC | C | |
| Barclays PLC and Barclays Bank PLC 2016 Annual Report on Form 20-F | 311 |
Notes to the financial statements
46 Related undertakingscontinued
| Wholly owned subsidiaries | Note | |
| – Corporation Trust Company, Corporation Trust Center, | ||
| 1209 Orange Street, Wilmington DE 19801 (continued) | ||
| Protium Finance I LLC | C | |
| Protium Master Mortgage LP | B | |
| Protium REO I LP | B | |
| RB Special Assets, L.L.C. | C | |
| Securitized Asset Backed Receivables LLC | C | |
| Sutton Funding LLC | C | |
| TPLL LLC | C | |
| TPProperty LLC | C | |
| TPWorks LLC | C | |
| US Secured Investments LLC | C | |
| Vail 09 LLC | C | |
| Vail Residential 09 LLC | C | |
| Vail SC LLC | C | |
– 1201 North Market Street, P.O. Box 1347 Wilmington, DE19801
| ||
| Barclays Bank Delaware | F, I | |
| Procella Investments LLC | C | |
| Procella Investments No.1 LLC | C | |
| Procella Investments No.2 LLC | C | |
| Procella Investments No.3 LLC | C | |
| Procella Swaps LLC | C | |
| Verain Investments LLC | ||
– 2711 Centerville Road, Suite 400, Wilmington DE 19808
| ||
| Analog Analytics Inc | ||
| Barclays Capital Equities Trading GP | B | |
| Barclays Capital Holdings Inc. | G, I | |
| Lagalla Investments LLC | ||
| Protium Master Grantor Trust | D | |
| Relative Value Holdings, LLC | ||
– 745 Seventh Avenue, New York NY 10019
| ||
| Alynore Investments Limited Partnership | B | |
| Curve Investments GP | B | |
| Preferred Liquidity, LLC | J | |
| – CT Corporation System, One Corporate Center, Floor 11, Hartford CT | ||
06103-3220
| ||
| Barclays Capital Inc. | ||
| – c/o RL&F Service Corp, One Rodney Square, 10th Floor, Tenth and | ||
King Streets, Wilmington DE 19801
| ||
| Analytical Trade Holdings LLC | ||
| Analytical Trade Investments LLC | BB | |
– 100 South West Street, Wilmington DE 19801
| ||
| Barclays Dryrock Funding LLC | C | |
| Wilmington Riverfront Receivables LLC | J, K | |
– 100 South Wacker Drive, Suite 2000, Chicago IL 60606
| ||
| BTXS Inc. | ||
– 15 East North Street, Dover DE DE 19801
| ||
| Barclays Services LLC | C | |
– 200 Park Avenue, New York, New York, 10166
| ||
| HYMF, Inc. | ||
– CT Corporation System, 225 Hillsborough Street, Raleigh, NC 27603
| ||
| Barclays US GPF Inc. | ||
– CT Corporation System, 350 North St. Paul Street, Dallas TX 75201
| ||
| La Torretta Beverages LLC | C | |
| La Torretta Hospitality LLC | C | |
| La Torretta Operations LLC | C | |
| – Aon Insurance Managers (USA) Inc., 199 Water Street, New York | ||
NY 10038
| ||
| Barclays Insurance U.S. Inc. | ||
– Suite 1100, 50 W. Liberty St., Reno, Nev 89501
| ||
| CPIA FX Investments Inc. | ||
– 500 Forest Point Circle, Charlotte, North Carolina 28273
| ||
| Equifirst Corporation (In Liquidation) | ||
| Zimbabwe | ||
| – 2 Premium Close, Mount Pleasant Business Park, | ||
Mount Pleasant, Harare
| ||
| Branchcall Computers (Pvt) Limited | ||
| – 2nd Floor, Barclays House, Corner Jason Moyo | ||
Avenue/First Street, Harare
| ||
| Afcarme Zimbabwe Holdings (Pvt) Limited | ||
Other Related Undertakings
Unless otherwise stated, the undertakings below are consolidated and the share capital disclosed comprises ordinary or common shares which are held by subsidiaries of the Group. The Group’s overall ownership percentage is provided for each undertaking.
| Other related undertakings | Percentage | Note | ||
| United Kingdom | ||||
– 1 Churchill Place, London, E14 5HP
| ||||
| Barclays Africa Limited | 50.10% | |||
| Barclaycard Funding PLC | 75.00% | J | ||
| Claas Finance Limited | 51.00% | K | ||
| PSA Credit Company Limited (in liquidation) | 50.00% | J, L | ||
| Barclays Covered Bond Funding LLP | 50.00% | B | ||
– 1 Angel Lane, London, EC4R 3AB
| ||||
| Vocalink Holdings Limited | 15.18% | Z | ||
– 1 Poultry, London, England, EC2R 8EJ
| ||||
| Igloo Regeneration (General Partner) Limited | 25.00% | L, Z | ||
| – 1 Robeson Way, Sharston Green Business Park, | ||||
Manchester, M22 4SW
| ||||
| KDC Holdings Limited | 37.41% | EE, Z | ||
–3-5 London Road, Rainham, Kent, ME8 7RG
| ||||
| Trade Ideas Limited | 20.00% | Z | ||
– Derby Training Centre, Ascot Drive, Derby, DE24 8GW
| ||||
| Develop Training Group Limited | 70.01% | CC, Z | ||
– 50 Lothian Road, Festival Square, Edinburgh, EH3 9BY
| ||||
| Equistone Founder Partner II L.P. | 20.00% | B, Z | ||
| Equistone Founder Partner III L.P. | 35.00% | B, Z | ||
| – Building 6 Chiswick Park, 566 Chiswick High Road, | ||||
London W4 5HR
| ||||
| Intelligent Processing Solutions Limited | 19.50% | Z | ||
| – 13 Frensham Road, Sweet Briar Industrial Estate, | ||||
Norwich, NR3 2BT
| ||||
| Warehouse Express Group Limited | 62.88% | DD, Z | ||
– Oak House, Ellesmere Port, Cheshire, CH65 9HQ
| ||||
| Elan Homes Holdings Limited | 59.94% | J, L, Z | ||
– 16 Palace Street, London, SW1E 5JD
| ||||
| Barclays Alma Mater Management Limited Partnership | 30.00% | B, Z | ||
–20-22 Bedford Row, London, WC1R 4JS
| ||||
| Cyber Defence Alliance Limited | 25.00% | E, Z | ||
– 30 Gresham Street, London, EC2V 7PG
| ||||
| Gresham Leasing March (3) Limited | 30.00% | Z | ||
– 80 New Bond Street, London, W1S 1SB
| ||||
| GN Tower Limited | 50.00% | Z | ||
| GW City Ventures Limited | 50.00% | K, Z | ||
| – Basepoint Business Centre,70-72 The Havens Ransomes | ||||
Europ, IP3 9SJ, Ipswich
| ||||
| Equity Estates Basingstoke Limited | 25.05% | J, Z | ||
– 5th Floor, 70 Gracechurch Street, London, EC3V 0XL
| ||||
| Camperdown UK Limited | 50.00% | J, Z | ||
– 5 North Colonnade, Canary Wharf, London, E14 4BB
| ||||
| BEIF Management Limited Partnership | 30.00% | B, Z | ||
| Imalivest LP | 66.71% | J, K, Z | ||
| – Blake House, Schooner Court, Crossways Business Park, | ||||
Dartford, DA2 6QQ
| ||||
| Lakeview Computers Group Limited | 57.83% | J, Z | ||
– Queens House, 8 Queen Street, London EC4N 1SP
| ||||
| BIE Topco Limited | 44.80% | J, Z | ||
– No.1 Dorset Street, Southampton, Hampshire, SO15 2DP
| ||||
| MCC (15) GH Limited | 72.25% | J, Z | ||
– 2nd Floor, 110 Cannon Street, London, EC4N 6EU
| ||||
| Vectorcommand Limited (in Liquidation) | 30.39% | J, K, Z | ||
– 55 Baker Street, London, W1U 7EU
| ||||
| Formerly H Limited (In Liquidation) | 70.32% | J, Z | ||
| – Countryside House, The Warley Hill Business Park, | ||||
The Drive, Brentwood, Essex, CM13 3AT
| ||||
| Woolwich Countryside Limited | 50.00% | O, Z | ||
| – Haberfield Old Moor Road, Wennington, Lancaster, | ||||
LA2 8PD
| ||||
| Full House Holdings Limited | 67.43% | J, Z | ||
– 6th Floor 60 Gracechurch Street, London, EC3V 0HR
| ||||
| BMC (UK) Limited | 40.57% | F, J, Z | ||
| – Central House, 124 High Street, Hampton Hill, Middlesex | ||||
TW12 1NS
| ||||
| Rio Laranja Holdings Limited | 45.00% | J, Z | ||
–13-15 York Buildings, London, WC2N 6JU
| ||||
| Business Growth Fund PLC | 24.18% | Z |
| 312 | Barclays PLC and Barclays Bank PLC 2016 Annual Report on Form 20-F |
46 Related undertakingscontinued
| Other related undertakings | Percentage | Note | ||
| Botswana | ||||
| – 5th Floor, Prime Plaza, Plot 74358, Central Business | ||||
District, Gabarone
| ||||
| Barclays Bank of Botswana Limited | 33.98% | |||
– Deloitte & Touche House, Lot 50664 , Gaborone
| ||||
| Barclays Insurance Services (Pty) Limited | 33.98% | |||
– Khama Crescent, Plot 17938, Government Enclave
| ||||
| Barclays Life Botswana Proprietary Limited | 50.10% | |||
| Canada | ||||
| – 15th Floor, Bankers Court, 850 – 2nd Street, Calgary AB | ||||
T2P 0R8
| ||||
| Clearbrook Resources Inc | 21.62% | Z | ||
| Cayman Islands | ||||
| – Maples Corporate Services Limited, PO Box 309GT, | ||||
| Ugland House, South Church Street, Grand Cayman, | ||||
KY1-1104
| ||||
| Chrysaor Holdings Limited | 39.60% | F, J, Z | ||
| Cupric Canyon Capital LP | 40.03% | FF, Z | ||
| Southern Peaks Mining LP | 56.17% | FF, Z | ||
| Third Energy Holdings Limited | 77.82% | F, J, K, Z | ||
| Germany | ||||
– SchopenhauerstraBe 10,D-90409, Nurnberg
| ||||
| Eschenbach Holding GmbH | 21.70% | Z | ||
| Ghana | ||||
– Barclays House, High Street, Accra
| ||||
| Barclays Bank of Ghana Limited | 50.10% | |||
| Hong Kong | ||||
– 6/F, Kiu Fu Commercial Building,300-306 Lockhart Road
| ||||
| CR SpaClub at Sea (HK) Limited | 53.86% | Z | ||
| Indonesia | ||||
| – Wisma GKBI 39th Floor, Suite 3906, Jl. Jend. Sudirman | ||||
No.28, Jakarta, 10210
| ||||
| PT Barclays Capital Securities Indonesia (In Liquidation) | 99.00% | |||
| Isle of Man | ||||
| – 3rd Floor, St George’s Court, Upper Church Street, | ||||
Douglas, IM1 1EE
| ||||
| Absa Manx Holdings Limited | 50.10% | |||
| Absa Manx Insurance Company Limited | 50.10% | |||
| Kenya | ||||
– 5th Floor, IKM Place, 5th Ngong Avenue, Nairobi
| ||||
| Barclays Life Assurance Kenya Limited | 31.99% | |||
– The West End Building, Waiyaki Way, Nairobi
| ||||
| Barclays (Kenya) Nominees Limited | 34.32% | |||
| Barclays Bank Insurance Agency Limited | 34.32% | |||
| Barclays Bank of Kenya Limited | 34.32% | |||
| Barclays Deposit-Taking Microfinance Limited | 34.32% | |||
| Barclays Financial Services Limited | 34.32% | |||
| Barclays Pension Services Limited | 31.20% | Z | ||
– 9th Floor, Williamson House, 4th Ngong Avenue, Nairobi
| ||||
| First Assurance Company Limited | 31.99% | |||
| First Assurance Holdings Limited | 50.10% | |||
| Korea, Republic of | ||||
| – 18th Floor, Daishin Finance Centre, 343, Samil-daero, | ||||
Jung-go, Seoul
| ||||
| Woori BC Pegasus Securitization Specialty Co., Limited | 70.00% | W | ||
| Luxembourg | ||||
– 9, allée Scheffer,L-2520
| ||||
| BNRI Limehouse No.1 Sarl | 96.30% | R | ||
| Partnership Investments S.à r.l. | 33.40% | |||
| Preferred Funding S.à r.l. | 33.33% | H | ||
| Preferred Investments S.à r.l. | 33.33% | H, I | ||
| Malta | ||||
– RS2 Buildings, Fort Road, Mosta MST 1859
| ||||
| RS2 Software PLC | 18.25% | Z | ||
| Other related undertakings | Percentage | Note | ||
| Mauritius | ||||
– Barclays House, 68 Cyber City, Ebène
| ||||
| Barclays Bank Mauritius Limited | 50.10% | G, H, J, K | ||
| Monaco | ||||
– 31 Avenue de la Costa, Monte Carlo
| ||||
| Societe Civile Immobiliere 31 Avenue de la Costa | 75.00% | |||
| Mozambique | ||||
– Avenida 25 de Setembro, No 1184, 15 Andar, Maputo
| ||||
| Barclays Bank Mocambique SA | 49.50% | |||
– Rua da Imprensa, 183 – R/C, Maputo
| ||||
| Global Alliance Seguros, S.A. | 50.10% | |||
| Namibia | ||||
– Bougain Villas, 78 Sam Nujoma Drive, Windhoek
| ||||
| EFS Namibia Proprietary Limited | 50.10% | |||
| – Unit 6, Ausspann Plaza, Dr Agostinho Nero Road, | ||||
Ausspannplatz, Windhoek
| ||||
| Absa Namibia Proprietary Limited | 50.10% | |||
| Netherlands | ||||
– Alexanderstraat 18, 2514 JM, The Hague
| ||||
| Tulip Oil Holding BV | 30.45% | J, L,Z | ||
| Nigeria | ||||
– Plot 6, Block XII, Osborne Estate, Ikoyi, Lagos
| ||||
| Absa Capital Representative Office Nigeria Limited | 50.10% | |||
| Norway | ||||
– Postbox 6783, ST Olavs plass, 0130 Oslo
| ||||
| EnterCard Norge AS | 40.00% | Z | ||
– Skansegata 2, Stavanger, 4006, Rogland
| ||||
| Origo Exploration Holding AS | 28.32% | F, I, Z | ||
| Seychelles | ||||
| – Capital City, Room1-01, 1st Floor, Independence | ||||
Avenue, Victoria, Mahe
| ||||
| Barclays Bank (Seychelles) Limited | 49.98% | |||
| South Africa | ||||
| – Barclays Towers West, 15 Troye Street, | ||||
Johannesburg, 2001
| ||||
| 1900 Summerstrand Share Block Limited | 50.10% | |||
| Absa Alternative Asset Management Proprietary Limited | 50.10% | |||
| Absa Asset Management Proprietary Limited | 50.05% | |||
| Absa Bank Limited | 50.10% | I, J | ||
| Absa Capital Securities Proprietary Limited | 50.10% | |||
| Absa Consultants and Actuaries Proprietary Limited | 50.10% | |||
| Absa Development Company Holdings Proprietary Limited | 50.10% | F, I | ||
| Absa Estate Agency Proprietary Limited | 50.10% | |||
| Absa Financial Services Africa Holdings Proprietary Limited | 50.10% | |||
| Absa Financial Services Limited | 50.10% | |||
| Absa Fleet Services Proprietary Limited | 50.10% | |||
| Absa Fund Managers Limited | 50.10% | |||
| Absa idirect Limited | 50.10% | |||
| Absa Insurance and Financial Advisers Proprietary Limited | 50.10% | |||
| Absa Insurance Company Limited | 50.10% | |||
| Absa Insurance Risk Management Services Limited | 50.10% | |||
| Absa Investment Management Services Proprietary Limited | 50.10% | |||
| Absa Life Limited | 50.10% | F, I | ||
| Absa Mortgage Fund Managers Proprietary Limited | 50.10% | |||
| Absa Nominees Proprietary Limited | 50.10% | |||
| Absa Ontwikkelingsmaatskappy Eiendoms Beperk | 50.10% | |||
| Absa Outsource Competency Centre Proprietary Limited | 50.10% | |||
| Absa Portfolio Managers Proprietary Limited | 50.10% | |||
| Absa Property Development Proprietary Limited | 50.10% | |||
| Absa Secretarial Services Proprietary Limited | 50.10% | |||
| Absa Stockbrokers and Portfolio Management | ||||
| Proprietary Limited | 50.10% | |||
| Absa Technology Finance Solutions Proprietary Limited | 50.10% | |||
| Absa Trading and Investment Solutions Holdings | ||||
| Proprietary Limited | 50.10% | |||
| Absa Trading and Investment Solutions Proprietary Limited | 50.10% | |||
| Absa Trust (Natal) Limited | 50.10% | |||
| Barclays PLC and Barclays Bank PLC 2016 Annual Report on Form 20-F | 313 |
Notes to the financial statements
46 Related undertakingscontinued
| Other related undertakings | Percentage | Note | ||
– Barclays Towers West, 15 Troye Street, Johannesburg, 2001 (continued) | ||||
| Absa Trust Limited | 50.10% | I, J | ||
| Absa Vehicle Management Proprietary Limited | 50.10% | |||
| Absa Vehicle Management Solutions Proprietary Limited | 50.10% | |||
| ABSAN Proprietary Limited | 50.10% | |||
| ACS Nominees Proprietary Limited | 50.10% | |||
| AIMS Nominees (RF) Proprietary Limited | 50.10% | |||
| Alberton Industrial Properties Proprietary Limited | 50.10% | |||
| Allied Development Company Proprietary Limited | 50.10% | |||
| Allied Grinaker Properties Proprietary Limited (In Liquidation) | 25.55% | |||
| Allpay Consolidated Investment Holdings Proprietary Limited | 50.10% | |||
| Allpay Eastern Cape Proprietary Limited (In Liquidation) | 33.07% | |||
| Allpay Free State Proprietary Limited (In Liquidation) | 30.06% | |||
| Allpay Gauteng Proprietary Limited (In Liquidation) | 30.06% | |||
| Allpay Mpumalanga Proprietary Limited | 50.10% | |||
| Allpay Western Cape Proprietary Limited (In Liquidation) | 33.07% | |||
| Bankorptrust Limited | 50.10% | |||
| Barclays Africa Group Limited | 50.10% | |||
| Barclays Africa Regional Office Proprietary Limited | 50.10% | |||
| Cedar Lakes Country Estates Proprietary Limited | ||||
| (Liquidated on 19 January 2017) | 50.10% | |||
| Combined Mortgage Nominees Proprietary Limited | 50.10% | |||
| Compro Holdings Proprietary Limited | 50.10% | |||
| Draaikloof Properties Proprietary Limited (In Liquidation) | 40.08% | |||
| FFS Finance South Africa (RF) Proprietary Limited | 25.05% | |||
| Fradey Nominees (RF) Proprietary Limited | 50.10% | |||
| Goldreef Village Share Block Limited | 50.10% | |||
| Instant Life Proprietary Limited | 37.57% | |||
| iSentials Proprietary Limited | 25.05% | |||
| MAN Financial Services (SA) (RF) Proprietary Limited | 25.05% | |||
| Marmanet Retirement Village Proprietary Limited | 50.10% | |||
| Kempwest Proprietary Limited | 25.05% | |||
| Lekkerleef Eiendoms Beperk | 50.10% | |||
| MB Acquired Operations Limited (In Liquidation) | 50.10% | |||
| Meeg Asset Finance Proprietary Limited (In Liquidation) | 50.10% | |||
| Merfin Proprietary Limited | 50.10% | |||
| Nation-Wide Recovery Services Proprietary Limited | 25.05% | |||
| NewFunds (RF) Proprietary Limited | 50.10% | |||
| Newgold Issuer (RF) Limited | 50.10% | Z | ||
| Newgold Managers Proprietary Limited | 24.55% | |||
| Olieven Properties Proprietary Limited | ||||
| (Liquidated on 19 January 2017) | 50.10% | |||
| Ottawa Development Trust Proprietary Limited | 50.10% | |||
| Palmietfontein Investments Proprietary Limited | ||||
| (Liquidated on 19 January 2017) | 50.10% | |||
| Roodekop Townships Proprietary Limited | 50.10% | |||
| UBS Trust Limited | 50.10% | |||
| United Development Corporation Proprietary Limited | 50.10% | |||
| United Towers Proprietary Limited | 50.10% | |||
| Volkskas Eiendomsdienste Eiendoms Beperk | 50.10% | I, J | ||
| Volkskastrust Beperk | 50.10% | I, J | ||
| Woodbook Finance Proprietary Limited | 50.10% | |||
| Woolworths Financial Services Proprietary Limited | 25.05% | |||
– Absa Capital, 15 Alice Lane, Sandton, Gauteng
| ||||
| Barrie Island Property Investments Proprietary Limited | 50.10% | |||
| Blue Age Properties 60 Proprietary Limited | 50.10% | |||
| Culemborg Investment Properties Proprietary Limited | 28.69% | J, K | ||
| Diluculo Investments Proprietary Limited | 50.10% | |||
| Diluculo Properties Proprietary Limited | 50.10% | |||
| Diluculo Property Trading Proprietary Limited | 50.10% | |||
| Ngwenya River Estate Proprietary Limited | 50.10% | |||
| Nkwe Rosslyn Properties Proprietary Limited | 50.10% | |||
| Pienaarsrivier Properties Proprietary Limited | 50.10% | |||
– 18 Bompas Road, Dunkeld West
| ||||
| African Spirit Trading 309 Proprietary Limited | 25.05% | Z | ||
– 52 Grosvenor Road, Bryanston, 2021
| ||||
| Campus on Rigel Proprietary Limited (In Liquidation) | 16.70% | Z | ||
| – 9th Floor, Standard Bank Centre, 5 Simmonds Street, | ||||
Johannesburg
| ||||
| Integrated Processing Solutions Proprietary Limited | 25.05% | |||
– Abcon House, Fairway Office Park, Bryanston
| ||||
| Somerset West Autopark Proprietary Limited | 16.70% | Z | ||
– Corner Ian Halle, P O Box 44845, Claremont, 7735
| ||||
| Northern Lights Trading 197 Proprietary Limited | 25.05% | Z | ||
| Pacific Heights Investments 196 Proprietary Limited | 25.05% | Z |
| Other related undertakings | Percentage | Note | ||
| Sweden | ||||
– c/o ForeningsSparbanken AB, 105 34 Stockholm
| ||||
| EnterCard Holding AB | 40.00% | K, Z | ||
| EnterCard Sverige AB | 40.00% | Z | ||
| Tanzania, United Republic of | ||||
| – Azali Certified Public Secretaries, Hillside Apartments, | ||||
First Floor, Suite #04, Ragati Road Upperhill, Nairobi
| ||||
| First Assurance Company Limited (Tanzania) | 16.79% | |||
| – Barclays House, P O Box 5137, Ohio Street, | ||||
Dar es Salaam
| ||||
| Barclays Bank Tanzania Limited | 50.10% | G, I | ||
| – Mezzanine Floor, NBC House, Sokoine Drive, | ||||
Dar Es Salaam
| ||||
| National Bank of Commerce Limited | 27.55% | |||
| Turkey | ||||
| – Bahcelievier Mah., Kaldirim Cad. No. 34/1, | ||||
Cengelkoy-Uskudar, Istanbul
| ||||
| CRKK RESORT OTEL ISLETMECILGI LIMITED SIRKETI | 54.40% | Z | ||
| Uganda | ||||
– 16 Kampala Road, Kampala
| ||||
| Barclays Bank of Uganda Limited | 50.10% | |||
| United States | ||||
– 777 Main Street, Fort Worth TX 76102
| ||||
| CR Lenox Residences, LLC | 54.40% | C, Z | ||
| CR Management, LLC | 54.40% | C, Z | ||
| CRE Diversified Holdings LLC | 80.00% | C, Z | ||
| Crescent Crown Greenway Plaza SPV LLC | 80.00% | C, Z | ||
| Crescent Crown Land Holding SPV LLC | 80.00% | C, Z | ||
| Crescent Plaza Hotel Owner GP, LLC | 80.00% | C, Z | ||
| Crescent Plaza Hotel Owner, L.P. | 80.00% | B, Z | ||
| Crescent Plaza Residential LP, LLC | 80.00% | C, Z | ||
| Crescent Plaza Residential, L.P. | 80.00% | B, Z | ||
| Crescent Plaza Residential, LLC | 80.00% | C, Z | ||
| Crescent Plaza Restaurant GP, LLC | 80.00% | C, Z | ||
| Crescent Property Services LLC | 80.00% | C, Z | ||
| Crescent Real Estate Equities Limited Partnership | 80.00% | B, Z | ||
| Crescent Real Estate Equities, LLC | 80.00% | C, Z | ||
| Crescent Real Estate Holdings LLC | 80.00% | C, Z | ||
| Crescent Resort Development LLC | 80.00% | C, Z | ||
| Crescent Tower Residences GP, LLC | 80.00% | C, Z | ||
| Crescent Tower Residences, L.P. | 80.00% | B, Z | ||
| Crescent TRS Holdings LLC | 80.00% | C, Z | ||
| Crescent-Fearing, L.P. | 40.00% | B, Z | ||
| CREW Tahoe Holdings LLC | 80.00% | C, Z | ||
| DBL Texas Holdings LLC | 80.00% | C, Z | ||
| Desert Mountain Development LLC | 80.00% | C, Z | ||
| Desert Mountain Properties Limited Partnership | 74.40% | B, Z | ||
| East West Resort Development VII LLC | 80.00% | C, Z | ||
| Mira Vista Development LLC | 78.40% | C, Z | ||
| Moon Acquisition Holdings LLC | 80.00% | C, Z | ||
| Moon Acquisition LLC | 80.00% | C, Z | ||
| Mountainside Partners LLC | 80.00% | C, Z | ||
| Sonoma Golf Club, LLC | 64.00% | C, Z | ||
| Sonoma Golf, LLC | 64.00% | C, Z | ||
| Sonoma National, LLC | 80.00% | C, Z | ||
– 8600 E. Rockcliff Road, Tuscon AZ 85750
| ||||
| Canyon Ranch Enterprises, LLC | 54.40% | C, Z | ||
| CR Employment, Inc. | 54.40% | Z | ||
| CR Las Vegas, LLC | 54.40% | C, Z | ||
| CR License, LLC | 54.40% | C, Z | ||
| CR Miami Employment, LLC | 54.40% | C, Z | ||
| CR Miami, LLC | 54.40% | C, Z | ||
| CR Operating, LLC | 54.40% | C, Z | ||
| CR Orlando, LLC | 54.40% | C, Z | ||
| CR Products, LLC | 54.40% | C, Z | ||
| CR Resorts, LLC | 54.40% | C, Z | ||
| CR SpaClub at Sea, LLC | 54.40% | C, Z | ||
| Spa Project Advisors, LLC | 54.40% | C, Z | ||
| Tucson/Lenox Special Manager, Inc. | 54.40% | Z | ||
| Tucson/Lenox, LLC | 54.40% | C, Z | ||
| 314 | Barclays PLC and Barclays Bank PLC 2016 Annual Report on Form 20-F |
46 Related undertakingscontinued
| Other related undertakings | Percentage | Note | ||
| – 126 Riverfront Lane , 5th Floor, Drawer 2770, | ||||
Avon CO 81620
| ||||
| Blue River Land Company, LLC | 39.55% | C, Z | ||
| East West Resort Development IV, L.P., L.L.L.P. | 71.11% | B, Z | ||
| East West Resort Development VI, L.P., L.L.L.P. | 35.86% | B, Z | ||
| East West Resort Development VIII, L.P., L.L.L.P. | 71.11% | B, Z | ||
| East West Resort Development XIV, L.P., L.L.L.P. | 33.52% | B, Z | ||
| EW Deer Valley, LLC | 29.28% | C, Z | ||
| EWRD Perry Holding, L.P., L.L.L.P. | 67.61% | B, Z | ||
| EWRD Perry-Riverbend, LLC | 54.31% | C, Z | ||
| EWRD Summit Holding, L.P., L.L.L.P. | 79.57% | B, Z | ||
| EWRD Summit, LLC | 79.10% | C, Z | ||
| MV Penthouses, LLC | 51.20% | C, Z | ||
| Water House on Main Street LLC | 35.26% | C, Z | ||
– 3001 Northstar Drive, C200, Truckee CA 96161
| ||||
| CREW Tahoe LLC | 60.80% | C, Z | ||
| East West Resort Development V, L.P., L.L.L.P. | 74.75% | B, Z | ||
| Gray’s Station, LLC | 56.96% | C, Z | ||
| Home Run Tahoe, LLC | 60.82% | C, Z | ||
| Northstar Mountain Properties, LLC | 60.82% | C, Z | ||
| Northstar Trailside Townhomes, LLC | 60.82% | C, Z | ||
| Northstar Village Townhomes, LLC | 56.93% | C, Z | ||
| Old Greenwood Realty, Inc. | 60.80% | Z | ||
| Old Greenwood, LLC | 60.80% | C, Z | ||
| Tahoe Club Company, LLC | 60.80% | C, Z | ||
| Tahoe Mountain Resorts, LLC | 60.82% | C, Z | ||
| The Glades Tahoe, LLC | 60.82% | C, Z | ||
– Corporation Service Company, 2711 Centreville Road, | ||||
Suite 400, Wilmington DE 19808
| ||||
| CR SPE1, LLC | 54.40% | C, Z | ||
| Crescent CR Holdings LLC | 80.00% | C, Z | ||
| Crescent Fresh Series B Hold Co. | 80.00% | Z | ||
| Crescent McKinney Olive Holdings GP LLC | 80.00% | C, Z | ||
| MVWP Development LLC | 30.40% | C, Z | ||
| MVWP Investors LLC | 60.80% | C, Z | ||
| Stellar Residences, LLC | 60.82% | C, Z | ||
| Stellar Townhomes, LLC | 60.82% | C, Z | ||
| – 1701 Wynkoop Street, Suite 140, Box 47, Denver | ||||
CO 80202
| ||||
| Parkside Townhomes, LLC | 47.63% | C, Z | ||
| St. Charles Place, LLC | 47.63% | C, Z | ||
| The Park at One Riverfront, LLC | 47.63% | C, Z | ||
| Central Platte Valley Management, LLC | 51.78% | C, Z | ||
| Union Center LLC | 51.78% | C, Z | ||
| – Corporation Trust Company, Corporation Trust Center, | ||||
1209 Orange Street, Wilmington DE 19801
| ||||
| DG Solar Lessee II, LLC | 50.00% | C, Z | ||
| DG Solar Lessee, LLC | 50.00% | C, Z | ||
| Cupric Canyon Capital LLC | 40.03% | FF, Z | ||
| VS BC Solar Lessee I LLC | 50.00% | C, Z | ||
| – East West Partners, Inc., 126 Riverfront Lane, 5th Floor, | ||||
Avon CO 81620
| ||||
| Tahoe Club Employee Company | 60.80% | Z | ||
| – 200 Renaissance Parkway Suite 20, Atlanta, | ||||
Georgia 30308
| ||||
| Overlook at Sugarloaf Inc | 50.10% | |||
| – C/O Capitol Services Inc., Suite B, 1675 South State | ||||
Street, Dover DE 19901-5140
| ||||
| Continental Intermodal Group LP | 37.58% | FF, Z | ||
| – C/O W.J. Harrison & Associates, P.C., 3561 East Sunrise | ||||
Dr., Ste. 201, Tucson AZ 85718
| ||||
| CR Bodrum Management, LLC | 54.40% | C, Z | ||
– 6600 Mira Vista Blvd., Fort Worth TX 76132
| ||||
| Mira Vista Golf Club, L.C. | 76.83% | Z | ||
| – c/o National Corporate Research Ltd. 615 DuPont | ||||
Highway, Dover, Kent County, DE 19901
| ||||
| Surrey Funding Corporation | 99.45% | |||
| Sussex Purchasing Corporation | 99.45% |
| Other related undertakings | Percentage | Note | ||
| Zambia | ||||
– 3rd Floor, Mpile Park, 74 Independence Avenue, Lusaka
| ||||
| Barclays Life Zambia Limited | 50.10% | |||
| – Stand No. 4643 and 4644, Elunda Office Park, | ||||
Addis Ababa Roundabout, Lusaka
| ||||
| Barclays Bank Zambia PLC | 50.10% | |||
– Kafue House, Cairo Road, Lusaka, 10101
| ||||
| Kafue House Limited | 50.10% | |||
| Zimbabwe | ||||
| – 2nd Floor, Barclay House, Corner First Street, Jason | ||||
Moyo Avenue, PO Box 1279, Harare
| ||||
| Barclays Bank of Zimbabwe Limited | 67.68% | |||
| Barclays Merchant Bank of Zimbabwe Limited (In Liquidation) | 67.68% | |||
| Barclays Zimbabwe Nominees (Pvt) Limited | 67.68% | |||
| Fincor Finance Corporation Limited | 67.68% | |||
| – 2 Premium Close, Mount Pleasant Business Park, | ||||
Mount Pleasant , Harare
| ||||
| BRAINS Computer Processing (Pvt) Limited (In Liquidation) | 78.45% | F, I | ||
Subsidiaries by virtue of control
The related undertakings below are subsidiaries in accordance with s.1162 Companies Act 2006 as Barclays can exercise dominant influence or control over them. The entities are owned by The Barclays Bank UK Retirement Fund.
| Subsidiaries by virtue of control | Percentage | Note | ||
| United Kingdom | ||||
– 1 Churchill Place, London, E14 5HP
| ||||
| Oak Pension Asset Management Limited | 0.00% | Z | ||
| Water Street Investments Limited | 0.00% | Z | ||
| Cayman Islands | ||||
| – PO Box 309GT, Ugland House, South Church Street, | ||||
Grand Cayman,KY1-1104
| ||||
| Hornbeam Limited | 0.00% | Z | ||
Joint Ventures
The related undertakings below are Joint Ventures in accordance with s. 18, Schedule 4, The Large andMedium-sized Companies and Groups (Accounts and Reports) Regulations 2008 and are proportionally consolidated.
| Joint Ventures | Percentage | Joint management factors | ||
United Kingdom
| ||||
– 21 Garlick Hill, London, EC4V 2AU
Vaultex UK Limited | 50.00% | The Joint Venture Board comprises two Barclays representative directors, two JV partner directors and threenon-JV partner directors. The Board is responsible for setting the company strategy and budgets. |
| Barclays PLC and Barclays Bank PLC 2016 Annual Report on Form 20-F | 315 |
Notes to the financial statements
46 Related undertakingscontinued
| Notes | ||
| A | Directly held by Barclays PLC | |
| B | Partnership Interest | |
| C | Membership Interest | |
| D | Trust Interest | |
| E | Guarantor | |
| F | Preference Shares | |
| G | A Preference Shares | |
| H | B Preference Shares | |
| I | Ordinary/Common Shares in addition to other shares | |
| J | A Ordinary Shares | |
| K | B Ordinary Shares | |
| L | C Ordinary Shares | |
| M | F Ordinary Shares | |
| N | O Ordinary Shares | |
| O | W Ordinary Shares | |
| P | Redeemable Ordinary Shares | |
| Q | Core Shares and Insurance (Classified) Shares | |
| R | B, C, D, E (94.36%), F (94.36%), G (94.36%), H (94.36%), I (94.36%), J (95.23%) and K Class Shares | |
| S | A and B Unit Shares | |
| T | Class A Residual Shares, Class B Residual Shares | |
| U | A Voting Shares and BNon-Voting Shares | |
| V | Class A Ordinary Shares, Class A Preference Shares (48.50%), Class B Ordinary Shares, Class C Ordinary Shares, Class C Preference Shares (92.53%), Class D Ordinary Shares, Class D Preference Shares, Class E Ordinary Shares, Class E Preference Shares, Class F Ordinary Shares, Class F Preference Shares, Class H 2012 Ordinary Shares, Class H 2012 Preference Shares, Class H Ordinary Shares, Class H Preference Shares (79.84%), Class I Preference Shares (50.00%), Class J Ordinary Shares, Class J Preference Shares | |
| W | First Class Common Shares, Second Class Common Shares | |
| X | PEF Carry Shares | |
| Y | EUR Tracker Shares, GBP Tracker Shares and USD Tracker Shares | |
| Z | Not Consolidated (see Note 37 Structured entities) | |
| AA | USD Linked Ordinary Shares | |
| BB | Redeemable Class B Shares | |
| CC | A Ordinary, Y Ordinary, Z Ordinary | |
| DD | A Ordinary, B Ordinary, ZA Ordinary, ZB Ordinary, D Ordinary | |
| EE | A Ordinary, ZI Ordinary | |
| FF | Class A Units / Interests | |
| 316 | Barclays PLC and Barclays Bank PLC 2016 Annual Report on Form 20-F |
Additional shareholder information
Shareholder information
Additional shareholder information
Articles of Association
Barclays PLC (the “Company”) is a public limited company registered in England and Wales under company number 48839. Barclays, originally named Barclay & Company Limited, was incorporated in England and Wales on 20 July 1896 under the Companies Acts 1862 to 1890 as a company limited by shares. The company name was changed to Barclays Bank Limited on 17 February 1917 and it was registered on 15 February 1982 as a public limited company under the Companies Acts 1948 to 1980. On 1 January 1985, the company changed its name to Barclays PLC.
Under the Companies Act 2006 a company’s Memorandum of Association now need only contain the names of the subscribers and the number of shares each subscriber has agreed to take. For companies in existence as of 1 October 2009, all other provisions which were contained in the company’s Memorandum of Association, including the company’s objects, are now deemed to be contained in the company’s articles. The Companies Act 2006 also states that a company’s objects are unrestricted unless the company’s articles provide otherwise.
The Articles of Association were adopted at the Company’s Annual General Meeting (“AGM”) on 30 April 2010 and amended at the AGM of the Company on 25 April 2013.
The following is a summary and explanation of the current Articles of Association, which are available for inspection.
Directors
(i) The minimum number of Directors (excluding alternate Directors) is five. There is no maximum limit. There is no age limit for Directors.
(ii) Excluding executive remuneration and any other entitlement to remuneration for extra services (including service on board committees) under the Articles, a Director is entitled to a fee at a rate determined by the Board but the aggregate fees paid to all Directors shall not exceed £2,000,000 per annum or such higher amount as may be approved by an ordinary resolution of the Company. Each Director is entitled to reimbursement for all reasonable travelling, hotel and other expenses properly incurred by him/her in or about the performance of his/her duties.
(iii) No Director may act (either himself/herself or through his/her firm) as an auditor of the Company. A Director may hold any other office of the Company on such terms as the Board shall determine.
(iv) At each AGM of the Company, one third of the Directors (rounded down) are required under the Articles of Association to retire from office by rotation and may offer themselves forre-election. The Directors so retiring are first, those who wish to retire and not offer themselves forre-election, and, second those who have been longest in office (and in the case of equality of service length are selected by lot). Other than a retiring Director, no person shall (unless recommended by the Board) be eligible for election unless a member notifies the Company Secretary in advance of
his/her intention to propose a person for election. It is Barclays’ practice that all Directors offer themselves forre-election annually in accordance with the UK Corporate Governance Code.
(v) The Board has the power to appoint additional Directors or to fill a casual vacancy amongst the Directors. Any Director so appointed holds office until the next AGM, when he/she may offer himself/herself for reappointment. He/she is not taken into account in determining the number of Directors retiring by rotation.
(vi) The Board may appoint any Director to any executive position or employment in the Company on such terms as they determine.
(vii) The Company may by ordinary resolution remove a Director before the expiry of his/her period of office (without prejudice to a claim for damages for breach of contract or otherwise) and may by ordinary resolution appoint another person who is willing to act to be a Director in his/her place.
(viii) A Director may appoint either another Director or some other person approved by the Board to act as his/her alternate with power to attend Board meetings and generally to exercise the functions of the appointing Director in his/her absence (other than the power to appoint an alternate).
(ix) The Board may authorise any matter in relation to which a Director has, or can have, a direct interest that conflicts, or possibly may conflict with, the Company’s interests. Only Directors who have no interest in the matter being considered will be able to authorise the relevant matter and they may impose limits or conditions when giving authorisation if they think this is appropriate.
(x) A Director may hold positions with or be interested in other companies and, subject to legislation applicable to the Company and the FCA’s requirements, may contract with the Company or any other company in which the Company is interested. A Director may not vote or count towards the quorum on any resolution concerning any proposal in which he/she (or any person connected with him/her) has a material interest (other than by virtue of his/her interest in securities of the Company) or if he/she has a duty which conflicts or may conflict with the interests of the Company, unless the resolution relates to any proposal:
(a) to indemnify a Director or provide him/her with a guarantee or security in respect of money lent by him/her to, or any obligation incurred by him/her or any other person for the benefit of (or at the request of), the Company (or any other member of the Group);
(b) to indemnify or give security or a guarantee to a third party in respect of a debt or obligation of the Company (or any other member of the Group) for which the Director has personally assumed responsibility;
(c) to obtain insurance for the benefit of Directors;
(d) involving the acquisition by a Director of any securities of the Company (or any other member of the Group) pursuant to an offer to existing holders of securities or to the public;
(e) that the Director underwrite any issue of securities of the Company (or any other member of the Group);
| Barclays PLC and Barclays Bank PLC 2016 Annual Report on Form 20-F | 317 |
Additional shareholder information
(f) concerning any other company in which the Director is interested as an officer or creditor or Shareholder but, broadly, only if he/she (together with his/her connected persons) is directly or indirectly interested in less than 1% of either any class of the issued equity share capital or of the voting rights of that company; and
(g) concerning any other arrangement for the benefit of employees of the Company (or any other member of the Group) under which the Director benefits or stands to benefit in a similar manner to the employees concerned and which does not give the Director any advantage which the employees to whom the arrangement relates would not receive.
(xi) A Director may not vote or be counted in the quorum on any resolution which concerns his/her own employment or appointment to any office of the Company or any other company in which the Company is interested.
(xii) Subject to applicable legislation, the provisions described insub-paragraphs (x) and (xi) may be relaxed or suspended by an ordinary resolution of the members of the Company or any applicable governmental or other regulatory body.
(xiii) A Director is required to hold an interest in ordinary shares having a nominal value of at least £500, which currently equates to 2,000 Ordinary Shares unless restricted from acquiring or holding such interest by any applicable law or regulation or any applicable governmental or other regulatory body. A Director may act before acquiring those shares but must acquire the qualification shares within two months from his/her appointment. Where a Director is unable to acquire the requisite number of shares within that time owing to law, regulation or requirement of any governmental or other relevant authority, he/she must acquire the shares as soon as reasonably practicable once the restriction(s) end.
(xiv) The Board may exercise all of the powers of the Company to borrow money, to mortgage or charge its undertaking, property and uncalled capital and to issue debentures and other securities.
Classes of Shares
The Company only has Ordinary Shares in issue. The Articles of Association also provide for pound sterling preference shares of £100 each, US dollar preference shares of US$100 each, US dollar preference shares of $0.25 each, euro preference shares of€100 each and yen preference shares of ¥10,000 each (together, the “Preference Shares”). In accordance with the authority granted at the AGM on 25 April 2013, Preference Shares may be issued by the Board from time to time in one or more series with such rights and subject to such restrictions and limitations as the Board may determine. No Preference Shares have been issued to date.
Dividends
Subject to the provisions of the Articles and applicable legislation, the Company in general meeting may declare dividends on the Ordinary Shares by ordinary resolution, but any such dividend may not exceed the amount recommended by the Board. The Board may also pay interim or final dividends if it appears they are justified by the Company’s financial position.
Each Preference Share confers the right to a preferential dividend (“Preference Dividend”) payable in such currency at such rates (whether fixed or calculated by reference to or in accordance with a specified procedure or mechanism), on such dates and on such
other terms as may be determined by the Board prior to allotment thereof.
The Preference Shares rank in regard to payment of dividends in priority to the holders of Ordinary Shares and any other class of shares in the Company ranking junior to the Preference Shares.
Dividends may be paid on the Preference Shares if, in the opinion of the Board, the Company has sufficient distributable profits, after payment in full or the setting aside of a sum to provide for all dividends payable on (or in the case of shares carrying a cumulative right to dividends, before) the relevant dividend payment date on any class of shares in the Company ranking pari passu with or in priority to the relevant series of Preference Shares as regards participation in the profits of the Company.
If the Board considers that the distributable profits of the Company available for distribution are insufficient to cover the payment in full of Preference Dividends, Preference Dividends shall be paid to the extent of the distributable profits on a pro rata basis.
Notwithstanding the above, the Board may, at its absolute discretion, determine that any Preference Dividend which would otherwise be payable may either not be payable at all or only payable in part.
If any Preference Dividend on a series of Preference Shares is not paid, or is only paid in part, for the reasons described above, holders of Preference Shares will not have a claim in respect of suchnon-payment.
If any dividend on a series of Preference Shares is not paid in full on the relevant dividend payment date, a dividend restriction shall apply. The dividend restriction means that, subject to certain exceptions, neither the Company nor Barclays Bank may (a) pay a dividend on, or (b) redeem, purchase, reduce or otherwise acquire, any of their respective ordinary shares, other preference shares or other share capital ranking equal or junior to the relevant series of Preference Shares until the earlier of such time as the Company next pays in full a dividend on the relevant series of Preference Shares or the date on which all of the relevant series of Preference Shares are redeemed.
All unclaimed dividends payable in respect of any share may be invested or otherwise made use of by the Board for the benefit of the Company until claimed. If a dividend is not claimed after 12 years of it becoming payable, it is forfeited and reverts to the Company.
The Board may, with the approval of an ordinary resolution of the Company, offer Shareholders the right to choose to receive an allotment of additional fully paid Ordinary Shares instead of cash in respect of all or part of any dividend. The Company currently provides a scrip dividend programme pursuant to an authority granted at the AGM held on 25 April 2013.
Redemption and Purchase
Subject to applicable legislation and the rights of the other shareholders, any share may be issued on terms that it is, at the option of the Company or the holder of such share, redeemable. The Directors are authorised to determine the terms, conditions and manner of redemption of any such shares under the Articles of Association.
| 318 | Barclays PLC and Barclays Bank PLC 2016 Annual Report on Form 20-F |
Additional shareholder information
Calls on capital
The Directors may make calls upon the members in respect of any monies unpaid on their shares. A person upon whom a call is made remains liable even if the shares in respect of which the call is made have been transferred. Interest will be chargeable on any unpaid amount called at a rate determined by the Board (of not more than 20% per annum).
If a member fails to pay any call in full (following notice from the Board that such failure will result in forfeiture of the relevant shares), such shares (including any dividends declared but not paid) may be forfeited by a resolution of the Board, and will become the property of the Company. Forfeiture shall not absolve a previous member for amounts payable by him/her (which may continue to accrue interest).
The Company also has a lien over all partly paid shares of the Company for all monies payable or called on that share and over the debts and liabilities of a member to the Company. If any monies which are the subject of the lien remain unpaid after a notice from the Board demanding payment, the Company may sell such shares.
Annual and other general meetings
The Company is required to hold an AGM in addition to such other general meetings as the Directors think fit. The type of the meeting will be specified in the notice calling it. Under the Companies Act 2006, the AGM must be held within six months of the financial year end. A general meeting may be convened by the Board on requisition in accordance with the applicable legislation.
In the case of an AGM, a minimum of 21 clear days’ notice is required. The notice must be in writing and must specify the place, the day and the hour of the meeting, and the general nature of the business to be transacted. A notice convening a meeting to pass a special resolution shall specify the intention to propose the resolution as such. The accidental failure to give notice of a general meeting or thenon-receipt of such notice will not invalidate the proceedings at such meeting.
Subject as noted above, all Shareholders are entitled to attend and vote at general meetings. The Articles do, however, provide that arrangements may be made for simultaneous attendance at a satellite meeting place or, if the meeting place is inadequate to accommodate all members and proxies entitled to attend, another meeting place may be arranged to accommodate such persons other than that specified in the notice of meeting, in which case Shareholders may be excluded from the principal place.
Holders of Preference Shares have no right to receive notice of, attend or vote at, any general meetings of the Company as a result of holding Preference Shares.
Notices
A document or information may be sent by the Company in hard copy form, electronic form, by being made available on a website, or by another means agreed with the recipient, in accordance with the provisions set out in the Companies Act 2006. Accordingly, a document or information may only be sent in electronic form to a person who has agreed to receive it in that form or, in the case of a company, who has been deemed to have so agreed pursuant to
applicable legislation. A document or information may only be sent by being made available on a website if the recipient has agreed to receive it in that form or has been deemed to have so agreed pursuant to applicable legislation, and has not revoked that agreement.
In respect of joint holdings, documents or information shall be sent to the joint holder whose name stands first in the register.
A member who (having no registered address within the UK) has not supplied an address in the UK at which documents or information may be sent in hard copy form, or an address to which notices, documents or information may be sent or supplied by electronic means, is not entitled to have documents or information sent to him/her.
In addition, the Company may cease to send notices to any member who has been sent documents on two consecutive occasions over a period of at least 12 months and when each of those documents is returned undelivered or notification is received that they have not been delivered.
Capitalisation of profits
The Company may, by ordinary resolution, upon the recommendation of the Board capitalise all or any part of an amount standing to the credit of a reserve or fund to be set free for distribution provided that amounts from the share premium account, capital redemption reserve or any profits not available for distribution should be applied only in paying up unissued shares to be allotted to members credited as fully paid and no unrealised profits shall be applied in paying up debentures of the Company or any amount unpaid on any share in the capital of the Company.
Indemnity
Subject to applicable legislation, every current and former Director or other officer of the Company (other than any person engaged by the company as auditor) shall be indemnified by the Company against any liability in relation to the Company, other than (broadly) any liability to the Company or a member of the Group, or any criminal or regulatory fine
| Barclays PLC and Barclays Bank PLC 2016 Annual Report on Form 20-F | 319 |
Additional shareholder information
| Officers of the Group | Date of Appointment as Officer | |||
Ashok Vaswani
| Chief Executive Officer, Barclays UK
| 2012
| ||
Bob Hoyt
| Group General Counsel
| 2013
| ||
Tushar Morzaria
| Group Finance Director
| 2013
| ||
Michael Roemer
| Group Head of Compliance
| 2014
| ||
James E Staley
| Group Chief Executive Officer
| 2015
| ||
Tristram Roberts
| Group Human Resources Director
| 2015
| ||
Amer Sajed
| CEO, Barclaycard International
| 2015
| ||
Paul Compton
| Group Chief Operating Officer
| 2016
| ||
CS Venkatakrishnan
| Chief Risk Officer
| 2016
| ||
Claire Davies
| Company Secretary
| 2016
| ||
Tim Throsby
| President, Barclays International
Chief Executive Officer, Corporate and Investment Bank
| 2017
| ||
| 320 | Barclays PLC and Barclays Bank PLC 2016 Annual Report on Form 20-F |
Additional shareholder information
Dividends on the ordinary shares of Barclays PLC
On 1 March 2016, Barclays announced that it would pay semi-annual dividends going forward. A final dividend for the full year ended 31 December 2015 of 3.5p was paid on 5 April 2016. In respect of the year ended 31 December 2016, one interim dividend of 1p was paid on 19 September 2016 and a final dividend of 2.0p was announced on 23 February 2017 for payment on 5 April 2017.
The dividends declared for each of the last five years were:
Pence per 25p ordinary share
|
| |||||||||||||||||||
|
| 2016
|
|
| 2015
|
|
| 2014
|
|
| 2013
|
|
| 2012
|
| ||||||
Interim | 1.00 | 3.00 | 3.00 | 3.00 | 3.00 | |||||||||||||||
Final
|
| 2.00
|
|
| 3.50
|
|
| 3.50
|
|
| 3.50
|
|
| 3.50
|
| |||||
Total
|
|
3.00
|
|
| 6.50
|
|
| 6.50
|
|
| 6.50
|
|
| 6.50
|
| |||||
US Dollars per 25p ordinary share
|
| |||||||||||||||||||
|
| 2016
|
|
| 2015
|
|
| 2014
|
|
| 2013
|
|
| 2012
|
| ||||||
Interim |
|
0.01
|
|
|
0.05
|
|
|
0.05
|
|
|
0.05
|
|
|
0.05
|
| |||||
Final
|
| 0.02
|
|
| 0.05
|
|
| 0.05
|
|
| 0.05
|
|
| 0.05
|
| |||||
Total
|
|
0.03
|
|
|
0.10
|
|
|
0.10
|
|
|
0.10
|
|
|
0.10
|
| |||||
The gross dividends applicable to an American Depositary Share (ADS) representing four ordinary shares, before deduction of withholding tax, are as follows:
US Dollars per American Depositary Share
|
| |||||||||||||||||||
|
| 2016
|
|
| 2015
|
|
| 2014
|
|
| 2013
|
|
| 2012
|
| ||||||
Interim
|
|
0.05
|
|
|
0.18
|
|
|
0.18
|
|
|
0.18
|
|
|
0.19
|
| |||||
Final
|
|
0.10
|
|
|
0.20
|
|
|
0.22
|
|
|
0.23
|
|
|
0.22
|
| |||||
Total
|
| 0.15
|
|
| 0.38
|
|
| 0.40
|
|
| 0.41
|
|
| 0.41
|
| |||||
The final dividends shown above are expressed in Dollars translated at the closing spot rate for Pounds Sterling as determined by Bloomberg at 5pm in New York City (the ‘Closing Spot Rate’) on the latest practicable date for inclusion in this report. No representation is made that
Pounds Sterling amounts have been, or could have been, or could be, converted into Dollars at these rates.
Trading market for ordinary shares of Barclays PLC
The principal trading market for Barclays PLC ordinary shares is the London Stock Exchange. At the close of business on 31 December 2016, 16,963,242,876 ordinary shares were in issue.
Ordinary share listings were also obtained on the New York Stock Exchange (NYSE) with effect from 9 September 1986. Trading on the NYSE is in the form of ADSs under the symbol ‘BCS’. Each ADS represents four ordinary shares and is evidenced by an American Depositary Receipt (ADR). The ADR depositary is JP Morgan Chase Bank, N.A. Details of trading activity are published in the stock tables of leading daily newspapers in the US.
There were 517 ADR holders and 1,673 recorded holders of ordinary shares with US addresses at 31 December 2016, whose shareholdings represented approximately 4.68% of total outstanding ordinary shares on that date. Since a certain number of the ordinary shares and ADRs were held by brokers or other nominees, the number of recorded holders in the US may not be representative of the number of beneficial holders or of their country of residence.
The following table shows the high and low sales price for the ordinary shares during the periods indicated, based onmid-market prices at close of business on the London Stock Exchange and the high and low sale price for ADSs as reported on the NYSE composite tape.
Sale prices for ordinary shares |
| |||||||||||||||
| 25p ordinary shares |
| American
Depositary Shares |
| |||||||||||||
|
High |
|
|
Low |
|
|
High |
|
|
Low |
| |||||
|
p |
|
|
p |
|
|
US$ |
|
|
US$ |
| |||||
2017
| ||||||||||||||||
By month: | ||||||||||||||||
February1
|
| 239.25
|
|
| 221.35
|
|
| 11.89
|
|
| 11.12
|
| ||||
January
|
| 236.25
|
|
| 219.45
|
|
| 11.71
|
|
| 11.07
|
| ||||
1 as at 22 February 2017
|
| |||||||||||||||
2016 | ||||||||||||||||
By month:
| ||||||||||||||||
| August |
|
172.25 |
|
|
146.00 |
|
|
9.11 |
|
|
7.84 |
| ||||
| September | 174.75 | 164.70 | 9.31 | 8.39 | ||||||||||||
| October | 191.30 | 166.50 | 9.27 | 8.16 | ||||||||||||
| November | 215.95 | 181.35 | 10.75 | 8.91 | ||||||||||||
| December | 239.00 | 212.95 | 11.99 | 10.70 | ||||||||||||
| By Quarter: | ||||||||||||||||
| First quarter | 215.25 | 147.85 | 12.85 | 8.62 | ||||||||||||
| Second quarter | 186.95 | 127.20 | 11.18 | 7.03 | ||||||||||||
| Third quarter | 174.75 | 131.65 | 9.31 | 7.06 | ||||||||||||
| Fourth quarter | 239.00 | 166.50 | 11.99 | 8.16 | ||||||||||||
| 2015 | ||||||||||||||||
| First quarter | 266.00 | 223.55 | 16.31 | 13.63 | ||||||||||||
| Second quarter | 274.45 | 248.90 | 17.15 | 14.94 | ||||||||||||
| Third quarter | 288.95 | 239.00 | 17.98 | 14.58 | ||||||||||||
| Fourth quarter | 257.00 | 209.10 | 15.81 | 12.80 | ||||||||||||
| 2014 | 296.50 | 207.90 | 19.58 | 13.50 | ||||||||||||
| 2013 | 308.39 | 242.39 | 18.93 | 15.69 | ||||||||||||
| 2012 | 288.00 | 148.20 | 17.47 | 9.31 | ||||||||||||
| 2011 | 333.55 | 138.85 | 21.64 | 8.55 | ||||||||||||
| 2010 | 383.20 | 255.40 | 24.10 | 15.40 | ||||||||||||
| 2009 | 383.60 | 51.20 | 25.40 | 3.10 | ||||||||||||
| Barclays PLC and Barclays Bank PLC 2016 Annual Report on Form 20-F | 321 |
Additional shareholder information
This section incorporates information on the prices at which securities of Barclays PLC have traded. It is emphasised that past performance cannot be relied upon as a guide to future performance.
Shareholdings at 31 December 2016a | Number of shareholders | Percentage of holders | Shares held | Percentage of capital | ||||
| Classification of shareholders | ||||||||
| Personal Holders | 266,012 | 97.24% | 456,102,830 | 2.69% | ||||
| Banks and Nominees | 2,764 | 1.01% | 14,785,945,892 | 87.16% | ||||
| Other Companies | 4,787 | 1.75% | 1,721,183,651 | 10.15% | ||||
| Insurance Companies | 2 | 0.00% | 523 | 0.00% | ||||
| Pension Funds | 7 | 0.00% | 9,980 | 0.00% | ||||
| Total | 273,572 | 100.00% | 16,963,242,876 | 100.00% | ||||
| Shareholding range | ||||||||
| 1 - 100 | 18,163 | 6.64% | 678,463 | 0.00% | ||||
| 101 - 250 | 55,920 | 20.44% | 11,370,607 | 0.07% | ||||
| 251 - 500 | 75,447 | 27.58% | 26,331,004 | 0.16% | ||||
| 501 - 1,000 | 44,334 | 16.21% | 31,375,347 | 0.18% | ||||
| 1,001 - 5,000 | 56,942 | 20.81% | 125,625,032 | 0.74% | ||||
| 5,001 - 10,000 | 12,094 | 4.42% | 84,906,729 | 0.50% | ||||
| 10,001 - 25,000 | 7,190 | 2.63% | 108,767,678 | 0.64% | ||||
| 25,001 - 50,000 | 1,668 | 0.61% | 56,858,249 | 0.34% | ||||
| 50,001 and over | 1,184 | 0.66% | 16,517,329,767 | 97.37% | ||||
| Totals | 273,572 | 100.00% | 16,963,242,876 | 100.00% | ||||
| United States Holdings | 1,673 | 0.61% | 4,200,586 | 0.02% | ||||
Note
| a. | These figures do not include Barclays Sharestore members. |
Currency of presentation
In this report, unless otherwise specified, all amounts are expressed in Pound Sterling. For the months of September 2016 through to February 2017, the highest and lowest closing spot rates as determined by Bloomberg at 5:00 p.m (New York time) (the ‘Closing Spot Rate’), expressed in USD per GBP were:
(US Dollars per Pound Sterling)
|
| |||||||||||||||||||||||
| February | January | December | November | October | September | |||||||||||||||||||
|
| 2017
|
|
| 2016
|
| |||||||||||||||||||
High
|
|
1.27
|
|
|
1.26
|
|
|
1.27
|
|
|
1.26
|
|
|
1.28
|
|
|
1.34
|
| ||||||
Low
|
| 1.24
|
|
|
1.20
|
|
|
1.22
|
|
|
1.22
|
|
|
1.21
|
|
|
1.30
|
| ||||||
(US Dollars per Pound Sterling)
|
| |||||||||||||||||||
|
| 2016
|
|
| 2015
|
|
| 2014
|
|
| 2013
|
|
| 2012
|
| ||||||
Average
|
| 1.56
|
|
|
1.53
|
|
|
1.65
|
|
|
1.56
|
|
|
1.59
|
| |||||
On 22 February 2017, the Closing Spot Rate in Pound Sterling was $1.25.
No representation is made that Pounds Sterling amounts have been, or could have been, or could be, converted into USD at any of the above rates. For the purpose of presenting financial information in this report, exchange rates other than those shown above may have been used.
| 322 | Barclays PLC and Barclays Bank PLC 2016 Annual Report on Form 20-F |
Additional shareholder information
Taxation of UK holders
The following is a summary of certain UK tax issues which are likely to be material to the holding and disposal of Ordinary Shares of Barclays PLC, Preference Shares of Barclays Bank PLC (the ‘Bank’), or ADSs representing such Ordinary Shares or Preference Shares (together the ‘Shares’).
It is based on current law and the practice of Her Majesty’s Revenue and Customs (‘HMRC’), which may be subject to change, possibly with retrospective effect. It is a general guide for information purposes and should be treated with appropriate caution. It is not intended as tax advice and it does not purport to describe all of the tax considerations that may be relevant to a prospective purchaser, holder or disposer of Shares. In particular, save where expressly stated to the contrary, this summary deals with shareholders who are resident and, in the case of individuals, domiciled in (and only in) the UK for UK tax purposes, who hold their Shares as investments (other than under an individual savings account) and who are the absolute beneficial owners of their Shares and any dividends paid on them.
The statements are not addressed to: (i) shareholders who own (or are deemed to own) 10 per cent. or more of the voting power of Barclays PLC or the Bank; (ii) shareholders who hold Shares as part of hedging transactions; (iii) investors who have (or are deemed to have) acquired their Shares by virtue of an office or employment; and (iv) shareholders who hold Shares in connection with a trade, profession or vocation carried on in the UK (whether through a branch or agency or, in the case of a corporate shareholder, through a permanent establishment, or otherwise). It does not discuss the tax treatment of classes of shareholder subject to special rules, such as dealers in securities.
Persons who are in any doubt as to their tax position should consult their professional advisers. Persons who may be liable to taxation in jurisdictions other than the UK in respect of their acquisition, holding or disposal of Shares are particularly advised to consult their professional advisers as to whether they are so liable.
(i) Taxation of dividends
In accordance with UK law, Barclays PLC or the Bank (as the case may be) pays dividends on the Shares without any deduction or withholding tax in respect of any taxes imposed by the UK government or any UK taxing authority.
Dividends paid on or after 6 April 2016
For dividends paid on or after 6 April 2016, dividends paid to a UK resident individual shareholder in a tax year (the ‘Total Dividend Income’) will generally form part of that shareholder’s total income for UK income tax purposes. The Total Dividend Income will be regarded as the top slice of the shareholder’s total income, and will be subject to UK income tax at the rates discussed below.
The rate of UK income tax applicable to the Total Dividend Income will depend on the amount of the Total Dividend Income and the UK income tax band(s) that the Total Dividend Income falls within when included as part of the shareholder’s total income for UK income tax purposes.
A nil rate of UK income tax applies to the first £5,000 of Total Dividend Income received by an individual shareholder in a tax year (the ‘Nil Rate Amount’)
Where the Total Dividend Income received by an individual shareholder in a tax year exceeds the Nil Rate Amount, the excess amount (the ‘Remaining Dividend Income’) will be subject to UK income tax at the following rates:
(a) at the rate of 7.5% on any portion of the Remaining Dividend Income that falls within the basic tax band;
(b) at the rate of 32.5% on any portion of the Remaining Dividend Income that falls within the higher tax band; and
(c) at the rate of 38.1% on any portion of the Remaining Dividend Income that falls within the additional tax band.
In determining the tax band the Remaining Dividend Income falls within, the individual shareholder’s Dividend Income (along with any other dividends received that are included in the shareholder’s total income for UK income tax purposes) for the tax year in question (including the portion comprising the Nil Rate Amount) will be treated as the top slice of the shareholder’s total income for UK tax purposes.
Subject to special rules for small companies, UK resident shareholders within the charge to UK corporation tax will be subject to UK corporation tax on the dividends paid on the Shares unless the dividend falls within an exempt class and certain conditions are met.
Dividends paid between 6 April 2015 and 5 April 2016 (inclusive)
In respect of dividends paid between 6 April 2015 and 5 April 2016 (inclusive) (the ‘2015-2016 tax year’), a UK resident individual shareholder will be subject to tax under a different UK regime for the taxation of dividends. UK resident individuals receiving a dividend during the 2015-2016 tax year will generally be entitled to a tax credit in respect of such dividend which may be used by certain shareholders to set against any liability they may have to UK income tax on that dividend. The value of the tax credit is equal toone-ninth of the amount of the cash dividend. The cash dividend received plus the related tax credit (together, the ‘gross dividend’) will be part of the shareholder’s total income for UK income tax purposes for the 2015-2016 tax year. The gross dividend will be regarded as the top slice of the shareholder’s income, and will be subject to UK income tax at the rates discussed below.
If the shareholder is a UK resident individual liable to UK income tax solely at the basic rate for the 2015-2016 tax year, then that shareholder will be liable to UK income tax of 10% of the gross dividend. Since the tax credit will fully match this liability, there should be no further tax liability in respect of the dividend received. A UK resident individual shareholder that is a higher or additional rate taxpayer for the 2015-2016 tax year will be liable to UK income tax on the gross dividend at special marginal rates (32.5% or 37.5% respectively) against which the tax credit may be set. In that case, there will be a further liability to UK income tax for the shareholder as the tax credit will not fully match the tax liability.
UK resident shareholders within the charge to UK corporation tax will be subject to UK corporation tax on dividends paid on the Shares in the 2015-2016 tax year in the same way as dividends paid on or
| Barclays PLC and Barclays Bank PLC 2016 Annual Report on Form 20-F | 323 |
Additional shareholder information
after 6 April 2016 (see the section “–(i) Taxation of Dividends-Dividends paid on or after 6 April 2016” above).
UK resident shareholders are not entitled to any repayment of the tax credits attaching to the dividends paid on the Shares in the 2015-2016 tax year. Anon-UK resident shareholder will not generally be entitled to any payment from HMRC of a tax credit in respect of a UK dividend paid on the Shares in the 2015-2016 tax year. Somenon-UK resident shareholders may be able to recover some of the tax credit in respect of a UK dividend paid on the Shares in the 2015-2016 tax year under an applicable double tax treaty and should consult their own professional advisers as to whether they are so entitled and as to the process for making such a claim.
(ii) Taxation of shares under the Dividend Reinvestment Plan
Where a shareholder elects to purchase shares using their cash dividend as part of the Dividend Reinvestment Plan, such shareholders will generally be liable for UK income tax or corporation tax (as the case may be) on dividends reinvested in the Dividend Reinvestment Plan on the same basis as if they had received the cash and arranged the investment themselves. They should accordingly include the dividend received in their tax return in the normal way.
(iii) Taxation of capital gains
The disposal of Shares may, depending on the shareholder’s circumstances, give rise to a liability to tax on chargeable capital gains.
Where Shares are sold, a liability to tax may result if the proceeds from that sale exceed the sum of the base cost of the Shares sold and any other allowable deductions such as share dealing costs and, in certain circumstances, indexation relief. To arrive at the total base cost of any Barclays PLC shares held, in appropriate cases the amount subscribed for rights taken up in 1985, 1988 and 2013 must be added to the cost of all such shares held. For this purpose, current legislation permits the market valuation at 31 March 1982 to be substituted for the original cost of shares purchased before that date. Shareholders other than those within the charge to UK corporation tax should note that, following the Finance Act 2008, no indexation allowance will be available. Shareholders within the charge to UK corporation tax may be eligible for indexation allowance.
Chargeable capital gains may also arise from the gifting of Shares to connected parties such as relatives (although not spouses or civil partners) and family trusts.
The calculations required to compute chargeable capital gains may be complex. Shareholders are advised to consult their personal financial adviser if further information regarding a possible tax liability in respect of their holdings of shares is required.
(iv) Stamp duty and stamp duty reserve tax
Dealings in Shares will generally be subject to UK stamp duty or stamp duty reserve tax (although see the comments below as regards ADSs in the section ‘Taxation of US holders – UK stamp Duty’). The transfer on sale of Ordinary Shares and Preference Shares will generally be liable to stamp duty at 0.5% of the consideration paid for that transfer. An unconditional agreement to transfer Ordinary Shares and Preference Shares, or any interest therein, will generally be subject to stamp duty reserve tax at 0.5% of the consideration given. Such liability to stamp duty reserve tax
will be cancelled, or a right to a repayment (generally with interest) in respect of the stamp duty reserve tax liability will arise, if the agreement is completed by a duly stamped transfer within six years of the agreement having become unconditional. Both stamp duty and stamp duty reserve tax are normally the liability of the transferee.
Paperless transfers of Ordinary Shares and Preference Shares within CREST are liable to stamp duty reserve tax rather than stamp duty.
Stamp duty reserve tax on transactions settled within the CREST system or reported through it for regulatory purposes will be collected by CREST.
Special rules apply to certain categories of person, including intermediaries, market makers, brokers, dealers and persons connected with depositary arrangements and clearance services.
(v) Inheritance tax
An individual may be liable to inheritance tax on the transfer of Shares. Where an individual is so liable, inheritance tax may be charged on the amount by which the value of his or her estate is reduced as a result of any transfer by way of gift or other gratuitous transaction made by them or treated as made by them.
Taxation of US holders
The following is a summary of the principal US federal income tax consequences and certain UK tax consequences for US holders (as defined below) of Ordinary Shares of Barclays PLC, Preference Shares of Barclays Bank PLC (the ‘Bank’), or ADSs representing such Ordinary Shares or Preference Shares, who own the shares or ADSs as capital assets for tax purposes. It is not, however, a comprehensive analysis of all the potential US or UK tax consequences for such holders and it does not discuss the tax consequences of members of special classes of holders subject to special rules, including (i) dealers in securities, (ii) traders in securities that elect to use amark-to-market method of accounting for securities holdings,(iii) tax-exempt organizations, (iv) life insurance companies, (v) holders liable for alternative minimum tax, (vi) holders that actually or constructively own 10 per cent or more of the voting stock of Barclays PLC or the Bank, (vii) holders that hold shares or ADSs as part of a straddle or a hedging or conversion transaction, (viii) holders that purchase or sell shares or ADSs as part of a wash sale, (ix) holders whose functional currency is not the US dollar, or (x) holders who are resident, or (in the case of individuals) ordinarily resident, or who are carrying on a trade, in the UK. The summary also does not address any aspect of US federal taxation other than US federal income taxation (such as the estate and gift tax or the Medicare tax on net investment income). Investors are advised to consult their tax advisers regarding the tax implications of their particular holdings, including the consequences under applicable state and local law, and in particular whether they are eligible for the benefits of the Treaty, as defined below.
This section is also based on the Internal Revenue Code of 1986, as amended (the ‘Code’), its legislative history, existing and proposed regulations, published rulings and court decisions, and on the Double Taxation Convention between the UK and the US as entered into force in March 2003 (the ‘Treaty’), and, in respect of UK tax, the Estate and Gift Tax Convention between the UK and the US as entered into force on 11 November 1979 (the ‘Estate and Gift Tax Convention’), the current UK tax law and the practice of HMRC, all of which are subject to change, possibly on a retroactive basis. This
| 324 | Barclays PLC and Barclays Bank PLC 2016 Annual Report on Form 20-F |
Additional shareholder information
section is based in part upon the representations of the ADR Depositary and the assumption that each obligation of the Deposit Agreement and any related agreement will be performed in accordance with its terms.
A “US holder” is a beneficial owner of shares or ADSs that is, for US federal income tax purposes, (i) a citizen or resident of the US, (ii) a US domestic corporation, (iii) an estate whose income is subject to US federal income tax regardless of its source, or (iv) a trust if a US court can exercise primary supervision over the trust’s administration and one or more US persons are authorised to control all substantial decisions of the trust. If a partnership holds the shares or ADSs, the US federal income tax treatment of a partner will generally depend on the status of the partner and the tax treatment of the partnership. A partner in a partnership holding the shares or ADSs should consult its tax adviser with regard to the US federal income tax treatment of an investment in the shares or ADSs.
For the purposes of the Treaty, the Estate and Gift Tax Convention, and the Code, the holders of ADRs evidencing ADSs will be treated as owners of the underlying Ordinary Shares or Preference Shares, as the case may be. Generally, exchanges of shares for ADRs and ADRs for shares will not be subject to US federal income tax or to UK capital gains tax.
(i) Taxation of dividends
Subject to the PFIC rules discussed below, a US holder is subject to US federal income taxation on the gross amount of any dividend paid by Barclays PLC or the Bank, as applicable, out of its current or accumulated earnings and profits (as determined for US federal income tax purposes).
Dividends paid by Barclays PLC or the Bank, as applicable, with respect to the Ordinary Shares, Preference Shares or ADSs will generally be qualified dividend income. Dividends paid to a noncorporate US holder that constitute qualified dividend income will be taxable to the holder at preferential rates, provided that the holder has a holding period of the shares or ADSs of more than 60 days during the121-day period beginning 60 days before theex-dividend date (or, in the case of Preference Shares or ADSs relating thereto, if the dividend is attributable to a period or periods aggregating over 366 days, provided that the holder holds the shares or ADSs for more than 90 days during the181-day period beginning 90 days before theex-dividend date) and meets certain other holding period requirements. A US holder will not be subject to UK withholding tax. Dividends must be included in income when the US holder, in the case of shares, or the Depositary, in the case of ADSs, actually or constructively receives the dividend, and will not be eligible for the dividends-received deduction generally allowed to US corporations in respect of dividends received from other US corporations. For foreign tax credit purposes, dividends will generally be income from sources outside the US and will, depending on a US holder’s circumstances, be either ‘passive’ or ‘general’ income for purposes of computing the foreign tax credit allowable to a US holder.
The amount of the dividend distribution includable in income will be the US Dollar value of the Pound Sterling payments made, determined at the spot Pound Sterling/US Dollar rate on the date the dividend distribution is includable in income, regardless of whether the payment is in fact converted into US Dollars. Generally, any gain or loss resulting from currency exchange fluctuations
during the period from the date the dividend payment is includable in income to the date the payment is converted into US Dollars will be treated as ordinary income or loss and, for foreign tax credit limitation purposes, from sources within the US, and will not be eligible for the special tax rates applicable to qualified dividend income.
Distributions in excess of current or accumulated earnings and profits, as determined for US federal income tax purposes, will be treated as a return of capital to the extent of the US holder’s basis in the shares or ADSs and thereafter as capital gain. Because Barclays PLC and the Bank do not currently maintain calculations of earnings and profits for US federal income tax purposes, it is expected that distributions with respect to the shares and ADSs will generally be reported to US holders as dividends.
(ii) Taxation of capital gains
Subject to the PFIC rules discussed below, generally, US holders will not be subject to UK tax, but will be subject to US tax on capital gains realised on the sale or other disposition of Ordinary Shares, Preference Shares or ADSs. Generally, a US holder will recognise capital gain or loss for US federal income tax purposes equal to the difference between the US Dollar value of the amount realised and a US holder’s tax basis, determined in US Dollars, in its shares or ADSs. Capital gain of a noncorporate US holder is generally taxed at preferential rates where the holder has a holding period of greater than one year. The gain or loss will generally be income or loss from sources within the US for foreign tax credit limitation purposes.
(iii) Taxation of premium on redemption or purchase of shares
No refund of tax will be available under the Treaty in respect of any premium paid on a redemption of Preference Shares by the Bank or on a purchase of Ordinary Shares by Barclays PLC. For US tax purposes, redemption premium generally will be treated as an additional amount realised in the calculation of a US holder’s gain or loss.
(iv) Taxation of passive foreign investment companies (PFICs)
Barclays PLC and the Bank believe that their respective shares and ADSs should not be treated as stock of a PFIC for US federal income tax purposes, but this conclusion is a factual determination that is made annually and thus may be subject to change. If Barclays PLC or the Bank were to be treated as a PFIC, then the gain realised on the sale or other disposition of the shares or ADSs would in general not be treated as capital gain. Instead, unless a US holder elects to be taxed annually on amark-to-market basis with respect to its shares or ADSs, such gain and certain ‘excess distributions’ would be treated as having been realised ratably over a US holder’s holding period for the shares or ADSs and generally would be taxed at the highest tax rate in effect for each such year to which the gain was allocated, together with an interest charge in respect of the tax attributable to each such year. With certain exceptions, a US holder’s shares or ADSs will be treated as stock in a PFIC if Barclays PLC or the Bank, as applicable, was a PFIC at any time during such holder’s holding period in its shares or ADSs. Dividends that a US holder receives will not be eligible for the special tax rates applicable to qualified dividend income if Barclays PLC or the Bank is treated as a PFIC with respect to such US holder either in the taxable year of the distribution or the preceding taxable year, but instead will be taxable at rates applicable to ordinary income.
| Barclays PLC and Barclays Bank PLC 2016 Annual Report on Form 20-F | 325 |
Additional shareholder information
(v) Certain Reporting Requirements
US holders should consult their tax advisers regarding any tax reporting or filing requirements that may apply to receiving payments on or with respect to, acquiring, owning, or disposing of the shares or ADSs. Failure to comply with certain reporting obligations could result in the imposition of substantial penalties.
(vi) UK stamp duty and stamp duty reserve tax
No obligation to pay UK stamp duty will arise on the transfer on sale of an ADS, provided that any instrument of transfer is not executed in, and remains at all times outside, the UK. No UK stamp duty reserve tax is payable in respect of an agreement to transfer an ADS. For the UK stamp duty and stamp duty reserve tax implications of dealings in shares, see the section “Taxation of UK holders – (iv) Stamp duty and stamp duty reserve tax” above.
(vii) UK estate and gift tax
Under the Estate and Gift Tax Convention, a US holder generally is not subject to UK inheritance tax.
FATCA Risk Factor
In certain circumstances, shares or ADSs may be subject to US “passthru” withholding tax starting in 2019. The US has enacted rules, commonly referred to as ‘FATCA’, that generally impose a new reporting and withholding regime with respect to certain US source payments (including dividends and interest), gross proceeds from the disposition of property that can produce US source interest and dividends, and certain payments made by, and financial accounts held with, entities that are classified as financial institutions under FATCA. The US has entered into an intergovernmental agreement regarding the implementation of FATCA with the UK (the “UK IGA”). Under the UK IGA, as currently drafted, it is not expected that either Barclays PLC or the Bank will be required to withhold tax under FATCA on payments made with respect to the shares or ADSs. However, significant aspects of when and how FATCA will apply remain unclear, and no assurance can be given that withholding under FATCA will not become relevant with respect to payments
made on or with respect to the shares or ADS in the future. Investors should consult their own tax advisers regarding the potential impact of FATCA.
The Barclays Group has registered with the Internal Revenue Service (‘IRS’) for FATCA. The Global Intermediary Identification Number (GIIN) for the Bank in the United Kingdom is E1QAZN.00001.ME.826 and it is a Reporting Model 1 FFI. The GIINs for other parts of the Barclays Group or Barclays branches outside of the UK may be obtained from your usual Barclays contact on request. The IRS list of registered Foreign Financial Institutions is publicly available at https://apps.irs.gov/app/fatcaFfilist/flu.jsf.
Exchange controls and other limitations affecting security holders
Other than certain economic sanctions which may be in force from time to time, there are currently no UK laws, decrees or regulations which would affect the transfer of capital or remittance of dividends, interest and other payments to holders of Barclays securities who are not residents of the UK. There are also no restrictions under the Articles of Association of either Barclays PLC or Barclays Bank PLC, or (subject to the effect of any such economic sanctions) under current UK laws, which relate only tonon-residents of the UK, and which limit the right of suchnon-residents to hold Barclays securities or, when entitled to vote, to do so.
Documents on display
It is possible to read and copy documents that have been filed by Barclays PLC and Barclays Bank PLC with the US Securities and Exchange Commission at the US Securities and Exchange Commission’s office of Investor Education and Advocacy located at 100 F Street, NE Washington DC 20549. Please call the US Securities and Exchange Commission at1-800-SEC-0330 for further information on the public reference rooms and their copy charges. Filings with the US Securities and Exchange Commission are also available to the public from commercial document retrieval services, and from the website maintained by the US Securities and Exchange Commission at www.sec.gov.
| 326 | Barclays PLC and Barclays Bank PLC 2016 Annual Report on Form 20-F |
Additional shareholder information
Fees and Charges Payable by a Holder of ADSs
The ADR depositary collects fees for delivery and surrender of ADSs directly from investors depositing ordinary shares or surrendering ADSs for the purpose of withdrawal or from intermediaries acting for them.
The charges of the ADR depositary payable by investors are as follows:
| Type of Service | ADR Depositary Actions | Fee | ||
ADR depositary or substituting the underlying shares |
Issuance of ADSs against the deposit of ordinary shares, including deposits and issuances in respect of:
|
$5.00 or less per 100 ADSs (or portion thereof) evidenced by the new ADSs delivered
| ||
– Share distributions, stock splits, rights issues, mergers | ||||
– Exchange of securities or other transactions or event or other distribution affecting the ADSs or deposited securities
| ||||
Receiving or distributing cash dividends
|
Distribution of cash dividends |
$0.04 or less per ADS* | ||
Selling or exercising rights |
Distribution or sale of securities, the fee being in an amount equal to the fee for the execution and delivery of ADSs which would have been charged as a result of the deposit of such securities
|
$5.00 or less per each 100 ADSs (or portion thereof) | ||
Withdrawing an underlying ordinary share
|
Acceptance of ADSs surrendered for withdrawal of deposited ordinary shares
|
$5.00 or less for each 100 ADSs (or portion thereof) | ||
General depositary services, particularly those charged on an annual basis
|
Other services performed by the ADR depositary in administering the ADS program |
No fee currently payable | ||
Expenses of the ADR depositary |
Expenses incurred on behalf of Holders in connection with:
- Expenses of the ADR depositary in connection with the conversion of foreign currency into US dollars (which are paid out of such foreign currency) |
Expenses payable at the sole discretion of the ADR depositary by billing Holders or by deducting charges from one or more cash dividends or other cash distributions | ||
– Taxes and other governmental charges | ||||
– Cable, telex and facsimile transmission/delivery | ||||
– Transfer or registration fees, if applicable, for the registration of transfers or underlying ordinary shares | ||||
– Any other charge payable by ADR depositary or its agents
|
* The fee in relation to the distribution of cash dividends was $0.0064 per ADS in respect of dividends paid in the year ended 31 December 2016.
| Barclays PLC and Barclays Bank PLC 2016 Annual Report on Form 20-F | 327 |
Additional shareholder information
Fees and Payments made by the ADR depositary to Barclays
The ADR depositary has agreed to provide Barclays with an amount based on the cash dividend fee charged on each ADS during each twelve-month period running from August 11 of the relevant year to August 10 of the following year (a ‘Contract Year’) for expenses incurred by Barclays in connection with the ADS program (such amount being the ‘Contribution’ for the relevant Contract Year). The Contributions are paid to Barclays in two instalments each Contract Year, both of which are scheduled to be paid in the Barclays’ fiscal year in which the relevant Contract Year ends.
The table below sets out the Contribution for the 2015/2016 Contract Year and thus the total amount received in the year ended 31 December 2016:
Cash Dividend Fee Amount Collected during 2015/2016
Contract Year
|
Amount provided in Contributions from the ADR depositary
for the year ended 31 December 2016 | |||
US$0.0084 per ADS**
|
$1,500,000
| |||
Total
|
$1,500,000
|
** On 1 March 2016, Barclays announced its decision to pay dividends on a bi-annual rather than quarterly basis. As a result, the fees in relation to the 2015/16 Contract Year covering the September and December 2015 and April 2016 dividends amounted to $0.0084 per ADS.
Under certain circumstances, includingnon-routine corporate actions, removal of the ADR depositary or termination of the ADS program by Barclays, Barclays may be charged by the ADR depositary certain fees (including in connection with depositary services, certain expenses paid on behalf of Barclays, an administrative fee, fees fornon-routine services and corporate actions and any other reasonable fees/expenses incurred by the ADR depositary).
The ADR depositary has agreed to waive certain of its fees chargeable to Barclays with respect to standard costs associated with the administration of the ADS program.
| 328 | Barclays PLC and Barclays Bank PLC 2016 Annual Report on Form 20-F |
Additional Information
External auditor objectivity andindependence: Non-Audit Services
Our policy on the provision of services by the Group’s statutory Auditor (the ‘Policy’) sets out the circumstances in which the auditor may be permitted to undertakenon-audit work for the Group.
The Board Audit Committee oversees compliance with the Policy and considers and, if appropriate, approves requests to use the Auditor fornon-audit work. Allowable services arepre-approved up to but not including £100,000 or £25,000 in the case of certain taxation services. The Group Finance Director and the Company Secretary and their teams deal with day to day administration of the Policy, facilitating requests for approval.
Details of the services that are prohibited and allowed under the Policy are set out below:
Services that are prohibited include:
| – | Bookkeeping; |
| – | design and implementation of financial information systems; |
| – | design or implementation of internal controls or risk management services related to financial information |
| – | *appraisal or valuation services; |
| – | fairness opinions orcontribution-in-kind reports; |
| – | *actuarial services; |
| – | internal audit; |
| – | management and Human Resources functions; |
| – | broker or dealer, investment advisor or investment banking services; |
| – | legal, expert and certain *tax services or personal services to persons in a financial reporting role; and |
| – | transaction-related and restructuring services. |
*these may be permissible subject to compliance with certain requirements
Allowable services that the Board Audit Committee considers for approval include:
| – | statutory audit and audit related services and regulatorynon-audit services; |
| – | other attest and assurance services; |
| – | training, surveys and software; |
| – | risk management and controls advice; |
| – | transaction support; |
| – | taxation services; |
| – | business support and recoveries; and |
| – | translation services. |
| Barclays PLC and Barclays Bank PLC 2016 Annual Report on Form 20-F | 329 |
Additional information
NYSE Corporate Governance
NYSE Corporate Governance Statement
As our main listing is on the London Stock Exchange, we follow the UK Corporate Governance Code. However, as Barclays also has American Depositary Receipts listed on the New York Stock Exchange (NYSE), we are also subject to the NYSE’s Corporate Governance Rules (NYSE Rules). We are exempt from most of the NYSE Rules, which US domestic companies must follow, because we are anon-US company listed on the NYSE. However, we are required to provide an Annual Written Affirmation to the NYSE of our compliance with the applicable NYSE Rules and must also disclose any significant differences between our corporate governance practices and those followed by domestic US companies listed on the NYSE. Key differences between the Code and NYSE Rules are set out here:
Director Independence
NYSE Rules require the majority of the Board to be independent. The Code requires at least half of the Board (excluding the Chairman) to be independent. The NYSE Rules contain different tests from the Code for determining whether a Director is independent. We follow the Code’s recommendations as well as developing best practices among other UK public companies. The independence of ournon-executive Directors is reviewed by the Board on an annual basis and it takes into account the guidance in the Code and the criteria we have established for determining independence, which are described on page 37.
Board Committees
We have a Board Nominations Committee and a Board Remuneration Committee, both of which are broadly similar in purpose and constitution to the Committees required by the NYSE Rules and whose terms of reference comply with the Code’s requirements. The NYSE Rules state that both Committees must be composed entirely of independent Directors. As the Group Chairman was independent on appointment, the Code permits him to chair the Board Nominations Committee. Except for this appointment, both Committees are composed solely ofnon-executive Directors, whom the Board has determined to be independent. We comply with the NYSE Rules requirement that we have a Board Audit Committee comprised solely of independentnon-executive Directors. However, we follow the Code recommendations, rather than the NYSE Rules, regarding the responsibilities of the Board Audit Committee (except for applicable mandatory responsibilities under the Sarbanes-Oxley Act), although both are broadly comparable. Although the NYSE Rules state that the Board Audit Committee is to take responsibility for risk oversight, Barclays has additional Board Committees which address different areas of risk management. To enhance Board governance of risk, Barclays has two risk committees; the Board Risk Committee and the Board Reputation Committee. A full description of each Board Committee can be found in the governance section.
Corporate Governance Guidelines
The NYSE Rules require domestic US companies to adopt and disclose corporate governance guidelines. There is no equivalent recommendation in the Code but the Board Nominations Committee has developed corporate governance guidelines, ‘Corporate Governance in Barclays’, which have been approved and adopted by the Board.
Code of Ethics
The NYSE Rules require that domestic US companies adopt and disclose a code of business conduct and ethics for Directors, officers and employees.The Barclays Way was introduced in 2013; this is a Code of Conduct which outlines the Values and Behaviours which govern our way of working across our business globally.The Barclays Way has been adopted on a Group wide basis by all Directors, Officers and employees.The Barclays Way is available to view on the Barclays website at home.barclays/about-barclays/barclays-values.
Shareholder Approval of Equity-compensation Plans
The NYSE listing standards require that shareholders must be given the opportunity to vote on all equity-compensation plans and material revisions to those plans. We comply with UK requirements, which are similar to the NYSE standards. However, the Board does not explicitly take into consideration the NYSE’s detailed definition of what are considered ‘material revisions’.
| 330 | Barclays PLC and Barclays Bank PLC 2016 Annual Report on Form 20-F |
Additional information
Substantial shareholders
As at 20 February 2017 the Company had been notified under Rule 5 of the Disclosure and Transparency Rules of the UKLA of the following holdings of voting rights in its shares:
| 2016 | ||||||||||||||||
| Holder | | Number of Barclays Shares | | | % of total voting rights attached to issued share capitala | | | Number of warrants | | | % of total voting rights attached to issued share capitala | | ||||
| The Capital Group Companies Incb | 1,172,090,125 | 6.98 | - | - | ||||||||||||
| Qatar Holding LLCc | 1,017,455,690 | 5.99 | - | - | ||||||||||||
| BlackRock, Incd | 922,509,972 | 5.45 | - | - | ||||||||||||
a The percentage of voting rights detailed above were as calculated at the time of the relevant disclosures made in accordance with Rule 5 of the DTR.
b. The Capital Group Companies Inc (CG) holds its shares via CG Management companies and funds. Part of the CG holding is held as American Depositary Receipts.
c. Qatar Holding LLC is wholly-owned by Qatar Investment Authority.
d Total shown includes 3,860,531 contracts for difference to which voting rights are attached. Part of the holding is held as American Depositary receipts. On 19 January 2017, BlackRock, Inc. disclosed by way of a Schedule 13G filed with the SEC, beneficial ownership of 1,054,988,420 ordinary shares of the Company as of 31 December 2016, representing 6.2% of that class of shares.
On 23 January 2017 the Company was notified that Norges Bank now holds 508,175,594 Barclays shares, representing 2.996% of the total voting rights attached to the issued share capital. The relevant threshold for UK disclosure is 3%, so Norges Bank will make no further notifications to the Company unless they again exceed 3% of the total voting rights attached to the issued share capital.
As at 29 February 2016 the Company had been notified under Rule 5 of the Disclosure and Transparency Rules of the UKLA of the following holdings of voting rights in its shares:
| 2015 | ||||||||||||||||
| Holder | | Number of Barclays Shares | | | % of total voting rights attached to issued share capitala | | | Number of warrants | | | % of total voting rights attached to issued share capitala | | ||||
| Qatar Holding LLCb | 813,964,552 | 6.65 | - | - | ||||||||||||
| BlackRock, Incc | 822,938,075 | 5.02 | - | - | ||||||||||||
| The Capital Group Companies Incd | 1,172,090,125 | 6.98 | - | - | ||||||||||||
| Norges Bank | 506,870,056 | 3.02 | - | - | ||||||||||||
a The percentage of voting rights detailed above were as calculated at the time of the relevant disclosures made in accordance with Rule 5 of the DTR.
b Qatar Holding LLC is wholly-owned by Qatar Investment Authority.
c Total shown includes 1,408,618 contracts for difference to which voting rights are attached. On 25 January 2016, BlackRock, Inc. disclosed, by way of a Schedule 13G filed with the SEC, beneficial ownership of 1,109,026,156 ordinary shares of Barclays PLC as of 31 December 2015, representing 6.6% of that class of shares.
d The Capital Group Companies Inc (CG) holds its shares via CG Management companies and funds. Part of the CG holding is held as American Depositary Receipts (ADRs) with a ratio of 1 share to every 4 ADRs.
| Barclays PLC and Barclays Bank PLC 2016 Annual Report on Form 20-F | 331 |
Additional information
As at 27 February 2015 the Company had been notified under Rule 5 of the Disclosure and Transparency Rules of the UKLA of the following holdings of voting rights in its shares:
| 2014 | ||||||||||||||||
| Holder | | Number of Barclays Shares | | | % of total voting rights attached to issued share capitala | | | Number of warrants | | | % of total voting rights attached to issued share capital | | ||||
| Qatar Holding LLCb | 813,964,552 | 6.65 | - | - | ||||||||||||
| BlackRock, Incc | 822,938,075 | 5.02 | - | - | ||||||||||||
| The Capital Group Companies Incd | 861,142,569 | 5.22 | - | - | ||||||||||||
a The percentage of voting rights detailed above were as calculated at the time of the relevant disclosures made in accordance with Rule 5 of the DTR.
b Qatar Holding LLC is wholly-owned by Qatar Investment Authority.
c Total shown includes 1,408,618 contracts for difference to which voting rights are attached. On 12 January 2015 BlackRock, Inc disclosed, by way of a Schedule 13G filed with the SEC, beneficial ownership of 1,032,843,875 ordinary shares of Barclays PLC as of 31 December 2014, representing 6.3% of that class of shares.
d The Capital Group Companies Inc (CG) holds its shares via CG Management companies and funds. Part of the CG holding is held as American Depositary Receipts (ADRs) with a ratio of 1 share to every 4 ADRs.
Disclosure controls and procedures
The Chief Executive, James E Staley, and the Group Finance Director, Tushar Morzaria, conducted with Group Management an evaluation of the effectiveness of the design and operation of the Group’s disclosure controls and procedures of each of Barclays PLC and Barclays Bank PLC as at 31 December 2016, which are defined as those controls and procedures designed to ensure that information required to be disclosed in reports filed or submitted under the US Securities Exchange Act of 1934 is recorded, processed, summarised and reported within the time periods specified in the US Securities and Exchange Commission’s rules and forms. As of the date of the evaluation, the Chief Executive and Group Finance Director concluded that the design and operation of these disclosure controls and procedures were effective.
Board of Directors
John McFarlane, Chairman
John McFarlane is a senior figure in global banking and financial services circles and is in his 42nd year in the sector (including 22 years as a main-board director, 10 years as CEO and six years as chairman). John is Chairman of Barclays PLC and Barclays Bank PLC. He is also anon-executive director of Westfield Corporation and Old Oak Holdings Limited. He is chairman of TheCityUK and a member of the Financial Services Trade and Investment Board and the European Financial Roundtable. John was formerly chairman of Aviva plc, where he oversaw a transformation of the company and for a brief period he was also chairman of FirstGroup plc. He was also anon-executive director of the Royal Bank of Scotland plc, joining at the time of the UK government rescue. Prior to that, for 10 years he was Chief Executive officer of Australia and New Zealand Banking Group Ltd, Group Executive Director of Standard Chartered plc and head of Citibank in the UK.
Jes Staley, Chief Executive, Executive Director
Jes Staley joined Barclays as Group Chief Executive on 1 December 2015. Jes has nearly four decades of extensive experience in banking and financial services. He worked for more than 30 years at JP Morgan, initially training as a commercial banker, and later advancing to the leadership of major businesses involving equities, private banking and asset management, and ultimately heading the company’s Global Investment Bank. Most recently, Jes served as Managing Partner at BlueMountain Capital.
Sir Gerry Grimstone, Deputy Chairman and Senior Independent Director, Non-executive Director
Sir Gerry Grimstone is Deputy Chairman and Senior Independent Director of Barclays and chairs the Board Reputation Committee. He is also chairman of Standard Life plc, one of the UK’s largest savings and investments businesses. He is an independentnon-executive board member of Deloitte LLP where he represents the public interest. Within the UK public sector, he is the leadnon-executive on the board of the Ministry of Defence and is a member of HM Treasury’s Financial Services Trade and Investment Board. From 2012-2015, Gerry served as the chairman of TheCityUK, the representative body for the financial and professional services industry in the UK. Gerry has held a number of board appointments in the public and private sectors and has served as one of the UK’s Business Ambassadors. He was previously a senior investment banker at Schroders and ran businesses in London, New York and Asia Pacific. He specialised in mergers and acquisitions and capital-raising for major companies worldwide. Prior to that, he was an official in HM Treasury where he was responsible for privatisation and policy towards state-owned enterprises.
Mike Ashley,Non-executive Director
Mike joined the Board as anon-executive Director in September 2013. He was formerly head of quality and risk management for KPMG Europe LLP (ELLP), which forms part of the KPMG global network, where his responsibilities included the management of professional risks and quality control.
| 332 | Barclays PLC and Barclays Bank PLC 2016 Annual Report on Form 20-F |
Additional information
He was a member of the ELLP Board and was also KPMG UK’s designated Ethics Partner. Mike has over 20 years’ experience as an audit partner, during which he was the lead audit partner for several large financial services groups, most recently HSBC Holdings PLC and Standard Chartered PLC, and also for the Bank of England. Mike has an in depth understanding of auditing and the associated regulatory issues, with specific experience of large, global banks. Mike’s other current principal external appointments are Institute of Chartered Accountants in England and Wales’ Ethics Standards Committee (member), Charity Commission (board member), Government Internal Audit Agency (chairman) and International Ethics Standards Board for Accountants (member).
Tim Breedon,Non-executive Director
Tim was appointed to the Board as anon-executive Director in November 2012. Tim held a number of roles at Legal & General Group plc (L&G) before joining its board as Group Director (Investments) and becoming Group Chief Executive, a position he held from January 2006 to June 2012. Tim was a director of the Association of British Insurers (ABI), and also served as its chairman. He was also chairman of the UK Government’snon-bank lending taskforce, anindustry-led taskforce that looked at the structural and behavioural barriers to the development of alternative debt markets in the UK. Tim was a director of the Financial Reporting Council and was on the board of the Investment Management Association. Tim has over 25 years of experience in financial services and has extensive knowledge and experience of regulatory and government relationships. He brings to the Board the experience and knowledge of leading a financial services company, combined with an understanding of the UK and EU regulatory environment and risk management. His customer focus and understanding of investor issues, gained both at L&G and the ABI, is of particular relevance to Barclays.Tim’s other current principal external appointments are as chairman of Apax Global Alpha Limited and chairman of The Northview Group.
Mary Francis, CBE,Non-executive Director
Mary Francis CBE was appointed to the Board as anon-executive Director in October 2016. Mary has extensive board-level experience across a range of industries and is currently serving on the boards of Swiss Re Group and Ensco plc. She has previously served as Senior Independent Director on the board of Centrica and as anon-executive director of Aviva, Cable & Wireless Communications, the Bank of England and Alliance & Leicester. In her executive career, Mary was a senior civil servant in HM Treasury for twelve years, before serving as Private Secretary to the Prime Minister, Deputy Private Secretary to the Queen and as Director General of the Association of British Insurers.
Crawford Gillies,Non-executive Director
Crawford joined the Board as anon-executive Director in May 2014. Crawford has over three decades of business and management experience, initially with Bain & Company, a firm of international management consultants, where he was managing director Europe from 2001 to 2005. While at Bain he worked with major companies in the UK, Continental Europe and North America across multiple sectors. From 2007-2016 Crawford was on the board of Standard Life plc, where he has chaired the remuneration committee. He was chairman of the law firm Hammonds, now Squire Sanders (2006 - 2009), has chaired Control Risks International since 2007 and chaired Touch Bionics (2006 - 2011), an innovative medical device company. Crawford was also on the board of MITIE Group PLC from 2012 to July 2015. He has also held public sector posts in England and Scotland. He was an independent member of the Department of Trade and Industry(2002 - 2007) and chaired its Audit and Risk Committee (2003 - 2007). He is former chairman of Scottish Enterprise and of the Confederation of British Industry in London. Crawford’s other current principal external appointments are as anon-executive director of SSE plc and The Edrington Group Limited.
Reuben Jeffery III,Non-executive Director
Reuben joined the Board in July 2009 as anon-executive Director. He is currently CEO, president and a director of Rockefeller & Co Inc. and Rockefeller Financial Services Inc. Reuben served in the US government as under secretary of State for Economic, Energy and Agricultural Affairs, as chairman of the Commodity Futures Trading Commission and as a special assistant to the President on the staff of the National Security Council. Before his government service, Reuben spent 18 years at Goldman, Sachs & Co where he was managing partner of Goldman Sachs in Paris and led the firm’s European financial institutions group in London. Prior to joining Goldman Sachs, Reuben was a corporate attorney with Davis Polk & Wardwell. Reuben has a broad range of financial services experience, particularly investment banking, and in addition brings extensive insight into the US political and regulatory environment. Reuben’s other current principal external appointments are Advisory Board of Towerbrook Capital Partners LP (member), Financial Services Volunteer Corps (director), Advisory Board of J. Rothschild Capital Management Limited (member) and The Asia Foundation (trustee).
Tushar Morzaria, Group Finance Director, Executive Director
Tushar joined the Board and Group Executive Committee of Barclays in October 2013 as Group Finance Director. Prior to this, he was CFO, corporate and investment bank at JP Morgan, a role he held on the merger of the investment bank and the wholesale treasury/security services business at JP Morgan. Prior to the merger, he was CFO of the investment bank and held other various roles during his career at JP Morgan. Tushar qualified as an accountant at Coopers and Lybrand Deloitte and for most of his career he has worked in investment banking, having held various roles at SG Warburg, JP Morgan and Credit Suisse. Tushar has over 20 years of strategic financial management experience, which prove invaluable in his role as Group Finance Director.
Dambisa Moyo,Non-executive Director
Dambisa joined the Board in May 2010 as anon-executive Director. She is an international economist and commentator on the global economy, with a background in financial services. After completing a PhD in Economics, she worked for Goldman Sachs in the debt capital markets, hedge funds coverage and global macroeconomics teams. Dambisa has also worked for the World Bank and formerly served as anon-executive director of Lundin Petroleum AB (publ) and SABMiller PLC. Dambisa’s background as an economist, in particular her knowledge and understanding of global macroeconomic issues and African economic, political and social issues, provides an important contribution to the Board’s discussion of Barclays’ business and citizenship strategy. Dambisa’s other current principal external appointments are asnon-executive director of Barrick Gold Corporation and Seagate Technology plc and Chevron Corporation.
| Barclays PLC and Barclays Bank PLC 2016 Annual Report on Form 20-F | 333 |
Additional information
Diane de Saint Victor,Non-executive Director
Diane was appointed as anon-executive Director in March 2013. She is currently general counsel and company secretary and a member of the group executive committee of ABB Limited, a pioneering technology leader in electrification products, robotics and motion, industrial automation and power grids. The company is headquartered in Switzerland. She is a member of the board of directors of the American Chamber of Commerce in France. At ABB her responsibilities include Head of Legal and Integrity Group. She was formerly senior vice president and general counsel of The Airbus Group, formerly EADS Group, the European aerospace and defence company. Diane’s legal experience and her knowledge of regulatory and compliance matters allows her to provide a unique perspective to the Board and its Committees.
Diane Schueneman,Non-executive Director
Diane was appointed to the Board as anon-executive Director in June 2015. Diane has extensive experience in managing global, cross-discipline business operations, client services and technology in the financial services industry. She spent 37 years with Merrill Lynch and held senior roles with responsibility for banking, brokerage services and technology provided to the company’s retail and middle market clients, and latterly for IT, operations and client services worldwide as senior vice president & head of global infrastructure solutions. As a consultant at McKinsey & Company she advised the IRS Commissioner in the US and has held a number ofnon-executive directorships.
Steve Thieke,Non-executive Director
Steve was appointed to the Board as anon-executive Director in January 2014. He has four decades of experience in financial services, both in regulation and investment banking. Steve worked for the Federal Reserve Bank of New York for 20 years, where he held several senior positions in credit and capital market operations and banking supervision and later he became anon-executive director at the FSA. He has also held senior roles in investment banking and risk management with JP Morgan, where he spent ten years. He was head of the fixed income division,co-head of global markets, president and chairman of JP Morgan Securities, Inc. and head of the corporate risk management group, retiring from JP Morgan in 1999. He has significant board level experience, both in executive andnon-executive roles, including spending seven years as a director of Risk Metrics Group, where latterly he served as chairman of the board, and nine years on the board of PNC Financial Services Group, Corp.
Group Executive Committee
Jes Staley, Group Chief Executive, Executive Director
See above for full biography.
Tushar Morzaria, Group Finance Director, Executive Director
See above for full biography.
Paul Compton, Group Chief Operating Officer
Paul joined Barclays as Group Chief Operating Officer in May 2016. In this role, Paul is responsible for leading the global Operations & Technology functions, driving the implementation of the structural reform and cost transformation programmes, and for the delivery of other major bank-wide projects. Prior to joining Barclays, Paul was the Chief Administrative Officer of JPMorgan Chase, and was accountable for overseeing global technology, operations, real estate and general services. Before being appointed in this role in 2013, Paul served asCo-Chief Administrative Officer for the Corporate & Investment Bank, Deputy Head of Operations for JPMorgan Chase, and head of the JPMorgan Chase Global Service Centre in India. Paul started his career at JPMorgan in 1997, and first led the overhaul of the wholesale bank’s credit risk infrastructure, before taking on the role as Chief Financial Officer for the Investment Bank. Previous to JP Morgan, Paul spent 10 years as Principal at Ernst & Young in the Brisbane and New York offices. He has previously been a
| 334 | Barclays PLC and Barclays Bank PLC 2016 Annual Report on Form 20-F |
Additional information
member of the Board of Directors of the Depository Trust and Clearing Corporation (DTCC) American Australian Association and the American Red Cross of Greater New York.
Bob Hoyt, Group General Counsel
Bob joined Barclays in October 2013 and is responsible for all legal and regulatory matters across Barclays as Group General Counsel. Previously, Bob was at PNC Financial Services Group, where he was General Counsel and Chief Regulatory Affairs Officer, having previously served as Deputy General Counsel since 2009. Between 2006 and 2009, Bob served as General Counsel of the US Department of the Treasury, where he was the Chief Legal Officer of the department and a senior policy advisor to Secretary Henry M. Paulson, Jr. Prior to that Bob served at the White House where he was Special Assistant and Associate Counsel to President George W. Bush. Earlier in his career, Bob was a partner in the Securities, Litigation and Corporate departments of the law firm of Wilmer Cutler Pickering Hale and Dorr (WilmerHale).
Tristram Roberts, Group Human Resources Director
Tristram is the Group Human Resources Director. Tristram joined Barclays in July 2013 as HR Director for the Investment Bank. His remit was expanded in May 2014 to include HR responsibilities for BarclaysNon-Core, and became the Group HR Director in December 2015. Prior to Barclays, Tristram was Head of Human Resources for Global Functions and Operations & Technology at HSBC Holdings PLC, as well as group head of performance and reward. Previously, he was group reward and policy director for Vodafone Group Plc. Tristram began his career in consulting. He became a partner with Arthur Andersen in 2001 and was subsequently a partner with both Deloitte and KPMG.
Michael Roemer, Group Head of Compliance
Mike joined Barclays in January 2011 as the Head of Internal Audit. Mike joined Barclays from CIT Group where he was the chief auditor, reporting directly to the board audit committee and having global responsibility for CIT Group’s internal audit function.Mike has 27 years’ experience in internal audit, with 23 years of that time spent at JP Morgan. Mike currently serves on the advisory board of theMake-A-Wish Foundation of Metro New York where he is audit committee chair. He also serves on the board of Ronald McDonald House of New York, Inc. where he is also audit committee chair. In 2016, the LGBT Agenda (Lesbian, Gay, Bisexual and Transgender) announced Mike’s appointment as the new ExCo sponsor.
Amer Sajed, CEO, Barclaycard International
Amer Sajed was appointed Chief Executive Officer for Barclaycard, the global consumer payments business of the Barclays Banking Group, in May 2015. Barclaycard is a leading payments company with more than 15,000 employees, £40bn in net loans and advances and 28m customers and clients. In 2015, Barclaycard enabled payments globally with a value of more than £293bn and contributed 30% of Barclays’ PBT. Prior to his appointment as CEO for Barclaycard Amer served as Chief Executive Officer for Barclaycard US, the payments arm of Barclays in the United States. During his five years leading the US business it doubled in size to rank as one of the top ten credit card companies locally. Amer joined Barclaycard in August of 2006. Before assuming the US post, he was Chief Executive Officer for UK Cards. From 2010 to 2012, Amer also oversaw Barclays’ South African cards issuing and acquiring businesses. Before coming to Barclaycard, Amer worked at Citigroup for 20 years in various roles – most recently overseeing the travel and affluent segment. Previously, he served in senior finance roles. Amer served on the Board of Visa Europe from July 2015 to June 2016.
Tim Throsby, President, Barclays International and Chief Executive Officer, Corporate and Investment Bank
Tim Throsby is President of Barclays International and Chief Executive Officer of the Corporate and Investment Bank at Barclays. Based in London, he is a member of the Group Executive Committee. Prior to joining Barclays in January 2017, Tim worked for JP Morgan where he held a variety of senior management roles, most recently serving as Global Head of Equities. Tim has had an extensive career in banking and asset management, working initially for Credit Suisse and Macquarie, before joining Goldman Sachs in 1995 as a Managing Director andCo-Head of Equity Derivatives for Asia. In 2002, he joined Lehman Brothers to lead the Asia Equities Division, before relocating to New York in 2004 to run the global Equity Derivatives business as well as risk arbitrage. In
| Barclays PLC and Barclays Bank PLC 2016 Annual Report on Form 20-F | 335 |
Additional information
2005, he became President of Citadel Asia where he oversaw the investment firm’s Asia business. He serves on the board of Human Dignity Trust, and is a school governor at the Ark Oval Primary Academy.
CS Venkatakrishnan, Chief Risk Officer
Venkat joined as Chief Risk Officer in March 2016. Venkat is responsible for helping to define, set and manage the risk profile of Barclays. He has over 20 years of financial market and risk management expertise. Venkat worked at JP Morganfrom 1994, most recently as Head of Model Risk and Development and Operational Risk. Prior to this, he worked in fixed income structuring at the JP Morgan Investment Bank. This followed upon 14 years in JP Morgan Asset Management where he held senior positions in the Global Fixed Income business.
Ashok Vaswani, CEO, Barclays UK
Ashok joined Barclays in 2010, managing the credit card business across the UK, Europe and the Nordics, becoming chairman of Entercard. He went on to manage Barclays in Africa, Barclays Retail Business Bank globally and Barclays Personal and Corporate Banking. Ashok represents Barclays as aNon-Executive director on the Board of Barclays Africa Group Limited and is a member of the Board of Directors of Telenor ASA and a member of the Trustee Board at Citizens Advice. He also sits on the advisory boards of a number of institutions such as Rutberg & Co and is Founder Director ofLend-a-Hand, anon-profit organisation focused on rural education in India. Ashok has previously served on the advisory boards of SP Jain Institute of Management, Insead Singapore and Visa Asia Pacific. Prior to Barclays, Ashok was a partner with a J P Morgan Chase funded private equity firm - Brysam Global Partners, which focused on building retail financial service businesses in emerging markets. Ashok also spent 20 years with Citigroup where his last position was as CEO, Asia Pacific. He was also a member of the Citigroup Operating Committee, the Citigroup Management Committee and the Global Consumer Planning Group.
| 336 | Barclays PLC and Barclays Bank PLC 2016 Annual Report on Form 20-F |
Additional information
Section 13(r) to the US Securities Exchange Act of 1934 (Iran sanctions and related disclosure)
Section 13(r) of the US Securities Exchange Act of 1934, as amended (the ‘Exchange Act’) requires each SEC reporting issuer to disclose in its annual and, if applicable, quarterly reports whether it or any of its affiliates have knowingly engaged in certain activities, transactions or dealings relating to Iran or with the Government of Iran or certain designated natural persons or entities involved in terrorism or the proliferation of weapons of mass destruction during the period covered by the report. The requirement includes disclosure of activities not prohibited by US or other law even if conducted outside the US bynon-US companies or affiliates in compliance with local law. Pursuant to Section 13(r) of the Exchange Act we note the following in relation to activity occurring in 2016, the period covered by this annual report, or in relation to activity we became aware of in 2016 relating to disclosable activity prior to the reporting period. Barclays earned total revenue of less than £30,000 in 2016 from the activities disclosed below.
Legacy guarantees
Barclays entered into several guarantees for the benefit of Iranian banks between 1993 and 2006 in connection with the supply of goods and services by Barclays’ customers to Iranian buyers. These were counter guarantees issued to the Iranian banks to support guarantees issued by these banks to the Iranian buyers. The Iranian banks and a number of the Iranian buyers were then designated as Specially Designated Nationals (“SDNs”) by the U.S. Treasury Department’s Office of Foreign Assets Control (“OFAC”). In addition, Barclays entered into similar guarantees between 1993 and 2005 for the benefit of a Syrian bank that is now an SDN. Some of the underlying buyers related to the Syrian guarantees have also been designated as SDNs.
The guarantees have been issued either on:
| (i) | an “extend or pay” basis, which means that, although the guarantee is of limited duration on its face, until there is full performance under the contract to provide goods and services, the terms of the guarantee require Barclays to either maintain the guarantee or pay the beneficiary bank the full amount of the guarantee, or |
| (ii) | the basis that Barclays obligations can only be discharged with the consent of the beneficiary counter party. |
Barclays is not able to exit its obligations under the guarantees unilaterally, and thus maintains a limited legacy portfolio of these guarantees. The guarantees were in compliance with applicable laws and regulations at the time at which they were entered into. Revenue in the amount of less than £11,000 was received in the year ended 31 December 2016.
Since the implementation of the Joint Comprehensive Plan of Action (“JCPOA”) on 16 January 2016, Barclays has terminated a number of these Iran-related legacy guarantees and intends to terminate the remainder where agreement can be reached with the counterparty, in accordance with applicable law. All payments made in connection with termination of the guarantees have been made in compliance with applicable laws and regulations.
Lease payments
Barclays is party to a long-term lease, entered into in 1979, with the National Iranian Oil Company (“NIOC”), pursuant to which Barclays rents part of NIOC House in London to house a Barclays bank branch. NIOC is the custodian trustee for the NIOC Pension Fund. The lease is for 60 years, contains no early termination clause and has 23 years remaining. Barclays makes quarterly lease payments to Naft Trading and Technology Ltd, a wholly-owned subsidiary of the NIOC Pension Fund in respect of this lease. NIOC is wholly owned by the Iranian Government and was an SDN until it was delisted by OFAC and EU in January 2016 following implementation of sanctions relief under the Joint Comprehensive Plan of Action (JCPOA) with Iran. In December 2012, NIOC Pension Fund was sanctioned in the UK, by HM Treasury. As a result of the listing, lease payments were made to a frozen account at Turkiye Is Bankasi in line with UK regulations. However, in 2014, Turkiye Is Bankasi refused to accept any further payments into the frozen account, preventing Barclays from making further lease payments. Barclays accrued the ongoing rental payments on its books until November 2016, when Turkiye Is Bankasi confirmed they would accept payments again into the frozen
| Barclays PLC and Barclays Bank PLC 2016 Annual Report on Form 20-F | 337 |
Additional information
account. At this time the accrued lease payments were made and quarterly lease payments have restarted. Sanctions on NIOC Pension Fund were lifted on 18 January 2017. Barclays attributed no revenue in 2016 in relation to this activity.
Local Clearing System
Banks in the United Arab Emirates (“UAE”), including certain of the Iranian banks that are or were SDNs, participate in the various banking payment and settlement systems used in the UAE (the “UAE Clearing Systems”). Barclays, by virtue of its banking activities in the UAE, participates in the UAE Clearing Systems, and its participation in the UAE Clearing Systems is in compliance with applicable laws and regulations. However, in order to help mitigate the risk of participating in transactions in which participant Iranian SDN banks may be involved, Barclays has implemented restrictions relating to its participation in the UAE Image Cheque Clearance System (ICCS), the UAE Funds Transfer System (FTS), the Direct Debit System (DDS) Automated Teller Machine (ATM) / Cheque Deposit Machine (CDM) activity as well as restricting activity via the Wages Protection Scheme (WPS). Barclays attributed no revenue in 2016 from the SDN banks in relation to its participation in the UAE Clearing Systems.
Commercial Mortgage
On 24 May 2013, a Barclays customer and its director were designated by OFAC under theNon-Proliferation of Weapons of Mass Destruction (“NPWMD”) regime. Both the customer and the director werede-listed inmid-January 2016 as a result of the implementation of the JCPOA. The customer continues to hold a commercial mortgage with Barclays. The terms and conditions of the commercial mortgage do not allow for an early exit and Barclays is legally required to maintain the loan until the maturity date or until the customer defaults on payments. Repayments of the mortgage by the customer are being made in accordance with applicable laws and regulations. Revenues earned by Barclays throughout 2016 were less than £18,000.
New OFAC Designees
On 31 March 2016, a Barclays retail customer was designated under the Specially Designated Global Terrorist (“SDGT”) regime by OFAC. The customer’s GBP account was opened in 2000, subsequently became dormant, and was closed in July 2003. Upon designation, the account balance was moved to an internal dormant account preventing funds from being paid outside of Barclays. No revenue was earned from the relationship in 2016.
In March 2016, a company which was a Barclays retail customer was designated under the Specially Designated Global Terrorist (“SDGT”) regime by OFAC, in addition to the company director and one of the company officials who also had accounts with Barclays. The accounts were closed wherever possible with the remaining balances being moved to a sundry account in accordance with applicable laws. One GBP credit card remains open but blocked to prevent spending. Repayments by the customer are being made in accordance with applicable laws and regulations. Barclays earned less than £850 in revenue from the three relationships in 2016.
Payments notified
Barclays Zimbabwe held an account for a relief, rescue, and medical aid organisation owned and controlled from within Iran and funded by the Government of Iran. The account was opened for the purpose of providingfree-of-charge medical services via a voluntary medical centre established through a memorandum of understanding (MOU) between the Government of Zimbabwe and the organisation. Neither the organisation nor its officials are designated by OFAC. The relationship was exited at the customer’s request on 30 June 2016. Barclays earned less than £150 in revenue throughout its relationship with the customer.
Barclays UK holds an account for aUK-based humanitarian organisation, which opened its office in Democratic People’s Republic of Korea in 2003 and implemented a small project. Barclays has processednon-USD payments to fund the office in North Korea and the projects that are run out of the office, which work to improve the lives of children in North Korea. The beneficiary bank is listed under the NPWMD regime. Barclays earned £70 in revenue from the activity.
Barclays holds a relationship with HMRC, a government agency which received funds from an OFAC SDN on the SDGT list in relation to the settlement of tax liabilities with the UK Government. The payment was received by Barclays and credited to the HMRC account. The payment activity was covered by licenses issued by OFAC and HM Treasury. Barclays earned £40 in revenue from the activity.
Barclays processed a payment of £106.13 from a UK resident customer, which was ultimately remitted to the Iranian Embassy in Russia. The funds relating to the original transaction were settled by anon-Barclays related merchant acquirer, which was subsequently reimbursed by Barclays. No direct monies were paid to the Iranian Government by Barclays. Revenues earned by Barclays in 2016 were negligible.
| 338 | Barclays PLC and Barclays Bank PLC 2016 Annual Report on Form 20-F |
Additional Information
Summary of Barclays Group share and cash plans and long-term incentive plans
Barclays operates a number of share, cash and long-term incentive plans. The principal plans used for awards made in or, in respect of, the 2016 performance year are shown in the table below. Awards are granted by the Board Remuneration Committee, and are subject to the applicable plan rules. Barclays has a number of employee benefit trusts which operate with these plans. In some cases the trustee purchases shares in the market to satisfy awards; in others, new issue or treasury shares may be used to satisfy awards where the appropriate shareholder approval has been obtained. Maria Ramos, Chief Executive of Barclays Africa Group Limited, also participates in share and cash plans and long-term incentive plans of Barclays Africa Group Limited.
Summary of principal share and cash plans and long-term incentive plans
| ||||||||
Name of plan
| Eligible employees
|
Executive Directors eligible
| Delivery
| Design details
| ||||
Deferred Share Value Plan (DSVP) |
All employees (excluding Directors) |
No |
Deferred share bonus typically released in annual instalments over a three, five or seven year period, dependent on future service and subject to malus provisions |
– Plan typically used for mandatory deferral of a proportion of bonus into Barclays shares where bonus is above a threshold (set annually by the Committee)
– This plan typically works in tandem with the CVP
– Deferred share bonus vests over three, five or seven years in equal annual instalments dependent on future service
– Vesting is subject to malus, and suspension provisions and the other provisions of the rules of the plan
– Dividend equivalents may be released based on the number of shares under award that are released
– On cessation of employment, eligible leavers normally remain eligible for release (on the scheduled release dates) subject to the Committee and/or trustee discretion. For other leavers, awards will normally lapse
– On change of control, awards may vest at the Committee’s and/or trustee’s discretion
– For SVP awards made in respect of 2016 to Material Risk Takers (“MRTs”), a holding period of 6 months will apply to shares (after tax) on release
| ||||
| Barclays PLC and Barclays Bank PLC 2016 Annual Report on Form 20-F | 339 |
Additional information
Share Value Plan (SVP) |
All employees (including executive Directors) |
Yes |
Deferred share bonus typically released in annual instalments over a three, five or seven year period, dependent on future service and subject to malus provisions |
– The SVP is in all material respects the same as the DSVP described above. The principle differences are that executive Directors may only participate in the SVP and under the DSVP, if a MRT whose award is deferred over five or seven years resigns after the third anniversary of grant, they will be treated as an eligible leaver in respect of any unvested tranches of that award.
| ||||
Cash Value Plan (CVP) |
All employees (excludingDirectors) |
No |
Deferred cash bonus paid in annual instalments over a three, five or seven year period, dependent on future service and subject to malus provisions |
– Plan typically used for mandatory deferral of a proportion of bonus where bonus is above a threshold (set annually by the Committee)
– This plan typically works in tandem with the DSVP
– Deferred cash bonus vests over three years in equal annual instalments dependent on future service
– Vesting is subject to malus, suspension provisions and the other provisions of the rules of the plan
– Participants may be awarded a service credit of 10% of the initial value of the award on the third anniversary of a grant
– Change of control and leaver provisions are as for SVP
| ||||
Barclays LTIP |
Selected employees (including executive Directors) |
Yes |
Awards over Barclays shares or over other capital instruments, subject to risk-adjusted performance conditions and malus provisions |
– Awarded on a discretionary basis with participation reviewed by the Committee
– Awards only vest if the risk-adjusted performance conditions are satisfied over a three year period
– Vesting is subject to malus, suspension provisions and the other provisions of the rules of the plan
– Any Barclays shares released under the Barclays LTIP award (after payment of tax) will be subject to an additional holder period of no less than the minimum regulatory requirements (currently 6 months). | ||||
– On cessation of employment, eligible leavers normally remain eligible for release (on the scheduled release dates)pro-rated for time and performance. For other leavers, awards will normally lapse
– On change of control, awards may vest at the Committee’s discretion
|
| 340 | Barclays PLC and Barclays Bank PLC 2016 Annual Report on Form 20-F |
Additional information
| Sharesave | All employees in the UK and Ireland | Yes | Options over Barclays shares at a discount of 20%, with shares or cash value of savings delivered after three to five years | – HMRC tax advantaged plan in the UK and approved by the Revenue Commissioners in Ireland
– Opportunity to purchase Barclays shares at a discount price (currently a 20% discount) set on award date with savings made over three, five or seven year term
– Maximum individual savings of £250 per month (€315 in Ireland)
– On cessation of employment, eligible leavers may exercise options and acquire shares to the extent of their savings for six months
– On change of control, participants may exercise options and acquire shares to the extent of their savings for six months
–
| ||||
Sharepurchase |
All employees in the UK |
Yes |
Barclays shares and dividend/matching shares held in trust for three to five years |
– HMRC tax advantaged plan
– Participants may purchase up to £1,800 of Barclays shares each tax year
– Barclays matches the first £600 of shares purchased by employees on a one for one basis for each tax year
– Dividends received are awarded as additional shares
| ||||
– Purchased shares may be withdrawn at any time (though if removed prior to three years from award, the corresponding matching shares are forfeited).
– On cessation of employment, participants must withdraw shares
– Depending on reason for and timing of leaving, matching shares may be forfeited
– On change of control, participants are able to instruct the Sharepurchase trustee how to act or vote on their behalf | ||||||||
Global Sharepurchase |
Employees in certainnon-UK jurisdictions |
Yes |
Barclays shares and dividend/matching shares held in trust for three to five years |
– Global Sharepurchase is an extension of the Sharepurchase plan offered in the UK
– Operates in substantially the same way as Sharepurchase (see above)
|
| Barclays PLC and Barclays Bank PLC 2016 Annual Report on Form 20-F | 341 |
Barclays’ approach to managing risks
Contents
Barclays’ approach to managing risks
| ||
| Page | ||
| Risk management strategy, governance and risk culture | 343 | |
| Management of credit risk and the internal ratings-based approach | 352 | |
| Management of credit risk mitigation techniques and counterparty credit risk | 368 | |
| Management of market risk | 372 | |
| Management of securitisation exposures | 380 | |
| Management of Treasury and Capital Risk | 384 | |
| Management of operational risk | 392 | |
| Management of model risk | 396 | |
| Management of conduct risk | 398 | |
| Management of reputation risk | 400 | |
| Management of legal risk | 402 |

| 342 | Barclays PLC and Barclays Bank PLC 2016 Annual Report on Form 20-F |
Barclays’ approach to managing risks
Risk management strategy, governance and risk culture
In this section we describe the approaches and strategies for managing risks at Barclays. It contains information on how risk management functions are organised, how they ensure their independence and foster a sound risk culture throughout the organisation.
§ A discussion of how our risk management strategy is designed to foster a strong risk culture is contained on pages 347 to 348
§ A governance structure, encompassing the organisation of the function as well as executive and Board committees, supports the continued application of the Enterprise Risk Management Framework (ERMF). This is discussed in pages 345 to 346
§ The ERMF sets out the tools, techniques and organisational arrangements to ensure all material risks are identified and understood (see page 344)
§ Pages 348 to 351 describe group-wide risk management tools that support risk management, ExCo and the Board in discharging their responsibilities, and how they are applied in the strategic planning cycle.
|

| Barclays PLC and Barclays Bank PLC 2016 Annual Report on Form 20-F | 343 |
Barclays’ approach to managing risks
Risk management strategy, governance and risk culture
Introduction
Barclays engages in activities which entail risk taking, every day, throughout its business. This section introduces these risks, and outlines key governance arrangements for managing them. These include roles and responsibilities, frameworks, policies and standards, assurance and lessons learned processes. The Group’s approach to fostering a strong Risk Culture is also described.
Enterprise Risk Management Framework (ERMF)
The Group has clear risk management objectives and a strategy to deliver them through core risk management processes. The ERMF sets the strategic direction by defining clear standards, objectives and responsibilities for all areas of Barclays. It supports the CEO and CRO in embedding effective risk management and a strong Risk Culture.
The ERMF sets out:
| § | Principal Risks faced by the group |
| § | Risk Appetite requirements |
| § | Roles and responsibilities for risk management |
| § | Risk Committee structure. |
A revised ERMF was approved by the Board in December 2016. This includes a revised risk taxonomy comprising eight Principal Risks. Credit, market, funding, operational and conduct Risk have been aligned to this new taxonomy and the management of these risks has not materially changed. Model Risk, Reputation Risk and Legal Risk are newly classified as Principal Risks in the latest version of the ERMF, reflecting the heightened importance of these risk types in the current environment. In 2016, Model Risk was managed in accordance with dedicated policies linked to the ERMF. These policies supplemented the key risk control frameworks underlying the financial risk types and applied to all businesses and functions in which financial risks were incurred or managed. Reputation Risk was considered as part of Conduct Risk and Legal Risk was included as asub-risk type under Operational Risk. In this Annual Report, the Risk Management sections (page 344 to 403) follows the new Principal Risk taxonomy of eight risks, reflecting our current approach to risk management. The Risk Performance sections follow the Principal Risk taxonomy (of five risks) which prevailed during 2016. Information on Reputation Risk Performance in 2016 is included as part of the Conduct Risk section (page 180), information on Legal Risk performance in 2016 can be found in the Material existing and emerging risks section (page 88), the Supervision and regulation section (page 182) and Note 29 to the Financial Statements (page 272). The definition of the Three Lines of Defence and associated responsibilities were also revised. The ERMF also contains a revised governance structure, including new Group and Business Risk committees, with representation from the First and Second Lines of Defence.
Principal Risks
The ERMF identifies Principal Risks and sets out responsibilities and risk management standards. Note that Legal, Reputation and Model risks are Principal Risks from January 2017 following Board approval in December 2016.
Financial Principal Risks:
| § | Credit risk: The risk of loss to the firm from the failure of clients, customers or counterparties, including sovereigns, to fully honour their obligations to the firm, including the whole and timely payment of principal, interest, collateral and other receivables |
| § | Market risk: The risk of loss arising from potential adverse changes in the value of the firm’s assets and liabilities from fluctuation in market variables including, but not limited to, interest rates, foreign exchange, equity prices, commodity prices, credit spreads, implied volatilities and asset correlations |
| § | Treasury and capital risk: This comprises: |
– Liquidity risk: The risk that the firm is unable to meet its contractual or contingent obligations or that it does not have the appropriate amount, tenor and composition of funding and liquidity to support its assets
– Capital risk: The risk that the firm has an insufficient level or composition of capital to support its normal business activities and to meet its regulatory capital requirements under normal operating environments or stressed conditions (both actual and as defined for internal planning or regulatory testing purposes). This includes the risk from the firm’s pension plans
– Interest rate risk in the banking book: The risk that the firm is exposed to capital or income volatility because of a mismatch between the interest rate exposures of its(non-traded) assets and liabilities
Non-Financial Principal Risks:
| § | Operational risk: The risk of loss to the firm from inadequate or failed processes or systems, human factors or due to external events (for example fraud) where the root cause is not due to credit or market risks. |
| § | Model risk: The risk of the potential adverse consequences from financial assessments or decisions based on incorrect or misused model outputs and reports |
| § | Reputation risk: The risk that an action, transaction, investment or event will reduce trust in the firm’s integrity and competence by clients, counterparties, investors, regulators, employees or the public |
| § | Conduct risk: The risk of detriment to customers, clients, market integrity, competition or Barclays from the inappropriate supply of financial services, including instances of wilful or negligent misconduct |
| § | Legal risk: The risk of loss or imposition of penalties, damages or fines from the failure of the firm to meet its legal obligations including regulatory or contractual requirements |
Risk Appetite for the Principal Risks
Risk Appetite is defined as the level of risk which the firm is prepared to accept in the conduct of its activities. The Risk Appetite of the firm:
| § | specifies the level of risk we are willing to take and why, to enable specific risk taking activities |
| § | considers all Principal Risks individually and, where appropriate, in aggregate |
| § | communicates the acceptable level of risk for different risk types; this may be expressed in financial ornon-financial terms, and is measured and effectively monitored |
| § | describes agreed parameters for the firm’s performance under varying levels of financial stress with respect to profitability |
| § | is considered in key decision-making processes, including business planning, mergers and acquisitions, new product approvals and business change initiatives. |
Risk Appetite is approved and disseminated across legal entities and businesses, including by use of Mandate and Scale limits to enable and control specific activities that have material concentration risk implications for the firm. These limits also help reduce the likelihood and size ofone-off losses. The Risk Appetite must be formally reviewed on at least an annual frequency in conjunction with the Medium Term Planning (MTP) process and approved by the Board.
| 344 | Barclays PLC and Barclays Bank PLC 2016 Annual Report on Form 20-F |
Barclays’ approach to managing risks
Risk management strategy, governance and risk culture
Roles and responsibilities in the management of risk – the Three Lines of Defence
All colleagues have a responsibility to contribute to the risk management of the group. These responsibilities are set out in the “Three Lines of Defence”. In 2016 these definitions were simplified. Regardless of their function, all teams who manage processes in the firm are responsible for designing, implementing, remediating, monitoring and testing the controls for those processes.
First Line of Defence:
The First Line comprises all employees engaged in the revenue generating and client facing areas of the firm and all associated support functions, including Finance, Treasury, Technology and Operations, Human Resources etc. Employees in the first line are responsible for:
| § | identifying all the risks in the activities in which they are engaged, and developing appropriate policies, standards and controls to govern their activities |
| § | operating within any and all limits which the Risk and Compliance functions establish in connection with the Risk Appetite of the firm |
| § | escalating risk events to senior managers and Risk and Compliance. |
Internal controls are critical to running a cost-effective and stable business. To ensure these controls remain strong, sustainable, and efficient the new strategic position of Chief Controls Officer has been created. The Chief Controls Office will help to maintain and enhance an effective and consistent control framework across the organisation.
The first line must establish their own policies and controls (subject to the Controls Framework of the firm), particularly with respect to operational activities, and require their colleagues to manage all controls to specified tolerances. These control-related activities are also considered First Line and are permitted so long as they are within any applicable limits established by Risk or Compliance. All activities in the first line are subject to oversight from the relevant parts of the second and third lines.
Second Line of Defence:
Employees of Risk and Compliance comprise the Second Line of Defence. The role of the Second Line is to establish the limits, rules and constraints under which first line activities shall be performed, consistent with the Risk Appetite of the firm, and to monitor the performance of the First Line against these limits and constraints.
The Second Line may not establish limits for all First Line activities, especially those related to Operational Risk. The controls for these will ordinarily be established by Controls Officers operating within the Controls Framework of the firm, under the oversight of the Second Line.
The Second Line can also undertake certain additional activities if, in the judgement of the Group CRO, this will reduce the firm’s exposure to risk.
Third Line of Defence:
Employees of Internal Audit comprise the Third Line of Defence. They provide independent assurance to the Board and Executive Management over the effectiveness of governance, risk management and control over current, systemic and evolving risks.
The Legal department does not sit in any of the three lines, but supports them all. The Legal department is, however, subject to oversight from Risk and Compliance, with respect to Operational and Conduct Risks.
Roles and responsibilities in the management of risk – risk committees
Business Risk Committees consider Risk matters relevant to their business, and escalate as required to the Group Risk Committee (GRC), whose Chairman in turn escalates to Board Committees and the Board.
There are five Board-level fora which review and monitor risk across the Group. These are: The main Board, the Board Risk Committee, the Board Audit Committee, the Board Reputation Committee and the Board Remuneration Committee.
The Chairman of each Committee prepares a statement each year on the committee’s activities, which is included in the governance section.
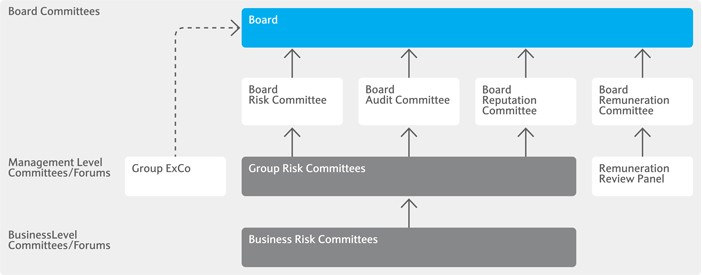
The Board
One of the Board’s (Board of Directors of Barclays PLC) responsibilities is the approval of Risk Appetite (see the Risk Management and Strategy section on page 348), which is the level of risk the Group chooses to take in pursuit of its business objectives. The Group CRO (GCRO) regularly presents a report to the Board summarising developments in the risk environment and performance trends in the key portfolios. The Board is also responsible for the ERMF. It oversees the management of the most significant risks through regular review of risk exposures. Executive management responsibilities relating to this are set out in the ERMF.
The Board Risk Committee (BRC)
The BRC monitors the Group’s risk profile against the agreed financial appetite. Where actual performance differs from expectations, the actions taken by management are reviewed to ensure that the BRC is comfortable with them. After each meeting, the Chairman of the BRC prepares a report for the next meeting of the Board. All members are independent executive directors. The Group Finance Director (GFD) and the GCRO attend each meeting as a matter of course.
The BRC also considers the Group’s risk appetite statement for operational risk and evaluates the Group’s operational risk profile and operational risk monitoring.
| Barclays PLC and Barclays Bank PLC 2016 Annual Report on Form 20-F | 345 |
Barclays’ approach to managing risks
Risk management strategy, governance and risk culture
The BRC receives regular and comprehensive reports on risk methodologies, the effectiveness of the risk management framework, and the Group’s risk profile, including the key issues affecting each business portfolio and forward risk trends. The Committee also commissionsin-depth analyses of significant risk topics, which are presented by the CRO or senior risk managers in the businesses.
The Board Reputation Committee (RepCo)
The RepCo reviews management’s recommendations on conduct and reputational risk and the effectiveness of the processes by which the Group identifies and manages these risks. It also reviews and monitors the effectiveness of Barclays’ Citizenship strategy, including the management of Barclays’ economic, social and environmental contribution.
In addition, the Board Audit and Board Remuneration Committees receive regular risk reports to assist them in the undertaking of their duties.
The Board Audit Committee (BAC)
The BAC receives regular reports on the effectiveness of internal control systems, quarterly reports on material control issues of significance, and quarterly papers on accounting judgements (including impairment). It also receives a quarterly review of the adequacy of impairment allowances, which it reviews relative to the risk inherent in the portfolios, the business environment, the Group’s policies and methodologies and the performance trends of peer banks. The Chairman of the BAC also sits on the BRC.
The Board Remuneration Committee (RemCo)
The RemCo receives a detailed report on risk management performance from the BRC, regular updates on the risk profile and proposals on anex-ante andex-post risk adjustments to variable remuneration. These inputs are considered in the setting of performance incentives.
Coverage of risk reports to executive and Board risk committees
Chairs of Risk Committees at executive and Board levels specify the information they require to discharge their duties. Advance committee calendars are agreed with the committee chairman. Topics that are regularly covered include:
| § | Financial and Operational risk profile |
| § | Risk perspective on medium-term plans and strategy |
| § | Risk Appetite |
| § | Results of stress tests, including CCAR |
| § | Risk inputs into remuneration decisions |
| § | Other technical topics, e.g. Model risk. |
In addition to regular topics, committees consider ad hoc papers on current risk topics, such as:
| § | Political events and their potential impacts on Barclays and its customers |
| § | Economic developments in major economies or sectors |
| § | Impacts of key market developments on the risk management of the firm. |
Reports are generally presented by CROs or other accountable executives. Occasionally subject matter experts are delegated to present specific topics of interest. Report presenters are responsible for ensuring the processes for creating reports include appropriate controls and that these are operated effectively.
Roles and responsibilities in the management of risk – senior management
Certain roles within Barclays carry specific responsibilities and accountabilities with respect to risk management and the ERMF.
Group CEO Officer (CEO)
The CEO is accountable for leading the development of Barclays’ strategy and business plans that align to our Goal, Purpose and Values within the approved Risk Appetite, and for managing and organising executive management to ensure these are executed. Managing Barclays’ financial and operational performance within the approved Risk Appetite is ultimately the CEO’s responsibility.
Specifically a crucial role of the CEO is to appoint the most senior Risk owners at the executive level including the Chief Risk Officer, Chief Compliance Officer and Group General Counsel, and all Chief Executive officers of business units. He must work with them to embed a strong Risk Culture within the firm, with particular regard to the identification, escalation and management of risk matters.
Group Chief Risk Officer (CRO)
The Group CRO leads the Risk Function across Barclays. His responsibilities include developing and maintaining the ERMF and to clearly articulate Risk Culture objectives. Specific accountabilities include:
| § | preparing and recommending the firm’s Risk Appetite to the Board Risk Committees |
| § | developing, operating and maintaining a comprehensive risk management framework for Barclays to monitor and manage the risk profile of the firm against the approved Risk Appetite |
| § | providing accurate, transparent and timely reporting to the Board that compares the Risk Appetite set for Barclays and the businesses (by risk type and in aggregate where appropriate), against the actual Risk Profile of the firm under normal and stressed scenarios |
| § | defining the risk taxonomy (Principal Risks) and ensuring it remains relevant and comprehensive |
| § | bringing a risk perspective to compensation decisions |
| § | reporting to the Group Wide Risk Committee, the Group Executive Committee, the Board and its relevant committees including the Board Risk Committee, regulators and other stakeholders on Barclays’ risk positions, adherence to Risk Appetite and enterprise wide risk and control. |
Chief Compliance Officer
The Chief Compliance Officer is accountable to the Group CEO for the oversight of regulated activities undertaken by the Group, and leads the Compliance Function across Barclays. Specific accountabilities include:
| § | ensuring the Group’s Conduct and Reputation Risks are effectively managed and escalated to the Board where appropriate |
| § | setting minimum standards through compliance policies applicable globally and monitoring breaches, specially for Conduct and Reputation Risks and Financial Crime |
| § | inputting into compensation structures, objectives and performance management of employees who can expose Barclays to significant risk |
| § | ensuring there is a robust whistleblowing process in place on an enterprise wide basis and for ensuring it is effectively managed |
| § | using mandate to access any part of the organisation and any information, bringing to the attention of line and senior management or the Board, as appropriate, any situation that is of concern from a Conduct or Reputation Risk management perspective of that could materially violate approve Risk Appetite guidelines. |
| 346 | Barclays PLC and Barclays Bank PLC 2016 Annual Report on Form 20-F |
Barclays’ approach to managing risks
Risk management strategy, governance and risk culture
Group General Counsel
The Group General Counsel is required to:
| § | Develop and maintain the Legal Risk Framework |
| § | Define the Legal Risk Policies |
| § | Develop the Group-wide and Business Risk Appetite for Legal Risk. |
Senior Managers Regime
A number of Members of the Board, the majority of the Executive Committee and a limited number of specified senior individuals are also subject to additional rules included within the Senior Managers Regime (SMR), which clarifies their accountability and responsibilities. Those designated with a Senior Manager Function under the SMR are held to four specific rules of conduct in which they must:
| 1. | take reasonable steps to ensure that the business of the firm for which they are responsible is controlled effectively |
| 2. | take reasonable steps to ensure that the business of the firm for which they are responsible complies with relevant regulatory requirements and standards of the regulatory system |
| 3. | take reasonable steps to ensure that any delegation of their responsibilities is to an appropriate individual and that they oversee the discharge of the delegated responsibilities effectively |
| 4. | disclose appropriately any information to the FCA or PRA, which they would reasonably expect notice. |
The SMR applies to specific legal entities. Within Barclays, the legal entities which are subject to the SMR are Barclays Bank PLC, Barclays Capital Securities Limited and Barclays Bank Trust Company Limited and the reference to “firm” above should be construed accordingly
Frameworks, Policies and Standards
Frameworks, policies and standards set out the governance around Barclays’ activities:
| § | Frameworks cover the management processes for a collection of related activities and define the associated policies used to govern them |
| § | Policies set out control objectives, principles and other core requirements for the activities of the firm. Policies describe “what” must be done |
| § | Standards set out the key controls that ensure the objectives set out in the Policy are met, and who needs to carry them out. Standards describe “how” controls should be undertaken. |
Frameworks, Policies and Standards are owned by the area responsible for performing the described activity. In particular, frameworks, policies and standards associated with the Principal Risks are owned and written by the second line of defence.
The Group CRO is accountable for ensuring that frameworks, policies and associated standards are developed and implemented for each of the Financial Principal Risks, Operational Risk and Model Risk and that they are subject to limits, monitored, reported on and escalated as required. The Chief Compliance Officer is likewise accountable for Conduct Risk and Reputation Risk, and the Group General Counsel for Legal Risk. The Group CRO and Group Chief Compliance Officer have the right to require amendments to any Frameworks, Policies or Standards in the firm, for any reason, including inconsistencies or contradictions among them.
Frameworks, Policies and Standards are subject to minimum annual review, and challenge by the Risk and/or Compliance functions, unless explicitly waived by the relevant heads of those functions. Principal Risk Frameworks are subject to approval by relevant committees of the Board.
Assurance
Assurance is undertaken to assess the control environment and to independently assess the ERMF, which includes testing specific elements of the control environment documented in standards and checking that control testing activities are reliable, to provide confidence to the Board in the risk and control framework.
The Credit Risk Review Group (CRRG) provides an independent review and monitoring of the quality and condition of all the wholesale loan and derivative portfolios through a review of the overall credit sanctioning process. CRRG has a mandate from the CRO and has direct access to the CRO and to the BRC.
Internal Audit is responsible for the independent review of risk management and the control environment. Its objective is to provide reliable, valued and timely assurance to the Board and executive management over the effectiveness of controls, mitigating current and evolving material risks and thus enhancing the control culture within the Group. The BAC reviews and approves Internal Audit’s plans and resources, and evaluates the effectiveness of Internal Audit. An assessment by independent external advisers is also carried out periodically.
Effectiveness of risk management arrangements
The embedding of the ERMF is monitored by executive and board committees as described above. The ERMF and its component principal risks are subject to control testing assurance reviews to confirm its effectiveness or identify issues to be mitigated. Management and the Board are satisfied that these arrangements are appropriate given the risk profile of the Group.
Learning from our mistakes
Learning from mistakes is central to the Group’s culture and values, demonstrating a commitment to excellence, service and stewardship and taking accountability for failure as well as success. The Group seeks to learn lessons on a continuous basis to support achievement of strategic objectives; operational excellence and to meet commitments to stakeholders, including colleagues, customers, shareholders and regulators.
Barclays has implemented an updated Group Lessons Learnt Standard as part of the ERMF, setting out requirements for completing Lessons Learnt Assessments in response to significant events. The approach to Lessons Learnt has been further enhanced with the implementation of a new process and system of record during 2016 and fulfils the Group’s Salz commitments by ensuring a consistent and effective approach applicable to all Principal Risks. The approach is directly aligned to the three lines of defence model (see page 345), with businesses and functions accountable for undertaking lessons learnt assessments; the second line providing input, oversight and challenge; with independent review by Internal Audit.
Core components of the Lessons Learnt approach include:
| § | defined triggers for when Lessons Learnt Assessments must be completed |
| § | requirements and guidance for root cause analysis to identify the causes of events within the Group |
| § | templates to ensure conclusions are reported consistently throughout management committees |
| § | a central system to record completed Lessons Learnt Assessments and to facilitate sharing across the Group. |
Barclays’ Risk Culture
Barclays defines Risk Culture as “norms, attitudes and behaviours related to risk awareness, risk taking and risk management”. At Barclays this is reflected in how we identify, escalate and manage risk matters.
Our Code of Conduct – the Barclays Way
Globally, all colleagues must attest to the “Barclays Way”, our Code of Conduct, and all frameworks, policies and standards applicable to their roles. The Code of Conduct outlines the Purpose and Values which govern our Barclays Way of working across our business globally. It constitutes a reference point covering all aspects of colleagues’ working relationships, specifically (but not exclusively) with other Barclays employees, customers and clients, governments and regulators, business partners, suppliers, competitors and the broader community.
| Barclays PLC and Barclays Bank PLC 2016 Annual Report on Form 20-F | 347 |
Barclays’ approach to managing risks
Risk management strategy, governance and risk culture
Definition of Risk Culture and its determinants
We review our culture through the lens of four “determinants”, associated with desired outcomes:
| § | Management and governance: Consistent tone from the top; responsibilities are clear to enable identification and challenge |
| § | Motivation and incentives: The right behaviours are rewarded and modelled |
| § | Competence and effectiveness: Colleagues are enabled to identify, coordinate, escalate and address risk and control matters |
| § | Integrity: Colleagues are willing to meet their risk management responsibilities; colleagues escalate issues on a timely basis. |
The rest of this section sets out key elements of our approach to embedding a strong Risk Culture.
Management and governance
Leaders must demonstrate through their everyday behaviours the importance of strong risk management and ensure that their teams have sufficient resource and capability to manage the risk environment.
The simplification of the three lines of defence, as well as the reorganisation of business and risk committees with first and second lines of defence representation promote ownership and accountabilities for risk management.
Motivation and incentives
Barclays seeks to ensure that compensation and promotion decisions take account of risk behaviours.
Management of risk and control is assessed as part of the annual performance appraisal process for all colleagues globally. Positive risk management behaviours will be rewarded and considered as part of promotion decisions, particularly to Managing Director.
Competence and effectiveness
A risk capability scorecard was developed for the Board Risk Committee to monitor and measure capability, and to identify any areas for improvement. Barclays has also appointed a Chief Risk Officer for Treasury and Capital and a Head of Model Risk Management.
Integrity
The “Being Barclays” global induction supports new colleagues in understanding how risk management culture and practices support how the Group does business and the link to Barclays’ values. The Leadership Curriculum covers building, sustaining and supporting a trustworthy organisation and is offered to colleagues globally.
The continued promotion and reinforcement of Barclays’ Values, as well as the Barclays Way was reflected in the near-perfect rate of completion of related training by employees. Messages and communications from the Chief Risk Officer emphasise the importance of early escalation of risk issues.
Group-wide risk management tools
To support the Group-wide management of risks, the Board uses risk appetite, mandate and scale, and stress testing as key inputs in the annual planning cycle, including setting of the Group’s strategy. The following describes in further detail the group-wide risk management tools used as part of this process.
Risk Appetite
Risk appetite is defined as the level of risk which the firm is prepared to accept in the conduct of its activities.
Risk appetite sets the ‘tone from the top’ and provides a basis for ongoing dialogue between management and Board with respect to the Group’s current and evolving risk profile, allowing strategic and financial decisions to be made on an informed basis.
The Risk Appetite Framework is intended to achieve the following objectives:
| § | Specify the level of risk we are willing to take and why, to enable specific risk taking activities |
| § | Consider all Principal Risks individually and in aggregate. |
| § | Consistently communicate the acceptable level of risk for different risk types; this may be expressed in financial ornon-financial terms, and should be measured, as applicable, and effectively monitored |
| § | Describe agreed parameters for the firm’s performance under financial stress with respect to profitability: |
| – | Profitability and loss metrics |
| – | Capital ratios |
| § | Be considered in key decision-making processes, including business planning, mergers and acquisitions, and business change initiatives |
The risk appetite for financial risks is set by the Board on the basis of “adverse” stress tests, as it is during periods of macro-economic stress that these losses materialise. In order to articulate the risk appetite for the firm, the Board first defines the deterioration in the firm’s performance it is willing to accept under stressed macroeconomic conditions. The acceptable deterioration is defined through a set of financial constraints which are reviewed by the Board on an annual basis. For 2017 these constraints are summarised in the following table.
| Measure relevant to strategy and risk | Link between strategy and risk profile | |
| Profit after tax | Fundamental performance of the Bank and underpins the firm’s capacity to make capital distributions. | |
| Common Equity Tier 1 (CET1) | Monitor capital adequacy in relation to capital plan, targets and regulatory hurdle rates. |
Barclays businesses run the stress test(s) as a fully integrated part of the annual Medium Term Planning (MTP) process, to ensure that the risk appetite businesses demand is based on the businesses’ most recent strategic plans. The deterioration of financial performance as a result of the stress test is subsequently compared to the tolerances agreed by the Board. With Board approval the risk appetite is allocated back to individual businesses and utilisation is monitored regularly and reported to Board on a quarterly basis. This approach ensures that businesses’ risk appetite proposals are based on their latest strategic plans and allows the Board to allocate risk appetite such that it fully supports the firm’s chosen strategy within acceptable boundaries of risk taking.
Mandate and scale
Mandate and scale is a risk management approach that seeks to formally review and control business activities to ensure that they are within mandate (i.e. aligned with expectations), and are of an appropriate scale (relative to the risk and reward of the underlying activities) based on an extensive system of limits. Using limits and triggers helps mitigate the risk of concentrations which would be out of line with expectations, and which may lead to unexpected losses of a scale that would be detrimental to the stability of the relevant business line or the Group.
For example, for leveraged finance and commercial property finance portfolios, there are a comprehensive series of limits in place to control exposure within each business and geographic sector. To ensure that limits are aligned to the underlying risk characteristics, the mandate and scale limits differentiate between types of exposure. There are, for example, individual limits for property investment and property development.
The mandate and scale framework is used to:
| § | limit concentration risk |
| § | keep business activities within Group and individual business mandate |
| § | ensure activities remain of an appropriate scale relative to the underlying risk and reward |
| § | ensure risk-taking is supported by appropriate expertise and capabilities. |
The most material mandate and scale limits are designated asA-level (Board level) andB-Level (Group-level). Group limits are approved by the appropriate risk committee (e.g. Wholesale Credit Risk Management Committee) and are subject to additional escalation and governance requirements.
Further limits are set by risk managers within each business, covering particular portfolios. Unapproved excesses of limits will result in
| 348 | Barclays PLC and Barclays Bank PLC 2016 Annual Report on Form 20-F |
Barclays’ approach to managing risks
Risk management strategy, governance and risk culture
performance management and disciplinary consequences. Business limits are approved by the relevant business risk team and reportable to the relevant risk committee.
Limits reflect the nature of the risk being managed and controlled and are measured by total financing limits, LGD, stress loss or other metrics as appropriate. There is explicit identification of the exposures that are captured by limits and any material exclusion must be agreed. Limits are reviewed at least annually. The factors taken into consideration when setting the limit will include:
| § | Group Risk Appetite |
| § | current exposure/MTP forecasts |
| § | risk return considerations |
| § | senior risk management judgement. |
Stress testing
Group-wide stress tests are an integral part of the MTP process and annual review of risk appetite. They aim to ensure that the Group’s financial position and risk profile provide sufficient resilience to withstand the impact of severe economic stress. The Group-wide stress testing process is supported by a Capital Stress Testing Standard which sets out the minimum control requirements and defines clear roles and responsibilities across businesses and central functions. The results also feed into our internal capital adequacy assessment process (ICAAP) submission to the PRA.
The following diagram outlines the key steps in the Group-wide stress testing process, which are described below.
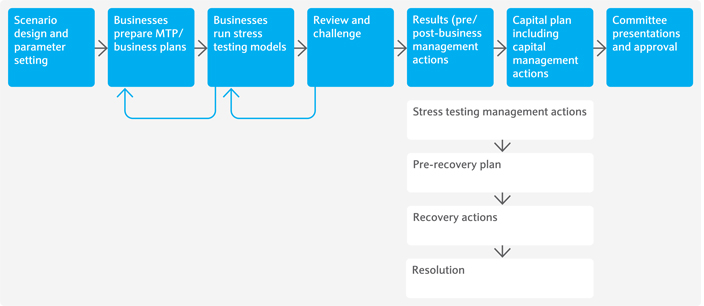
The Group-wide stress testing process begins with a detailed scenario setting process, with the GRC and BRC agreeing the range of scenarios to be tested. The scenarios are designed to be severe but plausible, and relevant to the business. A wide range of macroeconomic parameters are defined (such as GDP, unemployment, house prices, FX and interest rates), which allows the impact of the scenarios across the wide range of products and portfolios to be assessed across the Group.
Businesses prepare detailed MTP business plans which form the baseline for the stress test assessment. The stress test process is detailed and comprehensive, usingbottom-up analysis across all of our businesses including bothon- andoff-balance sheet positions, and combines running statistical models with expert judgement. An overview of the stress testing approach by Principal Risk is provided in the table on page 350. As part of their stress test assessments, businesses are also required to identify potential management actions that could be taken to mitigate the impact of stress and document these within their results.
There is robust governance in place with detailed review of stress testing methodology and results both within businesses (includingsign-off by business CROs and CFOs) and by central functions.
The businesses stress test results are consolidated to form a Group view which is used to assess the stress impact on the Group’s capital plans. For the latter, capital management actions such as reducing dividends or redeeming certain capital instruments may be considered. The Group also maintains recovery plans which take into consideration actions to facilitate recovery from severe stress or an orderly resolution. These actions are additional to those included in the Group-wide stress testing results.
The overall stress testing results are reviewed and signed off by the Board, following review by the GRC, BRC, Treasury Committee and ExCo.
| Barclays PLC and Barclays Bank PLC 2016 Annual Report on Form 20-F | 349 |
Barclays’ approach to managing risks
Risk management strategy, governance and risk culture
Summary of methodologies for Group-wide stress testing by risk type
| ||||
Principal Risk | Stress testing approach | |||
Credit risk | § Credit risk impairment:For retail portfolios businesses use regression models to establish a relationship between arrears movements and key macroeconomic parameters such as interest rates, inflation and unemployment, incorporating roll-rate analysis to estimate stressed levels of arrears by portfolio. In addition, house price reductions (for mortgages) and increased customer drawdowns (for revolving facilities) lead to higher LGDs which also contribute to increased impairment levels. For wholesale portfolios the stress shocks on credit risk drivers (PDs, LGDs and EADs) are primarily calibrated using historical and expected relationships with key macro-economic parameters such as GDP, inflation and interest rates.
§ Counterparty credit risk losses:The scenarios include market risk shocks that are applied to determine the market value under stress of contracts that give rise to Counterparty Credit Risk (CCR). Counterparty losses, including from changes to the Credit Valuation Adjustment and from defaults, are modelled based on the impact of these shocks as well as using stressed credit risk drivers (PDs and LGDs). The same approach is used to stress the market value of assets held as available for sale or at fair value in the banking book.
§ Credit risk weighted assets:The impact of the scenarios is calculated via a combination of business volumes and using similar factors to impairment drivers above, as well as the regulatory calculation and the level ofpro-cyclicality of underlying regulatory credit risk models. | |||
Market risk | § Trading book losses:All market risk factors on the balance sheet are stressed using specific market risk shocks (and are used for the CCR analysis, above). The severity of the shocks applied are dependent on the liquidity of the market under stress, e.g. illiquid positions are assumed to have a longer holding period than positions in liquid markets. | |||
Treasury and Capital Risk | Interest Rate Risk in the Banking Book & Liquidity Risk: § The risk of a mismatch between assets and liabilities, leading to funding difficulties, is assessed. Businesses apply scenario variables to forecasts of customer loans and advances and deposits levels, taking into account management actions to mitigate the impact of the stress which may impact business volumes. The Group funding requirement under stress is then estimated and takes into account lower availability of funds in the market.
§ The analysis of funding risk also contributes to the estimate of stressed income and costs:
| |||
| – | Stress impact onnon-interest income is primarily driven by lower projected business volumes and hence lower income from fees and commissions
| |||
| – | Impact on net interest income is driven by stressed margins, which depend on the level of interest rates under stress as well as funding costs, and on stressed balance sheet volumes. This can be partly mitigated by management actions that may include repricing of variable rate products, taking into account interbank lending rates under stress
| |||
| – | The impact on costs is mainly driven by business volumes and management actions to partly offset profit reductions (due to impairment increases and decreases in income) such as headcount reductions and lower performance costs.
| |||
Capital Risk: § Capital risk is assessed by taking all key risks (as listed above) into consideration when assessing Barclays’ ability to withstand a severe stress. The stressed results are considered against internally agreed risk appetite levels but also regulatory minima and perceived market expectations. The MTP can only be agreed by the Board if this is within the agreed risk appetite levels under stress.
§ The funding position of pension funds is also stressed as part of the capital risk assessment, taking into account key economic drivers impacting future obligations (e.g. long-term inflation and interest rates) and the impact of the scenarios on the value of fund assets. | ||||
Operational risk, and Conduct risk | § Operational risk is generally not impacted as there is no direct link to the stress economic scenario. However, it is included as part of the reverse stress testing framework that incorporates assessment of idiosyncratic operational risk events. | |||
In 2016, the internal Group-wide stress testing exercise was run as part of the MTP process, where the Group assessed the impact of an “Adverse” global recession scenario. This was used for the MTP Risk Review and risk appetite setting process.
The Group-wide stress testing framework also includes reverse stress testing techniques which aim to identify the circumstances under which the Group’s business model would no longer be viable, leading to a significant change in business strategy and to identify appropriate mitigating actions. Examples include extreme macroeconomic downturn (‘severely adverse’) scenarios, or specific idiosyncratic events, covering both operational risk and capital/liquidity events.
Reverse stress testing is used to help support ongoing risk management and is an input to our Recovery Planning process.
Business and risk type specific stress tests
Stress testing techniques at portfolio and product level are also used to support risk management. For example, portfolio management in the US cards business employs stressed assumptions of loss rates to determine profitability hurdles for new accounts. In the United Kingdom home loans business, affordability thresholds incorporate stressed estimates of interest rates. In investment banking, global scenario testing is used to gauge potential losses that could arise in conditions of a severe but plausible market stress. Stress testing is also conducted on positions in particular asset classes, including interest rates, commodities, equities, credit and foreign exchange.
Regulatory stress testing
In addition to running internal Group-wide stress tests, the Group also runs regulatory stress tests.
In 2016, the PRA ran its annual concurrent stress testing of the major UK banks, which was based on the Bank of England (BoE) stress scenario. The results of the stress test were published in November 2016, and support the BoE’s aim for increased transparency as part of its stress testing framework.
Additionally, in 2016, the European Banking Authority ran a stress test across the major European banks. The results were published in July.
The firm is also subject to stress testing run by non UK regulators e.g. the Federal Reserve, which are typically focused at the local legal entity level.
| 350 | Barclays PLC and Barclays Bank PLC 2016 Annual Report on Form 20-F |
Barclays’ approach to managing risks
Risk management strategy, governance and risk culture
Risk management in the setting of strategy
The risk appetite and (internal) stress testing processes described above form the basis of the risk review of the Medium Term Plan (MTP), performed annually. The MTP embeds the Group’s objectives into detailed business plans taking into account the likely business and macroeconomic environment. The strategy is informed by the risk review process, which includes reviewing the Group’s risk profile and setting of risk appetite.
| § | The MTP risk review process includes a review of the proposed risk appetite by the business, including assessment of business plans under stress which is used to inform the MTP. |
| § | If the businesses’ plans entail too high a level of risk, management will challenge the plans. This assessment is based on a comparison of businesses own risk appetite assessment reflected in their business plans(‘bottom-up’ risk appetite) with the central risk team’s view(‘top-down’ risk appetite) based on the financial constraints set by the Board for the Group. |
| § | Businesses may be asked to update their business plans to ensure thebottom-up risk appetite is withintop-down appetite. There is also a detailed review of the stressed estimates and methodology used to translate the economic scenario to stressed estimates, as well as the management actions included in businesses’ results to ensure that these are appropriate and realistic in a stressed environment. |
| § | Risk review meetings are held with the CEO, CFO, CRO and Treasurer of each business, where they present their business plans to the Group CRO and the findings from the risk reviews are discussed, including the risk appetite proposals and stress testing results. Businesses may be required to change their business plans as a result of these meetings |
The BRC has overall responsibility for reviewing the Group’s risk profile and making appropriate recommendations to the Board. The Board is ultimately responsible for approving the MTP and the Group’s risk appetite. The risk appetite process ensures that senior management and the Board understand the MTP’s sensitivities by risk type, and includes a set of limits to ensure the Group stays within appetite, as described above.
| Barclays PLC and Barclays Bank PLC 2016 Annual Report on Form 20-F | 351 |
Barclays’ approach to managing risks
Management of credit risk and the internal ratings-based approach
This section discusses the organisation specific to the management of credit risks, and provides details of the calculation of risk weighted assets under the Internal Ratings Based approach of the Basel framework.
| § | Page 353 covers the aspects of the Group’s risk management framework specific to credit risk, including committees and the Group reporting structure |
| § | As 66% of our regulatory capital is for credit risk, we devote pages360 to 367 to detailing how we approach the internal ratings models, and how the framework supports risk differentiation and management. |
| 352 | Barclays PLC and Barclays Bank PLC 2016 Annual Report on Form 20-F |
Barclays’ approach to managing risks
Management of credit risk and the internal ratings-based approach
Credit risk
The risk of loss to the firm from the failure of clients, customers or counterparties, including sovereigns, fully to honour their obligations to the firm, including the whole and timely payment of principal, interest, collateral and other receivables
|
Overview
The granting of credit is one of the Group’s major sources of income and, as a Principal Risk, the Group dedicates considerable resources to its control. The credit risk that the Group faces arises mainly from wholesale and retail loans and advances together with the counterparty
credit risk arising from derivative contracts with clients. Other sources of credit risk arise from trading activities, including: debt securities, settlement balances with market counterparties; available for sale assets; and reverse repurchase loans.
Credit risk management objectives are to:
| § | maintain a framework of controls to ensure credit risk-taking is based on sound credit risk management principles |
| § | identify, assess and measure credit risk clearly and accurately across the Group and within each separate business, from the level of individual facilities up to the total portfolio |
| § | control and plan credit risk-taking in line with external stakeholder expectations and avoiding undesirable concentrations |
| § | monitor credit risk and adherence to agreed controls |
| § | ensure that risk-reward objectives are met |
| § | More information of the reporting of credit risk can be found on page 354. |
Board oversight and flow of risk related information
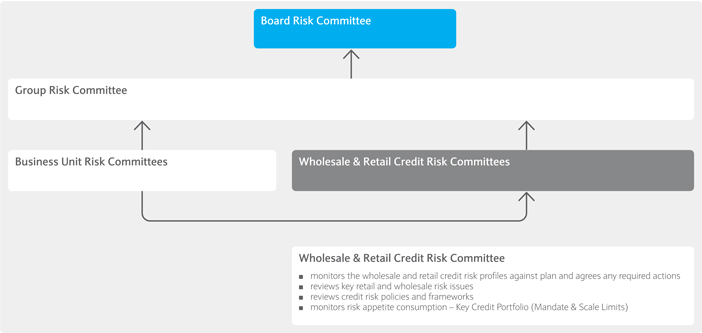
Organisation and structure
Wholesale and retail portfolios are managed separately to reflect the differing nature of the assets; wholesale balances tend to be larger and are managed on an individual basis, while retail balances are larger in number but smaller in value and are, therefore, managed on a homogenous portfolio basis.
Credit risk management responsibilities have been structured so that decisions are taken as close as possible to the business, while ensuring robust review and challenge of performance, risk infrastructure and strategic plans. The credit risk management teams in each business are accountable to the relevant Business CRO who, in turn, reports to the Group CRO.
Roles and responsibilities
The responsibilities of the credit risk management teams in the businesses, the sanctioning team and other shared services include: sanctioning new credit agreements (principally wholesale); setting policies for approval of transactions (principally retail); setting risk appetite; monitoring risk against limits and other parameters; maintaining robust processes, data gathering, quality, storage and reporting methods for effective credit risk management; performing effective turnaround and workout scenarios for wholesale portfolios via dedicated restructuring and recoveries teams; maintaining robust
collections and recovery processes/units for retail portfolios; and review and validation of credit risk measurement models.
For wholesale portfolios, credit risk approval is undertaken by experienced credit risk professionals operating within a clearly defined delegated authority framework, with only the most senior credit officers entrusted with the higher levels of delegated authority. The largest credit exposures, which are outside the Risk Sanctioning Unit or Risk Distribution Committee authority require the support of the Group Senior Credit Officer (GSCO), the Group’s most senior credit risk sanctioner. For exposures in excess of the GSCO’s authority, approval by Group CRO is required. In the wholesale portfolios, credit risk managers are organised in sanctioning teams by geography, industry and/or product.
The role of the Central Risk function is to provide Group-wide direction, oversight and challenge of credit risk-taking. Central Risk sets the Credit Risk Control Framework, which provides the structure within which credit risk is managed, together with supporting credit risk policies.
| Barclays PLC and Barclays Bank PLC 2016 Annual Report on Form 20-F | 353 |
Barclays’ approach to managing risks
Management of credit risk and the internal ratings-based approach
Reporting
The Group dedicates considerable resources to gaining a clear and accurate understanding of credit risk across the business and ensuring that its balance sheet correctly reflects the value of the assets in accordance with applicable accounting principles. This process can be summarised in five broad stages:
| § | measuring exposures and concentrations |
| § | monitoring performance and asset quality |
| § | monitoring for weaknesses in portfolios |
| § | raising allowances for impairment and other credit provisions |
| § | returning assets to a performing status or writing off assets when the whole or part of a debt is considered irrecoverable. |
Measuring exposures and concentrations
Loans and advances to customers provide the principal source of credit risk to the Group although it is also exposed to other forms of credit risk through, for example, loans and advances to banks, loan commitments and debt securities. Risk management policies and processes are designed to identify and analyse risk, to set appropriate risk appetite, limits and controls, and to monitor the risks and adherence to limits by means of reliable and timely data.
One area of particular review is concentration risk. A concentration of credit risk exists when a number of counterparties or customers are engaged in similar activities or geographies, and have similar economic
characteristics that would cause their ability to meet contractual obligations to be similarly affected by changes in economic and other conditions. As a result, the Group constantly reviews its concentration in a number of areas including, for example, geography, maturity and industry.
Mandate and scale limits are used to maintain concentrations at appropriate levels, which are aligned with the businesses’ stated risk appetite. Limits are typically based on the nature of the lending and the amount of the portfolio meeting certain standards of underwriting criteria. Diversification, to reduce concentration risk, is achieved through setting maximum exposure guidelines to individual counterparties. Excesses are reported to the BRC.
Monitoring performance and asset quality
Trends in the quality of the Group’s loan portfolio are monitored in a number of ways including tracking loan loss rate and coverage ratios.
Loan loss rate
The loan loss rate (LLR) provides a way of consistently monitoring trends in loan portfolio quality at the Group, business and product levels. The LLR represents the annualised impairment charges on loans and advances to customers and banks and other credit provisions as a percentage of the total,period-end loans and advances to customers and banks, gross of impairment allowances. Details of the LLR for the current period may be found in the Credit Risk Performance section on page 127.
Loan loss rate (bps) – Longer-term trends
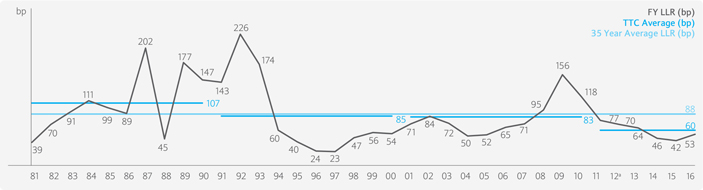
Note
| a | Restated to reflect the impact of IFRS10, which results in some former Exit Quadrant exposures being recorded at fair value from 2012 onwards |
| b | 2015 and 2016 figures exclude Africa |
From a full year peak of 156bps at 31 December 2009, the LLR has been on an improving trend. By the end of 2011, the LLR of 77bps had returned topre-crisis levels and was lower than the long-term average. The LLR fell from 2012 to 2014 and remained at a low level in 2015, increasing slightly in 2016 to 53bps.
Coverage ratios
The impairment allowance is the aggregate of the identified and unidentified impairment (UI) balances. Impairment allowance coverage, or the coverage ratio, is reported at two levels:
| § | credit risk loans (CRLs) coverage ratio, calculated as impairment allowances as a percentage of CRL balances |
| § | potential credit risk loans coverage ratio (impairment allowances as a percentage of total CRL and Potential Problem Loan balances). |
| § | See identifying potential credit risk loans on page 133 for more information for the criteria for these categories. |
CRL coverage
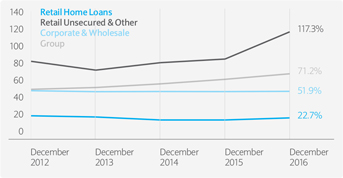
Notes
| a | SomeNon-core exposures are not reported as CRLs following the introduction of IFRS10, which accounts for these balances at fair value |
| b | All historical figures exclude Africa |
Appropriate coverage ratios will vary according to the type of product but can be broadly shown to have typical severity rates based upon historic analysis:
| § | secured Retail home loans:10%-25% |
| § | credit cards, unsecured and other personal lending products:65%-85% |
| 354 | Barclays PLC and Barclays Bank PLC 2016 Annual Report on Form 20-F |
Barclays’ approach to managing risks
Management of credit risk and the internal ratings-based approach
| § | corporate facilities:30%-50%. |
CRL coverage ratios would therefore be expected to be at or around these levels over a defined period of time.
Higher coverage in Retail unsecured and other is primarily driven by cards portfolio particularly in the UK and US, reflecting higher provisions pending full implementation of newly developed and independently approved models with enhanced methodology, following an impairment policy revision in Q3 2016.
In principle, a number of factors may affect the Group’s overall coverage ratios, including:
The mix of products within total CRL balances:coverage ratios will tend to be lower when there is a high proportion of secured Retail and corporate balances within total CRLs. This is due to the fact that the recovery outlook on these types of exposures is typically higher than Retail unsecured products, with the result that they will have lower impairment requirements.
The stage in the economic cycle:coverage ratios will tend to be lower in the earlier stages of deterioration in credit conditions. At this stage, Retail delinquent balances will be predominantly in the early delinquency cycles and
corporate names will have only recently moved to CRL categories. As such balances attract a lower impairment requirement, the CRL coverage ratio will be lower.
The balance of PPLs to CRLs:the impairment requirements for PPLs are lower than for CRLs, so the greater the proportion of PPLs, the lower the PCRL coverage ratio.
Write-off policies:the speed with which defaulted assets are written off will affect coverage ratios. The more quickly assets are written off, the lower the ratios will be, since stock with 100% coverage will tend to roll out of PCRL categories more quickly.
Details of the coverage ratios for the current period are shown in the above chart and may be found in the analysis of loans and advances and impairment section at page 127.
Monitoring weaknesses in portfolios
While the basic principles for monitoring weaknesses in Wholesale and Retail exposures are broadly similar, they reflect the differing nature of the assets. As a matter of policy, all facilities granted to corporate or Wholesale counterparties are subject to a review on, at least, an annual basis, even when they are performing satisfactorily.
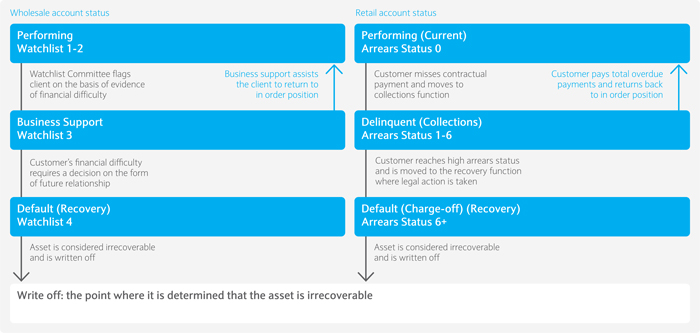
Wholesale portfolios1
Within the Wholesale portfolios, the Basel definitions of default are used as default indicators which have been aligned to the IAS 39 objective evidence of impairment. A default is triggered if individual identified impairment is recognised. Group definitions of default used are:
| § | bank puts the credit obligation on anon-accrued status |
| § | bank makes acharge-off or account specific identified impairment resulting from a significant perceived decline in credit quality |
| § | bank sells the credit obligation at a material credit-related economic loss |
| § | bank consents to a distressed restructuring of the credit obligation where this is likely to result in a diminished financial obligation caused by the material forgiveness or postponement of principal, interest or fees |
| § | bank triggers a petition for obligor’s bankruptcy or similar order |
| § | bank becomes aware of the obligor having sought or having been placed in bankruptcy or similar protection where this would avoid or delay repayment of the credit obligation to the banking group |
| § | bank becomes aware of an acceleration of an obligation by a firm |
| § | where the obligor is a bank – revocation of authorisation |
| § | where the obligor is a sovereign – trigger of default definition of an approved External Credit Assessment Institution (ECAI) such as a rating agency |
| § | obligor past due more than 90 days on any material credit obligation to the Group. |
Wholesale accounts that are deemed to contain heightened levels of risk are recorded on graded watchlists (WL) comprising three categories graded in line with the perceived severity of the risk attached to the lending, and its probability of default. Examples of heightened levels of risk may include, for example:
| § | a material reduction in profits |
| § | a material reduction in the value of collateral held |
| § | a decline in net tangible assets in circumstances which are not satisfactorily explained |
| § | periodic waiver requests or changes to the terms of the credit agreement over an extended period of time. |
These lists are updated monthly and circulated to the relevant risk control points. Once an account has been placed on WL, the exposure is monitored and, where appropriate, exposure reductions are effected. Should an account become impaired, it will normally, but not necessarily, have passed through each of the three categories, which reflects the need for increasing caution and control. While all counterparties, regardless of financial health, are subject to a full review of all facilities on at least an annual basis, more frequent interim reviews may be undertaken should circumstances dictate. Specialist recovery functions deal with counterparties in higher levels of WL, default, collection or insolvency. Their mandate is to maximise shareholder value, ideally via working intensively with the counterparty to help them
Note
| 1 | Includes certain Business Banking facilities which are recorded as Retail for |
| management purposes. |
| Barclays PLC and Barclays Bank PLC 2016 Annual Report on Form 20-F | 355 |
Barclays’ approach to managing risks
Management of credit risk and the internal ratings-based approach
to either return to financial health or, in the cases of insolvency, obtain the orderly and timely recovery of impaired debts. Where a counterparty’s financial health gives grounds for concern, it is immediately placed into the appropriate category.
Retail portfolios
Within the Retail portfolios, which tend to comprise homogeneous assets, statistical techniques more readily allow potential credit weaknesses to be monitored on a portfolio basis. The approach is consistent with the Group’s policy of raising a collective impairment allowance as soon as objective evidence of impairment is identified. Retail accounts can be classified according to specified categories of arrears status (or 30 day cycle), which reflects the level of contractual payments which are overdue. An outstanding balance is deemed to be delinquent when it is one day or “one penny” down and goes into default when it moves into recovery, normally 180 days. Impairment is considered at all stages of the customer’s outstanding obligations.
The probability of default increases with the number of contractual payments missed, thus raising the associated impairment requirement.
Once a loan has passed through a prescribed number of cycles, normally six, it will becharged-off and enter recovery status.Charge-off refers to the point in time when collections activity changes from the collection of arrears to the recovery of the full balance. In most cases,charge-off will result in the account moving to a legal recovery function or debt sale. This will typically occur after an account has been treated by a collections function. However, in certain cases, an account may be charged off directly from a performing status, such as in the case of insolvency or death.
The timings of thecharge-off points are established based on the type of loan. For the majority of products, the standard period for charging off accounts is six cycles (180 days past due date of contractual obligation). Earlycharge-off points are prescribed for unsecured assets. For example, in case of customer bankruptcy or insolvency, associated accounts are charged off within 60 days of notification.
Identifying potential credit risk loans
The Group reports potentially and actually impaired loans as PCRLs. PCRLs comprise two categories of loans: PPLs and CRLs.
PPLs are loans that are currently complying with repayment terms but where serious doubt exists as to the ability of the borrower to continue to comply with such terms in the near future. If the credit quality of a Wholesale loan on a WL deteriorates to the highest category, or a Retail loan deteriorates to delinquency cycle 2, consideration is given to including it within the PPL category.
Should further evidence of deterioration be observed, a loan may move to the CRL category. Events that would trigger the transfer of a loan from the PPL to the CRL category include a missed payment or a breach of covenant. CRLs comprise three classes of loans:
Impaired loans: comprise loans where an individually identified impairment allowance has been raised and also include loans which are fully collateralised or where indebtedness has already been written down to the expected realisable value. This category includes all Retail loans that have been charged off to legal recovery. The category may include loans, which, while impaired, are still performing.
Accruing past due 90 days or more: comprises loans that are 90 days or more past due with respect to principal or interest. An impairment allowance will be raised against these loans if the expected cash flows discounted at the effective interest rate are less than the carrying value.
Impaired and restructured loans: comprises loans not included above where, for economic or legal reasons related to the debtor’s financial difficulties, a concession has been granted to the debtor that would not otherwise be considered. Where the concession results in the expected cash flows discounted at the effective interest rate being less than the loan’s carrying value, an impairment allowance will be raised. See Forbearance and other concession programmes below for more detail.
Allowances for impairment and other credit provisions
The Group establishes, through charges against profit, impairment
allowances and other credit provisions for the incurred loss inherent in the lending book. Under IFRS, impairment allowances are recognised where there is objective evidence of impairment as a result of one or more loss events that have occurred after initial recognition, and where these events have had an impact on the estimated future cash flows of the financial asset or portfolio of financial assets. Impairment of loans and receivables is measured as the difference between the carrying amount and the present value of estimated future cash flows discounted at the financial asset’s original effective interest rate. If the carrying amount is less than the discounted cash flows, then no further allowance is necessary.
As one of the controls to ensure that adequate impairment allowances are held, movements in impairment to individual names with a total impairment allowance of £10m or more are presented to the GSCO for approval.
Individually assessed impairment
Impairment allowances are measured individually for assets that are individually significant, and collectively where a portfolio comprises homogenous assets and where appropriate statistical techniques are available. In terms of individual assessment, the principal trigger point for impairment is the missing of a contractual payment which is evidence that an account is exhibiting serious financial problems, and where any further deterioration is likely to lead to failure. Details of other trigger points can be found above. Two key inputs to the cash flow calculation are the valuation of all security and collateral, as well as the timing of all asset realisations, after allowing for all attendant costs. This method applies mainly in the Wholesale portfolios.
Collectively assessed impairment
For collective assessment, the principal trigger point for impairment is the missing of a contractual payment, which is the policy consistently adopted across all credit cards, unsecured loans, mortgages and most other Retail lending. The calculation methodology relies on the historical experience of pools of similar assets; hence the impairment allowance is collective. The impairment calculation is typically based on a roll-rate approach, where the percentage of assets that move from the initial delinquency to default is derived from statistical probabilities based on historical experience. Recovery amounts are calculated using a weighted average for the relevant portfolio. This method applies mainly to the Retail portfolios and is consistent with Group policy of raising an allowance as soon as impairment is identified. Unidentified impairment is also included in collective impairment.
Impairment for losses incurred but not specifically identified
Unidentified impairment allowances are also raised to cover losses which are judged to be incurred but not yet specifically identified in customer exposures at the balance sheet date, and which, therefore, have not been specifically reported. The incurred but not yet reported calculation is based on the asset’s probability of moving from the performing portfolio to being specifically identified as impaired within the given emergence period and then on to default within a specified period, termed as the outcome period. This is calculated on the present value of estimated future cash flows discounted at the financial asset’s effective interest rate. The emergence and outcome periods vary across products.
Wholesale portfolios
Impairment in the Wholesale portfolios is generally calculated by valuing each impaired asset on a case by case basis, i.e. on an individual assessment basis. A relatively small amount of Wholesale impairment relates to unidentified or collective impairment; in such cases, impairment is calculated using modelled Probability of Default (PD) x Loss Given Default (LGD) x Exposure at Default (EAD) adjusted for an emergence period.
Retail portfolios
For Retail portfolios, the impairment allowance is mainly assessed on a collective basis and is based on the drawn balances adjusted to take into account the likelihood of the customer defaulting at a particular point in time (PDpit) and the amount estimated as not recoverable (LGD). The basic calculation is:
Impairment allowance = Total outstandings x PDpit x LGD
| 356 | Barclays PLC and Barclays Bank PLC 2016 Annual Report on Form 20-F |
Barclays’ approach to managing risks
Management of credit risk and the internal ratings-based approach
The PDpit increases with the number of contractual payments missed thus raising the associated impairment requirement.
In Retail, the current policy also incorporates a high risk segment which is included in the unidentified impairment calculation. High risk segments are those which can be demonstrated to experience higher levels of loss within the performing segment. This segmentation allows for earlier identification of potential loss in a portfolio. Unidentified impairment is also referred to as collective impairment. This is to reflect the impairment that is collectively held against a pool of assets where a loss event has occurred, but has not yet been captured.
Sensitivity of the impairment to key assumptions
Wholesale portfolios
Impairment in the Wholesale portfolios is generally calculated by valuing each impaired asset on a case by case basis, and is not therefore primarily model-driven. As such, the key assumptions that would have the most impact on impairment provisions in the Wholesale portfolios are the valuations placed upon security and collateral held and the timing of asset realisations.
When calculating impairment, estimated future cash flows are discounted at the financial asset’s original effective interest rate. At present, in Wholesale portfolios, the impact of discounting is relatively small in itself but would rise with reference rates. In addition, to the extent that a rise in interest rates impacted economic growth and/or serviceability of Wholesale clients and customers, this would be expected to feed through in future impairment numbers.
Retail portfolios
For Retail portfolios, impairment is calculated predominantly using models. The models are developed using historical data and include explicit and implicit assumptions such as debt sale estimates, house price valuations and the distribution of accounts. Model monitoring and validation are undertaken regularly, at least annually, to ensure that models are fit for purpose. Further to this, the Group accounts for the impact of changes in the economic environment and lags resulting from the design of the models to ensure overall impairment adequacy. See Management adjustments to Models for Impairment for more information on key management judgements in 2016. See stress testing (page 161) for further information.
Emergence and outcome periods
To develop models to calculate the allowance for impairment it is first necessary to estimate the time horizons of these models. These time horizons are called the emergence and outcome periods Emergence Period relates to the time between a loss event occurring and that event becoming apparent via the account becoming delinquent and attracting identified impairment. Outcome is an analytically derived period taken to capture lifetime defaults associated with the observed loss event.
This methodology ensures that the Group captures the loss incurred at the correct balance sheet date. These impairment allowances are reviewed and adjusted at least quarterly by an appropriate charge or release of the stock of impairment allowances based on statistical analysis and management judgement. Where appropriate, the accuracy of this analysis is periodically assessed against actual losses. For further detail, see modelling of risk on pages 360 to 367.
Wholesale portfolios
For Wholesale portfolios in corporate banking and investment bank, the emergence period is portfolio specific and is based on the anticipated length of time from the occurrence of a loss event to identified impairment being incurred. The emergence period in corporate banking is derived from actual case file review. This is periodically benchmarked against the time taken to move between risk grades in internal watchlists, from WL1 or 2 into WL3, which is the level of risk that will attract a collective impairment allowance. Both methodologies produce similar results for the emergence period, which is currently six months. Within corporate banking, post model adjustments can be made to increase the emergence period for certain industry sectors to reflect, for example, a benign environment. The average life of the investment bank portfolio is estimated to be 18 months, during which time Investment Bank is exposed to losses on the portfolio. However, it is expected that incurred losses would become apparent within six months, therefore the
investment bank also uses asix-month emergence period.
Retail portfolios
During 2016, the Retail Impairment Policy was strengthened and required enhancements to modelling approaches to both emergence and outcome periods across the credit card portfolios, notably UK and US. Emergence periods at a product level, are shown in the table below.
Emergence periods | ||||
| Emergence period (months) | ||||
Product Type | 2016 | 2015 | ||
Credit cards | 3-3.5 | 2 | ||
Current Accounts | 4 | 4 | ||
Unsecured Loans | 4 | 4 | ||
Secured Loans | 6 | 6 | ||
Businesses undertake regular analysis, at least annually, to validate that the minimum emergence periods above continue to reflect the actual observed time between the occurrence of a loss event and entry to an impaired state, in order to ensure they remain appropriate and provide sufficient coverage of future losses.
Where any shortfalls are identified at a business or portfolio level, the prescribed minimum emergence periods are increased to reflect our mostup-to-date experience of customer behaviour.
The final approved emergence periods are incorporated within the rates used as part of the overall UI assessment, which now encompasses total outstanding balances on all accounts that are in order, and for which no identified impairment allowances are held.
Individual evidence based outcome periods are also derived at a business/portfolio level, Businesses are required to capture lifetime defaults allowing consideration to cure rates and future events, subject to a minimum floor of 80%.
Final outcome periods adopted arere-evaluated on an annual basis to ensure they continue to reflect the actual time elapsing from the initial indication of potential default to the default event.
Returning assets to a performing status
Wholesale portfolios
In Wholesale portfolios, an account may only be returned to a performing status when it ceases to have any actual or perceived financial stress and no longer meets any of the WL criteria, or once facilities have been fully repaid or cancelled. Unless a facility is fully repaid or cancelled, the decision in corporate banking to return an account to performing status may only be taken by the credit risk team, while within the investment bank, the decision can only be taken by the Barclays International Watch List Committee.
Retail portfolios
A Retail asset,pre-point ofcharge-off, may only be returned to a performing status in the following circumstances:
| § | all arrears (both capital and interest) have been cleared and payments have returned to original contractual payments |
| § | for revolving products, are-age event (see page 360) has occurred, when the customer is returned to anup-to-date status without having cleared the requisite level of arrears |
| § | for amortising products, which are performing on a programme of forbearance and meet the following criteria may be returned to the performing book classified as High Risk1: |
| – | no interest rate concessions must have been granted |
| – | restructure must remain within original product parameters (original term + extension) |
| – | twelve consecutive payments at the revised contractual payment amount must have been received post the restructure event. |
For residential mortgages, accounts may also be considered for rehabilitation postcharge-off, where customer circumstances have
Note
| 1 | The identification and subsequent treatment ofup-to-date customers who, either through an event or observed behaviour exhibit potential financial difficulty. High Risk includes customers who have suffered recent financial dislocation, i.e. prior forbearance orre-age. |
| Barclays PLC and Barclays Bank PLC 2016 Annual Report on Form 20-F | 357 |
Barclays’ approach to managing risks
Management of credit risk and the internal ratings-based approach
changed. The customer must clear all unpaid capital and interest, and confirm their ability to meet full payments going forward.
Recovery units
Recovery units are responsible for exposures where deterioration of the counterparty/customer credit profile is severe, to the extent that timely or full recovery of exposure is considered unlikely and default has occurred or is likely in the short term. Recovery teams set and implement strategies to recover the Group’s exposure through realisation of assets and collateral, inco-operation with counterparties/customers and where this is not possible through insolvency and legal procedures.
In Wholesale, for a case to be transferred to a recovery unit, it must be in default and have ceased to actively trade or be in insolvency. In Retail, the timings of thecharge-off points to recovery units are established based on the type of loan. For the majority of products, the standard period for charging off accounts is six missed contractual payments (180 days past due date of contractual obligation) unless a Forbearance programme is agreed. Early points are prescribed for unsecured assets. For example, in case of customer bankruptcy or insolvency, associated accounts are charged off within 60 days of notification. See recovery information included in Analysis of Specific Portfolio and Asset Types section in the 2016 Annual Report.
Foreclosures in process and properties in possession
Foreclosure is the process where the bank initiates legal action against a customer, with the intention of terminating the loan agreement whereby the bank may repossess the property subject to local law and recover amounts it is owned. This process can be initiated by the bank independent of the impairment treatment and it is therefore possible that the foreclosure process may be initiated while the account is still in collections (delinquent) or in recoveries (postcharge-off) where the customer has not agreed a satisfactory repayment schedule with the bank.
Properties in possession include properties held as ‘loans and advances to customers’ and properties held as ‘other real estate owned’.
Held as ‘loans and advances to customers’ (UK and Italy) refers to the properties where the customer continues to retain legal title but where the bank has enforced the possession order as part of the foreclosure process to allow for the disposal of the asset, or the court has ordered the auction of the property.
Held as ‘other real estate owned’ (South Africa) refers to properties where the bank has taken legal ownership of the title as a result of purchase at an auction or similar and treated as ‘other real estate owned’ within other assets on the bank’s balance sheet.
Writing off assets
Write-off refers to the point where it is determined that the asset is irrecoverable, it is no longer considered economically viable to try and recover the asset, it is deemed immaterial, or full and final settlement is reached and a shortfall remains. In the event ofwrite-off, the customer balance is removed from the balance sheet and the impairment reserve held against the asset is released.
The timing and extent of write-offs may involve some element of subjective judgement. Nevertheless, awrite-off will often be prompted by a specific event, such as the inception of insolvency proceedings or other formal recovery action, which makes it possible to establish that some or the entire advance is beyond realistic prospect of recovery. The position of impaired loans is also reviewed at least quarterly to ensure that irrecoverable advances are being written off in a prompt and orderly manner and in compliance with any local regulations.
For Retail portfolios, the timings of thewrite-off points are established based on the type of loan. For unsecured, assets in the recoveries book will bewritten-off if the required qualifying repayments are not made within a rolling twelve-month period. For secured loans, the shortfall after the receipt of the proceeds from the disposal of the collateral is written off within three months of that date if no repayment schedule has been agreed with the borrower. Such assets are only written off once all the necessary procedures have been completed and the amount of the loss has been determined.
Subsequent recoveries of amounts previously written off are written
back and hence decrease the amount of the reported loan impairment charge in the income statement. In 2016, total write-offs of impaired financial assets decreased 12% to £2.0bn (2015: £2.28bn).
Total write-offs of financial assets (£m)a
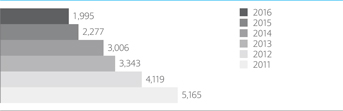
Note
| a | 2016 figure excludes Africa |
Forbearance and other concession programmes
Forbearance programmes
Forbearance takes place when a concession is made on the contractual terms of a facility in response to an obligor’s financial difficulties. The Group offers forbearance programmes to assist customers and clients in financial difficulty through agreements that may include accepting less than contractual amounts due where financial distress would otherwise prevent satisfactory repayment within the original terms and conditions of the contract. These agreements may be initiated by the customer, the bank or a third party.
Forbearance programmes for Wholesale portfolios
The majority of Wholesale client relationships are individually managed, with lending decisions made with reference to specific circumstances and on bespoke terms.
Forbearance occurs when, for reasons relating to the actual or perceived financial difficulty of an obligor, a concession is granted below the Group’s current standard rates (i.e. lending criteria below the Group’s current lending terms), that would not otherwise be considered. This includes all troubled debt restructures granted below our standard rates.
Forbearance would typically be evident where the concession(s) agreed impact the ability to repay debt or avoid recognising a default with a lack of appropriate commercial balance and risk mitigation/structural enhancement of benefit to the Group in return for concession(s).
The following list is not exhaustive but provides some examples of instances that would typically be considered to be evidence of forbearance:
| § | a reduction of current contractual interest rate for the sole purpose of maintaining performing debt status, with no other improvement to terms of benefit to the Group |
| § | non-enforcement of a material covenant breach impacting the counterparty’s ability to repay |
| § | converting a fully or partially amortising facility to a bullet repayment at maturity, with no other improvement to terms of benefit to the Group, for the sole purpose of avoiding a payment default due to customer’s inability to meet amortisation |
| § | extension in maturity date for a project finance facility that gives an effective contractual term longer than the underlying project contract being financed |
| § | any release of a material security interest without receiving appropriate value by way of repayment/ alternate security offered or other improvement in terms available to the Group commensurate with the value of the security released. |
Where a concession is granted that is not a result of financial difficulty and/or is within our current market terms, the concession would not amount to forbearance. For example, a commercially balanced restructure within the Group’s current terms which involves the granting concessions and receiving risk mitigation/structural enhancement of benefit to the Group would not be indicative of forbearance.
The following list (not exhaustive) gives some examples of instances
| 358 | Barclays PLC and Barclays Bank PLC 2016 Annual Report on Form 20-F |
Barclays’ approach to managing risks
Management of credit risk and the internal ratings-based approach
that would not typically be considered to be forbearance:
| § | temporary/permanent waivers/resets of covenants agreed in line with our current terms |
| § | amending contractual maturity to meet current lending terms that results in a previously amortising facility having a bullet repayment as a consequence of shorter maturity date |
| § | equity/warrants taken to increase return to the Group without compromising contractual interest |
| § | extension of maturity date where the extension is within the normally granted terms for the type of facility in question |
| § | release of a material security interest where commensurate value is received by way of repayment/ other security offered. |
Cases where a technical default may have occurred, the Group has decided to reserve its position but does not consider the default to be sufficient to impact the counterparty’s ability to pay, would not typically be considered forbearance (as the counterparty would continue to meet its payment obligations under existing terms).
The Troubled Assets Policy requires that a permanent record is retained of all individual cases of forbearance, and upon granting forbearance the counterparty is placed on WL. The counterparty then remains on WL and is flagged as being in forbearance for a minimum of 12 months from the date forbearance is applied. Counterparties may be removed from WL status within 12 months in exceptional circumstances, e.g. full repayment of facilities or significant restructuring. Counterparties placed on WL status are subject to increased levels of credit risk oversight.
Counterparties who have been granted forbearance are classified as a Basel ‘unlikeliness’ to pay default for capital purposes, with PD of 1 throughout the period that they remain classified as being in forbearance. This is on the basis that, without intervention by the Group, the counterparties are unlikely to meet their obligations in full which would lead to default.
Impairment is assessed on an individual basis and recognised where relevant impairment triggers have been reached including where counterparties are in arrears and require renegotiation of terms. Forbearance is considered to be an indicator that impairment may be present and an impairment test is performed for all cases placed in forbearance.
Given that these loans have already been assessed for impairment at the point of being classified as being in forbearance, the Group does not have additional procedures to evaluate the likelihood that these loans would default within the loss emergence and confirmation periods.
A control framework exists along with regular sampling to ensure policies for watchlist and impairment are enforced as defined and to ensure that all assets have suitable levels of impairment applied. Portfolios are subject to independent assessment.
Aggregate data for Wholesale forbearance cases is reviewed by the Wholesale Credit Risk Management Committee.
Forbearance programmes for retail portfolios
Retail forbearance is available to customers experiencing financial difficulties. Forbearance solutions take a number of forms depending on individual customer circumstances. Short-term solutions focus on temporary reductions to contractual payments and may change from capital and interest payments to interest only. For loan customers with longer-term financial difficulties, term extensions may be offered, which may include interest rate concessions, For credit card customers with longer-term financial difficulties, a switch to a fully amortising plan may be offered, which may include an interest rate concession.
When an account is placed into a programme of forbearance, the asset will be classified as such for the remainder of its term, unless after 12 months it qualifies for reclassification, upon which it will be returned to theup-to-date book and classified as high risk for a further 12 month period. When the Group agrees to a forbearance programme with a customer, the impairment allowance recognises the impact on cash flows of the agreement to receive less than the original contractual payments. The Retail Impairment Policy prescribes the methodology for impairment of forbearance assets, which is measured by comparing the debt outstanding to the revised expected repayment. This results in
higher impairment, in general, than for fully performing assets, reflecting the additional credit risk attached to loans subject to forbearance.
Barclays has continued to assist customers in financial difficulty through the use of forbearance programmes. However, the extent of forbearance offered by the Group to customers and clients remains small in comparison to the overall size of the loan book.
The level of forbearance extended to customers in other Retail portfolios is not material and, typically, does not currently play a significant part in the way customer relationships are managed. However, additional portfolios will be added to this disclosure should the forbearance in respect of such portfolios become material.
A Retail loan is not considered to be renegotiated where the amendment is at the request of the customer, there is no evidence of actual or imminent financial difficulty and the amendment meets with all underwriting criteria. In this case it would be treated as a new loan. In the normal course of business, customers who are not in financial difficulties frequently apply for new loan terms, for example to take advantage of a lower interest rate or to secure a further advance on a mortgage product. Where these applications meet our underwriting criteria and the loan is made at market interest rates, the loan is not classified as being in forbearance. Only in circumstances where a customer has requested a term extension, interest rate reduction or further advance and there is evidence of financial difficulty is the loan classified as forbearance and included in our disclosures on forbearance.
Please see the credit risk performance section on page 183 for details of principal Retail assets currently in forbearance.
Impairment of loans under forbearance
Loans under forbearance programmes are subject to Group policy. In both Retail and Wholesale portfolios, identified impairment is raised for such accounts, recognising the agreement between the Group and customer to pay less than the original contractual payment and is measured using a future discounted cash flow approach comparing the debt outstanding to the expected repayment on the debt. This results in higher impairment, in general, being held for loans under forbearance than for fully performing assets, reflecting the additional credit risk attached to loans subject to forbearance.
Sustainability of loans under forbearance
The Group monitors the sustainability of loans for which forbearance has been granted.
Wholesale portfolios
In the Wholesale portfolios, counterparties that have been granted forbearance are placed on WL and therefore are subject to increased levels of credit risk oversight. Counterparties then remain on WL and are classified as being in forbearance with a PD of 1 for capital purposes for a minimum of 12 months from the date forbearance is applied until satisfactory performance is evidenced. Forbearance status and the related default treatment for capital can be removed after 12 months from being applied if any of the following criteria is met:
| § | the counterparty no longer benefits from a concession below our current market rates or reverts back to their original lending terms (prior to the concession being applied) |
| § | the counterparty ceases to have any actual or perceived financial stress |
| § | a significant restructure takes place which leads to a significant improvement in the credit profile of the counterparty. |
Counterparties may only be removed from being classified as being in forbearance with a PD of 1 for capital purposes within 12 months in exceptional circumstances, e.g. full repayment of facilities or significant restructuring that materially improves credit quality. Counterparties continuing to benefit from a concession below current market can be removed from WL and no longer be classified as in forbearance provided they do not meet any of the WL criteria and can evidence consistent satisfactory performance throughout the minimum twelve-month period.
| Barclays PLC and Barclays Bank PLC 2016 Annual Report on Form 20-F | 359 |
Barclays’ approach to managing risks
Management of credit risk and the internal ratings-based approach
Retail portfolios
In Retail portfolios, the type of forbearance programme offered should be appropriate to the nature and the expected duration of the customer’s financial distress. It is imperative that the solution agreed is both appropriate to that customer and sustainable, with a clear demonstration from the customer of both willingness and ability to repay. Before any permanent programme of forbearance is granted, an affordability assessment is undertaken to ensure suitability of the offer. When customers exit forbearance, the accounts are ring-fenced as a High Risk segment within theup-to-date book for a period of at least twelve months.
For disclosure on the Group’s accounting policy with respect to impairment, seepage 233 – and Note 7.
Other programmes
Retailre-aging activity
Re-aging refers to the placing of an account into anup-to-date position without the requisite repayment of arrears. There-age policy applies to revolving products only. No reduction is made to the minimum due payment amounts which are calculated, as a percentage of balance, with any unpaid principal included in the calculation of the following month’s minimum due payment.
The changes in timing of cash flows followingre-aging do not result in any additional cost to the Group. The following are the conditions required to be met before are-age may occur:
| § | the account must not have been previously charged off or written off |
| § | the borrower cannot be bankrupt, subject to an Individual Voluntary Arrangement (a UK contractual arrangement with creditors for individuals wishing to avoid bankruptcy), a fraud or deceased |
| § | the borrower must show a renewed willingness and ability to repay the debt. This will be achieved by the borrower making at least three consecutive contractual monthly payments or the equivalent cumulative amount. Contractual monthly payment is defined as the contractual minimum due. Funds may not be advanced for any part of this |
| § | the account must have been on book at least nine months (i.e. nine months prior to the three-month qualification period) |
| § | no account should bere-aged more than once within any twelve-month period, or more than twice in a five year period. |
Assets are considered to belong to a separate High Risk pool. Under High Risk, the performance of the assets is a risk characteristic and results in a higher probability of default being assigned to them in impairment models which meet the requirement of IAS 39,AG87-88. This results in an appropriately higher impairment allowance being recognised on the assets.
Retail small arrears capitalisation
All small arrears capitalisations are now considered a form of Forbearance, based on the European Banking Authority’s requirements for Supervisory Reporting on Forbearance andNon-Performing exposures.
Refinancing risk
This is the risk that the borrower or group of correlated borrowers may be unable to repay bullet-repayment loans at expiry, and will therefore need refinancing.
From a large corporates perspective, refinancing risk will typically be associated with loans that have an element of bullet repayment incorporated into the repayment profile. Refinancing risk is taken into account on a case by case basis as part of the credit review and approval process for each individual loan. The review will consider factors such as the strength of the business model and sustainability of the cash flows; and for bridge loans, the certainty of the sources of repayment and any associated market risk.
Commercial real estate loans will frequently incorporate a bullet repayment element at maturity. Where this is the case, deals are sized and structured to enable the Group to term out the loan if the client were unable to refinance the loan at expiry. Credit review will incorporate an examination of various factors that are central to this consideration, such as tenant quality, tenancy agreements (including break clauses), property quality and interest rate sensitivity.
Loans to small and medium enterprises (SMEs) will typically be either revolving credit lines to cover working capital needs or amortising exposures, with periodic refinancing to give the opportunity to review structure, pricing, etc.
Please refer to the maturity analysis for UK CRE and customers with interest-only home loans in the credit risk performance section in the 2016 Annual Report for more information.
Environmental risk
The Group has a dedicated Environmental Risk Management team, as part of the central Credit Risk Management function, recognising that environment is a mainstream credit risk issue. Environmental issues are required considerations in credit risk assessment, and environmental risk standards are included in the Wholesale Credit Risk Control Framework.
The Group’s approach to environmental credit risk management addresses risk under three categories, namely Direct risk and Indirect risk, which are covered below, and Reputation risk, on which more detail may be found on page 400.
Direct risk can arise when the Group takes commercial land as collateral. In many jurisdictions, enforcement of a commercial mortgage by the bank, leading to possession, potentially renders the Group liable for the costs of remediating a site if deemed by the regulator to be contaminated, including forpre-existing conditions. In the UK, the Group’s approach requires commercial land, if being pledged as collateral, to be subject to a screening mechanism. Where required further assessment of the commercial history of a piece of land and its potential for environmental contamination helps ensure any potential environmental degradation is reflected in the value ascribed to that security. It also identifies potential liabilities which may be incurred by the Group, if realisation of the security were to become a possibility.
Indirect riskcan arise when environmental issues may impact the creditworthiness of the borrower. For instance, incremental costs may be incurred in upgrading a business’ operations to meet emerging environmental regulations or tightening standards. In other circumstances, failure to meet those standards may lead to fines. Environmental impacts on businesses may also include shifts in the market demand for goods or services generated by our customers, or changing supply chain pressures. Environmental considerations affecting our clients can be varied. The bank has developed a series of environmental risk briefing notes, covering ten broad industry headings ranging from Agriculture and Fisheries to Oil and Gas, from Mining and Metals to Utilities and Waste Management. These briefing notes are available to colleagues in business development and credit risk functions across the organisation, outlining the nature of environmental and social risks of which to be aware, as well as the factors which mitigate those risks.
Internal ratings based (IRB) approach
The IRB approach largely relies on internal models to derive the risk parameters/components used in determining the capital requirement for a given exposure. The main risk components include measures of the probability of default (PD), loss given default (LGD) and the exposure at default (EAD). The IRB approach is divided into three alternative applications,Own-Estimates, Supervisory Estimates and Specialised Lending:
Own-Estimates IRB (OEIRB): Barclays uses its own models to estimate PD, LGD and EAD to calculate given risk exposures for various asset classes and the associated Risk Weighted Assets (RWAs)
Supervisory IRB (SIRB): Barclays uses its own PD estimates, but relies on supervisory estimates for other risk components. The SIRB approach is particularly used to floor risk parameters for wholesale credit exposures where default data scarcity may impact the robustness of the model build process.
Specialised Lending IRB: For specialised lending exposures for which PD cannot be modelled reliably, Barclays uses a set of risk weights defined in the relevant regulation, and takes into account a range of prescribed risk factors.
While in the past the industry has used the terms ‘Advanced’,
| 360 | Barclays PLC and Barclays Bank PLC 2016 Annual Report on Form 20-F |
Barclays’ approach to managing risks
Management of credit risk and the internal ratings-based approach
‘Foundation’ and ‘Slotting’ IRB, the current enforcing regulation (the Capital Requirements Regulation) does not use these terms.
The IRB calculation for credit risk
For both OEIRB and SIRB approaches, Barclays uses the regulatory prescribed risk-weight functions for the purposes of deriving capital requirements.
In line with regulatory requirements, Long Run Average PD and downturn LGD and CF (Conversion Factor) estimates are used for each customer/facility to determine regulatory capital for all exposures in scope.
For the purpose of pricing and existing customer management, point in time (PIT) PD, LGD and EAD are generally used as these represent the best estimates of risk given the current position in the credit cycle. Whilst Long Run Average PDs are always tested at grade/pool level, PIT PDs are also used for the calculation of capital on certain retail unsecured products, in line with regulation.
Applications of internal ratings
The three components – PD, LGD and CF – are the building blocks used in a variety of applications that measure credit risk across the entire portfolio:
| § | credit approval: PD models are used in the approval process in both retail and wholesale portfolios. In high-volume retail portfolios, application and behaviour scorecards are frequently used as decision-making tools. In wholesale and some retail home loans portfolios, PD models are used to direct applications to an appropriate credit-sanctioning level |
| § | credit grading:this was originally introduced in the early 1990s to provide a common measure of risk across the Group. Barclays now employs a21-point scale of default probabilities. These are shown in page 121 |
| § | risk-reward and pricing:PD, LGD and CF estimates are used to assess the profitability of deals and portfolios and to facilitate risk-adjusted pricing and strategy decisions |
| § | risk appetite:estimates are used to calculate the expected loss and the potential volatility of loss in the Group’s risk appetite framework. See page 348 |
| § | impairment calculation: under IAS 39, many collective impairment estimates incorporate the use of PD and LGD models. |
| § | collections and recoveries:model outputs are used to identify segments of the portfolio where collection and recovery efforts should be prioritised |
| § | economic capital (EC) calculation:most EC calculations use similar inputs as the regulatory capital (RC) process |
| § | risk management information:Risk generate reports to inform senior management on issues such as business performance, risk appetite and EC consumption. Model outputs are used as key indicators in those reports. Risk also generates regular report on model risk, which covers model accuracy, model use, input data integrity and regulatory compliance among other issues. |
Ratings processes and models for credit exposures
Wholesale credit
To construct ratings for wholesale customers, including financial institutions, corporates, specialised lending, purchased corporate receivables and equity exposures, Barclays complements its internal models suite with external models and rating agencies’ information. A model hierarchy is in place requiring users/credit officers to adopt a consistent approach/model to rate each counterparty based on the asset class type and the nature of the transaction. Barclays has 144 internally approved Wholesale models, of which 38 are used to calculate regulatory capital for credit exposures.
Wholesale PD models
Barclays employs a range of methods in the construction of these models:
| § | statistical models are used for our high volume portfolios such as small or medium enterprises (SME). The models are typically built using large amounts of internal data, combined with supplemental |
data from external data suppliers where available. Wherever external data is sourced to validate or enhance internally held data, similar data quality standards to those applicable to the internal data management are enforced |
| § | structural models incorporate in their specification the elements of the industry-accepted Merton framework to identify the distance to default for a counterparty. This relies upon the modeller having access to specific time series data or data proxies for the portfolio. Data samples used to build and validate these models are typically constructed by appropriately combining data sets from internal default observations with comparable externally obtained data sets from commercial providers such as rating agencies and industry data gathering consortia |
| § | expert lender models are used for those parts of the portfolio where there is insufficient internal or external data to support the construction of a statistically robust model. These models utilise the knowledge andin-depth expertise of the senior credit officers dealing with the specific customer type being modelled. For all portfolios with a low number of default observations, the Group adopts specific regulatory rules, methodologies and floors in its estimates to ensure that the calibration of the model meets the current regulatory criteria for conservatism. |
Wholesale LGD models
The LGD models typically rely on statistical analysis to derive the model drivers (including seniority of claim, collateral coverage, recovery periods, industry and costs) that best explain the Group’s historical loss experience, often supplemented with other relevant and representative external information where available. The models are calibrated to downturn conditions for regulatory capital purposes and, where internal and external data is scarce, they are subject to SIRB floors to ensure the calibration of the model meets the current regulatory criteria for conservatism.
Wholesale CF models
The wholesale CF models estimate the potential utilisation of the currently available headroom based on statistical analysis of the available internal and external data and past client behaviour. As is the case with the LGD models, the CF models are subject to downturn calibration for regulatory capital purposes and to floors where data is scarce.
Retail credit
Retail banking and cards operations have long and extensive experience of using credit models in assessing and managing risks. As a result, models play an integral role in customer approval and management decisions. Most retail portfolios are data rich; consequently, most models are builtin-house using statistical techniques and internal data. Exceptions are some expert lender models (similar to those described in the wholesale context) where data scarcity precludes the statistically robust derivation of model parameters. In these cases, appropriately conservative assumptions are typically used, and wherever possible these models are validated/benchmarked against external data. Barclays has 235 internally approved retail models, of which 25 are used to calculate regulatory capital for credit exposures.
Retail PD models
Application and behavioural scorecards are most commonly used for retail PD modelling:
| § | application scorecards are derived from historically observed performance of new clients. They are built using customer demographic and financial information, supplemented by credit bureau information where available. Through statistical techniques, the relationship between these candidate variables and the default marker is quantified to produce output scores reflecting a PD. These scores are used primarily for new customer decisioning but are, in some cases, also used to allocate a PD to new customers for the purpose of capital calculation |
| § | behavioural scorecards differ from application scorecards in that they rely on the historically observed performance of existing clients. The statistically derived output scores are used for existing customer management activities as well as for the purpose of capital calculation. |
| Barclays PLC and Barclays Bank PLC 2016 Annual Report on Form 20-F | 361 |
Barclays’ approach to managing risks
Management of credit risk and the internal ratings-based approach
Retail LGD models
Retail LGD models are built using bespoke methods chosen to best model the operational recovery process and practices. In a number of secured portfolios, LGD drivers are parameterised with market factors (e.g. house price indices, haircut of the property value) to capture market trends. For most unsecured portfolios, where recoveries are not based on collateral, statistical models of cash flows are used to estimate ultimate recoveries and LGDs. In all instances, cash flows are discounted to the point of default by using bespoke country and product level factors. For capital calculations, customised economic downturn adjustments, taking into account loss and default dependency, are made to adjust losses to stressed conditions.
Retail CF models
CF models within retail portfolios are split into two main methodological categories. The general methodology is to derive product level credit conversion factors (CCFs) from historical balance migrations, typically for amortising product, such as mortgages, consumer loans. These are frequently further segmented at a bucket level (e.g. by delinquency). The most sophisticated CF models are based on behavioural factors, determining customer level CCFs from characteristics of the individual facility, typically for overdrafts and credit cards. For capital calculations, customised downturn adjustments, taking into account loss and default dependency, are made to adjust for stressed conditions.
The control mechanisms for the rating system
Model risk has been identified as a risk to be managed under the ERMF. Consequently, the GMRP and its supporting standards covering theend-to-end model life cycle are in place to support the management of risk models.
Key controls captured by the Model Risk Policy cover:
| § | model governance is anchored in assigning accountabilities and responsibilities to each of the main stakeholders: |
– model owner – each model must have a model owner who has overall accountability for the model
– model developers – support the model owner and drive development according to model owner defined scope/purpose
– independent Validation Unit (IVU) – responsible for independent review, challenge and approval of all models.
| § | externally developed models are subject to the same governance standards as internal models |
| § | models are classified by Materiality (High/Low) and Complexity(Complex/Non-complex) |
| § | all models must be validated and approved by IVU before initial implementation/use |
| § | models are subject to annual review by the model owner and periodic validation and approval by IVU |
| § | all models must be recorded in the Group Models Database (GMD), which records model owners and developers |
| § | model owners must ensure there is evidence that model implementation is accurate and tested. |
If a model is found to performsub-optimally, it may be rejected and/or subjected to a Post Model Adjustment (PMA) before approval for continued use is granted.
The Independent Validation Unit (IVU) reporting line is separate from that of the model developers. IVU is part of Model Risk Management (MRM), and the head of MRM reports to Barclays’ Chief Risk Officer. The model development teams have separate reporting lines to the Barclays UK and Barclays International Chief Risk Officers, who in turn report to the Barclays Chief Risk Officer.
Under the 3 lines of defence approach stated in ERMF, the actions of all parties with responsibilities under the Group Model Risk Policy are subject to independent audit by Barclays Internal Audit.
Validation processes for credit exposures
Validation of credit models covers observed model performance but also the scope of model use, interactions between models, data use and quality, the model’s theoretical basis, regulatory compliance and any remediations to model risk that are proposed or in place.
The following sections provide more detail on processes for validating the performance of each model type.
Wholesale PD models
To assess model calibration, the Independent Validation Unit compares the model prediction of default frequency to the realised internal default rate both over the latest year and over all observable model history. Due to the relative infrequency of default of large wholesale obligors, along-run perspective on default risk is vital. Default rates are also compared to external benchmarks where these are relevant and available, such as default rates in rating-agency data. In practice, since financial crises have been infrequent, IVU would expect the model PD used in calculating regulatory capital to exceed the long run observed default rate.
For portfolios where few internal defaults have been observed, portfolio PD is compared to the ‘most prudent PD’ generated by the industry-standard Pluto-Tasche method, using conservative parameter assumptions.
To assess model discrimination performance, the IVU compares the rank-ordering of internal ratings with the pattern of defaults, if any, to construct the industry-standard Gini statistic or similar. The ordering of internal ratings is also compared to the ordering of internal and external comparator ratings where these are available.
Mobility metric and population stability index is also routinely calculated to infer relevant aspects of the model performance.
Wholesale LGD models
To assess model calibration, model outputs are compared to the LGD observed on facilities that entered default in ‘downturn’ periods, as requested by the regulator. Both internal and external data on observed LGD are examined, but preference is given to internal data, since these reflect Barclays’ recover policies. Comparisons are performed by product seniority and security status and for other breakdowns of the portfolio. Model outputs are also compared to thelong-run average of observed LGD. The time-lapse between facility default and the closure of recovery is varied and may be long. In the construction of observed LGD, recoveries are discounted back to the date of default at a conservative interest rate, following regulatory guidance of at least 9%. As noted above, regulatory floors are in place for the LGD used in calculating regulatory capital for exposure types where few default observations are available.
To assess model discrimination, the IVU compares the rank-ordering of model predictions to that of observed LGD and calculates the Spearmans Rank correlation coefficient and other measures of discrimination.
Wholesale CF models
To assess model calibration, the conversion factors observed in internal data are compared to model predictions, both in downturn periods as defined by the regulator, and on along-run average basis. Comparisons are performed separately for different product types. Validation focuses on internal data, with external data used as a benchmark, because conversion factors are related to banks’ facility management practices. Particular care is used in separating cases where facility limits changed between the date of observation and default, as these can lead to measurements of conversion factors that take extreme values. As a benchmark only, total predicted exposure at default for all defaulted facilities is compared to realised exposure at default. This comparison is done because it is relatively insensitive to extreme values for observed CF on some facilities. The primary validation tests are performed on facility-weighted rather then exposure-weighted basis, however, in line with the relevant regulations.
Retail PD models
To assess rating philosophy, i.e. whether it is aPoint-in-Time system orThrough-the-Cycle system, the Independent Validation Unit produces migration indices to investigate relevant grade migration.
To assess model calibration, the Independent Validation Unit compares the model prediction of default frequency to the realised internal default rate by grade/pool as required by CRR. As a minimum, IVU expects the expected default rate is at least equal or above the level of observed
| 362 | Barclays PLC and Barclays Bank PLC 2016 Annual Report on Form 20-F |
Barclays’ approach to managing risks
Management of credit risk and the internal ratings-based approach
default rate.
To assess model discrimination performance, the IVU compares the rank-ordering of internal ratings with the pattern of defaults, if any, to construct the industry-standard Gini statistic or similar.
To assess model stability, the population distribution, the character distribution and parameter estimates are assessed individually.
A 0.03% regulatory floor is in place for the facility level PD used in calculating regulatory capital.
Retail LGD models
LGD model components are compared to observed value respectively, this may include but not limited to probability of possession/charge off, forced sale discount, time from default to crystallisation and discount rate. Where components are similar to PD in nature, the approach stated in the PD section applies to assess the calibration, discrimination and stability of the component.
The calibration of the overall LGD is assessed through the expected against actual comparison by default flow and stock population respectively. The downturn LGD appropriateness is further assessed to ensure that the downturn LGD is equal to or above thelong-run average of observed LGD. This exercise is performed at grade/pool level according to CRR. In the construction of observed LGD, recoveries are discounted back to the date of default at a conservative interest rate, following regulatory guidance. As noted above, regulatory floors are in place for the LGD used in calculating regulatory capital where appropriate (this includes but not limited to thenon-zero LGD floor at account level, the collateral uncertainty consideration, the portfolio level LGD floor and UK property haircut floor).
The primary validation tests are performed on facility-weighted rather then exposure-weighted basis, however, in line with the relevant regulations.
Retail CF models
The calibration of the overall CF is assessed through the expected
against actual comparison by default flow and stock population respectively. The downturn CF appropriateness is further assessed to ensure that the downturn CF is equal to or above thelong-run average of observed CF. This exercise is performed at grade/pool level according to CRR. Particular care is used in separating cases where facility limits changed between the date of observation and default, as these can lead to measurements of conversion factors that take extreme values.
Depending on the modelling approach, the relevant measure used for PD/LGD may be used accordingly to assess calibration, discrimination and stability.
CF is floored so that the exposure at the point of default cannot be less than exposure observed at point of regulatory reporting.
The primary validation tests are performed on facility-weighted rather then exposure-weighted basis, however, in line with the relevant regulations.
Table 84 for credit risk model characteristics shows modelled variables to calculate RWAs (PD, LGD, and EAD) at portfolio level, with number of models and their significance in terms of RWAs, model method or approach, numbers of years of data used, Basel asset class of the customer or client, and regulatory thresholds applied.
Selected features of material models
The table below contains selected features of the Group’s AIRB credit risk models which are used to calculate RWAs, with their significance in terms of RWAs, model methodology or approach, numbers of years of data used, Basel asset class of the customer or client, and any regulatory thresholds applied. RWAs have been reported with the BUK and BI split. Please note that RWAs reported are as of Sep’16 since complete reconciled information was not published for Dec’16 at the time of reporting.
| § | PD models listed in the table account for £106bn of total AIRB approach RWAs |
| § | LGD models listed in the table account for £119bn of total AIRB approach RWAs |
Table 84 IRB credit risk models’ selected features
| ||||||||||||||||||||
| Size of associated portfolio | Applicable | |||||||||||||||||||
| Component | (RWAs) | Number of | Basel asset | industry-wide | ||||||||||||||||
| modelled | Portfolio | BUK (£m) | BI (£m) | Model description and methodology | years loss data | classes measured | regulatory thresholds | |||||||||||||
| PD | Publicly traded corporate | 121 | 28,104 | Statistical model using a Merton-based methodology. It takes quantitative factors as inputs. | > 10 Years | Corporate | | PD floor of 0.03% | | |||||||||||
| PD | Customers rated by Moody’s and S&P | 11 | 27,009 | Rating Agency Equivalent model converts agency ratings into estimated equivalent PIT default rates using credit cycles based on Moody’s data. | > 10 Years | | Corporate, Financial Institutions and Sovereigns | | | PD floor of 0.03% for corporate and institutions | | |||||||||
| PD | Corporate and SME customers with turnover < £20m | 4,977 | 4,548 | Statistical models that uses regression techniques to derive relationship between observed default experience and a set of behavioral variables. | 6 - 10 Years | | Corporate, Corporate SME, | | | PD floor of 0.03% | | |||||||||
| PD | Corporate customers with turnover >= £20m | 221 | 10,618 | Statistically derived models sourced from an external vendor (Moody’s RiskCalc) | 6 - 10 Years | Corporate | | PD floor of 0.03% | | |||||||||||
| PD | Home Finance | 16,043 | – | Statistical scorecards estimated using regression techniques, segmented along arrears status and portfolio type. | 6 - 10 Years | | Secured By Real Estate (residential andbuy-to-let mortgages) | | | PD floor of 0.03% | | |||||||||
| PD | Barclaycard UK | 15,110 | – | Statistical scorecards estimated using regression techniques, segmented along arrears status and portfolio type. | 6 - 10 Years | | Qualifying Revolving Retail (QRRE) | | | PD floor of 0.03% | | |||||||||
| Barclays PLC and Barclays Bank PLC 2016 Annual Report on Form 20-F | 363 |
Barclays’ approach to managing risks
Management of credit risk and the internal ratings-based approach
Table ## IRB credit risk models’ selected features continued
| ||||||||||||||
| Size of associated portfolio | Applicable industry-wide regulatory thresholds | |||||||||||||
Component modelled | (RWAs) | Number of years loss data | Basel asset classes measured | |||||||||||
Portfolio | BUK (£m) | BI (£m) | Model description and methodology | |||||||||||
| LGD | Corporate and Financial Institutions | – | 53,992 | Model based on a statistical regression that outputs a long run average LGD by estimating the expected value of recovery. Inputs include industry, seniority, instrument, collateral and country. | > 10 Years | Corporate, Financial Institutions | LGD floor of 45% based on low default portfolio criteria | |||||||
| LGD | All business customers (excluding certain specialised sectors) | 4,938 | 29,292 | Model is based on a function estimated using actual recoveries experience. It takes account of collateral value and an allowance for non collateral recovery. | > 10 Years | Corporate, | LGD floor of 5% | |||||||
| LGD | UK Home Finance | 16,043 | – | Data driven estimates of loss and probability of possession | 6 - 10 Years | Secured By Real Estate (residential andbuy-to-let mortgages) | The portfolio average downturn LGD is floored at 10% | |||||||
| LGD | Barclaycard UK | 15,110 | – | Statistical models combining segmented regression and other forecasting techniques | 6 - 10 Years | Qualifying Revolving Retail (QRRE) | – | |||||||
Credit Risk IRB models performance back testing - estimated versus actual
The following tables compare the PDs and LGDs estimated by the Group’s IRB models with the actual default and loss rates. Comparisons are based on the assets in IRB approach portfolios and are used to assess performance of the models. The estimates and actual figures represent direct outputs from the models rather than outputs used in regulatory capital calculations that may be adjusted to apply more conservative assumptions.
Back testing results are reported within each IRB exposure class at overall Group level both for Retail and Wholesale excluding Africa, as the historical Barclays UK and Barclays International split is not available for the Wholesale obligors. The Barclays UK and Barclays International classification has been initiated from 2016 and we intend to report back testing results at Barclays UK and Barclays International level from next year onwards.
Risk models are subject to the Group Model Risk Policy which contains detailed guidance on the minimum standards for model risk management. For example, PDs must be estimated over a sufficient period, show sufficient differentiation in predictions for different customers, show conservatism where data limitations exist, and follow prescriptive techniques. These standards are achieved via an independent validation process through appropriately independent experts. Once validated and correctly implemented, models are subject to regular monitoring to ensure they can still be used. Comparing model estimates with actual default rates for PD and loss rates for LGD form part of this monitoring. Such analysis is used to assess and enhance the performance of the models.
Further detail is provided in the management of model risk on page 396.
PD measures
| § | The model estimated PIT PDs are compared with the actual default rates by PD ranges within each IRB exposure class. PD ranges, estimated PDs and actual default rates are based on the existing models default definitions. UK Cards is the only CRD IV compliant portfolio for the reporting period, for the remaining portfolios CRD IV compliant models are either under implementation or currently under development/approval as per the CRD IV roll out plan agreed with the PRA. |
| § | The estimated PDs are forward-looking average PD by the model at the beginning of the twelve-month period, i.e. average PD of the Nov’15non-defaulted obligors including inactive andnon-borrowers. Both EAD weighted and simple average PDs have been reported. |
| § | The estimated PDs are compared with the simple average of historical annual default rates over the past 5 years, starting Nov’11. |
| § | The PIT PD is used as a predicted measure in internal monitoring and annual validation of the models. In contrast, the capital calculation uses TTC or Regulatory PDs (not shown below), calibrated tolong-run default averages with additional adjustments where modelled outputs display evidence of risk understatement (including credit expert overrides, regulatory adjustments etc.). The PIT measure is subject to under or over prediction depending on the relative position of the portfolio to the credit cycle. |
| § | A mapping has been provided between external ratings and internal PD ranges based on the published reports from the two rating agencies - Moody’s and S&P. |
| § | For the wholesale models, the average default probabilities in the tables have been determined from the full scope of clients graded by the IRB model suite, which may include some clients that have either zero exposure or zero limits marked at the time of calculation. |
LGD measures
| § | The model estimated LGDs, unadjusted for regulatory floors and for downturn adjustments, are compared with the actual LGDs within each IRB exposure class. |
| § | The estimated LGDs are derived from a simple average of LGDs at the time of default for the set of cases closed over the previous twelve months. |
| § | The actual LGD rate is the simple average observed loss rate for the set of cases closed over the previous twelve months, regardless of the time of default. |
| § | The LGD measures are used as a predicted measure in internal monitoring and annual validation of the models. The capital calculation uses Downturn LGDs with additional adjustments and regulatory floors where modelled outputs display evidence of risk understatement. |
| 364 | Barclays PLC and Barclays Bank PLC 2016 Annual Report on Form 20-F |
Barclays’ approach to managing risks
Management of credit risk and the internal ratings-based approach
Table 85: Analysis of expected performance versus actual results
This table provides an overview of credit risk model performance, assessed by the analysis of average PDs and average LGDs.
The table compares the raw model output to the actual experience in our portfolios. Such analysis is used to assess and enhance the adequacy and accuracy of models. The raw outputs are subject to a number of adjustments before they are used in the calculation of capital, for example to allow for the position in the credit cycle and the impact of stress on recovery rates.
| Asset Class | ||||||||||||||||||||||||||||||
Weighted | Arithmetic | Number of obligors | Defaulted | of which: in the year | Average % | |||||||||||||||||||||||||
| External Ratings Equivalent | As at Nov’15 | As at Nov’16 | ||||||||||||||||||||||||||||
| Wholesale | EBA PD Range (%) | Moody’s | S&P | % | % | £m | ||||||||||||||||||||||||
Central | 0.00 to <0.15 | Aaa, Aa1, Aa2, Aa3, | AAA, AA+, AA,AA-, | 0.02% | 0.03% | 132 | 97 | – | – | 0.00% | ||||||||||||||||||||
governments | A1, A2, A3, Baa1 | A+, A,A-, BBB+ | ||||||||||||||||||||||||||||
or central | 0.15 to <0.25 | Baa1, Baa2 | BBB+, BBB | 0.18% | 0.22% | 6 | 7 | – | – | 0.00% | ||||||||||||||||||||
banks | 0.25 to <0.50 | Baa3, Ba1 | BBB-, BB+ | 0.36% | 0.37% | 7 | 8 | – | – | 0.00% | ||||||||||||||||||||
0.50 to <0.75 | Ba1, Ba2 | BB+, BB | 0.00% | 0.65% | 3 | 1 | – | – | 0.00% | |||||||||||||||||||||
0.75 to <2.50 | Ba2, Ba3, B1, B2 | BB,BB-, B+, B | 0.86% | 1.39% | 11 | 10 | – | – | 0.00% | |||||||||||||||||||||
2.50 to <10.00 | B1, B2, B3 | B+, B, B- | 0.00% | 6.58% | 6 | 7 | – | – | 0.00% | |||||||||||||||||||||
10.00 to <100.00 | Caa1, Caa2, Caa3, Ca, C | CCC+, CCC, CCC-, CC, C | 0.00% | 23.24% | 4 | 4 | – | – | 0.00% | |||||||||||||||||||||
100.00 (default) | D | D | 100.00% | 100.00% | – | – | – | – | 0.00% | |||||||||||||||||||||
Institutions | 0.00 to <0.15 | Aaa, Aa1, Aa2, Aa3, | AAA, AA+, AA, AA-, | 0.03% | 0.03% | 7,098 | 8,661 | – | – | 0.00% | ||||||||||||||||||||
A1, A2, A3, Baa1 | A+, A,A-, BBB+ | |||||||||||||||||||||||||||||
0.15 to <0.25 | Baa1, Baa2 | BBB+, BBB | 0.20% | 0.19% | 731 | 880 | – | – | 0.00% | |||||||||||||||||||||
0.25 to <0.50 | Baa3, Ba1 | BBB-, BB+ | 0.37% | 0.39% | 320 | 386 | – | – | 0.00% | |||||||||||||||||||||
0.50 to <0.75 | Ba1, Ba2 | BB+, BB | 0.61% | 0.65% | 123 | 111 | – | – | 0.00% | |||||||||||||||||||||
0.75 to <2.50 | Ba2, Ba3, B1, B2 | BB,BB-, B+, B | 1.53% | 1.34% | 264 | 222 | – | – | 0.00% | |||||||||||||||||||||
2.50 to <10.00 | B1, B2, B3 | B+, B, B- | 6.42% | 5.26% | 191 | 141 | – | – | 0.00% | |||||||||||||||||||||
10.00 to <100.00 | Caa1, Caa2, Caa3, | CCC+, CCC,CCC-, | 17.64% | 25.21% | 98 | 72 | 2 | – | 0.46% | |||||||||||||||||||||
Ca, C | CC, C | |||||||||||||||||||||||||||||
100.00 (default) | D | D | 100.00% | 100.00% | 47 | 15 | – | – | 0.00% | |||||||||||||||||||||
Corporate | 0.00 to <0.15 | Aaa, Aa1, Aa2, Aa3, | AAA, AA+, AA,AA-, | 0.04% | 0.05% | 1525 | 1383 | – | – | 0.00% | ||||||||||||||||||||
A1, A2, A3, Baa1 | A+, A,A-, BBB+ | |||||||||||||||||||||||||||||
0.15 to <0.25 | Baa1, Baa2 | BBB+, BBB | 0.20% | 0.20% | 300 | 364 | – | – | 0.03% | |||||||||||||||||||||
0.25 to <0.50 | Baa3, Ba1 | BBB-, BB+ | 0.36% | 0.38% | 713 | 636 | 4 | – | 0.25% | |||||||||||||||||||||
0.50 to <0.75 | Ba1, Ba2 | BB+, BB | 0.61% | 0.62% | 398 | 297 | 2 | – | 0.13% | |||||||||||||||||||||
0.75 to <2.50 | Ba2, Ba3, B1, B2 | BB,BB-, B+, B | 1.25% | 1.32% | 1,109 | 841 | 4 | – | 0.35% | |||||||||||||||||||||
2.50 to <10.00 | B1, B2, B3 | B+, B, B- | 4.57% | 4.78% | 845 | 1,263 | 29 | – | 1.85% | |||||||||||||||||||||
10.00 to <100.00 | Caa1, Caa2, Caa3, | CCC+, CCC,CCC-, | 23.94% | 21.88% | 323 | 247 | 18 | – | 3.99% | |||||||||||||||||||||
Ca, C | CC, C | |||||||||||||||||||||||||||||
100.00 (default) | D | D | 100.00% | 100.00% | 311 | 276 | – | – | 0.00% | |||||||||||||||||||||
Corporate | 0.00 to <0.15 | Aaa, Aa1, Aa2, Aa3, | AAA, AA+, AA, AA-, | 0.07% | 0.08% | 964 | 748 | – | – | 0.06% | ||||||||||||||||||||
SME | A1, A2, A3, Baa1 | A+, A,A-, BBB+ | ||||||||||||||||||||||||||||
0.15 to <0.25 | Baa1, Baa2 | BBB+, BBB | 0.19% | 0.19% | 1,310 | 1,508 | – | – | 0.20% | |||||||||||||||||||||
0.25 to <0.50 | Baa3, Ba1 | BBB-, BB+ | 0.36% | 0.36% | 2,826 | 2,904 | 4 | – | 0.13% | |||||||||||||||||||||
0.50 to <0.75 | Ba1, Ba2 | BB+, BB | 0.64% | 0.64% | 2,056 | 2,194 | 2 | 1 | 0.22% | |||||||||||||||||||||
0.75 to <2.50 | Ba2, Ba3, B1, B2 | BB,BB-, B+, B | 1.28% | 1.35% | 4,146 | 4,405 | 19 | 1 | 0.51% | |||||||||||||||||||||
2.50 to <10.00 | B1, B2, B3 | B+, B, B- | 5.24% | 4.96% | 3,698 | 4,719 | 72 | 5 | 3.60% | |||||||||||||||||||||
10.00 to <100.00 | Caa1, Caa2, Caa3, | CCC+, CCC,CCC-, | 23.28% | 23.01% | 732 | 528 | 48 | 1 | 10.18% | |||||||||||||||||||||
Ca, C | CC, C | |||||||||||||||||||||||||||||
100.00 (default) | D | D | 100.00% | 100.00% | 214 | 134 | – | – | 0.00% | |||||||||||||||||||||
Specialist | 0.00 to <0.15 | Aaa, Aa1, Aa2, Aa3, | AAA, AA+, AA,AA-, | 0.07% | 0.07% | 30 | 29 | – | – | 0.00% | ||||||||||||||||||||
Lending | A1, A2, A3, Baa1 | A+, A,A-, BBB+ | ||||||||||||||||||||||||||||
0.15 to <0.25 | Baa1, Baa2 | BBB+, BBB | 0.19% | 0.19% | 107 | 35 | – | – | 0.00% | |||||||||||||||||||||
0.25 to <0.50 | Baa3, Ba1 | BBB-, BB+ | 0.37% | 0.37% | 180 | 145 | – | – | 0.00% | |||||||||||||||||||||
0.50 to <0.75 | Ba1, Ba2 | BB+, BB | 0.61% | 0.64% | 137 | 169 | – | – | 0.76% | |||||||||||||||||||||
0.75 to <2.50 | Ba2, Ba3, B1, B2 | BB,BB-, B+, B | 1.18% | 1.29% | 142 | 218 | – | – | 0.00% | |||||||||||||||||||||
2.50 to <10.00 | B1, B2, B3 | B+, B, B- | 5.02% | 5.09% | 152 | 135 | 1 | – | 2.43% | |||||||||||||||||||||
10.00 to <100.00 | Caa1, Caa2, Caa3, | CCC+, CCC,CCC-, | 28.12% | 25.71% | 14 | 12 | 1 | – | 13.96% | |||||||||||||||||||||
Ca, C | CC, C | |||||||||||||||||||||||||||||
100.00 (default) | D | D | 100.00% | 100.00% | 69 | 60 | – | – | 0.00% | |||||||||||||||||||||
| Barclays PLC and Barclays Bank PLC 2016 Annual Report on Form 20-F | 365 |
Barclays’ approach to managing risks
Management of credit risk and the internal ratings-based approach
Table 85: Analysis of expected performance versus actual resultscontinued
|
| |||||||||||||||||||||||||||||
Asset Class |
| |||||||||||||||||||||||||||||
Arithmetic Average PD by obligors | ||||||||||||||||||||||||||||||
of which: new | Average historical | |||||||||||||||||||||||||||||
| Weighted | Number of obligors | Defaulted | ||||||||||||||||||||||||||||
| Average | As at | As at | obligors | defaulted | annual | |||||||||||||||||||||||||
| External Ratings Equivalent | PD | Nov’15 | Nov’16 | in the year | in the year | default | ||||||||||||||||||||||||
| Retail | EBA PD Range (%) | Moody’s | S&P | % | % | £m | £m | £m | £m | % | ||||||||||||||||||||
SMEa | 0.00 to <0.15 | Aaa, Aa1, Aa2, Aa3, | AAA, AA+, AA, AA-, | 0.04% | 0.06% | 33,578 | 34,933 | 21 | 1 | 0.04% | ||||||||||||||||||||
A1, A2, A3, Baa1 | A+, A,A-, BBB+ | |||||||||||||||||||||||||||||
0.15 to <0.25 | Baa1, Baa2 | BBB+, BBB | 0.20% | 0.20% | 23,989 | 25,288 | 28 | 1 | 0.07% | |||||||||||||||||||||
0.25 to <0.50 | Baa3, Ba1 | BBB-, BB+ | 0.37% | 0.37% | 54,759 | 57,747 | 69 | 4 | 0.07% | |||||||||||||||||||||
0.50 to <0.75 | Ba1, Ba2 | BB+, BB | 0.64% | 0.64% | 43,467 | 61,414 | 99 | 6 | 0.13% | |||||||||||||||||||||
0.75 to <2.50 | Ba2, Ba3, B1, B2 | BB,BB-, B+, B | 1.48% | 1.54% | 210,081 | 172,631 | 448 | 83 | 0.19% | |||||||||||||||||||||
2.50 to <10.00 | B1, B2, B3 | B+, B, B- | 4.68% | 5.54% | 305,063 | 313,511 | 1,374 | 288 | 0.43% | |||||||||||||||||||||
10.00 to <100.00 | Caa1, Caa2, Caa3, | CCC+, CCC, CCC-, | 20.67% | 23.61% | 303,665 | 339,375 | 7,206 | 1,136 | 3.46% | |||||||||||||||||||||
Ca, C | CC, C | |||||||||||||||||||||||||||||
100.00 (default) | D | D | 100.00% | 100.00% | 5,606 | 5,097 | – | – | 0.00% | |||||||||||||||||||||
Secured | 0.00 to <0.15 | Aaa, Aa1, Aa2, Aa3, | AAA, AA+, AA,AA-, | 0.09% | 0.09% | 700,161 | 745,590 | 510 | – | 0.08% | ||||||||||||||||||||
by Real | A1, A2, A3, Baa1 | A+, A,A-, BBB+ | ||||||||||||||||||||||||||||
Estate | 0.15 to <0.25 | Baa1, Baa2 | BBB+, BBB | 0.19% | 0.19% | 191,114 | 137,113 | 314 | – | 0.15% | ||||||||||||||||||||
0.25 to <0.50 | Baa3, Ba1 | BBB-, BB+ | 0.33% | 0.33% | 105,224 | 60,859 | 365 | – | 0.29% | |||||||||||||||||||||
0.50 to <0.75 | Ba1, Ba2 | BB+, BB | 0.63% | 0.62% | 17,538 | 12,575 | 145 | – | 0.69% | |||||||||||||||||||||
0.75 to <2.50 | Ba2, Ba3, B1, B2 | BB,BB-, B+, B | 1.23% | 1.25% | 21,316 | 18,452 | 450 | – | 2.03% | |||||||||||||||||||||
2.50 to <10.00 | B1, B2, B3 | B+, B, B- | 5.12% | 5.05% | 6,085 | 5,467 | 465 | – | 7.06% | |||||||||||||||||||||
10.00 to <100.00 | Caa1, Caa2, Caa3, | CCC+, CCC, CCC-, | 38.18% | 37.73% | 6,102 | 5,270 | 2,024 | – | 49.52% | |||||||||||||||||||||
Ca, C | CC, C | |||||||||||||||||||||||||||||
100.00 (default) | D | D | 100.00% | 100.00% | 11,983 | 11,694 | – | – | – | |||||||||||||||||||||
Qualifying | 0.00 to <0.15 | Aaa, Aa1, Aa2, Aa3, | AAA, AA+, AA,AA-, | 0.07% | 0.05% | 10,391,483 | 10,551,296 | 3,453 | 893 | 0.04% | ||||||||||||||||||||
Revolving | A1, A2, A3, Baa1 | A+, A,A-, BBB+ | ||||||||||||||||||||||||||||
Retail | 0.15 to <0.25 | Baa1, Baa2 | BBB+, BBB | 0.20% | 0.20% | 1,927,465 | 1,814,853 | 3,015 | 682 | 0.18% | ||||||||||||||||||||
0.25 to <0.50 | Baa3, Ba1 | BBB-, BB+ | 0.36% | 0.36% | 2,244,780 | 2,166,187 | 6,625 | 1,038 | 0.34% | |||||||||||||||||||||
0.50 to <0.75 | Ba1, Ba2 | BB+, BB | 0.62% | 0.61% | 1,158,422 | 1,140,628 | 6,018 | 564 | 0.60% | |||||||||||||||||||||
0.75 to <2.50 | Ba2, Ba3, B1, B2 | BB,BB-, B+, B | 1.44% | 1.38% | 2,652,087 | 2,703,357 | 31,720 | 1,293 | 1.29% | |||||||||||||||||||||
2.50 to <10.00 | B1, B2, B3 | B+, B, B- | 4.88% | 4.81% | 1,499,071 | 1,591,182 | 71,475 | 1,470 | 4.70% | |||||||||||||||||||||
10.00 to <100.00 | Caa1, Caa2, Caa3, | CCC+, CCC, CCC-, | 25.47% | 28.16% | 433,988 | 494,297 | 129,694 | 96 | 28.13% | |||||||||||||||||||||
Ca, C | CC, C | |||||||||||||||||||||||||||||
100.00 (default) | D | D | 100.00% | 100.00% | 591,116 | 476,487 | – | – | 0.00% | |||||||||||||||||||||
Other | 0.00 to <0.15 | Aaa, Aa1, Aa2, Aa3, | AAA, AA+, AA,AA-, | 0.13% | 0.12% | 351 | 60 | 2 | – | 0.58% | ||||||||||||||||||||
Retail | A1, A2, A3, Baa1 | A+, A,A-, BBB+ | ||||||||||||||||||||||||||||
0.15 to <0.25 | Baa1, Baa2 | BBB+, BBB | 0.21% | 0.21% | 2,259 | 1,958 | 5 | – | 0.56% | |||||||||||||||||||||
0.25 to <0.50 | Baa3, Ba1 | BBB-, BB+ | 0.41% | 0.40% | 19,001 | 46,054 | 66 | – | 0.58% | |||||||||||||||||||||
0.50 to <0.75 | Ba1, Ba2 | BB+, BB | 0.64% | 0.64% | 38,663 | 87,272 | 155 | – | 0.64% | |||||||||||||||||||||
0.75 to <2.50 | Ba2, Ba3, B1, B2 | BB,BB-, B+, B | 1.58% | 1.54% | 326,841 | 335,910 | 2,784 | – | 1.30% | |||||||||||||||||||||
2.50 to <10.00 | B1, B2, B3 | B+, B, B- | 3.99% | 3.98% | 161,800 | 124,689 | 6,406 | – | 4.47% | |||||||||||||||||||||
10.00 to <100.00 | Caa1, Caa2, Caa3, | CCC+, CCC, CCC-, | 45.12% | 41.24% | 18,055 | 25,917 | 8,251 | – | 35.54% | |||||||||||||||||||||
Ca, C | CC, C | |||||||||||||||||||||||||||||
100.00 (default) | D | D | 100.00% | 100.00% | 59,108 | 43,731 | – | – | 0.00% | |||||||||||||||||||||
Asset Class | ||||||||||||
| Number of | ||||||||||||
| resolved cases over | ||||||||||||
| last one year | Predicted LGD | Actual LGD | ||||||||||
| (Dec’15 to Nov’16) | (Simple Average) | (Simple Average) | ||||||||||
| % | % | |||||||||||
Wholesale | ||||||||||||
Investment Bank | 19 | 30% | 11% | |||||||||
Corporate Bank | 89 | 42% | 22% | |||||||||
Retail | ||||||||||||
SME | 2,116 | 82% | 67% | |||||||||
Secured by Real Estate | 4,168 | 4% | 4% | |||||||||
Qualifying Revolving Retail | 357,342 | 74% | 72% | |||||||||
Other retail | 36,968 | 79% | 77% | |||||||||
Note
a Refer to the notes below for an explanation of data limitations relating to the Retail SME figures presented in this table
| 366 | Barclays PLC and Barclays Bank PLC 2016 Annual Report on Form 20-F |
Barclays’ approach to managing risks
Management of credit risk and the internal ratings-based approach
2016 AIRB models back testing summary
Section below provides AIRB model performance summary based on the above back testing results, along with the remediation plans.
Wholesale
| § | The Wholesale book continues to maintain low default rates across IRB exposure classes, with no defaults observed for ‘Central Governments or Central Banks’. The estimated PDs are higher (conservative) compared to actual default rates for most PD ranges within each exposure class. |
| § | There are two key LGD models used for the Wholesale IRB exposures. Both the LGD models overestimate (conservative) on a PIT basis. |
| § | A new set of replacement models are currently under development to comply with CRD IV requirements for the material portfolios, and are scheduled to be submitted to the PRA over2017-18 |
Retail SME
| § | The estimated PDs rank order the actual default experience for the UK SME book, i.e. higher PDs implying higher actual default rates. |
| § | The estimated PDs and LGD are much higher (conservative) compared to the actual default rates and LGD. The actual PD is low due to the inclusion of immaterial and dormant customers in the denominator. In addition, there was a temporary default identification issue during the reporting period, which has now been rectified, though the retrospective identification was not possible. The LGD model is benchmarked to the Corporate LGD model. |
| § | A new set of CRD IV compliant models have been approved by the PRA in 2016 and are currently under implementation. |
Secured by Real Estate
| § | This covers mortgage portfolios for UK and Italy. Rank ordering is maintained across PD ranges. |
| § | For UK Mortgages, the PD model is accurate, slightly conservative at an overall level (0.34% expected vs. 0.31% actual). The portfolio maintains low LGD and the model overestimates (2.2% estimated vs. 1.0% actual). The new CRD IV compliant model suite is awaiting PRA approval. |
| § | For Italy Mortgages, both the PIT PD and LGD models underestimate(non-conservative) primarily due to a decrease in the House Price Index (HPI). The portfolio has observed significant losses in recovery as a result of the lengthening of the auction process and general collateral devaluation driven by a depressed housing market. In addition, the market at origination when appraisals of the collateral values were carried out was significantly optimistic. A new set of CRD IV compliant models are currently under development, and are due for PRA submission by December 2017. Interim Post Model Adjustments (PMA) are in place to address existing models deficiencies. |
Qualifying Revolving Retail
| § | This constitutes UK Cards, Germany Cards and UK Current Account portfolios. The estimated PDs rank order well across all 3 portfolios and at an overall level. |
| § | For UK Cards, a slight underestimation is observed in the PD model driven by the high risk bands; 1.9% estimated vs. 2.1% actual at an overall level. The LGD model is accurate (69.9% estimated vs. 69.5% actual). The existing CRD IV model suite is currently under recalibration to further improve its accuracy. |
| § | For Germany Cards, a slight overestimation in the PD estimates is driven byin-order population; 1.5% estimated vs. 1.4% actual at an overall level. The overestimation in the LGD model (84% estimated vs. 75% actual), is primarily driven by debt sale at a better price. New CRD IV models are currently under development, and are due for PRA submission in H1 2017. |
| § | For UK Current Accounts, PD model overestimates are primarily due to a decrease in actual default rates over the last year (0.73% estimated vs. 0.57% actual). The LGD model is accurate (84% estimated vs. 80% actual). New CRD IV compliant model suites are currently under internal review; to be submitted to the PRA by Q1 2017. |
Other Retail
| § | This covers UK Barclayloan portfolio. The PD rank ordering holds except for the low PD ranges, which have a low number of defaults. |
| § | The current portfolio default rate and estimated PD is lower compared to the historical average default rate due to an improvement in the portfolio quality. However, both PD (3.4% estimated vs. 3.1% actual) and LGD (79% expected vs. 77% actual) models are accurate at an overall level based on a comparison over past one year. |
| § | New CRD IV compliant capital suite has been submitted to the PRA in Dec’16. |
| Barclays PLC and Barclays Bank PLC 2016 Annual Report on Form 20-F | 367 |
Barclays’ approach to managing risks
Management of credit risk mitigation techniques and counterparty credit risk
Counterparty credit risk arises from derivatives and similar contracts. This section details the specific aspects of the risk framework related to this type of credit risk. As credit risk mitigation is one of the principal uses of derivative contracts by banks, this is also discussed in this section.
| § | A general discussion of credit risk mitigation (covering traditional credit risks) is also included from page 369. |
| § | Mitigation techniques specific to counterparty credit risk are also discussed. |
| 368 | Barclays PLC and Barclays Bank PLC 2016 Annual Report on Form 20-F |
Barclays’ approach to managing risks
Management of credit risk mitigation techniques and counterparty credit risk
Credit risk mitigation
The Group employs a range of techniques and strategies to actively mitigate the counterparty credit risks. These can broadly be divided into three types:
| § | netting andset-off |
| § | collateral |
| § | risk transfer. |
The Group has detailed policies in place to ensure that credit risk mitigation is appropriately recognised and recorded. The recognition of credit risk mitigation is subject to a number of considerations, including ensuring legal certainty of enforceability and effectiveness, ensuring the valuation and liquidity of the collateral is adequately monitored, and ensuring the value of the collateral is not materially correlated with the credit quality of the counterparty.
All three types of credit risk mitigation may be used by different areas of the Group for exposures with a full range of counterparties. For instance, businesses may take property, cash or other physical assets as collateral for exposures to retailers, property companies or other client types.
Netting andset-off
In most jurisdictions in which the Group operates, credit risk exposures can be reduced by applying netting andset-off. In exposure terms, this credit risk mitigation technique has the largest overall impact on net exposure to derivative transactions, compared with other risk mitigation techniques.
For derivative transactions, the Group’s normal practice is to enter into standard master agreements with counterparties (e.g. ISDAS). These master agreements typically allow for netting of credit risk exposure to a counterparty resulting from derivative transactions against the obligations to the counterparty in the event of default, and so produce a lower net credit exposure. These agreements may also reduce settlement exposure (e.g. for foreign exchange transactions) by allowing payments on the same day in the same currency to beset-off against one another.
Under IFRS, netting is permitted only if both of the following criteria are satisfied:
| § | the entity currently has a legally enforceable right to set off the recognised amounts |
| § | the entity intends either to settle on a net basis, or to realise the asset and settle the liability simultaneously. |
Under US GAAP, netting is also permitted, regardless of a currently legally enforceable right ofset-off and/or the intention to settle on a net basis, where there is a counterparty master agreement that would be enforceable in the event of bankruptcy.
Collateral
The Group has the ability to call on collateral in the event of default of the counterparty, comprising:
| § | home loans: a fixed charge over residential property in the form of houses, flats and other dwellings. The value of collateral is impacted by property market conditions which drive demand and therefore value of the property. Other regulatory interventions on ability to repossess, longer period to repossession and granting of forbearance may also affect the collateral value |
| § | wholesale lending: a fixed charge over commercial property and other physical assets, in various forms |
| § | other retail lending:includes charges over motor vehicle and other physical assets; second lien charges over residential property, which are subordinate to first charges held either by the Group or by another party; and finance lease receivables, for which typically the Group retains legal title to the leased asset and has the right to repossess the asset on the default of the borrower |
| § | derivatives:the Group also often seeks to enter into a margin agreement (e.g. Credit Support Annex (CSA)) with counterparties with which the Group has master netting agreements in place. These annexes to master agreements provide a mechanism for further reducing credit risk, whereby collateral (margin) is posted on a regular basis (typically daily) to collateralise the mark to market exposure of a |
derivative portfolio measured on a net basis. The Group may additionally negotiate the receipt of an independent amount further mitigating risk by collateralising potential mark to market exposure moves |
| § | reverse repurchase agreements:collateral typically comprises highly liquid securities which have been legally transferred to the Group subject to an agreement to return them for a fixed price |
| § | financial guarantees and similaroff-balance sheet commitments:cash collateral may be held against these arrangements. |
For details of the fair value of collateral held, please refer to maximum exposure table in the credit risk performance section on page 119.
In exposure terms, the main portfolios that the Group takes collateral for are home loans and reverse repurchase agreements with financial institutions.
Floating charges over receivables
The Group may also obtain collateral in the form of floating charges over receivables and inventory of corporate and other business customers. The value of this collateral varies from period to period depending on the level of receivables and inventory. It is impracticable to provide an estimate of the amount (fair value or nominal value) of this collateral. The Group may in some cases obtain collateral and other enhancements at a counterparty level, which are not specific to a particular class of financial instrument. The fair value of the credit enhancement gained has been apportioned across the relevant asset classes.
Collateral for derivative contracts
The collateral obtained for derivatives is predominantly cash or government bonds (G7 and other highly rated governments). Appropriate haircuts may be applied tonon-cash collateral, which are agreed when the margin agreement (e.g. CSA) is negotiated.
Valuation of collateral and impact of market moves
Typically, assets other than cash are subject to regular revaluation (for example via physical review, linking to an external index or depreciation of the asset), to ensure they continue to achieve appropriate mitigation of risk. Customer agreements often include requirements for provision of additional collateral, should valuations decline or credit exposure increase, for example due to market moves impacting a derivative exposure.
The carrying value ofnon-cash collateral reflects the fair value of the physical assets, limited to the carrying value of the asset where the exposure is over-collateralised. In certain cases, where active markets or recent valuations of the assets are not available, estimates are used. For assets collateralised by residential or commercial property (and certain other physical assets), where it is not practicable to assess current market valuations of each underlying property, values reflect historical fair values updated for movements in appropriate external indices. For further information on LTV ratios in principal home loans portfolios, see the Credit Risk review section on page 128 to 129.
Liens over fluctuating assets such as inventory and trade receivables, known as floating charges, over the assets of a borrower are monitored annually. The valuation of this type of collateral takes into account the ability to establish objectively a price or market value, the frequency with which the value can be obtained (including a professional appraisal or valuation), and the volatility or a proxy for the volatility of the value of the collateral.
For assets collateralised by traded financial instruments, values reflect MTM or mark to model values of those assets, applying a haircut where appropriate. A haircut is the valuation percentage applicable to each type of collateral and will be largely based on liquidity and price volatility of the underlying security.
Valuation of collateral – property
When property is taken as collateral, it is monitored to establish whether the current value is less than its value at origination. Monitoring is undertaken annually for commercial property or via linking to an external index for residential property. More frequent monitoring may be carried out where the property sector is subject to significant deterioration.
| Barclays PLC and Barclays Bank PLC 2016 Annual Report on Form 20-F | 369 |
Barclays’ approach to managing risks
Management of credit risk mitigation techniques and counterparty credit risk
Deterioration is monitored principally by geography. Specific exercises to monitor property values may be undertaken where the property sector in a given geography has been subject to significant deterioration and where the Group has a material concentration of property collateral.
Monitoring may be undertaken either at a portfolio level (typically retail) or at an individual level (typically wholesale).
In retail businesses, monitoring on a portfolio level refers to a more frequent process of indexing collateral values on each individual loan, using a regional or national index, and updating LGD values. This monitoring may be a desk top assessment and need not necessarily include physical assessment of properties. In the event ofcharge-off, an individual valuation of the property is undertaken within 3 months of thecharge-off event and subsequently undertaken at least every six months whilst incharge-off.
In wholesale, monitoring is undertaken by individuals who are not part of the sales / relationship part of the business. Where an appropriate local index is not available, property values are monitored on an individual basis as part of the annual review process for the loan. For larger loans, in addition to the regular annual review, the property value is reviewed by an independent valuer at least once every three years. This review is a more detailed assessment than the standard property monitoring review, and may include a fresh professional valuation. In addition, an independent valuer reviews the property valuation where information indicates that the value of the property may have declined materially relative to general market prices. In addition, trigger points are defined under which property values must be reviewed.
Valuation of collateral – distressed assets
The net realisable value from a distressed sale of collateral obtained by the Group upon default or insolvency of counterparty will in some cases be lower than the carrying value recognised. Assets obtained are normally sold, generally at auction, or realised in an orderly manner for the maximum benefit of the Group, the borrower’s other creditors and the borrower, in accordance with the relevant insolvency regulations. For business customers, in some circumstances, where excess funds are available after repayment in full of the outstanding loan, they are offered to any other, lower ranked, secured lenders. Any additional funds are returned to the borrower. The Group does not occupy repossessed properties for its business use or use assets obtained in its operations.
Additional revaluations are usually performed when a loan is moved to WL. Exceptions to this may be considered where it is clear a revaluation is not necessary, for instance where there is a very high margin of security or a recent valuation has been undertaken. Conversely, a material reduction in the value of collateral held represents an increase in credit risk and will often cause a loan to be placed on the WL.
Any one of the above events may also trigger a test for impairment, depending on individual circumstances of the loan. When calculating impairment, the difference between an asset’s carrying amount and the present value of all estimated cash flows discounted at the original effective interest rate will be recognised as impairment. Such cash flows include the estimated fair value of the collateral, which reflects the results of the monitoring and review of collateral values as detailed above and valuations undertaken as part of the Group’s impairment process.
Whether property values are updated as part of the annual review process, or by indexation of collateral values, the updated collateral values feed into the calculation of risk parameters which, in turn, feed into identified and unidentified impairment calculations at each balance sheet date.
Trends in LLRs incorporate the impact of any decrease in the fair value of collateral held.
Risk transfer
A range of instruments including guarantees, credit insurance, credit derivatives and securitisation can be used to transfer credit risk from one counterparty to another. These mitigate credit risk in two main ways:
| § | if the risk is transferred to a counterparty which is more credit worthy than the original counterparty, then overall credit risk is reduced |
| § | where recourse to the first counterparty remains, both counterparties must default before a loss materialises. This is less likely than the default of either counterparty individually so credit risk is reduced. |
Risk transfer can also be used to reduce risk concentrations within portfolios lowering the impact of stress events.
Risk transfer transactions are undertaken with consideration to whether the collateral provider is correlated with the exposure, the credit worthiness of the collateral provider and legal certainty of enforceability and effectiveness. Where credit risk mitigation is deemed to transfer credit risk, this exposure is appropriately recorded against the credit risk mitigation provider.
In exposure terms, risk transfer is used most extensively as a credit risk mitigation technique for wholesale loans and derivative financial instruments.
Off-balance sheet risk mitigation
The Group applies fundamentally the same risk management policies foroff-balance sheet risks as it does for itson-balance sheet risks. In the case of commitments to lend, counterparties/customers will be subject to the same credit management policies as for loans and advances. Collateral may be sought depending on the strength of the counterparty and the nature of the transaction.
Recognition of credit risk mitigation in capital calculations
Credit risk mitigation is used to reduce credit risk associated with an exposure, which may reduce potential losses in the event of obligor default or other specified credit events.
Credit risk mitigation that meets certain regulatory criteria may be used to improve risk parameters and reduce RWA consumption against a given obligor. Collateral that meets these regulatory conditions is referred to as eligible collateral. Eligibility criteria are specified in articles 195 to 204 of the Capital Regulations Requirement (CRR).
The Group’s policies and standards set out criteria for the recognition of collateral as eligible credit risk mitigation and are designed to be fully consistent with all applicable local regulations and regulatory permissions.
Where regulatory capital is calculated under AIRB regulations, the benefit of collateral is generally taken by adjusting LGDs. For standardised portfolios, the benefit of collateral is taken using the financial collateral comprehensive method: supervisory volatility adjustments approach.
For instruments that are deemed to transfer credit risk, in AIRB portfolios the protection is generally recognised by using the PD and LGD of the protection provider.
For exposures treated under the standardised approach, the impact of eligible credit risk mitigation is primarily recognised by reducing the EAD associated with the exposure that benefits from the mitigation.
Managing concentrations within credit risk mitigation
Credit risk mitigation taken by the Group to reduce credit risk may result in credit or market risk concentrations.
Guarantees that are treated as eligible credit risk mitigation are marked as an exposure against the guarantor and aggregated with other credit exposure to the guarantor. Limit monitoring at the counterparty level is then used for monitoring of concentrations in line with Group policy.
Commercial real estate lending is another potential source of concentration risk arising from the use of credit risk mitigation. The portfolio is regularly reviewed to assess whether a concentration in a particular region, industry or property type exists, and portfolio limits are in place to control the level of exposure to commercial, residential, investment and development activity. See pages 119 for more information on collateral, valuation and monitoring of concentrations.
Counterparty credit risk
Derivative counterparty credit exposures
The Group enters into financial instruments that are traded or cleared on an exchange, including interest rate swaps, futures and options on futures. Holders of exchange traded instruments provide daily margins
| 370 | Barclays PLC and Barclays Bank PLC 2016 Annual Report on Form 20-F |
Barclays’ approach to managing risks
Management of credit risk mitigation techniques and counterparty credit risk
with cash or other securities at the exchange, to which the holders look for ultimate settlement.
The Group also enters into financial instruments that are traded over the counter, rather than on a recognised exchange. These instruments range from standardised transactions in derivative markets, to trades where the specific terms are tailored to the requirements of the Group’s counterparties. In most cases, industry standard documentation is used, most commonly in the form of a master agreement, with individual transaction confirmations. The existence of a signed master agreement is intended to give the Group protection in situations where the Group’s counterparty is in default.
Counterparty credit exposure arises from the risk that parties are unable to meet their payment obligations under certain financial contracts such as derivatives, securities financing transactions (e.g. repurchase agreements), or long settlement transactions.
A Monte Carlo simulation engine is used to estimate the Potential Future Exposure (PFE) to derivative and securities financing counterparties. The exposure simulation model simulates future market states and the MTM of the derivative transactions under those states. Simulated exposures including the effect of credit mitigants such as netting, collateral and mandatory break clauses can then be generated.
Credit limits for CCR are assessed and allocated using the PFE measure. A number of factors are taken into account when setting credit limits for individual counterparties, including but not limited to the credit quality and nature of the counterparty the rationale for the trading activity entered into and anywrong-way risk considerations.
The expected exposures generated by this engine are also used as an input into both internal and regulatory capital calculations covering CCR.
‘Wrong-way risk’ in a trading exposure arises when there is significant correlation between the underlying asset and the counterparty, which in the event of default would lead to a significant MTM loss to the counterparty. Specificwrong-way risk trades, which are self-referencing or reference to other entities within the same counterparty group, require approval by a senior credit officer. The exposure to the counterparty will reflect the additional risk generated by these transactions.
Derivative CCR (credit value adjustments)
As the Group participates in derivative transactions it is exposed to CCR, which is the risk that a counterparty will fail to make the future payments agreed in the derivative contract. This is considered as a separate risk to the volatility of the MTM payment flows. Modelling this counterparty risk is an important part of managing credit risk on derivative transactions.
The counterparty risk arising under derivative transactions is taken into account when reporting the fair value of derivative positions. The adjustment to the value is known as credit value adjustment (CVA). It is the difference between the value of a derivative contract with a risk-free counterparty and that of a contract with the actual counterparty. This is equivalent to the cost of hedging the counterparty risk in the Credit Default Swap (CDS) market.
CVAs for derivative positions are calculated as a function of the expected exposure, which is the average of future hypothetical exposure values for a single transaction or group of transactions with the same counterparty, the credit spread for a given horizon and the LGD.
The expected exposure is calculated using Monte Carlo simulations of risk factors that may affect the valuation of the derivative transactions in order to simulate the exposure to the counterparty through time. These simulated exposures include the effect of credit mitigants such as netting, collateral and mandatory break clauses. Counterparties with appropriate credit mitigants will generate a lower expected exposure profile compared to counterparties without credit mitigants in place for the same derivative transactions.
Derivative netting and collateral arrangements
Credit risk from derivatives is mitigated where possible through netting agreements whereby derivative assets and liabilities with the same counterparty can be offset. Group policy requires all netting arrangements to be legally documented. The ISDA Master Agreement is
the Group’s preferred agreement for documenting OTC derivatives. It provides the contractual framework within which dealing activities across a full range of OTC products are conducted, and contractually binds both parties to applyclose-out netting across all outstanding transactions covered by an agreement if either party defaults or other predetermined events occur. The majority of the Group’s OTC derivative exposures are covered by ISDA master netting and ISDA CSA collateral agreements.
Collateral is obtained against derivative assets, depending on the creditworthiness of the counterparty and/or nature of the transaction. Any collateral taken in respect of OTC trading exposures will be subject to a ‘haircut’, which is negotiated at the time of signing the collateral agreement. A haircut is the valuation percentage applicable to each type of collateral and will be largely based on liquidity and price volatility of the underlying security. The collateral obtained for derivatives is predominantly either cash, direct debt obligation government (G14+) bonds denominated in the domestic currency of the issuing country, debt issued by supranationals or letters of credit issued by an institution with a long-term unsecured debt rating of A+/A3 or better. Where the Group has ISDA master agreements, the collateral document will be the ISDA CSA. The collateral document must give Barclays the power to realise any collateral placed with it in the event of the failure of the counterparty.
| Barclays PLC and Barclays Bank PLC 2016 Annual Report on Form 20-F | 371 |
Barclays’ approach to managing risks
Management of market risk
This section describes the governance structure specific to the management of market risks, as well as a discussion of measurement techniques.
§ The governance structure specific to market risks is discussed on pages 373 to 374.
|
| 372 | Barclays PLC and Barclays Bank PLC 2016 Annual Report on Form 20-F |
Barclays’ approach to managing risks
Management of market risk
Market risk
The risk of loss arising from potential adverse changes in the value of the firm’s assets and liabilities from fluctuation in market variables including, but not limited to, interest rates, foreign exchange, equity prices, commodity prices, credit spreads, implied volatilities and asset correlations
|
Overview
Market risk
Market risk arises primarily as a result of client facilitation in wholesale markets, involving market making activities, risk management solutions and execution of syndications. Upon execution of a trade with a client, the Group will look to hedge against the risk of the trade moving in an adverse direction. Mismatches between client transactions and hedges result in market risk due to changes in asset prices.
Market risk in the businesses resides primarily in Barclays International, Group Treasury andNon-Core. These businesses have the mandate to incur market risk.
Market risk oversight and challenge is provided by business committees and Group committees, including the Market Risk Committee.
Organisation and structure

Roles and responsibilities
The objectives of market risk management are to:
| § | understand and control market risk by robust measurement, limit setting, reporting and oversight |
| § | facilitate business growth within a controlled and transparent risk management framework |
| § | ensure that market risk in the businesses is controlled according to the allocated appetite |
| § | support theNon-Core strategy of asset reductions by ensuring that market risk remains within agreed risk appetite. |
To ensure the above objectives are met, a well established governance structure is in place to manage these risks consistent with the ERMF. See page 344 on risk management strategy, governance and risk culture.
The BRC recommends market risk appetite to the Board for their approval. The Market Risk Principal Risk Officer (MRPRO) is responsible for the Market Risk Control Framework and, under delegated authority
from the CRO, agrees with the BCROs a limit framework within the context of the approved market risk appetite.
Across the Group, market risk oversight and challenge is provided by business committees, Group committees, including the Market Risk Committee.
The Market Risk Committee approves and makes recommendations concerning the Group-wide market risk profile. This includes overseeing the operation of the Market Risk Framework and associated standards and policies; reviewing arising market or regulatory issues, limits and utilisation; and risk appetite levels to the Board. The Committee is chaired by the MRPRO and attendees include the business heads of market risk, business aligned market risk managers and Internal Audit.
The head of each business is accountable for all market risks associated with its activities, while the head of the market risk team covering each business is responsible for implementing the risk control framework for market risk.
| Barclays PLC and Barclays Bank PLC 2016 Annual Report on Form 20-F | 373 |
Barclays’ approach to managing risks
Management of market risk
Risk management in the setting of strategy
Appetite for market risk is recommended by the risk function to BRC for agreement by the Board. Mandate and scales are set to control levels of market risk and ensure the Group remains within the BRC approved risk appetite. The Group runs an annual Group-wide stress testing exercise which aims to simulate the dynamics of exposures across the Group and cover all risk factors. The exercise is also designed to measure the impact to the Group’s fundamental business plan, and is used to manage the wider Group’s strategy.
 | See page 351 for more detail on the role of risk in the setting of strategy. |
Market risk culture
Market risk managers are independent from the businesses they cover, and their line management reports into the CRO. This embeds a risk culture with strong adherence to limits that support Group-wide risk appetite.
| See pages 347 to 348 for more detail on risk culture. |
Management of traded market risk, mitigation and hedging policies
The governance structure helps ensure all market risks that the Group is exposed to are well managed and understood.
Traded market risk is generated primarily as a result of market making activities, syndications and providing risk management solutions to clients. Group Treasury supports the businesses in managing their interest rate risk. Positions will contribute both to market risk limits and regulatory capital if relevant.
As part of the continuous monitoring of the risk profile, Market Risk meets with the businesses to discuss the risk profile on a regular basis. The outcome of these reviews includes further detailed assessments of event risk via stress testing, risk mitigation and risk reduction.
Traded market risk measurement – management view
Market risk management measures
A range of complementary approaches to measure traded market risk are used which aim to capture the level of losses that the bank is exposed to due to unfavourable changes in asset prices. The primary tools to control the firm’s exposures are:
| Measure | Description | |
| Management Value at Risk (VaR) | An estimate of the potential loss arising from unfavourable market movements, if the current positions were to be held unchanged for one business day. | |
| Primary stress tests | An estimate of potential losses that might arise from severe market moves or scenarios impacting key liquid market risk exposures. | |
| Secondary stress tests | Modelled losses from unfavourable market movements to illiquid market risk exposures. | |
| Business scenario stresses | Multi asset scenario analysis of severe, but plausible events that may impact the market risk exposures of the investment bank. |
The use of Management VaR for traded market risk is broader than the application for use of VaR for regulatory capital, and captures standardised, advanced and certain banking books where traded market risks are deemed to exist. The wider scope of Management VaR is what the Group deems as material market risk exposures which may have a detrimental impact on the performance of the trading business. The scope used in Regulatory VaR (see page 377) is narrower as it applies only to trading book positions as approved by the PRA
Stress testing and scenario analysis are also an important part of the risk management framework, to capture potential risk that may arise in severe but plausible events.
Management VaR
| § | Estimates the potential loss arising from unfavourable market movements, over one day for a given confidence level: |
| § | differs from the Regulatory VaR used for capital purposes in scope, confidence level and horizon |
| § | back testing is performed to ensure the model is fit for purpose. |
VaR is an estimate of the potential loss arising from unfavourable market movements if the current positions were to be held unchanged for one business day. For internal market risk management purposes, a historical simulation methodology with atwo-year equally weighted historical period, at the 95% confidence level is used for all trading books and some banking books. Risk factors driving VaR are grouped into key risk types as summarised below:
| Risk factor | Description | |
| Interest rate | Changes in the level or shape of interest rate expectations can impact prices of interest rate sensitive assets, such as bonds and derivatives instruments, such as interest rate swaps. | |
| Spread | Difference between bond yields and swaps rates that arises when a business has positions in both bonds and interest rate/inflation derivatives instruments. Both assets may trade at different levels but are fundamentally exposed to similar risk. | |
| Foreign exchange | The impact of changes in foreign exchange rates and volatilities. | |
| Equity | Risk due to changes in equity prices, volatilities and dividend yields, for example as part of market making activities, syndication or underwriting of initial public offerings. | |
| Commodity | Arises primarily from providing hedging solutions to clients and access to financial investors via financially-settled energy derivatives exposed to changes in the level of energy spot or forward prices and their volatilities. | |
| Inflation | Arises from the impact of changes in inflation rates and volatilities on cash instruments and derivatives. This arises as part of market marking activities, whereby the Group may be exposed to changes in inflation rates, for example, market making syndications for inflation linked securities. | |
| Traded credit | Arises from the uncertainty of credit quality impacting prices of assets, for example positions such as corporate bonds, securitised products and credit based derivative instruments, including credit default swaps. | |
| Basis | The impact of changes in interest rate tenor basis (e.g. the basis between swaps vs 3M LIBOR and swaps vs 6M LIBOR) and cross-currency basis and is primarily generated as a result of market making activities. |
In some instances, historical data is not available for particular market risk factors for the entire look-back period, for example, complete historical data would not be available for our equity security following an initial public offering. In these cases, market risk managers will proxy the unavailable market risk factor data with available data for a related market risk factor.
The output of the Management VaR model can be readily tested through back testing. This checks instances where actual losses exceed the predicted potential loss estimated by the VaR model. If the number of instances is higher than expected, where actual losses exceed the predicted potential loss estimated by the VaR model, this may indicate limitations with the VaR calculation, for example, a risk factor that would not be adequately captured by the model.
| 374 | Barclays PLC and Barclays Bank PLC 2016 Annual Report on Form 20-F |
Barclays’ approach to managing risks
Management of market risk
The Management VaR model in some instances may not appropriately measure some market risk exposures, especially for market moves that are not directly observable via prices. Market risk managers are required to identify risks which are not adequately captured in VaR (‘risks not in VaR’ or ‘RNIVs’, discussed below).
When reviewing VaR estimates, the following considerations are taken into account:
| § | the historical simulation uses the most recent two years of past data to generate possible future market moves, but the past may not be a good indicator of the future |
| § | theone-day time horizon may not fully capture the market risk of positions that cannot be closed out or hedged within one day |
| § | VaR is based on positions as at close of business and consequently, it is not an appropriate measure forintra-day risk arising from a position bought and sold on the same day |
| § | VaR does not indicate the potential loss beyond the VaR confidence level. |
Limits are applied at the total level as well as by risk factor type, which are then cascaded down to particular trading desks and businesses by the market risk management function.
Primary stress tests
| § | Key tool used by management to measure liquid market risks from extreme market movements or scenarios in each major trading asset class. |
Stress testing provides an estimate of potential significant future losses that might arise from extreme market moves or scenarios. Primary stress tests apply stress moves to key liquid risk factors for each of the major trading asset classes, namely:
| § | interest rates:shock to the level and structure of interest rates and inflation across currencies |
| § | credit:impact on traded corporate credit exposures and securities structures, including across rating grades, geography, sectors and products |
| § | foreign exchange:impact of unfavourable moves in currency prices and volatility |
| § | equity:shocks to share prices including exposures to specific markets and sectors |
| § | commodities:adverse commodity price changes across both physical and derivative markets. |
Primary stresses apply moves to liquid assets incorporating up to 10 days holding period. Shock scenarios are determined by a combination of observed extreme historical moves and forward looking elements as appropriate.
Primary stresses are calculated for each asset class on a standalone basis. Risk managers calculate several stress scenarios and communicate the results to senior managers to highlight concentrations and the level of exposures. Primary stress loss limits are applied across the trading businesses and is a key market risk control.
Secondary stress tests
| § | Key tool used by management to measure illiquid market risks from extreme market movements or scenarios in each major trading asset class. |
Secondary stress tests are used in measuring potential losses arising from market risks that are not captured in the primary stress tests. These may relate to financial instruments or risk exposures which are not readily or easily tradable or markets that are naturally sensitive to a rapid deterioration in market conditions.
For each asset class, secondary stresses are aggregated to a single stress loss which allows the business to manage its liquid and illiquid risk factors. Limits against secondary stress losses are also applied, which allows the firm to manage and control the level of illiquid risk factors.
Stresses are specific to the exposure held and are calibrated on both
observed extreme moves and some forward-looking elements as appropriate.
Business scenario stresses
| § | Key tool used by management to measure aggregated losses across the entire trading book as a result of extreme forward-looking scenarios encompassing simultaneous shocks to multiple asset classes. |
Business scenario stresses apply simultaneous shocks to all risk factors assessed by applying changes to foreign exchange rates, interest rates, credit spreads, commodities and equities to the entire portfolio, for example, the impact of a rapid and extreme slowdown in the global economy. The measure shows results on a multi-asset basis across all trading exposures. Business scenarios are used for risk appetite monitoring purposes and are useful in identifying concentrations of exposures and highlighting areas that may provide some diversification.
The estimated impact on market risk exposures are calculated and reported by the market risk management function on a frequent and regular basis. The stress scenario and the calibration on the shocks are also reviewed by market risk managers periodically for its relevance considering any market environment.
Scenarios such as adverse global recession, deterioration in the availability of liquidity, contagion effects of a slowdown in one of the major economies, easing of global growth concerns, and a historical event scenario are examples of business scenarios. If necessary, market event-specific scenarios are also calculated, such as, a unilateral decision to exit the Eurozone by a member country, and the impact of a large financial institution collapse, a disorderly exit of quantitative easing programmes, including unexpected rapid and continuous interest rate rises as a result.
Traded market risk measurement – regulatory view
Regulatory view of traded positions
For regulatory purposes, the trading book is defined as one that consists of all positions in CRD financial instruments and commodities held either with trading intent, or in order to hedge other elements of trading, and which are either free of any restrictive covenants on their tradability, or able to be hedged. A CRD financial instrument is defined as a contract that gives rise to both a financial asset of one party and a financial liability or equity instrument of another party.
All of the below regulatory measures, including the standardised approach, generate market risk capital requirements, in line with the regulatory requirements set out in the Capital Requirements Directive (‘CRD IV’) and Regulation. Positions which cannot be included in the trading book are included within the banking book and generate risk capital requirements in line with this treatment.
Inclusion of exposures in the regulatory trading book
The Group maintains a Trading Book Policy, which defines the minimum requirements a business must meet to run trading positions and the process by which positions are allocated to trading or banking books. Trading intent is a key element in deciding whether a position should be treated as a trading or banking book exposure.
Positions in the trading book are subject to market risk capital, computed using models where regulatory approval has been granted, otherwise the market risk capital requirement is calculated using standard rules as defined in the Capital Requirement Regulation (CRR), part of the CRD IV package. If any of the criteria specified in the policy are not met for a position, then that position must be allocated to the banking book.
Most of the Group’s market risk regulatory models are assigned the highest model materiality rating. Consequently, the Regulatory VaR model is subject to annualre-approval by the Independent Validation Unit. The Independent Validation Unit makes an assessment of model assumptions and considers evidence of model suitability provided by the model owner. The following table summarises the models used for market risk regulatory purposes and the applicable regulatory thresholds.
| Barclays PLC and Barclays Bank PLC 2016 Annual Report on Form 20-F | 375 |
Barclays’ approach to managing risks
Management of market risk
Valuation standards
CRR article 105 defines regulatory principles which need to be applied to fair value assets and liabilities, in order to determine a prudent valuation.
The Prudent Valuation Adjustment (PVA) is applied to accounting fair values where there are a range of plausible alternative valuations. It is calculated in accordance with Article 105 of the Capital Requirements Regulation (CRR), and includes (where relevant) adjustments for the following factors: unearned credit spreads,close-out costs, operational risk, market price uncertainty, early termination, investing and funding costs, future administrative costs and model risk. The PVA includes adjustment for all fair valued financial instruments and commodities, irrespective of whether they are in the trading or banking book.
Page 246 sets out the valuation control framework for accounting valuations and the related responsibilities of the Finance-product control valuations function and the Valuation Committee. This function and committee are also responsible for the oversight of the PVA and ensuring compliance with article 105 of the CRR.
Regulatory measures for traded market risk
There are a number of regulatory measures which the Group has permission to use in calculating regulatory capital (internal models approval). These are listed below:
| Measure | Definition | |
| Regulatory Value at Risk (VaR) | An estimate of the potential loss arising from unfavourable market movements calibrated to 99% confidence interval10-day holding period. | |
| Stressed Value at Risk (SVaR) | An estimate of the potential loss arising from a twelve-month period of significant financial stress calibrated to 99% confidence interval10-day holding period. | |
| Incremental Risk Charge (IRC) | An estimate of the incremental risk arising from rating migrations and defaults, beyond what is already captured in specific market risk VaR for thenon-correlation trading portfolio. Uses a 99.9% confidence level and aone-year horizon. | |
| Comprehensive Risk Measure (CRM) | An estimate of all the material market risk, including rating migration and default for the correlation trading portfolio. |
Regulatory VaR
| § | Estimates the potential loss arising from unfavourable market movements. |
| § | Regulatory VaR differs from the management approach in the following respects. |
| VaR Variable | Regulatory | Management | ||
| Confidence interval | 99% | 95% | ||
| Scope | As approved by the regulator (PRA) | Management view of market risk exposures. Includes trading books and banking books exposed to price risk | ||
| Look-back period | 2 years | 2 years | ||
| Liquidity Horizon (holding period) | 10 days | 1 day |
Regulatory VaR allows oversight of the total potential losses, at a given confidence level, of those trading books which received approval from the regulator to be covered via an internal model. Regulatory VaR levels contribute to the calculation of the market risk RWAs.
Management VaR allows the bank to supervise the total market risk across the Group, including all trading books and some banking books.
Management VaR is also utilised for internal capital model (economic capital).
Regulatory VaR is fundamentally the same as the Management VaR (see page 374), with the key differences listed above.
The model is complemented with RNIVs, as described on page 379.
Stressed Value at Risk (SVaR)
| § | Estimates the potential loss arising from unfavourable market movements in a stressed environment. |
| § | Identical to Regulatory VaR, but calibrated over aone-year stressed period. |
| § | Regulatory capital is allocated to individual businesses. For regulatory capital calculation purposes the Group computes a market risk capital requirement based on aone-day scaled toten-day, 99% VaR metric calibrated to a period of significant financial stress. This Stressed VaR (‘SVaR’) capital requirement is added to the market risk capital requirement arising from regulatory VaR, the Incremental Risk Charge and the Comprehensive Risk Measure on an undiversified basis. |
The SVaR model must be identical to the VaR model used by the Group, with the exception that the SVaR model must be calibrated to aone-year period of significant financial stress (‘the SVaR period’). The Group selects the SVaR period to be aone-year period that maximises the sum of general market risk Regulatory VaR and specific market risk Regulatory VaR for positions in scope of regulatory approval. The SVaR period is reviewed on a quarterly basis or when required by material changes in market conditions or the trading portfolio.
SVaR cannot be meaningfully backtested as it is not sensitive to current market conditions. Many market risk factors with complete historical data over atwo-year period may not have complete data covering the SVaR period and consequently, more proxies may be required for SVaR than for VaR. The SVaR metric itself has the same strengths and weaknesses as the Group’s VaR model.
Incremental Risk Charge (IRC)
| § | Captures risk arising from rating migrations and defaults for traded debt instruments incremental to that already captured by Regulatory VaR and SVaR. |
IRC captures the risk arising from ratings migrations or defaults in the traded credit portfolio. IRC measures this risk at a 99.9% confidence level with aone-year holding period and applies to all positions in scope for specific risk including sovereign exposure.
The Group’s IRC model simulates default and ratings transition events for individual names. The behaviour of names is correlated with one another to simulate a systemic factor to model the possibility of multiple downgrades or defaults. The correlations betweennon-sovereign names are based on the Basel-defined correlations stipulated in the IRB approach to measuring credit risk capital, with a fixed correlation between sovereign names.
The Group’s IRC model simulates the impact of a ratings transition by estimating the improvement or deterioration in credit spreads resulting from the transition and assumes that the historically observed average change in credit spreads (measured in relative terms) resulting from ratings transitions provides an accurate estimate of likely widening or tightening of credit spreads in future transitions. For each position, the model computes the impact of spread moves up or down atpre-specified relative movements, and the actual impact is obtained by interpolating or extrapolating the actual spread move from thesepre-computed values.
The Group’s IRC model assumes that ratings transitions, defaults and any spread increases occur on an instantaneous basis.
| 376 | Barclays PLC and Barclays Bank PLC 2016 Annual Report on Form 20-F |
Barclays’ approach to managing risks
Management of market risk
Comprehensive Risk Measure (CRM)
| § | Captures all market risks affecting the correlation trading portfolio. |
Comprehensive Risk Measure covers the correlation trading portfolio and is intended to adequately capture all risk factors relevant to corporateNth-to-default (on a basket of referenced names) and tranched credit derivatives. The capital requirement is based on a 99.9% confidence interval over aone-year holding period. The model generates a scenario based on a Monte Carlo simulation and revalues the portfolio under the simulated market scenario.
The model captures the following risk factors in the correlation trading portfolio:
| § | default and ratings migration over aone-year time horizon |
| § | credit spread volatility |
| § | recovery risk: uncertainty of the recoverable value under default |
| § | correlation risk |
| § | basis risk: basis between credit indices and its underlying constituents |
| § | hedge slippage: portfolio rebalancing assumption. |
The Group’s Comprehensive Risk Measure model is based on the IRC model but also captures market risks not related to transition or default events, such as movements in credit spreads or correlations. These risk factors are included as part of the Monte Carlo simulation using distributions calibrated to historically observed moves.
Table 86: Market risk models selected features
Component modelled | Number of significant models and size of associated portfolio (RWAs) | Model description and methodology | Applicable regulatory thresholds | |||
Regulatory VaR | 1 model; £3.5bn | Equally-weighted historical simulation of potential daily P&L arising from market moves | Regulatory VaR is computed withten-day holding period and 99% confidence level | |||
SVaR | 1 model; £6.6bn | Same methodology as used for VaR model, but using a different time series | Regulatory SVaR is computed withten-day holding period and 99% confidence level | |||
IRC | 1 model; £2.1bn | Monte Carlo simulation of P&L arising from ratings migrations and defaults | IRC is computed withone-year holding period and 99.9% confidence level | |||
Comprehensive Risk Measure | 1 model; £0.4bn | Same approach as IRC, but it incorporates market-driven movements in spreads and correlations for application to correlation trading portfolios. | Comprehensive Risk Measure is computed withone-year holding period and 99.9% confidence level. As required in CRD IV, the Comprehensive Risk Measure charge is subject to a floor set with reference to standard rules charge |
Regulatory back testing
Back testing is the method by which the Group checks and affirms that its procedures for estimating VaR are reasonable and serve its purpose of estimating the potential loss arising from unfavourable market movements. The back testing process is a regulatory requirement and seeks to estimate the performance of the regulatory VaR model. Performance is measured by the number of exceptions to the model i.e. net trading P&L loss in one trading day is greater than the estimated VaR for the same trading day. The Group’s procedures could be underestimating VaR if exceptions occur more frequently than expected (a 99% confidence interval indicates that one exception will occur in 100 days).
Back testing is performed at a legal entity level,sub-portfolio levels and business-aligned portfolios (shown in the table below and in the charts on the next page) on the Group’s regulatory VaR model. Regulatory back testing compares Regulatory VaR at 99% confidence level(one-day holding period equivalent) to actual and hypothetical changes in portfolio value as defined in CRR Article 366. The consolidated Barclays Bank PLC and Barclays Capital Securities Ltd is the highest level of consolidation for the VaR models that are used in the calculation of regulatory capital.
A back testing exception is generated when a loss is greater than the daily VaR for any given day.
As defined by the PRA, a green status is consistent with a good working VaR model and is achieved for models that have four or fewer back testing exceptions in a12-month period. Back testing counts the number of days when a loss exceeds the corresponding VaR estimate, measured at the 99% regulatory confidence level. For the investment bank’s regulatory DVaR model at the consolidated legal entity level, green model status was maintained for 2016.
Back testing is also performed on management VaR to ensure it remains reasonable and fit for purpose.
The table below shows the VaR back testing exceptions on legal entities aligned to the Group’s business as at 31 December 2016. A back testing exception is generated when a loss is greater than the VaR for a given day. Exceptions are shown by legal entity rather than asset class as in prior disclosures. Model performance at a legal entity level determines regulatory capital within those entities. Legal entity disclosure also reflects the management perspective as Barclays moves forward with structural change, where VaR and model performance of VaR for a legal entity across asset class becomes more relevant than asset class metrics across legal entity.
For the investment bank’s regulatory DVaR model at the consolidated legal entity level, green model status was maintained for 2016.
| Actual P&L | Hypo P&L | |||||||||||||||
Legal entity | | Total Exceptions | | Status† | | Total Exceptions |
| Status† | ||||||||
BBPlc Trading and BCSL | 2 | G | 2 | G | ||||||||||||
BBPlc Trading | 1 | G | 2 | G | ||||||||||||
BSCL | 6 | A | 1 | G | ||||||||||||
BBSA | 3 | G | – | G | ||||||||||||
BCI* | 2 | G | 3 | G | ||||||||||||
IHC | – | G | 1 | G | ||||||||||||
| * | BCI back testing has been replaced by IHC back testing from 1 July 2016 (both are included below for their respective periods). Please note that IHC back testing is performed for hypo P&L only as per US regulatory requirements. |
| † | RAG status is accurate as ofyear-end. |
| Barclays PLC and Barclays Bank PLC 2016 Annual Report on Form 20-F | 377 |
Barclays’ approach to managing risks
Management of market risk
The charts below show VaR for the Group’s regulatory portfolios aligned to legal entity where at least one exception has occurred during 2016. The dark blue and grey points on the charts indicate losses on the small number of days on which actual and hypo P&L respectively exceeded the VaR amount.
Backtesting exceptions are caused when realised volatility exceeds the 99% percentile predicted by VaR. In addition to being driven by market moves in excess of the 99% confidence level, exceptions can be caused
by risks that impact P&L that are not captured directly in the VaR itself but that are separately captured through VaR and nonVaR-type Risks Not in VaR (RNIVs).
Exceptions are reported to internal management and regulators on a regular basis and exceptions are investigated to ensure the model performs as expected. Overall back testing for the consolidated legal entity remains in the green zone, suggesting that the VaR remains fit for purpose.
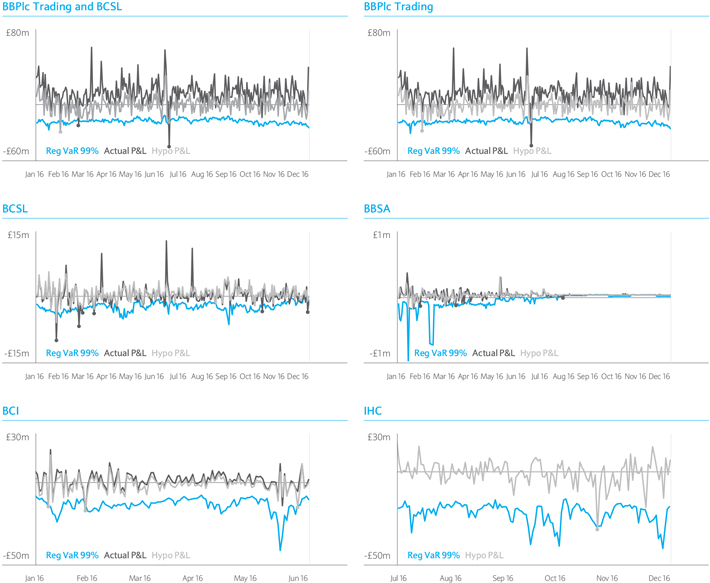
| 378 | Barclays PLC and Barclays Bank PLC 2016 Annual Report on Form 20-F |
Barclays’ approach to managing risks
Management of market risk
Management of risks not fully captured in models, including Risks not in VaR (RNIVs)
The Group’s’ risk identification process captures risks that either have been observed to, or have the capacity to, produce material losses in normal and stressed market conditions. To ensure risk coverage, the range of core risks is identified following either market convention, regulatory guidance, or the specific historical experience of the Groups and is considered as part of the new product processes.
In some instances, the Management and Regulatory VaR model may not appropriately measure some market risks, especially where market moves are not directly observable via prices, the Group has policies to ensure thatadd-ons are applied where risks are not captured by the model. RNIVs refer to those core risks that are not captured, or not adequately captured, in VaR and SVaR. RNIVs can include:
| § | risks not fully captured elsewhere and/or illiquid risk factors such as cross-risks; |
| § | basis risks; |
| § | higher-order risks; |
| § | calibration parameters, for instance to model parameter uncertainty; and |
| § | potential losses in excess of fair valuation adjustments taken in line with the Valuation Control Framework. Please see note 18 ‘Fair value of assets and liabilities’ for more details on fair value adjustments. |
The treatment of RNIVs follows whether the risks are considered VaR type ornon-VaR type, which depends on, and can change with, the evolving state of financial markets:
| § | VaR-type RNIVs: Typically represent risks that are not well captured in VaR, mainly because of infrastructure limitations or methodology limitations. In this instance two metrics are calculated, a VaR RNIV and a SVaR RNIV, using the same confidence level, capital horizon and observation period as VaR and SVaR respectively and are capitalised using the same multipliers as VaR and SVaR |
| § | NonVaR-type RNIVs: Typically represent risks which would not be well captured by any VaR model either because it represents an event not historically observed in the VaR time series (e.g., currency peg break) or a market risk factor which is not seen to move frequently (e.g. correlation). These are typically estimated using stress scenarios. The stress methodology is calibrated equivalently to at least 99% confidence level and a capital horizon of at least 10 days over an appropriate observation period, depending on the liquidity of the risk. For the purpose of regulatory capital, the capital charge is equal to the loss arising from the stress test except when these risks are already adequately captured elsewhere e.g. via the IRC or APR models, which are intended to capture certain risks not adequately covered by VaR |
For regulatory capital these RNIVs are aggregated without any offsetting or diversification benefit.
Traded market risk control
The metrics that are used to measure market risk are controlled through the implementation of appropriate limit frameworks. Limits are set at the total Group level, asset class level, for example, interest rate risk, and at business level, for example, rates trading. Stress limits and many book limits, such as foreign exchange and interest rate sensitivity limits, are also used to control risk appetite.
Firm-wide limits are reported to the BRC and are termedA-level limits for total management VaR, asset class VaR, primary stress and secondary stresses and business scenarios. These are then cascaded down by risk managers in order to meet the firm-wide risk appetite.
EachA-level limit is set after consideration is given to revenue generation opportunities and overall risk appetite approved by the Board. Compliance with limits is monitored by the independent risk functions in the trading businesses with oversight provided by Group Market Risk.
Throughout 2016, Group Market Risk continued its ongoing programme of control testing and conformance testing on the trading businesses’ market risk management practices. These reviews are intended to verify the business’s conformance with the Market Risk Control Framework and best practices.
Traded market risk reporting
Trading businesses market risk managers produce a number of detailed and summary market risk reports daily, weekly, fortnightly and monthly for business and risk managers. Where relevant on a Group-wide basis, these are sent to Group Market Risk for review and a risk summary is presented at the Group Market Risk Committee and the trading businesses’ various market risk committees. The overall market risk profile is also presented to BRC on a regular basis.
| Barclays PLC and Barclays Bank PLC 2016 Annual Report on Form 20-F | 379 |
Barclays’ approach to managing risks
Management of securitisation exposures
Securitisations give rise to credit, market and other risks. This section discusses the types of business activities and exposures that we incur in the course of activities related to securitisations.
§ The objectives pursued in securitisation activities and the types of activities undertaken are discussed on page 381.
§ A description of the risks incurred in the course of securitisation activities, and how we manage them, is contained on page 382.
|

| 380 | Barclays PLC and Barclays Bank PLC 2016 Annual Report on Form 20-F |
Barclays’ approach to managing risks
Management of securitisation exposures
This section discloses information about the Group’s securitisation activities distinguishing between the various functions performed in supporting its customers and managing its risks. It includes traditional securitisations as well as synthetic transactions effected through the use of derivatives or guarantees.
A securitisation is defined as a transaction or scheme where the payments are dependent upon the performance of a single exposure or pool of exposures and where the subordination of tranches determines the distribution of losses during the ongoing life of the transaction or scheme. Such transactions are ordinarily undertaken to transfer risk for the Group or on behalf of a client.
Certain transactions undertaken by the Group are not disclosed as they do not fall under the regulatory securitisation framework (defined under Part Three, Title II, Chapter 5 of the CRR, part of the CRD IV package). These include funding transactions for the purposes of generating term liquidity, and certain government guaranteed transactions.
Objectives of securitisation activities
In the course of its business, the Group has undertaken securitisations of its own originated assets as well as the securitisation of third party assets via special purpose vehicles, sponsored conduit vehicles and shelf programmes.
The Group has securitised its own originated assets in order to manage the Group’s credit risk position and to generate term funding for the Group balance sheet. The Group also participates in primary securitisations and distributes bonds to the market to facilitate term liquidity for its clients.
The Group also purchases asset backed loans and securities for the purpose of supporting client franchise, and purchases asset backed securities (ABS) for the purpose of investing its liquidity pool.
Further, the Group makes a secondary market for a range of securitised products globally, including residential mortgage backed securities (RMBS), commercial mortgage backed securities (CMBS) and ABS.
The role and involvement of the Group in securitisations in 2016
The Group adopts the following roles in the securitisation processes in which it is involved:
Originator of assets prior to securitisation
The Group originates or purchases commercial mortgage loans for the purpose of securitisation. The securities are then sold to investors through a broker-dealer subsidiary.
The Group securitises assets otherwise originated in the ordinary course of business including corporate loans, consumer loans and commercial mortgage loans. The Group also provides derivative transactions to securitisations sponsored by itself and third parties. These transactions are included in the Group trading book.
Providing warehousing facilities collateralised by third party assets prior to securitisation or exit via whole-loan sale
The Group provides warehouse financing to third party loan originators, including for agency eligible loans that can be securitised by the Federal National Mortgage Association (‘Fannie Mae’), the Federal Home Loan Mortgage Corporation (‘Freddie Mac’), or the Government National Mortgage Association (‘Ginnie Mae’) and for corporate loans that can be securitised via collateralized loan obligations (CLO).
Executor of securitisation trades including bond marketing and syndication
The Group transacts primarily as a principal in RMBS, ABS, CLO and CMBS with institutional investors and other broker-dealers. Agency backed residential and commercial mortgage securitisations include Credit Risk Transfer securities (FannieMae-sponsored CAS and FreddieMac-sponsored STACR bonds). ABS securitisations include consumer ABS (e.g. credit card, student loan and auto) andnon-traditional ABS (e.g. timeshares, wireless towers and whole business securitisations).Non-agency commercial mortgage securitisations include CMBS and commercial real estate collateralised loan obligations (CRE CLO). The bank makes secondary market in CLOs and acts as arranger on behalf of clients to structure and place arbitrage CLOs. The bank can also createre-securitisations of real estate mortgage investment conduits(Re-REMICs) of mortgage backed securities.
Purchaser of third party securitisations to support client franchise
The Group may purchase third party securitisations. The Group also funds on its own balance sheet securitisations similar to the ones funded via its sponsored conduits (see below). In such transactions the Group would not be defined as an originator or sponsor for regulatory purposes.
Sponsoring conduit vehicles
The Group acts as managing agent and administrative agent of amulti-seller asset backed commercial paper (ABCP) conduit, Sheffield Receivables Corporation (Sheffield), through which interests in securitisations of third party originated assets are funded via the issuance of ABCP.
From a regulatory perspective, Barclays acts as a sponsor of Sheffield. In relation to such conduit activity, the Group provides all or a portion of the backstop liquidity to the commercial paper, programme-wide credit enhancement and, as appropriate, interest rate and foreign currency hedging facilities. The Group receives fees for the provision of these services.
Sheffield holds securities classified as available for sale, measured at fair value with changes in fair value recognised through other comprehensive income (OCI) andnon-securities classified as loans and receivables, measured at amortised cost on its standalone financial statements. It funds the assets through the issuance of ABCP. Note that Sheffield is consolidated for accounting but not regulatory purposes.
Funding transactions to generate term liquidity
Secured funding forms one of the key components of the Group’s diversified funding sources providing access to the secured wholesale market and complementing the diversification of funding by maturity, currency and geography. The Group issues ABS and covered bonds secured primarily by customer loans and advances. In 2016, the Group raised £0.4bn term funding through public securitisation.
While Barclays has a number of outstanding securitisation transactions to provide term or contingent liquidity, the Group currently manages four key,on-balance sheet asset backed funding programmes to obtain term financing for mortgage and credit card lendings. These programmes also support retained issuances for the Group to access central bank funding. The UK regulated covered bond and the residential mortgage master trust securitisation programmes both utilise assets originated by the Group’s UK residential mortgage business. The third programme is a credit card master trust securitisation and uses receivables from the Group’s UK credit card business. The fourth programme is a SEC registered securitisation programme backed by US domiciled credit card receivables.
Risk transfer transactions
The Group has entered into synthetic and cash securitizations of corporate and commercial loans (originated in the ordinary course of business) for the purposes of the transfer of credit risk to third party investors. The regulatory capital requirements of these transactions fall under CRD IV.
| Barclays PLC and Barclays Bank PLC 2016 Annual Report on Form 20-F | 381 |
Barclays’ approach to managing risks
Management of securitisation exposures
Securitisation risks, monitoring and hedging policies
Capital requirements against securitisation exposures are subject to a separate framework under CRD IV (see CRR article 449) to account for the particular characteristics of this asset class. For risk management purposes, however, a securitisation is aligned to the risk type to which it gives rise.
Credit risks
In a securitisation structure, the payments are dependent upon the performance of a single exposure or pool of exposures. As these underlying exposures are usually credit instruments, the performance of the securitisation is exposed to credit risk.
Securitisation exposures are subject to the Group Credit Risk policies and standards and business level procedures. This includes the requirement to review in detail each transaction at a minimum on an annual basis. As collateral risk is the primary driver the analysis places a particular focus on the underlying collateral performance, key risk drivers, servicer due diligence and cash flows, and the impact of these risks on the securitisation notes. The risk is addressed through the transaction structure and by setting an appropriate modelled tolerance level. Structural features incorporate wind-down triggers set against factors including, but not limited to, defaults/charge-offs, delinquencies, excess spread, dilution, payment rates and yield, all of which help to mitigate potential credit deterioration. Qualitative aspects such as counterparty risk and ancillary issues (operational and legal risk) are also considered. Changes to the credit risk profile of securitisation exposures will also be identified through ongoing transaction performance monitoring. In addition, periodic stress tests of the portfolio as part of ongoing risk management are conducted as well as in response to Group-wide or Regulatory requests.
The principal committee responsible for the monitoring of the credit risk arising from securitisations is Wholesale Credit Risk Management Committee (WCRMC). Executive responsibility rests with the Regional Heads of Financial Institutions Credit Risk.
Market and liquidity risks
Market risk for securitised products is measured, controlled and limited through a suite of VaR,non-VAR and stress metrics in accordance with the Group’s Market Risk Policies and Procedures. The key risks of securitisation structures are interest rate, credit, spread, prepayment and liquidity risk. Interest rate and spread risk is hedged with standard liquid interest rate instruments (including interest rate swaps, US Treasuries and US Treasury futures). The universe of hedging instruments for credit and prepayment risk is limited and relatively illiquid, resulting in basis risks. In providing warehouse financing, the Group is exposed to mark to market (if counterparty defaults on related margin call).
Hedging
Securitisation andre-securitisation exposures benefit from the relative seniority of the exposure in the capital structure. Due to lack of availability in the credit default swap market for individual asset backed securities, there are no material CDS hedge counterparties relating to the securitisation andre-securitisation population.
Operational risks
Operational risks are incurred in all of the Group’s operations. In particular, all securitised (andre-securitised) assets are subject to a degree of risk associated with documentation and the collection of cash flows.
In providing warehouse financing, we incur potential contingent operational risks related to representations and warranties should we need to foreclose on the line and it be later discovered that the underlying loans were not underwritten to agency agreed criteria. Such risks are mitigated by daily collateral margining and ready agency bids. Market risk is also mitigated by employing forward trades.
The Operational Risk Review Forum oversees the management of operational risks for the entire range of the Group’s activities.
Rating methodologies, ECAIs and RWA calculations
RWAs reported for securitised andre-securitised banking book and trading book assets at 31 December 2016 are calculated in line with CRR and UK PRA rules and guidance. The Group has approval to use, and therefore applies, the internal ratings based approach for the calculation of RWAs where appropriate, and the Standardised Approach elsewhere.
The Group employs eligible ratings issued by nominated External Credit Assessment Institutions (ECAIs) to risk weight its securitisation and re securitisation exposure where their use is permitted. Ratings are considered eligible for use based on their conformance with internal rating standard which is compliant with both CRR and European Credit Rating Agency regulation. The ECAIs nominated by the Group for this purpose are Standard & Poor’s, Moody’s, Fitch and DBRS.
As required by CRR, the Group uses credit ratings issued by these ECAIs consistently for all exposures within the securitisation exposure class. For that reason, there is no systematic assignment of particular agencies to types of transactions within the securitisation exposure class.
For Sheffield, the Internal Assessment Approach (IAA) framework mirrors the ECAI methodology, which also includes Moody’s and Fitch, who rate the Sheffield programme. Under the IAA framework, the securitisation exposure must be internally rated, and the bank’s internal assessment process must meet certain requirements in order to map its own internal rating to an ECAI. Cash flow stress analysis on a securitisation structure is performed as prescribed by an ECAI methodology for the relevant ratings level, and is at least as conservative as the published methodology. Stress factors may include, among other factors, asset yields, principal payment rates, losses, delinquency rates and interest rates.
In determining an internal rating, collateral risks are the primary driver and are addressed through the transaction structure and modelled statistical confidence. The analysis reflects the Group’s view on the transaction, including dilution risk, concentration and tenor limits, as well as qualitative aspects such as counterparty risk and important ancillary issues (operational and legal risks). The adequacy and integrity of the servicer’s systems and processes for underwriting, collections policies and procedures are also reviewed. The Group conducts a full due diligence review of the servicer for each transaction. Each transaction is reviewed on, at least, an annual basis with a focus on the performance of underlying assets. The results of any due diligence review and the financial strength of the seller/servicer, are also factored into the analysis. Ratings of the transaction are reaffirmed with the most up to date ECAI methodologies. Any transaction which deviates from the current methodology is amended accordingly.
| 382 | Barclays PLC and Barclays Bank PLC 2016 Annual Report on Form 20-F |
Barclays’ approach to managing risks
Management of securitisation exposures
Summary of the accounting policies for securitisation activities
Certain Group-sponsored entities have issued debt securities or have entered into funding arrangements with lenders in order to finance specific assets. An entity is consolidated by the Group when the Group has control over the entity. The Group controls an entity if it has all of the three elements of control which are i) power over the entity; and ii) exposure, or rights, to variable returns from its involvement with the entity; iii) the ability to use its power over the entity to affect the amount of the Group returns.
The consolidation treatment must be initially assessed at inception and is reassessed if facts and circumstances indicate that there are changes to one or more of the three elements of control.
Typically, assets that are awaiting securitisation on the Group balance sheet are measured at fair value through P&L, using the appropriate method for the asset class as they are classified as held for trading or are designed at fair value through profit and loss, under the IAS 39 fair value option. However somenon-derivative assets held prior to securitisation may qualify as loans and receivables and are measured at amortised cost. When securitised assets have been included on the Group balance sheet it is necessary to consider whether those assets may be removed from the Group balance sheet. Assets which have been transferred to third parties (i.e. an unconsolidated Group entity), will remain on the Group balance sheet, and treated as financings, unless the following criteria apply:
| § | substantially all the risks and rewards associated with the assets have been transferred, in which case, they are derecognised in full |
| § | if a significant portion, but not all, of the risks and rewards have been transferred, the asset is derecognised entirely if the transferee has the ability to sell the financial asset, otherwise the asset continues to be recognised only to the extent of the Group’s continuing involvement. |
Any financial support or contractual arrangements provided to unconsolidated entities, over securitised assets, would be recognised as a liability on balance sheet if it met the relevant IFRS criteria, or gave rise to a provision under IAS 37, and have to be disclosed. Note, however, that the Group has a Significant Risk Transfer policy that does not allow for any support to be provided to any transactions that fall under the securitisation framework.
Assets may be transferred to a third party through a legal sale or an arrangement that meets the ‘passthrough’ criteria where the substance of the arrangement is principally that the Group is acting solely as a cash collection agent on behalf of the eventual recipients.
Where the transfer applies to a fully proportionate share of all or specifically identified cash flows, the relevant accounting treatment is applied to that proportion of the asset.
When the above criteria support the case that the securitisation should not be accounted for as financing, the transaction will result in sale treatment or partial sale treatment to the extent the Group has no continuing involvement. Where the Group has continuing involvement the assets will continue to be recognised to the extent of the continuing involvement. Gains are recognised to the extent that proceeds that can be measured using observable market data exceed the assets derecognised.
Any retained interests, which will consist of loans and/or securities depending on the nature of the transaction, are valued in accordance with the Group’s Accounting Policies, as set out in the 2016 Annual Report. To the extent that these interests are measured at fair value, they will be included within the fair value disclosures in the financial statements in the Annual Report. As outlined in these disclosures, key valuation assumptions for retained interests of this nature will include spreads to discount rates, default and recovery rates and prepayment rates that may be observable or unobservable.
In a synthetic securitisation transaction, the underlying assets are not sold into the relevant special purpose entity (SPE). Instead, their performance is transferred into the vehicle through a synthetic instrument such as a CDS, a credit linked note or a financial guarantee. The accounting policies outlined above will apply to synthetic securitisations.
| Barclays PLC and Barclays Bank PLC 2016 Annual Report on Form 20-F | 383 |
Barclays’ approach to managing risks
Management of Treasury and Capital Risk
This section provides an analysis of the management of liquidity, capital and Interest rate risk in the banking risk.
§ Liquidity risk, with a focus on how it is managed to ensure that resources are adequate at all times including under stress, is discussed on pages 386 to 387
§ Capital risk, including how the risk of insufficient capital and leverage ratios and pension risk are managed, is discussed on pages 388 to 389
§ The management of Interest rate risk in the banking book is discussed on pages390 to 391
|
|
| 384 | Barclays PLC and Barclays Bank PLC 2016 Annual Report on Form 20-F |
Barclays’ approach to managing risks
Management of Treasury and Capital Risk
Treasury and capital risk
The risk that the Group may not achieve its business plans because of the availability of planned liquidity, a shortfall in capital or a mismatch in the interest rate exposures of its assets and liabilities. The Treasury and Capital Risk function is an independent risk function with responsibility for oversight of the following risks:
∎ Liquidity risk:The risk that the firm is unable to meet its contractual or contingent obligations or that it does not have the appropriate amount, tenor and composition of funding and liquidity to support its assets
∎ Capital risk:The risk that the firm has an insufficient level or composition of capital to support its normal business activities and to meet its regulatory capital requirements under normal operating environments or stressed conditions (both actual and as defined for internal planning or regulatory testing purposes). This includes the risk from the firm’s pension plans
∎ Interest rate risk in the banking book: The risk that the firm is exposed to capital or income volatility because of a mismatch between the interest rate exposures of its(non-traded) assets and liabilities.
|
Overview
Barclays Treasury manages treasury and capital risk on aday-to-day basis with the Treasury Committee acting as the principal management body. To ensure effective oversight and segregation of duties and in line with the ERMF, the Treasury and Capital Risk function is responsible for oversight key capital and liquidity risk management activities.
To ensure effective oversight and segregation of duties and in line with the ERMF, the Treasury and Capital Risk function is responsible for oversight key capital, liquidity,non-traded market risk (NTMR) and pension risk management activities. The following describes the structure and governance associated with the risk types within the Treasury and Capital Risk function.
Organisation and structure

| Barclays PLC and Barclays Bank PLC 2016 Annual Report on Form 20-F | 385 |
Barclays’ approach to managing risks
Management of Treasury and Capital Risk
Liquidity risk management
Overview
The efficient management of liquidity is essential to the Group in retaining the confidence of the financial markets and ensuring that the business is sustainable. There is a control framework in place for managing liquidity risk and this is designed to meet the following objectives:
| § | To maintain liquidity resources that are sufficient in amount and quality and a funding profile that is appropriate to meet the liquidity risk appetite as expressed by the Board |
| § | To maintain market confidence in the Group’s name. |
This is achieved via a combination of policy formation, review and governance, analysis, stress testing, limit setting and monitoring. Together, these meet internal and regulatory requirements.
Roles and responsibilities
The Treasury and Capital Risk function is responsible for the management and governance of the liquidity risk mandate defined by the Board. Treasury has the primary responsibility for managing liquidity risk within the set risk appetite.
Liquidity risk management
A control framework is in place for Liquidity Risk under which the Treasury function operates. The control framework describes liquidity risk management processes, associated policies and controls that the Group has implemented to manage liquidity risk within the Liquidity Risk Appetite (LRA) and is subject to annual review.
The Board sets the LRA over Group stress tests and is represented as the level of risk the Group chooses to take in pursuit of its business objectives and in meeting its regulatory obligations. The approved LRA is implemented in line with the control framework and policy for liquidity risk.
Control framework
Barclays has a comprehensive control framework for managing the Group’s liquidity risk. It is designed to deliver the appropriate term and structure of funding consistent with the LRA set by the Board.
The control framework incorporates a range of ongoing business management tools to monitor, limit and stress test the Group’s balance sheet and contingent liabilities and a Contingency Funding Plan. Limit setting and transfer pricing are tools that are designed to control the level of liquidity risk taken and drive the appropriate mix of funds. Together, these tools reduce the likelihood that a liquidity stress event could lead to an inability to meet the Group’s obligations as they fall due.
The stress tests assess the potential contractual and contingent stress outflows under a range of scenarios, which are then used to determine the size of the liquidity pool that is immediately available to meet anticipated outflows if a stress occurs.
The Group maintains a Contingency Funding Plan which details how liquidity stress events of varying severity would be managed. Since the precise nature of any stress event cannot be known in advance, the plans are designed to be flexible to the nature and severity of the stress event and provide a menu of options that can be drawn upon as required. Barclays also maintains Recovery Plans which consider actions to generate additional liquidity in order to facilitate recovery in a severe stress.

Risk Appetite and planning
Barclays has established a LRA over Group stress tests and is represented as the level of liquidity risk the Group chooses to take in pursuit of its business objectives and in meeting its regulatory obligations.
The key expression of the liquidity risk is through stress tests. It is measured with reference to the liquidity pool compared to anticipated stressed net contractual and contingent outflows for each of five stress scenarios. Barclays has defined both internal short term and long term LRA stress test metrics.
The LRA for internal stress tests is approved by the Board. The LRA is reviewed on a continuous basis and is subject to formal review at least annually as part of the Individual Liquidity Adequacy Assessment Process (ILAAP).
Statement of Liquidity Risk Appetite: The Board has approved that the Group will maintain an amount of available liquidity resources to meet modelled and prescribed regulatory liquidity stress outflows over a period of time (minimum buffer duration):
§ 30 days in a Barclays specific stress
§ 90 days in a market wide stress
§ 30 days in a combined stress
§ LCR 30 days minimum ratio 100% (Pillar 1 basis)
§ LCR 30 days minimum ratio 80% (Pillar 2 basis)
§ Long term LRA 80% LCR (Pillar 2).
|
The stress outflows are used to determine the size of the Group Liquidity Pool, which represents those resources immediately available to meet outflows in a stress. In addition to the liquidity pool, the control framework and policy provides for other management actions, including generating liquidity from other liquid assets on the Group’s balance sheet in order to meet additional stress outflows, or to preserve or restore the Liquidity Pool in the event of a liquidity stress.
| 386 | Barclays PLC and Barclays Bank PLC 2016 Annual Report on Form 20-F |
Barclays’ approach to managing risks
Management of Treasury and Capital Risk
Liquidity limits
Barclays manages limits on a variety of on andoff-balance sheet exposures, a sample of which is shown in the table below. These limits serve to control the overall extent and composition of liquidity risk taken by managing exposure to the cash outflows.
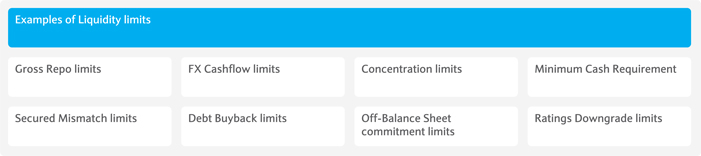
Early warning indicators
Barclays monitors a range of market indicators for early signs of liquidity risk either in the market or specific to Barclays, a sample of which are shown in the table below. These are designed to immediately identify the emergence of increased liquidity risk to maximise the time available
to execute appropriate mitigating actions. Early warning indicators are used as part of the assessment of whether to invoke the Group’s Contingency Funding Plan, which provides a framework for how the liquidity stress would be managed.
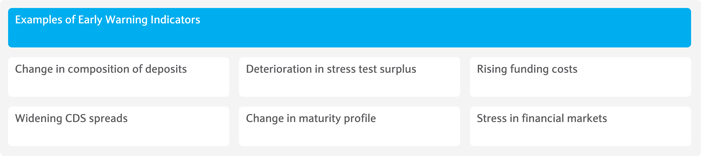
Contingency funding plan and recovery & resolution planning
Barclays maintains a Contingency Funding Plan (CFP) which is designed to provide a framework where a liquidity stress could be effectively managed. The CFP is proportionate to the nature, scale and complexity of the business and is tested to ensure that it is operationally robust. The CFP details the circumstances in which the plan could be invoked, including as a result of adverse movements in liquidity early warning indicators. As part of the plan, the Barclays Treasurer has established a Liquidity Management Committee (LMC). On invocation of the CFP by the Executive Committee, the LMC would meet to identify the likely impact of the event on the Group and determine the appropriate response for the nature and severity of the stress.
The CFP provides a communication plan and includes management actions to respond to liquidity stresses of varying severity. This could include monetising the liquidity pool, slowing the extension of credit, increasing the tenor of funding and securitising or selling assets.
| Barclays PLC and Barclays Bank PLC 2016 Annual Report on Form 20-F | 387 |
| Barclays’ approach to managing risks | ||
Management of Treasury and Capital Risk
| ||
Capital risk management
Overview
Capital risk is managed through ongoing monitoring and management of the capital position, regular stress testing and a robust capital governance framework
|
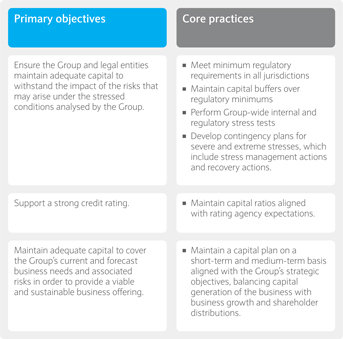
Organisation and structure
The management of capital risk is integral to the Group’s approach to financial stability and sustainability management, and is embedded in the way businesses and legal entities operate.
Capital risk management is underpinned by a control framework and policy. The capital management strategy, outlined in the Group and legal entity capital plans, is developed in alignment with the control framework and policy for capital risk, and is implemented consistently in order to deliver on the Group’s objectives.
The Board approves the Group capital plan, internal and regulatory stress tests, and the Group recovery plan. The Treasury Committee is responsible for monitoring and managing capital risk in line with the Group’s capital management objectives, capital plan and risk frameworks. The Board Risk Committee reviews the risk profile, and annually reviews risk appetite and the impact of stress scenarios on the Group capital plan/forecast in order to agree the Group’s projected capital adequacy.
Local management ensures compliance with an entity’s minimum regulatory capital requirements by reporting to local Asset and Liability Committees with oversight by the Group’s Treasury Committee, as required.
Roles and responsibilities
Treasury has the primary responsibility for managing and monitoring capital and reports to the Group Finance Director. The Treasury and Capital Risk function contains a Capital Risk Oversight team, and is an independent risk function that reports to the Group CRO and is responsible for oversight of capital risk.
Capital risk management
The Group’s capital management strategy is driven by the strategic aims of the Group and the risk appetite set by the Board. The Group’s objectives are achieved through well embedded capital management practices.
Capital planning and allocation
The Group assesses its capital requirements on multiple bases, with the Group’s capital plan set in consideration of the Group’s risk profile and appetite, strategic and performance objectives, regulatory requirements, and market and internal factors, including the results of stress testing. The capital plan is managed on atop-down andbottom-up basis through both short-term and medium-term financial planning cycles, and is developed with the objective of ensuring that the Group maintains an adequate level of capital to support its capital requirements.
The PRA determines the regulatory capital requirements for the consolidated Group. Under these regulatory frameworks, capital requirements are set in consideration of the level of risk that the firm is exposed to and the factors above, and are measured through both risk-based RWAs and leverage-based metrics. An internal assessment of the Bank’s capital adequacy is undertaken through the Internal Capital Adequacy Assessment Process (ICAAP) and is used to inform the capital requirements of the firm.
The Group expects to meet the minimum requirements for capital and leverage both during the transition period and upon full implementation, and also holds an internal buffer sized according to the firm’s assessment of capital risk.
Through the capital planning process, capital allocations are approved by the Group Executive committee, taking into consideration the risk appetite and strategic aims of the Group. Regulated legal entities are, at a minimum, capitalised to meet their current and forecast regulatory and business requirements.
Monitoring and reporting
Capital is managed and monitored to ensure that Barclays’ capital plans remain appropriate and that risks to the plans are considered.
Limits are in place to support alignment with the capital plan and adherence to regulatory requirements, and are monitored through appropriately governed forums. Capital risks against firm-specific and macroeconomic early warning indicators are monitored and reported to the Treasury Committee, with clear escalation channels to senior management. This enables a consistent and objective approach to monitoring the capital outlook against the capital plan, and supports the early identification when outlooks deteriorate.
Capital management information is readily available to support the Senior Management’s strategic andday-to-day business decision making.
Stress testing and risk mitigation
Internal group-wide stress testing is undertaken to quantify and understand the impact of sensitivities on the capital plan and capital ratios arising from stressed macroeconomic conditions. Recent economic, market and peer institution stresses are used to inform the assumptions developed for internal stress tests and to assess the effectiveness of mitigation strategies.
The Group also undertakes stress tests prescribed by the BoE and EBA, and legal entities undertake stress tests prescribed by their local regulators. These stress tests inform decisions on the size and quality of the internal capital buffer required and the results are incorporated into the Group capital plan to ensure adequacy of capital under normal and severe, but plausible stressed conditions.
Actions are identified as part of the stress tests that can be taken to mitigate the risks that may arise in the event of material adverse changes in the current economic and business outlook. As an additional layer of protection, the Group Recovery Plan defines the actions and implementation strategies available to the Group to increase or preserve capital resources in the situation that a stress occurs that is more severe than anticipated.
| 388 | Barclays PLC and Barclays Bank PLC 2016 Annual Report on Form 20-F |
Barclays’ approach to managing risks
Management of Treasury and Capital Risk
Regulatory and accounting developments
Further changes to capital requirements are expected due to continued regulatory focus on the risk weighting of assets, including Basel Committee on Banking Supervision (BCBS) proposals on fundamental review of the trading book, revisions to standardised rules for credit risk, counterparty credit risk, CVA volatility risk and operational risk, application of an RWA floor based on the standardised approach to limit the use of internal models in certain areas as well as the impact of IFRS 9 on the firm’s capital position.
Additional capital requirements are also expected from other regulatory reforms, including UK, EU and US proposals on bank structural reform and current European Banking Authority (EBA) proposals for ‘Minimum Requirement for own funds and Eligible Liabilities (MREL) under the EU Bank Recovery and Resolution Directive (BRRD). Included within these reforms are the Bank of England final rules on MREL requirements for UK banks which were published on 31 October 2016. The Bank of England has stated that the bank’s final MREL requirements will be subject to a review in 2020.
Many of the expected regulatory proposals are still subject to finalisation, with calibration and timing of implementation still to be determined and the potential for the impacts to be different from those originally expected when in final form. For further information see ‘Funding Risk’ in the Material Risks section and ‘Regulatory Developments’ in the Supervision and Regulation section.
Transferability of capital
Surplus capital held in Group entities is required to be repatriated to Barclays Bank PLC in the form of dividends and/or capital repatriation, subject to local regulatory requirements, exchange controls and tax implications. This approach provides optimal flexibility on there-deployment of capital across legal entities. Pre and post the implementation of ring-fencing, capital is managed for the Group as a whole as well as its operating subsidiaries to ensure fungibility and redeployment of capital while meeting relevant internal and regulatory targets at entity levels.
Foreign exchange risk
The Group has capital resources and RWAs denominated in foreign currencies. Changes in foreign exchange rates result in changes in the Sterling equivalent value of foreign currency denominated capital resources and RWAs. As a result, the Group’s regulatory capital ratios are sensitive to foreign currency movements.
The Group’s capital ratio management strategy is to minimise the volatility of the capital ratios caused by foreign exchange rate movements. To achieve this, the Group aims to maintain the ratio of foreign currency CET1, Tier 1 and Total capital resources to foreign currency RWAs the same as the Group’s consolidated capital ratios.
The Group’s investments in foreign currency subsidiaries and branches, to the extent that they are not hedged for foreign exchange movements, translate into GBP upon consolidation creating CET1 capital resources sensitive to foreign currency movements. Changes in the GBP value of the investments due to foreign currency movements are captured in the currency translation reserve, resulting in a movement in CET1 capital.
To create foreign currency Tier 1 and Total Capital resources additional to the CET1 capital resources, the Group issues debt capital innon-Sterling currencies, where possible. This is primarily achieved through the issuance of debt capital from Barclays PLC or Barclays Bank PLC in US Dollar and Euro, but can also be achieved by subsidiaries issuing capital in local currencies.
Management of pension risk
The Group maintains a number of defined benefit pension schemes for past and current employees. The ability of the pension fund to meet the projected pension payments is maintained principally through investments.
Pension risk arises because the estimated market value of the pension fund assets might decline; investment returns might reduce; or the estimated value of the pension liabilities might increase as a result of changes to the market process. The Group monitors the market risks arising from its defined benefit pension schemes, and works with the Trustees to address shortfalls. In these circumstances, the Group could be required or might choose to make extra contributions to the pension fund. The Group’s main defined benefit scheme was closed to new entrants in 2012.
Many of the Group’s defined benefit (DB) pension funds are established as trusts in order to keep the fund’s assets separate from the sponsor (Barclays). As such, the Trustees are responsible for:
| § | Investment strategy including asset allocation and performance of assets. |
| § | Assessing the level of technical provision required. |
| § | Ensuring any minimum funding objectives is met. |
| § | Complying with local legislation. |
The legal structure of Barclays’ DB pension funds and the role of the Trustees mean that Pension Risk is not part of the Bank’s risk appetite assessment used to manage other key risks.
Pension Forums
The Pension Executive Board (PEB) has accountability for the effective operation of pensions across Barclays Group. It is the most senior executive body for pensions in Barclays.
The Pension Management Group (PMG) is accountable for oversight and workflow management of the group’s responsibilities of the pension arrangements operated by Barclays PLC and its subsidiaries globally. The PMG is accountable to the PEB.
The PEB and PMG are not created or mandated under the ERMF. However these forums provide Risk the opportunity to discuss pension risk in a wider context as other relevant stakeholders from HR, Legal, Treasury and Finance are also represented at these meetings.
Key Pension Risk control and governance include:
Annual review, challenge and proposal of the IAS19 market driven assumptions used for the calculation of the pension scheme liabilities used in Barclays disclosures.
| § | Representation and input at key Pension forums. |
| § | Input into the Group’s ICAAP for Pension risk. |
| § | Input into the Group’s strategic plan and Stress Test exercise. |
| § | Provide independent oversight of the Pension risk profiles from the Bank’s perspective. |
| § | Coordinates response to regulatory initiatives, developments and proposals on Pension, which may include inputs from material overseas schemes such as in the US, Europe and Africa. |
| Barclays PLC and Barclays Bank PLC 2016 Annual Report on Form 20-F | 389 |
Barclays’ approach to managing risks
Management of Treasury and Capital Risk
Interest rate risk in the banking book management
Overview
Banking book operations generatenon-traded market risk, primarily through interest rate risk arising from the sensitivity of net interest margins to changes in interest rates. To manage interest rate risk within its defined risk appetite, the principal banking businesses engages in internal derivative trades with Treasury. However, the businesses remain susceptible to market risk from six key sources:
| § | direct risk: the mismatch between therun-off of product balances and the associated interest rate hedge, given that the balance sheet is held static |
| § | structural risk:the impact of the rate shock on the rolling hedge replenishment rate onnon-maturity products, given that the balance sheet is held static |
| § | prepayment risk:balancerun-off may be faster or slower than expected, due to customer behaviour in response to general economic conditions or interest rates. This can lead to a mismatch between the actual balance of products and the hedges executed with Treasury based on initial expectations |
| § | recruitment risk:the volume of new business may be lower or higher than expected, requiring the business to unwindpre-hedging or execute hedging transactions with Treasury at different rates than expected |
| § | residual risk and margin compression:the business may retain a small element of interest rate risk to facilitate the day to day management of customer business. Additionally, in the current low rate environment, deposits on which the Group sets the interest rate are exposed to margin compression. This is because for any further fall in base rate the Group must absorb an increasing amount of the rate move in its margin |
| § | lag risk:the risk of being unable tore-price products immediately after a change in interest rates due to both mandatory notification periods and operational constraints in large volume mailings. This is highly prevalent in managed rates savings product (e.g. Every Day Saver) where customers must be informed in writing of any planned reduction in their savings rates. |
Non-traded market risk also arises from the Liquidity Buffer investment portfolio, which is managed to a defined risk appetite. Investments in the liquidity buffer are generally subject to available for sale accounting rules; changes in the value of these assets impact capital via the available for sale reserve.
Roles and responsibilities
The Treasury Market Risk team:
| § | Provides risk management oversight and monitoring of all traded- andnon-traded market risk in Treasury, which specifically includes risk management of the liquidity buffer, funding activities, asset and liability management hedging, residual interest rate risk from the hedge accounting solution and foreign exchange translation hedging |
| § | Sets and monitors risk limits to ensurenon-traded market risk taken in Treasury and the customer banking book adheres to agreed risk appetite. |
The IRRBB team:
| § | Assesses interest rate risk in the banking book, particularly as it relates to customer banking book and Treasury |
| § | Acts as review and challenge of the first line’s risk management practices and decisions including the hedging activity performed by Treasury on behalf of the business |
| § | Acts as review and challenge for the behavioural assumptions used in hedging and transfer pricing. |
Management ofnon-traded market risk, mitigation and hedging policies
Barclays actively seeks to minimise interest risk in the banking book by actively hedging this risk with the use of interest rate products. At the same time Barclays actively manages the potential asset and liability mismatches and changes to interest rates that could reduce the value of our investment portfolios.
Non-traded risk measurement
Barclays uses a range of complementary technical approaches to measurenon-traded market risk.
Summary of measures fornon-traded market risk
| ||
Measure | Definition | |
Annual earnings at risk | Impact on earnings of a parallel (upward or downward) movement in interest rates. | |
Economic value of equity (EVE) | Change in the present value of the banking book of a parallel (upward or downward) interest rate shock. | |
Economic capital | Economic Capital (EC) is held to protect against unexpected loss (in excess of expected loss) and calculated over aone-year time horizon. | |
Value at risk (VaR) | An estimate of the potential loss arising from unfavourable market movements, if the current positions were to be held unchanged for a set period of time. | |
Stress testing | Scenario based stress testing using a variety of economic parameters to quantify the impact to P&L and the balance sheet under various levels of stress. | |
The risk in each business is measured and controlled using both an income metric (Annual Earnings at Risk) and value metrics (Economic Value of Equity, Economic Capital and VaR).
Annual Earnings at Risk (AEaR)
AEaR measures the sensitivity of net interest income over the nextone-year period. It is calculated as the difference between the estimated income using the expected base rate forecast and the lowest estimated income following a parallel increase or decrease in interest rates (200bps), subject to a minimum interest rate of 0%. 200bp shocks are consistent with industry best practice and supported by banking regulators.
The main model assumptions are:
| § | The balance sheet is kept at the current level, i.e. no growth is assumed |
| § | Balances are adjusted for an assumed behavioural profile. This includes the treatment of fixed rate loans including mortgages. |
AEaR is applied to the entire banking book, including the liquidity buffer and internal trades with the trading book to hedge against interest rate risk in the banking book exposures. The metric provides a measure of how interest rate risk may impact the Group’s earnings, providing a simple comparison between risk and returns. The main disadvantage of the metric is its short-term focus, as it only measures the impact on a position in the first 12 months. In order to counter this, the Group has implemented additional economic value risk metrics.
| 390 | Barclays PLC and Barclays Bank PLC 2016 Annual Report on Form 20-F |
Barclays’ approach to managing risks
Management of Treasury and Capital Risk
Economic Value of Equity (EVE)
EVE calculates the change in the present value of thenon-traded exposure for a parallel upward and downward interest rate (200bps) shock. This shock is useful for drawing comparisons across portfolios, and is also a regulatory reporting requirement. Note that the EVE calculation measures sensitivity in terms of present value, while AEaR measures income sensitivity.
The EVE measure is applied to the entire banking book, that is, the same coverage as AEaR, and covers the full life of transactions and hedges ensuring the risk over the whole life of positions are considered. The main weaknesses of this model stem from its simplicity. In particular, it does not capture the impact of business growth or of management actions, and is based on the balance sheet as at the reporting date.
Economic Capital (EC, for recruitment, prepayment and residual risk)
EC consistent models, based on DVaR methodologies, are used to measure unexpected losses to a 99.98% confidence interval over aone-year period. Withinnon-traded risk, this measure aims to capture recruitment risk, prepayment risk and residual risk for banking book products (see definitions on page 108). EC metrics typically measure variations in economic value from specific sources of risk, for example, prepayment risk EC for fixed rate mortgages predicts the cost of hedging to reduce any mismatch exposure resulting from the impact of an interest rate shock on customer prepayment levels.
EC is used in the active management of the banking book. Limits are set against EC metrics and breaches trigger mitigating actions to reduce exposure to appropriate levels. EC modelling is typically applied only to fixed rate products and the majority of variable rate and administered rate portfolios are not subject to an EC measure.
Advantages of EC are that it can calculate unexpected losses to an appropriate degree of confidence given the nature of the risks, and that it covers sources of loss beyond the scope of other models (AEaR only covers income changes over aone-year period; EVE only considers existing business and does not include any dynamic customer behaviour assumptions). The main weaknesses come from necessary simplifying assumptions. In the case of models based on statistical confidence intervals, the choice of the statistical distribution may drive under-prediction of very extreme events (i.e. the real distribution may befat-tailed). To mitigate this, the Group continues to improve its models using long time series of historical data to capture extreme effects.
Value at Risk (VaR)
VaR is an estimate of the potential loss arising from unfavourable market movements, if the current positions were to be held unchanged for a set period. For internal market risk management purposes, a historical simulation methodology is used with atwo-year equally weighted historical period, at the 95% confidence level for banking book portfolios covered by the measure. This calculation is a present value sensitivity while AEaR is an income sensitivity.
Daily VaR is used to measure residual interest and foreign exchange risks within certain banking book portfolios.
Quarterly scaled VaR is used to measure risk in the Liquidity Buffer Investment Portfolio. The calculation uses a five-year historical period, a 95% confidence level and is scaled from daily to quarterly by an approved constant factor.
Stress testing
Stress losses are calculated for the liquidity buffer portfolio, but not subject to controlled limits.
Allnon-traded market risk positions are subject to the Group’s annual stress testing exercise, where scenarios based on economic parameters are used to determine the potential impact of the positions on results and the balance sheet.
Non-traded market risk control
Non-traded market risk is controlled through the use of limits on many of the above risk measures. Limits are set at the total business level and then cascaded down. The total business level limits are owned by the BCROs, while the overall Group AEaR limit is agreed with Group Market Risk and approved by the BRC. Compliance with limits is monitored by the respective business market risk team with oversight provided by Group Market Risk.
Businesses manage their interest rate risk exposures by transferring this risk to Group Treasury, who then mitigate this risk using external markets if appropriate to keep the overall exposure within the agreed risk appetite. Group policy preventsnon-trading businesses to run trading books; this is only permitted for the investment bank, Group Treasury, BarclaysNon-Core and Africa Banking.
Non-traded market risk reporting
Businesses market risk managers produce a number of detailed and summary market risk reports monthly. Where relevant on a Group-wide basis, these are sent to Group Market Risk for review and a risk summary is presented at the Group Market Risk Committee and the various market risk committees at business level. The overall market risk profile is also presented to BRC on a regular basis.
| Barclays PLC and Barclays Bank PLC 2016 Annual Report on Form 20-F | 391 |
Barclays’ approach to managing risks
Management of operational risk
The sources of operational risks, and how those risks are managed, are detailed in this section.
| § | The types of risks that are classified as operational risks are described on page393. |
| § | Governance, management and measurement techniques are covered on pages 159 to 161. |

| 392 | Barclays PLC and Barclays Bank PLC 2016 Annual Report on Form 20-F |
Barclays’ approach to managing risks
Management of operational risk
Operational risks
The risk of loss to the firm from inadequate or failed processes or systems, human factors or due to external events (for example fraud) where the root cause is not due to credit or market risks.
|
Overview
The management of operational risk has two key objectives:
| § | minimise the impact of losses suffered, both in the normal course of business (small losses) and from extreme events (large losses) |
| § | improve the effective management of the Group and strengthen its brand and external reputation. |
The Group is committed to the management and measurement of operational risk and was granted a waiver by the FSA (now the PRA) to operate an Advanced Measurement Approach (AMA) for operational risk, which commenced in January 2008. The majority of the Group calculates regulatory capital requirements using AMA (94% of capital requirements), except for small parts of the organisation acquired since the original permission (6% of capital requirements) using the Basic Indicator Approach (BIA). The Group works to benchmark its internal operational risk management and measurement practices with peer banks and to drive the further development of advanced techniques.
The Group is committed to operating within a strong system of internal controls that enables business to be transacted and risk taken without exposing the Group to unacceptable potential losses or reputational damages. The Group has an overarching framework that sets out the approach to internal governance. This guide establishes the mechanisms and processes by which the Board directs the organisation, through setting the tone and expectations from the top, delegating authority and monitoring compliance.
Organisation and structure
Organisation and structure
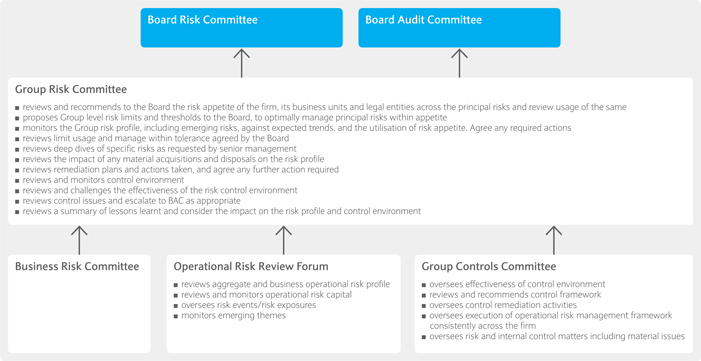
Operational Risk comprises a number of specific risks defined as follow:
| § | external supplier:inadequate selection and ongoing management of external suppliers |
| § | financialreporting:reporting mis-statement or omission within external financial or regulatory reporting |
| § | fraud:dishonest behaviour with the intent to make a gain or cause a loss to others |
| § | information:inadequate protection of the Group’s information in accordance with its value and sensitivity |
| § | payments process:failure in operation of payments processes |
| § | people:inadequate people capabilities, and/or performance/reward structures, and/or inappropriate behaviours |
| § | premises & security: unavailability of premises (to meet business demand) and/or safe working environments, and inadequate protection of physical assets, employees and customers against external threats |
| § | taxation: failure to comply with tax laws and practice which could lead to financial penalties, additional tax charges or reputational damages |
| § | technology (including cyber security):failure to develop and deploy secure, stable and reliable technology solutions which includes risk of loss or detriment to the Group’s business and customers as a result of actions committed or facilitated through the use of networked information systems |
| § | transaction operations: failure in the management of critical transaction processes. |
| Barclays PLC and Barclays Bank PLC 2016 Annual Report on Form 20-F | 393 |
Barclays’ approach to managing risks
Management of operational risk
In order to ensure complete coverage of the potential adverse impacts on the Group arising from operational risk, the operational risk taxonomy extends beyond the operational risks listed above to cover areas included within conduct risk. For more information on conduct risk please see page 399.
These risks may result in financial and/or non-financial impacts including legal/regulatory breaches or reputational damages.
The Group also recognises that there are certain threats/risk drivers that are more thematic and have the potential to impact the bank’s strategic objectives. These are Enterprise Risk Themes and require an overarching and integrated management approach. These include:
| § | change: risk of failure in delivering change appropriately |
| § | cyber: any cyber attack that disrupts the ability of networks, infrastructures, or applications to perform their intended functions |
| § | resilience: characteristic of an organisation, whereby it is able to survive and prosper in its commercial endeavors regardless of the impact of adverse events, shocks and chronic or incremental changes. |
Roles and responsibilities
The prime responsibility for the management of operational risk and the compliance with control requirements rests with the business and functional units where the risk arises. The operational risk profile and control environment is reviewed by business management through specific meetings which cover governance, risk and control. Businesses are required to report their operational risks on both a regular and an event-driven basis. The reports include a profile of the material risks that may threaten the achievement of their objectives and the effectiveness of key controls, operational risk events and a review of scenarios.
The Group Head of Operational Risk is responsible for establishing, owning and maintaining an appropriate Group-wide Operational Risk Framework and for overseeing the portfolio of operational risk across the Group.
Operational risk management acts in a second line of defence capacity, and is responsible for implementation of the framework and monitoring operational risk events and risk exposures Key indicators (KIs) allow the Group to monitor its operational risk profile and alert management when risk levels exceed acceptable ranges or risk appetite levels and drive timely decision making and actions. Through attendance at business GRC meetings, operational risk management provides specific risk input into the issues highlighted and the overall risk profile of the business. Operational risk issues escalated from these meetings are considered through the second line of defence review meetings. Depending on their nature, the outputs of these meetings are presented to the BRC or the BAC.
Specific reports are prepared by businesses, Key Risk Officers and Group Operational Risk on a regular basis for BRC and BAC.
Operational risk framework
The Operational Risk Framework comprises a number of elements which allow the Group to manage and measure its operational risk profile and to calculate the amount of operational risk capital that the Group needs to hold to absorb potential losses. The minimum, mandatory requirements for each of these elements are set out in the Group Operational Risk Framework and supporting policies and standards. This framework is implemented across the Group with all businesses required to implement and operate an Operational Risk Framework that meets, as a minimum, the requirements detailed in the operational risk policies.
The Operational Risk Framework is a key component of the ERMF and has been designed to improve risk management and meet a number of external governance requirements including the Basel Capital Accord, the Capital Requirements Directive and Turnbull guidance as an evaluation framework for the purposes of Section 404(a) of the Sarbanes-Oxley Act. It also supports the Sarbanes-Oxley requirements.
The Operational Risk Framework includes the following elements:
Risk and control self-assessments
The Group identifies and assesses all material risks within each business and evaluates the key controls in place to mitigate those risks. Managers
in the businesses use self-assessment techniques to identify risks, evaluate the effectiveness of key controls in place and assess whether the risks are being effectively managed. The businesses are then able to make decisions on what action, if any, is required to reduce the level of risk to the Group. These risk assessments are monitored on a regular basis to ensure that each business continually understands the risks it faces.
Risk events
An operational risk event is any circumstance where, through the lack or failure of a control, the Group has actually, or could have, made a loss. The definition includes situations in which the Group could have made a loss, but in fact made a gain, as well as incidents resulting in reputational damage or regulatory impact only.
A standard threshold is used across the Group for reporting risk events and part of the analysis includes the identification of improvements to processes or controls, to reduce the recurrence and/or magnitude of risk events. For significant events, both financial and non-financial, this analysis includes the completion of a formal lessons learnt.
The Group also maintains a record of external risk events which are publicly available and is a member of the Operational Riskdata eXchange (ORX), a not-for-profit association of international banks formed to share anonymous loss data information. This external loss information is used to support and inform risk identification, assessment and measurement.
Operational risk appetite
The Group’s approach to determining its operational risk appetite combines both quantitative measures and qualitative judgement, in order to best reflect the nature of non-financial risks.
The monitoring and tracking of operational risk measures is supplemented with qualitative review and discussion at senior management executive committees on the actions being taken to improve controls and reduce risk to an acceptable level.
Operational risk appetite is aligned to the Group’s Risk Appetite Framework. The BRC considers, and recommends to the Board for approval, the Group’s risk appetite statement for operational risk based on performance in the current year and the projections for financial volatility the following year.
Key indicators
Key indicators (KIs) are metrics which allow the Group to monitor its operational risk profile. KIs include measurable thresholds that reflect the risk appetite of the business and are monitored to alert management when risk levels exceed acceptable ranges or risk appetite levels and drive timely decision making and actions.
Risk scenarios
Risk scenarios are a summary of the extreme potential risk exposure for each risk in each business and function, and include an assessment of the potential frequency of risk events, the average size of losses and three extreme scenarios. The risk scenario assessments are a key input to the Advanced Measurement Approach calculation of regulatory and economic capital requirements (see following section on operational risk measurement). The assessment considers analysis of internal and external loss experience, key risk indicators, risk and control self-assessments and other risk information. The businesses and functions analyse potential extreme scenarios, considering the:
| § | circumstances and contributing factors that could lead to an extreme event |
| § | potential financial and non-financial impacts (for example reputational damage) |
| § | controls that seek to limit the likelihood of such an event occurring, and the mitigating actions that would be taken if the event were to occur (for example crisis management procedures, business continuity or disaster recovery plans). |
Management may then conclude whether the potential risk is acceptable (within appetite) or whether changes in risk management control or business strategy are required.
The risk scenarios are regularly re-assessed, taking into account trends in risk factors such as mis-selling, conduct and financial crime risks.
| 394 | Barclays PLC and Barclays Bank PLC 2016 Annual Report on Form 20-F |
Barclays’ approach to managing risks
Management of operational risk
Reporting
The ongoing monitoring and reporting of operational risk is a key component of the Operational Risk Framework. Reports are used by the operational risk function and by business management to understand, monitor, manage and control operational risks and losses.
The operational risk profile is reviewed by senior management at the Businesses GRC meetings as well as Operational Risk Review Forum and BRC, BAC and the Board.
Operational risk measurement
The Group assesses its operational risk capital requirements using an Advanced Measurement Approach. The approach involves estimating the potential range of losses that could be incurred in a year from operational risk events, using statistical distributions. Regulatory capital requirements are set to cover 99.9% of the estimated losses. The Group also assesses its economic capital requirements to cover 99.98% of the estimated losses that exceed the typical losses (diversified across all risk classes).
The potential frequency and severity of losses is estimated for each Key Risk (within the Operational Risk and Conduct risk categories) across the Group’s businesses and functions. The potential range of individual loss severities is represented by a statistical distribution, estimated from the average loss size and three extreme scenarios (from Risk Assessments), as well as loss data from the Operational Riskdata eXchange (ORX).
The capital calculation also takes into account the possibility of dependences between operational risk losses occurring in a year (between businesses and functions and between risks).
In certain joint ventures and associates, the Group uses the Basic Indicator Approach to determine the capital requirements: some Africa Retail Banking, including Barclays Bank Mozambique and National Bank of Commerce (Tanzania); the business activities acquired from Lehman Brothers; and the portfolios of assets purchased from Woolworths Financial Services in South Africa, Standard Life Bank, ING Direct, MBNA Corporate Cards, Upromise, RCI, Egg Cards, EdCon, Sallie Mae, Ameriprice, Hawaiian Airlines, JetBlue and US Airways.
| Barclays PLC and Barclays Bank PLC 2016 Annual Report on Form 20-F | 395 |
Barclays’ approach to managing risks
Management of model risk
The sources of model risks, and how those risks are managed, are detailed in this section.
§ The types of risks that are classified as model risks are described on page 397.
§ Governance, management and measurement techniques are covered on page 397.
|

| 396 | Barclays PLC and Barclays Bank PLC 2016 Annual Report on Form 20-F |
Barclays’ approach to managing risks
Management of model risk
Model risk Model risk is the potential for adverse consequences arising from decisions based on incorrect or misused model outputs.
|
Overview
Barclays uses models to support a broad range of activities, including informing business decisions and strategies, measuring and limiting risk, valuing exposures, conducting stress testing, assessing capital adequacy, managing client assets, and meeting reporting requirements.
Because models are imperfect and incomplete representations of reality, they may be subject to errors affecting the accuracy of their output.
Model errors can result in inappropriate business decisions being made, financial loss, regulatory risk, reputational risk and/or inadequate capital reporting.
Models may also be misused, for instance applied to products that they were not intended for, or not adjusted, where fundamental changes to their environment would justify re-evaluating their core assumptions.
Errors and misuse are the primary sources of model risk.
Robust model risk management is crucial to ensuring that model risk is assessed and managed within a defined risk appetite. Strong model risk culture, appropriate technology environment, and adequate focus on understanding and resolving model limitations are crucial components.
Organisation and structure
Barclays allocates substantial resources to identify and record models and their usage, document and monitor the performance of models, validate models and ensure that model limitations are adequately addressed.
Barclays has a dedicated Model Risk Management (MRM) function that consists of two main units: the Independent Validation Unit (IVU), responsible for model validation and approval, and Model Governance and Controls (MGC), covering model risk governance, controls and reporting, including ownership of model risk policy.
The model risk policy prescribes group-wide, end to end requirements for the identification, measurement and management of model risk, covering model documentation, development, implementation, monitoring, annual review, independent validation and approval, change and reporting processes. The Policy is supported by global Standards covering model inventory, documentation, validation, complexity and materiality, testing and monitoring, overlays, as well as vendor models and CCAR benchmarking.
Barclays is continuously enhancing model risk management. MRM reports to the Group Chief Risk Officer and operates a global framework. Implementation of best practice standards is a central objective of the Group. Large new model development programmes are currently in motion to implement the model requirements of UK structural reform, CCAR, FRTB and IFRS9.
Organisation and structure

Roles and responsibilities
The key model risk management activities include:
| § | ensuring that models are correctly identified across all relevant areas of the firm, and recorded in the Group Models Database (GMD), the Group-wide model inventory. The heads of the relevant areas (typically, the Business Chief Risk Officers, Business Chief Executive Officers, the Treasurer, the Chief Financial Officer etc) annually attest to the completeness and accuracy of the model inventory. MGC undertakes regular conformance reviews on the model inventory. These activities are detailed in the Model Inventory, Workflow and Taxonomy Standard |
| § | ensuring that every model has a model owner who is accountable for the model. The model owner must sign off models prior to submission to IVU for validation. The model owner works with the relevant technical teams (model developers, implementation, monitoring, data services, regulatory) to ensure that the model presented to IVU is and remains fit for purpose, in accordance with the Model Documentation Standard, and the Model Testing, Monitoring and Annual Review Standard |
| § | ensuring that every model is subject to validation and approval by IVU, prior to being implemented and on a continual basis, in accordance with the Model Validation and Approval Standard. The level of review and challenge applied by IVU is tailored to the materiality and complexity of each model. Validation includes a review of the model assumptions, conceptual soundness, data, design, performance testing, compliance with external requirements if applicable, as well as any limitations, proposed remediation and overlays with supporting rationale. Material model changes are subject to prioritised validation and approval |
| § | specific Standards cover model risk management activities relating to CCAR benchmarking and challenger modelling, model overlays, vendor models, and model complexity and materiality. |
| Barclays PLC and Barclays Bank PLC 2016 Annual Report on Form 20-F | 397 |
Barclays’ approach to managing risks
Management of conduct risk
This section provides an analysis of the management of conduct risk.
§ Conduct risk is the risk that detriment is caused to our customers, clients, counterparties or the Group and its employees because of inappropriate judgement in the execution of our business activities (see page 399).
|
| 398 | Barclays PLC and Barclays Bank PLC 2016 Annual Report on Form 20-F |
Barclays’ approach to managing risks
Management of conduct risk
Conduct risk
The risk of detriment to customers, clients, market integrity, competition or Barclays from the inappropriate supply of financial services, including instances of wilful or negligent misconduct.
|
Overview
The Group defines, manages and mitigates conduct risk with the goals of providing positive customer and client outcomes and protecting market integrity. This includes taking reasonable steps to ensure our culture and strategy are appropriately aligned to these goals; our products and services are reasonably designed and delivered to meet the needs of our customers and clients as well as promoting the fair and orderly operation of the markets in which we do business.
As part of the Enterprise Risk Management Framework (ERMF) refresh (page 344), Reputation risk has been designated as a Principal Risk and Financial Crime has been designated as a Risk Category under Conduct Risk.
Organisation and structure
The Group Risk Committee (GRC) is the most senior Executive body responsible for reviewing and monitoring the effectiveness of Barclays’ management of conduct risk.

Roles and responsibilities
The Conduct PRF comprises a number of elements that allow the Group to manage and measure its conduct risk profile.
The PRF is implemented vertically across the Group through an organisational structure that requires all businesses to implement and operate their own conduct risk frameworks that meet the requirements within the ERMF.
The primary responsibility for managing conduct risk and compliance with control requirements sits with the business where the risk arises. The Conduct Risk Accountable Executive for each business is responsible for ensuring the implementation of, and adherence to the PRF.
The Conduct Risk Lead is responsible for owning and maintaining an appropriate Group-wide Conduct Risk PRF and for overseeing Group-wide conduct risk management.
Businesses are required to report their conduct risks on both a quarterly and an event-driven basis. The quarterly reports detail conduct risks inherent within the business strategy and include forward looking horizon scanning analysis as well as backward looking evidence-based indicators from both internal and external sources.
| Barclays PLC and Barclays Bank PLC 2016 Annual Report on Form 20-F | 399 |
Barclays’ approach to managing risks
Management of reputation risk
This section provides an analysis of the management of reputation risk.
| § | Reputation risk is the risk of damage to the Barclays brand arising from association, action or inaction which is perceived by stakeholders to be inappropriate or unethical (see page 401). |

| 400 | Barclays PLC and Barclays Bank PLC 2016 Annual Report on Form 20-F |
Barclays’ approach to managing risks
Management of reputation risk
Reputation risk
The risk that an action, transaction, investment or event will reduce trust in the firm’s integrity and competence by clients, counterparties, investors, regulators, employees or the public.
|
Overview
A reduction of trust in Barclays’ integrity and competence may reduce the attractiveness of Barclays to stakeholders and could lead to negative publicity, loss of revenue, regulatory or legislative action, loss of existing and potential client business, reduced workforce morale and difficulties in recruiting talent. Ultimately it may destroy shareholder value.
With effect from 2017, Reputation Risk has been re-designated as a Principal Risk within the Enterprise Risk Management Framework.
Organisation and structure
The Group Risk Committee (GRC) is the most senior Executive body responsible for reviewing and monitoring the effectiveness of Barclays’ management of Reputation Risk.

Roles and responsibilities
The Chief Compliance Officer is accountable for ensuring that a Reputation Principal Risk Framework and policies are developed and that they are subject to limits, monitored, reported on and escalated, as required.
Reputation risk it is by nature pervasive and can be difficult to quantify, requiring more subjective judgment than many other risks. The Reputation Principal Risk Framework sets out what is required to ensure reputation risk is managed effectively and consistently across the bank.
The primary responsibility for identifying and managing reputation risk and adherence to the control requirements sits with the business and support functions where the risk arises.
Each business is required to operate within established reputation risk appetite and to submit quarterly reports to the Group Reputation Management team, highlighting their most significant current and potential reputation risks and issues and how they are being managed. These reports are a key internal source of information for the quarterly reputation risk reports which are prepared for the Group Risk Committee and the Board Reputation Committee.
| Barclays PLC and Barclays Bank PLC 2016 Annual Report on Form 20-F | 401 |
Barclays’ approach to managing risks
Management of legal risk
This section provides an analysis of the management of legal risk.
§ Legal risk is the risk of loss or imposition of penalties, damages or fines from the failure of the firm to meet its legal obligations including regulatory or contractual requirements (see page 403)
|

| 402 | Barclays PLC and Barclays Bank PLC 2016 Annual Report on Form 20-F |
Barclays’ approach to managing risks
Management of legal risk
Legal risk
The risk of loss or imposition of penalties, damages or fines from the failure of the firm to meet its legal obligations including regulatory or contractual requirements.
|
Overview
With effect from 2017, legal risk, which was previously a Key Risk under operational risk, has been re-designated as a Principal Risk within the Enterprise Risk Management Framework.
The Legal Risk Framework prescribes group-wide requirements for the identification, measurement and management of legal risk, covering assessment, risk appetite, key indicators and governance. The Group General Counsel (GCC) is the Legal Principal Risk Officer and owns the Legal Risk Framework and the associated legal policies.
Legal risk is defined by the five respective Legal Policies:
| § | Contractual arrangements – failure to have enforceable contracts in place or for contracts to be enforceable as intended |
| § | Litigation management – failure to adequately manage litigation involving Barclays as either claimant or defendant |
| § | Intellectual property (IP) – failure to protect the Group’s IP assets or Barclays infringing IP rights of third parties |
| § | Competition/antitrust law – failure to follow competition/antitrust law or failure to manage relationships with competition and antitrust authorities |
| § | Use of law firms – failure to control instruction of an external law firm. |
Group-wide and Business/Function specific Standards may be put in place to support the implementation of the legal policies. The standards are aligned to one of the policies and are implemented by Businesses/ Functions.
Organisation and structure
The Group Risk Committee (GRC) is the most senior executive body responsible for reviewing and monitoring the effectiveness of Barclays’ management of legal risk. Escalation paths from this forum exist to the Board of Barclays Plc.

Roles and responsibilities
The Legal Risk Framework sets out what is required to ensure legal risk is managed effectively and consistently across the bank.
The primary responsibility for managing legal risk and adherence to the control requirements sits with the business where the risk arises.
On behalf of the businesses, the aligned General Counsel or Legal Senior Management, will undertake legal risk appetite assessments and provide advice and guidance on legal risk management. The legal risk assessment includes both quantitative and qualitative criteria including:
| § | Knowledge of legal risk material control issues or weaknesses |
| § | Emerging risks resulting from upcoming changes in the control environment, systems, or internal organisational structures |
| § | Potential implications on Barclays of forthcoming changes in the external legal and regulatory environment and/or prevailing decisions from courts and enforcing authorities as they relate to defined legal risks. |
| § | The Legal Principal Risk Officer is responsible for owning and maintaining an appropriate Legal Risk Framework and for overseeing Group-wide legal risk management. |
| Barclays PLC and Barclays Bank PLC 2016 Annual Report on Form 20-F | 403 |
Additional information
Additional financial disclosure (unaudited)
Deposits and short-term borrowings
Deposits
Deposits include deposits from banks and customer accounts.
Average for the year ended 31 Decembera | | 2016 £m |
| | 2015 £m |
| | 2014 £m |
| |||
| Deposits from banks | ||||||||||||
| UK | 5,552 | 7,402 | 6,002 | |||||||||
| Europe | 38,180 | 40,389 | 41,101 | |||||||||
| Americas | 6,633 | 7,439 | 6,191 | |||||||||
| Asia | 6,611 | 6,744 | 6,524 | |||||||||
| Africa | 2,705 | 3,710 | 3,735 | |||||||||
| Total deposits from banks | 59,681 | 65,684 | 63,553 | |||||||||
| Customer Accounts | ||||||||||||
| UK | 301,730 | 283,482 | 274,468 | |||||||||
| Europe | 41,718 | 44,474 | 55,121 | |||||||||
| Americas | 76,909 | 70,924 | 65,433 | |||||||||
| Asia | 7,914 | 10,279 | 13,444 | |||||||||
| Africa | 12,258 | 39,159 | 43,101 | |||||||||
| Customer Accounts | 440,529 | 448,318 | 451,567 |
Deposits from banks in offices in the United Kingdom received from non-residents amounted to £36,976m (2015: £31,976m). The balances below are on a spot basis as at 31 December 2016, rather than the average basis per the tables included above.
Year ended 31 December | | 2016 £m | | | 2015 £m | | | 2014 £m | | |||
Customer Accounts | 423,178 | 418,242 | 427,704 | |||||||||
In offices in the United Kingdom: | ||||||||||||
Current and Demand Accounts | ||||||||||||
- interest free | 85,296 | 73,987 | 68,647 | |||||||||
Current and Demand Accounts | ||||||||||||
- interest bearing | 37,200 | 33,467 | 34,047 | |||||||||
Savings accounts | 123,833 | 119,838 | 114,828 | |||||||||
Other time deposits- retail | 14,526 | 13,903 | 12,100 | |||||||||
Other time deposits- wholesale | 84,805 | 70,399 | 72,150 | |||||||||
Total repayable in offices in the United Kingdom | 345,660 | 311,594 | 301,772 | |||||||||
In offices outside the United Kingdom: | ||||||||||||
Current and Demand Accounts | ||||||||||||
- interest free | 9,722 | 12,777 | 17,236 | |||||||||
Current and Demand Accounts | ||||||||||||
- interest bearing | 5,986 | 26,891 | 23,127 | |||||||||
Savings accounts | 9,511 | 15,729 | 16,335 | |||||||||
Other time deposits | 52,299 | 51,251 | 69,234 | |||||||||
Total repayable in offices outside the United Kingdom | 77,518 | 106,648 | 125,932 |
Customer accounts deposits in offices in the United Kingdom received from non-residents amounted to £51,161m (2015: £41,924mb).
Note
| a | Calculated based on month-end balances. The average balance differs to the average balance sheets as the latter excludes non-interest bearing settlement balances. |
| b | Amounts for 2015 have been revised by £5,205m to better reflect amounts due from non-residents. |
| 404 | Barclays PLC and Barclays Bank PLC 2016 Annual Report on Form 20-F |
Additional information
Additional financial disclosure (unaudited)
Short-term borrowings
Short-term borrowings include deposits from banks, commercial paper, negotiable certificates of deposit and repurchase agreements.
Deposits from banks
Deposits from banks are taken from a wide range of counterparties and generally have maturities of less than one year.
|
| |||||||||||
| | 2016 £m |
| | 2015 £m |
| | 2014 £m |
| ||||
Year-end balance | 48,214 | 47,080 | 58,390 | |||||||||
Average balancea, b | 59,681 | 65,684 | 63,553 | |||||||||
Maximum balancea | 66,404 | 84,270 | 72,810 | |||||||||
Average interest rate during year | 0.4% | 0.3% | 0.3% | |||||||||
Year-end interest rate | 0.4% | 0.2% | 0.4% | |||||||||
Notes
| a | Calculated based on month-end balances. |
| b | The average balance differs to the average balance sheet as the latter excludes non-interest bearing settlement balances. |
Commercial paper
Commercial paper is issued by the Group, mainly in the United States, generally in denominations of not less than $100,000, with maturities of up to 270 days.
| | 2016 £m | | | 2015 £m |
| | 2014 £m |
| ||||
Year-end balance | 8,132 | 6,689 | 7,125 | |||||||||
Average balancea | 7,711 | 9,192 | 11,797 | |||||||||
Maximum balancea | 8,471 | 13,407 | 16,891 | |||||||||
Average interest rate during year | 0.8% | 0.3% | 0.3% | |||||||||
Year-end interest rate | 1.0% | 0.3% | 0.2% |
Note
| a | Calculated based on month-end balances. |
Negotiable certificates of deposit
Negotiable certificates of deposits are issued mainly in the United Kingdom and United States, generally in denominations of not less than $100,000.
| | 2016 £m | | | 2015 £m | | | 2014 £m | | ||||
Year-end balance | 20,373 | 14,312 | 23,928 | |||||||||
Average balancea | 15,540 | 22,298 | 23,947 | |||||||||
Maximum balancea | 20,373 | 29,216 | 29,100 | |||||||||
Average interest rate during year | 0.4% | 1.0% | 0.9% | |||||||||
Year-end interest rate | 0.5% | 1.0% | 0.9% |
Note
| a | Calculated based on month-end balances. |
| Barclays PLC and Barclays Bank PLC 2016 Annual Report on Form 20-F | 405 |
Additional information
Additional financial disclosure (unaudited)
Repurchase Agreements
Repurchase agreements are entered into with both customers and banks and generally have maturities of not more than three months.
|
2016 |
|
|
2015 |
|
|
2014 |
| ||||
|
| £m
|
|
| £m
|
|
| £m
|
| ||||
Year-end balanced | 19,760 | 25,035 | 124,479 | |||||||||
Average balancea, b, c, d | 24,966 | 114,933 | 191,181 | |||||||||
Maximum balancea, d | 28,057 | 167,343 | 218,523 | |||||||||
Average interest rate during year | 0.8% | 0.3% | 0.2% | |||||||||
Year-end interest rate |
| 0.7%
|
|
| 0.3%
|
|
| 0.2%
|
| |||
Notes
| a | Calculated based on month-end balances. |
| b | The average balance differs to the average balance sheet as the latter excludes non-interest bearing settlement balances. |
| c | The average balance differs to the average balance sheet as the latter is stated on a gross basis prior to any offsetting of liabilities against assets. |
| d | During 2015, reverse repurchase and repurchase agreements including other similar lending and borrowing in certain businesses have been designated at fair value following a change in accounting treatment to better align to the way the business manages the portfolio’s risk and performance. |
Commitments and contractual obligations
Commercial commitments include guarantees, contingent liabilities and standby facilities.
Commercial commitments
|
| Amount of commitment expiration per period
|
| |||||||||||||||||
|
| Less than
one year
|
|
|
Between
one to three
years
|
|
|
Between
three to five
years
|
|
| After five
years
|
|
|
Total
amounts
committed
|
| ||||||
| £m | £m | £m | £m | £m | ||||||||||||||||
As at 31 December 2016 | ||||||||||||||||||||
Guarantees and letters of credit pledged as collateral security | 14,498 | 403 | 25 | 377 | 15,304 | |||||||||||||||
Performance guarantees, acceptances and endorsements | 4,400 | 140 | 64 | 32 | 4,636 | |||||||||||||||
Documentary credits and other short-term trade related transactions | 1,005 | - | - | - | 1,005 | |||||||||||||||
Forward starting reverse repurchase agreements | 24 | - | - | - | 24 | |||||||||||||||
Standby facilities, credit lines and other commitments | 302,335 | 102 | 150 | 70 | 302,657 | |||||||||||||||
As at 31 December 2015 | ||||||||||||||||||||
Guarantees and letters of credit pledged as collateral security | 15,227 | 499 | 47 | 292 | 16,065 | |||||||||||||||
Performance guarantees, acceptances and endorsements | 4,350 | 83 | 114 | 10 | 4,557 | |||||||||||||||
Documentary credits and other short-term trade related transactions | 718 | 119 | 8 | - | 845 | |||||||||||||||
Forward starting reverse repurchase agreements | 93 | - | - | - | 93 | |||||||||||||||
Standby facilities, credit lines and other commitments | 278,923 | 1,426 | 906 | 114 | 281,369 | |||||||||||||||
Note
Commercial commitments for 2016 exclude BAGL balances now held for sale but are included for 2015
| 406 | Barclays PLC and Barclays Bank PLC 2016 Annual Report on Form 20-F |
Additional information
Additional financial disclosure (unaudited)
Contractual obligations include debt securities, operating lease and purchase obligations.
Contractual obligations | Payments due by period | |||||||||||||||||||
|
| Less than
one year |
|
| Between
one to
three years |
|
| Between
three to
five years |
|
| After five
years |
| Total | ||||||||
| £m | £m | £m | £m | £m | ||||||||||||||||
As at 31 December 2016 | ||||||||||||||||||||
Long-term debta | 46,528 | 20,005 | 19,829 | 31,044 | 117,406 | |||||||||||||||
Operating lease obligations | 364 | 547 | 450 | 1,520 | 2,881 | |||||||||||||||
Purchase obligations | 342 | 206 | 122 | 127 | 797 | |||||||||||||||
Total | 47,234 | 20,758 | 20,401 | 32,691 | 121,084 | |||||||||||||||
As at 31 December 2015 | ||||||||||||||||||||
Long-term debta | 30,525 | 23,101 | 17,773 | 31,978 | 103,377 | |||||||||||||||
Operating lease obligations | 377 | 603 | 535 | 1,874 | 3,389 | |||||||||||||||
Purchase obligations | 485 | 434 | 262 | 276 | 1,457 | |||||||||||||||
Total | 31,387 | 24,138 | 18,570 | 34,128 | 108,223 | |||||||||||||||
Notes
| a | Long-term debt has been prepared to reflect cash flows on an undiscounted basis, which includes interest payments. |
Net cash flows from derivatives used to hedge long-term debt amount to £3.5bn (2015: £5.5bn).
Further information on the contractual maturity of the Group’s assets and liabilities is given in the Funding section of the Risk Review.
| Barclays PLC and Barclays Bank PLC 2016 Annual Report on Form 20-F | 407 |
Additional information
Additional financial disclosure (unaudited)
Securities
Securities at fair value
|
| 2016
|
|
| 2015
|
|
| 2014
|
| |||
As at 31 December
|
| £m
|
|
| £m
|
|
| £m
|
| |||
Investment securities – Financial Investments
| ||||||||||||
United Kingdom government
|
| 15,351
|
|
| 17,947
|
|
| 18,849
|
| |||
Other government
|
| 28,750
|
|
| 49,427
|
|
| 41,700
|
| |||
Other public bodies and US Agencies
|
| 1,635
|
|
| 5,462
|
|
| 6,034
|
| |||
Mortgage and asset backed securities
|
| 804
|
|
| 1,082
|
|
| 1,230
|
| |||
Bank and building society certificates of deposit
|
| –
|
|
| –
|
|
| 38
|
| |||
Corporate and other issuers
|
| 16,339
|
|
| 15,360
|
|
| 17,688
|
| |||
Debt securities
|
| 62,879
|
|
| 89,278
|
|
| 85,539
|
| |||
Equity securities
|
| 438
|
|
| 989
|
|
| 527
|
| |||
Investment securities – Financial Investments
|
| 63,317
|
|
| 90,267
|
|
| 86,066
|
| |||
Other securities – held for trading
| ||||||||||||
United Kingdom government
|
| 4,793
|
|
| 4,020
|
|
| 7,450
|
| |||
Other government
|
| 15,134
|
|
| 19,503
|
|
| 29,720
|
| |||
Other public bodies and US Agencies
|
| 5,396
|
|
| 8,683
|
|
| 9,879
|
| |||
Mortgage and asset backed securities
|
| 1,568
|
|
| 2,927
|
|
| 7,165
|
| |||
Bank and building society certificates of deposit
|
| 23
|
|
| 559
|
|
| 240
|
| |||
Corporate and other issuers
|
| 11,875
|
|
| 9,884
|
|
| 11,544
|
| |||
Debt securities
|
| 38,789
|
|
| 45,576
|
|
| 65,998
|
| |||
Equity securities
|
| 38,329
|
|
| 29,055
|
|
| 44,576
|
| |||
Other securities – held for trading
|
| 77,118
|
|
| 74,631
|
|
| 110,574
|
|
Investment debt securities include government securities held as part of the Group’s treasury management portfolio for asset and liability, liquidity and regulatory purposes and are for use on a continuing basis in the activities of the Group. In addition, the Group holds as investments listed and unlisted corporate securities.
Maturities and yield of Financial Investments
|
| |||||||||||||||||||||||||||||||||||||||
As at 31 December 2016 |
| Maturing with one
year |
|
| Maturing one but
within five years |
|
| Maturing after five
but within ten
years |
|
| Maturing after ten
years |
| Total | |||||||||||||||||||||||||||
| Amount | Yield | Amount | Yield | Amount | Yield | Amount | Yield | Amount | Yield | |||||||||||||||||||||||||||||||
|
| £m
|
|
| %
|
|
| £m
|
|
| %
|
|
| £m
|
|
| %
|
|
| £m
|
|
| %
|
|
| £m
|
|
| %
|
| |||||||||||
Government
|
| 3,014
|
|
| 1.4%
|
|
| 22,635
|
|
| 1.4%
|
|
| 10,153
|
|
| 1.3%
|
|
| 8,300
|
|
| 2.8%
|
|
| 44,102
|
|
| 1.6%
|
| ||||||||||
Other public bodies and US Agencies
|
| 157
|
|
| 1.3%
|
|
| 1,469
|
|
| 0.9%
|
|
| -
|
|
| 0.0%
|
|
| -
|
|
| 0.0%
|
|
| 1,626
|
|
| 0.9%
|
| ||||||||||
Other issuers
|
| 4,249
|
|
| 1.0%
|
|
| 10,024
|
|
| 2.0%
|
|
| 2,585
|
|
| 2.0%
|
|
| 293
|
|
| 2.0%
|
|
| 17,151
|
|
| 1.7%
|
| ||||||||||
Total book value
|
| 7,420
|
|
| 1.2%
|
|
| 34,128
|
|
| 1.5%
|
|
| 12,738
|
|
| 1.5%
|
|
| 8,593
|
|
| 2.7%
|
|
| 62,879
|
|
| 1.6%
|
| ||||||||||
The yield for each range of maturities is calculated by dividing the annualised interest income prevailing at 31 December 2016 by the fair value of securities held at that date.
| 408 | Barclays PLC and Barclays Bank PLC 2016 Annual Report on Form 20-F |
Additional information
Additional financial disclosure (unaudited)
Average balance sheet
Average balances are based upon monthly averages.
Assets
|
|
2016
|
| |||||||||||||||||||||
|
| Average
balance
|
|
| Interest
presented
within net
interest
income
|
|
| Interest
presented
elsewhere |
|
| Total interest
|
|
| Rate
|
| ||||||||||
|
£m
|
|
|
£m
|
|
|
£m
|
|
|
£m
|
|
|
%
|
| ||||||||||
Loans and advances to banks | UK | 55,902 | 588 | 3 | 591 | 1.1 | ||||||||||||||||||
Loans and advances to banks | Non-UK | 65,549 | 197 | - | 197 | 0.3 | ||||||||||||||||||
Loans and advances to banksa | Total | 121,451 | 785 | 3 | 788 | 0.6 | ||||||||||||||||||
Loans and advances to customers | UK | 290,751 | 9,665 | 136 | 9,801 | 3.4 | ||||||||||||||||||
Loans and advances to customers | Non-UK | 92,044 | 3,293 | 89 | 3,382 | 3.7 | ||||||||||||||||||
Loans and advances to customersa | Total | 382,795 | 12,958 | 225 | 13,183 | 3.4 | ||||||||||||||||||
Financial investments | UK | 71,697 | 520 | 43 | 563 | 0.8 | ||||||||||||||||||
Financial investments | Non-UK | 7,661 | 220 | - | 220 | 2.9 | ||||||||||||||||||
Financial investments | Total | 79,358 | 740 | 43 | 783 | 1.0 | ||||||||||||||||||
Reverse repurchase agreements | UK | 5,949 | (7) | 71 | 64 | 1.1 | ||||||||||||||||||
Reverse repurchase agreements | Non-UK | 14,752 | 34 | 287 | 321 | 2.2 | ||||||||||||||||||
Reverse repurchase agreementsb | Total | 20,701 | 27 | 358 | 385 | 1.9 | ||||||||||||||||||
Other interest incomec | 31 | - | 31 | - | ||||||||||||||||||||
Total interest earning assets not at fair value through P&L | 604,305 | 14,541 | 629 | 15,170 | 2.5 | |||||||||||||||||||
Less interest expense | (4,004) | (214) | (4,218) | - | ||||||||||||||||||||
Net interest | 604,305 | 10,537 | 415 | 10,952 | 1.8 | |||||||||||||||||||
Interest earning assets at fair value through P&L | UK | 65,449 | ||||||||||||||||||||||
Interest earning assets at fair value through P&L | Non-UK | 78,470 | ||||||||||||||||||||||
Interest earning assets at fair value through P&L | Total | 143,919 | ||||||||||||||||||||||
Total interest earning assets | 748,224 | |||||||||||||||||||||||
Impairments | (4,669) | |||||||||||||||||||||||
Non-interest earning assets | 550,299 | |||||||||||||||||||||||
Total | 1,293,854 | |||||||||||||||||||||||
Percentage of total average interest earning assets in offices outside the UK | 35% | |||||||||||||||||||||||
Notes
| a | Loans and advances to banks and customers include all doubtful lendings, includingnon-accrual lendings. Interest receivable on such lendings has been included to the extent to which either cash payments have been received or interest has been accrued in accordance with the income recognition policy of the Group. |
| b | Average balances for reverse repurchase agreements and cash collateral on securities borrowed have been stated on a gross basis prior to any offsetting to provide a more meaningful comparison to the related interest income and expense. The Group balance sheet offsets financial assets and liabilities where there is a legally enforceable right to set off the recognised amounts and there is an intention to settle on a net basis or to realise an asset and liability simultaneously. Reverse repurchase and repurchase agreements including other similar lending and borrowing in certain businesses have been designated at fair value following a change in accounting treatment to better align to the way the business manages the portfolio’s risk and performance. |
| c | Other interest income principally includes interest income relating to hedging activity. |
| Barclays PLC and Barclays Bank PLC 2016 Annual Report on Form 20-F | 409 |
Additional information
Additional financial disclosure (unaudited)
Assets
|
|
2015
|
| |||||||||||||||||||||
|
| Average
balance
|
|
| Interest
presented
within net
interest
income
|
|
| Interest
presented
elsewhere
|
|
| Total interest
|
|
| Rate
|
| ||||||||||
|
£m
|
|
|
£m
|
|
|
£m
|
|
|
£m
|
|
| %
|
| ||||||||||
Loans and advances to banks | UK | 51,597 | 513 | 1 | 514 | 1.0 | ||||||||||||||||||
Loans and advances to banks | Non-UK | 48,521 | 131 | 60 | 191 | 0.4 | ||||||||||||||||||
Loans and advances to banksa | Total | 100,118 | 644 | 61 | 705 | 0.7 | ||||||||||||||||||
Loans and advances to customers | UK | 283,191 | 9,686 | 84 | 9,770 | 3.4 | ||||||||||||||||||
Loans and advances to customers | Non-UK | 120,252 | 2,825 | 3,420 | 6,245 | 5.2 | ||||||||||||||||||
Loans and advances to customersa | Total | 403,443 | 12,511 | 3,504 | 16,015 | 4.0 | ||||||||||||||||||
Financial investments | UK | 84,291 | 494 | - | 494 | 0.6 | ||||||||||||||||||
Financial investments | Non-UK | 9,436 | 204 | 144 | 348 | 3.7 | ||||||||||||||||||
Financial investments | Total | 93,727 | 698 | 144 | 842 | 0.9 | ||||||||||||||||||
Reverse repurchase agreements | UK | 86,322 | 18 | 187 | 205 | 0.2 | ||||||||||||||||||
Reverse repurchase agreements | Non-UK | 96,187 | (239) | 479 | 240 | 0.2 | ||||||||||||||||||
Reverse repurchase agreementsb | Total | 182,509 | (221) | 666 | 445 | 0.2 | ||||||||||||||||||
Other interest incomec | - | 321 | - | 321 | - | |||||||||||||||||||
Total interest earning assets not at fair value through P&L | 779,797 | 13,953 | 4,375 | 18,328 | 2.4 | |||||||||||||||||||
Less interest expense | - | (3,345) | (2,371) | (5,716) | - | |||||||||||||||||||
Net interest | 779,797 | 10,608 | 2,004 | 12,612 | 1.6 | |||||||||||||||||||
Interest earning assets at fair value through P&L | UK | 48,360 | ||||||||||||||||||||||
Interest earning assets at fair value through P&L | Non-UK | 81,031 | ||||||||||||||||||||||
Interest earning assets at fair value through P&L | Total | 129,391 | ||||||||||||||||||||||
Total interest earning assets | 909,188 | |||||||||||||||||||||||
Impairments | (5,273) | |||||||||||||||||||||||
Non-interest earning assets | 526,448 | |||||||||||||||||||||||
Total | 1,430,363 | |||||||||||||||||||||||
Percentage of total average interest earning assets in offices outside the UK | 39% | |||||||||||||||||||||||
Notes
| a | Loans and advances to banks and customers include all doubtful lendings, includingnon-accrual lendings. Interest receivable on such lendings has been included to the extent to which either cash payments have been received or interest has been accrued in accordance with the income recognition policy of the Group. |
| b | Average balances for reverse repurchase agreements and cash collateral on securities borrowed have been stated on a gross basis prior to any offsetting to provide a more meaningful comparison to the related interest income and expense. The Group balance sheet offsets financial assets and liabilities where there is a legally enforceable right to set off the recognised amounts and there is an intention to settle on a net basis or to realise an asset and liability simultaneously. |
| c | Other interest income principally includes interest income relating to hedging activity. |
| d. | Net Interest Income from discontinued operations is included within Interest presented elsewhere. |
| 410 | Barclays PLC and Barclays Bank PLC 2016 Annual Report on Form 20-F |
Additional information
Additional financial disclosure (unaudited)
Assets
|
|
2014
|
| |||||||||||||||||||||
|
| Average
balance
|
|
|
Interest
presented
within net
interest
income
|
|
| Interest
presented
elsewhere
|
|
| Total interest
|
|
| Rate
|
| ||||||||||
|
£m
|
|
|
£m
|
|
|
£m
|
|
|
£m
|
|
|
%
|
| ||||||||||
Loans and advances to banks | UK | 48,162 | 380 | - | 380 | 0.8 | ||||||||||||||||||
Loans and advances to banks | Non-UK | 47,375 | 185 | 77 | 262 | 0.6 | ||||||||||||||||||
Loans and advances to banksa | Total | 95,537 | 565 | 77 | 642 | 0.7 | ||||||||||||||||||
Loans and advances to customers | UK | 272,463 | 10,021 | 74 | 10,095 | 3.7 | ||||||||||||||||||
Loans and advances to customers | Non-UK | 137,122 | 2,744 | 3,338 | 6,082 | 4.4 | ||||||||||||||||||
Loans and advances to customersa | Total | 409,585 | 12,765 | 3,412 | 16,177 | 3.9 | ||||||||||||||||||
Financial investments | UK | 74,868 | 686 | - | 686 | 0.9 | ||||||||||||||||||
Financial investments | Non-UK | 11,130 | 117 | 175 | 292 | 2.6 | ||||||||||||||||||
Financial investments | Total | 85,998 | 803 | 175 | 978 | 1.1 | ||||||||||||||||||
Reverse repurchase agreements | UK | 155,170 | 31 | 589 | 620 | 0.4 | ||||||||||||||||||
Reverse repurchase agreements | Non-UK | 127,670 | (316) | 658 | 342 | 0.3 | ||||||||||||||||||
Reverse repurchase agreementsb | Total | 282,840 | (285) | 1,247 | 962 | 0.3 | ||||||||||||||||||
Other interest incomec | - | 346 | - | 346 | - | |||||||||||||||||||
Total interest earning assets not at fair value through P&L | 873,960 | 14,194 | 4,911 | 19,105 | 2.2 | |||||||||||||||||||
Less interest expense | - | (4,108) | (2,763) | (6,871) | - | |||||||||||||||||||
Net interest | 873,960 | 10,086 | 2,148 | 12,234 | 1.4 | |||||||||||||||||||
Interest earning assets at fair value through P&L | UK | 57,070 | ||||||||||||||||||||||
Interest earning assets at fair value through P&L | Non-UK | 56,477 | ||||||||||||||||||||||
Interest earning assets at fair value through P&L | Total | 113,547 | ||||||||||||||||||||||
Total interest earning assets | 987,507 | |||||||||||||||||||||||
Impairments | (6,770) | |||||||||||||||||||||||
Non-interest earning assets | 515,020 | |||||||||||||||||||||||
Total | 1,495,757 | |||||||||||||||||||||||
Percentage of total average interest earning assets in offices outside the UK | 38% | |||||||||||||||||||||||
Notes
| a | Loans and advances to banks and customers include all doubtful lendings, includingnon-accrual lendings. Interest receivable on such lendings has been included to the extent to which either cash payments have been received or interest has been accrued in accordance with the income recognition policy of the Group. |
| b | Average balances for reverse repurchase agreements and cash collateral on securities borrowed have been stated on a gross basis prior to any offsetting to provide a more meaningful comparison to the related interest income and expense. The Group balance sheet offsets financial assets and liabilities where there is a legally enforceable right to set off the recognised amounts and there is an intention to settle on a net basis or to realise an asset and liability simultaneously. |
| c | Other interest income principally includes interest income relating to hedging activity. |
| d. | Net Interest Income from discontinued operations is included within Interest presented elsewhere. |
| Barclays PLC and Barclays Bank PLC 2016 Annual Report on Form 20-F | 411 |
Additional information
Additional financial disclosure (unaudited)
Liabilities
|
| 2016
|
| |||||||||||||||||||||
|
| Average
balance
|
|
| Interest
presented
within net
interest
income
|
|
| Interest
presented
elsewhere
|
|
| Total interest
|
|
| Rate
|
| ||||||||||
|
£m
|
|
|
£m
|
|
|
£m
|
|
|
£m
|
|
|
%
|
| ||||||||||
Deposits by banks | UK | 44,890 | 145 | 2 | 147 | 0.3 | ||||||||||||||||||
Deposits by banks | Non-UK | 9,469 | 120 | - | 120 | 1.3 | ||||||||||||||||||
Deposits by banks | Total | 54,359 | 265 | 2 | 267 | 0.5 | ||||||||||||||||||
Customer accounts | UK | 251,738 | 400 | (84) | 316 | 0.1 | ||||||||||||||||||
Customer accounts | Non-UK | 62,127 | 1,113 | 74 | 1,187 | 1.9 | ||||||||||||||||||
Customer accounts | Total | 313,865 | 1,513 | (10) | 1,503 | 0.5 | ||||||||||||||||||
Debt securities in issue | UK | 39,956 | 757 | - | 757 | 1.9 | ||||||||||||||||||
Debt securities in issue | Non-UK | 25,712 | 232 | - | 232 | 0.9 | ||||||||||||||||||
Debt securities in issue | Total | 65,668 | 989 | - | 989 | 1.5 | ||||||||||||||||||
Subordinated liabilities | UK | 22,437 | 1,104 | - | 1,104 | 4.9 | ||||||||||||||||||
Subordinated liabilities | Non-UK | 228 | - | - | - | - | ||||||||||||||||||
Subordinated liabilities | Total | 22,665 | 1,104 | - | 1,104 | 4.9 | ||||||||||||||||||
Repurchase agreements | UK | 13,736 | 116 | 110 | 226 | 1.6 | ||||||||||||||||||
Repurchase agreements | Non-UK | 11,424 | 47 | 112 | 159 | 1.4 | ||||||||||||||||||
Repurchase agreementsa | Total | 25,160 | 163 | 222 | 385 | 1.5 | ||||||||||||||||||
Other interest expenseb | (30) | - | (30) | - | ||||||||||||||||||||
Total interest bearing liabilities not at fair value through P&L | 481,717 | 4,004 | 214 | 4,218 | 0.9 | |||||||||||||||||||
Interest bearing liabilities at fair value through P&L | UK | 78,036 | ||||||||||||||||||||||
Interest bearing liabilities at fair value through P&L | Non-UK | 69,976 | ||||||||||||||||||||||
Interest bearing liabilities at fair value through P&L | Total | 148,012 | ||||||||||||||||||||||
Total interest bearing liabilities | 629,729 | |||||||||||||||||||||||
Interest free customer deposits | UK | 78,788 | ||||||||||||||||||||||
Interest free customer deposits | Non-UK | 10,074 | ||||||||||||||||||||||
Interest free customer deposits | Total | 88,862 | ||||||||||||||||||||||
Othernon-interest bearing liabilities | 510,767 | |||||||||||||||||||||||
Shareholders’ equity | 64,496 | |||||||||||||||||||||||
Total | 1,293,854 | |||||||||||||||||||||||
Percentage of total average interest bearing liabilities in offices outside the UK | 28% | |||||||||||||||||||||||
Notes
| a | Average balances for repurchase agreements and cash collateral on securities lent have been stated on a gross basis prior to any offsetting to provide a more meaningful comparison to the related interest income and expense. The Group balance sheet offsets financial assets and liabilities where there is a legally enforceable right to set off the recognised amounts and there is an intention to settle on a net basis or to realise an asset and liability simultaneously. Reverse repurchase and repurchase agreements including other similar lending and borrowing in certain businesses have been designated at fair value following a change in accounting treatment to better align to the way the business manages the portfolio’s risk and performance. |
| b | Other interest expense principally includes interest expense relating to hedging activity. |
| c. | Net Interest Income from discontinued operations is included within Interest presented elsewhere. |
| 412 | Barclays PLC and Barclays Bank PLC 2016 Annual Report on Form 20-F |
Additional information
Additional financial disclosure (unaudited)
Liabilities
|
|
2015
|
| |||||||||||||||||||||
|
| Average
balance
|
|
|
Interest
presented
within net
interest
income
|
|
| Interest
presented
elsewhere
|
|
| Total interest
|
|
| Rate
|
| ||||||||||
|
£m
|
|
|
£m
|
|
|
£m
|
|
|
£m
|
|
|
%
|
| ||||||||||
Deposits by banks | UK | 46,577 | 72 | 8 | 80 | 0.2 | ||||||||||||||||||
Deposits by banks | Non-UK | 12,716 | 59 | 49 | 108 | 0.8 | ||||||||||||||||||
Deposits by banks | Total | 59,293 | 131 | 57 | 188 | 0.3 | ||||||||||||||||||
Customer accounts | UK | 237,723 | 2,185 | 28 | 2,213 | 0.9 | ||||||||||||||||||
Customer accounts | Non-UK | 84,304 | (781) | 1,401 | 620 | 0.7 | ||||||||||||||||||
Customer accounts | Total | 322,027 | 1,404 | 1,429 | 2,833 | 0.9 | ||||||||||||||||||
Debt securities in issue | UK | 45,625 | 346 | 58 | 404 | 0.9 | ||||||||||||||||||
Debt securities in issue | Non-UK | 35,507 | 205 | 431 | 636 | 1.8 | ||||||||||||||||||
Debt securities in issue | Total | 81,132 | 551 | 489 | 1,040 | 1.3 | ||||||||||||||||||
Subordinated liabilities | UK | 20,015 | 1,007 | - | 1,007 | 5.0 | ||||||||||||||||||
Subordinated liabilities | Non-UK | 818 | 8 | 72 | 80 | 9.8 | ||||||||||||||||||
Subordinated liabilities | Total | 20,833 | 1,015 | 72 | 1,087 | 5.2 | ||||||||||||||||||
Repurchase agreements | UK | 94,660 | - | 232 | 232 | 0.2 | ||||||||||||||||||
Repurchase agreements | Non-UK | 93,438 | 52 | 231 | 283 | 0.3 | ||||||||||||||||||
Repurchase agreementsa | Total | 188,098 | 52 | 463 | 515 | 0.3 | ||||||||||||||||||
Other interest expenseb | - | 192 | (139) | 53 | - | |||||||||||||||||||
Total interest bearing liabilities not at fair value through P&L | 671,383 | 3,345 | 2,371 | 5,716 | 0.9 | |||||||||||||||||||
Interest bearing liabilities at fair value through P&L | UK | 51,164 | ||||||||||||||||||||||
Interest bearing liabilities at fair value through P&L | Non-UK | 63,779 | ||||||||||||||||||||||
Interest bearing liabilities at fair value through P&L | Total | 114,943 | ||||||||||||||||||||||
Total interest bearing liabilities | 786,326 | |||||||||||||||||||||||
Interest free customer deposits | UK | 71,763 | ||||||||||||||||||||||
Interest free customer deposits | Non-UK | 14,182 | ||||||||||||||||||||||
Interest free customer deposits | Total | 85,945 | ||||||||||||||||||||||
Othernon-interest bearing liabilities | 490,992 | |||||||||||||||||||||||
Shareholders’ equity | 67,100 | |||||||||||||||||||||||
Total | 1,430,363 | |||||||||||||||||||||||
Percentage of total average interest bearing liabilities in offices outside the UK | 37% | |||||||||||||||||||||||
Notes
| a | Average balances for repurchase agreements and cash collateral on securities lent have been stated on a gross basis prior to any offsetting to provide a more meaningful comparison to the related interest income and expense. The Group balance sheet offsets financial assets and liabilities where there is a legally enforceable right to set off the recognised amounts and there is an intention to settle on a net basis or to realise an asset and liability simultaneously. |
| b | Other interest expense principally includes interest expense relating to hedging activity. |
| c. | Net Interest Income from discontinued operations is included within Interest presented elsewhere. |
| Barclays PLC and Barclays Bank PLC 2016 Annual Report on Form 20-F | 413 |
Additional information
Additional financial disclosure (unaudited)
Liabilities
|
| 2014
|
| |||||||||||||||||||||
|
| Average
balance
|
|
| Interest
presented
within net
interest
income
|
|
| Interest
presented
elsewhere
|
|
| Total interest
|
|
| Rate
|
| ||||||||||
|
£m
|
|
|
£m
|
|
|
£m
|
|
|
£m
|
|
|
%
|
| ||||||||||
Deposits by banks | UK | 41,931 | 89 | - | 89 | 0.2 | ||||||||||||||||||
Deposits by banks | Non-UK | 15,388 | 44 | 70 | 114 | 0.7 | ||||||||||||||||||
Deposits by banks | Total | 57,319 | 133 | 70 | 203 | 0.4 | ||||||||||||||||||
Customer accounts | UK | 231,792 | 2,761 | 6 | 2,767 | 1.2 | ||||||||||||||||||
Customer accounts | Non-UK | 92,337 | (557) | 1,516 | 959 | 1.0 | ||||||||||||||||||
Customer accounts | Total | 324,129 | 2,204 | 1,522 | 3,726 | 1.1 | ||||||||||||||||||
Debt securities in issue | UK | 51,218 | 456 | 82 | 538 | 1.1 | ||||||||||||||||||
Debt securities in issue | Non-UK | 38,515 | 236 | 425 | 661 | 1.7 | ||||||||||||||||||
Debt securities in issue | Total | 89,733 | 692 | 507 | 1,199 | 1.3 | ||||||||||||||||||
Subordinated liabilities | UK | 19,575 | 989 | - | 989 | 5.1 | ||||||||||||||||||
Subordinated liabilities | Non-UK | 1,151 | 17 | 64 | 81 | 7.0 | ||||||||||||||||||
Subordinated liabilities | Total | 20,726 | 1,006 | 64 | 1,070 | 5.2 | ||||||||||||||||||
Repurchase agreements | UK | 166,224 | 64 | 376 | 440 | 0.3 | ||||||||||||||||||
Repurchase agreements | Non-UK | 126,347 | 9 | 230 | 239 | 0.2 | ||||||||||||||||||
Repurchase agreementsa | Total | 292,571 | 73 | 606 | 679 | 0.2 | ||||||||||||||||||
Other interest expenseb | - | (6) | (6) | - | ||||||||||||||||||||
Total interest bearing liabilities not at fair value through P&L | 784,478 | 4,108 | 2,763 | 6,871 | 0.9 | |||||||||||||||||||
Interest bearing liabilities at fair value through P&L | UK | 37,722 | ||||||||||||||||||||||
Interest bearing liabilities at fair value through P&L | Non-UK | 28,755 | ||||||||||||||||||||||
Interest bearing liabilities at fair value through P&L | Total | 66,477 | ||||||||||||||||||||||
Total interest bearing liabilities | 850,955 | |||||||||||||||||||||||
Interest free customer deposits | UK | 65,294 | ||||||||||||||||||||||
Interest free customer deposits | Non-UK | 15,033 | ||||||||||||||||||||||
Interest free customer deposits | Total | 80,327 | ||||||||||||||||||||||
Othernon-interest bearing liabilities | 498,675 | |||||||||||||||||||||||
Shareholders’ equity | 65,800 | |||||||||||||||||||||||
Total | 1,495,757 | |||||||||||||||||||||||
Percentage of total average interest bearing liabilities in offices outside the UK | 36% | |||||||||||||||||||||||
Notes
| a | Average balances for repurchase agreements and cash collateral on securities lent have been stated on a gross basis prior to any offsetting to provide a more meaningful comparison to the related interest income and expense. The Group balance sheet offsets financial assets and liabilities where there is a legally enforceable right to set off the recognised amounts and there is an intention to settle on a net basis or to realise an asset and liability simultaneously. |
| b | Other interest expense principally includes interest expense relating to hedging activity. |
| c. | Net Interest Income from discontinued operations is included within Interest presented elsewhere. |
| 414 | Barclays PLC and Barclays Bank PLC 2016 Annual Report on Form 20-F |
Additional information
Additional financial disclosure (unaudited)
Changes in total interest – volume and rate analysis
The following tables allocate changes in interest between changes in volume and changes in interest rates for the last two years. Volume and rate variances have been calculated on the movement in the average balances and the change in the interest rates on average interest earning assets and average interest bearing liabilities. Where variances have arisen from changes in both volumes and interest rates, these have been allocated proportionately between the two.
Interest income
|
|
2016/2015 Change due to
increase/(decrease) in:
|
|
|
2015/2014 Change due to
increase/(decrease) in:
| |||||||||||||||||||||
|
| Total
change
|
|
| Volume
|
|
| Rate
|
|
| Total
change
|
|
| Volume
|
| Rate
| |||||||||||
|
£m
|
|
| £m
|
|
| £m
|
|
| £m
|
|
| £m
|
| £m
| |||||||||||
Loans and advances to banks | UK | 77 | 45 | 32 | 134 | 28 | 106 | |||||||||||||||||||
Loans and advances to banks | Non-UK | 6 | 57 | (51) | (71) | 7 | (78) | |||||||||||||||||||
Loans and advances to banks | Total | 83 | 102 | (19) | 63 | 35 | 28 | |||||||||||||||||||
Loans and advances to customers | UK | 31 | 258 | (227) | (325) | 387 | (712) | |||||||||||||||||||
Loans and advances to customers | Non-UK | (2,863) | (1,274) | (1,589) | 163 | (802) | 965 | |||||||||||||||||||
Loans and advances to customers | Total | (2,832) | (1,016) | (1,816) | (162) | (415) | 253 | |||||||||||||||||||
Financial investments | UK | 69 | (82) | 151 | (192) | 78 | (270) | |||||||||||||||||||
Financial investments | Non-UK | (128) | (59) | (69) | 56 | (49) | 105 | |||||||||||||||||||
Financial investments | Total | (59) | (141) | 82 | (136) | 29 | (165) | |||||||||||||||||||
Reverse repurchase agreements | UK | (141) | (332) | 191 | (415) | (216) | (198) | |||||||||||||||||||
Reverse repurchase agreements | Non-UK | 81 | (358) | 439 | (102) | (79) | (22) | |||||||||||||||||||
Reverse repurchase agreements | Total | (60) | (690) | 630 | (517) | (295) | (220) | |||||||||||||||||||
Other interest income | (290) | - | (290) | (25) | - | (25) | ||||||||||||||||||||
Total interest receivable | (3,158) | (1,745) | (1,413) | (777) | (646) | (129) | ||||||||||||||||||||
Interest expense
|
| 2016/2015 Change due to
increase/(decrease) in:
|
|
| 2015/2014 Change due to
increase/(decrease) in:
| |||||||||||||||||||||
|
| Total
change
|
|
| Volume
|
|
| Rate
|
|
| Total
change
|
|
| Volume
|
| Rate
| |||||||||||
|
£m
|
|
|
£m
|
|
|
£m
|
|
|
£m
|
|
|
£m
|
|
£m
| |||||||||||
Deposits by banks | UK | 67 | (1) | 68 | (9) | 10 | (19) | |||||||||||||||||||
Deposits by banks | Non-UK | 12 | (31) | 43 | (6) | (21) | 15 | |||||||||||||||||||
Deposits by banks | Total | 79 | (32) | 111 | (15) | (11) | (4) | |||||||||||||||||||
Customer accounts | UK | (1,897) | 124 | (2,021) | (554) | 69 | (623) | |||||||||||||||||||
Customer accounts | Non-UK | 567 | (201) | 768 | (339) | (78) | (261) | |||||||||||||||||||
Customer accounts | Total | (1,330) | (77) | (1,253) | (893) | (9) | (884) | |||||||||||||||||||
Debt securities in issue | UK | 353 | (56) | 409 | (134) | (55) | (79) | |||||||||||||||||||
Debt securities in issue | Non-UK | (404) | (145) | (259) | (25) | (53) | 28 | |||||||||||||||||||
Debt securities in issue | Total | (51) | (201) | 150 | (159) | (108) | (51) | |||||||||||||||||||
Subordinated liabilities | UK | 97 | 121 | (24) | 18 | 23 | (5) | |||||||||||||||||||
Subordinated liabilities | Non-UK | (80) | (33) | (47) | (1) | (27) | 26 | |||||||||||||||||||
Subordinated liabilities | Total | 17 | 88 | (71) | 17 | (4) | 21 | |||||||||||||||||||
Repurchase agreements | UK | (5) | (344) | 339 | (208) | (177) | (31) | |||||||||||||||||||
Repurchase agreements | Non-UK | (124) | (423) | 299 | 44 | (73) | 117 | |||||||||||||||||||
Repurchase agreements | Total | (129) | (767) | 638 | (164) | (250) | 86 | |||||||||||||||||||
Other interest expense | (83) | - | (83) | 59 | - | 59 | ||||||||||||||||||||
Total interest payable | (1,497) | (989) | (508) | (1,155) | (382) | (773) | ||||||||||||||||||||
| Barclays PLC and Barclays Bank PLC 2016 Annual Report on Form 20-F | 415 |
Additional information
Additional financial disclosure (unaudited)
Credit risk additional disclosure
This section of the report contains supplementary information that is more detailed or contains longer histories than the data presented in the credit risk management section.
A. Impairment
Movements in allowance for impairment by geography
| ||||||||||||||||||
|
2016
£m
|
|
|
2015
£m
|
|
|
2014
£m
|
|
|
2013
£m
|
|
2012
£m
| ||||||
Allowance for impairment as at 1 January | 4,921 | 5,455 | 7,258 | 7,799 | 10,597 | |||||||||||||
Effects of the adoption of IFRS 10 | - | - | - | - | (1,701) | |||||||||||||
Acquisitions and disposals | (5) | - | 13 | (5) | (80) | |||||||||||||
Unwind of discount | (75) | (149) | (153) | (179) | (211) | |||||||||||||
Exchange and other adjustments | (736) | (617) | (1,047) | (260) | (206) | |||||||||||||
Amounts written off: | ||||||||||||||||||
United Kingdom | (1,272) | (1,354) | (1,313) | (1,548) | (1,972) | |||||||||||||
Europe | (218) | (200) | (742) | (957) | (1,119) | |||||||||||||
Americas | (664) | (411) | (535) | (276) | (311) | |||||||||||||
Africa and Middle East | (20) | (300) | (423) | (534) | (655) | |||||||||||||
Asia | (19) | (12) | (24) | (28) | (62) | |||||||||||||
Recoveries: | ||||||||||||||||||
United Kingdom | 241 | 281 | 147 | 119 | 127 | |||||||||||||
Europe | 18 | 15 | 27 | 18 | 31 | |||||||||||||
Americas | 104 | 52 | - | - | - | |||||||||||||
Africa and Middle East | 1 | 52 | 46 | 63 | 51 | |||||||||||||
Asia | 1 | - | 1 | 1 | 3 | |||||||||||||
New and increased impairment allowance: | ||||||||||||||||||
United Kingdom | 1,659 | 1,559 | 1,596 | 1,687 | 1,728 | |||||||||||||
Europe | 350 | 399 | 757 | 1,131 | 1,566 | |||||||||||||
Americas | 1,164 | 649 | 378 | 514 | 250 | |||||||||||||
Africa and Middle East | 73 | 438 | 449 | 566 | 853 | |||||||||||||
Asia | 13 | 11 | 50 | 31 | 50 | |||||||||||||
Reversals of impairment allowance: | ||||||||||||||||||
United Kingdom | (288) | (320) | (381) | (302) | (356) | |||||||||||||
Europe | (90) | (141) | (337) | (323) | (463) | |||||||||||||
Americas | (139) | (59) | (38) | (4) | (23) | |||||||||||||
Africa and Middle East | (29) | (22) | (45) | (45) | (70) | |||||||||||||
Asia | (5) | (5) | (8) | (9) | (16) | |||||||||||||
Recoveries: | ||||||||||||||||||
United Kingdom | (241) | (281) | (147) | (119) | (127) | |||||||||||||
Europe | (18) | (15) | (27) | (18) | (31) | |||||||||||||
Americas | (104) | (52) | - | - | - | |||||||||||||
Africa and Middle East | (1) | (52) | (46) | (63) | (51) | |||||||||||||
Asia | (1) | - | (1) | (1) | (3) | |||||||||||||
Allowance for impairment as at 31 December | 4,620 | 4,921 | 5,455 | 7,258 | 7,799 | |||||||||||||
Average loans and advances for the year | 504,246 | 503,561 | 505,122 | 525,995 | 564,128 | |||||||||||||
| 416 | Barclays PLC and Barclays Bank PLC 2016 Annual Report on Form 20-F |
Additional information
Additional financial disclosure (unaudited)
Analysis of impairment charges
| ||||||||||||||||||
As at 31 December
|
|
2016
£m
|
|
|
2015
£m
|
|
|
2014
£m
|
|
|
2013
£m
|
|
2012
£m
| |||||
Impairment charges: | ||||||||||||||||||
United Kingdom | 1,130 | 960 | 1,071 | 1,262 | 1,245 | |||||||||||||
Europe | 242 | 244 | 392 | 790 | 1,072 | |||||||||||||
Americas | 921 | 539 | 339 | 510 | 227 | |||||||||||||
Africa and Middle East | 43 | 7 | 9 | ( 12 | ) | 37 | ||||||||||||
Asia | 7 | 6 | 41 | 21 | 31 | |||||||||||||
Impairment on loans and advances | 2,343 | 1,756 | 1,852 | 2,571 | 2,612 | |||||||||||||
Impairment on available for sale assets | 21 | 18 | ( 31 | ) | - | 40 | ||||||||||||
Impairment on reverse repurchase agreements | - | - | ( 5 | ) | 8 | ( 3) | ||||||||||||
Impairment charges | 2,364 | 1,774 | 1,816 | 2,579 | 2,649 | |||||||||||||
Other credit provisions charge | 9 | ( 12 | ) | 5 | 17 | ( 4) | ||||||||||||
Impairment charges | 2,373 | 1,762 | 1,821 | 2,596 | 2,645 | |||||||||||||
The industry classifications in the tables below have been prepared at the level of the borrowing entity. This means that a loan to a subsidiary of a major corporation is classified by the industry in which the subsidiary operates, even though the Parent’s predominant business may be in a different industry.
| ||||||||||||||||||
Total impairment charges on loans and advances by industry
| ||||||||||||||||||
As at 31 December
|
|
2016
£m
|
|
|
2015
£m
|
|
|
2014
£m
|
|
|
2013
£m
|
|
2012
£m
| |||||
United Kingdom: | ||||||||||||||||||
Financial institutions | (1) | (4) | (9) | 2 | 30 | |||||||||||||
Manufacturing | 39 | (8) | 1 | 44 | 12 | |||||||||||||
Construction | 7 | 10 | 8 | 23 | 25 | |||||||||||||
Property | (13) | 11 | 10 | 25 | 82 | |||||||||||||
Energy and water | 12 | 42 | - | - | 1 | |||||||||||||
Wholesale and retail distribution and leisure | 38 | 38 | 54 | 52 | 109 | |||||||||||||
Business and other services | 56 | 110 | 76 | 82 | 138 | |||||||||||||
Home loans | (4) | 27 | 28 | 38 | 18 | |||||||||||||
Cards, unsecured and other personal lending | 975 | 735 | 893 | 980 | 799 | |||||||||||||
Other | 20 | (1) | 10 | 16 | 31 | |||||||||||||
Total United Kingdom | 1,129 | 960 | 1,071 | 1,262 | 1,245 | |||||||||||||
Overseas | 1,214 | 796 | 781 | 1,309 | 1,367 | |||||||||||||
Total Impairment charges | 2,343 | 1,756 | 1,852 | 2,571 | 2,612 | |||||||||||||
| Barclays PLC and Barclays Bank PLC 2016 Annual Report on Form 20-F | 417 |
Additional information
Additional financial disclosure (unaudited)
Allowance for impairment by industry
| ||||||||||||||||||||||||||||||||||||||
|
2016
|
|
|
2015
|
|
|
2014
|
|
|
2013
|
|
|
2012
| |||||||||||||||||||||||||
As at 31 December
|
|
£m
|
|
| %
|
|
| £m
|
|
| %
|
|
| £m
|
|
| %
|
|
| £m
|
|
| %
|
|
| £m
|
| %
| ||||||||||
United Kingdom: | ||||||||||||||||||||||||||||||||||||||
Financial institutions | 5 | 0.1 | 10 | 0.2 | 9 | 0.2 | 23 | 0.3 | 411 | 5.3 | ||||||||||||||||||||||||||||
Manufacturing | 60 | 1.3 | 30 | 0.6 | 32 | 0.6 | 84 | 1.2 | 37 | 0.5 | ||||||||||||||||||||||||||||
Construction | 35 | 0.8 | 32 | 0.7 | 33 | 0.6 | 45 | 0.6 | 31 | 0.4 | ||||||||||||||||||||||||||||
Property | 89 | 1.9 | 122 | 2.5 | 140 | 2.6 | 73 | 1.0 | 118 | 1.5 | ||||||||||||||||||||||||||||
Government and central bank | - | - | - | - | - | - | 18 | 0.2 | - | - | ||||||||||||||||||||||||||||
Energy and water | 114 | 2.5 | 90 | 1.8 | - | - | 1 | - | - | - | ||||||||||||||||||||||||||||
Wholesale and retail distribution and leisure | 143 | 3.1 | 124 | 2.5 | 137 | 2.5 | 124 | 1.7 | 243 | 3.1 | ||||||||||||||||||||||||||||
Business and other services | 252 | 5.5 | 238 | 4.8 | 205 | 3.8 | 202 | 2.8 | 217 | 2.8 | ||||||||||||||||||||||||||||
Home loans | 144 | 3.1 | 157 | 3.2 | 123 | 2.3 | 111 | 1.5 | 129 | 1.7 | ||||||||||||||||||||||||||||
Cards, unsecured and other personal lending | 1,653 | 35.8 | 1,652 | 33.6 | 1,912 | 35.1 | 2,228 | 30.7 | 2,043 | 26.2 | ||||||||||||||||||||||||||||
Other | 49 | 1.1 | 37 | 0.8 | 61 | 1.1 | 71 | 1.0 | 41 | 0.5 | ||||||||||||||||||||||||||||
Total United Kingdom | 2,544 | 55.1 | 2,492 | 50.6 | 2,652 | 48.6 | 2,980 | 41.1 | 3,270 | 41.9 | ||||||||||||||||||||||||||||
Overseas | 2,076 | 44.9 | 2,429 | 49.4 | 2,803 | 51.4 | 4,278 | 58.9 | 4,529 | 58.1 | ||||||||||||||||||||||||||||
Total | 4,620 | 100.0 | 4,921 | 100.0 | 5,455 | 100.0 | 7,258 | 100.0 | 7,799 | 100.0 | ||||||||||||||||||||||||||||
Amounts written off and recovered by industry
| ||||||||||||||||||||||||||||||||||||||
|
Amounts written off
|
|
| Recoveries of amounts previously written off
| ||||||||||||||||||||||||||||||||||
As at 31 December
|
|
2016
£m
|
|
|
2015
£m
|
|
| 2014
£m
|
|
| 2013
£m
|
|
| 2012
£m
|
|
| 2016
£m
|
|
| 2015
£m
|
|
| 2014
£m
|
|
| 2013
£m
|
| 2012
£m
| ||||||||||
United Kingdom: | ||||||||||||||||||||||||||||||||||||||
Financial institutions | 2 | 3 | 1 | 13 | 55 | 1 | 8 | 11 | 1 | 4 | ||||||||||||||||||||||||||||
Manufacturing | 15 | 6 | 13 | 55 | 76 | 3 | 2 | 6 | 4 | 2 | ||||||||||||||||||||||||||||
Construction | 5 | 13 | 21 | 26 | 52 | 1 | 3 | 3 | 2 | 4 | ||||||||||||||||||||||||||||
Property | 18 | 24 | 19 | 34 | 95 | 11 | 13 | 17 | 1 | 7 | ||||||||||||||||||||||||||||
Energy and water | - | - | - | 1 | 1 | 2 | 2 | - | - | - | ||||||||||||||||||||||||||||
Wholesale and retail distribution and leisure | 25 | 94 | 48 | 78 | 246 | 5 | 17 | 13 | 4 | 13 | ||||||||||||||||||||||||||||
Business and other services | 52 | 65 | 59 | 138 | 200 | 10 | 15 | 10 | 19 | 22 | ||||||||||||||||||||||||||||
Home loans | 11 | 22 | 15 | 39 | 36 | - | 3 | 2 | 2 | 2 | ||||||||||||||||||||||||||||
Cards, unsecured and other personal lending | 1,134 | 1,113 | 994 | 1,127 | 1,184 | 206 | 214 | 81 | 82 | 73 | ||||||||||||||||||||||||||||
Other | 10 | 14 | 144 | 37 | 27 | 2 | 4 | 4 | 4 | - | ||||||||||||||||||||||||||||
Total United Kingdom | 1,272 | 1,354 | 1,314 | 1,548 | 1,972 | 241 | 281 | 147 | 119 | 127 | ||||||||||||||||||||||||||||
Overseas | 921 | 923 | 1,723 | 1,795 | 2,147 | 125 | 119 | 74 | 82 | 85 | ||||||||||||||||||||||||||||
Total | 2,193 | 2,277 | 3,037 | 3,343 | 4,119 | 366 | 400 | 221 | 201 | 212 | ||||||||||||||||||||||||||||
Impairment ratios
| ||||||||||||||||||||||||||||||||||||||
|
2016
%
|
|
|
2015
%
|
|
| 2014
%
|
|
| 2013
%
|
| 2012
%
| ||||||||||||||||||||||||||
Impairment charges as a percentage of average loans and advances |
| 0.46 | 0.42 | 0.44 | 0.58 | 0.59 | ||||||||||||||||||||||||||||||||
Amounts written off (net of recoveries) as a percentage of average loans and advances |
| 0.36 | 0.37 | 0.56 | 0.60 | 0.69 | ||||||||||||||||||||||||||||||||
Allowance for impairment balance as a percentage of loans and advances as at 31 December |
| 1.05 | 1.10 | 1.15 | 1.54 | 1.65 | ||||||||||||||||||||||||||||||||
| 418 | Barclays PLC and Barclays Bank PLC 2016 Annual Report on Form 20-F |
Additional information
Additional financial disclosure (unaudited)
B. Potential credit risk loans
Credit risk loans summary | ||||||||||||||||||||
As at 31 December
|
| 2016
£m
|
|
| 2015
£m
|
|
| 2014
£m
|
|
| 2013
£m
|
|
| 2012
£m
|
| |||||
Impaired loans | 4,614 | 5,635 | 6,854 | 10,510 | 11,747 | |||||||||||||||
Accruing loans which are contractually overdue 90 days or more as to principal or interest | 1,474 | 1,744 | 1,912 | 1,903 | 2,490 | |||||||||||||||
Impaired and restructured loans | 403 | 438 | 723 | 885 | 788 | |||||||||||||||
Credit risk loans | 6,491 | 7,817 | 9,489 | 13,298 | 15,025 | |||||||||||||||
Credit risk loans
As at 31 December |
|
2016
£m
|
|
|
2015
£m
|
|
|
2014
£m
|
|
|
2013
£m
|
|
|
2012
£m
|
| |||||
Impaired loans: | ||||||||||||||||||||
United Kingdom | 2,688 | 2747 | 3090 | 3986 | 4717 | |||||||||||||||
Europe | 1,078 | 1198 | 2011 | 4137 | 4433 | |||||||||||||||
Americas | 641 | 499 | 317 | 683 | 357 | |||||||||||||||
Africa and Middle East | 140 | 1106 | 1353 | 1626 | 2167 | |||||||||||||||
Asia | 67 | 85 | 83 | 78 | 73 | |||||||||||||||
Total | 4,614 | 5,635 | 6,854 | 10,510 | 11,747 | |||||||||||||||
Accruing loans which are contractually overdue 90 days or more as to principal or interest: | ||||||||||||||||||||
United Kingdom | 810 | 848 | 971 | 953 | 1,227 | |||||||||||||||
Europe | 331 | 300 | 354 | 503 | 476 | |||||||||||||||
Americas | 320 | 185 | 149 | 81 | 96 | |||||||||||||||
Africa and Middle East | 13 | 411 | 437 | 364 | 688 | |||||||||||||||
Asia | - | - | 1 | 2 | 3 | |||||||||||||||
Total | 1,474 | 1,744 | 1,912 | 1,903 | 2,490 | |||||||||||||||
Impaired and restructured loans: | ||||||||||||||||||||
United Kingdom | 217 | 286 | 559 | 734 | 615 | |||||||||||||||
Europe | 6 | 33 | 31 | 13 | 27 | |||||||||||||||
Americas | 180 | 117 | 90 | 81 | 116 | |||||||||||||||
Africa and Middle East | - | 2 | 42 | 56 | 25 | |||||||||||||||
Asia | - | - | 1 | 1 | 5 | |||||||||||||||
Total | 403 | 438 | 723 | 885 | 788 | |||||||||||||||
Total credit risk loans: | ||||||||||||||||||||
United Kingdom | 3,715 | 3,881 | 4,620 | 5,673 | 6,559 | |||||||||||||||
Europe | 1,415 | 1,531 | 2,396 | 4,653 | 4,936 | |||||||||||||||
Americas | 1,141 | 801 | 556 | 845 | 569 | |||||||||||||||
Africa and Middle East | 153 | 1,519 | 1,832 | 2,046 | 2,880 | |||||||||||||||
Asia | 67 | 85 | 85 | 81 | 81 | |||||||||||||||
Credit risk loans | 6,491 | 7,817 | 9,489 | 13,298 | 15,025 | |||||||||||||||
| Barclays PLC and Barclays Bank PLC 2016 Annual Report on Form 20-F | 419 |
Additional information
Additional financial disclosure (unaudited)
Potential problem loans
As at 31 December
|
| 2016
£m
|
|
| 2015
£m
|
|
| 2014
£m
|
|
| 2013
£m
|
|
| 2012
£m
|
| |||||
United Kingdom | 1,302 | 983 | 942 | 1,112 | 1,035 | |||||||||||||||
Europe | 209 | 158 | 208 | 285 | 430 | |||||||||||||||
Americas | 599 | 487 | 146 | 99 | 80 | |||||||||||||||
Africa and Middle East | 32 | 408 | 306 | �� | 310 | 314 | ||||||||||||||
Asia
|
| 54
|
|
| 14
|
|
| 10
|
|
| 2
|
|
| 1
|
| |||||
Potential problem loans
|
|
2,196
|
|
|
2,050
|
|
|
1,612
|
|
|
1,808
|
|
|
1,860
|
| |||||
|
2016 |
|
|
2015 |
|
2014 | ||||
Interest foregone on credit risk loans
|
|
£m
|
|
|
£m
|
|
£m
| |||
Interest income that would have been recognised under the original contractual terms | ||||||||||
United Kingdom | 91 | 139 | 195 | |||||||
Rest of the World
| 196 | 151 | 173 | |||||||
Total
|
|
287
|
|
|
290
|
|
368
| |||
Total impairment allowance coverage of credit risk loans |
|
2016 |
|
|
2015 |
|
|
2014 |
|
|
2013 |
|
|
2012 |
| |||||
As at 31 December |
|
%
|
|
|
%
|
|
|
%
|
|
|
%
|
|
|
%
|
| |||||
United Kingdom | 68.5 | 64.2 | 57.4 | 52.5 | 49.9 | |||||||||||||||
Europe | 48.4 | 53.3 | 50.9 | 53.4 | 52.8 | |||||||||||||||
Americas | 109.3 | 89.2 | 89.7 | 77.4 | 83.0 | |||||||||||||||
Africa and Middle East | 58.2 | 55.3 | 54.7 | 52.7 | 48.0 | |||||||||||||||
Asia
|
| 82.1
|
|
| 70.3
|
|
| 96.5
|
|
| 72.8
|
|
| 86.4
|
| |||||
Total coverage of credit risk lending
|
|
71.2
|
|
|
63.0
|
|
|
57.5
|
|
|
54.6
|
|
|
51.9
|
| |||||
| ||||||||||||||||||||
Total impairment allowance coverage of potential credit risk loans |
|
2016 |
|
|
2015 |
|
|
2014 |
|
|
2013 |
|
|
2012 |
| |||||
As at 31 December
|
|
%
|
|
|
%
|
|
|
%
|
|
|
%
|
|
|
%
|
| |||||
United Kingdom | 50.7 | 51.2 | 48.7 | 43.9 | 43.1 | |||||||||||||||
Europe | 42.2 | 48.3 | 46.9 | 50.3 | 48.6 | |||||||||||||||
Americas | 71.7 | 55.5 | 71.1 | 69.3 | 72.7 | |||||||||||||||
Africa and Middle East | 48.1 | 43.6 | 46.9 | 45.8 | 43.2 | |||||||||||||||
Asia
|
| 45.5
|
|
| 60.4
|
|
| 86.3
|
|
| 71.1
|
|
| 85.4
|
| |||||
Total coverage of potential credit risk lending
|
|
53.2
|
|
|
49.9
|
|
|
49.7
|
|
|
48.0
|
|
|
46.2
|
| |||||
| 420 | Barclays PLC and Barclays Bank PLC 2016 Annual Report on Form 20-F |
Additional information
Additional financial disclosure (unaudited)
C. Maturity Analysis of Loans and Advances
Maturity analysis of loans and advances to customers |
| |||||||||||||||||||||||||||||||||||
| As at 31 December 2016 | On
demand
£m | Not more
than
three
months
£m | Over
three
months
but not
more
than six
months
£m | Over six
months
but not
more
than one
year
£m | Over one
year but
not more
than
three
years
£m | Over
three
years but
not more
than five
years
£m | Over five
years but
not more
than ten
years
£m | Over ten
years
£m | Total
£m | |||||||||||||||||||||||||||
United Kingdom | ||||||||||||||||||||||||||||||||||||
Corporate lending | 14,810 | 20,056 | 1,127 | 2,929 | 14,917 | 14,123 | 4,478 | 13,626 | 86,066 | |||||||||||||||||||||||||||
Other lending to customers in the United Kingdom | 3,544 | 3,768 | 2,489 | 5,181 | 19,484 | 16,020 | 34,367 | 85,377 | 170,230 | |||||||||||||||||||||||||||
Total United Kingdom | 18,354 | 23,824 | 3,616 | 8,110 | 34,401 | 30,143 | 38,845 | 99,003 | 256,296 | |||||||||||||||||||||||||||
Europe | 5,295 | 21,497 | 1,076 | 1,948 | 5,618 | 4,917 | 2,870 | 4,515 | 47,736 | |||||||||||||||||||||||||||
Americas | 3,442 | 35,518 | 2,330 | 4,781 | 13,982 | 8,822 | 6,646 | 6,771 | 82,292 | |||||||||||||||||||||||||||
Africa and Middle East | 210 | 861 | 200 | 307 | 578 | 870 | 93 | 59 | 3,178 | |||||||||||||||||||||||||||
Asia | 895 | 4,482 | 454 | 764 | 912 | 307 | 74 | 14 | 7,902 | |||||||||||||||||||||||||||
Total loans and advances to customers | 28,196 | 86,182 | 7,676 | 15,910 | 55,491 | 45,059 | 48,528 | 110,362 | 397,404 | |||||||||||||||||||||||||||
As at 31 December 2015 | ||||||||||||||||||||||||||||||||||||
United Kingdom | ||||||||||||||||||||||||||||||||||||
Corporate lending | 14,634 | 14,957 | 2,791 | 3,301 | 12,692 | 13,922 | 4,585 | 11,307 | 78,189 | |||||||||||||||||||||||||||
Other lending to customers in the United Kingdom | 3,811 | 4,157 | 2,454 | 5,248 | 18,925 | 15,911 | 33,604 | 79,279 | 163,389 | |||||||||||||||||||||||||||
Total United Kingdom | 18,445 | 19,114 | 5,245 | 8,549 | 31,617 | 29,833 | 38,189 | 90,586 | 241,578 | |||||||||||||||||||||||||||
Europe | 4,459 | 19,236 | 4,639 | 1,957 | 4,865 | 4,400 | 3,351 | 5,281 | 48,188 | |||||||||||||||||||||||||||
Americas | 3,090 | 30,144 | 2,788 | 5,336 | 10,987 | 8,450 | 4,926 | 4,807 | 70,528 | |||||||||||||||||||||||||||
Africa and Middle East | 4,034 | 3,021 | 1,503 | 2,435 | 7,057 | 5,855 | 4,485 | 5,910 | 34,300 | |||||||||||||||||||||||||||
Asia | 509 | 5,169 | 578 | 1,410 | 1,092 | 544 | 175 | 67 | 9,544 | |||||||||||||||||||||||||||
Total loans and advances to customers | 30,537 | 76,684 | 14,753 | 19,687 | 55,618 | 49,082 | 51,126 | 106,651 | 404,138 | |||||||||||||||||||||||||||
| Barclays PLC and Barclays Bank PLC 2016 Annual Report on Form 20-F | 421 |
Additional information
Additional financial disclosure (unaudited)
Maturity analysis of loans and advances to banks |
| |||||||||||||||||||||||||||||||||||
| As at 31 December 2016 | On
demand
£m | Not more
than
three months | Over
three
months
but not
more
than six
months
£m | Over six
months
but not
more
than one
year
£m | Over one
year but
not more
than
three
years
£m | Over
three
years but
not more
than five
years
£m | Over five
years but
not more
than ten
years
£m | Over ten
years
£m | Total
£m | |||||||||||||||||||||||||||
United Kingdom | 270 | 5,624 | 1,485 | 34 | 45 | - | - | - | 7,458 | |||||||||||||||||||||||||||
Europe | 1,178 | 11,398 | 12 | 25 | 61 | - | - | - | 12,674 | |||||||||||||||||||||||||||
Americas | 1,887 | 14,329 | 136 | 211 | 313 | 18 | - | - | 16,894 | |||||||||||||||||||||||||||
Africa and Middle East | 224 | 772 | 305 | 331 | 146 | - | - | - | 1,778 | |||||||||||||||||||||||||||
Asia | 1,299 | 2,224 | 815 | 12 | 83 | 1 | 13 | - | 4,447 | |||||||||||||||||||||||||||
Total loans and advances to banks | 4,858 | 34,347 | 2,753 | 613 | 648 | 19 | 13 | - | 43,251 | |||||||||||||||||||||||||||
As at 31 December 2015 | ||||||||||||||||||||||||||||||||||||
United Kingdom | 441 | 9,520 | 560 | - | 199 | 13 | - | - | 10,733 | |||||||||||||||||||||||||||
Europe | 1,109 | 7,885 | 832 | 26 | 66 | - | - | - | 9,918 | |||||||||||||||||||||||||||
Americas | 1,193 | 10,980 | 244 | 327 | 308 | 26 | - | - | 13,078 | |||||||||||||||||||||||||||
Africa and Middle East | 1,173 | 880 | 102 | 306 | 404 | 1 | - | 34 | 2,900 | |||||||||||||||||||||||||||
Asia | 1,438 | 2,274 | 216 | 175 | 602 | 3 | 12 | - | 4,720 | |||||||||||||||||||||||||||
Total loans and advances to banks | 5,354 | 31,539 | 1,954 | 834 | 1,579 | 43 | 12 | 34 | 41,349 | |||||||||||||||||||||||||||
| 422 | Barclays PLC and Barclays Bank PLC 2016 Annual Report on Form 20-F |
Additional information
Additional financial disclosure (unaudited)
D. Industrial and Geographical Concentrations of Loans and Advances
Loans and advances to customers by industry | 2016 | 2015 | 2014 | 2013 | 2012 | |||||||||||||||
As at 31 December | £m | £m | £m | £m | £m | |||||||||||||||
Financial institutions | 91,826 | 80,785 | 103,503 | 103,703 | 93,745 | |||||||||||||||
Manufacturing | 12,470 | 12,444 | 11,849 | 10,632 | 11,907 | |||||||||||||||
Construction | 3,525 | 3,798 | 3,767 | 4,245 | 4,625 | |||||||||||||||
Property | 20,856 | 20,019 | 19,544 | 20,844 | 22,575 | |||||||||||||||
Government and central bank | 12,029 | 5,942 | 7,127 | 4,999 | 4,809 | |||||||||||||||
Energy and water | 7,565 | 7,874 | 8,557 | 7,547 | 7,638 | |||||||||||||||
Wholesale and retail distribution and leisure | 13,143 | 14,034 | 13,635 | 13,288 | 15,070 | |||||||||||||||
Business and other services | 22,135 | 26,092 | 22,803 | 20,663 | 24,722 | |||||||||||||||
Home loans | 145,184 | 156,384 | 167,520 | 180,295 | 172,875 | |||||||||||||||
Cards, unsecured loans and other personal lending | 59,851 | 63,217 | 58,914 | 55,806 | 58,863 | |||||||||||||||
Other | 8,820 | 13,549 | 16,003 | 19,463 | 21,530 | |||||||||||||||
Loans and advances to customers | 397,404 | 404,138 | 433,222 | 441,485 | 438,359 | |||||||||||||||
Loans and advances to customers in the UK | 2016 | 2015 | 2014 | 2013 | 2012 | |||||||||||||||
As at 31 December | £m | £m | £m | £m | £m | |||||||||||||||
Financial institutions | 22,214 | 18,530 | 23,728 | 22,101 | 22,290 | |||||||||||||||
Manufacturing | 6,816 | 5,735 | 6,274 | 5,411 | 6,078 | |||||||||||||||
Construction | 3,254 | 3,164 | 2,957 | 3,195 | 3,108 | |||||||||||||||
Property | 18,145 | 15,556 | 15,053 | 15,096 | 15,283 | |||||||||||||||
Government and central bank | 6,654 | 512 | 276 | 819 | 198 | |||||||||||||||
Energy and water | 2,348 | 1,922 | 2,096 | 1,715 | 2,286 | |||||||||||||||
Wholesale and retail distribution and leisure | 10,586 | 10,382 | 9,997 | 9,734 | 9,810 | |||||||||||||||
Business and other services | 16,427 | 16,314 | 13,944 | 13,052 | 15,971 | |||||||||||||||
Home loans | 131,945 | 132,324 | 132,864 | 129,703 | 119,781 | |||||||||||||||
Cards, unsecured loans and other personal lending | 31,260 | 30,452 | 28,061 | 30,396 | 31,772 | |||||||||||||||
Other | 6,647 | 6,687 | 8,944 | 8,444 | 9,476 | |||||||||||||||
Loans and advances to customers in the UK | 256,296 | 241,578 | 244,194 | 239,666 | 236,053 | |||||||||||||||
Loans and advances to customers in Europe | 2016 | 2015 | 2014 | 2013 | 2012 | |||||||||||||||
As at 31 December | £m | £m | £m | £m | £m | |||||||||||||||
Financial institutions | 19,803 | 16,918 | 22,126 | 17,791 | 20,245 | |||||||||||||||
Manufacturing | 2,613 | 2,352 | 1,641 | 2,051 | 2,827 | |||||||||||||||
Construction | 30 | 68 | 193 | 625 | 663 | |||||||||||||||
Property | 1,047 | 796 | 1,175 | 2,652 | 3,242 | |||||||||||||||
Government and central bank | 3,545 | 3,415 | 3,759 | 1,583 | 2,458 | |||||||||||||||
Energy and water | 1,497 | 1,280 | 2,612 | 3,119 | 2,376 | |||||||||||||||
Wholesale and retail distribution and leisure | 944 | 711 | 1,105 | 1,524 | 2,588 | |||||||||||||||
Business and other services | 1,170 | 3,355 | 1,878 | 2,882 | 2,985 | |||||||||||||||
Home loans | 12,189 | 12,503 | 19,933 | 35,110 | 36,965 | |||||||||||||||
Cards, unsecured loans and other personal lending | 4,283 | 5,047 | 5,226 | 7,146 | 6,346 | |||||||||||||||
Other | 615 | 1,743 | 1,589 | 2,014 | 2,471 | |||||||||||||||
Loans and advances to customers in Europe | 47,736 | 48,188 | 61,237 | 76,497 | 83,166 | |||||||||||||||
| Barclays PLC and Barclays Bank PLC 2016 Annual Report on Form 20-F | 423 |
Additional information
Additional financial disclosure (unaudited)
Loans and advances to customers in the Americas |
|
2016 |
| 2015 | 2014 | 2013 | 2012 | |||||||||||||||||
As at 31 December | £m | £m | £m | £m | £m | |||||||||||||||||||
Financial institutions | 45,193 | 39,798 | 49,171 | 49,457 | 43,428 | |||||||||||||||||||
Manufacturing | 2,516 | 1,562 | 1,458 | 1,308 | 1,229 | |||||||||||||||||||
Construction | 204 | 120 | 119 | 19 | 1 | |||||||||||||||||||
Property | 1,472 | 1,720 | 1,542 | 944 | 686 | |||||||||||||||||||
Government and central bank | 125 | 3 | 320 | 371 | 785 | |||||||||||||||||||
Energy and water | 2,720 | 2,914 | 2,487 | 1,496 | 1,761 | |||||||||||||||||||
Wholesale and retail distribution and leisure | 985 | 934 | 490 | 473 | 739 | |||||||||||||||||||
Business and other services | 3,904 | 3,363 | 3,262 | 2,227 | 2,368 | |||||||||||||||||||
Home loans | 595 | 624 | 770 | 783 | 480 | |||||||||||||||||||
Cards, unsecured loans and other personal lending | 23,700 | 18,140 | 15,666 | 12,936 | 12,047 | |||||||||||||||||||
Other | 878 | 1,350 | 1,775 | 1,301 | 1,235 | |||||||||||||||||||
Loans and advances to customers in the Americas | 82,292 | 70,528 | 77,060 | 71,315 | 64,759 | |||||||||||||||||||
Loans and advances to customers in Africa and Middle East |
|
2016 |
| 2015 | 2014 | 2013 | 2012 | |||||||||||||||||
As at 31 December | £m | £m | £m | £m | £m | |||||||||||||||||||
Financial institutions | 427 | 1,860 | 4,169 | 6,298 | 4,546 | |||||||||||||||||||
Manufacturing | 60 | 2,320 | 1,856 | 1,229 | 1,252 | |||||||||||||||||||
Construction | 2 | 363 | 403 | 379 | 829 | |||||||||||||||||||
Property | 96 | 1,780 | 1,579 | 2,029 | 3,117 | |||||||||||||||||||
Government and central bank | 483 | 613 | 997 | 1,090 | 1,368 | |||||||||||||||||||
Energy and water | 494 | 1,025 | 645 | 739 | 822 | |||||||||||||||||||
Wholesale and retail distribution and leisure | 328 | 1,837 | 1,831 | 1,378 | 1,833 | |||||||||||||||||||
Business and other services | 237 | 2,685 | 3,358 | 2,058 | 2,760 | |||||||||||||||||||
Home loans | 357 | 10,689 | 13,591 | 14,347 | 15,376 | |||||||||||||||||||
Cards, unsecured loans and other personal lending | 494 | 8,081 | 8,605 | 4,043 | 7,540 | |||||||||||||||||||
Other | 200 | 3,047 | 3,210 | 7,073 | 7,827 | |||||||||||||||||||
Loans and advances to customers in Africa and Middle East | 3,178 | 34,300 | 40,244 | 40,663 | 47,270 | |||||||||||||||||||
Loans and advances to customers in Asia |
|
2016 |
| 2015 | 2014 | 2013 | 2012 | |||||||||||||||||
As at 31 December | £m | £m | £m | £m | £m | |||||||||||||||||||
Financial institutions | 4,189 | 3,679 | 4,309 | 8,056 | 3,236 | |||||||||||||||||||
Manufacturing | 465 | 475 | 620 | 633 | 521 | |||||||||||||||||||
Construction | 35 | 83 | 95 | 27 | 24 | |||||||||||||||||||
Property | 96 | 167 | 195 | 123 | 247 | |||||||||||||||||||
Government and central bank | 1,222 | 1,399 | 1,775 | 1,136 | - | |||||||||||||||||||
Energy and water | 506 | 733 | 717 | 478 | 393 | |||||||||||||||||||
Wholesale and retail distribution and leisure | 300 | 170 | 212 | 179 | 100 | |||||||||||||||||||
Business and other services | 397 | 375 | 361 | 444 | 638 | |||||||||||||||||||
Home loans | 98 | 244 | 362 | 352 | 273 | |||||||||||||||||||
Cards, unsecured loans and other personal lending | 114 | 1,497 | 1,356 | 1,285 | 1,158 | |||||||||||||||||||
Other | 480 | 722 | 485 | 631 | 521 | |||||||||||||||||||
Loans and advances to customers in Asia | 7,902 | 9,544 | 10,487 | 13,344 | 7,111 | |||||||||||||||||||
Interest rate sensitivity of loans and
advances |
| 2016
|
|
| 2015
|
| ||||||||||||||||||
As at 31 December
|
|
Fixed rate
£m
|
|
| Variable rate
£m
|
|
|
Total
£m
|
|
|
Fixed rate
£m
|
|
|
Variable rate
£m
|
|
|
Total
£m
|
| ||||||
Banks
|
| 14,047
|
|
| 29,204
|
|
| 43,251
|
|
| 12,348
|
|
| 29,001
|
|
| 41,349
|
| ||||||
Customers
|
| 124,995
|
|
| 272,409
|
|
| 397,404
|
|
| 121,960
|
|
| 282,178
|
|
| 404,138
|
| ||||||
| 424 | Barclays PLC and Barclays Bank PLC 2016 Annual Report on Form 20-F |
Additional information
Additional financial disclosure (unaudited)
Foreign outstandings in currencies other than the local currency of the borrower for countries where this exceeds 0.75% of total Group assets
|
| |||||||||||||||||||
As % of
| Total
| Banks
and other
financial
institutions
| Government
and official
institutions
|
Commercial
industrial
and other
private
sectors
| ||||||||||||||||
assets
| £m
| £m
| £m
| £m
| ||||||||||||||||
As at 31 December 2016a | ||||||||||||||||||||
United States | 7.5 | 91,365 | 11,749 | 10,149 | 69,468 | |||||||||||||||
Germany | 1.6 | 18,044 | 10,204 | 4,685 | 3,155 | |||||||||||||||
France | 1.8 | 19,153 | 8,120 | 2,872 | 8,161 | |||||||||||||||
Cayman Islands | 2.0 | 14,192 | 28 | 2 | 14,162 | |||||||||||||||
Switzerland | 0.8 | 9,884 | 651 | 7,533 | 1,700 | |||||||||||||||
As at 31 December 2015a | ||||||||||||||||||||
United States | 6.9 | 76,744 | 11,648 | 18,422 | 46,674 | |||||||||||||||
Germany | 1.7 | 18,564 | 10,054 | 5,916 | 2,594 | |||||||||||||||
France | 1.6 | 18,388 | 6,250 | 7,694 | 4,444 | |||||||||||||||
Netherlands | 0.9 | 10,574 | 1,074 | 3,208 | 6,292 | |||||||||||||||
Cayman Islands | 1.0 | 10,748 | 78 | 1 | 10,669 | |||||||||||||||
Switzerland | 0.8 | 9,336 | 1,452 | 6,642 | 1,242 | |||||||||||||||
As at 31 December 2014 | ||||||||||||||||||||
United States | 6.2 | 84,606 | 7,196 | 23,409 | 54,001 | |||||||||||||||
Germany | 1.4 | 19,481 | 8,381 | 8,620 | 2,480 | |||||||||||||||
France | 2.0 | 26,884 | 12,632 | 5,919 | 8,333 | |||||||||||||||
Netherlands | 1.1 | 15,080 | 1,437 | 3,279 | 10,364 | |||||||||||||||
Cayman Islands | 0.9 | 12,480 | 49 | 1 | 12,430 | |||||||||||||||
Note
a Figures are net of short securities. | ||||||||||||||||||||
Off-Balance Sheet and other Credit Exposures
|
|
2016
|
|
|
2015
|
|
|
2014
|
| |||
As at 31 December
|
| £m
|
|
| £m
|
|
| £m
|
| |||
Off-balance sheet exposures | ||||||||||||
Contingent liabilities | 19,939 | 20,621 | 21,324 | |||||||||
Commitments | 303,686 | 282,307 | 291,262 | |||||||||
On-balance sheet exposures | ||||||||||||
Trading portfolio assets | 80,240 | 77,348 | 114,717 | |||||||||
Financial assets designated at fair value | 78,608 | 76,830 | 38,300 | |||||||||
Derivative financial instruments | 346,626 | 327,709 | 439,909 | |||||||||
Financial investments
|
| 63,318
|
|
| 90,267
|
|
| 86,066
|
| |||
| Barclays PLC and Barclays Bank PLC 2016 Annual Report on Form 20-F | 425 |
Additional information
Additional financial disclosure (unaudited)
Notional principal amounts of credit derivatives
|
|
2016
|
|
|
2015
|
|
|
2014
|
| |||
As at 31 December
|
| £m
|
|
| £m
|
|
| £m
|
| |||
Credit derivatives held or issued for trading purposesa
|
| 947,800
|
|
| 948,646
|
|
| 1,183,963
|
|
Note
| a | Includes credit derivatives held as economic hedges which are not designated as hedges for accounting purposes. |
Additional Related Parties disclosures
For US disclosure purposes, the aggregate emoluments of all Directors and Officers of Barclays PLC who held office during the year (2016:32, 2015: 32 persons, 2014: 33 persons) for the year ended 31st December 2016 amounted to £71m (2015: £52.2m, 2014: £56.9m). In addition, the aggregate amount set aside for the year ended 31st December 2016, to provide pension benefits for the Directors and Officers amounted to £0.2m (2015:£ 0.3m 2014: £0.3m).
Ratio of earnings to fixed charges – Barclays Plc
| ||||||||||||||||||||
|
2016
|
|
|
2015
|
|
|
2014
|
|
|
2013
|
|
|
2012
|
| ||||||
|
(In £m except for ratios)
|
| ||||||||||||||||||
Fixed charges | ||||||||||||||||||||
Interest expense | 4,004 | 3,345 | 4,108 | 4,904 | 5,330 | |||||||||||||||
Rental expense | 208 | 157 | 207 | 221 | 213 | |||||||||||||||
Total Fixed charges | 4,212 | 3,502 | 4,315 | 5,125 | 5,543 | |||||||||||||||
Earnings | ||||||||||||||||||||
Income before taxes andnon-controlling interests | 3,230 | 1,146 | 1,313 | 1,879 | (175) | |||||||||||||||
Less: unremittedpre-tax income of associated companies and joint ventures | (53) | (26) | (34) | 102 | (94) | |||||||||||||||
Total earnings excluding fixed charges | 3,177 | 1,120 | 1,279 | 1,981 | (269) | |||||||||||||||
Fixed charges | 4,212 | 3,502 | 4,315 | 5,125 | 5,543 | |||||||||||||||
Total earnings including fixed charges | 7,389 | 4,622 | 5,594 | 7,106 | 5,274 | |||||||||||||||
Ratio of earnings to fixed charges | 1.75 | 1.32 | 1.30 | 1.39 | 0.95 | |||||||||||||||
Ratio of earnings to fixed charges and preference shares – Barclays Plc
| ||||||||||||||||||||
|
2016
|
|
|
2015
|
|
|
2014
|
|
|
2013
|
|
|
2012
|
| ||||||
|
(In £m except for ratios)
|
| ||||||||||||||||||
Fixed charges, preference share dividends and similar appropriations | ||||||||||||||||||||
Interest expense | 4,004 | 3,345 | 4,108 | 4,904 | 5,330 | |||||||||||||||
Rental expense | 208 | 157 | 207 | 221 | 213 | |||||||||||||||
Fixed charges | 4,212 | 3,502 | 4,315 | 5,125 | 5,543 | |||||||||||||||
Preference share dividends and similar appropriations | 343 | 345 | 443 | 412 | 466 | |||||||||||||||
Total fixed charges | 4,555 | 3,847 | 4,758 | 5,537 | 6,009 | |||||||||||||||
Earnings | ||||||||||||||||||||
Income before taxes andnon-controlling interests | 3,230 | 1,146 | 1,313 | 1,879 | (175) | |||||||||||||||
Less: unremittedpre-tax income of associated companies and joint ventures | (53) | (26) | (34) | 102 | (94) | |||||||||||||||
Total earnings excluding fixed charges | 3,177 | 1,120 | 1,279 | 1,981 | (269) | |||||||||||||||
Fixed charges | 4,555 | 3,847 | 4,758 | 5,537 | 6,009 | |||||||||||||||
Total earnings including fixed charges | 7,732 | 4,967 | 6,037 | 7,518 | 5,740 | |||||||||||||||
Ratio of earnings to fixed charges, preference share dividends and similar appropriations | 1.70 | 1.29 | 1.27 | 1.36 | 0.96 | |||||||||||||||
| 426 | Barclays PLC and Barclays Bank PLC 2016 Annual Report on Form 20-F |
Independent Registered Public Accounting Firm’s Report
Report of Independent Registered Public Accounting Firm
To the Board of Directors and Shareholders of Barclays Bank PLC
In our opinion, the accompanying consolidated balance sheets and the related consolidated income statements, statements of comprehensive income, consolidated statements of changes in equity and consolidated cash flow statements present fairly, in all material respects, the financial position of Barclays Bank PLC (“the Bank”) and its subsidiaries at 31 December 2016 and 31 December 2015, and the results of their operations and their cash flows for each of the three years in the period ended 31 December 2016 in conformity with International Financial Reporting Standards as issued by the International Accounting Standards Board. These financial statements are the responsibility of the Bank’s management. Our responsibility is to express an opinion on these financial statements based on our audits. We conducted our audits in accordance with the standards of the Public Company Accounting Oversight Board (United States). Those standards require that we plan and perform the audits to obtain reasonable assurance about whether the financial statements are free of material misstatement. An audit includes examining, on a test basis, evidence supporting the amounts and disclosures in the financial statements, assessing the accounting principles used and significant estimates made by management, and evaluating the overall financial statement presentation. We believe that our audits provide a reasonable basis for our opinion.
/s/ PricewaterhouseCoopers LLP
London, United Kingdom
22 February 2017
| Barclays PLC and Barclays Bank PLC 2016 Annual Report on Form 20-F | 427 |
Presentation of information
[•••] Consolidated income statement
[•••] Consolidated statement of comprehensive income
[•••] Consolidated balance sheet
[•••] Consolidated statement of changes in equity
[•••] Consolidated cash flow statement
[•••] Notes to the accounts
[•••] Financial data
Barclays Bank PLC is a public limited company, registered in England under company number 1026167. The bank was incorporated on 7 August 1925 under the Colonial Bank Act 1925 and on the 4 October 1971 was registered as a company limited by shares under the Companies Act 1948 to 1967. Pursuant to The Barclays Bank Act 1984, on 1 January 1985 the Bank was registered as a public limited company and its name was changed from Barclays Bank International Limited to Barclays Bank PLC.
All of the issued ordinary share capital of Barclays Bank PLC is owned by Barclays PLC.
Barclays approach to disclosures
The Group aims to continually enhance its disclosures and their usefulness to the readers of the financial statements in the light of developing market practice and areas of focus. Consequently Barclays disclosures go beyond the minimum standards required by accounting standards and other regulatory requirements.
Barclays continue to support the recommendations and guidance made by the Enhanced Disclosure Taskforce (EDTF). The EDTF was formed by the Financial Stability Board with a remit to broaden and deepen the risk disclosures of global banks in a number of areas, including liquidity and funding, credit risk and market risk. Barclays has adopted the recommendations across the Annual Report and Pillar 3 report.
In line with the Financial Reporting Council’s guidance on Clear and Concise reporting. Barclays has focused reporting on material items and sought to reorganise information to aid users understanding.
It is Barclays view that best in class disclosures will continue to evolve in light of ongoing market and stakeholder engagement with the banking sector. Barclays are committed to engaging with a published Code for Financial Reporting Disclosure (the Code). The Code sets out five disclosure principles together with supporting guidance which states that UK banks will:
| ● | Provide high quality, meaningful and decision-useful disclosures; |
| ● | Review and enhance their financial instrument disclosures for key areas of interest; |
| ● | Assess the applicability and relevance of good practice recommendations to their disclosures acknowledging the importance of such guidance; |
| ● | Seek to enhance the comparability of financial statement disclosures across the UK banking sector; and |
| ● | Clearly differentiate in their annual reports between information that is audited and information that is unaudited. |
On 1 March 2016, Barclays announced its intention to sell down the Group’s interest in BAGL. This sell down is intended to be to a level which will permit deconsolidation from an accounting and regulatory perspective, subject to shareholder and regulatory approvals as required. As the Africa Banking Business meets requirements for presentation as a discontinued operation, these results have been presented as two lines on the face of the Group income statement, representing the profit after tax andnon-controlling interest in respect of the discontinued operation.
British Bankers’ Association (BBA) Code for Financial Reporting Disclosure
Barclays has adopted the BBA Code for Financial Reporting Disclosure and has prepared the 2016 Annual Report and Accounts in compliance with the Code.
Statutory Accounts
The consolidated accounts of Barclays PLC and its subsidiaries are set out on pages 216 to 316 along with the accounts of Barclays PLC itself on pages224 to 225. The accounting policies on pages 226 to 230 and the Notes commencing on page 226 apply equally to both sets of accounts unless otherwise stated.
The financial statements have been prepared on going concern basis, in accordance with The Companies Act 2006 as applicable to companies using IFRS.
Capital RequirementsCountry-by Country Reporting
HM Treasury has transposed the requirements set out under CRD IV and issued the Capital RequirementsCountry-by-Country Reporting Regulations 2013. The legislation requires Barclays PLC to publish additional information in respect of the year ended 31 December 2016. This information is available on the Barclays’s website:barclays.com/citizenship/reports-and-publications/country-snapshot.html
| 428 | Barclays PLC and Barclays Bank PLC 2016 Annual Report on Form 20-F |
Barclays Bank PLC data
More extensive disclosures are contained in the Barclays PLC Results Announcement for the period ended 31 December 2016, attached, including risk exposures and business performance, which are materially the same as those for Barclays Bank PLC.
Barclays Bank PLC is a wholly owned subsidiary of Barclays PLC, which is the Group’s ultimate parent company. The business activities of Barclays Bank PLC Group and Barclays PLC Group are fundamentally the same as the only differences are the holding company, Barclays PLC and following a restructure in November 2016, the Group Service Company transferring from Barclays Bank PLC to Barclays PLC.
Differences between Barclays PLC and Barclays Bank PLC results can be summarised as follows:
| – | Balance Sheet Asset size – Barclays PLC £1,213,126m, Barclays Bank PLC £1,213,955m |
| – | Income Statement Profit before tax – Barclays PLC £2,828m, Barclays Bank PLC £3,729m |
The differences occur primarily due to the following reasons:
| – | Funding structures |
| – | Cash flow hedging |
| – | Group Service Company |
More detail regarding the main differences is described below.
Funding structures
| Instrument Type | Barclays PLC
£m | Barclays Bank PLC
£m | ||
| Preference shares | - | 5,836 | ||
Other shareholders’ equity | - | 271 | ||
Non-controlling interests (NCI) | 6,492 | 3,522 |
Preference shares and capital notes issued by Barclays Bank PLC are included within share capital in Barclays Bank PLC, and where still outstanding are presented asnon-controlling interests in the financial statements of Barclays PLC Group.
| Instrument Type | Barclays PLC
£m | Barclays Bank PLC
£m | ||
| Treasury shares | (42) | - |
Barclays PLC shares held for the purposes of employee share schemes and for trading are recognised as available for sale investments and trading portfolio assets respectively within Barclays Bank PLC. Barclays PLC deducts these treasury shares from shareholders’ equity.
| Instrument Type | Barclays PLC
£m | Barclays Bank PLC
£m | ||
| Capital Redemption Reserve (CRR) | 394 | 38 |
Arising from the redemption or exchange of Barclays PLC or Barclays Bank PLC shares respectively
Instrument Type |
Barclays PLC |
Barclays Bank PLC | ||
Derivative financial instruments | 346,626 | 346,820 | ||
Loans and advances to banks | 43,251 | 43,634 | ||
Subordinated liabilities | (23,383) | (23,871) | ||
| Barclays PLC and Barclays Bank PLC 2016 Annual Report on Form 20-F | 429 |
Barclays Bank PLC data
Barclays Bank PLC has in issue two series of contingent capital notes (CCNs). These both pay interest and principal to the holder unless the consolidated CRD IV CET 1 ratio (FSA October 2012 transitional statement) of Barclays PLC falls below 7%, in which case they are cancelled from the Barclays PLC consolidated perspective. The coupon payable on the CCNs is higher than a market rate of interest for a similar note without this risk. Barclays Bank PLC holds a derivative asset and loan relating to these issuances. The CCN is included in subordinated liabilities and has a higher carrying value in Barclays Bank PLC due to the higher fair value on initial recognition.
Cash flow hedging
| ||||||||
Instrument Type |
Barclays PLC
£m |
Barclays Bank PLC
£m | ||||||
Income Statement | ||||||||
Net interest income | 10,537 | 11,457 | ||||||
Tax | (993) | (1,245) | ||||||
Equity | ||||||||
Cash flow hedging reserve | 2,105 | 954 | ||||||
Barclays PLC cash flow hedging reserve is larger than Barclays Bank PLC as it is no longer exposed to the same variable rate cash flows. This is as a direct result of anticipated bank ring fencing and transfer of assets to an entity which is not expected to be consolidated by Barclays Bank PLC (although is expected to be consolidated by Barclays PLC). There is also a difference in the income statement due to variance in income and tax due to cash flow hedging not included in Barclays Bank PLC.
Group Service Company
The ownership of the Group service company was transferred in November 2016 contributing to the following key differences between Barclays PLC and Barclays Bank PLC.
Instrument Type |
Barclays PLC
£m |
Barclays Bank PLC
£m | ||
Staff costs | (9,423) | (9,211) | ||
Administration and general expenses | (2,917) | (3,200) | ||
Employees within the Group Service Company reallocated from Barclays Bank PLC as part of the restructure. Therefore these staff costs are only shown in Barclays PLC. Group Service Company recharged costs to Barclays Bank PLC leading to higher expenses. These are eliminated on consolidation in Barclays PLC.
Instrument Type |
Barclays PLC
£m |
Barclays Bank PLC
£m | ||
Prepayments, accrued income and other assets | 2,893 | 4,011 | ||
Barclays Bank PLC recognises a receivable from the Group Service Company which is eliminated on consolidation in Barclays PLC. The Bank funded acquisition of shares on behalf of the Group Service Company to satisfy employee share awards creating a receivable of £1bn.
Instrument Type |
Barclays PLC
£m |
Barclays Bank PLC
£m | ||
Goodwill and intangibles | 7,726 | 7,348 | ||
Property, plant and equipment | 2,825 | 2,466 | ||
Customer accounts | (423,178) | (424,703) | ||
Debt securities in issue | (75,932) | (75,369) | ||
Provisions | (4,134) | (3,909) | ||
Differences driven by Group Service Company balances reflected in Barclays PLC only, or in the case of customer accounts, intercompany balances between Group Service Company and Barclays Bank Plc, which eliminate on consolidation in Barclays PLC.
| 430 | Barclays PLC and Barclays Bank PLC 2016 Annual Report on Form 20-F |
Barclays Bank PLC data
Consolidated income statement
For the year ended 31 December 2016 | Notes |
| 2016
£m |
|
| 2015
£m |
|
| 2014
£m |
| ||||||
Continuing operations | ||||||||||||||||
Interest income | a | 14,423 | 13,947 | 14,200 | ||||||||||||
Interest expense | a | (2,966) | (2,584) | (4,056) | ||||||||||||
Net interest income | 11,457 | 11,363 | 10,144 | |||||||||||||
Fee and commission income | b | 8,625 | 8,494 | 8,636 | ||||||||||||
Fee and commission expense | b | (1,789) | (1,611) | (1,500) | ||||||||||||
Net fee and commission income | 6,836 | 6,883 | 7,136 | |||||||||||||
Net trading income | c | 2,795 | 3,430 | 3,064 | ||||||||||||
Net investment income | d | �� | 1,324 | 1,097 | 1,309 | |||||||||||
Other income | 57 | 35 | 157 | |||||||||||||
Total income | 22,469 | 22,808 | 21,810 | |||||||||||||
Credit impairment charges and other credit provisions | 7 | (2,373) | (1,762) | (1,821) | ||||||||||||
Net operating income | 20,096 | 21,046 | 19,989 | |||||||||||||
Staff costs | 8 | (9,211) | (8,853) | (9,860) | ||||||||||||
Infrastructure costs | e | (2,937) | (2,691) | (2,895) | ||||||||||||
Administration and general expenses | e | (3,200) | (2,983) | (3,063) | ||||||||||||
Provisions for UK customer redress | 27 | (1,000) | (2,772) | (1,110) | ||||||||||||
Provision for ongoing investigations and litigation including Foreign Exchange | 27 | (1,237) | (1,250) | |||||||||||||
Operating expenses | (16,348) | (18,536) | (18,178) | |||||||||||||
Share ofpost-tax results of associates and joint ventures | 70 | 41 | 28 | |||||||||||||
Loss/(gains) on disposal of subsidiaries, associates and joint ventures | 9 | 565 | (637) | (473) | ||||||||||||
Profit before tax from continuing operations | 4,383 | 1,914 | 1,366 | |||||||||||||
Tax | f | (1,245) | (1,302) | (1,165) | ||||||||||||
Profit after tax from continuing operations | 3,138 | 612 | 201 | |||||||||||||
Profit after tax from discontinued operations | 591 | 626 | 653 | |||||||||||||
Profit after tax | 3,729 | 1,238 | 854 | |||||||||||||
Equity holders of the Parent | 2,867 | 566 | 85 | |||||||||||||
Other equity holders | n | 457 | 345 | 443 | ||||||||||||
Non-controlling interests | ||||||||||||||||
Profit attributable tonon-controlling interests in respect of continuing operations | 3 | 3 | 6 | |||||||||||||
Profit attributable tonon-controlling interests in respect of discontinued operations | 402 | 324 | 320 | |||||||||||||
Profit after tax | 3,729 | 1,238 | 854 |
The note numbers refer to the notes on pages 226 to 316, whereas the note letters refer to Barclays Bank PLC supplementary notes on pages 436 to 446.
Barclays Bank PLC supplementary notes provided on pages 436 to 446 cover the line items where there is a difference to Barclays PLC.
| Barclays PLC and Barclays Bank PLC 2016 Annual Report on Form 20-F | 431 |
Barclays Bank PLC data
Consolidated statement of comprehensive income
| For the year ended 31 December | | 2016 £m |
| | 2015 £m |
| | 2014 £m |
| |||
| Profit after tax | 3,729 | 1,238 | 854 | |||||||||
| Profit after tax from continuing operations | 3,138 | 612 | 201 | |||||||||
| Profit after tax from discontinued operations | 591 | 626 | 653 | |||||||||
| Other comprehensive income/(loss) for continuing operations: | ||||||||||||
| Currency translation reservea | ||||||||||||
- Currency translation differences | 3,027 | 748 | 774 | |||||||||
Available for sale reservea | ||||||||||||
- Net gains from changes in fair value | 2,178 | 60 | 5,352 | |||||||||
- Net losses transferred to net profit on disposal | (912) | (377) | (619) | |||||||||
- Net losses/(gains) transferred to net profit due to impairment | 20 | 17 | (31) | |||||||||
- Net losses transferred to net profit due to fair value hedging | (1,677) | (148) | (4,074) | |||||||||
- Changes in insurance liabilities | 53 | 86 | (94) | |||||||||
- Tax | (18) | 132 | (103) | |||||||||
Cash flow hedging reservea | ||||||||||||
- Net gains/(losses) from changes in fair value | 689 | (990) | 2,651 | |||||||||
- Net losses transferred to net profit | (431) | (276) | (713) | |||||||||
- Tax | (59) | 221 | (384) | |||||||||
Other | 47 | 19 | (19) | |||||||||
| Total comprehensive income/(loss) that may be recycled to profit and loss | 2,917 | (508) | 2,740 | |||||||||
| Other comprehensive income/(loss) not recycled to profit and loss: | ||||||||||||
| Retirement benefit remeasurements | (1,309) | 1,179 | 268 | |||||||||
| Tax | 329 | (260) | (63) | |||||||||
| Total comprehensive income for the year, net of tax from continuing operations | 5,075 | 1,023 | 3,146 | |||||||||
Total comprehensive income/(loss) for the year, net of tax from discontinued operations | 2,111 | (720) | 346 | |||||||||
| Total comprehensive income for the year | 7,186 | 303 | 3,492 | |||||||||
| Attributable to: | ||||||||||||
Equity holders of the Parent | 5,947 | 457 | 3,245 | |||||||||
Non-controlling interests | 1,239 | (154) | 247 | |||||||||
| 7,186 | 303 | 3,492 | ||||||||||
Notes
| a | For further details refer to Note l |
| 432 | Barclays PLC and Barclays Bank PLC 2016 Annual Report on Form 20-F |
Barclays Bank PLC data
Consolidated balance sheet
|
| 31 December
2016
|
|
| 31 December
2015
|
| 31 December
2014
| ||||||||
As at 31.12.2016 | Notes | £m | £m | £m | ||||||||||
Assets | ||||||||||||||
Cash and balances at central banks | 102,328 | 49,711 | 39,695 | |||||||||||
Items in the course of collection from other banks | 1,467 | 1,011 | 1,210 | |||||||||||
Trading portfolio assets | g | 80,255 | 77,398 | 114,755 | ||||||||||
Financial assets designated at fair value | 13 | 78,608 | 76,830 | 38,300 | ||||||||||
Derivative financial instruments | j | 346,820 | 327,870 | 440,076 | ||||||||||
Financial investments | h | 63,365 | 90,304 | 86,105 | ||||||||||
Loans and advances to banks | i | 43,634 | 41,829 | 42,657 | ||||||||||
Loans and advances to customers | i | 392,783 | 399,217 | 427,767 | ||||||||||
Reverse repurchase agreements and other similar secured lending | 21 | 13,454 | 28,187 | 131,753 | ||||||||||
Prepayments, accrued income and other assets | 4,011 | 3,027 | 3,604 | |||||||||||
Investments in associates and joint ventures | 39 | 684 | 573 | 711 | ||||||||||
Property, plant and equipment | 22 | 2,466 | 3,468 | 3,786 | ||||||||||
Goodwill and intangible assets | 23 | 7,348 | 8,222 | 8,180 | ||||||||||
Current tax assets | f | 501 | 385 | 334 | ||||||||||
Deferred tax assets | 10 | 4,763 | 4,495 | 4,130 | ||||||||||
Retirement benefit assets | 35 | 14 | 836 | 56 | ||||||||||
Assets in disposal groups classified as held for disposal | 46 | 71,454 | 7,364 | 15,574 | ||||||||||
Total assets | 1,213,955 | 1,120,727 | 1,358,693 | |||||||||||
Liabilities | ||||||||||||||
Deposits from banks | 48,214 | 47,080 | 58,390 | |||||||||||
Items in the course of collection due to other banks | 636 | 1,013 | 1,177 | |||||||||||
Customer accounts | 424,703 | 418,307 | 427,868 | |||||||||||
Repurchase agreements and other similar secured borrowing | 21 | 19,760 | 25,035 | 124,479 | ||||||||||
Trading portfolio liabilities | 12 | 34,687 | 33,967 | 45,124 | ||||||||||
Financial liabilities designated at fair value | 16 | 96,032 | 91,745 | 56,972 | ||||||||||
Derivative financial instruments | j | 340,487 | 324,252 | 439,320 | ||||||||||
Debt securities in issue | 75,369 | 69,150 | 86,099 | |||||||||||
Subordinated liabilities | 29 | 23,871 | 21,955 | 21,685 | ||||||||||
Accruals, deferred income and other liabilities | 25 | 8,951 | 10,612 | 11,432 | ||||||||||
Provisions | 26 | 3,909 | 4,142 | 4,135 | ||||||||||
Current tax liabilities | f | 708 | 930 | 1,023 | ||||||||||
Deferred tax liabilities | 4 | 100 | 255 | |||||||||||
Retirement benefit liabilities | 35 | 377 | 423 | 1,574 | ||||||||||
Liabilities included in disposal groups classified as held for sale | 45 | 65,292 | 5,997 | 13,115 | ||||||||||
Total liabilities | 1,143,000 | 1,054,708 | 1,292,648 | |||||||||||
Total equity | ||||||||||||||
Called up share capital and share premium | 31 | 14,462 | 14,472 | 14,472 | ||||||||||
Other equity instruments | 31 | 6,486 | 5,350 | 4,350 | ||||||||||
Other reserves | 32 | 4,295 | 933 | 2,322 | ||||||||||
Retained earnings | 42,190 | 43,350 | 42,650 | |||||||||||
Total equity excludingnon-controlling interests | 67,433 | 64,105 | 63,794 | |||||||||||
Non-controlling interests | n | 3,522 | 1,914 | 2,251 | ||||||||||
Total equity | 70,955 | 66,019 | 66,045 | |||||||||||
Total liabilities and equity | 1,213,955 | 1,120,727 | 1,358,693 | |||||||||||
The note numbers refer to the notes on pages 226 to 316, whereas the note letters refer to those on pages 436 to 446.
These financial statements have been approved for issue by the Board of Directors on 29 February 2016.
| Barclays PLC and Barclays Bank PLC 2016 Annual Report on Form 20-F | 433 |
Barclays Bank PLC data
Consolidated statement of changes in equity
|
| Called up
share
capital
and share
premiuma
£m |
|
| Other
equity
instrumentsa
£m |
|
| Available
for sale
reserveb
£m |
|
| Cash
flow
hedging
reserveb
£m |
|
| Currency
translation
reserveb
£m |
|
| Other
reserves and
other
shareholders’
equitya
£m |
|
| Retained
earnings
£m |
|
| Total
equity
excluding
non-
controlling
interests
£m |
|
| Non-
controlling
interests
£m |
|
| Total
equity
£m |
| |||||||||||
Balance at 1 January 2016 | 14,472 | 5,350 | 338 | 709 | (623) | 509 | 43,350 | 64,105 | 1,914 | 66,019 | ||||||||||||||||||||||||||||||
Profit after tax | - | 457 | - | - | - | - | 2,678 | 3,135 | 3 | 3,138 | ||||||||||||||||||||||||||||||
Currency translation movements | - | - | - | - | 3,025 | - | - | 3,025 | 2 | 3,027 | ||||||||||||||||||||||||||||||
Available for sale investments | - | - | (356) | - | - | - | - | (356) | - | (356) | ||||||||||||||||||||||||||||||
Cash flow hedges | - | - | - | 199 | - | - | - | 199 | - | 199 | ||||||||||||||||||||||||||||||
Pension remeasurement | - | - | - | - | - | - | (980) | (980) | - | (980) | ||||||||||||||||||||||||||||||
Other | (17) | - | - | - | - | - | 64 | 47 | - | 47 | ||||||||||||||||||||||||||||||
Other comprehensive income for the period from continuing operations | (17) | 457 | (356) | 199 | 3,025 | - | 1,762 | 5,070 | 5 | 5,075 | ||||||||||||||||||||||||||||||
Other comprehensive income for the period from discontinued operations | - | - | (4) | 46 | 652 | - | 183 | 877 | 1,234 | 2,111 | ||||||||||||||||||||||||||||||
Total comprehensive income for the year | (17) | 457 | (360) | 245 | 3,677 | - | 1,945 | 5,947 | 1,239 | 7,186 | ||||||||||||||||||||||||||||||
Issue and exchange of equity instruments | - | 1,136 | - | - | - | - | - | 1,136 | - | 1,136 | ||||||||||||||||||||||||||||||
Other equity instruments coupons paid | - | (457) | - | - | - | - | 128 | (329) | - | (329) | ||||||||||||||||||||||||||||||
Equity settled share schemes | - | - | - | - | - | - | 577 | 577 | - | 577 | ||||||||||||||||||||||||||||||
Redemption of preference shares | - | - | - | - | - | (199) | (1,378) | (1,577) | - | (1,577) | ||||||||||||||||||||||||||||||
Vesting of shares under employee share schemes | - | - | - | - | - | - | (414) | (414) | - | (414) | ||||||||||||||||||||||||||||||
Dividends paid | - | - | - | - | - | - | (978) | (978) | (235) | (1,213) | ||||||||||||||||||||||||||||||
Capital contribution from Barclays PLC | - | - | - | - | - | - | 114 | 114 | - | 114 | ||||||||||||||||||||||||||||||
Net equity impact of partial BAGL disposal | - | - | - | - | - | - | (349) | (349) | 601 | 252 | ||||||||||||||||||||||||||||||
Net equity impact of Group Service Company disposal | - | - | - | - | - | - | (806) | (806) | - | (806) | ||||||||||||||||||||||||||||||
Other reserve movements | 7 | - | - | - | - | (1) | 1 | 7 | 3 | 10 | ||||||||||||||||||||||||||||||
Balance at 31st December 2016 | 14,462 | 6,486 | (22) | 954 | 3,054 | 309 | 42,190 | 67,433 | 3,522 | 70,955 | ||||||||||||||||||||||||||||||
Balance at 1 January 2015 | 14,472 | 4,350 | 578 | 1,817 | (582) | 509 | 42,650 | 63,794 | 2,251 | 66,045 | ||||||||||||||||||||||||||||||
Continuing Operations | ||||||||||||||||||||||||||||||||||||||||
Profit after tax | - | 345 | - | - | - | - | 264 | 609 | 3 | 612 | ||||||||||||||||||||||||||||||
Currency translation movements | - | - | - | - | 748 | - | - | 748 | - | 748 | ||||||||||||||||||||||||||||||
Available for sale investments | - | - | (230) | - | - | - | - | (230) | - | (230) | ||||||||||||||||||||||||||||||
Cash flow hedges | - | - | - | (1,045) | - | - | - | (1,045) | - | (1,045) | ||||||||||||||||||||||||||||||
Pension remeasurement | - | - | - | - | - | - | 919 | 919 | - | 919 | ||||||||||||||||||||||||||||||
Other | - | - | - | - | - | - | 19 | 19 | - | 19 | ||||||||||||||||||||||||||||||
Other comprehensive income for the period from continuing operations | - | 345 | (230) | (1,045) | 748 | - | 1,202 | 1,020 | 3 | 1,023 | ||||||||||||||||||||||||||||||
Other comprehensive income for the period from discontinued operations | - | - | (10) | (63) | (789) | - | 299 | (563) | (157) | (720) | ||||||||||||||||||||||||||||||
Total comprehensive income for the year | - | 345 | (240) | (1,108) | (41) | - | 1,501 | 457 | (154) | 303 | ||||||||||||||||||||||||||||||
Issue of shares under employees share schemes | - | - | - | - | - | - | 571 | 571 | - | 571 | ||||||||||||||||||||||||||||||
Issue and exchange of equity instruments | - | 1,000 | - | - | - | - | - | 1,000 | - | 1,000 | ||||||||||||||||||||||||||||||
Other equity instruments coupons paid | - | (345) | - | - | - | - | 70 | (275) | - | (275) | ||||||||||||||||||||||||||||||
Vesting of shares under employee share schemes | - | - | - | - | - | - | (755) | (755) | - | (755) | ||||||||||||||||||||||||||||||
Dividends paid | - | - | - | - | - | - | (1,219) | (1,219) | (209) | (1,428) | ||||||||||||||||||||||||||||||
Capital contribution from Barclays PLC | - | - | - | - | - | - | 560 | 560 | - | 560 | ||||||||||||||||||||||||||||||
Other reserve movements | - | - | - | - | - | - | (28) | (28) | 26 | (2) | ||||||||||||||||||||||||||||||
Balance at 31st December 2015 | 14,472 | 5,350 | 338 | 709 | (623) | 509 | 43,350 | 64,105 | 1,914 | 66,019 | ||||||||||||||||||||||||||||||
Balance at 1 January 2014 | 14,494 | 2,078 | 151 | 273 | (1,142) | 485 | 44,670 | 61,009 | 2,211 | 63,220 | ||||||||||||||||||||||||||||||
Continuing Operations | ||||||||||||||||||||||||||||||||||||||||
Profit after tax | - | 250 | - | - | - | - | (55) | 195 | 6 | 201 | ||||||||||||||||||||||||||||||
Currency translation movements | - | - | - | - | 773 | - | - | 773 | 1 | 774 | ||||||||||||||||||||||||||||||
Available for sale investments | - | - | 431 | - | - | - | - | 431 | - | 431 | ||||||||||||||||||||||||||||||
Cash flow hedges | - | - | - | 1,554 | - | - | - | 1,554 | - | 1,554 | ||||||||||||||||||||||||||||||
Pension remeasurement | - | - | - | - | - | - | 205 | 205 | - | 205 | ||||||||||||||||||||||||||||||
Other | - | - | - | - | - | - | (19) | (19) | - | (19) | ||||||||||||||||||||||||||||||
Other comprehensive income for the period from continuing operations | - | 250 | 431 | 1,554 | 773 | - | 131 | 3,139 | 7 | 3,146 | ||||||||||||||||||||||||||||||
Other comprehensive income for the period from discontinued operations | - | - | (4) | (10) | (213) | 333 | 106 | 240 | 346 | |||||||||||||||||||||||||||||||
Total comprehensive income for the year | - | 250 | 427 | 1,544 | 560 | - | 464 | 3,245 | 247 | 3,492 | ||||||||||||||||||||||||||||||
Issue and exchange of equity instruments | (15) | 2,272 | - | - | - | 16 | (1,683) | 590 | - | 590 | ||||||||||||||||||||||||||||||
Other equity instruments coupons paid | - | (250) | - | - | - | - | 54 | (196) | - | (196) | ||||||||||||||||||||||||||||||
Redemption of preference shares | (7) | - | - | - | - | 8 | (792) | (791) | - | (791) | ||||||||||||||||||||||||||||||
Equity settled share schemes | - | - | - | - | - | - | 693 | 693 | - | 693 | ||||||||||||||||||||||||||||||
Vesting of shares under employee share schemes | - | - | - | - | - | - | (866) | (866) | - | (866) | ||||||||||||||||||||||||||||||
Dividends paid | - | - | - | - | - | - | (1,262) | (1,262) | (190) | (1,452) | ||||||||||||||||||||||||||||||
Capital contribution from Barclays PLC | - | - | - | - | - | - | 1,412 | 1,412 | - | 1,412 | ||||||||||||||||||||||||||||||
Other reserve movements | - | - | - | - | - | - | (40) | (40) | (17) | (57) | ||||||||||||||||||||||||||||||
Balance at 31st December 2014 | 14,472 | 4,350 | 578 | 1,817 | (582) | 509 | 42,650 | 63,794 | 2,251 | 66,045 | ||||||||||||||||||||||||||||||
Notes
| a | For further details refer to Note l |
| b | For further details refer to Note m |
| 434 | Barclays PLC and Barclays Bank PLC 2016 Annual Report on Form 20-F |
Barclays Bank PLC data
Consolidated cash flow statement
For the year ended 31 December |
|
2016
£m |
|
|
2015
£m |
|
|
2014
£m |
| |||
Continuing operations | ||||||||||||
Reconciliation of profit before tax to net cash flows from operating activities: | ||||||||||||
Profit before tax | 4,383 | 1,914 | 1,365 | |||||||||
Adjustment fornon-cash items: | ||||||||||||
Allowance for impairment | 2,357 | 1,752 | 1,816 | |||||||||
Depreciation, amortisation and impairment of property, plant, equipment and intangibles | 1,232 | 1,215 | 1,108 | |||||||||
Other provisions, including pensions | 1,726 | 4,243 | 3,487 | |||||||||
Net profit on disposal of investments and property, plant and equipment | (912) | (374) | (620) | |||||||||
Othernon-cash movements including exchange rate movements | 20,780 | (1,189) | (1,486) | |||||||||
Changes in operating assets and liabilities | ||||||||||||
Net (increase)/decrease in loans and advances to banks and customers | (25,439) | 22,705 | 3,933 | |||||||||
Net decrease in reverse repurchase agreements and other similar lending | 14,733 | 103,471 | 54,380 | |||||||||
Net increase/(decrease) in deposits and debt securities in issue | 49,961 | (33,219) | (2,189) | |||||||||
Net (decrease) in repurchase agreements and other similar borrowing | (4,852) | (99,602) | (72,107) | |||||||||
Net (increase)/decrease in derivative financial instruments | (2,351) | (3,309) | 2,954 | |||||||||
Net (increase)/decrease in trading assets | (5,542) | 37,079 | 18,633 | |||||||||
Net increase/(decrease) in trading liabilities | 880 | (10,877) | (8,565) | |||||||||
Net decrease/(increase) in financial investments | 807 | (3,064) | (5,882) | |||||||||
Net (increase) in other assets | (3,731) | (2,680) | (14,642) | |||||||||
Net (increase)/decrease in other liabilities | (452) | (1,772) | 7,360 | |||||||||
Corporate income tax paid | (742) | (1,643) | (1,590) | |||||||||
Net cash from operating activities | 11,278 | 14,650 | (12,045) | |||||||||
Purchase of available for sale investments | (65,086) | (120,061) | (109,290) | |||||||||
Proceeds from sale or redemption of available for sale investments | 102,515 | 114,529 | 119,129 | |||||||||
Purchase of property, plant and equipment and intangibles | (2,054) | (1,928) | (1,690) | |||||||||
Proceeds from sale of property, plant and equipment and intangibles | 234 | 393 | 354 | |||||||||
Proceeds from part disposal of investment in BAGL | 595 | - | - | |||||||||
Other cash flows associated with investing activities | 32 | 516 | (68) | |||||||||
Net cash from investing activities | 36,236 | (6,551) | 8,435 | |||||||||
Dividends paid | (1,186) | (1,428) | (1,452) | |||||||||
Issuance of subordinated debt | 1,457 | 879 | 848 | |||||||||
Redemption of subordinated debt | (1,143) | (556) | (869) | |||||||||
Net redemption of shares and other equity instruments | 1,125 | 655 | (1,100) | |||||||||
Capital contribution from Barclays PLC | 114 | 560 | 1,412 | |||||||||
Repurchase of shares and other equity instruments | (1,378) | - | - | |||||||||
Net cash from financing activities | (1,011) | 110 | (1,161) | |||||||||
Net cash from discontinued operations | 405 | (1,821) | 1,809 | |||||||||
Effect of exchange rates on cash and cash equivalents | 10,468 | 1,689 | (313) | |||||||||
Net increase in cash and cash equivalents | 57,376 | 8,077 | (3,275) | |||||||||
Cash and cash equivalents at beginning of year | 86,556 | 78,479 | 81,754 | |||||||||
Cash and cash equivalents at end of year | 143,932 | 86,556 | 78,479 | |||||||||
Cash and cash equivalents comprise: | ||||||||||||
Cash and balances at central banks | 102,328 | 49,711 | 39,695 | |||||||||
Loans and advances to banks with original maturity less than three months | 38,099 | 35,876 | 36,282 | |||||||||
Available for sale treasury and other eligible bills with original maturity less than three months | 356 | 816 | 2,322 | |||||||||
Trading portfolio assets with original maturity less than three months | - | 153 | 180 | |||||||||
Cash and cash equivalents held for sale | 3,149 | - | - | |||||||||
| 143,932 | 86,556 | 78,479 | ||||||||||
Interest received by The Group was £21,981m (2015: £20,370m; 2014: £21,372m) and interest paid by The Group was £7,812m (2015: £6,992m; 2014: £8,566m).
The Group is required to maintain balances with central banks and other regulatory authorities and these amounted to £4,254m at 31 December2016 (2015: £4,369m; 2014: £4,448m).
For the purposes of the cash flow statement, cash comprises cash on hand and demand deposits, and cash equivalents comprise highly liquid investments that are convertible into cash with an insignificant risk of changes in value with original maturities of three months or less. Repurchase and reverse repurchase agreements are not considered to be part of cash equivalents.
| Barclays PLC and Barclays Bank PLC 2016 Annual Report on Form 20-F | 435 |
Barclays Bank PLC data
Notes to the accounts
a Net interest income
| ||||||||||||
|
2016
£m |
|
|
2015
£m |
|
|
2014
£m |
| ||||
| Cash and balances with central banks | 186 | 157 | 186 | |||||||||
| Financial investments | 740 | 698 | 803 | |||||||||
| Loans and advances to banks | 483 | 481 | 382 | |||||||||
| Loans and advances to customers | 12,957 | 12,512 | 12,768 | |||||||||
Other
|
| 57
|
|
| 99
|
|
| 61
|
| |||
Interest incomea
|
| 14,423
|
|
| 13,947
|
|
| 14,200
|
| |||
| Deposits from banks | (204) | (123) | (138) | |||||||||
| Customer accounts | (1,808) | (1,510) | (2,166) | |||||||||
| Debt securities in issue | (690) | (422) | (684) | |||||||||
| Subordinated liabilities | (988) | (978) | (995) | |||||||||
Other
|
| 724
|
|
| 449
|
|
| (73)
|
| |||
Interest expensea
|
| (2,966)
|
|
| (2,584)
|
|
| (4,056)
|
| |||
Net interest income
|
| 11,457
|
|
| 11,363
|
|
| 10,144
|
| |||
b Net fee and commission income
| ||||||||||||
|
2016
£m |
|
|
2015
£m |
|
|
2014
£m |
| ||||
| Banking, investment management and credit related fees and commissions | 8,507 | 8,365 | 8,483 | |||||||||
Foreign exchange commission
|
| 118
|
|
| 129
|
|
| 139
|
| |||
Fee and commission income
|
| 8,625
|
|
| 8,494
|
|
| 8,622
|
| |||
Fee and commission expense
|
| (1,789)
|
|
| (1,611)
|
|
| (1,500)
|
| |||
Net fee and commission income
|
| 6,836
|
|
| 6,883
|
|
| 7,122
|
| |||
c Net Trading Income
| ||||||||||||
|
2016
£m |
|
|
2015
£m |
|
|
2014
£m |
| ||||
| Trading income | 2,830 | 3,000 | 3,030 | |||||||||
Own credit gains/(losses)
|
| (35)
|
|
| 430
|
|
| 34
|
| |||
Net trading income
|
| 2,795
|
|
| 3,430
|
|
| 3,064
|
| |||
Note
| a | Both interest income and interest expenses for 2015 and 2014 have been adjusted by £442m and £605m respectively, in order to better align the effect of hedge accounting relationships with the related hedged items. The following categories were restated: financial investments by £(545)m (2014: £(637)m), loans and advances to customers by £987m (2014: £1,242m), customer accounts by £(1,783m) (2014: £(2,016)m), debt securities in issues by £784m (2014: £859m) and subordinated liabilities by £557m (2014: £552m). |
| 436 | Barclays PLC and Barclays Bank PLC 2016 Annual Report on Form 20-F |
Barclays Bank PLC data
Notes to the accounts
d Net investment income
| ||||||||||||
|
| 2016
£m |
|
| 2015
£m |
|
| 2014
£m |
| ||||
| Net gain from disposal of available for sale assets | 912 | 385 | 622 | |||||||||
| Dividend income | 8 | 8 | 9 | |||||||||
| Net gain from financial instruments designated at fair value | 158 | 193 | 203 | |||||||||
Other investment income
|
| 246
|
|
| 511
|
|
| 475
|
| |||
Net investment income
|
| 1,324
|
|
| 1,097
|
|
| 1,309
|
| |||
e Administrative and general expenses
| ||||||||||||
|
| 2016
£m |
|
| 2015
£m |
|
| 2014
£m |
| ||||
| Infrastructure costs | ||||||||||||
| Property and equipment | 1,147 | 1,082 | 1,281 | |||||||||
| Depreciation of property, plant and equipment | 482 | 475 | 495 | |||||||||
| Operating lease rentals | 550 | 411 | 512 | |||||||||
| Amortisation of intangible assets | 661 | 570 | 454 | |||||||||
| Impairment of property, equipment and intangible assets | 97 | 150 | 153 | |||||||||
Gain on property disposals
|
| -
|
|
| 3
|
|
| -
|
| |||
Total infrastructure costs
|
| 2,937
|
|
| 2,691
|
|
| 2,895
|
| |||
| Administration and general costs | ||||||||||||
| Consultancy, legal and professional fees | 1,079 | 1,078 | 997 | |||||||||
| Subscriptions, publications, stationery and communications | 638 | 678 | 756 | |||||||||
| Marketing, advertising and sponsorship | 430 | 451 | 470 | |||||||||
| Travel and accommodation | 132 | 188 | 185 | |||||||||
| UK bank levy | 410 | 425 | 418 | |||||||||
| Goodwill Impairment | - | 102 | - | |||||||||
Other administration and general expenses
|
| 511
|
|
| 61
|
|
| 237
|
| |||
Total administration and general costs
|
| 3,200
|
|
| 2,983
|
|
| 3,063
|
| |||
| Staff costsa | 9,211 | 8,853 | 9,860 | |||||||||
| Provision for UK customer redress | 1,000 | 2,772 | 1,110 | |||||||||
Provision for ongoing investigations and litigation including Foreign Exchange
|
| -
|
|
| 1,237
|
|
| 1,250
|
| |||
Operating expensesb
|
| 16,348
|
|
| 18,536
|
|
| 18,178
|
| |||
| a | The Group has realigned outsourcing costs from administration and general expenses to staff costs in order to more appropriately reflect the nature and internal management of these costs. The net effect of these movements is to reduce administration and general expenses and to increase staff costs to £1,063m in 2016 and £1,014m in 2015. |
| b | Total operating expenses of £16,348m (2015: £18,536m; 2014: £18,178m) include depreciation of property, plant and equipment of £482m (2015: £475m; 2014: £495m), amortisation of intangible assets of £661m (2015: £570m; 2014: £454m),goodwill impairment nil( 2015 : £102m; 2014 : nil) and administration and other expenses of £15,205m (2015 £17,389m; 2014: £17,229m). |
| Barclays PLC and Barclays Bank PLC 2016 Annual Report on Form 20-F | 437 |
Barclays Bank PLC data
Notes to the accounts
f Tax
|
| 2016
£m |
|
| 2015
£m |
|
| 2014
£m |
| ||||
Current tax charge/(credit) | ||||||||||||
Current year | 1,147 | 1,772 | 1,158 | |||||||||
Adjustment for prior years
|
| (359)
|
|
| (188)
|
|
| (19)
|
| |||
|
788
|
|
| 1,584
|
|
| 1,139
|
| ||||
Deferred tax charge/(credit) | ||||||||||||
Current year | 392 | (360) | 92 | |||||||||
Adjustment for prior years
|
| 65
|
|
| 78
|
|
| (66)
|
| |||
|
457
|
|
|
(282)
|
|
|
26
|
| ||||
Tax charge
|
| 1,245
|
|
| 1,302
|
|
| 1,165
|
| |||
Tax relating to each component of other comprehensive income can be found in the consolidated statement of comprehensive income which additionally includes within Other a tax credit of £49m (2015: £19m credit) principally relating to share based payments.
The table below shows the reconciliation between the actual tax charge and the tax charge that would result from applying the standard UK corporation tax rate to The Group’s profit before tax. | ||||||
|
| 2016
£m |
|
| 2015
£m |
|
| 2014
£m |
| ||||
Profit before tax from continuing operations
|
| 4,383
|
|
| 1,914
|
|
| 1,366
|
| |||
Tax charge based on the standard UK corporation tax rate of 20% (2015: 20.25%, 2014: 21.50%) | 877 | 387 | 293 | |||||||||
Impact of profits/losses earned in territories with different statutory rates to the UK (weighted average tax rate is 29.5% (2015: 28.1%, 2014: 29.0%)) | 415 | 151 | 103 | |||||||||
Recurring items:
| ||||||||||||
Non-creditable taxes including withholding taxes | 277 | 309 | 329 | |||||||||
Non-deductible expenses | 114 | 67 | 146 | |||||||||
Impact of UK bank levy beingnon-deductible | 82 | 96 | 99 | |||||||||
Banking surcharge on UK profits | 75 | - | - | |||||||||
Other items | 49 | (16) | 75 | |||||||||
Tax adjustments in respect of share based payments | 34 | 30 | 21 | |||||||||
Impact of change in tax rates | 32 | 158 | 9 | |||||||||
Adjustments in respect of prior years | (294) | (110) | (85) | |||||||||
Non-taxable gains and income | (208) | (197) | (212) | |||||||||
Changes in recognition of deferred tax and effect of unrecognised tax losses | (178) | (71) | (115) | |||||||||
Impact of BB PLC’s overseas branches being taxed both locally and in the UK | (128) | (35) | (68) | |||||||||
Non-recurring items: | ||||||||||||
Non-deductible provisions for UK customer redress | 203 | 283 | - | |||||||||
Non-deductible impairments and losses on divestments | 27 | 39 | 234 | |||||||||
Non-deductible provisions for investigations and litigation | 48 | 261 | 387 | |||||||||
Non-taxable gains and income on divestments
|
| (180)
|
|
| (50)
|
|
| (51)
|
| |||
Tax charge | 1,245 | 1,302 | 1,165 | |||||||||
Effective tax rate
|
| 28.4%
|
|
| 68.0%
|
|
| 85.3%
|
| |||
| 438 | Barclays PLC and Barclays Bank PLC 2016 Annual Report on Form 20-F |
Barclays Bank PLC data
Notes to the accounts
Current tax assets and liabilities
Movements on current tax assets and liabilities were as follows:
|
| 2016
£m |
|
| 2015
£m |
| |||
Assets | 385 | 334 | ||||||
Liabilities
|
| (930)
|
|
| (1,023)
|
| ||
As at 1 January | (545) | (689) | ||||||
Income statement from continuing operations | (788) | (1,584) | ||||||
Income statement in relation to BAGL disposal group | - | (301) | ||||||
Other comprehensive income | 295 | 145 | ||||||
Corporate income tax paid | 742 | 1,643 | ||||||
Other movements
|
| 89
|
|
| 241
|
| ||
|
| (207)
|
|
| (545)
|
| |||
Assets
|
| 501
|
|
| 385
|
| ||
Liabilities
|
| (708)
|
|
| (930)
|
| ||
As at 31 December
|
| (207)
|
|
| (545)
|
| ||
| Other movements include the impact of changes in foreign exchange rates, as well as deferred tax amounts relating to acquisitions, disposals and transfers to held for sale. | ||||||||
| Barclays PLC and Barclays Bank PLC 2016 Annual Report on Form 20-F | 439 |
Barclays Bank PLC data
Notes to the accounts
g Trading portfolio assets
| ||||||||
|
2016
£m |
|
|
2015
£m |
| |||
Debt securities and other eligible bills | 38,804 | 45,626 | ||||||
Equity securities | 38,329 | 29,055 | ||||||
Traded loans | 2,975 | 2,474 | ||||||
Commodities
|
| 147
|
|
| 243
|
| ||
Trading portfolio assets
|
| 80,255
|
|
| 77,398
|
| ||
h Financial Investments
| ||||||||
|
| 2016
£m |
|
| 2015
£m |
| |||
Available for sale debt securities and other eligible bills | 57,704 | 89,278 | ||||||
Available for sale equity securities | 485 | 1,206 | ||||||
Held to maturity debt securities
|
| 5,176
|
|
| -
|
| ||
Financial Investments
|
| 63,365
|
|
| 90,304
|
| ||
i Loans and advances to banks and customers
| ||||||||
|
| 2016
£m |
|
| 2015
£m |
| |||
Gross loans and advances to banks | 43,634 | 41,829 | ||||||
Less: allowance for impairment
|
| -
|
|
| -
|
| ||
Loans and advances to banks
|
| 43,634
|
|
| 41,829
|
| ||
Gross loans and advances to customers | 397,403 | 404,138 | ||||||
Less: allowance for impairment
|
| (4,620)
|
|
| (4,921)
|
| ||
Loans and advances to customers
|
| 392,783
|
|
| 399,217
|
| ||
j Derivative financial instruments
| ||||||||||||
|
| Notional
contract
amount
£m |
|
| Fair value
Assets
£m |
|
| Liabilities
£m |
| ||||
Year ended 31 December 2016 | ||||||||||||
Total derivative assets/(liabilities) held for trading | 36,261,030 | 345,834 | (339,647) | |||||||||
Total derivative assets/(liabilities) held for risk management
|
| 261,314
|
|
| 986
|
|
| (840)
|
| |||
Derivative assets/(liabilities)
|
| 36,522,344
|
|
| 346,820
|
|
| (340,487)
|
| |||
Year ended 31 December 2015 | ||||||||||||
Total derivative assets/(liabilities) held for trading | 29,437,102 | 326,933 | (323,788) | |||||||||
Total derivative assets/(liabilities) held for risk management
|
| 316,605
|
|
| 937
|
|
| (464)
|
| |||
Derivative assets/(liabilities)
|
| 29,753,707
|
|
| 327,870
|
|
| (324,252)
|
| |||
| 440 | Barclays PLC and Barclays Bank PLC 2016 Annual Report on Form 20-F |
Barclays Bank PLC data
Notes to the accounts
k Subordinated liabilities
| ||||||||
|
2016
£m |
|
|
2015
£m |
| |||
Undated subordinated liabilities | 4,495 | 5,248 | ||||||
Dated subordinated liabilities
|
| 19,376
|
|
| 16,707
|
| ||
Total subordindated liabilities
|
| 23,871
|
|
| 21,955
|
| ||
l Ordinary shares, share premium, and other equity
Called up share capital, allotted and fully paid
|
| Ordinary
share
capital
£m |
|
| Preference
share
capital
£m |
|
| Share
premium
£m |
|
| Total share
capital and
share
premium
£m |
|
| Other
equity
instruments
£m |
| ||||||
As at 1 January 2016 | 2,342 | 38 | 12,092 | 14,472 | 5,350 | |||||||||||||||
AT1 securities issuance
|
| -
|
|
| -
|
|
| -
|
|
| -
|
|
| 1,136
|
| |||||
Redemptions
|
| -
|
|
| (10)
|
|
| -
|
|
| (10)
|
|
| -
|
| |||||
As at 31 December 2016
|
| 2,342
|
|
| 28
|
|
| 12,092
|
|
| 14,462
|
|
| 6,486
|
| |||||
As at 1 January 2015 | 2,342 | 38 | 12,092 | 14,472 | 4,350 | |||||||||||||||
AT1 securities issuance
|
| -
|
|
| -
|
|
| -
|
|
| -
|
|
| 1,000
|
| |||||
As at 31 December 2015
|
| 2,342
|
|
| 38
|
|
| 12,092
|
|
| 14,472
|
|
| 5,350
|
| |||||
Ordinary shares
The issued ordinary share capital of Barclays Bank PLC, as at 31 December 2016, comprised 2,342 million ordinary shares of £1 each (2015: 2,342 million).
Ordinary share capital constitutes 60% (2015: 60%) of total share capital issued.
Preference shares
The issued preference share capital of Barclays Bank PLC, as at 31 December 2016, comprised 1,000 Sterling Preference Shares of £1 each (2015: 1,000); 31,856 Euro Preference Shares of€ 100 each (2015: 31,856); 20,930 Sterling Preference Shares of £100 each (2015: 20,930); 58,133 US Dollar Preference Shares of $100 each (2015: 58,133); and 161 million US Dollar Preference Shares of $0.25 each (2015: 237 million). In the second quarter of 2016, 46 million US Dollar Preference Shares of $0.25 each were redeemed. In the third quarter of 2016, 30 million US Dollar Preference Shares of $0.25 were redeemed.
Preference share capital constitutes 40% (2015: 40%) of total share capital issued.
Sterling £1 Preference Shares
1,000 Sterling cumulative callable preference shares of £1 each (the £1 Preference Shares) were issued on 31 December 2004 at nil premium.
The £1 Preference Shares entitle the holders thereof to receive Sterling cumulative cash dividends out of distributable profits of Barclays Bank PLC, semi-annually at a rate reset semi-annually equal to the Sterling interbank offered rate forsix-month sterling deposits.
Barclays Bank PLC shall be obliged to pay such dividends if: (1) it has profits available for the purpose of distribution under the Companies Act 2006 as at each dividend payment date; and (2) it is solvent on the relevant dividend payment date, provided that a capital regulations condition is satisfied on such dividend payment date. The dividends shall not be due and payable on the relevant dividend payment date except to the extent that Barclays Bank PLC could make such payment and still be solvent immediately thereafter. Barclays Bank PLC shall be considered solvent on any date if: (1) it is able to pay its debts to senior creditors as they fall due; and (2) its auditors have reported within the previous six months that its assets exceed its liabilities. If Barclays Bank PLC shall not pay, or shall pay only in part, a dividend for a period of seven days or more after the due date for payment, the holders of the £1 Preference Shares may institute proceedings for thewinding-up of Barclays Bank PLC. No remedy against Barclays Bank PLC shall be available to the holder of any £1 Preference Shares for the recovery of amounts owing in respect of £1 Preference Shares other than the institution of proceedings for thewinding-up of Barclays Bank PLC and/or proving in suchwinding-up.
| Barclays PLC and Barclays Bank PLC 2016 Annual Report on Form 20-F | 441 |
Barclays Bank PLC data
Notes to the accounts
On awinding-up or other return of capital (other than a redemption or purchase by Barclays Bank PLC of any of its issued shares, or a reduction of share capital, permitted by the Articles of Barclays Bank PLC and under applicable law), the assets of Barclays Bank PLC available to shareholders shall be applied in priority to any payment to the holders of ordinary shares and any other class of shares in the capital of Barclays Bank PLC then in issue ranking junior to the £1 Preference Shares on such a return of capital and pari passu on such a return of capital with the holders of any other class of shares in the capital of Barclays Bank PLC then in issue (other than any class of shares in the capital of Barclays Bank PLC then in issue ranking in priority to the £1 Preference Shares on awinding-up or other such return of capital), in payment to the holders of the £1 Preference Shares of a sum equal to the aggregate of: (1) an amount equal to the dividends accrued thereon for the then current dividend period (and any accumulated arrears thereof) to the date of the commencement of thewinding-up or other such return of capital; and (2) an amount equal to £1 per £1 Preference Share. After payment of the full amount of the liquidating distributions to which they are entitled, the holders of the £1 Preference Shares will have no right or claim to any of the remaining assets of Barclays Bank PLC and will not be entitled to any further participation in such return of capital.
The £1 Preference Shares are redeemable at the option of Barclays Bank PLC, in whole but not in part only, subject to the Companies Act 2006 and its Articles. Holders of the £1 Preference Shares are not entitled to receive notice of, or to attend, or vote at, any general meeting of Barclays Bank PLC.
Euro Preference Shares
140,000 Euro 4.75%non-cumulative callable preference shares of€ 100 each (the 4.75% Preference Shares) were issued on 15 March 2005 for a consideration of€ 1,383.3m (£966.7m), of which the nominal value was€ 14m and the balance was share premium. The 4.75% Preference Shares entitle the holders thereof to receive Euronon-cumulative cash dividends out of distributable profits of Barclays Bank PLC, annually at a fixed rate of 4.75% per annum on the amount of€ 10,000 per preference share until 15 March 2020, and thereafter quarterly at a rate reset quarterly equal to 0.71% per annum above the Euro interbank offered rate for three-month Euro deposits.
The 4.75% Preference Shares are redeemable at the option of Barclays Bank PLC, in whole but not in part only, on 15 March 2020, and on each dividend payment date thereafter at€ 10,000 per share plus any dividends accrued for the then current dividend period to the date fixed for redemption.
Sterling Preference Shares
75,000 Sterling 6.0%non-cumulative callable preference shares of £100 each (the 6.0% Preference Shares) were issued on 22 June 2005 for a consideration of £743.7m, of which the nominal value was £7.5m and the balance was share premium. The 6.0% Preference Shares entitle the holders thereof to receive Sterlingnon-cumulative cash dividends out of distributable profits of Barclays Bank PLC, annually at a fixed rate of 6.0% per annum on the amount of £10,000 per preference share until 15 December 2017, and thereafter quarterly at a rate reset quarterly equal to 1.42% per annum above the London interbank offered rate for three-month Sterling deposits.
The 6.0% Preference Shares are redeemable at the option of Barclays Bank PLC, in whole but not in part only, on 15 December 2017, and on each dividend payment date thereafter at £10,000 per share plus any dividends accrued for the then current dividend period to the date fixed for redemption.
US Dollar Preference Shares
100,000 US Dollar 6.278%non-cumulative callable preference shares of $100 each (the 6.278% Preference Shares), represented by 100,000 American Depositary Shares, Series 1, were issued on 8 June 2005 for a consideration of $995.4m (£548.1m), of which the nominal value was $10m and the balance was share premium. The 6.278% Preference Shares entitle the holders thereof to receive US Dollarnon-cumulative cash dividends out of distributable profits of Barclays Bank PLC, semi-annually at a fixed rate of 6.278% per annum on the amount of $10,000 per preference share until 15 December 2034, and thereafter quarterly at a rate reset quarterly equal to 1.55% per annum above the London interbank offered rate for three-month US Dollar deposits.
The 6.278% Preference Shares are redeemable at the option of Barclays Bank PLC, in whole but not in part only, on 15 December 2034, and on each dividend payment date thereafter at $10,000 per share plus any dividends accrued for the then current dividend period to the date fixed for redemption.
55 million US Dollar 7.1%non-cumulative callable preference shares of $0.25 each (the 7.1% Preference Shares), represented by 55 million American Depositary Shares, Series 3, were issued on 13 September 2007 for a consideration of $1,335m (£657m), of which the nominal value was $13.75m and the balance was share premium. The 7.1% Preference Shares entitle the holders thereof to receive US Dollarnon-cumulative cash dividends out of distributable profits of Barclays Bank PLC, quarterly at a fixed rate of 7.1% per annum on the amount of $25 per preference share.
| 442 | Barclays PLC and Barclays Bank PLC 2016 Annual Report on Form 20-F |
Barclays Bank PLC data
Notes to the accounts
The 7.1% Preference Shares are redeemable at the option of Barclays Bank PLC, in whole or in part, on any dividend payment date at $25 per share plus any dividends accrued for the then current dividend period to the date fixed for redemption.
106 million US Dollar 8.125%non-cumulative callable preference shares of $0.25 each (the 8.125% Preference Shares), represented by 106 million American Depositary Shares, Series 5, were issued on 11 April 2008 and 25 April 2008 for a total consideration of $2,650m (£1,345m), of which the nominal value was $26.5m and the balance was share premium. The 8.125% Preference Shares entitle the holders thereof to receive US Dollarnon-cumulative cash dividends out of distributable profits of Barclays Bank PLC, quarterly at a fixed rate of 8.125% per annum on the amount of $25 per preference share.
The 8.125% Preference Shares are redeemable at the option of Barclays Bank PLC, in whole or in part, on any dividend payment date at $25 per share plus any dividends accrued for the then current dividend period to the date fixed for redemption.
No redemption or purchase of any 4.75% Preference Shares, the 6.0% Preference Shares, the 6.278% Preference Shares, the 6.625% Preference Shares, the 7.1% Preference Shares, the 7.75% Preference Shares and the 8.125% Preference Shares (together, the Preference Shares) may be made by Barclays Bank PLC without the prior approval of the UK PRA and any such redemption will be subject to the Companies Act 2006 and the Articles of Barclays Bank PLC.
On awinding-up of Barclays Bank PLC or other return of capital (other than a redemption or purchase of shares of Barclays Bank PLC, or a reduction of share capital), a holder of Preference Shares will rank in the application of assets of Barclays Bank PLC available to shareholders: (1) junior to the holder of any shares of Barclays Bank PLC in issue ranking in priority to the Preference Shares; (2) equally in all respects with holders of other preference shares and any other shares of Barclays Bank PLC in issue ranking pari passu with the Preference Shares; and (3) in priority to the holders of ordinary shares and any other shares of Barclays Bank PLC in issue ranking junior to the Preference Shares.
The holders of the £13m 6% Callable Perpetual Core Tier One Notes and the $569m 6.86% Callable Perpetual Core Tier One Notes of Barclays Bank PLC (together, the TONs) and the holders of the £35m 5.3304%Step-up Callable Perpetual Reserve Capital Instruments, the $159m 5.926%Step-up Callable Perpetual Reserve Capital Instruments, the £33m 6.3688%Step-up Callable Perpetual Reserve Capital Instruments, the $117m 7.434%Step-up Callable Perpetual Reserve Capital Instruments and the £3,000m 14%Step-up Callable Perpetual Reserve Capital Instruments of Barclays Bank PLC (together, the RCIs) would, for the purposes only of calculating the amounts payable in respect of such securities on awinding-up of Barclays Bank PLC, subject to limited exceptions and to the extent that the TONs and the RCIs are then in issue, rank pari passu with the holders of the most senior class or classes of preference shares then in issue in the capital of Barclays Bank PLC. Accordingly, the holders of the preference shares would rank equally with the holders of such TONs and RCIs on such awinding-up of Barclays Bank PLC (unless one or more classes of shares of Barclays Bank PLC ranking in priority to the preference shares are in issue at the time of suchwinding-up, in which event the holders of such TONs and RCIs would rank equally with the holders of such shares and in priority to the holders of the preference shares).
Subject to such ranking, in such event, holders of the preference shares will be entitled to receive out of assets of Barclays Bank PLC available for distributions to shareholders, liquidating distributions in the amount of€ 10,000 per 4.75% Preference Share, £10,000 per 6.0% Preference Share, $10,000 per 6.278% Preference Share, $25 per 6.625% Preference Share, $25 per 7.1% Preference Share, $25 per 7.75% Preference Share and $0.25 per 8.125% Preference Share, plus, in each case, an amount equal to the accrued dividend for the then current dividend period to the date of the commencement of thewinding-up or other such return of capital. If a dividend is not paid in full on any preference shares on any dividend payment date, then a dividend restriction shall apply.
This dividend restriction will mean that neither Barclays Bank PLC nor Barclays PLC may (a) declare or pay a dividend (other than payment by Barclays PLC of a final dividend declared by its shareholders prior to the relevant dividend payment date, or a dividend paid by Barclays Bank PLC to Barclays PLC or to a wholly owned subsidiary) on any of their respective ordinary shares, other preference shares or other share capital or (b) redeem, purchase, reduce or otherwise acquire any of their respective share capital, other than shares of Barclays Bank PLC held by Barclays PLC or a wholly owned subsidiary, until the earlier of: (1) the date on which Barclays Bank PLC next declares and pays in full a preference dividend; and (2) the date on or by which all the preference shares are redeemed in full or purchased by Barclays Bank PLC.
Holders of the preference shares are not entitled to receive notice of, or to attend, or vote at, any general meeting of Barclays Bank PLC. Barclays Bank PLC is not permitted to create a class of shares ranking as regards participation in the profits or assets of Barclays Bank PLC in priority to the preference shares, save with the sanction of a special resolution of a separate general meeting of the holders of the preference shares (requiring a majority of not less than three-fourths of the holders of the preference shares voting at the separate general meeting) or with the consent in writing of the holders of three-fourths of the preference shares.
Except as described above, the holders of the preference shares have no right to participate in the surplus assets of Barclays Bank PLC.
| Barclays PLC and Barclays Bank PLC 2016 Annual Report on Form 20-F | 443 |
Barclays Bank PLC data
Notes to the accounts
Other equity instruments
Other equity instruments of £6,486m (2015: £5,230m) include AT1 securities issued by Barclays Bank PLC. In 2016, there was one issuance of Fixed Rate Resetting Perpetual Subordinated Contingent Convertible Securities, with a principal amount of £1.1bn.
The AT1 securities are perpetual securities with no fixed maturity and are structured to qualify as AT1 instruments under CRD IV.
Other shareholders’ equity
| ||||||||||||
| The Group | The Bank | |||||||||||
2016
|
| 2015
|
| 2016
|
| 2015
|
| |||||
| £m | £m | £m | £m | |||||||||
| As at 1 January | 485 | 485 | 549 | 549 | ||||||||
| Redemption | (214) | - | (214) | - | ||||||||
| As at 31 December | 271 | 485 | 335 | 549 | ||||||||
Included in other shareholders’ equity are capital notes which bear interest at rates fixed periodically in advance, based on London interbank rates. These notes are repayable in each case, at the option of the Bank, in whole on any interest payment date. The Bank is not obliged to make a payment of interest on its capital notes if, in the preceding six months, a dividend has not been declared or paid on any class of shares of Barclays PLC.
Upper Tier 2 Capital instruments were redeemed in full during 2016, resulting in a reduction in other shareholders’ equity of £214m.
Reserves
Currency translation reserve
The currency translation reserve represents the cumulative gains and losses on the retranslation of the Group’s net investment in foreign operations, net of the effects of hedging.
As at 31 December 2016 there was a credit balance of £3,054m (2015: £623m debit) in the currency translation reserve. The increase in the credit balance of £3,677m (2015: £41m debit) principally reflected the strengthening of all major currencies against GBP. The currency translation reserve movement associated withnon-controlling interests was a £801m credit (2015: £435m debit) reflecting the appreciation of ZAR against GBP.
During the year a £94m net gain (2015: £65m net loss) from recycling of the currency translation reserve was recognised in the income statement.
Available for sale reserve
The available for sale reserve represents the unrealised change in the fair value of available for sale investments since initial recognition.
As at 31 December 2016 there was a debit balance of £22m in the available for sale reserve (2015: £338m credit). The decrease of £360m (2015: £240m decrease) primarily due to £2,223m gain from changes in fair value on Government Bonds, predominantly held in the liquidity pool, £1,677m of losses from related hedging, £912m of net gains transferred to net profit, mainly due to £615m gain on disposal of Barclays’ share of Visa Europe Limited. A tax charge of £28m was recognised in the period relating to these items.
Cash flow hedging reserve
The cash flow hedging reserve represents the cumulative gains and losses on effective cash flow hedging instruments that will be recycled to the income statement when the hedged transactions affect profit or loss.
As at 31 December 2016 there was a credit balance of £954m (2015: £709m credit) in the cash flow hedging reserve. The increase of £245m (2015: £1,108m decrease) principally reflected a £829m increase in the fair value of interest rate swaps held for hedging purposes as interest rate forward curves decreased, partially offset by £516m gains recycled to the income statement in line with when the hedged item affects profit or loss and a tax credit of £93m.
m Non-controlling interests
|
| Profit attributable to Non-
Controlling interest
|
|
| Equity attributable to Non-
Controlling interest
|
|
| Dividends paid to Non-
Controlling interest
|
| ||||||||||||||||
|
| 2016
|
|
| 2015
|
|
| 2016
|
|
| 2015
|
|
| 2016
|
|
| 2015
|
| |||||||
| £m | £m | £m | £m | £m | £m | |||||||||||||||||||
| Barclays Africa Group Limited | 402 | 324 | 3,507 | 1,902 | 235 | 209 | ||||||||||||||||||
| Othernon-controlling interests | 3 | 3 | 15 | 12 | - | - | ||||||||||||||||||
Total | 405 | 327 | 3,522 | 1,914 | 235 | 209 | ||||||||||||||||||
Barclays Bank PLC owns 50.2% (2015: 62.5%) of Barclays Africa Group Limited.
| 444 | Barclays PLC and Barclays Bank PLC 2016 Annual Report on Form 20-F |
Barclays Bank PLC data
Notes to the accounts
n Dividends on ordinary shares
Ordinary dividends were paid to enable Barclays PLC to fund its dividend to shareholders.
The 2016 financial statements include £638m (2015: £876m) of dividends paid. This includes the final dividend declared in relation to the prior year of £502m (2015: £476m) and interim dividends of £119m (2015: £400m), resulting in interim dividends of 5p (2015: 17p) per ordinary share and a total dividend for the year of 27p (2015: 37p) per ordinary share paid during the year. There was a £18m dividend in specie paid to Barclays PLC in respect of the distribution of Group Service Company to Barclays Bank PLC.
Dividends paid on the 4.75%€100 preference shares amounted to £370.20 per share (2015: £339.67). Dividends paid on the 6.0% £100 preference shares amounted to £600.00 per share (2015: £600.00). Dividends paid on the 6.278% US$100 preference shares amounted to £467.05 per share (2015: £410.28). Dividends paid on the 6.625% US$0.25 preference shares amounted to £1.19 per share (2015: £1.09). Dividends paid on the 7.1% US$0.25 preference shares amounted to £1.30 per share (2015: £1.17). Dividends paid on the 7.75% US$0.25 preference shares amounted to £1.35 per share (2015: £1.28). Dividends paid on the 8.125% US$0.25 preference shares amounted to £1.49 per share (2015: £1.34).
Dividends paid on preference shares amounted to £339m (2015: £343m). Dividends paid on other equity instruments amounted to £462m (2015: £346m).
o Capital
The Barclays Bank PLC Group’s policies and objectives for managing capital are the same as those for the Barclays PLC Group, disclosed on page 388.
The table below provides details of the Barclays Bank PLC Group at 31 December 2016.
| Regulatory capital | 2016 | |||
|
£m |
| ||
| Fully loaded Common Equity Tier 1 | 46,450 | |||
| PRA Transitional Tier 1 | 58,652 | |||
| PRA Transitional Total Capital Resources | 74,871 |
| Barclays PLC and Barclays Bank PLC 2016 Annual Report on Form 20-F | 445 |
Barclays Bank PLC data
Notes to the accounts
p Segmental reporting
Segmental reporting by Barclays Bank PLC is the same as that presented in the Barclays PLC financial statements, except for:
– the difference in profit before tax of £1.2bn (2015: £0.8bn) between Barclays PLC and Barclays Bank PLC is included in Head Office; and
– the difference in total assets of £0.9bn (2015: £0.8bn) is mainly due to loan notes issued by Barclays Bank PLC to fund the derivatives in Barclays PLC.
q Related Parties
The aggregate emoluments of all Directors and Officers of Barclays Bank PLC who held office during the year (2016: 33 persons, 2015: 33 persons, 2014: 34 persons) for the year ended 31st December 2016 amounted to £71.3m (2015: £52.5m, 2014: £57.0m). In addition, the aggregate amount set aside by the Bank and its subsidiaries for the year ended 31st December 2016, to provide pension benefits for the Directors and Officers amounted to £0.2m (2015: £0.3m 2014: £0.3m).
| 446 | Barclays PLC and Barclays Bank PLC 2016 Annual Report on Form 20-F |
Additional Financial data
Additional financial disclosure (unaudited)
Selected financial statistics |
| 2016
|
|
| 2015
|
|
| 2014
|
|
| 2013
|
|
| 2012
|
| |||||
| % | % | % | % | % | ||||||||||||||||
Return on average shareholders’ equitya | 4.5 | 0.9 | 0.1 | 1.7 | (0.5) | |||||||||||||||
Return on average total assetsb | 0.2 | - | - | 0.1 | - | |||||||||||||||
Average shareholders’ equity as a percentage of average total assets | 5.1 | 4.9 | 4.6 | 3.9 | 3.8 | |||||||||||||||
|
| 2016
|
|
| 2015
|
|
| 2014
|
|
| 2013
|
|
| 2012
|
| ||||||
Selected income statement data | £m | £m | £m | £m | £m | |||||||||||||||
Continuing operations | ||||||||||||||||||||
Interest income | 14,423 | 13,947 | 14,200 | 14,361 | 14,772 | |||||||||||||||
Interest expense | (2,966) | (2,584) | (4,056) | (4,851) | (5,334) | |||||||||||||||
Non-interest income | 11,012 | 11,445 | 11,665 | 14,553 | 11,251 | |||||||||||||||
Operating expenses | (16,348) | (18,536) | (18,178) | (19,534) | (18,474) | |||||||||||||||
Impairment charges | (2,373) | (1,762) | (1,821) | (2,601) | (2,659) | |||||||||||||||
Share of post-tax results of associates and joint ventures | 70 | 41 | 28 | (65) | 92 | |||||||||||||||
Profit on disposal of subsidiaries, associates and joint ventures | 565 | (637) | (473) | 6 | 28 | |||||||||||||||
Gain on acquisitions | - | - | - | 26 | 2 | |||||||||||||||
Profit before tax | 4,383 | 1,914 | 1,365 | 1,896 | (322) | |||||||||||||||
Profit attributable to equity holders of the parent | 2,867 | 566 | 85 | 963 | (306) | |||||||||||||||
|
| 2016
|
|
| 2015
|
|
| 2014
|
|
| 2013
|
|
| 2012
|
| ||||||
Selected balance sheet data | £m | £m | £m | £m | £m | |||||||||||||||
Total shareholders’ equity | 60,947 | 64,105 | 59,444 | 58,931 | 57,067 | |||||||||||||||
Subordinated liabilities | 23,871 | 21,955 | 21,685 | 22,249 | 24,422 | |||||||||||||||
Deposits from banks, customer accounts and debt securities in issue | 548,286 | 534,537 | 572,357 | 574,340 | 587,787 | |||||||||||||||
Loans and advances to banks and customers | 436,417 | 441,046 | 470,424 | 474,059 | 472,809 | |||||||||||||||
Total assets | 1,213,955 | 1,120,727 | 1,358,693 | 1,344,201 | 1,512,777 | |||||||||||||||
Notes
| a | Return on average shareholders’ equity represents profit attributable to the equity holders of the parent as a percentage of average shareholders’ equity. |
| b | Return on average total assets represents profit attributable to the equity holders of the parent as a percentage of average total assets. |
| Barclays PLC and Barclays Bank PLC 2016 Annual Report on Form 20-F | 447 |
Additional Financial data
Additional financial disclosure (unaudited)
Ratio of earnings to fixed charges – Barclays Bank Plc
|
|
2016
|
|
|
2015
|
|
|
2014
|
|
|
2013
|
|
|
2012
|
| |||||
|
(In £m except for ratios)
|
| ||||||||||||||||||
| Ratio of earnings to fixed charges | ||||||||||||||||||||
| Fixed charges | ||||||||||||||||||||
| Interest expense | 2,966 | 2,584 | 4,056 | 4,851 | 5,334 | |||||||||||||||
| Rental expense | 204 | 157 | 207 | 219 | 216 | |||||||||||||||
| Total fixed charges | 3,170 | 2,741 | 4,263 | 5,070 | 5,550 | |||||||||||||||
| Earnings | ||||||||||||||||||||
| Income before taxes and non-controlling interests | 4,383 | 1,914 | 1,365 | 1,896 | 322 | |||||||||||||||
| Less: unremitted pre-tax income of associated companies and joint ventures | (53) | (26) | (34) | 102 | (94) | |||||||||||||||
| Total earnings excluding fixed charges | 4,330 | 1,888 | 1,331 | 1,998 | (416) | |||||||||||||||
| Fixed charges | 3,170 | 2,741 | 4,263 | 5,070 | 5,550 | |||||||||||||||
| Total earnings including fixed charges | 7,500 | 4,629 | 5,594 | 7,068 | 5,134 | |||||||||||||||
Ratio of earnings to fixed charges
|
|
2.37
|
|
|
1.69
|
|
|
1.31
|
|
|
1.39
|
|
|
0.93
|
| |||||
Ratio of earnings to fixed charges and preference shares – Barclays Bank Plc
|
| 2016
|
|
| 2015
|
|
| 2014
|
|
| 2013
|
|
| 2012
|
| |||||
|
(In £m except for ratios)
|
| ||||||||||||||||||
| Combined fixed charges, preference share dividends and similar appropriations | ||||||||||||||||||||
| Interest expense | 2,966 | 2,584 | 4,056 | 4,851 | 5,334 | |||||||||||||||
| Rental expense | 204 | 157 | 207 | 219 | 216 | |||||||||||||||
| Fixed charges | 3,170 | 2,741 | 4,263 | 5,070 | 5,550 | |||||||||||||||
| Preference share dividends and similar appropriations | 343 | 345 | 443 | 412 | 466 | |||||||||||||||
| Total fixed charges | 3,513 | 3,086 | 4,706 | 5,482 | 6,016 | |||||||||||||||
| Earnings | ||||||||||||||||||||
| Income before taxes and non-controlling interests | 4,383 | 1,914 | 1,365 | 1,896 | 322 | |||||||||||||||
| Less: unremitted pre-tax income of associated companies and joint ventures | (53) | (26) | (34) | 102 | (94) | |||||||||||||||
| Total earnings excluding fixed charges | 4,330 | 1,888 | 1,331 | 1,998 | 416 | |||||||||||||||
| Fixed charges | 3,513 | 3,086 | 4,706 | 5,482 | 6,016 | |||||||||||||||
| Total earnings including fixed charges | 7,843 | 4,974 | 6,037 | 7,480 | 5,600 | |||||||||||||||
| Ratio of earnings to fixed charges, preference share dividends and similarappropriations | 2.23 | 1.61 | 1.28 | 1.36 | 0.93 | |||||||||||||||
| 448 | Barclays PLC and Barclays Bank PLC 2016 Annual Report on Form 20-F |
Glossary
Glossary of terms
‘A-IRB’ / ‘Advanced-Internal Ratings Based’ See ‘Internal Ratings Based (IRB)’.
‘ABS CDO Super Senior’Super senior tranches of debt linked to collateralised debt obligations of asset backed securities (defined below). Payment of super senior tranches takes priority over other obligations.
‘Acceptances and endorsements’ An acceptance is an undertaking by a bank to pay a bill of exchange drawn on a customer. The Group expects most acceptances to be presented, but reimbursement by the customer is normally immediate. Endorsements are residual liabilities of the Group in respect of bills of exchange which have been paid and subsequently rediscounted.
‘Additional Tier 1 (AT1) capital’ In the context of CRD IV, a type of capital as defined in the Capital Requirements Regulation (CRR).
‘Additional Tier 1 (AT1) securities’Securities that are treated as additional tier 1 (AT1) capital in the context of CRD IV.
‘Advanced Measurement Approach’ Under CRD IV, operational risk charges can be calculated by using one of three methods (or approaches) that increase in sophistication and risk sensitivity: (i) the Basic Indicator Approach; (ii) the Standardised Approach; and (iii) the Advanced Measurement Approach (AMA). Under the AMA the banks are allowed to develop their own empirical model to quantify required capital for operational risk. Banks can only use this approach subject to approval from their local regulators.
‘Africa Banking’ The previously reported Africa Retail and Business Banking combined with other businesses across Africa (excluding the Egypt and Zimbabwe businesses transferred to BarclaysNon-Core). The Africa head office function is also included in Barclays Africa. This combined Barclays Africa business is managed under three primary businesses: Retail and Business Banking; Wealth, Investment Management and Insurance; and Corporate and Investment Banking. The resulting Barclays Africa business comprises the Barclays Africa Group Limited (‘BAGL’ or ‘Barclays Africa’) listed entity.
‘Agencies’Bonds issued by state and / or government agencies or government-sponsored entities.
‘Agency Mortgage-Backed Securities’ Mortgage-Backed Securities issued by government-sponsored institutions.
‘All price risk (APR)’ An estimate of all the material market risks, including rating migration and default for the correlation trading portfolio.
‘American Depository Receipts (ADR)’ A negotiable certificate that represents the ownership of shares in anon-US company (for example Barclays) trading in US financial markets.
‘Americas’ Geographic segment comprising the USA, Canada and countries where Barclays operates within Latin America.
‘Annual Earnings at Risk (AEaR)’Impact on earnings of a parallel (upward or downward) movement in interest rates.
‘Application scorecards’ Algorithm based decision tools used to aid business decisions and manage credit risk based on available customer data at the point of application for a product.
‘Arrears’Customers are said to be in arrears when they are behind in fulfilling their obligations with the result that an outstanding loan is unpaid or overdue. Such customers are also said to be in a state of delinquency. When a customer is in arrears, their entire outstanding balance is said to be delinquent, meaning that delinquent balances are the total outstanding loans on which payments are overdue.
‘Arrears Managed Accounts’ Arrears Managed Accounts are principally Business Lending customers in arrears with an exposure limit less than £50,000 in the UK and€ 100,000 in Europe, supervised using processes designed to manage a homogeneous set of assets.
‘Asia’ Geographic segment comprising countries where Barclays operates within Asia (including Singapore, Japan, China and India), Australia and the Middle East.
‘Asset Backed Commercial Paper’ Typically short-term notes secured on specified assets issued by consolidated special purpose entities for funding purposes.
‘Asset Backed Securities (ABS)’ Securities that represent an interest in an underlying pool of referenced assets. The referenced pool can comprise any assets which attract a set of associated cash flows but are commonly pools of residential or commercial mortgages and, in the case of Collateralised Debt Obligations (CDOs), the referenced pool may be ABS or other classes of assets.
‘Attributable profit’ Profit after tax that is attributable to ordinary equity holders of Barclays PLC adjusted for the after tax amounts of capital securities classified as equity.
‘Average allocated tangible shareholders equity’ Calculated as the average of the monthlyperiod-end allocated tangible equity during the period.
‘Average leverage ratio’ As per the updated PRA rulebook, is calculated as the average capital measure divided by the average exposure measure for the quarter, where the average is based on the capital and exposure measure on the last day of each month in the quarter.
‘Average shareholders equity’ Calculated as the average of monthly period end shareholders’ equity excludingnon-controlling interests.
‘Average tangible shareholders equity’ Calculated as the average of monthly period end shareholders’ equity excludingnon-controlling interests adjusted for the deduction of intangible assets and goodwill.
‘Back testing’Includes a number of techniques that assess the continued statistical validity of a model by simulating how the model would have predicted recent experience.
‘Balance weighted Loan to Value (LTV) ratio’ In the context of the credit risk disclosures on secured home loans, a means of calculating marked to market LTVs derived by calculating individual LTVs at account level and weighting it by the balances to arrive at the average position. Balance weighted loan to value is calculated using the following formula: LTV = ((loan balance 1 x MTM LTV%
| Barclays PLC and Barclays Bank PLC 2016 Annual Report on Form 20-F | 449 |
Glossary
for loan 1) + (loan balance 2 x MTM LTV% for loan 2) + ... ) / total outstandings in portfolio.
‘The Bank’ Barclays Bank PLC.
‘Barclaycard’ An international consumer payments company serving the needs of businesses and consumers through credit cards, consumer lending, merchant acquiring, commercial cards and point of sale finance. Barclaycard has scaled operations in UK, US, Germany and Scandinavia.
‘Barclays Core’ Barclays Core includes Barclays UK, Barclays International and Head Office. See also ‘Barclays Non-Core’
‘Barclays Core Operating businesses’The core Barclays businesses operated by Barclays UK (which include the UK Personal business, the small UK Corporate and UK Wealth businesses and the Barclaycard UK consumer credit cards business) and Barclays International (which include the large UK Corporate business; the international Corporate and Wealth businesses; the Investment Bank; the international Barclaycard business; and Barclaycard Business Solutions). See also ‘BarclaysNon-Core’
‘Barclays Direct’ A Barclays brand, comprising the savings and mortgage businesses acquired from ING Direct UK in March 2013.
‘Barclays International’ The division of Barclays which will not ultimately be ring-fenced as part of regulatory ring fencing requirements. The division includes the large UK Corporate business; the international Corporate and Wealth businesses; the Investment Bank; the international Barclaycard business (consisting of the US, German and Nordic consumer credit cards businesses); and Barclaycard Business Solutions (including merchant acquiring).
‘BarclaysNon-Core’ This unit groups together businesses and assets that are not strategically attractive to Barclays and that will be exited, or run down. See also ‘Barclays Core’
‘Barclays UK’ The division of Barclays which will be ring-fenced as part of regulatory ring fencing requirements. The division includes the UK Personal business; the small UK Corporate and UK Wealth businesses; and the Barclaycard UK consumer credit cards business
‘Basel 3’The third of the Basel Accords on banking supervision. Developed in response to the financial crisis of 2008, setting new requirements on composition of capital, counterparty credit risk, liquidity and leverage ratios.
‘Basel Committee of Banking Supervisors (BCBS or The Basel Committee)’ A forum for regular cooperation on banking supervisory matters which develops global supervisory standards for the banking industry. Its members are officials
from central banks or prudential supervisors from 27 countries and territories.
‘Basis point(s)’ / ‘bp(s)’ One hundredth of a per cent (0.01%); 100 basis points is 1%. The measure is used in quoting movements in interest rates, yields on securities and for other purposes.
‘Basis risk’ Measures the impact of changes in tenor basis (e.g., the basis between swaps vs. 3 month (3M) Libor and swaps vs. 6 month (6M) Libor) and cross currency basis.
‘Behavioural scorecards’ Algorithm based decision tools used to aid business decisions and manage credit risk based on existing customer data derived from account usage.
‘Book quality’ In the context of the Funding Risk, Capital Risk section, changes in RWAs caused by factors such as underlying customer behaviour or demographics leading to changes in risk profile.
‘Book size’ In the context of the Funding Risk, Capital Risk section, changes in RWAs driven by business activity, including net originations or repayments.
‘Businesses’ In the context ofNon-Core Analysis of Total income, Barclays Non Core businesses comprise ongoing businesses seeking to besold-off or run down including Europe retail andnon-core elements of the Investment Bank and other non strategic businesses.
‘Business Lending’ Business Lending in Barclays UK that primarily relates to small and medium enterprises typically with exposures up to £3m or with a turnover up to £5m.
‘Business scenario stresses’ Multi asset scenario analysis of extreme, but plausible events that may impact the market risk exposures of the Investment Bank.
‘Buy to let mortgage’ A mortgage where the intention of the customer (investor) was to let the property at origination.
‘Capital Conservation Buffer (CCB)’ Common Equity Tier 1 capital required to be held under CRD IV to ensure that banks build up surplus capital outside periods of stress which can be drawn down if losses are incurred.
‘Capital deduction approach’ An approach available to institutions when calculating risk-weighted assets for securitisation exposures. It is the same as a deduction from capital where most punitive risk weight of 1250% is applied (assuming 8% Capital Adequacy ratio).
‘Capital ratios’ Key financial ratios measuring the Group’s capital adequacy or financial strength. These include the CET1 ratio, Tier 1 capital ratio and Total capital ratio.
‘Capital requirements’ Amount to be held by the Group to cover the risk of losses to a certain confidence level.
‘Capital Requirements Regulation (CRR)’ Regulation (EU) No 575/2013, which accompanies CRD IV and sets out detailed rules for capital eligibility, the calculation of RWAs, the measurement of leverage, the management of large exposures and minimum standards for liquidity.
‘Capital requirements on the underlying exposures (KIRB)’ An approach available to banks when calculating risk weighted assets (RWA) for securitisation exposures. This is based upon the RWA amounts that would be calculated under the IRB approach for the
| 450 | Barclays PLC and Barclays Bank PLC 2016 Annual Report on Form 20-F |
Glossary
underlying pool of securitised exposures in the program, had such exposures not been securitised.
‘Capital resources’ Financial instruments on balance sheet that are eligible to satisfy capital requirements.
‘Central Counterparty’ / ‘Central Clearing Counterparties (CCPs)’ A clearing house mediating between the buyer and the seller in a financial transaction, such as a derivative contract or repurchase agreement (repo). Where a central counterparty is used, a singlebi-lateral contract between the buyer and seller is replaced with two contracts, one between the buyer and the CCP and one between the CCP and the seller. The use of CCPs allows for greater oversight and improved credit risk mitigation inover-the-counter (OTC) markets.
‘Charge-off’ In the retail segment this refers to the point in time when collections activity changes from the collection of arrears to the recovery of the full balance. This is normally when six payments are in arrears.
‘Chargesadd-on and non VaR’ In the context of Risk Weighted Assets, any additional Market Risk not captured within Modelled VaR, including Incremental Risk Charges and Correlation Risk.
‘Client Assets’ Assets managed or administered by Barclays on behalf of clients including assets under management (AUM), custody assets, assets under administration and client deposits.
‘CLOs and Other insured assets’ Highly rated CLO positions wrapped by monolines,non-CLOs wrapped by monolines and other assets wrapped with Credit Support Annex (CSA) protection.
‘Collateralised Debt Obligation (CDO)’ Securities issued by a third party which reference Asset Backed Securities (ABSs) (defined above) and/or certain other related assets purchased by the issuer. CDOs may feature exposure tosub-prime mortgage assets through the underlying assets.
‘Collateralised Loan Obligation (CLO)’ A security backed by the repayments from a pool of commercial loans. The payments may be made to different classes of owners (in tranches).
‘Collateralised Mortgage Obligation (CMO)’ A type of security backed by mortgages. A special purpose entity receives income from the mortgages and passes them on to investors of the security.
‘Collectively assessed impairment allowances’ Impairment of financial assets is measured collectively where a portfolio comprises homogenous assets and where appropriate statistical techniques are available.
‘Combined Buffer Requirement’ In the context of the CRD IV capital obligations, the combined requirements of the Capital Conservation Buffer, the GSII Buffer, the OSII buffer, the Systemic Risk bubber and an institution specific counter-cyclical buffer.
‘Commercial paper (CP)’ Short-term notes issued by entities, including banks, for funding purposes.
‘Commercial real estate’ Commercial real estate includes office buildings, industrial property, medical centres, hotels, retail stores, shopping centres, farm land, multifamily housing buildings, warehouses, garages, and industrial properties and other similar
properties. Commercial real estate loans are loans backed by a package of commercial real estate. Note: for the purposes of the Credit Risk section, the UK CRE portfolio includes property investment, development, trading and housebuilders but excludes social housing contractors.
‘Committee of Sponsoring Organisations of the Treadway Commission Framework (COSO)’ A joint initiative of five private sector organisations dedicated to providing development of frameworks and guidance on enterprise risk management, internal control and fraud deterrence.
‘Commodity derivatives’ Exchange traded andover-the-counter (OTC) derivatives based on an underlying commodity (e.g. metals, precious metals, oil and oil related, power and natural gas).
‘Commodity risk’ Measures the impact of changes in commodity prices and volatilities, including the basis between related commodities (e.g. Brent vs. WTI crude prices).
‘Common Equity Tier 1 (CET1) capital’ In the context of CRD IV, a type of capital as defined by the Capital Requirements Regulation, predominantly consisting of common equity.
‘Common Equity Tier 1 (CET1) ratio’ A measure of the Group’s Common Equity Tier 1 capital as a percentage of Risk Weighted Assets under CRD IV. The Group must meet a prescribed ratio.
‘Compensation: income ratio’ The ratio of compensation expense over total income. Compensation represents total staff costs lessnon-compensation items consisting of outsourcing, bank payroll tax, staff training, redundancy costs and retirement costs.
‘Comprehensive Risk Measure (CRM)’ An estimate of all the material market risks, including rating migration and default for the correlation trading portfolio. Also referred to as All Price Risk (APR) and Comprehensive Risk Capital Charge (CRCC).
‘Constant Currency Basis’ Excluding the impact of foreign currency conversion to GBP when comparing financial results in two different financial periods.
‘Contingent capital notes (CCNs)’ Interest bearing debt securities issued by Barclays PLC or its subsidiaries that are either permanently written off or converted into an equity instrument from the issuer’s perspective in the event of the
Group’s core tier 1 (CT1) or Common Equity Tier 1 (CET1) ratio, as appropriate, falling below a specified level.
‘Core deposit intangibles’ Premium paid to acquire the deposit base of an institution.
‘Correlation risk’ Refers to the change in marked to market value of a security when the correlation between the underlying assets changes over time.
‘Corporate and Investment Banking (CIB)’ Barclays Corporate and Investment Banking businesses which form part of Barclays International.
‘Cost: income ratio’ Total operating expenses divided by total income.
| Barclays PLC and Barclays Bank PLC 2016 Annual Report on Form 20-F | 451 |
Glossary
‘Cost of Equity’ The rate of return targeted by the equity holders of a company.
‘Cost: net operating income ratio’ Operating expenses compared to total income less credit impairment charges and other provisions.
‘Cost to Achieve (CTA)’Non-recurring investment in initiatives to drive cost and business efficiency across Barclays through rightsizing, industrialisation and innovation.
‘Cost to income jaws’Relationship of the percentage change movement in total operating expenses relative to total income.
‘Counter-Cyclical Capital Buffer (CCCB)’ CET1 Capital that is required to be held under CRD IV rules to ensure that banks build up surplus capital when macroeconomics conditions indicate areas of the economy are overheating.
‘Counter-Cyclical Capital Buffer (CCyB)’ A macroprudential buffer that applies to all PRA regulated institutions from 2018 and is calculated at 35% of any risk weighted countercyclical capital buffer set by the FPC. The CCLB applies in addition to the minimum of 3% and anyG-SII additional Leverage Ratio Buffer that applies,
‘Counterparty credit risk’ In the context of Risk Weighted Assets, a component of Risk Weighted Assets that represents the risk of loss in derivatives, repurchase agreements and similar transactions resulting from the default of the counterparty.
‘Coverage ratio’In the context of the Credit risk disclosures, impairment allowances as a percentage of Credit Risk Loan balances.
‘Covered bonds’Debt securities backed by a portfolio of mortgages that are segregated from the issuer’s other assets solely for the benefit of the holders of the covered bonds.
‘CRD IV’ The Fourth Capital Requirements Directive, an EU Directive and an accompanying Regulation (CRR) that together prescribe EU capital adequacy and liquidity requirements and implements Basel 3 in the European Union.
‘Credit conversion factor (CCF)’ Factor used to estimate the risk fromoff-balance sheet commitments for the purpose of calculating the total Exposure at Default (EAD) used to calculate Risk Weighted Assets (RWAs).
‘Credit default swaps (CDS)’ A contract under which the protection seller receives premiums or interest-related payments in return for contracting to make payments to the protection buyer in the event of a defined credit event. Credit events normally include bankruptcy, payment default on a reference asset or assets, or downgrades by a rating agency.
‘Credit derivatives (CDs)’ An arrangement whereby the credit risk of an asset (the reference asset) is transferred from the buyer to the seller of the protection.
‘Credit impairment charges’ Also known as ‘credit impairment’. Impairment charges on loans and advances to customers and banks and impairment charges on available for sale assets and reverse repurchase agreements.
‘Credit market exposures’ Assets and other instruments relating to commercial real estate and leveraged finance businesses that have been significantly impacted by the deterioration in the global credit markets. The exposures include positions subject to fair value movements in the Income Statement, positions that are classified as loans and advances and available for sale and other assets.
‘Credit Products’Represents credit products and Securitised Products income.
‘Credit quality step’ In the context of the Standardised Approach to calculating credit risk RWAs, a “credit quality assessment scale” maps the credit assessments of a recognised credit rating agency or export credit agency to credit quality steps that determine the risk weight to be applied to an exposure.
‘Credit Rating’ An evaluation of the creditworthiness of an entity seeking to enter into a credit agreement.
‘Credit risk’ The risk of the Group suffering financial loss if a counterparty fails to fulfil its contractual obligations to the Group under a loan agreement or similar. In the context of Risk Weighted Assets, it is the component of Risk Weighted Assets that represents the risk of loss in loans and advances and similar transactions resulting from the default of the counterparty.
‘Credit Risk Loans (CRLs)’ A loan becomes a credit risk loan when evidence of deterioration has been observed, for example a missed payment or other breach of covenant. A loan may be reported in one of three categories: (i) impaired loans; (ii) accruing past due 90 days or more; and (iii) impaired or restructured loans. These may include loans which, while impaired, are still performing but have associated individual impairment allowances raised against them.
‘Credit risk mitigation’ A range of techniques and strategies to actively mitigate credit risks to which the bank is exposed. These can be broadly divided into three types; collateral, netting andset-off, and risk transfer.
‘Credit spread’ The premium over the benchmark or risk-free rate required by the market to accept a lower credit quality.
‘Credit Valuation Adjustment (CVA)’ The difference between the risk-free value of a portfolio of trades and the market value which takes into account the counterparty’s risk of default. The CVA therefore represents an estimate of the adjustment to fair value that a market participant would make to incorporate the credit risk of the counterparty due to any failure to perform on contractual agreements.
‘CRL Coverage’ Impairment allowances as a percentage of total CRL (See ‘Credit Risk Loans’). Also known as the ‘CRL coverage ratio’.
‘Customer assets’ Represents loans and advances to customers. Average balances are calculated as the sum of all daily balances for the year to date divided by number of days in the year to date.
‘Customer deposits’ In the context of Funding Risk, Liquidity Risk section, money deposited by all individuals and companies that are not credit institutions. Such funds are recorded as liabilities in the Group’s balance sheet under Customer Accounts.
| 452 | Barclays PLC and Barclays Bank PLC 2016 Annual Report on Form 20-F |
Glossary
‘Customer liabilities’ Customer deposits.
‘Customer net interest income’ The sum of customer asset and customer liability net interest income. Customer net interest income reflects interest related to customer assets and liabilities only and does not include any interest on securities or othernon-customer assets and liabilities.
‘CVA volatility charge’ The volatility charge added to exposures that adjusts formid-market valuation on a portfolio of transactions with a counterparty. This is to reflect the current market value of the credit risk associated with the counterparty to the Bank. The charge is prescribed by the CRR.
‘Daily Value at Risk (DVaR)’ An estimate of the potential loss which might arise from market movements under normal market conditions, if the current positions were to be held unchanged for one business day, measured to a specified confidence level.
‘DBRS’ A credit rating agency.
‘Debit Valuation Adjustment (DVA)’ The opposite of Credit Valuation Adjustment (CVA). It is the difference between the risk-free value of a portfolio of trades and the market value which takes into account the Group’s risk of default. The DVA, therefore, represents an estimate of the adjustment to fair value that a market participant would make to incorporate the credit risk of the Group due to any failure to perform on contractual obligations. The DVA decreases the value of a liability to take into account a reduction in the remaining balance that would be settled should the Group default or not perform any contractual obligations.
‘Debtbuy-backs’ Purchases of the Group’s issued debt securities, including equity accounted instruments, leading to theirde-recognition from the balance sheet.
‘Debt securities in issue’ Transferable securities evidencing indebtedness of the Group. These are liabilities of the Group and include certificates of deposit and commercial paper.
‘Default grades’ Barclays classify ranges of default probabilities into a set of 21 intervals called default grades, in order to distinguish differences in the probability of default risk.
‘Default fund contributions’ The amount of contribution made by members of a central counterparty (CCP). All members are required to contribute to this fund in advance of using a CCP. The default fund can be used by the CCP to cover losses incurred by the CCP where losses are greater than the margins provided by that member.
‘Derivatives’ In the context ofNon-Core Analysis of Total income, Derivatives comprise non strategic businesses from thenon-core Investment Bank
‘Derivatives netting’ Adjustments applied across asset and liabilitymark-to-market derivative positions pursuant to legally enforceable bilateral netting agreements and eligible cash collateral received in derivative transactions that meet the requirements of BCBS 270.
‘Diversification effect’ Reflects the fact the risk of a diversified portfolio is smaller than the sum of the risks of its constituent parts. It is measured as the sum of the individual asset class DVaR (see above) estimates less the total DVaR.
‘Dodd-Frank Act (DFA)’ The US Dodd-Frank Wall Street Reform and Consumer Protection Act of 2010.
‘Early warning lists (EWL)’ Categorisations for wholesale customers used to identify at an early stage those customers where it is believed that difficulties may develop, allowing timely corrective action to be taken. There are three categories of EWL, with risk increasing from EWL 1 (caution) to EWL 2 (medium) and EWL 3 (high). It is expected that most cases would be categorised EWL 1 before moving to 2 or 3, but it is recognised that some cases may be categorised to EWL 2 or 3 directly.
‘Early Warning List (EWL) Managed accounts’ EWL Managed accounts are Business Lending customers that exceed the Arrears Managed Accounts limits and are monitored with standard processes that record heightened levels of risk through an EWL grading.
‘Earnings per Share contribution’ The attributable profit or loss generated by a particular business or segment divided by the weighted average number of Barclays shares in issue to illustrate on a per share basis how that business or segment contributes total earnings per share.
‘Economic Value of Equity (EVE)’ Change in the present value of the banking book of a parallel (upward or downward) interest rate shock.
‘Encumbrance’ The use of assets to secure liabilities, such as by way of a lien or charge.
‘Enterprise Risk Management Framework (ERMF)’ Barclays risk management responsibilities are laid out in the Enterprise Risk Management Framework. This framework creates clear ownership and accountability, ensures the Group’s most significant risk exposures are controlled, understood and managed in accordance with agreed risk appetite, and ensures regular reporting of both risk exposures and the operating effectiveness of controls. This framework also clarifies the definition of the three lines of defence and extends its scope to all businesses and functions.
‘Equities’ Trading businesses encompassing Cash Equities, Equity Derivatives & Equity Financing
‘Equity and stock index derivatives’ Derivatives whose value is derived from equity securities. This category includes equity and stock index swaps and options (including warrants, which are equity options listed on an exchange). The Group also enters into fund-linked derivatives, being swaps and options whose underlyings include mutual funds, hedge funds, indices and multi-asset portfolios. An equity swap is an agreement between two parties to exchange periodic payments, based upon a notional principal amount, with one side paying fixed or floating interest and the other side paying based on the actual return of the stock or stock index. An equity option provides the buyer with the right, but not the obligation, either to purchase or sell a specified stock, basket of stocks or stock index at a specified price or level on or before a specified date.
‘Equity risk’ In the context of trading book capital requirements, the risk of change in market value of an equity investment.
‘Equity structural hedge’ An interest rate hedge in place to manage the volatility in net earnings generated by businesses on the Group’s
| Barclays PLC and Barclays Bank PLC 2016 Annual Report on Form 20-F | 453 |
Glossary
equity, with the impact allocated to businesses in line with their economic capital usage.
‘Euro Interbank Offered Rate (EURIBOR)’ A benchmark interest rate at which banks can borrow funds from other banks in the European interbank market.
‘Europe’ Geographic segment comprising countries in which Barclays operates within the EU (excluding UK), Northern Continental and Eastern Europe.
‘European Securities and Markets Authority (ESMA)’ An independent European Supervisory Authority with the remit of enhancing the protection of investors and reinforcing stable and well-functioning financial markets in the European Union.
‘Expected losses’ The Group’s measure of anticipated losses for exposures captured under an internal ratings based credit risk approach for capital adequacy calculations. It is measured as the Barclays modelled view of anticipated losses based on Probability of Default (PD), Loss Given Default (LGD) and Exposure at Default (EAD), with a one year time horizon.
‘Expert lender models’ Models of risk measures that are used for parts of the portfolio where the risk drivers are specific to a particular counterparty, but where there is insufficient data to support the construction of a statistical model. These models utilise the knowledge of credit experts that have in depth experience of the specific customer type being modelled.
‘Exposure’ Generally refers to positions or actions taken by the firm, or consequences thereof, that may put a certain amount of a bank’s resources at risk.
‘Exposure at Default (EAD)’ The estimation of the extent to which Barclays may be exposed to a customer or counterparty in the event of, and at the time of, that counterparty’s default. At default, the customer may not have drawn the loan fully or may already have repaid some of the principal, so that exposure may be less than the approved loan limit.
‘External Credit Assessment Institutions (ECAI)’ Institutions whose credit assessments may be used by credit institutions for the determination of risk weight exposures according to CRD IV.
‘F-IRB / Foundation-Internal Ratings Based’ See ‘Internal Ratings Based (IRB)’.
‘Financial Conduct Authority (FCA)’ The statutory body responsible for conduct of business regulation and supervision of UK authorised firms. The FCA also has responsibility for the prudential regulation of firms that do not fall within the PRA’s scope.
‘Financial Services Compensation Scheme (FSCS)’ The UK’s fund for compensation of authorised financial services firms that are unable to pay claims.
‘Financial collateral comprehensive method (FCCM)’ A counterparty credit risk exposure calculation approach which applies volatility adjustments to the market value of exposure and collateral when calculating risk weighted asset values.
‘Fitch’ A credit rating agency.
‘Forbearance’ Forbearance programmes to assist customers in financial difficulty through agreements to accept less than contractual amounts due where financial distress would otherwise prevent satisfactory repayment within the original terms and conditions of the contract. These agreements may be initiated by the customer, Barclays or a third party and include approved debt counselling plans, minimum due reductions, interest rate concessions and switches from capital and interest repayments to interest-only payments.
‘Forbearance Programmes for Credit Cards’ Can be split into 2 main types: Repayment plans- A temporary reduction in the minimum payment due, for a maximum of 60 months. This may involve a reduction in interest rates to prevent negative amortization; Fully amortising- A permanent conversion of the outstanding balance into a fully amortising loan, over a maximum period of 60 months for cards and 120 months for loans.
‘Forbearance Programmes for Home Loans’ Can be split into 4 main types: Interest-only conversions- A temporary change from a capital and interest repayment to an interest-only repayment, for a maximum of 24 months; Interest rate reductions- A temporary reduction in interest rate, for a maximum of 12 months; Payment concessions- An agreement to temporarily accept reduced loan repayments, for a maximum of 24 months; Term extensions- A permanent extension to the loan maturity date which may involve a reduction in interest rates, and usually involves the capitalisation of arrears.
‘Forbearance Programmes for Unsecured Loans’ Can be split into 3 main types: Payment concessions- An agreement to temporarily accept reduced loan repayments, for a maximum of 12 months; Term extensions- A permanent extension to the loan maturity date, usually involving the capitalisation of arrears; Fully amortising- A permanent conversion of the outstanding balance into a fully amortising loan, over a maximum period of 60 months for cards and 120 months for loans.
‘Foreclosures in Progress’ The process by which the bank initiates legal action against a customer with the intention of terminating a loan agreement whereby the bank may repossess the property subject to local law and recover amounts it is owed.
‘Foreign exchange derivatives’ The Group’s principal exchange rate-related contracts are forward foreign exchange contracts, currency swaps and currency options. Forward foreign exchange contracts are agreements to buy or sell a specified quantity of foreign currency, usually on a specified future date at an agreed rate. Currency swaps generally involves the exchange, or notional exchange, of equivalent amounts of two currencies and a commitment to exchange interest periodically until the principal amounts arere-exchanged on a future date. Currency options provide the buyer with the right, but not the obligation, either to purchase or sell a fixed amount of a currency at a specified exchange rate on or before a future date. As compensation for assuming the option risk, the option writer generally receives a premium at the start of the option period.
‘Foreign exchange risk’ In the context of DVaR, the impact of changes in foreign exchange rates and volatilities.
| 454 | Barclays PLC and Barclays Bank PLC 2016 Annual Report on Form 20-F |
Glossary
‘Front Arena’ A deal solution that helps to trade and manage positions and risk in the global capital markets.
‘Full time equivalent’ Full time equivalent units are theon-job hours paid for employee services divided by the number of ordinary-time hours normally paid for a full-time staff member when on the job (or contract employees where applicable).
‘Fully loaded’ When a measure is presented or described as being on a fully loaded basis, it is calculated without
applying the transitional provisions set out in Part Ten of CRD IV.
‘Fully loaded CET1 ratio’ A risk based ratio calculated as Common Equity Tier 1 capital divided by Risk Weighted Assets (before the application of transitional provisions set out in CRD IV and interpretive guidance published by the PRA).
‘Funding for Lending Scheme (FLS)’ Scheme launched by the Bank of England to incentivise banks and building societies to lend to UK households andnon-financial companies through reduced funding costs, the benefits of which are passed on to UK borrowers in the form of cheaper and more easily available loans.
‘Funding mismatch’ In the context of Eurozone balance sheet funding exposures, the excess of local euro denominated external assets, such as customer loans, over local euro denominated liabilities, such as customer deposits.
‘Funding risk’ The risk that the Group may not be able to achieve its business plans due to being unable to maintain appropriate capital ratios (Capital Risk), being unable to meet its obligations as they fall due (Liquidity Risk), rating agency methodology changes or of adverse changes in interest rate curves impacting structural hedges of non – interest bearing assets/ liabilities or on income or foreign exchange rates on capital ratios (Structural risk).
‘Funds and fund-linked products’ Includes holdings in mutual funds, hedge funds, fund of funds and fund linked derivatives.
‘Gains on acquisitions’ The amount by which the acquirer’s interest in the net fair value of the identifiable assets, liabilities and contingent liabilities, recognised in a business combination, exceeds the cost of the combination.
‘General market risk’ The risk of a price change in a financial instrument due to a change in level of interest rates or owing to a broad equity market movement unrelated to any specific attributes of individual securities.
‘Globally-Systemically Important Banks(G-SIBs orG-SIIs)’ Global financial institutions whose size, complexity and systemic interconnectedness, mean that their distress or failure would cause significant disruption to the wider financial system and economic activity. The Financial Stability Board (FSB) and the Basel Committee on Banking Supervision (BCBS) have identified a group of 30 globally systemically important banks.
‘G-SII additional leverage ratio buffer(G-SII ALRB)’ A macroprudential buffer that applies to globally systemically important banks(G-SIBs) and other major domestic UK banks and building societies, including banks that are subject to ring-fencing requirements. TheG-SII ALRB will be calibrated as 35% (on a phased basis) of the combined systemic risk buffers that applies to the bank.
‘GSII Buffer’ Common Equity Tier 1 capital required to be held under CRD IV to ensure thatG-SIBs build up surplus capital to compensate for the systemic risk that such institutions represent to the financial system.
‘Grandfathering’ In the context of CRD IV capital resources, the application of the rules on instrument eligibility during the transitional period as defined in the Capital Requirements Regulation.
‘Grosscharge-off rates’ Represents the balancescharged-off to recoveries in the reporting period, expressed as a percentage of average outstanding balances excluding balances in recoveries.Charge-off to recoveries generally occurs when the collections focus switches from the collection of arrears to the recovery of the entire outstanding balance, and represents a fundamental change in the relationship between the bank and the customer. This is a measure of the proportion of customers that have gone into default during the period.
‘Gross new lending’ Newlending advanced to customers during the period.
‘Group’ Barclays PLC together with its subsidiaries.
‘Guarantee’ Unless otherwise described, an undertaking by a third party to pay a creditor should a debtor fail to do so. It is a form of credit substitution.
‘Head Office and Other Operations’ A business segment comprising Brand and Marketing, Finance, Head Office, Human Resources, Internal Audit, Legal and Compliance, Risk, Treasury and Tax and other operations.
‘High Net Worth’ Businesses within Barclays UK and Barclays International that provide banking and other services to high net worth customers.
‘High Risk’ In retail banking, ‘High Risk’ is defined as the subset ofup-to-date customers who, either through an event or observed behaviour exhibit potential financial difficulty. Where appropriate, these customers are proactively contacted to assess whether assistance is required.
‘Home loan’ A loan to purchase a residential property. The property is then used as collateral to guarantee repayment of the loan. The borrower gives the lender a lien against the property and the lender can foreclose on the property if the borrower does not repay the loan per the agreed terms. Also known as a residential mortgage.
‘IHC’ or ‘US IHC’ Barclays US LLC, the intermediate holding company established by Barclays in July 2016, which holds most of Barclays’ subsidiaries and assets in the United States.
‘IMA / Internal Model Approach’ In the context of Risk Weighted Assets, Risk Weighted Assets for which the exposure amount has been derived via the use of a PRA approved internal market risk model.
‘IMM / Internal Model Method’ In the context of Risk Weighted Assets, Risk Weighted Assets for which the exposure amount has been derived via the use of a PRA approved internal counterparty credit risk model.
| Barclays PLC and Barclays Bank PLC 2016 Annual Report on Form 20-F | 455 |
Glossary
‘Impairment allowances’ A provision held on the balance sheet as a result of the raising of a charge against profit for incurred losses in the lending book. An impairment allowance may either be identified or unidentified and individual or collective.
‘Impairment coverage ratio’ Impairment allowance held against balances in specific LTV band expressed as a percentage of balances in the specific LTV Band.
‘Income’ Total income,, unless otherwise specified.
‘Incremental Risk Charge’ An estimate of the incremental risk arising from rating migrations and defaults beyond what is already captured in specific market risk VaR for the non correlation trading portfolio.
‘Independent Commission on Banking (ICB)’ Body set up by HM Government to identify structural andnon-structural measures to reform the UK banking system and promote competition.
‘Individual liquidity guidance (ILG)’ Guidance given to a firm about the amount, quality and funding profile of liquidity resources that the PRA has asked the firm to maintain.
‘Inflation risk’ In the context of DVaR, the impact of changes in inflation rates and volatilities on cash instruments and derivatives.
‘Insurance Risk’ The risk of the Group’s aggregate insurance premiums received from policyholders under a portfolio of insurance contracts being inadequate to cover the claims arising from those policies.
‘Interchange’ Income paid to a credit card issuer for the clearing and settlement of a sale or cash advance transaction.
‘Interest only home loans’ Under the terms of these loans, the customer makes payments of interest only for the entire term of the mortgage, although customers may make early repayments of the principal within the terms of their agreement. The customer is responsible for repaying the entire outstanding principal on maturity, which may require the sale of the mortgaged property.
‘Interest rate derivatives’ Derivatives linked to interest rates. This category includes interest rate swaps, collars, floors options and swaptions. An interest rate swap is an agreement between two parties to exchange fixed rate and floating rate interest by means of periodic payments based upon a notional principal amount and the interest rates defined in the contract. Certain agreements combine interest rate and foreign currency swap transactions, which may or may not include the exchange of principal amounts. A basis swap is a form of interest rate swap, in which both parties exchange interest payments based on floating rates, where the floating rates are based upon different underlying reference indices. In a forward rate agreement, two parties agree a future settlement of the difference between an agreed rate and a future interest rate, applied to a notional principal amount. The settlement, which generally occurs at the start of the contract period, is the discounted present value of the payment that would otherwise be made at the end of that period.
‘Interest rate risk’ The risk of interest rate volatility adversely impacting the Groups net interest margin. In the context of the
calculation of market risk DVaR, measures the impact of changes in interest (swap) rates and volatilities on cash instruments and derivatives.
‘Internal Assessment Approach (IAA)’ One of three types of calculation that a firm with permission to use the Internal Ratings Based (IRB) approach may apply to securitisation exposures. It consists of mapping a firm’s internal rating methodology for credit exposures to those of an External Credit Assessment Institution (ECAI) to determine the appropriate risk weight based on the ratings based approach. Its applicability is limited to ABCP programmes related to liquidity facilities and credit enhancement.
‘Internal Capital Adequacy Assessment Process (ICAAP)’ Companies are required to perform a formal Internal Capital Adequacy Assessment Process (ICAAP) as part of the Pillar 2 requirements (BIPRU) and to provide this document to the PRA on a yearly basis. The ICAAP document summarises the group’s risk management framework, including approach to managing all risks (i.e. Pillar 1 andnon-Pillar 1 risks); and, the group’s risk appetite, economic capital and stress testing frameworks.
‘Internal model method (IMM)’ In the context of Risk Weighted Assets, Risk Weighted Assets for which the exposure amount has been derived via the use of a PRA approved internal counterparty credit risk model.
‘Internal Ratings Based (IRB)’ An approach under the CRR framework that relies on the bank’s internal models to derive the risk weights. The IRB approach is divided into two alternative applications, Advanced and Foundation:
| – | Advanced IRB(‘A-IRB’): the bank uses its own estimates of probability of default (PD), loss given default (LGD) and credit conversion factor to model a given risk exposure. |
| – | Foundation IRB: the bank applies its own PD as for Advanced, but it uses standard parameters for the LGD and the credit conversion factor. The Foundation IRB approach is specifically designed for wholesale credit exposures. Hence retail, equity, securitisation positions andnon-credit obligations asset exposures are treated under standardised orA-IRB. |
‘Investment Bank’ The Group’s investment bank which consists of origination led and returns focused markets and banking business which forms part of the Corporate and Investment Banking segment of Barclays International.
‘Investment Banking Fees’ In the context of Investment Bank Analysis of Total Income, fees generated from origination activity businesses – including financial advisory, debt and equity underwriting.
‘Investment grade’ A debt security, treasury bill or similar instrument with a credit rating of AAA to BBB as measured by external credit rating agencies.
‘ISDA Master Agreement’ The most commonly used master contract for OTC derivative transactions internationally. It is part of a framework of documents, designed to enable OTC derivatives to be documented fully and flexibly. The framework consists of a master
| 456 | Barclays PLC and Barclays Bank PLC 2016 Annual Report on Form 20-F |
Glossary
agreement, a schedule, confirmations, definition booklets, and a credit support annex. The ISDA master agreement is published by the International Swaps and Derivatives Association (ISDA).
‘Key Risk Scenarios (KRS)’ Key Risk Scenarios are a summary of the extreme potential risk exposure for each Key Risk in each business and function, including an assessment of the potential frequency of risk events, the average size of losses and three extreme scenarios. The Key Risk Scenario assessments are a key input to the Advanced Measurement Approach calculation of regulatory and economic capital requirements.
‘Large exposure’ A large exposure is defined as the total exposure of a firm to a counterparty or group of connected clients, whether in the banking book or trading book or both, which in aggregate equals or exceeds 10% of the firm’s eligible capital.
‘Lender Option Borrower Option (LOBO)’ A clause previously included in ESHLA loans that allowed Barclays, on specific dates, to raise the fixed interest rate on the loan, upon which the borrower had the option to either continue with the loan at the higher rate, orre-pay the loan at par.
‘Lending’ In the context of Investment Bank Analysis of Total Income, lending income includes net interest income, gains or losses on loan sale activity, and risk management activity relating to the loan portfolio.
‘Letters of credit’ A letter typically used for the purposes of international trade guaranteeing that a debtor’s payment to a creditor will be made on time and in full. In the event that the debtor is unable to make payment, the bank will be required to cover the full or remaining amount of the purchase.
‘Level 1 assets’ High quality liquid assets under the Basel Committee’s Liquidity Coverage Ratio (LCR), including cash, central bank reserves and higher quality government securities.
‘Level 2 assets’ Under the Basel Committee’s Liquidity Coverage Ratio high quality liquid assets (HQLA) are comprised of Level 1 and Level 2 assets, with the latter comprised of Level 2A and Level 2B assets. Level 2A assets include, for example, lower quality government securities, covered bonds and corporate debt securities. Level 2B assets include, for example, lower rated corporate bonds, residential mortgage backed securities and equities that meet certain conditions.
‘Leverage ratio’ A measure of the Group’s Tier 1 capital to total leverage exposure under CRD IV.
‘Liquidity Coverage Ratio (LCR)’ The ratio of the stock of high quality liquid assets to expected net cash outflows over the next 30 days. High-quality liquid assets should be unencumbered, liquid in markets during a time of stress and, ideally, be central bank eligible. These include, for example, cash and claims on central governments and central banks.
‘Liquidity Pool’ The Group liquidity pool comprises cash at central banks and highly liquid collateral specifically held by the Group as a contingency to enable the bank to meet cash outflows in the event of stressed market conditions.
‘Liquidity risk appetite (LRA)’The level of liquidity risk that the Group chooses to take in pursuit of its business objectives and in meeting its regulatory obligations.
‘Liquidity Risk Management Framework (the Liquidity Framework)’ The Liquidity Risk Management Framework (the Liquidity Framework), which is sanctioned by the Board Risk Committee (BRC) and which incorporates liquidity policies, systems and controls that the Group has implemented to manage liquidity risk within tolerances approved by the Board and regulatory agencies.
‘Litigation and conduct charges’ Litigation and conduct charges include regulatory fines, litigation settlements and conduct related customer redress.
‘Loan loss rate’ Is quoted in basis points and represents total loan impairment divided by gross loans and advances to customers and banks held at amortised cost at the balance sheet date.
‘Loan to deposit ratio’ Loans and advances divided by customer accounts calculated for Barclays UK; Barclays International andNon-Core, excluding investment banking businesses. This excludes particular liabilities issued by the retail businesses that have characteristics comparable to retail deposits (for example structured Certificates of Deposit and retail bonds), which are included within debt securities in issue.
‘Loan to value (LTV) ratio’ Expresses the amount borrowed against an asset (i.e. a mortgage) as a percentage of the appraised value of the asset. The ratios are used in determining the appropriate level of risk for the loan and are generally reported as an average for new mortgages or an entire portfolio. Also see ‘Marked to market (MMT) LTV ratio.’
‘London Interbank Offered Rate (LIBOR)’ A benchmark interest rate at which banks can borrow funds from other banks in the London interbank market.
‘Long-term refinancing operation (LTRO)’The European Central Bank’s 3 year long term bank refinancing operation.
‘Loss Given Default (LGD)’ The fraction of Exposure at Default (EAD) (defined above) that will not be recovered following default. LGD comprises the actual loss (the part that is not expected to be recovered), together with the economic costs associated with the recovery process.
‘Macro Products’ Represents Rates, currency and commodities income.
‘Management DVaR’ The Daily Value at Risk (DVaR) used for internal market risk management purposes. The Investment Bank uses a DVaR with atwo-year equally weighted historical period, at a 95% confidence level, for all trading portfolios and certain banking books.
‘Mandatory break clause’In the context of counterparty credit risk, a contract clause that means a trade will be ended on a particular date.
‘Marked to market approach’ A counterparty credit risk exposure calculation approach which uses the current mark to market value of derivative positions as well as a potential future exposureadd-on to calculate an exposure to which a risk weight can be applied.
| Barclays PLC and Barclays Bank PLC 2016 Annual Report on Form 20-F | 457 |
Glossary
‘Marked to market (MTM) LTV ratio’ The loan amount as a percentage of the current value of the asset used to secure the loan. Also see ‘Balance weighted Loan to Value (LTV) ratio’ and ‘Valuation weighted Loan to Value (LTV) ratio.’
‘Market risk’ The risk of the Group suffering financial loss due to changes in market prices. In the context of Risk Weighted Assets, it is the component of Risk Weighted Assets that represents the risk of loss resulting from fluctuations in the market value of positions held in equities, commodities, currencies, derivatives and interest rates.
‘Master netting agreements’ An agreement that provides for a single net settlement of all financial instruments and collateral covered by the agreement in the event of the counterparty’s default or bankruptcy or insolvency, resulting in a reduced exposure.
‘Master trust securitisation programmes’ A securitisation structure where a trust is set up for the purpose of acquiring a pool of receivables. The trust issues multiple series of securities backed by these receivables.
‘Matchbook (or matched book)’ An asset/liability management strategy where assets are matched against liabilities of equivalent value and maturity.
‘Material Risk Takers (MRTs)’ Categories of staff whose professional activities have or are deemed to have a material impact on Barclays’ risk profile, as determined in accordance with the European Banking Authority regulatory technical standard on the identification of such staff.
‘Methodology and policy’ In the context of the Funding Risk, Capital Risk section, the effect on RWAs of methodology changes driven by regulatory policy changes.
‘Minimum capital requirement’ Under Pillar 1 of the Basel framework, the amount of capital required for an exposure.
‘Model updates’ In the context of the Funding Risk, Capital Risk section, changes in RWAs caused by model implementation, changes in model scope or any changes required to address model malfunctions.
‘Model validation’ Process through which models are independently challenged, tested and verified to prove that they have been built, implemented and used correctly, and that they continue to befit-for-purpose.
‘Modelled—VaR’ In the context of Risk Weighted Assets, Market risk calculated using value at risk models laid down by the CRR and supervised by the PRA.
‘Money market funds’ Investment funds typically invested in short-term debt securities.
‘Monoline derivatives’ Derivatives with a monoline insurer such as credit default swaps referencing the underlying exposures held.
‘Moody’s’ A credit rating agency.
‘Mortgage Current Accounts (MCA) Reserves’ A secured overdraft facility available to home loan customers which allows them to borrow against the equity in their home. It allows draw-down up to an agreed available limit on a separate but connected account to the main mortgage loan facility. The balance drawn must be repaid on redemption of the mortgage.
‘Multilateral development banks’ Financial institutions created for the purposes of development, where membership transcends national boundaries.
‘National discretion’ Discretions in CRD IV given to member states to allow the local regulator additional powers in the application of certain CRD IV rules in its jurisdiction.
‘Net asset value per share’ Calculated by dividing shareholders’ equity, excludingnon-controlling interests and other equity instruments, by the number of issued ordinary shares.
‘Net interest income’ The difference between interest income on assets and interest expense on liabilities.
‘Net interest margin’ Net interest income divided by the sum of average customer assets.
‘Net investment income’ Changes in the fair value of financial instruments designated at fair value, dividend income and the net result on disposal of available for sale assets.
‘Net Stable Funding Ratio (NSFR)’ The ratio of available stable funding to required stable funding over a one year time horizon, assuming a stressed scenario. The ratio is required to be over 100%. Available stable funding would include such items as equity capital, preferred stock with a maturity of over 1 year, or liabilities with a maturity of over 1 year. The required amount of stable funding is calculated as the sum of the value of the assets held and funded by the institution, multiplied by a specific required stable funding (RSF) factor assigned to each particular asset type, added to the amount of potential liquidity exposure multiplied by its associated RSF factor.
‘Net tangible asset value per share’ Calculated by dividing shareholders equity, excludingnon-controlling interests and other equity instruments, less goodwill and intangible assets, by the number of issued ordinary shares.
‘Net trading income’ Gains and losses arising from trading positions which are held at fair value, in respect of both market-making and customer business, together with interest, dividends and funding costs relating to trading activities.
‘Net written credit protection’ In the context of leverage exposure, the net notional value of credit derivatives protection sold and credit derivatives protection bought.
‘New bookings’ The total of the original balance on accounts opened in the reporting period, including any applicable fees and charges included in the loan amount.
‘Non-asset backed debt instruments’ Debt instruments not backed by collateral, including government bonds; US agency bonds;
| 458 | Barclays PLC and Barclays Bank PLC 2016 Annual Report on Form 20-F |
Glossary
corporate bonds; commercial paper; certificates of deposit; convertible bonds; corporate bonds and issued notes.
‘Non-customer net interest income(NII)’ /‘Non-customer interest income’ Principally comprises the impact of product and equity structural hedges, as well as certain other net interest income received on government bonds and other debt securities held for the purposes of interest rate hedging and liquidity for local banking activities.
‘Non-model method (NMM)’ In the context of Risk Weighted Assets, Counterparty credit risk, Risk Weighted Assets where the exposure amount has been derived through the use of CRR norms, as opposed to an internal model.
‘Non-performance costs’ Costs other than performance costs.
‘Non-performing proportion of outstanding balances’ Defined as balances greater than 90 days delinquent (including forbearance accounts greater than 90 days and accounts charged off to recoveries), expressed as a percentage of outstanding balances.
‘Non-performing balances impairment coverage ratio’ Impairment allowance held against non performing balances expressed as a percentage of non performing balances.
‘Non-Traded Market Risk’ The risk of a reduction to earnings or capital due to an inability to hedge the banking book balance sheet.
‘Non-Traded VaR’ Reflects the volatility in the value of the available for sale investments in the liquidity pool which flow directly through capital via the available for sale reserve. The underlying methodology to calculate non traded VaR is similar to Traded Management VaR, but the two measures are not directly comparable. The Non Traded VaR represents the volatility to capital driven by the available for sale exposures. These exposures are in the banking book and do not meet the criteria for trading book treatment.
‘Notable items’ Notable items are considered to be significant items impacting comparability of performance and are shown for each of the business segments.
‘Notch’ A single unit of measurement in a credit rating scale.
‘Notional amount’ The nominal or face amount of a financial instrument, such as a loan or a derivative, that is used to calculate payments made on that instrument.
‘Operational risk’ The risk of loss resulting from inadequate or failed internal processes, people and systems or from external events, including legal risk. In the context of Risk Weighted Assets, it is the component of Risk Weighted Assets that represents the risk of loss resulting from these risks.
‘Operational RiskData eXchange (ORX)’ The Operational Riskdata eXchange Association (ORX) is anot-for-profit industry association dedicated to advancing the measurement and management of operational risk in the global financial services industry. Barclays is a member of ORX.‘Origination led’ Focus on high margin low capital fee based activities and related hedging opportunities.
‘Origination exposure model’ A technique used to measure the counterparty credit risk of losing anticipated cash flows from
forwards, swaps, options and other derivatives contracts in the event the counterparty to the contract should default.
‘OSII’ Other systemically important institutions are institutions that are deemed to create risk to financial stability due to their systemic importance.
‘Over-the-counter (OTC) derivatives’ Derivative contracts that are traded (and privately negotiated) directly between two parties. They offer flexibility because, unlike standardised exchange-traded products, they can be tailored to fit specific needs.
‘Own credit’ The effect of changes in the Group’s own credit standing on the fair value of financial liabilities.
‘Owner occupied mortgage’ A mortgage where the intention of the customer was to occupy the property at origination.
‘Past due items’ Refers to loans where the borrower has failed to make a payment when due under the terms of the loan contract.
‘Payment Protection Insurance (PPI) redress’ Provision for the settlement of PPI miss-selling claims and related claims management costs.
‘Pension Risk’ The risk of the Group’s earnings and capital being adversely impacted by the Group’s defined benefit obligations increasing or the value of the assets backing these defined benefit obligations decreasing due to changes in both the level and volatility of prices.
‘Performance costs’ The accounting charge recognised in the period for performance awards. For deferred incentives and long-term incentives, the accounting charge is spread over the relevant periods in which the employee delivers service.
‘Period end allocated tangible equity’ Allocated tangible equity is calculated as 11.5% of CRD IV fully loaded risk weighted assets for each business, adjusted for CRD IV fully loaded capital deductions, excluding goodwill and intangible assets, reflecting assumptions the Group uses for capital planning purposes. Head Office tangible equity represents the difference between the Group’s tangible equity and the amounts allocated to businesses.
‘Pillar 1’ The part of the Basel framework that sets outs the rules that govern the calculation of Minimum capital requirements for credit, market and operational risks.
‘Pillar 2’ The part of the Basel framework that covers the supervisory reviews of the bank’s internal assessment of capital to ensure that firms have adequate capital to support all the relevant risks in their business.
‘Pillar 3’ The part of the Basel framework that covers external communication of risk and capital information by banks to promote transparency and good risk management.
‘Post-model adjustment (PMA)’ In the context of Basel models, a PMA is a short term increase in regulatory capital applied at portfolio level to account for model input data deficiencies, inadequate model performance or changes to regulatory definitions
| Barclays PLC and Barclays Bank PLC 2016 Annual Report on Form 20-F | 459 |
Glossary
(e.g. definition of default) to ensure the model output is accurate, complete and appropriate.
‘Potential Credit Risk Loans (PCRLs)’ Comprise the outstanding balances to Potential Problem Loans (defined below) and the three categories of Credit Risk Loans (defined above).
‘Potential Future Exposure on Derivatives’ A regulatory calculation in respect of the Group’s potential future credit exposure on both exchange traded and OTC derivative contracts, calculated by assigning a standardised percentage (based on the underlying risk category and residual trade maturity) to the gross notional value of each contract.
‘Potential Problem Loans (PPLs)’ Loans where serious doubt exists as to the ability of the borrowers to continue to comply with repayment terms in the near future.
‘PRA waivers’ PRA approvals that specifically give permission to the Bank to either modify or waive existing rules. Waivers are specific to an organisation and require applications being submitted to and approved by the PRA.
‘Primary securitisations’The issuance of securities (bonds and commercial papers) for fund-raising.
‘Primary Stress Tests’ In the context of Traded Market Risk, Stress Testing provides an estimate of potentially significant future losses that might arise from extreme market moves or scenarios. Primary Stress Tests apply stress moves to key liquid risk factors for each of the major trading asset classes.
‘Prime Services’ Involves financing of fixed income and equity positions using Repo and stock lending facilities. The Prime Services business also provides brokerage facilitation services for hedge fund clients offering execution and clearance facilities for a variety of asset classes.
‘Principal’ In the context of a loan, the amount borrowed, or the part of the amount borrowed which remains unpaid (excluding interest).
‘Principal Investments’ Private equity investments.
‘Principal Risks’ the principal risks affecting the Group described in the risk review section of the Barclays PLC Annual Report.
‘Private equity investments’ Investments in equity securities in operating companies not quoted on a public exchange. Investment in private equity often involves the investment of capital in private companies or the acquisition of a public company that results in the delisting of public equity. Capital for private equity investment is raised by retail or institutional investors and used to fund investment strategies such as leveraged buyouts, venture capital, growth capital, distressed investments and mezzanine capital.
‘Private-label securitisation’ Residential mortgage backed security transactions sold or guaranteed by entities that are not sponsored or owned by the government.
‘Probability of Default (PD)’ The likelihood that a loan will not be repaid and will fall into default. PD may be calculated for each client who has a loan (normally applicable to wholesale customers/clients)
or for a portfolio of clients with similar attributes (normally applicable to retail customers). To calculate PD, Barclays assesses the credit quality of borrowers and other counterparties and assigns them an internal risk rating. Multiple rating methodologies may be used to inform the rating decision on individual large credits, such as internal and external models, rating agency ratings, and for wholesale assets market information such as credit spreads. For smaller credits, a single source may suffice such as the result from an internal rating model.
‘Product structural hedge’ An interest rate hedge that converts short term interest margin volatility on product balances (such asnon-interest bearing current accounts and managed rate deposits) into a more stable medium term rate and which is built on a monthly basis to achieve a targeted maturity profile.
‘Properties in Possession held as ‘Loans and Advances to Customers’’ Properties in the UK and Italy where the customer continues to retain legal title but where the bank has enforced the possession order as part of the foreclosure process to allow for the disposal of the asset or the court has ordered the auction of the property.
‘Properties in Possession held as ‘Other Real Estate Owned’’ Properties in South Africa, where the bank has taken legal ownership of the title as a result of purchase at an auction or similar and treated as ‘Other Real Estate Owned’ within other assets on the bank’s balance sheet.
‘Proprietary trading’ When a bank, brokerage or other financial institution trades on its own account, at its own risk, rather than on behalf of customers, so as to make a profit for itself.
‘Prudential Regulation Authority (PRA)’ The statutory body responsible for the prudential supervision of banks, building societies, insurers and a small number of significant investment firms in the UK. The PRA is a subsidiary of the Bank of England.
‘Prudential valuation adjustment (PVA)’ A calculation which adjusts the accounting values of positions held on balance sheet at fair value to comply with regulatory valuation standards, which place greater emphasis on the inherent uncertainty around the value at which a trading book position could be exited.
‘Public benchmark’ Unsecured medium term notes issued in public syndicated transactions.
‘Qualifying Revolving Retail Exposure (QRRE)’ In the context of the IRB approach to credit risk RWA calculations, an exposure meeting the criteria set out in BIPRU 4.6.42 R (2). It includes most types of credit card exposure.
‘Rates’ In the context of Investment Bank income analysis, trading revenue relating to government bonds and linear interest rate derivatives.
‘Re-aging’ The returning of a delinquent account toup-to-date status without collecting the full arrears (principal, interest and fees).
| 460 | Barclays PLC and Barclays Bank PLC 2016 Annual Report on Form 20-F |
Glossary
‘Real Estate Mortgage Investment Conduits (REMICs)’ An entity that holds a fixed pool of mortgages and that is separated into multiple classes of interests for issuance to investors.
‘Recoveries Impairment Coverage Ratio’ Impairment allowance held against recoveries balances expressed as a percentage of balance in recoveries.
‘Recoveries proportion of outstanding balances’ Represents the amount of recoveries (grossmonth-end customer balances of all accounts that havecharged-off) as at the period end compared to total outstanding balances. The size of the recoveries book would ultimately have an impact on the overall impairment requirement on the portfolio. Balances in recoveries will decrease if: assets arewritten-off; amounts are collected; or assets are sold to a third party (i.e. debt sale).
‘Redenomination risk’ The risk of financial loss to the Group should one or more countries exit from the Euro, potentially leading to the devaluation of local balance sheet assets and liabilities.
‘Regulatory capital’ The amount of capital that a bank holds to satisfy regulatory requirements.
‘Renegotiated loans’ Loans are generally renegotiated either as part of an ongoing customer relationship or in response to an adverse change in the circumstances of the borrower. In the latter case renegotiation can result in an extension of the due date of payment or repayment plans under which the Group offers a concessionary rate of interest to genuinely distressed borrowers. This will result in the asset continuing to be overdue and will be individually impaired where the renegotiated payments of interest and principal will not recover the original carrying amount of the asset. In other cases, renegotiation will lead to a new agreement, which is treated as a new loan.
‘Repricing lag risk’ The risk that when underlying interest rates change it can take a number of months to change the customer rate e.g. should rates decrease then we would need to let our variable savings rate customers know that we would be decreasing their savings rates. This could result in a loss of income as it may take several months, whereas the “funding/investment” benefit reduces immediately.
‘Repurchase agreement (Repo)’ / ‘Reverse repurchase agreement (Reverse repo)’ Arrangements that allow counterparties to use financial securities as collateral for an interest bearing cash loan. The borrower agrees to sell a security to the lender subject to a commitment to repurchase the asset at a specified price on a given date. For the party selling the security (and agreeing to repurchase it in the future) it is a Repurchase agreement or Repo; for the counterparty to the transaction (buying the security and agreeing to sell in the future) it is a Reverse repurchase agreement or Reverse repo.
‘Re-securitisations’ The repackaging of Securitised Products into securities. The resulting securities are therefore securitisation positions where the underlying assets are also predominantly securitisation positions.
‘Reserve Capital Instruments (RCIs)’ Hybrid issued capital securities which may be debt or equity accounted, depending on the terms.
‘Residential Mortgage-Backed Securities (RMBS)’ Securities that represent interests in a group of residential mortgages. Investors in these securities have the right to cash received from future mortgage payments (interest and/or principal).
‘Residual maturity’ The remaining contractual term of a credit obligation associated with a credit exposure.
‘Restructured loans’ Comprises loans where, for economic or legal reasons related to the debtor’s financial difficulties, a concession has been granted to the debtor that would not otherwise be considered. Where the concession results in the expected cash flows discounted at the original effective interest rate being less than the loan’s carrying value, an impairment allowance will be raised.
‘Retail Loans’ Loans to individuals or small and medium sized enterprises rather than to financial institutions and larger businesses. It includes both secured and unsecured loans such as mortgages and credit card balances, as well as loans to certain smaller business customers, typically with exposures up to £3m or with a turnover up to £5m.
‘Return on average Risk Weighted Assets’ Statutory profit as a proportion of average Risk Weighted Assets.
‘Return on average shareholders’ equity’ Statutory profit after tax attributable to ordinary shareholders, including an adjustment for the tax credit in reserves in respect of other equity instruments, as a proportion of average shareholders’ equity, excludingnon-controlling interests and other equity instruments.
‘Return on average tangible shareholders’ equity’ Statutory profit after tax attributable to ordinary shareholders, including an adjustment for the tax credit in reserves in respect of other equity instruments, as a proportion of average shareholders’ equity excludingnon-controlling interests and other equity instruments adjusted for the deduction of intangible assets and goodwill.
‘Return on average allocated tangible shareholders’ equity’ Statutory profit after tax attributable to ordinary shareholders, including an adjustment for the tax credit in reserves in respect of other equity instruments, as a proportion of average allocated tangible shareholders’ equity.
‘Risk Appetite’ The level of risk that Barclays is prepared to accept whilst pursuing its business strategy, recognising a range of possible outcomes as business plans are implemented.
‘Risk weighted assets (RWAs)’ A measure of a bank’s assets adjusted for their associated risks. Risk weightings are established in accordance with the Basel rules as implemented by CRD IV and local regulators.
‘Risks not in VaR (RNIVS)’ Refers to all the key risks which are not captured or not well captured within the VaR model framework.
‘Roll rate analysis’The measurement of the rate at which retail accounts deteriorate through delinquency phases.
‘Sales commissions, commitments and other incentives’ Includes commission-based arrangements, guaranteed incentives and Long Term Incentive Plan awards.
| Barclays PLC and Barclays Bank PLC 2016 Annual Report on Form 20-F | 461 |
Glossary
‘Sarbanes-Oxley requirements’ The Sarbanes-Oxley Act 2002 (SOX), which was introduced by the U.S. Government to safeguard against corporate governance scandals such as Enron, WorldCom and Tyco. AllUS-listed companies must comply with SOX.
‘Second Lien’ Debt that is issued against the same collateral as higher lien debt but that is subordinate to it. In the case of default, compensation for this debt will only be received after the first lien has been repaid and thus represents a riskier investment than the first lien.
‘Secondary Stress Tests’ Secondary stress tests are used in measuring potential losses arising from illiquid market risks that cannot be hedged or reduced within the time period covered in Primary Stress Tests.
‘Securities and loans’ In the context ofNon-Core Analysis of Total income, BarclaysNon-Core Securities and Loans comprise non strategic businesses, predominantly from thenon-core Investment Bank and Corporate Bank.
‘Securities Financing Transactions (SFT)’ In the context of Risk Weighted Assets (RWAs), any of the following transactions: a repurchase transaction, a securities or commodities lending or borrowing transaction, or a margin lending transaction whereby cash collateral is received or paid in respect of the transfer of a related asset.
‘Securities financing transactions adjustments’ In the context of leverage ratio, a regulatoryadd-on calculated as exposure less collateral, taking into account master netting agreements.
‘Securities lending arrangements’ Arrangements whereby securities are legally transferred to a third party subject to an agreement to return them at a future date. The counterparty generally provides collateral against non performance in the form of cash or other assets.
‘Securitisation’ Typically, a process by which debt instruments such as mortgage loans or credit card balances are aggregated into a pool, which is used to back new securities. A company sells assets to a special purpose vehicle (SPV) which then issues securities backed by the assets. This allows the credit quality of the assets to be separated from the credit rating of the original borrower and transfers risk to external investors.
‘Securitised Products’ A business within the Investment Bank that offers a range of products relating to residential mortgage backed securities, commercial mortgage backed securities and other asset backed securities, in addition to restructuring and unwinding legacy credit structures.
‘Set-off clauses’In the context of Counterparty credit risk, contract clauses that allow Barclays to set off amounts owed to us by a counterparty against amounts owed by us to the counterparty.
‘Settlement balances’ Are receivables or payables recorded between the date (the trade date) a financial instrument (such as a bond) is sold, purchased or otherwise closed out, and the date the asset is delivered by or to the entity (the settlement date) and cash is received or paid.
‘Settlement risk’ The risk that settlement in a transfer system will not take place as expected, usually owing to a party defaulting on one or more settlement obligations.
‘Slotting’ Slotting is a Basel 2 approach that requires a standard set of rules to be used in the calculation of RWAs, based upon an assessment of factors such as the financial strength of the counterparty. The requirements for the application of the Slotting approach are detailed in BIPRU 4.5.
‘South Africa’ In the context of Africa Banking, the operations of Africa Banking based in South Africa.
‘Sovereign exposure(s)’ Exposures to central governments, including holdings in government bonds and local government bonds.
‘Specific market risk’ A risk that is due to the individual nature of an asset and can potentially be diversified or the risk of a price change in an investment due to factors related to the issuer or, in the case of a derivative, the issuer of the underlying investment.
‘Spread risk’ Measures the impact of changes to the swap spread, i.e. the difference between swap rates and government bond yields.
‘Standard & Poor’s’ A credit rating agency.
‘Standby facilities, credit lines and other commitments’ Agreements to lend to a customer in the future, subject to certain conditions. Such commitments are either made for a fixed period, or have no specific maturity but are cancellable by the lender subject to notice requirements.
‘Statutory’ Line items of income, expense, profit or loss, assets, liabilities or equity stated in accordance with the requirements of the UK Companies Act 2006 and the requirements of International Financial Reporting Standards (IFRS).
‘Statutory return on average shareholders’ equity’ Statutory profit after tax attributable to ordinary shareholders as a proportion of average shareholders’ equity.
‘STD’ / ‘Standardised Approach’ A method of calculating Risk Weighted Assets that relies on a mandatory framework set by the regulator to derive risk weights based on counterparty type and a credit rating provided by an External Credit Assessment Institute.
‘Stress Testing’ A process which involves identifying possible future adverse events or changes in economic conditions that could have unfavourable effects on the Group (either financial ornon-financial), assessing the Group’s ability to withstand such changes, and identifying management actions to mitigate the impact.
‘Stressed Value at Risk (SVaR)’ An estimate of the potential loss arising from a 12 month period of significant financial stress over a one day horizon.
‘Structured entity’ An entity in which voting or similar rights are not the dominant factor in deciding control. Structured entities are generally created to achieve a narrow and well defined objective with restrictions around their ongoing activities.
| 462 | Barclays PLC and Barclays Bank PLC 2016 Annual Report on Form 20-F |
Glossary
‘Structural hedge’ / ‘hedging’ An interest rate hedge which functions to reduce the impact of the volatility of short-term interest rate movements on positions that exist within the balance sheet that carry interest rates that do notre-price with market rates. See also ‘Equity structural hedge’ and ‘Product structural hedge’.
‘Structural model of default’ A model based on the assumption that an obligor will default when its assets are insufficient to cover its liabilities.
‘Structured credit’ Includes legacy structured credit portfolio primarily comprising derivative exposure and financing exposure to structured credit vehicles.
‘Subordinated liabilities’ Liabilities which, in the event of insolvency or liquidation of the issuer, are subordinated to the claims of depositors and other creditors of the issuer.
‘Supranational bonds’ Bonds issued by an international organisation, where membership transcends national boundaries (e.g. the European Union or World Trade Organisation).
‘Synthetic Securitisation Transactions’Securitisation transactions effected through the use of derivatives.
‘Systemic Risk Buffer’CET1 capital that may be required to be held as part of the Combined Buffer Requirement increasing the capacity of UK banks to absorb stress and limiting the damage to the economy as a results of restricted lending.
‘Tangible net asset value’ Shareholders’ equity excludingnon-controlling interests adjusted for the deduction of intangible assets and goodwill.
‘Tangible net asset value per share’ Shareholders’ equity excludingnon-controlling interests adjusted for the deduction of intangible assets and goodwill, divided by the number of issued ordinary shares.
‘Tangible shareholders equity’ Shareholders’ equity excludingnon-controlling interests adjusted for the deduction of intangible assets and goodwill.
‘Term premium’ Additional interest required by investors to hold assets with a longer period to maturity.
‘The three lines of defence’ The three lines of defence operating model enables Barclays to separate risk management activities between those parties that: own and take risk, and implement controls (first line); oversee and challenge the first line, provide second line risk management activity and support controls (second line); and, provide assurance that the Evaluate, Respond and Monitor(‘E-R-M’) process isfit-for-purpose, and that it is being carried out as intended (third line).
‘Tier 1 capital’ The sum of the Common Equity Tier 1 capital and Additional Tier 1 capital.
‘Tier 1 capital ratio’ The ratio which expresses Tier 1 capital as a percentage of Risk Weighted Assets under CRD IV.
‘Tier 2 (T2) capital’ In the context of CRD IV, a type of capital as defined in the Capital Requirements Regulation.
‘Tier 2 (T2) securities’ Securities that are treated as Tier 2 (T2) capital in the context of CRD IV.
‘Total capital ratio’ Total Regulatory capital as a percentage of Risk Weighted Assets.
‘Total outstanding balance’ In retail banking, total outstanding balance is defined as the grossmonth-end customer balances on all accounts including accounts charged off to recoveries.
‘Total return swap’ An instrument whereby the seller of protection receives the full return of the asset, including both the income and change in the capital value of the asset. The buyer of the protection in return receives a predetermined amount.
‘Total balances on forbearance programmes coverage ratio’ Impairment allowance held against Forbearance balances expressed as a percentage of balance in forbearance.
‘Traded Market Risk’ The risk of a reduction to earnings or capital due to volatility of trading book positions.
‘Trading book’ All positions in financial instruments and commodities held by an institution either with trading intent, or in order to hedge positions held with trading intent.
‘Traditional Securitisation Transactions’ Securitisation transactions in which an underlying pool of assets generates cash flows to service payments to investors.
‘Transitional’ In the context of CRD IV a measure is described as transitional when the transitional provisions set out in Part Ten of the CRD IV Regulation are applied in its calculation.
‘Unencumbered’ Assets not used to secure liabilities or otherwise pledged.
‘United Kingdom (UK)’ Geographic segment where Barclays operates comprising the UK. Also see ‘Europe’.
‘UK Bank levy’ A levy that applies to UK banks, building societies and the UK operations of foreign banks. The levy is payable based on a percentage of the chargeable equity and liabilities of the bank on its balance sheet date.
‘UK leverage ratio’ as per the updated PRA rulebook, is calculated as the average capital measure divided by the average exposure measure for the quarter, where the average is based on the capital and exposure measure on the last day of each month in the quarter. The average exposure calculation also includes the FPC’s recommendation to allow firms to exclude claims on the central bank from the calculation of the leverage exposure measure, as long as these are matched by deposits denominated in the same currency and of identical or longer maturity.
‘US Partner Portfolio’Co-branded credit card programs with companies across various sectors including travel, entertainment, retail and financial sectors.
‘US Residential Mortgages’ Securities that represent interests in a group of US residential mortgages.
| Barclays PLC and Barclays Bank PLC 2016 Annual Report on Form 20-F | 463 |
Glossary
‘Utilisation rate’ Utilisation of MCA balances expressed as a percentage of total MCA reserve limits.
‘Valuation weighted Loan to Value (LTV) Ratio’ In the context of credit risk disclosures on secured home loans, a means of calculating marked to market LTVs derived by comparing total outstanding balance and the value of total collateral we hold against these balances. Valuation weighted loan to value is calculated using the following formula: LTV = total outstandings in portfolio /total property values of total outstandings in portfolio.
‘Value at Risk (VaR)’ See ‘DVaR’.
‘Weighted off balance sheet commitments’ Regulatoryadd-ons to the leverage exposure measure based on credit conversion factors used in the Standardised Approach to credit risk.
‘Wholesale loans’ / ‘lending’ Lending to larger businesses, financial institutions and sovereign entities.
‘Write-off’ Refers to the point where it is determined that an asset is irrecoverable, or it is no longer considered economically viable to try to recover the asset or it is deemed immaterial or full and final settlement is reached and the shortfall written off. In the event ofwrite-off, the customer balance is removed from the balance sheet and the impairment reserve held against the asset is released.
‘Wrong-way risk’ Arises, in a trading exposure, when there is significant correlation between the underlying asset and the counterparty, which in the event of default would lead to a significant mark to market loss. When assessing the credit exposure of awrong-way trade, analysts take into account the correlation between the counterparty and the underlying asset as part of the sanctioning process.
| 464 | Barclays PLC and Barclays Bank PLC 2016 Annual Report on Form 20-F |
Shareholder information
Resources for shareholders including
contact details for shareholder enquiries
Shareholder information
|
| Page
|
| |||
§ Your Barclays shareholding |
|
466 |
| |||
§ Useful contact details | 467 | |||||

| Barclays PLC and Barclays Bank PLC 2016 Annual Report on Form 20-F | 465 |
Shareholder information
Your Barclays shareholding
Key dates
| ||||
5 April 2017 |
|
|
| |
| Final dividend payment date | ||||
28 April 2017 | ||||
| Q1 Results Announcement | ||||
10 May 2017 | ||||
| Annual General Meeting | ||||
18 September 2017 | ||||
Interim dividend payment date1
|

Annual General Meeting (AGM)
This year’s AGM will be held at the Royal Festival Hall, Southbank Centre, Belvedere Road, London SE1 8XX on Wednesday, 10 May 2017 at 11.00am.
The Chairman and Chief Executive will update shareholders on our performance in 2016 and our goals for 2017. Shareholders will also have the opportunity to ask the Board questions at the meeting.

 | You can find out more at home.barclays/agm |
Dividends
The last dividend for the year ended 31 December 2016 will be 2.09 pence per share, making the 2016 total dividend 3.09 pence, in line with our intention to reduce the dividend in 2016 and 2017 to help us to continue the rundown ofNon-Core. The Board recognise the importance of paying a meaningful dividend and are committed to doing so in the future.
How do Barclays shareholders receive their dividends?
|
| |||||
| ||||||
| As at 31 December 2016, Barclays shareholders received their dividends in the following ways: | |||||
Direct to bank account | 53.5% | |||||
| Cheque | 25.1% | |||||
Scrip dividend programme (new shares)
|
| 21.4%
|
| |||
| ||||||

Save time and receive your dividends faster by choosing to have them paid directly into your bank or building society account
It is easy to set up and your money will be in your bank account on the dividend payment date. If you hold 2,500 shares or less, you can provide your bank or building society details quickly and easily over the telephone using the Equiniti contact details overleaf. If you hold more than 2,500 shares, please contact Equiniti for details of how to change your payment instruction.
Scrip Dividend Programme
Shareholders can choose to have their dividends reinvested in new ordinary Barclays shares through the Scrip Dividend Programme. More information, including the Terms and Conditions and application form, are available on our website.
 | To find out more, contact Equiniti or visit home.barclays/dividends |
Keep your personal details up to date
Please remember to tell Equiniti if:
| § | you move |
| § | you need to update your bank or building society details. |
If you are a Shareview member, you can update your bank or building society account or address details online. If you hold 2,500 shares or less, you can update details quickly and easily over the telephone using the Equiniti contact details overleaf. If you hold more than 2,500 shares you will need to write to Equiniti. You must provide a copy of your share certificate, Sharestore statement or most recent dividend confirmation. If these are not available, you will need to provide a copy of a utility bill or bank statement dated in the last three months.
Donations to charity
We launched a Share Dealing Service in November 2016 aimed at shareholders with relatively small shareholdings for whom it might otherwise be uneconomical to deal. One option open to shareholders was to donate their sale proceeds to ShareGift. As a result of this initiative, more than £100,000 was donated.
|
Returning funds to shareholders
Over 60,000 shareholders did not cash their Shares Not Taken Up (SNTU) cheque following the Rights Issue in September 2013. In 2016, we continued the tracing process to reunite these shareholders with their SNTU monies and any unclaimed dividends. By the end of the year, we had returned over £1.65m to our shareholders.
|
Note
| 1 | Please note that this date is provisional and subject to change. |
| 466 | Barclays PLC and Barclays Bank PLC 2016 Annual Report on Form 20-F |
Useful contact details
Equiniti
 | The Barclays share register is maintained by Equiniti. If you have any questions about your Barclays shares, please contact Equiniti by visitingshareview.co.uk | |
|
Equiniti | |
| 0371 384 20552 (in the UK) | ||
| +44 121 415 7004 (from overseas) | ||
| 0371 384 22552 (for the hearing impaired in the UK) | ||
| +44 121 415 7028 (for the hearing impaired from overseas) | ||
|
Aspect House | |
| Spencer Road | ||
| Lancing | ||
| West Sussex | ||
| BN99 6DA |


American Depositary Receipts (ADRs)
ADRs represent the ownership of Barclays PLC shares which are traded on the New York Stock Exchange. ADRs carry prices, and pay dividends, in US dollars.
| If you have any questions about ADRs, please contact J.P. Morgan:jpmorgan.adr@wellsfargo.comor visitadr.com | |
|
J.P. Morgan Shareholder Services | |
| +1 800 990 1135 (toll free in US and Canada) | ||
| +1 651 453 2128 (outside the US and Canada) | ||
|
JPMorgan Chase Bank N.A. | |
| PO Box 64504 | ||
| St Paul | ||
| MN 55164-0854 | ||
| USA |
Shareholder Relations
| To give us your feedback or if you have any questions, please contact:privateshareholderrelations@barclays.com | |
|
Shareholder Relations | |
| Barclays PLC | ||
| 1 Churchill Place | ||
| London | ||
| E14 5HP |
Share price
| Information on the Barclays share price and other share price tools are available at:home.barclays/investorrelations
|
| Alternative formats | |
Shareholder documents can be provided in large print, audio CD or braille free of charge by calling Equiniti. | ||
| 0371 384 20552 (in the UK) | ||
| +44 121 415 7004 (from overseas) | ||
Audio versions of the Strategic Report will also be available at the AGM
| ||

Managing your shares online
Shareview
Barclays shareholders can go online to manage their shareholding and find out about Barclays performance by joining Shareview.
Through Shareview, you:
| § | will receive the latest updates from Barclays direct to your email. |
| § | can update your address and bank details online. |
| § | can vote in advance of general meetings. |

To join Shareview, please follow these three easy steps:
| ||
| Step 1 | Go toshareview.co.uk | |
| Step 2 | Register for electronic communications by following the instructions on screen | |
Step 3
|
You will be sent an activation code
| |
Shareholder security
Shareholders should be wary of any cold calls with an offer to buy or sell shares. Fraudsters use persuasive and high-pressure techniques to lure shareholders into high-risk investments or scams. You should treat any unsolicited calls with caution.
Please keep in mind that firms authorised by the Financial Conduct Authority (FCA) are unlikely to contact you out of the blue. You should consider getting independent financial or professional advice from someone unconnected to the respective firm before you hand over any money.
 | Report a scam.If you suspect that you have been approached by fraudsters please tell the FCA using the share fraud reporting form atfca.org.uk/scams. You can also call the | |
| FCA Helpline on 0800 111 6768 or through Action Fraud on 0300 123 2040. | ||
Note
| 2 | Lines open 8.30am to 5.30pm Monday to Friday, excluding public holidays. |
| Barclays PLC and Barclays Bank PLC 2016 Annual Report on Form 20-F | 467 |
Signatures
The registrant hereby certifies that it meets all of the requirements for filing on Form20-F and that it has duly caused and authorised the undersigned to sign this annual report on its behalf.
Date February 23rd, 2017
| Barclays PLC
(Registrant) | |||||
| By | ||||||
/s/ Tushar Morzaria | ||||||
Tushar Morzaria, Group Finance Director | ||||||
The registrant hereby certifies that it meets all of the requirements for filing on Form20-F and that it has duly caused and authorised the undersigned to sign this annual report on its behalf.
| Date February 23rd, 2017 | Barclays Bank PLC
(Registrant) | |||||
| By | ||||||
/s/ Tushar Morzaria | ||||||
Tushar Morzaria, Group Finance Director | ||||||
EXHIBIT INDEX
| Exhibit | Description | |
| 1.1 | Articles of Association of Barclays PLC (incorporated by reference to the Form6-K filed on May 2nd, 2013) | |
| 1.2 | Articles of Association of Barclays Bank PLC (incorporated by reference to the Form6-K filed on May 13th, 2010) | |
| 2.1 | Long Term Debt Instruments: Neither Barclays PLC nor Barclays Bank PLC is party to any single instrument relating to long-term debt pursuant to which a total amount of securities exceeding 10% of either Barclays PLC’s or Barclays Bank PLC’s total assets (on a consolidated basis) is authorised to be issued. Each of Barclays PLC and Barclays Bank PLC hereby agrees to furnish to the Securities and Exchange Commission (the “Commission”), upon its request, a copy of any instrument defining the rights of holders of its long-term debt or the rights of holders of the long-term debt of any of its subsidiaries for which consolidated or unconsolidated financial statements are required to be filed with the Commission. | |
| 4.0 | Rules of the Barclays Group Performance Share Plan (2005) (incorporated by reference to the 2006 Form20-F filed on March 26th, 2007) | |
| 4.1 | Rules of the Barclays PLC Renewed 1986 Executive Share Option Scheme (incorporated by reference to the Barclays PLC Registration Statement on FormS-8 (File no.333-153723) filed on September 29th, 2008) | |
| 4.2 | Rules of the Barclays PLC Approved Incentive Share Option Plan (incorporated by reference to the Barclays PLC Registration Statement on FormS-8 (File no.333-153723) filed on September 29th, 2008) | |
| 4.3 | Rules of the Barclays PLC Unapproved Incentive Share Option Plans (incorporated by reference to the Barclays PLC Registration Statement on FormS-8 (File no.333-153723) filed on September 29th, 2008) | |
| 4.4 | Rules of the Barclays PLC Executive Share Award Scheme - Incorporated by reference to the Barclays PLC Registration Statement on FormS-8 (File no.333-173899) filed on May 3rd, 2011) | |
| 4.5 | Rules of the Barclays Group Special Award Performance Share Plan (incorporated by reference to the Barclays PLC Registration Statement on FormS-8 (File no.333-153723) filed on September 29th, 2008 | |
| 4.6 | Rules of the Barclays Group Incentive Share Plan (incorporated by reference to the Barclays PLC Registration Statement on FormS-8 (File no.333-153723) filed on September 29th, 2008) | |
| 4.7 | Rules of Barclays Bank PLC 1999 Directors Deferred Compensation Plan (amended and restated, effective January 1st, 2008) (incorporated by reference to Barclays Bank PLC’s Registration Statement on FormS-8 (File no.333-149301) filed on February 19th, 2008) | |
| 4.8 | Rules of Barclays Bank PLC Senior Management Deferred Compensation Plan (amended and restated, effective January 1st, 2008) (incorporated by reference to Barclays Bank PLC’s Registration Statement on FormS-8 (File no.333-149302) filed on February 19th, 2008) | |
| 4.9 | Rules of the Barclays Group Share Value Plan (incorporated by reference to the 2013 Form20-F filed on | |
| March 14th. 2014) | ||
| 4.10 | Rules of the Barclays PLC Long Term Incentive Plan (Incorporated by reference to the Barclays PLC Registration Statement on FormS-8 (File no.333-173899) filed on May 3rd, 2011) | |
| 4.11 | Rules of the Barclays Group Deferred Share Value Plan | |
| 4.12 | Contract of Employment – Tushar Morzaria (Incorporated by reference to the 2014 Form20-F filed on March 14th, 2014) | |
| 4.13 | Appointment Letter – Reuben Jeffery III (incorporated by reference to the 2009 Form20-F filed on March 19th, 2010) | |
| 4.14 | Appointment Letter – Dambisa Moyo (incorporated by reference to the 2010 Form20-F filed on March 21st, 2011) | |
| 4.15 | Appointment Letter – Tim Breedon (incorporated by reference to the 2012 Form20-F filed on March 13th, 2013) | |
| 4.16 | Appointment Letter – Diane de Saint Victor (incorporated by reference to the 2012 Form20-F filed on March 13th, 2013) | |
| 4.17 | Appointment Letter – Michael Ashley (Incorporated by reference to the 2013 Form20-F filed on March 14th, 2014) | |
| 4.18 | Appointment Letter – Stephen Thieke (Incorporated by reference to the 2013 Form20-F filed on March 14th, 2014) | |
| 4.19 | Appointment Letter - Crawford Gillies (Incorporated by reference to the 2014 Form20-F filed on March 3rd, 2015) | |
| 4.20 | Appointment Letter - John McFarlane (Incorporated by reference to the 2014 Form20-F filed on March 3rd, 2015) | |
| 4.21 | Appointment Letter – Sir Gerry Grimstone (incorporated by reference to the 2015 Form20-F filed on March 1st, 2016) | |
| 4.22 | Appointment Letter – Diane Schueneman (incorporated by reference to the 2015 Form20-F filed on March 1st, 2016) | |
| 4.23 | Contract of employment – James E Staley (incorporated by reference to the 2015 Form20-F filed on March 1st, 2016) | |
| 4.24 | Transfer of Employment – James E Staley | |
| 4.25 | Transfer of Employment – Tushar Morzaria | |
| 4.26 | Appointment Letter – Mary Francis | |
| 7.1 | Ratios of earnings to fixed charges. The calculations can be found in the Barclays Bank PLC financial data on page 448 of theForm 20-F. | |
| 7.2 | Ratios of earnings to combined fixed charges, preference share dividends and similar appropriations. The calculations can be found in the Barclays Bank PLC financial data on page 448 of theForm 20-F. | |
| 7.3 | Ratios of earnings to fixed charges. The calculations can be found in the Barclays PLC financial data on page 426 of theForm 20-F. | |
| 7.4 | Ratios of earnings to combined fixed charges, preference share dividends and similar appropriations. The calculations can be found in the Barclays PLC financial data on page 426 of theForm 20-F. | |
| 8.1 | List of subsidiaries – The list of subsidiaries of Barclays PLC can be found in Note 46 of the Barclays PLC financial statements on pages 308 to 316 of the Form20-F. | |
| 11.1 | Code of Ethics | |
| 12.1 | Certifications filed pursuant to 17 CFR 240.13(a)-14(a) | |
| 13.1 | Certifications filed pursuant to 17 CFR 240. 13(a) and 18 U.S.C 1350(a) and 1350(b) | |
| 15.1 | Consent of PricewaterhouseCoopers LLP for incorporation by reference of reports in certain securities registration statements of Barclays PLC and Barclays Bank PLC. | |
| 99.2 | A table setting forth the issued share capital of Barclays PLC and the Barclays PLC Group’s total shareholders’ equity, indebtedness and contingent liabilities as at 31 December 2016 | |
| 99.3 | A table setting forth the issued share capital of Barclays Bank PLC and the Barclays Bank PLC Group’s total shareholders’ equity, indebtedness and contingent liabilities as at 31 December 2016 | |