Filed Pursuant to Rule 424(b)(2)
Registration No. 333-265158
 |  | Pricing Supplement dated August 1, 2022 to the Prospectus dated May 23, 2022 and the Prospectus Supplement |
$50,000,000 iPath® Series B Bloomberg Agriculture Subindex Total ReturnSM ETN1
$50,000,000 iPath® Series B Bloomberg Aluminum Subindex Total ReturnSM ETN
$250,000,000 iPath® Series B Bloomberg Coffee Subindex Total ReturnSM ETN2
$100,000,000 iPath® Series B Bloomberg Copper Subindex Total ReturnSM ETN3
$50,000,000 iPath® Series B Bloomberg Cotton Subindex Total ReturnSM ETN
iPath® Series B Bloomberg Energy Subindex Total ReturnSM ETN
$100,000,000 iPath® Series B Bloomberg Grains Subindex Total ReturnSM ETN
$50,000,000 iPath® Series B Bloomberg Industrial Metals Subindex Total ReturnSM ETN
$150,000,000 iPath® Series B Bloomberg Livestock Subindex Total ReturnSM ETN4
$50,000,000 iPath® Series B Bloomberg Nickel Subindex Total ReturnSM ETN5
$50,000,000 iPath® Series B Bloomberg Platinum Subindex Total ReturnSM ETN
$50,000,000 iPath® Series B Bloomberg Precious Metals Subindex Total ReturnSM ETN
$50,000,000 iPath® Series B Bloomberg Softs Subindex Total ReturnSM ETN
$100,000,000 iPath® Series B Bloomberg Sugar Subindex Total ReturnSM ETN
$50,000,000 iPath® Series B Bloomberg Tin Subindex Total ReturnSM ETN
This pricing supplement relates to 15 series of iPath® Exchange-Traded Notes (the “ETNs”) that Barclays Bank PLC may issue from time to time. The return of each of the 15 series of ETNs is linked to the performance of a sub-index of the Bloomberg Commodity Index Total ReturnSM (the “Commodity Index” or the “BCOM Index”) (the “Sub-Indices,” and together with the Commodity Index, the “Indices”). Each Index is composed of one or more futures contracts on the relevant commodity or commodities (the “index components”) and is intended to reflect the returns that are potentially available through (1) an unleveraged investment in those contracts plus (2) the rate of interest that could be earned on cash collateral invested in specified Treasury Bills. The ETNs do not guarantee any return of principal at or prior to maturity and do not pay any interest during their term. Instead, you will receive a cash payment in U.S. dollars at maturity or upon early redemption based on the performance of the Index to which your ETNs are linked, less an investor fee.
You may lose all or a substantial portion of your investment within a single day if you invest in the ETNs. Any payment on the ETNs at or prior to maturity, including any repayment of principal, is not guaranteed by any third party and is subject to both the creditworthiness of Barclays Bank PLC and to the exercise of any U.K. Bail-in Power by the relevant U.K. resolution authority. If Barclays Bank PLC were to default on its payment obligations or become subject to the exercise of any U.K. Bail-in Power (or any other resolution measure) by the relevant U.K. resolution authority, you might not receive any amounts owed to you under the ETNs. See “Consent to U.K. Bail-in Power” and “Risk Factors” in this pricing supplement and “Risk Factors” in the accompanying prospectus supplement for more information.
THE ETNS OFFER EXPOSURE TO COMMODITY FUTURES CONTRACTS AND NOT DIRECT EXPOSURE TO COMMODITIES OR THEIR SPOT PRICES. THESE FUTURES CONTRACTS WILL NOT TRACK THE PERFORMANCE OF THE RELEVANT COMMODITIES. In addition, the nature of the commodity futures market has historically resulted in a significant cost to maintain a rolling position in the futures contracts underlying the Indices. As a result, the levels of the Indices, which each track a rolling position in specified futures contracts, may experience significant declines as a result of these costs, known as roll costs, especially over a longer period. The relevant commodity or commodities will perform differently than the Indices and, in certain cases, may have positive performance during periods where the Index underlying your ETNs is experiencing negative performance. In turn, an investment in the ETNs may experience a significant decline in value over time, the risk of which increases the longer that the ETNs are held. For more information, see “Risk Factors” beginning on page PS-16 of this pricing supplement and the historical performance of the Index presented below in this pricing supplement.
The ETNs may not be suitable for all investors and should be used only by investors with the sophistication and knowledge necessary to understand the risks inherent in the relevant Index, the futures contracts that the relevant Index tracks and investments in commodities as an asset class generally. Investors should consult with their broker or financial advisor when making an investment decision and to evaluate their investment in the ETNs and should actively manage and monitor their investments in the ETNs throughout each trading day.
Furthermore, because the investor fee reduces the amount of your return at maturity or upon early redemption, the level of the Index underlying your ETNs will need to increase significantly in order for you to receive at least the amount you invested in the ETNs at maturity or upon early redemption. If the increase in the level of the applicable Index is insufficient to offset the negative effect of the investor fee, or if the applicable Index level decreases, you will receive less than the amount you invested in the ETNs
1 On May 19, 2021, Barclays Bank PLC announced a 3 for 1 split of the iPath® Series B Bloomberg Agriculture Subindex Total ReturnSM ETN (the “Agriculture ETNs”), effective June 4, 2021. Following the split, 3,000,000 Agriculture ETNs, principal amount $16.66666667 per ETN were outstanding.
24,000,000 Coffee ETNs, principal amount $50.00 per ETN, were issued on January 19, 2018; and an additional 1,000,000 Coffee ETNs, principal amount $50.00 per ETN, were issued on March 4, 2020.
3 On May 19, 2021, Barclays Bank PLC announced a 3 for 1 split of the iPath® Series B Bloomberg Copper Subindex Total ReturnSM ETN (the “Copper ETNs”), effective June 4, 2021. Following the split, 6,000,000 Copper ETNs, principal amount $16.66666667 per ETN were outstanding.
4 1,000,000 Livestock ETNs, principal amount $50.00 per ETN, were issued on January 19, 2018; and an additional 2,000,000 Livestock ETNs, principal amount $50.00 per ETN, were issued on November 20, 2019.
5 On May 19, 2021, Barclays Bank PLC announced a 3 for 1 split of the iPath® Series B Bloomberg Nickel Subindex Total ReturnSM ETN (the “Nickel ETNs”), effective June 4, 2021. Following the split, 3,000,000 Nickel ETNs, principal amount $16.66666667 per ETN were outstanding.
Cover Page, continued
at maturity or upon early redemption. Our estimated value of each series of ETNs as of the inception date is $50.00 per ETN. See “Risk Factors” beginning on page PS-16 of this pricing supplement for risks relating to an investment in the ETNs.
The principal terms of each series of ETNs are as follows:
Issuer: Barclays Bank PLC
Series: Global Medium-Term Notes, Series A
Inception and Issue Dates: The ETNs were first sold on January 17, 2018 (the “inception date”) and were first issued on January 19, 2018 (the “issue date”).
No Further Sales or Issuances of the iPath® Series B Bloomberg Energy Subindex Total ReturnSM ETNs: Effective as of the open of trading on April 28, 2022, we have suspended, until further notice, any further sales from inventory and any further issuances of the iPath® Series B Bloomberg Energy Subindex Total ReturnSM ETNs, and announced that neither we nor any of our affiliates will engage in purchase or resale transactions in the iPath® Series B Bloomberg Energy Subindex Total ReturnSM ETNs.
Maturity Date: January 23, 2048
Underlying Indices: The return on each series of ETNs is linked to the performance of the Index to which those ETNs are linked. The Commodity Index is designed to be a benchmark for commodities as an asset class, and the Sub-Indices are each designed to be benchmarks for specific types of commodities as an asset class. Each Index is intended to reflect the returns that are potentially available through an unleveraged investment in the futures contract or contracts on the physical commodity or commodities comprising the relevant Index plus the Treasury Bill rate of interest that could be earned on funds committed to the trading of the underlying futures contracts. On July 1, 2014, UBS Securities LLC (collectively with its affiliates, “UBS”) entered into a commodity index license agreement with Bloomberg Finance L.P., whereby UBS engaged Bloomberg’s services for calculation, publication, administration and marketing of the Bloomberg Commodity IndexesSM. In September 2020, Bloomberg (as defined below) acquired the Bloomberg Commodity IndexesSM. Each Index is calculated, administered and published by Bloomberg Index Services Limited (“BISL” or the “Index Sponsor” and, collectively with its affiliates, “Bloomberg”).
Secondary Market, CUSIP Numbers and ISINs: We have listed each series of ETNs on the NYSE Arca stock exchange (“NYSE Arca”). The ticker symbols, CUSIP numbers and ISINs for the respective ETNs are as follows:
| ETN | Ticker Symbol6 | CUSIP | ISIN |
| iPath® Series B Bloomberg Agriculture Subindex Total ReturnSM ETN | JJA | 06746P589 | US06746P5897 |
| iPath® Series B Bloomberg Aluminum Subindex Total ReturnSM ETN | JJU | 06746P571 | US06746P5715 |
| iPath® Series B Bloomberg Coffee Subindex Total ReturnSM ETN | JO | 06746P563 | US06746P5632 |
| iPath® Series B Bloomberg Copper Subindex Total ReturnSM ETN | JJC | 06746P555 | US06746P5558 |
| iPath® Series B Bloomberg Cotton Subindex Total ReturnSM ETN | BAL | 06746P548 | US06746P5483 |
| iPath® Series B Bloomberg Energy Subindex Total ReturnSM ETN | JJE | 06746P530 | US06746P5301 |
| iPath® Series B Bloomberg Grains Subindex Total ReturnSM ETN | JJG | 06746P522 | US06746P5228 |
| iPath® Series B Bloomberg Industrial Metals Subindex Total ReturnSM ETN | JJM | 06746P514 | US06746P5145 |
| iPath® Series B Bloomberg Livestock Subindex Total ReturnSM ETN | COW | 06746P498 | US06746P4981 |
| iPath® Series B Bloomberg Nickel Subindex Total ReturnSM ETN | JJN | 06746P480 | US06746P4809 |
| iPath® Series B Bloomberg Platinum Subindex Total ReturnSM ETN | PGM | 06746P472 | US06746P4726 |
| iPath® Series B Bloomberg Precious Metals Subindex Total ReturnSM ETN | JJP | 06746P464 | US06746P4643 |
| iPath® Series B Bloomberg Softs Subindex Total ReturnSM ETN | JJS | 06746P456 | US06746P4569 |
| iPath® Series B Bloomberg Sugar Subindex Total ReturnSM ETN | SGG | 06746P449 | US06746P4494 |
| iPath® Series B Bloomberg Tin Subindex Total ReturnSM ETN | JJT | 06746P431 | US06746P4312 |
To the extent that a series of ETNs is listed and an active secondary market in that series of ETNs exists, we expect that investors will purchase and sell the ETNs in that series primarily in this secondary market. We are not required to maintain any listing of any series of the ETNs on NYSE Arca or any other securities exchange.
Consent to U.K. Bail-in Power: Notwithstanding and to the exclusion of any other term of the ETNs or any other agreements, arrangements or understandings between Barclays Bank PLC and any holder or beneficial owner of the ETNs, by acquiring the ETNs, each holder and beneficial owner of the ETNs acknowledges, accepts, agrees to be bound by, and consents to the exercise of, any U.K. Bail-in Power by the relevant U.K. resolution authority. See “Consent to U.K. Bail-in Power” on page PS-39 of this pricing supplement.
6 As of November 15, 2018, the ticker symbol for each series of ETNs was changed to the ticker symbols set forth in the table above. Each of these ticker symbols was used historically in connection with the listing of certain iPath® ETNs (together, the “Delisted ETNs”), each of which was delisted on April 12, 2018 and was linked to the same Indices as the series of ETNs set forth in the table above. The ETNs to which this pricing supplement relates are not the same securities as the Delisted ETNs.
Cover Page, continued
Payment at Maturity
Payment at Maturity: If you hold your ETNs to maturity, you will receive a cash payment per ETN at maturity in U.S. dollars equal to the closing indicative value of your ETN on the final valuation date.
Closing Indicative Value: The closing indicative value for each series of ETN on the initial valuation date was equal to $50. On each subsequent calendar day until maturity or early redemption, the closing indicative value for each series of ETN will equal (1) the daily index factor for such series of ETN on such calendar day (or, if such day is not an index business day, one) times (2) the closing indicative value for such series of ETN on the immediately preceding calendar day minus (3) the investor fee on such calendar day. An “index business day” is a day on which the Index is calculated and published by the Index Sponsor. If the ETNs undergo a split or reverse split, the closing indicative value will be adjusted accordingly.
Barclays Bank PLC implemented a 3 for 1 split of the Agriculture ETNs, the Copper ETNs and the Nickel ETNs, effective at the open of trading on June 4, 2021. For the purpose of calculating the closing indicative value of each of the Agriculture ETNs, the Copper ETNs and the Nickel ETNs on June 4, 2021, the effective date of the split, the “closing indicative value for such series of ETN on the immediately preceding calendar day” in the above formula were adjusted to $21.3609, $22.3942 and $23.4262, respectively, which is equal to the closing indicative value of the relevant series of $64.0827, $67.1826 and $70.2785 on June 3, 2021 divided by 3.
The closing indicative value is not the market price of the ETNs in any secondary market and is not intended as a price or quotation, or as an offer or solicitation for the purchase or sale of your ETNs or as a recommendation to transact in the ETNs at the stated price. The market price of the ETNs at any time may vary significantly from the closing indicative value.
Daily Index Factor: The daily index factor for each series of ETNs on any index business day will equal (1) the closing level of the Index to which those ETNs are linked on such index business day divided by (2) the closing level of the Index to which those ETNs are linked on the immediately preceding index business day.
Investor Fee: The investor fee for each series of ETN on the initial valuation date was equal to zero. On each subsequent calendar day until maturity or early redemption, the investor fee for each series of ETN will be equal to (1) 0.45% times (2) the daily index factor for such series of ETN on that day (or, if such day is not an index business day, one) times (3) the closing indicative value for such ETN on the immediately preceding calendar day divided by (4) 365. Because the investor fee is calculated and subtracted from the closing indicative value on a daily basis, the net effect of the investor fee accumulates over time and is subtracted at the rate of approximately 0.45% per year.
The investor fee reduces the daily return of each series of ETNs. Because the net effect of the investor fee is a fixed percentage of the value of each ETN, the aggregate effect of the investor fee will increase or decrease in a manner directly proportional to the value of each ETN and the amount of ETNs that are held, as applicable.
Barclays Bank PLC implemented a 3 for 1 split of the Agriculture ETNs, the Copper ETNs and the Nickel ETNs, effective at the open of trading on June 4, 2021. For the purpose of calculating the investor fee of each of the Agriculture ETNs, the Copper ETNs and the Nickel ETNs on June 4, 2021, the effective date of the split, the “closing indicative value for such ETN on the immediately preceding calendar day” in the above formula was adjusted to $21.3609, $22.3942 and $23.4262, respectively, which is equal to the closing indicative value of the relevant series of $64.0827, $67.1826 and $70.2785, respectively, on June 3, 2021 divided by 3.
Intraday Indicative Value: The intraday indicative value for any series of ETNs is intended to provide investors with an approximation of the effect that changes in the level of the Index underlying the ETNs during the current trading day would have on the closing indicative value of such series of ETNs from the previous day. Intraday indicative value differs from the closing indicative value in two important respects. First, intraday indicative value is based on the most recent Index level published by the Index Sponsor, which reflects the most recent reported sales prices for the index components, rather than the closing indicative value of a series of ETNs for the immediately preceding calendar day. Second, the intraday indicative value only reflects the accrued investor fee for a series of ETNs at the close of business on the preceding calendar day, but does not include any adjustment for the accrued investor fee of such series of ETNs accruing during the course of the current day.
The intraday indicative value is not the market price of a series of ETNs in any secondary market and is not intended as a price or quotation, or as an offer or solicitation for the purchase or sale of that series of ETNs or as a recommendation to transact in that series of ETNs at the stated price. Because the intraday indicative value is based on the intraday Index levels, it will reflect any lags, disruptions or suspensions that affect the Index underlying your ETNs. The market price of a series of ETNs at any time may vary significantly from the intraday indicative value due to, among other things, imbalances of supply and demand for that series of ETNs (including as a result of any decision of ours to issue, stop issuing or resume issuing additional ETNs), futures contracts included in the Index underlying that series of ETNs and/or other derivatives related to the Index or that series of ETNs; any trading disruptions, suspension or limitations to any of the forgoing; lack of liquidity; severe volatility; transaction costs; credit considerations; and bid-offer spreads. A premium or discount market price over the intraday indicative value can also arise as a result of mismatches of trading hours between a series of ETNs and the futures contracts included in the Index underlying that series of ETNs, actions (or failure to take action) by the Index Sponsor and the relevant exchange of the futures contracts included in the Index and technical or human errors by service providers, market participants and others.
Business Day: A business day means a Monday, Tuesday, Wednesday, Thursday or Friday that is not a day on which banking institutions in New York City generally are authorized or obligated by law, regulation, or executive order to close.
Trading Day: A trading day with respect to the ETNs is a day (i) that is an index business day, (ii) on which trading is generally conducted on NYSE Arca and (iii) on which trading is generally conducted on the markets on which the futures contracts underlying the relevant Index are traded, in each case as determined by the calculation agent in its sole discretion.
Valuation Date: A valuation date means each trading day from January 17, 2018 to January 17, 2048, inclusive, subject to postponement due to the occurrence of a market disruption event, such postponement not to exceed five trading days. We refer to January 17, 2018 as the “initial valuation date” and January 17, 2048 as the “final valuation date” for the ETNs.
Early Redemption
Holder Redemption: Subject to the notification requirements set forth under “Specific Terms of the ETNs—Early Redemption Procedures” in this pricing supplement, you may redeem your ETNs on any redemption date during the term of the ETNs. If you redeem your ETNs, you
Cover Page, continued
will receive a cash payment in U.S. dollars per ETN on such date in an amount equal to the closing indicative value on the applicable valuation date. You must redeem at least 50,000 ETNs of the same series at one time in order to exercise your right to redeem your ETNs on any redemption date. If you hold fewer than 50,000 ETNs of the same series or fewer than 50,000 ETNs of the same series are outstanding, you will not be able to exercise your right to redeem your ETNs. We may from time to time, in our sole discretion, reduce this minimum redemption amount on a consistent basis for all holders of the ETNs.
Notwithstanding the foregoing, we currently have reduced the minimum redemption amount to 5,000 ETNs. Our reduction of the minimum redemption amount will be available to any and all holders of the ETNs on such early redemption dates and will remain in effect until the waiver is removed by us at our sole discretion. We intend to provide to holders of the ETNs at least ten calendar days’ notice prior to removing any waiver for the reduction of the minimum redemption amount for the ETNs. We may, at any time and in our sole discretion, make further modifications to the minimum redemption amount, including, among others, to reinstate the minimum redemption amount of 50,000 ETNs for all redemption dates after such further modification. Any such modification will be applied on a consistent basis for all holders of the ETNs at the time such modification becomes effective.
Issuer Redemption: We may redeem the ETNs (in whole but not in part) at our sole discretion on any business day on or after the inception date until and including the maturity date. To exercise our right to redeem, we must deliver notice to the holders of the ETNs not less than ten calendar days prior to the redemption date on which we intend to redeem the ETNs. If we redeem the ETNs, you will receive a cash payment in U.S. dollars per ETN in an amount equal to the applicable closing indicative value on the valuation date specified by us in such notice.
Redemption Date: In the case of holder redemption, a redemption date is the second business day following each valuation date (other than the final valuation date). The final redemption date will be the second business day following the valuation date that is immediately prior to the final valuation date. In the case of issuer redemption, the redemption date for the ETNs is the fifth business day after the valuation date specified by us in the issuer redemption notice, which will in no event be prior to the tenth calendar day following the date on which we deliver the redemption notice.
Sale to Public
We sold a portion of each series of ETNs on the inception date at 100% of the principal amount through Barclays Capital Inc., our affiliate, as principal, in the initial distribution. Following the inception date, the remainder of the ETNs of each series will be offered and sold from time to time through Barclays Capital Inc., as agent. Sales of each series of ETNs by us after the inception date will be made at market prices prevailing at the time of sale, at prices related to market prices or at negotiated prices. However, we are under no obligation to issue or sell ETNs at any time. If we limit, restrict or stop sales of ETNs, or if we subsequently resume sales of ETNs, the liquidity and trading price of the relevant series of ETNs in the secondary market could be materially and adversely affected. Barclays Capital Inc. will not receive an agent’s commission in connection with sales of the ETNs. Please see “Supplemental Plan of Distribution” in this pricing supplement for more information.
We may use this pricing supplement in the initial sale of the ETNs. In addition, Barclays Capital Inc. or another of our affiliates may use this pricing supplement in market-making transactions in any ETNs after the initial sale of ETNs. Unless we or our agent informs you otherwise in the confirmation of sale or in a notice delivered at the same time as the confirmation of sale, this pricing supplement is being used in a market-making transaction.
The ETNs are not deposit liabilities of Barclays Bank PLC and are not insured by the United States Federal Deposit Insurance Corporation or any other governmental agency of the United States, the United Kingdom or any other jurisdiction.
Neither the Securities and Exchange Commission nor any state securities commission has approved or disapproved of any series of these ETNs or determined that this pricing supplement is truthful or complete. Any representation to the contrary is a criminal offense.

Pricing Supplement dated August 1, 2022
iPath® Series B Bloomberg Agriculture Subindex Total ReturnSM ETN, issued in denominations of $16.66666667
iPath® Series B Bloomberg Copper Subindex Total ReturnSM ETN, issued in denominations of $16.66666667
iPath® Series B Bloomberg Nickel Subindex Total ReturnSM ETN, issued in denominations of $16.66666667
All other series of ETNs, issued in denominations of $50
Cover Page, continued
Suspension of Further Sales and Issuances of the iPath® Series B Bloomberg Energy Subindex Total ReturnSM Exchange-Traded Notes
On April 28, 2022, Barclays Bank PLC announced that it was suspending, until further notice, any further sales from inventory and any further issuances of the iPath® Series B Bloomberg Energy Subindex Total ReturnSM ETNs, and that neither we nor any of our affiliates will engage in purchase or resale transactions in the iPath® Series B Bloomberg Energy Subindex Total ReturnSM ETNs. As described in this pricing supplement, under the heading “Risk Factors ― The Market Value of Each Series of ETNs May Be Influenced by Many Unpredictable Factors, Including Volatile Commodities Prices,” the market value of the iPath® Series B Bloomberg Energy Subindex Total ReturnSM ETNs may be influenced by, among other things, the levels of supply and demand for such ETNs. It is possible that this suspension may influence the market value of the iPath® Series B Bloomberg Energy Subindex Total ReturnSM ETNs. Barclays Bank PLC believes that the limitations on issuance and sale implemented may cause an imbalance of supply and demand in the secondary market for the iPath® Series B Bloomberg Energy Subindex Total ReturnSM ETNs, which may cause such ETNs to trade at a premium or discount in relation to their indicative value. Therefore, any purchase of the iPath® Series B Bloomberg Energy Subindex Total ReturnSM ETNs in the secondary market may be at a purchase price significantly different from their indicative value. In particular, paying a premium purchase price over the indicative value of the iPath® Series B Bloomberg Energy Subindex Total ReturnSM ETNs could lead to significant losses in the event you sell your iPath® Series B Bloomberg Energy Subindex Total ReturnSM ETNs at a time when such premium is no longer present in the marketplace or if we redeem the iPath® Series B Bloomberg Energy Subindex Total ReturnSM ETNs at our discretion. Investors should consult their financial advisors before purchasing or selling the iPath® Series B Bloomberg Energy Subindex Total ReturnSM ETNs, especially such ETNs trading at a premium over their indicative value. Furthermore, if you sell your iPath® Series B Bloomberg Energy Subindex Total ReturnSM ETNs at a price which reflects a discount below the intraday indicative value, you may experience a significant loss.
The following is a summary of terms of 15 series of iPath® Exchange-Traded Notes (the “ETNs”) that Barclays Bank PLC may issue from time to time, as well as a discussion of risks and other considerations you should take into account when deciding whether to invest in the ETNs. The information in this section is qualified in its entirety by the more detailed explanations set forth elsewhere in this pricing supplement and the accompanying prospectus and prospectus supplement. References to the “prospectus” mean our accompanying prospectus, dated May 23, 2022, and references to the “prospectus supplement” mean our accompanying prospectus supplement, dated June 27, 2022, which supplements the prospectus. See “—Additional Documents Related to the Offering of the ETNs” below.
We may, without your consent, create and issue additional securities having the same terms and conditions as any series of the ETNs. We may consolidate the additional securities to form a single class with the outstanding ETNs of that series. We may, but are not required to, offer and sell ETNs after the inception date through Barclays Capital Inc., our affiliate, as agent. We may impose a requirement to purchase a particular minimum amount of ETNs from our inventory in a single purchase, though we may waive this requirement with respect to any purchase at any time in our sole discretion. In addition, we may offer to sell ETNs from our inventory at a price that is greater or less than the prevailing intraday indicative value or the prevailing market price at the time such sale is made. However, we are under no obligation to sell additional ETNs at any time, and if we do sell additional ETNs, we may limit such sales and stop selling additional ETNs at any time.
Any limitation or suspension on the issuance or sale of the ETNs of any series may materially and adversely affect the price and liquidity of the ETNs of that series in the secondary market. Alternatively, the decrease in supply may cause an imbalance in the market supply and demand, which may cause a series of ETNs to trade at a premium over their indicative value. Any premium may be reduced or eliminated at any time. Paying a premium purchase price over the indicative value of the ETNs of any series could lead to significant losses in the event you sell your ETNs
at a time when such premium is no longer present in the marketplace or if we redeem the ETNs of that series. Investors should consult their financial advisors before purchasing or selling the ETNs, especially ETNs trading at a premium over their indicative value.
This section summarizes the following aspects of the ETNs:
| · | What are the ETNs and how do they work? |
| · | How do you redeem your ETNs? |
| · | What are some of the risks of the ETNs? |
| · | Is this the right investment for you? |
| · | What are the tax consequences? |
What Are the ETNs and How Do They Work?
Each series of ETNs are medium-term notes that are senior unsecured debt obligations of Barclays Bank PLC. The ETNs will be issued in denominations of $50 (with the exception of the Agriculture ETNs, the Copper ETNs and the Nickel ETNs, which will be issued in denominations of $16.66666667). The Agriculture ETNs, the Copper ETNs and the Nickel ETNs were issued in denominations of $50 from, and including, the inception date to, but excluding, June 4, 2021, the effective date of the 3 for 1 split of the ETNs.
The return on each series of ETNs is linked to the performance of a sub-index (the “Sub-Indices”) of the Bloomberg Commodity Index Total ReturnSM (the “Commodity Index” or the “BCOM Index,” and together with the Sub-Indices, the “Indices”).
We have listed the ETNs on NYSE Arca. To the extent that an active secondary market in the ETNs exists, we expect that investors will purchase and sell the ETNs primarily in the secondary market.
THE ETNS OFFER EXPOSURE TO COMMODITY FUTURES CONTRACTS AND NOT DIRECT EXPOSURE TO COMMODITIES OR THEIR SPOT PRICES. THESE FUTURES CONTRACTS WILL NOT TRACK THE PERFORMANCE OF THE RELEVANT COMMODITIES. In addition, the nature of the commodity futures market has historically resulted in a significant cost to maintain a rolling position in the futures contracts
PS-1
underlying the Indices. As a result, the levels of the Indices, which each track a rolling position in specified futures contracts, may experience significant declines as a result of these costs, known as roll costs, especially over a longer period. The relevant commodity or commodities will perform differently than the Indices and, in certain cases, may have positive performance during periods where the Index underlying your ETNs is experiencing negative performance. In turn, an investment in the ETNs may experience a significant decline in value over time, the risk of which increases the longer that the ETNs are held. For more information, see “Risk Factors” beginning on page PS-16 of this pricing supplement and the historical performance of the Indices presented below in this pricing supplement.
The ETNs may not be suitable for all investors and should be used only by investors with the sophistication and knowledge necessary to understand the risks inherent in the relevant Index, the futures contracts that the relevant Index tracks and investments in commodities as an asset class generally. Investors should consult with their broker or financial advisor when making an investment decision and to evaluate their investment in the ETNs and should actively manage and monitor their investments in the ETNs throughout each trading day.
The Indices
Each Index is composed of one or more futures contracts on physical commodities (the “index components”) and is intended to reflect the returns that are potentially available through (1) an unleveraged investment in those contracts plus (2) the rate of interest that could be earned on cash collateral invested in specified Treasury Bills.
UBS acquired AIG Financial Product Corp.’s commodity business as of May 6, 2009, at which time, UBS Securities LLC (collectively with its affiliates, “UBS”) and Dow Jones & Company, Inc. (“Dow Jones”) entered into an agreement to jointly market the Indices. The joint marketing agreement with Dow Jones was terminated and on July 1, 2014, UBS entered into a commodity index license agreement (“CILA”) with Bloomberg Finance L.P., whereby UBS engaged Bloomberg’s services for calculation, publication,
administration and marketing of the Indices. As a result of Bloomberg’s assumption of these functions, on July 1, 2014, the Dow Jones-UBS Commodity IndexesSM were re-branded as the Bloomberg Commodity IndexesSM. In September 2020, Bloomberg (as defined below) acquired the Bloomberg Commodity IndexesSM. Each Index is calculated, administered and published by Bloomberg Index Services Limited (“BISL” or the “Index Sponsor” and, collectively with its affiliates, “Bloomberg”).
The Indices are as follows (for additional information on each Index, please see the section entitled “The Indices—General Information,” as well as the Index-specific sections, in this pricing supplement):
| · | The Bloomberg Agriculture Subindex Total ReturnSM (the “Agriculture Sub-Index”) is designed to be a benchmark for agricultural commodities as an asset class and is currently composed of futures contracts on the following eight commodities: coffee, corn, cotton, soybean meal, soybean oil, soybeans, sugar and wheat (futures contracts for Soft (Chicago) and Hard Red Winter (Kansas City)). We refer to the series of ETNs linked to the Agriculture Sub-Index as the “Agriculture ETNs.” |
| · | The Bloomberg Aluminum Subindex Total ReturnSM (the “Aluminum Sub-Index”) is designed to be a benchmark for aluminum as an asset class and is currently composed of one futures contract on the commodity of aluminum. We refer to the series of ETNs linked to the Aluminum Sub-Index as the “Aluminum ETNs.” |
| · | The Bloomberg Coffee Subindex Total ReturnSM (the “Coffee Sub-Index”) is designed to be a benchmark for coffee as an asset class and is currently composed of one futures contract on the commodity of coffee. We refer to the series of ETNs linked to the Coffee Sub-Index as the “Coffee ETNs.” |
| · | The Bloomberg Copper Subindex Total ReturnSM (the “Copper Sub-Index”) is designed to be a benchmark for copper as an asset class and is currently composed of one futures contract on the commodity of copper. We refer to the series of ETNs |
PS-2
linked to the Copper Sub-Index as the “Copper ETNs.”
| · | The Bloomberg Cotton Subindex Total ReturnSM (the “Cotton Sub-Index”) is designed to be a benchmark for cotton as an asset class and is currently composed of one futures contract on the commodity of cotton. We refer to the series of ETNs linked to the Cotton Sub-Index as the “Cotton ETNs.” |
| · | The Bloomberg Energy Subindex Total ReturnSM (the “Energy Sub-Index”) is designed to be a benchmark for energy-related commodities as an asset class and is currently composed of futures contracts on the following five commodities: crude oil (futures contract for Brent crude oil and WTI crude oil), ULS diesel, low sulphur gas oil, natural gas and RBOB gasoline. We refer to the series of ETNs linked to the Energy Sub-Index as the “Energy ETNs.” |
| · | The Bloomberg Grains Subindex Total ReturnSM (the “Grains Sub-Index”) is designed to be a benchmark for grains as an asset class and is currently composed of futures contracts on the following three commodities: corn, soybeans and wheat (futures contracts for Soft (Chicago) and Hard Red Winter (Kansas City)). We refer to the series of ETNs linked to the Grains Sub-Index as the “Grains ETNs.” |
| · | The Bloomberg Industrial Metals Subindex Total ReturnSM (the “Industrial Metals Sub-Index”) is designed to be a benchmark for industrial metals as an asset class and is currently composed of futures contracts on the following four commodities: aluminum, copper, nickel and zinc. We refer to the series of ETNs linked to the Industrial Metals Sub-Index as the “Industrial Metals ETNs.” |
| · | The Bloomberg Livestock Subindex Total ReturnSM (the “Livestock Sub-Index”) is designed to be a benchmark for livestock as an asset class and is currently composed of futures contracts on the following two commodities: lean hogs and live cattle. We refer to the series of ETNs linked to the Livestock Sub-Index as the “Livestock ETNs.” |
| · | The Bloomberg Nickel Subindex Total ReturnSM (the “Nickel Sub-Index”) is designed to be a benchmark for nickel as an asset class and is currently composed of one futures contract on the commodity of nickel. We refer to the series of ETNs linked to the Nickel Sub-Index as the “Nickel ETNs.” |
| · | The Bloomberg Platinum Subindex Total ReturnSM (the “Platinum Sub-Index”) is designed to be a benchmark for platinum as an asset class and is currently composed of one futures contract on the commodity of platinum. We refer to the series of ETNs linked to the Platinum Sub-Index as the “Platinum ETNs.” |
| · | The Bloomberg Precious Metals Subindex Total ReturnSM (the “Precious Metals Sub-Index”) is designed to be a benchmark for precious metals as an asset class and is currently composed of futures contracts on the following two commodities: gold and silver. We refer to the series of ETNs linked to the Precious Metals Sub-Index as the “Precious Metals ETNs.” |
| · | The Bloomberg Softs Subindex Total ReturnSM (the “Softs Sub-Index”) is designed to be a benchmark for soft commodities as an asset class and is currently composed of futures contracts on the following three commodities: coffee, cotton and sugar. We refer to the series of ETNs linked to the Softs Sub-Index as the “Softs ETNs.” |
| · | The Bloomberg Sugar Subindex Total ReturnSM (the “Sugar Sub-Index”) is designed to be a benchmark for sugar as an asset class and is currently composed of one futures contract on the commodity of sugar. We refer to the series of ETNs linked to the Sugar Sub-Index as the “Sugar ETNs.” |
| · | The Bloomberg Tin Subindex Total ReturnSM (the “Tin Sub-Index”) is designed to be a benchmark for tin as an asset class and is currently composed of one futures contract on the commodity of tin. We refer to the series of ETNs linked to the Tin Sub-Index as the “Tin ETNs.” |
PS-3
We refer to the Sub-Indices with multiple index components as the “multiple-component Sub-Indices,” and we refer to the Sub-Indices with a single index component as the “single-component Sub-Indices.”
Inception, Issuance and Maturity
Each series of ETNs were first sold on January 17, 2018 (the “inception date”), were first issued on January 19, 2018 (the “issue date”) and are due on January 23, 2048 (the “maturity date”).
Understanding the Value of the ETNs
The “principal amount” for a series of ETNs is $50.00 per ETN (with the exception of the Agriculture ETNs, the Copper ETNs and the Nickel ETNs, which will be issued in denominations of $16.66666667). The Agriculture ETNs, the Copper ETNs and the Nickel ETNs were issued in denominations of $50 from, and including, the inception date to, but excluding, June 4, 2021, the effective date of the 3 for 1 split of the ETNs.
The “closing indicative value” for any series of ETNs is the value of the ETNs of such series calculated by us on a daily basis and is used to determine the payment at maturity or upon early redemption. The calculation of the closing indicative value on any valuation date following the initial valuation date is based on the closing indicative value for the immediately preceding calendar day. As a result, the closing indicative value of a series of ETNs differs from the intraday indicative value or the trading price of that series. The closing indicative value for each series of ETN on the initial valuation date will equal $50. On each subsequent calendar day until maturity or early redemption, the closing indicative value for each series of ETN will equal (1) the daily index factor for such series of ETNs on such calendar day (or, if such day is not an index business day, one) times (2) the closing indicative value for such series of ETN on the immediately preceding calendar day minus (3) the investor fee on such calendar day. If the ETNs of any series undergo any splits or reverse splits, the closing indicative value for such series of ETNs will be adjusted accordingly.
Barclays Bank PLC implemented a 3 for 1 split of the Agriculture ETNs, the Copper ETNs and the Nickel ETNs, effective at the open of trading on June 4, 2021. For the purpose of calculating the closing indicative value of each of the Agriculture
ETNs, the Copper ETNs and the Nickel ETNs on June 4, 2021, the effective date of the split, the “closing indicative value for such series of ETN on the immediately preceding calendar day” in the above formula was adjusted to $21.3609, $22.3942 and $23.4262, respectively, which is equal to the closing indicative value of the relevant series of $64.0827, $67.1826 and $70.2785 on June 3, 2021 divided by 3.
The “intraday indicative value” for any series of ETNs is intended to provide investors with an approximation of the effect that changes in the level of the Index underlying the ETNs during the current trading day would have on the closing indicative value of such series of ETNs from the previous day. Intraday indicative value differs from the closing indicative value in two important respects. First, intraday indicative value is based on the most recent Index level published by the Index Sponsor, which reflects the most recent reported sales prices for the index components, rather than the closing indicative value of a series of ETNs for the immediately preceding calendar day. Second, the intraday indicative value only reflects the accrued investor fee for a series of ETNs at the close of business on the preceding calendar day, but does not include any adjustment for the accrued investor fee of such series of ETNs accruing during the course of the current day.
The intraday indicative value is not the market price of a series of ETNs in any secondary market and is not intended as a price or quotation, or as an offer or solicitation for the purchase or sale of that series of ETNs or as a recommendation to transact in that series of ETNs at the stated price. Because the intraday indicative value is based on the intraday Index levels, it will reflect any lags, disruptions or suspensions that affect the Index underlying your ETNs. The market price of a series of ETNs at any time may vary significantly from the intraday indicative value due to, among other things, imbalances of supply and demand for that series of ETNs (including as a result of any decision of ours to issue, stop issuing or resume issuing additional ETNs), futures contracts included in the Index underlying that series of ETNs and/or other derivatives related to the Index or that series of ETNs; any trading disruptions, suspension or limitations to any of the forgoing; lack of liquidity; severe volatility;
PS-4
transaction costs; credit considerations; and bid-offer spreads. A premium or discount market price over the intraday indicative value can also arise as a result of mismatches of trading hours between a series of ETNs and the futures contracts included in the Index underlying that series of ETNs, actions (or failure to take action) by the Index Sponsor and the relevant exchange of the futures contracts included in the Index and technical or human errors by service providers, market participants and others.
The daily settlement price of each futures contract underlying the relevant Index is determined at or prior to 2:30 p.m., New York City time, on each trading day. However, because of a time lag in the publication of the daily settlement price, the closing level of the relevant Index, which is based on the daily settlement price, is typically not published until after 4:00 p.m., New York City time. The Index Sponsor suspends real-time calculation of the intraday level of the relevant Index following the initial determination of the daily settlement price (subject to adjustment to reflect any late settlement of relevant futures contracts), even though the futures contracts underlying the relevant Index might continue to trade on their markets. As a result, the intraday indicative value (which reflects the most recently published intraday level of the relevant Index) will not reflect any trading in the futures contracts underlying the relevant Index that might take place during this time period. Therefore, during this time period, the intraday indicative value is likely to differ from the value of the ETNs that would be determined if real-time trading data of the futures contracts were used in the calculation. As a result, we expect that the trading price of the ETNs is likely to diverge from the intraday indicative value during this time period, particularly if there is a significant price movement in the futures contracts during this time period.
The intraday indicative value will not be updated to reflect any trading in the futures contracts included in the Index that might take place after 4:15 p.m. The ETNs trade on the NYSE Arca exchange from approximately 9:30 a.m. to 4:00 p.m., New York City time. The ETNs may also trade during after-hours trading. Therefore, during after-hours trading, the last-published intraday indicative value is likely to differ from any
value of the ETNs determined based on real-time trading data of the futures contracts, particularly if there is a significant price movement in the futures contracts during this time period. It is possible that the value of the ETNs could undergo a rapid and substantial decline outside of ordinary market trading hours. You may not be able to accurately assess the value of the ETNs relative to the trading price during after-hours trading, including any premium or discount thereto, when there is no recent intraday indicative value available.
The intraday indicative value is calculated and published every 15 seconds on each trading day from approximately 9:30 a.m. to approximately 4:15 p.m., New York City time by ICE Data Indices, LLC (ICE Data) or a successor for each series of ETNs under the intraday indicative value (IIV) ticker symbols listed in the following table:
| ETNs | IIV Ticker |
| Agriculture ETNs | JJA.IV |
| Aluminum ETNs | JJU.IV |
| Coffee ETNs | JO.IV |
| Copper ETNs | JJC.IV |
| Cotton ETNs | BAL.V |
| Energy ETNs | JJE.IV |
| Grains ETNs | JJG.IV |
| Industrial Metals ETNs | JJM.IV |
| Livestock ETNs | COW.IV |
| Nickel ETNs | JJN.IV |
| Platinum ETNs | PGM.IV |
| Precious Metals ETNs | JJP.IV |
| Softs ETNs | JJS.IV |
| Sugar ETNs | SGG.IV |
| Tin ETNs | JJT.IV |
For more information regarding the intraday indicative value, see “Valuation of the ETNs—Intraday Indicative Value” in this pricing supplement.
If you sell your ETNs on the secondary market, you will receive the “trading price” for your ETNs, which may be substantially above or below the principal amount, closing indicative value and/or the intraday indicative value because the trading price reflects investor supply and demand for the ETNs. In addition, if you purchase your ETNs at a price which reflects a premium over the closing indicative value, you may experience a significant loss if you sell or redeem your ETNs at a time when such premium is no longer present in the market place or if we exercise our right to
PS-5
redeem the ETNs. Furthermore, if you sell your ETNs at a price which reflects a discount below the intraday indicative value, you may experience a significant loss.
The ETN performance is linked to the performance of the Index underlying your ETNs less an investor fee. There is no minimum limit to the level of the Index underlying your ETNs. Moreover, the ETNs are not principal protected. Therefore, you could lose up to your entire investment in the ETNs.
Furthermore, because the investor fee reduces the amount of your return at maturity or upon early redemption, the level of the Index underlying your ETNs will need to increase significantly in order for you to receive at least the amount you invested in the ETNs at maturity or upon early redemption. If the increase in the level of the applicable Index is insufficient to offset the negative effect of the investor fee, or the level of that Index decreases, you will receive less than the amount you invested in the ETNs at maturity or upon early redemption.
How Do You Redeem Your ETNs?
To redeem your ETNs, you must instruct your broker or other person through whom you hold your ETNs to take the following steps:
| · | deliver a notice of holder redemption, which is attached as Annex A, to us via facsimile or email by no later than 4:00 p.m., New York City time, on the business day prior to the valuation date specified in your notice of redemption. If we receive your notice by the time specified in the preceding sentence, we will respond by sending you a form of confirmation of holder redemption, which is attached as Annex B; |
| · | deliver the signed confirmation of holder redemption to us via facsimile or email in the specified form by 5:00 p.m., New York City time, on the same day. We or our affiliate must acknowledge receipt in order for your confirmation to be effective; |
| · | instruct your Depository Trust Company (“DTC”) custodian to book a delivery vs. payment trade with respect to your ETNs on the valuation date at a price equal to the applicable closing indicative value per ETN, facing Barclays DTC 229; and |
| · | cause your DTC custodian to deliver the trade as booked for settlement via DTC at or prior to 10:00 a.m., New York City time, on the applicable redemption date (the second business day following the applicable valuation date). |
Different brokerage firms may have different deadlines for accepting instructions from their customers. Accordingly, you should consult the brokerage firm through which you own your interest in the ETNs in respect of such deadlines. If we do not receive your notice of holder redemption by 4:00 p.m., New York City time, or your confirmation of holder redemption by 5:00 p.m., New York City time, on the business day prior to the valuation date specified in your notice of redemption, your notice will not be effective and we will not redeem your ETNs on the applicable redemption date. Any redemption instructions for which we (or our affiliate) receive a valid confirmation in accordance with the procedures described above will be irrevocable.
The redemption value is determined according to a formula which relies upon the closing indicative value and will be calculated on a valuation date that will occur after the redemption notice is submitted. It is not possible to publicly disclose, or for you to determine, the precise redemption value prior to your election to redeem. The redemption value may be below the most recent intraday indicative value or closing indicative value of your ETNs at the time when you submit your redemption notice.
What Are Some of the Risks of the ETNs?
An investment in the ETNs involves risks. Some of these risks are summarized here, but we urge you to read the more detailed explanation of risks in “Risk Factors” in this pricing supplement.
PS-6
| · | Uncertain Principal Repayment — There is no minimum limit to the level of each Index. Moreover, the ETNs are not principal protected. Therefore, a decrease in the level of the Index underlying your ETNs could cause you to lose up to your entire investment in the ETNs. Furthermore, because the investor fee reduces the amount of your return at maturity or upon early redemption, the level of the Index underlying your ETNs will need to increase significantly in order for you to receive at least the amount you invested in the ETNs at maturity or upon early redemption. If the increase in the level of the Index underlying your ETNs is insufficient to offset the negative effect of the investor fee, or if the level of the Index underlying your ETNs decreases, you will receive less than the amount you invested in the ETNs at maturity or upon early redemption. |
| · | Credit of Issuer — The ETNs of each series are unsecured and unsubordinated debt obligations of the Issuer, Barclays Bank PLC, and are not, either directly or indirectly, an obligation of any third party. Any payment to be made on the ETNs, including any repayment of principal, is subject to the ability of Barclays Bank PLC to satisfy its obligations as they come due and is not guaranteed by any third party. As a result, the actual and perceived creditworthiness of Barclays Bank PLC may affect the market value of the ETNs and, in the event Barclays Bank PLC were to default on its obligations, you might not receive any amount owed to you under the terms of the ETNs. |
| · | Issuer Redemption — Subject to the procedures described in this pricing supplement, we have the right to redeem or “call” the ETNs of any series (in whole but not in part) at our sole discretion without your consent on any business day on or after the inception date until and including maturity. |
| · | Commodity Market Risk — The return on each series of ETNs is linked to the performance of an Index which, in turn, is linked to the prices of its index components. The prices of the index components may change unpredictably, affecting the level of the Indices and, consequently, the value of your ETNs in unforeseeable ways. |
| · | Limited or Lack of Portfolio Diversification — The index components of the Sub-Indices are concentrated in one part of the commodities sector or in one commodity. Your investment may therefore carry risks similar to a concentrated securities investment in one industry or sector (in the case of the series of ETNs linked to multiple-component Sub-Indices) or in one issuer (in the case of the series of ETNs linked to single-component Sub-Indices). |
| · | No Interest Payments — You will not receive any periodic interest payments on the ETNs. |
| · | A Trading Market for the ETNs May Not Exist — Although we have listed each series of ETNs on NYSE Arca, a trading market for any series of the ETNs may not exist at any time. Even if there is a secondary market for the ETNs, whether as a result of any listing of the ETNs or on an over-the-counter basis, it may not provide enough liquidity to trade or sell your ETNs easily. Certain affiliates of Barclays Bank PLC intend to engage in limited purchase and resale transactions. If they do, however, they are not required to do so and may stop at any time. We are not required to maintain any listing of the ETNs of any series on NYSE Arca or any other securities exchange and may cause the ETNs of any series to be de-listed at our discretion. |
Is This the Right Investment for You?
The ETNs may be a suitable investment for you if:
| · | You do not seek a guaranteed return of principal and you are willing to risk losing up to your entire investment in the ETNs; |
| · | You intend to regularly monitor your investment in the ETNs to ensure that it remains consistent with your market views and investment strategies; |
| · | You do not seek current income from your investment; |
| · | You seek an investment with a return linked to the performance of the Index underlying your ETNs; |
PS-7
| · | You are willing to accept the risk of fluctuations in commodities prices in general and prices of the index components of the Index underlying your ETNs in particular; |
| · | You are willing to accept the risks of an investment linked to the underlying Index, which tracks a rolling position in commodity futures contracts, and in particular risks associated with roll costs reflected in the level of the underlying Index; |
| · | You believe the level of the Index underlying your ETNs will not decrease and will increase by an amount sufficient to offset the investor fee during the term of the ETNs; |
| · | You are willing to hold securities that are subject to an issuer redemption right on or after the inception date; and |
| · | You are willing and able to assume the credit risk of Barclays Bank PLC, as issuer of the ETNs, for all payments under the ETNs and understand that if Barclays Bank PLC were to default on its payment obligations or become subject to the exercise of any U.K. Bail-in Power, you might not receive any amounts due to you under the ETNs, including any repayment of principal. |
The ETNs may not be a suitable investment for you if:
| · | You seek a guaranteed return of principal and you are not willing to risk losing up to your entire investment in the ETNs; |
| · | You do not intend to regularly monitor your investment in the ETNs to ensure that it remains consistent with your market views and investment strategies; |
| · | You seek current income from your investment; |
| · | You are not willing to be exposed to fluctuations in commodities prices in general and prices of the index components of the Index underlying your ETNs in particular; |
| · | You are not willing to accept the risks of an investment linked to the underlying Index, which tracks a rolling position in commodity futures contracts, and in particular risks associated with roll costs reflected in the level of the underlying Index; |
| · | You believe the level of the Index underlying your ETNs will decrease or will not increase by an amount sufficient to offset the investor fee during the term of the ETNs; |
| · | You are not willing to hold ETNs that are subject to an issuer redemption right on or after the inception date; |
| · | You prefer the lower risk and therefore accept the potentially lower returns of fixed income investments with comparable maturities and credit ratings; or |
| · | You are unwilling or unable to assume the credit risk of Barclays Bank PLC, as issuer of the ETNs, for all payments under the ETNs or you are not willing to be exposed to the risk that if Barclays Bank PLC were to default on its payment obligations or become subject to the exercise of any U.K. Bail-in Power, you might not receive any amounts due to you under the ETNs, including any repayment of principal. |
What Are the Tax Consequences?
Absent a change in law or an administrative or judicial ruling to the contrary, in the opinion of our special tax counsel, Davis Polk & Wardwell LLP, each series of ETNs should be treated for U.S. federal income tax purposes as prepaid forward contracts with respect to the relevant Index that are not debt instruments, as discussed further in the section below entitled “Material U.S. Federal Income Tax Considerations.” If the ETNs are so treated, you should generally recognize capital gain or loss upon the sale, exchange, early redemption or maturity of your ETNs in an amount equal to the difference between the amount you receive at such time and your tax basis in the ETNs.
However, the U.S. federal income tax consequences of your investment in the ETNs are uncertain. It is possible that the Internal Revenue Service (the “IRS”) may assert an alternative treatment. Because of this uncertainty, we urge you to consult your own tax advisor as to the tax consequences of your investment in the ETNs.
For a more complete discussion of the U.S. federal income tax consequences of your investment in the ETNs, including possible alternative treatments for the ETNs, see “Material
PS-8
U.S. Federal Income Tax Considerations” in this pricing supplement.
Additional Documents Related to the Offering of the ETNs
You should read this pricing supplement together with the prospectus dated May 23, 2022, as supplemented by the prospectus supplement dated June 27, 2022 relating to our Global Medium-Term Notes, Series A, of which these ETNs are a part. This pricing supplement, together with the documents listed below, contains the terms of the ETNs and supersedes all prior or contemporaneous oral statements as well as any other written materials including preliminary or indicative pricing terms, correspondence, trade ideas, structures for implementation, sample structures, brochures or other educational materials of ours. You should carefully consider, among other things, the matters set forth under “Risk Factors” in the prospectus supplement and this pricing supplement, as the ETNs involve risks not associated with conventional debt securities. We urge you to consult your investment, legal, tax, accounting and other advisors before you invest in the ETNs.
You may access these documents on the SEC website at www.sec.gov as follows (or if such address has changed, by reviewing our filings for the relevant date on the SEC website):
| · | Prospectus dated May 23, 2022: |
http://www.sec.gov/Archives/edgar/data/312070/
000119312522157585/d337542df3asr.htm
| · | Prospectus Supplement dated June 27, 2022: |
http://www.sec.gov/Archives/edgar/data/0000312070/
000095010322011301/dp169388_424b2-prosupp.htm
Our SEC file number is 1-10257. As used in this pricing supplement, “we,” “us” and “our” refer to Barclays Bank PLC.
Conflicts of Interest
Barclays Capital Inc. is an affiliate of Barclays Bank PLC and, as such, has a “conflict of interest” in this offering within the meaning of Rule 5121 of Financial Industry Regulatory Authority, Inc. (“FINRA”). Consequently, this offering is being
conducted in compliance with the provisions of FINRA Rule 5121 (or any successor rule thereto). In addition, Barclays Capital Inc. will not sell the ETNs to a discretionary account without specific written approval from the account holder. For more information, please refer to “Plan of Distribution (Conflicts of Interest)—Conflicts of Interest” in the accompanying prospectus supplement.
PS-9
Hypothetical Examples
The following hypothetical examples show how a series of ETNs would perform in hypothetical circumstances, assuming a starting level for the relevant Index of 100.
Because the investor fee is calculated and subtracted from the closing indicative value on a daily basis, the net effect of the fee accumulates over time and is subtracted at the rate of 0.45% per year. The figures in these examples use the annualized effect of the investor fee for convenience.
The hypothetical examples in this section do not take into account the effects of applicable taxes. The after-tax return you receive on a series of ETNs will depend on the U.S. tax treatment of your ETNs and on your particular circumstances. Accordingly, the after-tax rate of return of your ETNs could be different than the after-tax return of a direct investment in the components of the relevant Index or the relevant Index itself.
Figures for year 30 are as of the final valuation date, and figures for each year prior to year 30 represent the hypothetical amount that would be paid upon early redemption at each anniversary of the inception date, assuming that the relevant valuation date for each early redemption occurs on each anniversary of the inception date. The figures in these examples have been rounded for convenience.
These hypothetical examples are provided for illustrative purposes only. Past performance of the Index underlying your ETNs and the hypothetical performance of your ETNs are not indicative of the future results of the Index or the ETNs. The actual performance of the Index and your ETNs will vary, perhaps significantly, from the examples illustrated below.
Assumptions:
| Investor Fee Rate | Days | Principal | Starting Index |
| 0.45% per annum | 365 | $50.00 | 100.00 |
| A | B | C | D | E | F |
| Year | Index Level | Annualized Index Return | Yearly Investor Fee | Total | Closing Indicative Value |
| A | B | C | C x Previous CINV x 0.45% | Running total of D | C x Previous CINV – E |
| 0 | 100.0000 | - | - | - | $50.0000 |
| 1 | 103.0000 | 3.00% | $0.2318 | $0.2318 | $51.2683 |
| 2 | 106.0900 | 3.00% | $0.2376 | $0.4694 | $52.5687 |
| 3 | 109.2727 | 3.00% | $0.2437 | $0.7130 | $53.9021 |
| 4 | 112.5509 | 3.00% | $0.2498 | $0.9629 | $55.2693 |
| 5 | 115.9274 | 3.00% | $0.2562 | $1.2190 | $56.6712 |
| 6 | 119.4052 | 3.00% | $0.2627 | $1.4817 | $58.1087 |
| 7 | 122.9874 | 3.00% | $0.2693 | $1.7510 | $59.5826 |
| 8 | 126.6770 | 3.00% | $0.2762 | $2.0272 | $61.0939 |
| 9 | 130.4773 | 3.00% | $0.2832 | $2.3104 | $62.6436 |
| 10 | 134.3916 | 3.00% | $0.2904 | $2.6007 | $64.2325 |
| 11 | 138.4234 | 3.00% | $0.2977 | $2.8985 | $65.8618 |
| 12 | 142.5761 | 3.00% | $0.3053 | $3.2037 | $67.5324 |
| 13 | 146.8534 | 3.00% | $0.3130 | $3.5167 | $69.2453 |
| 14 | 151.2590 | 3.00% | $0.3210 | $3.8377 | $71.0017 |
| 15 | 155.7967 | 3.00% | $0.3291 | $4.1668 | $72.8027 |
| 16 | 160.4706 | 3.00% | $0.3374 | $4.5042 | $74.6493 |
| 17 | 165.2848 | 3.00% | $0.3460 | $4.8502 | $76.5428 |
PS-10
| 18 | 170.2433 | 3.00% | $0.3548 | $5.2050 | $78.4843 |
| 19 | 175.3506 | 3.00% | $0.3638 | $5.5688 | $80.4751 |
| 20 | 180.6111 | 3.00% | $0.3730 | $5.9418 | $82.5163 |
| 21 | 186.0295 | 3.00% | $0.3825 | $6.3242 | $84.6093 |
| 22 | 191.6103 | 3.00% | $0.3922 | $6.7164 | $86.7554 |
| 23 | 197.3587 | 3.00% | $0.4021 | $7.1185 | $88.9560 |
| 24 | 203.2794 | 3.00% | $0.4123 | $7.5308 | $91.2124 |
| 25 | 209.3778 | 3.00% | $0.4228 | $7.9536 | $93.5260 |
| 26 | 215.6591 | 3.00% | $0.4335 | $8.3871 | $95.8983 |
| 27 | 222.1289 | 3.00% | $0.4445 | $8.8316 | $98.3307 |
| 28 | 228.7928 | 3.00% | $0.4558 | $9.2873 | $100.8249 |
| 29 | 235.6566 | 3.00% | $0.4673 | $9.7547 | $103.3823 |
| 30 | 242.7262 | 3.00% | $0.4792 | $10.2338 | $106.0046 |
| Annualized Index Return | 3.00% | |||
| Annualized ETN Return | 2.54% |
PS-11
Hypothetical Examples
A | B | C | D | E | F |
| Year | Index Level | Annualized Index Return | Yearly Investor Fee | Total | Closing Indicative Value |
| A | B | C | C x Previous CINV x 0.45% | Running total of D | C x Previous CINV – E |
| 0 | 100.0000 | - | - | - | $50.0000 |
| 1 | 100.4000 | 0.40% | $0.2259 | $0.2259 | $49.9741 |
| 2 | 100.8016 | 0.40% | $0.2258 | $0.4517 | $49.9482 |
| 3 | 101.2048 | 0.40% | $0.2257 | $0.6773 | $49.9223 |
| 4 | 101.6096 | 0.40% | $0.2255 | $0.9029 | $49.8965 |
| 5 | 102.0161 | 0.40% | $0.2254 | $1.1283 | $49.8706 |
| 6 | 102.4241 | 0.40% | $0.2253 | $1.3536 | $49.8448 |
| 7 | 102.8338 | 0.40% | $0.2252 | $1.5788 | $49.8190 |
| 8 | 103.2452 | 0.40% | $0.2251 | $1.8039 | $49.7932 |
| 9 | 103.6581 | 0.40% | $0.2250 | $2.0289 | $49.7674 |
| 10 | 104.0728 | 0.40% | $0.2248 | $2.2537 | $49.7416 |
| 11 | 104.4891 | 0.40% | $0.2247 | $2.4785 | $49.7158 |
| 12 | 104.9070 | 0.40% | $0.2246 | $2.7031 | $49.6901 |
| 13 | 105.3266 | 0.40% | $0.2245 | $2.9276 | $49.6643 |
| 14 | 105.7480 | 0.40% | $0.2244 | $3.1520 | $49.6386 |
| 15 | 106.1709 | 0.40% | $0.2243 | $3.3762 | $49.6129 |
| 16 | 106.5956 | 0.40% | $0.2242 | $3.6004 | $49.5872 |
| 17 | 107.0220 | 0.40% | $0.2240 | $3.8244 | $49.5615 |
| 18 | 107.4501 | 0.40% | $0.2239 | $4.0483 | $49.5358 |
| 19 | 107.8799 | 0.40% | $0.2238 | $4.2721 | $49.5102 |
| 20 | 108.3114 | 0.40% | $0.2237 | $4.4958 | $49.4845 |
| 21 | 108.7447 | 0.40% | $0.2236 | $4.7194 | $49.4589 |
| 22 | 109.1796 | 0.40% | $0.2235 | $4.9429 | $49.4333 |
| 23 | 109.6164 | 0.40% | $0.2233 | $5.1662 | $49.4077 |
| 24 | 110.0548 | 0.40% | $0.2232 | $5.3894 | $49.3821 |
| 25 | 110.4950 | 0.40% | $0.2231 | $5.6125 | $49.3565 |
| 26 | 110.9370 | 0.40% | $0.2230 | $5.8355 | $49.3309 |
| 27 | 111.3808 | 0.40% | $0.2229 | $6.0584 | $49.3054 |
| 28 | 111.8263 | 0.40% | $0.2228 | $6.2812 | $49.2798 |
| 29 | 112.2736 | 0.40% | $0.2226 | $6.5038 | $49.2543 |
| 30 | 112.7227 | 0.40% | $0.2225 | $6.7263 | $49.2288 |
| Annualized Index Return | 0.40% | |||
| Annualized ETN Return | -0.05% |
PS-12
Hypothetical Examples
| A | B | C | D | E | F |
| Year | Index Level | Annualized Index Return | Yearly Investor Fee | Total | Closing Indicative Value |
| A | B | C | C x Previous CINV x 0.45% | Running total of D | C x Previous CINV – E |
| 0 | 100.0000 | - | - | - | $50.0000 |
| 1 | 103.0000 | 3.00% | $0.2318 | $0.2318 | $51.2683 |
| 2 | 106.0900 | 3.00% | $0.2376 | $0.4694 | $52.5687 |
| 3 | 109.2727 | 3.00% | $0.2437 | $0.7130 | $53.9021 |
| 4 | 112.5509 | 3.00% | $0.2498 | $0.9629 | $55.2693 |
| 5 | 115.9274 | 3.00% | $0.2562 | $1.2190 | $56.6712 |
| 6 | 119.4052 | 3.00% | $0.2627 | $1.4817 | $58.1087 |
| 7 | 122.9874 | 3.00% | $0.2693 | $1.7510 | $59.5826 |
| 8 | 126.6770 | 3.00% | $0.2762 | $2.0272 | $61.0939 |
| 9 | 130.4773 | 3.00% | $0.2832 | $2.3104 | $62.6436 |
| 10 | 134.3916 | 3.00% | $0.2904 | $2.6007 | $64.2325 |
| 11 | 138.4234 | 3.00% | $0.2977 | $2.8985 | $65.8618 |
| 12 | 142.5761 | 3.00% | $0.3053 | $3.2037 | $67.5324 |
| 13 | 146.8534 | 3.00% | $0.3130 | $3.5167 | $69.2453 |
| 14 | 151.2590 | 3.00% | $0.3210 | $3.8377 | $71.0017 |
| 15 | 155.7967 | 3.00% | $0.3291 | $4.1668 | $72.8027 |
| 16 | 151.2590 | -2.91% | $0.3181 | $4.4849 | $70.3641 |
| 17 | 146.8534 | -2.91% | $0.3074 | $4.7923 | $68.0073 |
| 18 | 142.5761 | -2.91% | $0.2971 | $5.0894 | $65.7294 |
| 19 | 138.4234 | -2.91% | $0.2872 | $5.3766 | $63.5278 |
| 20 | 134.3916 | -2.91% | $0.2775 | $5.6541 | $61.3999 |
| 21 | 130.4773 | -2.91% | $0.2683 | $5.9224 | $59.3433 |
| 22 | 126.6770 | -2.91% | $0.2593 | $6.1816 | $57.3556 |
| 23 | 122.9874 | -2.91% | $0.2506 | $6.4322 | $55.4344 |
| 24 | 119.4052 | -2.91% | $0.2422 | $6.6744 | $53.5777 |
| 25 | 115.9274 | -2.91% | $0.2341 | $6.9085 | $51.7831 |
| 26 | 112.5509 | -2.91% | $0.2262 | $7.1347 | $50.0486 |
| 27 | 109.2727 | -2.91% | $0.2187 | $7.3534 | $48.3722 |
| 28 | 106.0900 | -2.91% | $0.2113 | $7.5647 | $46.7520 |
| 29 | 103.0000 | -2.91% | $0.2043 | $7.7690 | $45.1860 |
| 30 | 100.0000 | -2.91% | $0.1974 | $7.9664 | $43.6725 |
| Annualized Index Return | 0.00% | |||
| Annualized ETN Return | -0.45% |
PS-13
Investing in the ETNs involves risks. Set forth below is a summary of principal risks associated with an investment in the ETNs. You should refer to the more detailed discussion of these and other risks set forth under “Risk Factors” in this pricing supplement and in the accompanying prospectus supplement.
Risks Relating to the ETNs Generally
| · | The ETNs do not guarantee any return of principal, and you may lose some or all of your investment. |
| · | We may redeem the ETNs of any series at any time on or after the inception date. |
| · | You will not benefit from any increase in the level of the Index underlying your ETNs if such increase is not reflected in the level of that Index on the applicable valuation date. |
| · | You will not receive interest payments on the ETNs or have rights in respect of any of the index components. |
| · | If a market disruption event has occurred or exists on a valuation date, the calculation agent can postpone the determination of, as applicable, the closing indicative value or the maturity date or a redemption date. |
| · | Postponement of a valuation date may result in a reduced amount payable at maturity or upon early redemption. |
Risks Relating to the Issuer
| · | The ETNs are subject to the credit risk of the issuer, Barclays Bank PLC. |
| · | You may lose some or all of your investment if any U.K. Bail-in Power is exercised by the relevant U.K. resolution authority. |
Risks Relating to the Indices Generally
| · | Future prices of the index components that are different relative to their current prices may affect the level of the Indices and result in a reduced amount payable on your ETNs at maturity or upon redemption. |
| · | The ETNs offer exposure to futures contracts and not direct exposure to physical commodities. |
| · | Concentration risks relating to the Indices may adversely affect the value of the ETNs. |
| · | The Indices may in the future include contracts that are not traded on regulated futures exchanges. |
| · | Commodity prices may change unpredictably, affecting the level of the Indices and the value of your ETNs in unforeseeable ways. |
| · | Supply of and demand for physical commodities tends to be particularly concentrated, so prices are likely to be volatile. |
| · | Historical levels of the Indices or any index component should not be taken as an indication of the future performance of the Indices during the term of the ETNs. |
| · | The ETNs will be subject to significant movements in underlying commodities futures markets outside of the hours during which the ETNs are traded on NYSE Arca. |
| · | Changes in law or regulation relating to commodities futures contracts may adversely affect the market value of the ETNs and the amounts payable on your ETNs. |
| · | Data sourcing, data publication and calculation and concentration risks relating to the Indices may adversely affect the market price of the ETNs. |
| · | BISL may be required to replace a designated contract if the existing futures contract is terminated or replaced. |
| · | Changes in the Treasury Bill rate of interest may affect the level of the Indices and your ETNs. |
| · | Suspension or disruptions of market trading in commodities and related futures may adversely affect the value of your ETNs. |
| · | Barclays Bank PLC and its affiliates have no affiliation with the Index Sponsor and are not responsible for their public disclosure of information, which may change over time. |
| · | Barclays Bank PLC has a non-exclusive right to use the Indices. |
| · | The policies of the Index Sponsor and changes that affect the composition and valuation of the Indices or the index components could affect the amount payable on your ETNs and their market value. |
PS-14
Risks Relating to Liquidity and the Secondary Market
| · | The estimated value of the ETNs is not a prediction of the prices at which the ETNs may trade in the secondary market, if any such market exists, and such secondary market prices, if any, may be lower than the principal amount of the ETNs and may be lower than such estimated value of the ETNs. |
| · | The market value of each series of ETNs may be influenced by many unpredictable factors, including volatile commodities prices. |
| · | There may not be an active trading market in the ETNs; sales in the secondary market may result in significant losses. |
| · | The liquidity of the market for the ETNs may vary materially over time. |
| · | The ETNs may trade at a substantial premium to or discount from the closing indicative value and/or the intraday indicative value. |
| · | We have no obligation to issue additional ETNs, and we may cease or suspend sales of the ETNs. |
| · | Changes in our credit ratings may affect the market value of your ETNs. |
| · | There are restrictions on the minimum number of ETNs you may redeem and on the dates on which you may redeem them. |
| · | There may be restrictions on your ability to purchase additional ETNs from us. |
Risks Relating to Conflicts of Interest and Hedging
| · | There are potential conflicts of interest between you and the calculation agent. |
| · | Trading and other transactions by Barclays Bank PLC or its affiliates in instruments linked to Indices or index components may impair the market value of the ETNs. |
| · | Our business activities may create conflicts of interest. |
Risks Relating to Tax Consequences
| · | The tax consequences are uncertain. |
Additional Risks Relating to ETNs Linked to an Index that Includes a Specific Commodity
| · | The ETNs may be subject to certain risks specific to aluminum, coffee, copper, corn, |
cotton, crude oil, gold, ULS diesel, lean hogs, live cattle, natural gas, nickel, platinum, silver, soybean oil, soybeans, sugar, tin, unleaded gasoline, wheat or zinc as a commodity, respectively.
PS-15
The ETNs are senior unsecured debt obligations of Barclays Bank PLC and are not secured debt. The ETNs are riskier than ordinary unsecured debt securities. The return on a series of ETNs is linked to the performance of the Index underlying those ETNs. Investing in a series of ETNs is not equivalent to investing directly in the underlying index components or Index itself. See the section entitled “The Indices—General Information,” as well as the Index-specific sections, in this pricing supplement for more information.
The ETNs may not be suitable for all investors and should be used only by investors with the sophistication and knowledge necessary to understand the risks inherent in the relevant Index, the futures contracts that the relevant Index tracks and investments in commodities as an asset class generally. Investors should consult with their broker or financial advisor when making an investment decision and to evaluate their investment in the ETNs and should actively manage and monitor their investments in the ETNs throughout each trading day.
You may lose all or a substantial portion of your investment within a single day if you invest in the ETNs.
This section describes the most significant risks relating to an investment in the ETNs. We urge you to read the following information about these risks, together with the other information in this pricing supplement and the accompanying prospectus and prospectus supplement, before investing in the ETNs.
You should also consider the tax consequences of investing in the ETNs, significant aspects of which are uncertain. See “Material U.S. Federal Income Tax Considerations” in this pricing supplement.
Risks Relating to the ETNs Generally
The ETNs Do Not Guarantee Any Return of Principal, and You May Lose Some or All of Your Investment
The ETN performance is linked to the performance of the Index underlying your ETNs less an investor fee. There is no minimum limit to the level of the Index underlying your ETNs. Moreover, the ETNs are not principal protected. Therefore, a decrease in the level of the Index underlying your ETNs could cause you to lose up
to your entire investment in the ETNs. You may lose all or a substantial portion of your investment within a single day if you invest in the ETNs.
Furthermore, because the investor fee reduces the amount of your return at maturity or upon early redemption, the level of the Index underlying your ETNs will need to increase significantly in order for you to receive at least the amount you invested in the ETNs at maturity or upon early redemption. If the increase in the level of the Index underlying your ETNs is insufficient to offset the negative effect of the investor fee, or if the level of the Index underlying your ETNs decreases, you will receive less than the amount you invested in the ETNs at maturity or upon early redemption.
We May Redeem the ETNs of any Series at Any Time on or after the Inception Date
We have the right to redeem or “call” the ETNs of any series (in whole but not in part) at our sole discretion without your consent on any business day on or after the inception date until and including the maturity date. If we elect to redeem the ETNs, we will deliver written notice of such election to redeem to the holders of the ETNs not less than ten calendar days prior to the redemption date on which we intend to redeem the ETNs. In this scenario, the ETNs will be redeemed on the fifth business day following the valuation date specified by us in the issuer redemption notice, but in no event prior to the tenth calendar day following the date on which we deliver such notice.
If we exercise our right to redeem a series of ETNs, the payment you receive may be less than the payment that you would have otherwise been entitled to receive at maturity and may be less than the secondary market trading price of that series of ETNs. Also, you may not be able to reinvest any amounts received on the redemption date in a comparable investment. Our right to redeem the ETNs may also adversely impact your ability to sell your ETNs, and/or the price at which you may be able to sell your ETNs, particularly after delivery of the issuer redemption notice.
You Will Not Benefit from Any Increase in the Level of the Index Underlying Your ETNs If Such Increase Is Not Reflected in the Level of that Index on the Applicable Valuation Date
If the Index underlying your ETNs does not increase by an amount sufficient to offset the investor fee between the date you purchased the ETNs and the applicable valuation date (including
PS-16
the final valuation date), we will pay you less than the amount you invested in the ETNs at maturity or upon early redemption. This will be true even if the level of the Index underlying your ETNs as of some date or dates prior to the applicable valuation date would have been sufficiently high to offset the negative effect of the investor fee.
You Will Not Receive Interest Payments on the ETNs or Have Rights in Respect of Any of the Index Components
You will not receive any periodic interest payments on your ETNs. As an owner of the ETNs, you will not have rights that investors in the index components included in the Index may have. Your ETNs will be paid in cash, and you will have no right to receive delivery of any index components or commodities underlying the index components. In addition, the return on your ETNs will not reflect the return you would have realized if you had actually owned the index components or a security directly linked to the performance of the applicable Index and held such investment for a similar period. Any return on your ETNs includes the negative effect of the accrued investor fee. Furthermore, if the level of the Index underlying your ETNs increases during the term of the ETNs, the market value of the ETNs may not increase by the same amount or may even decline.
If a Market Disruption Event Has Occurred or Exists on a Valuation Date, the Calculation Agent Can Postpone the Determination of, as Applicable, the Closing Indicative Value or the Maturity Date or a Redemption Date
The determination of the value of the ETNs on a valuation date, including the final valuation date, may be postponed if the calculation agent determines that a market disruption event has occurred or is continuing on such valuation date. If such a postponement occurs, the value of the index components unaffected by the market disruption event shall be determined on the scheduled valuation date and the value of the affected index component shall be determined using the closing value of the affected index component on the first trading day after that day on which no market disruption event occurs or is continuing. In no event, however, will a valuation date for any series of ETNs be postponed by more than five trading days. As a result, the maturity date or a redemption date for a series of ETNs could also be postponed to the fifth business day following such valuation date, as postponed. If a valuation date is postponed until
the fifth trading day following the scheduled valuation date but a market disruption event occurs or is continuing on such day, that day will nevertheless be the valuation date and the calculation agent will make a good faith estimate in its sole discretion of the level of the relevant Index for such day. See “Specific Terms of the ETNs—Market Disruption Events” in this pricing supplement.
Postponement of a Valuation Date May Result in a Reduced Amount Payable at Maturity or Upon Early Redemption
As the payment at maturity or upon early redemption is a function of, among other things, the change in Index level on the final valuation date or applicable valuation date, as the case may be, the postponement of any valuation date may result in the application of a different applicable change in Index level and an increase in the accrued value of the investor fee and, accordingly, decrease the payment you receive at maturity or upon early redemption.
Risks Relating to the Issuer
The ETNs Are Subject to the Credit Risk of the Issuer, Barclays Bank PLC
The ETNs are senior unsecured debt obligations of the issuer, Barclays Bank PLC, and are not, either directly or indirectly, an obligation of any third party. Any payment to be made on the ETNs depends on the ability of Barclays Bank PLC to satisfy its obligations as they come due and are not guaranteed by a third party. As a result, the actual and perceived creditworthiness of Barclays Bank PLC may affect the market value of the ETNs and, in the event Barclays Bank PLC were to default on its obligations, you may not receive the amounts owed to you under the terms of the ETNs.
You May Lose Some or All of Your Investment If Any U.K. Bail-in Power Is Exercised by the Relevant U.K. Resolution Authority
Notwithstanding and to the exclusion of any other term of the ETNs or any other agreements, arrangements or understandings between Barclays Bank PLC and any holder or beneficial owner of the ETNs, by acquiring the ETNs, each holder and beneficial owner of the ETNs acknowledges, accepts, agrees to be bound by, and consents to the exercise of, any U.K. Bail-in Power by the relevant U.K. resolution authority as set forth under “Consent to U.K. Bail-in Power” in this pricing supplement. Accordingly, any U.K. Bail-in Power may be exercised in such a manner
PS-17
as to result in you and other holders and beneficial owners of the ETNs losing all or a part of the value of your investment in the ETNs or receiving a different security from the ETNs, which may be worth significantly less than the ETNs and which may have significantly fewer protections than those typically afforded to debt securities. Moreover, the relevant U.K. resolution authority may exercise the U.K. Bail-in Power without providing any advance notice to, or requiring the consent of, the holders and beneficial owners of the ETNs. The exercise of any U.K. Bail-in Power by the relevant U.K. resolution authority with respect to the ETNs will not be a default or an event of default and the Trustee (as defined herein) will not be liable for any action that the Trustee takes, or abstains from taking, in either case, in accordance with the exercise of the U.K. Bail-in Power by the relevant U.K. resolution authority with respect to the ETNs. See “Consent to U.K. Bail-in Power” in this pricing supplement as well as “U.K. Bail-in Power,” “Risk Factors—Risks Relating to the Securities Generally—Regulatory action in the event a bank or investment firm in the Group is failing or likely to fail could materially adversely affect the value of the securities” and “Risk Factors—Risks Relating to the Securities Generally—Under the terms of the securities, you have agreed to be bound by the exercise of any U.K. Bail-in Power by the relevant U.K. resolution authority” in the accompanying prospectus supplement.
Risks Relating to the Indices Generally
Future Prices of the Index Components That Are Different Relative to Their Current Prices May Affect the Level of the Indices and Result in a Reduced Amount Payable on Your ETNs at Maturity or Upon Redemption
Each Index is composed of commodity futures contracts on physical commodities, rather than on the underlying physical commodities themselves. Unlike equities, which typically entitle the holder to a continuing stake in a corporation, commodity futures contracts normally specify a certain future month for delivery of the underlying physical commodity. As the exchange-traded futures contracts that comprise the Indices approach expiration, they are replaced by similar contracts that have a later expiration. Thus, for example, a futures contract purchased and held in August may specify an October expiration date. As time passes, the contract expiring in October may be replaced by a contract for delivery in
December. This process is referred to as “rolling.”
If the market for these futures contracts is (putting aside other considerations) in “backwardation,” which means that the prices are lower in the distant delivery months than in the nearer delivery months, the purchase of the December contract would take place at a price that is lower than the sale price of the October contract. Conversely, if the market for these contracts is in “contango,” which means that the prices are higher in the distant delivery months than in the nearer delivery months, the purchase of the December contract would take place at a price that is higher than the sale price of the October contract.
“Roll yield” refers to any profit (i.e., positive roll yield) or loss (i.e., negative roll yield) represented by the difference between (i) the return of buying and selling a futures contract in connection with the rolling process and (ii) the return reflected by the movement in the spot price of the underlying commodity between the purchase date and the sale date of the futures contract. A positive roll yield generally occurs when the price of the longer tenor futures contract is lower than the spot price for the underlying commodity or the price of the shorter tenor futures contract, which is typically realized when the market for such contracts are in “backwardation”; and a negative roll yield generally occurs when the price of the longer tenor futures contract is higher than the spot price for the underlying commodity or the price of the shorter tenor futures contract, which is typically realized when the market for such contracts are in “contango.”
The presence of contango or the absence of backwardation in the commodity markets could result in negative “roll yields.” Because of the potential effects of negative roll yields, it is possible for the level of the Indices to decrease significantly over time even when the spot prices of underlying commodities are stable or increasing. This would accordingly decrease the payment you receive at maturity or upon early redemption of your ETNs.
Certain of the commodities included in the Indices, such as gold, have historically traded in contango markets, and the Indices have experienced periods in which many of the commodities in the Indices are in contango. Although certain of the contracts included in the Indices have historically experienced periods of backwardation, it is possible that such backwardation will not be experienced in the future.
PS-18
The ETNs Offer Exposure to Futures Contracts and Not Direct Exposure to Physical Commodities
The ETNs offer investors exposure to the price of futures contracts and not to the spot price of physical commodities. The price of a commodity futures contract reflects the expected value of the commodity upon delivery in the future, whereas the spot price of a commodity reflects the immediate delivery value of the commodity. A variety of factors can lead to a disparity between the expected future price of a commodity and the spot price at a given point in time, such as the cost of storing the commodity for the term of the futures contract, interest charges to finance the purchase of the commodity, market demand for the futures contract and expectations concerning supply and demand for the commodity. The price movement of a futures contract is typically correlated with the movements of the spot price of the reference commodity, but the correlation is generally imperfect and price moves in the spot market may not be reflected in the futures market (and vice versa). Accordingly, the ETNs may underperform a similar investment that reflects the return on the physical commodity.
Concentration Risks Relating to the Indices May Adversely Affect the Value of the ETNs
Because each series of ETNs is linked to an Index, which is comprised of one or more contracts on physical commodities, it will be less diversified than other funds, investment portfolios or indices investing in or tracking a broader range of products and, therefore, could experience greater volatility. You should be aware, in particular, that other commodities indices may be more diversified in terms of both the number of and variety of futures contracts on commodities than the Index underlying your ETNs. Your investment may carry risks similar to a concentrated securities investment in one industry or sector (in the case of the series of ETNs linked to multiple-component Sub-Indices) or in one issuer (in the case of the series of ETNs linked to single-component Sub-Indices).
The Indices May in the Future Include Contracts That Are Not Traded on Regulated Futures Exchanges
At present, the Index is composed exclusively of futures contracts traded on regulated futures exchanges (referred to in the United States as “designated contract markets”). As described below, however, any of the Indices may in the future include over-the-counter contracts (such
as swaps and forward contracts) traded on trading facilities that are subject to lesser degrees of regulation or, in some cases, no substantive regulation. As a result, trading in such contracts, and the manner in which prices and volumes are reported by the relevant trading facilities, may not be subject to the provisions of, and the protections afforded by, the U.S. Commodity Exchange Act, or other applicable statutes and related regulations, that govern trading on regulated U.S. futures exchanges, or similar statutes and regulations that govern trading on regulated foreign exchanges. In addition, many electronic trading facilities have only recently initiated trading and do not have significant trading histories. As a result, the trading of contracts on such facilities, and the inclusion of such contracts in any of the Indices, may be subject to certain risks not presented by most exchange-traded futures contracts, including risks related to the liquidity and price histories of the relevant contracts.
Commodity Prices May Change Unpredictably, Affecting the Level of the Indices and the Value of Your ETNs in Unforeseeable Ways
Trading in futures contracts on physical commodities, including trading in the index components, is speculative and can be extremely volatile. Market prices of the index components may fluctuate rapidly based on numerous factors, including: changes in supply and demand relationships (whether actual, perceived, anticipated, unanticipated or unrealized); weather; agriculture; trade; fiscal, monetary and exchange control programs; domestic and foreign political and economic events and policies; disease; pestilence; technological developments; changes in interest rates, whether through governmental action or market movements; and monetary and other governmental policies, action and inaction. The current or “spot” prices of the underlying physical commodities may also affect, in a volatile and inconsistent manner, the prices of futures contracts in respect of the relevant commodity. These factors may affect the level of the Index underlying your ETNs and therefore the value of your ETNs in varying ways, and different factors may cause the prices of index components, and the volatilities of their prices, to move in inconsistent directions at inconsistent rates.
PS-19
Supply of and Demand for Physical Commodities Tends to be Particularly Concentrated, So Prices Are Likely to Be Volatile
The prices of physical commodities, including the commodities underlying index components, can fluctuate widely due to supply and demand disruptions in major producing or consuming regions or industries.
Certain commodities are used primarily in one industry, and fluctuations in levels of activity in (or the availability of alternative resources to) one industry may have a disproportionate effect on global demand for a particular commodity. Moreover, recent growth in industrial production and gross domestic product has made China and other developing nations oversized users of commodities and has increased the extent to which certain commodities rely on those markets. Political, economic and other developments that affect those countries may affect the value of the commodities underlying the index components included in an Index and, thus, the level of the ETNs linked to that Index.
In addition, because certain of the commodities underlying the index components may be produced in a limited number of countries and may be controlled by a small number of producers, political, economic and supply-related events in such countries or with such producers could have a disproportionate impact on the prices of such commodities and therefore the value of your ETNs.
Historical Levels of the Indices or Any Index Component Should Not Be Taken as an Indication of the Future Performance of the Indices During the Term of the ETNs
It is impossible to predict whether the level of the Indices will fall or rise. The actual performance of the Index underlying your ETNs or any index component over the term of the ETNs, as well as the amount payable at maturity or upon early redemption, may bear little relation to the historical values of that Index or the index components, which in most cases have been highly volatile.
The ETNs Will Be Subject to Significant Movements in Underlying Commodities Futures Markets Outside of the Hours During Which the ETNs are Traded on NYSE Arca
The commodities futures markets on which certain of the index components are traded are located in Europe and, therefore, are open for
trading in different time zones than that of NYSE Arca. Significant price movements may take place in the underlying commodities futures markets during hours when the ETNs are not traded on NYSE Arca, and those movements may be reflected in the market value of the ETNs when trading of the ETNs commences on NYSE Arca.
Changes in Law or Regulation Relating to Commodities Futures Contracts May Adversely Affect the Market Value of the ETNs and the Amounts Payable on Your ETNs.
Commodity futures contracts, such as the index components, are subject to legal and regulatory regimes that impose significant regulatory requirements on the trading of such instruments, and on market participants. The Dodd-Frank Wall Street Reform and Consumer Protection Act (the “Dodd-Frank Act”) regulatory scheme (including the rulemaking authority granted to the Commodity Futures Trading Commission (“CFTC”)) extended and expanded this regime. In particular, for example, while position limits currently exist with respect to futures contracts on physical commodities, the CFTC’s proposed rules under Dodd-Frank would create a more extensive and restrictive set of position limits. It is currently unclear whether the proposed position limit rules will be adopted. However, if adopted as proposed, the rules could adversely affect the cost and liquidity of futures contracts and the market value of the ETNs. Similarly, other regulatory organizations (such as the European Securities and Markets Authority) have proposed, and in the future may propose, further reforms similar to those enacted by the Dodd-Frank Act or other legislation which could have an adverse impact on the liquidity and depth of the commodities, futures and derivatives markets. Any of these changes in laws or regulations may have a material adverse effect on the market value of the ETNs and any amounts payable or property deliverable on the ETNs.
Data Sourcing, Data Publication and Calculation and Concentration Risks Relating to the Indices May Adversely Affect the Market Price of the ETNs
Because the ETNs are linked to Indices which are composed of a basket of exchange-traded futures contracts on commodities, the Indices will be less diversified than other funds or investment portfolios investing in, or notes linked to, a broader range of products and, therefore, could experience greater volatility. Additionally, the
PS-20
annual composition of the Indices will be recalculated in reliance upon historic price, liquidity and production data that are subject to potential errors in data sources or other errors that may affect the weighting of components of the Indices. Any discrepancies that require revision are not applied retroactively but will be reflected in the weighting calculations of the Indices for the following period. Additionally, BISL may not discover every discrepancy.
Furthermore, the weightings for the Indices are determined by BISL, which has a significant degree of discretion with respect to Indices. This discretion would permit, among other things, changes to the composition of the Indices or changes to the manner or timing of the publication of the levels of the Indices, at any time during the year if BISL deemed the changes necessary in light of factors that include, but are not limited to (i) changes in liquidity of the underlying futures contracts that are included in the Indices or (ii) changes in legal, regulatory, sourcing or licensing matters relating to publication or replication of the Indices. In particular, without limitation, BISL’s access and rights to use data in connection with calculating, publishing and licensing the Indices remain subject to the ongoing consent of the sources of such data (including, without limitation, exchanges), which consent can be revoked at any time. Further, the sources of such data reserve the right to revise the terms and conditions of access and use of their data upon notice to BISL. BISL reserves the right to modify the composition of the Indices on an as needed basis to minimize the impact of any loss of access to or revised terms of use with respect to such source data on the Indices.
BISL has no obligation to take the needs of any parties to transactions involving the Indices into consideration when reweighting or making any other changes to the Indices.
BISL May Be Required to Replace a Designated Contract if the Existing Futures Contract Is Terminated or Replaced
A futures contract known as a “designated contract” has been selected as the reference contract for the physical commodity underlying each index component. Data concerning this designated contract will be used to calculate each Index that includes that index component. If a designated contract were to be terminated or replaced in accordance with the rules set forth in the Bloomberg Commodity Index Methodology, (a document that is considered proprietary to the
Index Sponsor), a comparable futures contract would be selected by BISL, if available, to replace that designated contract. The termination or replacement of any designated contract may have an adverse impact on the value of any Index in which the relevant index component is included.
Changes in the Treasury Bill Rate of Interest May Affect the Level of the Indices and Your ETNs
Because the level of each of the Indices is linked, in part, to the Treasury Bill rate of interest that could be earned on cash collateral invested in specified Treasury Bills, changes in the Treasury Bill rate of interest may affect the amount payable on your ETNs at maturity or upon redemption and, therefore, the market value of your ETNs. Assuming the trading prices of the index components included in the Index to which your ETNs is linked remain constant, an increase in the Treasury Bill rate of interest will increase the level of the Index and, therefore, the value of your ETNs. A decrease in the Treasury Bill rate of interest will adversely impact the level of the Index and, therefore, the value of your ETNs.
Suspension or Disruptions of Market Trading in Commodities and Related Futures May Adversely Affect the Value of Your ETNs
The commodity futures markets occasionally experience disruptions in trading (including temporary distortions or other disruptions) due to various factors, such as lack of liquidity in the markets, the participation of speculators and government regulation and intervention. In addition, U.S. futures exchanges (including the New York Mercantile Exchange) and some foreign exchanges have regulations that limit the amount of fluctuation in some futures contract prices that may occur during a single business day. These limits are generally referred to as “daily price fluctuation limits” and the maximum or minimum price of a contract on any given day as a result of these limits is referred to as a “limit price.” Once the limit price has been reached in a particular contract, no trades may be made at a price beyond the limit, or trading may be limited for a set period of time. Limit prices have the effect of precluding trading in a particular contract or forcing the liquidation of contracts at potentially disadvantageous times or prices. These circumstances could adversely affect the level of the Index underlying your ETNs and, therefore, the value of your ETNs.
PS-21
Barclays Bank PLC and Its Affiliates Have No Affiliation with the Index Sponsor and Are Not Responsible for Their Public Disclosure of Information, Which May Change Over Time
We and our affiliates are not affiliated with the Index Sponsor in any way and have no ability to control or predict their actions, including any errors in, or discontinuation of disclosure regarding their methods or policies relating to the calculation of the Indices. The Index Sponsor is not under any obligation to continue to calculate the Indices or required to calculate any successor indices. If the Index Sponsor discontinues or suspends the calculation of an Index, it may become difficult to determine the market value of the ETNs linked to that Index or the amount payable at maturity or upon redemption. The calculation agent may designate a successor index selected in its sole discretion. If the calculation agent determines in its sole discretion that no successor index comparable to the discontinued or suspended Index exists, the amount you receive at maturity or upon redemption of the ETNs linked to that Index will be determined by the calculation agent in its sole discretion. See “Specific Terms of the ETNs—Market Disruption Event” and “—Discontinuance or Modification of an Index” in this pricing supplement.
We have derived all information in this pricing supplement regarding the Indices, including, without limitation, its make-up, method of calculation and changes in its components, from (i) publicly available sources and (ii) the Bloomberg Commodity Index Methodology (a document that is considered proprietary to Bloomberg). We have not independently verified this information. You, as an investor in the ETNs, should make your own investigation into the Indices and the Index Sponsor. The Index Sponsor has no obligation to consider your interests as a holder of the ETNs.
Barclays Bank PLC Has a Non-Exclusive Right to Use the Indices
We have been granted a non-exclusive right to use the Indices and related service marks and trademarks in connection with the ETNs. If we breach our obligations under the license, Bloomberg will have the right to terminate the license. If Bloomberg chooses to terminate the license agreement, we still have the right to use the Indices and related service marks and trademarks in connection with the ETNs until their maturity, provided that we cure our breach within thirty days of the termination of the license. If we
fail to cure this breach, it may become difficult for us to determine the closing indicative value or your payment at maturity in the ETNs. The calculation agent in this case will determine the level of the Indices or the fair market value of the ETNs—and thus the amount payable at maturity or the closing indicative value—in a manner it considers appropriate in its reasonable discretion.
The Policies of the Index Sponsor and Changes That Affect the Composition and Valuation of the Indices or the Index Components Could Affect the Amount Payable on Your ETNs and Their Market Value
The policies of the Index Sponsor concerning the calculation of the level of the Indices, additions, deletions or substitutions of index components and the manner in which changes affecting the index components are reflected in any Index could affect the levels of the Indices and, therefore, the amount payable on your ETNs at maturity or upon early redemption and the market value of your ETNs prior to maturity.
Additional commodity futures contracts may satisfy the eligibility criteria for inclusion in an Index, and the commodity futures contracts currently included in an Index may fail to satisfy such criteria. The weighting factors applied to each futures contract included in each Index may change annually, based on changes in commodity production and volume statistics. In addition, the Index Sponsor may modify the methodology for determining the composition and weighting of each Index, for calculating its value in order to assure that the relevant Index represents an adequate measure of market performance or for other reasons, or for calculating the level of the relevant Index. The Index Sponsor may also discontinue or suspend calculation or publication of any of the Indices, in which case it may become difficult to determine the level of that Index. Any such changes could adversely affect the value of your ETNs.
Modifications of the methodology for determining the composition and weighting of an Index could adversely affect the amount paid in connection with or the value of the relevant ETNs, which will continue to be based on the relevant Index. In addition, if events such as those identified above occur, or if the level of any Index is not available or cannot be calculated because of a market disruption event or for any other reason, the calculation agent may be required to make a good faith estimate in its sole discretion of the level of such Index. The circumstances in which
PS-22
the calculation agent will be required to make such a determination are described more fully under “Specific Terms of the ETNs—Market Disruption Event,” “—Discontinuance or Modification of an Index” and “—Role of Calculation Agent.”
Risks Relating to Liquidity and the Secondary Market
The Estimated Value of the ETNs Is Not a Prediction of the Prices at Which the ETNs May Trade in the Secondary Market, If Any Such Market Exists, and Such Secondary Market Prices, If Any, May Be Lower Than the Principal Amount of the ETNs and May Be Lower Than Such Estimated Value of the ETNs
The estimated value of the ETNs is not a prediction of the prices at which the ETNs may be redeemed or at which the ETNs may trade in secondary market transactions, if any such market exists, including on NYSE Arca. The price at which you may be able to sell the ETNs in the secondary market at any time will be influenced by many factors that cannot be predicted, such as market conditions, and any bid and ask spread for similar sized trades, and may be substantially less than our estimated value of the ETNs at the time of pricing as of the inception date. For more information regarding additional factors that may influence the market value of the ETNs, please see the risk factor “Risks Relating to Each Series of ETNs—The Market Value of Each Series of ETNs May Be Influenced by Many Unpredictable Factors, Including Volatile Commodities Prices.”
The Market Value of Each Series of ETNs May Be Influenced by Many Unpredictable Factors, Including Volatile Commodities Prices
The market value of your ETNs may fluctuate between the date you purchase them and the applicable valuation date. You may also sustain a significant loss if you sell your ETNs in the secondary market. We expect that generally the value of the index components will affect the Index underlying your ETNs and thus the market value of those ETNs and the payment you receive at maturity or upon early redemption, more than any other factor. Several other factors, many of which are beyond our control, and many of which could themselves affect the prices of the index components, will influence the market value of a series of the ETNs and the payment you receive at maturity or upon early redemption, including the following:
| · | prevailing spot prices for the commodities underlying the index component or components (See the risk factor “Risks Relating to Indices Generally―Commodity Prices May Change Unpredictably, Affecting the Level of the Indices and the Value of Your ETNs in Unforeseeable Ways”); |
| · | supply and demand for the ETNs, including inventory positions with Barclays Capital Inc. or any market maker and any decision we may make not to issue additional ETNs or to cease or suspend sales of ETNs from inventory; |
| · | the level of contango or backwardation in the markets for the relevant commodity futures contracts and the roll costs associated with maintaining a rolling position in such futures contracts; |
| · | the time remaining to maturity of the ETNs; |
| · | the volatility of the Index underlying your ETNs, the market prices of the index components and the prices of the relevant commodities; |
| · | economic, financial, political, regulatory, geographical, or judicial events that affect the level of the underlying Index or the market price of the index components included in that Index; |
| · | the general interest rate environment; |
| · | the perceived creditworthiness of Barclays Bank PLC; or |
| · | supply and demand in the listed and over-the-counter commodity derivative markets. |
These factors interrelate in complex ways, and the effect of one factor on the market value of your ETNs may offset or enhance the effect of another factor.
There May Not Be an Active Trading Market in the ETNs; Sales in the Secondary Market May Result in Significant Losses
Although we have listed each series of ETNs on NYSE Arca, a trading market for any series of the ETNs may not exist at any time. Even if there is a secondary market for one or more series of the ETNs, whether as a result of any listing of the ETNs of such series or on an over-the-counter basis, it may not provide enough liquidity for you to trade or sell your ETNs easily. Although certain affiliates of Barclays Bank PLC may engage in limited purchase and resale
PS-23
transactions in the ETNs, they are not required to do so. If they decide to engage in such transactions, they may stop at any time. We are not required to maintain the listing of any series of ETNs on NYSE Arca or any other securities exchange and may cause the ETNs to be de-listed at our discretion.
The Liquidity of the Market for the ETNs May Vary Materially Over Time
As stated on the cover of this pricing supplement, we sold a portion of the ETNs on the inception date, and the remainder of the ETNs may be offered and sold from time to time through Barclays Capital Inc., our affiliate, as agent. Also, the number of ETNs of any series outstanding or held by persons other than our affiliates could be reduced at any time due to holder redemptions of the ETNs. Accordingly, the liquidity of the market for a series of ETNs could vary materially over the term of the ETNs. While you may elect to redeem your ETNs prior to maturity, holder redemption is subject to the conditions and procedures described elsewhere in this pricing supplement, including the condition that you must redeem at least 50,000 (subject to the reduction of the minimum redemption size to 5,000 ETNs as described elsewhere in this pricing supplement) ETNs of the same series at one time in order to exercise your right to redeem your ETNs on any redemption date.
The ETNs May Trade at a Substantial Premium to or Discount from the Closing Indicative Value and/or the Intraday Indicative Value
The ETNs may trade at a substantial premium to or discount from the closing indicative value and/or the intraday indicative value. The closing indicative value is the value of the ETNs calculated by us on a daily basis and is used to determine the payment at maturity or upon early redemption. The intraday indicative value is meant to approximate on an intraday basis the component of the ETN’s value that is attributable to the Index and is provided for reference purposes only. In contrast, the market price of the ETNs at any time is the price at which you may be able to sell your ETNs in the secondary market at that time, if one exists.
If you sell your ETNs on the secondary market, you will receive the market price for your ETNs, which may be substantially above or below the closing indicative value and/or the intraday indicative value due to, among other things, imbalances of supply and demand for the ETNs (including as a result of any decision of ours to
issue, stop issuing or resume issuing additional ETNs), futures contracts included in the Index and/or other derivatives related to the Index or the ETNs; any trading disruptions, suspension or limitations to any of the forgoing; lack of liquidity; severe volatility; transaction costs; credit considerations and bid-offer spreads. A premium or discount market price over the intraday indicative value can also arise as a result of mismatches of trading hours between the ETNs and the futures contracts included in the Index, actions (or failure to take action) by the Index Sponsor and the NYSE Arca and technical or human errors by service providers, market participants and others. In addition, paying a premium purchase price over the intraday indicative value could lead to significant losses if you sell your ETNs at a time when such premium is no longer present in the market place or if we exercise our right to redeem the ETNs. Furthermore, if you sell your ETNs at a price which reflects a discount below the intraday indicative value, you may experience a significant loss.
The daily settlement price of each futures contract underlying the relevant Index is determined at or prior to 2:30 p.m., New York City time, on each trading day. However, because of a time lag in the publication of the daily settlement price, the closing level of the relevant Index, which is based on the daily settlement price, is typically not published until after 4:00 p.m., New York City time. The Index Sponsor suspends real-time calculation of the intraday level of the relevant Index following the initial determination of the daily settlement price (subject to adjustment to reflect any late settlement of relevant futures contracts), even though the futures contracts underlying the relevant Index might continue to trade on their markets. As a result, the intraday indicative value (which reflects the most recently published intraday level of the relevant Index) will not reflect any trading in the futures contracts underlying the relevant Index that might take place during this time period. Therefore, during this time period, the intraday indicative value is likely to differ from the value of the ETNs that would be determined if real-time trading data of the futures contracts were used in the calculation. As a result, we expect that the trading price of the ETNs is likely to diverge from the intraday indicative value during this time period, particularly if there is a significant price movement in the futures contracts during this time period.
PS-24
The intraday indicative value will not be updated to reflect any trading in the futures contracts included in the Index that might take place after 4:15 p.m. The ETNs trade on the NYSE Arca exchange from approximately 9:30 a.m. to 4:00 p.m., New York City time. The ETNs may also trade during after-hours trading. Therefore, during after-hours trading, the last-published intraday indicative value is likely to differ from any value of the ETNs determined based on real-time trading data of the futures contracts, particularly if there is a significant price movement in the futures contracts during this time period. It is possible that the value of the ETNs could undergo a rapid and substantial decline outside of ordinary market trading hours. You may not be able to accurately assess the value of the ETNs relative to the trading price during after-hours trading, including any premium or discount thereto, when there is no recent intraday indicative value available.
We Have No Obligation to Issue Additional ETNs, and We May Cease or Suspend Sales of the ETNs
As further described in the accompanying prospectus supplement under “Summary—Medium-Term Notes—Amounts That We May Issue” on page S-3 and “Summary—Medium-Term Notes—Reissuances or Reopened Issues” on page S-3, we have the right, but not the obligation, to issue additional ETNs once the initial distribution is complete. We also reserve the right to cease or suspend sales of the ETNs from inventory held at any time after the inception date.
Any limitation or suspension on the issuance or sale of the ETNs may materially and adversely affect the price and liquidity of the ETNs in the secondary market. Alternatively, the decrease in supply may cause an imbalance in the market supply and demand, which may cause the ETNs to trade at a premium over their indicative value. Any premium may be reduced or eliminated at any time. Paying a premium purchase price over the indicative value of the ETNs could lead to significant losses in the event you sell your ETNs at a time when such premium is no longer present in the marketplace or if we redeem the ETNs at our discretion. Investors should consult their financial advisors before purchasing or selling the ETNs, especially ETNs trading at a premium over their indicative value.
Changes in Our Credit Ratings May Affect the Market Value of Your ETNs
Our credit ratings are an assessment of our ability to pay our obligations, including those on the ETNs. Consequently, actual or anticipated changes in our credit ratings may affect the market value of your ETNs. However, because the return on your ETNs is dependent upon certain factors in addition to our ability to pay our obligations on your ETNs, an improvement in our credit ratings will not reduce the other investment risks related to your ETNs.
There Are Restrictions on the Minimum Number of ETNs You May Redeem and on the Dates on Which You May Redeem Them
You must redeem at least 50,000 ETNs of the same series at one time in order to exercise your right to redeem your ETNs on a redemption date. Accordingly, if you hold fewer than 50,000 ETNs of the same series or fewer than 50,000 ETNs of the same series are outstanding, you will not be able to purchase enough ETNs to meet the minimum size requirement in order to exercise your early repurchase right. The unavailability of the repurchase right can result in the ETNs trading in the secondary market at a discount below their closing indicative value and/or intraday indicative value. The number of ETNs outstanding or held by persons other than our affiliates could be reduced at any time due to early repurchase of the ETNs or due to our or our affiliates’ purchases of ETNs in the secondary market. A suspension of additional issuances of the ETNs could result in a significant reduction in the number of outstanding ETNs if investors subsequently exercise their right to have the ETNs repurchased by us.
Notwithstanding the foregoing, we currently have reduced the minimum redemption amount to 5,000 ETNs. Our reduction of the minimum redemption amount will be available to any and all holders of the ETNs on such early redemption dates and will remain in effect until the waiver is removed by us at our sole discretion. We intend to provide to holders of the ETNs at least ten calendar days’ notice prior to removing any waiver for the reduction of the minimum redemption amount for the ETNs. We may, at any time and in our sole discretion, make further modifications to the minimum redemption amount, including, among others, to reinstate the minimum redemption amount of 50,000 ETNs for all redemption dates after such further modification. Any such modification will be applied on a consistent basis for all holders of the
PS-25
ETNs at the time such modification becomes effective.
You may only redeem your ETNs on a redemption date if we receive a notice of redemption from you by no later than 4:00 p.m., New York City time, and a confirmation of redemption by no later than 5:00 p.m., New York City time, on the business day prior to the valuation date specified in your notice of redemption. If we do not receive your notice of redemption by 4:00 p.m., New York City time, or your confirmation of redemption by 5:00 p.m., New York City time, on the business day prior to the valuation date specified in your notice of redemption, your notice will not be effective and we will not redeem your ETNs on the applicable redemption date. Your notice of redemption and confirmation of redemption will not be effective until we confirm receipt. See “Specific Terms of the ETNs—Early Redemption Procedures” in this pricing supplement for more information.
There May Be Restrictions on Your Ability to Purchase Additional ETNs From Us
We may, but are not required to, offer and sell ETNs after the inception date through Barclays Capital Inc., our affiliate, as agent. We may impose a requirement to purchase a particular minimum amount of ETNs from our inventory in a single purchase, though we may waive this requirement with respect to any purchase at any time in our sole discretion. In addition, we may offer to sell ETNs from our inventory at a price that is greater or less than the intraday indicative value or the prevailing market price at the time such sale is made. However, we are under no obligation to issue or sell additional ETNs at any time, and if we do issue or sell additional ETNs, we may limit such sales and stop selling additional ETNs at any time.
Any limitations or restrictions that we place on the sale of the ETNs from inventory, and the price at which we sell the ETNs from inventory, may impact supply and demand for the ETNs and may impact the liquidity and price of the ETNs in the secondary market. See “Specific Terms of the ETNs—Further Issuances” and “Supplemental Plan of Distribution” in this pricing supplement for more information.
Risks Relating to Conflicts of Interest and Hedging
There Are Potential Conflicts of Interest Between You and the Calculation Agent
Currently, Barclays Bank PLC serves as the calculation agent for the ETNs. The calculation agent will, among other things, determine the amount of the return paid out to you on the ETNs at maturity or upon early redemption. For a more detailed description of the calculation agent’s role, see “Specific Terms of the ETNs—Role of Calculation Agent” in this pricing supplement.
If Bloomberg were to discontinue or suspend calculation or publication of an Index, it may become difficult to determine the market value of the ETNs linked to that Index. If events such as these occur, or if the level of the Index underlying your ETNs is not available or cannot be calculated because of a market disruption event or for any other reason, the calculation agent may be required to make a good faith estimate in its sole discretion of the level of that Index. The circumstances in which the calculation agent will be required to make such a determination are described more fully under “Specific Terms of the ETNs—Role of Calculation Agent” in this pricing supplement.
The calculation agent will exercise its judgment when performing its functions. For example, the calculation agent may have to determine whether a market disruption event affecting an Index has occurred or is continuing on a valuation date, including the final valuation date. This determination may, in turn, depend on the calculation agent’s judgment as to whether the event has materially interfered with our ability to unwind our or our affiliates’ hedge positions. Since these determinations by the calculation agent may affect the market value of the ETNs, the calculation agent may have a conflict of interest if it needs to make any such decision.
Trading and Other Transactions by Barclays Bank PLC or Its Affiliates in Instruments Linked to Indices or Index Components May Impair the Market Value of the ETNs
As described below under “Use of Proceeds and Hedging” in this pricing supplement, we or one or more of our affiliates may hedge our obligations under any series of ETNs by purchasing index components (including the underlying physical commodities), futures or options on index components or Indices, or other derivative instruments with returns linked to the
PS-26
performance of index components or Indices, and we may adjust these hedges by, among other things, purchasing or selling any of the foregoing. Any of these hedging activities may adversely affect the market price of index components and the level of the Indices and, therefore, the market value of the ETNs. It is possible that we or one or more of our affiliates could receive substantial returns from these hedging activities while the market value of the ETNs declines.
We or one or more of our affiliates may also engage in trading in index components, futures or options on index components, the physical commodities underlying the index components or the Indices, and other investments relating to index components or the Indices on a regular basis as part of our general broker-dealer and other businesses, for proprietary accounts, for hedging or reducing risk of loss to us or an affiliate, for other accounts under management or to facilitate transactions for customers. Any of these activities could adversely affect the market price of the index components or the level of the Indices and, therefore, the market value of the ETNs. We or one or more of our affiliates may also issue or underwrite other securities or financial or derivative instruments with returns linked or related to changes in the performance of any of the foregoing. By introducing competing products into the marketplace in this manner, we or one or more of our affiliates could adversely affect the market value of the ETNs. With respect to any of the activities described above, neither Barclays Bank PLC nor any of its affiliates has any obligation to take the needs of any buyer, seller or holder of the ETNs into consideration at any time.
Our Business Activities May Create Conflicts of Interest
We and our affiliates expect to play a variety of roles in connection with the issuance of the ETNs. As noted above, we and our affiliates expect to engage in trading activities related to the index components (including the underlying physical commodities), futures or options on index components or Indices, or other derivative instruments with returns linked to the performance of index components or Indices that are not for the accounts of holders of the ETNs or on their behalf. These trading activities may present a conflict between the holders’ interest in the ETNs and the interests that we and our affiliates will have in our and our affiliates’ proprietary accounts, in facilitating transactions, including options and other derivatives
transactions, for our and our affiliates’ customers and in accounts under our and our affiliates’ management. These trading activities, if they influence the value of the index components or the level of any Indices, could be adverse to the interests of the holders of the ETNs. Moreover, we and our affiliates have published and in the future expect to publish research reports with respect to some or all of the physical commodities underlying the index components and physical commodities generally. This research is modified from time to time without notice and may express opinions or provide recommendations that are inconsistent with purchasing or holding the ETNs. The research should not be viewed as a recommendation or endorsement of the ETNs in any way and investors must make their own independent investigation of the merits of your investment. Any of these activities by us, Barclays Capital Inc. or our other affiliates may affect the market price of the index components and the level of the Indices and, therefore, the market value of the ETNs.
With respect to any of the activities described above, neither Barclays Bank PLC nor its affiliates has any obligation to take the needs of any buyer, seller or holder of the ETNs into consideration at any time.
Risks Relating to Tax Consequences
The Tax Consequences Are Uncertain
The U.S. federal income tax treatment of each series of ETNs is uncertain and the IRS could assert that any series of ETNs should be taxed in a manner that is different from that described in this pricing supplement. As discussed further below, the U.S. Treasury Department and the IRS issued a notice in 2007 indicating that the U.S. Treasury Department and the IRS are actively considering whether, among other issues, you should be required to accrue interest over the term of an instrument such as the ETNs and whether all or part of the gain you may recognize upon the sale, early redemption or maturity of an instrument such as the ETNs should be treated as ordinary income. It is impossible to anticipate how any ultimate guidance would affect the tax treatment of instruments such as the ETNs.
Moreover, each series of ETNs might be treated as debt instruments. In that event, if you are a U.S. Holder, you will be required under Treasury regulations relating to the taxation of “contingent payment debt instruments” to accrue into income original issue discount on the ETNs every year at a “comparable yield” determined at the time of
PS-27
issuance and recognize any gain on the ETNs as ordinary income. It is also possible that the IRS could seek to tax your ETNs by reference to your deemed ownership of the relevant Index components. In this case, it is possible that Section 1256 of the Internal Revenue Code (the “Code”), could apply to your ETNs, in which case any gain or loss that you recognize with respect to the ETNs that is attributable to the regulated futures contracts represented in the relevant Index would be treated as 60% long-term capital gain or loss and 40% short-term capital gain or loss, without regard to your holding period in the ETNs, and you would also be required to mark such portion of the relevant ETN to market at the end of each taxable year (i.e., recognize gain and loss as if the relevant portion of your ETNs had been sold for fair market value).
Even if the ETNs are treated as prepaid forward contracts, due to the lack of controlling authority, there remain substantial uncertainties regarding the tax consequences of an investment in the ETNs. For example, the IRS could assert that a “deemed” taxable exchange has occurred on one or more roll dates or Index rebalance dates under certain circumstances. If the IRS were successful in asserting that a taxable exchange had occurred, you could be required to recognize gain (but probably not loss) prior to a taxable disposition of your ETNs.
For a discussion of the U.S. federal income tax treatment applicable to your ETNs as well as other potential alternative characterizations for your ETNs, please see the discussion under “Material U.S. Federal Income Tax Considerations” below. You should consult your tax advisor as to the possible alternative treatments in respect of the ETNs.
Additional Risks Relating to ETNs Linked to an Index that Includes Aluminum
The ETNs May Be Subject to Certain Risks Specific to Aluminum as a Commodity
Aluminum is an industrial metal. Consequently, in addition to factors affecting commodities generally that are described above, each Index that includes aluminum (currently the Aluminum Sub-Index and the Industrial Metals Sub-Index) may be subject to a number of additional factors specific to industrial metals, and in particular aluminum, that might cause price volatility. These may include, among others:
| · | changes in the level of industrial activity using industrial metals, and in particular aluminum, including the availability of substitutes such as man-made or synthetic substitutes; |
| · | changes in demand from China and other economies which have become oversized users of aluminum and risk of economic downturns in such economies; |
| · | disruptions in the supply chain, from mining to storage to smelting or refining; |
| · | adjustments to inventory in response to changes in economic activity and/or pricing levels; |
| · | variations in production costs, including storage, labor and energy costs; |
| · | costs associated with regulatory compliance, including environmental regulations; and |
| · | changes in industrial, government and consumer demand, both in individual consuming nations and internationally. |
These factors interrelate in complex ways, and the effect of one factor on the level of an Index, and the market value of the ETNs linked to that Index, may offset or enhance the effect of another factor.
The London Metal Exchange’s Use of or Omission to Use Price Controls May Result in Limited Appreciation but Unlimited Depreciation in the Price of the Index Component and, Therefore, the Value of Your ETNs
The futures contract on aluminum that is included in the Aluminum Sub-Index and the Industrial Metals Sub-Index is traded on the London Metal Exchange (the “LME”) and not on a U.S. futures exchange. U.S. exchanges have regulations that limit the amount of fluctuation in some futures contract prices that may occur during a single business day. These limits are generally referred to as “daily price fluctuation limits.” In contrast, the LME has no daily price fluctuation limits to restrict the extent of daily fluctuations in the prices of contracts traded on the LME, including the index components. In a declining market, therefore, it is possible that prices for one or more contracts traded on the LME, including the index components, would continue to decline without limitation within a trading day or over a period of trading days. A steep decline in the price of the index component could have a significant
PS-28
adverse impact on the level of each Index in which aluminum is included and, therefore, the value of the ETNs linked to that Index.
Moreover, the LME has discretion to impose “backwardation limits” by permitting short sellers who are unable to effect delivery of an underlying commodity and/or borrow such commodity at a price per day that is no greater than the backwardation limit to defer their delivery obligations by paying a penalty in the amount of the backwardation limit to buyers for whom delivery was deferred. Backwardation limits tend to either constrain appreciation or cause depreciation of the prices of futures contracts expiring in near delivery months. Impositions of such backwardation limits could adversely affect the level of each Index in which aluminum is included and, therefore, the value of the ETNs linked to that Index.
Contracts Traded on the LME Are Exposed to Concentration Risks Beyond Those Characteristic of Futures Contracts on U.S. Futures Exchanges
Futures contracts traded on U.S. futures exchanges generally call for delivery of the physical commodities to which such contracts relate in stated delivery months. In contrast, contracts traded on the LME may call for delivery on a daily, weekly or monthly basis. As a result, there may be a greater risk of a concentration of positions in contracts trading on the LME on particular delivery dates than for futures contracts traded on U.S. futures exchanges, since, for example, contracts calling for delivery on a daily, weekly or monthly basis could call for delivery on the same or approximately the same date. Such a concentration of positions, in turn, could cause temporary aberrations in the prices of contracts traded on the LME for delivery dates to which such positions relate. To the extent such aberrations are in evidence on a given valuation date with respect to the price of the index component, they could adversely affect the level of each Index in which aluminum is included and, therefore, the value of the ETNs linked to that Index.
Additional Risks Relating to ETNs Linked to an Index that Includes Coffee
The ETNs May Be Subject to Certain Risks Specific to Coffee as a Commodity
Coffee is an agricultural commodity and a soft commodity. Consequently, in addition to factors affecting commodities generally that are
described above, each Index that includes coffee (currently the Agriculture Sub-Index, the Coffee Sub-Index and the Softs Sub-Index) may be subject to a number of additional factors specific to agricultural commodities and softs, and in particular coffee, that might cause price volatility. These may include, among others:
| · | weather conditions, including floods, drought and freezing conditions; |
| · | changes in government policies with regard to number of trees planted, price support programs and world export quotas; |
| · | changes in global demand for food; |
| · | planting decisions and harvesting practices; and |
| · | changes in demand for agricultural products or softs, and in particular coffee, both with end users and as inputs into various industries. |
These factors interrelate in complex ways, and the effect of one factor on the level of an Index, and the market value of the ETNs linked to that Index, may offset or enhance the effect of another factor.
Additional Risks Relating to ETNs Linked to an Index that Includes Copper
The ETNs May Be Subject to Certain Risks Specific to Copper as a Commodity
Copper is an industrial metal. Consequently, in addition to factors affecting commodities generally that are described above, each Index that includes copper (currently the Copper Sub-Index and the Industrial Metals Sub-Index) may be subject to a number of additional factors specific to industrial metals, and in particular copper, that might cause price volatility. These may include, among others:
| · | changes in the level of industrial activity using industrial metals, and in particular copper, including the availability of substitutes such as man-made or synthetic substitutes; |
| · | changes in demand from China and other economies which have become oversized users of copper and risk of economic downturns in such economies; |
| · | disruptions in the supply chain, from mining to storage to smelting or refining; |
| · | adjustments to inventory; |
PS-29
| · | governmental programs and policies; |
| · | variations in production costs, including storage, labor and energy costs; |
| · | costs associated with regulatory compliance, including environmental regulations; and |
| · | changes in industrial, government and consumer demand, both in individual consuming nations and internationally. |
These factors interrelate in complex ways, and the effect of one factor on the level of an Index, and the market value of the ETNs linked to that Index, may offset or enhance the effect of another factor.
Additional Risks Relating to ETNs Linked to an Index that Includes Corn
The ETNs May Be Subject to Certain Risks Specific to Corn as a Commodity
Corn is an agricultural commodity and a grain. Consequently, in addition to factors affecting commodities generally that are described above, each Index that includes corn (currently the Agriculture Sub-Index and the Grains Sub-Index) may be subject to a number of additional factors specific to agricultural commodities and grains, and in particular corn, that might cause price volatility. These may include, among others:
| · | weather conditions, including floods, drought and freezing conditions; |
| · | changes in government policies, including government requirements regarding use of ethanol; |
| · | changes in demand from China and other economies which have become oversized users of corn and risk of economic downturns in such economies; |
| · | changes in global demand for food; |
| · | changes in ethanol demand; |
| · | planting decisions, crop yields and technological developments; and |
| · | changes in demand for agricultural products or grains, and in particular corn, both with end users and as inputs into various industries. |
These factors interrelate in complex ways, and the effect of one factor on the level of an Index, and the market value of the ETNs linked to that
Index, may offset or enhance the effect of another factor.
Additional Risks Relating to ETNs Linked to an Index that Includes Cotton
The ETNs May Be Subject to Certain Risks Specific to Cotton as a Commodity
Cotton is an agricultural commodity and a soft commodity. Consequently, in addition to factors affecting commodities generally that are described above, each Index that includes cotton (currently the Agriculture Sub-Index, the Cotton Sub-Index and the Softs Sub-Index) may be subject to a number of additional factors specific to agricultural commodities and softs, and in particular cotton, that might cause price volatility. These may include, among others:
| · | weather conditions, including floods, drought and freezing conditions; |
| · | changes in government policies regarding agriculture and trade, fiscal and monetary issues; |
| · | changes in demand from China and other economies which have become oversized users of cotton and risk of economic downturns in such economies; |
| · | planting decisions, crop yields and technological developments; and |
| · | changes in demand for agricultural products or softs, and in particular cotton, both with end users and as inputs into various industries. |
These factors interrelate in complex ways, and the effect of one factor on the level of an Index, and the market value of the ETNs linked to that Index, may offset or enhance the effect of another factor.
Additional Risks Relating to ETNs Linked to an Index that Includes Crude Oil
The ETNs May Be Subject to Certain Risks Specific to Crude Oil as a Commodity
Crude oil is an energy-related commodity. Consequently, in addition to factors affecting commodities generally that are described above, each Index that includes crude oil (currently the Energy Sub-Index) may be subject to a number of additional factors specific to energy-related commodities, and in particular crude oil, that might cause price volatility. These may include, among others:
PS-30
| · | changes in the level of industrial and commercial activity with high levels of energy demand; |
| · | changes in demand from China and other economies which have become oversized users of crude oil and risk of economic downturns in such economies; |
| · | disruptions in the supply chain or in the production or supply of other energy sources; |
| · | changes in governmental regulations, such as environmental or consumption policies; |
| · | political events, labor activity and direct governmental intervention (such as embargos); |
| · | development of and price changes in alternative sources of energy; |
| · | production decisions by the Organization of the Petroleum Exporting Countries and other crude oil producers; |
| · | adjustments to inventory; |
| · | variations in production and shipping costs; |
| · | costs associated with regulatory compliance, including environmental regulations; and |
| · | changes in industrial, government and consumer demand, both in individual consuming nations and internationally. |
These factors interrelate in complex ways, and the effect of one factor on the level of an Index, and the market value of the ETNs linked to that Index, may offset or enhance the effect of another factor.
Additional Risks Relating to ETNs Linked to an Index that Includes Gold
The ETNs May Be Subject to Certain Risks Specific to Gold as a Commodity
Gold is a precious metal. Consequently, in addition to factors affecting commodities generally that are described above, each Index that includes gold (currently the Precious Metals Sub-Index) may be subject to a number of additional factors specific to precious metals, and in particular gold, that might cause price volatility. These may include, among others:
| · | disruptions in the supply chain, from mining to storage to smelting or refining; |
| · | changes in demand from China and other economies which have become oversized users of precious metals and risk of economic downturns in such economies; |
| · | adjustments to inventory; |
| · | domestic and international monetary policies; |
| · | variations in production costs, including storage, labor and energy costs; |
| · | costs associated with regulatory compliance, including environmental regulations; |
| · | changes in industrial, government and consumer demand, both in individual consuming nations and internationally; |
| · | precious metal leasing rates; |
| · | currency exchange rates; |
| · | level of economic growth and inflation; and |
| · | degree to which consumers, governments, corporate and financial institutions hold physical gold as a safe haven asset (hoarding) which may be caused by a banking crisis/recovery, a rapid change in the value of other assets (both financial and physical) or changes in the level of inflation or geopolitical tension. |
These factors interrelate in complex ways, and the effect of one factor on the level of an Index, and the market value of the ETNs linked to that Index, may offset or enhance the effect of another factor.
Additional Risks Relating to ETNs Linked to an Index that Includes ULS Diesel
The ETNs May Be Subject to Certain Risks Specific to ULS Diesel as a Commodity
ULS diesel is an energy-related commodity. Consequently, in addition to factors affecting commodities generally that are described above, each Index that includes ULS diesel (currently the Energy Sub-Index) may be subject to a number of additional factors specific to energy-related commodities, and in particular ULS diesel, that might cause price volatility. These may include, among others:
| · | changes in the level of industrial and commercial activity with high levels of energy demand; |
PS-31
| · | changes in demand from China and other economies which have become oversized users of ULS diesel and risk of economic downturns in such economies; |
| · | disruptions in the supply chain or in the production or supply of other energy sources; |
| · | price changes in alternative sources of energy; |
| · | adjustments to inventory; |
| · | variations in production and shipping costs; |
| · | costs associated with regulatory compliance, including environmental regulations; and |
| · | changes in industrial, government and consumer demand, both in individual consuming nations and internationally. |
These factors interrelate in complex ways, and the effect of one factor on the level of an Index, and the market value of the ETNs linked to that Index, may offset or enhance the effect of another factor.
Additional Risks Relating to ETNs Linked to an Index that Includes Lean Hogs
ETNs May Be Subject to Certain Risks Specific to Lean Hogs as a Commodity
Lean hogs are a type of livestock. Consequently, in addition to factors affecting commodities generally that are described above, each Index that includes lean hogs (currently the Livestock Sub-Index) may be subject to a number of additional factors specific to livestock, and in particular lean hogs, that might cause price volatility. These may include, among others:
| · | weather conditions, including floods, drought and freezing conditions; |
| · | disease and famine; |
| · | availability of and prices for livestock feed; |
| · | changes in government policies; and |
| · | changes in end-user demand for livestock. |
These factors interrelate in complex ways, and the effect of one factor on the level of an Index, and the market value of the ETNs linked to that Index, may offset or enhance the effect of another factor.
Additional Risks Relating to ETNs Linked to an Index that Includes Live Cattle
ETNs May Be Subject to Certain Risks Specific to Live Cattle as a Commodity
Live cattle are a type of livestock. Consequently, in addition to factors affecting commodities generally that are described above, each Index that includes live cattle (currently the Livestock Sub-Index) may be subject to a number of additional factors specific to livestock, and in particular live cattle, that might cause price volatility. These may include, among others:
| · | weather conditions, including floods, drought and freezing conditions; |
| · | disease and famine; |
| · | availability of and prices for livestock feed; |
| · | changes in government policies; and |
| · | changes in end-user demand for livestock. |
These factors interrelate in complex ways, and the effect of one factor on the level of an Index, and the market value of the ETNs linked to that Index, may offset or enhance the effect of another factor.
Additional Risks Relating to ETNs Linked to an Index that Includes Natural Gas
The ETNs May Be Subject to Certain Risks Specific to Natural Gas as a Commodity
Natural gas is an energy-related commodity. Consequently, in addition to factors affecting commodities generally that are described above, each Index that includes natural gas (currently the Energy Sub-Index) may be subject to a number of additional factors specific to energy-related commodities, and in particular natural gas, that might cause price volatility. These may include, among others:
| · | changes in the level of industrial and commercial activity with high levels of energy demand; |
| · | changes in demand from China and other economies which have become oversized users of natural gas and risk of economic downturns in such economies; |
| · | disruptions in the supply chain or in the production or supply of other energy sources; |
| · | changes in governmental regulations, such as environmental or consumption policies; |
PS-32
| · | price changes in alternative sources of energy; |
| · | adjustments to inventory; |
| · | variations in production and shipping costs; |
| · | costs associated with regulatory compliance, including environmental regulations; and |
| · | changes in industrial, government and consumer demand, both in individual consuming nations and internationally. |
These factors interrelate in complex ways, and the effect of one factor on the level of an Index, and the market value of the ETNs linked to that Index, may offset or enhance the effect of another factor.
Additional Risks Relating to ETNs Linked to an Index that Includes Nickel
The ETNs May Be Subject to Certain Risks Specific to Nickel as a Commodity
Nickel is an industrial metal. Consequently, in addition to factors affecting commodities generally that are described above, each Index that includes nickel (currently the Industrial Metals Sub-Index and the Nickel Sub-Index) may be subject to a number of additional factors specific to industrial metals, and in particular nickel, that might cause price volatility. These may include, among others:
| · | changes in the level of industrial activity using industrial metals, and in particular nickel, including the availability of substitutes such as man-made or synthetic substitutes; |
| · | changes in demand from China and other economies which have become oversized users of nickel and risk of economic downturns in such economies; |
| · | disruptions in the supply chain, from mining to storage to smelting or refining; |
| · | adjustments to inventory; |
| · | variations in production costs, including storage, labor and energy costs; |
| · | costs associated with regulatory compliance, including environmental regulations; and |
| · | changes in industrial, government and consumer demand, both in individual consuming nations and internationally. |
These factors interrelate in complex ways, and the effect of one factor on the level of an Index, and the market value of the ETNs linked to that Index, may offset or enhance the effect of another factor.
The LME’s Use of or Omission to Use Price Controls May Result in Limited Appreciation but Unlimited Depreciation in the Price of the Index Component and, Therefore, the Value of Your ETNs
The futures contract on nickel that is included in the Industrial Metals Sub-Index and the Nickel Sub-Index is traded on the LME and not on a U.S. futures exchange. U.S. exchanges have regulations that limit the amount of fluctuation in some futures contract prices that may occur during a single business day. These limits are generally referred to as “daily price fluctuation limits.” In contrast, the LME has no daily price fluctuation limits to restrict the extent of daily fluctuations in the prices of contracts traded on the LME, including the index component. In a declining market, therefore, it is possible that prices for one or more contracts traded on the LME, including the index component, would continue to decline without limitation within a trading day or over a period of trading days. A steep decline in the price of the index component could have a significant adverse impact on the level of each Index in which nickel is included and, therefore, the value of the ETNs linked to that Index.
Moreover, the LME has discretion to impose “backwardation limits” by permitting short sellers who are unable to effect delivery of an underlying commodity and/or borrow such commodity at a price per day that is no greater than the backwardation limit to defer their delivery obligations by paying a penalty in the amount of the backwardation limit to buyers for whom delivery was deferred. Backwardation limits tend to either constrain appreciation or cause depreciation of the prices of futures contracts expiring in near delivery months. Impositions of such backwardation limits could adversely affect the level of each Index in which nickel is included and, therefore, the value of the ETNs linked to that Index.
Contracts Traded on the LME Are Exposed to Concentration Risks Beyond Those Characteristic of Futures Contracts on U.S. Futures Exchanges
Futures contracts traded on U.S. futures exchanges generally call for delivery of the
PS-33
physical commodities to which such contracts relate in stated delivery months. In contrast, contracts traded on the LME may call for delivery on a daily, weekly or monthly basis. As a result, there may be a greater risk of a concentration of positions in contracts trading on the LME on particular delivery dates than for futures contracts traded on U.S. futures exchanges, since, for example, contracts calling for delivery on a daily, weekly or monthly basis could call for delivery on the same or approximately the same date. Such a concentration of positions, in turn, could cause temporary aberrations in the prices of contracts traded on the LME for delivery dates to which such positions relate. To the extent such aberrations are in evidence on a given valuation date with respect to the price of the index component, they could adversely affect the level of each Index in which nickel is included and, therefore, the value of the ETNs linked to that Index.
Additional Risks Relating to ETNs Linked to an Index that Includes Platinum
The ETNs May Be Subject to Certain Risks Specific to Platinum as a Commodity
Platinum is a precious metal. Consequently, in addition to factors affecting commodities generally that are described above, each Index that includes platinum (currently only the Platinum Sub-Index) may be subject to a number of additional factors specific to precious metals, and in particular platinum, that might cause price volatility. These may include, among others:
| · | disruptions in the supply chain, from mining to storage to smelting or refining; |
| · | changes in demand from China and other economies which have become oversized users of precious metals and risk of economic downturns in such economies; |
| · | adjustments to inventory; |
| · | variations in production costs, including storage, labor and energy costs; |
| · | costs associated with regulatory compliance, including environmental regulations; and |
| · | changes in industrial, government and consumer demand, both in individual consuming nations and internationally. |
These factors interrelate in complex ways, and the effect of one factor on the level of an Index, and the market value of the ETNs linked to that
Index, may offset or enhance the effect of another factor.
Additional Risks Relating to ETNs Linked to an Index that Includes Silver
The ETNs May Be Subject to Certain Risks Specific to Silver as a Commodity
Silver is a precious metal. Consequently, in addition to factors affecting commodities generally that are described above, each Index that includes silver (currently the Precious Metals Sub-Index) may be subject to a number of additional factors specific to precious metals, and in particular silver that might cause price volatility. These may include, among others:
| · | disruptions in the supply chain, from mining to storage to smelting or refining; |
| · | changes in demand from China and other economies which have become oversized users of precious metals and risk of economic downturns in such economies; |
| · | adjustments to inventory; |
| · | variations in production costs, including storage, labor and energy costs; |
| · | costs associated with regulatory compliance, including environmental regulations; |
| · | changes in industrial, government and consumer demand, both in individual consuming nations and internationally; |
| · | precious metal leasing rates; |
| · | currency exchange rates; |
| · | level of economic growth and inflation; and |
| · | degree to which consumers, governments, corporate and financial institutions hold physical silver as a safe haven asset (hoarding) which may be caused by a banking crisis/recovery, a rapid change in the value of other assets (both financial and physical) or changes in the level of geopolitical tension. |
These factors interrelate in complex ways, and the effect of one factor on the level of an Index, and the market value of the ETNs linked to that Index, may offset or enhance the effect of another factor.
PS-34
Additional Risks Relating to ETNs Linked to an Index that Includes Soybean Oil
The ETNs May Be Subject to Certain Risks Specific to Soybean Oil as a Commodity
Soybean oil is an agricultural commodity. Consequently, in addition to factors affecting commodities generally that are described above, each Index that includes soybean oil (currently the Agriculture Sub-Index) may be subject to a number of additional factors specific to agricultural commodities, and in particular soybean oil, that might cause price volatility. These may include, among others:
| · | weather conditions, including floods, drought and freezing conditions; |
| · | changes in demand from China and other economies which have become oversized users of soybean oil and risk of economic downturns in such economies; |
| · | changes in government policies; |
| · | changes in global demand for food; |
| · | changes in bio-diesel demand; |
| · | planting decisions, crop yields and technological developments; and |
| · | changes in demand for agricultural products, and in particular soybean oil, both with end users and as inputs into various industries. |
These factors interrelate in complex ways, and the effect of one factor on the level of an Index, and the market value of the ETNs linked to that Index, may offset or enhance the effect of another factor.
Additional Risks Relating to ETNs Linked to an Index that Includes Soybeans
The ETNs May Be Subject to Certain Risks Specific to Soybeans as a Commodity
Soybeans are an agricultural commodity and a grain. Consequently, in addition to factors affecting commodities generally that are described above, each Index that includes soybeans (currently the Agriculture Sub-Index and the Grains Sub-Index) may be subject to a number of additional factors specific to agricultural commodities and grains, and in particular soybeans, that might cause price volatility. These may include, among others:
| · | weather conditions, including floods, drought and freezing conditions; |
| · | changes in demand from China and other economies which have become oversized users of soybeans and risk of economic downturns in such economies; |
| · | changes in government policies; |
| · | changes in global demand for food; |
| · | changes in bio-diesel demand; |
| · | planting decisions, crop yields and technological developments; and |
| · | changes in demand for agricultural products or grains, and in particular soybeans, both with end users and as inputs into various industries. |
These factors interrelate in complex ways, and the effect of one factor on the level of an Index, and the market value of the ETNs linked to that Index, may offset or enhance the effect of another factor.
Additional Risks Relating to ETNs Linked to an Index that Includes Sugar
The ETNs May Be Subject to Certain Risks Specific to Sugar as a Commodity
Sugar is an agricultural commodity and a soft commodity. Consequently, in addition to factors affecting commodities generally that are described above, each Index that includes sugar (currently the Agriculture Sub-Index, the Softs Sub-Index and the Sugar Sub-Index) may be subject to a number of additional factors specific to agricultural commodities and softs, and in particular sugar, that might cause price volatility. These may include, among others:
| · | weather conditions, including floods, drought and freezing conditions; |
| · | changes in demand from China and other economies which have become oversized users of sugar and risk of economic downturns in such economies; |
| · | changes in government policies regarding agriculture and energy and international trade agreements; |
| · | changes in global demand for food; |
| · | changes in ethanol demand; |
| · | planting decisions, crop yields and technological developments; and |
| · | changes in demand for agricultural products or softs, and in particular sugar, both with |
PS-35
end users and as inputs into various industries.
These factors interrelate in complex ways, and the effect of one factor on the level of an Index, and the market value of the ETNs linked to that Index, may offset or enhance the effect of another factor.
Additional Risks Relating to ETNs Linked to an Index that Includes Tin
The ETNs May Be Subject to Certain Risks Specific to Tin as a Commodity
Tin is an industrial metal. Consequently, in addition to factors affecting commodities generally that are described above, each Index that includes tin (currently only the Tin Sub-Index) may be subject to a number of additional factors specific to industrial metals, and in particular tin, that might cause price volatility. These may include, among others:
| · | changes in the level of industrial activity using industrial metals, and in particular tin, including the availability of substitutes such as man-made or synthetic substitutes; |
| · | changes in demand from China and other economies which have become oversized users of tin and risk of economic downturns in such economies; |
| · | disruptions in the supply chain, from mining to storage to smelting or refining; |
| · | adjustments to inventory; |
| · | variations in production costs, including storage, labor and energy costs; |
| · | costs associated with regulatory compliance, including environmental regulations; and |
| · | changes in industrial, government and consumer demand, both in individual consuming nations and internationally. |
These factors interrelate in complex ways, and the effect of one factor on the level of an Index, and the market value of the ETNs linked to that Index, may offset or enhance the effect of another factor.
The LME’s Use of or Omission to Use Price Controls May Result in Limited Appreciation but Unlimited Depreciation in the Price of the Index Component and, Therefore, the Value of Your ETNs
The futures contract on tin that is included in the Tin Sub-Index and eligible to be included in the Commodity Index is traded on the LME and not on a U.S. futures exchange. U.S. exchanges have regulations that limit the amount of fluctuation in some futures contract prices that may occur during a single business day. These limits are generally referred to as “daily price fluctuation limits.” In contrast, the LME has no daily price fluctuation limits to restrict the extent of daily fluctuations in the prices of contracts traded on the LME, including the index component. In a declining market, therefore, it is possible that prices for one or more contracts traded on the LME, including the index component, would continue to decline without limitation within a trading day or over a period of trading days. A steep decline in the price of the index component could have a significant adverse impact on the level of each Index in which tin is included and, therefore, the value of the ETNs linked to that Index.
Moreover, the LME has discretion to impose “backwardation limits” by permitting short sellers who are unable to effect delivery of an underlying commodity and/or borrow such commodity at a price per day that is no greater than the backwardation limit to defer their delivery obligations by paying a penalty in the amount of the backwardation limit to buyers for whom delivery was deferred. Backwardation limits tend to either constrain appreciation or cause depreciation of the prices of futures contracts expiring in near delivery months. Impositions of such backwardation limits could adversely affect the level of each Index in which tin is included and, therefore, the value of the ETNs linked to that Index.
Contracts Traded on the LME Are Exposed to Concentration Risks Beyond Those Characteristic of Futures Contracts on U.S. Futures Exchanges
Futures contracts traded on U.S. futures exchanges generally call for delivery of the physical commodities to which such contracts relate in stated delivery months. In contrast, contracts traded on the LME may call for delivery on a daily, weekly or monthly basis. As a result, there may be a greater risk of a concentration of positions in contracts trading on the LME on
PS-36
particular delivery dates than for futures contracts traded on U.S. futures exchanges, since, for example, contracts calling for delivery on a daily, weekly or monthly basis could call for delivery on the same or approximately the same date. Such a concentration of positions, in turn, could cause temporary aberrations in the prices of contracts traded on the LME for delivery dates to which such positions relate. To the extent such aberrations are in evidence on a given valuation date with respect to the price of the index component, they could adversely affect the level of each Index in which tin is included and, therefore, the value of the ETNs linked to that Index.
Additional Risks Relating to ETNs Linked to an Index that Includes Unleaded Gasoline
The ETNs May Be Subject to Certain Risks Specific to Unleaded Gasoline as a Commodity
Unleaded gasoline is an energy-related commodity. Consequently, in addition to factors affecting commodities generally that are described above, each Index that includes unleaded gasoline (currently the Energy Sub-Index) may be subject to a number of additional factors specific to energy-related commodities, and in particular unleaded gasoline, that might cause price volatility. These may include, among others:
| · | changes in the level of industrial and commercial activity with high levels of energy demand; |
| · | changes in demand from China and other economies which have become oversized users of unleaded gasoline and risk of economic downturns in such economies; |
| · | disruptions in the supply chain or in the production or supply of other energy sources; |
| · | changes in governmental regulations, such as environmental or consumption policies; |
| · | price changes in alternative sources of energy; |
| · | adjustments to inventory; |
| · | variations in production and shipping costs; |
| · | costs associated with regulatory compliance, including environmental regulations; and |
| · | changes in industrial, government and consumer demand, both in individual consuming nations and internationally. |
These factors interrelate in complex ways, and the effect of one factor on the level of an Index, and the market value of the ETNs linked to that Index, may offset or enhance the effect of another factor.
Additional Risks Relating to ETNs Linked to an Index that Includes Wheat
The ETNs May Be Subject to Certain Risks Specific to Wheat as a Commodity
Wheat is an agricultural commodity and a grain. Consequently, in addition to factors affecting commodities generally that are described above, each Index that includes wheat (currently the Agriculture Sub-Index and the Grains Sub-Index) may be subject to a number of additional factors specific to agricultural commodities and grains, and in particular wheat, that might cause price volatility. These may include, among others:
| · | weather conditions, including floods, drought and freezing conditions; |
| · | changes in demand from China and other economies which have become oversized users of wheat and risk of economic downturns in such economies; |
| · | changes in government policies; |
| · | planting decisions, crop yields and technological developments; and |
| · | changes in demand for agricultural products or grains, and in particular wheat, both with end users and as inputs into various industries. |
These factors interrelate in complex ways, and the effect of one factor on the level of an Index, and the market value of the ETNs linked to that Index, may offset or enhance the effect of another factor.
Additional Risks Relating to ETNs Linked to an Index that Includes Zinc
The ETNs May Be Subject to Certain Risks Specific to Zinc as a Commodity
Zinc is an industrial metal. Consequently, in addition to factors affecting commodities generally that are described above, each Index that includes zinc (currently the Industrial Metals Sub-Index) may be subject to a number of additional factors specific to industrial metals, and
PS-37
in particular zinc, that might cause price volatility. These may include, among others:
| · | changes in the level of industrial activity using industrial metals, and in particular zinc, including the availability of substitutes such as man-made or synthetic substitutes; |
| · | changes in demand from China and other economies which have become oversized users of zinc and risk of economic downturns in such economies; |
| · | disruptions in the supply chain, from mining to storage to smelting or refining; |
| · | adjustments to inventory; |
| · | variations in production costs, including storage, labor and energy costs; |
| · | costs associated with regulatory compliance, including environmental regulations; and |
| · | changes in industrial, government and consumer demand, both in individual consuming nations and internationally. |
These factors interrelate in complex ways, and the effect of one factor on the level of an Index, and the market value of the ETNs linked to that Index, may offset or enhance the effect of another factor.
The LME’s Use of or Omission to Use Price Controls May Result in Limited Appreciation but Unlimited Depreciation in the Price of the Index Component and, Therefore, the Value of Your ETNs
The futures contract on zinc that is included in the Industrial Metals Sub-Index is traded on the LME and not on a U.S. futures exchange. U.S. exchanges have regulations that limit the amount of fluctuation in some futures contract prices that may occur during a single business day. These limits are generally referred to as “daily price fluctuation limits.” In contrast, the LME has no daily price fluctuation limits to restrict the extent of daily fluctuations in the prices of contracts traded on the LME, including the index component. In a declining market, therefore, it is possible that prices for one or more contracts traded on the LME, including the index component, would continue to decline without limitation within a trading day or over a period of trading days. A steep decline in the price of the index component could have a significant adverse impact on the level of each Index in
which zinc is included and, therefore, the value of the ETNs linked to that Index.
Moreover, the LME has discretion to impose “backwardation limits” by permitting short sellers who are unable to effect delivery of an underlying commodity and/or borrow such commodity at a price per day that is no greater than the backwardation limit to defer their delivery obligations by paying a penalty in the amount of the backwardation limit to buyers for whom delivery was deferred. Backwardation limits tend to either constrain appreciation or cause depreciation of the prices of futures contracts expiring in near delivery months. Impositions of such backwardation limits could adversely affect the level of each Index in which zinc is included and, therefore, the value of the ETNs linked to that Index.
Contracts Traded on the LME Are Exposed to Concentration Risks Beyond Those Characteristic of Futures Contracts on U.S. Futures Exchanges
Futures contracts traded on U.S. futures exchanges generally call for delivery of the physical commodities to which such contracts relate in stated delivery months. In contrast, contracts traded on the LME may call for delivery on a daily, weekly or monthly basis. As a result, there may be a greater risk of a concentration of positions in contracts trading on the LME on particular delivery dates than for futures contracts traded on U.S. futures exchanges, since, for example, contracts calling for delivery on a daily, weekly or monthly basis could call for delivery on the same or approximately the same date. Such a concentration of positions, in turn, could cause temporary aberrations in the prices of contracts traded on the LME for delivery dates to which such positions relate. To the extent such aberrations are in evidence on a given valuation date with respect to the price of the index component, they could adversely affect the level of each Index in which zinc is included and, therefore, the value of the ETNs linked to that Index.
PS-38
Notwithstanding and to the exclusion of any other term of the ETNs or any other agreements, arrangements or understandings between us and any holder or beneficial owner of the ETNs, by acquiring the ETNs, each holder and beneficial owner of the ETNs acknowledges, accepts, agrees to be bound by, and consents to the exercise of, any U.K. Bail-in Power by the relevant U.K. resolution authority.
Under the U.K. Banking Act 2009, as amended, the relevant U.K. resolution authority may exercise a U.K. Bail-in Power in circumstances in which the relevant U.K. resolution authority is satisfied that the resolution conditions are met. These conditions include that a U.K. bank or investment firm is failing or is likely to fail to satisfy the Financial Services and Markets Act 2000 (the “FSMA”) threshold conditions for authorization to carry on certain regulated activities (within the meaning of section 55B FSMA) or, in the case of a U.K. banking group company that is a European Economic Area (“EEA”) or third country institution or investment firm, that the relevant EEA or third country relevant authority is satisfied that the resolution conditions are met in respect of that entity.
The U.K. Bail-in Power includes any write-down, conversion, transfer, modification and/or suspension power, which allows for (i) the reduction or cancellation of all, or a portion, of the principal amount of, interest on, or any other amounts payable on, the ETNs; (ii) the conversion of all, or a portion, of the principal amount of, interest on, or any other amounts payable on, the ETNs into shares or other securities or other obligations of Barclays Bank PLC or another person (and the issue to, or conferral on, the holder or beneficial owner of the ETNs such shares, securities or obligations); (iii) the cancellation of the ETNs and/or (iv) the amendment or alteration of the maturity of the ETNs, or amendment of the amount of interest or any other amounts due on the ETNs, or the dates on which interest or any other amounts become payable, including by suspending payment for a temporary period; which U.K. Bail-in Power may be exercised by means of a variation of the terms of the ETNs solely to give effect to the exercise by the relevant U.K. resolution authority of such U.K. Bail-in Power. Each holder and beneficial owner of the ETNs further acknowledges and agrees that the rights of the holders or beneficial
owners of the ETNs are subject to, and will be varied, if necessary, solely to give effect to, the exercise of any U.K. Bail-in Power by the relevant U.K. resolution authority. For the avoidance of doubt, this consent and acknowledgment is not a waiver of any rights holders or beneficial owners of the securities may have at law if and to the extent that any U.K. Bail-in Power is exercised by the relevant U.K. resolution authority in breach of laws applicable in England.
For more information, please see “Risk Factors—Risks Relating to the Issuer—You May Lose Some or All of Your Investment If Any U.K. Bail-in Power Is Exercised by the Relevant U.K. Resolution Authority” in this pricing supplement as well as “U.K. Bail-in Power,” “Risk Factors—Risks Relating to the Securities Generally—Regulatory action in the event a bank or investment firm in the Group is failing or likely to fail could materially adversely affect the value of the securities” and “Risk Factors—Risks Relating to the Securities Generally—Under the terms of the securities, you have agreed to be bound by the exercise of any U.K. Bail-in Power by the relevant U.K. resolution authority” in the accompanying prospectus supplement.
PS-39
THE INDICES – GENERAL INFORMATION
We have derived all information contained in this pricing supplement regarding each Index, including, without limitation, its make-up, method of calculation and changes in its components, from (i) publicly available sources and (ii) the Bloomberg Commodity Index Methodology (a document that is considered proprietary to Bloomberg Index Services Limited (“BISL” or the “Index Sponsor” and, collectively with its affiliates, “Bloomberg”)).
Such information reflects the policies of, and is subject to change by the Index Sponsor.
In connection with any offering of ETNs, neither we nor any of our agents or dealers have participated in the preparation of the information described in the first paragraph of this section or made any due diligence inquiry with respect to the Index Sponsor. Neither we nor any of our agents or dealers make any representation or warranty as to the accuracy or completeness of such information or any other publicly available information regarding the Indices or the Index Sponsor.
You, as an investor in the ETNs, should make your own investigation into the Indices and the Index Sponsor. BISL is not involved in any offer of ETNs in any way and have no obligation to consider your interests as a holder of the ETNs. The Index Sponsor has no obligation to continue to publish any Index and may discontinue or suspend publication of any Index at any time in their sole discretion.
Historical performance of the Indices is not an indication of future performance. Future performance of the Indices may differ significantly from historical performance, either positively or negatively.
Information contained on certain websites mentioned below is not incorporated by reference in, and should not be considered part of, this pricing supplement or the accompanying prospectus and prospectus supplement.
Because each Sub-Index is a sub-index of the Commodity Index, disclosure in this pricing supplement relating to the Commodity Index accordingly relates to each of the Sub-Indices as well and should be read in conjunction with the individual descriptions of the Sub-Indices.
Commodity Futures Markets
As discussed in the descriptions of the individual Indices below, each Index is composed of one or
more futures contracts on physical commodities. Futures contracts on physical commodities and commodity indices are traded on regulated futures exchanges, and physical commodities and other derivatives on physical commodities and commodity indices are traded in the over-the-counter market and on various types of physical and electronic trading facilities and markets. At present, all of the contracts included in the Indices are exchange-traded futures contracts. An exchange-traded futures contract provides for the purchase and sale of a specified type and quantity of a commodity or financial instrument during a stated delivery month for a fixed price. A futures contract on an index of commodities provides for the payment and receipt of cash based on the level of the index at settlement or liquidation of the contract. A futures contract provides for a specified settlement month in which the cash settlement is made or in which the commodity or financial instrument is to be delivered by the seller (whose position is therefore described as “short”) and acquired by the purchaser (whose position is therefore described as “long”).
There is no purchase price paid or received on the purchase or sale of a futures contract. Instead, an amount of cash or cash equivalents must be deposited with the broker as “initial margin.” This amount varies based on the requirements imposed by the exchange clearing houses, but may be as low as 5% or less of the notional value of the contract. This margin deposit provides collateral for the obligations of the parties to the futures contract.
By depositing margin, which may vary in form depending on the exchange, with the clearing house or broker involved, a market participant may be able to earn interest on its margin funds, thereby increasing the total return that it may realize from an investment in futures contracts. The market participant normally makes to, and receives from, the broker subsequent daily payments as the price of the futures contract fluctuates. These payments are called “variation margin” and are made as the existing positions in the futures contract become more or less valuable, a process known as “marking to the market.”
Futures contracts are traded on organized exchanges, known as “designated contract markets” in the United States. At any time prior to the expiration of a futures contract, subject to the availability of a liquid secondary market, a trader may elect to close out its position by taking
PS-40
an opposite position on the exchange on which the trader obtained the position. This operates to terminate the position and fix the trader’s profit or loss. Futures contracts are cleared through the facilities of a centralized clearing house and a brokerage firm, referred to as a “futures commission merchant,” which is a member of the clearing house. The clearing house guarantees the performance of each clearing member that is a party to a futures contract by, in effect, taking the opposite side of the transaction. Clearing houses do not guarantee the performance by clearing members of their obligations to their customers.
Unlike equity securities, futures contracts, by their terms, have stated expirations and, at a specified point in time prior to expiration, trading in a futures contract for the current delivery month will cease. As a result, a market participant wishing to maintain its exposure to a futures contract on a particular commodity with the nearest expiration must close out its position in the expiring contract and establish a new position in the contract for the next delivery month, a process referred to as “rolling.” For example, a market participant with a long position in November crude oil futures that wishes to maintain a position in the nearest delivery month will, as the November contract nears expiration, sell November futures, which serves to close out the existing long position, and buy December futures. This will “roll” the November position into a December position, and, when the November contract expires, the market participant will still have a long position in the nearest delivery month.
Futures exchanges and clearing houses in the United States are subject to regulation by the Commodities Futures Trading Commission. Exchanges may adopt rules and take other actions that affect trading, including imposing speculative position limits, maximum price fluctuations and trading halts and suspensions and requiring liquidation of contracts in certain circumstances. Futures markets outside the United States are generally subject to regulation by comparable regulatory authorities. The structure and nature of trading on non-U.S. exchanges, however, may differ from this description.
THE BLOOMBERG COMMODITY INDEXSM
UBS acquired AIG Financial Product Corp.’s commodity business as of May 6, 2009, at which time, UBS and Dow Jones & Company, Inc. (“Dow Jones”) entered into an agreement to jointly market the Index. The joint marketing
agreement with Dow Jones was terminated and on July 1, 2014, UBS entered into a commodity index license agreement (“CILA”) with Bloomberg Finance L.P., whereby UBS engaged Bloomberg’s services for calculation, publication, administration and marketing of the Indices. As a result of Bloomberg’s assumption of these functions, the Dow Jones-UBS Commodity IndexesSM were re-branded as the Bloomberg Commodity IndexesSM. In September 2020, Bloomberg (as defined below) acquired the Bloomberg Commodity IndexesSM. Each Index is calculated, administered and published by Bloomberg Index Services Limited (“BISL” or the “Index Sponsor” and, collectively with its affiliates, “Bloomberg”).
The Commodity Index was introduced in July 1998 to provide unique, diversified, economically rational and liquid benchmarks for commodities as an asset class. The Commodity Index currently is composed of the prices of twenty-three exchange-traded futures contracts on twenty-one physical commodities. An exchange-traded futures contract is a bilateral agreement providing for the purchase and sale of a specified type and quantity of a commodity or financial instrument during a stated delivery month for a fixed price. For a general description of the commodity future markets, see “—The Commodity Futures Markets” above. The commodities included in the Commodity Index for 2022 are as follows: aluminum, coffee, copper, corn, cotton, crude oil (WTI and Brent), gold, ULS diesel, lean hogs, live cattle, low sulphur gas oil, natural gas, nickel, silver, soybeans, soybean meal, soybean oil, sugar, RBOB gasoline, wheat (Chicago and KC HRW) and zinc.
Benchmark Governance, Audit and Review Structure
BISL uses two primary committees to provide overall governance and effective oversight of its benchmark administration activities:
The Product, Risk & Operations Committee (“PROC”) provides direct governance and is responsible for the first line of controls over the creation, design, production and dissemination of benchmark indices, strategy indices and fixings administered by BISL, including the Indices. The PROC is composed of Bloomberg personnel with significant experience or relevant expertise in relation to financial benchmarks. Meetings are attended by Bloomberg Legal & Compliance personnel. Nominations and removals are subject to review by the BOC, discussed below.
PS-41
The oversight function is provided by Bloomberg’s Benchmark Oversight Committee (“BOC”). The BOC is independent of the PROC and is responsible for reviewing and challenging the activities carried out by the PROC. In carrying out its oversight duties, the BOC receives reports of management information both from the PROC as well as Bloomberg Legal & Compliance members engaged in second level controls.
On a quarterly basis, the PROC reports to the BOC on governance matters, including but not limited to client complaints, the launch of new benchmarks, operational incidents (including errors & restatements), major announcements and material changes concerning the benchmarks, the results of any reviews of the benchmarks (internal or external) and material stakeholder engagements.
As described in more detail below, the composition of the Index is rebalanced by BISL each year pursuant to the established procedures by index managers operating within the PROC governance body under the oversight of the BOC oversight function. Any material deviations or changes from established procedures are subject to review by such bodies. In addition, to the extent practicable, BISL may solicit stakeholder feedback, including by means of the Index Advisory Council. Once approved, the new composition of the Index is publicly announced and takes effect in the month of January immediately following the announcement.
Four Main Principles Guiding the Creation of the Commodity Index
The Commodity Index was created using the following four main principles:
| · | Economic Significance. A commodity index should fairly represent the importance of a diversified group of commodities to the world economy. To achieve a fair representation, the Commodity Index uses both liquidity data and U.S. dollar-weighted production data in determining the relative quantities of included commodities. The Commodity Index primarily relies on liquidity data, or the relative amount of trading activity of a particular commodity, as an important indicator of the value placed on that commodity by financial and physical market participants. The Commodity Index also relies on production data as a useful measure of the importance of a commodity to the world economy. Production data alone, however, may underestimate the |
economic significance of storable commodities (e.g., gold) relative to non-storable commodities (e.g., live cattle). Production data alone also may underestimate the investment value that financial market participants place on certain commodities, and/or the amount of commercial activity that is centered around various commodities. Accordingly, production statistics alone do not necessarily provide as accurate a blueprint of economic importance as the pronouncements of the markets themselves. The Commodity Index thus relies on data that is both endogenous to the futures markets (liquidity) and exogenous to the futures markets (production) in determining relative weightings.
| · | Diversification. A second major goal of the Commodity Index is to provide diversified exposure to commodities as an asset class. Disproportionate weightings of any particular commodity or sector increase volatility and negate the concept of a broad-based commodity index. Instead of diversified commodities exposure, the investor is unduly subjected to micro-economic shocks in one commodity or sector. As described further below, diversification rules have been established and are applied annually. Additionally, the Commodity Index is rebalanced annually on a price-percentage basis in order to maintain diversified commodities exposure over time. |
| · | Continuity. A third goal of the Commodity Index is to be responsive to the changing nature of commodity markets in a manner that does not completely reshape the character of the Commodity Index from year to year. The Commodity Index is intended to provide a stable benchmark, so that end-users may be reasonably confident that historical performance data (including such diverse measures as correlation, spot yield, roll yield and volatility) is based on a structure that bears some resemblance to both the current and future composition of the Commodity Index. |
| · | Liquidity. Another goal of the Commodity Index is to provide a highly liquid index. The explicit inclusion of liquidity as a weighting factor helps to ensure that the Commodity Index can accommodate substantial investment flows. The liquidity of an index affects transaction costs associated with |
PS-42
current investments. It also may affect the reliability of historical price performance data.
These principles represent goals of the Commodity Index, its creators and owners and there can be no assurance that these goals will be reached by the Index Sponsor.
Composition of the Commodity Index
Commodities available for inclusion in the Commodity Index
The commodities that have been selected for possible inclusion in the Commodity Index are believed by the Index Sponsor to be sufficiently significant to the world economy to merit consideration for inclusion in the Commodity Index, and each such commodity is the subject of a qualifying related futures contract (a “Designated Contract”).
The 25 commodities currently eligible for inclusion in the Commodity Index are as follows: aluminum, cocoa, coffee, copper, corn, cotton, crude oil, gold, lead, lean hogs, live cattle, low sulphur gas oil, natural gas, nickel, platinum, RBOB gasoline, silver, soybean meal, soybean oil, soybeans, sugar, tin, ULS diesel, wheat and zinc.
Designated contracts for each commodity
The 21 commodities selected to be included in the Commodity Index for 2022 are as follows: aluminum, coffee, copper, corn, cotton, crude oil, gold, lean hogs, live cattle, low sulphur gas oil, natural gas, nickel, RBOB gasoline, silver, soybean meal, soybean oil, soybeans, sugar, wheat and zinc.
Historically, through and including the composition of the Commodity Index for 2022,
BISL has chosen for each commodity one Designated Contract that is traded in North America and denominated in U.S. dollars (with the exception of several LME contracts, which are traded in London, and with the exception of crude oil, for which two Designated Contracts have been selected starting in 2012, and wheat, for which two Designated Contracts that are traded in North America have been selected starting in 2013). It is possible that BISL will in the future select more than one Designated Contract for additional commodities or may select Designated Contracts that are traded outside of the United States or in currencies other than the U.S. dollar. For example, in the event that changes in regulations concerning position limits materially affect the ability of market participants to replicate the Commodity Index in the underlying futures markets, it may become appropriate to include multiple Designated Contracts for one or more commodities (in addition to crude oil and wheat) to enhance liquidity. The termination or replacement of a futures contract on an established exchange occurs infrequently. If a Designated Contract were to be terminated or replaced, a comparable futures contract would be selected, if available, to replace the Designated Contract.
Commodity Groups
For purposes of applying the diversification rules discussed above and below, the commodities available for inclusion in the Commodity Index are assigned to Commodity Groups. The Commodity Groups currently include Energy, Grain, Industrial Metals, Livestock, Precious Metals and Softs.
The commodity groups, and the commodities included in each group are currently as follows:
PS-43
| Commodity Group | Commodity
|
| Energy | WTI Crude Oil |
| Brent Crude Oil | |
| Natural Gas | |
| RBOB Gasoline | |
| Low Sulphur Gas Oil | |
| Heating Oil | |
| Grains | Corn |
| Soybeans | |
| Soybean Oil | |
| Soybean Meal | |
| Wheat (Chicago) | |
| Wheat (KC HRW) | |
| Industrial Metals | Aluminum |
| Copper | |
| Nickel | |
| Zinc | |
| Precious Metals | Gold |
| Silver | |
| Softs | Sugar |
| Coffee | |
| Cotton | |
| Livestock | Live Cattle |
| Lean Hogs |
PS-44
The target weights for the commodities included in the Commodity Index and the target weights for the commodity groups for 2022 are as follows:
2022 Commodity Index Target Weights Breakdown by Commodity and Commodity Group
| Commodity Group | Commodity | Target Weight | Target Group Weight |
| Energy | WTI Crude Oil | 8.04% | 29.83% |
| Natural Gas | 7.95% | ||
| Brent Crude Oil | 6.96% | ||
| Low Sulphur Gas Oil | 2.65% | ||
| RBOB Gasoline | 2.17% | ||
| Heating Oil | 2.05% | ||
| Grains | Corn | 5.59% | 22.58% |
| Soybeans | 5.79% | ||
| Soybean Meal | 3.52% | ||
| Wheat (Chicago) | 2.85% | ||
| Soybean Oil | 3.17% | ||
| Wheat (KC HRW) | 1.66% | ||
| Industrial Metals | Copper | 5.40% | 15.48% |
| Aluminum | 4.25% | ||
| Zinc | 3.12% | ||
| Nickel | 2.71% | ||
| Precious Metals | Gold | 15.00% | 19.75% |
| Silver | 4.75% | ||
| Softs | Sugar | 2.79% | 7.03% |
| Coffee | 2.73% | ||
| Cotton | 1.50% | ||
| Livestock | Live Cattle | 3.58% | 5.34% |
| Lean Hogs | 1.75% |
Source: Bloomberg.
Determination of Relative Weightings
The relative weightings of the component commodities included in the Commodity Index are determined annually according to both liquidity and U.S. dollar-adjusted production data in 2/3 and 1/3 shares, respectively. For each of the commodities designated for potential inclusion in the Commodity Index, liquidity is measured by the Commodity Liquidity Percentage (“CLP”) and production by the Commodity Production Percentage (“CPP”). The CLP for each commodity is determined by taking a five-year average of the product of trading volume and the historic U.S. dollar value of the Designated Contract for that commodity, and dividing the result by the sum of such products for
all commodities which were designated for potential inclusion in the applicable index. The CPP is determined for each commodity by taking a five-year average of annual world production figures, adjusted by the historic U.S. dollar value of the Designated Contract, and dividing the result by the sum of such production figures for all the commodities which were designated for potential inclusion in the applicable index. For primary commodities that appear in the Commodity Index along with their derivatives (e.g., crude oil, together with ULS diesel and RBOB gasoline), the CPPs within that group of commodities are reassigned among the primary commodity and its derivative commodities to eliminate the double-counting production figures for the primary commodity that would otherwise
PS-45
occur if no adjustment were made. The same process is applied when more than one Designated Contract has been selected for a particular commodity. The CLP and the CPP are then combined (using a ratio of 2:1) to establish the Commodity Index Percentage (“CIP”) for each commodity. This CIP is then adjusted in accordance with the diversification rules in order to determine the commodities which will be included in the Commodity Index and their respective percentage weights.
Diversification Rules
The Commodity Index is designed to provide diversified exposure to commodities as an asset class. To ensure that no single commodity or commodity sector dominates the Commodity Index, the following diversification rules are applied to the annual reweighting and rebalancing of the Commodity Index as of January of the applicable year:
| · | No single commodity (e.g., natural gas or silver) may constitute over 15% of the Commodity Index. |
| · | No single commodity, together with its derivatives (e.g., WTI Crude Oil and Brent Crude Oil, together with ULS Diesel, Unleaded Gas and Low Sulfur Gas Oil), may constitute more than 25% of the Commodity Index, |
| · | No related group of commodities (e.g., energy, precious metals, livestock or grains) may constitute more than 33% of the Commodity Index. |
| · | No single commodity (e.g., natural gas or silver) may constitute less than 2% of the Commodity Index, as liquidity allows. |
The last rule helps to increase the diversification of the Commodity Index by giving even the smallest commodity within the basket a reasonably significant weight. Commodities with small weights initially may have their weights increased to higher than 2% by prior steps.
Following the annual reweighting and rebalancing of the Commodity Index in January, the percentage of any single commodity or group of commodities at any time prior to the next reweighting or rebalancing will fluctuate and may exceed or be less than the percentages set forth above.
Commodity Index Multipliers
The new unit weights for each commodity included in the Commodity Index are determined by calculating the applicable Commodity Index Multipliers (“CIMs”). Following application of the diversification rules discussed above, CIPs are incorporated into the Commodity Index by calculating the new unit weights for each commodity. On the fourth business day of the month of January (the “CIM Determination Date”) following the calculation of the CIPs, the CIPs are combined with the settlement prices of all Designated Contacts for such day to create the CIM for each Designated Contract for each index component. This CIM is used to achieve the percentage weightings of the index components, in U.S. dollar terms, indicated by their respective CIPs. After the CIMs are calculated, they remain fixed throughout the year. As a result, the observed price percentage of each index component will float throughout the year, until the CIMs are reset the following year based on new CIPs.
Calculation of the Commodity Index
The Commodity Index is calculated by BISL by applying the impact of the changes to the futures prices of commodities included in the Commodity Index (based on their relative weightings).
Once the CIMs are determined as discussed above, the calculation of the Commodity Index is a mathematical process that reflects the performance of each index component and the returns that correspond to the weekly announced interest rate for specified 3-month U.S. Treasury Bills.
At present, BISL disseminates the Commodity Index levels approximately every 15 seconds (assuming the Commodity Index levels have changed within such 15-second interval) from 10:00 p.m. to 3:20 p.m., New York City time, and publishes daily levels at approximately 5:00 p.m., New York City time, on Bloomberg page “BCOMTR <Index>.”
The Commodity Index is a rolling index
The Commodity Index is composed of futures contracts on physical commodities. Unlike equities, which typically entitle the holder to a continuing stake in a corporation, commodity futures contracts normally specify a certain date for the delivery of the underlying physical
PS-46
commodity. In order to avoid delivering the underlying physical commodities and to maintain exposure to the underlying physical commodities, periodically futures contracts on physical commodities specifying delivery on a nearby date must be sold and futures contracts on physical commodities that have not yet reached the delivery period must be purchased. The rollover for each contract occurs over a period of five BCOM Business Days each month according to a pre-determined schedule. This process is known as “rolling” a futures position. The Commodity Index is a “rolling index.”
A “BCOM Business Day” means any day on which the sum of the CIPs for those index components that are open for trading is greater than 50%. For purposes of this definition, the CIPs used during any calendar year are those calculated in the preceding year and applied on the CIM Determination Date for that year; provided however, that on any day during such calendar year falling prior to or on the CIM Determination Date, the preceding year’s CIPs will be used for purposes of determining the existence of a BCOM Business Day.
The Commodity Index is calculated on a Total Return Basis
The Commodity Index is a “total return” index. The overall return on the Commodity Index is generated by two components: (i) unleveraged returns on futures contracts on the physical commodities comprising the Commodity Index and (ii) the returns that correspond to the weekly announced interest rate for specified 3-month U.S. Treasury Bills. The returns are calculated by using the most recent weekly auction high rate for 13-week U.S. Treasury Bills, as reported on the website http://www.treasurydirect.gov/ under the tab entitled “Auction Results” published by the Bureau of the Fiscal Service of the Department of the Treasury, or any successor source, which is generally published once per week on Monday.
Commodity Index Calculation Disruption Events
From time to time, disruptions can occur in trading futures contracts on various commodity exchanges. The daily calculation of the Commodity Index may be adjusted in the event that BISL determines that any of the following index calculation disruption events exists:
| · | the termination or suspension of, or material limitation or disruption in the trading of any futures contract used in the calculation of the Commodity Index on that day; |
| · | the settlement price of any futures contract used in the calculation of the Commodity Index reflects the maximum permitted price change from the previous day’s settlement price; |
| · | the failure of an exchange to publish official settlement prices for any futures contract used in the calculation of the Commodity Index; or |
| · | with respect to any futures contract used in the calculation of the Commodity Index that trades on the LME, a BCOM Business Day on which the LME is not open for trading. |
PS-47
The Agriculture Sub-Index is a multiple-component Sub-Index that is designed to be a benchmark for agricultural commodities as an asset class. It is composed of the futures contracts on agricultural commodities that are included in the Commodity Index and is intended to reflect the returns that are potentially available through (1) an unleveraged investment in those contracts plus (2) the rate of interest that could be earned on cash collateral invested in specified Treasury Bills.
Composition of the Agriculture Sub-Index
The Agriculture Sub-Index currently is composed of the nine exchange-traded futures contracts included in the Commodity Index that relate to agricultural commodities: coffee, corn, cotton, soybean meal, soybean oil, soybeans, sugar and wheat (Soft (Chicago) and Hard Red Winter (Kansas City)).
The weights as of July 26, 2022 for the contracts included in the Agriculture Sub-Index are as follows:
| Commodity | Weighting |
| Chicago Wheat | 10.43% |
| Coffee | 8.55% |
| Corn | 18.80% |
| Cotton | 4.21% |
| Kansas City Wheat | 6.46% |
| Soybean Meal | 12.17% |
| Soybean Oil | 10.61% |
| Soybeans | 19.64% |
| Sugar | 9.13% |
Calculation and Publication of the Agriculture Sub-Index
The Agriculture Sub-Index is calculated using the same methodology as the Commodity Index but with reference only to the contracts included in the Agriculture Sub-Index and to their respective weightings within the Agriculture Sub-Index.
At present, BISL disseminates the Agriculture Sub-Index levels approximately every 15 seconds (assuming the Agriculture Sub-Index levels have changed within such 15-second interval) from 10:00 p.m. to 3:20 p.m., New York City time, and publishes daily levels at approximately 5:00 p.m., New York City time, on Bloomberg page “BCOMAGTR <Index>.”
Historical Closing Levels of the Agriculture Sub-Index
Since its inception, the Agriculture Sub-Index has experienced significant fluctuations. Any historical upward or downward trend in the value of the Agriculture Sub-Index during any period shown below is not an indication that the value of the Agriculture Sub-Index is more or less likely to increase or decrease at any time during the term of the Agriculture ETNs. The historical levels do not give an indication of future performance of the Agriculture Sub-Index. There can be no assurance that the future performance of the Agriculture Sub-Index or its index components will result in holders of the Agriculture ETNs receiving a positive return on their investment.
The Agriculture Sub-Index was launched on July 7, 2005. All data relating to the period prior to the launch of the Agriculture Sub-Index is an historical estimate by the sponsors using available data as to how the Index may have performed in the pre-launch period based upon the percentage weightings in effect in 2005. Such data does not represent actual performance and should not be interpreted as an indication of actual performance. Accordingly, the following table illustrates:
| (i) | on a hypothetical basis, how the Agriculture Sub-Index would have performed from December 31, 1991 to December 31, 2004 based on the selection criteria and methodology described above; and |
| (ii) | on an actual basis, how the Agriculture Sub-Index has performed from December 30, 2005 onwards. |
| December 31, 1991 | 102.665 |
| December 31, 1992 | 93.956 |
| December 31, 1993 | 111.159 |
| December 30, 1994 | 120.360 |
| December 29, 1995 | 149.251 |
| December 31, 1996 | 152.354 |
| December 31, 1997 | 176.881 |
| December 31, 1998 | 140.753 |
| December 31, 1999 | 111.838 |
| December 29, 2000 | 108.975 |
| December 31, 2001 | 90.102 |
| December 31, 2002 | 107.342 |
| December 31, 2003 | 122.268 |
| December 31, 2004 | 106.556 |
| December 30, 2005 | 107.711 |
| December 29, 2006 | 123.064 |
| December 31, 2007 | 159.846 |
PS-48
| December 31, 2008 | 115.94 |
| December 31, 2009 | 131.843 |
| December 31, 2010 | 182.595 |
| December 30, 2011 | 156.385 |
| December 31, 2012 | 162.614 |
| December 31, 2013 | 139.387 |
| December 31, 2014 | 126.529 |
| December 31, 2015 | 106.786 |
| December 30, 2016 | 109.024 |
| December 29, 2017 | 96.979 |
| December 31, 2018 | 86.518 |
| December 31, 2019 | 88.003 |
| December 31, 2020 | 102.507 |
| December 31, 2021 | 129.846 |
| July 26, 2022 | 138.788 |
Hypothetical and actual historical performance of the Index is not an indication of future performance. Future performance of the Index may differ significantly from hypothetical and actual historical performance, either positively or negatively.
PAST PERFORMANCE IS NOT INDICATIVE OF FUTURE RESULTS.
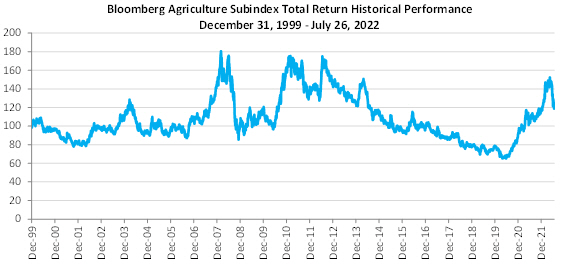
Source: Bloomberg.
PAST PERFORMANCE IS NOT INDICATIVE OF FUTURE RESULTS.
The Aluminum Sub-Index is a single-component Sub-Index that is designed to be a benchmark for aluminum as an asset class. It is composed of the futures contract on aluminum that is included or eligible to be included in the Commodity Index and is intended to reflect the returns that are potentially available through (1) an unleveraged investment in that contract plus (2) the rate of interest that could be earned on cash collateral invested in specified Treasury Bills.
Calculation and Publication of the Aluminum Sub-Index
The Aluminum Sub-Index is calculated using the same methodology as the Commodity Index but with reference only to the contract included in the Aluminum Sub-Index (which, for purposes of the calculation, has a weighting of 100%).
At present, BISL disseminates the Aluminum Sub-Index levels approximately every 15 seconds (assuming the Aluminum Sub-Index levels have changed within such 15-second interval) from 10:00 p.m. to 3:20 p.m., New York
PS-49
City time, and publishes daily levels at approximately 5:00 p.m., New York City time, on Bloomberg page “BCOMALTR <Index>.”
Historical Closing Levels of the Aluminum Sub-Index
Since its inception, the Aluminum Sub-Index has experienced significant fluctuations. Any historical upward or downward trend in the value of the Aluminum Sub-Index during any period shown below is not an indication that the value of the Aluminum Sub-Index is more or less likely to increase or decrease at any time during the term of the Aluminum ETNs. The historical levels do not give an indication of future performance of the Aluminum Sub-Index. There can be no assurance that the future performance of the Aluminum Sub-Index or its index components will result in holders of the Aluminum ETNs receiving a positive return on their investment.
The Aluminum Sub-Index was launched on February 1, 2006. All data relating to the period prior to the launch of the Aluminum Sub-Index is an historical estimate by the sponsors using available data as to how the Index may have performed in the pre-launch period based upon the weightings in effect in the Commodity Index. Such data does not represent actual performance and should not be interpreted as an indication of actual performance. Accordingly, the following table illustrates:
| (i) | on a hypothetical basis, how the Aluminum Sub-Index would have performed from December 31, 1991 to December 30, 2005 based on the selection criteria and methodology described above; and |
| (ii) | on an actual basis, how the Aluminum Sub-Index has performed from December 29, 2006 onwards. |
| December 31, 1991 | 70.392 |
| December 31, 1992 | 73.349 |
| December 31, 1993 | 63.105 |
| December 30, 1994 | 109.359 |
| December 29, 1995 | 93.704 |
| December 31, 1996 | 82.439 |
| December 31, 1997 | 84.268 |
| December 31, 1998 | 66.788 |
| December 31, 1999 | 86.608 |
| December 29, 2000 | 85.518 |
| December 31, 2001 | 73.962 |
| December 31, 2002 | 72.065 |
| December 31, 2003 | 86.724 |
| December 31, 2004 | 107.482 |
| December 30, 2005 | 128.195 |
| December 29, 2006 | 160.569 |
| December 31, 2007 | 136.205 |
| December 31, 2008 | 81.544 |
| December 31, 2009 | 109.128 |
| December 31, 2010 | 114.996 |
| December 30, 2011 | 90.069 |
| December 31, 2012 | 86.487 |
| December 31, 2013 | 68.547 |
| December 31, 2014 | 66.434 |
| December 31, 2015 | 51.196 |
| December 30, 2016 | 56.182 |
| December 29, 2017 | 73.698 |
| December 31, 2018 | 61.235 |
| December 31, 2019 | 58.919 |
| December 31, 2020 | 61.212 |
| December 31, 2021 | 85.084 |
| July 26, 2022 | 73.515 |
Hypothetical and actual historical performance of the Index is not an indication of future performance. Future performance of the Index may differ significantly from hypothetical and actual historical performance, either positively or negatively.
PAST PERFORMANCE IS NOT INDICATIVE OF FUTURE RESULTS.
PS-50

Source: Bloomberg.
PAST PERFORMANCE IS NOT INDICATIVE OF FUTURE RESULTS.
PS-51
The Coffee Sub-Index is a single-component Sub-Index that is designed to be a benchmark for coffee as an asset class. It is composed of the futures contract on coffee that is included or eligible to be included in the Commodity Index and is intended to reflect the returns that are potentially available through (1) an unleveraged investment in that contract plus (2) the rate of interest that could be earned on cash collateral invested in specified Treasury Bills.
Calculation and Publication of the Coffee Sub-Index
The Coffee Sub-Index is calculated using the same methodology as the Commodity Index but with reference only to the contract included in the Coffee Sub-Index (which, for purposes of the calculation, has a weighting of 100%).
At present, BISL disseminates the Coffee Sub-Index levels approximately every 15 seconds (assuming the Coffee Sub-Index levels have changed within such 15-second interval) from 10:00 p.m. to 3:20 p.m., New York City time, and publishes daily levels at approximately 5:00 p.m., New York City time, on Bloomberg page “BCOMKCTR <Index>.”
Historical Closing Levels of the Coffee
Sub-Index
Since its inception, the Coffee Sub-Index has experienced significant fluctuations. Any historical upward or downward trend in the value of the Coffee Sub-Index during any period shown below is not an indication that the value of the Coffee Sub-Index is more or less likely to increase or decrease at any time during the term of the Coffee ETNs. The historical levels do not give an indication of future performance of the Coffee Sub-Index. There can be no assurance that the future performance of the Coffee Sub-Index or its index components will result in holders of the Coffee ETNs receiving a positive return on their investment.
The Coffee Sub-Index was launched on February 1, 2006. All data relating to the period prior to the launch of the Coffee Sub-Index is an historical estimate by the sponsors using available data as to how the Index may have performed in the pre-launch period based upon the weightings in effect in the Commodity Index. Such data does not represent actual performance and should not be
interpreted as an indication of actual performance. Accordingly, the following table illustrates:
| (i) | on a hypothetical basis, how the Coffee Sub-Index would have performed from December 31, 1991 to December 30, 2005 based on the selection criteria and methodology described above; and |
| (ii) | on an actual basis, how the Coffee Sub-Index has performed from December 29, 2006 onwards. |
| December 31, 1991 | 78.741 |
| December 31, 1992 | 67.006 |
| December 31, 1993 | 52.106 |
| December 30, 1994 | 118.365 |
| December 29, 1995 | 70.377 |
| December 31, 1996 | 111.682 |
| December 31, 1997 | 252.681 |
| December 31, 1998 | 223.594 |
| December 31, 1999 | 226.536 |
| December 29, 2000 | 100.741 |
| December 31, 2001 | 55.521 |
| December 31, 2002 | 55.720 |
| December 31, 2003 | 48.986 |
| December 31, 2004 | 66.318 |
| December 30, 2005 | 60.490 |
| December 29, 2006 | 64.129 |
| December 31, 2007 | 62.786 |
| December 31, 2008 | 46.362 |
| December 31, 2009 | 51.139 |
| December 31, 2010 | 85.399 |
| December 30, 2011 | 75.847 |
| December 31, 2012 | 44.303 |
| December 31, 2013 | 30.783 |
| December 31, 2014 | 42.415 |
| December 31, 2015 | 29.039 |
| December 30, 2016 | 28.648 |
| December 29, 2017 | 24.060 |
| December 31, 2018 | 17.687 |
| December 31, 2019 | 19.843 |
| December 31, 2020 | 17.959 |
| December 31, 2021 | 29.401 |
| July 26, 2022 | 27.815 |
Hypothetical and actual historical performance of the Index is not an indication of future performance. Future performance of the Index may differ significantly from hypothetical and actual historical performance, either positively or negatively.
PAST PERFORMANCE IS NOT INDICATIVE OF FUTURE RESULTS.
PS-52
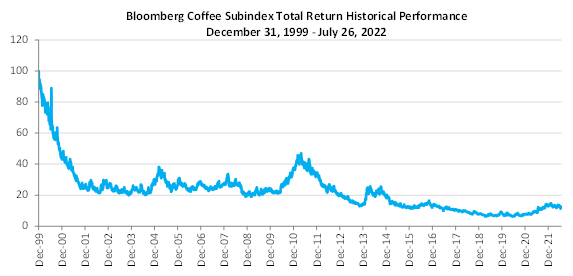
Source: Bloomberg.
PAST PERFORMANCE IS NOT INDICATIVE OF FUTURE RESULTS.
PS-53
The Copper Sub-Index is a single-component Sub-Index that is designed to be a benchmark for copper as an asset class. It is composed of the futures contract on copper that is included or eligible to be included in the Commodity Index and is intended to reflect the returns that are potentially available through (1) an unleveraged investment in that contract plus (2) the rate of interest that could be earned on cash collateral invested in specified Treasury Bills.
Calculation and Publication of the Copper Sub-Index
The Copper Sub-Index is calculated using the same methodology as the Commodity Index but with reference only to the contract included in the Copper Sub-Index (which, for purposes of the calculation, has a weighting of 100%).
At present, BISL disseminates the Copper Sub-Index levels approximately every 15 seconds (assuming the Copper Sub-Index levels have changed within such 15-second interval) from 10:00 p.m. to 3:20 p.m., New York City time, and publishes daily levels at approximately 5:00 p.m., New York City time, on Bloomberg page “BCOMHGTR <Index>.”
Historical Closing Levels of the Copper
Sub-Index
Since its inception, the Copper Sub-Index has experienced significant fluctuations. Any historical upward or downward trend in the value of the Copper Sub-Index during any period shown below is not an indication that the value of the Copper Sub-Index is more or less likely to increase or decrease at any time during the term of the Copper ETNs. The historical levels do not give an indication of future performance of the Copper Sub-Index. There can be no assurance that the future performance of the Copper Sub-Index or its index components will result in holders of the Copper ETNs receiving a positive return on their investment.
The Copper Sub-Index was launched on February 1, 2006. All data relating to the period prior to the launch of the Copper Sub-Index is an historical estimate by the sponsors using available data as to how the Index may have performed in the pre-launch period based upon the weightings in effect in the Commodity Index. Such data does not represent actual performance and should not be interpreted as an indication of
actual performance. Accordingly, the following table illustrates:
| (i) | on a hypothetical basis, how the Copper Sub-Index would have performed from December 31, 1991 to December 30, 2005 based on the selection criteria and methodology described above; and |
| (ii) | on an actual basis, how the Copper Sub-Index has performed from December 29, 2006 onwards. |
| December 31, 1991 | 93.852 |
| December 31, 1992 | 102.887 |
| December 31, 1993 | 81.793 |
| December 30, 1994 | 145.666 |
| December 29, 1995 | 157.850 |
| December 31, 1996 | 158.254 |
| December 31, 1997 | 143.182 |
| December 31, 1998 | 123.356 |
| December 31, 1999 | 155.247 |
| December 29, 2000 | 153.271 |
| December 31, 2001 | 118.121 |
| December 31, 2002 | 122.198 |
| December 31, 2003 | 178.567 |
| December 31, 2004 | 257.498 |
| December 30, 2005 | 415.010 |
| December 29, 2006 | 631.804 |
| December 31, 2007 | 688.285 |
| December 31, 2008 | 323.062 |
| December 31, 2009 | 742.970 |
| December 31, 2010 | 962.468 |
| December 30, 2011 | 727.563 |
| December 31, 2012 | 763.980 |
| December 31, 2013 | 697.041 |
| December 31, 2014 | 581.652 |
| December 31, 2015 | 435.477 |
| December 30, 2016 | 504.015 |
| December 29, 2017 | 651.021 |
| December 31, 2018 | 512.699 |
| December 31, 2019 | 549.972 |
| December 31, 2020 | 678.230 |
| December 31, 2021 | 861.421 |
| July 26, 2022 | 652.200 |
Hypothetical and actual historical performance of the Index is not an indication of future performance. Future performance of the Index may differ significantly from hypothetical and actual historical performance, either positively or negatively.
PAST PERFORMANCE IS NOT INDICATIVE OF FUTURE RESULTS.
PS-54

Source: Bloomberg.
PAST PERFORMANCE IS NOT INDICATIVE OF FUTURE RESULTS.
PS-55
The Cotton Sub-Index is a single-component Sub-Index that is designed to be a benchmark for cotton as an asset class. It is composed of the futures contract on cotton that is included or eligible to be included in the Commodity Index and is intended to reflect the returns that are potentially available through (1) an unleveraged investment in that contract plus (2) the rate of interest that could be earned on cash collateral invested in specified Treasury Bills.
Calculation and Publication of the Cotton Sub-Index
The Cotton Sub-Index is calculated using the same methodology as the Commodity Index but with reference only to the contract included in the Cotton Sub-Index (which, for purposes of the calculation, has a weighting of 100%).
At present, BISL disseminates the Cotton Sub-Index levels approximately every 15 seconds (assuming the Cotton Sub-Index levels have changed within such 15-second interval) from 10:00 p.m. to 3:20 p.m., New York City time, and publishes daily levels at approximately 5:00 p.m., New York City time, on Bloomberg page “BCOMCTTR <Index>.”
Historical Closing Levels of the Cotton
Sub-Index
Since its inception, the Cotton Sub-Index has experienced significant fluctuations. Any historical upward or downward trend in the value of the Cotton Sub-Index during any period shown below is not an indication that the value of the Cotton Sub-Index is more or less likely to increase or decrease at any time during the term of the Cotton ETNs. The historical levels do not give an indication of future performance of the Cotton Sub-Index. There can be no assurance that the future performance of the Cotton Sub-Index or its index components will result in holders of the Cotton ETNs receiving a positive return on their investment.
The Cotton Sub-Index was launched on February 1, 2006. All data relating to the period prior to the launch of the Cotton Sub-Index is an historical estimate by the sponsors using available data as to how the Index may have performed in the pre-launch period based upon the weightings in effect in the Commodity Index. Such data does not represent actual performance and should not be
interpreted as an indication of actual performance. Accordingly, the following table illustrates:
| (i) | on a hypothetical basis, how the Cotton Sub-Index would have performed from December 31, 1991 to December 30, 2005 based on the selection criteria and methodology described above; and |
| (ii) | on an actual basis, how the Cotton Sub-Index has performed from December 29, 2006 onwards. |
| December 31, 1991 | 94.976 |
| December 31, 1992 | 88.700 |
| December 31, 1993 | 100.423 |
| December 30, 1994 | 142.241 |
| December 29, 1995 | 202.343 |
| December 31, 1996 | 193.905 |
| December 31, 1997 | 165.050 |
| December 31, 1998 | 148.593 |
| December 31, 1999 | 123.310 |
| December 29, 2000 | 134.921 |
| December 31, 2001 | 67.353 |
| December 31, 2002 | 78.345 |
| December 31, 2003 | 93.981 |
| December 31, 2004 | 53.229 |
| December 30, 2005 | 54.108 |
| December 29, 2006 | 46.221 |
| December 31, 2007 | 47.217 |
| December 31, 2008 | 27.020 |
| December 31, 2009 | 35.161 |
| December 31, 2010 | 69.675 |
| December 30, 2011 | 54.557 |
| December 31, 2012 | 47.613 |
| December 31, 2013 | 51.921 |
| December 31, 2014 | 40.929 |
| December 31, 2015 | 42.143 |
| December 30, 2016 | 46.587 |
| December 29, 2017 | 52.431 |
| December 31, 2018 | 48.601 |
| December 31, 2019 | 45.459 |
| December 31, 2020 | 50.002 |
| December 31, 2021 | 71.314 |
| July 26, 2022 | 72.528 |
Hypothetical and actual historical performance of the Index is not an indication of future performance. Future performance of the Index may differ significantly from hypothetical and actual historical performance, either positively or negatively.
PAST PERFORMANCE IS NOT INDICATIVE OF FUTURE RESULTS.
PS-56
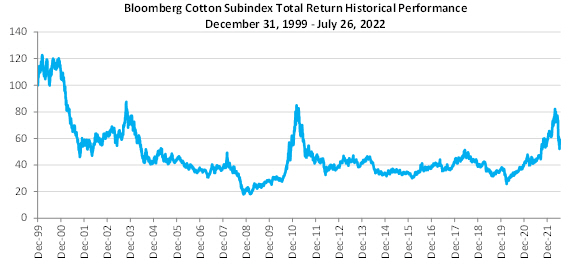
Source: Bloomberg.
PAST PERFORMANCE IS NOT INDICATIVE OF FUTURE RESULTS.
PS-57
The Energy Sub-Index is a multiple-component Sub-Index that is designed to be a benchmark for energy-related commodities as an asset class. It is composed of the futures contracts on energy-related commodities that are included in the Commodity Index and is intended to reflect the returns that are potentially available through (1) an unleveraged investment in those contracts plus (2) the rate of interest that could be earned on cash collateral invested in specified Treasury Bills.
Composition of the Energy Sub-Index
The Energy Sub-Index currently is composed of the six exchange-traded futures contracts included in the Commodity Index that relate to energy-related commodities: Brent crude oil, ULS diesel, low sulphur gas oil, natural gas, RBOB gasoline and WTI crude oil.
The weights as of July 26, 2022 for the contracts included in the Energy Sub-Index are as follows:
| Commodity | Weighting |
| Brent Crude Oil | 17.61% |
| Heating Oil | 6.31% |
| Low Sulphur Gas Oil | 8.42% |
| Natural Gas | 40.83% |
| RBOB Gasoline | 6.19% |
| WTI Crude Oil | 20.65% |
Calculation and Publication of the Energy Sub-Index
The Energy Sub-Index is calculated using the same methodology as the Commodity Index but with reference only to the contracts included in the Energy Sub-Index and to their respective weightings within the Energy Sub-Index.
At present, BISL disseminates the Energy Sub-Index levels approximately every 15 seconds (assuming the Energy Sub-Index levels have changed within such 15-second interval) from 10:00 p.m. to 3:20 p.m., New York City time, and publishes daily levels at approximately 5:00 p.m., New York City time, on Bloomberg page “BCOMENTR <Index>.”
Historical Closing Levels of the Energy Sub-Index
Since its inception, the Energy Sub-Index has experienced significant fluctuations. Any historical upward or downward trend in the value of the Energy Sub-Index during any period shown below is not an indication that the value of the Energy Sub-Index is more or less likely to increase or decrease at any time during the term of the Energy ETNs. The historical levels do not give an indication of future performance of the Energy Sub-Index. There can be no assurance that the future performance of the Energy Sub-Index or its index components will result in holders of the Energy ETNs receiving a positive return on their investment.
The Energy Sub-Index was launched on November 15, 2001. All data relating to the period prior to the launch of the Energy Sub-Index is an historical estimate by the sponsors using available data as to how the Index may have performed in the pre-launch period based upon the percentage weightings in effect in 2001. Such data does not represent actual performance and should not be interpreted as an indication of actual performance. Accordingly, the following table illustrates:
| (i) | on a hypothetical basis, how the Energy Sub-Index would have performed from December 31, 1991 to December 29, 2000 based on the selection criteria and methodology described above; and |
| (ii) | on an actual basis, how the Energy Sub-Index has performed from December 31, 2001 onwards. |
| December 31, 1991 | 88.767 |
| December 31, 1992 | 100.648 |
| December 31, 1993 | 75.850 |
| December 30, 1994 | 87.814 |
| December 29, 1995 | 109.188 |
| December 31, 1996 | 204.849 |
| December 31, 1997 | 158.488 |
| December 31, 1998 | 85.458 |
| December 31, 1999 | 155.294 |
| December 29, 2000 | 342.212 |
| December 31, 2001 | 215.135 |
| December 31, 2002 | 333.642 |
| December 31, 2003 | 439.460 |
| December 31, 2004 | 523.493 |
| December 30, 2005 | 744.210 |
| December 29, 2006 | 436.062 |
| December 31, 2007 | 526.268 |
| December 31, 2008 | 277.168 |
| December 31, 2009 | 262.465 |
PS-58
| December 31, 2010 | 234.779 |
| December 30, 2011 | 197.294 |
| December 31, 2012 | 178.826 |
| December 31, 2013 | 188.120 |
| December 31, 2014 | 114.106 |
| December 31, 2015 | 69.751 |
| December 30, 2016 | 81.100 |
| December 29, 2017 | 77.602 |
| December 31, 2018 | 67.747 |
| December 31, 2019 | 75.725 |
| December 31, 2020 | 43.377 |
| December 31, 2021 | 65.989 |
| July 26, 2022 | 118.281 |
Hypothetical and actual historical performance of the Index is not an indication of future performance. Future performance of the Index may differ significantly from hypothetical and actual historical performance, either positively or negatively.
PAST PERFORMANCE IS NOT INDICATIVE OF FUTURE RESULTS

Source: Bloomberg.
PAST PERFORMANCE IS NOT INDICATIVE OF FUTURE RESULTS.
PS-59
The Grains Sub-Index is a multiple-component Sub-Index that is designed to be a benchmark for grains as an asset class. It is composed of the futures contracts on grains that are included in the Commodity Index and is intended to reflect the returns that are potentially available through (1) an unleveraged investment in those contracts plus (2) the rate of interest that could be earned on cash collateral invested in specified Treasury Bills.
Composition of the Grains Sub-Index
The Grains Sub-Index currently is composed of the four exchange-traded futures contracts included in the Commodity Index that relate to grains: Chicago wheat, corn, Kansas City wheat and soybeans.
The weights as of July 26, 2022 for the contracts included in the Grains Sub-Index are as follows:
| Commodity | Weighting |
| Chicago Wheat | 18.85% |
| Corn | 33.98% |
| Kansas City Wheat | 11.67% |
Soybeans | 35.50% |
Calculation and Publication of the Grains Sub-Index
The Grains Sub-Index is calculated using the same methodology as the Commodity Index but with reference only to the contracts included in the Grains Sub-Index and to their respective weightings within the Grains Sub-Index.
At present, BISL disseminates the Grains Sub-Index levels approximately every 15 seconds (assuming the Grains Sub-Index levels have changed within such 15-second interval) from 10:00 p.m. to 3:20 p.m., New York City time, and publishes daily levels at approximately 5:00 p.m., New York City time, on Bloomberg page “BCOMGRTR <Index>.”
Historical Closing Levels of the Grains Sub-Index
Since its inception, the Grains Sub-Index has experienced significant fluctuations. Any historical upward or downward trend in the value of the Grains Sub-Index during any period shown below is not an indication that the value of the Grains Sub-Index is more or less likely to
increase or decrease at any time during the term of the Grains ETNs. The historical levels do not give an indication of future performance of the Grains Sub-Index. There can be no assurance that the future performance of the Grains Sub-Index or its index components will result in holders of the Grains ETNs receiving a positive return on their investment.
The Grains Sub-Index was launched on November 15, 2001. All data relating to the period prior to the launch of the Grains Sub-Index is an historical estimate by the sponsors using available data as to how the Index may have performed in the pre-launch period based upon the percentage weightings in effect in 2001. Such data does not represent actual performance and should not be interpreted as an indication of actual performance. Accordingly, the following table illustrates:
| (i) | on a hypothetical basis, how the Grains Sub-Index would have performed from December 31, 1991 to December 29, 2000 based on the selection criteria and methodology described above; and |
| (ii) | on an actual basis, how the Grains Sub-Index has performed from December 31, 2001 onwards. |
| December 31, 1991 | 107.489 |
| December 31, 1992 | 98.296 |
| December 31, 1993 | 123.665 |
| December 30, 1994 | 104.503 |
| December 29, 1995 | 141.546 |
| December 31, 1996 | 135.392 |
| December 31, 1997 | 147.845 |
| December 31, 1998 | 114.389 |
| December 31, 1999 | 92.413 |
| December 29, 2000 | 90.890 |
| December 31, 2001 | 74.585 |
| December 31, 2002 | 87.244 |
| December 31, 2003 | 106.209 |
| December 31, 2004 | 81.057 |
| December 30, 2005 | 78.368 |
| December 29, 2006 | 96.872 |
| December 31, 2007 | 137.627 |
| December 31, 2008 | 101.406 |
| December 31, 2009 | 99.736 |
| December 31, 2010 | 129.936 |
| December 30, 2011 | 111.218 |
| December 31, 2012 | 131.518 |
| December 31, 2013 | 109.291 |
| December 31, 2014 | 99.054 |
| December 31, 2015 | 79.814 |
| December 30, 2016 | 75.124 |
| December 29, 2017 | 66.629 |
| December 31, 2018 | 62.965 |
PS-60
| December 31, 2019 | 62.260 |
| December 31, 2020 | 74.292 |
| December 31, 2021 | 89.857 |
| July 26, 2022 | 98.035 |
Hypothetical and actual historical performance of the Index is not an indication of future performance. Future performance of the Index
may differ significantly from hypothetical and actual historical performance, either positively or negatively.
PAST PERFORMANCE IS NOT INDICATIVE OF FUTURE RESULTS.
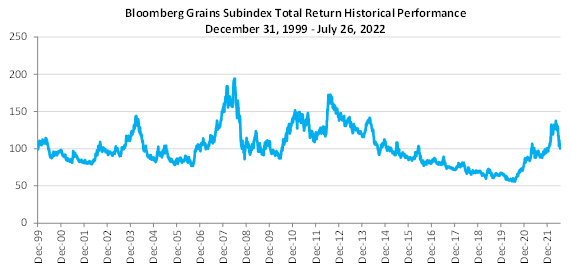
Source: Bloomberg.
PAST PERFORMANCE IS NOT INDICATIVE OF FUTURE RESULTS.
PS-61
The Industrial Metals Sub-Index is a multiple-component Sub-Index that is designed to be a benchmark for industrial metals as an asset class. It is composed of the futures contracts on industrial metals that are included in the Commodity Index and is intended to reflect the returns that are potentially available through (1) an unleveraged investment in those contracts plus (2) the rate of interest that could be earned on cash collateral invested in specified Treasury Bills.
Composition of the Industrial Metals
Sub-Index
The Industrial Metals Sub-Index currently is composed of the four exchange-traded futures contracts included in the Commodity Index that relate to industrial metals: aluminum, copper, nickel and zinc.
The weights as of July 26, 2022 for the contracts included in the Industrial Metals Sub-Index are as follows:
| Commodity | Weighting |
| Aluminum | 26.59% |
| Copper | 31.59% |
| Nickel | 21.56% |
| Zinc | 20.27% |
Calculation and Publication of the Industrial Metals Sub-Index
The Industrial Metals Sub-Index is calculated using the same methodology as the Commodity Index but with reference only to the contracts included in the Industrial Metals Sub-Index and to their respective weightings within the Industrial Metals Sub-Index.
At present, BISL disseminates the Industrial Metals Sub-Index levels approximately every 15 seconds (assuming the Industrial Metals Sub-Index levels have changed within such 15-second interval) from 10:00 p.m. to 3:20 p.m., New York City time, and publishes daily levels at approximately 5:00 p.m., New York City time, on Bloomberg page “BCOMINTR <Index>.”
Historical Closing Levels of the Industrial Metals Sub-Index
Since its inception, the Industrial Metals Sub-Index has experienced significant fluctuations.
Any historical upward or downward trend in the value of the Industrial Metals Sub-Index during any period shown below is not an indication that the value of the Industrial Metals Sub-Index is more or less likely to increase or decrease at any time during the term of the Industrial Metals ETNs. The historical levels do not give an indication of future performance of the Industrial Metals Sub-Index. There can be no assurance that the future performance of the Industrial Metals Sub-Index or its index components will result in holders of the Industrial Metals ETNs receiving a positive return on their investment.
The Industrial Metals Sub-Index was launched on November 15, 2001. All data relating to the period prior to the launch of the Industrial Metals Sub-Index is an historical estimate by the sponsors using available data as to how the Index may have performed in the pre-launch period based upon the percentage weightings in effect in 2001. Such data does not represent actual performance and should not be interpreted as an indication of actual performance. Accordingly, the following table illustrates:
| (i) | on a hypothetical basis, how the Industrial Metals Sub-Index would have performed from December 31, 1991 to December 29, 2000 based on the selection criteria and methodology described above; and |
| (ii) | on an actual basis, how the Industrial Metals Sub-Index has performed from December 31, 2001 onwards. |
| December 31, 1991 | 86.470 |
| December 31, 1992 | 90.324 |
| December 31, 1993 | 75.839 |
| December 30, 1994 | 126.387 |
| December 29, 1995 | 121.396 |
| December 31, 1996 | 113.539 |
| December 31, 1997 | 111.532 |
| December 31, 1998 | 90.497 |
| December 31, 1999 | 123.622 |
| December 29, 2000 | 120.305 |
| December 31, 2001 | 97.855 |
| December 31, 2002 | 100.693 |
| December 31, 2003 | 144.527 |
| December 31, 2004 | 181.048 |
| December 30, 2005 | 241.645 |
| December 29, 2006 | 416.470 |
| December 31, 2007 | 375.397 |
| December 31, 2008 | 194.208 |
| December 31, 2009 | 349.541 |
| December 31, 2010 | 406.319 |
PS-62
| December 30, 2011 | 307.878 |
| December 31, 2012 | 309.949 |
| December 31, 2013 | 267.695 |
| December 31, 2014 | 249.305 |
| December 31, 2015 | 182.297 |
| December 30, 2016 | 218.606 |
| December 29, 2017 | 282.771 |
| December 31, 2018 | 227.686 |
| December 31, 2019 | 243.578 |
| December 31, 2020 | 283.360 |
| December 31, 2021 | 369.337 |
| July 26, 2022 | 318.642 |
Hypothetical and actual historical performance of the Index is not an indication of future performance. Future performance of the Index may differ significantly from hypothetical and actual historical performance, either positively or negatively.
PAST PERFORMANCE IS NOT INDICATIVE OF FUTURE RESULTS.
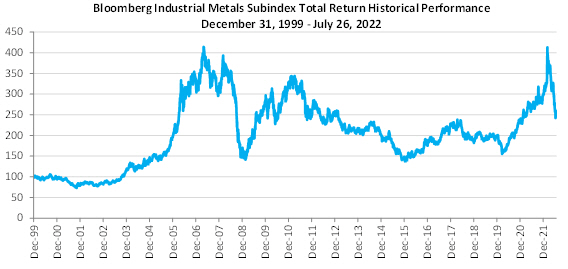
Source: Bloomberg.
PAST PERFORMANCE IS NOT INDICATIVE OF FUTURE RESULTS.
PS-63
The Livestock Sub-Index is a multiple-component Sub-Index that is designed to be a benchmark for livestock as an asset class. It is composed of the futures contracts on livestock that are included in the Commodity Index and is intended to reflect the returns that are potentially available through (1) an unleveraged investment in those contracts plus (2) the rate of interest that could be earned on cash collateral invested in specified Treasury Bills.
Composition of the Livestock Sub-Index
The Livestock Sub-Index currently is composed of the two exchange-traded futures contracts included in the Commodity Index that relate to livestock: lean hogs and live cattle.
The weights as of July 26, 2022 for the contracts included in the Livestock Sub-Index are as follows:
| Commodity | Weighting |
| Lean Hogs | 34.80% |
| Live Cattle | 66.20% |
Calculation and Publication of the Livestock Sub-Index
The Livestock Sub-Index is calculated using the same methodology as the Commodity Index but with reference only to the contracts included in the Livestock Sub-Index and to their respective weightings within the Livestock Sub-Index.
At present, BISL disseminates the Livestock Sub-Index levels approximately every 15 seconds (assuming the Livestock Sub-Index levels have changed within such 15-second interval) from 10:00 p.m. to 3:20 p.m., New York City time, and publishes daily levels at approximately 5:00 p.m., New York City time, on Bloomberg page “BCOMLITR <Index>.”
Historical Closing Levels of the Livestock Sub-Index
Since its inception, the Livestock Sub-Index has experienced significant fluctuations. Any historical upward or downward trend in the value of the Livestock Sub-Index during any period shown below is not an indication that the value of the Livestock Sub-Index is more or less likely to increase or decrease at any time during the term of the Livestock ETNs. The historical levels do not give an indication of future performance of the Livestock Sub-Index. There can be no assurance
that the future performance of the Livestock Sub-Index or its index components will result in holders of the Livestock ETNs receiving a positive return on their investment.
The Livestock Sub-Index was launched on November 15, 2001. All data relating to the period prior to the launch of the Livestock Sub-Index is an historical estimate by the sponsors using available data as to how the Index may have performed in the pre-launch period based upon the percentage weightings in effect in 2001. Such data does not represent actual performance and should not be interpreted as an indication of actual performance. Accordingly, the following table illustrates:
| (i) | on a hypothetical basis, how the Livestock Sub-Index would have performed from December 31, 1991 to December 29, 2000 based on the selection criteria and methodology described above; and |
| (ii) | on an actual basis, how the Livestock Sub-Index has performed from December 31, 2001 onwards. |
| December 31, 1991 | 101.203 |
| December 31, 1992 | 127.855 |
| December 31, 1993 | 138.078 |
| December 30, 1994 | 124.555 |
| December 29, 1995 | 130.599 |
| December 31, 1996 | 151.002 |
| December 31, 1997 | 142.237 |
| December 31, 1998 | 101.495 |
| December 31, 1999 | 116.346 |
| December 29, 2000 | 126.184 |
| December 31, 2001 | 125.452 |
| December 31, 2002 | 111.108 |
| December 31, 2003 | 106.760 |
| December 31, 2004 | 135.694 |
| December 30, 2005 | 135.341 |
| December 29, 2006 | 127.058 |
| December 31, 2007 | 113.498 |
| December 31, 2008 | 81.259 |
| December 31, 2009 | 69.014 |
| December 31, 2010 | 75.413 |
| December 30, 2011 | 73.679 |
| December 31, 2012 | 71.069 |
| December 31, 2013 | 68.552 |
| December 31, 2014 | 76.474 |
| December 31, 2015 | 62.073 |
| December 30, 2016 | 58.577 |
| December 29, 2017 | 62.304 |
| December 31, 2018 | 61.241 |
| December 31, 2019 | 57.573 |
| December 31, 2020 | 44.089 |
| December 31, 2021 | 47.890 |
PS-64
| July 26, 2022 | 48.814 |
Hypothetical and actual historical performance of the Index is not an indication of future performance. Future performance of the Index may differ significantly from hypothetical and
actual historical performance, either positively or negatively.
PAST PERFORMANCE IS NOT INDICATIVE OF FUTURE RESULTS.

Source: Bloomberg.
PAST PERFORMANCE IS NOT INDICATIVE OF FUTURE RESULTS.
PS-65
The Nickel Sub-Index is a single-component Sub-Index that is designed to be a benchmark for nickel as an asset class. It is composed of the futures contract on nickel that is included or eligible to be included in the Commodity Index and is intended to reflect the returns that are potentially available through (1) an unleveraged investment in that contract plus (2) the rate of interest that could be earned on cash collateral invested in specified Treasury Bills.
Calculation and Publication of the Nickel Sub-Index
The Nickel Sub-Index is calculated using the same methodology as the Commodity Index but with reference only to the contract included in the Nickel Sub-Index (which, for purposes of the calculation, has a weighting of 100%).
At present, BISL disseminates the Nickel Sub-Index levels approximately every 15 seconds (assuming the Nickel Sub-Index levels have changed within such 15-second interval) from 10:00 p.m. to 3:20 p.m., New York City time, and publishes daily levels at approximately 5:00 p.m., New York City time, on Bloomberg page “BCOMNITR <Index>.”
Historical Closing Levels of the Nickel Sub-Index
Since its inception, the Nickel Sub-Index has experienced significant fluctuations. Any historical upward or downward trend in the value of the Nickel Sub-Index during any period shown below is not an indication that the value of the Nickel Sub-Index is more or less likely to increase or decrease at any time during the term of the Nickel ETNs. The historical levels do not give an indication of future performance of the Nickel Sub-Index. There can be no assurance that the future performance of the Nickel Sub-Index or its index components will result in holders of the Nickel ETNs receiving a positive return on their investment.
The Nickel Sub-Index was launched on February 1, 2006. All data relating to the period prior to the launch of the Nickel Sub-Index is an historical estimate by the sponsors using available data as to how the Index may have performed in the pre-launch period based upon the weightings in effect in the Commodity Index. Such data does not
represent actual performance and should not be interpreted as an indication of actual performance. Accordingly, the following table illustrates:
| (i) | on a hypothetical basis, how the Nickel Sub-Index would have performed from December 31, 1991 to December 30, 2005 based on the selection criteria and methodology described above; and |
| (ii) | on an actual basis, how the Nickel Sub-Index has performed from December 29, 2006 onwards. |
| December 31, 1991 | 90.748 |
| December 31, 1992 | 74.436 |
| December 31, 1993 | 65.116 |
| December 30, 1994 | 108.756 |
| December 29, 1995 | 96.199 |
| December 31, 1996 | 77.880 |
| December 31, 1997 | 72.706 |
| December 31, 1998 | 48.462 |
| December 31, 1999 | 101.943 |
| December 29, 2000 | 99.047 |
| December 31, 2001 | 89.010 |
| December 31, 2002 | 117.759 |
| December 31, 2003 | 280.755 |
| December 31, 2004 | 268.788 |
| December 30, 2005 | 255.078 |
| December 29, 2006 | 714.957 |
| December 31, 2007 | 621.979 |
| December 31, 2008 | 272.542 |
| December 31, 2009 | 422.125 |
| December 31, 2010 | 558.007 |
| December 30, 2011 | 420.297 |
| December 31, 2012 | 337.347 |
| December 31, 2013 | 301.500 |
| December 31, 2014 | 323.537 |
| December 31, 2015 | 185.587 |
| December 30, 2016 | 207.577 |
| December 29, 2017 | 260.680 |
| December 31, 2018 | 217.956 |
| December 31, 2019 | 288.929 |
| December 31, 2020 | 337.000 |
| December 31, 2021 | 421.732 |
| July 26, 2022 | 442.739 |
Hypothetical and actual historical performance of the Index is not an indication of future performance. Future performance of the Index may differ significantly from hypothetical and actual historical performance, either positively or negatively.
PS-66
PAST PERFORMANCE IS NOT INDICATIVE OF FUTURE RESULTS.
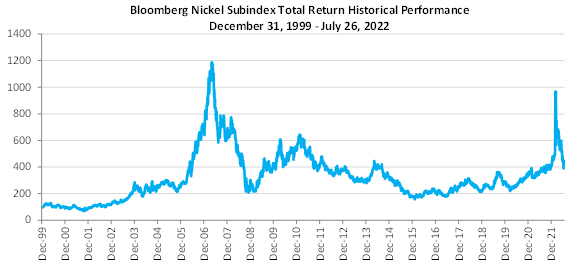
Source: Bloomberg.
PAST PERFORMANCE IS NOT INDICATIVE OF FUTURE RESULTS.
PS-67
The Platinum Sub-Index is a single-component Sub-Index that is designed to be a benchmark for platinum as an asset class. It is composed of the futures contract on platinum that is included or eligible to be included in the Commodity Index and is intended to reflect the returns that are potentially available through (1) an unleveraged investment in that contract plus (2) the rate of interest that could be earned on cash collateral invested in specified Treasury Bills.
At present, platinum is one of the four commodities eligible for inclusion but not included in the Commodity Index. The contract included in the Platinum Sub-Index is the “Platinum” contract traded on the New York Mercantile Exchange, which is the contract that would be eligible for inclusion in the Commodity Index if platinum were one of the commodities included in the Commodity Index.
Calculation and Publication of the Platinum Sub-Index
The Platinum Sub-Index is calculated using the same methodology as the Commodity Index but with reference only to the contract included in the Platinum Sub-Index (which, for purposes of the calculation, has a weighting of 100%).
At present, BISL disseminates the Platinum Sub-Index levels approximately every 15 seconds (assuming the Platinum Sub-Index levels have changed within such 15-second interval) from 10:00 p.m. to 3:20 p.m., New York City time, and publishes daily levels at approximately 5:00 p.m., New York City time, on Bloomberg page “BCOMPLTR <Index>.”
Historical Closing Levels of the Platinum Sub-Index
Since its inception, the Platinum Sub-Index has experienced significant fluctuations. Any historical upward or downward trend in the value of the Platinum Sub-Index during any period shown below is not an indication that the value of the Platinum Sub-Index is more or less likely to increase or decrease at any time during the term of the Platinum ETNs. The historical levels do not give an indication of future performance of the Platinum Sub-Index. There can be no assurance that the future performance of the Platinum Sub-Index or its index components will result in holders of the Platinum ETNs receiving a positive return on their investment.
The Platinum Sub-Index was launched on March 7, 2008. All data relating to the period prior to the
launch of the Platinum Sub-Index is an historical estimate by the sponsors using available data as to how the Index may have performed in the pre-launch period based upon the weightings in effect in the Commodity Index. Such data does not represent actual performance and should not be interpreted as an indication of actual performance. Accordingly, the following table illustrates:
| (i) | on a hypothetical basis, how the Platinum Sub-Index would have performed from December 31, 1991 to December 31, 2007 based on the selection criteria and methodology described above; and |
| (ii) | on an actual basis, how the Platinum Sub-Index has performed from March 7, 2008 onwards. |
| December 31, 1991 | 79.211 |
| December 31, 1992 | 85.599 |
| December 31, 1993 | 99.317 |
| December 30, 1994 | 106.351 |
| December 29, 1995 | 106.224 |
| December 31, 1996 | 101.439 |
| December 31, 1997 | 106.799 |
| December 31, 1998 | 112.277 |
| December 31, 1999 | 140.490 |
| December 29, 2000 | 238.084 |
| December 31, 2001 | 206.344 |
| December 31, 2002 | 271.644 |
| December 31, 2003 | 397.291 |
| December 31, 2004 | 444.141 |
| December 30, 2005 | 522.497 |
| December 29, 2006 | 619.368 |
| December 31, 2007 | 841.008 |
| December 31, 2008 | 519.555 |
| December 31, 2009 | 800.327 |
| December 31, 2010 | 955.178 |
| December 30, 2011 | 746.560 |
| December 31, 2012 | 811.338 |
| December 31, 2013 | 715.791 |
| December 31, 2014 | 627.722 |
| December 31, 2015 | 461.663 |
| December 30, 2016 | 465.139 |
| December 29, 2017 | 479.002 |
| December 31, 2018 | 407.928 |
| December 31, 2019 | 495.894 |
| December 31, 2020 | 537.839 |
| December 31, 2021 | 476.388 |
| July 26, 2022 | 428.063 |
Hypothetical and actual historical performance of the Index is not an indication of future performance. Future performance of the Index may differ significantly from hypothetical and
PS-68
actual historical performance, either positively or negatively.
PAST PERFORMANCE IS NOT INDICATIVE OF FUTURE RESULTS

Source: Bloomberg.
PAST PERFORMANCE IS NOT INDICATIVE OF FUTURE RESULTS.
PS-69
The Precious Metals Sub-Index is a multiple-component Sub-Index that is designed to be a benchmark for precious metals as an asset class. It is composed of the futures contracts on precious metals that are included in the Commodity Index and is intended to reflect the returns that are potentially available through (1) an unleveraged investment in those contracts plus (2) the rate of interest that could be earned on cash collateral invested in specified Treasury Bills.
Composition of the Precious Metals Sub-Index
The Precious Metals Sub-Index currently is composed of the two exchange-traded futures contracts included in the Commodity Index that relate to precious metals: gold and silver.
The weights as of July 26, 2022 for the contracts included in the Precious Metals Sub-Index are as follows:
| Commodity | Weighting |
| Gold | 78.59% |
| Silver | 21.41% |
Calculation and Publication of the Precious Metals Sub-Index
The Precious Metals Sub-Index is calculated using the same methodology as the Commodity Index but with reference only to the contracts included in the Precious Metals Sub-Index and to their respective weightings within the Precious Metals Sub-Index.
At present, BISL disseminates the Precious Metals Sub-Index levels approximately every 15 seconds (assuming the Precious Metals Sub-Index levels have changed within such 15-second interval) from 10:00 p.m. to 3:20 p.m., New York City time, and publishes daily levels at approximately 5:00 p.m., New York City time, on Bloomberg page “BCOMPRTR <Index>.”
Historical Closing Levels of the Precious Metals Sub-Index
Since its inception, the Precious Metals Sub-Index has experienced significant fluctuations. Any historical upward or downward trend in the value of the Precious Metals Sub-Index during any period shown below is not an indication that the value of the Precious Metals Sub-Index is
more or less likely to increase or decrease at any time during the term of the Precious Metals ETNs. The historical levels do not give an indication of future performance of the Precious Metals Sub-Index. There can be no assurance that the future performance of the Precious Metals Sub-Index or its index components will result in holders of the Precious Metals ETNs receiving a positive return on their investment.
The Precious Metals Sub-Index was launched on November 15, 2001. All data relating to the period prior to the launch of the Precious Metals Sub-Index is an historical estimate by the sponsors using available data as to how the Index may have performed in the pre-launch period based upon the percentage weightings in effect in 2001. Such data does not represent actual performance and should not be interpreted as an indication of actual performance. Accordingly, the following table illustrates:
| (i) | on a hypothetical basis, how the Precious Metals Sub-Index would have performed from December 31, 1991 to December 29, 2000 based on the selection criteria and methodology described above; and |
| (ii) | on an actual basis, how the Precious Metals Sub-Index has performed from December 31, 2001 onwards. |
| December 31, 1991 | 91.645 |
| December 31, 1992 | 86.197 |
| December 31, 1993 | 106.795 |
| December 30, 1994 | 103.442 |
| December 29, 1995 | 106.513 |
| December 31, 1996 | 101.332 |
| December 31, 1997 | 93.883 |
| December 31, 1998 | 90.647 |
| December 31, 1999 | 94.139 |
| December 29, 2000 | 86.830 |
| December 31, 2001 | 87.910 |
| December 31, 2002 | 104.488 |
| December 31, 2003 | 125.684 |
| December 31, 2004 | 134.989 |
| December 30, 2005 | 162.583 |
| December 29, 2006 | 206.666 |
| December 31, 2007 | 260.306 |
| December 31, 2008 | 249.749 |
| December 31, 2009 | 322.681 |
| December 31, 2010 | 460.320 |
| December 30, 2011 | 481.314 |
| December 31, 2012 | 511.569 |
| December 31, 2013 | 353.995 |
| December 31, 2014 | 330.251 |
| December 31, 2015 | 292.429 |
PS-70
| December 30, 2016 | 320.215 |
| December 29, 2017 | 355.248 |
| December 31, 2018 | 339.025 |
| December 31, 2019 | 396.726 |
| December 31, 2020 | 498.301 |
| December 31, 2021 | 467.877 |
| July 26, 2022 | 421.591 |
Hypothetical and actual historical performance of the Index is not an indication of future
performance. Future performance of the Index may differ significantly from hypothetical and actual historical performance, either positively or negatively.
PAST PERFORMANCE IS NOT INDICATIVE OF FUTURE RESULTS.
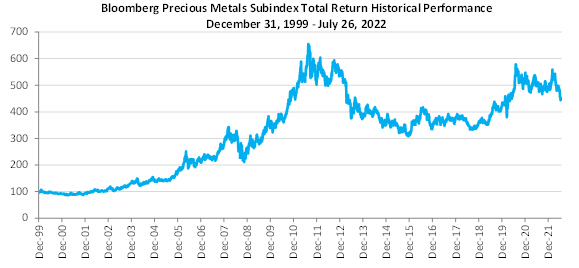
Source: Bloomberg.
PAST PERFORMANCE IS NOT INDICATIVE OF FUTURE RESULTS.
PS-71
The Softs Sub-Index is a multiple-component Sub-Index that is designed to be a benchmark for soft commodities as an asset class. It is composed of the futures contracts on soft commodities that are included in the Commodity Index and is intended to reflect the returns that are potentially available through (1) an unleveraged investment in those contracts plus (2) the rate of interest that could be earned on cash collateral invested in specified Treasury Bills.
Composition of the Softs Sub-Index
The Softs Sub-Index currently is composed of the three exchange-traded futures contracts included in the Commodity Index that relate to soft commodities: coffee, cotton and sugar.
The weights as of July 26, 2022 for the contracts included in the Softs Sub-Index are as follows:
| Commodity | Weighting |
| Coffee | 39.07% |
| Cotton | 19.23% |
| Sugar | 41.69% |
Calculation and Publication of the Softs Sub-Index
The Softs Sub-Index is calculated using the same methodology as the Commodity Index but with reference only to the contracts included in the Softs Sub-Index and to their respective weightings within the Softs Sub-Index.
At present, BISL disseminates the Softs Sub-Index levels approximately every 15 seconds (assuming the Softs Sub-Index levels have changed within such 15-second interval) from 10:00 p.m. to 3:20 p.m., New York City time, and publishes daily levels at approximately 5:00 p.m., New York City time, on Bloomberg page “BCOMSOTR <Index>.”
Historical Closing Levels of the Softs Sub-Index
Since its inception, the Softs Sub-Index has experienced significant fluctuations. Any historical upward or downward trend in the value of the Softs Sub-Index during any period shown below is not an indication that the value of the Softs Sub-Index is more or less likely to increase or decrease at any time during the term of the Softs ETNs. The historical levels do not give an indication of future performance of the Softs Sub-
Index. There can be no assurance that the future performance of the Softs Sub-Index or its index components will result in holders of the Softs ETNs receiving a positive return on their investment.
The Softs Sub-Index was launched on November 15, 2001. All data relating to the period prior to the launch of the Softs Sub-Index is an historical estimate by the sponsors using available data as to how the Index may have performed in the pre-launch period based upon the percentage weightings in effect in 1998. Such data does not represent actual performance and should not be interpreted as an indication of actual performance. Accordingly, the following table illustrates:
| (i) | on a hypothetical basis, how the Softs Sub-Index would have performed from December 31, 1991 to December 29, 2000 based on the selection criteria and methodology described above; and |
| (ii) | on an actual basis, how the Softs Sub-Index has performed from December 31, 2001 onwards. |
| December 31, 1991 | 95.408 |
| December 31, 1992 | 82.248 |
| December 31, 1993 | 84.495 |
| December 30, 1994 | 130.755 |
| December 29, 1995 | 129.052 |
| December 31, 1996 | 153.343 |
| December 31, 1997 | 204.213 |
| December 31, 1998 | 166.665 |
| December 31, 1999 | 133.983 |
| December 29, 2000 | 130.453 |
| December 31, 2001 | 105.968 |
| December 31, 2002 | 127.912 |
| December 31, 2003 | 123.838 |
| December 31, 2004 | 126.890 |
| December 30, 2005 | 140.339 |
| December 29, 2006 | 123.540 |
| December 31, 2007 | 119.273 |
| December 31, 2008 | 85.358 |
| December 31, 2009 | 123.124 |
| December 31, 2010 | 196.873 |
| December 30, 2011 | 169.372 |
| December 31, 2012 | 131.447 |
| December 31, 2013 | 109.282 |
| December 31, 2014 | 98.245 |
| December 31, 2015 | 88.564 |
| December 30, 2016 | 100.219 |
| December 29, 2017 | 85.387 |
| December 31, 2018 | 66.378 |
| December 31, 2019 | 69.209 |
| December 31, 2020 | 71.226 |
| December 31, 2021 | 102.542 |
| July 26, 2022 | 99.646 |
PS-72
Hypothetical and actual historical performance of the Index is not an indication of future performance. Future performance of the Index may differ significantly from hypothetical and
actual historical performance, either positively or negatively.
PAST PERFORMANCE IS NOT INDICATIVE OF FUTURE RESULTS.
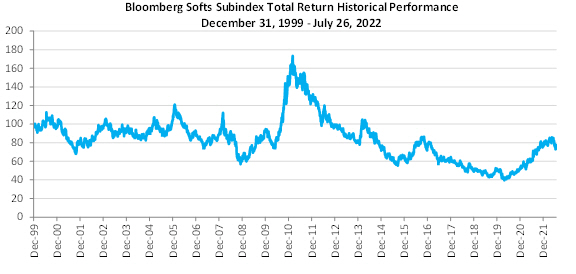
Source: Bloomberg.
PAST PERFORMANCE IS NOT INDICATIVE OF FUTURE RESULTS.
PS-73
The Sugar Sub-Index is a single-component Sub-Index that is designed to be a benchmark for sugar as an asset class. It is composed of the futures contract on sugar that is included or eligible to be included in the Commodity Index and is intended to reflect the returns that are potentially available through (1) an unleveraged investment in that contract plus (2) the rate of interest that could be earned on cash collateral invested in specified Treasury Bills.
Calculation and Publication of the Sugar Sub-Index
The Sugar Sub-Index is calculated using the same methodology as the Commodity Index but with reference only to the contract included in the Sugar Sub-Index (which, for purposes of the calculation, has a weighting of 100%).
At present, BISL disseminates the Sugar Sub-Index levels approximately every 15 seconds (assuming the Sugar Sub-Index levels have changed within such 15-second interval) from 10:00 p.m. to 3:20 p.m., New York City time, and publishes daily levels at approximately 5:00 p.m., New York City time, on Bloomberg page “BCOMSBTR <Index>.”
Historical Closing Levels of the Sugar Sub-Index
Since its inception, the Sugar Sub-Index has experienced significant fluctuations. Any historical upward or downward trend in the value of the Sugar Sub-Index during any period shown below is not an indication that the value of the Sugar Sub-Index is more or less likely to increase or decrease at any time during the term of the Sugar ETNs. The historical levels do not give an indication of future performance of the Sugar Sub-Index. There can be no assurance that the future performance of the Sugar Sub-Index or its index components will result in holders of the Sugar ETNs receiving a positive return on their investment.
The Sugar Sub-Index was launched on February 1, 2006. All data relating to the period prior to the launch of the Sugar Sub-Index is an historical estimate by the sponsors using available data as to how the Index may have performed in the pre-launch period based upon the weightings in effect in the Commodity Index.
Such data does not represent actual performance and should not be interpreted as an indication of actual performance. Accordingly, the following table illustrates:
| (i) | on a hypothetical basis, how the Sugar Sub-Index would have performed from December 31, 1991 to December 30, 2005 based on the selection criteria and methodology described above; and |
| (ii) | on an actual basis, how the Sugar Sub-Index has performed from December 29, 2006 onwards. |
| December 31, 1991 | 116.775 |
| December 31, 1992 | 127.696 |
| December 31, 1993 | 141.670 |
| December 30, 1994 | 193.099 |
| December 29, 1995 | 209.616 |
| December 31, 1996 | 250.997 |
| December 31, 1997 | 289.693 |
| December 31, 1998 | 183.941 |
| December 31, 1999 | 146.428 |
| December 29, 2000 | 253.801 |
| December 31, 2001 | 215.207 |
| December 31, 2002 | 289.917 |
| December 31, 2003 | 232.452 |
| December 31, 2004 | 288.680 |
| December 30, 2005 | 430.708 |
| December 29, 2006 | 321.010 |
| December 31, 2007 | 286.516 |
| December 31, 2008 | 229.426 |
| December 31, 2009 | 427.334 |
| December 31, 2010 | 529.731 |
| December 30, 2011 | 466.624 |
| December 31, 2012 | 406.178 |
| December 31, 2013 | 325.006 |
| December 31, 2014 | 224.600 |
| December 31, 2015 | 214.039 |
| December 30, 2016 | 262.931 |
| December 29, 2017 | 196.200 |
| December 31, 2018 | 145.041 |
| December 31, 2019 | 147.829 |
| December 31, 2020 | 163.509 |
| December 31, 2021 | 200.634 |
| July 26, 2022 | 189.611 |
Hypothetical and actual historical performance of the Index is not an indication of future performance. Future performance of the Index may differ significantly from hypothetical and actual historical performance, either positively or negatively.
PS-74
PAST PERFORMANCE IS NOT INDICATIVE OF FUTURE RESULTS.

Source: Bloomberg.
PAST PERFORMANCE IS NOT INDICATIVE OF FUTURE RESULTS.
PS-75
The Tin Sub-Index is a single-component Sub-Index that is designed to be a benchmark for tin as an asset class. It is composed of the futures contract on tin that is included or eligible to be included in the Commodity Index and is intended to reflect the returns that are potentially available through (1) an unleveraged investment in that contract plus (2) the rate of interest that could be earned on cash collateral invested in specified Treasury Bills.
At present, tin is one of the four commodities eligible for inclusion but not included in the Commodity Index. The contract included in the Tin Sub-Index is the “Refined Tin” contract traded on the LME, which is the contract that would be eligible for inclusion in the Commodity Index if tin were one of the commodities included in the Commodity Index.
Calculation and Publication of the Tin Sub-Index
The Tin Sub-Index is calculated using the same methodology as the Commodity Index but with reference only to the contract included in the Tin Sub-Index (which, for purposes of the calculation, has a weighting of 100%).
At present, BISL disseminates the Tin Sub-Index levels approximately every 15 seconds (assuming the Tin Sub-Index levels have changed within such 15-second interval) from 10:00 p.m. to 3:20 p.m., New York City time, and publishes daily levels at approximately 5:00 p.m., New York City time, on Bloomberg page “BCOMSNTR <Index>.”
Historical Closing Levels of the Tin Sub-Index
Since its inception, the Tin Sub-Index has experienced significant fluctuations. Any historical upward or downward trend in the value of the Tin Sub-Index during any period shown below is not an indication that the value of the Tin Sub-Index is more or less likely to increase or decrease at any time during the term of the Tin ETNs. The historical levels do not give an indication of future performance of the Tin Sub-Index. There can be no assurance that the future performance of the Tin Sub-Index or its index components will result in holders of the Tin ETNs receiving a positive return on their investment.
The Tin Sub-Index was launched on March 7, 2008. All data relating to the period prior to the launch of the Tin Sub-Index is an historical estimate by the sponsors using available data as to how the Index may have performed in the pre-launch period based upon the weightings in effect in the Commodity Index. Such data does not represent actual performance and should not be interpreted as an indication of actual performance. Accordingly, the following table illustrates:
| (i) | on a hypothetical basis, how the Tin Sub-Index would have performed from December 31, 1991 to December 31, 2007 based on the selection criteria and methodology described above; and |
| (ii) | on an actual basis, how the Tin Sub-Index has performed from March 7, 2008 onwards. |
| December 31, 1991 | 99.702 |
| December 31, 1992 | 104.499 |
| December 31, 1993 | 86.922 |
| December 30, 1994 | 109.651 |
| December 29, 1995 | 120.127 |
| December 31, 1996 | 114.318 |
| December 31, 1997 | 109.359 |
| December 31, 1998 | 116.331 |
| December 31, 1999 | 143.638 |
| December 29, 2000 | 125.872 |
| December 31, 2001 | 95.203 |
| December 31, 2002 | 103.768 |
| December 31, 2003 | 160.283 |
| December 31, 2004 | 206.970 |
| December 30, 2005 | 187.208 |
| December 29, 2006 | 348.100 |
| December 31, 2007 | 519.023 |
| December 31, 2008 | 346.38 |
| December 31, 2009 | 584.663 |
| December 31, 2010 | 924.939 |
| December 30, 2011 | 655.129 |
| December 31, 2012 | 799.327 |
| December 31, 2013 | 759.076 |
| December 31, 2014 | 659.256 |
| December 31, 2015 | 497.505 |
| December 30, 2016 | 736.118 |
| December 29, 2017 | 714.380 |
| December 31, 2018 | 717.082 |
| December 31, 2019 | 655.295 |
| December 31, 2020 | 788.935 |
| December 31, 2021 | 1,742.649 |
| July 26, 2022 | 1,122.130 |
PS-76
Hypothetical and actual historical performance of the Index is not an indication of future performance. Future performance of the Index may differ significantly from hypothetical and actual historical performance, either positively or negatively.
PAST PERFORMANCE IS NOT INDICATIVE OF FUTURE RESULTS

Source: Bloomberg.
PAST PERFORMANCE IS NOT INDICATIVE OF FUTURE RESULTS.
PS-77
“Bloomberg®,” “Bloomberg Commodity IndexSM,” “Bloomberg Commodity Index Total ReturnSM,” “Bloomberg Agriculture Subindex Total ReturnSM,” “Bloomberg Aluminum Subindex Total ReturnSM,” “Bloomberg Coffee Subindex Total ReturnSM,” “Bloomberg Copper Subindex Total ReturnSM,” “Bloomberg Cotton Subindex Total ReturnSM,” “Bloomberg Energy Subindex Total ReturnSM,” “Bloomberg Grains Subindex Total ReturnSM,” “Bloomberg Industrial Metals Subindex Total ReturnSM,” “Bloomberg Livestock Subindex Total ReturnSM,” “Bloomberg Natural Gas Subindex Total ReturnSM,” “Bloomberg Nickel Subindex Total ReturnSM,” “Bloomberg Platinum Subindex Total ReturnSM,” “Bloomberg Precious Metals Subindex Total ReturnSM,” “Bloomberg Softs Subindex Total ReturnSM,” “Bloomberg Sugar Subindex Total ReturnSM,” “Bloomberg Tin Subindex Total ReturnSM” and “BCOM” are service marks of Bloomberg Finance L.P. and its affiliates, including Bloomberg Index Services Limited (“BISL”), the administrator of the Indices (collectively, “Bloomberg”) and have been licensed for use for certain purposes by Barclays Bank PLC.
Any ETNs based on the Bloomberg Commodity Index are not sponsored, endorsed, sold or promoted by Bloomberg or any of its subsidiaries or affiliates. None of Bloomberg nor any of its subsidiaries or affiliates makes any representation or warranty, express or implied, to the holders of or counterparties to the ETNs or any member of the public regarding the advisability of investing in securities or commodities generally or in the ETNs particularly. The only relationship of Bloomberg or any of its subsidiaries or affiliates to Barclays Bank PLC is the licensing of certain trademarks, trade names and service marks and of the Bloomberg Commodity IndexSM, which is determined, composed and calculated by BISL without regard to Barclays Bank PLC or the ETNs. Bloomberg has no obligation to take the needs of Barclays Bank PLC or the holders of the ETNs into consideration in determining, composing or calculating the Bloomberg Commodity IndexSM. Bloomberg nor any of its subsidiaries or affiliates is responsible for or has participated in the determination of the timing of, prices at, or quantities of the ETNs to be issued or in the determination or calculation of the
equation by which the ETNs are to be converted into cash. None of Bloomberg nor any of its subsidiaries or affiliates shall have any obligation or liability, including, without limitation, to securities customers, in connection with the administration, marketing or trading of the ETNs.
Purchasers of the ETNs should not conclude that the inclusion of a futures contract in the Bloomberg Commodity IndexSM is any form of investment recommendation of the futures contract or the underlying exchange-traded physical commodity by Bloomberg or any of its subsidiaries or affiliates. The information in this index supplement regarding the Bloomberg Commodity IndexSM components has been derived solely from publicly available documents. Bloomberg nor any of its subsidiaries or affiliates has made any due diligence inquiries with respect to the Bloomberg Commodity IndexSM components in connection with the ETNs. Bloomberg nor any of its subsidiaries or affiliates makes any representation that these publicly available documents or any other publicly available information regarding the Bloomberg Commodity IndexSM components, including without limitation a description of factors that affect the prices of such components, are accurate or complete.
BLOOMBERG DOES NOT GUARANTEE THE TIMELINESS, ACCURACY OR COMPLETENESS OF ANY DATA OR INFORMATION RELATING TO THE BLOOMBERG COMMODITY INDEXSM. BLOOMBERG MAKES NO WARRANTY, EXPRESSED OR IMPLIED, AS TO THE BLOOMBERG COMMODITY INDEXSM OR ANY DATA OR VALUES RELATING THERETO OR RESULTS TO BE OBTAINED THEREFROM, AND EXPRESSLY DISCLAIMS ALL WARRANTIES OF MERCHANTABILITY AND FITNESS FOR A PARTICULAR PURPOSE WITH RESPECT THERETO. IT IS NOT POSSIBLE TO INVEST DIRECTLY IN AN INDEX. BACK-TESTING PERFORMANCE IS NOT ACTUAL PERFORMANCE. TO THE MAXIMUM EXTENT ALLOWED BY LAW, BLOOMBERG, ITS LICENSORS AND ITS AND THEIR RESPECTIVE EMPLOYEES, CONTRACTORS, AGENTS, SUPPLIERS AND VENDORS SHALL HAVE NO LIABILITY OR RESPONSIBILITY WHATSOEVER FOR ANY INJURY OR DAMAGES—WHETHER DIRECT, INDIRECT, CONSEQUENTIAL, INCIDENTAL,
PS-78
PUNITIVE OR OTHERWISE—ARISING IN CONNECTION WITH THE BLOOMBERG COMMODITY INDEXSM OR ANY DATA OR VALUES RELATING THERETO—WHETHER ARISING FROM THEIR NEGLIGENCE OR OTHERWISE. NOTHING IN THE BLOOMBERG COMMODITY INDEXSM SHALL CONSTITUTE OR BE CONSTRUED AS AN OFFERING OF FINANCIAL INSTRUMENTS OR AS INVESTMENT ADVICE OR INVESTMENT RECOMMENDATIONS (I.E., RECOMMENDATIONS AS TO WHETHER OR NOT TO “BUY,” “SELL,” “HOLD” OR TO ENTER OR NOT TO ENTER INTO ANY OTHER TRANSACTION INVOLVING ANY SPECIFIC INTEREST OR INTERESTS) BY BLOOMBERG OR ITS AFFILIATES OR A RECOMMENDATION AS TO AN INVESTMENT OR OTHER STRATEGY BY BLOOMBERG OR ITS AFFILIATES. DATA AND OTHER INFORMATION AVAILABLE VIA THE BLOOMBERG COMMODITY INDEXSM SHOULD NOT BE CONSIDERED AS INFORMATION SUFFICIENT UPON WHICH TO BASE AN INVESTMENT DECISION. ALL INFORMATION PROVIDED BY THE BLOOMBERG COMMODITY INDEXSM IS IMPERSONAL AND NOT TAILORED TO NEEDS OF ANY PERSON, ENTITY OR GROUP OF PERSONS. BLOOMBERG AND ITS AFFILIATES DO NOT EXPRESS AN OPINION ON THE FUTURE OR EXPECTED VALUE OF ANY SECURITY OR OTHER INTEREST AND DO NOT EXPLICITLY OR IMPLICITLY RECOMMEND OR SUGGEST AN INVESTMENT STRATEGY OR ANY KIND.
PS-79
The market value of each series of ETNs will be affected by several factors, many of which are beyond our control. We expect that generally the level of the Index underlying the ETNs on any day will affect the market value of the ETNs more than any other factors. Other factors that may influence the market value of a series of ETNs include, but are not limited to, prevailing spot prices for the commodities underlying the index component or components; supply and demand for the ETNs, including inventory positions with Barclays Capital Inc. or any market maker and any decision we may make not to issue additional ETNs or to cease or suspend sales of ETNs from inventory; the level of contango or backwardation in the markets for the relevant commodity futures contracts and the roll costs associated with maintaining a rolling position in such futures contracts; the time remaining to maturity of the ETNs; the volatility of the Index underlying your ETNs, the market prices of the index components and the prices of the relevant commodities; economic, financial, political, regulatory, geographical, or judicial events that affect the level of the underlying Index or the market price of the index components included in that Index; the general interest rate environment; the perceived creditworthiness of Barclays Bank PLC; or supply and demand in the listed and over-the-counter commodity derivative markets. See “Risk Factors” in this pricing supplement for a discussion of the factors that may influence the market value of the ETNs prior to maturity.
These factors interrelate in complex ways, and the effect of one factor on the market value of your ETNs may offset or enhance the effect of another factor. See “Risk Factors” in this pricing supplement for a discussion of the factors that may influence the market value of the ETNs prior to maturity.
Intraday Indicative Value
The “intraday indicative value” for any series of ETNs is intended to provide investors with an approximation of the effect that changes in the level of the Index underlying the ETNs during the current trading day would have on the closing indicative value of such series of ETNs from the previous day. Intraday indicative value differs from closing indicative value in two important respects. First, intraday indicative value is based
on the most recent Index level published by the Index Sponsor, which reflects the most recent reported sales prices for the index components, rather than the closing indicative value of a series of ETNs for the immediately preceding calendar day. Second, the intraday indicative value only reflects the accrued investor fee for a series of ETNs at the close of business on the preceding calendar day, but does not include any adjustment for the accrued investor fee of such series of ETNs accruing during the course of the current day.
The intraday indicative value for any series of ETNs is published as a convenience for reference purposes only and does not represent the actual trading price of such ETNs, which may be influenced by bid-offer spreads, hedging and transaction costs and market liquidity, among other factors.
The intraday indicative value for any series is calculated and published by ICE Data Indices, LLC (ICE Data) (the “IIV calculation agent”) or a successor for each series of ETNs under the intraday indicative value (IIV) ticker symbols listed in the following table:
| ETNs | IIV Ticker |
| Agriculture ETNs | JJA.IV |
| Aluminum ETNs | JJU.IV |
| Coffee ETNs | JO.IV |
| Copper ETNs | JJC.IV |
| Cotton ETNs | BAL.V |
| Energy ETNs | JJE.IV |
| Grains ETNs | JJG.IV |
| Industrial Metals ETNs | JJM.IV |
| Livestock ETNs | COW.IV |
| Nickel ETNs | JJN.IV |
| Platinum ETNs | PGM.IV |
| Precious Metals ETNs | JJP.IV |
| Softs ETNs | JJS.IV |
| Sugar ETNs | SGG.IV |
| Tin ETNs | JJT.IV |
In connection with any series of ETNs, we use the term “intraday indicative value” to refer to the value at a given time on any trading day determined based on the following equation:
Intraday Indicative Value = Closing Indicative Value on the immediately preceding calendar day Í Current Daily Index Factor
where:
PS-80
Closing Indicative Value = The closing indicative value of each series of the ETNs as described in this pricing supplement;
Current Daily Index Factor = The most recent published level of the Index underlying the ETNs as reported by the Index Sponsor / the closing level of that Index on the immediately preceding index business day.
The IIV calculation agent is not affiliated with Barclays Bank PLC and does not approve, endorse, review or recommend Barclays Bank PLC or the ETNs.
With respect to indices composed of multiple commodity futures contracts, it is possible that some of the underlying commodity futures contracts may have stopped trading, for instance, futures contracts trading on a non-U.S. futures exchange, while other continue to trade at any given time the Commodity Index levels are published by Bloomberg. The Index levels and the intraday indicative value for any series of ETNs will only reflect the last traded price of the impacted commodity futures contracts. Furthermore, the actual trading price of any series of ETNs in the secondary market may vary significantly from their intraday indicative values due to this reason, as secondary markets may price in post-close expectations on the respective impacted commodity futures contracts.
The intraday indicative value will be derived from sources deemed reliable, but the IIV calculation agent and its suppliers do not guarantee the correctness or completeness of the intraday indicative value or other information furnished in connection with any series of ETNs. The IIV calculation agent makes no warranty, express or implied, as to results to be obtained by Barclays Bank PLC, Barclays Bank PLC’s customers, holders of the ETNs, or any other person or entity from the use of the intraday indicative value or any data included therein. The IIV calculation agent makes no express or implied warranties, and expressly disclaims all warranties of merchantability or fitness for a particular purpose with respect to the intraday indicative value or any data included therein.
The IIV calculation agent and its employees, subcontractors, agents, suppliers and vendors shall have no liability or responsibility, contingent or otherwise, for any injury or damages, whether caused by the negligence of the IIV calculation
agent, its employees, subcontractors, agents, suppliers or vendors or otherwise, arising in connection with the intraday indicative value or any series of the ETNs, and shall not be liable for any lost profits, losses, punitive, incidental or consequential damages. The IIV calculation agent shall not be responsible for or have any liability for any injuries or damages caused by errors, inaccuracies, omissions or any other failure in, or delays or interruptions of, the intraday indicative value, from whatever cause. The IIV calculation agent is not responsible for the selection of or use of any Index or any series of the ETNs, the accuracy and adequacy of any Index or information used by Barclays Bank PLC and the resultant output thereof.
The intraday indicative value calculation is not intended as a price or quotation, or as an offer or solicitation for the purchase, sale, redemption or termination of your ETNs. The actual trading price of any series of ETNs in the secondary market may vary significantly from their intraday indicative value. See “Risk Factors—Risks Relating to Liquidity and the Secondary Market—The ETNs May Trade at a Substantial Premium to or Discount from the Closing Indicative Value and/or the Intraday Indicative Value” in this pricing supplement.
Furthermore, as the intraday indicative value is calculated using the closing indicative value on the immediately preceding calendar day, the intraday indicative value published at any time during a given trading day will not reflect the investor fee that may have accrued over the course of such trading day. Published Index levels from the Index Sponsor may occasionally be subject to delay or postponement. Any such delays or postponements will affect the current Index level and therefore the intraday indicative value for a series of ETNs. The actual trading price of any series of ETNs may be different from their intraday indicative value.
Split or Reverse Split of the ETNs
On any business day we may elect to initiate a split of your ETNs or a reverse split of your ETNs. Such date shall be deemed to be the “announcement date,” and we will issue a notice to holders of the relevant ETNs and a press release announcing the split or reverse split, specifying the effective date of the split or reverse split and the split or reverse split ratio.
PS-81
If a series of ETNs undergoes a split, we will adjust the terms of such series of ETNs accordingly. For example, if the split ratio is 4 and hence a series of ETNs undergo a 4:1 split, every investor who holds ETNs of such series via DTC on the relevant record date will, after the split, hold four ETNs of such series, and adjustments will be made as described below. The record date for the split will be the 9th business day after the announcement date. The closing indicative value of such series of ETNs on such record date will be divided by 4 to reflect the 4:1 split of your ETNs. Any adjustment of closing indicative value of such series of ETNs will be rounded to 8 decimal places. The split will become effective at the opening of trading of such series of ETNs on the business day immediately following the record date.
In the case of a reverse split of a series of ETNs, we reserve the right to address odd numbers of ETNs of such series (commonly referred to as “partials”) in a commercially reasonable manner determined by us in our sole discretion. For example, if the reverse split ratio is 4 and the a series of ETNs undergo a 1:4 reverse split, every investor who holds 4 ETNs of such series via DTC on the relevant record date will, after the reverse split, hold only one ETN of such series and adjustments will be made as described below. The record date for the reverse split will be on the 9th business day after the announcement date. The closing indicative value of such series of ETNs on such record date will be multiplied by four to reflect the 1:4 reverse split of your ETNs. Any adjustment of closing indicative value of such series of ETNs will be rounded to 8 decimal places. The reverse split will become effective at the opening of trading of such series of ETNs on the business day immediately following the record date.
In the case of a reverse split of a series of ETNs, holders who own a number of ETNs of such series on the record date which is not evenly divisible by the split ratio will receive the same treatment as all other holders of such series of ETNs for the maximum number of ETNs of such series they hold which is evenly divisible by the split ratio, and we will have the right to compensate holders for their remaining or “partial” ETNs in a commercially reasonable manner determined by us in our sole discretion. Our current intention is to provide holders with a cash payment for their partials on the 17th
business day following the announcement date in an amount equal to the appropriate percentage of the closing indicative value of the reverse split-adjusted ETNs on the 14th business day following the announcement date. For example, if the reverse split ratio is 1:4, a holder who held 23 ETNs of the affected series via DTC on the record date would receive 5 post reverse split ETNs of the affected series on the immediately following business day, and a cash payment on the 17th business day following the announcement date that is equal to 3/4 of the closing indicative value of the reverse split-adjusted ETNs on the 14th business day following the announcement date.
In the event of a reverse split, the redemption amount will be adjusted accordingly by the Issuer, in its sole discretion and in a commercially reasonable manner, to take into account the reverse split.
In this section, references to “holders” mean those who own the ETNs registered in their own names, on the books that we or the Trustee (as defined below), or any successor trustee, as applicable, maintain for this purpose, and not those who own beneficial interests in the ETNs registered in street name or in the ETNs issued in book-entry form through The Depository Trust Company (“DTC”) or another depositary. Owners of beneficial interests in the ETNs should read the section entitled “Description of Debt Securities—Legal Ownership; Form of Debt Securities” in the accompanying prospectus.
Each series of ETNs is part of a series of debt securities entitled “Global Medium-Term Notes, Series A” (the “medium-term notes”) that we may issue under the senior debt securities indenture, dated September 16, 2004 (as may be amended or supplemented from time to time, the “Indenture”), between Barclays Bank PLC and The Bank of New York Mellon, as trustee, (the “Trustee”) from time to time. This pricing supplement summarizes specific financial and other terms that apply to each series of ETNs. Terms that apply generally to all medium-term notes are described in “Summary—Medium-Term Notes” and “Terms of the Notes” in the accompanying prospectus supplement. The terms described here (i.e., in this pricing supplement) supplement those described in the accompanying prospectus, prospectus
PS-82
supplement and any related free writing prospectuses and, if the terms described here are inconsistent with those described in those documents, the terms described here are controlling.
Please note that the information about the price to the public and the proceeds to Barclays Bank PLC on the front cover of this pricing supplement relates only to the initial sale of the ETNs. If you have purchased the ETNs in a market-making transaction after the initial sale, information about the price and date of sale to you will be provided in a separate confirmation of sale.
We describe the terms of each series of ETNs in more detail below.
Inception, Issuance and Maturity
The ETNs were first sold on January 17, 2018, which we refer to as the “inception date.” The ETNs were first issued on January 19, 2018, which we refer to as the “issue date,” and will be due on January 23, 2048.
If the maturity date for a series of ETNs stated on the cover of this pricing supplement is not a business day, the maturity date will be the next following business day. If the final valuation date is postponed (as described above), the maturity date will be the fifth business day following the final valuation date, as postponed. The calculation agent may postpone the final valuation date—and therefore the maturity date—of the ETNs if a market disruption event occurs or is continuing on a day that would otherwise be the final valuation date or if the level of the Index is not available or cannot be calculated. We describe market disruption events under “—Market Disruption Events” below.
In the event that payment at maturity is deferred beyond the stated maturity date, penalty interest will not accrue or be payable with respect to that deferred payment.
Coupon
We will not pay you interest during the term of the ETNs.
Denomination
The ETNs will be issued in denominations of $50 (with the exception of the Agriculture ETNs, the Copper ETNs and the Nickel ETNs, which will be
issued in denominations of $16.66666667). The Agriculture ETNs, the Copper ETNs and the Nickel ETNs were issued in denominations of $50, from, and including, the Inception Date to, but excluding June 4, 2021, the effective date of the 3 for 1 split of the ETNs. We reserve the right to initiate a split or reverse split of the ETNs in our sole discretion.
Payment at Maturity
If you hold your ETNs to maturity, you will receive a cash payment in U.S. dollars per ETN equal to the closing indicative value on the final valuation date.
The “closing indicative value” for each series of ETN on the initial valuation date will equal $50. On each subsequent calendar day until maturity or early redemption, the closing indicative value for each series of ETN will equal (1) the daily index factor for such series of ETN on such calendar day (or, if such day is not an index business day, one) times (2) the closing indicative value for such series of ETN on the immediately preceding calendar day minus (3) the investor fee on such calendar day. If the ETNs undergo a split or reverse split, the closing indicative value will be adjusted accordingly.
Barclays Bank PLC implemented a 3 for 1 split of the Agriculture ETNs, the Copper ETNs and the Nickel ETNs, effective at the open of trading on June 4, 2021. For the purpose of calculating the closing indicative value of each of the Agriculture ETNs, the Copper ETNs and the Nickel ETNs on June 4, 2021, the effective date of the split, the “closing indicative value for such series of ETN on the immediately preceding calendar day” in the above formula was adjusted to $21.3609, $22.3942 and $23.4262, respectively, which is equal to the closing indicative value of the relevant series of $64.0827, $67.1826 and $70.2785 on June 3, 2021 divided by 3.
An “index business day” is a day on which the Index is calculated and published by the Index Sponsor.
The “daily index factor” for each series of ETNs on any index business day will equal (1) the closing level of the Index to which those ETNs are linked on such index business day divided by (2) the closing level of the Index to which those ETNs are linked on the immediately preceding index business day.
PS-83
The “investor fee” for each series of ETN on the initial valuation date will equal zero. On each subsequent calendar day until maturity or early redemption, the investor fee for each series of ETN will be equal to (1) 0.45% times (2) the daily index factor for such series of ETN on that day (or, if such day is not an index business day, one) times (3) the closing indicative value for such ETN on the immediately preceding calendar day divided by (4) 365. Because the investor fee is calculated and subtracted from the closing indicative value on a daily basis, the net effect of the fee accumulates over time and is subtracted at the rate of approximately 0.45% per year. Because the net effect of the investor fee is a fixed percentage of the value of each ETN, the aggregate effect of the investor fee will increase or decrease in a manner directly proportional to the value of each ETN and the amount of ETNs that are held, as applicable.
Barclays Bank PLC implemented a 3 for 1 split of the Agriculture ETNs, the Copper ETNs and the Nickel ETNs, effective at the open of trading on June 4, 2021. For the purpose of calculating the investor fee of each of the Agriculture ETNs, the Copper ETNs and the Nickel ETNs on June 4, 2021, the effective date of the split, the “closing indicative value for such ETN on the immediately preceding calendar day” in the above formula was adjusted to $21.3609, $22.3942 and $23.4262, respectively, which is equal to the closing indicative value of the relevant series of $64.0827, $67.1826 and $70.2785, respectively, on June 3, 2021 divided by 3.
A “business day” means a Monday, Tuesday, Wednesday, Thursday or Friday that is not a day on which banking institutions in New York City generally are authorized or obligated by law, regulation, or executive order to close.
A “trading day” with respect to the ETNs is a day (i) that is an index business day, (ii) on which trading is generally conducted on NYSE Arca and (iii) on which trading is generally conducted on the markets on which the futures contracts underlying the relevant Index are traded, in each case as determined by the calculation agent in its sole discretion.
A “valuation date” means each trading day from January 17, 2018 to January 17, 2048, inclusive, subject to postponement due to the occurrence of a market disruption event, such postponement not to exceed five trading days.
The “initial valuation date” for the ETNs is January 17, 2018.
The “final valuation date” for the ETNs is January 17, 2048.
Payment Upon Holder Redemption and Issuer Redemption
Up to the valuation date immediately preceding the final valuation date, and subject to certain restrictions, you may elect to redeem your ETNs on any redemption date during the term of the ETNs, provided that you present at least 50,000 ETNs of the same series for redemption, or your broker or other financial intermediary (such as a bank or other financial institution not required to register as a broker-dealer to engage in securities transactions) bundles your ETNs for redemption with those of other investors to reach this minimum. We may from time to time, in our sole discretion, reduce this minimum redemption amount on a consistent basis for all holders of ETNs. If you choose to redeem your ETNs, you will receive a cash payment in U.S. dollars for each ETN on the applicable redemption date equal to the closing indicative value applicable to such ETN on the applicable valuation date.
Notwithstanding the foregoing, we currently have reduced the minimum redemption amount to 5,000 ETNs. Our reduction of the minimum redemption amount will be available to any and all holders of the ETNs on such early redemption dates and will remain in effect until the waiver is removed by us at our sole discretion. We intend to provide to holders of the ETNs at least ten calendar days’ notice prior to removing any waiver for the reduction of the minimum redemption amount for the ETNs. We may, at any time and in our sole discretion, make further modifications to the minimum redemption amount, including, among others, to reinstate the minimum redemption amount of 50,000 ETNs for all redemption dates after such further modification. Any such modification will be applied on a consistent basis for all holders of the ETNs at the time such modification becomes effective.
Prior to maturity, we may redeem the ETNs (in whole but not in part) at our sole discretion on any business day on or after the inception date until and including maturity. If we redeem the ETNs, you will receive a cash payment in U.S. dollars per ETN in an amount equal to the closing
PS-84
indicative value applicable to such ETN on the applicable valuation date.
Redemption Date
A redemption date is:
| · | in the case of holder redemption, the second business day following each valuation date (other than the final valuation date). The final redemption date will be the second business day following the valuation date that is immediately prior to the final valuation date; and |
| · | in the case of issuer redemption, the fifth business day following the valuation date specified by us in the issuer redemption notice, which will in no event be prior to the tenth calendar day following the date on which we deliver such notice. |
In the event that payment upon early redemption is deferred beyond the original redemption date, penalty interest will not accrue or be payable with respect to that deferred payment.
Early Redemption Procedures
Holder Redemption Procedures
You may, subject to the minimum redemption amount described above, elect to redeem your ETNs on any redemption date. To redeem your ETNs, you must instruct your broker or other person through whom you hold your ETNs to take the following steps:
| · | deliver a notice of holder redemption, which is attached as Annex A, to us via facsimile or email by no later than 4:00 p.m., New York City time, on the business day prior to the valuation date specified in your notice of redemption. If we receive your notice by the time specified in the preceding sentence, we will respond by sending you a form of confirmation of holder redemption, which is attached as Annex B; |
| · | deliver the signed confirmation of holder redemption to us via facsimile or email in the specified form by 5:00 p.m., New York City time, on the same day. We or our affiliate must acknowledge receipt in order for your confirmation to be effective; |
| · | instruct your DTC custodian to book a delivery vs. payment trade with respect to your ETNs on the valuation date at a price equal to the applicable closing indicative value, facing Barclays DTC 229; and |
| · | cause your DTC custodian to deliver the trade as booked for settlement via DTC at or prior to 10:00 a.m., New York City time, on the applicable redemption date (the second business day following the valuation date). |
Different brokerage firms may have different deadlines for accepting instructions from their customers. Accordingly, you should consult the brokerage firm through which you own your interest in the ETNs in respect of such deadlines. If we do not receive your notice of holder redemption by 4:00 p.m., New York City time, or your confirmation of holder redemption by 5:00 p.m., New York City time, on the business day prior to the valuation date specified in your notice of redemption, your notice will not be effective and we will not redeem your ETNs on the applicable redemption date. Any redemption instructions for which we (or our affiliate) receive a valid confirmation in accordance with the procedures described above will be irrevocable.
If you elect to redeem your ETNs on a redemption date that is later in time than the redemption date resulting from our subsequent election to exercise our issuer redemption right, your election to redeem your ETNs will be deemed to be ineffective, and your ETNs will instead be redeemed on the redemption date pursuant to such issuer redemption.
The redemption value is determined according to a formula which relies upon the closing indicative value and will be calculated on a valuation date that will occur after the redemption notice is submitted. It is not possible to publicly disclose, or for you to determine, the precise redemption value prior to your election to redeem. The redemption value may be below the most recent intraday indicative value or closing indicative value of your ETNs at the time when you submit your redemption notice.
Issuer Redemption Procedures
We have the right to redeem or “call” the ETNs (in whole but not in part) at our sole discretion without your consent on any business day on or after inception date until and including maturity. If
PS-85
we elect to redeem the ETNs, we will deliver written notice of such election to redeem to the holders of such ETNs not less than ten calendar days prior to the redemption date on which we intend to redeem the ETNs. In this scenario, the final valuation date will be the date specified by us as such in such notice (subject to postponement in the event of a market disruption event as described below in this pricing supplement), and the ETNs will be redeemed on the fifth business day following such valuation date, but in no event prior to the tenth calendar day following the date on which we deliver such notice.
Market Disruption Events
As set forth under “—Payment at Maturity” “—Payment Upon Holder Redemption” and “—Issuer Redemption Procedures” above, the calculation agent will determine the level of the relevant Index on each valuation date, including the final valuation date. As described above, a valuation date for any series of ETNs may be postponed and thus the determination of the level of the relevant Index may be postponed if the calculation agent determines that, on a valuation date, a market disruption event has occurred or is continuing in respect of any index component. If such a postponement occurs, the value of the index components unaffected by the market disruption event shall be determined on the scheduled valuation date and the value of the affected index component shall be determined using the closing value of the affected index component on the first trading day after that day on which no market disruption event occurs or is continuing. In no event, however, will a valuation date for a series of ETNs be postponed by more than five trading days.
If a valuation date is postponed until the fifth trading day following the scheduled valuation date but a market disruption event occurs or is continuing on such day, that day will nevertheless be the valuation date and the calculation agent will make a good faith estimate in its sole discretion of the level of the relevant Index for such day.
Any of the following will be a market disruption event:
| · | a material limitation, suspension or disruption in the trading of any index component which results in a failure by the |
trading facility on which the relevant contract is traded to report a daily contract reference price (the price of the relevant contract that is used as a reference or benchmark by market participants);
| · | the daily contract reference price for any index component is a “limit price,” which means that the daily contract reference price for such contract has increased or decreased from the previous day’s daily contract reference price by the maximum amount permitted under the applicable rules or procedures of the relevant trading facility; |
| · | failure by the Index Sponsor to publish the closing value of the relevant Index or of the applicable trading facility or other price source to announce or publish the daily contract reference price for one or more index components; or |
| · | any other event, if the calculation agent determines in its sole discretion that the event materially interferes with our ability or the ability of any of our affiliates to unwind all or a material portion of a hedge with respect to the ETNs that we or our affiliates have effected or may effect as described below under “Use of Proceeds and Hedging” in this pricing supplement. |
The following events will not be market disruption events:
| · | a limitation on the hours or numbers of days of trading on a trading facility on which any index component is traded, but only if the limitation results from an announced change in the regular business hours of the relevant market; or |
| · | a decision by a trading facility to permanently discontinue trading in any index component. |
Default Amount on Acceleration
For the purpose of determining whether the holders of our medium-term notes, of which the ETNs are a part, are entitled to take any action under the Indenture, we will treat the principal amount of the ETNs outstanding as their principal amount. Although the terms of the ETNs may differ from those of the other medium-term notes, holders of specified percentages in principal amount of all medium-term notes, together in
PS-86
some cases with other series of our debt securities, will be able to take action affecting all the medium-term notes, including the ETNs. This action may involve changing some of the terms that apply to the medium-term notes, accelerating the maturity of the medium-term notes after a default or waiving some of our obligations under the Indenture. We discuss these matters in the attached prospectus under “Description of Debt Securities—Modification and Waiver” and “—Senior Events of Default; Dated Subordinated Enforcement Events and Remedies; Limitations on Suits.”
If an event of default occurs and the maturity of the ETNs is accelerated, the amount declared due and payable upon any acceleration of the ETNs will be determined by the calculation agent and will equal, for each ETN, the closing indicative value on the date of acceleration.
Further Issuances
We may, without your consent, create and issue additional securities having the same terms and conditions as any series of ETNs. If there is substantial demand for a series of ETNs, we may issue additional ETNs frequently. We may consolidate the additional securities to form a single class with the outstanding ETNs. However, we are under no obligation to issue or sell additional ETNs at any time, and if we do issue or sell additional ETNs, we may limit such sales and stop selling additional ETNs at any time.
We also reserve the right to cease or suspend sales of ETNs from inventory held by our affiliate Barclays Capital Inc. at any time. If we limit, restrict or stop sales of ETNs, or if we subsequently resume sales of ETNs, the liquidity and trading price of the relevant series of ETNs in the secondary market could be materially and adversely affected.
Discontinuance or Modification of an Index
If the Index Sponsor discontinues publication of an Index and the Index Sponsor or any other person or entity publishes an index that the calculation agent determines is comparable to the discontinued Index and approves as a successor index, then the calculation agent will determine the level of the relevant Index on the applicable valuation date and the amount payable at
maturity or upon early redemption by reference to such successor index.
If the calculation agent determines that the publication of an Index is discontinued and that there is no successor index, or that the closing level of an Index is not available because of a market disruption event or for any other reason, on the date on which the level of that Index is required to be determined, or if for any other reason an Index is not available to us or the calculation agent on the relevant date, the calculation agent will determine the amount payable by a computation methodology that the calculation agent determines will as closely as reasonably possible replicate the relevant Index.
If the calculation agent determines that an Index, the index components of an Index or the method of calculating an Index has been changed at any time in any respect—including any addition, deletion or substitution and any reweighting or rebalancing of index components, and whether the change is made by the Index Sponsor under their existing policies or following a modification of those policies, is due to the publication of a successor index, is due to events affecting one or more of the index components, or is due to any other reason—then the calculation agent will be permitted (but not required) to make such adjustments to that Index or method of calculating that Index as it believes are appropriate to ensure that the level of the Index used to determine the amount payable on the maturity date or upon redemption is equitable.
All determinations and adjustments to be made by the calculation agent with respect to the level of an Index and the amount payable at maturity or upon early redemption or otherwise relating to the value of an Index may be made in the calculation agent’s sole discretion. See “Risk Factors” in this pricing supplement for a discussion of certain conflicts of interest which may arise with respect to the calculation agent.
Manner of Payment and Delivery
Any payment on or delivery of a series of ETNs at maturity will be made to accounts designated by you and approved by us, or at the office of the Trustee in New York City, but only when the ETNs are surrendered to the Trustee at that office. We also may make any payment or delivery in accordance with the applicable procedures of the depositary.
PS-87
Role of Calculation Agent
Currently, Barclays Bank PLC serves as the calculation agent. We may change the calculation agent after the original issue date of the ETNs without notice. The calculation agent will, in its sole discretion, make all determinations regarding the value of each series of ETNs, including at maturity or upon early redemption, market disruption events, business days, index business days, trading days, valuation dates, the daily index factor, the investor fee, the default amount, the level of any index on any valuation date, the closing indicative value of the ETNs on any valuation date, the maturity date, redemption dates, the amount payable in respect of your ETNs at maturity or upon early redemption and any other calculations or determinations to be made by the calculation agent as specified herein. Absent manifest error, all determinations of the calculation agent will be final, conclusive and binding on you and us, without any liability on the part of the calculation agent. You will not be entitled to any compensation from us for any loss suffered as a result of any of the above determinations by the calculation agent.
The calculation agent reserves the right to make adjustments to correct errors contained in previously published information and to publish the corrected information, but is under no obligation to do so and shall have no liability in respect of any errors or omissions contained in any subsequent publication.
DTC participants that hold the ETNs through DTC on behalf of investors will follow the settlement practices applicable to equity securities in DTC’s settlement system with respect to the primary distribution of the ETNs and secondary market trading between DTC participants.
We will use the net proceeds we receive from the sale of the ETNs for the purposes we describe in the accompanying prospectus supplement under “Use of Proceeds and Hedging.” We or our affiliates may also use those proceeds in transactions intended to hedge our obligations under the ETNs as described below.
In anticipation of the sale of a series of ETNs, we or our affiliates expect to enter into hedging transactions involving purchases of instruments
linked to the Index underlying those ETNs prior to or on the inception date. In addition, from time to time after we issue a series of ETNs, we or our affiliates may enter into additional hedging transactions or unwind those hedging transactions we have entered into. In this regard, we or our affiliates may:
| · | acquire or dispose of long or short positions in listed or over-the-counter options, futures, or other instruments linked to some or all of the index components (including the underlying physical commodities) or the Indices; |
| · | acquire or dispose of long or short positions in listed or over-the-counter options, futures, or other instruments linked to the level of other similar market indices, contracts or commodities; or |
| · | any combination of the above two. |
We or our affiliates may acquire a long or short position in securities similar to a series of ETNs from time to time and may, in our or their sole discretion, hold or resell those securities.
Our affiliate, Barclays Capital Inc., may make a market in any series of ETNs. In connection with any such market making activities, Barclays Capital Inc. may acquire long or short positions in a series of ETNs, including through options or other derivative financial instruments linked to such series of ETNs, and may hedge such long or short positions by selling or purchasing such series of ETNs or entering into options or other derivative financial instruments linked to such series of ETNs.
We or our affiliates may close out our or their hedge positions on or before a final valuation date. That step may involve sales or purchases of listed or over-the-counter options or futures on index components (including the underlying physical commodities) or listed or over-the-counter options, futures, or other instruments linked to the level of the index components or the Indices, as well as other indices designed to track the performance of the Indices or other components of the commodities market.
The hedging activity discussed above may adversely affect the level of an Index and, as a consequence, the market value of the ETNs linked to that Index from time to time and the amount payable at maturity or upon early
PS-88
redemption. See “Risk Factors” in this pricing supplement for a discussion of
possible adverse effects related to our hedging activities.
PS-89
MATERIAL U.S. FEDERAL INCOME TAX CONSIDERATIONS
The following section supplements the discussion of U.S. federal income taxation in the accompanying prospectus supplement and, when read in combination therewith, is the opinion of Davis Polk & Wardwell LLP, our special tax counsel. The following discussion supersedes the discussion in the accompanying prospectus supplement to the extent it is inconsistent therewith. This section applies to you only if you are a U.S. Holder (as defined below) and you hold your ETNs as capital assets for tax purposes. This discussion does not address all aspects of U.S. federal income taxation that may be relevant to you in light of your particular circumstances, including alternative minimum tax consequences and the application of the “Medicare contribution tax” on investment income. This section does not apply to you if you are a member of a class of U.S. Holders subject to special rules, such as:
| · | a dealer in securities; |
| · | a trader in securities that elects to use a mark-to-market method of accounting for your securities holdings; |
| · | a financial institution; |
| · | an insurance company; |
| · | a tax-exempt entity, including an “individual retirement account” or “Roth IRA” as defined in Code Section 408 or 408A, respectively; |
| · | a “regulated investment company” as defined in Code Section 851; |
| · | a “real estate investment trust” as defined in Code Section 856; |
| · | a partnership or other pass-through entity; |
| · | a person that owns an ETN as part of a straddle or conversion transaction for tax purposes or that has entered into a “constructive sale” with respect to the ETN; or |
| · | a person whose functional currency for tax purposes is not the U.S. dollar. |
If you are a partnership for U.S. federal income tax purposes, the U.S. federal income tax
treatment of your partners will generally depend on the status of your partners and your activities.
This section is based on the Code, its legislative history, existing and proposed regulations under the Code, published rulings and court decisions, all as currently in effect. These laws are subject to change, possibly on a retroactive basis.
You should consult your tax advisor concerning the U.S. federal income tax and other tax consequences of your investment in the ETNs in your particular circumstances, including the application of state, local or other tax laws and the possible effects of changes in federal or other tax laws.
You are a U.S. Holder if you are a beneficial owner of an ETN and you are for U.S. federal income tax purposes:
| · | a citizen or individual resident of the United States; |
| · | a corporation or other entity taxable as a corporation created or organized under the laws of the United States, any state therein or the District of Columbia; |
| · | an estate whose income is subject to U.S. federal income tax regardless of its source; or |
| · | a trust if a U.S. court can exercise primary supervision over the trust’s administration and one or more U.S. persons are authorized to control all substantial decisions of the trust. |
In the opinion of our special tax counsel, which is based on current market conditions, each series of ETNs should be treated for U.S. federal income tax purposes as prepaid forward contracts with respect to the relevant Index that are not debt instruments. If the ETNs are so treated, you should not recognize taxable income or loss over the term of the ETNs prior to maturity, other than pursuant to a sale, exchange, early redemption, or “deemed exchange” as described below. You should generally recognize capital gain or loss upon the sale, exchange, early redemption or maturity of your ETNs in an amount equal to the difference between the amount you receive at such time and your tax basis in the ETNs. In general, your tax basis in your ETNs will be equal to the price you paid for your ETNs. This capital
PS-90
gain or loss should be long-term capital gain or loss if you have held the ETN for more than one year at that time. The deductibility of capital losses is subject to limitations. Unless otherwise indicated, the following discussion assumes that the treatment of the ETNs as prepaid forward contracts that are not debt is correct.
The IRS could assert that a “deemed” taxable exchange has occurred on one or more roll dates or Index rebalance dates under certain circumstances. If the IRS were successful in asserting that a taxable exchange had occurred, you could be required to recognize gain (but probably not loss), which would equal the amount by which the fair market value of the ETN exceeds your tax basis therein on the relevant roll date or Index rebalance date. Any gain recognized on a deemed exchange should be capital gain. You should consult your tax advisor regarding the possible U.S. federal income tax consequences of Index rolls or rebalancings.
Alternative Treatments
There is no judicial or administrative authority discussing how your ETNs should be treated for U.S. federal income tax purposes. Therefore the IRS might assert that your ETNs should be treated in a manner that differs from that described above. For example, the IRS might assert that your ETNs should be treated as debt instruments subject to the special tax rules governing contingent payment debt instruments. If your ETNs were so treated, regardless of whether you are an accrual-method or cash-method taxpayer, you would be required to accrue interest income over the term of your ETNs based upon the yield at which we would issue a non-contingent fixed-rate debt instrument with other terms and conditions similar to your ETNs. You would recognize gain or loss upon the sale, exchange, early redemption or maturity of your ETNs in an amount equal to the difference, if any, between the amount you receive at such time and your adjusted basis in your ETNs. In general, your adjusted basis in your ETNs would be equal to the amount you paid for your ETNs, increased by the amount of interest you previously accrued with respect to your ETNs. Any gain you recognize upon the sale, exchange, early redemption or maturity of your ETNs would be ordinary income and any loss recognized by you at such time would be ordinary loss to the extent of interest you included in income in the
current or previous taxable years in respect of your ETNs, and thereafter, would be capital loss. Additionally, if you recognized a loss above certain thresholds, you might be required to file a disclosure statement with the IRS.
Even if the treatment of the ETNs as prepaid forward contracts that are not debt instruments is respected, due to the lack of controlling authority there remain significant additional uncertainties regarding the tax consequences of your ownership and disposition of your ETNs. For instance, you might be required to treat all or a portion of the gain or loss on the sale or exchange of your ETNs as ordinary income or loss or as short-term capital gain or loss, without regard to how long you held your ETNs.
Moreover, it is possible that the IRS could seek to tax your ETNs by reference to your deemed ownership of the relevant Index components. In this case, it is possible that Code Section 1256 could apply to your ETNs, in which case any gain or loss that you recognize with respect to the ETNs that is attributable to the regulated futures contracts represented in the relevant Index would be treated as 60% long-term capital gain or loss and 40% short-term capital gain or loss, without regard to your holding period in the ETNs and you would be required to mark such portion of the relevant ETN to market at the end of each taxable year (i.e., recognize gain and loss as if the relevant portion of your ETNs had been sold for fair market value).
Additionally, if your ETNs are linked to an Index that consists of one or more metals (including both precious metals and industrial metals), it is also possible that the IRS could assert that your ETNs should be treated as giving rise to “collectibles” gain or loss if you hold your ETNs for more than one year.
In addition, in 2007, the U.S. Treasury Department and the IRS released a notice that may affect the taxation of the ETNs. According to the notice, the U.S. Treasury Department and the IRS are actively considering whether the beneficial owner of an instrument such as the ETNs should be required to accrue ordinary income on a current basis. The notice also states that the U.S. Treasury Department and the IRS are considering other relevant issues, including whether gain or loss from such instruments should be treated as ordinary or capital, whether non-U.S. investors in instruments such as the
PS-91
ETNs should be subject to withholding tax on any deemed income accruals, and whether the special “constructive ownership rules” of Code Section 1260 might be applied to such instruments.
It is impossible to anticipate how any ultimate guidance would affect the tax treatment of instruments such as the ETNs.
No statutory, judicial or administrative authority directly discusses how your ETNs should be treated for U.S. federal income tax purposes. As a result, the U.S. federal income tax consequences of your investment in the ETNs are uncertain and alternative characterizations are possible. Accordingly, we urge you to consult your tax advisor in determining the tax consequences of an investment in your ETNs in your particular circumstances, including the application of state, local or other tax laws and the possible effects of changes in federal or other tax laws.
“Specified Foreign Financial Asset” Reporting
Owners of “specified foreign financial assets” with an aggregate value in excess of $50,000 (and in some circumstances, a higher threshold) may be required to file an information report with respect to such assets with their tax returns. “Specified foreign financial assets” may include any financial accounts maintained by foreign financial institutions as well as any of the following (which may include the ETNs), but only if they are held for investment and not held in accounts maintained by financial institutions: (i) stocks and securities issued by non-U.S. persons, (ii) financial instruments and contracts that have non-U.S. issuers or counterparties and (iii) interests in foreign entities. Holders are urged to consult their tax advisors regarding the application of this legislation to their ownership of the ETNs.
Information Reporting and Backup Withholding
Please see the discussion under “Material U.S. Federal Income Tax Consequences—Information Reporting and Backup Withholding” in the accompanying prospectus supplement for a description of the applicability of the information reporting and backup withholding rules to payments made on your ETNs.
SUPPLEMENTAL PLAN OF DISTRIBUTION
We sold a portion of each series of ETNs on the inception date at 100% of the principal amount through Barclays Capital Inc., our affiliate, as principal, in the initial distribution. Following the inception date, the remainder of the ETNs of each series will be offered and sold from time to time through Barclays Capital Inc., as agent. Sales of each series of ETNs by us after the inception date will be made at market prices prevailing at the time of sale, at prices related to market prices or at negotiated prices. Barclays Capital Inc. will not receive an agent’s commission in connection with sales of the ETNs.
In connection with this offering, we will sell the ETNs of any series to dealers (including our affiliate Barclays Capital Inc.) as principal, and such dealers may then resell such ETNs to the public at varying prices that the dealers will determine at the time of resale. In addition, such dealers may make a market in the ETNs of any series, although none of them are obligated to do so and any of them may stop doing so at any time without notice. This prospectus (including this pricing supplement and the accompanying prospectus and prospectus supplement) may be used by such dealers in connection with market-making transactions. In these transactions, dealers may resell an ETN covered by this prospectus that they acquire from us or other holders after the original offering and sale of the ETNs, or they may sell an ETN covered by this prospectus in short sale transactions.
Barclays Capital Inc., or another affiliate of ours, or a third party distributor, may purchase and hold some of the ETNs for subsequent resale at variable prices after the initial issue date of the ETNs. In offering ETNs for sale after the initial issue date of the ETNs, there may be circumstances where investors may be offered ETNs from one distributor (including Barclays Capital Inc. or an affiliate) at a more favorable price than from other distributors. Furthermore, from time to time, Barclays Capital Inc. or an affiliate may offer and sell ETNs to purchasers of a large quantity of the ETNs at a more favorable price than it would offer to a purchaser acquiring a smaller quantity of the ETNs.
Broker-dealers and other persons are cautioned that some of their activities may result in their being deemed participants in the distribution of
PS-92
the ETNs of any series in a manner that would render them statutory underwriters and subject them to the prospectus delivery and liability provisions of the Securities Act of 1933, as amended (the “Securities Act”). Among other activities, broker-dealers and other persons may make short sales of the ETNs of any series and may cover such short positions by borrowing ETNs from us or our affiliates or by purchasing ETNs from us or our affiliates subject to our obligation to repurchase such ETNs at a later date. As a result of these activities, these market participants may be deemed statutory underwriters. A determination of whether a particular market participant is an underwriter must take into account all the facts and circumstances pertaining to the activities of the participant in the particular case, and the example mentioned above should not be considered a complete description of all the activities that would lead to designation as an underwriter and subject a market participant to the prospectus-delivery and liability provisions of the Securities Act. This prospectus will be deemed to cover any short sales of ETNs of any series by market participants who cover their short positions with ETNs borrowed or acquired from us or our affiliates in the manner described above.
PS-93
NOTICE OF REDEMPTION
To: ipathredemptions@barclays.com
Subject: iPath® Notice of Redemption, CUSIP No. [ ]
[BODY OF EMAIL]
Name of holder: [ ]
Number of ETNs to be redeemed: [ ]
Applicable Valuation Date: [ ], 20[ ]
Contact Name: [ ]
Telephone #: [ ]
Acknowledgement: I acknowledge that the ETNs specified above will not be redeemed unless all of the requirements specified in the pricing supplement relating to the ETNs are satisfied.
A-1
CONFIRMATION OF REDEMPTION
Dated:
Barclays Bank PLC
Barclays Bank PLC, as Calculation Agent
| Fax: | 212-412-1232 |
| Email: | mailto:ipathredemptions@barclays.com |
Dear Sir/Madam:
The undersigned holder of Barclays Bank PLC’s Global Medium-Term Notes, Series A, iPath® Exchange Traded Notes due [insert maturity date] CUSIP No. [insert CUSIP No.] (the “ETNs”), redeemable for a cash amount based on the [insert name of relevant Index] hereby irrevocably elects to exercise, on the redemption date of ____________, with respect to the number of ETNs indicated below, as of the date hereof, the redemption right as described in the pricing supplement relating to the ETNs (the “Pricing Supplement”). Terms not defined herein have the meanings given to such terms in the Pricing Supplement.
The undersigned certifies to you that it will (i) instruct its DTC custodian with respect to the ETNs (specified below) to book a delivery vs. payment trade on the valuation date with respect to the number of ETNs specified below at a price per ETN equal to the applicable closing indicative value on the applicable valuation date, facing Barclays DTC 229 and (ii) cause the DTC custodian to deliver the trade as booked for settlement via DTC at or prior to 10:00 a.m., New York City time, on the redemption date.
| Very truly yours, | |
| [NAME OF HOLDER] | |
| Name: | |
| Title: | |
| Telephone: | |
| Fax: | |
| E-mail: |
Number of ETNs surrendered for redemption:
DTC # (and any relevant sub-account):
Contact Name:
Telephone:
(You must redeem at least 50,000 ETNs at one time in order to exercise your right to redeem your ETNs on any redemption date.)
B-1