Free Writing Prospectus
Filed Pursuant to Rule 433
Registration No. 333-265158

iPath ® Series B Carbon ETN July 2023 This document is for informational purposes only and not for onward distribution . It is not intended for retail investors . Please see important disclosures at the end of this document . Data is sourced as of May 31 st, 2023 unless otherwise stated . Further information is available upon request . GRN
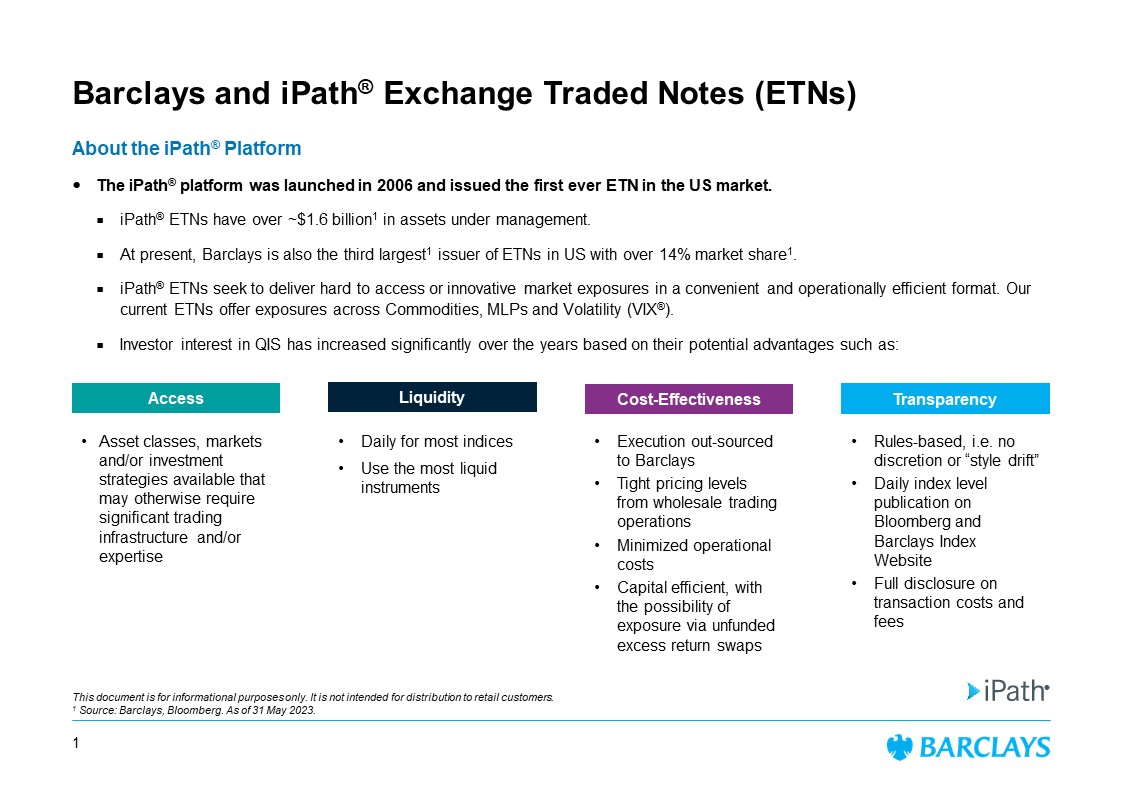
Barclays and iPath ® Exchange Traded Notes (ETNs) About the iPath ® Platform ■ The iPath ® platform was launched in 2006 and issued the first ever ETN in the US market. ■ iPath ® ETNs have over ~$1.6 billion 1 in assets under management. ■ At present, Barclays is also the third largest 1 issuer of ETNs in US with over 14% market share 1 . ■ iPath ® ETNs seek to deliver hard to access or innovative market exposures in a convenient and operationally efficient format. Our current ETNs offer exposures across Commodities, MLPs and Volatility ( VIX ® ). ■ Investor interest in QIS has increased significantly over the years based on their potential advantages such as: 1 Cost - Effectiveness Liquidity Access Transparency • Asset classes, markets and/or investment strategies available that may otherwise require significant trading infrastructure and/or expertise • Daily for most indices • Use the most liquid instruments • Execution out - sourced to Barclays • Tight pricing levels from wholesale trading operations • Minimized operational costs • Capital efficient, with the possibility of exposure via unfunded excess return swaps • Rules - based, i.e. no discretion or “style drift” • Daily index level publication on Bloomberg and Barclays Index Website • Full disclosure on transaction costs and fees This document is for informational purposes only. It is not intended for distribution to retail customers. 1 Source: Barclays, Bloomberg. As of 31 May 2023.

ESG Responsiveness to Our Clients Our starting premise with clients is: ■ Risks related to environmental, social and governance factors are imbedded in nearly every business model and investment port fol io, directly or indirectly. ■ Society at all levels expects responsiveness to ESG and sustainability principles, driving change and creating new opportunit ies . ■ Financial solutions should be bespoke to each client need, with ESG expertise available from across Barclays . 2 This document is for informational purposes only. It is not intended for distribution to retail customers. Group Strategy Research Global Markets Fundamental ESG Credit & Equities Sustainable & Thematic Investing Quantitative Portfolio Strategy Financing Solutions Funded: Credit & Securitized Products Unfunded : Equities Hedging Solutions Unfunded: Credit – Equities – FX – Rate s Investment Solutions Credit – Equities – FX – Rates OUR CLIENTS Investment Banking Sustainable & Impact Investment Banking Sustainable Capital Markets

Overview of EU Emissions Trading System This document is for informational purposes only. It is not intended for distribution to retail customers. 1 Source : Barclays , Bloomberg. As of 31 May 2023. 3 What are Carbon Credits? ■ Carbons credits allow companies to emit a specific level of carbon from factories or power stations. ■ Each unit allows them to emit one ton of either carbon dioxide or another greenhouse gas specified for that credit. About the European Union Emissions Trading System (EU ETS) ■ The EU ETS is the world’s first and largest major carbon market - A cornerstone of the EU’s policy to combat climate change and its key tool for reducing greenhouse gas emissions cost effectively. ■ It limits emissions from over 10,000 heavy energy using installations (power stations and industrial plants) and airlines operating between all EU countries plus Iceland, Liechtenstein and Norway and covers around 40% of the EU’s greenhouse gas. How Does the EU ETS Work? ■ Under the EU ETS, a cap is placed on total carbon that maybe emitted by the installations covered by the system. ■ Companies that want to emit beyond the cap must purchase emissions allowances or face heavy fines. ■ A liquid futures market exists to purchase futures contracts on Emissions Allowances and hedge future price risk .
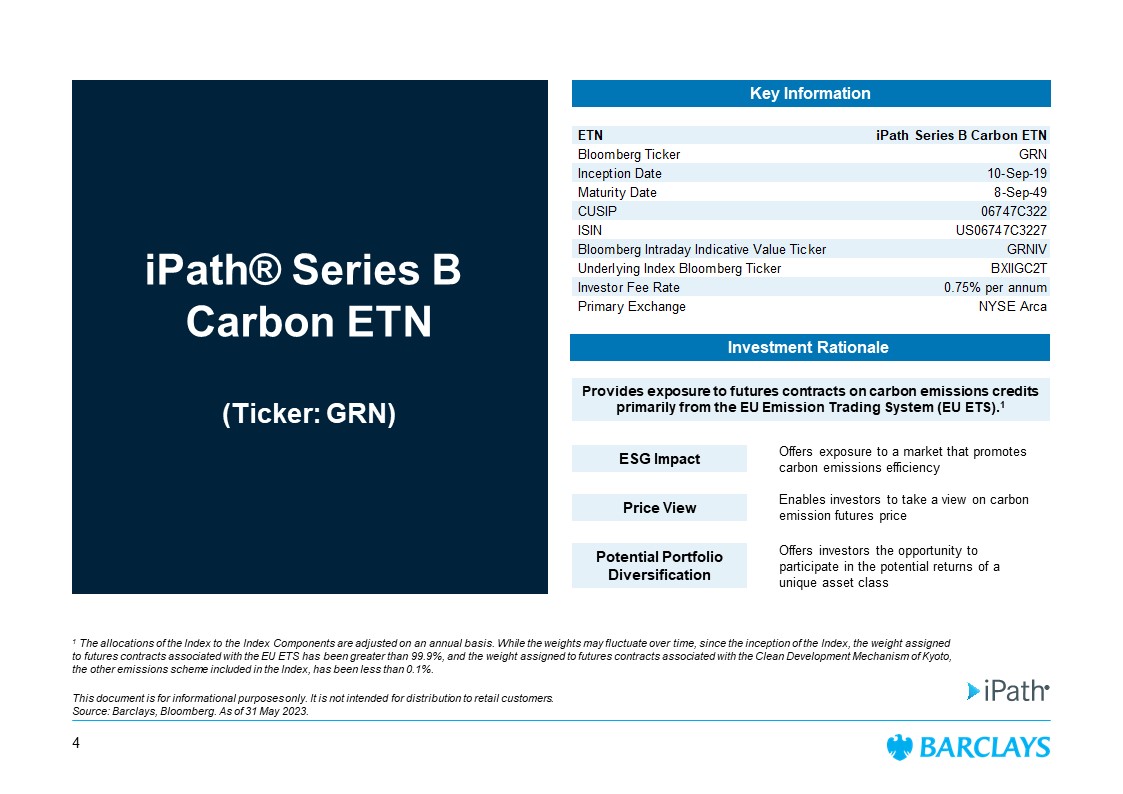
4 1 The allocations of the Index to the Index Components are adjusted on an annual basis. While the weights may fluctuate over time, sin ce the inception of the Index, the weight assigned to futures contracts associated with the EU ETS has been greater than 99.9%, and the weight assigned to futures contracts ass oci ated with the Clean Development Mechanism of Kyoto, the other emissions scheme included in the Index, has been less than 0.1%. This document is for informational purposes only. It is not intended for distribution to retail customers. Source: Barclays, Bloomberg. As of 31 May 2023. Investment Rationale Key Information ESG Impact Price View Potential Portfolio Diversification Offers exposure to a market that promotes carbon emissions efficiency Enables investors to take a view on carbon emission futures price Offers investors the opportunity to participate in the potential returns of a unique asset class iPath® Series B Carbon ETN (Ticker: GRN) ETN iPath Series B Carbon ETN Bloomberg Ticker GRN Inception Date 10-Sep-19 Maturity Date 8-Sep-49 CUSIP 06747C322 ISIN US06747C3227 Bloomberg Intraday Indicative Value Ticker GRNIV Underlying Index Bloomberg Ticker BXIIGC2T Investor Fee Rate 0.75% per annum Primary Exchange NYSE Arca Provides exposure to futures contracts on carbon emissions credits primarily from the EU Emission Trading System (EU ETS). 1
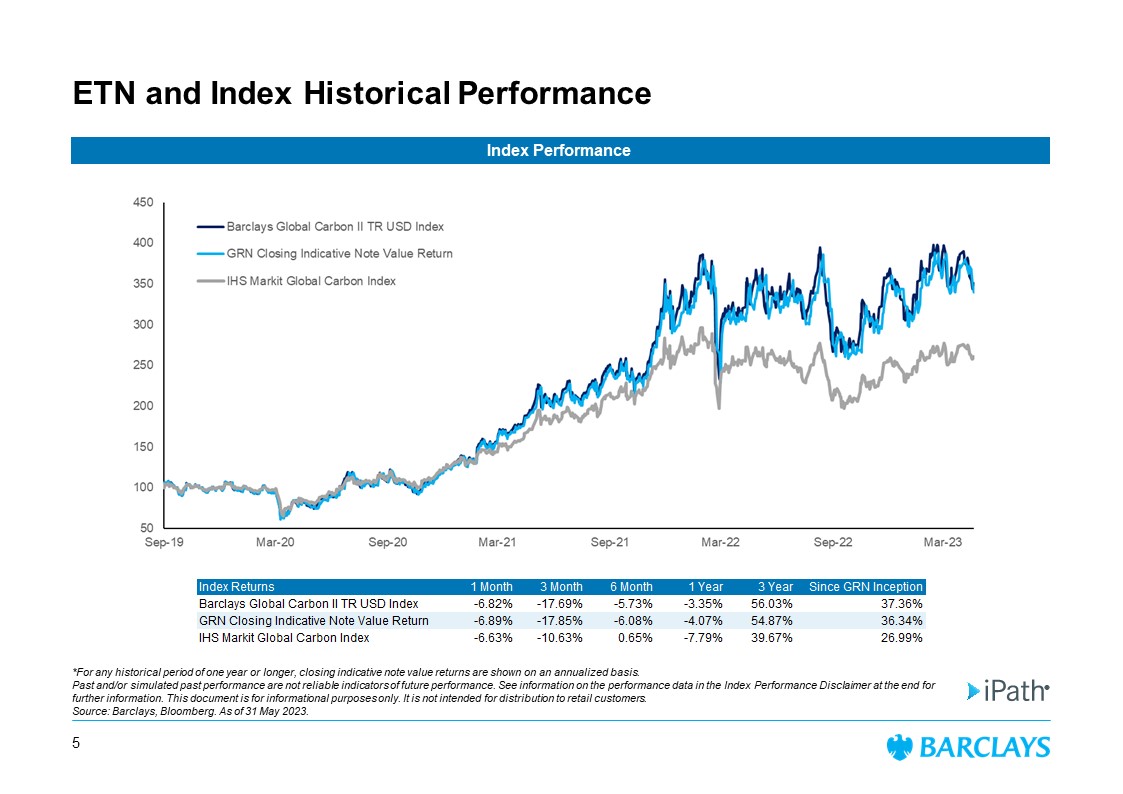
ETN and Index Historical Performance *For any historical period of one year or longer, closing indicative note value returns are shown on an annualized basis . Past and/or simulated past performance are not reliable indicators of future performance. See information on the performance data in the Index Performance Disclaimer at the end for further information . This document is for informational purposes only. It is not intended for distribution to retail customers. Source: Barclays, Bloomberg. As of 31 May 2023. 5 Index Performance Index Returns 1 Month 3 Month 6 Month 1 Year 3 Year Since GRN Inception Barclays Global Carbon II TR USD Index -6.82% -17.69% -5.73% -3.35% 56.03% 37.36% GRN Closing Indicative Note Value Return -6.89% -17.85% -6.08% -4.07% 54.87% 36.34% IHS Markit Global Carbon Index -6.63% -10.63% 0.65% -7.79% 39.67% 26.99%

ETNs vs ETFs The following table describes some of the key differences and similarities between ETNs and ETFs : 1 Tracking error refers to the under/over performance differential of an ETN versus its underlying index over a given time peri od , after accounting for the ETN's fees and costs. One cannot invest directly in an index. 2 With short sales, an investor faces the potential for unlimited losses as the security's price rises . This document is for informational purposes only. It is not intended for distribution to retail customers. 6 Liquidity Daily on exchange, subject to trading market Daily on exchange, subject to trading market Registration Securities Act of 1933 Investment Company Act of 1940 Recourse Issuer credit Portfolio of securities Principal Risk Market and issuer risk Market risk Tracking Error 1 Minimal to none Low Tax Issues Capital gains only realized upon the sale, redemption or maturity of the ETN. No dividend distributions. Interest paid only on ETNs designed to pay a periodic coupon. Significant aspects of the tax treatment of ETNs are uncertain. You should consult your tax advisor about your own situation. Potential exposure to capital gains and losses of portfolio, although creation/redemption mechanism works to minimize this. Dividends and interest income passed through to shareholders. Transparency Performance of ETNs generally depends on the return of the underlying index, less applicable fees and costs. There is typically not an underlying portfolio of securities that investors have recourse to. Performance of ETFs generally depends on the return on a portfolio of securities or instruments held by the fund, less applicable fees and costs. Holdings of the fund are disclosed by the fund sponsor. Accessibility Access through any brokerage account (certain firms may have restrictions on product availability on their platforms) Access through any brokerage account (certain firms may have restrictions on product availability on their platforms) Institutional Size Redemption Daily to the issuer, subject to minimum redemption amount Daily via custodian, subject to minimum redemption amount Short Sales 2 Yes, on an uptick or a downtick Yes, on an uptick or a downtick ETNs ETFs

Disclaimers
Index Performance Disclaimer This document is for informational purposes only. It is not intended for distribution to retail customers. This communication includes past performance data related to select indices developed and published by Barclays Bank PLC (“Ba rcl ays”). This disclaimer is intended to highlight the risks inherent in assessing such performance data. Index performance data included in this communication are accompanied by a footnote specifying the relevant Index Base Date a nd Index Live Date. The Index Base Date is defined as the first date for which the level of the index has been calculated. The Index Live Date is defined as the date on which the ind ex rules were established and the index was first published. In assessing past performance, it is important to distinguish Past simulated index performance from Past index per for mance: Past simulated index performance Past simulated index performance refers to the period from the Index Base Date to the Index Live Date. This performance is hy pot hetical and back - tested using criteria applied retroactively. It benefits from hindsight and knowledge of factors that may have favorably affected the performance and canno t a ccount for all financial risk that may affect the actual performance of the index. It is in Barclays’ interest to demonstrate favorable simulated index performance. The actual perfor man ce of the index may vary significantly from the past simulated performance. Past simulated index performance is not a reliable indicator of future performance. Past index performance Past index performance refers to the period from the Index Live Date to the date of this presentation. This performance is ac tua l past performance of the index. Past index performance is not a reliable indicator of future performance. Past index performance is usually highlighted in blue and designated as "Live"". Past simulated index performance is usually not highlighted. Past and / or Past simulated index performance is provided for a period of at least 10 years, unless the instruments underlyi ng the index were only available or sufficiently liquid for a lesser period. In that case, Past and Past simulated index performance is provided from the time when the instruments underly ing the index were available or sufficiently liquid. Unless stated otherwise, performance, volatility, Sharpe ratio and correlation data are calculated using monthly returns and maximum dr awdown data are calculated using daily returns. For the purpose of regulatory compliance and to facilitate comparison, performance data include returns calculated for each of the fi ve consecutive 12 month periods extending back from month - end of last month. However, Barclays has provided additional information to supplement statutory and/or regulatory require ments. The index methodology is available for review upon request, subject to the execution of a non - disclosure agreement. The performance data reflect all costs, charges and fees that are incorporated into the index formula (if any). Depending on the transaction/product terms, additional charges may apply as part of the transaction/product; such charges are not reflected in the performance statistics. Barclays or an affiliate of Barclays prepared the provided performance information (including the simulated performance infor mat ion), may be the index sponsor and potentially is the counterparty to a transaction referencing the index. 7

Select Risk Considerations This document is for informational purposes only. It is not intended for distribution to retail customers. An investment in the iPath ETNs described herein (the “ETNs”) involves risks, including possible loss of principal, and may n ot be suitable for all investors. Selected risks are summarized here and select product specific risk factors are summarized under “Select Risk Cons ide rations” on the relevant product pages, but we urge you to read the more detailed explanation of risks described under “Risk Factors” in the applicabl e p roduct prospectus. You May Lose Some or All of Your Principal: The ETNs are exposed to any change in the level of the underlying index, or the Volume Weighted Average Price ("VWAP") level, in the case of the iPath® S&P MLP ETN, between the inception date and the applicable valuation date. Addition all y, if the level of the underlying index or the VWAP level, is insufficient to offset the negative effect of the investor fee and other applicable costs, you will los e s ome or all of your investment at maturity or upon redemption, even if the value of such index or the VWAP level has increased or decreased, as the case may be. Because th e E TNs are subject to an investor fee and other applicable costs, the return on the ETNs will always be lower than the total return on a direct investment in the i nde x components. The ETNs are riskier than ordinary unsecured debt securities and have no principal protection. Credit of Barclays Bank PLC: The ETNs are unsecured debt obligations of the issuer, Barclays Bank PLC, and are not, either directly or indirectly, an obli gat ion of or guaranteed by any third party. Any payment to be made on the ETNs, including any payment at maturity or upon redemption, depe nds on the ability of Barclays Bank PLC to satisfy its obligations as they come due. As a result, the actual and perceived creditworthiness of Barclays Bank PLC wil l affect the market value, if any, of the ETNs prior to maturity or redemption. In addition, in the event Barclays Bank PLC were to default on its obligations, you may no t receive any amounts owed to you under the terms of the ETNs. A Trading Market for the ETNs May Not Develop: Although the ETNs are listed on a U.S. national securities exchange, a trading market for the ETNs may not develop and the liquidity of the ETNs may be limited, as we are not required to maintain any listing of the ETNs. No Interest Payments from the ETNs: You may not receive any interest payments on the ETNs. Restrictions on the Minimum Number of ETNs and Date Restrictions for Redemptions: You must redeem at least 5,000 ETNs of the same series at one time in order to exercise your right to redeem your ETNs on any redemption date. You may only redeem your ETNs on a redemption date i f w e receive a notice of redemption from you by certain dates and times as set forth in the product prospectus. Uncertain Tax Treatment: Significant aspects of the tax treatment of the ETNs are uncertain. You should consult your own tax advisor about your own ta x s ituation. The ETNs may be sold throughout the day on the exchange through any brokerage account. Commissions may apply and there are ta x c onsequences in the event of sale, redemption or maturity of ETNs. Issuer Redemption: If specified in the applicable prospectus, Barclays Bank PLC will have the right to redeem or call a series of ETNs (in whole bu t not in part) at its sole discretion and without your consent on any trading day on or after the inception date until and including maturity. 8

Select Risk Considerations This document is for informational purposes only. It is not intended for distribution to retail customers. Carbon Market Risk: Trading in futures contracts on carbon emissions credits, including trading in the index components, is speculative and can b e e xtremely volatile. The futures markets are subject to temporary distortions or other disruptions due to various factors, including the la ck of liquidity in the markets, the participation of speculators and government regulation and intervention. Market prices of the index components may fluctuate rap idly based on numerous factors including but not limited to changes in supply and demand, domestic and foreign political or government actions and technolog ica l developments. These factors could adversely affect the value of the underlying index and, therefore, the value of your ETNs. Cap & trade mechanisms have arisen pr imarily due to relative international consensus on the correlation between the rise in greenhouse gas emissions and the onset of global warming. Accordingly, chang es in regulation and enforcement of cap & trade mechanisms as a result of changes in international consensus can adversely affect market behavior and the value o f t he ETNs. Concentration Risk: Because the ETNs are linked to an index composed of futures contracts on a single commodity or in only one commodity sector, the ETNs are less diversified than other funds. The ETNs can therefore experience greater volatility than other funds or investments. Barclays Bank PLC has filed a registration statement (including a base prospectus) with the SEC for the offering to which this communi cat ion relates. Before you invest, you should read the base prospectus for this offering in that registration statement and other documents B arc lays Bank PLC has filed with the SEC for more complete information about Barclays Bank PLC and this offering. You may get these documents for free by se arching the SEC online database (EDGAR) at www.sec.gov . Alternatively, you may obtain a copy of the base prospectus from Barclays Bank PLC by calling toll - free 1 - 888 - 227 - 2275 (extension 7 - 7990). © 2023 Barclays Bank PLC. iPath, iPath ETNs and the iPath logo are registered trademarks of Barclays Bank PLC. Barclays Global Car bon II TR USD Index" is a trademark of Barclays Bank PLC. All other trademarks, servicemarks or registered trademarks are the property, and used with t he permission, of their respective owners . NOT FDIC INSURED • NO BANK GUARANTEE • MAY LOSE VALUE The prospectus for the ETN can be accessed at ipathetn.barclays /GRN 9