UNITED STATES
SECURITIES AND EXCHANGE COMMISSION
Washington, D.C. 20549
FORM N-CSR
CERTIFIED SHAREHOLDER REPORT OF REGISTERED MANAGEMENT
INVESTMENT COMPANIES
Investment Company Act file number | 811- 2946 |
| |
| Dreyfus Municipal Money Market Fund, Inc. | |
| (Exact name of Registrant as specified in charter) | |
| | |
| c/o The Dreyfus Corporation 200 Park Avenue New York, New York 10166 | |
| (Address of principal executive offices) (Zip code) | |
| | |
| Michael A. Rosenberg, Esq. 200 Park Avenue New York, New York 10166 | |
| (Name and address of agent for service) | |
|
Registrant's telephone number, including area code: | (212) 922-6000 |
| |
Date of fiscal year end: | 5/31 | |
Date of reporting period: | 5/31/11 | |
| | | | | | | |
FORM N-CSR
Item 1. Reports to Stockholders.
|
| Dreyfus |
| Municipal Money |
| Market Fund, Inc. |
ANNUAL REPORT May 31, 2011

Save time. Save paper. View your next shareholder report online as soon as it’s available. Log into www.dreyfus.com and sign up for Dreyfus eCommunications. It’s simple and only takes a few minutes.
The views expressed in this report reflect those of the portfolio manager only through the end of the period covered and do not necessarily represent the views of Dreyfus or any other person in the Dreyfus organization. Any such views are subject to change at any time based upon market or other conditions and Dreyfus disclaims any responsibility to update such views.These views may not be relied on as investment advice and, because investment decisions for a Dreyfus fund are based on numerous factors, may not be relied on as an indication of trading intent on behalf of any Dreyfus fund.
Not FDIC-Insured • Not Bank-Guaranteed • May Lose Value
| | Contents |
| | THE FUND |
| 2 | A Letter from the Chairman and CEO |
| 3 | Discussion of Fund Performance |
| 6 | Understanding Your Fund’s Expenses |
| 6 | Comparing Your Fund’s Expenses With Those of Other Funds |
| 7 | Statement of Investments |
| 18 | Statement of Assets and Liabilities |
| 19 | Statement of Operations |
| 20 | Statement of Changes in Net Assets |
| 21 | Financial Highlights |
| 22 | Notes to Financial Statements |
| 28 | Report of Independent Registered Public Accounting Firm |
| 29 | Important Tax Information |
| 30 | Board Members Information |
| 33 | Officers of the Fund |
| | FOR MORE INFORMATION |
| | Back Cover |
Dreyfus Municipal
Money Market Fund, Inc.
The Fund

A LETTER FROM THE CHAIRMAN AND CEO
Dear Shareholder:
We are pleased to present this annual report for Dreyfus Municipal Money Market Fund, Inc., covering the 12-month period from June 1, 2010, through May 31, 2011. For information about how the fund performed during the reporting period, as well as general market perspectives, we provide a Discussion of Fund Performance on the pages that follow.
The U.S. economy appears to have hit a soft patch in the spring of 2011 after accelerating over the second half of 2010. Disappointing labor, housing and manufacturing data have come at a time of higher energy prices and some tightening of monetary policy in global markets. In our view, the current slowdown should be relatively brief as the world recovers from the supply shocks created by weather impacts on food production, the decline in Libyan oil exports and supply-chain disruptions stemming from Japan’s natural and nuclear disasters. Yields of money market instruments remained near zero percent in this choppy economic environment, as the Federal Reserve Board maintained its aggressively accommodative policy stance.
We remain optimistic as the U.S. economy moves through the middle stages of its cycle. Indeed, global macroeconomic policy generally has remained stimulative despite the recent efforts of some central banks to forestall inflationary pressures. We continue to expect sustainable economic growth, a rising but volatile uptrend in inflation and an improving U.S. labor market in the months ahead.As always, to determine how these forces may affect your investments, we urge you to talk regularly with your financial advisor.
Thank you for your continued confidence and support.

Jonathan R. Baum
Chairman and Chief Executive Officer
The Dreyfus Corporation
June 15, 2011
2

DISCUSSION OF FUND PERFORMANCE
For the period of June 1, 2010, through May 31, 2011, as provided by Colleen Meehan, Senior Portfolio Manager
Fund and Market Performance Overview
For the 12-month period ended May 31, 2011, Dreyfus Municipal Money Market Fund produced a yield of 0.05%.Taking into account the effects of compounding, the fund produced an effective yield of 0.05%.1
Although investors grew more optimistic about the economy during the fall of 2010 and yields of longer-term municipal bonds climbed, yields of short-term municipal money market instruments remained anchored near zero percent by a historically low federal funds rate.
The Fund’s Investment Approach
The fund seeks as high a level of current income exempt from federal income tax as is consistent with the preservation of capital and the maintenance of liquidity.
In pursuing this objective, we employ two primary strategies. First, we normally attempt to add value by investing substantially all of the fund’s net assets in high-quality short-term municipal obligations throughout the United States and its territories that provide income exempt from federal personal income tax. Second, we actively manage the fund’s average maturity based on our anticipation of supply-and-demand changes in the short-term municipal marketplace and interest-rate cycles while anticipating liquidity needs.
For example, if we expect an increase in short-term supply, we may decrease the average maturity of the fund, which could enable us to take advantage of opportunities when short-term supply increases. Generally, yields tend to rise when there is an increase in new-issue supply competing for investor interest. New securities are generally issued with maturities in the one-year range, which in turn may lengthen the fund’s average maturity if purchased. If we anticipate limited new-issue supply, we may then look to extend the fund’s average maturity to maintain
DISCUSSION OF FUND PERFORMANCE (continued)
then-current yields for as long as we believe practical.At other times, we try to maintain an average maturity that reflects our view of short-term interest-rate trends and future supply-and-demand considerations.
Low Yields Persisted Despite a Stronger Economic Recovery
The reporting period began during a time of economic weakness due to a sovereign debt crisis in Europe and high unemployment in the United States. However, economic sentiment improved dramatically in the fall of 2010, when the Federal Reserve Board (the “Fed”) announced a new quantitative easing program. Greater economic optimism subsequently was reinforced by improved hiring activity and greater consumer spending. Indeed, the U.S. Department of Commerce estimated that U.S. GDP expanded at a 3.1% annualized rate during the fourth quarter of 2010, up from 2.6% during the third quarter. Expectations of continued economic growth and related inflation fears in 2011 drove yields of longer-term U.S.Treasury securities and highly rated municipal bonds higher.
Many analysts were surprised by a lower-than-expected estimate of 1.8% annualized GDP growth for the first quarter of 2011, and surging energy prices added to their concerns. Nonetheless, the Fed maintained an aggressively accommodative policy stance, leaving the overnight federal funds rate in a range between 0% and 0.25%. Consequently, tax-exempt money market instruments continued to offer yields of little more than zero percent.
The supply of newly issued municipal money market instruments remained ample in December 2010, and the expiration of the Build America Bonds program at the end of the year had relatively little impact on issuance volumes during the first five months of 2011. Meanwhile, demand for municipal money market instruments remained robust as individuals sought to shelter income from rising state taxes and institutional investors searched for alternatives to taxable money market instruments.
Most states and municipalities reduced spending and some raised taxes to bridge budget deficits during the reporting period. Although tax revenues remain below prerecession levels, receipts have trended up
4
over the past year, and we believe that well-publicized concerns regarding potential municipal defaults have been overstated. In addition, several banks have initiated programs providing municipal issuers with credit, a positive development that appears likely to continue.
Focus on Liquidity and Capital Preservation
We have maintained a conservative investment posture, emphasizing direct, high-quality municipal obligations and commercial paper that were deemed creditworthy by our analysts.We also favored instruments backed by pledged tax appropriations or dedicated revenues.We generally shied away from general obligation debt and instruments issued by localities that depend heavily on state aid. Finally, we maintained the fund’s weighted average maturity in a range that was roughly in line with industry averages, as it has made little sense to us to incur the interest-rate risks that longer-dated instruments typically entail.
Increased Supply Could Lift Yields
Despite ongoing signs of economic recovery and higher commodity prices, the Fed is expected to keep short-term interest rates at current low levels.Therefore, we believe the prudent course continues to be an emphasis on preservation of capital and liquidity. However, we expect the supply of newly issued tax-exempt money market instruments to increase later in 2011, which could put upward pressure on yields.
June 15, 2011
| |
| | An investment in the fund is not insured or guaranteed by the FDIC or any other government |
| | agency.Although the fund seeks to preserve the value of your investment at $1.00 per share, it is |
| | possible to lose money by investing in the fund. |
| | Short-term municipal securities holdings involve credit and liquidity risks and risk of principal loss. |
| 1 | Effective yield is based upon dividends declared daily and reinvested monthly. Past performance is |
| | no guarantee of future results.Yields fluctuate. Income may be subject to state and local taxes, and |
| | some income may be subject to the federal alternative minimum tax (AMT) for certain investors. |
| | Yields provided for the fund reflect the absorption of certain fund expenses by The Dreyfus |
| | Corporation pursuant to a voluntary undertaking that may be extended, terminated or modified at |
| | any time. Had these expenses not been absorbed, the fund yields would have been lower. |
UNDERSTANDING YOUR FUND’S EXPENSES (Unaudited)
As a mutual fund investor, you pay ongoing expenses, such as management fees and other expenses. Using the information below, you can estimate how these expenses affect your investment and compare them with the expenses of other funds.You also may pay one-time transaction expenses, including sales charges (loads) and redemption fees, which are not shown in this section and would have resulted in higher total expenses. For more information, see your fund’s prospectus or talk to your financial adviser.
Review your fund’s expenses
The table below shows the expenses you would have paid on a $1,000 investment in Dreyfus Municipal Money Market Fund, Inc. from December 1, 2010 to May 31, 2011. It also shows how much a $1,000 investment would be worth at the close of the period, assuming actual returns and expenses.
Expenses and Value of a $1,000 Investment
assuming actual returns for the six months ended May 31, 2011
| |
| Expenses paid per $1,000† | $ 1.45 |
| Ending value (after expenses) | $1,000.30 |
COMPARING YOUR FUND’S EXPENSES
WITH THOSE OF OTHER FUNDS (Unaudited)
Using the SEC’s method to compare expenses
The Securities and Exchange Commission (SEC) has established guidelines to help investors assess fund expenses. Per these guidelines, the table below shows your fund’s expenses based on a $1,000 investment, assuming a hypothetical 5% annualized return. You can use this information to compare the ongoing expenses (but not transaction expenses or total cost) of investing in the fund with those of other funds.All mutual fund shareholder reports will provide this information to help you make this comparison. Please note that you cannot use this information to estimate your actual ending account balance and expenses paid during the period.
Expenses and Value of a $1,000 Investment
assuming a hypothetical 5% annualized return for the six months ended May 31, 2011
| |
| Expenses paid per $1,000† | $ 1.46 |
| Ending value (after expenses) | $1,023.49 |
|
| † Expenses are equal to the fund’s annualized expense ratio of .29%, multiplied by the average account value over the |
| period, multiplied by 182/365 (to reflect the one-half year period). |
6
|
| STATEMENT OF INVESTMENTS |
| May 31, 2011 |
| | | | | |
| Short-Term | Coupon | Maturity | Principal | | |
| Investments—95.8% | Rate (%) | Date | Amount ($) | | Value ($) |
| California—3.6% | | | | | |
| Alameda County Industrial | | | | | |
| Development Authority, Revenue | | | | | |
| (Golden West Paper Converting | | | | | |
| Corporation Project) (LOC; | | | | | |
| Comerica Bank) | 0.30 | 6/7/11 | 3,315,000 | a | 3,315,000 |
| California, | | | | | |
| GO Notes (LOC; KBC Bank) | 0.15 | 6/1/11 | 2,000,000 | a | 2,000,000 |
| California Pollution Control | | | | | |
| Financing Authority, SWDR | | | | | |
| (GreenWaste Recovery, Inc. | | | | | |
| Project) (LOC; Comerica Bank) | 0.28 | 6/7/11 | 5,730,000 | a | 5,730,000 |
| California Pollution Control | | | | | |
| Financing Authority, SWDR | | | | | |
| (Sunset Waste Paper, Inc. | | | | | |
| Project) (LOC; Comerica Bank) | 0.28 | 6/7/11 | 3,000,000 | a | 3,000,000 |
| California Statewide Communities | | | | | |
| Development Authority, | | | | | |
| Revenue, CP (Kaiser Permanente) | 0.34 | 10/12/11 | 3,000,000 | | 3,000,000 |
| Colorado—3.5% | | | | | |
| Denver City and County, | | | | | |
| Airport System Revenue (LOC; | | | | | |
| Landesbank Baden-Wurttemberg) | 0.21 | 6/7/11 | 16,500,000 | a | 16,500,000 |
| Connecticut—1.1% | | | | | |
| Hamden, | | | | | |
| GO Notes, BAN | 2.00 | 8/24/11 | 5,000,000 | | 5,015,105 |
| Delaware—1.0% | | | | | |
| Delaware Health Facilities | | | | | |
| Authority, Revenue (Christiana | | | | | |
| Care Health Services) | 0.12 | 6/1/11 | 4,800,000 | a | 4,800,000 |
| District of Columbia—2.5% | | | | | |
| District of Columbia, | | | | | |
| Enterprise Zone Revenue | | | | | |
| (Trigen-Pepco Energy Services, | | | | | |
| LLC Issue) (LOC; M&T Trust) | 0.28 | 6/7/11 | 7,815,000 | a | 7,815,000 |
| Metropolitan Washington Airports | | | | | |
| Authority, Airport System | | | | | |
| Revenue (Liquidity Facility; | | | | | |
| Landesbank Baden-Wurttemberg) | 0.20 | 6/7/11 | 4,300,000 | a | 4,300,000 |
STATEMENT OF INVESTMENTS (continued)
| | | | | |
| Short-Term | Coupon | Maturity | Principal | | |
| Investments (continued) | Rate (%) | Date | Amount ($) | | Value ($) |
| Florida—18.8% | | | | | |
| Alachua Housing Finance Authority, | | | | | |
| MFHR (Edenwood Park Project) | | | | | |
| (Liquidity Facility; FHLMC and | | | | | |
| LOC; FHLMC) | 0.35 | 6/7/11 | 3,165,000 | a,b | 3,165,000 |
| Broward County Housing Finance | | | | | |
| Authority, MFHR (Cypress Grove | | | | | |
| Apartments Project) (LOC; FNMA) | 0.25 | 6/7/11 | 20,000,000 | a | 20,000,000 |
| Capital Trust Agency, | | | | | |
| MFHR (Brittany Bay Apartments | | | | | |
| —Waterman’s Crossing) | | | | | |
| (Liquidity Facility; FHLMC | | | | | |
| and LOC; FHLMC) | 0.21 | 6/7/11 | 25,220,000 | a,b | 25,220,000 |
| Florida Finance Housing | | | | | |
| Corporation, MFHR (Falls of | | | | | |
| Venice Project) (Liquidity | | | | | |
| Facility; FNMA and LOC; FNMA) | 0.25 | 6/7/11 | 3,850,000 | a | 3,850,000 |
| Florida Local Government Finance | | | | | |
| Commission, Pooled Loan | | | | | |
| Program Revenue, CP | | | | | |
| (LOC; Bank of America) | 0.30 | 6/1/11 | 3,105,000 | | 3,105,000 |
| Halifax Hospital Medical Center, | | | | | |
| Hospital Improvement Revenue, | | | | | |
| Refunding (LOC; JPMorgan | | | | | |
| Chase Bank) | 0.18 | 6/7/11 | 11,500,000 | a | 11,500,000 |
| Highlands County Health Facilities | | | | | |
| Authority, HR (Adventist | | | | | |
| Health System/Sunbelt | | | | | |
| Obligated Group) | 0.15 | 6/7/11 | 12,000,000 | a | 12,000,000 |
| Hillsborough County Industrial | | | | | |
| Development Authority, IDR | | | | | |
| (Seaboard Tampa Terminals | | | | | |
| Venture Project) (LOC; Wells | | | | | |
| Fargo Bank) | 0.50 | 6/7/11 | 4,000,000 | a | 4,000,000 |
| Orange County Health Facilities | | | | | |
| Authority, HR (Orlando Regional | | | | | |
| Healthcare System) (LOC; Branch | | | | | |
| Banking and Trust Co.) | 0.19 | 6/7/11 | 2,500,000 | a | 2,500,000 |
| Polk County Industrial Development | | | | | |
| Authority, IDR (Florida | | | | | |
| Treatt, Inc. Project) (LOC; | | | | | |
| Bank of America) | 0.40 | 6/7/11 | 2,835,000 | a | 2,835,000 |
8
| | | | | |
| Short-Term | Coupon | Maturity | Principal | | |
| Investments (continued) | Rate (%) | Date | Amount ($) | | Value ($) |
| Florida (continued) | | | | | |
| Sunshine State Governmental | | | | | |
| Financing Commission, Revenue | | | | | |
| (LOC; Dexia Credit Locale) | 0.60 | 6/7/11 | 1,315,000 | a | 1,315,000 |
| Georgia—3.9% | | | | | |
| Atlanta, | | | | | |
| Airport Revenue, CP (LOC; | | | | | |
| Wells Fargo Bank) | 0.27 | 9/16/11 | 6,000,000 | | 6,000,000 |
| Floyd County Development | | | | | |
| Authority, Revenue (Berry | | | | | |
| College Project) (LOC; FHLB) | 0.18 | 6/7/11 | 6,000,000 | a | 6,000,000 |
| Metropolitan Atlanta Rapid Transit | | | | | |
| Authority, Sales Tax Revenue, | | | | | |
| CP (Liquidity Facility; Wells | | | | | |
| Fargo Bank) | 0.32 | 6/10/11 | 3,000,000 | | 3,000,000 |
| Municipal Electric Authority of | | | | | |
| Georgia, CP (LOC; Barclays | | | | | |
| Bank PLC) | 0.30 | 6/9/11 | 3,500,000 | | 3,500,000 |
| Illinois—2.6% | | | | | |
| Chicago, | | | | | |
| GO Notes (Project and | | | | | |
| Refunding Series) (Liquidity | | | | | |
| Facility; JPMorgan Chase Bank) | 0.13 | 6/1/11 | 3,000,000 | a | 3,000,000 |
| Chicago, | | | | | |
| GO Notes (Project and | | | | | |
| Refunding Series) (Liquidity | | | | | |
| Facility; JPMorgan Chase Bank) | 0.13 | 6/1/11 | 2,000,000 | a | 2,000,000 |
| Southwestern Illinois Development | | | | | |
| Authority, Solid Waste | | | | | |
| Disposal Facilities Revenue | | | | | |
| (Center Ethanol Company, LLC | | | | | |
| Project) (LOC; FHLB) | 0.45 | 6/7/11 | 7,370,000 | a | 7,370,000 |
| Indiana—.7% | | | | | |
| Puttable Floating Option Tax | | | | | |
| Exempt Receipts (Indiana | | | | | |
| Health Facility Financing | | | | | |
| Authority, Hospital Improvement | | | | | |
| Revenue, Refunding (Community | | | | | |
| Hospitals Projects)) (Liquidity | | | | | |
| Facility; Bank of America and | | | | | |
| LOC; Bank of America) | 0.33 | 6/7/11 | 3,380,000 | a,b | 3,380,000 |
STATEMENT OF INVESTMENTS (continued)
| | | | | |
| Short-Term | Coupon | Maturity | Principal | | |
| Investments (continued) | Rate (%) | Date | Amount ($) | | Value ($) |
| Iowa—1.3% | | | | | |
| Iowa Finance Authority, | | | | | |
| SWDR (MidAmerican | | | | | |
| Energy Project) | 0.30 | 6/7/11 | 6,000,000 | a | 6,000,000 |
| Kentucky—.6% | | | | | |
| Kentucky Rural Water Finance | | | | | |
| Corporation, Public Projects | | | | | |
| Construction Notes | 1.50 | 12/1/11 | 3,000,000 | | 3,012,718 |
| Louisiana—2.1% | | | | | |
| Ascension Parish, | | | | | |
| Revenue, CP (BASF SE) | 0.42 | 7/14/11 | 1,000,000 | | 1,000,000 |
| Ascension Parish Industrial | | | | | |
| Development Board, Revenue | | | | | |
| (International Matex Tank | | | | | |
| Terminals—Geismar Project) | | | | | |
| (LOC; FHLB) | 0.18 | 6/7/11 | 9,000,000 | a | 9,000,000 |
| Maryland—.2% | | | | | |
| Baltimore County, | | | | | |
| Revenue, Refunding (Shade Tree | | | | | |
| Trace Apartments Facility) | | | | | |
| (LOC; M&T Trust) | 0.25 | 6/7/11 | 1,100,000 | a | 1,100,000 |
| Massachusetts—4.6% | | | | | |
| Massachusetts Development Finance | | | | | |
| Agency, Revenue, Refunding | | | | | |
| (Wentworth Institute of | | | | | |
| Technology Issue) (LOC; | | | | | |
| JPMorgan Chase Bank) | 0.19 | 6/7/11 | 18,800,000 | a | 18,800,000 |
| Northampton, | | | | | |
| GO Notes, BAN | 1.50 | 2/10/12 | 3,000,000 | | 3,017,504 |
| Michigan—1.1% | | | | | |
| Michigan, | | | | | |
| GO Notes | 2.00 | 9/30/11 | 5,000,000 | | 5,025,960 |
| Missouri—.3% | | | | | |
| Missouri Development Finance | | | | | |
| Board, LR (Missouri | | | | | |
| Association of Municipal | | | | | |
| Utilities Lease Financing | | | | | |
| Program) (LOC: U.S. Bank NA) | 0.13 | 6/1/11 | 1,400,000 | a | 1,400,000 |
10
| | | | | |
| Short-Term | Coupon | Maturity | Principal | | |
| Investments (continued) | Rate (%) | Date | Amount ($) | | Value ($) |
| Nevada—1.2% | | | | | |
| Las Vegas Valley Water District, | | | | | |
| CP (Liquidity Facility; | | | | | |
| JPMorgan Chase Bank) | 0.26 | 10/6/11 | 5,890,000 | | 5,890,000 |
| New Hampshire—1.8% | | | | | |
| New Hampshire Health and | | | | | |
| Education Facilities Authority, HR | | | | | |
| (Catholic Medical Center | | | | | |
| Issue) (LOC; FHLB) | 0.20 | 6/7/11 | 8,500,000 | a | 8,500,000 |
| New Jersey—3.6% | | | | | |
| Montclair Township, | | | | | |
| Temporary Notes | 1.50 | 3/9/12 | 2,100,000 | | 2,107,999 |
| New Jersey Turnpike Authority, | | | | | |
| Turnpike Revenue (Insured; | | | | | |
| Assured Guaranty Municipal | | | | | |
| Corp. and Liquidity Facility; | | | | | |
| Westdeutsche Landesbank) | 0.38 | 6/7/11 | 15,000,000 | a | 15,000,000 |
| New York—6.9% | | | | | |
| JPMorgan Chase Putter/Drivers | | | | | |
| Trust (New York City | | | | | |
| Transitional Finance | | | | | |
| Authority, Future Tax | | | | | |
| Secured Revenue, Refunding) | | | | | |
| (Liquidity Facility; | | | | | |
| JPMorgan Chase Bank) | 0.15 | 6/1/11 | 13,000,000 | a,b | 13,000,000 |
| Long Island Power Authority, | | | | | |
| Electric System Subordinated | | | | | |
| Revenue (LOC: Bayerische | | | | | |
| Landesbank and Westdeutsche | | | | | |
| Landesbank) | 0.15 | 6/1/11 | 4,000,000 | a | 4,000,000 |
| New York Liberty Development | | | | | |
| Corporation, Liberty Revenue | | | | | |
| (World Trade Center Project) | 0.35 | 2/1/12 | 6,000,000 | | 6,000,000 |
| New York Local Government | | | | | |
| Assistance Corporation, | | | | | |
| Subordinate Lien Revenue, | | | | | |
| Refunding (Liquidity Facility; | | | | | |
| Bank of America) | 0.16 | 6/7/11 | 8,000,000 | a | 8,000,000 |
STATEMENT OF INVESTMENTS (continued)
| | | | | |
| Short-Term | Coupon | Maturity | Principal | | |
| Investments (continued) | Rate (%) | Date | Amount ($) | | Value ($) |
| New York (continued) | | | | | |
| New York State Thruway Authority, | | | | | |
| General Revenue, BAN | 4.00 | 7/15/11 | 1,725,000 | | 1,732,568 |
| North Carolina—1.1% | | | | | |
| North Carolina Medical Care | | | | | |
| Commission, Health Care | | | | | |
| Facility Revenue (Merlots | | | | | |
| Program) (Providence Place | | | | | |
| Retirement Community Nursing | | | | | |
| Home Project) (Liquidity | | | | | |
| Facility; Wells Fargo Bank | | | | | |
| and LOC; GNMA) | 0.19 | 6/7/11 | 2,150,000 | a,b | 2,150,000 |
| North Carolina Medical Care | | | | | |
| Commission, HR (Randolph | | | | | |
| Hospital) (LOC; Bank of America) | 0.15 | 6/1/11 | 3,150,000 | a | 3,150,000 |
| Ohio—1.7% | | | | | |
| Columbus, | | | | | |
| Sewerage System Revenue | | | | | |
| (Putters Program) (Liquidity | | | | | |
| Facility; JPMorgan Chase Bank) | 0.18 | 6/7/11 | 1,400,000 | a,b | 1,400,000 |
| Cuyahoga County, | | | | | |
| IDR (King Nut Project) (LOC; | | | | | |
| National City Bank) | 0.27 | 6/7/11 | 2,365,000 | a | 2,365,000 |
| Cuyahoga County, | | | | | |
| IDR (King Nut Project) (LOC; | | | | | |
| National City Bank) | 0.27 | 6/7/11 | 2,310,000 | a | 2,310,000 |
| Ohio, | | | | | |
| HR (Cleveland Clinic Health | | | | | |
| System Obligated Group) | 0.10 | 6/1/11 | 1,100,000 | a | 1,100,000 |
| Union Township, | | | | | |
| GO Notes, BAN (Various Purpose) | 1.25 | 9/13/11 | 1,100,000 | | 1,101,553 |
| Pennsylvania—12.8% | | | | | |
| Berks County Municipal Authority, | | | | | |
| Revenue (The Reading Hospital | | | | | |
| and Medical Center Project) | 0.38 | 7/14/11 | 4,600,000 | | 4,600,000 |
| Emmaus General Authority, | | | | | |
| Local Government Revenue (Bond | | | | | |
| Pool Program) (LOC; U.S. Bank NA) | 0.20 | 6/7/11 | 13,600,000 | a | 13,600,000 |
| Franklin County Industrial | | | | | |
| Development Authority, Revenue | | | | | |
| (James and Donna Martin Project) | | | | | |
| (LOC; Wells Fargo Bank) | 0.40 | 6/7/11 | 1,000,000 | a | 1,000,000 |
12
| | | | | |
| Short-Term | Coupon | Maturity | Principal | | |
| Investments (continued) | Rate (%) | Date | Amount ($) | | Value ($) |
| Pennsylvania (continued) | | | | | |
| Horizon Hospital System Authority, | | | | | |
| Senior Health and Housing | | | | | |
| Facilities Revenue (Saint Paul | | | | | |
| Homes Project) (LOC; M&T Trust) | 0.23 | 6/7/11 | 1,500,000 | a | 1,500,000 |
| Montgomery County Higher Education | | | | | |
| and Health Authority, Revenue | | | | | |
| (Pennsylvania Higher Education | | | | | |
| and Health Loan Program) | | | | | |
| (LOC; M&T Trust) | 0.23 | 6/7/11 | 4,720,000 | a | 4,720,000 |
| Montgomery County Industrial | | | | | |
| Development Authority, Revenue | | | | | |
| (Abington Friends School Project) | | | | | |
| (LOC; Wells Fargo Bank) | 0.18 | 6/7/11 | 4,875,000 | a | 4,875,000 |
| Pennsylvania Economic Development | | | | | |
| Financing Authority, Revenue | | | | | |
| (Evergreen Community Power | | | | | |
| Facility) (LOC; M&T Trust) | 0.33 | 6/7/11 | 15,000,000 | a | 15,000,000 |
| Pennsylvania Housing Finance | | | | | |
| Agency, SFMR (LOC; | | | | | |
| Barclays Bank PLC) | 0.16 | 6/7/11 | 10,350,000 | a | 10,350,000 |
| RBC Municipal Products Inc. Trust | | | | | |
| (Allegheny County Hospital | | | | | |
| Development Authority, Revenue | | | | | |
| (University of Pittsburgh | | | | | |
| Medical Center)) (Liquidity | | | | | |
| Facility; Royal Bank of Canada | | | | | |
| and LOC; Royal Bank of Canada) | 0.18 | 6/7/11 | 5,500,000 | a,b | 5,500,000 |
| Tennessee—3.7% | | | | | |
| Clarksville Public Building Authority, | | | | | |
| Pooled Financing Revenue | | | | | |
| (Tennessee Municipal Bond | | | | | |
| Fund) (LOC; Bank of America) | 0.15 | 6/1/11 | 2,060,000 | a | 2,060,000 |
| Metropolitan Government of Nashville | | | | | |
| and Davidson County Health and | | | | | |
| Educational Facilities Board, | | | | | |
| Revenue, Refunding (Belmont | | | | | |
| University Project) (LOC; FHLB) | 0.18 | 6/7/11 | 6,000,000 | a | 6,000,000 |
| Tennergy Corporation, | | | | | |
| Gas Revenue (Putters Program) | | | | | |
| (Liquidity Facility; JPMorgan | | | | | |
| Chase Bank) | 0.23 | 6/7/11 | 4,770,000 | a,b | 4,770,000 |
STATEMENT OF INVESTMENTS (continued)
| | | | | |
| Short-Term | Coupon | Maturity | Principal | | |
| Investments (continued) | Rate (%) | Date | Amount ($) | | Value ($) |
| Tennessee (continued) | | | | | |
| Tennergy Corporation, | | | | | |
| Gas Revenue (Putters Program) | | | | | |
| (LOC; BNP Paribas) | 0.23 | 6/7/11 | 4,860,000 | a,b | 4,860,000 |
| Texas—13.9% | | | | | |
| Harris County Health Facilities | | | | | |
| Development Corporation, | | | | | |
| Revenue (Saint Luke’s | | | | | |
| Episcopal Hospital) (Liquidity | | | | | |
| Facility: Bank of America, | | | | | |
| JPMorgan Chase Bank and | | | | | |
| Northern Trust Co.) | 0.13 | 6/1/11 | 2,650,000 | a | 2,650,000 |
| Jefferson County Industrial | | | | | |
| Development Corporation, | | | | | |
| Hurricane Ike Disaster Area | | | | | |
| Revenue (Jefferson Refinery, | | | | | |
| LLC Project) (LOC; Branch | | | | | |
| Banking and Trust Co.) | 0.55 | 6/30/11 | 8,700,000 | | 8,700,000 |
| Port of Port Arthur Navigation | | | | | |
| District, Revenue, CP (BASF SE) | 0.42 | 7/14/11 | 2,000,000 | | 2,000,000 |
| RBC Municipal Products Inc. Trust | | | | | |
| (Houston, Combined Utility | | | | | |
| System First Lien Revenue, | | | | | |
| Refunding) (Liquidity | | | | | |
| Facility; Royal Bank of Canada | | | | | |
| and LOC; Royal Bank of Canada) | 0.18 | 6/7/11 | 4,000,000 | a,b | 4,000,000 |
| San Antonio, | | | | | |
| Water System Revenue, CP | | | | | |
| (Liquidity Facility: Bank of | | | | | |
| America, State Street Bank and | | | | | |
| Trust Co. and U.S. Bank NA) | 0.32 | 7/13/11 | 13,600,000 | | 13,600,000 |
| Texas, | | | | | |
| GO Notes (Veterans’ Housing | | | | | |
| Assistance Program) (Liquidity | | | | | |
| Facility; State Street Bank | | | | | |
| and Trust Co.) | 0.23 | 6/7/11 | 9,000,000 | a | 9,000,000 |
14
| | | | | |
| Short-Term | Coupon | Maturity | Principal | | |
| Investments (continued) | Rate (%) | Date | Amount ($) | | Value ($) |
| Texas (continued) | | | | | |
| Texas, | | | | | |
| TRAN | 2.00 | 8/31/11 | 12,855,000 | | 12,908,262 |
| Texas Department of Housing and | | | | | |
| Community Affairs, SFMR | 0.20 | 6/7/11 | 8,235,000 | a | 8,235,000 |
| Texas Municipal Power Agency, | | | | | |
| Revenue, CP (LOC: Bank of America | | | | | |
| and JPMorgan Chase Bank) | 0.30 | 8/9/11 | 5,000,000 | | 5,000,000 |
| Washington—.7% | | | | | |
| Pierce County Economic Development | | | | | |
| Corporation, Industrial | | | | | |
| Revenue (SeaTac Packaging | | | | | |
| Project) (LOC; HSBC Bank USA) | 0.30 | 6/7/11 | 3,390,000 | a | 3,390,000 |
| Wisconsin—.5% | | | | | |
| Wisconsin Rural Water Construction | | | | | |
| Loan Program Commission, | | | | | |
| Revenue, BAN | 1.50 | 11/1/11 | 2,550,000 | | 2,559,549 |
| |
| Total Investments (cost $456,256,218) | | | 95.8% | | 456,256,218 |
| Cash and Receivables (Net) | | | 4.2% | | 19,953,863 |
| Net Assets | | | 100.0% | | 476,210,081 |
|
| a Variable rate demand note—rate shown is the interest rate in effect at May 31, 2011. Maturity date represents the |
| next demand date, or the ultimate maturity date if earlier. |
| b Securities exempt from registration under Rule 144A of the Securities Act of 1933.These securities may be resold in |
| transactions exempt from registration, normally to qualified institutional buyers.At May 31, 2011, these securities |
| amounted to $67,445,000 or 14.2% of net assets. |
STATEMENT OF INVESTMENTS (continued)
| | | |
| Summary of Abbreviations | | |
| |
| ABAG | Association of Bay Area Governments | ACA | American Capital Access |
| AGC | ACE Guaranty Corporation | AGIC | Asset Guaranty Insurance Company |
| AMBAC | American Municipal Bond | ARRN | Adjustable Rate Receipt Notes |
| | Assurance Corporation | | |
| BAN | Bond Anticipation Notes | BPA | Bond Purchase Agreement |
| CIFG | CDC Ixis Financial Guaranty | COP | Certificate of Participation |
| CP | Commercial Paper | EDR | Economic Development Revenue |
| EIR | Environmental Improvement Revenue | FGIC | Financial Guaranty Insurance |
| | | | Company |
| FHA | Federal Housing Administration | FHLB | Federal Home Loan Bank |
| FHLMC | Federal Home Loan Mortgage | FNMA | Federal National |
| | Corporation | | Mortgage Association |
| GAN | Grant Anticipation Notes | GIC | Guaranteed Investment Contract |
| GNMA | Government National | GO | General Obligation |
| | Mortgage Association | | |
| HR | Hospital Revenue | IDB | Industrial Development Board |
| IDC | Industrial Development Corporation | IDR | Industrial Development Revenue |
| LOC | Letter of Credit | LOR | Limited Obligation Revenue |
| LR | Lease Revenue | MFHR | Multi-Family Housing Revenue |
| MFMR | Multi-Family Mortgage Revenue | PCR | Pollution Control Revenue |
| PILOT | Payment in Lieu of Taxes | PUTTERS Puttable Tax-Exempt Receipts |
| RAC | Revenue Anticipation Certificates | RAN | Revenue Anticipation Notes |
| RAW | Revenue Anticipation Warrants | RRR | Resources Recovery Revenue |
| SAAN | State Aid Anticipation Notes | SBPA | Standby Bond Purchase Agreement |
| SFHR | Single Family Housing Revenue | SFMR | Single Family Mortgage Revenue |
| SONYMA | State of New York Mortgage Agency | SWDR | Solid Waste Disposal Revenue |
| TAN | Tax Anticipation Notes | TAW | Tax Anticipation Warrants |
| TRAN | Tax and Revenue Anticipation Notes | XLCA | XL Capital Assurance |
16
| | | | | |
| Summary of Combined Ratings (Unaudited) | |
| |
| Fitch | or | Moody’s | or | Standard & Poor’s | Value (%)† |
| F1+,F1 | | VMIG1,MIG1,P1 | | SP1+,SP1,A1+,A1 | 88.8 |
| AAA,AA,Ac | | Aaa,Aa,Ac | | AAA,AA,Ac | 8.4 |
| Not Ratedd | | Not Ratedd | | Not Ratedd | 2.8 |
| | | | | | 100.0 |
|
| † Based on total investments. |
| c Notes which are not F, MIG and SP rated are represented by bond ratings of the issuers. |
| d Securities which, while not rated by Fitch, Moody’s and Standard & Poor’s, have been determined by the Manager to |
| be of comparable quality to those rated securities in which the fund may invest. |
See notes to financial statements.
|
| STATEMENT OF ASSETS AND LIABILITIES |
| May 31, 2011 |
| | |
| | Cost | Value |
| Assets ($): | | |
| Investments in securities—See Statement of Investments | 456,256,218 | 456,256,218 |
| Cash | | 1,623,431 |
| Receivable for investment securities sold | | 30,141,510 |
| Interest receivable | | 537,234 |
| Prepaid expenses | | 37,840 |
| | | 488,596,233 |
| Liabilities ($): | | |
| Due to The Dreyfus Corporation and affiliates—Note 2(b) | | 106,985 |
| Payable for investment securities purchased | | 12,046,032 |
| Payable for shares of Common Stock redeemed | | 124,048 |
| Accrued expenses | | 109,087 |
| | | 12,386,152 |
| Net Assets ($) | | 476,210,081 |
| Composition of Net Assets ($): | | |
| Paid-in capital | | 476,210,081 |
| Net Assets ($) | | 476,210,081 |
| Shares Outstanding | | |
| (5 billion shares of $.001 par value Common Stock authorized) | | 476,245,547 |
| Net Asset Value, offering and redemption price per share ($) | | 1.00 |
| |
| See notes to financial statements. | | |
18
|
| STATEMENT OF OPERATIONS |
| Year Ended May 31, 2011 |
| |
| Investment Income ($): | |
| Interest Income | 1,743,796 |
| Expenses: | |
| Management fee—Note 2(a) | 2,468,395 |
| Shareholder servicing costs—Note 2(b) | 390,111 |
| Professional fees | 77,568 |
| Prospectus and shareholders’ reports | 66,577 |
| Directors’ fees and expenses—Note 2(c) | 61,182 |
| Registration fees | 56,814 |
| Custodian fees—Note 2(b) | 55,956 |
| Miscellaneous | 27,658 |
| Total Expenses | 3,204,261 |
| Less—reduction in expenses due to undertaking—Note 2(a) | (1,706,603) |
| Less—reduction in fees due to earnings credits—Note 2(b) | (595) |
| Net Expenses | 1,497,063 |
| Investment Income—Net, representing net increase | |
| in net assets resulting from operations | 246,733 |
| |
| See notes to financial statements. | |
STATEMENT OF CHANGES IN NET ASSETS
| | |
| | | Year Ended May 31, |
| | 2011 | 2010 |
| Operations ($): | | |
| Investment income—net | 246,733 | 493,837 |
| Net realized gain (loss) on investments | — | 322 |
| Net Increase (Decrease) in Net Assets | | |
| Resulting from Operations | 246,733 | 494,159 |
| Dividends to Shareholders from ($): | | |
| Investment income—net | (246,733) | (493,837) |
| Capital Stock Transactions ($1.00 per share): | | |
| Net proceeds from shares sold | 807,809,576 | 937,052,564 |
| Capital contribution from affiliate† | 1,727,964 | — |
| Dividends reinvested | 201,761 | 272,139 |
| Cost of shares redeemed | (841,931,097) | (1,401,806,330) |
| Increase (Decrease) in Net Assets | | |
| from Capital Stock Transactions | (32,191,796) | (464,481,627) |
| Total Increase (Decrease) in Net Assets | (32,191,796) | (464,481,305) |
| Net Assets ($): | | |
| Beginning of Period | 508,401,877 | 972,883,182 |
| End of Period | 476,210,081 | 508,401,877 |
| |
| See notes to financial statements. | | |
| † See Note 2(d). | | |
20
FINANCIAL HIGHLIGHTS
The following table describes the performance for the fiscal periods indicated. Total return shows how much your investment in the fund would have increased (or decreased) during each period, assuming you had reinvested all dividends and distributions.These figures have been derived from the fund’s financial statements.
| | | | | |
| | | Year Ended May 31, | |
| | 2011 | 2010 | 2009 | 2008 | 2007 |
| Per Share Data ($): | | | | | |
| Net asset value, beginning of period | 1.00 | 1.00 | 1.00 | 1.00 | 1.00 |
| Investment Operations: | | | | | |
| Investment income—net | .001 | .001 | .012 | .028 | .031 |
| Distributions: | | | | | |
| Dividends from | | | | | |
| investment income—net | (.001) | (.001) | (.012) | (.028) | (.031) |
| Net asset value, end of period | 1.00 | 1.00 | 1.00 | 1.00 | 1.00 |
| Total Return (%) | .05 | .07 | 1.23 | 2.84 | 3.14 |
| Ratios/Supplemental Data (%): | | | | | |
| Ratio of total expenses | | | | | |
| to average net assets | .65 | .62 | .61 | .59 | .59 |
| Ratio of net expenses | | | | | |
| to average net assets | .30 | .45 | .61 | .58 | .58 |
| Ratio of net investment income | | | | | |
| to average net assets | .05 | .07 | 1.24 | 2.74 | 3.10 |
| Net Assets, end of period | | | | | |
| ($ x 1,000) | 476,210 | 508,402 | 972,883 | 1,025,116 | 779,746 |
| |
| See notes to financial statements. | | | | | |
NOTES TO FINANCIAL STATEMENTS
NOTE 1—Significant Accounting Policies:
Dreyfus Municipal Money Market Fund, Inc. (the “fund”) is registered under the Investment Company Act of 1940, as amended (the “Act”), as a diversified open-end management investment company.The fund’s investment objective is to seek as high a level of current income exempt from federal income tax as is consistent with the preservation of capital and the maintenance of liquidity. The Dreyfus Corporation (the “Manager” or “Dreyfus”), a wholly-owned subsidiary of The Bank of New York Mellon Corporation (“BNY Mellon”), serves as the fund’s investment adviser. MBSC Securities Corporation (the “Distributor”), a wholly-owned subsidiary of the Manager, is the distributor of the fund’s shares, which are sold without a sales charge.
It is the fund’s policy to maintain a continuous net asset value per share of $1.00; the fund has adopted certain investment, portfolio valuation, and dividend and distribution policies to enable it to do so. There is no, assurance, however, that the fund will be able to maintain a stable net asset value per share of $1.00.
The Financial Accounting Standards Board (“FASB”) Accounting Standards Codification (“ASC”) is the exclusive reference of authoritative U.S. generally accepted accounting principles (“GAAP”) recognized by the FASB to be applied by nongovernmental entities. Rules and interpretive releases of the Securities and Exchange Commission (“SEC”) under authority of federal laws are also sources of authoritative GAAP for SEC registrants. The fund’s financial statements are prepared in accordance with GAAP, which may require the use of management estimates and assumptions.Actual results could differ from those estimates.
The fund enters into contracts that contain a variety of indemnifications. The fund’s maximum exposure under these arrangements is unknown.The fund does not anticipate recognizing any loss related to these arrangements.
22
(a) Portfolio valuation: Investments in securities are valued at amortized cost in accordance with Rule 2a-7 of the Act, which has been determined by the Board of Directors to represent the fair value of the fund’s investments.
The fair value of a financial instrument is the amount that would be received to sell an asset or paid to transfer a liability in an orderly transaction between market participants at the measurement date (i.e. the exit price). GAAP establishes a fair value hierarchy that prioritizes the inputs of valuation techniques used to measure fair value.This hierarchy gives the highest priority to unadjusted quoted prices in active markets for identical assets or liabilities (Level 1 measurements) and the lowest priority to unobservable inputs (Level 3 measurements).
Additionally, GAAP provides guidance on determining whether the volume and activity in a market has decreased significantly and whether such a decrease in activity results in transactions that are not orderly. GAAP requires enhanced disclosures around valuation inputs and techniques used during annual and interim periods.
Various inputs are used in determining the value of the fund’s investments relating to fair value measurements.These inputs are summarized in the three broad levels listed below:
Level 1—unadjusted quoted prices in active markets for identical investments.
Level 2—other significant observable inputs (including quoted prices for similar investments, interest rates, prepayment speeds, credit risk, etc.).
Level 3—significant unobservable inputs (including the fund’s own assumptions in determining the fair value of investments).
The inputs or methodology used for valuing securities are not necessarily an indication of the risk associated with investing in those securities.
NOTES TO FINANCIAL STATEMENTS (continued)
For example, money market securities are valued using amortized cost, in accordance with rules under the Act. Generally, amortized cost approximates the current fair value of a security, but since the value is not obtained from a quoted price in an active market, such securities are reflected as Level 2.
The following is a summary of the inputs used as of May 31, 2011 in valuing the fund’s investments:
| |
| | Short-Term |
| Valuation Inputs | Investments ($)† |
| Level 1—Unadjusted Quoted Prices | — |
| Level 2—Other Significant Observable Inputs | 456,256,218 |
| Level 3—Significant Unobservable Inputs | — |
| Total | 456,256,218 |
| |
| † | See Statement of Investments for additional detailed categorizations. |
(b) Securities transactions and investment income: Securities transactions are recorded on a trade date basis. Interest income, adjusted for accretion of discount and amortization of premium on investments, is earned from settlement date and recognized on the accrual basis. Realized gains and losses from securities transactions are recorded on the identified cost basis. Cost of investments represents amortized cost.
(c) Dividends to shareholders: It is the policy of the fund to declare dividends daily from investment income-net. Such dividends are paid monthly. Dividends from net realized capital gains, if any, are normally declared and paid annually, but the fund may make distributions on a more frequent basis to comply with the distribution requirements of the Internal Revenue Code of 1986, as amended (the “Code”).To the extent that net realized capital gains can be offset by capital loss carryovers, it is the policy of the fund not to distribute such gains.
(d) Federal income taxes: It is the policy of the fund to continue to qualify as a regulated investment company, which can distribute tax exempt dividends, by complying with the applicable provisions of the Code, and to make distributions of income and net realized capital gain sufficient to relieve it from substantially all federal income and excise taxes.
24
As of and during the period ended May 31, 2011, the fund did not have any liabilities for any uncertain tax positions.The fund recognizes interest and penalties, if any, related to uncertain tax positions as income tax expense in the Statement of Operations. During the period, the fund did not incur any interest or penalties.
Each of the tax years in the four-year period ended May 31, 2011 remains subject to examination by the Internal Revenue Service and state taxing authorities.
At May 31, 2011, the components of accumulated earnings on a tax basis were substantially the same as for financial reporting purposes.
The tax character of distributions paid to shareholders during the fiscal periods ended May 31, 2011 and May 31, 2010 were all tax exempt income.
During the period ended May 31, 2011, as a result of permanent book to tax differences, primarily due to capital contributions from an affiliate, the fund increased accumulated net realized gain (loss) on investments by $19,115 and decreased paid in capital by the same amount. Net assets and net asset value per share were not affected by this reclassification.
At May 31, 2011, the cost of investments for federal income tax purposes was substantially the same as the cost for financial reporting purposes (see the Statement of Investments).
NOTE 2—Management Fee and Other Transactions With Affiliates:
(a) Pursuant to a management agreement with the Manager, the management fee is computed at the annual rate of .50% of the value of the fund’s average daily net assets and is payable monthly.
The Manager has undertaken to reimburse expenses in the event that current yields drop below a certain level. Such expense limitations may fluctuate daily, are voluntary and not contractual and may be terminated at any time. The reduction in expenses, pursuant to the undertaking, amounted to $1,706,603 during the period ended May 31, 2011.
NOTES TO FINANCIAL STATEMENTS (continued)
(b) Under the Shareholder Services Plan, the fund reimburses the Distributor an amount not to exceed an annual rate of .25% of the value of the fund’s average daily net assets for certain allocated expenses of providing personal services and/or maintaining shareholder accounts. The services provided may include personal services relating to shareholder accounts, such as answering shareholder inquiries regarding the fund and providing reports and other information, and services related to the maintenance of shareholder accounts. During the period ended May 31, 2011, the fund was charged $236,337 pursuant to the Shareholder Services Plan.
The fund compensates Dreyfus Transfer, Inc., a wholly-owned subsidiary of the Manager, under a transfer agency agreement for providing personnel and facilities to perform transfer agency services for the fund. During the period ended May 31, 2011, the fund was charged $97,299 pursuant to the transfer agency agreement, which is included in Shareholder servicing costs in the Statement of Operations.
The fund has arrangements with the custodian and cash management bank whereby the fund may receive earnings credits when positive cash balances are maintained, which are used to offset custody and cash management fees. For financial reporting purposes, the fund includes net earnings credits as an expense offset in the Statement of Operations.
The fund compensates The Bank of New York Mellon, a subsidiary of BNY Mellon and an affiliate of Dreyfus, under a cash management agreement for performing cash management services related to fund subscriptions and redemptions. During the period ended May 31, 2011, the fund was charged $10,405 pursuant to the cash management agreement, which is included in Shareholder servicing costs in the Statement of Operations.These fees were partially offset by earnings credits of $595.
The fund also compensates The Bank of New York Mellon under a custody agreement for providing custodial services for the fund. During the period ended May 31, 2011, the fund was charged $55,956 pursuant to the custody agreement.
26
During the period ended May 31, 2011, the fund was charged $6,387 for services performed by the Chief Compliance Officer.
The components of “Due to The Dreyfus Corporation and affiliates” in the Statement of Assets and Liabilities consist of: management fees $209,713, shareholder services plan fees $19,000, custodian fees $18,450, chief compliance officer fees $3,006 and transfer agency per account fees $15,200, which are offset against an expense reimbursement currently in effect in the amount of $158,384.
(c) Each Board member also serves as a Board member of other funds within the Dreyfus complex. Annual retainer fees and attendance fees are allocated to each fund based on net assets.
(d) During the period ended May 31, 2011, BNY Mellon made voluntary capital contributions of $1,727,964 to the fund. These contributions were made to reimburse the fund for previous realized losses experienced by the fund.
NOTE 3—Securities Transactions:
The fund is permitted to purchase or sell securities from or to certain affiliated funds under specified conditions outlined in procedures adopted by the Board of Directors.The procedures have been designed to ensure that any purchase or sale of securities by the fund from or to another fund or portfolio that are, or could be, considered an affiliate by virtue of having a common investment adviser (or affiliated investment adviser), common Director and/or common officers, complies with Rule 17a-7 of the Act. During the period ended May 31, 2011, the fund engaged in purchases and sales of securities pursuant to Rule 17a-7 of the Act amounting to $338,890,000 and $217,400,000, respectively.
REPORT OF INDEPENDENT REGISTERED
PUBLIC ACCOUNTING FIRM
Shareholders and Board of Directors Dreyfus Municipal Money Market Fund, Inc.
We have audited the accompanying statement of assets and liabilities of Dreyfus Municipal Money Market Fund, Inc., including the statement of investments, as of May 31, 2011, and the related statement of operations for the year then ended, the statement of changes in net assets for each of the two years in the period then ended, and financial highlights for each of the years indicated therein. These financial statements and financial highlights are the responsibility of the fund’s management. Our responsibility is to express an opinion on these financial statements and financial highlights based on our audits.
We conducted our audits in accordance with the standards of the Public Company Accounting Oversight Board (United States).Those standards require that we plan and perform the audit to obtain reasonable assurance about whether the financial statements and financial highlights are free of material misstatement.We were not engaged to perform an audit of the Fund’s internal control over financial reporting. Our audits included consideration of internal control over financial reporting as a basis for designing audit procedures that are appropriate in the circumstances, but not for the purpose of expressing an opinion on the effectiveness of the Fund’s internal control over financial reporting.Accordingly, we express no such opinion. An audit also includes examining, on a test basis, evidence supporting the amounts and disclosures in the financial statements and financial highlights, assessing the accounting principles used and significant estimates made by management, and evaluating the overall financial statement presentation. Our procedures included confirmation of securities owned as of May 31, 2011 by correspondence with the custodian and others.We believe that our audits provide a reasonable basis for our opinion.
In our opinion, the financial statements and financial highlights referred to above present fairly, in all material respects, the financial position of Dreyfus Municipal Money Market Fund, Inc. at May 31, 2011, the results of its operations for the year then ended, the changes in its net assets for each of the two years in the period then ended, and the financial highlights for each of the indicated years, in conformity with U.S. generally accepted accounting principles.

New York, New York
July 26, 2011
28
IMPORTANT TAX INFORMATION (Unaudited)
In accordance with federal tax law, the fund hereby designates all the dividends paid from investment income-net during the fiscal year ended May 31, 2011 as “exempt-interest dividends” (not generally subject to regular federal income tax). Where required by federal tax law rules, shareholders will receive notification of their portion of the fund’s exempt-interest dividends paid for the 2011 calendar year on Form 1099-INT, which will be mailed in early 2012.
BOARD MEMBERS INFORMATION (Unaudited)
|
| Joseph S. DiMartino (67) |
| Chairman of the Board (1995) |
| Principal Occupation During Past 5Years: |
| • Corporate Director and Trustee |
| Other Public Company Board Memberships During Past 5Years: |
| • CBIZ (formerly, Century Business Services, Inc.), a provider of outsourcing functions for small |
| and medium size companies, Director (1997-present) |
| • Sunair Services Corporation, a provider of certain outdoor-related services to homes and |
| businesses, Director (2005-2009) |
| • The Newark Group, a provider of a national market of paper recovery facilities, paperboard |
| mills and paperboard converting plants, Director (2000-2010) |
| No. of Portfolios for which Board Member Serves: 170 |
| ——————— |
| David W. Burke (75) |
| Board Member (1980) |
| Principal Occupation During Past 5Years: |
| • Corporate Director and Trustee |
| No. of Portfolios for which Board Member Serves: 84 |
| ——————— |
| William Hodding Carter III (76) |
| Board Member (1988) |
| Principal Occupation During Past 5Years: |
| • Professor of Leadership & Public Policy, University of North Carolina, Chapel Hill (2006-present) |
| • President and Chief Executive Officer of the John S. and James L. Knight Foundation (1998-2006) |
| No. of Portfolios for which Board Member Serves: 29 |
| ——————— |
| Gordon J. Davis (69) |
| Board Member (2006) |
| Principal Occupation During Past 5Years: |
| • Partner in the law firm of Dewey & LeBoeuf LLP |
| Other Public Company Board Memberships During Past 5Years: |
| • Consolidated Edison, Inc., a utility company, Director (1997-present) |
| • The Phoenix Companies, Inc., a life insurance company, Director (2000-present) |
| No. of Portfolios for which Board Member Serves: 45 |
30
|
| Joni Evans (69) |
| Board Member (2006) |
| Principal Occupation During Past 5Years: |
| • Chief Executive Officer, www.wowOwow.com an online community dedicated to women’s |
| conversations and publications (2007-present) |
| • Principal, Joni Evans Ltd. (publishing) (2006-present) |
| • Senior Vice President of the William Morris Agency (1994-2006) |
| No. of Portfolios for which Board Member Serves: 29 |
| ——————— |
| Ehud Houminer (70) |
| Board Member (1994) |
| Principal Occupation During Past 5Years: |
| • Executive-in-Residence at the Columbia Business School, Columbia University (1992-present) |
| Other Public Company Board Memberships During Past 5Years: |
| • Avnet Inc., an electronics distributor, Director (1993-present) |
| No. of Portfolios for which Board Member Serves: 64 |
| ——————— |
| Richard C. Leone (71) |
| Board Member (1980) |
| Principal Occupation During Past 5Years: |
| • President of The Century Foundation (formerly,The Twentieth Century Fund, Inc.), a tax exempt |
| research foundation engaged in the study of economic, foreign policy and domestic issues |
| Other Public Company Board Memberships During Past 5Years: |
| • Partnership for a Secure America, Director |
| No. of Portfolios for which Board Member Serves: 29 |
| ——————— |
| Hans C. Mautner (73) |
| Board Member (1980) |
| Principal Occupation During Past 5Years: |
| • President—International Division and an Advisory Director of Simon Property Group, a real |
| estate investment company (1998-2010) |
| • Chairman and Chief Executive Officer of Simon Global Limited (1999-2010) |
| No. of Portfolios for which Board Member Serves: 29 |
BOARD MEMBERS INFORMATION (Unaudited) (continued)
|
| Robin A. Melvin (47) |
| Board Member (1995) |
| Principal Occupation During Past 5Years: |
| • Director, Boisi Family Foundation, a private family foundation that supports youth-serving |
| organizations that promote the self sufficiency of youth from disadvantaged circumstances |
| (1995-present) |
| • SeniorVice President, Mentor, a national non-profit youth mentoring organization (1992-2005) |
| No. of Portfolios for which Board Member Serves: 56 |
| ——————— |
| Burton N. Wallack (60) |
| Board Member (2006) |
| Principal Occupation During Past 5Years: |
| • President and Co-owner of Wallack Management Company, a real estate management company |
| No. of Portfolios for which Board Member Serves: 29 |
| ——————— |
| John E. Zuccotti (73) |
| Board Member (1980) |
| Principal Occupation During Past 5Years: |
| • Chairman of Brookfield Properties, Inc. |
| • Senior Counsel of Weil, Gotshal & Manges, LLP |
| • Emeritus Chairman of the Real Estate Board of New York |
| Other Public Company Board Memberships During Past 5Years: |
| • Emigrant Savings Bank, Director (2004-present) |
| • Doris Duke Charitable Foundation,Trustee (2006-present) |
| No. of Portfolios for which Board Member Serves: 29 |
| ——————— |
Once elected all Board Members serve for an indefinite term, but achieve Emeritus status upon reaching age 80.The address of the Board Members and Officers is in c/o The Dreyfus Corporation, 200 Park Avenue, NewYork, NewYork 10166.Additional information about the Board Members is available in the fund’s Statement of Additional Information which can be obtained from Dreyfus free of charge by calling this toll free number: 1-800-554-4611.
Arnold S. Hiatt, Emeritus Board Member
32
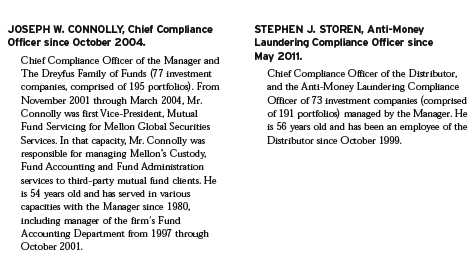
OFFICERS OF THE FUND (Unaudited)
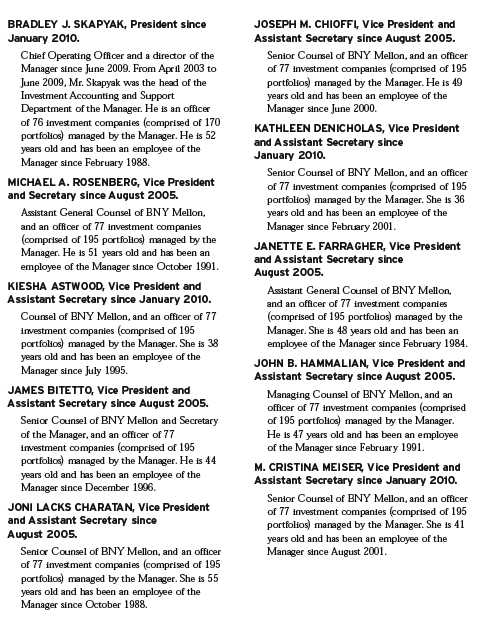
OFFICERS OF THE FUND (Unaudited) (continued)

34
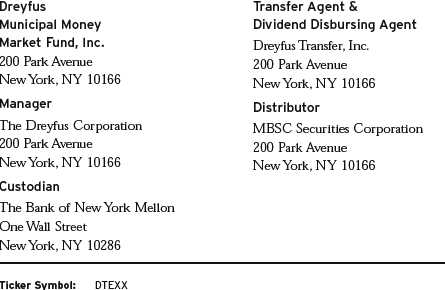
For More Information
Telephone 1-800-DREYFUS
Mail The Dreyfus Family of Funds, 144 Glenn Curtiss Boulevard, Uniondale, NY 11556-0144 E-mail Send your request to info@dreyfus.com Internet Information can be viewed online or downloaded at: http://www.dreyfus.com
The fund will disclose daily, on www.dreyfus.com, the fund’s complete schedule of holdings as of the end of the previous business day. The schedule of holdings will remain on the website until the fund files its Form N-Q or Form N-CSR for the period that includes the date of the posted holdings.
The fund files its complete schedule of portfolio holdings with the Securities and Exchange Commission (“SEC”) for the first and third quarters of each fiscal year on Form N-Q. The fund’s Forms N-Q are available on the SEC’s website at http://www.sec.gov and may be reviewed and copied at the SEC’s Public Reference Room in Washington, DC. Information on the operation of the Public Reference Room may be obtained by calling 1-800-SEC-0330.
Information regarding how the fund voted proxies relating to portfolio securities for the most recent 12-month period ended June 30 is available on the SEC’s website at http://www.sec.gov and without charge, upon request, by calling 1-800-DREYFUS.

Item 2. Code of Ethics.
The Registrant has adopted a code of ethics that applies to the Registrant's principal executive officer, principal financial officer, principal accounting officer or controller, or persons performing similar functions. There have been no amendments to, or waivers in connection with, the Code of Ethics during the period covered by this Report.
Item 3. Audit Committee Financial Expert.
The Registrant's Board has determined that Ehud Houminer, a member of the Audit Committee of the Board, is an audit committee financial expert as defined by the Securities and Exchange Commission (the "SEC"). Ehud Houminer is "independent" as defined by the SEC for purposes of audit committee financial expert determinations.
Item 4. Principal Accountant Fees and Services.
(a) Audit Fees. The aggregate fees billed for each of the last two fiscal years (the "Reporting Periods") for professional services rendered by the Registrant's principal accountant (the "Auditor") for the audit of the Registrant's annual financial statements or services that are normally provided by the Auditor in connection with the statutory and regulatory filings or engagements for the Reporting Periods, were $41,463 in 2010 and $30,312 in 2011.
(b) Audit-Related Fees. The aggregate fees billed in the Reporting Periods for assurance and related services by the Auditor that are reasonably related to the performance of the audit of the Registrant's financial statements and are not reported under paragraph (a) of this Item 4 were $5,382 in 2010 and $6,000 in 2011. These services consisted of one or more of the following: (i) agreed upon procedures related to compliance with Internal Revenue Code section 817(h), (ii) security counts required by Rule 17f-2 under the Investment Company Act of 1940, as amended, (iii) advisory services as to the accounting or disclosure treatment of Registrant transactions or events and (iv) advisory services to the accounting or disclosure treatment of the actual or potential impact to the Registrant of final or proposed rules, standards or interpretations by the Securities and Exchange Commission, the Financial Accounting Standards Boards or other regulatory or standard-setting bodies.
The aggregate fees billed in the Reporting Periods for non-audit assurance and related services by the Auditor to the Registrant's investment adviser (not including any sub-investment adviser whose role is primarily portfolio management and is subcontracted with or overseen by another investment adviser), and any entity controlling, controlled by or under common control with the investment adviser that provides ongoing services to the Registrant ("Service Affiliates"), that were reasonably related to the performance of the annual audit of the Service Affiliate, which required pre-approval by the Audit Committee were $0 in 2010 and $0 in 2011.
(c) Tax Fees. The aggregate fees billed in the Reporting Periods for professional services rendered by the Auditor for tax compliance, tax advice, and tax planning ("Tax Services") were $3,559 in 2010 and $3,897 in 2011. These services consisted of: (i) review or preparation of U.S. federal, state, local and excise tax returns; (ii) U.S. federal, state and local tax planning, advice and assistance regarding statutory, regulatory or administrative developments; (iii) tax advice regarding tax qualification matters and/or treatment of various financial instruments held or proposed to be acquired or held. The aggregate fees billed in the Reporting Periods for Tax Services by the Auditor to Service Affiliates, which required pre-approval by the Audit Committee were $0 in 2010 and $0 in 2011.
(d) All Other Fees. The aggregate fees billed in the Reporting Periods for products and services provided by the Auditor, other than the services reported in paragraphs (a) through (c) of this Item, were $0 in 2010 and $329 in 2011. [These services consisted of a review of the Registrant's anti-money laundering program].
The aggregate fees billed in the Reporting Periods for Non-Audit Services by the Auditor to Service Affiliates, other than the services reported in paragraphs (b) through (c) of this Item, which required pre-approval by the Audit Committee, were $0 in 2010 and $0 in 2011.
(e)(1) Audit Committee Pre-Approval Policies and Procedures. The Registrant's Audit Committee has established policies and procedures (the "Policy") for pre-approval (within specified fee limits) of the Auditor's engagements for non-audit services to the Registrant and Service Affiliates without specific case-by-case consideration. The pre-approved services in the Policy can include pre-approved audit services, pre-approved audit-related services, pre-approved tax services and pre-approved all other services. Pre-approval considerations include whether the proposed services are compatible with maintaining the Auditor's independence. Pre-approvals pursuant to the Policy are considered annually.
(e)(2) Note: None of the services described in paragraphs (b) through (d) of this Item 4 were approved by the Audit Committee pursuant to paragraph (c)(7)(i)(C) of Rule 2-01 of Regulation S-X.
(f) None of the hours expended on the principal accountant's engagement to audit the registrant's financial statements for the most recent fiscal year were attributed to work performed by persons other than the principal account's full-time, permanent employees.
Non-Audit Fees. The aggregate non-audit fees billed by the Auditor for services rendered to the Registrant, and rendered to Service Affiliates, for the Reporting Periods were $28,017,293 in 2010 and $19,526,919 in 2011.
Auditor Independence. The Registrant's Audit Committee has considered whether the provision of non-audit services that were rendered to Service Affiliates, which were not pre-approved (not requiring pre-approval), is compatible with maintaining the Auditor's independence.
Item 5. Audit Committee of Listed Registrants.
Not applicable. [CLOSED-END FUNDS ONLY]
Item 6. Investments.
(a) Not applicable.
Item 7. Disclosure of Proxy Voting Policies and Procedures for Closed-End Management Investment Companies.
Not applicable. [CLOSED-END FUNDS ONLY]
Item 8. Portfolio Managers of Closed-End Management Investment Companies.
Not applicable. [CLOSED-END FUNDS ONLY, beginning with reports for periods ended on and after December 31, 2005]
Item 9. Purchases of Equity Securities by Closed-End Management Investment Companies and Affiliated Purchasers.
Not applicable. [CLOSED-END FUNDS ONLY]
Item 10. Submission of Matters to a Vote of Security Holders.
There have been no material changes to the procedures applicable to Item 10.
Item 11. Controls and Procedures.
(a) The Registrant's principal executive and principal financial officers have concluded, based on their evaluation of the Registrant's disclosure controls and procedures as of a date within 90 days of the filing date of this report, that the Registrant's disclosure controls and procedures are reasonably designed to ensure that information required to be disclosed by the Registrant on Form N-CSR is recorded, processed, summarized and reported within the required time periods and that information required to be disclosed by the Registrant in the reports that it files or submits on Form N-CSR is accumulated and communicated to the Registrant's management, including its principal executive and principal financial officers, as appropriate to allow timely decisions regarding required disclosure.
(b) There were no changes to the Registrant's internal control over financial reporting that occurred during the second fiscal quarter of the period covered by this report that have materially affected, or are reasonably likely to materially affect, the Registrant's internal control over financial reporting.
Item 12. Exhibits.
(a)(1) Code of ethics referred to in Item 2.
(a)(2) Certifications of principal executive and principal financial officers as required by Rule 30a-2(a) under the Investment Company Act of 1940.
(a)(3) Not applicable.
(b) Certification of principal executive and principal financial officers as required by Rule 30a-2(b) under the Investment Company Act of 1940.
SIGNATURES
Pursuant to the requirements of the Securities Exchange Act of 1934 and the Investment Company Act of 1940, the Registrant has duly caused this Report to be signed on its behalf by the undersigned, thereunto duly authorized.
Dreyfus Municipal Money Market Fund, Inc.
By: /s/ Bradley J. Skapyak |
Bradley J. Skapyak, President |
Date: | July 25, 2011 |
|
Pursuant to the requirements of the Securities Exchange Act of 1934 and the Investment Company Act of 1940, this Report has been signed below by the following persons on behalf of the Registrant and in the capacities and on the dates indicated. |
|
By: /s/ Bradley J. Skapyak |
Bradley J. Skapyak, President |
Date: | July 25, 2011 |
|
By: /s/ James Windels |
James Windels, Treasurer |
Date: | July 25, 2011 |
|
EXHIBIT INDEX
(a)(1) Code of ethics referred to in Item 2.
(a)(2) Certifications of principal executive and principal financial officers as required by Rule 30a-2(a) under the Investment Company Act of 1940. (EX-99.CERT)
(b) Certification of principal executive and principal financial officers as required by Rule 30a-2(b) under the Investment Company Act of 1940. (EX-99.906CERT)