0000031266eatonvance:EATONVANCEIndexBloombergUSAggregateBondIndex19314AdditionalIndexMember2017-03-310000031266eatonvance:EATONVANCEIndexBloombergUSAggregateBondIndex19417AdditionalIndexMember2019-11-300000031266eatonvance:C000014213Member2017-12-310000031266eatonvance:EATONVANCEIndexSP500Index19204BroadBasedIndexMember2016-10-310000031266eatonvance:EATONVANCEIndexRussell1000Value19375AdditionalIndexMember2016-09-300000031266eatonvance:EATONVANCEIndexRussell200019224AdditionalIndexMember2016-10-31
UNITED STATES
SECURITIES AND EXCHANGE COMMISSION
Washington, D.C. 20549
Form N-CSR
CERTIFIED SHAREHOLDER REPORT OF REGISTERED
MANAGEMENT INVESTMENT COMPANIES
Investment Company Act File Number: 811-01545
Eaton Vance Special Investment Trust
(Exact Name of Registrant as Specified in Charter)
One Post Office Square, Boston, Massachusetts 02109
(Address of Principal Executive Offices)
Deidre E. Walsh
One Post Office Square, Boston, Massachusetts 02109
(Name and Address of Agent for Services)
(617) 482-8260
(Registrant’s Telephone Number)
December 31
Date of Fiscal Year End
December 31, 2024
Date of Reporting Period
| Item 1. | Reports to Stockholders |
Eaton Vance Balanced Fund
Annual Shareholder Report December 31, 2024
This annual shareholder report contains important information about the Eaton Vance Balanced Fund for the period of January 1, 2024 to December 31, 2024. You can find additional information about the Fund at www.eatonvance.com/open-end-mutual-fund-documents.php. You can also request this information by contacting us at 1-800-262-1122.
What were the Fund costs for the last year?Footnote Reference*
(based on a hypothetical $10,000 investment)
| Class Name | Costs of a $10,000 investment | Costs paid as a percentage of a $10,000 investment |
|---|
| Class A | $106 | 0.97% |
|---|
| Footnote | Description |
Footnote* | Expenses in the table reflect the expenses of both the Fund and Stock Portfolio and Core Bond Portfolio, the Portfolios in which it invests. |
How did the Fund perform last year and what affected its performance?
Key contributors to (↑) and detractors from (↓) performance, relative to the S&P 500® Index (the Index), and the Bloomberg U.S. Aggregate Bond Index (the Secondary Index):
• The Fund invests in a blend of Stock Portfolio — the Fund’s equity allocation — and Core Bond Portfolio — the Fund’s fixed-income allocation
↓ Core Bond Portfolio underperformed the Index and detracted from Index-relative returns during the period — but outperformed the Secondary Index
↓ An underweight exposure to agency mortgage-backed securities (MBS), yield-curve positioning, and the use of derivatives detracted from returns during the period
↑ Bond selections ― notably in investment-grade corporate bonds ― and sector allocations ― notably an overweight exposure to commercial MBS ― aided returns
↑ Stock Portfolio outperformed the Index; an overweight position in artificial intelligence chipmaker NVIDIA Corp. contributed to Index-relative returns
↑ Among sectors, stock selections and underweight exposures to health care and consumer staples, and stock selections in information technology, helped returns
↓ An overweight position in energy exploration and production firm ConocoPhillips fell in value as global energy demand and oil prices weakened during the period
↓ Among sectors within the Index, the Fund’s stock selections in the energy and real estate sectors detracted from Index-relative performance during the period
Comparison of the change in value of a $10,000 investment for the period indicated.
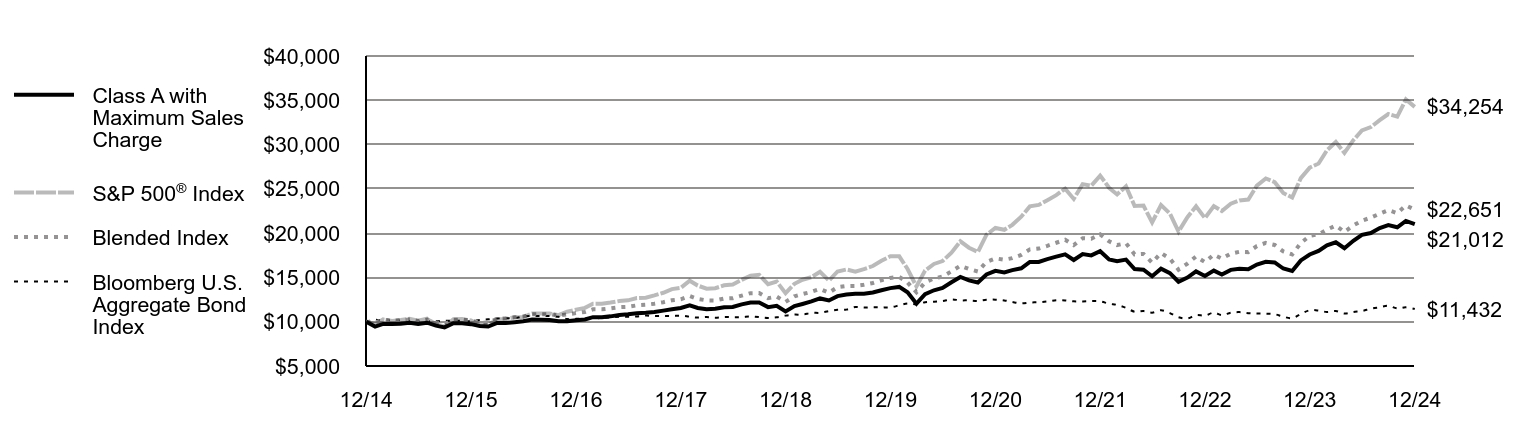
| Class A with Maximum Sales Charge | S&P 500® Index | Blended Index | Bloomberg U.S. Aggregate Bond Index |
|---|
| 12/14 | $10,000 | $10,000 | $10,000 | $10,000 |
|---|
| 1/15 | $9,453 | $9,700 | $9,904 | $10,210 |
|---|
| 2/15 | $9,755 | $10,257 | $10,208 | $10,114 |
|---|
| 3/15 | $9,747 | $10,095 | $10,130 | $10,161 |
|---|
| 4/15 | $9,759 | $10,192 | $10,174 | $10,124 |
|---|
| 5/15 | $9,879 | $10,323 | $10,243 | $10,100 |
|---|
| 6/15 | $9,750 | $10,123 | $10,079 | $9,990 |
|---|
| 7/15 | $9,889 | $10,335 | $10,234 | $10,059 |
|---|
| 8/15 | $9,552 | $9,712 | $9,857 | $10,045 |
|---|
| 9/15 | $9,354 | $9,471 | $9,738 | $10,113 |
|---|
| 10/15 | $9,820 | $10,270 | $10,231 | $10,114 |
|---|
| 11/15 | $9,832 | $10,301 | $10,239 | $10,088 |
|---|
| 12/15 | $9,726 | $10,138 | $10,128 | $10,055 |
|---|
| 1/16 | $9,512 | $9,635 | $9,883 | $10,193 |
|---|
| 2/16 | $9,453 | $9,622 | $9,903 | $10,266 |
|---|
| 3/16 | $9,865 | $10,275 | $10,342 | $10,360 |
|---|
| 4/16 | $9,865 | $10,315 | $10,382 | $10,400 |
|---|
| 5/16 | $9,948 | $10,500 | $10,495 | $10,402 |
|---|
| 6/16 | $10,044 | $10,527 | $10,587 | $10,589 |
|---|
| 7/16 | $10,248 | $10,915 | $10,848 | $10,656 |
|---|
| 8/16 | $10,212 | $10,931 | $10,852 | $10,644 |
|---|
| 9/16 | $10,186 | $10,933 | $10,851 | $10,638 |
|---|
| 10/16 | $10,042 | $10,733 | $10,699 | $10,556 |
|---|
| 11/16 | $10,054 | $11,131 | $10,835 | $10,307 |
|---|
| 12/16 | $10,174 | $11,351 | $10,970 | $10,321 |
|---|
| 1/17 | $10,258 | $11,566 | $11,103 | $10,341 |
|---|
| 2/17 | $10,512 | $12,025 | $11,398 | $10,411 |
|---|
| 3/17 | $10,507 | $12,039 | $11,403 | $10,406 |
|---|
| 4/17 | $10,604 | $12,163 | $11,509 | $10,486 |
|---|
| 5/17 | $10,750 | $12,334 | $11,641 | $10,567 |
|---|
| 6/17 | $10,831 | $12,411 | $11,680 | $10,556 |
|---|
| 7/17 | $10,962 | $12,667 | $11,844 | $10,601 |
|---|
| 8/17 | $11,011 | $12,705 | $11,909 | $10,696 |
|---|
| 9/17 | $11,090 | $12,967 | $12,033 | $10,645 |
|---|
| 10/17 | $11,250 | $13,270 | $12,205 | $10,652 |
|---|
| 11/17 | $11,410 | $13,677 | $12,423 | $10,638 |
|---|
| 12/17 | $11,551 | $13,829 | $12,529 | $10,687 |
|---|
| 1/18 | $11,855 | $14,621 | $12,901 | $10,564 |
|---|
| 2/18 | $11,550 | $14,082 | $12,567 | $10,464 |
|---|
| 3/18 | $11,412 | $13,724 | $12,408 | $10,531 |
|---|
| 4/18 | $11,462 | $13,777 | $12,399 | $10,452 |
|---|
| 5/18 | $11,641 | $14,108 | $12,614 | $10,527 |
|---|
| 6/18 | $11,659 | $14,195 | $12,654 | $10,514 |
|---|
| 7/18 | $11,953 | $14,724 | $12,938 | $10,516 |
|---|
| 8/18 | $12,164 | $15,203 | $13,224 | $10,584 |
|---|
| 9/18 | $12,173 | $15,290 | $13,235 | $10,516 |
|---|
| 10/18 | $11,646 | $14,245 | $12,651 | $10,433 |
|---|
| 11/18 | $11,787 | $14,535 | $12,836 | $10,495 |
|---|
| 12/18 | $11,155 | $13,223 | $12,235 | $10,688 |
|---|
| 1/19 | $11,761 | $14,282 | $12,875 | $10,801 |
|---|
| 2/19 | $12,003 | $14,741 | $13,120 | $10,795 |
|---|
| 3/19 | $12,290 | $15,027 | $13,374 | $11,003 |
|---|
| 4/19 | $12,628 | $15,636 | $13,700 | $11,005 |
|---|
| 5/19 | $12,398 | $14,642 | $13,275 | $11,201 |
|---|
| 6/19 | $12,890 | $15,674 | $13,903 | $11,341 |
|---|
| 7/19 | $13,080 | $15,899 | $14,035 | $11,366 |
|---|
| 8/19 | $13,154 | $15,648 | $14,047 | $11,661 |
|---|
| 9/19 | $13,159 | $15,940 | $14,175 | $11,599 |
|---|
| 10/19 | $13,296 | $16,286 | $14,376 | $11,634 |
|---|
| 11/19 | $13,556 | $16,877 | $14,686 | $11,628 |
|---|
| 12/19 | $13,791 | $17,386 | $14,948 | $11,620 |
|---|
| 1/20 | $13,931 | $17,379 | $15,060 | $11,843 |
|---|
| 2/20 | $13,315 | $15,949 | $14,424 | $12,056 |
|---|
| 3/20 | $12,032 | $13,979 | $13,321 | $11,985 |
|---|
| 4/20 | $13,100 | $15,771 | $14,441 | $12,198 |
|---|
| 5/20 | $13,550 | $16,522 | $14,880 | $12,255 |
|---|
| 6/20 | $13,807 | $16,850 | $15,095 | $12,332 |
|---|
| 7/20 | $14,456 | $17,801 | $15,696 | $12,517 |
|---|
| 8/20 | $15,058 | $19,080 | $16,322 | $12,416 |
|---|
| 9/20 | $14,671 | $18,355 | $15,947 | $12,409 |
|---|
| 10/20 | $14,428 | $17,867 | $15,664 | $12,353 |
|---|
| 11/20 | $15,328 | $19,823 | $16,754 | $12,475 |
|---|
| 12/20 | $15,750 | $20,585 | $17,150 | $12,492 |
|---|
| 1/21 | $15,562 | $20,377 | $16,997 | $12,402 |
|---|
| 2/21 | $15,822 | $20,939 | $17,180 | $12,223 |
|---|
| 3/21 | $16,034 | $21,856 | $17,545 | $12,071 |
|---|
| 4/21 | $16,756 | $23,022 | $18,163 | $12,166 |
|---|
| 5/21 | $16,756 | $23,183 | $18,262 | $12,206 |
|---|
| 6/21 | $17,067 | $23,724 | $18,570 | $12,291 |
|---|
| 7/21 | $17,342 | $24,288 | $18,917 | $12,429 |
|---|
| 8/21 | $17,603 | $25,026 | $19,248 | $12,405 |
|---|
| 9/21 | $16,965 | $23,863 | $18,644 | $12,298 |
|---|
| 10/21 | $17,632 | $25,534 | $19,426 | $12,294 |
|---|
| 11/21 | $17,487 | $25,357 | $19,368 | $12,331 |
|---|
| 12/21 | $17,956 | $26,494 | $19,869 | $12,299 |
|---|
| 1/22 | $17,035 | $25,123 | $19,081 | $12,034 |
|---|
| 2/22 | $16,832 | $24,371 | $18,653 | $11,900 |
|---|
| 3/22 | $17,014 | $25,276 | $18,861 | $11,569 |
|---|
| 4/22 | $15,950 | $23,071 | $17,588 | $11,130 |
|---|
| 5/22 | $15,871 | $23,114 | $17,653 | $11,202 |
|---|
| 6/22 | $15,135 | $21,206 | $16,668 | $11,026 |
|---|
| 7/22 | $15,982 | $23,161 | $17,753 | $11,296 |
|---|
| 8/22 | $15,480 | $22,217 | $17,118 | $10,977 |
|---|
| 9/22 | $14,510 | $20,170 | $15,876 | $10,502 |
|---|
| 10/22 | $14,982 | $21,804 | $16,565 | $10,366 |
|---|
| 11/22 | $15,675 | $23,022 | $17,364 | $10,748 |
|---|
| 12/22 | $15,159 | $21,696 | $16,732 | $10,699 |
|---|
| 1/23 | $15,770 | $23,059 | $17,569 | $11,028 |
|---|
| 2/23 | $15,324 | $22,496 | $17,130 | $10,743 |
|---|
| 3/23 | $15,852 | $23,322 | $17,682 | $11,016 |
|---|
| 4/23 | $15,985 | $23,686 | $17,890 | $11,083 |
|---|
| 5/23 | $15,918 | $23,789 | $17,859 | $10,962 |
|---|
| 6/23 | $16,460 | $25,361 | $18,541 | $10,923 |
|---|
| 7/23 | $16,759 | $26,176 | $18,894 | $10,915 |
|---|
| 8/23 | $16,693 | $25,759 | $18,665 | $10,846 |
|---|
| 9/23 | $16,006 | $24,531 | $17,941 | $10,570 |
|---|
| 10/23 | $15,722 | $24,015 | $17,602 | $10,403 |
|---|
| 11/23 | $16,924 | $26,208 | $18,885 | $10,874 |
|---|
| 12/23 | $17,592 | $27,399 | $19,689 | $11,291 |
|---|
| 1/24 | $17,996 | $27,859 | $19,866 | $11,260 |
|---|
| 2/24 | $18,620 | $29,347 | $20,390 | $11,101 |
|---|
| 3/24 | $18,971 | $30,291 | $20,859 | $11,203 |
|---|
| 4/24 | $18,294 | $29,054 | $20,137 | $10,920 |
|---|
| 5/24 | $19,140 | $30,494 | $20,873 | $11,105 |
|---|
| 6/24 | $19,810 | $31,589 | $21,401 | $11,210 |
|---|
| 7/24 | $20,013 | $31,973 | $21,757 | $11,472 |
|---|
| 8/24 | $20,573 | $32,749 | $22,199 | $11,637 |
|---|
| 9/24 | $20,902 | $33,448 | $22,602 | $11,793 |
|---|
| 10/24 | $20,664 | $33,145 | $22,255 | $11,500 |
|---|
| 11/24 | $21,379 | $35,090 | $23,133 | $11,622 |
|---|
| 12/24 | $21,012 | $34,254 | $22,651 | $11,432 |
|---|
Average Annual Total Returns (%)
| Fund | 1 Year | 5 Years | 10 Years |
|---|
| Class A | 19.46% | 8.78% | 8.28% |
|---|
| Class A with 5.25% Maximum Sales Charge | 13.18% | 7.61% | 7.70% |
|---|
S&P 500® Index | 25.02% | 14.51% | 13.09% |
|---|
| Bloomberg U.S. Aggregate Bond Index | 1.25% | (0.33)% | 1.35% |
|---|
Blended IndexFootnote Reference1 | 15.04% | 8.66% | 8.51% |
|---|
| Footnote | Description |
Footnote1 | Benchmark is an internally constructed benchmark comprised of a blend of 60% S&P 500® Index and 40% Bloomberg U.S. Aggregate Bond Index, and is rebalanced monthly. |
Performance does not reflect the deduction of taxes that a shareholder would pay on Fund distributions or redemption of Fund shares. Performance assumes that all dividends and distributions, if any, were reinvested. For more recent performance information, visit www.eatonvance.com/performance.php.
THE FUND'S PAST PERFORMANCE IS NO GUARANTEE OF FUTURE RESULTS.
| Total Net Assets | $1,013,190,430 |
|---|
| # of Portfolio Holdings (for Stock and Core Bond Portfolios) | 373 |
|---|
| Portfolio Turnover Rate | 5% |
|---|
| Total Advisory Fees Paid | $5,002,640 |
|---|
What did the Fund invest in?
The following tables reflect what the Fund invested in as of the report date.
References to the Fund's investments are to the Fund's pro rata share of the investments of Stock Portfolio and Core Bond Portfolio, affiliated investment companies in which the Fund invests substantially all of its assets.
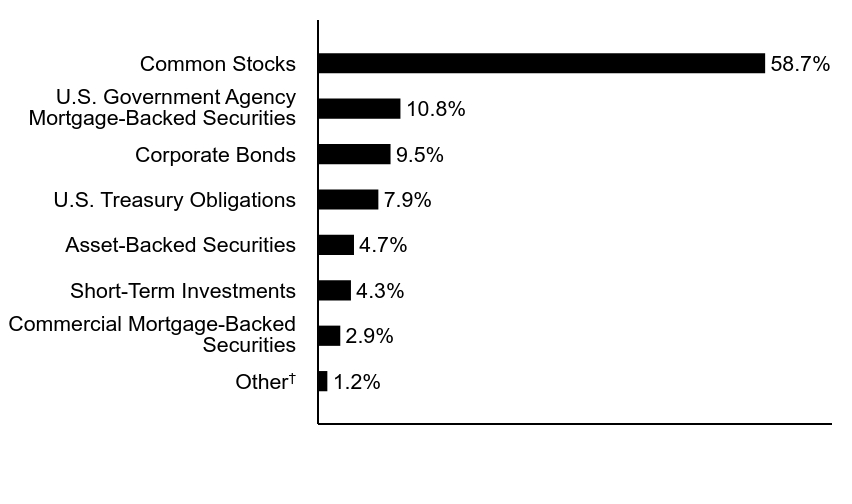
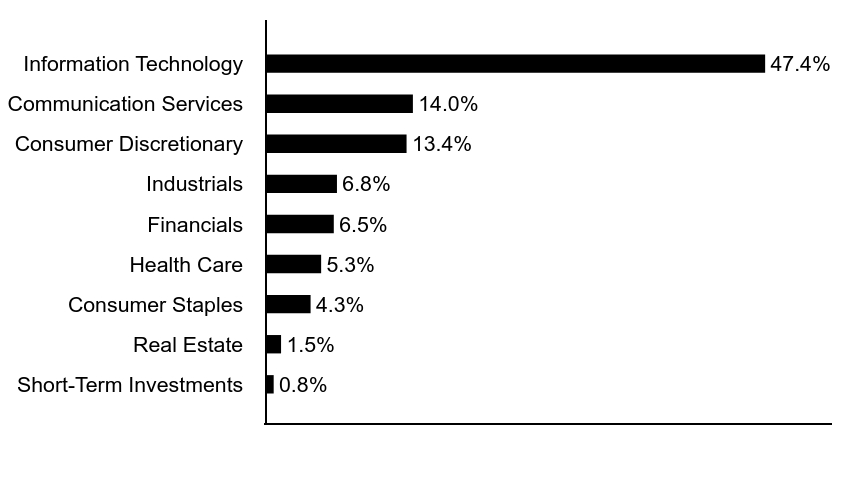
Asset Allocation (% of total investments)
| Value | Value |
|---|
OtherFootnote Reference† | 1.2% |
| Commercial Mortgage-Backed Securities | 2.9% |
| Short-Term Investments | 4.3% |
| Asset-Backed Securities | 4.7% |
| U.S. Treasury Obligations | 7.9% |
| Corporate Bonds | 9.5% |
| U.S. Government Agency Mortgage-Backed Securities | 10.8% |
| Common Stocks | 58.7% |
| Footnote | Description |
Footnote† | Investment types less than 1% each |
Top Ten Holdings (% of total investments)Footnote Referencea
| Uniform Mortgage-Backed Security, 5.50%, 30-Year, TBA | 4.7% |
| Apple, Inc. | 4.5% |
| Microsoft Corp. | 4.5% |
| NVIDIA Corp. | 4.3% |
| Amazon.com, Inc. | 3.2% |
| Alphabet, Inc., Class C | 2.6% |
| Uniform Mortgage-Backed Security, 5.00%, 30-Year, TBA | 2.6% |
| Broadcom, Inc. | 2.1% |
| Meta Platforms, Inc., Class A | 1.8% |
| U.S. Treasury Notes, 0.38%, 12/31/25 | 1.5% |
| Total | 31.8% |
| Footnote | Description |
Footnotea | Excluding cash equivalents |
If you wish to view additional information about the Fund, including the prospectus, statement of additional information, financial statements and holdings, please scan the QR code or visit www.eatonvance.com/open-end-mutual-fund-documents.php. For proxy information, please visit www.eatonvance.com/proxyvoting.
The Funds may deliver a single copy of certain required shareholder documents (including prospectuses, shareholder reports, and proxy materials) to investors with the same last name and the same address. Your participation will continue indefinitely unless you instruct otherwise by calling 1-800-262-1122 or by contacting your financial intermediary. Your instruction will typically be effective within 30 days of receipt.
Not FDIC Insured | May Lose Value | No Bank Guarantee
Annual Shareholder Report December 31, 2024
Eaton Vance Balanced Fund
Annual Shareholder Report December 31, 2024
This annual shareholder report contains important information about the Eaton Vance Balanced Fund for the period of January 1, 2024 to December 31, 2024. You can find additional information about the Fund at www.eatonvance.com/open-end-mutual-fund-documents.php. You can also request this information by contacting us at 1-800-262-1122.
What were the Fund costs for the last year?Footnote Reference*
(based on a hypothetical $10,000 investment)
| Class Name | Costs of a $10,000 investment | Costs paid as a percentage of a $10,000 investment |
|---|
| Class C | $188 | 1.72% |
|---|
| Footnote | Description |
Footnote* | Expenses in the table reflect the expenses of both the Fund and Stock Portfolio and Core Bond Portfolio, the Portfolios in which it invests. |
How did the Fund perform last year and what affected its performance?
Key contributors to (↑) and detractors from (↓) performance, relative to the S&P 500® Index (the Index), and the Bloomberg U.S. Aggregate Bond Index (the Secondary Index):
• The Fund invests in a blend of Stock Portfolio — the Fund’s equity allocation — and Core Bond Portfolio — the Fund’s fixed-income allocation
↓ Core Bond Portfolio underperformed the Index and detracted from Index-relative returns during the period — but outperformed the Secondary Index
↓ An underweight exposure to agency mortgage-backed securities (MBS), yield-curve positioning, and the use of derivatives detracted from returns during the period
↑ Bond selections ― notably in investment-grade corporate bonds ― and sector allocations ― notably an overweight exposure to commercial MBS ― aided returns
↑ Stock Portfolio outperformed the Index; an overweight position in artificial intelligence chipmaker NVIDIA Corp. contributed to Index-relative returns
↑ Among sectors, stock selections and underweight exposures to health care and consumer staples, and stock selections in information technology, helped returns
↓ An overweight position in energy exploration and production firm ConocoPhillips fell in value as global energy demand and oil prices weakened during the period
↓ Among sectors within the Index, the Fund’s stock selections in the energy and real estate sectors detracted from Index-relative performance during the period
Comparison of the change in value of a $10,000 investment for the period indicated.

| Class C | S&P 500® Index | Blended Index | Bloomberg U.S. Aggregate Bond Index |
|---|
| 12/14 | $10,000 | $10,000 | $10,000 | $10,000 |
|---|
| 1/15 | $9,976 | $9,700 | $9,904 | $10,210 |
|---|
| 2/15 | $10,294 | $10,257 | $10,208 | $10,114 |
|---|
| 3/15 | $10,273 | $10,095 | $10,130 | $10,161 |
|---|
| 4/15 | $10,284 | $10,192 | $10,174 | $10,124 |
|---|
| 5/15 | $10,399 | $10,323 | $10,243 | $10,100 |
|---|
| 6/15 | $10,257 | $10,123 | $10,079 | $9,990 |
|---|
| 7/15 | $10,403 | $10,335 | $10,234 | $10,059 |
|---|
| 8/15 | $10,039 | $9,712 | $9,857 | $10,045 |
|---|
| 9/15 | $9,826 | $9,471 | $9,738 | $10,113 |
|---|
| 10/15 | $10,314 | $10,270 | $10,231 | $10,114 |
|---|
| 11/15 | $10,314 | $10,301 | $10,239 | $10,088 |
|---|
| 12/15 | $10,186 | $10,138 | $10,128 | $10,055 |
|---|
| 1/16 | $9,963 | $9,635 | $9,883 | $10,193 |
|---|
| 2/16 | $9,901 | $9,622 | $9,903 | $10,266 |
|---|
| 3/16 | $10,328 | $10,275 | $10,342 | $10,360 |
|---|
| 4/16 | $10,315 | $10,315 | $10,382 | $10,400 |
|---|
| 5/16 | $10,390 | $10,500 | $10,495 | $10,402 |
|---|
| 6/16 | $10,485 | $10,527 | $10,587 | $10,589 |
|---|
| 7/16 | $10,697 | $10,915 | $10,848 | $10,656 |
|---|
| 8/16 | $10,647 | $10,931 | $10,852 | $10,644 |
|---|
| 9/16 | $10,627 | $10,933 | $10,851 | $10,638 |
|---|
| 10/16 | $10,465 | $10,733 | $10,699 | $10,556 |
|---|
| 11/16 | $10,465 | $11,131 | $10,835 | $10,307 |
|---|
| 12/16 | $10,581 | $11,351 | $10,970 | $10,321 |
|---|
| 1/17 | $10,669 | $11,566 | $11,103 | $10,341 |
|---|
| 2/17 | $10,932 | $12,025 | $11,398 | $10,411 |
|---|
| 3/17 | $10,908 | $12,039 | $11,403 | $10,406 |
|---|
| 4/17 | $11,008 | $12,163 | $11,509 | $10,486 |
|---|
| 5/17 | $11,159 | $12,334 | $11,641 | $10,567 |
|---|
| 6/17 | $11,234 | $12,411 | $11,680 | $10,556 |
|---|
| 7/17 | $11,356 | $12,667 | $11,844 | $10,601 |
|---|
| 8/17 | $11,394 | $12,705 | $11,909 | $10,696 |
|---|
| 9/17 | $11,479 | $12,967 | $12,033 | $10,645 |
|---|
| 10/17 | $11,631 | $13,270 | $12,205 | $10,652 |
|---|
| 11/17 | $11,783 | $13,677 | $12,423 | $10,638 |
|---|
| 12/17 | $11,918 | $13,829 | $12,529 | $10,687 |
|---|
| 1/18 | $12,231 | $14,621 | $12,901 | $10,564 |
|---|
| 2/18 | $11,918 | $14,082 | $12,567 | $10,464 |
|---|
| 3/18 | $11,767 | $13,724 | $12,408 | $10,531 |
|---|
| 4/18 | $11,806 | $13,777 | $12,399 | $10,452 |
|---|
| 5/18 | $11,989 | $14,108 | $12,614 | $10,527 |
|---|
| 6/18 | $11,998 | $14,195 | $12,654 | $10,514 |
|---|
| 7/18 | $12,285 | $14,724 | $12,938 | $10,516 |
|---|
| 8/18 | $12,501 | $15,203 | $13,224 | $10,584 |
|---|
| 9/18 | $12,501 | $15,290 | $13,235 | $10,516 |
|---|
| 10/18 | $11,962 | $14,245 | $12,651 | $10,433 |
|---|
| 11/18 | $12,080 | $14,535 | $12,836 | $10,495 |
|---|
| 12/18 | $11,437 | $13,223 | $12,235 | $10,688 |
|---|
| 1/19 | $12,042 | $14,282 | $12,875 | $10,801 |
|---|
| 2/19 | $12,289 | $14,741 | $13,120 | $10,795 |
|---|
| 3/19 | $12,572 | $15,027 | $13,374 | $11,003 |
|---|
| 4/19 | $12,916 | $15,636 | $13,700 | $11,005 |
|---|
| 5/19 | $12,668 | $14,642 | $13,275 | $11,201 |
|---|
| 6/19 | $13,158 | $15,674 | $13,903 | $11,341 |
|---|
| 7/19 | $13,337 | $15,899 | $14,035 | $11,366 |
|---|
| 8/19 | $13,413 | $15,648 | $14,047 | $11,661 |
|---|
| 9/19 | $13,406 | $15,940 | $14,175 | $11,599 |
|---|
| 10/19 | $13,531 | $16,286 | $14,376 | $11,634 |
|---|
| 11/19 | $13,795 | $16,877 | $14,686 | $11,628 |
|---|
| 12/19 | $14,035 | $17,386 | $14,948 | $11,620 |
|---|
| 1/20 | $14,162 | $17,379 | $15,060 | $11,843 |
|---|
| 2/20 | $13,524 | $15,949 | $14,424 | $12,056 |
|---|
| 3/20 | $12,217 | $13,979 | $13,321 | $11,985 |
|---|
| 4/20 | $13,283 | $15,771 | $14,441 | $12,198 |
|---|
| 5/20 | $13,737 | $16,522 | $14,880 | $12,255 |
|---|
| 6/20 | $14,002 | $16,850 | $15,095 | $12,332 |
|---|
| 7/20 | $14,642 | $17,801 | $15,696 | $12,517 |
|---|
| 8/20 | $15,235 | $19,080 | $16,322 | $12,416 |
|---|
| 9/20 | $14,846 | $18,355 | $15,947 | $12,409 |
|---|
| 10/20 | $14,587 | $17,867 | $15,664 | $12,353 |
|---|
| 11/20 | $15,493 | $19,823 | $16,754 | $12,475 |
|---|
| 12/20 | $15,889 | $20,585 | $17,150 | $12,492 |
|---|
| 1/21 | $15,701 | $20,377 | $16,997 | $12,402 |
|---|
| 2/21 | $15,947 | $20,939 | $17,180 | $12,223 |
|---|
| 3/21 | $16,159 | $21,856 | $17,545 | $12,071 |
|---|
| 4/21 | $16,869 | $23,022 | $18,163 | $12,166 |
|---|
| 5/21 | $16,869 | $23,183 | $18,262 | $12,206 |
|---|
| 6/21 | $17,163 | $23,724 | $18,570 | $12,291 |
|---|
| 7/21 | $17,438 | $24,288 | $18,917 | $12,429 |
|---|
| 8/21 | $17,685 | $25,026 | $19,248 | $12,405 |
|---|
| 9/21 | $17,032 | $23,863 | $18,644 | $12,298 |
|---|
| 10/21 | $17,699 | $25,534 | $19,426 | $12,294 |
|---|
| 11/21 | $17,540 | $25,357 | $19,368 | $12,331 |
|---|
| 12/21 | $17,989 | $26,494 | $19,869 | $12,299 |
|---|
| 1/22 | $17,054 | $25,123 | $19,081 | $12,034 |
|---|
| 2/22 | $16,852 | $24,371 | $18,653 | $11,900 |
|---|
| 3/22 | $17,015 | $25,276 | $18,861 | $11,569 |
|---|
| 4/22 | $15,940 | $23,071 | $17,588 | $11,130 |
|---|
| 5/22 | $15,862 | $23,114 | $17,653 | $11,202 |
|---|
| 6/22 | $15,114 | $21,206 | $16,668 | $11,026 |
|---|
| 7/22 | $15,940 | $23,161 | $17,753 | $11,296 |
|---|
| 8/22 | $15,426 | $22,217 | $17,118 | $10,977 |
|---|
| 9/22 | $14,465 | $20,170 | $15,876 | $10,502 |
|---|
| 10/22 | $14,918 | $21,804 | $16,565 | $10,366 |
|---|
| 11/22 | $15,590 | $23,022 | $17,364 | $10,748 |
|---|
| 12/22 | $15,081 | $21,696 | $16,732 | $10,699 |
|---|
| 1/23 | $15,669 | $23,059 | $17,569 | $11,028 |
|---|
| 2/23 | $15,228 | $22,496 | $17,130 | $10,743 |
|---|
| 3/23 | $15,735 | $23,322 | $17,682 | $11,016 |
|---|
| 4/23 | $15,866 | $23,686 | $17,890 | $11,083 |
|---|
| 5/23 | $15,768 | $23,789 | $17,859 | $10,962 |
|---|
| 6/23 | $16,304 | $25,361 | $18,541 | $10,923 |
|---|
| 7/23 | $16,599 | $26,176 | $18,894 | $10,915 |
|---|
| 8/23 | $16,533 | $25,759 | $18,665 | $10,846 |
|---|
| 9/23 | $15,840 | $24,531 | $17,941 | $10,570 |
|---|
| 10/23 | $15,545 | $24,015 | $17,602 | $10,403 |
|---|
| 11/23 | $16,710 | $26,208 | $18,885 | $10,874 |
|---|
| 12/23 | $17,366 | $27,399 | $19,689 | $11,291 |
|---|
| 1/24 | $17,747 | $27,859 | $19,866 | $11,260 |
|---|
| 2/24 | $18,359 | $29,347 | $20,390 | $11,101 |
|---|
| 3/24 | $18,701 | $30,291 | $20,859 | $11,203 |
|---|
| 4/24 | $18,021 | $29,054 | $20,137 | $10,920 |
|---|
| 5/24 | $18,850 | $30,494 | $20,873 | $11,105 |
|---|
| 6/24 | $19,485 | $31,589 | $21,401 | $11,210 |
|---|
| 7/24 | $19,667 | $31,973 | $21,757 | $11,472 |
|---|
| 8/24 | $20,214 | $32,749 | $22,199 | $11,637 |
|---|
| 9/24 | $20,513 | $33,448 | $22,602 | $11,793 |
|---|
| 10/24 | $20,264 | $33,145 | $22,255 | $11,500 |
|---|
| 11/24 | $20,962 | $35,090 | $23,133 | $11,622 |
|---|
| 12/24 | $20,907 | $34,254 | $22,651 | $11,432 |
|---|
Average Annual Total Returns (%)
| Fund | 1 Year | 5 Years | 10 Years |
|---|
| Class C, with conversion to Class A after 8 years | 18.63% | 7.97% | 7.65% |
|---|
| Class C, with 1% Maximum Deferred Sales Charge and conversion to Class A after 8 years | 17.63% | 7.97% | 7.65% |
|---|
S&P 500® Index | 25.02% | 14.51% | 13.09% |
|---|
| Bloomberg U.S. Aggregate Bond Index | 1.25% | (0.33)% | 1.35% |
|---|
Blended IndexFootnote Reference1 | 15.04% | 8.66% | 8.51% |
|---|
| Footnote | Description |
Footnote1 | Benchmark is an internally constructed benchmark comprised of a blend of 60% S&P 500® Index and 40% Bloomberg U.S. Aggregate Bond Index, and is rebalanced monthly. |
Performance does not reflect the deduction of taxes that a shareholder would pay on Fund distributions or redemption of Fund shares. Performance assumes that all dividends and distributions, if any, were reinvested. For more recent performance information, visit www.eatonvance.com/performance.php.
THE FUND'S PAST PERFORMANCE IS NO GUARANTEE OF FUTURE RESULTS.
| Total Net Assets | $1,013,190,430 |
|---|
| # of Portfolio Holdings (for Stock and Core Bond Portfolios) | 373 |
|---|
| Portfolio Turnover Rate | 5% |
|---|
| Total Advisory Fees Paid | $5,002,640 |
|---|
What did the Fund invest in?
The following tables reflect what the Fund invested in as of the report date.
References to the Fund's investments are to the Fund's pro rata share of the investments of Stock Portfolio and Core Bond Portfolio, affiliated investment companies in which the Fund invests substantially all of its assets.
Asset Allocation (% of total investments)
| Value | Value |
|---|
OtherFootnote Reference† | 1.2% |
| Commercial Mortgage-Backed Securities | 2.9% |
| Short-Term Investments | 4.3% |
| Asset-Backed Securities | 4.7% |
| U.S. Treasury Obligations | 7.9% |
| Corporate Bonds | 9.5% |
| U.S. Government Agency Mortgage-Backed Securities | 10.8% |
| Common Stocks | 58.7% |
| Footnote | Description |
Footnote† | Investment types less than 1% each |
Top Ten Holdings (% of total investments)Footnote Referencea
| Uniform Mortgage-Backed Security, 5.50%, 30-Year, TBA | 4.7% |
| Apple, Inc. | 4.5% |
| Microsoft Corp. | 4.5% |
| NVIDIA Corp. | 4.3% |
| Amazon.com, Inc. | 3.2% |
| Alphabet, Inc., Class C | 2.6% |
| Uniform Mortgage-Backed Security, 5.00%, 30-Year, TBA | 2.6% |
| Broadcom, Inc. | 2.1% |
| Meta Platforms, Inc., Class A | 1.8% |
| U.S. Treasury Notes, 0.38%, 12/31/25 | 1.5% |
| Total | 31.8% |
| Footnote | Description |
Footnotea | Excluding cash equivalents |
If you wish to view additional information about the Fund, including the prospectus, statement of additional information, financial statements and holdings, please scan the QR code or visit www.eatonvance.com/open-end-mutual-fund-documents.php. For proxy information, please visit www.eatonvance.com/proxyvoting.
The Funds may deliver a single copy of certain required shareholder documents (including prospectuses, shareholder reports, and proxy materials) to investors with the same last name and the same address. Your participation will continue indefinitely unless you instruct otherwise by calling 1-800-262-1122 or by contacting your financial intermediary. Your instruction will typically be effective within 30 days of receipt.
Not FDIC Insured | May Lose Value | No Bank Guarantee
Annual Shareholder Report December 31, 2024
Eaton Vance Balanced Fund
Annual Shareholder Report December 31, 2024
This annual shareholder report contains important information about the Eaton Vance Balanced Fund for the period of January 1, 2024 to December 31, 2024. You can find additional information about the Fund at www.eatonvance.com/open-end-mutual-fund-documents.php. You can also request this information by contacting us at 1-800-262-1122.
What were the Fund costs for the last year?Footnote Reference*
(based on a hypothetical $10,000 investment)
| Class Name | Costs of a $10,000 investment | Costs paid as a percentage of a $10,000 investment |
|---|
| Class I | $79 | 0.72% |
|---|
| Footnote | Description |
Footnote* | Expenses in the table reflect the expenses of both the Fund and Stock Portfolio and Core Bond Portfolio, the Portfolios in which it invests. |
How did the Fund perform last year and what affected its performance?
Key contributors to (↑) and detractors from (↓) performance, relative to the S&P 500® Index (the Index), and the Bloomberg U.S. Aggregate Bond Index (the Secondary Index):
• The Fund invests in a blend of Stock Portfolio — the Fund’s equity allocation — and Core Bond Portfolio — the Fund’s fixed-income allocation
↓ Core Bond Portfolio underperformed the Index and detracted from Index-relative returns during the period — but outperformed the Secondary Index
↓ An underweight exposure to agency mortgage-backed securities (MBS), yield-curve positioning, and the use of derivatives detracted from returns during the period
↑ Bond selections ― notably in investment-grade corporate bonds ― and sector allocations ― notably an overweight exposure to commercial MBS ― aided returns
↑ Stock Portfolio outperformed the Index; an overweight position in artificial intelligence chipmaker NVIDIA Corp. contributed to Index-relative returns
↑ Among sectors, stock selections and underweight exposures to health care and consumer staples, and stock selections in information technology, helped returns
↓ An overweight position in energy exploration and production firm ConocoPhillips fell in value as global energy demand and oil prices weakened during the period
↓ Among sectors within the Index, the Fund’s stock selections in the energy and real estate sectors detracted from Index-relative performance during the period
Comparison of the change in value of a $1,000,000 investment for the period indicated.
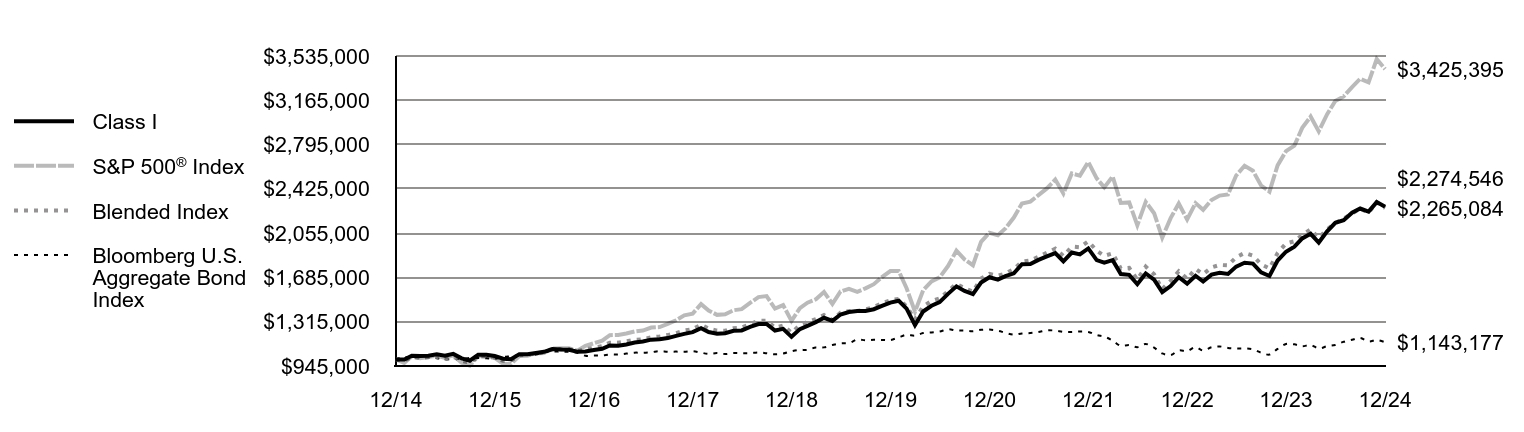
| Class I | S&P 500® Index | Blended Index | Bloomberg U.S. Aggregate Bond Index |
|---|
| 12/14 | $1,000,000 | $1,000,000 | $1,000,000 | $1,000,000 |
|---|
| 1/15 | $998,818 | $969,981 | $990,376 | $1,020,969 |
|---|
| 2/15 | $1,030,733 | $1,025,727 | $1,020,802 | $1,011,370 |
|---|
| 3/15 | $1,029,209 | $1,009,506 | $1,013,012 | $1,016,066 |
|---|
| 4/15 | $1,031,580 | $1,019,190 | $1,017,389 | $1,012,420 |
|---|
| 5/15 | $1,043,087 | $1,032,296 | $1,024,259 | $1,009,982 |
|---|
| 6/15 | $1,030,063 | $1,012,313 | $1,007,895 | $998,970 |
|---|
| 7/15 | $1,046,005 | $1,033,522 | $1,023,368 | $1,005,914 |
|---|
| 8/15 | $1,009,217 | $971,166 | $985,733 | $1,004,469 |
|---|
| 9/15 | $988,884 | $947,136 | $973,766 | $1,011,264 |
|---|
| 10/15 | $1,039,375 | $1,027,030 | $1,023,116 | $1,011,431 |
|---|
| 11/15 | $1,039,375 | $1,030,085 | $1,023,860 | $1,008,759 |
|---|
| 12/15 | $1,028,821 | $1,013,838 | $1,012,848 | $1,005,500 |
|---|
| 1/16 | $1,006,210 | $963,527 | $988,266 | $1,019,336 |
|---|
| 2/16 | $1,001,185 | $962,227 | $990,270 | $1,026,567 |
|---|
| 3/16 | $1,044,065 | $1,027,503 | $1,034,211 | $1,035,986 |
|---|
| 4/16 | $1,044,065 | $1,031,487 | $1,038,205 | $1,039,963 |
|---|
| 5/16 | $1,054,165 | $1,050,010 | $1,049,498 | $1,040,229 |
|---|
| 6/16 | $1,063,672 | $1,052,731 | $1,058,672 | $1,058,920 |
|---|
| 7/16 | $1,086,496 | $1,091,544 | $1,084,769 | $1,065,615 |
|---|
| 8/16 | $1,082,692 | $1,093,076 | $1,085,186 | $1,064,396 |
|---|
| 9/16 | $1,080,719 | $1,093,283 | $1,085,055 | $1,063,773 |
|---|
| 10/16 | $1,064,174 | $1,073,340 | $1,069,860 | $1,055,636 |
|---|
| 11/16 | $1,065,445 | $1,113,091 | $1,083,511 | $1,030,666 |
|---|
| 12/16 | $1,078,804 | $1,135,093 | $1,096,972 | $1,032,120 |
|---|
| 1/17 | $1,089,066 | $1,156,621 | $1,110,316 | $1,034,145 |
|---|
| 2/17 | $1,116,007 | $1,202,546 | $1,139,753 | $1,041,096 |
|---|
| 3/17 | $1,114,801 | $1,203,949 | $1,140,311 | $1,040,550 |
|---|
| 4/17 | $1,125,112 | $1,216,313 | $1,150,858 | $1,048,580 |
|---|
| 5/17 | $1,141,871 | $1,233,430 | $1,164,119 | $1,056,651 |
|---|
| 6/17 | $1,149,906 | $1,241,129 | $1,168,010 | $1,055,587 |
|---|
| 7/17 | $1,165,040 | $1,266,650 | $1,184,431 | $1,060,130 |
|---|
| 8/17 | $1,168,939 | $1,270,527 | $1,190,856 | $1,069,639 |
|---|
| 9/17 | $1,178,104 | $1,296,736 | $1,203,326 | $1,064,544 |
|---|
| 10/17 | $1,196,392 | $1,326,995 | $1,220,453 | $1,065,161 |
|---|
| 11/17 | $1,213,368 | $1,367,694 | $1,242,285 | $1,063,794 |
|---|
| 12/17 | $1,227,788 | $1,382,901 | $1,252,853 | $1,068,676 |
|---|
| 1/18 | $1,261,476 | $1,462,078 | $1,290,120 | $1,056,368 |
|---|
| 2/18 | $1,229,135 | $1,408,190 | $1,256,698 | $1,046,354 |
|---|
| 3/18 | $1,215,100 | $1,372,403 | $1,240,760 | $1,053,065 |
|---|
| 4/18 | $1,219,164 | $1,377,669 | $1,239,925 | $1,045,232 |
|---|
| 5/18 | $1,239,463 | $1,410,846 | $1,261,380 | $1,052,692 |
|---|
| 6/18 | $1,242,191 | $1,419,530 | $1,265,418 | $1,051,397 |
|---|
| 7/18 | $1,272,088 | $1,472,355 | $1,293,793 | $1,051,647 |
|---|
| 8/18 | $1,295,882 | $1,520,333 | $1,322,418 | $1,058,414 |
|---|
| 9/18 | $1,296,357 | $1,528,986 | $1,323,528 | $1,051,599 |
|---|
| 10/18 | $1,241,540 | $1,424,480 | $1,265,066 | $1,043,288 |
|---|
| 11/18 | $1,255,240 | $1,453,508 | $1,283,555 | $1,049,516 |
|---|
| 12/18 | $1,188,640 | $1,322,270 | $1,223,451 | $1,068,797 |
|---|
| 1/19 | $1,253,240 | $1,428,231 | $1,287,474 | $1,080,147 |
|---|
| 2/19 | $1,280,521 | $1,474,089 | $1,311,978 | $1,079,522 |
|---|
| 3/19 | $1,311,912 | $1,502,733 | $1,337,352 | $1,100,250 |
|---|
| 4/19 | $1,347,952 | $1,563,578 | $1,369,978 | $1,100,532 |
|---|
| 5/19 | $1,322,004 | $1,464,216 | $1,327,470 | $1,120,068 |
|---|
| 6/19 | $1,375,265 | $1,567,408 | $1,390,271 | $1,134,134 |
|---|
| 7/19 | $1,395,530 | $1,589,935 | $1,403,483 | $1,136,629 |
|---|
| 8/19 | $1,404,917 | $1,564,750 | $1,404,691 | $1,166,081 |
|---|
| 9/19 | $1,404,835 | $1,594,027 | $1,417,468 | $1,159,870 |
|---|
| 10/19 | $1,419,436 | $1,628,553 | $1,437,597 | $1,163,364 |
|---|
| 11/19 | $1,447,187 | $1,687,668 | $1,468,614 | $1,162,772 |
|---|
| 12/19 | $1,474,800 | $1,738,605 | $1,494,800 | $1,161,961 |
|---|
| 1/20 | $1,489,759 | $1,737,924 | $1,505,955 | $1,184,323 |
|---|
| 2/20 | $1,423,952 | $1,594,859 | $1,442,416 | $1,205,639 |
|---|
| 3/20 | $1,286,199 | $1,397,874 | $1,332,126 | $1,198,544 |
|---|
| 4/20 | $1,400,389 | $1,577,072 | $1,444,060 | $1,219,849 |
|---|
| 5/20 | $1,448,469 | $1,652,185 | $1,488,016 | $1,225,529 |
|---|
| 6/20 | $1,478,310 | $1,685,042 | $1,509,521 | $1,233,249 |
|---|
| 7/20 | $1,547,702 | $1,780,054 | $1,569,609 | $1,251,670 |
|---|
| 8/20 | $1,610,597 | $1,908,005 | $1,632,236 | $1,241,566 |
|---|
| 9/20 | $1,571,684 | $1,835,507 | $1,594,666 | $1,240,886 |
|---|
| 10/20 | $1,545,689 | $1,786,694 | $1,566,373 | $1,235,345 |
|---|
| 11/20 | $1,642,008 | $1,982,273 | $1,675,398 | $1,247,466 |
|---|
| 12/20 | $1,686,602 | $2,058,487 | $1,714,971 | $1,249,185 |
|---|
| 1/21 | $1,666,536 | $2,037,705 | $1,699,664 | $1,240,229 |
|---|
| 2/21 | $1,695,862 | $2,093,895 | $1,717,967 | $1,222,319 |
|---|
| 3/21 | $1,719,564 | $2,185,598 | $1,754,530 | $1,207,057 |
|---|
| 4/21 | $1,795,404 | $2,302,241 | $1,816,257 | $1,216,592 |
|---|
| 5/21 | $1,796,954 | $2,318,321 | $1,826,242 | $1,220,567 |
|---|
| 6/21 | $1,831,395 | $2,372,442 | $1,856,954 | $1,229,143 |
|---|
| 7/21 | $1,860,888 | $2,428,799 | $1,891,726 | $1,242,886 |
|---|
| 8/21 | $1,888,825 | $2,502,648 | $1,924,797 | $1,240,520 |
|---|
| 9/21 | $1,819,995 | $2,386,250 | $1,864,418 | $1,229,779 |
|---|
| 10/21 | $1,893,106 | $2,553,435 | $1,942,587 | $1,229,440 |
|---|
| 11/21 | $1,877,550 | $2,535,743 | $1,936,810 | $1,233,078 |
|---|
| 12/21 | $1,927,436 | $2,649,385 | $1,986,908 | $1,229,922 |
|---|
| 1/22 | $1,830,226 | $2,512,287 | $1,908,095 | $1,203,425 |
|---|
| 2/22 | $1,808,438 | $2,437,066 | $1,865,302 | $1,189,999 |
|---|
| 3/22 | $1,829,173 | $2,527,553 | $1,886,128 | $1,156,939 |
|---|
| 4/22 | $1,713,168 | $2,307,145 | $1,758,813 | $1,113,035 |
|---|
| 5/22 | $1,706,443 | $2,311,378 | $1,765,286 | $1,120,212 |
|---|
| 6/22 | $1,628,368 | $2,120,588 | $1,666,780 | $1,102,638 |
|---|
| 7/22 | $1,717,802 | $2,316,116 | $1,775,282 | $1,129,580 |
|---|
| 8/22 | $1,665,491 | $2,221,660 | $1,711,777 | $1,097,662 |
|---|
| 9/22 | $1,562,191 | $2,017,049 | $1,587,601 | $1,050,236 |
|---|
| 10/22 | $1,613,021 | $2,180,352 | $1,656,497 | $1,036,633 |
|---|
| 11/22 | $1,687,573 | $2,302,198 | $1,736,407 | $1,074,756 |
|---|
| 12/22 | $1,633,141 | $2,169,558 | $1,673,249 | $1,069,908 |
|---|
| 1/23 | $1,698,822 | $2,305,880 | $1,756,921 | $1,102,823 |
|---|
| 2/23 | $1,650,893 | $2,249,619 | $1,713,031 | $1,074,309 |
|---|
| 3/23 | $1,708,749 | $2,332,212 | $1,768,172 | $1,101,599 |
|---|
| 4/23 | $1,723,018 | $2,368,614 | $1,789,018 | $1,108,275 |
|---|
| 5/23 | $1,714,100 | $2,378,910 | $1,785,892 | $1,096,208 |
|---|
| 6/23 | $1,775,324 | $2,536,097 | $1,854,146 | $1,092,298 |
|---|
| 7/23 | $1,807,570 | $2,617,569 | $1,889,368 | $1,091,536 |
|---|
| 8/23 | $1,800,404 | $2,575,893 | $1,866,491 | $1,084,564 |
|---|
| 9/23 | $1,727,471 | $2,453,080 | $1,794,125 | $1,057,004 |
|---|
| 10/23 | $1,696,880 | $2,401,500 | $1,760,165 | $1,040,323 |
|---|
| 11/23 | $1,826,440 | $2,620,818 | $1,888,498 | $1,087,435 |
|---|
| 12/23 | $1,899,654 | $2,739,884 | $1,968,891 | $1,129,061 |
|---|
| 1/24 | $1,941,465 | $2,785,925 | $1,986,580 | $1,125,961 |
|---|
| 2/24 | $2,010,543 | $2,934,682 | $2,038,998 | $1,110,053 |
|---|
| 3/24 | $2,049,634 | $3,029,104 | $2,085,892 | $1,120,303 |
|---|
| 4/24 | $1,976,629 | $2,905,381 | $2,013,699 | $1,092,006 |
|---|
| 5/24 | $2,069,711 | $3,049,444 | $2,087,263 | $1,110,519 |
|---|
| 6/24 | $2,141,486 | $3,158,864 | $2,140,105 | $1,121,033 |
|---|
| 7/24 | $2,163,468 | $3,197,315 | $2,175,730 | $1,147,217 |
|---|
| 8/24 | $2,225,753 | $3,274,872 | $2,219,901 | $1,163,702 |
|---|
| 9/24 | $2,260,865 | $3,344,813 | $2,260,237 | $1,179,283 |
|---|
| 10/24 | $2,235,111 | $3,314,481 | $2,225,518 | $1,150,038 |
|---|
| 11/24 | $2,314,213 | $3,509,044 | $2,313,314 | $1,162,197 |
|---|
| 12/24 | $2,274,546 | $3,425,395 | $2,265,084 | $1,143,177 |
|---|
Average Annual Total Returns (%)
| Fund | 1 Year | 5 Years | 10 Years |
|---|
| Class I | 19.74% | 9.04% | 8.56% |
|---|
S&P 500® Index | 25.02% | 14.51% | 13.09% |
|---|
| Bloomberg U.S. Aggregate Bond Index | 1.25% | (0.33)% | 1.35% |
|---|
Blended IndexFootnote Reference1 | 15.04% | 8.66% | 8.51% |
|---|
| Footnote | Description |
Footnote1 | Benchmark is an internally constructed benchmark comprised of a blend of 60% S&P 500® Index and 40% Bloomberg U.S. Aggregate Bond Index, and is rebalanced monthly. |
Performance does not reflect the deduction of taxes that a shareholder would pay on Fund distributions or redemption of Fund shares. Performance assumes that all dividends and distributions, if any, were reinvested. For more recent performance information, visit www.eatonvance.com/performance.php.
THE FUND'S PAST PERFORMANCE IS NO GUARANTEE OF FUTURE RESULTS.
| Total Net Assets | $1,013,190,430 |
|---|
| # of Portfolio Holdings (for Stock and Core Bond Portfolios) | 373 |
|---|
| Portfolio Turnover Rate | 5% |
|---|
| Total Advisory Fees Paid | $5,002,640 |
|---|
What did the Fund invest in?
The following tables reflect what the Fund invested in as of the report date.
References to the Fund's investments are to the Fund's pro rata share of the investments of Stock Portfolio and Core Bond Portfolio, affiliated investment companies in which the Fund invests substantially all of its assets.
Asset Allocation (% of total investments)
| Value | Value |
|---|
OtherFootnote Reference† | 1.2% |
| Commercial Mortgage-Backed Securities | 2.9% |
| Short-Term Investments | 4.3% |
| Asset-Backed Securities | 4.7% |
| U.S. Treasury Obligations | 7.9% |
| Corporate Bonds | 9.5% |
| U.S. Government Agency Mortgage-Backed Securities | 10.8% |
| Common Stocks | 58.7% |
| Footnote | Description |
Footnote† | Investment types less than 1% each |
Top Ten Holdings (% of total investments)Footnote Referencea
| Uniform Mortgage-Backed Security, 5.50%, 30-Year, TBA | 4.7% |
| Apple, Inc. | 4.5% |
| Microsoft Corp. | 4.5% |
| NVIDIA Corp. | 4.3% |
| Amazon.com, Inc. | 3.2% |
| Alphabet, Inc., Class C | 2.6% |
| Uniform Mortgage-Backed Security, 5.00%, 30-Year, TBA | 2.6% |
| Broadcom, Inc. | 2.1% |
| Meta Platforms, Inc., Class A | 1.8% |
| U.S. Treasury Notes, 0.38%, 12/31/25 | 1.5% |
| Total | 31.8% |
| Footnote | Description |
Footnotea | Excluding cash equivalents |
If you wish to view additional information about the Fund, including the prospectus, statement of additional information, financial statements and holdings, please scan the QR code or visit www.eatonvance.com/open-end-mutual-fund-documents.php. For proxy information, please visit www.eatonvance.com/proxyvoting.
The Funds may deliver a single copy of certain required shareholder documents (including prospectuses, shareholder reports, and proxy materials) to investors with the same last name and the same address. Your participation will continue indefinitely unless you instruct otherwise by calling 1-800-262-1122 or by contacting your financial intermediary. Your instruction will typically be effective within 30 days of receipt.
Not FDIC Insured | May Lose Value | No Bank Guarantee
Annual Shareholder Report December 31, 2024
Eaton Vance Balanced Fund
Annual Shareholder Report December 31, 2024
This annual shareholder report contains important information about the Eaton Vance Balanced Fund for the period of January 1, 2024 to December 31, 2024. You can find additional information about the Fund at www.eatonvance.com/open-end-mutual-fund-documents.php. You can also request this information by contacting us at 1-800-262-1122.
What were the Fund costs for the last year?Footnote Reference*
(based on a hypothetical $10,000 investment)
| Class Name | Costs of a $10,000 investment | Costs paid as a percentage of a $10,000 investment |
|---|
| Class R | $134 | 1.22% |
|---|
| Footnote | Description |
Footnote* | Expenses in the table reflect the expenses of both the Fund and Stock Portfolio and Core Bond Portfolio, the Portfolios in which it invests. |
How did the Fund perform last year and what affected its performance?
Key contributors to (↑) and detractors from (↓) performance, relative to the S&P 500® Index (the Index), and the Bloomberg U.S. Aggregate Bond Index (the Secondary Index):
• The Fund invests in a blend of Stock Portfolio — the Fund’s equity allocation — and Core Bond Portfolio — the Fund’s fixed-income allocation
↓ Core Bond Portfolio underperformed the Index and detracted from Index-relative returns during the period — but outperformed the Secondary Index
↓ An underweight exposure to agency mortgage-backed securities (MBS), yield-curve positioning, and the use of derivatives detracted from returns during the period
↑ Bond selections ― notably in investment-grade corporate bonds ― and sector allocations ― notably an overweight exposure to commercial MBS ― aided returns
↑ Stock Portfolio outperformed the Index; an overweight position in artificial intelligence chipmaker NVIDIA Corp. contributed to Index-relative returns
↑ Among sectors, stock selections and underweight exposures to health care and consumer staples, and stock selections in information technology, helped returns
↓ An overweight position in energy exploration and production firm ConocoPhillips fell in value as global energy demand and oil prices weakened during the period
↓ Among sectors within the Index, the Fund’s stock selections in the energy and real estate sectors detracted from Index-relative performance during the period
Comparison of the change in value of a $10,000 investment for the period indicated.
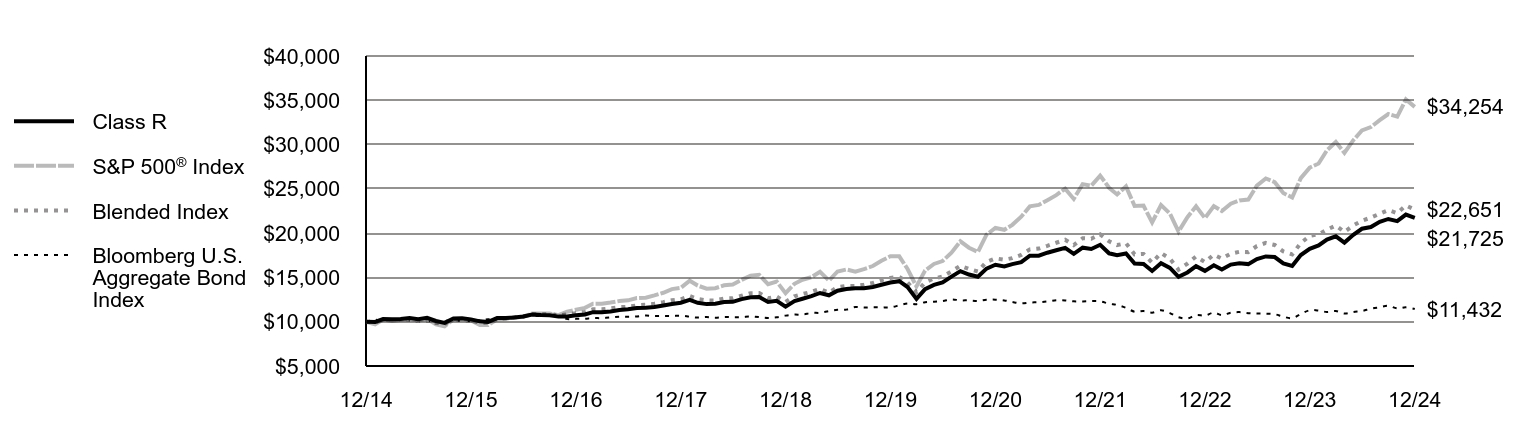
| Class R | S&P 500® Index | Blended Index | Bloomberg U.S. Aggregate Bond Index |
|---|
| 12/14 | $10,000 | $10,000 | $10,000 | $10,000 |
|---|
| 1/15 | $9,976 | $9,700 | $9,904 | $10,210 |
|---|
| 2/15 | $10,296 | $10,257 | $10,208 | $10,114 |
|---|
| 3/15 | $10,287 | $10,095 | $10,130 | $10,161 |
|---|
| 4/15 | $10,299 | $10,192 | $10,174 | $10,124 |
|---|
| 5/15 | $10,426 | $10,323 | $10,243 | $10,100 |
|---|
| 6/15 | $10,290 | $10,123 | $10,079 | $9,990 |
|---|
| 7/15 | $10,437 | $10,335 | $10,234 | $10,059 |
|---|
| 8/15 | $10,082 | $9,712 | $9,857 | $10,045 |
|---|
| 9/15 | $9,873 | $9,471 | $9,738 | $10,113 |
|---|
| 10/15 | $10,364 | $10,270 | $10,231 | $10,114 |
|---|
| 11/15 | $10,377 | $10,301 | $10,239 | $10,088 |
|---|
| 12/15 | $10,265 | $10,138 | $10,128 | $10,055 |
|---|
| 1/16 | $10,039 | $9,635 | $9,883 | $10,193 |
|---|
| 2/16 | $9,977 | $9,622 | $9,903 | $10,266 |
|---|
| 3/16 | $10,411 | $10,275 | $10,342 | $10,360 |
|---|
| 4/16 | $10,411 | $10,315 | $10,382 | $10,400 |
|---|
| 5/16 | $10,487 | $10,500 | $10,495 | $10,402 |
|---|
| 6/16 | $10,587 | $10,527 | $10,587 | $10,589 |
|---|
| 7/16 | $10,814 | $10,915 | $10,848 | $10,656 |
|---|
| 8/16 | $10,763 | $10,931 | $10,852 | $10,644 |
|---|
| 9/16 | $10,741 | $10,933 | $10,851 | $10,638 |
|---|
| 10/16 | $10,577 | $10,733 | $10,699 | $10,556 |
|---|
| 11/16 | $10,589 | $11,131 | $10,835 | $10,307 |
|---|
| 12/16 | $10,722 | $11,351 | $10,970 | $10,321 |
|---|
| 1/17 | $10,811 | $11,566 | $11,103 | $10,341 |
|---|
| 2/17 | $11,079 | $12,025 | $11,398 | $10,411 |
|---|
| 3/17 | $11,068 | $12,039 | $11,403 | $10,406 |
|---|
| 4/17 | $11,158 | $12,163 | $11,509 | $10,486 |
|---|
| 5/17 | $11,311 | $12,334 | $11,641 | $10,567 |
|---|
| 6/17 | $11,403 | $12,411 | $11,680 | $10,556 |
|---|
| 7/17 | $11,540 | $12,667 | $11,844 | $10,601 |
|---|
| 8/17 | $11,579 | $12,705 | $11,909 | $10,696 |
|---|
| 9/17 | $11,656 | $12,967 | $12,033 | $10,645 |
|---|
| 10/17 | $11,837 | $13,270 | $12,205 | $10,652 |
|---|
| 11/17 | $11,993 | $13,677 | $12,423 | $10,638 |
|---|
| 12/17 | $12,139 | $13,829 | $12,529 | $10,687 |
|---|
| 1/18 | $12,459 | $14,621 | $12,901 | $10,564 |
|---|
| 2/18 | $12,139 | $14,082 | $12,567 | $10,464 |
|---|
| 3/18 | $11,988 | $13,724 | $12,408 | $10,531 |
|---|
| 4/18 | $12,041 | $13,777 | $12,399 | $10,452 |
|---|
| 5/18 | $12,229 | $14,108 | $12,614 | $10,527 |
|---|
| 6/18 | $12,242 | $14,195 | $12,654 | $10,514 |
|---|
| 7/18 | $12,551 | $14,724 | $12,938 | $10,516 |
|---|
| 8/18 | $12,759 | $15,203 | $13,224 | $10,584 |
|---|
| 9/18 | $12,777 | $15,290 | $13,235 | $10,516 |
|---|
| 10/18 | $12,222 | $14,245 | $12,651 | $10,433 |
|---|
| 11/18 | $12,358 | $14,535 | $12,836 | $10,495 |
|---|
| 12/18 | $11,701 | $13,223 | $12,235 | $10,688 |
|---|
| 1/19 | $12,324 | $14,282 | $12,875 | $10,801 |
|---|
| 2/19 | $12,593 | $14,741 | $13,120 | $10,795 |
|---|
| 3/19 | $12,888 | $15,027 | $13,374 | $11,003 |
|---|
| 4/19 | $13,243 | $15,636 | $13,700 | $11,005 |
|---|
| 5/19 | $12,987 | $14,642 | $13,275 | $11,201 |
|---|
| 6/19 | $13,497 | $15,674 | $13,903 | $11,341 |
|---|
| 7/19 | $13,696 | $15,899 | $14,035 | $11,366 |
|---|
| 8/19 | $13,775 | $15,648 | $14,047 | $11,661 |
|---|
| 9/19 | $13,771 | $15,940 | $14,175 | $11,599 |
|---|
| 10/19 | $13,915 | $16,286 | $14,376 | $11,634 |
|---|
| 11/19 | $14,173 | $16,877 | $14,686 | $11,628 |
|---|
| 12/19 | $14,428 | $17,386 | $14,948 | $11,620 |
|---|
| 1/20 | $14,575 | $17,379 | $15,060 | $11,843 |
|---|
| 2/20 | $13,914 | $15,949 | $14,424 | $12,056 |
|---|
| 3/20 | $12,576 | $13,979 | $13,321 | $11,985 |
|---|
| 4/20 | $13,682 | $15,771 | $14,441 | $12,198 |
|---|
| 5/20 | $14,153 | $16,522 | $14,880 | $12,255 |
|---|
| 6/20 | $14,431 | $16,850 | $15,095 | $12,332 |
|---|
| 7/20 | $15,096 | $17,801 | $15,696 | $12,517 |
|---|
| 8/20 | $15,712 | $19,080 | $16,322 | $12,416 |
|---|
| 9/20 | $15,326 | $18,355 | $15,947 | $12,409 |
|---|
| 10/20 | $15,072 | $17,867 | $15,664 | $12,353 |
|---|
| 11/20 | $16,000 | $19,823 | $16,754 | $12,475 |
|---|
| 12/20 | $16,432 | $20,585 | $17,150 | $12,492 |
|---|
| 1/21 | $16,236 | $20,377 | $16,997 | $12,402 |
|---|
| 2/21 | $16,508 | $20,939 | $17,180 | $12,223 |
|---|
| 3/21 | $16,720 | $21,856 | $17,545 | $12,071 |
|---|
| 4/21 | $17,461 | $23,022 | $18,163 | $12,166 |
|---|
| 5/21 | $17,461 | $23,183 | $18,262 | $12,206 |
|---|
| 6/21 | $17,792 | $23,724 | $18,570 | $12,291 |
|---|
| 7/21 | $18,065 | $24,288 | $18,917 | $12,429 |
|---|
| 8/21 | $18,337 | $25,026 | $19,248 | $12,405 |
|---|
| 9/21 | $17,660 | $23,863 | $18,644 | $12,298 |
|---|
| 10/21 | $18,357 | $25,534 | $19,426 | $12,294 |
|---|
| 11/21 | $18,206 | $25,357 | $19,368 | $12,331 |
|---|
| 12/21 | $18,686 | $26,494 | $19,869 | $12,299 |
|---|
| 1/22 | $17,723 | $25,123 | $19,081 | $12,034 |
|---|
| 2/22 | $17,511 | $24,371 | $18,653 | $11,900 |
|---|
| 3/22 | $17,707 | $25,276 | $18,861 | $11,569 |
|---|
| 4/22 | $16,579 | $23,071 | $17,588 | $11,130 |
|---|
| 5/22 | $16,513 | $23,114 | $17,653 | $11,202 |
|---|
| 6/22 | $15,733 | $21,206 | $16,668 | $11,026 |
|---|
| 7/22 | $16,602 | $23,161 | $17,753 | $11,296 |
|---|
| 8/22 | $16,078 | $22,217 | $17,118 | $10,977 |
|---|
| 9/22 | $15,072 | $20,170 | $15,876 | $10,502 |
|---|
| 10/22 | $15,565 | $21,804 | $16,565 | $10,366 |
|---|
| 11/22 | $16,272 | $23,022 | $17,364 | $10,748 |
|---|
| 12/22 | $15,740 | $21,696 | $16,732 | $10,699 |
|---|
| 1/23 | $16,376 | $23,059 | $17,569 | $11,028 |
|---|
| 2/23 | $15,895 | $22,496 | $17,130 | $10,743 |
|---|
| 3/23 | $16,452 | $23,322 | $17,682 | $11,016 |
|---|
| 4/23 | $16,590 | $23,686 | $17,890 | $11,083 |
|---|
| 5/23 | $16,504 | $23,789 | $17,859 | $10,962 |
|---|
| 6/23 | $17,075 | $25,361 | $18,541 | $10,923 |
|---|
| 7/23 | $17,369 | $26,176 | $18,894 | $10,915 |
|---|
| 8/23 | $17,300 | $25,759 | $18,665 | $10,846 |
|---|
| 9/23 | $16,592 | $24,531 | $17,941 | $10,570 |
|---|
| 10/23 | $16,296 | $24,015 | $17,602 | $10,403 |
|---|
| 11/23 | $17,530 | $26,208 | $18,885 | $10,874 |
|---|
| 12/23 | $18,232 | $27,399 | $19,689 | $11,291 |
|---|
| 1/24 | $18,617 | $27,859 | $19,866 | $11,260 |
|---|
| 2/24 | $19,283 | $29,347 | $20,390 | $11,101 |
|---|
| 3/24 | $19,637 | $30,291 | $20,859 | $11,203 |
|---|
| 4/24 | $18,933 | $29,054 | $20,137 | $10,920 |
|---|
| 5/24 | $19,812 | $30,494 | $20,873 | $11,105 |
|---|
| 6/24 | $20,497 | $31,589 | $21,401 | $11,210 |
|---|
| 7/24 | $20,690 | $31,973 | $21,757 | $11,472 |
|---|
| 8/24 | $21,272 | $32,749 | $22,199 | $11,637 |
|---|
| 9/24 | $21,601 | $33,448 | $22,602 | $11,793 |
|---|
| 10/24 | $21,354 | $33,145 | $22,255 | $11,500 |
|---|
| 11/24 | $22,096 | $35,090 | $23,133 | $11,622 |
|---|
| 12/24 | $21,725 | $34,254 | $22,651 | $11,432 |
|---|
Average Annual Total Returns (%)Footnote Reference1
| Fund | 1 Year | 5 Years | 10 Years |
|---|
| Class R | 19.16% | 8.52% | 8.06% |
|---|
S&P 500® Index | 25.02% | 14.51% | 13.09% |
|---|
| Bloomberg U.S. Aggregate Bond Index | 1.25% | (0.33)% | 1.35% |
|---|
Blended IndexFootnote Reference2 | 15.04% | 8.66% | 8.51% |
|---|
| Footnote | Description |
Footnote1 | Class R performance prior to 5/2/16 is linked to Class A. This linked performance is not adjusted for class expense differences. If adjusted for such differences, the performance would be different. Performance presented in the Financial Highlights included in the financial statements is not linked. |
Footnote2 | Benchmark is an internally constructed benchmark comprised of a blend of 60% S&P 500® Index and 40% Bloomberg U.S. Aggregate Bond Index, and is rebalanced monthly. |
Performance does not reflect the deduction of taxes that a shareholder would pay on Fund distributions or redemption of Fund shares. Performance assumes that all dividends and distributions, if any, were reinvested. For more recent performance information, visit www.eatonvance.com/performance.php.
THE FUND'S PAST PERFORMANCE IS NO GUARANTEE OF FUTURE RESULTS.
| Total Net Assets | $1,013,190,430 |
|---|
| # of Portfolio Holdings (for Stock and Core Bond Portfolios) | 373 |
|---|
| Portfolio Turnover Rate | 5% |
|---|
| Total Advisory Fees Paid | $5,002,640 |
|---|
What did the Fund invest in?
The following tables reflect what the Fund invested in as of the report date.
References to the Fund's investments are to the Fund's pro rata share of the investments of Stock Portfolio and Core Bond Portfolio, affiliated investment companies in which the Fund invests substantially all of its assets.
Asset Allocation (% of total investments)
| Value | Value |
|---|
OtherFootnote Reference† | 1.2% |
| Commercial Mortgage-Backed Securities | 2.9% |
| Short-Term Investments | 4.3% |
| Asset-Backed Securities | 4.7% |
| U.S. Treasury Obligations | 7.9% |
| Corporate Bonds | 9.5% |
| U.S. Government Agency Mortgage-Backed Securities | 10.8% |
| Common Stocks | 58.7% |
| Footnote | Description |
Footnote† | Investment types less than 1% each |
Top Ten Holdings (% of total investments)Footnote Referencea
| Uniform Mortgage-Backed Security, 5.50%, 30-Year, TBA | 4.7% |
| Apple, Inc. | 4.5% |
| Microsoft Corp. | 4.5% |
| NVIDIA Corp. | 4.3% |
| Amazon.com, Inc. | 3.2% |
| Alphabet, Inc., Class C | 2.6% |
| Uniform Mortgage-Backed Security, 5.00%, 30-Year, TBA | 2.6% |
| Broadcom, Inc. | 2.1% |
| Meta Platforms, Inc., Class A | 1.8% |
| U.S. Treasury Notes, 0.38%, 12/31/25 | 1.5% |
| Total | 31.8% |
| Footnote | Description |
Footnotea | Excluding cash equivalents |
If you wish to view additional information about the Fund, including the prospectus, statement of additional information, financial statements and holdings, please scan the QR code or visit www.eatonvance.com/open-end-mutual-fund-documents.php. For proxy information, please visit www.eatonvance.com/proxyvoting.
The Funds may deliver a single copy of certain required shareholder documents (including prospectuses, shareholder reports, and proxy materials) to investors with the same last name and the same address. Your participation will continue indefinitely unless you instruct otherwise by calling 1-800-262-1122 or by contacting your financial intermediary. Your instruction will typically be effective within 30 days of receipt.
Not FDIC Insured | May Lose Value | No Bank Guarantee
Annual Shareholder Report December 31, 2024
Eaton Vance Balanced Fund
Annual Shareholder Report December 31, 2024
This annual shareholder report contains important information about the Eaton Vance Balanced Fund for the period of January 1, 2024 to December 31, 2024. You can find additional information about the Fund at www.eatonvance.com/open-end-mutual-fund-documents.php. You can also request this information by contacting us at 1-800-262-1122.
What were the Fund costs for the last year?Footnote Reference*
(based on a hypothetical $10,000 investment)
| Class Name | Costs of a $10,000 investment | Costs paid as a percentage of a $10,000 investment |
|---|
| Class R6 | $75 | 0.68% |
|---|
| Footnote | Description |
Footnote* | Expenses in the table reflect the expenses of both the Fund and Stock Portfolio and Core Bond Portfolio, the Portfolios in which it invests. |
How did the Fund perform last year and what affected its performance?
Key contributors to (↑) and detractors from (↓) performance, relative to the S&P 500® Index (the Index), and the Bloomberg U.S. Aggregate Bond Index (the Secondary Index):
• The Fund invests in a blend of Stock Portfolio — the Fund’s equity allocation — and Core Bond Portfolio — the Fund’s fixed-income allocation
↓ Core Bond Portfolio underperformed the Index and detracted from Index-relative returns during the period — but outperformed the Secondary Index
↓ An underweight exposure to agency mortgage-backed securities (MBS), yield-curve positioning, and the use of derivatives detracted from returns during the period
↑ Bond selections ― notably in investment-grade corporate bonds ― and sector allocations ― notably an overweight exposure to commercial MBS ― aided returns
↑ Stock Portfolio outperformed the Index; an overweight position in artificial intelligence chipmaker NVIDIA Corp. contributed to Index-relative returns
↑ Among sectors, stock selections and underweight exposures to health care and consumer staples, and stock selections in information technology, helped returns
↓ An overweight position in energy exploration and production firm ConocoPhillips fell in value as global energy demand and oil prices weakened during the period
↓ Among sectors within the Index, the Fund’s stock selections in the energy and real estate sectors detracted from Index-relative performance during the period
Comparison of the change in value of a $5,000,000 investment for the period indicated.
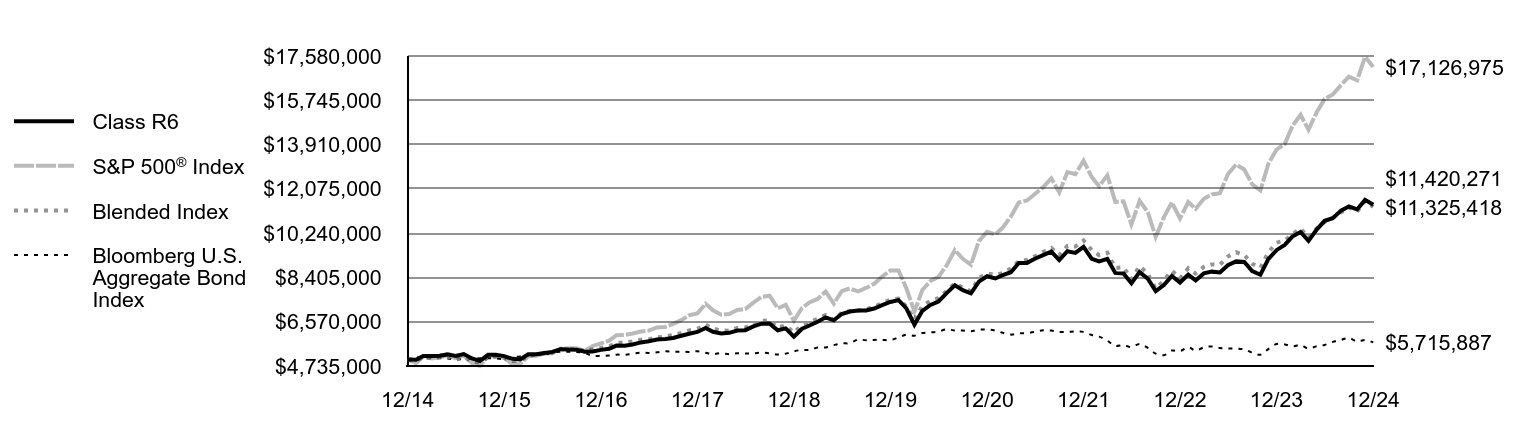
| Class R6 | S&P 500® Index | Blended Index | Bloomberg U.S. Aggregate Bond Index |
|---|
| 12/14 | $5,000,000 | $5,000,000 | $5,000,000 | $5,000,000 |
|---|
| 1/15 | $4,994,090 | $4,849,904 | $4,951,881 | $5,104,846 |
|---|
| 2/15 | $5,153,664 | $5,128,635 | $5,104,012 | $5,056,848 |
|---|
| 3/15 | $5,146,044 | $5,047,528 | $5,065,062 | $5,080,330 |
|---|
| 4/15 | $5,157,901 | $5,095,950 | $5,086,947 | $5,062,101 |
|---|
| 5/15 | $5,215,435 | $5,161,481 | $5,121,295 | $5,049,910 |
|---|
| 6/15 | $5,150,317 | $5,061,564 | $5,039,476 | $4,994,848 |
|---|
| 7/15 | $5,230,025 | $5,167,610 | $5,116,838 | $5,029,568 |
|---|
| 8/15 | $5,046,085 | $4,855,829 | $4,928,667 | $5,022,345 |
|---|
| 9/15 | $4,944,420 | $4,735,678 | $4,868,831 | $5,056,318 |
|---|
| 10/15 | $5,196,875 | $5,135,152 | $5,115,578 | $5,057,157 |
|---|
| 11/15 | $5,196,875 | $5,150,423 | $5,119,300 | $5,043,797 |
|---|
| 12/15 | $5,144,107 | $5,069,192 | $5,064,238 | $5,027,498 |
|---|
| 1/16 | $5,031,050 | $4,817,637 | $4,941,329 | $5,096,682 |
|---|
| 2/16 | $5,005,926 | $4,811,137 | $4,951,350 | $5,132,837 |
|---|
| 3/16 | $5,220,327 | $5,137,516 | $5,171,056 | $5,179,931 |
|---|
| 4/16 | $5,220,327 | $5,157,433 | $5,191,023 | $5,199,814 |
|---|
| 5/16 | $5,270,826 | $5,250,051 | $5,247,489 | $5,201,147 |
|---|
| 6/16 | $5,318,583 | $5,263,654 | $5,293,361 | $5,294,601 |
|---|
| 7/16 | $5,432,711 | $5,457,718 | $5,423,843 | $5,328,074 |
|---|
| 8/16 | $5,413,688 | $5,465,381 | $5,425,931 | $5,321,982 |
|---|
| 9/16 | $5,404,605 | $5,466,414 | $5,425,275 | $5,318,864 |
|---|
| 10/16 | $5,328,231 | $5,366,700 | $5,349,298 | $5,278,180 |
|---|
| 11/16 | $5,334,583 | $5,565,456 | $5,417,553 | $5,153,332 |
|---|
| 12/16 | $5,402,460 | $5,675,463 | $5,484,859 | $5,160,600 |
|---|
| 1/17 | $5,447,381 | $5,783,106 | $5,551,581 | $5,170,726 |
|---|
| 2/17 | $5,582,139 | $6,012,730 | $5,698,764 | $5,205,478 |
|---|
| 3/17 | $5,577,024 | $6,019,744 | $5,701,557 | $5,202,748 |
|---|
| 4/17 | $5,628,606 | $6,081,566 | $5,754,290 | $5,242,898 |
|---|
| 5/17 | $5,712,446 | $6,167,151 | $5,820,594 | $5,283,253 |
|---|
| 6/17 | $5,760,186 | $6,205,643 | $5,840,048 | $5,277,936 |
|---|
| 7/17 | $5,829,389 | $6,333,248 | $5,922,153 | $5,300,648 |
|---|
| 8/17 | $5,855,406 | $6,352,635 | $5,954,278 | $5,348,193 |
|---|
| 9/17 | $5,895,717 | $6,483,678 | $6,016,630 | $5,322,721 |
|---|
| 10/17 | $5,987,239 | $6,634,977 | $6,102,264 | $5,325,804 |
|---|
| 11/17 | $6,072,194 | $6,838,471 | $6,211,424 | $5,318,968 |
|---|
| 12/17 | $6,145,297 | $6,914,505 | $6,264,265 | $5,343,380 |
|---|
| 1/18 | $6,313,911 | $7,310,388 | $6,450,599 | $5,281,841 |
|---|
| 2/18 | $6,152,038 | $7,040,948 | $6,283,490 | $5,231,772 |
|---|
| 3/18 | $6,082,674 | $6,862,015 | $6,203,798 | $5,265,323 |
|---|
| 4/18 | $6,109,791 | $6,888,345 | $6,199,624 | $5,226,162 |
|---|
| 5/18 | $6,204,636 | $7,054,230 | $6,306,902 | $5,263,461 |
|---|
| 6/18 | $6,219,370 | $7,097,648 | $6,327,090 | $5,256,987 |
|---|
| 7/18 | $6,375,864 | $7,361,777 | $6,468,964 | $5,258,237 |
|---|
| 8/18 | $6,488,213 | $7,601,663 | $6,612,090 | $5,292,071 |
|---|
| 9/18 | $6,491,574 | $7,644,931 | $6,617,640 | $5,257,993 |
|---|
| 10/18 | $6,217,074 | $7,122,399 | $6,325,332 | $5,216,442 |
|---|
| 11/18 | $6,292,541 | $7,267,542 | $6,417,776 | $5,247,582 |
|---|
| 12/18 | $5,953,254 | $6,611,349 | $6,117,257 | $5,343,987 |
|---|
| 1/19 | $6,276,804 | $7,141,155 | $6,437,369 | $5,400,737 |
|---|
| 2/19 | $6,413,438 | $7,370,445 | $6,559,892 | $5,397,608 |
|---|
| 3/19 | $6,570,543 | $7,513,666 | $6,686,759 | $5,501,252 |
|---|
| 4/19 | $6,751,046 | $7,817,891 | $6,849,891 | $5,502,660 |
|---|
| 5/19 | $6,628,307 | $7,321,079 | $6,637,350 | $5,600,341 |
|---|
| 6/19 | $6,888,548 | $7,837,041 | $6,951,357 | $5,670,671 |
|---|
| 7/19 | $6,990,053 | $7,949,676 | $7,017,416 | $5,683,144 |
|---|
| 8/19 | $7,037,072 | $7,823,750 | $7,023,455 | $5,830,404 |
|---|
| 9/19 | $7,037,471 | $7,970,136 | $7,087,339 | $5,799,352 |
|---|
| 10/19 | $7,117,934 | $8,142,767 | $7,187,984 | $5,816,820 |
|---|
| 11/19 | $7,256,933 | $8,438,340 | $7,343,070 | $5,813,858 |
|---|
| 12/19 | $7,388,814 | $8,693,027 | $7,474,000 | $5,809,806 |
|---|
| 1/20 | $7,463,761 | $8,689,618 | $7,529,775 | $5,921,613 |
|---|
| 2/20 | $7,134,064 | $7,974,296 | $7,212,078 | $6,028,194 |
|---|
| 3/20 | $6,444,646 | $6,989,368 | $6,660,631 | $5,992,719 |
|---|
| 4/20 | $7,024,337 | $7,885,361 | $7,220,302 | $6,099,247 |
|---|
| 5/20 | $7,265,248 | $8,260,926 | $7,440,082 | $6,127,644 |
|---|
| 6/20 | $7,408,230 | $8,425,212 | $7,547,606 | $6,166,243 |
|---|
| 7/20 | $7,755,977 | $8,900,269 | $7,848,045 | $6,258,348 |
|---|
| 8/20 | $8,078,798 | $9,540,025 | $8,161,179 | $6,207,832 |
|---|
| 9/20 | $7,876,964 | $9,177,536 | $7,973,331 | $6,204,429 |
|---|
| 10/20 | $7,746,682 | $8,933,470 | $7,831,865 | $6,176,725 |
|---|
| 11/20 | $8,229,415 | $9,911,364 | $8,376,989 | $6,237,332 |
|---|
| 12/20 | $8,453,717 | $10,292,437 | $8,574,854 | $6,245,927 |
|---|
| 1/21 | $8,360,876 | $10,188,527 | $8,498,320 | $6,201,145 |
|---|
| 2/21 | $8,500,100 | $10,469,475 | $8,589,836 | $6,111,597 |
|---|
| 3/21 | $8,619,845 | $10,927,992 | $8,772,651 | $6,035,284 |
|---|
| 4/21 | $9,007,777 | $11,511,206 | $9,081,284 | $6,082,962 |
|---|
| 5/21 | $9,007,814 | $11,591,604 | $9,131,208 | $6,102,836 |
|---|
| 6/21 | $9,181,415 | $11,862,208 | $9,284,770 | $6,145,714 |
|---|
| 7/21 | $9,329,277 | $12,143,994 | $9,458,631 | $6,214,430 |
|---|
| 8/21 | $9,477,114 | $12,513,240 | $9,623,984 | $6,202,598 |
|---|
| 9/21 | $9,125,167 | $11,931,252 | $9,322,090 | $6,148,896 |
|---|
| 10/21 | $9,491,734 | $12,767,177 | $9,712,935 | $6,147,201 |
|---|
| 11/21 | $9,421,540 | $12,678,713 | $9,684,049 | $6,165,388 |
|---|
| 12/21 | $9,673,130 | $13,246,924 | $9,934,538 | $6,149,612 |
|---|
| 1/22 | $9,177,288 | $12,561,435 | $9,540,476 | $6,017,124 |
|---|
| 2/22 | $9,068,034 | $12,185,328 | $9,326,508 | $5,949,995 |
|---|
| 3/22 | $9,173,049 | $12,637,763 | $9,430,638 | $5,784,693 |
|---|
| 4/22 | $8,591,303 | $11,535,727 | $8,794,067 | $5,565,176 |
|---|
| 5/22 | $8,566,009 | $11,556,891 | $8,826,428 | $5,601,058 |
|---|
| 6/22 | $8,167,025 | $10,602,941 | $8,333,900 | $5,513,188 |
|---|
| 7/22 | $8,624,040 | $11,580,580 | $8,876,408 | $5,647,901 |
|---|
| 8/22 | $8,353,216 | $11,108,302 | $8,558,884 | $5,488,311 |
|---|
| 9/22 | $7,836,101 | $10,085,243 | $7,938,007 | $5,251,180 |
|---|
| 10/22 | $8,091,071 | $10,901,758 | $8,282,484 | $5,183,165 |
|---|
| 11/22 | $8,465,029 | $11,510,992 | $8,682,037 | $5,373,780 |
|---|
| 12/22 | $8,192,682 | $10,847,792 | $8,366,245 | $5,349,540 |
|---|
| 1/23 | $8,522,170 | $11,529,401 | $8,784,607 | $5,514,113 |
|---|
| 2/23 | $8,281,733 | $11,248,096 | $8,565,154 | $5,371,544 |
|---|
| 3/23 | $8,573,036 | $11,661,061 | $8,840,862 | $5,507,994 |
|---|
| 4/23 | $8,644,627 | $11,843,072 | $8,945,090 | $5,541,376 |
|---|
| 5/23 | $8,608,832 | $11,894,550 | $8,929,459 | $5,481,038 |
|---|
| 6/23 | $8,908,110 | $12,680,485 | $9,270,730 | $5,461,489 |
|---|
| 7/23 | $9,069,913 | $13,087,845 | $9,446,838 | $5,457,682 |
|---|
| 8/23 | $9,042,946 | $12,879,467 | $9,332,457 | $5,422,822 |
|---|
| 9/23 | $8,668,952 | $12,265,401 | $8,970,624 | $5,285,019 |
|---|
| 10/23 | $8,515,439 | $12,007,502 | $8,800,825 | $5,201,615 |
|---|
| 11/23 | $9,165,611 | $13,104,092 | $9,442,491 | $5,437,177 |
|---|
| 12/23 | $9,534,135 | $13,699,419 | $9,844,457 | $5,645,307 |
|---|
| 1/24 | $9,753,100 | $13,929,627 | $9,932,901 | $5,629,804 |
|---|
| 2/24 | $10,099,796 | $14,673,408 | $10,194,991 | $5,550,265 |
|---|
| 3/24 | $10,288,071 | $15,145,519 | $10,429,459 | $5,601,515 |
|---|
| 4/24 | $9,921,621 | $14,526,907 | $10,068,494 | $5,460,030 |
|---|
| 5/24 | $10,388,844 | $15,247,219 | $10,436,317 | $5,552,595 |
|---|
| 6/24 | $10,750,321 | $15,794,322 | $10,700,525 | $5,605,163 |
|---|
| 7/24 | $10,860,675 | $15,986,576 | $10,878,648 | $5,736,083 |
|---|
| 8/24 | $11,173,345 | $16,374,358 | $11,099,506 | $5,818,510 |
|---|
| 9/24 | $11,350,556 | $16,724,066 | $11,301,184 | $5,896,416 |
|---|
| 10/24 | $11,221,257 | $16,572,403 | $11,127,590 | $5,750,191 |
|---|
| 11/24 | $11,618,388 | $17,545,222 | $11,566,571 | $5,810,987 |
|---|
| 12/24 | $11,420,271 | $17,126,975 | $11,325,418 | $5,715,887 |
|---|
Average Annual Total Returns (%)Footnote Reference1
| Fund | 1 Year | 5 Years | 10 Years |
|---|
| Class R6 | 19.79% | 9.09% | 8.60% |
|---|
S&P 500® Index | 25.02% | 14.51% | 13.09% |
|---|
| Bloomberg U.S. Aggregate Bond Index | 1.25% | (0.33)% | 1.35% |
|---|
Blended IndexFootnote Reference2 | 15.04% | 8.66% | 8.51% |
|---|
| Footnote | Description |
Footnote1 | Class R6 performance prior to 5/2/16 is linked to Class I. This linked performance is not adjusted for class expense differences. If adjusted for such differences, the performance would be different. Performance presented in the Financial Highlights included in the financial statements is not linked. |
Footnote2 | Benchmark is an internally constructed benchmark comprised of a blend of 60% S&P 500® Index and 40% Bloomberg U.S. Aggregate Bond Index, and is rebalanced monthly. |
Performance does not reflect the deduction of taxes that a shareholder would pay on Fund distributions or redemption of Fund shares. Performance assumes that all dividends and distributions, if any, were reinvested. For more recent performance information, visit www.eatonvance.com/performance.php.
THE FUND'S PAST PERFORMANCE IS NO GUARANTEE OF FUTURE RESULTS.
| Total Net Assets | $1,013,190,430 |
|---|
| # of Portfolio Holdings (for Stock and Core Bond Portfolios) | 373 |
|---|
| Portfolio Turnover Rate | 5% |
|---|
| Total Advisory Fees Paid | $5,002,640 |
|---|
What did the Fund invest in?
The following tables reflect what the Fund invested in as of the report date.
References to the Fund's investments are to the Fund's pro rata share of the investments of Stock Portfolio and Core Bond Portfolio, affiliated investment companies in which the Fund invests substantially all of its assets.
Asset Allocation (% of total investments)
| Value | Value |
|---|
OtherFootnote Reference† | 1.2% |
| Commercial Mortgage-Backed Securities | 2.9% |
| Short-Term Investments | 4.3% |
| Asset-Backed Securities | 4.7% |
| U.S. Treasury Obligations | 7.9% |
| Corporate Bonds | 9.5% |
| U.S. Government Agency Mortgage-Backed Securities | 10.8% |
| Common Stocks | 58.7% |
| Footnote | Description |
Footnote† | Investment types less than 1% each |
Top Ten Holdings (% of total investments)Footnote Referencea
| Uniform Mortgage-Backed Security, 5.50%, 30-Year, TBA | 4.7% |
| Apple, Inc. | 4.5% |
| Microsoft Corp. | 4.5% |
| NVIDIA Corp. | 4.3% |
| Amazon.com, Inc. | 3.2% |
| Alphabet, Inc., Class C | 2.6% |
| Uniform Mortgage-Backed Security, 5.00%, 30-Year, TBA | 2.6% |
| Broadcom, Inc. | 2.1% |
| Meta Platforms, Inc., Class A | 1.8% |
| U.S. Treasury Notes, 0.38%, 12/31/25 | 1.5% |
| Total | 31.8% |
| Footnote | Description |
Footnotea | Excluding cash equivalents |
If you wish to view additional information about the Fund, including the prospectus, statement of additional information, financial statements and holdings, please scan the QR code or visit www.eatonvance.com/open-end-mutual-fund-documents.php. For proxy information, please visit www.eatonvance.com/proxyvoting.
The Funds may deliver a single copy of certain required shareholder documents (including prospectuses, shareholder reports, and proxy materials) to investors with the same last name and the same address. Your participation will continue indefinitely unless you instruct otherwise by calling 1-800-262-1122 or by contacting your financial intermediary. Your instruction will typically be effective within 30 days of receipt.
Not FDIC Insured | May Lose Value | No Bank Guarantee
Annual Shareholder Report December 31, 2024
Eaton Vance Core Bond Fund
Annual Shareholder Report December 31, 2024
This annual shareholder report contains important information about the Eaton Vance Core Bond Fund for the period of January 1, 2024 to December 31, 2024. You can find additional information about the Fund at www.eatonvance.com/open-end-mutual-fund-documents.php. You can also request this information by contacting us at 1-800-262-1122.
What were the Fund costs for the last year?Footnote Reference1
(based on a hypothetical $10,000 investment)
| Class Name | Costs of a $10,000 investment | Costs paid as a percentage of a $10,000 investment |
|---|
| Class A | $75 | 0.74% |
|---|
| Footnote | Description |
Footnote1 | Expenses in the table reflect the expenses of both the Fund and Core Bond Portfolio, the Portfolio in which it invests. |
How did the Fund perform last year and what affected its performance?
Key contributors to (↑) and detractors from (↓) performance, relative to the Bloomberg U.S. Aggregate Bond Index (the Index):
↑ The Fund’s security selections ― especially in investment-grade corporate bonds ― contributed to returns relative to the Index during the period
↑ The Fund’s selections in asset-backed securities contributed to performance relative to the Index during the period
↑ The Fund’s allocations by sector ― especially an overweight exposure to commercial mortgage-backed securities ― helped Index-relative returns during the period
↑ The Fund’s slightly underweight duration contributed to performance relative to the Index during the period
↓ In contrast, the Fund’s underweight exposure to agency mortgage-backed securities detracted from performance relative to the Index during the period
↓ The Fund’s yield-curve positioning detracted from performance relative to the Index during the period
↓ The Fund’s use of derivatives detracted from performance relative to the Index during the period
Comparison of the change in value of a $10,000 investment for the period indicated.
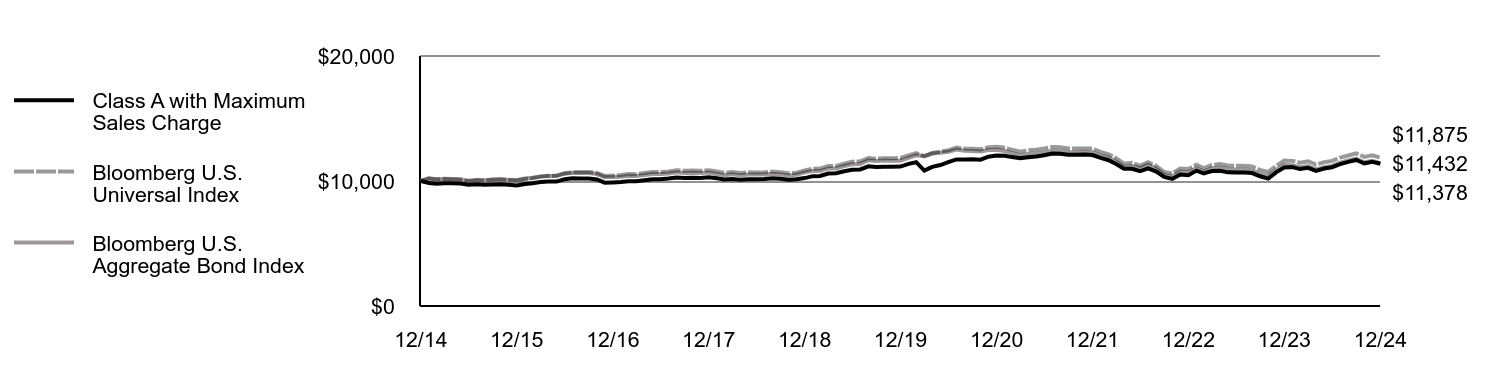
| Class A with Maximum Sales Charge | Bloomberg U.S. Universal Index | Bloomberg U.S. Aggregate Bond Index |
|---|
| 12/14 | $10,000 | $10,000 | $10,000 |
|---|
| 1/15 | $9,839 | $10,190 | $10,210 |
|---|
| 2/15 | $9,789 | $10,131 | $10,114 |
|---|
| 3/15 | $9,818 | $10,173 | $10,161 |
|---|
| 4/15 | $9,812 | $10,161 | $10,124 |
|---|
| 5/15 | $9,797 | $10,143 | $10,100 |
|---|
| 6/15 | $9,703 | $10,030 | $9,990 |
|---|
| 7/15 | $9,746 | $10,088 | $10,059 |
|---|
| 8/15 | $9,701 | $10,059 | $10,045 |
|---|
| 9/15 | $9,712 | $10,098 | $10,113 |
|---|
| 10/15 | $9,731 | $10,130 | $10,114 |
|---|
| 11/15 | $9,701 | $10,093 | $10,088 |
|---|
| 12/15 | $9,645 | $10,043 | $10,055 |
|---|
| 1/16 | $9,754 | $10,154 | $10,193 |
|---|
| 2/16 | $9,812 | $10,226 | $10,266 |
|---|
| 3/16 | $9,914 | $10,351 | $10,360 |
|---|
| 4/16 | $9,965 | $10,422 | $10,400 |
|---|
| 5/16 | $9,956 | $10,430 | $10,402 |
|---|
| 6/16 | $10,138 | $10,614 | $10,589 |
|---|
| 7/16 | $10,220 | $10,701 | $10,656 |
|---|
| 8/16 | $10,191 | $10,713 | $10,644 |
|---|
| 9/16 | $10,200 | $10,715 | $10,638 |
|---|
| 10/16 | $10,119 | $10,644 | $10,556 |
|---|
| 11/16 | $9,864 | $10,405 | $10,307 |
|---|
| 12/16 | $9,884 | $10,436 | $10,321 |
|---|
| 1/17 | $9,915 | $10,473 | $10,341 |
|---|
| 2/17 | $9,988 | $10,553 | $10,411 |
|---|
| 3/17 | $9,979 | $10,550 | $10,406 |
|---|
| 4/17 | $10,062 | $10,637 | $10,486 |
|---|
| 5/17 | $10,145 | $10,719 | $10,567 |
|---|
| 6/17 | $10,146 | $10,710 | $10,556 |
|---|
| 7/17 | $10,198 | $10,764 | $10,601 |
|---|
| 8/17 | $10,282 | $10,856 | $10,696 |
|---|
| 9/17 | $10,242 | $10,818 | $10,645 |
|---|
| 10/17 | $10,254 | $10,831 | $10,652 |
|---|
| 11/17 | $10,246 | $10,815 | $10,638 |
|---|
| 12/17 | $10,300 | $10,863 | $10,687 |
|---|
| 1/18 | $10,217 | $10,758 | $10,564 |
|---|
| 2/18 | $10,125 | $10,656 | $10,464 |
|---|
| 3/18 | $10,161 | $10,710 | $10,531 |
|---|
| 4/18 | $10,102 | $10,638 | $10,452 |
|---|
| 5/18 | $10,147 | $10,696 | $10,527 |
|---|
| 6/18 | $10,141 | $10,681 | $10,514 |
|---|
| 7/18 | $10,168 | $10,703 | $10,516 |
|---|
| 8/18 | $10,226 | $10,756 | $10,584 |
|---|
| 9/18 | $10,188 | $10,710 | $10,516 |
|---|
| 10/18 | $10,106 | $10,620 | $10,433 |
|---|
| 11/18 | $10,132 | $10,668 | $10,495 |
|---|
| 12/18 | $10,234 | $10,835 | $10,688 |
|---|
| 1/19 | $10,388 | $10,984 | $10,801 |
|---|
| 2/19 | $10,402 | $10,996 | $10,795 |
|---|
| 3/19 | $10,592 | $11,195 | $11,003 |
|---|
| 4/19 | $10,619 | $11,210 | $11,005 |
|---|
| 5/19 | $10,778 | $11,382 | $11,201 |
|---|
| 6/19 | $10,892 | $11,543 | $11,341 |
|---|
| 7/19 | $10,928 | $11,578 | $11,366 |
|---|
| 8/19 | $11,172 | $11,840 | $11,661 |
|---|
| 9/19 | $11,119 | $11,788 | $11,599 |
|---|
| 10/19 | $11,142 | $11,826 | $11,634 |
|---|
| 11/19 | $11,143 | $11,824 | $11,628 |
|---|
| 12/19 | $11,155 | $11,842 | $11,620 |
|---|
| 1/20 | $11,368 | $12,054 | $11,843 |
|---|
| 2/20 | $11,503 | $12,235 | $12,056 |
|---|
| 3/20 | $10,836 | $11,996 | $11,985 |
|---|
| 4/20 | $11,131 | $12,236 | $12,198 |
|---|
| 5/20 | $11,278 | $12,350 | $12,255 |
|---|
| 6/20 | $11,502 | $12,453 | $12,332 |
|---|
| 7/20 | $11,728 | $12,672 | $12,517 |
|---|
| 8/20 | $11,729 | $12,599 | $12,416 |
|---|
| 9/20 | $11,742 | $12,576 | $12,409 |
|---|
| 10/20 | $11,709 | $12,531 | $12,353 |
|---|
| 11/20 | $11,948 | $12,695 | $12,475 |
|---|
| 12/20 | $12,035 | $12,739 | $12,492 |
|---|
| 1/21 | $12,019 | $12,659 | $12,402 |
|---|
| 2/21 | $11,912 | $12,495 | $12,223 |
|---|
| 3/21 | $11,815 | $12,350 | $12,071 |
|---|
| 4/21 | $11,905 | $12,454 | $12,166 |
|---|
| 5/21 | $11,962 | $12,501 | $12,206 |
|---|
| 6/21 | $12,065 | $12,592 | $12,291 |
|---|
| 7/21 | $12,192 | $12,719 | $12,429 |
|---|
| 8/21 | $12,177 | $12,710 | $12,405 |
|---|
| 9/21 | $12,101 | $12,602 | $12,298 |
|---|
| 10/21 | $12,108 | $12,591 | $12,294 |
|---|
| 11/21 | $12,117 | $12,607 | $12,331 |
|---|
| 12/21 | $12,078 | $12,598 | $12,299 |
|---|
| 1/22 | $11,843 | $12,322 | $12,034 |
|---|
| 2/22 | $11,682 | $12,154 | $11,900 |
|---|
| 3/22 | $11,362 | $11,828 | $11,569 |
|---|
| 4/22 | $10,980 | $11,387 | $11,130 |
|---|
| 5/22 | $10,978 | $11,449 | $11,202 |
|---|
| 6/22 | $10,779 | $11,221 | $11,026 |
|---|
| 7/22 | $11,010 | $11,503 | $11,296 |
|---|
| 8/22 | $10,752 | $11,204 | $10,977 |
|---|
| 9/22 | $10,321 | $10,721 | $10,502 |
|---|
| 10/22 | $10,161 | $10,603 | $10,366 |
|---|
| 11/22 | $10,511 | $10,999 | $10,748 |
|---|
| 12/22 | $10,468 | $10,961 | $10,699 |
|---|
| 1/23 | $10,833 | $11,301 | $11,028 |
|---|
| 2/23 | $10,600 | $11,024 | $10,743 |
|---|
| 3/23 | $10,793 | $11,282 | $11,016 |
|---|
| 4/23 | $10,811 | $11,351 | $11,083 |
|---|
| 5/23 | $10,692 | $11,233 | $10,962 |
|---|
| 6/23 | $10,685 | $11,216 | $10,923 |
|---|
| 7/23 | $10,679 | $11,227 | $10,915 |
|---|
| 8/23 | $10,637 | $11,160 | $10,846 |
|---|
| 9/23 | $10,378 | $10,893 | $10,570 |
|---|
| 10/23 | $10,195 | $10,730 | $10,403 |
|---|
| 11/23 | $10,693 | $11,213 | $10,874 |
|---|
| 12/23 | $11,076 | $11,638 | $11,291 |
|---|
| 1/24 | $11,112 | $11,610 | $11,260 |
|---|
| 2/24 | $10,955 | $11,471 | $11,101 |
|---|
| 3/24 | $11,056 | $11,584 | $11,203 |
|---|
| 4/24 | $10,805 | $11,313 | $10,920 |
|---|
| 5/24 | $10,999 | $11,500 | $11,105 |
|---|
| 6/24 | $11,105 | $11,606 | $11,210 |
|---|
| 7/24 | $11,355 | $11,869 | $11,472 |
|---|
| 8/24 | $11,525 | $12,044 | $11,637 |
|---|
| 9/24 | $11,683 | $12,209 | $11,793 |
|---|
| 10/24 | $11,402 | $11,932 | $11,500 |
|---|
| 11/24 | $11,532 | $12,057 | $11,622 |
|---|
| 12/24 | $11,378 | $11,875 | $11,432 |
|---|
Average Annual Total Returns (%)Footnote Reference1
| Fund | 1 Year | 5 Years | 10 Years |
|---|
| Class A | 2.77% | 0.40% | 1.64% |
|---|
| Class A with 3.25% Maximum Sales Charge | (0.59)% | (0.26)% | 1.30% |
|---|
| Bloomberg U.S. Universal Index | 2.04% | 0.06% | 1.73% |
|---|
| Bloomberg U.S. Aggregate Bond Index | 1.25% | (0.33)% | 1.35% |
|---|
| Footnote | Description |
Footnote1 | In accordance with regulatory changes requiring the Fund's primary benchmark to represent the overall applicable market, the Fund's primary prospectus benchmark changed to the Bloomberg U.S. Universal Index effective May 1, 2024. |
Performance does not reflect the deduction of taxes that a shareholder would pay on Fund distributions or redemption of Fund shares. Performance assumes that all dividends and distributions, if any, were reinvested. For more recent performance information, visit www.eatonvance.com/performance.php.
THE FUND'S PAST PERFORMANCE IS NO GUARANTEE OF FUTURE RESULTS.
| Total Net Assets | $217,744,054 |
|---|
| # of Portfolio Holdings (for Core Bond Portfolio) | 317 |
|---|
| Portfolio Turnover Rate (for Core Bond Portfolio) | 375% |
|---|
| Total Advisory Fees Paid | $954,526 |
|---|
What did the Fund invest in?
The following tables reflect what the Fund invested in as of the report date.
References to the Fund's investments are to the Fund's pro rata share of the investments of Core Bond Portfolio, an affiliated investment company in which the Fund invests substantially all of its assets.
Asset Allocation (% of total investments)
| Value | Value |
|---|
OtherFootnote Reference† | 1.0% |
| Collateralized Mortgage Obligations | 2.0% |
| Commercial Mortgage-Backed Securities | 7.0% |
| Short-Term Investments | 10.2% |
| Asset-Backed Securities | 11.3% |
| U.S. Treasury Obligations | 19.2% |
| Corporate Bonds | 23.0% |
| U.S. Government Agency Mortgage-Backed Securities | 26.3% |
| Footnote | Description |
Footnote† | Investment types less than 1% each |
Credit Quality (% of net assets)Footnote Referencea
| Value | Value |
|---|
| Cash & Equivalents | (6.5%) |
| Not Rated | 1.9% |
| CCC or Lower | 0.2% |
| B | 1.1% |
| BB | 1.2% |
| BBB | 21.1% |
| A | 14.9% |
| AA | 5.8% |
| AAA | 60.3% |
| Footnote | Description |
Footnotea | Ratings are based on Moody’s Investors Service, Inc. (“Moody’s”), S&P Global Ratings (“S&P”) or Fitch Ratings (“Fitch”), or Kroll Bond Rating Agency, LLC (“Kroll”) for securitized debt instruments only (such as asset-backed and mortgage-backed securities). If securities are rated differently by the ratings agencies, the highest rating is applied. Moody's ratings are converted to the S&P, Fitch and Kroll scale with ratings ranging from AAA, being the highest, to D, being the lowest. Ratings of BBB or higher are considered to be investment-grade quality. Holdings designated as “Not Rated” (if any) are not rated by the national ratings agencies stated above. |
If you wish to view additional information about the Fund, including the prospectus, statement of additional information, financial statements and holdings, please scan the QR code or visit www.eatonvance.com/open-end-mutual-fund-documents.php. For proxy information, please visit www.eatonvance.com/proxyvoting.
The Funds may deliver a single copy of certain required shareholder documents (including prospectuses, shareholder reports, and proxy materials) to investors with the same last name and the same address. Your participation will continue indefinitely unless you instruct otherwise by calling 1-800-262-1122 or by contacting your financial intermediary. Your instruction will typically be effective within 30 days of receipt.
Not FDIC Insured | May Lose Value | No Bank Guarantee
Annual Shareholder Report December 31, 2024
Eaton Vance Core Bond Fund
Annual Shareholder Report December 31, 2024
This annual shareholder report contains important information about the Eaton Vance Core Bond Fund for the period of January 1, 2024 to December 31, 2024. You can find additional information about the Fund at www.eatonvance.com/open-end-mutual-fund-documents.php. You can also request this information by contacting us at 1-800-262-1122.
What were the Fund costs for the last year?Footnote Reference1
(based on a hypothetical $10,000 investment)
| Class Name | Costs of a $10,000 investment | Costs paid as a percentage of a $10,000 investment |
|---|
| Class I | $50 | 0.49% |
|---|
| Footnote | Description |
Footnote1 | Expenses in the table reflect the expenses of both the Fund and Core Bond Portfolio, the Portfolio in which it invests. |
How did the Fund perform last year and what affected its performance?
Key contributors to (↑) and detractors from (↓) performance, relative to the Bloomberg U.S. Aggregate Bond Index (the Index):
↑ The Fund’s security selections ― especially in investment-grade corporate bonds ― contributed to returns relative to the Index during the period
↑ The Fund’s selections in asset-backed securities contributed to performance relative to the Index during the period
↑ The Fund’s allocations by sector ― especially an overweight exposure to commercial mortgage-backed securities ― helped Index-relative returns during the period
↑ The Fund’s slightly underweight duration contributed to performance relative to the Index during the period
↓ In contrast, the Fund’s underweight exposure to agency mortgage-backed securities detracted from performance relative to the Index during the period
↓ The Fund’s yield-curve positioning detracted from performance relative to the Index during the period
↓ The Fund’s use of derivatives detracted from performance relative to the Index during the period
Comparison of the change in value of a $1,000,000 investment for the period indicated.
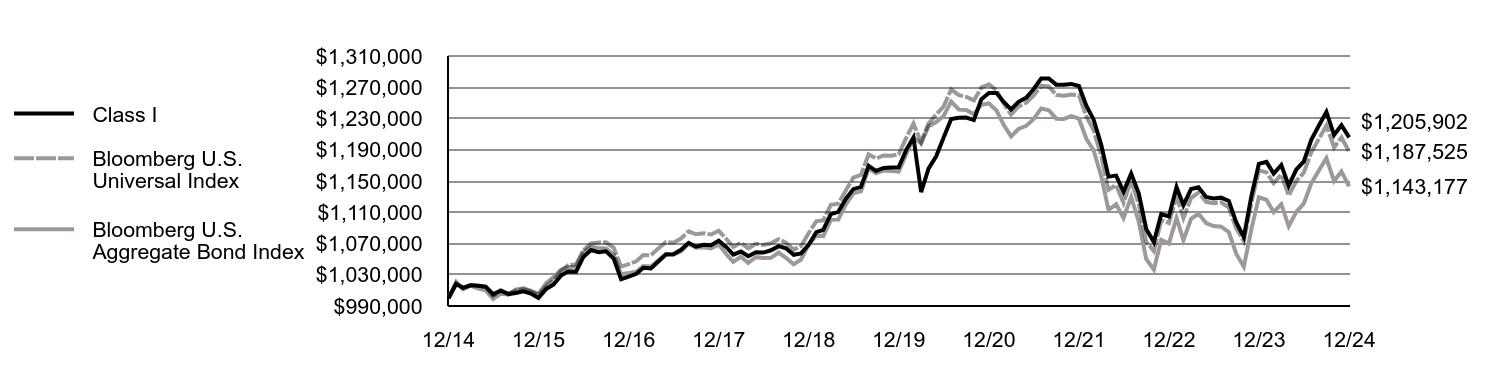
| Class I | Bloomberg U.S. Universal Index | Bloomberg U.S. Aggregate Bond Index |
|---|
| 12/14 | $1,000,000 | $1,000,000 | $1,000,000 |
|---|
| 1/15 | $1,018,214 | $1,019,035 | $1,020,969 |
|---|
| 2/15 | $1,013,246 | $1,013,096 | $1,011,370 |
|---|
| 3/15 | $1,016,410 | $1,017,278 | $1,016,066 |
|---|
| 4/15 | $1,015,993 | $1,016,097 | $1,012,420 |
|---|
| 5/15 | $1,014,703 | $1,014,320 | $1,009,982 |
|---|
| 6/15 | $1,005,067 | $1,002,999 | $998,970 |
|---|
| 7/15 | $1,009,786 | $1,008,840 | $1,005,914 |
|---|
| 8/15 | $1,005,275 | $1,005,867 | $1,004,469 |
|---|
| 9/15 | $1,006,667 | $1,009,805 | $1,011,264 |
|---|
| 10/15 | $1,008,911 | $1,013,032 | $1,011,431 |
|---|
| 11/15 | $1,005,986 | $1,009,338 | $1,008,759 |
|---|
| 12/15 | $1,000,389 | $1,004,296 | $1,005,500 |
|---|
| 1/16 | $1,011,842 | $1,015,382 | $1,019,336 |
|---|
| 2/16 | $1,017,110 | $1,022,595 | $1,026,567 |
|---|
| 3/16 | $1,028,897 | $1,035,127 | $1,035,986 |
|---|
| 4/16 | $1,034,424 | $1,042,180 | $1,039,963 |
|---|
| 5/16 | $1,033,716 | $1,042,994 | $1,040,229 |
|---|
| 6/16 | $1,052,857 | $1,061,356 | $1,058,920 |
|---|
| 7/16 | $1,061,575 | $1,070,102 | $1,065,615 |
|---|
| 8/16 | $1,058,760 | $1,071,256 | $1,064,396 |
|---|
| 9/16 | $1,059,926 | $1,071,510 | $1,063,773 |
|---|
| 10/16 | $1,050,637 | $1,064,402 | $1,055,636 |
|---|
| 11/16 | $1,024,358 | $1,040,477 | $1,030,666 |
|---|
| 12/16 | $1,027,712 | $1,043,568 | $1,032,120 |
|---|
| 1/17 | $1,031,136 | $1,047,250 | $1,034,145 |
|---|
| 2/17 | $1,038,905 | $1,055,330 | $1,041,096 |
|---|
| 3/17 | $1,038,173 | $1,054,976 | $1,040,550 |
|---|
| 4/17 | $1,047,056 | $1,063,730 | $1,048,580 |
|---|
| 5/17 | $1,055,935 | $1,071,937 | $1,056,651 |
|---|
| 6/17 | $1,056,248 | $1,071,028 | $1,055,587 |
|---|
| 7/17 | $1,061,891 | $1,076,363 | $1,060,130 |
|---|
| 8/17 | $1,070,878 | $1,085,649 | $1,069,639 |
|---|
| 9/17 | $1,065,853 | $1,081,828 | $1,064,544 |
|---|
| 10/17 | $1,068,416 | $1,083,127 | $1,065,161 |
|---|
| 11/17 | $1,067,789 | $1,081,488 | $1,063,794 |
|---|
| 12/17 | $1,073,600 | $1,086,256 | $1,068,676 |
|---|
| 1/18 | $1,065,213 | $1,075,803 | $1,056,368 |
|---|
| 2/18 | $1,055,764 | $1,065,602 | $1,046,354 |
|---|
| 3/18 | $1,059,717 | $1,070,977 | $1,053,065 |
|---|
| 4/18 | $1,053,786 | $1,063,831 | $1,045,232 |
|---|
| 5/18 | $1,058,766 | $1,069,632 | $1,052,692 |
|---|
| 6/18 | $1,058,364 | $1,068,081 | $1,051,397 |
|---|
| 7/18 | $1,061,324 | $1,070,316 | $1,051,647 |
|---|
| 8/18 | $1,066,555 | $1,075,589 | $1,058,414 |
|---|
| 9/18 | $1,063,892 | $1,070,981 | $1,051,599 |
|---|
| 10/18 | $1,055,574 | $1,062,021 | $1,043,288 |
|---|
| 11/18 | $1,057,390 | $1,066,798 | $1,049,516 |
|---|
| 12/18 | $1,068,278 | $1,083,488 | $1,068,797 |
|---|
| 1/19 | $1,084,636 | $1,098,427 | $1,080,147 |
|---|
| 2/19 | $1,087,442 | $1,099,625 | $1,079,522 |
|---|
| 3/19 | $1,107,490 | $1,119,481 | $1,100,250 |
|---|
| 4/19 | $1,110,599 | $1,121,048 | $1,100,532 |
|---|
| 5/19 | $1,127,407 | $1,138,221 | $1,120,068 |
|---|
| 6/19 | $1,139,584 | $1,154,320 | $1,134,134 |
|---|
| 7/19 | $1,142,508 | $1,157,756 | $1,136,629 |
|---|
| 8/19 | $1,169,417 | $1,183,953 | $1,166,081 |
|---|
| 9/19 | $1,162,935 | $1,178,824 | $1,159,870 |
|---|
| 10/19 | $1,166,755 | $1,182,633 | $1,163,364 |
|---|
| 11/19 | $1,167,147 | $1,182,396 | $1,162,772 |
|---|
| 12/19 | $1,167,485 | $1,184,158 | $1,161,961 |
|---|
| 1/20 | $1,190,018 | $1,205,411 | $1,184,323 |
|---|
| 2/20 | $1,205,572 | $1,223,460 | $1,205,639 |
|---|
| 3/20 | $1,135,818 | $1,199,562 | $1,198,544 |
|---|
| 4/20 | $1,165,822 | $1,223,591 | $1,219,849 |
|---|
| 5/20 | $1,181,581 | $1,235,019 | $1,225,529 |
|---|
| 6/20 | $1,205,287 | $1,245,324 | $1,233,249 |
|---|
| 7/20 | $1,229,220 | $1,267,199 | $1,251,670 |
|---|
| 8/20 | $1,230,862 | $1,259,892 | $1,241,566 |
|---|
| 9/20 | $1,231,279 | $1,257,621 | $1,240,886 |
|---|
| 10/20 | $1,228,004 | $1,253,126 | $1,235,345 |
|---|
| 11/20 | $1,254,554 | $1,269,479 | $1,247,466 |
|---|
| 12/20 | $1,262,773 | $1,273,862 | $1,249,185 |
|---|
| 1/21 | $1,262,600 | $1,265,856 | $1,240,229 |
|---|
| 2/21 | $1,251,559 | $1,249,522 | $1,222,319 |
|---|
| 3/21 | $1,241,623 | $1,234,981 | $1,207,057 |
|---|
| 4/21 | $1,251,415 | $1,245,366 | $1,216,592 |
|---|
| 5/21 | $1,256,402 | $1,250,116 | $1,220,567 |
|---|
| 6/21 | $1,267,441 | $1,259,230 | $1,229,143 |
|---|
| 7/21 | $1,281,160 | $1,271,874 | $1,242,886 |
|---|
| 8/21 | $1,281,101 | $1,271,025 | $1,240,520 |
|---|
| 9/21 | $1,273,317 | $1,260,171 | $1,229,779 |
|---|
| 10/21 | $1,273,081 | $1,259,141 | $1,229,440 |
|---|
| 11/21 | $1,274,261 | $1,260,662 | $1,233,078 |
|---|
| 12/21 | $1,271,660 | $1,259,812 | $1,229,922 |
|---|
| 1/22 | $1,245,852 | $1,232,192 | $1,203,425 |
|---|
| 2/22 | $1,229,179 | $1,215,392 | $1,189,999 |
|---|
| 3/22 | $1,196,936 | $1,182,784 | $1,156,939 |
|---|
| 4/22 | $1,155,621 | $1,138,670 | $1,113,035 |
|---|
| 5/22 | $1,156,894 | $1,144,935 | $1,120,212 |
|---|
| 6/22 | $1,136,155 | $1,122,056 | $1,102,638 |
|---|
| 7/22 | $1,159,431 | $1,150,267 | $1,129,580 |
|---|
| 8/22 | $1,133,804 | $1,120,364 | $1,097,662 |
|---|
| 9/22 | $1,088,522 | $1,072,095 | $1,050,236 |
|---|
| 10/22 | $1,071,876 | $1,060,331 | $1,036,633 |
|---|
| 11/22 | $1,107,690 | $1,099,867 | $1,074,756 |
|---|
| 12/22 | $1,104,683 | $1,096,132 | $1,069,908 |
|---|
| 1/23 | $1,142,163 | $1,130,134 | $1,102,823 |
|---|
| 2/23 | $1,119,134 | $1,102,365 | $1,074,309 |
|---|
| 3/23 | $1,139,718 | $1,128,225 | $1,101,599 |
|---|
| 4/23 | $1,141,868 | $1,135,118 | $1,108,275 |
|---|
| 5/23 | $1,129,513 | $1,123,349 | $1,096,208 |
|---|
| 6/23 | $1,127,708 | $1,121,603 | $1,092,298 |
|---|
| 7/23 | $1,128,670 | $1,122,718 | $1,091,536 |
|---|
| 8/23 | $1,124,458 | $1,115,957 | $1,084,564 |
|---|
| 9/23 | $1,097,235 | $1,089,347 | $1,057,004 |
|---|
| 10/23 | $1,078,076 | $1,072,965 | $1,040,323 |
|---|
| 11/23 | $1,129,660 | $1,121,254 | $1,087,435 |
|---|
| 12/23 | $1,171,847 | $1,163,799 | $1,129,061 |
|---|
| 1/24 | $1,174,493 | $1,161,014 | $1,125,961 |
|---|
| 2/24 | $1,159,445 | $1,147,094 | $1,110,053 |
|---|
| 3/24 | $1,170,442 | $1,158,357 | $1,120,303 |
|---|
| 4/24 | $1,144,000 | $1,131,288 | $1,092,006 |
|---|
| 5/24 | $1,164,806 | $1,150,040 | $1,110,519 |
|---|
| 6/24 | $1,174,873 | $1,160,553 | $1,121,033 |
|---|
| 7/24 | $1,203,111 | $1,186,895 | $1,147,217 |
|---|
| 8/24 | $1,221,388 | $1,204,368 | $1,163,702 |
|---|
| 9/24 | $1,238,415 | $1,220,886 | $1,179,283 |
|---|
| 10/24 | $1,208,822 | $1,193,156 | $1,150,038 |
|---|
| 11/24 | $1,221,368 | $1,205,735 | $1,162,197 |
|---|
| 12/24 | $1,205,902 | $1,187,525 | $1,143,177 |
|---|
Average Annual Total Returns (%)Footnote Reference1
| Fund | 1 Year | 5 Years | 10 Years |
|---|
| Class I | 2.90% | 0.65% | 1.89% |
|---|
| Bloomberg U.S. Universal Index | 2.04% | 0.06% | 1.73% |
|---|
| Bloomberg U.S. Aggregate Bond Index | 1.25% | (0.33)% | 1.35% |
|---|
| Footnote | Description |
Footnote1 | In accordance with regulatory changes requiring the Fund's primary benchmark to represent the overall applicable market, the Fund's primary prospectus benchmark changed to the Bloomberg U.S. Universal Index effective May 1, 2024. |
Performance does not reflect the deduction of taxes that a shareholder would pay on Fund distributions or redemption of Fund shares. Performance assumes that all dividends and distributions, if any, were reinvested. For more recent performance information, visit www.eatonvance.com/performance.php.
THE FUND'S PAST PERFORMANCE IS NO GUARANTEE OF FUTURE RESULTS.
| Total Net Assets | $217,744,054 |
|---|
| # of Portfolio Holdings (for Core Bond Portfolio) | 317 |
|---|
| Portfolio Turnover Rate (for Core Bond Portfolio) | 375% |
|---|
| Total Advisory Fees Paid | $954,526 |
|---|
What did the Fund invest in?
The following tables reflect what the Fund invested in as of the report date.
References to the Fund's investments are to the Fund's pro rata share of the investments of Core Bond Portfolio, an affiliated investment company in which the Fund invests substantially all of its assets.
Asset Allocation (% of total investments)
| Value | Value |
|---|
OtherFootnote Reference† | 1.0% |
| Collateralized Mortgage Obligations | 2.0% |
| Commercial Mortgage-Backed Securities | 7.0% |
| Short-Term Investments | 10.2% |
| Asset-Backed Securities | 11.3% |
| U.S. Treasury Obligations | 19.2% |
| Corporate Bonds | 23.0% |
| U.S. Government Agency Mortgage-Backed Securities | 26.3% |
| Footnote | Description |
Footnote† | Investment types less than 1% each |
Credit Quality (% of net assets)Footnote Referencea
| Value | Value |
|---|
| Cash & Equivalents | (6.5%) |
| Not Rated | 1.9% |
| CCC or Lower | 0.2% |
| B | 1.1% |
| BB | 1.2% |
| BBB | 21.1% |
| A | 14.9% |
| AA | 5.8% |
| AAA | 60.3% |
| Footnote | Description |
Footnotea | Ratings are based on Moody’s Investors Service, Inc. (“Moody’s”), S&P Global Ratings (“S&P”) or Fitch Ratings (“Fitch”), or Kroll Bond Rating Agency, LLC (“Kroll”) for securitized debt instruments only (such as asset-backed and mortgage-backed securities). If securities are rated differently by the ratings agencies, the highest rating is applied. Moody's ratings are converted to the S&P, Fitch and Kroll scale with ratings ranging from AAA, being the highest, to D, being the lowest. Ratings of BBB or higher are considered to be investment-grade quality. Holdings designated as “Not Rated” (if any) are not rated by the national ratings agencies stated above. |
If you wish to view additional information about the Fund, including the prospectus, statement of additional information, financial statements and holdings, please scan the QR code or visit www.eatonvance.com/open-end-mutual-fund-documents.php. For proxy information, please visit www.eatonvance.com/proxyvoting.
The Funds may deliver a single copy of certain required shareholder documents (including prospectuses, shareholder reports, and proxy materials) to investors with the same last name and the same address. Your participation will continue indefinitely unless you instruct otherwise by calling 1-800-262-1122 or by contacting your financial intermediary. Your instruction will typically be effective within 30 days of receipt.
Not FDIC Insured | May Lose Value | No Bank Guarantee
Annual Shareholder Report December 31, 2024
Eaton Vance Dividend Builder Fund
Annual Shareholder Report December 31, 2024
This annual shareholder report contains important information about the Eaton Vance Dividend Builder Fund for the period of January 1, 2024 to December 31, 2024. You can find additional information about the Fund at www.eatonvance.com/open-end-mutual-fund-documents.php. You can also request this information by contacting us at 1-800-262-1122.
What were the Fund costs for the last year?
(based on a hypothetical $10,000 investment)
| Class Name | Costs of a $10,000 investment | Costs paid as a percentage of a $10,000 investment |
|---|
| Class A | $106 | 0.99% |
|---|
How did the Fund perform last year and what affected its performance?
Key contributors to (↑) and detractors from (↓) performance, relative to the S&P 500® Index (the Index):
↓ Not owning semiconductor maker NVIDIA Corp. or Facebook parent Meta Platforms Inc. hurt relative returns as both stocks performed well. Both firms pay nominal dividends, but did not meet the Fund’s criteria for investing in stocks that demonstrate the ability to produce attractive levels of dividend income over time
↓ An overweight position in CDW Corp., a distributor of technology products and services, lost value as demand from small- and mid-size businesses declined
↓ Among sectors, stock selections and underweight exposures to information technology and communication services, and an overweight in health care hurt returns
↑ In contrast, an overweight position in Broadcom Inc. aided returns as its stock price doubled on AI-driven demand for its semiconductor and software products
↑ An overweight position in global retail and grocery giant Walmart Inc. rose in value as its core U.S. retail business gained market share during the period
↑ An overweight position in paper products firm International Paper Co. rose in value as its new CEO cut costs and employed new strategies that investors favored
↑ Among sectors, stock selections in materials and consumer staples, and stock selections and an underweight exposure to real estate helped Index-relative returns
Comparison of the change in value of a $10,000 investment for the period indicated.
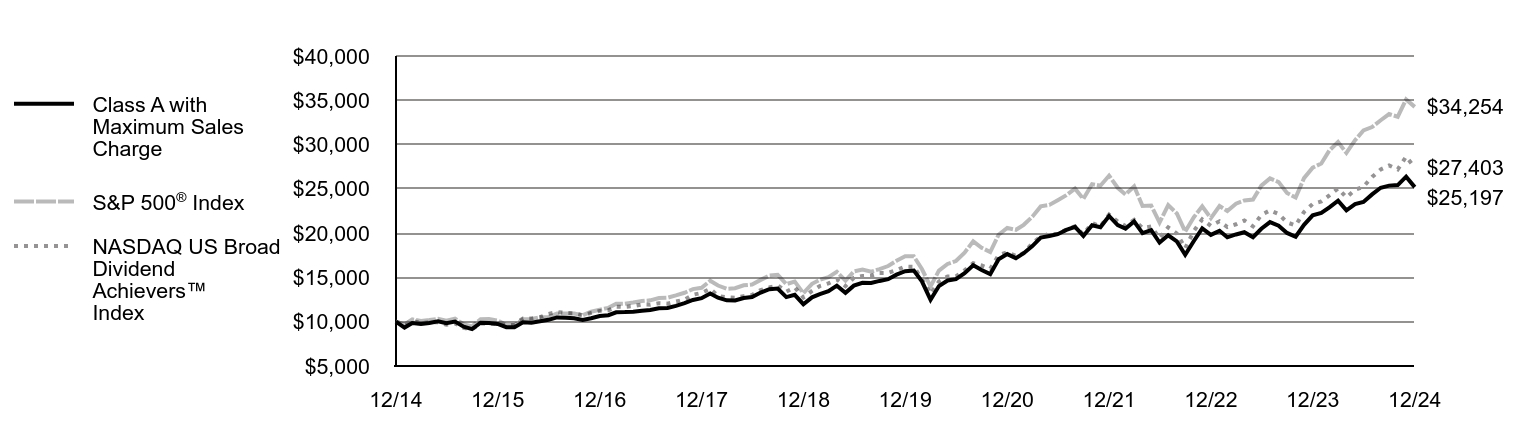
| Class A with Maximum Sales Charge | S&P 500® Index | NASDAQ US Broad Dividend Achievers™ Index |
|---|
| 12/14 | $10,000 | $10,000 | $10,000 |
|---|
| 1/15 | $9,340 | $9,700 | $9,689 |
|---|
| 2/15 | $9,860 | $10,257 | $10,087 |
|---|
| 3/15 | $9,745 | $10,095 | $9,861 |
|---|
| 4/15 | $9,865 | $10,192 | $9,925 |
|---|
| 5/15 | $10,059 | $10,323 | $9,929 |
|---|
| 6/15 | $9,831 | $10,123 | $9,658 |
|---|
| 7/15 | $10,009 | $10,335 | $9,805 |
|---|
| 8/15 | $9,438 | $9,712 | $9,299 |
|---|
| 9/15 | $9,171 | $9,471 | $9,152 |
|---|
| 10/15 | $9,890 | $10,270 | $9,807 |
|---|
| 11/15 | $9,864 | $10,301 | $9,795 |
|---|
| 12/15 | $9,750 | $10,138 | $9,742 |
|---|
| 1/16 | $9,388 | $9,635 | $9,657 |
|---|
| 2/16 | $9,382 | $9,622 | $9,746 |
|---|
| 3/16 | $9,937 | $10,275 | $10,374 |
|---|
| 4/16 | $9,893 | $10,315 | $10,373 |
|---|
| 5/16 | $10,052 | $10,500 | $10,513 |
|---|
| 6/16 | $10,211 | $10,527 | $10,885 |
|---|
| 7/16 | $10,486 | $10,915 | $11,087 |
|---|
| 8/16 | $10,457 | $10,931 | $10,991 |
|---|
| 9/16 | $10,390 | $10,933 | $10,964 |
|---|
| 10/16 | $10,209 | $10,733 | $10,724 |
|---|
| 11/16 | $10,386 | $11,131 | $10,993 |
|---|
| 12/16 | $10,649 | $11,351 | $11,225 |
|---|
| 1/17 | $10,737 | $11,566 | $11,296 |
|---|
| 2/17 | $11,063 | $12,025 | $11,703 |
|---|
| 3/17 | $11,088 | $12,039 | $11,677 |
|---|
| 4/17 | $11,137 | $12,163 | $11,768 |
|---|
| 5/17 | $11,242 | $12,334 | $11,953 |
|---|
| 6/17 | $11,315 | $12,411 | $11,924 |
|---|
| 7/17 | $11,524 | $12,667 | $12,085 |
|---|
| 8/17 | $11,542 | $12,705 | $12,040 |
|---|
| 9/17 | $11,795 | $12,967 | $12,276 |
|---|
| 10/17 | $12,089 | $13,270 | $12,494 |
|---|
| 11/17 | $12,457 | $13,677 | $13,043 |
|---|
| 12/17 | $12,660 | $13,829 | $13,247 |
|---|
| 1/18 | $13,193 | $14,621 | $13,711 |
|---|
| 2/18 | $12,716 | $14,082 | $12,907 |
|---|
| 3/18 | $12,412 | $13,724 | $12,761 |
|---|
| 4/18 | $12,404 | $13,777 | $12,712 |
|---|
| 5/18 | $12,678 | $14,108 | $12,890 |
|---|
| 6/18 | $12,784 | $14,195 | $13,021 |
|---|
| 7/18 | $13,295 | $14,724 | $13,578 |
|---|
| 8/18 | $13,666 | $15,203 | $13,859 |
|---|
| 9/18 | $13,748 | $15,290 | $14,094 |
|---|
| 10/18 | $12,783 | $14,245 | $13,399 |
|---|
| 11/18 | $13,035 | $14,535 | $13,881 |
|---|
| 12/18 | $11,977 | $13,223 | $12,725 |
|---|
| 1/19 | $12,755 | $14,282 | $13,476 |
|---|
| 2/19 | $13,103 | $14,741 | $14,031 |
|---|
| 3/19 | $13,442 | $15,027 | $14,326 |
|---|
| 4/19 | $14,070 | $15,636 | $14,772 |
|---|
| 5/19 | $13,261 | $14,642 | $14,028 |
|---|
| 6/19 | $14,074 | $15,674 | $14,949 |
|---|
| 7/19 | $14,386 | $15,899 | $15,167 |
|---|
| 8/19 | $14,369 | $15,648 | $15,202 |
|---|
| 9/19 | $14,606 | $15,940 | $15,507 |
|---|
| 10/19 | $14,804 | $16,286 | $15,511 |
|---|
| 11/19 | $15,315 | $16,877 | $15,824 |
|---|
| 12/19 | $15,701 | $17,386 | $16,228 |
|---|
| 1/20 | $15,773 | $17,379 | $16,204 |
|---|
| 2/20 | $14,563 | $15,949 | $14,803 |
|---|
| 3/20 | $12,465 | $13,979 | $13,146 |
|---|
| 4/20 | $14,023 | $15,771 | $14,530 |
|---|
| 5/20 | $14,654 | $16,522 | $15,116 |
|---|
| 6/20 | $14,807 | $16,850 | $15,118 |
|---|
| 7/20 | $15,469 | $17,801 | $15,800 |
|---|
| 8/20 | $16,374 | $19,080 | $16,610 |
|---|
| 9/20 | $15,830 | $18,355 | $16,345 |
|---|
| 10/20 | $15,367 | $17,867 | $15,977 |
|---|
| 11/20 | $17,052 | $19,823 | $17,516 |
|---|
| 12/20 | $17,634 | $20,585 | $17,847 |
|---|
| 1/21 | $17,180 | $20,377 | $17,437 |
|---|
| 2/21 | $17,731 | $20,939 | $17,731 |
|---|
| 3/21 | $18,533 | $21,856 | $18,854 |
|---|
| 4/21 | $19,492 | $23,022 | $19,606 |
|---|
| 5/21 | $19,682 | $23,183 | $19,924 |
|---|
| 6/21 | $19,882 | $23,724 | $19,905 |
|---|
| 7/21 | $20,364 | $24,288 | $20,408 |
|---|
| 8/21 | $20,701 | $25,026 | $20,762 |
|---|
| 9/21 | $19,688 | $23,863 | $19,856 |
|---|
| 10/21 | $20,884 | $25,534 | $21,136 |
|---|
| 11/21 | $20,665 | $25,357 | $20,756 |
|---|
| 12/21 | $21,940 | $26,494 | $22,102 |
|---|
| 1/22 | $20,914 | $25,123 | $21,305 |
|---|
| 2/22 | $20,517 | $24,371 | $20,801 |
|---|
| 3/22 | $21,318 | $25,276 | $21,493 |
|---|
| 4/22 | $20,010 | $23,071 | $20,574 |
|---|
| 5/22 | $20,346 | $23,114 | $20,745 |
|---|
| 6/22 | $18,935 | $21,206 | $19,431 |
|---|
| 7/22 | $19,762 | $23,161 | $20,647 |
|---|
| 8/22 | $19,072 | $22,217 | $19,955 |
|---|
| 9/22 | $17,565 | $20,170 | $18,296 |
|---|
| 10/22 | $19,112 | $21,804 | $20,240 |
|---|
| 11/22 | $20,548 | $23,022 | $21,554 |
|---|
| 12/22 | $19,801 | $21,696 | $20,825 |
|---|
| 1/23 | $20,261 | $23,059 | $21,338 |
|---|
| 2/23 | $19,533 | $22,496 | $20,688 |
|---|
| 3/23 | $19,852 | $23,322 | $21,001 |
|---|
| 4/23 | $20,104 | $23,686 | $21,433 |
|---|
| 5/23 | $19,535 | $23,789 | $20,771 |
|---|
| 6/23 | $20,493 | $25,361 | $22,061 |
|---|
| 7/23 | $21,250 | $26,176 | $22,573 |
|---|
| 8/23 | $20,843 | $25,759 | $22,159 |
|---|
| 9/23 | $20,024 | $24,531 | $21,212 |
|---|
| 10/23 | $19,594 | $24,015 | $20,871 |
|---|
| 11/23 | $20,940 | $26,208 | $22,397 |
|---|
| 12/23 | $22,010 | $27,399 | $23,299 |
|---|
| 1/24 | $22,275 | $27,859 | $23,587 |
|---|
| 2/24 | $22,906 | $29,347 | $24,261 |
|---|
| 3/24 | $23,667 | $30,291 | $25,044 |
|---|
| 4/24 | $22,573 | $29,054 | $24,037 |
|---|
| 5/24 | $23,271 | $30,494 | $24,889 |
|---|
| 6/24 | $23,528 | $31,589 | $25,243 |
|---|
| 7/24 | $24,373 | $31,973 | $26,336 |
|---|
| 8/24 | $25,128 | $32,749 | $27,200 |
|---|
| 9/24 | $25,365 | $33,448 | $27,647 |
|---|
| 10/24 | $25,423 | $33,145 | $27,198 |
|---|
| 11/24 | $26,374 | $35,090 | $28,641 |
|---|
| 12/24 | $25,197 | $34,254 | $27,403 |
|---|
Average Annual Total Returns (%)
| Fund | 1 Year | 5 Years | 10 Years |
|---|
| Class A | 14.51% | 9.92% | 10.27% |
|---|
| Class A with 5.25% Maximum Sales Charge | 8.53% | 8.75% | 9.67% |
|---|
S&P 500® Index | 25.02% | 14.51% | 13.09% |
|---|
| NASDAQ US Broad Dividend Achievers™ Index | 17.61% | 11.03% | 10.60% |
|---|
Performance does not reflect the deduction of taxes that a shareholder would pay on Fund distributions or redemption of Fund shares. Performance assumes that all dividends and distributions, if any, were reinvested. For more recent performance information, visit www.eatonvance.com/performance.php.
THE FUND'S PAST PERFORMANCE IS NO GUARANTEE OF FUTURE RESULTS.
| Total Net Assets | $893,743,464 |
|---|
| # of Portfolio Holdings | 57 |
|---|
| Portfolio Turnover Rate | 50% |
|---|
| Total Advisory Fees Paid | $5,677,375 |
|---|
What did the Fund invest in?
The following tables reflect what the Fund invested in as of the report date.
Sector Allocation (% of total investments)
| Value | Value |
|---|
| Short-Term Investments | 1.0% |
| Real Estate | 1.8% |
| Materials | 2.3% |
| Consumer Discretionary | 3.4% |
| Utilities | 4.0% |
| Communication Services | 5.2% |
| Energy | 5.9% |
| Consumer Staples | 7.1% |
| Health Care | 12.8% |
| Industrials | 13.5% |
| Information Technology | 20.6% |
| Financials | 22.4% |
Top Ten Holdings (% of total investments)Footnote Referencea
| Broadcom, Inc. | 4.9% |
| Microsoft Corp. | 4.2% |
| Chevron Corp. | 3.3% |
| JPMorgan Chase & Co. | 3.0% |
| Johnson & Johnson | 2.7% |
| EOG Resources, Inc. | 2.6% |
| International Paper Co. | 2.3% |
| UnitedHealth Group, Inc. | 2.3% |
| Procter & Gamble Co. | 2.3% |
| Bristol-Myers Squibb Co. | 2.3% |
| Total | 29.9% |
| Footnote | Description |
Footnotea | Excluding cash equivalents |
If you wish to view additional information about the Fund, including the prospectus, statement of additional information, financial statements and holdings, please scan the QR code or visit www.eatonvance.com/open-end-mutual-fund-documents.php. For proxy information, please visit www.eatonvance.com/proxyvoting.
The Funds may deliver a single copy of certain required shareholder documents (including prospectuses, shareholder reports, and proxy materials) to investors with the same last name and the same address. Your participation will continue indefinitely unless you instruct otherwise by calling 1-800-262-1122 or by contacting your financial intermediary. Your instruction will typically be effective within 30 days of receipt.
Not FDIC Insured | May Lose Value | No Bank Guarantee
Annual Shareholder Report December 31, 2024
Eaton Vance Dividend Builder Fund
Annual Shareholder Report December 31, 2024
This annual shareholder report contains important information about the Eaton Vance Dividend Builder Fund for the period of January 1, 2024 to December 31, 2024. You can find additional information about the Fund at www.eatonvance.com/open-end-mutual-fund-documents.php. You can also request this information by contacting us at 1-800-262-1122.
What were the Fund costs for the last year?
(based on a hypothetical $10,000 investment)
| Class Name | Costs of a $10,000 investment | Costs paid as a percentage of a $10,000 investment |
|---|
| Class C | $186 | 1.74% |
|---|
How did the Fund perform last year and what affected its performance?
Key contributors to (↑) and detractors from (↓) performance, relative to the S&P 500® Index (the Index):
↓ Not owning semiconductor maker NVIDIA Corp. or Facebook parent Meta Platforms Inc. hurt relative returns as both stocks performed well. Both firms pay nominal dividends, but did not meet the Fund’s criteria for investing in stocks that demonstrate the ability to produce attractive levels of dividend income over time
↓ An overweight position in CDW Corp., a distributor of technology products and services, lost value as demand from small- and mid-size businesses declined
↓ Among sectors, stock selections and underweight exposures to information technology and communication services, and an overweight in health care hurt returns
↑ In contrast, an overweight position in Broadcom Inc. aided returns as its stock price doubled on AI-driven demand for its semiconductor and software products
↑ An overweight position in global retail and grocery giant Walmart Inc. rose in value as its core U.S. retail business gained market share during the period
↑ An overweight position in paper products firm International Paper Co. rose in value as its new CEO cut costs and employed new strategies that investors favored
↑ Among sectors, stock selections in materials and consumer staples, and stock selections and an underweight exposure to real estate helped Index-relative returns
Comparison of the change in value of a $10,000 investment for the period indicated.
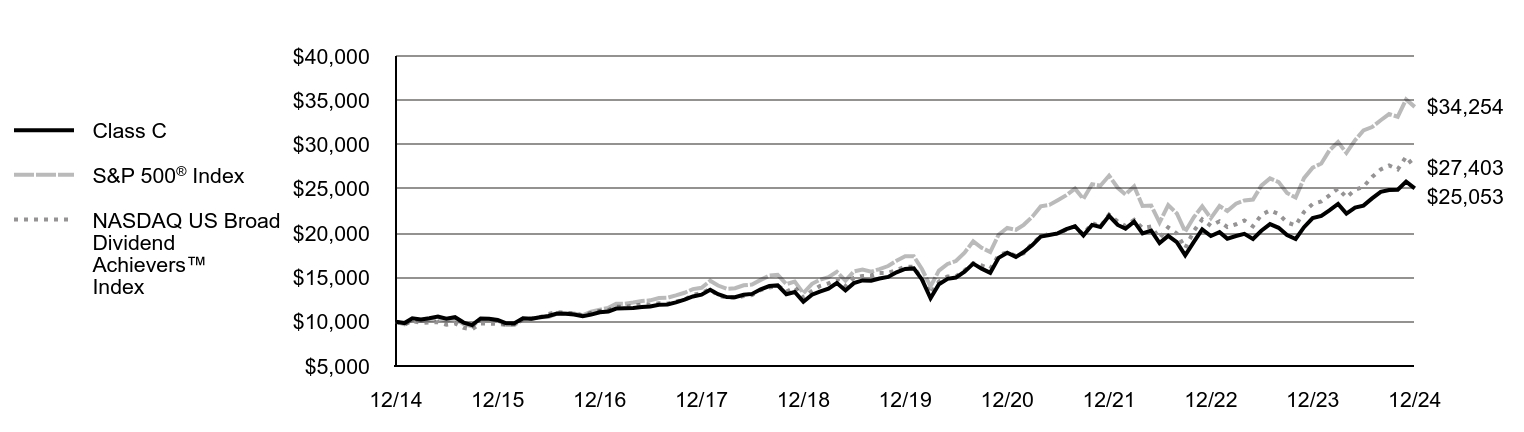
| Class C | S&P 500® Index | NASDAQ US Broad Dividend Achievers™ Index |
|---|
| 12/14 | $10,000 | $10,000 | $10,000 |
|---|
| 1/15 | $9,846 | $9,700 | $9,689 |
|---|
| 2/15 | $10,386 | $10,257 | $10,087 |
|---|
| 3/15 | $10,259 | $10,095 | $9,861 |
|---|
| 4/15 | $10,385 | $10,192 | $9,925 |
|---|
| 5/15 | $10,583 | $10,323 | $9,929 |
|---|
| 6/15 | $10,338 | $10,123 | $9,658 |
|---|
| 7/15 | $10,510 | $10,335 | $9,805 |
|---|
| 8/15 | $9,906 | $9,712 | $9,299 |
|---|
| 9/15 | $9,620 | $9,471 | $9,152 |
|---|
| 10/15 | $10,366 | $10,270 | $9,807 |
|---|
| 11/15 | $10,339 | $10,301 | $9,795 |
|---|
| 12/15 | $10,205 | $10,138 | $9,742 |
|---|
| 1/16 | $9,821 | $9,635 | $9,657 |
|---|
| 2/16 | $9,817 | $9,622 | $9,746 |
|---|
| 3/16 | $10,389 | $10,275 | $10,374 |
|---|
| 4/16 | $10,337 | $10,315 | $10,373 |
|---|
| 5/16 | $10,496 | $10,500 | $10,513 |
|---|
| 6/16 | $10,646 | $10,527 | $10,885 |
|---|
| 7/16 | $10,932 | $10,915 | $11,087 |
|---|
| 8/16 | $10,896 | $10,931 | $10,991 |
|---|
| 9/16 | $10,819 | $10,933 | $10,964 |
|---|
| 10/16 | $10,624 | $10,733 | $10,724 |
|---|
| 11/16 | $10,801 | $11,131 | $10,993 |
|---|
| 12/16 | $11,074 | $11,351 | $11,225 |
|---|
| 1/17 | $11,151 | $11,566 | $11,296 |
|---|
| 2/17 | $11,480 | $12,025 | $11,703 |
|---|
| 3/17 | $11,508 | $12,039 | $11,677 |
|---|
| 4/17 | $11,551 | $12,163 | $11,768 |
|---|
| 5/17 | $11,652 | $12,334 | $11,953 |
|---|
| 6/17 | $11,720 | $12,411 | $11,924 |
|---|
| 7/17 | $11,919 | $12,667 | $12,085 |
|---|
| 8/17 | $11,938 | $12,705 | $12,040 |
|---|
| 9/17 | $12,191 | $12,967 | $12,276 |
|---|
| 10/17 | $12,486 | $13,270 | $12,494 |
|---|
| 11/17 | $12,856 | $13,677 | $13,043 |
|---|
| 12/17 | $13,055 | $13,829 | $13,247 |
|---|
| 1/18 | $13,603 | $14,621 | $13,711 |
|---|
| 2/18 | $13,105 | $14,082 | $12,907 |
|---|
| 3/18 | $12,776 | $13,724 | $12,761 |
|---|
| 4/18 | $12,769 | $13,777 | $12,712 |
|---|
| 5/18 | $13,041 | $14,108 | $12,890 |
|---|
| 6/18 | $13,141 | $14,195 | $13,021 |
|---|
| 7/18 | $13,656 | $14,724 | $13,578 |
|---|
| 8/18 | $14,026 | $15,203 | $13,859 |
|---|
| 9/18 | $14,100 | $15,290 | $14,094 |
|---|
| 10/18 | $13,108 | $14,245 | $13,399 |
|---|
| 11/18 | $13,356 | $14,535 | $13,881 |
|---|
| 12/18 | $12,260 | $13,223 | $12,725 |
|---|
| 1/19 | $13,054 | $14,282 | $13,476 |
|---|
| 2/19 | $13,405 | $14,741 | $14,031 |
|---|
| 3/19 | $13,741 | $15,027 | $14,326 |
|---|
| 4/19 | $14,371 | $15,636 | $14,772 |
|---|
| 5/19 | $13,532 | $14,642 | $14,028 |
|---|
| 6/19 | $14,356 | $15,674 | $14,949 |
|---|
| 7/19 | $14,664 | $15,899 | $15,167 |
|---|
| 8/19 | $14,637 | $15,648 | $15,202 |
|---|
| 9/19 | $14,876 | $15,940 | $15,507 |
|---|
| 10/19 | $15,057 | $16,286 | $15,511 |
|---|
| 11/19 | $15,574 | $16,877 | $15,824 |
|---|
| 12/19 | $15,953 | $17,386 | $16,228 |
|---|
| 1/20 | $16,016 | $17,379 | $16,204 |
|---|
| 2/20 | $14,776 | $15,949 | $14,803 |
|---|
| 3/20 | $12,642 | $13,979 | $13,146 |
|---|
| 4/20 | $14,224 | $15,771 | $14,530 |
|---|
| 5/20 | $14,839 | $16,522 | $15,116 |
|---|
| 6/20 | $14,985 | $16,850 | $15,118 |
|---|
| 7/20 | $15,652 | $17,801 | $15,800 |
|---|
| 8/20 | $16,559 | $19,080 | $16,610 |
|---|
| 9/20 | $15,992 | $18,355 | $16,345 |
|---|
| 10/20 | $15,518 | $17,867 | $15,977 |
|---|
| 11/20 | $17,209 | $19,823 | $17,516 |
|---|
| 12/20 | $17,789 | $20,585 | $17,847 |
|---|
| 1/21 | $17,323 | $20,377 | $17,437 |
|---|
| 2/21 | $17,864 | $20,939 | $17,731 |
|---|
| 3/21 | $18,655 | $21,856 | $18,854 |
|---|
| 4/21 | $19,612 | $23,022 | $19,606 |
|---|
| 5/21 | $19,788 | $23,183 | $19,924 |
|---|
| 6/21 | $19,976 | $23,724 | $19,905 |
|---|
| 7/21 | $20,445 | $24,288 | $20,408 |
|---|
| 8/21 | $20,777 | $25,026 | $20,762 |
|---|
| 9/21 | $19,745 | $23,863 | $19,856 |
|---|
| 10/21 | $20,933 | $25,534 | $21,136 |
|---|
| 11/21 | $20,693 | $25,357 | $20,756 |
|---|
| 12/21 | $21,957 | $26,494 | $22,102 |
|---|
| 1/22 | $20,923 | $25,123 | $21,305 |
|---|
| 2/22 | $20,516 | $24,371 | $20,801 |
|---|
| 3/22 | $21,298 | $25,276 | $21,493 |
|---|
| 4/22 | $19,977 | $23,071 | $20,574 |
|---|
| 5/22 | $20,297 | $23,114 | $20,745 |
|---|
| 6/22 | $18,888 | $21,206 | $19,431 |
|---|
| 7/22 | $19,694 | $23,161 | $20,647 |
|---|
| 8/22 | $18,989 | $22,217 | $19,955 |
|---|
| 9/22 | $17,488 | $20,170 | $18,296 |
|---|
| 10/22 | $19,013 | $21,804 | $20,240 |
|---|
| 11/22 | $20,430 | $23,022 | $21,554 |
|---|
| 12/22 | $19,681 | $21,696 | $20,825 |
|---|
| 1/23 | $20,107 | $23,059 | $21,338 |
|---|
| 2/23 | $19,378 | $22,496 | $20,688 |
|---|
| 3/23 | $19,681 | $23,322 | $21,001 |
|---|
| 4/23 | $19,915 | $23,686 | $21,433 |
|---|
| 5/23 | $19,345 | $23,789 | $20,771 |
|---|
| 6/23 | $20,272 | $25,361 | $22,061 |
|---|
| 7/23 | $21,014 | $26,176 | $22,573 |
|---|
| 8/23 | $20,603 | $25,759 | $22,159 |
|---|
| 9/23 | $19,787 | $24,531 | $21,212 |
|---|
| 10/23 | $19,340 | $24,015 | $20,871 |
|---|
| 11/23 | $20,673 | $26,208 | $22,397 |
|---|
| 12/23 | $21,705 | $27,399 | $23,299 |
|---|
| 1/24 | $21,948 | $27,859 | $23,587 |
|---|
| 2/24 | $22,565 | $29,347 | $24,261 |
|---|
| 3/24 | $23,292 | $30,291 | $25,044 |
|---|
| 4/24 | $22,198 | $29,054 | $24,037 |
|---|
| 5/24 | $22,878 | $30,494 | $24,889 |
|---|
| 6/24 | $23,112 | $31,589 | $25,243 |
|---|
| 7/24 | $23,925 | $31,973 | $26,336 |
|---|
| 8/24 | $24,658 | $32,749 | $27,200 |
|---|
| 9/24 | $24,872 | $33,448 | $27,647 |
|---|
| 10/24 | $24,901 | $33,145 | $27,198 |
|---|
| 11/24 | $25,822 | $35,090 | $28,641 |
|---|
| 12/24 | $25,053 | $34,254 | $27,403 |
|---|
Average Annual Total Returns (%)
| Fund | 1 Year | 5 Years | 10 Years |
|---|
| Class C, with conversion to Class A after 8 years | 13.67% | 9.10% | 9.61% |
|---|
| Class C, with 1% Maximum Deferred Sales Charge and conversion to Class A after 8 years | 12.67% | 9.10% | 9.61% |
|---|
S&P 500® Index | 25.02% | 14.51% | 13.09% |
|---|
| NASDAQ US Broad Dividend Achievers™ Index | 17.61% | 11.03% | 10.60% |
|---|
Performance does not reflect the deduction of taxes that a shareholder would pay on Fund distributions or redemption of Fund shares. Performance assumes that all dividends and distributions, if any, were reinvested. For more recent performance information, visit www.eatonvance.com/performance.php.
THE FUND'S PAST PERFORMANCE IS NO GUARANTEE OF FUTURE RESULTS.
| Total Net Assets | $893,743,464 |
|---|
| # of Portfolio Holdings | 57 |
|---|
| Portfolio Turnover Rate | 50% |
|---|
| Total Advisory Fees Paid | $5,677,375 |
|---|
What did the Fund invest in?
The following tables reflect what the Fund invested in as of the report date.
Sector Allocation (% of total investments)
| Value | Value |
|---|
| Short-Term Investments | 1.0% |
| Real Estate | 1.8% |
| Materials | 2.3% |
| Consumer Discretionary | 3.4% |
| Utilities | 4.0% |
| Communication Services | 5.2% |
| Energy | 5.9% |
| Consumer Staples | 7.1% |
| Health Care | 12.8% |
| Industrials | 13.5% |
| Information Technology | 20.6% |
| Financials | 22.4% |
Top Ten Holdings (% of total investments)Footnote Referencea
| Broadcom, Inc. | 4.9% |
| Microsoft Corp. | 4.2% |
| Chevron Corp. | 3.3% |
| JPMorgan Chase & Co. | 3.0% |
| Johnson & Johnson | 2.7% |
| EOG Resources, Inc. | 2.6% |
| International Paper Co. | 2.3% |
| UnitedHealth Group, Inc. | 2.3% |
| Procter & Gamble Co. | 2.3% |
| Bristol-Myers Squibb Co. | 2.3% |
| Total | 29.9% |
| Footnote | Description |
Footnotea | Excluding cash equivalents |
If you wish to view additional information about the Fund, including the prospectus, statement of additional information, financial statements and holdings, please scan the QR code or visit www.eatonvance.com/open-end-mutual-fund-documents.php. For proxy information, please visit www.eatonvance.com/proxyvoting.
The Funds may deliver a single copy of certain required shareholder documents (including prospectuses, shareholder reports, and proxy materials) to investors with the same last name and the same address. Your participation will continue indefinitely unless you instruct otherwise by calling 1-800-262-1122 or by contacting your financial intermediary. Your instruction will typically be effective within 30 days of receipt.
Not FDIC Insured | May Lose Value | No Bank Guarantee
Annual Shareholder Report December 31, 2024
Eaton Vance Dividend Builder Fund
Annual Shareholder Report December 31, 2024
This annual shareholder report contains important information about the Eaton Vance Dividend Builder Fund for the period of January 1, 2024 to December 31, 2024. You can find additional information about the Fund at www.eatonvance.com/open-end-mutual-fund-documents.php. You can also request this information by contacting us at 1-800-262-1122.
What were the Fund costs for the last year?
(based on a hypothetical $10,000 investment)
| Class Name | Costs of a $10,000 investment | Costs paid as a percentage of a $10,000 investment |
|---|
| Class I | $79 | 0.74% |
|---|
How did the Fund perform last year and what affected its performance?
Key contributors to (↑) and detractors from (↓) performance, relative to the S&P 500® Index (the Index):
↓ Not owning semiconductor maker NVIDIA Corp. or Facebook parent Meta Platforms Inc. hurt relative returns as both stocks performed well. Both firms pay nominal dividends, but did not meet the Fund’s criteria for investing in stocks that demonstrate the ability to produce attractive levels of dividend income over time
↓ An overweight position in CDW Corp., a distributor of technology products and services, lost value as demand from small- and mid-size businesses declined
↓ Among sectors, stock selections and underweight exposures to information technology and communication services, and an overweight in health care hurt returns
↑ In contrast, an overweight position in Broadcom Inc. aided returns as its stock price doubled on AI-driven demand for its semiconductor and software products
↑ An overweight position in global retail and grocery giant Walmart Inc. rose in value as its core U.S. retail business gained market share during the period
↑ An overweight position in paper products firm International Paper Co. rose in value as its new CEO cut costs and employed new strategies that investors favored
↑ Among sectors, stock selections in materials and consumer staples, and stock selections and an underweight exposure to real estate helped Index-relative returns
Comparison of the change in value of a $1,000,000 investment for the period indicated.
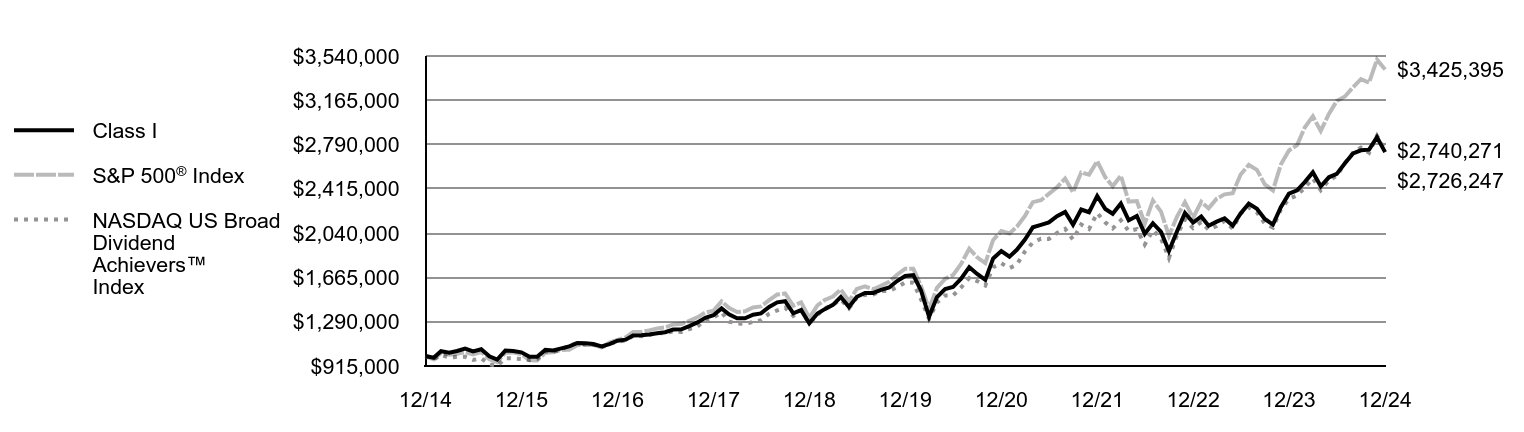
| Class I | S&P 500® Index | NASDAQ US Broad Dividend Achievers™ Index |
|---|
| 12/14 | $1,000,000 | $1,000,000 | $1,000,000 |
|---|
| 1/15 | $985,199 | $969,981 | $968,884 |
|---|
| 2/15 | $1,040,339 | $1,025,727 | $1,008,688 |
|---|
| 3/15 | $1,028,411 | $1,009,506 | $986,092 |
|---|
| 4/15 | $1,041,923 | $1,019,190 | $992,519 |
|---|
| 5/15 | $1,062,668 | $1,032,296 | $992,917 |
|---|
| 6/15 | $1,038,806 | $1,012,313 | $965,806 |
|---|
| 7/15 | $1,057,055 | $1,033,522 | $980,542 |
|---|
| 8/15 | $997,014 | $971,166 | $929,892 |
|---|
| 9/15 | $968,929 | $947,136 | $915,242 |
|---|
| 10/15 | $1,045,203 | $1,027,030 | $980,690 |
|---|
| 11/15 | $1,042,647 | $1,030,085 | $979,538 |
|---|
| 12/15 | $1,030,930 | $1,013,838 | $974,166 |
|---|
| 1/16 | $992,743 | $963,527 | $965,735 |
|---|
| 2/16 | $992,371 | $962,227 | $974,560 |
|---|
| 3/16 | $1,051,251 | $1,027,503 | $1,037,448 |
|---|
| 4/16 | $1,046,899 | $1,031,487 | $1,037,292 |
|---|
| 5/16 | $1,063,937 | $1,050,010 | $1,051,292 |
|---|
| 6/16 | $1,080,945 | $1,052,731 | $1,088,514 |
|---|
| 7/16 | $1,110,291 | $1,091,544 | $1,108,672 |
|---|
| 8/16 | $1,107,437 | $1,093,076 | $1,099,089 |
|---|
| 9/16 | $1,100,597 | $1,093,283 | $1,096,432 |
|---|
| 10/16 | $1,081,595 | $1,073,340 | $1,072,435 |
|---|
| 11/16 | $1,100,603 | $1,113,091 | $1,099,312 |
|---|
| 12/16 | $1,128,743 | $1,135,093 | $1,122,464 |
|---|
| 1/17 | $1,138,338 | $1,156,621 | $1,129,586 |
|---|
| 2/17 | $1,173,146 | $1,202,546 | $1,170,326 |
|---|
| 3/17 | $1,176,073 | $1,203,949 | $1,167,660 |
|---|
| 4/17 | $1,181,570 | $1,216,313 | $1,176,840 |
|---|
| 5/17 | $1,192,925 | $1,233,430 | $1,195,273 |
|---|
| 6/17 | $1,200,927 | $1,241,129 | $1,192,421 |
|---|
| 7/17 | $1,223,415 | $1,266,650 | $1,208,547 |
|---|
| 8/17 | $1,225,555 | $1,270,527 | $1,203,956 |
|---|
| 9/17 | $1,252,737 | $1,296,736 | $1,227,633 |
|---|
| 10/17 | $1,284,258 | $1,326,995 | $1,249,382 |
|---|
| 11/17 | $1,322,778 | $1,367,694 | $1,304,338 |
|---|
| 12/17 | $1,344,571 | $1,382,901 | $1,324,705 |
|---|
| 1/18 | $1,402,431 | $1,462,078 | $1,371,076 |
|---|
| 2/18 | $1,352,009 | $1,408,190 | $1,290,654 |
|---|
| 3/18 | $1,319,832 | $1,372,403 | $1,276,128 |
|---|
| 4/18 | $1,319,356 | $1,377,669 | $1,271,248 |
|---|
| 5/18 | $1,348,694 | $1,410,846 | $1,288,966 |
|---|
| 6/18 | $1,360,340 | $1,419,530 | $1,302,142 |
|---|
| 7/18 | $1,415,070 | $1,472,355 | $1,357,769 |
|---|
| 8/18 | $1,453,882 | $1,520,333 | $1,385,878 |
|---|
| 9/18 | $1,463,927 | $1,528,986 | $1,409,362 |
|---|
| 10/18 | $1,361,298 | $1,424,480 | $1,339,858 |
|---|
| 11/18 | $1,388,506 | $1,453,508 | $1,388,129 |
|---|
| 12/18 | $1,275,984 | $1,322,270 | $1,272,469 |
|---|
| 1/19 | $1,359,238 | $1,428,231 | $1,347,550 |
|---|
| 2/19 | $1,396,632 | $1,474,089 | $1,403,052 |
|---|
| 3/19 | $1,433,029 | $1,502,733 | $1,432,572 |
|---|
| 4/19 | $1,500,329 | $1,563,578 | $1,477,222 |
|---|
| 5/19 | $1,414,384 | $1,464,216 | $1,402,836 |
|---|
| 6/19 | $1,501,485 | $1,567,408 | $1,494,913 |
|---|
| 7/19 | $1,534,007 | $1,589,935 | $1,516,709 |
|---|
| 8/19 | $1,533,601 | $1,564,750 | $1,520,231 |
|---|
| 9/19 | $1,559,172 | $1,594,027 | $1,550,677 |
|---|
| 10/19 | $1,579,603 | $1,628,553 | $1,551,094 |
|---|
| 11/19 | $1,634,615 | $1,687,668 | $1,582,393 |
|---|
| 12/19 | $1,677,211 | $1,738,605 | $1,622,811 |
|---|
| 1/20 | $1,684,198 | $1,737,924 | $1,620,353 |
|---|
| 2/20 | $1,556,339 | $1,594,859 | $1,480,263 |
|---|
| 3/20 | $1,332,204 | $1,397,874 | $1,314,631 |
|---|
| 4/20 | $1,499,201 | $1,577,072 | $1,452,970 |
|---|
| 5/20 | $1,566,961 | $1,652,185 | $1,511,607 |
|---|
| 6/20 | $1,583,636 | $1,685,042 | $1,511,805 |
|---|
| 7/20 | $1,653,792 | $1,780,054 | $1,580,021 |
|---|
| 8/20 | $1,752,110 | $1,908,005 | $1,660,957 |
|---|
| 9/20 | $1,694,215 | $1,835,507 | $1,634,530 |
|---|
| 10/20 | $1,643,819 | $1,786,694 | $1,597,712 |
|---|
| 11/20 | $1,825,902 | $1,982,273 | $1,751,648 |
|---|
| 12/20 | $1,888,634 | $2,058,487 | $1,784,667 |
|---|
| 1/21 | $1,840,329 | $2,037,705 | $1,743,679 |
|---|
| 2/21 | $1,898,674 | $2,093,895 | $1,773,081 |
|---|
| 3/21 | $1,986,145 | $2,185,598 | $1,885,392 |
|---|
| 4/21 | $2,089,366 | $2,302,241 | $1,960,646 |
|---|
| 5/21 | $2,110,151 | $2,318,321 | $1,992,443 |
|---|
| 6/21 | $2,130,922 | $2,372,442 | $1,990,519 |
|---|
| 7/21 | $2,183,071 | $2,428,799 | $2,040,793 |
|---|
| 8/21 | $2,219,681 | $2,502,648 | $2,076,158 |
|---|
| 9/21 | $2,111,393 | $2,386,250 | $1,985,555 |
|---|
| 10/21 | $2,240,314 | $2,553,435 | $2,113,582 |
|---|
| 11/21 | $2,217,268 | $2,535,743 | $2,075,644 |
|---|
| 12/21 | $2,354,674 | $2,649,385 | $2,210,151 |
|---|
| 1/22 | $2,244,886 | $2,512,287 | $2,130,539 |
|---|
| 2/22 | $2,203,854 | $2,437,066 | $2,080,095 |
|---|
| 3/22 | $2,290,381 | $2,527,553 | $2,149,336 |
|---|
| 4/22 | $2,149,064 | $2,307,145 | $2,057,436 |
|---|
| 5/22 | $2,185,676 | $2,311,378 | $2,074,482 |
|---|
| 6/22 | $2,034,385 | $2,120,588 | $1,943,130 |
|---|
| 7/22 | $2,123,785 | $2,316,116 | $2,064,709 |
|---|
| 8/22 | $2,049,980 | $2,221,660 | $1,995,485 |
|---|
| 9/22 | $1,889,418 | $2,017,049 | $1,829,638 |
|---|
| 10/22 | $2,056,331 | $2,180,352 | $2,023,972 |
|---|
| 11/22 | $2,211,399 | $2,302,198 | $2,155,400 |
|---|
| 12/22 | $2,130,153 | $2,169,558 | $2,082,504 |
|---|
| 1/23 | $2,180,265 | $2,305,880 | $2,133,846 |
|---|
| 2/23 | $2,102,181 | $2,249,619 | $2,068,848 |
|---|
| 3/23 | $2,137,057 | $2,332,212 | $2,100,075 |
|---|
| 4/23 | $2,164,637 | $2,368,614 | $2,143,283 |
|---|
| 5/23 | $2,103,685 | $2,378,910 | $2,077,110 |
|---|
| 6/23 | $2,207,490 | $2,536,097 | $2,206,108 |
|---|
| 7/23 | $2,289,699 | $2,617,569 | $2,257,279 |
|---|
| 8/23 | $2,246,235 | $2,575,893 | $2,215,899 |
|---|
| 9/23 | $2,159,870 | $2,453,080 | $2,121,208 |
|---|
| 10/23 | $2,112,320 | $2,401,500 | $2,087,063 |
|---|
| 11/23 | $2,259,729 | $2,620,818 | $2,239,661 |
|---|
| 12/23 | $2,374,174 | $2,739,884 | $2,329,918 |
|---|
| 1/24 | $2,403,238 | $2,785,925 | $2,358,744 |
|---|
| 2/24 | $2,472,008 | $2,934,682 | $2,426,066 |
|---|
| 3/24 | $2,554,785 | $3,029,104 | $2,504,371 |
|---|
| 4/24 | $2,437,007 | $2,905,381 | $2,403,674 |
|---|
| 5/24 | $2,512,929 | $3,049,444 | $2,488,894 |
|---|
| 6/24 | $2,541,324 | $3,158,864 | $2,524,279 |
|---|
| 7/24 | $2,631,533 | $3,197,315 | $2,633,603 |
|---|
| 8/24 | $2,715,466 | $3,274,872 | $2,720,019 |
|---|
| 9/24 | $2,741,741 | $3,344,813 | $2,764,747 |
|---|
| 10/24 | $2,746,882 | $3,314,481 | $2,719,808 |
|---|
| 11/24 | $2,852,105 | $3,509,044 | $2,864,075 |
|---|
| 12/24 | $2,726,247 | $3,425,395 | $2,740,271 |
|---|
Average Annual Total Returns (%)
| Fund | 1 Year | 5 Years | 10 Years |
|---|
| Class I | 14.82% | 10.19% | 10.54% |
|---|
S&P 500® Index | 25.02% | 14.51% | 13.09% |
|---|
| NASDAQ US Broad Dividend Achievers™ Index | 17.61% | 11.03% | 10.60% |
|---|
Performance does not reflect the deduction of taxes that a shareholder would pay on Fund distributions or redemption of Fund shares. Performance assumes that all dividends and distributions, if any, were reinvested. For more recent performance information, visit www.eatonvance.com/performance.php.
THE FUND'S PAST PERFORMANCE IS NO GUARANTEE OF FUTURE RESULTS.
| Total Net Assets | $893,743,464 |
|---|
| # of Portfolio Holdings | 57 |
|---|
| Portfolio Turnover Rate | 50% |
|---|
| Total Advisory Fees Paid | $5,677,375 |
|---|
What did the Fund invest in?
The following tables reflect what the Fund invested in as of the report date.
Sector Allocation (% of total investments)
| Value | Value |
|---|
| Short-Term Investments | 1.0% |
| Real Estate | 1.8% |
| Materials | 2.3% |
| Consumer Discretionary | 3.4% |
| Utilities | 4.0% |
| Communication Services | 5.2% |
| Energy | 5.9% |
| Consumer Staples | 7.1% |
| Health Care | 12.8% |
| Industrials | 13.5% |
| Information Technology | 20.6% |
| Financials | 22.4% |
Top Ten Holdings (% of total investments)Footnote Referencea
| Broadcom, Inc. | 4.9% |
| Microsoft Corp. | 4.2% |
| Chevron Corp. | 3.3% |
| JPMorgan Chase & Co. | 3.0% |
| Johnson & Johnson | 2.7% |
| EOG Resources, Inc. | 2.6% |
| International Paper Co. | 2.3% |
| UnitedHealth Group, Inc. | 2.3% |
| Procter & Gamble Co. | 2.3% |
| Bristol-Myers Squibb Co. | 2.3% |
| Total | 29.9% |
| Footnote | Description |
Footnotea | Excluding cash equivalents |
If you wish to view additional information about the Fund, including the prospectus, statement of additional information, financial statements and holdings, please scan the QR code or visit www.eatonvance.com/open-end-mutual-fund-documents.php. For proxy information, please visit www.eatonvance.com/proxyvoting.
The Funds may deliver a single copy of certain required shareholder documents (including prospectuses, shareholder reports, and proxy materials) to investors with the same last name and the same address. Your participation will continue indefinitely unless you instruct otherwise by calling 1-800-262-1122 or by contacting your financial intermediary. Your instruction will typically be effective within 30 days of receipt.
Not FDIC Insured | May Lose Value | No Bank Guarantee
Annual Shareholder Report December 31, 2024
Eaton Vance Greater India Fund
Annual Shareholder Report December 31, 2024
This annual shareholder report contains important information about the Eaton Vance Greater India Fund for the period of January 1, 2024 to December 31, 2024. You can find additional information about the Fund at www.eatonvance.com/open-end-mutual-fund-documents.php. You can also request this information by contacting us at 1-800-262-1122.
What were the Fund costs for the last year?Footnote Reference*
(based on a hypothetical $10,000 investment)
| Class Name | Costs of a $10,000 investment | Costs paid as a percentage of a $10,000 investment |
|---|
| Class A | $161 | 1.48% |
|---|
| Footnote | Description |
Footnote* | Expenses in the table reflect the expenses of both the Fund and Greater India Portfolio, the Portfolio in which it invests. |
How did the Fund perform last year and what affected its performance?
Key contributors to (↑) and detractors from (↓) performance, relative to the MSCI India Index (the Index):
↑ Among sectors within the Index, the Fund’s exposures to the consumer discretionary and energy markets were the largest contributors to Index-relative returns
↑ An underweight position in Reliance Industries Ltd. ― whose petrochemical business struggled from weak global demand ― was the top contributor to returns
↑ An overweight position in Dixon Technologies India Ltd. ― maker of lights, mobile phones, and consumer appliances ― helped returns amid a surge in net profits
↓ In contrast, the Fund’s exposures to the industrials and financials sectors were the largest detractors from Index-relative performance during the period
↓ Among stocks, an overweight position in Tata Consumer Products Ltd. ― maker and exporter of tea, salt, oil, and spices ― was the largest detractor from returns
↓ In the financials sector, the Fund’s underweight position in IIFL Finance Ltd. detracted from Index-relative returns during the period ― and was sold from the Fund after the Reserve Bank of India directed the integrated financial services firm to cease disbursal of gold loans, citing business inconsistencies
Comparison of the change in value of a $10,000 investment for the period indicated.

| Class A with Maximum Sales Charge | MSCI India Index |
|---|
| 12/14 | $10,000 | $10,000 |
|---|
| 1/15 | $10,395 | $10,794 |
|---|
| 2/15 | $10,585 | $10,995 |
|---|
| 3/15 | $10,152 | $10,540 |
|---|
| 4/15 | $9,558 | $9,850 |
|---|
| 5/15 | $9,882 | $10,129 |
|---|
| 6/15 | $9,935 | $10,159 |
|---|
| 7/15 | $10,036 | $10,339 |
|---|
| 8/15 | $9,131 | $9,431 |
|---|
| 9/15 | $9,302 | $9,474 |
|---|
| 10/15 | $9,309 | $9,623 |
|---|
| 11/15 | $9,047 | $9,163 |
|---|
| 12/15 | $9,005 | $9,388 |
|---|
| 1/16 | $8,299 | $8,742 |
|---|
| 2/16 | $7,719 | $8,095 |
|---|
| 3/16 | $8,708 | $9,153 |
|---|
| 4/16 | $8,988 | $9,197 |
|---|
| 5/16 | $9,313 | $9,370 |
|---|
| 6/16 | $9,634 | $9,494 |
|---|
| 7/16 | $10,273 | $10,033 |
|---|
| 8/16 | $10,591 | $10,149 |
|---|
| 9/16 | $10,382 | $10,056 |
|---|
| 10/16 | $10,431 | $10,007 |
|---|
| 11/16 | $9,421 | $9,260 |
|---|
| 12/16 | $9,243 | $9,253 |
|---|
| 1/17 | $9,823 | $9,656 |
|---|
| 2/17 | $10,382 | $10,226 |
|---|
| 3/17 | $11,007 | $10,837 |
|---|
| 4/17 | $11,362 | $11,046 |
|---|
| 5/17 | $11,601 | $11,240 |
|---|
| 6/17 | $11,668 | $11,152 |
|---|
| 7/17 | $12,408 | $12,012 |
|---|
| 8/17 | $12,485 | $11,922 |
|---|
| 9/17 | $12,047 | $11,482 |
|---|
| 10/17 | $12,645 | $12,328 |
|---|
| 11/17 | $12,790 | $12,241 |
|---|
| 12/17 | $13,383 | $12,839 |
|---|
| 1/18 | $13,452 | $13,281 |
|---|
| 2/18 | $12,631 | $12,391 |
|---|
| 3/18 | $12,529 | $11,946 |
|---|
| 4/18 | $12,838 | $12,438 |
|---|
| 5/18 | $12,395 | $11,991 |
|---|
| 6/18 | $12,235 | $11,874 |
|---|
| 7/18 | $12,918 | $12,648 |
|---|
| 8/18 | $12,795 | $12,770 |
|---|
| 9/18 | $11,491 | $11,607 |
|---|
| 10/18 | $10,709 | $10,797 |
|---|
| 11/18 | $11,844 | $11,917 |
|---|
| 12/18 | $11,760 | $11,901 |
|---|
| 1/19 | $11,547 | $11,672 |
|---|
| 2/19 | $11,525 | $11,676 |
|---|
| 3/19 | $12,472 | $12,753 |
|---|
| 4/19 | $12,373 | $12,825 |
|---|
| 5/19 | $12,494 | $12,852 |
|---|
| 6/19 | $12,449 | $12,817 |
|---|
| 7/19 | $11,748 | $12,149 |
|---|
| 8/19 | $11,611 | $11,794 |
|---|
| 9/19 | $12,304 | $12,157 |
|---|
| 10/19 | $12,777 | $12,682 |
|---|
| 11/19 | $12,819 | $12,611 |
|---|
| 12/19 | $12,989 | $12,803 |
|---|
| 1/20 | $13,088 | $12,702 |
|---|
| 2/20 | $12,565 | $11,778 |
|---|
| 3/20 | $9,183 | $8,818 |
|---|
| 4/20 | $10,516 | $10,241 |
|---|
| 5/20 | $10,278 | $9,956 |
|---|
| 6/20 | $10,816 | $10,633 |
|---|
| 7/20 | $11,736 | $11,737 |
|---|
| 8/20 | $12,196 | $12,147 |
|---|
| 9/20 | $12,307 | $12,223 |
|---|
| 10/20 | $12,519 | $12,360 |
|---|
| 11/20 | $13,381 | $13,426 |
|---|
| 12/20 | $14,734 | $14,794 |
|---|
| 1/21 | $14,415 | $14,450 |
|---|
| 2/21 | $14,931 | $15,205 |
|---|
| 3/21 | $15,144 | $15,550 |
|---|
| 4/21 | $14,943 | $15,406 |
|---|
| 5/21 | $15,915 | $16,742 |
|---|
| 6/21 | $16,203 | $16,625 |
|---|
| 7/21 | $16,754 | $16,768 |
|---|
| 8/21 | $18,011 | $18,603 |
|---|
| 9/21 | $18,049 | $18,715 |
|---|
| 10/21 | $18,300 | $18,566 |
|---|
| 11/21 | $17,662 | $18,003 |
|---|
| 12/21 | $18,275 | $18,675 |
|---|
| 1/22 | $17,852 | $18,420 |
|---|
| 2/22 | $16,998 | $17,682 |
|---|
| 3/22 | $17,197 | $18,328 |
|---|
| 4/22 | $16,377 | $18,022 |
|---|
| 5/22 | $15,407 | $16,972 |
|---|
| 6/22 | $14,375 | $15,827 |
|---|
| 7/22 | $15,643 | $17,303 |
|---|
| 8/22 | $15,759 | $18,014 |
|---|
| 9/22 | $15,137 | $16,855 |
|---|
| 10/22 | $15,655 | $17,288 |
|---|
| 11/22 | $16,435 | $18,185 |
|---|
| 12/22 | $15,435 | $17,190 |
|---|
| 1/23 | $15,245 | $16,676 |
|---|
| 2/23 | $14,745 | $15,914 |
|---|
| 3/23 | $14,770 | $16,098 |
|---|
| 4/23 | $15,210 | $16,769 |
|---|
| 5/23 | $15,630 | $17,257 |
|---|
| 6/23 | $16,446 | $18,068 |
|---|
| 7/23 | $16,962 | $18,607 |
|---|
| 8/23 | $16,862 | $18,253 |
|---|
| 9/23 | $16,962 | $18,558 |
|---|
| 10/23 | $16,586 | $18,006 |
|---|
| 11/23 | $17,612 | $19,210 |
|---|
| 12/23 | $18,615 | $20,766 |
|---|
| 1/24 | $19,141 | $21,267 |
|---|
| 2/24 | $19,656 | $21,849 |
|---|
| 3/24 | $19,766 | $22,027 |
|---|
| 4/24 | $20,161 | $22,537 |
|---|
| 5/24 | $20,408 | $22,697 |
|---|
| 6/24 | $21,932 | $24,275 |
|---|
| 7/24 | $22,972 | $25,240 |
|---|
| 8/24 | $23,125 | $25,505 |
|---|
| 9/24 | $23,887 | $26,044 |
|---|
| 10/24 | $22,252 | $23,892 |
|---|
| 11/24 | $22,389 | $23,793 |
|---|
| 12/24 | $21,876 | $23,095 |
|---|
Average Annual Total Returns (%)Footnote Reference1
| Fund | 1 Year | 5 Years | 10 Years |
|---|
| Class A | 17.51% | 10.97% | 8.72% |
|---|
| Class A with 5.25% Maximum Sales Charge | 11.34% | 9.78% | 8.14% |
|---|
| MSCI India Index (net of foreign withholding taxes) | 11.22% | 12.51% | 8.72% |
|---|
| Footnote | Description |
Footnote1 | Performance prior to September 15, 2016 is that of the Fund’s former investment sub-adviser. |
Performance does not reflect the deduction of taxes that a shareholder would pay on Fund distributions or redemption of Fund shares. Performance assumes that all dividends and distributions, if any, were reinvested. For more recent performance information, visit www.eatonvance.com/performance.php.
THE FUND'S PAST PERFORMANCE IS NO GUARANTEE OF FUTURE RESULTS.
| Total Net Assets | $300,905,703 |
|---|
| # of Portfolio Holdings (for Greater India Portfolio) | 64 |
|---|
| Portfolio Turnover Rate (for Greater India Portfolio) | 22% |
|---|
| Total Advisory Fees Paid | $2,379,377 |
|---|
What did the Fund invest in?
The following tables reflect what the Fund invested in as of the report date.
References to the Fund's investments are to the Fund's pro rata share of the investments of Greater India Portfolio, an affiliated investment company in which the Fund invests substantially all of its assets.
Sector Allocation (% of total investments)
| Value | Value |
|---|
| Real Estate | 1.8% |
| Short-Term Investments | 2.1% |
| Energy | 2.4% |
| Utilities | 3.3% |
| Industrials | 4.1% |
| Consumer Staples | 4.5% |
| Communication Services | 5.9% |
| Materials | 6.4% |
| Health Care | 8.1% |
| Information Technology | 12.8% |
| Consumer Discretionary | 21.9% |
| Financials | 26.7% |
Top Ten Holdings (% of total investments)Footnote Referencea
| ICICI Bank Ltd. | 8.3% |
| Infosys Ltd. | 6.5% |
| Bharti Airtel Ltd. | 4.5% |
| Mahindra & Mahindra Ltd. | 4.1% |
| Sun Pharmaceutical Industries Ltd. | 3.7% |
| Zomato Ltd. | 3.5% |
| Bajaj Finance Ltd. | 3.4% |
| Axis Bank Ltd. | 3.3% |
| Trent Ltd. | 2.8% |
| Dixon Technologies India Ltd. | 2.6% |
| Total | 42.7% |
| Footnote | Description |
Footnotea | Excluding cash equivalents |
If you wish to view additional information about the Fund, including the prospectus, statement of additional information, financial statements and holdings, please scan the QR code or visit www.eatonvance.com/open-end-mutual-fund-documents.php. For proxy information, please visit www.eatonvance.com/proxyvoting.
The Funds may deliver a single copy of certain required shareholder documents (including prospectuses, shareholder reports, and proxy materials) to investors with the same last name and the same address. Your participation will continue indefinitely unless you instruct otherwise by calling 1-800-262-1122 or by contacting your financial intermediary. Your instruction will typically be effective within 30 days of receipt.
Not FDIC Insured | May Lose Value | No Bank Guarantee
Annual Shareholder Report December 31, 2024
Eaton Vance Greater India Fund
Annual Shareholder Report December 31, 2024
This annual shareholder report contains important information about the Eaton Vance Greater India Fund for the period of January 1, 2024 to December 31, 2024. You can find additional information about the Fund at www.eatonvance.com/open-end-mutual-fund-documents.php. You can also request this information by contacting us at 1-800-262-1122.
What were the Fund costs for the last year?Footnote Reference*
(based on a hypothetical $10,000 investment)
| Class Name | Costs of a $10,000 investment | Costs paid as a percentage of a $10,000 investment |
|---|
| Class C | $242 | 2.23% |
|---|
| Footnote | Description |
Footnote* | Expenses in the table reflect the expenses of both the Fund and Greater India Portfolio, the Portfolio in which it invests. |
How did the Fund perform last year and what affected its performance?
Key contributors to (↑) and detractors from (↓) performance, relative to the MSCI India Index (the Index):
↑ Among sectors within the Index, the Fund’s exposures to the consumer discretionary and energy markets were the largest contributors to Index-relative returns
↑ An underweight position in Reliance Industries Ltd. ― whose petrochemical business struggled from weak global demand ― was the top contributor to returns
↑ An overweight position in Dixon Technologies India Ltd. ― maker of lights, mobile phones, and consumer appliances ― helped returns amid a surge in net profits
↓ In contrast, the Fund’s exposures to the industrials and financials sectors were the largest detractors from Index-relative performance during the period
↓ Among stocks, an overweight position in Tata Consumer Products Ltd. ― maker and exporter of tea, salt, oil, and spices ― was the largest detractor from returns
↓ In the financials sector, the Fund’s underweight position in IIFL Finance Ltd. detracted from Index-relative returns during the period ― and was sold from the Fund after the Reserve Bank of India directed the integrated financial services firm to cease disbursal of gold loans, citing business inconsistencies
Comparison of the change in value of a $10,000 investment for the period indicated.
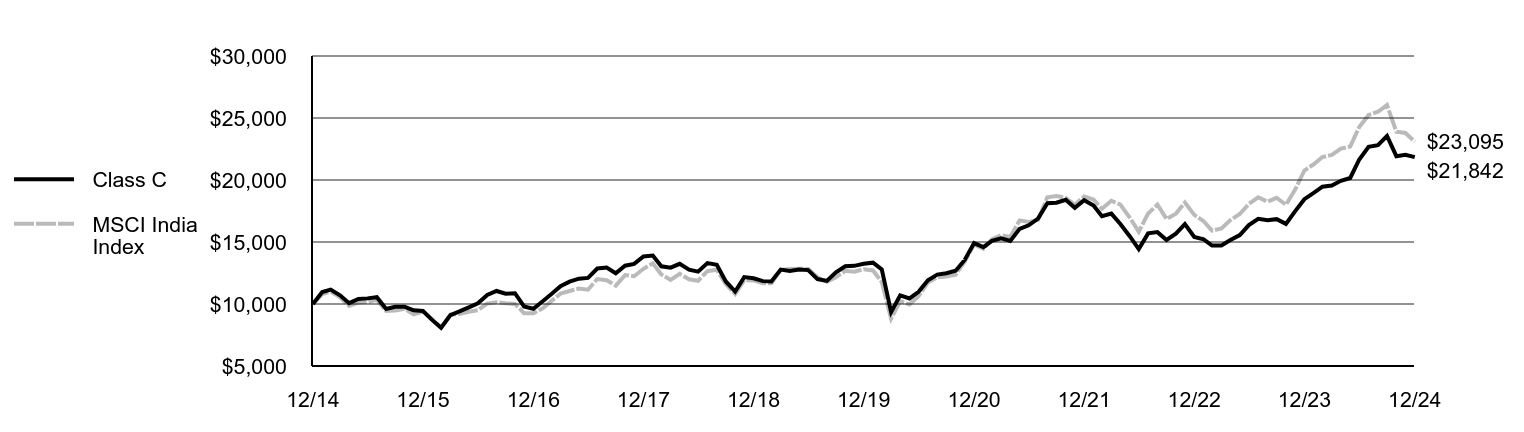
| Class C | MSCI India Index |
|---|
| 12/14 | $10,000 | $10,000 |
|---|
| 1/15 | $10,966 | $10,794 |
|---|
| 2/15 | $11,161 | $10,995 |
|---|
| 3/15 | $10,700 | $10,540 |
|---|
| 4/15 | $10,066 | $9,850 |
|---|
| 5/15 | $10,403 | $10,129 |
|---|
| 6/15 | $10,453 | $10,159 |
|---|
| 7/15 | $10,553 | $10,339 |
|---|
| 8/15 | $9,596 | $9,431 |
|---|
| 9/15 | $9,772 | $9,474 |
|---|
| 10/15 | $9,772 | $9,623 |
|---|
| 11/15 | $9,487 | $9,163 |
|---|
| 12/15 | $9,437 | $9,388 |
|---|
| 1/16 | $8,698 | $8,742 |
|---|
| 2/16 | $8,083 | $8,095 |
|---|
| 3/16 | $9,111 | $9,153 |
|---|
| 4/16 | $9,400 | $9,197 |
|---|
| 5/16 | $9,734 | $9,370 |
|---|
| 6/16 | $10,064 | $9,494 |
|---|
| 7/16 | $10,729 | $10,033 |
|---|
| 8/16 | $11,051 | $10,149 |
|---|
| 9/16 | $10,825 | $10,056 |
|---|
| 10/16 | $10,871 | $10,007 |
|---|
| 11/16 | $9,809 | $9,260 |
|---|
| 12/16 | $9,621 | $9,253 |
|---|
| 1/17 | $10,223 | $9,656 |
|---|
| 2/17 | $10,791 | $10,226 |
|---|
| 3/17 | $11,439 | $10,837 |
|---|
| 4/17 | $11,799 | $11,046 |
|---|
| 5/17 | $12,041 | $11,240 |
|---|
| 6/17 | $12,104 | $11,152 |
|---|
| 7/17 | $12,862 | $12,012 |
|---|
| 8/17 | $12,937 | $11,922 |
|---|
| 9/17 | $12,475 | $11,482 |
|---|
| 10/17 | $13,089 | $12,328 |
|---|
| 11/17 | $13,232 | $12,241 |
|---|
| 12/17 | $13,836 | $12,839 |
|---|
| 1/18 | $13,901 | $13,281 |
|---|
| 2/18 | $13,042 | $12,391 |
|---|
| 3/18 | $12,930 | $11,946 |
|---|
| 4/18 | $13,241 | $12,438 |
|---|
| 5/18 | $12,774 | $11,991 |
|---|
| 6/18 | $12,606 | $11,874 |
|---|
| 7/18 | $13,301 | $12,648 |
|---|
| 8/18 | $13,164 | $12,770 |
|---|
| 9/18 | $11,818 | $11,607 |
|---|
| 10/18 | $11,005 | $10,797 |
|---|
| 11/18 | $12,167 | $11,917 |
|---|
| 12/18 | $12,071 | $11,901 |
|---|
| 1/19 | $11,844 | $11,672 |
|---|
| 2/19 | $11,818 | $11,676 |
|---|
| 3/19 | $12,779 | $12,753 |
|---|
| 4/19 | $12,670 | $12,825 |
|---|
| 5/19 | $12,788 | $12,852 |
|---|
| 6/19 | $12,735 | $12,817 |
|---|
| 7/19 | $12,010 | $12,149 |
|---|
| 8/19 | $11,863 | $11,794 |
|---|
| 9/19 | $12,561 | $12,157 |
|---|
| 10/19 | $13,037 | $12,682 |
|---|
| 11/19 | $13,077 | $12,611 |
|---|
| 12/19 | $13,240 | $12,803 |
|---|
| 1/20 | $13,335 | $12,702 |
|---|
| 2/20 | $12,792 | $11,778 |
|---|
| 3/20 | $9,345 | $8,818 |
|---|
| 4/20 | $10,694 | $10,241 |
|---|
| 5/20 | $10,445 | $9,956 |
|---|
| 6/20 | $10,984 | $10,633 |
|---|
| 7/20 | $11,913 | $11,737 |
|---|
| 8/20 | $12,373 | $12,147 |
|---|
| 9/20 | $12,478 | $12,223 |
|---|
| 10/20 | $12,687 | $12,360 |
|---|
| 11/20 | $13,551 | $13,426 |
|---|
| 12/20 | $14,914 | $14,794 |
|---|
| 1/21 | $14,583 | $14,450 |
|---|
| 2/21 | $15,096 | $15,205 |
|---|
| 3/21 | $15,305 | $15,550 |
|---|
| 4/21 | $15,092 | $15,406 |
|---|
| 5/21 | $16,064 | $16,742 |
|---|
| 6/21 | $16,346 | $16,625 |
|---|
| 7/21 | $16,887 | $16,768 |
|---|
| 8/21 | $18,133 | $18,603 |
|---|
| 9/21 | $18,165 | $18,715 |
|---|
| 10/21 | $18,401 | $18,566 |
|---|
| 11/21 | $17,756 | $18,003 |
|---|
| 12/21 | $18,370 | $18,675 |
|---|
| 1/22 | $17,941 | $18,420 |
|---|
| 2/22 | $17,083 | $17,682 |
|---|
| 3/22 | $17,290 | $18,328 |
|---|
| 4/22 | $16,457 | $18,022 |
|---|
| 5/22 | $15,467 | $16,972 |
|---|
| 6/22 | $14,428 | $15,827 |
|---|
| 7/22 | $15,695 | $17,303 |
|---|
| 8/22 | $15,796 | $18,014 |
|---|
| 9/22 | $15,159 | $16,855 |
|---|
| 10/22 | $15,669 | $17,288 |
|---|
| 11/22 | $16,442 | $18,185 |
|---|
| 12/22 | $15,413 | $17,190 |
|---|
| 1/23 | $15,210 | $16,676 |
|---|
| 2/23 | $14,709 | $15,914 |
|---|
| 3/23 | $14,722 | $16,098 |
|---|
| 4/23 | $15,153 | $16,769 |
|---|
| 5/23 | $15,559 | $17,257 |
|---|
| 6/23 | $16,359 | $18,068 |
|---|
| 7/23 | $16,866 | $18,607 |
|---|
| 8/23 | $16,752 | $18,253 |
|---|
| 9/23 | $16,841 | $18,558 |
|---|
| 10/23 | $16,460 | $18,006 |
|---|
| 11/23 | $17,469 | $19,210 |
|---|
| 12/23 | $18,454 | $20,766 |
|---|
| 1/24 | $18,961 | $21,267 |
|---|
| 2/24 | $19,460 | $21,849 |
|---|
| 3/24 | $19,555 | $22,027 |
|---|
| 4/24 | $19,933 | $22,537 |
|---|
| 5/24 | $20,163 | $22,697 |
|---|
| 6/24 | $21,656 | $24,275 |
|---|
| 7/24 | $22,669 | $25,240 |
|---|
| 8/24 | $22,811 | $25,505 |
|---|
| 9/24 | $23,547 | $26,044 |
|---|
| 10/24 | $21,919 | $23,892 |
|---|
| 11/24 | $22,041 | $23,793 |
|---|
| 12/24 | $21,842 | $23,095 |
|---|
Average Annual Total Returns (%)Footnote Reference1
| Fund | 1 Year | 5 Years | 10 Years |
|---|
| Class C, with conversion to Class A after 8 years | 16.62% | 10.19% | 8.12% |
|---|
| Class C, with 1% Maximum Deferred Sales Charge and conversion to Class A after 8 years | 15.62% | 10.19% | 8.12% |
|---|
| MSCI India Index (net of foreign withholding taxes) | 11.22% | 12.51% | 8.72% |
|---|
| Footnote | Description |
Footnote1 | Performance prior to September 15, 2016 is that of the Fund’s former investment sub-adviser. |
Performance does not reflect the deduction of taxes that a shareholder would pay on Fund distributions or redemption of Fund shares. Performance assumes that all dividends and distributions, if any, were reinvested. For more recent performance information, visit www.eatonvance.com/performance.php.
THE FUND'S PAST PERFORMANCE IS NO GUARANTEE OF FUTURE RESULTS.
| Total Net Assets | $300,905,703 |
|---|
| # of Portfolio Holdings (for Greater India Portfolio) | 64 |
|---|
| Portfolio Turnover Rate (for Greater India Portfolio) | 22% |
|---|
| Total Advisory Fees Paid | $2,379,377 |
|---|
What did the Fund invest in?
The following tables reflect what the Fund invested in as of the report date.
References to the Fund's investments are to the Fund's pro rata share of the investments of Greater India Portfolio, an affiliated investment company in which the Fund invests substantially all of its assets.
Sector Allocation (% of total investments)
| Value | Value |
|---|
| Real Estate | 1.8% |
| Short-Term Investments | 2.1% |
| Energy | 2.4% |
| Utilities | 3.3% |
| Industrials | 4.1% |
| Consumer Staples | 4.5% |
| Communication Services | 5.9% |
| Materials | 6.4% |
| Health Care | 8.1% |
| Information Technology | 12.8% |
| Consumer Discretionary | 21.9% |
| Financials | 26.7% |
Top Ten Holdings (% of total investments)Footnote Referencea
| ICICI Bank Ltd. | 8.3% |
| Infosys Ltd. | 6.5% |
| Bharti Airtel Ltd. | 4.5% |
| Mahindra & Mahindra Ltd. | 4.1% |
| Sun Pharmaceutical Industries Ltd. | 3.7% |
| Zomato Ltd. | 3.5% |
| Bajaj Finance Ltd. | 3.4% |
| Axis Bank Ltd. | 3.3% |
| Trent Ltd. | 2.8% |
| Dixon Technologies India Ltd. | 2.6% |
| Total | 42.7% |
| Footnote | Description |
Footnotea | Excluding cash equivalents |
If you wish to view additional information about the Fund, including the prospectus, statement of additional information, financial statements and holdings, please scan the QR code or visit www.eatonvance.com/open-end-mutual-fund-documents.php. For proxy information, please visit www.eatonvance.com/proxyvoting.
The Funds may deliver a single copy of certain required shareholder documents (including prospectuses, shareholder reports, and proxy materials) to investors with the same last name and the same address. Your participation will continue indefinitely unless you instruct otherwise by calling 1-800-262-1122 or by contacting your financial intermediary. Your instruction will typically be effective within 30 days of receipt.
Not FDIC Insured | May Lose Value | No Bank Guarantee
Annual Shareholder Report December 31, 2024
Eaton Vance Greater India Fund
Annual Shareholder Report December 31, 2024
This annual shareholder report contains important information about the Eaton Vance Greater India Fund for the period of January 1, 2024 to December 31, 2024. You can find additional information about the Fund at www.eatonvance.com/open-end-mutual-fund-documents.php. You can also request this information by contacting us at 1-800-262-1122.
What were the Fund costs for the last year?Footnote Reference*
(based on a hypothetical $10,000 investment)
| Class Name | Costs of a $10,000 investment | Costs paid as a percentage of a $10,000 investment |
|---|
| Class I | $134 | 1.23% |
|---|
| Footnote | Description |
Footnote* | Expenses in the table reflect the expenses of both the Fund and Greater India Portfolio, the Portfolio in which it invests. |
How did the Fund perform last year and what affected its performance?
Key contributors to (↑) and detractors from (↓) performance, relative to the MSCI India Index (the Index):
↑ Among sectors within the Index, the Fund’s exposures to the consumer discretionary and energy markets were the largest contributors to Index-relative returns
↑ An underweight position in Reliance Industries Ltd. ― whose petrochemical business struggled from weak global demand ― was the top contributor to returns
↑ An overweight position in Dixon Technologies India Ltd. ― maker of lights, mobile phones, and consumer appliances ― helped returns amid a surge in net profits
↓ In contrast, the Fund’s exposures to the industrials and financials sectors were the largest detractors from Index-relative performance during the period
↓ Among stocks, an overweight position in Tata Consumer Products Ltd. ― maker and exporter of tea, salt, oil, and spices ― was the largest detractor from returns
↓ In the financials sector, the Fund’s underweight position in IIFL Finance Ltd. detracted from Index-relative returns during the period ― and was sold from the Fund after the Reserve Bank of India directed the integrated financial services firm to cease disbursal of gold loans, citing business inconsistencies
Comparison of the change in value of a $1,000,000 investment for the period indicated.
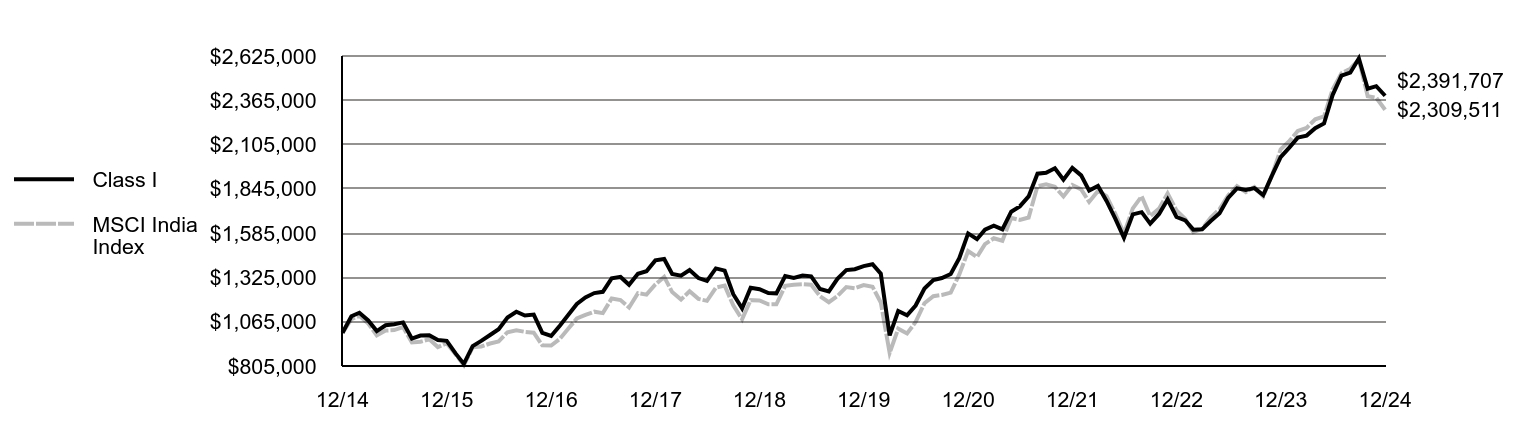
| Class I | MSCI India Index |
|---|
| 12/14 | $1,000,000 | $1,000,000 |
|---|
| 1/15 | $1,097,402 | $1,079,426 |
|---|
| 2/15 | $1,117,600 | $1,099,485 |
|---|
| 3/15 | $1,072,149 | $1,053,959 |
|---|
| 4/15 | $1,009,728 | $985,033 |
|---|
| 5/15 | $1,044,154 | $1,012,904 |
|---|
| 6/15 | $1,049,975 | $1,015,881 |
|---|
| 7/15 | $1,060,872 | $1,033,920 |
|---|
| 8/15 | $965,697 | $943,116 |
|---|
| 9/15 | $983,855 | $947,411 |
|---|
| 10/15 | $984,955 | $962,290 |
|---|
| 11/15 | $957,349 | $916,334 |
|---|
| 12/15 | $952,998 | $938,760 |
|---|
| 1/16 | $878,873 | $874,158 |
|---|
| 2/16 | $817,464 | $809,460 |
|---|
| 3/16 | $922,091 | $915,329 |
|---|
| 4/16 | $952,243 | $919,684 |
|---|
| 5/16 | $987,111 | $936,970 |
|---|
| 6/16 | $1,021,254 | $949,405 |
|---|
| 7/16 | $1,089,570 | $1,003,289 |
|---|
| 8/16 | $1,123,343 | $1,014,914 |
|---|
| 9/16 | $1,101,561 | $1,005,622 |
|---|
| 10/16 | $1,106,663 | $1,000,654 |
|---|
| 11/16 | $999,850 | $926,036 |
|---|
| 12/16 | $981,294 | $925,312 |
|---|
| 1/17 | $1,043,237 | $965,575 |
|---|
| 2/17 | $1,102,619 | $1,022,593 |
|---|
| 3/17 | $1,169,344 | $1,083,728 |
|---|
| 4/17 | $1,207,468 | $1,104,640 |
|---|
| 5/17 | $1,233,119 | $1,124,041 |
|---|
| 6/17 | $1,240,470 | $1,115,243 |
|---|
| 7/17 | $1,319,520 | $1,201,164 |
|---|
| 8/17 | $1,327,999 | $1,192,153 |
|---|
| 9/17 | $1,281,574 | $1,148,173 |
|---|
| 10/17 | $1,346,057 | $1,232,816 |
|---|
| 11/17 | $1,361,524 | $1,224,130 |
|---|
| 12/17 | $1,425,050 | $1,283,920 |
|---|
| 1/18 | $1,433,002 | $1,328,121 |
|---|
| 2/18 | $1,345,641 | $1,239,077 |
|---|
| 3/18 | $1,335,022 | $1,194,646 |
|---|
| 4/18 | $1,368,469 | $1,243,811 |
|---|
| 5/18 | $1,321,389 | $1,199,108 |
|---|
| 6/18 | $1,304,682 | $1,187,438 |
|---|
| 7/18 | $1,377,984 | $1,264,784 |
|---|
| 8/18 | $1,365,113 | $1,276,978 |
|---|
| 9/18 | $1,226,586 | $1,160,725 |
|---|
| 10/18 | $1,143,300 | $1,079,738 |
|---|
| 11/18 | $1,264,565 | $1,191,703 |
|---|
| 12/18 | $1,256,121 | $1,190,130 |
|---|
| 1/19 | $1,233,094 | $1,167,201 |
|---|
| 2/19 | $1,231,576 | $1,167,568 |
|---|
| 3/19 | $1,332,881 | $1,275,324 |
|---|
| 4/19 | $1,322,540 | $1,282,473 |
|---|
| 5/19 | $1,335,965 | $1,285,249 |
|---|
| 6/19 | $1,331,342 | $1,281,724 |
|---|
| 7/19 | $1,256,899 | $1,214,892 |
|---|
| 8/19 | $1,242,490 | $1,179,371 |
|---|
| 9/19 | $1,316,840 | $1,215,654 |
|---|
| 10/19 | $1,367,851 | $1,268,233 |
|---|
| 11/19 | $1,372,988 | $1,261,111 |
|---|
| 12/19 | $1,391,581 | $1,280,283 |
|---|
| 1/20 | $1,402,646 | $1,270,172 |
|---|
| 2/20 | $1,346,895 | $1,177,801 |
|---|
| 3/20 | $984,667 | $881,776 |
|---|
| 4/20 | $1,127,829 | $1,024,109 |
|---|
| 5/20 | $1,102,517 | $995,628 |
|---|
| 6/20 | $1,160,252 | $1,063,281 |
|---|
| 7/20 | $1,259,504 | $1,173,676 |
|---|
| 8/20 | $1,309,194 | $1,214,700 |
|---|
| 9/20 | $1,321,495 | $1,222,262 |
|---|
| 10/20 | $1,344,895 | $1,235,999 |
|---|
| 11/20 | $1,437,710 | $1,342,593 |
|---|
| 12/20 | $1,583,253 | $1,479,427 |
|---|
| 1/21 | $1,549,536 | $1,444,959 |
|---|
| 2/21 | $1,605,055 | $1,520,519 |
|---|
| 3/21 | $1,628,477 | $1,555,021 |
|---|
| 4/21 | $1,607,483 | $1,540,622 |
|---|
| 5/21 | $1,710,994 | $1,674,201 |
|---|
| 6/21 | $1,741,904 | $1,662,523 |
|---|
| 7/21 | $1,800,628 | $1,676,839 |
|---|
| 8/21 | $1,933,890 | $1,860,310 |
|---|
| 9/21 | $1,939,046 | $1,871,538 |
|---|
| 10/21 | $1,965,620 | $1,856,642 |
|---|
| 11/21 | $1,899,385 | $1,800,287 |
|---|
| 12/21 | $1,968,145 | $1,867,516 |
|---|
| 1/22 | $1,924,121 | $1,841,988 |
|---|
| 2/22 | $1,834,777 | $1,768,232 |
|---|
| 3/22 | $1,862,401 | $1,832,824 |
|---|
| 4/22 | $1,773,920 | $1,802,183 |
|---|
| 5/22 | $1,669,039 | $1,697,218 |
|---|
| 6/22 | $1,557,683 | $1,582,725 |
|---|
| 7/22 | $1,695,367 | $1,730,276 |
|---|
| 8/22 | $1,708,315 | $1,801,367 |
|---|
| 9/22 | $1,640,984 | $1,685,540 |
|---|
| 10/22 | $1,697,525 | $1,728,772 |
|---|
| 11/22 | $1,782,553 | $1,818,547 |
|---|
| 12/22 | $1,679,642 | $1,718,978 |
|---|
| 1/23 | $1,659,411 | $1,667,556 |
|---|
| 2/23 | $1,605,464 | $1,591,364 |
|---|
| 3/23 | $1,608,057 | $1,609,812 |
|---|
| 4/23 | $1,656,299 | $1,676,882 |
|---|
| 5/23 | $1,702,466 | $1,725,710 |
|---|
| 6/23 | $1,791,687 | $1,806,751 |
|---|
| 7/23 | $1,848,229 | $1,860,727 |
|---|
| 8/23 | $1,837,854 | $1,825,289 |
|---|
| 9/23 | $1,849,266 | $1,855,849 |
|---|
| 10/23 | $1,808,286 | $1,800,643 |
|---|
| 11/23 | $1,920,850 | $1,920,962 |
|---|
| 12/23 | $2,031,063 | $2,076,616 |
|---|
| 1/24 | $2,088,659 | $2,126,686 |
|---|
| 2/24 | $2,145,711 | $2,184,949 |
|---|
| 3/24 | $2,157,665 | $2,202,660 |
|---|
| 4/24 | $2,201,133 | $2,253,696 |
|---|
| 5/24 | $2,228,845 | $2,269,683 |
|---|
| 6/24 | $2,395,655 | $2,427,487 |
|---|
| 7/24 | $2,509,759 | $2,523,969 |
|---|
| 8/24 | $2,527,147 | $2,550,512 |
|---|
| 9/24 | $2,610,824 | $2,604,379 |
|---|
| 10/24 | $2,432,603 | $2,389,194 |
|---|
| 11/24 | $2,447,817 | $2,379,262 |
|---|
| 12/24 | $2,391,707 | $2,309,511 |
|---|
Average Annual Total Returns (%)Footnote Reference1
| Fund | 1 Year | 5 Years | 10 Years |
|---|
| Class I | 17.77% | 11.43% | 9.10% |
|---|
| MSCI India Index (net of foreign withholding taxes) | 11.22% | 12.51% | 8.72% |
|---|
| Footnote | Description |
Footnote1 | Performance prior to September 15, 2016 is that of the Fund’s former investment sub-adviser. |
Performance does not reflect the deduction of taxes that a shareholder would pay on Fund distributions or redemption of Fund shares. Performance assumes that all dividends and distributions, if any, were reinvested. For more recent performance information, visit www.eatonvance.com/performance.php.
THE FUND'S PAST PERFORMANCE IS NO GUARANTEE OF FUTURE RESULTS.
| Total Net Assets | $300,905,703 |
|---|
| # of Portfolio Holdings (for Greater India Portfolio) | 64 |
|---|
| Portfolio Turnover Rate (for Greater India Portfolio) | 22% |
|---|
| Total Advisory Fees Paid | $2,379,377 |
|---|
What did the Fund invest in?
The following tables reflect what the Fund invested in as of the report date.
References to the Fund's investments are to the Fund's pro rata share of the investments of Greater India Portfolio, an affiliated investment company in which the Fund invests substantially all of its assets.
Sector Allocation (% of total investments)
| Value | Value |
|---|
| Real Estate | 1.8% |
| Short-Term Investments | 2.1% |
| Energy | 2.4% |
| Utilities | 3.3% |
| Industrials | 4.1% |
| Consumer Staples | 4.5% |
| Communication Services | 5.9% |
| Materials | 6.4% |
| Health Care | 8.1% |
| Information Technology | 12.8% |
| Consumer Discretionary | 21.9% |
| Financials | 26.7% |
Top Ten Holdings (% of total investments)Footnote Referencea
| ICICI Bank Ltd. | 8.3% |
| Infosys Ltd. | 6.5% |
| Bharti Airtel Ltd. | 4.5% |
| Mahindra & Mahindra Ltd. | 4.1% |
| Sun Pharmaceutical Industries Ltd. | 3.7% |
| Zomato Ltd. | 3.5% |
| Bajaj Finance Ltd. | 3.4% |
| Axis Bank Ltd. | 3.3% |
| Trent Ltd. | 2.8% |
| Dixon Technologies India Ltd. | 2.6% |
| Total | 42.7% |
| Footnote | Description |
Footnotea | Excluding cash equivalents |
If you wish to view additional information about the Fund, including the prospectus, statement of additional information, financial statements and holdings, please scan the QR code or visit www.eatonvance.com/open-end-mutual-fund-documents.php. For proxy information, please visit www.eatonvance.com/proxyvoting.
The Funds may deliver a single copy of certain required shareholder documents (including prospectuses, shareholder reports, and proxy materials) to investors with the same last name and the same address. Your participation will continue indefinitely unless you instruct otherwise by calling 1-800-262-1122 or by contacting your financial intermediary. Your instruction will typically be effective within 30 days of receipt.
Not FDIC Insured | May Lose Value | No Bank Guarantee
Annual Shareholder Report December 31, 2024
Annual Shareholder Report December 31, 2024
This annual shareholder report contains important information about the Eaton Vance Growth Fund for the period of January 1, 2024 to December 31, 2024. You can find additional information about the Fund at www.eatonvance.com/open-end-mutual-fund-documents.php. You can also request this information by contacting us at 1-800-262-1122.
What were the Fund costs for the last year?
(based on a hypothetical $10,000 investment)
| Class Name | Costs of a $10,000 investment | Costs paid as a percentage of a $10,000 investment |
|---|
| Class A | $121 | 1.04% |
|---|
How did the Fund perform last year and what affected its performance?
Key contributors to (↑) and detractors from (↓) performance, relative to the Russell 1000® Growth Index (the Index):
↓ An overweight position in marketing and publishing software firm Adobe Inc. lost value over concerns about competition from artificial intelligence (AI) products
↓ An overweight position in tax and accounting software maker Intuit Inc. underperformed the Index as investors questioned its ability to compete for AI business
↓ An underweight position in electric car maker Tesla Inc. hurt returns as its stock price rose over optimism about the potential launch of an autonomous vehicle
↓ Among sectors, stock selections and an underweight exposure to consumer discretionary, and stock selections and an overweight in real estate hurt returns
↑ An overweight position in NVIDIA Corp., a major microchip supplier for AI applications, contributed to relative returns as its stock price more than doubled
↑ Owning mobile chipmaker Qualcomm Inc. early in the period as its stock price rose ― and selling the stock in June 2024 before its price dropped ― helped returns
↑ An underweight position in Microsoft Corp. helped returns as its stock underperformed the Index over concerns about the costs needed to pursue AI opportunities
↑ Among sectors, stock selections in consumer staples and industrials, and an underweight exposure to health care contributed to Index-relative returns
Comparison of the change in value of a $10,000 investment for the period indicated.
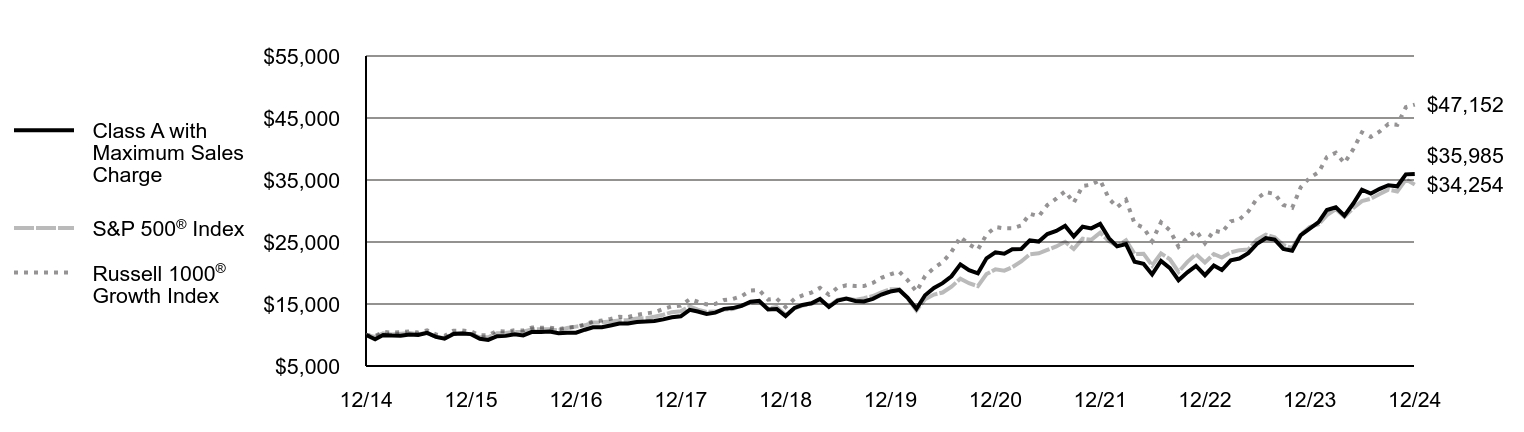
| Class A with Maximum Sales Charge | S&P 500® Index | Russell 1000® Growth Index |
|---|
| 12/14 | $10,000 | $10,000 | $10,000 |
|---|
| 1/15 | $9,304 | $9,700 | $9,847 |
|---|
| 2/15 | $9,987 | $10,257 | $10,503 |
|---|
| 3/15 | $9,912 | $10,095 | $10,384 |
|---|
| 4/15 | $9,877 | $10,192 | $10,436 |
|---|
| 5/15 | $10,087 | $10,323 | $10,583 |
|---|
| 6/15 | $9,992 | $10,123 | $10,396 |
|---|
| 7/15 | $10,338 | $10,335 | $10,749 |
|---|
| 8/15 | $9,692 | $9,712 | $10,096 |
|---|
| 9/15 | $9,396 | $9,471 | $9,846 |
|---|
| 10/15 | $10,150 | $10,270 | $10,694 |
|---|
| 11/15 | $10,257 | $10,301 | $10,724 |
|---|
| 12/15 | $10,142 | $10,138 | $10,567 |
|---|
| 1/16 | $9,398 | $9,635 | $9,977 |
|---|
| 2/16 | $9,207 | $9,622 | $9,973 |
|---|
| 3/16 | $9,800 | $10,275 | $10,645 |
|---|
| 4/16 | $9,859 | $10,315 | $10,548 |
|---|
| 5/16 | $10,128 | $10,500 | $10,753 |
|---|
| 6/16 | $9,931 | $10,527 | $10,711 |
|---|
| 7/16 | $10,508 | $10,915 | $11,216 |
|---|
| 8/16 | $10,498 | $10,931 | $11,160 |
|---|
| 9/16 | $10,545 | $10,933 | $11,201 |
|---|
| 10/16 | $10,275 | $10,733 | $10,938 |
|---|
| 11/16 | $10,378 | $11,131 | $11,176 |
|---|
| 12/16 | $10,378 | $11,351 | $11,314 |
|---|
| 1/17 | $10,852 | $11,566 | $11,696 |
|---|
| 2/17 | $11,243 | $12,025 | $12,182 |
|---|
| 3/17 | $11,248 | $12,039 | $12,322 |
|---|
| 4/17 | $11,541 | $12,163 | $12,604 |
|---|
| 5/17 | $11,839 | $12,334 | $12,932 |
|---|
| 6/17 | $11,848 | $12,411 | $12,898 |
|---|
| 7/17 | $12,085 | $12,667 | $13,241 |
|---|
| 8/17 | $12,178 | $12,705 | $13,483 |
|---|
| 9/17 | $12,267 | $12,967 | $13,659 |
|---|
| 10/17 | $12,518 | $13,270 | $14,188 |
|---|
| 11/17 | $12,863 | $13,677 | $14,619 |
|---|
| 12/17 | $13,015 | $13,829 | $14,733 |
|---|
| 1/18 | $14,056 | $14,621 | $15,776 |
|---|
| 2/18 | $13,787 | $14,082 | $15,363 |
|---|
| 3/18 | $13,391 | $13,724 | $14,941 |
|---|
| 4/18 | $13,601 | $13,777 | $14,994 |
|---|
| 5/18 | $14,217 | $14,108 | $15,651 |
|---|
| 6/18 | $14,339 | $14,195 | $15,801 |
|---|
| 7/18 | $14,695 | $14,724 | $16,265 |
|---|
| 8/18 | $15,359 | $15,203 | $17,155 |
|---|
| 9/18 | $15,506 | $15,290 | $17,251 |
|---|
| 10/18 | $14,119 | $14,245 | $15,708 |
|---|
| 11/18 | $14,188 | $14,535 | $15,875 |
|---|
| 12/18 | $13,051 | $13,223 | $14,510 |
|---|
| 1/19 | $14,356 | $14,282 | $15,814 |
|---|
| 2/19 | $14,848 | $14,741 | $16,380 |
|---|
| 3/19 | $15,118 | $15,027 | $16,846 |
|---|
| 4/19 | $15,809 | $15,636 | $17,607 |
|---|
| 5/19 | $14,516 | $14,642 | $16,495 |
|---|
| 6/19 | $15,539 | $15,674 | $17,628 |
|---|
| 7/19 | $15,887 | $15,899 | $18,026 |
|---|
| 8/19 | $15,489 | $15,648 | $17,888 |
|---|
| 9/19 | $15,406 | $15,940 | $17,890 |
|---|
| 10/19 | $15,832 | $16,286 | $18,394 |
|---|
| 11/19 | $16,523 | $16,877 | $19,210 |
|---|
| 12/19 | $17,016 | $17,386 | $19,790 |
|---|
| 1/20 | $17,264 | $17,379 | $20,232 |
|---|
| 2/20 | $16,018 | $15,949 | $18,854 |
|---|
| 3/20 | $14,227 | $13,979 | $17,000 |
|---|
| 4/20 | $16,405 | $15,771 | $19,515 |
|---|
| 5/20 | $17,578 | $16,522 | $20,825 |
|---|
| 6/20 | $18,365 | $16,850 | $21,732 |
|---|
| 7/20 | $19,472 | $17,801 | $23,404 |
|---|
| 8/20 | $21,387 | $19,080 | $25,819 |
|---|
| 9/20 | $20,453 | $18,355 | $24,604 |
|---|
| 10/20 | $19,950 | $17,867 | $23,769 |
|---|
| 11/20 | $22,364 | $19,823 | $26,203 |
|---|
| 12/20 | $23,338 | $20,585 | $27,408 |
|---|
| 1/21 | $23,105 | $20,377 | $27,205 |
|---|
| 2/21 | $23,826 | $20,939 | $27,199 |
|---|
| 3/21 | $23,878 | $21,856 | $27,666 |
|---|
| 4/21 | $25,255 | $23,022 | $29,548 |
|---|
| 5/21 | $25,073 | $23,183 | $29,140 |
|---|
| 6/21 | $26,281 | $23,724 | $30,968 |
|---|
| 7/21 | $26,775 | $24,288 | $31,988 |
|---|
| 8/21 | $27,600 | $25,026 | $33,184 |
|---|
| 9/21 | $25,898 | $23,863 | $31,326 |
|---|
| 10/21 | $27,470 | $25,534 | $34,039 |
|---|
| 11/21 | $27,197 | $25,357 | $34,247 |
|---|
| 12/21 | $27,917 | $26,494 | $34,971 |
|---|
| 1/22 | $25,597 | $25,123 | $31,970 |
|---|
| 2/22 | $24,293 | $24,371 | $30,612 |
|---|
| 3/22 | $24,653 | $25,276 | $31,809 |
|---|
| 4/22 | $21,804 | $23,071 | $27,968 |
|---|
| 5/22 | $21,493 | $23,114 | $27,318 |
|---|
| 6/22 | $19,766 | $21,206 | $25,154 |
|---|
| 7/22 | $21,952 | $23,161 | $28,173 |
|---|
| 8/22 | $20,788 | $22,217 | $26,861 |
|---|
| 9/22 | $18,835 | $20,170 | $24,249 |
|---|
| 10/22 | $20,111 | $21,804 | $25,667 |
|---|
| 11/22 | $21,148 | $23,022 | $26,836 |
|---|
| 12/22 | $19,644 | $21,696 | $24,782 |
|---|
| 1/23 | $21,200 | $23,059 | $26,847 |
|---|
| 2/23 | $20,470 | $22,496 | $26,528 |
|---|
| 3/23 | $22,033 | $23,322 | $28,342 |
|---|
| 4/23 | $22,338 | $23,686 | $28,621 |
|---|
| 5/23 | $23,209 | $23,789 | $29,926 |
|---|
| 6/23 | $24,689 | $25,361 | $31,972 |
|---|
| 7/23 | $25,612 | $26,176 | $33,050 |
|---|
| 8/23 | $25,389 | $25,759 | $32,753 |
|---|
| 9/23 | $23,893 | $24,531 | $30,972 |
|---|
| 10/23 | $23,581 | $24,015 | $30,531 |
|---|
| 11/23 | $26,118 | $26,208 | $33,859 |
|---|
| 12/23 | $27,168 | $27,399 | $35,358 |
|---|
| 1/24 | $28,195 | $27,859 | $36,240 |
|---|
| 2/24 | $30,166 | $29,347 | $38,713 |
|---|
| 3/24 | $30,606 | $30,291 | $39,394 |
|---|
| 4/24 | $29,246 | $29,054 | $37,723 |
|---|
| 5/24 | $31,201 | $30,494 | $39,981 |
|---|
| 6/24 | $33,441 | $31,589 | $42,677 |
|---|
| 7/24 | $32,814 | $31,973 | $41,951 |
|---|
| 8/24 | $33,580 | $32,749 | $42,825 |
|---|
| 9/24 | $34,150 | $33,448 | $44,038 |
|---|
| 10/24 | $33,987 | $33,145 | $43,893 |
|---|
| 11/24 | $35,910 | $35,090 | $46,740 |
|---|
| 12/24 | $35,985 | $34,254 | $47,152 |
|---|
Average Annual Total Returns (%)Footnote Reference1
| Fund | 1 Year | 5 Years | 10 Years |
|---|
| Class A | 32.46% | 16.14% | 14.26% |
|---|
| Class A with 5.25% Maximum Sales Charge | 25.50% | 14.89% | 13.65% |
|---|
S&P 500® Index | 25.02% | 14.51% | 13.09% |
|---|
Russell 1000® Growth Index | 33.36% | 18.94% | 16.76% |
|---|
| Footnote | Description |
Footnote1 | In accordance with regulatory changes requiring the Fund's primary benchmark to represent the overall applicable market, the Fund's primary prospectus benchmark changed to the S&P 500® Index effective May 1, 2024. |
Performance does not reflect the deduction of taxes that a shareholder would pay on Fund distributions or redemption of Fund shares. Performance assumes that all dividends and distributions, if any, were reinvested. For more recent performance information, visit www.eatonvance.com/performance.php.
THE FUND'S PAST PERFORMANCE IS NO GUARANTEE OF FUTURE RESULTS.
| Total Net Assets | $431,912,057 |
|---|
| # of Portfolio Holdings | 49 |
|---|
| Portfolio Turnover Rate | 18% |
|---|
| Total Advisory Fees Paid | $2,655,868 |
|---|
What did the Fund invest in?
The following tables reflect what the Fund invested in as of the report date.
Sector Allocation (% of total investments)
| Value | Value |
|---|
| Short-Term Investments | 0.8% |
| Real Estate | 1.5% |
| Consumer Staples | 4.3% |
| Health Care | 5.3% |
| Financials | 6.5% |
| Industrials | 6.8% |
| Consumer Discretionary | 13.4% |
| Communication Services | 14.0% |
| Information Technology | 47.4% |
Top Ten Holdings (% of total investments)Footnote Referencea
| NVIDIA Corp. | 12.7% |
| Microsoft Corp. | 9.0% |
| Amazon.com, Inc. | 8.7% |
| Apple, Inc. | 8.1% |
| Alphabet, Inc., Class A | 5.6% |
| Broadcom, Inc. | 4.2% |
| Meta Platforms, Inc., Class A | 3.5% |
| Alphabet, Inc., Class C | 2.6% |
| Eli Lilly & Co. | 2.6% |
| Intuit, Inc. | 2.4% |
| Total | 59.4% |
| Footnote | Description |
Footnotea | Excluding cash equivalents |
If you wish to view additional information about the Fund, including the prospectus, statement of additional information, financial statements and holdings, please scan the QR code or visit www.eatonvance.com/open-end-mutual-fund-documents.php. For proxy information, please visit www.eatonvance.com/proxyvoting.
The Funds may deliver a single copy of certain required shareholder documents (including prospectuses, shareholder reports, and proxy materials) to investors with the same last name and the same address. Your participation will continue indefinitely unless you instruct otherwise by calling 1-800-262-1122 or by contacting your financial intermediary. Your instruction will typically be effective within 30 days of receipt.
Not FDIC Insured | May Lose Value | No Bank Guarantee
Annual Shareholder Report December 31, 2024
Annual Shareholder Report December 31, 2024
This annual shareholder report contains important information about the Eaton Vance Growth Fund for the period of January 1, 2024 to December 31, 2024. You can find additional information about the Fund at www.eatonvance.com/open-end-mutual-fund-documents.php. You can also request this information by contacting us at 1-800-262-1122.
What were the Fund costs for the last year?
(based on a hypothetical $10,000 investment)
| Class Name | Costs of a $10,000 investment | Costs paid as a percentage of a $10,000 investment |
|---|
| Class C | $207 | 1.79% |
|---|
How did the Fund perform last year and what affected its performance?
Key contributors to (↑) and detractors from (↓) performance, relative to the Russell 1000® Growth Index (the Index):
↓ An overweight position in marketing and publishing software firm Adobe Inc. lost value over concerns about competition from artificial intelligence (AI) products
↓ An overweight position in tax and accounting software maker Intuit Inc. underperformed the Index as investors questioned its ability to compete for AI business
↓ An underweight position in electric car maker Tesla Inc. hurt returns as its stock price rose over optimism about the potential launch of an autonomous vehicle
↓ Among sectors, stock selections and an underweight exposure to consumer discretionary, and stock selections and an overweight in real estate hurt returns
↑ An overweight position in NVIDIA Corp., a major microchip supplier for AI applications, contributed to relative returns as its stock price more than doubled
↑ Owning mobile chipmaker Qualcomm Inc. early in the period as its stock price rose ― and selling the stock in June 2024 before its price dropped ― helped returns
↑ An underweight position in Microsoft Corp. helped returns as its stock underperformed the Index over concerns about the costs needed to pursue AI opportunities
↑ Among sectors, stock selections in consumer staples and industrials, and an underweight exposure to health care contributed to Index-relative returns
Comparison of the change in value of a $10,000 investment for the period indicated.

| Class C | S&P 500® Index | Russell 1000® Growth Index |
|---|
| 12/14 | $10,000 | $10,000 | $10,000 |
|---|
| 1/15 | $9,813 | $9,700 | $9,847 |
|---|
| 2/15 | $10,525 | $10,257 | $10,503 |
|---|
| 3/15 | $10,442 | $10,095 | $10,384 |
|---|
| 4/15 | $10,400 | $10,192 | $10,436 |
|---|
| 5/15 | $10,613 | $10,323 | $10,583 |
|---|
| 6/15 | $10,506 | $10,123 | $10,396 |
|---|
| 7/15 | $10,865 | $10,335 | $10,749 |
|---|
| 8/15 | $10,179 | $9,712 | $10,096 |
|---|
| 9/15 | $9,858 | $9,471 | $9,846 |
|---|
| 10/15 | $10,640 | $10,270 | $10,694 |
|---|
| 11/15 | $10,752 | $10,301 | $10,724 |
|---|
| 12/15 | $10,620 | $10,138 | $10,567 |
|---|
| 1/16 | $9,834 | $9,635 | $9,977 |
|---|
| 2/16 | $9,632 | $9,622 | $9,973 |
|---|
| 3/16 | $10,244 | $10,275 | $10,645 |
|---|
| 4/16 | $10,298 | $10,315 | $10,548 |
|---|
| 5/16 | $10,571 | $10,500 | $10,753 |
|---|
| 6/16 | $10,365 | $10,527 | $10,711 |
|---|
| 7/16 | $10,959 | $10,915 | $11,216 |
|---|
| 8/16 | $10,937 | $10,931 | $11,160 |
|---|
| 9/16 | $10,981 | $10,933 | $11,201 |
|---|
| 10/16 | $10,692 | $10,733 | $10,938 |
|---|
| 11/16 | $10,792 | $11,131 | $11,176 |
|---|
| 12/16 | $10,787 | $11,351 | $11,314 |
|---|
| 1/17 | $11,270 | $11,566 | $11,696 |
|---|
| 2/17 | $11,676 | $12,025 | $12,182 |
|---|
| 3/17 | $11,670 | $12,039 | $12,322 |
|---|
| 4/17 | $11,965 | $12,163 | $12,604 |
|---|
| 5/17 | $12,271 | $12,334 | $12,932 |
|---|
| 6/17 | $12,271 | $12,411 | $12,898 |
|---|
| 7/17 | $12,510 | $12,667 | $13,241 |
|---|
| 8/17 | $12,599 | $12,705 | $13,483 |
|---|
| 9/17 | $12,682 | $12,967 | $13,659 |
|---|
| 10/17 | $12,932 | $13,270 | $14,188 |
|---|
| 11/17 | $13,282 | $13,677 | $14,619 |
|---|
| 12/17 | $13,425 | $13,829 | $14,733 |
|---|
| 1/18 | $14,493 | $14,621 | $15,776 |
|---|
| 2/18 | $14,211 | $14,082 | $15,363 |
|---|
| 3/18 | $13,794 | $13,724 | $14,941 |
|---|
| 4/18 | $14,000 | $13,777 | $14,994 |
|---|
| 5/18 | $14,622 | $14,108 | $15,651 |
|---|
| 6/18 | $14,740 | $14,195 | $15,801 |
|---|
| 7/18 | $15,098 | $14,724 | $16,265 |
|---|
| 8/18 | $15,767 | $15,203 | $17,155 |
|---|
| 9/18 | $15,908 | $15,290 | $17,251 |
|---|
| 10/18 | $14,481 | $14,245 | $15,708 |
|---|
| 11/18 | $14,540 | $14,535 | $15,875 |
|---|
| 12/18 | $13,366 | $13,223 | $14,510 |
|---|
| 1/19 | $14,692 | $14,282 | $15,814 |
|---|
| 2/19 | $15,188 | $14,741 | $16,380 |
|---|
| 3/19 | $15,454 | $15,027 | $16,846 |
|---|
| 4/19 | $16,154 | $15,636 | $17,607 |
|---|
| 5/19 | $14,822 | $14,642 | $16,495 |
|---|
| 6/19 | $15,855 | $15,674 | $17,628 |
|---|
| 7/19 | $16,195 | $15,899 | $18,026 |
|---|
| 8/19 | $15,781 | $15,648 | $17,888 |
|---|
| 9/19 | $15,692 | $15,940 | $17,890 |
|---|
| 10/19 | $16,114 | $16,286 | $18,394 |
|---|
| 11/19 | $16,808 | $16,877 | $19,210 |
|---|
| 12/19 | $17,290 | $17,386 | $19,790 |
|---|
| 1/20 | $17,533 | $17,379 | $20,232 |
|---|
| 2/20 | $16,258 | $15,949 | $18,854 |
|---|
| 3/20 | $14,428 | $13,979 | $17,000 |
|---|
| 4/20 | $16,629 | $15,771 | $19,515 |
|---|
| 5/20 | $17,806 | $16,522 | $20,825 |
|---|
| 6/20 | $18,595 | $16,850 | $21,732 |
|---|
| 7/20 | $19,703 | $17,801 | $23,404 |
|---|
| 8/20 | $21,628 | $19,080 | $25,819 |
|---|
| 9/20 | $20,676 | $18,355 | $24,604 |
|---|
| 10/20 | $20,150 | $17,867 | $23,769 |
|---|
| 11/20 | $22,571 | $19,823 | $26,203 |
|---|
| 12/20 | $23,543 | $20,585 | $27,408 |
|---|
| 1/21 | $23,294 | $20,377 | $27,205 |
|---|
| 2/21 | $24,008 | $20,939 | $27,199 |
|---|
| 3/21 | $24,041 | $21,856 | $27,666 |
|---|
| 4/21 | $25,410 | $23,022 | $29,548 |
|---|
| 5/21 | $25,219 | $23,183 | $29,140 |
|---|
| 6/21 | $26,414 | $23,724 | $30,968 |
|---|
| 7/21 | $26,896 | $24,288 | $31,988 |
|---|
| 8/21 | $27,701 | $25,026 | $33,184 |
|---|
| 9/21 | $25,983 | $23,863 | $31,326 |
|---|
| 10/21 | $27,535 | $25,534 | $34,039 |
|---|
| 11/21 | $27,244 | $25,357 | $34,247 |
|---|
| 12/21 | $27,946 | $26,494 | $34,971 |
|---|
| 1/22 | $25,612 | $25,123 | $31,970 |
|---|
| 2/22 | $24,293 | $24,371 | $30,612 |
|---|
| 3/22 | $24,634 | $25,276 | $31,809 |
|---|
| 4/22 | $21,774 | $23,071 | $27,968 |
|---|
| 5/22 | $21,451 | $23,114 | $27,318 |
|---|
| 6/22 | $19,717 | $21,206 | $25,154 |
|---|
| 7/22 | $21,885 | $23,161 | $28,173 |
|---|
| 8/22 | $20,713 | $22,217 | $26,861 |
|---|
| 9/22 | $18,748 | $20,170 | $24,249 |
|---|
| 10/22 | $20,012 | $21,804 | $25,667 |
|---|
| 11/22 | $21,027 | $23,022 | $26,836 |
|---|
| 12/22 | $19,520 | $21,696 | $24,782 |
|---|
| 1/23 | $21,056 | $23,059 | $26,847 |
|---|
| 2/23 | $20,313 | $22,496 | $26,528 |
|---|
| 3/23 | $21,859 | $23,322 | $28,342 |
|---|
| 4/23 | $22,146 | $23,686 | $28,621 |
|---|
| 5/23 | $22,988 | $23,789 | $29,926 |
|---|
| 6/23 | $24,445 | $25,361 | $31,972 |
|---|
| 7/23 | $25,347 | $26,176 | $33,050 |
|---|
| 8/23 | $25,109 | $25,759 | $32,753 |
|---|
| 9/23 | $23,613 | $24,531 | $30,972 |
|---|
| 10/23 | $23,286 | $24,015 | $30,531 |
|---|
| 11/23 | $25,783 | $26,208 | $33,859 |
|---|
| 12/23 | $26,794 | $27,399 | $35,358 |
|---|
| 1/24 | $27,792 | $27,859 | $36,240 |
|---|
| 2/24 | $29,711 | $29,347 | $38,713 |
|---|
| 3/24 | $30,126 | $30,291 | $39,394 |
|---|
| 4/24 | $28,768 | $29,054 | $37,723 |
|---|
| 5/24 | $30,676 | $30,494 | $39,981 |
|---|
| 6/24 | $32,853 | $31,589 | $42,677 |
|---|
| 7/24 | $32,224 | $31,973 | $41,951 |
|---|
| 8/24 | $32,954 | $32,749 | $42,825 |
|---|
| 9/24 | $33,492 | $33,448 | $44,038 |
|---|
| 10/24 | $33,313 | $33,145 | $43,893 |
|---|
| 11/24 | $35,175 | $35,090 | $46,740 |
|---|
| 12/24 | $35,759 | $34,254 | $47,152 |
|---|
Average Annual Total Returns (%)Footnote Reference1
| Fund | 1 Year | 5 Years | 10 Years |
|---|
| Class C, with conversion to Class A after 8 years | 31.46% | 15.28% | 13.58% |
|---|
| Class C, with 1% Maximum Deferred Sales Charge and conversion to Class A after 8 years | 30.46% | 15.28% | 13.58% |
|---|
S&P 500® Index | 25.02% | 14.51% | 13.09% |
|---|
Russell 1000® Growth Index | 33.36% | 18.94% | 16.76% |
|---|
| Footnote | Description |
Footnote1 | In accordance with regulatory changes requiring the Fund's primary benchmark to represent the overall applicable market, the Fund's primary prospectus benchmark changed to the S&P 500® Index effective May 1, 2024. |
Performance does not reflect the deduction of taxes that a shareholder would pay on Fund distributions or redemption of Fund shares. Performance assumes that all dividends and distributions, if any, were reinvested. For more recent performance information, visit www.eatonvance.com/performance.php.
THE FUND'S PAST PERFORMANCE IS NO GUARANTEE OF FUTURE RESULTS.
| Total Net Assets | $431,912,057 |
|---|
| # of Portfolio Holdings | 49 |
|---|
| Portfolio Turnover Rate | 18% |
|---|
| Total Advisory Fees Paid | $2,655,868 |
|---|
What did the Fund invest in?
The following tables reflect what the Fund invested in as of the report date.
Sector Allocation (% of total investments)
| Value | Value |
|---|
| Short-Term Investments | 0.8% |
| Real Estate | 1.5% |
| Consumer Staples | 4.3% |
| Health Care | 5.3% |
| Financials | 6.5% |
| Industrials | 6.8% |
| Consumer Discretionary | 13.4% |
| Communication Services | 14.0% |
| Information Technology | 47.4% |
Top Ten Holdings (% of total investments)Footnote Referencea
| NVIDIA Corp. | 12.7% |
| Microsoft Corp. | 9.0% |
| Amazon.com, Inc. | 8.7% |
| Apple, Inc. | 8.1% |
| Alphabet, Inc., Class A | 5.6% |
| Broadcom, Inc. | 4.2% |
| Meta Platforms, Inc., Class A | 3.5% |
| Alphabet, Inc., Class C | 2.6% |
| Eli Lilly & Co. | 2.6% |
| Intuit, Inc. | 2.4% |
| Total | 59.4% |
| Footnote | Description |
Footnotea | Excluding cash equivalents |
If you wish to view additional information about the Fund, including the prospectus, statement of additional information, financial statements and holdings, please scan the QR code or visit www.eatonvance.com/open-end-mutual-fund-documents.php. For proxy information, please visit www.eatonvance.com/proxyvoting.
The Funds may deliver a single copy of certain required shareholder documents (including prospectuses, shareholder reports, and proxy materials) to investors with the same last name and the same address. Your participation will continue indefinitely unless you instruct otherwise by calling 1-800-262-1122 or by contacting your financial intermediary. Your instruction will typically be effective within 30 days of receipt.
Not FDIC Insured | May Lose Value | No Bank Guarantee
Annual Shareholder Report December 31, 2024
Annual Shareholder Report December 31, 2024
This annual shareholder report contains important information about the Eaton Vance Growth Fund for the period of January 1, 2024 to December 31, 2024. You can find additional information about the Fund at www.eatonvance.com/open-end-mutual-fund-documents.php. You can also request this information by contacting us at 1-800-262-1122.
What were the Fund costs for the last year?
(based on a hypothetical $10,000 investment)
| Class Name | Costs of a $10,000 investment | Costs paid as a percentage of a $10,000 investment |
|---|
| Class I | $92 | 0.79% |
|---|
How did the Fund perform last year and what affected its performance?
Key contributors to (↑) and detractors from (↓) performance, relative to the Russell 1000® Growth Index (the Index):
↓ An overweight position in marketing and publishing software firm Adobe Inc. lost value over concerns about competition from artificial intelligence (AI) products
↓ An overweight position in tax and accounting software maker Intuit Inc. underperformed the Index as investors questioned its ability to compete for AI business
↓ An underweight position in electric car maker Tesla Inc. hurt returns as its stock price rose over optimism about the potential launch of an autonomous vehicle
↓ Among sectors, stock selections and an underweight exposure to consumer discretionary, and stock selections and an overweight in real estate hurt returns
↑ An overweight position in NVIDIA Corp., a major microchip supplier for AI applications, contributed to relative returns as its stock price more than doubled
↑ Owning mobile chipmaker Qualcomm Inc. early in the period as its stock price rose ― and selling the stock in June 2024 before its price dropped ― helped returns
↑ An underweight position in Microsoft Corp. helped returns as its stock underperformed the Index over concerns about the costs needed to pursue AI opportunities
↑ Among sectors, stock selections in consumer staples and industrials, and an underweight exposure to health care contributed to Index-relative returns
Comparison of the change in value of a $1,000,000 investment for the period indicated.
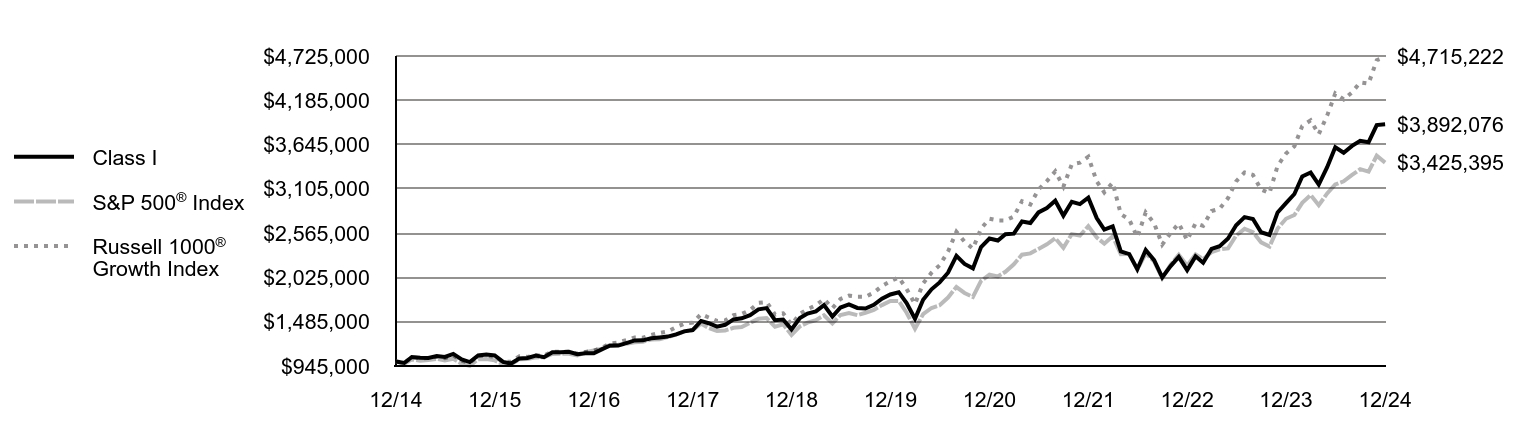
| Class I | S&P 500® Index | Russell 1000® Growth Index |
|---|
| 12/14 | $1,000,000 | $1,000,000 | $1,000,000 |
|---|
| 1/15 | $981,917 | $969,981 | $984,687 |
|---|
| 2/15 | $1,054,250 | $1,025,727 | $1,050,322 |
|---|
| 3/15 | $1,046,564 | $1,009,506 | $1,038,376 |
|---|
| 4/15 | $1,042,959 | $1,019,190 | $1,043,577 |
|---|
| 5/15 | $1,065,525 | $1,032,296 | $1,058,266 |
|---|
| 6/15 | $1,055,782 | $1,012,313 | $1,039,623 |
|---|
| 7/15 | $1,092,435 | $1,033,522 | $1,074,878 |
|---|
| 8/15 | $1,024,249 | $971,166 | $1,009,602 |
|---|
| 9/15 | $993,172 | $947,136 | $984,626 |
|---|
| 10/15 | $1,072,956 | $1,027,030 | $1,069,408 |
|---|
| 11/15 | $1,085,020 | $1,030,085 | $1,072,410 |
|---|
| 12/15 | $1,072,629 | $1,013,838 | $1,056,673 |
|---|
| 1/16 | $994,403 | $963,527 | $997,681 |
|---|
| 2/16 | $974,602 | $962,227 | $997,256 |
|---|
| 3/16 | $1,037,284 | $1,027,503 | $1,064,512 |
|---|
| 4/16 | $1,043,413 | $1,031,487 | $1,054,791 |
|---|
| 5/16 | $1,072,158 | $1,050,010 | $1,075,274 |
|---|
| 6/16 | $1,051,750 | $1,052,731 | $1,071,051 |
|---|
| 7/16 | $1,113,402 | $1,091,544 | $1,121,607 |
|---|
| 8/16 | $1,112,450 | $1,093,076 | $1,116,035 |
|---|
| 9/16 | $1,117,264 | $1,093,283 | $1,120,117 |
|---|
| 10/16 | $1,089,321 | $1,073,340 | $1,093,813 |
|---|
| 11/16 | $1,099,924 | $1,113,091 | $1,117,613 |
|---|
| 12/16 | $1,100,410 | $1,135,093 | $1,131,448 |
|---|
| 1/17 | $1,150,984 | $1,156,621 | $1,169,576 |
|---|
| 2/17 | $1,192,882 | $1,202,546 | $1,218,155 |
|---|
| 3/17 | $1,193,833 | $1,203,949 | $1,232,245 |
|---|
| 4/17 | $1,224,659 | $1,216,313 | $1,260,426 |
|---|
| 5/17 | $1,256,936 | $1,233,430 | $1,293,201 |
|---|
| 6/17 | $1,257,894 | $1,241,129 | $1,289,794 |
|---|
| 7/17 | $1,283,499 | $1,266,650 | $1,324,076 |
|---|
| 8/17 | $1,293,661 | $1,270,527 | $1,348,348 |
|---|
| 9/17 | $1,303,317 | $1,296,736 | $1,365,879 |
|---|
| 10/17 | $1,330,370 | $1,326,995 | $1,418,803 |
|---|
| 11/17 | $1,367,096 | $1,367,694 | $1,461,906 |
|---|
| 12/17 | $1,383,376 | $1,382,901 | $1,473,287 |
|---|
| 1/18 | $1,494,675 | $1,462,078 | $1,577,634 |
|---|
| 2/18 | $1,466,323 | $1,408,190 | $1,536,267 |
|---|
| 3/18 | $1,424,851 | $1,372,403 | $1,494,138 |
|---|
| 4/18 | $1,447,100 | $1,377,669 | $1,499,358 |
|---|
| 5/18 | $1,512,875 | $1,410,846 | $1,565,077 |
|---|
| 6/18 | $1,526,039 | $1,419,530 | $1,580,146 |
|---|
| 7/18 | $1,564,976 | $1,472,355 | $1,626,533 |
|---|
| 8/18 | $1,635,303 | $1,520,333 | $1,715,466 |
|---|
| 9/18 | $1,651,516 | $1,528,986 | $1,725,054 |
|---|
| 10/18 | $1,504,263 | $1,424,480 | $1,570,788 |
|---|
| 11/18 | $1,511,850 | $1,453,508 | $1,587,472 |
|---|
| 12/18 | $1,391,129 | $1,322,270 | $1,450,985 |
|---|
| 1/19 | $1,529,777 | $1,428,231 | $1,581,409 |
|---|
| 2/19 | $1,583,434 | $1,474,089 | $1,637,991 |
|---|
| 3/19 | $1,611,963 | $1,502,733 | $1,684,613 |
|---|
| 4/19 | $1,686,701 | $1,563,578 | $1,760,724 |
|---|
| 5/19 | $1,548,592 | $1,464,216 | $1,649,493 |
|---|
| 6/19 | $1,658,147 | $1,567,408 | $1,762,775 |
|---|
| 7/19 | $1,695,257 | $1,589,935 | $1,802,580 |
|---|
| 8/19 | $1,653,048 | $1,564,750 | $1,788,774 |
|---|
| 9/19 | $1,645,037 | $1,594,027 | $1,788,996 |
|---|
| 10/19 | $1,690,680 | $1,628,553 | $1,839,431 |
|---|
| 11/19 | $1,764,880 | $1,687,668 | $1,921,034 |
|---|
| 12/19 | $1,817,467 | $1,738,605 | $1,978,994 |
|---|
| 1/20 | $1,844,876 | $1,737,924 | $2,023,234 |
|---|
| 2/20 | $1,711,667 | $1,594,859 | $1,885,448 |
|---|
| 3/20 | $1,520,598 | $1,397,874 | $1,699,966 |
|---|
| 4/20 | $1,753,375 | $1,577,072 | $1,951,512 |
|---|
| 5/20 | $1,879,741 | $1,652,185 | $2,082,526 |
|---|
| 6/20 | $1,964,416 | $1,685,042 | $2,173,209 |
|---|
| 7/20 | $2,082,700 | $1,780,054 | $2,340,414 |
|---|
| 8/20 | $2,288,437 | $1,908,005 | $2,581,926 |
|---|
| 9/20 | $2,189,234 | $1,835,507 | $2,460,447 |
|---|
| 10/20 | $2,135,568 | $1,786,694 | $2,376,885 |
|---|
| 11/20 | $2,394,535 | $1,982,273 | $2,620,259 |
|---|
| 12/20 | $2,499,177 | $2,058,487 | $2,740,768 |
|---|
| 1/21 | $2,474,549 | $2,037,705 | $2,720,489 |
|---|
| 2/21 | $2,552,486 | $2,093,895 | $2,719,859 |
|---|
| 3/21 | $2,558,518 | $2,185,598 | $2,766,587 |
|---|
| 4/21 | $2,706,424 | $2,302,241 | $2,954,822 |
|---|
| 5/21 | $2,687,711 | $2,318,321 | $2,913,953 |
|---|
| 6/21 | $2,817,615 | $2,372,442 | $3,096,768 |
|---|
| 7/21 | $2,871,614 | $2,428,799 | $3,198,826 |
|---|
| 8/21 | $2,960,248 | $2,502,648 | $3,318,426 |
|---|
| 9/21 | $2,778,315 | $2,386,250 | $3,132,575 |
|---|
| 10/21 | $2,947,586 | $2,553,435 | $3,403,905 |
|---|
| 11/21 | $2,918,930 | $2,535,743 | $3,424,717 |
|---|
| 12/21 | $2,996,843 | $2,649,385 | $3,497,125 |
|---|
| 1/22 | $2,748,188 | $2,512,287 | $3,196,984 |
|---|
| 2/22 | $2,609,084 | $2,437,066 | $3,061,197 |
|---|
| 3/22 | $2,648,004 | $2,527,553 | $3,180,943 |
|---|
| 4/22 | $2,342,410 | $2,307,145 | $2,796,807 |
|---|
| 5/22 | $2,309,977 | $2,311,378 | $2,731,788 |
|---|
| 6/22 | $2,124,746 | $2,120,588 | $2,515,400 |
|---|
| 7/22 | $2,359,708 | $2,316,116 | $2,817,300 |
|---|
| 8/22 | $2,235,740 | $2,221,660 | $2,686,059 |
|---|
| 9/22 | $2,025,284 | $2,017,049 | $2,424,932 |
|---|
| 10/22 | $2,163,666 | $2,180,352 | $2,566,666 |
|---|
| 11/22 | $2,275,381 | $2,302,198 | $2,683,621 |
|---|
| 12/22 | $2,113,777 | $2,169,558 | $2,478,172 |
|---|
| 1/23 | $2,282,152 | $2,305,880 | $2,684,721 |
|---|
| 2/23 | $2,204,032 | $2,249,619 | $2,652,836 |
|---|
| 3/23 | $2,373,165 | $2,332,212 | $2,834,174 |
|---|
| 4/23 | $2,406,536 | $2,368,614 | $2,862,136 |
|---|
| 5/23 | $2,499,824 | $2,378,910 | $2,992,588 |
|---|
| 6/23 | $2,660,614 | $2,536,097 | $3,197,237 |
|---|
| 7/23 | $2,760,728 | $2,617,569 | $3,304,952 |
|---|
| 8/23 | $2,737,217 | $2,575,893 | $3,275,277 |
|---|
| 9/23 | $2,576,427 | $2,453,080 | $3,097,155 |
|---|
| 10/23 | $2,543,056 | $2,401,500 | $3,053,059 |
|---|
| 11/23 | $2,817,612 | $2,620,818 | $3,385,876 |
|---|
| 12/23 | $2,931,597 | $2,739,884 | $3,535,809 |
|---|
| 1/24 | $3,042,286 | $2,785,925 | $3,623,998 |
|---|
| 2/24 | $3,256,229 | $2,934,682 | $3,871,252 |
|---|
| 3/24 | $3,304,139 | $3,029,104 | $3,939,403 |
|---|
| 4/24 | $3,157,931 | $2,905,381 | $3,772,310 |
|---|
| 5/24 | $3,369,396 | $3,049,444 | $3,998,140 |
|---|
| 6/24 | $3,612,250 | $3,158,864 | $4,267,741 |
|---|
| 7/24 | $3,545,341 | $3,197,315 | $4,195,145 |
|---|
| 8/24 | $3,628,770 | $3,274,872 | $4,282,521 |
|---|
| 9/24 | $3,691,549 | $3,344,813 | $4,403,847 |
|---|
| 10/24 | $3,674,202 | $3,314,481 | $4,389,274 |
|---|
| 11/24 | $3,883,189 | $3,509,044 | $4,673,964 |
|---|
| 12/24 | $3,892,076 | $3,425,395 | $4,715,222 |
|---|
Average Annual Total Returns (%)Footnote Reference1
| Fund | 1 Year | 5 Years | 10 Years |
|---|
| Class I | 32.76% | 16.43% | 14.54% |
|---|
S&P 500® Index | 25.02% | 14.51% | 13.09% |
|---|
Russell 1000® Growth Index | 33.36% | 18.94% | 16.76% |
|---|
| Footnote | Description |
Footnote1 | In accordance with regulatory changes requiring the Fund's primary benchmark to represent the overall applicable market, the Fund's primary prospectus benchmark changed to the S&P 500® Index effective May 1, 2024. |
Performance does not reflect the deduction of taxes that a shareholder would pay on Fund distributions or redemption of Fund shares. Performance assumes that all dividends and distributions, if any, were reinvested. For more recent performance information, visit www.eatonvance.com/performance.php.
THE FUND'S PAST PERFORMANCE IS NO GUARANTEE OF FUTURE RESULTS.
| Total Net Assets | $431,912,057 |
|---|
| # of Portfolio Holdings | 49 |
|---|
| Portfolio Turnover Rate | 18% |
|---|
| Total Advisory Fees Paid | $2,655,868 |
|---|
What did the Fund invest in?
The following tables reflect what the Fund invested in as of the report date.
Sector Allocation (% of total investments)
| Value | Value |
|---|
| Short-Term Investments | 0.8% |
| Real Estate | 1.5% |
| Consumer Staples | 4.3% |
| Health Care | 5.3% |
| Financials | 6.5% |
| Industrials | 6.8% |
| Consumer Discretionary | 13.4% |
| Communication Services | 14.0% |
| Information Technology | 47.4% |
Top Ten Holdings (% of total investments)Footnote Referencea
| NVIDIA Corp. | 12.7% |
| Microsoft Corp. | 9.0% |
| Amazon.com, Inc. | 8.7% |
| Apple, Inc. | 8.1% |
| Alphabet, Inc., Class A | 5.6% |
| Broadcom, Inc. | 4.2% |
| Meta Platforms, Inc., Class A | 3.5% |
| Alphabet, Inc., Class C | 2.6% |
| Eli Lilly & Co. | 2.6% |
| Intuit, Inc. | 2.4% |
| Total | 59.4% |
| Footnote | Description |
Footnotea | Excluding cash equivalents |
If you wish to view additional information about the Fund, including the prospectus, statement of additional information, financial statements and holdings, please scan the QR code or visit www.eatonvance.com/open-end-mutual-fund-documents.php. For proxy information, please visit www.eatonvance.com/proxyvoting.
The Funds may deliver a single copy of certain required shareholder documents (including prospectuses, shareholder reports, and proxy materials) to investors with the same last name and the same address. Your participation will continue indefinitely unless you instruct otherwise by calling 1-800-262-1122 or by contacting your financial intermediary. Your instruction will typically be effective within 30 days of receipt.
Not FDIC Insured | May Lose Value | No Bank Guarantee
Annual Shareholder Report December 31, 2024
Annual Shareholder Report December 31, 2024
This annual shareholder report contains important information about the Eaton Vance Growth Fund for the period of January 1, 2024 to December 31, 2024. You can find additional information about the Fund at www.eatonvance.com/open-end-mutual-fund-documents.php. You can also request this information by contacting us at 1-800-262-1122.
What were the Fund costs for the last year?
(based on a hypothetical $10,000 investment)
| Class Name | Costs of a $10,000 investment | Costs paid as a percentage of a $10,000 investment |
|---|
| Class R | $149 | 1.28% |
|---|
How did the Fund perform last year and what affected its performance?
Key contributors to (↑) and detractors from (↓) performance, relative to the Russell 1000® Growth Index (the Index):
↓ An overweight position in marketing and publishing software firm Adobe Inc. lost value over concerns about competition from artificial intelligence (AI) products
↓ An overweight position in tax and accounting software maker Intuit Inc. underperformed the Index as investors questioned its ability to compete for AI business
↓ An underweight position in electric car maker Tesla Inc. hurt returns as its stock price rose over optimism about the potential launch of an autonomous vehicle
↓ Among sectors, stock selections and an underweight exposure to consumer discretionary, and stock selections and an overweight in real estate hurt returns
↑ An overweight position in NVIDIA Corp., a major microchip supplier for AI applications, contributed to relative returns as its stock price more than doubled
↑ Owning mobile chipmaker Qualcomm Inc. early in the period as its stock price rose ― and selling the stock in June 2024 before its price dropped ― helped returns
↑ An underweight position in Microsoft Corp. helped returns as its stock underperformed the Index over concerns about the costs needed to pursue AI opportunities
↑ Among sectors, stock selections in consumer staples and industrials, and an underweight exposure to health care contributed to Index-relative returns
Comparison of the change in value of a $10,000 investment for the period indicated.
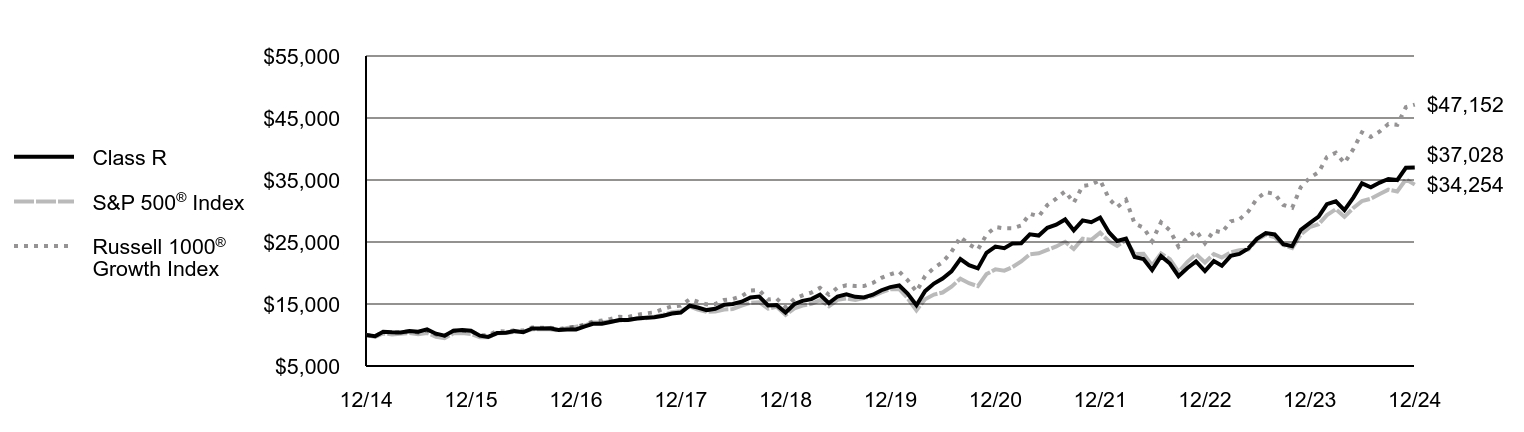
| Class R | S&P 500® Index | Russell 1000® Growth Index |
|---|
| 12/14 | $10,000 | $10,000 | $10,000 |
|---|
| 1/15 | $9,817 | $9,700 | $9,847 |
|---|
| 2/15 | $10,535 | $10,257 | $10,503 |
|---|
| 3/15 | $10,450 | $10,095 | $10,384 |
|---|
| 4/15 | $10,413 | $10,192 | $10,436 |
|---|
| 5/15 | $10,637 | $10,323 | $10,583 |
|---|
| 6/15 | $10,531 | $10,123 | $10,396 |
|---|
| 7/15 | $10,898 | $10,335 | $10,749 |
|---|
| 8/15 | $10,209 | $9,712 | $10,096 |
|---|
| 9/15 | $9,896 | $9,471 | $9,846 |
|---|
| 10/15 | $10,686 | $10,270 | $10,694 |
|---|
| 11/15 | $10,801 | $10,301 | $10,724 |
|---|
| 12/15 | $10,678 | $10,138 | $10,567 |
|---|
| 1/16 | $9,889 | $9,635 | $9,977 |
|---|
| 2/16 | $9,688 | $9,622 | $9,973 |
|---|
| 3/16 | $10,310 | $10,275 | $10,645 |
|---|
| 4/16 | $10,369 | $10,315 | $10,548 |
|---|
| 5/16 | $10,648 | $10,500 | $10,753 |
|---|
| 6/16 | $10,441 | $10,527 | $10,711 |
|---|
| 7/16 | $11,044 | $10,915 | $11,216 |
|---|
| 8/16 | $11,029 | $10,931 | $11,160 |
|---|
| 9/16 | $11,079 | $10,933 | $11,201 |
|---|
| 10/16 | $10,795 | $10,733 | $10,938 |
|---|
| 11/16 | $10,899 | $11,131 | $11,176 |
|---|
| 12/16 | $10,894 | $11,351 | $11,314 |
|---|
| 1/17 | $11,392 | $11,566 | $11,696 |
|---|
| 2/17 | $11,801 | $12,025 | $12,182 |
|---|
| 3/17 | $11,805 | $12,039 | $12,322 |
|---|
| 4/17 | $12,109 | $12,163 | $12,604 |
|---|
| 5/17 | $12,418 | $12,334 | $12,932 |
|---|
| 6/17 | $12,423 | $12,411 | $12,898 |
|---|
| 7/17 | $12,667 | $12,667 | $13,241 |
|---|
| 8/17 | $12,766 | $12,705 | $13,483 |
|---|
| 9/17 | $12,856 | $12,967 | $13,659 |
|---|
| 10/17 | $13,115 | $13,270 | $14,188 |
|---|
| 11/17 | $13,473 | $13,677 | $14,619 |
|---|
| 12/17 | $13,631 | $13,829 | $14,733 |
|---|
| 1/18 | $14,718 | $14,621 | $15,776 |
|---|
| 2/18 | $14,436 | $14,082 | $15,363 |
|---|
| 3/18 | $14,018 | $13,724 | $14,941 |
|---|
| 4/18 | $14,238 | $13,777 | $14,994 |
|---|
| 5/18 | $14,870 | $14,108 | $15,651 |
|---|
| 6/18 | $15,000 | $14,195 | $15,801 |
|---|
| 7/18 | $15,371 | $14,724 | $16,265 |
|---|
| 8/18 | $16,061 | $15,203 | $17,155 |
|---|
| 9/18 | $16,207 | $15,290 | $17,251 |
|---|
| 10/18 | $14,760 | $14,245 | $15,708 |
|---|
| 11/18 | $14,822 | $14,535 | $15,875 |
|---|
| 12/18 | $13,633 | $13,223 | $14,510 |
|---|
| 1/19 | $14,991 | $14,282 | $15,814 |
|---|
| 2/19 | $15,507 | $14,741 | $16,380 |
|---|
| 3/19 | $15,786 | $15,027 | $16,846 |
|---|
| 4/19 | $16,504 | $15,636 | $17,607 |
|---|
| 5/19 | $15,145 | $14,642 | $16,495 |
|---|
| 6/19 | $16,213 | $15,674 | $17,628 |
|---|
| 7/19 | $16,569 | $15,899 | $18,026 |
|---|
| 8/19 | $16,154 | $15,648 | $17,888 |
|---|
| 9/19 | $16,065 | $15,940 | $17,890 |
|---|
| 10/19 | $16,504 | $16,286 | $18,394 |
|---|
| 11/19 | $17,222 | $16,877 | $19,210 |
|---|
| 12/19 | $17,727 | $17,386 | $19,790 |
|---|
| 1/20 | $17,987 | $17,379 | $20,232 |
|---|
| 2/20 | $16,686 | $15,949 | $18,854 |
|---|
| 3/20 | $14,811 | $13,979 | $17,000 |
|---|
| 4/20 | $17,076 | $15,771 | $19,515 |
|---|
| 5/20 | $18,293 | $16,522 | $20,825 |
|---|
| 6/20 | $19,114 | $16,850 | $21,732 |
|---|
| 7/20 | $20,259 | $17,801 | $23,404 |
|---|
| 8/20 | $22,249 | $19,080 | $25,819 |
|---|
| 9/20 | $21,271 | $18,355 | $24,604 |
|---|
| 10/20 | $20,742 | $17,867 | $23,769 |
|---|
| 11/20 | $23,249 | $19,823 | $26,203 |
|---|
| 12/20 | $24,259 | $20,585 | $27,408 |
|---|
| 1/21 | $24,006 | $20,377 | $27,205 |
|---|
| 2/21 | $24,756 | $20,939 | $27,199 |
|---|
| 3/21 | $24,806 | $21,856 | $27,666 |
|---|
| 4/21 | $26,229 | $23,022 | $29,548 |
|---|
| 5/21 | $26,040 | $23,183 | $29,140 |
|---|
| 6/21 | $27,281 | $23,724 | $30,968 |
|---|
| 7/21 | $27,793 | $24,288 | $31,988 |
|---|
| 8/21 | $28,641 | $25,026 | $33,184 |
|---|
| 9/21 | $26,868 | $23,863 | $31,326 |
|---|
| 10/21 | $28,494 | $25,534 | $34,039 |
|---|
| 11/21 | $28,199 | $25,357 | $34,247 |
|---|
| 12/21 | $28,941 | $26,494 | $34,971 |
|---|
| 1/22 | $26,535 | $25,123 | $31,970 |
|---|
| 2/22 | $25,176 | $24,371 | $30,612 |
|---|
| 3/22 | $25,543 | $25,276 | $31,809 |
|---|
| 4/22 | $22,587 | $23,071 | $27,968 |
|---|
| 5/22 | $22,267 | $23,114 | $27,318 |
|---|
| 6/22 | $20,472 | $21,206 | $25,154 |
|---|
| 7/22 | $22,725 | $23,161 | $28,173 |
|---|
| 8/22 | $21,518 | $22,217 | $26,861 |
|---|
| 9/22 | $19,487 | $20,170 | $24,249 |
|---|
| 10/22 | $20,808 | $21,804 | $25,667 |
|---|
| 11/22 | $21,870 | $23,022 | $26,836 |
|---|
| 12/22 | $20,310 | $21,696 | $24,782 |
|---|
| 1/23 | $21,926 | $23,059 | $26,847 |
|---|
| 2/23 | $21,166 | $22,496 | $26,528 |
|---|
| 3/23 | $22,774 | $23,322 | $28,342 |
|---|
| 4/23 | $23,089 | $23,686 | $28,621 |
|---|
| 5/23 | $23,978 | $23,789 | $29,926 |
|---|
| 6/23 | $25,504 | $25,361 | $31,972 |
|---|
| 7/23 | $26,450 | $26,176 | $33,050 |
|---|
| 8/23 | $26,215 | $25,759 | $32,753 |
|---|
| 9/23 | $24,664 | $24,531 | $30,972 |
|---|
| 10/23 | $24,333 | $24,015 | $30,531 |
|---|
| 11/23 | $26,959 | $26,208 | $33,859 |
|---|
| 12/23 | $28,035 | $27,399 | $35,358 |
|---|
| 1/24 | $29,083 | $27,859 | $36,240 |
|---|
| 2/24 | $31,110 | $29,347 | $38,713 |
|---|
| 3/24 | $31,554 | $30,291 | $39,394 |
|---|
| 4/24 | $30,141 | $29,054 | $37,723 |
|---|
| 5/24 | $32,159 | $30,494 | $39,981 |
|---|
| 6/24 | $34,452 | $31,589 | $42,677 |
|---|
| 7/24 | $33,812 | $31,973 | $41,951 |
|---|
| 8/24 | $34,585 | $32,749 | $42,825 |
|---|
| 9/24 | $35,163 | $33,448 | $44,038 |
|---|
| 10/24 | $34,994 | $33,145 | $43,893 |
|---|
| 11/24 | $36,968 | $35,090 | $46,740 |
|---|
| 12/24 | $37,028 | $34,254 | $47,152 |
|---|
Average Annual Total Returns (%)Footnote Reference1
| Fund | 1 Year | 5 Years | 10 Years |
|---|
| Class R | 32.10% | 15.85% | 13.97% |
|---|
S&P 500® Index | 25.02% | 14.51% | 13.09% |
|---|
Russell 1000® Growth Index | 33.36% | 18.94% | 16.76% |
|---|
| Footnote | Description |
Footnote1 | In accordance with regulatory changes requiring the Fund's primary benchmark to represent the overall applicable market, the Fund's primary prospectus benchmark changed to the S&P 500® Index effective May 1, 2024. |
Performance does not reflect the deduction of taxes that a shareholder would pay on Fund distributions or redemption of Fund shares. Performance assumes that all dividends and distributions, if any, were reinvested. For more recent performance information, visit www.eatonvance.com/performance.php.
THE FUND'S PAST PERFORMANCE IS NO GUARANTEE OF FUTURE RESULTS.
| Total Net Assets | $431,912,057 |
|---|
| # of Portfolio Holdings | 49 |
|---|
| Portfolio Turnover Rate | 18% |
|---|
| Total Advisory Fees Paid | $2,655,868 |
|---|
What did the Fund invest in?
The following tables reflect what the Fund invested in as of the report date.
Sector Allocation (% of total investments)
| Value | Value |
|---|
| Short-Term Investments | 0.8% |
| Real Estate | 1.5% |
| Consumer Staples | 4.3% |
| Health Care | 5.3% |
| Financials | 6.5% |
| Industrials | 6.8% |
| Consumer Discretionary | 13.4% |
| Communication Services | 14.0% |
| Information Technology | 47.4% |
Top Ten Holdings (% of total investments)Footnote Referencea
| NVIDIA Corp. | 12.7% |
| Microsoft Corp. | 9.0% |
| Amazon.com, Inc. | 8.7% |
| Apple, Inc. | 8.1% |
| Alphabet, Inc., Class A | 5.6% |
| Broadcom, Inc. | 4.2% |
| Meta Platforms, Inc., Class A | 3.5% |
| Alphabet, Inc., Class C | 2.6% |
| Eli Lilly & Co. | 2.6% |
| Intuit, Inc. | 2.4% |
| Total | 59.4% |
| Footnote | Description |
Footnotea | Excluding cash equivalents |
If you wish to view additional information about the Fund, including the prospectus, statement of additional information, financial statements and holdings, please scan the QR code or visit www.eatonvance.com/open-end-mutual-fund-documents.php. For proxy information, please visit www.eatonvance.com/proxyvoting.
The Funds may deliver a single copy of certain required shareholder documents (including prospectuses, shareholder reports, and proxy materials) to investors with the same last name and the same address. Your participation will continue indefinitely unless you instruct otherwise by calling 1-800-262-1122 or by contacting your financial intermediary. Your instruction will typically be effective within 30 days of receipt.
Not FDIC Insured | May Lose Value | No Bank Guarantee
Annual Shareholder Report December 31, 2024
Eaton Vance Large-Cap Value Fund
Annual Shareholder Report December 31, 2024
This annual shareholder report contains important information about the Eaton Vance Large-Cap Value Fund for the period of January 1, 2024 to December 31, 2024. You can find additional information about the Fund at www.eatonvance.com/open-end-mutual-fund-documents.php. You can also request this information by contacting us at 1-800-262-1122.
What were the Fund costs for the last year?
(based on a hypothetical $10,000 investment)
| Class Name | Costs of a $10,000 investment | Costs paid as a percentage of a $10,000 investment |
|---|
| Class A | $106 | 1.00% |
|---|
How did the Fund perform last year and what affected its performance?
Key contributors to (↑) and detractors from (↓) performance, relative to the Russell 1000® Value Index (the Index):
↓ An overweight position in discount chain Dollar Tree Inc. ― sold by period-end ― lost value over concerns about competition, product theft, and firm strategy
↓ An overweight position in agricultural chemical firm FMC Corp. declined in value due to excess inventory and struggles in its Asian and South American markets
↓ An overweight position in analog chipmaker ON Semiconductor Corp. lost value due to softening demand, particularly among automotive and industrial customers
↓ Among sectors, stock selections in consumer staples and energy, along with stock selections and an underweight position in financials, hurt relative returns
↑ An overweight position in international broker/dealer Interactive Brokers Group Inc. doubled in value on strong account growth, commission revenues, and margins
↑ An overweight position in conglomerate 3M Co. grew in value as it settled class-action suits, spun off its health care business, and hired a new CEO and CFO
↑ Not owning Index position and chipmaker Intel Corp. aided returns as its price declined over concerns about increasing competition in sales for AI applications
↑ Among sectors, stock selections in health care and communication services, and an overweight position in utilities contributed to Index-relative returns
Comparison of the change in value of a $10,000 investment for the period indicated.

| Class A with Maximum Sales Charge | Russell 3000® Index | Russell 1000® Value Index |
|---|
| 12/14 | $10,000 | $10,000 | $10,000 |
|---|
| 1/15 | $9,257 | $9,722 | $9,600 |
|---|
| 2/15 | $9,687 | $10,285 | $10,065 |
|---|
| 3/15 | $9,597 | $10,180 | $9,928 |
|---|
| 4/15 | $9,689 | $10,226 | $10,021 |
|---|
| 5/15 | $9,801 | $10,368 | $10,141 |
|---|
| 6/15 | $9,533 | $10,194 | $9,939 |
|---|
| 7/15 | $9,667 | $10,365 | $9,982 |
|---|
| 8/15 | $9,094 | $9,739 | $9,388 |
|---|
| 9/15 | $8,794 | $9,455 | $9,104 |
|---|
| 10/15 | $9,468 | $10,202 | $9,791 |
|---|
| 11/15 | $9,540 | $10,258 | $9,829 |
|---|
| 12/15 | $9,373 | $10,048 | $9,617 |
|---|
| 1/16 | $8,929 | $9,481 | $9,120 |
|---|
| 2/16 | $8,822 | $9,478 | $9,118 |
|---|
| 3/16 | $9,345 | $10,145 | $9,775 |
|---|
| 4/16 | $9,413 | $10,208 | $9,980 |
|---|
| 5/16 | $9,520 | $10,391 | $10,135 |
|---|
| 6/16 | $9,514 | $10,412 | $10,223 |
|---|
| 7/16 | $9,763 | $10,825 | $10,520 |
|---|
| 8/16 | $9,775 | $10,853 | $10,601 |
|---|
| 9/16 | $9,684 | $10,870 | $10,579 |
|---|
| 10/16 | $9,503 | $10,635 | $10,415 |
|---|
| 11/16 | $9,928 | $11,111 | $11,010 |
|---|
| 12/16 | $10,269 | $11,327 | $11,285 |
|---|
| 1/17 | $10,332 | $11,541 | $11,365 |
|---|
| 2/17 | $10,668 | $11,970 | $11,774 |
|---|
| 3/17 | $10,542 | $11,978 | $11,654 |
|---|
| 4/17 | $10,537 | $12,105 | $11,632 |
|---|
| 5/17 | $10,502 | $12,229 | $11,621 |
|---|
| 6/17 | $10,691 | $12,339 | $11,811 |
|---|
| 7/17 | $10,765 | $12,572 | $11,967 |
|---|
| 8/17 | $10,645 | $12,596 | $11,828 |
|---|
| 9/17 | $11,047 | $12,903 | $12,178 |
|---|
| 10/17 | $11,145 | $13,185 | $12,267 |
|---|
| 11/17 | $11,547 | $13,585 | $12,642 |
|---|
| 12/17 | $11,789 | $13,721 | $12,827 |
|---|
| 1/18 | $12,212 | $14,444 | $13,323 |
|---|
| 2/18 | $11,645 | $13,912 | $12,687 |
|---|
| 3/18 | $11,522 | $13,633 | $12,464 |
|---|
| 4/18 | $11,704 | $13,684 | $12,505 |
|---|
| 5/18 | $11,710 | $14,071 | $12,579 |
|---|
| 6/18 | $11,807 | $14,163 | $12,610 |
|---|
| 7/18 | $12,414 | $14,633 | $13,109 |
|---|
| 8/18 | $12,670 | $15,147 | $13,303 |
|---|
| 9/18 | $12,725 | $15,172 | $13,329 |
|---|
| 10/18 | $11,914 | $14,055 | $12,639 |
|---|
| 11/18 | $12,160 | $14,336 | $13,016 |
|---|
| 12/18 | $10,985 | $13,002 | $11,767 |
|---|
| 1/19 | $11,837 | $14,118 | $12,682 |
|---|
| 2/19 | $12,263 | $14,614 | $13,088 |
|---|
| 3/19 | $12,377 | $14,828 | $13,171 |
|---|
| 4/19 | $13,071 | $15,420 | $13,638 |
|---|
| 5/19 | $12,223 | $14,422 | $12,761 |
|---|
| 6/19 | $13,092 | $15,435 | $13,677 |
|---|
| 7/19 | $13,273 | $15,664 | $13,791 |
|---|
| 8/19 | $12,938 | $15,345 | $13,385 |
|---|
| 9/19 | $13,273 | $15,614 | $13,863 |
|---|
| 10/19 | $13,401 | $15,951 | $14,056 |
|---|
| 11/19 | $13,898 | $16,557 | $14,491 |
|---|
| 12/19 | $14,257 | $17,035 | $14,890 |
|---|
| 1/20 | $14,006 | $17,016 | $14,569 |
|---|
| 2/20 | $12,599 | $15,623 | $13,158 |
|---|
| 3/20 | $10,480 | $13,475 | $10,910 |
|---|
| 4/20 | $11,674 | $15,259 | $12,136 |
|---|
| 5/20 | $12,069 | $16,075 | $12,552 |
|---|
| 6/20 | $11,944 | $16,443 | $12,469 |
|---|
| 7/20 | $12,457 | $17,376 | $12,962 |
|---|
| 8/20 | $12,943 | $18,635 | $13,497 |
|---|
| 9/20 | $12,597 | $17,957 | $13,166 |
|---|
| 10/20 | $12,487 | $17,569 | $12,993 |
|---|
| 11/20 | $14,112 | $19,707 | $14,741 |
|---|
| 12/20 | $14,583 | $20,593 | $15,306 |
|---|
| 1/21 | $14,375 | $20,501 | $15,166 |
|---|
| 2/21 | $15,298 | $21,142 | $16,082 |
|---|
| 3/21 | $16,181 | $21,900 | $17,028 |
|---|
| 4/21 | $16,836 | $23,029 | $17,709 |
|---|
| 5/21 | $17,128 | $23,134 | $18,123 |
|---|
| 6/21 | $16,918 | $23,705 | $17,915 |
|---|
| 7/21 | $17,009 | $24,105 | $18,059 |
|---|
| 8/21 | $17,288 | $24,793 | $18,417 |
|---|
| 9/21 | $16,715 | $23,681 | $17,776 |
|---|
| 10/21 | $17,645 | $25,282 | $18,678 |
|---|
| 11/21 | $16,925 | $24,897 | $18,020 |
|---|
| 12/21 | $18,125 | $25,877 | $19,157 |
|---|
| 1/22 | $18,058 | $24,355 | $18,711 |
|---|
| 2/22 | $18,088 | $23,741 | $18,493 |
|---|
| 3/22 | $18,516 | $24,512 | $19,015 |
|---|
| 4/22 | $17,444 | $22,312 | $17,943 |
|---|
| 5/22 | $17,819 | $22,282 | $18,292 |
|---|
| 6/22 | $16,435 | $20,418 | $16,694 |
|---|
| 7/22 | $17,463 | $22,333 | $17,801 |
|---|
| 8/22 | $17,035 | $21,500 | $17,270 |
|---|
| 9/22 | $15,807 | $19,506 | $15,756 |
|---|
| 10/22 | $17,553 | $21,106 | $17,371 |
|---|
| 11/22 | $18,442 | $22,208 | $18,457 |
|---|
| 12/22 | $17,622 | $20,907 | $17,713 |
|---|
| 1/23 | $18,392 | $22,347 | $18,631 |
|---|
| 2/23 | $17,801 | $21,825 | $17,974 |
|---|
| 3/23 | $17,396 | $22,408 | $17,891 |
|---|
| 4/23 | $17,802 | $22,647 | $18,161 |
|---|
| 5/23 | $17,138 | $22,735 | $17,460 |
|---|
| 6/23 | $18,045 | $24,288 | $18,620 |
|---|
| 7/23 | $18,757 | $25,158 | $19,275 |
|---|
| 8/23 | $18,186 | $24,673 | $18,754 |
|---|
| 9/23 | $17,486 | $23,497 | $18,031 |
|---|
| 10/23 | $16,748 | $22,875 | $17,395 |
|---|
| 11/23 | $17,870 | $25,008 | $18,707 |
|---|
| 12/23 | $19,017 | $26,334 | $19,743 |
|---|
| 1/24 | $18,703 | $26,626 | $19,764 |
|---|
| 2/24 | $19,538 | $28,067 | $20,493 |
|---|
| 3/24 | $20,509 | $28,973 | $21,517 |
|---|
| 4/24 | $20,075 | $27,698 | $20,598 |
|---|
| 5/24 | $20,614 | $29,006 | $21,251 |
|---|
| 6/24 | $20,322 | $29,904 | $21,051 |
|---|
| 7/24 | $21,056 | $30,460 | $22,127 |
|---|
| 8/24 | $21,282 | $31,123 | $22,721 |
|---|
| 9/24 | $21,634 | $31,767 | $23,036 |
|---|
| 10/24 | $21,334 | $31,534 | $22,783 |
|---|
| 11/24 | $22,726 | $33,632 | $24,238 |
|---|
| 12/24 | $21,198 | $32,604 | $22,580 |
|---|
Average Annual Total Returns (%)Footnote Reference1
| Fund | 1 Year | 5 Years | 10 Years |
|---|
| Class A | 11.49% | 8.25% | 8.38% |
|---|
| Class A with 5.25% Maximum Sales Charge | 5.65% | 7.09% | 7.80% |
|---|
Russell 3000® Index | 23.81% | 13.85% | 12.53% |
|---|
Russell 1000® Value Index | 14.37% | 8.67% | 8.48% |
|---|
| Footnote | Description |
Footnote1 | In accordance with regulatory changes requiring the Fund's primary benchmark to represent the overall applicable market, the Fund's primary prospectus benchmark changed to the Russell 3000® Index effective May 1, 2024. |
Performance does not reflect the deduction of taxes that a shareholder would pay on Fund distributions or redemption of Fund shares. Performance assumes that all dividends and distributions, if any, were reinvested. For more recent performance information, visit www.eatonvance.com/performance.php.
THE FUND'S PAST PERFORMANCE IS NO GUARANTEE OF FUTURE RESULTS.
| Total Net Assets | $1,449,359,065 |
|---|
| # of Portfolio Holdings | 66 |
|---|
| Portfolio Turnover Rate | 75% |
|---|
| Total Advisory Fees Paid | $9,249,241 |
|---|
What did the Fund invest in?
The following tables reflect what the Fund invested in as of the report date.
Sector Allocation (% of total investments)
| Value | Value |
|---|
| Short-Term Investments | 0.9% |
| Materials | 4.1% |
| Communication Services | 4.7% |
| Real Estate | 5.1% |
| Consumer Discretionary | 5.2% |
| Utilities | 5.8% |
| Energy | 6.7% |
| Consumer Staples | 6.9% |
| Information Technology | 7.1% |
| Industrials | 16.0% |
| Health Care | 18.7% |
| Financials | 18.8% |
Top Ten Holdings (% of total investments)Footnote Referencea
| Wells Fargo & Co. | 3.0% |
| Bristol-Myers Squibb Co. | 2.9% |
| Walt Disney Co. | 2.8% |
| American International Group, Inc. | 2.6% |
| Cisco Systems, Inc. | 2.6% |
| Bank of America Corp. | 2.5% |
| Emerson Electric Co. | 2.5% |
| Reinsurance Group of America, Inc. | 2.5% |
| AbbVie, Inc. | 2.4% |
| UnitedHealth Group, Inc. | 2.4% |
| Total | 26.2% |
| Footnote | Description |
Footnotea | Excluding cash equivalents |
If you wish to view additional information about the Fund, including the prospectus, statement of additional information, financial statements and holdings, please scan the QR code or visit www.eatonvance.com/open-end-mutual-fund-documents.php. For proxy information, please visit www.eatonvance.com/proxyvoting.
The Funds may deliver a single copy of certain required shareholder documents (including prospectuses, shareholder reports, and proxy materials) to investors with the same last name and the same address. Your participation will continue indefinitely unless you instruct otherwise by calling 1-800-262-1122 or by contacting your financial intermediary. Your instruction will typically be effective within 30 days of receipt.
Not FDIC Insured | May Lose Value | No Bank Guarantee
Annual Shareholder Report December 31, 2024
Eaton Vance Large-Cap Value Fund
Annual Shareholder Report December 31, 2024
This annual shareholder report contains important information about the Eaton Vance Large-Cap Value Fund for the period of January 1, 2024 to December 31, 2024. You can find additional information about the Fund at www.eatonvance.com/open-end-mutual-fund-documents.php. You can also request this information by contacting us at 1-800-262-1122.
What were the Fund costs for the last year?
(based on a hypothetical $10,000 investment)
| Class Name | Costs of a $10,000 investment | Costs paid as a percentage of a $10,000 investment |
|---|
| Class C | $184 | 1.75% |
|---|
How did the Fund perform last year and what affected its performance?
Key contributors to (↑) and detractors from (↓) performance, relative to the Russell 1000® Value Index (the Index):
↓ An overweight position in discount chain Dollar Tree Inc. ― sold by period-end ― lost value over concerns about competition, product theft, and firm strategy
↓ An overweight position in agricultural chemical firm FMC Corp. declined in value due to excess inventory and struggles in its Asian and South American markets
↓ An overweight position in analog chipmaker ON Semiconductor Corp. lost value due to softening demand, particularly among automotive and industrial customers
↓ Among sectors, stock selections in consumer staples and energy, along with stock selections and an underweight position in financials, hurt relative returns
↑ An overweight position in international broker/dealer Interactive Brokers Group Inc. doubled in value on strong account growth, commission revenues, and margins
↑ An overweight position in conglomerate 3M Co. grew in value as it settled class-action suits, spun off its health care business, and hired a new CEO and CFO
↑ Not owning Index position and chipmaker Intel Corp. aided returns as its price declined over concerns about increasing competition in sales for AI applications
↑ Among sectors, stock selections in health care and communication services, and an overweight position in utilities contributed to Index-relative returns
Comparison of the change in value of a $10,000 investment for the period indicated.
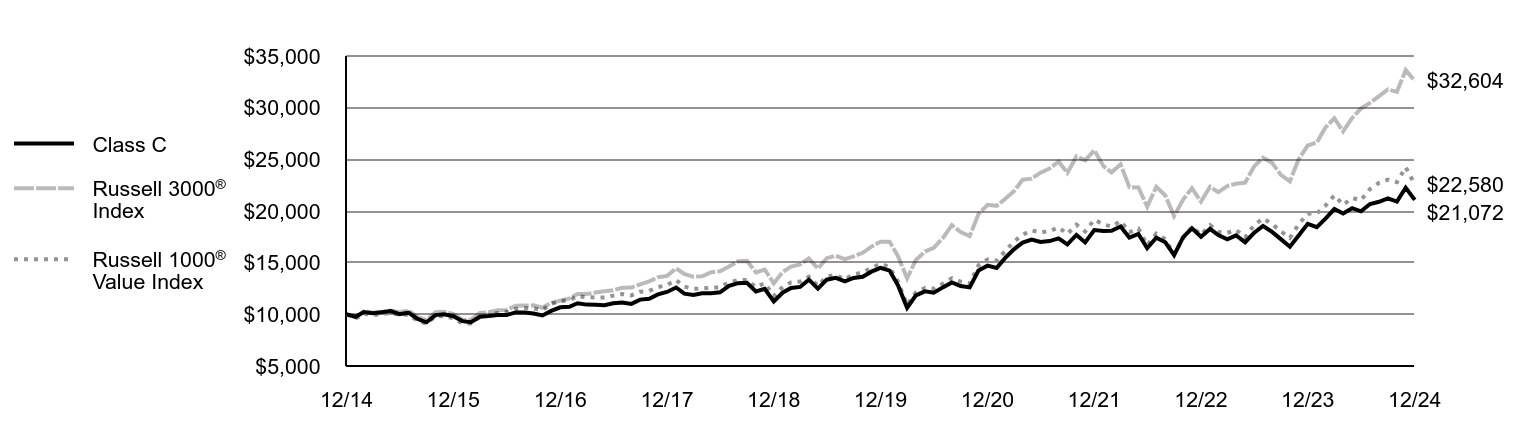
| Class C | Russell 3000® Index | Russell 1000® Value Index |
|---|
| 12/14 | $10,000 | $10,000 | $10,000 |
|---|
| 1/15 | $9,765 | $9,722 | $9,600 |
|---|
| 2/15 | $10,213 | $10,285 | $10,065 |
|---|
| 3/15 | $10,109 | $10,180 | $9,928 |
|---|
| 4/15 | $10,200 | $10,226 | $10,021 |
|---|
| 5/15 | $10,313 | $10,368 | $10,141 |
|---|
| 6/15 | $10,022 | $10,194 | $9,939 |
|---|
| 7/15 | $10,158 | $10,365 | $9,982 |
|---|
| 8/15 | $9,550 | $9,739 | $9,388 |
|---|
| 9/15 | $9,227 | $9,455 | $9,104 |
|---|
| 10/15 | $9,928 | $10,202 | $9,791 |
|---|
| 11/15 | $9,999 | $10,258 | $9,829 |
|---|
| 12/15 | $9,818 | $10,048 | $9,617 |
|---|
| 1/16 | $9,342 | $9,481 | $9,120 |
|---|
| 2/16 | $9,230 | $9,478 | $9,118 |
|---|
| 3/16 | $9,773 | $10,145 | $9,775 |
|---|
| 4/16 | $9,832 | $10,208 | $9,980 |
|---|
| 5/16 | $9,938 | $10,391 | $10,135 |
|---|
| 6/16 | $9,924 | $10,412 | $10,223 |
|---|
| 7/16 | $10,184 | $10,825 | $10,520 |
|---|
| 8/16 | $10,184 | $10,853 | $10,601 |
|---|
| 9/16 | $10,082 | $10,870 | $10,579 |
|---|
| 10/16 | $9,893 | $10,635 | $10,415 |
|---|
| 11/16 | $10,330 | $11,111 | $11,010 |
|---|
| 12/16 | $10,676 | $11,327 | $11,285 |
|---|
| 1/17 | $10,735 | $11,541 | $11,365 |
|---|
| 2/17 | $11,078 | $11,970 | $11,774 |
|---|
| 3/17 | $10,940 | $11,978 | $11,654 |
|---|
| 4/17 | $10,928 | $12,105 | $11,632 |
|---|
| 5/17 | $10,887 | $12,229 | $11,621 |
|---|
| 6/17 | $11,071 | $12,339 | $11,811 |
|---|
| 7/17 | $11,142 | $12,572 | $11,967 |
|---|
| 8/17 | $11,012 | $12,596 | $11,828 |
|---|
| 9/17 | $11,423 | $12,903 | $12,178 |
|---|
| 10/17 | $11,512 | $13,185 | $12,267 |
|---|
| 11/17 | $11,928 | $13,585 | $12,642 |
|---|
| 12/17 | $12,166 | $13,721 | $12,827 |
|---|
| 1/18 | $12,596 | $14,444 | $13,323 |
|---|
| 2/18 | $12,005 | $13,912 | $12,687 |
|---|
| 3/18 | $11,864 | $13,633 | $12,464 |
|---|
| 4/18 | $12,045 | $13,684 | $12,505 |
|---|
| 5/18 | $12,051 | $14,071 | $12,579 |
|---|
| 6/18 | $12,133 | $14,163 | $12,610 |
|---|
| 7/18 | $12,757 | $14,633 | $13,109 |
|---|
| 8/18 | $13,013 | $15,147 | $13,303 |
|---|
| 9/18 | $13,057 | $15,172 | $13,329 |
|---|
| 10/18 | $12,214 | $14,055 | $12,639 |
|---|
| 11/18 | $12,465 | $14,336 | $13,016 |
|---|
| 12/18 | $11,250 | $13,002 | $11,767 |
|---|
| 1/19 | $12,115 | $14,118 | $12,682 |
|---|
| 2/19 | $12,544 | $14,614 | $13,088 |
|---|
| 3/19 | $12,653 | $14,828 | $13,171 |
|---|
| 4/19 | $13,355 | $15,420 | $13,638 |
|---|
| 5/19 | $12,483 | $14,422 | $12,761 |
|---|
| 6/19 | $13,355 | $15,435 | $13,677 |
|---|
| 7/19 | $13,532 | $15,664 | $13,791 |
|---|
| 8/19 | $13,184 | $15,345 | $13,385 |
|---|
| 9/19 | $13,523 | $15,614 | $13,863 |
|---|
| 10/19 | $13,638 | $15,951 | $14,056 |
|---|
| 11/19 | $14,130 | $16,557 | $14,491 |
|---|
| 12/19 | $14,492 | $17,035 | $14,890 |
|---|
| 1/20 | $14,231 | $17,016 | $14,569 |
|---|
| 2/20 | $12,792 | $15,623 | $13,158 |
|---|
| 3/20 | $10,636 | $13,475 | $10,910 |
|---|
| 4/20 | $11,835 | $15,259 | $12,136 |
|---|
| 5/20 | $12,228 | $16,075 | $12,552 |
|---|
| 6/20 | $12,098 | $16,443 | $12,469 |
|---|
| 7/20 | $12,608 | $17,376 | $12,962 |
|---|
| 8/20 | $13,092 | $18,635 | $13,497 |
|---|
| 9/20 | $12,735 | $17,957 | $13,166 |
|---|
| 10/20 | $12,610 | $17,569 | $12,993 |
|---|
| 11/20 | $14,246 | $19,707 | $14,741 |
|---|
| 12/20 | $14,712 | $20,593 | $15,306 |
|---|
| 1/21 | $14,489 | $20,501 | $15,166 |
|---|
| 2/21 | $15,417 | $21,142 | $16,082 |
|---|
| 3/21 | $16,294 | $21,900 | $17,028 |
|---|
| 4/21 | $16,943 | $23,029 | $17,709 |
|---|
| 5/21 | $17,229 | $23,134 | $18,123 |
|---|
| 6/21 | $17,002 | $23,705 | $17,915 |
|---|
| 7/21 | $17,086 | $24,105 | $18,059 |
|---|
| 8/21 | $17,351 | $24,793 | $18,417 |
|---|
| 9/21 | $16,773 | $23,681 | $17,776 |
|---|
| 10/21 | $17,688 | $25,282 | $18,678 |
|---|
| 11/21 | $16,961 | $24,897 | $18,020 |
|---|
| 12/21 | $18,153 | $25,877 | $19,157 |
|---|
| 1/22 | $18,071 | $24,355 | $18,711 |
|---|
| 2/22 | $18,094 | $23,741 | $18,493 |
|---|
| 3/22 | $18,500 | $24,512 | $19,015 |
|---|
| 4/22 | $17,420 | $22,312 | $17,943 |
|---|
| 5/22 | $17,785 | $22,282 | $18,292 |
|---|
| 6/22 | $16,398 | $20,418 | $16,694 |
|---|
| 7/22 | $17,412 | $22,333 | $17,801 |
|---|
| 8/22 | $16,972 | $21,500 | $17,270 |
|---|
| 9/22 | $15,738 | $19,506 | $15,756 |
|---|
| 10/22 | $17,467 | $21,106 | $17,371 |
|---|
| 11/22 | $18,332 | $22,208 | $18,457 |
|---|
| 12/22 | $17,512 | $20,907 | $17,713 |
|---|
| 1/23 | $18,266 | $22,347 | $18,631 |
|---|
| 2/23 | $17,666 | $21,825 | $17,974 |
|---|
| 3/23 | $17,262 | $22,408 | $17,891 |
|---|
| 4/23 | $17,647 | $22,647 | $18,161 |
|---|
| 5/23 | $16,977 | $22,735 | $17,460 |
|---|
| 6/23 | $17,867 | $24,288 | $18,620 |
|---|
| 7/23 | $18,553 | $25,158 | $19,275 |
|---|
| 8/23 | $17,983 | $24,673 | $18,754 |
|---|
| 9/23 | $17,275 | $23,497 | $18,031 |
|---|
| 10/23 | $16,543 | $22,875 | $17,395 |
|---|
| 11/23 | $17,637 | $25,008 | $18,707 |
|---|
| 12/23 | $18,757 | $26,334 | $19,743 |
|---|
| 1/24 | $18,435 | $26,626 | $19,764 |
|---|
| 2/24 | $19,245 | $28,067 | $20,493 |
|---|
| 3/24 | $20,189 | $28,973 | $21,517 |
|---|
| 4/24 | $19,757 | $27,698 | $20,598 |
|---|
| 5/24 | $20,268 | $29,006 | $21,251 |
|---|
| 6/24 | $19,967 | $29,904 | $21,051 |
|---|
| 7/24 | $20,676 | $30,460 | $22,127 |
|---|
| 8/24 | $20,889 | $31,123 | $22,721 |
|---|
| 9/24 | $21,215 | $31,767 | $23,036 |
|---|
| 10/24 | $20,915 | $31,534 | $22,783 |
|---|
| 11/24 | $22,255 | $33,632 | $24,238 |
|---|
| 12/24 | $21,072 | $32,604 | $22,580 |
|---|
Average Annual Total Returns (%)Footnote Reference1
| Fund | 1 Year | 5 Years | 10 Years |
|---|
| Class C, with conversion to Class A after 8 years | 10.68% | 7.45% | 7.73% |
|---|
| Class C, with 1% Maximum Deferred Sales Charge and conversion to Class A after 8 years | 9.68% | 7.45% | 7.73% |
|---|
Russell 3000® Index | 23.81% | 13.85% | 12.53% |
|---|
Russell 1000® Value Index | 14.37% | 8.67% | 8.48% |
|---|
| Footnote | Description |
Footnote1 | In accordance with regulatory changes requiring the Fund's primary benchmark to represent the overall applicable market, the Fund's primary prospectus benchmark changed to the Russell 3000® Index effective May 1, 2024. |
Performance does not reflect the deduction of taxes that a shareholder would pay on Fund distributions or redemption of Fund shares. Performance assumes that all dividends and distributions, if any, were reinvested. For more recent performance information, visit www.eatonvance.com/performance.php.
THE FUND'S PAST PERFORMANCE IS NO GUARANTEE OF FUTURE RESULTS.
| Total Net Assets | $1,449,359,065 |
|---|
| # of Portfolio Holdings | 66 |
|---|
| Portfolio Turnover Rate | 75% |
|---|
| Total Advisory Fees Paid | $9,249,241 |
|---|
What did the Fund invest in?
The following tables reflect what the Fund invested in as of the report date.
Sector Allocation (% of total investments)
| Value | Value |
|---|
| Short-Term Investments | 0.9% |
| Materials | 4.1% |
| Communication Services | 4.7% |
| Real Estate | 5.1% |
| Consumer Discretionary | 5.2% |
| Utilities | 5.8% |
| Energy | 6.7% |
| Consumer Staples | 6.9% |
| Information Technology | 7.1% |
| Industrials | 16.0% |
| Health Care | 18.7% |
| Financials | 18.8% |
Top Ten Holdings (% of total investments)Footnote Referencea
| Wells Fargo & Co. | 3.0% |
| Bristol-Myers Squibb Co. | 2.9% |
| Walt Disney Co. | 2.8% |
| American International Group, Inc. | 2.6% |
| Cisco Systems, Inc. | 2.6% |
| Bank of America Corp. | 2.5% |
| Emerson Electric Co. | 2.5% |
| Reinsurance Group of America, Inc. | 2.5% |
| AbbVie, Inc. | 2.4% |
| UnitedHealth Group, Inc. | 2.4% |
| Total | 26.2% |
| Footnote | Description |
Footnotea | Excluding cash equivalents |
If you wish to view additional information about the Fund, including the prospectus, statement of additional information, financial statements and holdings, please scan the QR code or visit www.eatonvance.com/open-end-mutual-fund-documents.php. For proxy information, please visit www.eatonvance.com/proxyvoting.
The Funds may deliver a single copy of certain required shareholder documents (including prospectuses, shareholder reports, and proxy materials) to investors with the same last name and the same address. Your participation will continue indefinitely unless you instruct otherwise by calling 1-800-262-1122 or by contacting your financial intermediary. Your instruction will typically be effective within 30 days of receipt.
Not FDIC Insured | May Lose Value | No Bank Guarantee
Annual Shareholder Report December 31, 2024
Eaton Vance Large-Cap Value Fund
Annual Shareholder Report December 31, 2024
This annual shareholder report contains important information about the Eaton Vance Large-Cap Value Fund for the period of January 1, 2024 to December 31, 2024. You can find additional information about the Fund at www.eatonvance.com/open-end-mutual-fund-documents.php. You can also request this information by contacting us at 1-800-262-1122.
What were the Fund costs for the last year?
(based on a hypothetical $10,000 investment)
| Class Name | Costs of a $10,000 investment | Costs paid as a percentage of a $10,000 investment |
|---|
| Class I | $79 | 0.75% |
|---|
How did the Fund perform last year and what affected its performance?
Key contributors to (↑) and detractors from (↓) performance, relative to the Russell 1000® Value Index (the Index):
↓ An overweight position in discount chain Dollar Tree Inc. ― sold by period-end ― lost value over concerns about competition, product theft, and firm strategy
↓ An overweight position in agricultural chemical firm FMC Corp. declined in value due to excess inventory and struggles in its Asian and South American markets
↓ An overweight position in analog chipmaker ON Semiconductor Corp. lost value due to softening demand, particularly among automotive and industrial customers
↓ Among sectors, stock selections in consumer staples and energy, along with stock selections and an underweight position in financials, hurt relative returns
↑ An overweight position in international broker/dealer Interactive Brokers Group Inc. doubled in value on strong account growth, commission revenues, and margins
↑ An overweight position in conglomerate 3M Co. grew in value as it settled class-action suits, spun off its health care business, and hired a new CEO and CFO
↑ Not owning Index position and chipmaker Intel Corp. aided returns as its price declined over concerns about increasing competition in sales for AI applications
↑ Among sectors, stock selections in health care and communication services, and an overweight position in utilities contributed to Index-relative returns
Comparison of the change in value of a $1,000,000 investment for the period indicated.
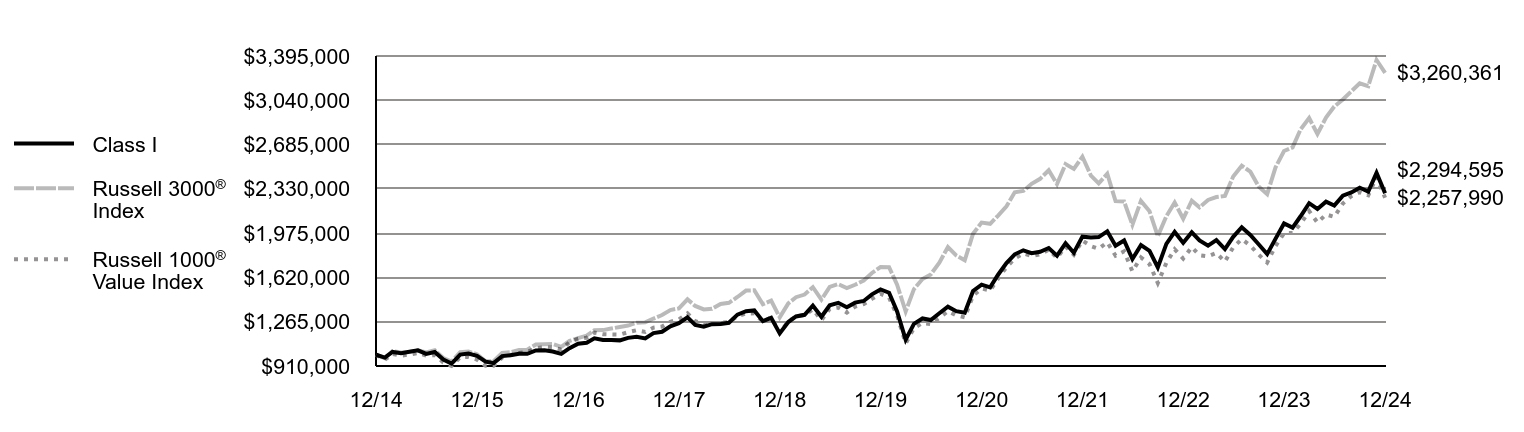
| Class I | Russell 3000® Index | Russell 1000® Value Index |
|---|
| 12/14 | $1,000,000 | $1,000,000 | $1,000,000 |
|---|
| 1/15 | $977,648 | $972,168 | $960,027 |
|---|
| 2/15 | $1,022,885 | $1,028,458 | $1,006,482 |
|---|
| 3/15 | $1,013,346 | $1,018,003 | $992,781 |
|---|
| 4/15 | $1,023,498 | $1,022,607 | $1,002,063 |
|---|
| 5/15 | $1,035,338 | $1,036,751 | $1,014,105 |
|---|
| 6/15 | $1,007,235 | $1,019,406 | $993,856 |
|---|
| 7/15 | $1,021,925 | $1,036,456 | $998,214 |
|---|
| 8/15 | $961,559 | $973,886 | $938,764 |
|---|
| 9/15 | $929,541 | $945,507 | $910,423 |
|---|
| 10/15 | $1,001,080 | $1,020,188 | $979,117 |
|---|
| 11/15 | $1,009,265 | $1,025,843 | $982,864 |
|---|
| 12/15 | $991,743 | $1,004,788 | $961,727 |
|---|
| 1/16 | $944,960 | $948,092 | $912,032 |
|---|
| 2/16 | $933,716 | $947,787 | $911,802 |
|---|
| 3/16 | $989,445 | $1,014,517 | $977,483 |
|---|
| 4/16 | $996,578 | $1,020,804 | $998,017 |
|---|
| 5/16 | $1,008,472 | $1,039,067 | $1,013,518 |
|---|
| 6/16 | $1,007,899 | $1,041,203 | $1,022,282 |
|---|
| 7/16 | $1,034,773 | $1,082,526 | $1,051,965 |
|---|
| 8/16 | $1,035,960 | $1,085,287 | $1,060,076 |
|---|
| 9/16 | $1,026,521 | $1,086,993 | $1,057,867 |
|---|
| 10/16 | $1,007,330 | $1,063,475 | $1,041,494 |
|---|
| 11/16 | $1,052,903 | $1,111,068 | $1,100,979 |
|---|
| 12/16 | $1,088,994 | $1,132,748 | $1,128,495 |
|---|
| 1/17 | $1,096,215 | $1,154,069 | $1,136,534 |
|---|
| 2/17 | $1,132,336 | $1,196,991 | $1,177,374 |
|---|
| 3/17 | $1,118,506 | $1,197,805 | $1,165,381 |
|---|
| 4/17 | $1,118,509 | $1,210,501 | $1,163,194 |
|---|
| 5/17 | $1,115,491 | $1,222,890 | $1,162,053 |
|---|
| 6/17 | $1,135,541 | $1,233,926 | $1,181,050 |
|---|
| 7/17 | $1,143,431 | $1,257,191 | $1,196,747 |
|---|
| 8/17 | $1,131,291 | $1,259,613 | $1,182,807 |
|---|
| 9/17 | $1,173,927 | $1,290,333 | $1,217,839 |
|---|
| 10/17 | $1,184,273 | $1,318,490 | $1,226,681 |
|---|
| 11/17 | $1,228,116 | $1,358,527 | $1,264,244 |
|---|
| 12/17 | $1,253,366 | $1,372,105 | $1,282,698 |
|---|
| 1/18 | $1,299,420 | $1,444,429 | $1,332,290 |
|---|
| 2/18 | $1,238,644 | $1,391,188 | $1,268,671 |
|---|
| 3/18 | $1,225,818 | $1,363,261 | $1,246,354 |
|---|
| 4/18 | $1,245,071 | $1,368,443 | $1,250,469 |
|---|
| 5/18 | $1,246,998 | $1,407,074 | $1,257,892 |
|---|
| 6/18 | $1,256,723 | $1,416,276 | $1,261,007 |
|---|
| 7/18 | $1,321,814 | $1,463,277 | $1,310,917 |
|---|
| 8/18 | $1,349,550 | $1,514,664 | $1,330,292 |
|---|
| 9/18 | $1,355,616 | $1,517,171 | $1,332,931 |
|---|
| 10/18 | $1,269,588 | $1,405,458 | $1,263,910 |
|---|
| 11/18 | $1,296,317 | $1,433,607 | $1,301,644 |
|---|
| 12/18 | $1,171,045 | $1,300,182 | $1,176,654 |
|---|
| 1/19 | $1,262,212 | $1,411,782 | $1,268,238 |
|---|
| 2/19 | $1,307,442 | $1,461,433 | $1,308,760 |
|---|
| 3/19 | $1,320,275 | $1,482,773 | $1,317,081 |
|---|
| 4/19 | $1,394,779 | $1,541,983 | $1,363,799 |
|---|
| 5/19 | $1,304,686 | $1,442,198 | $1,276,111 |
|---|
| 6/19 | $1,397,161 | $1,543,493 | $1,367,716 |
|---|
| 7/19 | $1,416,377 | $1,566,437 | $1,379,053 |
|---|
| 8/19 | $1,381,497 | $1,534,505 | $1,338,502 |
|---|
| 9/19 | $1,417,945 | $1,561,437 | $1,386,256 |
|---|
| 10/19 | $1,431,518 | $1,595,050 | $1,405,633 |
|---|
| 11/19 | $1,484,401 | $1,655,680 | $1,449,090 |
|---|
| 12/19 | $1,523,595 | $1,703,486 | $1,488,953 |
|---|
| 1/20 | $1,497,568 | $1,701,625 | $1,456,921 |
|---|
| 2/20 | $1,347,165 | $1,562,308 | $1,315,824 |
|---|
| 3/20 | $1,121,070 | $1,347,463 | $1,090,957 |
|---|
| 4/20 | $1,248,137 | $1,525,921 | $1,213,604 |
|---|
| 5/20 | $1,290,968 | $1,607,525 | $1,255,192 |
|---|
| 6/20 | $1,278,275 | $1,644,276 | $1,246,861 |
|---|
| 7/20 | $1,332,944 | $1,737,643 | $1,296,153 |
|---|
| 8/20 | $1,385,453 | $1,863,526 | $1,349,749 |
|---|
| 9/20 | $1,349,481 | $1,795,673 | $1,316,595 |
|---|
| 10/20 | $1,336,950 | $1,756,917 | $1,299,291 |
|---|
| 11/20 | $1,511,714 | $1,970,651 | $1,474,064 |
|---|
| 12/20 | $1,562,029 | $2,059,307 | $1,530,579 |
|---|
| 1/21 | $1,540,555 | $2,050,147 | $1,516,562 |
|---|
| 2/21 | $1,639,805 | $2,114,229 | $1,608,212 |
|---|
| 3/21 | $1,734,972 | $2,190,009 | $1,702,846 |
|---|
| 4/21 | $1,805,578 | $2,302,902 | $1,770,945 |
|---|
| 5/21 | $1,837,517 | $2,313,415 | $1,812,287 |
|---|
| 6/21 | $1,814,798 | $2,370,461 | $1,791,533 |
|---|
| 7/21 | $1,825,243 | $2,410,547 | $1,805,852 |
|---|
| 8/21 | $1,855,800 | $2,479,291 | $1,841,664 |
|---|
| 9/21 | $1,794,217 | $2,368,050 | $1,777,560 |
|---|
| 10/21 | $1,894,394 | $2,528,189 | $1,867,820 |
|---|
| 11/21 | $1,817,393 | $2,489,706 | $1,801,998 |
|---|
| 12/21 | $1,946,916 | $2,587,747 | $1,915,679 |
|---|
| 1/22 | $1,940,527 | $2,435,494 | $1,871,055 |
|---|
| 2/22 | $1,943,722 | $2,374,146 | $1,849,343 |
|---|
| 3/22 | $1,989,878 | $2,451,154 | $1,901,548 |
|---|
| 4/22 | $1,874,522 | $2,231,182 | $1,794,294 |
|---|
| 5/22 | $1,916,178 | $2,228,191 | $1,829,174 |
|---|
| 6/22 | $1,767,715 | $2,041,783 | $1,669,356 |
|---|
| 7/22 | $1,878,599 | $2,233,339 | $1,780,055 |
|---|
| 8/22 | $1,832,800 | $2,149,993 | $1,727,017 |
|---|
| 9/22 | $1,700,770 | $1,950,626 | $1,575,580 |
|---|
| 10/22 | $1,889,386 | $2,110,589 | $1,737,125 |
|---|
| 11/22 | $1,984,500 | $2,220,753 | $1,845,680 |
|---|
| 12/22 | $1,897,044 | $2,090,721 | $1,771,278 |
|---|
| 1/23 | $1,981,301 | $2,234,714 | $1,863,066 |
|---|
| 2/23 | $1,917,065 | $2,182,483 | $1,797,376 |
|---|
| 3/23 | $1,874,903 | $2,240,841 | $1,789,099 |
|---|
| 4/23 | $1,918,428 | $2,264,715 | $1,816,055 |
|---|
| 5/23 | $1,847,282 | $2,273,527 | $1,746,014 |
|---|
| 6/23 | $1,945,715 | $2,428,776 | $1,861,996 |
|---|
| 7/23 | $2,022,133 | $2,515,839 | $1,927,473 |
|---|
| 8/23 | $1,960,830 | $2,467,274 | $1,875,438 |
|---|
| 9/23 | $1,886,118 | $2,349,748 | $1,803,066 |
|---|
| 10/23 | $1,806,933 | $2,287,459 | $1,739,450 |
|---|
| 11/23 | $1,929,080 | $2,500,760 | $1,870,692 |
|---|
| 12/23 | $2,052,518 | $2,633,405 | $1,974,314 |
|---|
| 1/24 | $2,018,899 | $2,662,591 | $1,976,358 |
|---|
| 2/24 | $2,110,275 | $2,806,718 | $2,049,266 |
|---|
| 3/24 | $2,215,011 | $2,897,256 | $2,151,718 |
|---|
| 4/24 | $2,169,207 | $2,769,771 | $2,059,806 |
|---|
| 5/24 | $2,227,110 | $2,900,635 | $2,125,102 |
|---|
| 6/24 | $2,196,240 | $2,990,431 | $2,105,112 |
|---|
| 7/24 | $2,276,071 | $3,046,020 | $2,212,729 |
|---|
| 8/24 | $2,301,236 | $3,112,328 | $2,272,086 |
|---|
| 9/24 | $2,338,734 | $3,176,709 | $2,303,622 |
|---|
| 10/24 | $2,308,270 | $3,153,381 | $2,278,269 |
|---|
| 11/24 | $2,457,977 | $3,363,157 | $2,423,756 |
|---|
| 12/24 | $2,294,595 | $3,260,361 | $2,257,990 |
|---|
Average Annual Total Returns (%)Footnote Reference1
| Fund | 1 Year | 5 Years | 10 Years |
|---|
| Class I | 11.79% | 8.52% | 8.65% |
|---|
Russell 3000® Index | 23.81% | 13.85% | 12.53% |
|---|
Russell 1000® Value Index | 14.37% | 8.67% | 8.48% |
|---|
| Footnote | Description |
Footnote1 | In accordance with regulatory changes requiring the Fund's primary benchmark to represent the overall applicable market, the Fund's primary prospectus benchmark changed to the Russell 3000® Index effective May 1, 2024. |
Performance does not reflect the deduction of taxes that a shareholder would pay on Fund distributions or redemption of Fund shares. Performance assumes that all dividends and distributions, if any, were reinvested. For more recent performance information, visit www.eatonvance.com/performance.php.
THE FUND'S PAST PERFORMANCE IS NO GUARANTEE OF FUTURE RESULTS.
| Total Net Assets | $1,449,359,065 |
|---|
| # of Portfolio Holdings | 66 |
|---|
| Portfolio Turnover Rate | 75% |
|---|
| Total Advisory Fees Paid | $9,249,241 |
|---|
What did the Fund invest in?
The following tables reflect what the Fund invested in as of the report date.
Sector Allocation (% of total investments)
| Value | Value |
|---|
| Short-Term Investments | 0.9% |
| Materials | 4.1% |
| Communication Services | 4.7% |
| Real Estate | 5.1% |
| Consumer Discretionary | 5.2% |
| Utilities | 5.8% |
| Energy | 6.7% |
| Consumer Staples | 6.9% |
| Information Technology | 7.1% |
| Industrials | 16.0% |
| Health Care | 18.7% |
| Financials | 18.8% |
Top Ten Holdings (% of total investments)Footnote Referencea
| Wells Fargo & Co. | 3.0% |
| Bristol-Myers Squibb Co. | 2.9% |
| Walt Disney Co. | 2.8% |
| American International Group, Inc. | 2.6% |
| Cisco Systems, Inc. | 2.6% |
| Bank of America Corp. | 2.5% |
| Emerson Electric Co. | 2.5% |
| Reinsurance Group of America, Inc. | 2.5% |
| AbbVie, Inc. | 2.4% |
| UnitedHealth Group, Inc. | 2.4% |
| Total | 26.2% |
| Footnote | Description |
Footnotea | Excluding cash equivalents |
If you wish to view additional information about the Fund, including the prospectus, statement of additional information, financial statements and holdings, please scan the QR code or visit www.eatonvance.com/open-end-mutual-fund-documents.php. For proxy information, please visit www.eatonvance.com/proxyvoting.
The Funds may deliver a single copy of certain required shareholder documents (including prospectuses, shareholder reports, and proxy materials) to investors with the same last name and the same address. Your participation will continue indefinitely unless you instruct otherwise by calling 1-800-262-1122 or by contacting your financial intermediary. Your instruction will typically be effective within 30 days of receipt.
Not FDIC Insured | May Lose Value | No Bank Guarantee
Annual Shareholder Report December 31, 2024
Eaton Vance Large-Cap Value Fund
Annual Shareholder Report December 31, 2024
This annual shareholder report contains important information about the Eaton Vance Large-Cap Value Fund for the period of January 1, 2024 to December 31, 2024. You can find additional information about the Fund at www.eatonvance.com/open-end-mutual-fund-documents.php. You can also request this information by contacting us at 1-800-262-1122.
What were the Fund costs for the last year?
(based on a hypothetical $10,000 investment)
| Class Name | Costs of a $10,000 investment | Costs paid as a percentage of a $10,000 investment |
|---|
| Class R | $132 | 1.25% |
|---|
How did the Fund perform last year and what affected its performance?
Key contributors to (↑) and detractors from (↓) performance, relative to the Russell 1000® Value Index (the Index):
↓ An overweight position in discount chain Dollar Tree Inc. ― sold by period-end ― lost value over concerns about competition, product theft, and firm strategy
↓ An overweight position in agricultural chemical firm FMC Corp. declined in value due to excess inventory and struggles in its Asian and South American markets
↓ An overweight position in analog chipmaker ON Semiconductor Corp. lost value due to softening demand, particularly among automotive and industrial customers
↓ Among sectors, stock selections in consumer staples and energy, along with stock selections and an underweight position in financials, hurt relative returns
↑ An overweight position in international broker/dealer Interactive Brokers Group Inc. doubled in value on strong account growth, commission revenues, and margins
↑ An overweight position in conglomerate 3M Co. grew in value as it settled class-action suits, spun off its health care business, and hired a new CEO and CFO
↑ Not owning Index position and chipmaker Intel Corp. aided returns as its price declined over concerns about increasing competition in sales for AI applications
↑ Among sectors, stock selections in health care and communication services, and an overweight position in utilities contributed to Index-relative returns
Comparison of the change in value of a $10,000 investment for the period indicated.

| Class R | Russell 3000® Index | Russell 1000® Value Index |
|---|
| 12/14 | $10,000 | $10,000 | $10,000 |
|---|
| 1/15 | $9,770 | $9,722 | $9,600 |
|---|
| 2/15 | $10,219 | $10,285 | $10,065 |
|---|
| 3/15 | $10,119 | $10,180 | $9,928 |
|---|
| 4/15 | $10,216 | $10,226 | $10,021 |
|---|
| 5/15 | $10,335 | $10,368 | $10,141 |
|---|
| 6/15 | $10,050 | $10,194 | $9,939 |
|---|
| 7/15 | $10,186 | $10,365 | $9,982 |
|---|
| 8/15 | $9,581 | $9,739 | $9,388 |
|---|
| 9/15 | $9,263 | $9,455 | $9,104 |
|---|
| 10/15 | $9,969 | $10,202 | $9,791 |
|---|
| 11/15 | $10,045 | $10,258 | $9,829 |
|---|
| 12/15 | $9,867 | $10,048 | $9,617 |
|---|
| 1/16 | $9,393 | $9,481 | $9,120 |
|---|
| 2/16 | $9,280 | $9,478 | $9,118 |
|---|
| 3/16 | $9,833 | $10,145 | $9,775 |
|---|
| 4/16 | $9,898 | $10,208 | $9,980 |
|---|
| 5/16 | $10,011 | $10,391 | $10,135 |
|---|
| 6/16 | $9,999 | $10,412 | $10,223 |
|---|
| 7/16 | $10,267 | $10,825 | $10,520 |
|---|
| 8/16 | $10,273 | $10,853 | $10,601 |
|---|
| 9/16 | $10,171 | $10,870 | $10,579 |
|---|
| 10/16 | $9,980 | $10,635 | $10,415 |
|---|
| 11/16 | $10,428 | $11,111 | $11,010 |
|---|
| 12/16 | $10,780 | $11,327 | $11,285 |
|---|
| 1/17 | $10,846 | $11,541 | $11,365 |
|---|
| 2/17 | $11,200 | $11,970 | $11,774 |
|---|
| 3/17 | $11,061 | $11,978 | $11,654 |
|---|
| 4/17 | $11,055 | $12,105 | $11,632 |
|---|
| 5/17 | $11,013 | $12,229 | $11,621 |
|---|
| 6/17 | $11,210 | $12,339 | $11,811 |
|---|
| 7/17 | $11,282 | $12,572 | $11,967 |
|---|
| 8/17 | $11,162 | $12,596 | $11,828 |
|---|
| 9/17 | $11,577 | $12,903 | $12,178 |
|---|
| 10/17 | $11,673 | $13,185 | $12,267 |
|---|
| 11/17 | $12,096 | $13,585 | $12,642 |
|---|
| 12/17 | $12,343 | $13,721 | $12,827 |
|---|
| 1/18 | $12,787 | $14,444 | $13,323 |
|---|
| 2/18 | $12,190 | $13,912 | $12,687 |
|---|
| 3/18 | $12,055 | $13,633 | $12,464 |
|---|
| 4/18 | $12,246 | $13,684 | $12,505 |
|---|
| 5/18 | $12,252 | $14,071 | $12,579 |
|---|
| 6/18 | $12,345 | $14,163 | $12,610 |
|---|
| 7/18 | $12,982 | $14,633 | $13,109 |
|---|
| 8/18 | $13,250 | $15,147 | $13,303 |
|---|
| 9/18 | $13,300 | $15,172 | $13,329 |
|---|
| 10/18 | $12,450 | $14,055 | $12,639 |
|---|
| 11/18 | $12,707 | $14,336 | $13,016 |
|---|
| 12/18 | $11,474 | $13,002 | $11,767 |
|---|
| 1/19 | $12,367 | $14,118 | $12,682 |
|---|
| 2/19 | $12,800 | $14,614 | $13,088 |
|---|
| 3/19 | $12,924 | $14,828 | $13,171 |
|---|
| 4/19 | $13,644 | $15,420 | $13,638 |
|---|
| 5/19 | $12,756 | $14,422 | $12,761 |
|---|
| 6/19 | $13,658 | $15,435 | $13,677 |
|---|
| 7/19 | $13,840 | $15,664 | $13,791 |
|---|
| 8/19 | $13,497 | $15,345 | $13,385 |
|---|
| 9/19 | $13,845 | $15,614 | $13,863 |
|---|
| 10/19 | $13,971 | $15,951 | $14,056 |
|---|
| 11/19 | $14,484 | $16,557 | $14,491 |
|---|
| 12/19 | $14,857 | $17,035 | $14,890 |
|---|
| 1/20 | $14,594 | $17,016 | $14,569 |
|---|
| 2/20 | $13,124 | $15,623 | $13,158 |
|---|
| 3/20 | $10,917 | $13,475 | $10,910 |
|---|
| 4/20 | $12,156 | $15,259 | $12,136 |
|---|
| 5/20 | $12,562 | $16,075 | $12,552 |
|---|
| 6/20 | $12,431 | $16,443 | $12,469 |
|---|
| 7/20 | $12,966 | $17,376 | $12,962 |
|---|
| 8/20 | $13,466 | $18,635 | $13,497 |
|---|
| 9/20 | $13,104 | $17,957 | $13,166 |
|---|
| 10/20 | $12,982 | $17,569 | $12,993 |
|---|
| 11/20 | $14,677 | $19,707 | $14,741 |
|---|
| 12/20 | $15,159 | $20,593 | $15,306 |
|---|
| 1/21 | $14,934 | $20,501 | $15,166 |
|---|
| 2/21 | $15,897 | $21,142 | $16,082 |
|---|
| 3/21 | $16,807 | $21,900 | $17,028 |
|---|
| 4/21 | $17,489 | $23,029 | $17,709 |
|---|
| 5/21 | $17,787 | $23,134 | $18,123 |
|---|
| 6/21 | $17,557 | $23,705 | $17,915 |
|---|
| 7/21 | $17,652 | $24,105 | $18,059 |
|---|
| 8/21 | $17,942 | $24,793 | $18,417 |
|---|
| 9/21 | $17,341 | $23,681 | $17,776 |
|---|
| 10/21 | $18,302 | $25,282 | $18,678 |
|---|
| 11/21 | $17,552 | $24,897 | $18,020 |
|---|
| 12/21 | $18,797 | $25,877 | $19,157 |
|---|
| 1/22 | $18,719 | $24,355 | $18,711 |
|---|
| 2/22 | $18,750 | $23,741 | $18,493 |
|---|
| 3/22 | $19,183 | $24,512 | $19,015 |
|---|
| 4/22 | $18,070 | $22,312 | $17,943 |
|---|
| 5/22 | $18,459 | $22,282 | $18,292 |
|---|
| 6/22 | $17,017 | $20,418 | $16,694 |
|---|
| 7/22 | $18,078 | $22,333 | $17,801 |
|---|
| 8/22 | $17,633 | $21,500 | $17,270 |
|---|
| 9/22 | $16,355 | $19,506 | $15,756 |
|---|
| 10/22 | $18,160 | $21,106 | $17,371 |
|---|
| 11/22 | $19,074 | $22,208 | $18,457 |
|---|
| 12/22 | $18,226 | $20,907 | $17,713 |
|---|
| 1/23 | $19,017 | $22,347 | $18,631 |
|---|
| 2/23 | $18,403 | $21,825 | $17,974 |
|---|
| 3/23 | $17,988 | $22,408 | $17,891 |
|---|
| 4/23 | $18,393 | $22,647 | $18,161 |
|---|
| 5/23 | $17,704 | $22,735 | $17,460 |
|---|
| 6/23 | $18,641 | $24,288 | $18,620 |
|---|
| 7/23 | $19,371 | $25,158 | $19,275 |
|---|
| 8/23 | $18,779 | $24,673 | $18,754 |
|---|
| 9/23 | $18,050 | $23,497 | $18,031 |
|---|
| 10/23 | $17,286 | $22,875 | $17,395 |
|---|
| 11/23 | $18,440 | $25,008 | $18,707 |
|---|
| 12/23 | $19,622 | $26,334 | $19,743 |
|---|
| 1/24 | $19,290 | $26,626 | $19,764 |
|---|
| 2/24 | $20,154 | $28,067 | $20,493 |
|---|
| 3/24 | $21,146 | $28,973 | $21,517 |
|---|
| 4/24 | $20,697 | $27,698 | $20,598 |
|---|
| 5/24 | $21,246 | $29,006 | $21,251 |
|---|
| 6/24 | $20,939 | $29,904 | $21,051 |
|---|
| 7/24 | $21,690 | $30,460 | $22,127 |
|---|
| 8/24 | $21,923 | $31,123 | $22,721 |
|---|
| 9/24 | $22,272 | $31,767 | $23,036 |
|---|
| 10/24 | $21,971 | $31,534 | $22,783 |
|---|
| 11/24 | $23,392 | $33,632 | $24,238 |
|---|
| 12/24 | $21,820 | $32,604 | $22,580 |
|---|
Average Annual Total Returns (%)Footnote Reference1
| Fund | 1 Year | 5 Years | 10 Years |
|---|
| Class R | 11.20% | 7.98% | 8.11% |
|---|
Russell 3000® Index | 23.81% | 13.85% | 12.53% |
|---|
Russell 1000® Value Index | 14.37% | 8.67% | 8.48% |
|---|
| Footnote | Description |
Footnote1 | In accordance with regulatory changes requiring the Fund's primary benchmark to represent the overall applicable market, the Fund's primary prospectus benchmark changed to the Russell 3000® Index effective May 1, 2024. |
Performance does not reflect the deduction of taxes that a shareholder would pay on Fund distributions or redemption of Fund shares. Performance assumes that all dividends and distributions, if any, were reinvested. For more recent performance information, visit www.eatonvance.com/performance.php.
THE FUND'S PAST PERFORMANCE IS NO GUARANTEE OF FUTURE RESULTS.
| Total Net Assets | $1,449,359,065 |
|---|
| # of Portfolio Holdings | 66 |
|---|
| Portfolio Turnover Rate | 75% |
|---|
| Total Advisory Fees Paid | $9,249,241 |
|---|
What did the Fund invest in?
The following tables reflect what the Fund invested in as of the report date.
Sector Allocation (% of total investments)
| Value | Value |
|---|
| Short-Term Investments | 0.9% |
| Materials | 4.1% |
| Communication Services | 4.7% |
| Real Estate | 5.1% |
| Consumer Discretionary | 5.2% |
| Utilities | 5.8% |
| Energy | 6.7% |
| Consumer Staples | 6.9% |
| Information Technology | 7.1% |
| Industrials | 16.0% |
| Health Care | 18.7% |
| Financials | 18.8% |
Top Ten Holdings (% of total investments)Footnote Referencea
| Wells Fargo & Co. | 3.0% |
| Bristol-Myers Squibb Co. | 2.9% |
| Walt Disney Co. | 2.8% |
| American International Group, Inc. | 2.6% |
| Cisco Systems, Inc. | 2.6% |
| Bank of America Corp. | 2.5% |
| Emerson Electric Co. | 2.5% |
| Reinsurance Group of America, Inc. | 2.5% |
| AbbVie, Inc. | 2.4% |
| UnitedHealth Group, Inc. | 2.4% |
| Total | 26.2% |
| Footnote | Description |
Footnotea | Excluding cash equivalents |
If you wish to view additional information about the Fund, including the prospectus, statement of additional information, financial statements and holdings, please scan the QR code or visit www.eatonvance.com/open-end-mutual-fund-documents.php. For proxy information, please visit www.eatonvance.com/proxyvoting.
The Funds may deliver a single copy of certain required shareholder documents (including prospectuses, shareholder reports, and proxy materials) to investors with the same last name and the same address. Your participation will continue indefinitely unless you instruct otherwise by calling 1-800-262-1122 or by contacting your financial intermediary. Your instruction will typically be effective within 30 days of receipt.
Not FDIC Insured | May Lose Value | No Bank Guarantee
Annual Shareholder Report December 31, 2024
Eaton Vance Large-Cap Value Fund
Annual Shareholder Report December 31, 2024
This annual shareholder report contains important information about the Eaton Vance Large-Cap Value Fund for the period of January 1, 2024 to December 31, 2024. You can find additional information about the Fund at www.eatonvance.com/open-end-mutual-fund-documents.php. You can also request this information by contacting us at 1-800-262-1122.
What were the Fund costs for the last year?
(based on a hypothetical $10,000 investment)
| Class Name | Costs of a $10,000 investment | Costs paid as a percentage of a $10,000 investment |
|---|
| Class R6 | $74 | 0.70% |
|---|
How did the Fund perform last year and what affected its performance?
Key contributors to (↑) and detractors from (↓) performance, relative to the Russell 1000® Value Index (the Index):
↓ An overweight position in discount chain Dollar Tree Inc. ― sold by period-end ― lost value over concerns about competition, product theft, and firm strategy
↓ An overweight position in agricultural chemical firm FMC Corp. declined in value due to excess inventory and struggles in its Asian and South American markets
↓ An overweight position in analog chipmaker ON Semiconductor Corp. lost value due to softening demand, particularly among automotive and industrial customers
↓ Among sectors, stock selections in consumer staples and energy, along with stock selections and an underweight position in financials, hurt relative returns
↑ An overweight position in international broker/dealer Interactive Brokers Group Inc. doubled in value on strong account growth, commission revenues, and margins
↑ An overweight position in conglomerate 3M Co. grew in value as it settled class-action suits, spun off its health care business, and hired a new CEO and CFO
↑ Not owning Index position and chipmaker Intel Corp. aided returns as its price declined over concerns about increasing competition in sales for AI applications
↑ Among sectors, stock selections in health care and communication services, and an overweight position in utilities contributed to Index-relative returns
Comparison of the change in value of a $5,000,000 investment for the period indicated.
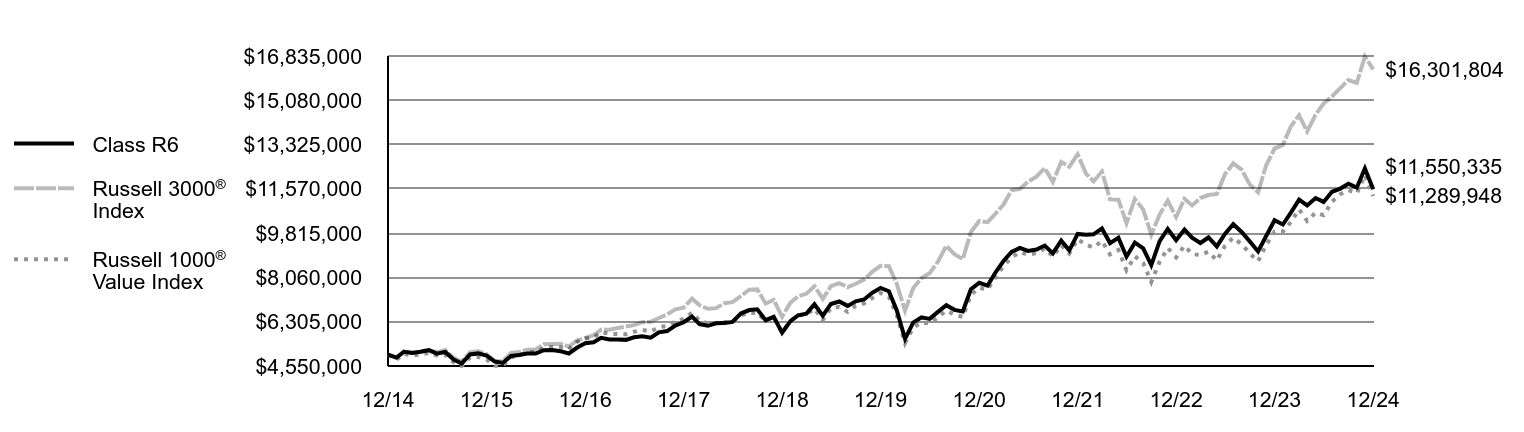
| Class R6 | Russell 3000® Index | Russell 1000® Value Index |
|---|
| 12/14 | $5,000,000 | $5,000,000 | $5,000,000 |
|---|
| 1/15 | $4,885,699 | $4,860,842 | $4,800,133 |
|---|
| 2/15 | $5,114,301 | $5,142,290 | $5,032,408 |
|---|
| 3/15 | $5,065,072 | $5,090,013 | $4,963,904 |
|---|
| 4/15 | $5,115,867 | $5,113,037 | $5,010,313 |
|---|
| 5/15 | $5,177,629 | $5,183,757 | $5,070,525 |
|---|
| 6/15 | $5,038,109 | $5,097,030 | $4,969,282 |
|---|
| 7/15 | $5,108,721 | $5,182,280 | $4,991,070 |
|---|
| 8/15 | $4,807,045 | $4,869,429 | $4,693,819 |
|---|
| 9/15 | $4,650,884 | $4,727,534 | $4,552,113 |
|---|
| 10/15 | $5,008,396 | $5,100,940 | $4,895,583 |
|---|
| 11/15 | $5,049,345 | $5,129,217 | $4,914,320 |
|---|
| 12/15 | $4,960,413 | $5,023,938 | $4,808,634 |
|---|
| 1/16 | $4,726,609 | $4,740,461 | $4,560,160 |
|---|
| 2/16 | $4,670,345 | $4,738,934 | $4,559,008 |
|---|
| 3/16 | $4,950,047 | $5,072,584 | $4,887,417 |
|---|
| 4/16 | $4,985,718 | $5,104,021 | $4,990,084 |
|---|
| 5/16 | $5,045,153 | $5,195,334 | $5,067,590 |
|---|
| 6/16 | $5,043,566 | $5,206,017 | $5,111,412 |
|---|
| 7/16 | $5,177,974 | $5,412,628 | $5,259,824 |
|---|
| 8/16 | $5,183,934 | $5,426,434 | $5,300,380 |
|---|
| 9/16 | $5,137,925 | $5,434,965 | $5,289,333 |
|---|
| 10/16 | $5,044,935 | $5,317,376 | $5,207,471 |
|---|
| 11/16 | $5,272,884 | $5,555,340 | $5,504,893 |
|---|
| 12/16 | $5,451,678 | $5,663,742 | $5,642,473 |
|---|
| 1/17 | $5,490,871 | $5,770,345 | $5,682,671 |
|---|
| 2/17 | $5,668,617 | $5,984,953 | $5,886,871 |
|---|
| 3/17 | $5,603,646 | $5,989,025 | $5,826,903 |
|---|
| 4/17 | $5,600,669 | $6,052,507 | $5,815,968 |
|---|
| 5/17 | $5,585,582 | $6,114,448 | $5,810,267 |
|---|
| 6/17 | $5,687,136 | $6,169,628 | $5,905,250 |
|---|
| 7/17 | $5,726,579 | $6,285,956 | $5,983,733 |
|---|
| 8/17 | $5,668,859 | $6,298,067 | $5,914,033 |
|---|
| 9/17 | $5,883,906 | $6,451,663 | $6,089,193 |
|---|
| 10/17 | $5,935,679 | $6,592,452 | $6,133,404 |
|---|
| 11/17 | $6,152,123 | $6,792,633 | $6,321,218 |
|---|
| 12/17 | $6,283,094 | $6,860,525 | $6,413,491 |
|---|
| 1/18 | $6,510,530 | $7,222,147 | $6,661,448 |
|---|
| 2/18 | $6,209,405 | $6,955,941 | $6,343,357 |
|---|
| 3/18 | $6,143,105 | $6,816,307 | $6,231,770 |
|---|
| 4/18 | $6,242,808 | $6,842,214 | $6,252,343 |
|---|
| 5/18 | $6,249,260 | $7,035,372 | $6,289,458 |
|---|
| 6/18 | $6,299,399 | $7,081,382 | $6,305,034 |
|---|
| 7/18 | $6,628,767 | $7,316,384 | $6,554,583 |
|---|
| 8/18 | $6,767,759 | $7,573,319 | $6,651,462 |
|---|
| 9/18 | $6,795,952 | $7,585,855 | $6,664,653 |
|---|
| 10/18 | $6,364,902 | $7,027,288 | $6,319,549 |
|---|
| 11/18 | $6,498,750 | $7,168,035 | $6,508,221 |
|---|
| 12/18 | $5,872,228 | $6,500,910 | $5,883,268 |
|---|
| 1/19 | $6,329,153 | $7,058,910 | $6,341,189 |
|---|
| 2/19 | $6,555,861 | $7,307,165 | $6,543,800 |
|---|
| 3/19 | $6,624,518 | $7,413,863 | $6,585,403 |
|---|
| 4/19 | $6,994,342 | $7,709,913 | $6,818,996 |
|---|
| 5/19 | $6,542,770 | $7,210,990 | $6,380,554 |
|---|
| 6/19 | $7,007,648 | $7,717,466 | $6,838,579 |
|---|
| 7/19 | $7,107,543 | $7,832,186 | $6,895,263 |
|---|
| 8/19 | $6,932,619 | $7,672,525 | $6,692,508 |
|---|
| 9/19 | $7,113,052 | $7,807,184 | $6,931,280 |
|---|
| 10/19 | $7,184,743 | $7,975,248 | $7,028,164 |
|---|
| 11/19 | $7,449,869 | $8,278,402 | $7,245,449 |
|---|
| 12/19 | $7,644,080 | $8,517,431 | $7,444,766 |
|---|
| 1/20 | $7,513,484 | $8,508,127 | $7,284,604 |
|---|
| 2/20 | $6,759,298 | $7,811,539 | $6,579,118 |
|---|
| 3/20 | $5,626,437 | $6,737,313 | $5,454,783 |
|---|
| 4/20 | $6,267,385 | $7,629,604 | $6,068,019 |
|---|
| 5/20 | $6,478,632 | $8,037,624 | $6,275,961 |
|---|
| 6/20 | $6,416,318 | $8,221,379 | $6,234,303 |
|---|
| 7/20 | $6,694,169 | $8,688,216 | $6,480,767 |
|---|
| 8/20 | $6,957,544 | $9,317,629 | $6,748,746 |
|---|
| 9/20 | $6,774,740 | $8,978,365 | $6,582,975 |
|---|
| 10/20 | $6,711,844 | $8,784,583 | $6,496,457 |
|---|
| 11/20 | $7,592,479 | $9,853,255 | $7,370,322 |
|---|
| 12/20 | $7,846,051 | $10,296,534 | $7,652,896 |
|---|
| 1/21 | $7,734,563 | $10,250,735 | $7,582,810 |
|---|
| 2/21 | $8,236,355 | $10,571,145 | $8,041,061 |
|---|
| 3/21 | $8,711,352 | $10,950,045 | $8,514,229 |
|---|
| 4/21 | $9,069,306 | $11,514,512 | $8,854,725 |
|---|
| 5/21 | $9,229,565 | $11,567,075 | $9,061,433 |
|---|
| 6/21 | $9,113,124 | $11,852,306 | $8,957,665 |
|---|
| 7/21 | $9,165,520 | $12,052,736 | $9,029,258 |
|---|
| 8/21 | $9,322,643 | $12,396,454 | $9,208,321 |
|---|
| 9/21 | $9,014,844 | $11,840,251 | $8,887,798 |
|---|
| 10/21 | $9,517,754 | $12,640,942 | $9,339,098 |
|---|
| 11/21 | $9,131,189 | $12,448,531 | $9,009,988 |
|---|
| 12/21 | $9,783,182 | $12,938,737 | $9,578,394 |
|---|
| 1/22 | $9,751,106 | $12,177,472 | $9,355,276 |
|---|
| 2/22 | $9,767,144 | $11,870,730 | $9,246,714 |
|---|
| 3/22 | $10,000,219 | $12,255,772 | $9,507,741 |
|---|
| 4/22 | $9,420,962 | $11,155,911 | $8,971,468 |
|---|
| 5/22 | $9,630,138 | $11,140,954 | $9,145,870 |
|---|
| 6/22 | $8,881,891 | $10,208,916 | $8,346,778 |
|---|
| 7/22 | $9,438,775 | $11,166,696 | $8,900,275 |
|---|
| 8/22 | $9,212,793 | $10,749,963 | $8,635,086 |
|---|
| 9/22 | $8,550,945 | $9,753,128 | $7,877,901 |
|---|
| 10/22 | $9,498,351 | $10,552,943 | $8,685,623 |
|---|
| 11/22 | $9,980,152 | $11,103,767 | $9,228,402 |
|---|
| 12/22 | $9,538,186 | $10,453,603 | $8,856,389 |
|---|
| 1/23 | $9,957,262 | $11,173,571 | $9,315,330 |
|---|
| 2/23 | $9,638,764 | $10,912,414 | $8,986,882 |
|---|
| 3/23 | $9,424,245 | $11,204,203 | $8,945,495 |
|---|
| 4/23 | $9,642,924 | $11,323,577 | $9,080,276 |
|---|
| 5/23 | $9,289,673 | $11,367,634 | $8,730,069 |
|---|
| 6/23 | $9,786,007 | $12,143,878 | $9,309,982 |
|---|
| 7/23 | $10,170,020 | $12,579,197 | $9,637,367 |
|---|
| 8/23 | $9,861,965 | $12,336,371 | $9,377,192 |
|---|
| 9/23 | $9,487,954 | $11,748,738 | $9,015,331 |
|---|
| 10/23 | $9,089,976 | $11,437,294 | $8,697,251 |
|---|
| 11/23 | $9,699,644 | $12,503,802 | $9,353,458 |
|---|
| 12/23 | $10,325,939 | $13,167,027 | $9,871,571 |
|---|
| 1/24 | $10,156,945 | $13,312,954 | $9,881,791 |
|---|
| 2/24 | $10,616,261 | $14,033,591 | $10,246,328 |
|---|
| 3/24 | $11,145,050 | $14,486,278 | $10,758,591 |
|---|
| 4/24 | $10,914,763 | $13,848,857 | $10,299,032 |
|---|
| 5/24 | $11,205,881 | $14,503,174 | $10,625,511 |
|---|
| 6/24 | $11,052,514 | $14,952,155 | $10,525,562 |
|---|
| 7/24 | $11,453,948 | $15,230,100 | $11,063,646 |
|---|
| 8/24 | $11,580,487 | $15,561,640 | $11,360,429 |
|---|
| 9/24 | $11,770,095 | $15,883,546 | $11,518,111 |
|---|
| 10/24 | $11,616,895 | $15,766,903 | $11,391,344 |
|---|
| 11/24 | $12,374,138 | $16,815,783 | $12,118,781 |
|---|
| 12/24 | $11,550,335 | $16,301,804 | $11,289,948 |
|---|
Average Annual Total Returns (%)Footnote Reference1
| Fund | 1 Year | 5 Years | 10 Years |
|---|
| Class R6 | 11.85% | 8.60% | 8.73% |
|---|
Russell 3000® Index | 23.81% | 13.85% | 12.53% |
|---|
Russell 1000® Value Index | 14.37% | 8.67% | 8.48% |
|---|
| Footnote | Description |
Footnote1 | In accordance with regulatory changes requiring the Fund's primary benchmark to represent the overall applicable market, the Fund's primary prospectus benchmark changed to the Russell 3000® Index effective May 1, 2024. |
Performance does not reflect the deduction of taxes that a shareholder would pay on Fund distributions or redemption of Fund shares. Performance assumes that all dividends and distributions, if any, were reinvested. For more recent performance information, visit www.eatonvance.com/performance.php.
THE FUND'S PAST PERFORMANCE IS NO GUARANTEE OF FUTURE RESULTS.
| Total Net Assets | $1,449,359,065 |
|---|
| # of Portfolio Holdings | 66 |
|---|
| Portfolio Turnover Rate | 75% |
|---|
| Total Advisory Fees Paid | $9,249,241 |
|---|
What did the Fund invest in?
The following tables reflect what the Fund invested in as of the report date.
Sector Allocation (% of total investments)
| Value | Value |
|---|
| Short-Term Investments | 0.9% |
| Materials | 4.1% |
| Communication Services | 4.7% |
| Real Estate | 5.1% |
| Consumer Discretionary | 5.2% |
| Utilities | 5.8% |
| Energy | 6.7% |
| Consumer Staples | 6.9% |
| Information Technology | 7.1% |
| Industrials | 16.0% |
| Health Care | 18.7% |
| Financials | 18.8% |
Top Ten Holdings (% of total investments)Footnote Referencea
| Wells Fargo & Co. | 3.0% |
| Bristol-Myers Squibb Co. | 2.9% |
| Walt Disney Co. | 2.8% |
| American International Group, Inc. | 2.6% |
| Cisco Systems, Inc. | 2.6% |
| Bank of America Corp. | 2.5% |
| Emerson Electric Co. | 2.5% |
| Reinsurance Group of America, Inc. | 2.5% |
| AbbVie, Inc. | 2.4% |
| UnitedHealth Group, Inc. | 2.4% |
| Total | 26.2% |
| Footnote | Description |
Footnotea | Excluding cash equivalents |
If you wish to view additional information about the Fund, including the prospectus, statement of additional information, financial statements and holdings, please scan the QR code or visit www.eatonvance.com/open-end-mutual-fund-documents.php. For proxy information, please visit www.eatonvance.com/proxyvoting.
The Funds may deliver a single copy of certain required shareholder documents (including prospectuses, shareholder reports, and proxy materials) to investors with the same last name and the same address. Your participation will continue indefinitely unless you instruct otherwise by calling 1-800-262-1122 or by contacting your financial intermediary. Your instruction will typically be effective within 30 days of receipt.
Not FDIC Insured | May Lose Value | No Bank Guarantee
Annual Shareholder Report December 31, 2024
Eaton Vance Small-Cap Fund
Annual Shareholder Report December 31, 2024
This annual shareholder report contains important information about the Eaton Vance Small-Cap Fund for the period of January 1, 2024 to December 31, 2024. You can find additional information about the Fund at www.eatonvance.com/open-end-mutual-fund-documents.php. You can also request this information by contacting us at 1-800-262-1122.
What were the Fund costs for the last year?
(based on a hypothetical $10,000 investment)
| Class Name | Costs of a $10,000 investment | Costs paid as a percentage of a $10,000 investment |
|---|
| Class A | $128 | 1.21% |
|---|
How did the Fund perform last year and what affected its performance?
Key contributors to (↑) and detractors from (↓) performance, relative to the Russell 2000® Index (the Index): ↑ Sector allocations ― especially an underweight exposure to the health care sector and a lack of exposure to energy ― contributed to Index-relative performance ↑ Security selections ― particularly in the consumer discretionary and financials sectors ― contributed to returns relative to the Index during the period ↑ The Fund’s allocation to Dorman Products, Inc., a maker of aftermarket auto parts, helped returns as the company posted strong revenue and earnings growth ↑ An overweight exposure to industrial products maker CSW Industries, Inc. aided returns amid strategic business acquisitions, sales growth, and price increases ↓ The Fund’s security selections in the information technology and health care sectors detracted from performance relative to the Index during the period ↓ The Fund’s underweight exposure to the information technology sector detracted from performance relative to the Index during the period ↓ An overweight exposure to Quaker Chemical Corp., a developer of industrial chemical products, hurt returns as soft demand led to declines in sales and prices ↓ Not owning Super Micro Computer Inc., a maker of computer servers and data storage, hurt returns as the company benefited from the artificial intelligence boom
Comparison of the change in value of a $10,000 investment for the period indicated.

| Class A with Maximum Sales Charge | Russell 3000® Index | Russell 2000® Index |
|---|
| 12/14 | $10,000 | $10,000 | $10,000 |
|---|
| 1/15 | $9,240 | $9,722 | $9,678 |
|---|
| 2/15 | $9,877 | $10,285 | $10,253 |
|---|
| 3/15 | $10,155 | $10,180 | $10,432 |
|---|
| 4/15 | $9,778 | $10,226 | $10,165 |
|---|
| 5/15 | $10,163 | $10,368 | $10,398 |
|---|
| 6/15 | $10,217 | $10,194 | $10,475 |
|---|
| 7/15 | $10,136 | $10,365 | $10,354 |
|---|
| 8/15 | $9,725 | $9,739 | $9,703 |
|---|
| 9/15 | $9,281 | $9,455 | $9,227 |
|---|
| 10/15 | $9,570 | $10,202 | $9,747 |
|---|
| 11/15 | $9,712 | $10,258 | $10,064 |
|---|
| 12/15 | $9,211 | $10,048 | $9,559 |
|---|
| 1/16 | $8,638 | $9,481 | $8,718 |
|---|
| 2/16 | $8,675 | $9,478 | $8,718 |
|---|
| 3/16 | $9,332 | $10,145 | $9,413 |
|---|
| 4/16 | $9,325 | $10,208 | $9,561 |
|---|
| 5/16 | $9,672 | $10,391 | $9,777 |
|---|
| 6/16 | $9,545 | $10,412 | $9,770 |
|---|
| 7/16 | $9,880 | $10,825 | $10,354 |
|---|
| 8/16 | $10,005 | $10,853 | $10,537 |
|---|
| 9/16 | $9,982 | $10,870 | $10,654 |
|---|
| 10/16 | $9,841 | $10,635 | $10,148 |
|---|
| 11/16 | $10,700 | $11,111 | $11,279 |
|---|
| 12/16 | $10,991 | $11,327 | $11,595 |
|---|
| 1/17 | $11,008 | $11,541 | $11,641 |
|---|
| 2/17 | $11,293 | $11,970 | $11,866 |
|---|
| 3/17 | $11,370 | $11,978 | $11,881 |
|---|
| 4/17 | $11,388 | $12,105 | $12,012 |
|---|
| 5/17 | $11,310 | $12,229 | $11,767 |
|---|
| 6/17 | $11,595 | $12,339 | $12,174 |
|---|
| 7/17 | $11,668 | $12,572 | $12,264 |
|---|
| 8/17 | $11,535 | $12,596 | $12,108 |
|---|
| 9/17 | $12,067 | $12,903 | $12,864 |
|---|
| 10/17 | $12,191 | $13,185 | $12,974 |
|---|
| 11/17 | $12,607 | $13,585 | $13,348 |
|---|
| 12/17 | $12,629 | $13,721 | $13,294 |
|---|
| 1/18 | $13,023 | $14,444 | $13,641 |
|---|
| 2/18 | $12,591 | $13,912 | $13,113 |
|---|
| 3/18 | $12,716 | $13,633 | $13,283 |
|---|
| 4/18 | $12,773 | $13,684 | $13,397 |
|---|
| 5/18 | $13,513 | $14,071 | $14,211 |
|---|
| 6/18 | $13,619 | $14,163 | $14,312 |
|---|
| 7/18 | $13,830 | $14,633 | $14,562 |
|---|
| 8/18 | $14,368 | $15,147 | $15,190 |
|---|
| 9/18 | $14,310 | $15,172 | $14,824 |
|---|
| 10/18 | $12,946 | $14,055 | $13,214 |
|---|
| 11/18 | $13,273 | $14,336 | $13,424 |
|---|
| 12/18 | $11,895 | $13,002 | $11,830 |
|---|
| 1/19 | $13,063 | $14,118 | $13,160 |
|---|
| 2/19 | $13,803 | $14,614 | $13,845 |
|---|
| 3/19 | $13,653 | $14,828 | $13,555 |
|---|
| 4/19 | $14,264 | $15,420 | $14,015 |
|---|
| 5/19 | $13,663 | $14,422 | $12,925 |
|---|
| 6/19 | $14,628 | $15,435 | $13,839 |
|---|
| 7/19 | $14,885 | $15,664 | $13,918 |
|---|
| 8/19 | $14,472 | $15,345 | $13,231 |
|---|
| 9/19 | $14,527 | $15,614 | $13,507 |
|---|
| 10/19 | $14,538 | $15,951 | $13,862 |
|---|
| 11/19 | $15,041 | $16,557 | $14,433 |
|---|
| 12/19 | $15,171 | $17,035 | $14,849 |
|---|
| 1/20 | $14,941 | $17,016 | $14,373 |
|---|
| 2/20 | $13,756 | $15,623 | $13,163 |
|---|
| 3/20 | $11,444 | $13,475 | $10,303 |
|---|
| 4/20 | $12,583 | $15,259 | $11,718 |
|---|
| 5/20 | $13,296 | $16,075 | $12,481 |
|---|
| 6/20 | $13,388 | $16,443 | $12,922 |
|---|
| 7/20 | $13,975 | $17,376 | $13,280 |
|---|
| 8/20 | $14,478 | $18,635 | $14,028 |
|---|
| 9/20 | $13,769 | $17,957 | $13,559 |
|---|
| 10/20 | $14,141 | $17,569 | $13,843 |
|---|
| 11/20 | $15,826 | $19,707 | $16,395 |
|---|
| 12/20 | $17,102 | $20,593 | $17,813 |
|---|
| 1/21 | $17,137 | $20,501 | $18,709 |
|---|
| 2/21 | $18,196 | $21,142 | $19,876 |
|---|
| 3/21 | $18,767 | $21,900 | $20,075 |
|---|
| 4/21 | $19,407 | $23,029 | $20,497 |
|---|
| 5/21 | $19,477 | $23,134 | $20,539 |
|---|
| 6/21 | $19,442 | $23,705 | $20,937 |
|---|
| 7/21 | $19,431 | $24,105 | $20,181 |
|---|
| 8/21 | $19,722 | $24,793 | $20,632 |
|---|
| 9/21 | $19,198 | $23,681 | $20,024 |
|---|
| 10/21 | $20,176 | $25,282 | $20,876 |
|---|
| 11/21 | $19,431 | $24,897 | $20,006 |
|---|
| 12/21 | $20,725 | $25,877 | $20,453 |
|---|
| 1/22 | $19,156 | $24,355 | $18,484 |
|---|
| 2/22 | $19,794 | $23,741 | $18,681 |
|---|
| 3/22 | $19,622 | $24,512 | $18,914 |
|---|
| 4/22 | $18,319 | $22,312 | $17,039 |
|---|
| 5/22 | $17,880 | $22,282 | $17,065 |
|---|
| 6/22 | $16,883 | $20,418 | $15,661 |
|---|
| 7/22 | $18,385 | $22,333 | $17,296 |
|---|
| 8/22 | $17,335 | $21,500 | $16,942 |
|---|
| 9/22 | $15,953 | $19,506 | $15,319 |
|---|
| 10/22 | $17,734 | $21,106 | $17,005 |
|---|
| 11/22 | $18,399 | $22,208 | $17,402 |
|---|
| 12/22 | $17,506 | $20,907 | $16,273 |
|---|
| 1/23 | $19,137 | $22,347 | $17,859 |
|---|
| 2/23 | $19,164 | $21,825 | $17,557 |
|---|
| 3/23 | $18,643 | $22,408 | $16,718 |
|---|
| 4/23 | $18,534 | $22,647 | $16,418 |
|---|
| 5/23 | $17,862 | $22,735 | $16,266 |
|---|
| 6/23 | $19,041 | $24,288 | $17,589 |
|---|
| 7/23 | $19,534 | $25,158 | $18,664 |
|---|
| 8/23 | $18,808 | $24,673 | $17,731 |
|---|
| 9/23 | $17,478 | $23,497 | $16,687 |
|---|
| 10/23 | $16,436 | $22,875 | $15,549 |
|---|
| 11/23 | $17,848 | $25,008 | $16,956 |
|---|
| 12/23 | $19,480 | $26,334 | $19,028 |
|---|
| 1/24 | $19,025 | $26,626 | $18,288 |
|---|
| 2/24 | $20,074 | $28,067 | $19,322 |
|---|
| 3/24 | $20,902 | $28,973 | $20,013 |
|---|
| 4/24 | $19,577 | $27,698 | $18,605 |
|---|
| 5/24 | $20,143 | $29,006 | $19,538 |
|---|
| 6/24 | $19,908 | $29,904 | $19,357 |
|---|
| 7/24 | $21,247 | $30,460 | $21,324 |
|---|
| 8/24 | $21,551 | $31,123 | $21,006 |
|---|
| 9/24 | $21,758 | $31,767 | $21,152 |
|---|
| 10/24 | $21,220 | $31,534 | $20,847 |
|---|
| 11/24 | $23,470 | $33,632 | $23,134 |
|---|
| 12/24 | $21,803 | $32,604 | $21,223 |
|---|
Average Annual Total Returns (%)Footnote Reference1
| Fund | 1 Year | 5 Years | 10 Years |
|---|
| Class A | 11.93% | 7.52% | 8.68% |
|---|
| Class A with 5.25% Maximum Sales Charge | 6.07% | 6.36% | 8.10% |
|---|
Russell 3000® Index | 23.81% | 13.85% | 12.53% |
|---|
Russell 2000® Index | 11.54% | 7.40% | 7.81% |
|---|
| Footnote | Description |
Footnote1 | In accordance with regulatory changes requiring the Fund's primary benchmark to represent the overall applicable market, the Fund's primary prospectus benchmark changed to the Russell 3000® Index effective May 1, 2024. |
Performance does not reflect the deduction of taxes that a shareholder would pay on Fund distributions or redemption of Fund shares. Performance assumes that all dividends and distributions, if any, were reinvested. For more recent performance information, visit www.eatonvance.com/performance.php.
THE FUND'S PAST PERFORMANCE IS NO GUARANTEE OF FUTURE RESULTS.
| Total Net Assets | $170,636,608 |
|---|
| # of Portfolio Holdings | 71 |
|---|
| Portfolio Turnover Rate | 38% |
|---|
| Total Advisory Fees Paid | $980,604 |
|---|
What did the Fund invest in?
The following tables reflect what the Fund invested in as of the report date.
Sector Allocation (% of total investments)
| Value | Value |
|---|
| Communication Services | 0.5% |
| Short-Term Investments | 2.1% |
| Utilities | 2.2% |
| Consumer Staples | 3.7% |
| Materials | 5.1% |
| Real Estate | 6.6% |
| Health Care | 8.7% |
| Information Technology | 9.1% |
| Consumer Discretionary | 14.1% |
| Financials | 23.9% |
| Industrials | 24.0% |
Top Ten Holdings (% of total investments)Footnote Referencea
| Commerce Bancshares, Inc. | 2.9% |
| Wyndham Hotels & Resorts, Inc. | 2.8% |
| CBIZ, Inc. | 2.8% |
| AptarGroup, Inc. | 2.7% |
| Essential Properties Realty Trust, Inc. | 2.7% |
| Dorman Products, Inc. | 2.5% |
| Community Financial System, Inc. | 2.5% |
| Core & Main, Inc., Class A | 2.4% |
| Stifel Financial Corp. | 2.3% |
| White Mountains Insurance Group Ltd. | 2.3% |
| Total | 25.9% |
| Footnote | Description |
Footnotea | Excluding cash equivalents |
If you wish to view additional information about the Fund, including the prospectus, statement of additional information, financial statements and holdings, please scan the QR code or visit www.eatonvance.com/open-end-mutual-fund-documents.php. For proxy information, please visit www.eatonvance.com/proxyvoting.
The Funds may deliver a single copy of certain required shareholder documents (including prospectuses, shareholder reports, and proxy materials) to investors with the same last name and the same address. Your participation will continue indefinitely unless you instruct otherwise by calling 1-800-262-1122 or by contacting your financial intermediary. Your instruction will typically be effective within 30 days of receipt.
Not FDIC Insured | May Lose Value | No Bank Guarantee
Annual Shareholder Report December 31, 2024
Eaton Vance Small-Cap Fund
Annual Shareholder Report December 31, 2024
This annual shareholder report contains important information about the Eaton Vance Small-Cap Fund for the period of January 1, 2024 to December 31, 2024. You can find additional information about the Fund at www.eatonvance.com/open-end-mutual-fund-documents.php. You can also request this information by contacting us at 1-800-262-1122.
What were the Fund costs for the last year?
(based on a hypothetical $10,000 investment)
| Class Name | Costs of a $10,000 investment | Costs paid as a percentage of a $10,000 investment |
|---|
| Class C | $207 | 1.96% |
|---|
How did the Fund perform last year and what affected its performance?
Key contributors to (↑) and detractors from (↓) performance, relative to the Russell 2000® Index (the Index): ↓ The Fund’s security selections in the information technology and health care sectors detracted from performance relative to the Index during the period ↓ The Fund’s underweight exposure to the information technology sector detracted from performance relative to the Index during the period ↓ An overweight exposure to Quaker Chemical Corp., a developer of industrial chemical products, hurt returns as soft demand led to declines in sales and prices ↓ Not owning Super Micro Computer Inc., a maker of computer servers and data storage, hurt returns as the company benefited from the artificial intelligence boom ↑ Sector allocations ― especially an underweight exposure to the health care sector and a lack of exposure to energy ― contributed to Index-relative performance ↑ Security selections ― particularly in the consumer discretionary and financials sectors ― contributed to returns relative to the Index during the period ↑ The Fund’s allocation to Dorman Products, Inc., a maker of aftermarket auto parts, helped returns as the company posted strong revenue and earnings growth �� An overweight exposure to industrial products maker CSW Industries, Inc. aided returns amid strategic business acquisitions, sales growth, and price increases
Comparison of the change in value of a $10,000 investment for the period indicated.
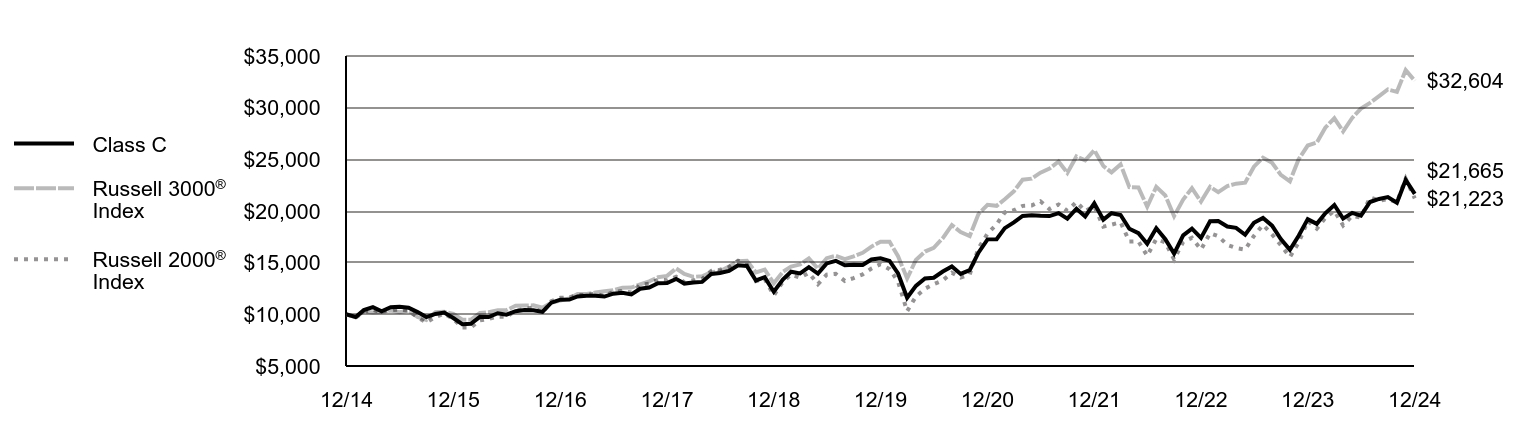
| Class C | Russell 3000® Index | Russell 2000® Index |
|---|
| 12/14 | $10,000 | $10,000 | $10,000 |
|---|
| 1/15 | $9,744 | $9,722 | $9,678 |
|---|
| 2/15 | $10,406 | $10,285 | $10,253 |
|---|
| 3/15 | $10,698 | $10,180 | $10,432 |
|---|
| 4/15 | $10,292 | $10,226 | $10,165 |
|---|
| 5/15 | $10,692 | $10,368 | $10,398 |
|---|
| 6/15 | $10,739 | $10,194 | $10,475 |
|---|
| 7/15 | $10,645 | $10,365 | $10,354 |
|---|
| 8/15 | $10,215 | $9,739 | $9,703 |
|---|
| 9/15 | $9,738 | $9,455 | $9,227 |
|---|
| 10/15 | $10,035 | $10,202 | $9,747 |
|---|
| 11/15 | $10,176 | $10,258 | $10,064 |
|---|
| 12/15 | $9,641 | $10,048 | $9,559 |
|---|
| 1/16 | $9,045 | $9,481 | $8,718 |
|---|
| 2/16 | $9,081 | $9,478 | $8,718 |
|---|
| 3/16 | $9,756 | $10,145 | $9,413 |
|---|
| 4/16 | $9,739 | $10,208 | $9,561 |
|---|
| 5/16 | $10,103 | $10,391 | $9,777 |
|---|
| 6/16 | $9,962 | $10,412 | $9,770 |
|---|
| 7/16 | $10,303 | $10,825 | $10,354 |
|---|
| 8/16 | $10,423 | $10,853 | $10,537 |
|---|
| 9/16 | $10,396 | $10,870 | $10,654 |
|---|
| 10/16 | $10,239 | $10,635 | $10,148 |
|---|
| 11/16 | $11,124 | $11,111 | $11,279 |
|---|
| 12/16 | $11,421 | $11,327 | $11,595 |
|---|
| 1/17 | $11,432 | $11,541 | $11,641 |
|---|
| 2/17 | $11,732 | $11,970 | $11,866 |
|---|
| 3/17 | $11,794 | $11,978 | $11,881 |
|---|
| 4/17 | $11,804 | $12,105 | $12,012 |
|---|
| 5/17 | $11,721 | $12,229 | $11,767 |
|---|
| 6/17 | $12,001 | $12,339 | $12,174 |
|---|
| 7/17 | $12,078 | $12,572 | $12,264 |
|---|
| 8/17 | $11,929 | $12,596 | $12,108 |
|---|
| 9/17 | $12,473 | $12,903 | $12,864 |
|---|
| 10/17 | $12,601 | $13,185 | $12,974 |
|---|
| 11/17 | $13,017 | $13,585 | $13,348 |
|---|
| 12/17 | $13,032 | $13,721 | $13,294 |
|---|
| 1/18 | $13,431 | $14,444 | $13,641 |
|---|
| 2/18 | $12,974 | $13,912 | $13,113 |
|---|
| 3/18 | $13,091 | $13,633 | $13,283 |
|---|
| 4/18 | $13,138 | $13,684 | $13,397 |
|---|
| 5/18 | $13,901 | $14,071 | $14,211 |
|---|
| 6/18 | $13,994 | $14,163 | $14,312 |
|---|
| 7/18 | $14,206 | $14,633 | $14,562 |
|---|
| 8/18 | $14,745 | $15,147 | $15,190 |
|---|
| 9/18 | $14,686 | $15,172 | $14,824 |
|---|
| 10/18 | $13,279 | $14,055 | $13,214 |
|---|
| 11/18 | $13,595 | $14,336 | $13,424 |
|---|
| 12/18 | $12,182 | $13,002 | $11,830 |
|---|
| 1/19 | $13,374 | $14,118 | $13,160 |
|---|
| 2/19 | $14,123 | $14,614 | $13,845 |
|---|
| 3/19 | $13,963 | $14,828 | $13,555 |
|---|
| 4/19 | $14,565 | $15,420 | $14,015 |
|---|
| 5/19 | $13,949 | $14,422 | $12,925 |
|---|
| 6/19 | $14,927 | $15,435 | $13,839 |
|---|
| 7/19 | $15,181 | $15,664 | $13,918 |
|---|
| 8/19 | $14,745 | $15,345 | $13,231 |
|---|
| 9/19 | $14,800 | $15,614 | $13,507 |
|---|
| 10/19 | $14,786 | $15,951 | $13,862 |
|---|
| 11/19 | $15,309 | $16,557 | $14,433 |
|---|
| 12/19 | $15,416 | $17,035 | $14,849 |
|---|
| 1/20 | $15,168 | $17,016 | $14,373 |
|---|
| 2/20 | $13,955 | $15,623 | $13,163 |
|---|
| 3/20 | $11,602 | $13,475 | $10,303 |
|---|
| 4/20 | $12,757 | $15,259 | $11,718 |
|---|
| 5/20 | $13,473 | $16,075 | $12,481 |
|---|
| 6/20 | $13,546 | $16,443 | $12,922 |
|---|
| 7/20 | $14,145 | $17,376 | $13,280 |
|---|
| 8/20 | $14,638 | $18,635 | $14,028 |
|---|
| 9/20 | $13,913 | $17,957 | $13,559 |
|---|
| 10/20 | $14,283 | $17,569 | $13,843 |
|---|
| 11/20 | $15,970 | $19,707 | $16,395 |
|---|
| 12/20 | $17,255 | $20,593 | $17,813 |
|---|
| 1/21 | $17,270 | $20,501 | $18,709 |
|---|
| 2/21 | $18,338 | $21,142 | $19,876 |
|---|
| 3/21 | $18,902 | $21,900 | $20,075 |
|---|
| 4/21 | $19,525 | $23,029 | $20,497 |
|---|
| 5/21 | $19,599 | $23,134 | $20,539 |
|---|
| 6/21 | $19,540 | $23,705 | $20,937 |
|---|
| 7/21 | $19,510 | $24,105 | $20,181 |
|---|
| 8/21 | $19,792 | $24,793 | $20,632 |
|---|
| 9/21 | $19,258 | $23,681 | $20,024 |
|---|
| 10/21 | $20,222 | $25,282 | $20,876 |
|---|
| 11/21 | $19,466 | $24,897 | $20,006 |
|---|
| 12/21 | $20,749 | $25,877 | $20,453 |
|---|
| 1/22 | $19,159 | $24,355 | $18,484 |
|---|
| 2/22 | $19,788 | $23,741 | $18,681 |
|---|
| 3/22 | $19,614 | $24,512 | $18,914 |
|---|
| 4/22 | $18,286 | $22,312 | $17,039 |
|---|
| 5/22 | $17,850 | $22,282 | $17,065 |
|---|
| 6/22 | $16,837 | $20,418 | $15,661 |
|---|
| 7/22 | $18,339 | $22,333 | $17,296 |
|---|
| 8/22 | $17,273 | $21,500 | $16,942 |
|---|
| 9/22 | $15,876 | $19,506 | $15,319 |
|---|
| 10/22 | $17,640 | $21,106 | $17,005 |
|---|
| 11/22 | $18,286 | $22,208 | $17,402 |
|---|
| 12/22 | $17,393 | $20,907 | $16,273 |
|---|
| 1/23 | $19,004 | $22,347 | $17,859 |
|---|
| 2/23 | $19,022 | $21,825 | $17,557 |
|---|
| 3/23 | $18,497 | $22,408 | $16,718 |
|---|
| 4/23 | $18,370 | $22,647 | $16,418 |
|---|
| 5/23 | $17,701 | $22,735 | $16,266 |
|---|
| 6/23 | $18,859 | $24,288 | $17,589 |
|---|
| 7/23 | $19,330 | $25,158 | $18,664 |
|---|
| 8/23 | $18,587 | $24,673 | $17,731 |
|---|
| 9/23 | $17,284 | $23,497 | $16,687 |
|---|
| 10/23 | $16,235 | $22,875 | $15,549 |
|---|
| 11/23 | $17,610 | $25,008 | $16,956 |
|---|
| 12/23 | $19,212 | $26,334 | $19,028 |
|---|
| 1/24 | $18,756 | $26,626 | $18,288 |
|---|
| 2/24 | $19,778 | $28,067 | $19,322 |
|---|
| 3/24 | $20,580 | $28,973 | $20,013 |
|---|
| 4/24 | $19,267 | $27,698 | $18,605 |
|---|
| 5/24 | $19,814 | $29,006 | $19,538 |
|---|
| 6/24 | $19,559 | $29,904 | $19,357 |
|---|
| 7/24 | $20,872 | $30,460 | $21,324 |
|---|
| 8/24 | $21,164 | $31,123 | $21,006 |
|---|
| 9/24 | $21,347 | $31,767 | $21,152 |
|---|
| 10/24 | $20,799 | $31,534 | $20,847 |
|---|
| 11/24 | $23,007 | $33,632 | $23,134 |
|---|
| 12/24 | $21,665 | $32,604 | $21,223 |
|---|
Average Annual Total Returns (%)Footnote Reference1
| Fund | 1 Year | 5 Years | 10 Years |
|---|
| Class C, with conversion to Class A after 8 years | 11.06% | 6.71% | 8.03% |
|---|
| Class C, with 1% Maximum Deferred Sales Charge and conversion to Class A after 8 years | 10.06% | 6.71% | 8.03% |
|---|
Russell 3000® Index | 23.81% | 13.85% | 12.53% |
|---|
Russell 2000® Index | 11.54% | 7.40% | 7.81% |
|---|
| Footnote | Description |
Footnote1 | In accordance with regulatory changes requiring the Fund's primary benchmark to represent the overall applicable market, the Fund's primary prospectus benchmark changed to the Russell 3000® Index effective May 1, 2024. |
Performance does not reflect the deduction of taxes that a shareholder would pay on Fund distributions or redemption of Fund shares. Performance assumes that all dividends and distributions, if any, were reinvested. For more recent performance information, visit www.eatonvance.com/performance.php.
THE FUND'S PAST PERFORMANCE IS NO GUARANTEE OF FUTURE RESULTS.
| Total Net Assets | $170,636,608 |
|---|
| # of Portfolio Holdings | 71 |
|---|
| Portfolio Turnover Rate | 38% |
|---|
| Total Advisory Fees Paid | $980,604 |
|---|
What did the Fund invest in?
The following tables reflect what the Fund invested in as of the report date.
Sector Allocation (% of total investments)
| Value | Value |
|---|
| Communication Services | 0.5% |
| Short-Term Investments | 2.1% |
| Utilities | 2.2% |
| Consumer Staples | 3.7% |
| Materials | 5.1% |
| Real Estate | 6.6% |
| Health Care | 8.7% |
| Information Technology | 9.1% |
| Consumer Discretionary | 14.1% |
| Financials | 23.9% |
| Industrials | 24.0% |
Top Ten Holdings (% of total investments)Footnote Referencea
| Commerce Bancshares, Inc. | 2.9% |
| Wyndham Hotels & Resorts, Inc. | 2.8% |
| CBIZ, Inc. | 2.8% |
| AptarGroup, Inc. | 2.7% |
| Essential Properties Realty Trust, Inc. | 2.7% |
| Dorman Products, Inc. | 2.5% |
| Community Financial System, Inc. | 2.5% |
| Core & Main, Inc., Class A | 2.4% |
| Stifel Financial Corp. | 2.3% |
| White Mountains Insurance Group Ltd. | 2.3% |
| Total | 25.9% |
| Footnote | Description |
Footnotea | Excluding cash equivalents |
If you wish to view additional information about the Fund, including the prospectus, statement of additional information, financial statements and holdings, please scan the QR code or visit www.eatonvance.com/open-end-mutual-fund-documents.php. For proxy information, please visit www.eatonvance.com/proxyvoting.
The Funds may deliver a single copy of certain required shareholder documents (including prospectuses, shareholder reports, and proxy materials) to investors with the same last name and the same address. Your participation will continue indefinitely unless you instruct otherwise by calling 1-800-262-1122 or by contacting your financial intermediary. Your instruction will typically be effective within 30 days of receipt.
Not FDIC Insured | May Lose Value | No Bank Guarantee
Annual Shareholder Report December 31, 2024
Eaton Vance Small-Cap Fund
Annual Shareholder Report December 31, 2024
This annual shareholder report contains important information about the Eaton Vance Small-Cap Fund for the period of January 1, 2024 to December 31, 2024. You can find additional information about the Fund at www.eatonvance.com/open-end-mutual-fund-documents.php. You can also request this information by contacting us at 1-800-262-1122.
What were the Fund costs for the last year?
(based on a hypothetical $10,000 investment)
| Class Name | Costs of a $10,000 investment | Costs paid as a percentage of a $10,000 investment |
|---|
| Class I | $102 | 0.96% |
|---|
How did the Fund perform last year and what affected its performance?
Key contributors to (↑) and detractors from (↓) performance, relative to the Russell 2000® Index (the Index): ↑ Sector allocations ― especially an underweight exposure to the health care sector and a lack of exposure to energy ― contributed to Index-relative performance ↑ Security selections ― particularly in the consumer discretionary and financials sectors ― contributed to returns relative to the Index during the period ↑ The Fund’s allocation to Dorman Products, Inc., a maker of aftermarket auto parts, helped returns as the company posted strong revenue and earnings growth ↑ An overweight exposure to industrial products maker CSW Industries, Inc. aided returns amid strategic business acquisitions, sales growth, and price increases ↓ The Fund’s security selections in the information technology and health care sectors detracted from performance relative to the Index during the period ↓ The Fund’s underweight exposure to the information technology sector detracted from performance relative to the Index during the period ↓ An overweight exposure to Quaker Chemical Corp., a developer of industrial chemical products, hurt returns as soft demand led to declines in sales and prices ↓ Not owning Super Micro Computer Inc., a maker of computer servers and data storage, hurt returns as the company benefited from the artificial intelligence boom
Comparison of the change in value of a $1,000,000 investment for the period indicated.
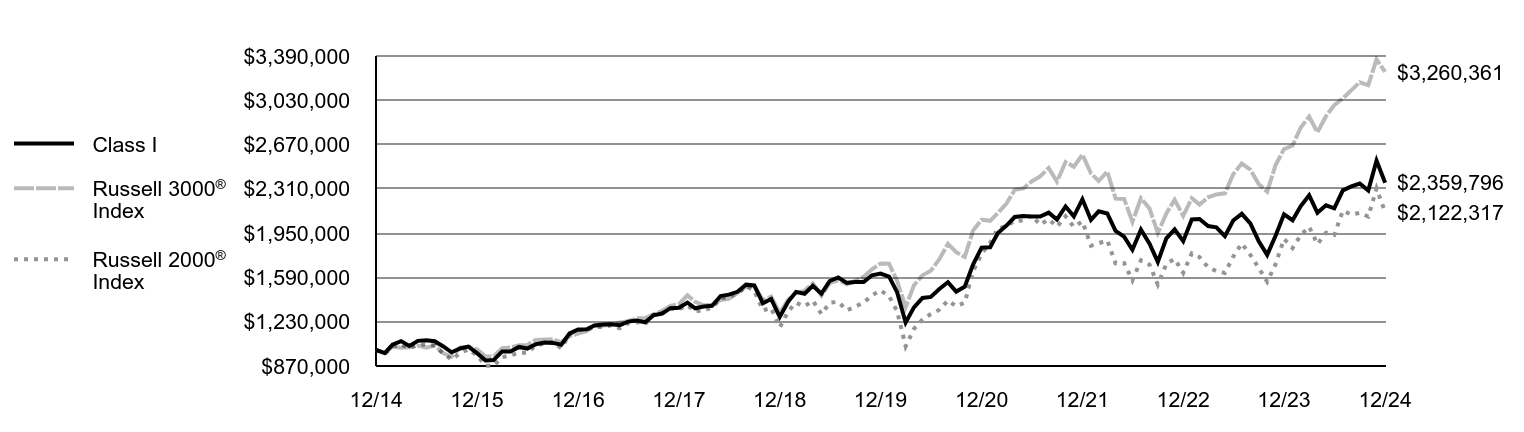
| Class I | Russell 3000® Index | Russell 2000® Index |
|---|
| 12/14 | $1,000,000 | $1,000,000 | $1,000,000 |
|---|
| 1/15 | $975,293 | $972,168 | $967,834 |
|---|
| 2/15 | $1,042,619 | $1,028,458 | $1,025,291 |
|---|
| 3/15 | $1,072,267 | $1,018,003 | $1,043,153 |
|---|
| 4/15 | $1,033,360 | $1,022,607 | $1,016,549 |
|---|
| 5/15 | $1,074,271 | $1,036,751 | $1,039,757 |
|---|
| 6/15 | $1,079,620 | $1,019,406 | $1,047,543 |
|---|
| 7/15 | $1,070,914 | $1,036,456 | $1,035,369 |
|---|
| 8/15 | $1,028,747 | $973,886 | $970,306 |
|---|
| 9/15 | $981,228 | $945,507 | $922,699 |
|---|
| 10/15 | $1,012,689 | $1,020,188 | $974,684 |
|---|
| 11/15 | $1,027,416 | $1,025,843 | $1,006,390 |
|---|
| 12/15 | $974,312 | $1,004,788 | $955,859 |
|---|
| 1/16 | $914,726 | $948,092 | $871,806 |
|---|
| 2/16 | $918,448 | $947,787 | $871,767 |
|---|
| 3/16 | $988,468 | $1,014,517 | $941,344 |
|---|
| 4/16 | $987,723 | $1,020,804 | $956,118 |
|---|
| 5/16 | $1,024,971 | $1,039,067 | $977,655 |
|---|
| 6/16 | $1,011,659 | $1,041,203 | $977,038 |
|---|
| 7/16 | $1,046,992 | $1,082,526 | $1,035,374 |
|---|
| 8/16 | $1,060,825 | $1,085,287 | $1,053,684 |
|---|
| 9/16 | $1,057,748 | $1,086,993 | $1,065,420 |
|---|
| 10/16 | $1,043,158 | $1,063,475 | $1,014,770 |
|---|
| 11/16 | $1,134,574 | $1,111,068 | $1,127,929 |
|---|
| 12/16 | $1,166,303 | $1,132,748 | $1,159,533 |
|---|
| 1/17 | $1,167,983 | $1,154,069 | $1,164,107 |
|---|
| 2/17 | $1,199,162 | $1,196,991 | $1,186,573 |
|---|
| 3/17 | $1,206,745 | $1,197,805 | $1,188,126 |
|---|
| 4/17 | $1,209,266 | $1,210,501 | $1,201,155 |
|---|
| 5/17 | $1,200,832 | $1,222,890 | $1,176,719 |
|---|
| 6/17 | $1,231,161 | $1,233,926 | $1,217,396 |
|---|
| 7/17 | $1,240,038 | $1,257,191 | $1,226,441 |
|---|
| 8/17 | $1,225,360 | $1,259,613 | $1,210,838 |
|---|
| 9/17 | $1,282,351 | $1,290,333 | $1,286,405 |
|---|
| 10/17 | $1,296,166 | $1,318,490 | $1,297,371 |
|---|
| 11/17 | $1,340,201 | $1,358,527 | $1,334,760 |
|---|
| 12/17 | $1,343,200 | $1,372,105 | $1,329,373 |
|---|
| 1/18 | $1,385,027 | $1,444,429 | $1,364,115 |
|---|
| 2/18 | $1,339,477 | $1,391,188 | $1,311,294 |
|---|
| 3/18 | $1,353,415 | $1,363,261 | $1,328,254 |
|---|
| 4/18 | $1,358,986 | $1,368,443 | $1,339,738 |
|---|
| 5/18 | $1,438,917 | $1,407,074 | $1,421,060 |
|---|
| 6/18 | $1,450,061 | $1,416,276 | $1,431,243 |
|---|
| 7/18 | $1,473,309 | $1,463,277 | $1,456,188 |
|---|
| 8/18 | $1,530,928 | $1,514,664 | $1,518,964 |
|---|
| 9/18 | $1,524,410 | $1,517,171 | $1,482,429 |
|---|
| 10/18 | $1,380,344 | $1,405,458 | $1,321,413 |
|---|
| 11/18 | $1,414,735 | $1,433,607 | $1,342,417 |
|---|
| 12/18 | $1,268,373 | $1,300,182 | $1,182,956 |
|---|
| 1/19 | $1,393,566 | $1,411,782 | $1,316,037 |
|---|
| 2/19 | $1,472,589 | $1,461,433 | $1,384,455 |
|---|
| 3/19 | $1,457,187 | $1,482,773 | $1,355,480 |
|---|
| 4/19 | $1,521,847 | $1,541,983 | $1,401,526 |
|---|
| 5/19 | $1,458,225 | $1,442,198 | $1,292,526 |
|---|
| 6/19 | $1,560,846 | $1,543,493 | $1,383,878 |
|---|
| 7/19 | $1,589,574 | $1,566,437 | $1,391,845 |
|---|
| 8/19 | $1,545,946 | $1,534,505 | $1,323,124 |
|---|
| 9/19 | $1,552,222 | $1,561,437 | $1,350,654 |
|---|
| 10/19 | $1,553,257 | $1,595,050 | $1,386,225 |
|---|
| 11/19 | $1,607,646 | $1,655,680 | $1,443,288 |
|---|
| 12/19 | $1,621,071 | $1,703,486 | $1,484,905 |
|---|
| 1/20 | $1,597,026 | $1,701,625 | $1,437,282 |
|---|
| 2/20 | $1,470,220 | $1,562,308 | $1,316,288 |
|---|
| 3/20 | $1,223,172 | $1,347,463 | $1,030,305 |
|---|
| 4/20 | $1,346,699 | $1,525,921 | $1,171,822 |
|---|
| 5/20 | $1,423,219 | $1,607,525 | $1,248,078 |
|---|
| 6/20 | $1,431,965 | $1,644,276 | $1,292,194 |
|---|
| 7/20 | $1,496,461 | $1,737,643 | $1,327,960 |
|---|
| 8/20 | $1,550,834 | $1,863,526 | $1,402,782 |
|---|
| 9/20 | $1,474,731 | $1,795,673 | $1,355,924 |
|---|
| 10/20 | $1,514,433 | $1,756,917 | $1,384,323 |
|---|
| 11/20 | $1,695,322 | $1,970,651 | $1,639,488 |
|---|
| 12/20 | $1,832,520 | $2,059,307 | $1,781,304 |
|---|
| 1/21 | $1,835,837 | $2,050,147 | $1,870,943 |
|---|
| 2/21 | $1,950,855 | $2,114,229 | $1,987,550 |
|---|
| 3/21 | $2,011,668 | $2,190,009 | $2,007,513 |
|---|
| 4/21 | $2,081,331 | $2,302,902 | $2,049,668 |
|---|
| 5/21 | $2,090,180 | $2,313,415 | $2,053,894 |
|---|
| 6/21 | $2,085,754 | $2,370,461 | $2,093,687 |
|---|
| 7/21 | $2,084,638 | $2,410,547 | $2,018,087 |
|---|
| 8/21 | $2,116,709 | $2,479,291 | $2,063,228 |
|---|
| 9/21 | $2,061,414 | $2,368,050 | $2,002,394 |
|---|
| 10/21 | $2,166,475 | $2,528,189 | $2,087,575 |
|---|
| 11/21 | $2,086,850 | $2,489,706 | $2,000,586 |
|---|
| 12/21 | $2,225,740 | $2,587,747 | $2,045,276 |
|---|
| 1/22 | $2,057,595 | $2,435,494 | $1,848,369 |
|---|
| 2/22 | $2,127,344 | $2,374,146 | $1,868,101 |
|---|
| 3/22 | $2,109,907 | $2,451,154 | $1,891,351 |
|---|
| 4/22 | $1,969,164 | $2,231,182 | $1,703,901 |
|---|
| 5/22 | $1,921,834 | $2,228,191 | $1,706,476 |
|---|
| 6/22 | $1,814,719 | $2,041,783 | $1,566,130 |
|---|
| 7/22 | $1,977,882 | $2,233,339 | $1,729,638 |
|---|
| 8/22 | $1,864,540 | $2,149,993 | $1,694,245 |
|---|
| 9/22 | $1,716,324 | $1,950,626 | $1,531,876 |
|---|
| 10/22 | $1,908,133 | $2,110,589 | $1,700,519 |
|---|
| 11/22 | $1,980,373 | $2,220,753 | $1,740,239 |
|---|
| 12/22 | $1,885,041 | $2,090,721 | $1,627,294 |
|---|
| 1/23 | $2,060,722 | $2,234,714 | $1,785,900 |
|---|
| 2/23 | $2,064,569 | $2,182,483 | $1,755,734 |
|---|
| 3/23 | $2,008,146 | $2,240,841 | $1,671,846 |
|---|
| 4/23 | $1,997,887 | $2,264,715 | $1,641,789 |
|---|
| 5/23 | $1,926,076 | $2,273,527 | $1,626,623 |
|---|
| 6/23 | $2,053,028 | $2,428,776 | $1,758,870 |
|---|
| 7/23 | $2,106,886 | $2,515,839 | $1,866,431 |
|---|
| 8/23 | $2,028,664 | $2,467,274 | $1,773,057 |
|---|
| 9/23 | $1,886,324 | $2,349,748 | $1,668,673 |
|---|
| 10/23 | $1,773,478 | $2,287,459 | $1,554,871 |
|---|
| 11/23 | $1,926,076 | $2,500,760 | $1,695,602 |
|---|
| 12/23 | $2,102,483 | $2,633,405 | $1,902,777 |
|---|
| 1/24 | $2,054,640 | $2,662,591 | $1,828,771 |
|---|
| 2/24 | $2,168,428 | $2,806,718 | $1,932,173 |
|---|
| 3/24 | $2,257,647 | $2,897,256 | $2,001,343 |
|---|
| 4/24 | $2,115,413 | $2,769,771 | $1,860,483 |
|---|
| 5/24 | $2,176,186 | $2,900,635 | $1,953,818 |
|---|
| 6/24 | $2,151,618 | $2,990,431 | $1,935,745 |
|---|
| 7/24 | $2,297,732 | $3,046,020 | $2,132,415 |
|---|
| 8/24 | $2,330,058 | $3,112,328 | $2,100,561 |
|---|
| 9/24 | $2,353,332 | $3,176,709 | $2,115,242 |
|---|
| 10/24 | $2,296,439 | $3,153,381 | $2,084,690 |
|---|
| 11/24 | $2,539,530 | $3,363,157 | $2,313,368 |
|---|
| 12/24 | $2,359,796 | $3,260,361 | $2,122,317 |
|---|
Average Annual Total Returns (%)Footnote Reference1
| Fund | 1 Year | 5 Years | 10 Years |
|---|
| Class I | 12.23% | 7.79% | 8.96% |
|---|
Russell 3000® Index | 23.81% | 13.85% | 12.53% |
|---|
Russell 2000® Index | 11.54% | 7.40% | 7.81% |
|---|
| Footnote | Description |
Footnote1 | In accordance with regulatory changes requiring the Fund's primary benchmark to represent the overall applicable market, the Fund's primary prospectus benchmark changed to the Russell 3000® Index effective May 1, 2024. |
Performance does not reflect the deduction of taxes that a shareholder would pay on Fund distributions or redemption of Fund shares. Performance assumes that all dividends and distributions, if any, were reinvested. For more recent performance information, visit www.eatonvance.com/performance.php.
THE FUND'S PAST PERFORMANCE IS NO GUARANTEE OF FUTURE RESULTS.
| Total Net Assets | $170,636,608 |
|---|
| # of Portfolio Holdings | 71 |
|---|
| Portfolio Turnover Rate | 38% |
|---|
| Total Advisory Fees Paid | $980,604 |
|---|
What did the Fund invest in?
The following tables reflect what the Fund invested in as of the report date.
Sector Allocation (% of total investments)
| Value | Value |
|---|
| Communication Services | 0.5% |
| Short-Term Investments | 2.1% |
| Utilities | 2.2% |
| Consumer Staples | 3.7% |
| Materials | 5.1% |
| Real Estate | 6.6% |
| Health Care | 8.7% |
| Information Technology | 9.1% |
| Consumer Discretionary | 14.1% |
| Financials | 23.9% |
| Industrials | 24.0% |
Top Ten Holdings (% of total investments)Footnote Referencea
| Commerce Bancshares, Inc. | 2.9% |
| Wyndham Hotels & Resorts, Inc. | 2.8% |
| CBIZ, Inc. | 2.8% |
| AptarGroup, Inc. | 2.7% |
| Essential Properties Realty Trust, Inc. | 2.7% |
| Dorman Products, Inc. | 2.5% |
| Community Financial System, Inc. | 2.5% |
| Core & Main, Inc., Class A | 2.4% |
| Stifel Financial Corp. | 2.3% |
| White Mountains Insurance Group Ltd. | 2.3% |
| Total | 25.9% |
| Footnote | Description |
Footnotea | Excluding cash equivalents |
If you wish to view additional information about the Fund, including the prospectus, statement of additional information, financial statements and holdings, please scan the QR code or visit www.eatonvance.com/open-end-mutual-fund-documents.php. For proxy information, please visit www.eatonvance.com/proxyvoting.
The Funds may deliver a single copy of certain required shareholder documents (including prospectuses, shareholder reports, and proxy materials) to investors with the same last name and the same address. Your participation will continue indefinitely unless you instruct otherwise by calling 1-800-262-1122 or by contacting your financial intermediary. Your instruction will typically be effective within 30 days of receipt.
Not FDIC Insured | May Lose Value | No Bank Guarantee
Annual Shareholder Report December 31, 2024
Eaton Vance Small-Cap Fund
Annual Shareholder Report December 31, 2024
This annual shareholder report contains important information about the Eaton Vance Small-Cap Fund for the period of January 1, 2024 to December 31, 2024. You can find additional information about the Fund at www.eatonvance.com/open-end-mutual-fund-documents.php. You can also request this information by contacting us at 1-800-262-1122.
What were the Fund costs for the last year?
(based on a hypothetical $10,000 investment)
| Class Name | Costs of a $10,000 investment | Costs paid as a percentage of a $10,000 investment |
|---|
| Class R | $154 | 1.46% |
|---|
How did the Fund perform last year and what affected its performance?
Key contributors to (↑) and detractors from (↓) performance, relative to the Russell 2000® Index (the Index): ↑ Sector allocations ― especially an underweight exposure to the health care sector and a lack of exposure to energy ― contributed to Index-relative performance ↑ Security selections ― particularly in the consumer discretionary and financials sectors ― contributed to returns relative to the Index during the period ↑ The Fund’s allocation to Dorman Products, Inc., a maker of aftermarket auto parts, helped returns as the company posted strong revenue and earnings growth ↑ An overweight exposure to industrial products maker CSW Industries, Inc. aided returns amid strategic business acquisitions, sales growth, and price increases ↓ The Fund’s security selections in the information technology and health care sectors detracted from performance relative to the Index during the period ↓ The Fund’s underweight exposure to the information technology sector detracted from performance relative to the Index during the period ↓ An overweight exposure to Quaker Chemical Corp., a developer of industrial chemical products, hurt returns as soft demand led to declines in sales and prices ↓ Not owning Super Micro Computer Inc., a maker of computer servers and data storage, hurt returns as the company benefited from the artificial intelligence boom
Comparison of the change in value of a $10,000 investment for the period indicated.
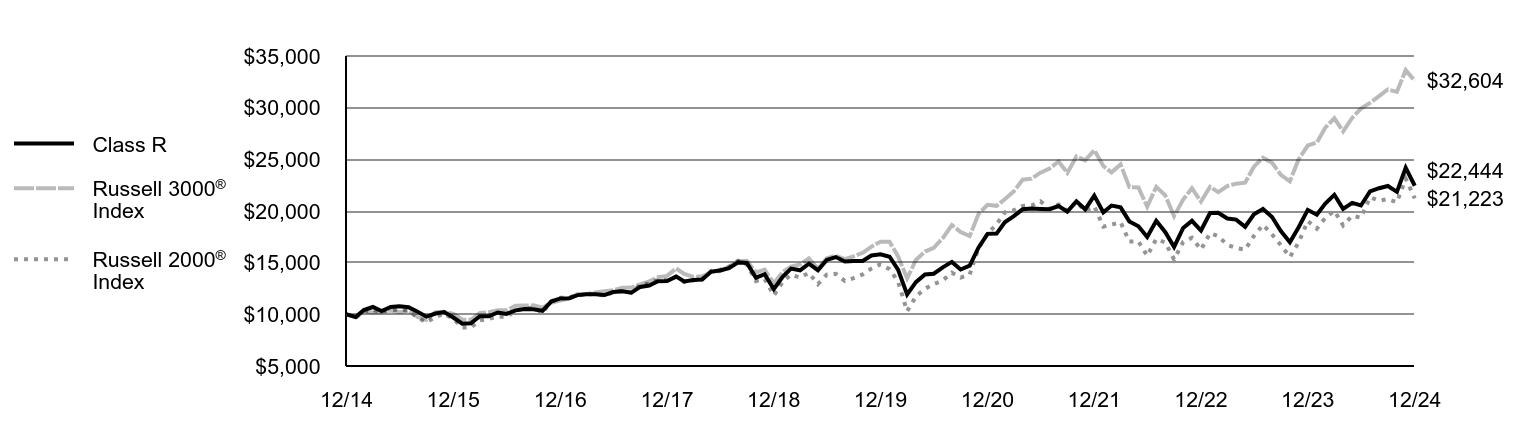
| Class R | Russell 3000® Index | Russell 2000® Index |
|---|
| 12/14 | $10,000 | $10,000 | $10,000 |
|---|
| 1/15 | $9,748 | $9,722 | $9,678 |
|---|
| 2/15 | $10,419 | $10,285 | $10,253 |
|---|
| 3/15 | $10,711 | $10,180 | $10,432 |
|---|
| 4/15 | $10,312 | $10,226 | $10,165 |
|---|
| 5/15 | $10,719 | $10,368 | $10,398 |
|---|
| 6/15 | $10,770 | $10,194 | $10,475 |
|---|
| 7/15 | $10,683 | $10,365 | $10,354 |
|---|
| 8/15 | $10,248 | $9,739 | $9,703 |
|---|
| 9/15 | $9,777 | $9,455 | $9,227 |
|---|
| 10/15 | $10,081 | $10,202 | $9,747 |
|---|
| 11/15 | $10,226 | $10,258 | $10,064 |
|---|
| 12/15 | $9,695 | $10,048 | $9,559 |
|---|
| 1/16 | $9,092 | $9,481 | $8,718 |
|---|
| 2/16 | $9,133 | $9,478 | $8,718 |
|---|
| 3/16 | $9,825 | $10,145 | $9,413 |
|---|
| 4/16 | $9,809 | $10,208 | $9,561 |
|---|
| 5/16 | $10,176 | $10,391 | $9,777 |
|---|
| 6/16 | $10,038 | $10,412 | $9,770 |
|---|
| 7/16 | $10,384 | $10,825 | $10,354 |
|---|
| 8/16 | $10,519 | $10,853 | $10,537 |
|---|
| 9/16 | $10,485 | $10,870 | $10,654 |
|---|
| 10/16 | $10,342 | $10,635 | $10,148 |
|---|
| 11/16 | $11,235 | $11,111 | $11,279 |
|---|
| 12/16 | $11,541 | $11,327 | $11,595 |
|---|
| 1/17 | $11,560 | $11,541 | $11,641 |
|---|
| 2/17 | $11,859 | $11,970 | $11,866 |
|---|
| 3/17 | $11,933 | $11,978 | $11,881 |
|---|
| 4/17 | $11,952 | $12,105 | $12,012 |
|---|
| 5/17 | $11,868 | $12,229 | $11,767 |
|---|
| 6/17 | $12,158 | $12,339 | $12,174 |
|---|
| 7/17 | $12,237 | $12,572 | $12,264 |
|---|
| 8/17 | $12,093 | $12,596 | $12,108 |
|---|
| 9/17 | $12,650 | $12,903 | $12,864 |
|---|
| 10/17 | $12,785 | $13,185 | $12,974 |
|---|
| 11/17 | $13,207 | $13,585 | $13,348 |
|---|
| 12/17 | $13,231 | $13,721 | $13,294 |
|---|
| 1/18 | $13,649 | $14,444 | $13,641 |
|---|
| 2/18 | $13,189 | $13,912 | $13,113 |
|---|
| 3/18 | $13,314 | $13,633 | $13,283 |
|---|
| 4/18 | $13,367 | $13,684 | $13,397 |
|---|
| 5/18 | $14,139 | $14,071 | $14,211 |
|---|
| 6/18 | $14,244 | $14,163 | $14,312 |
|---|
| 7/18 | $14,474 | $14,633 | $14,562 |
|---|
| 8/18 | $15,027 | $15,147 | $15,190 |
|---|
| 9/18 | $14,964 | $15,172 | $14,824 |
|---|
| 10/18 | $13,544 | $14,055 | $13,214 |
|---|
| 11/18 | $13,878 | $14,336 | $13,424 |
|---|
| 12/18 | $12,432 | $13,002 | $11,830 |
|---|
| 1/19 | $13,661 | $14,118 | $13,160 |
|---|
| 2/19 | $14,422 | $14,614 | $13,845 |
|---|
| 3/19 | $14,258 | $14,828 | $13,555 |
|---|
| 4/19 | $14,902 | $15,420 | $14,015 |
|---|
| 5/19 | $14,270 | $14,422 | $12,925 |
|---|
| 6/19 | $15,265 | $15,435 | $13,839 |
|---|
| 7/19 | $15,545 | $15,664 | $13,918 |
|---|
| 8/19 | $15,106 | $15,345 | $13,231 |
|---|
| 9/19 | $15,154 | $15,614 | $13,507 |
|---|
| 10/19 | $15,166 | $15,951 | $13,862 |
|---|
| 11/19 | $15,693 | $16,557 | $14,433 |
|---|
| 12/19 | $15,810 | $17,035 | $14,849 |
|---|
| 1/20 | $15,571 | $17,016 | $14,373 |
|---|
| 2/20 | $14,335 | $15,623 | $13,163 |
|---|
| 3/20 | $11,927 | $13,475 | $10,303 |
|---|
| 4/20 | $13,112 | $15,259 | $11,718 |
|---|
| 5/20 | $13,856 | $16,075 | $12,481 |
|---|
| 6/20 | $13,932 | $16,443 | $12,922 |
|---|
| 7/20 | $14,550 | $17,376 | $13,280 |
|---|
| 8/20 | $15,076 | $18,635 | $14,028 |
|---|
| 9/20 | $14,337 | $17,957 | $13,559 |
|---|
| 10/20 | $14,706 | $17,569 | $13,843 |
|---|
| 11/20 | $16,452 | $19,707 | $16,395 |
|---|
| 12/20 | $17,788 | $20,593 | $17,813 |
|---|
| 1/21 | $17,814 | $20,501 | $18,709 |
|---|
| 2/21 | $18,912 | $21,142 | $19,876 |
|---|
| 3/21 | $19,500 | $21,900 | $20,075 |
|---|
| 4/21 | $20,164 | $23,029 | $20,497 |
|---|
| 5/21 | $20,240 | $23,134 | $20,539 |
|---|
| 6/21 | $20,202 | $23,705 | $20,937 |
|---|
| 7/21 | $20,176 | $24,105 | $20,181 |
|---|
| 8/21 | $20,483 | $24,793 | $20,632 |
|---|
| 9/21 | $19,934 | $23,681 | $20,024 |
|---|
| 10/21 | $20,942 | $25,282 | $20,876 |
|---|
| 11/21 | $20,163 | $24,897 | $20,006 |
|---|
| 12/21 | $21,492 | $25,877 | $20,453 |
|---|
| 1/22 | $19,868 | $24,355 | $18,484 |
|---|
| 2/22 | $20,527 | $23,741 | $18,681 |
|---|
| 3/22 | $20,351 | $24,512 | $18,914 |
|---|
| 4/22 | $18,991 | $22,312 | $17,039 |
|---|
| 5/22 | $18,522 | $22,282 | $17,065 |
|---|
| 6/22 | $17,484 | $20,418 | $15,661 |
|---|
| 7/22 | $19,049 | $22,333 | $17,296 |
|---|
| 8/22 | $17,952 | $21,500 | $16,942 |
|---|
| 9/22 | $16,518 | $19,506 | $15,319 |
|---|
| 10/22 | $18,362 | $21,106 | $17,005 |
|---|
| 11/22 | $19,049 | $22,208 | $17,402 |
|---|
| 12/22 | $18,112 | $20,907 | $16,273 |
|---|
| 1/23 | $19,801 | $22,347 | $17,859 |
|---|
| 2/23 | $19,832 | $21,825 | $17,557 |
|---|
| 3/23 | $19,274 | $22,408 | $16,718 |
|---|
| 4/23 | $19,168 | $22,647 | $16,418 |
|---|
| 5/23 | $18,474 | $22,735 | $16,266 |
|---|
| 6/23 | $19,681 | $24,288 | $17,589 |
|---|
| 7/23 | $20,194 | $25,158 | $18,664 |
|---|
| 8/23 | $19,424 | $24,673 | $17,731 |
|---|
| 9/23 | $18,052 | $23,497 | $16,687 |
|---|
| 10/23 | $16,981 | $22,875 | $15,549 |
|---|
| 11/23 | $18,429 | $25,008 | $16,956 |
|---|
| 12/23 | $20,111 | $26,334 | $19,028 |
|---|
| 1/24 | $19,640 | $26,626 | $18,288 |
|---|
| 2/24 | $20,718 | $28,067 | $19,322 |
|---|
| 3/24 | $21,568 | $28,973 | $20,013 |
|---|
| 4/24 | $20,202 | $27,698 | $18,605 |
|---|
| 5/24 | $20,779 | $29,006 | $19,538 |
|---|
| 6/24 | $20,536 | $29,904 | $19,357 |
|---|
| 7/24 | $21,902 | $30,460 | $21,324 |
|---|
| 8/24 | $22,205 | $31,123 | $21,006 |
|---|
| 9/24 | $22,418 | $31,767 | $21,152 |
|---|
| 10/24 | $21,856 | $31,534 | $20,847 |
|---|
| 11/24 | $24,179 | $33,632 | $23,134 |
|---|
| 12/24 | $22,444 | $32,604 | $21,223 |
|---|
Average Annual Total Returns (%)Footnote Reference1
| Fund | 1 Year | 5 Years | 10 Years |
|---|
| Class R | 11.61% | 7.25% | 8.41% |
|---|
Russell 3000® Index | 23.81% | 13.85% | 12.53% |
|---|
Russell 2000® Index | 11.54% | 7.40% | 7.81% |
|---|
| Footnote | Description |
Footnote1 | In accordance with regulatory changes requiring the Fund's primary benchmark to represent the overall applicable market, the Fund's primary prospectus benchmark changed to the Russell 3000® Index effective May 1, 2024. |
Performance does not reflect the deduction of taxes that a shareholder would pay on Fund distributions or redemption of Fund shares. Performance assumes that all dividends and distributions, if any, were reinvested. For more recent performance information, visit www.eatonvance.com/performance.php.
THE FUND'S PAST PERFORMANCE IS NO GUARANTEE OF FUTURE RESULTS.
| Total Net Assets | $170,636,608 |
|---|
| # of Portfolio Holdings | 71 |
|---|
| Portfolio Turnover Rate | 38% |
|---|
| Total Advisory Fees Paid | $980,604 |
|---|
What did the Fund invest in?
The following tables reflect what the Fund invested in as of the report date.
Sector Allocation (% of total investments)
| Value | Value |
|---|
| Communication Services | 0.5% |
| Short-Term Investments | 2.1% |
| Utilities | 2.2% |
| Consumer Staples | 3.7% |
| Materials | 5.1% |
| Real Estate | 6.6% |
| Health Care | 8.7% |
| Information Technology | 9.1% |
| Consumer Discretionary | 14.1% |
| Financials | 23.9% |
| Industrials | 24.0% |
Top Ten Holdings (% of total investments)Footnote Referencea
| Commerce Bancshares, Inc. | 2.9% |
| Wyndham Hotels & Resorts, Inc. | 2.8% |
| CBIZ, Inc. | 2.8% |
| AptarGroup, Inc. | 2.7% |
| Essential Properties Realty Trust, Inc. | 2.7% |
| Dorman Products, Inc. | 2.5% |
| Community Financial System, Inc. | 2.5% |
| Core & Main, Inc., Class A | 2.4% |
| Stifel Financial Corp. | 2.3% |
| White Mountains Insurance Group Ltd. | 2.3% |
| Total | 25.9% |
| Footnote | Description |
Footnotea | Excluding cash equivalents |
If you wish to view additional information about the Fund, including the prospectus, statement of additional information, financial statements and holdings, please scan the QR code or visit www.eatonvance.com/open-end-mutual-fund-documents.php. For proxy information, please visit www.eatonvance.com/proxyvoting.
The Funds may deliver a single copy of certain required shareholder documents (including prospectuses, shareholder reports, and proxy materials) to investors with the same last name and the same address. Your participation will continue indefinitely unless you instruct otherwise by calling 1-800-262-1122 or by contacting your financial intermediary. Your instruction will typically be effective within 30 days of receipt.
Not FDIC Insured | May Lose Value | No Bank Guarantee
Annual Shareholder Report December 31, 2024
The registrant (sometimes referred to as the “Fund”) has adopted a code of ethics applicable to its Principal Executive Officer, Principal Financial Officer and Principal Accounting Officer. The registrant undertakes to provide a copy of such code of ethics to any person upon request, without charge, by calling 1-800-262-1122. The registrant has not amended the code of ethics as described in Form N-CSR during the period covered by this report. The registrant has not granted any waiver, including an implicit waiver, from a provision of the code of ethics as described in Form N-CSR during the period covered by this report.
| Item 3. | Audit Committee Financial Expert |
The registrant’s Board of Trustees (the “Board”) has designated George J. Gorman and Scott E. Wennerholm, each an independent trustee, as audit committee financial experts. Mr. Gorman is a certified public accountant who is the Principal at George J. Gorman LLC (a consulting firm). Previously, Mr. Gorman served in various capacities at Ernst & Young LLP (a registered public accounting firm), including as Senior Partner. Mr. Gorman also has experience serving as an independent trustee and audit committee financial expert of other mutual fund complexes. Mr. Wennerholm is a private investor. Previously, Mr. Wennerholm served as a Trustee at Wheelock College (postsecondary institution), as a Consultant at GF Parish Group (executive recruiting firm), Chief Operating Officer and Executive Vice President at BNY Mellon Asset Management (investment management firm), Chief Operating Officer and Chief Financial Officer at Natixis Global Asset Management (investment management firm), and Vice President at Fidelity Investments Institutional Services (investment management firm).
| Item 4. | Principal Accountant Fees and Services |
Eaton Vance Balanced Fund, Eaton Vance Core Bond Fund, Eaton Vance Dividend Builder Fund, Eaton Vance Greater India Fund, Eaton Vance Growth Fund, Eaton Vance Large-Cap Value Fund and Eaton Vance Small-Cap Fund (the “Fund(s)”) are series of Eaton Vance Special Investment Trust (the “Trust”), a Massachusetts business trust, which, including the Funds, contains a total of 8 series (the “Series”). The Trust is registered under the Investment Company Act of 1940 as an open-end management investment company. This Form N-CSR relates to the Funds’ annual reports.
(a)-(d)
The following tables present the aggregate fees billed to each Fund for each Fund’s fiscal years ended December 31, 2023 and December 31, 2024 by the registrant’s principal accountant, Deloitte & Touche LLP (“D&T”), for professional services rendered for the audit of the Funds’ annual financial statements and fees billed for other services rendered by D&T during those periods.
Eaton Vance Balanced Fund
| | | | | | | | |
Fiscal Years Ended | | 12/31/23 | | | 12/31/24 | |
Audit Fees | | $ | 28,100 | | | $ | 38,200 | |
Audit-Related Fees(1) | | $ | 0 | | | $ | 0 | |
Tax Fees(2) | | $ | 0 | | | $ | 0 | |
All Other Fees(3) | | $ | 0 | | | $ | 0 | |
| | | | | | | | |
Total | | $ | 28,100 | | | $ | 38,200 | |
| | | | | | | | |
Eaton Vance Core Bond Fund
| | | | | | | | |
Fiscal Years Ended | | 12/31/23 | | | 12/31/24 | |
Audit Fees | | $ | 18,200 | | | $ | 23,700 | |
Audit-Related Fees(1) | | $ | 0 | | | $ | 0 | |
Tax Fees(2) | | $ | 0 | | | $ | 0 | |
All Other Fees(3) | | $ | 0 | | | $ | 0 | |
| | | | | | | | |
Total | | $ | 18,200 | | | $ | 23,700 | |
| | | | | | | | |
Eaton Vance Dividend Builder Fund
| | | | | | | | |
Fiscal Years Ended | | 12/31/23 | | | 12/31/24 | |
Audit Fees | | $ | 44,200 | | | $ | 49,600 | |
Audit-Related Fees(1) | | $ | 0 | | | $ | 0 | |
Tax Fees(2) | | $ | 0 | | | $ | 0 | |
All Other Fees(3) | | $ | 0 | | | $ | 0 | |
| | | | | | | | |
Total | | $ | 44,200 | | | $ | 49,600 | |
| | | | | | | | |
Eaton Vance Greater India Fund
| | | | | | | | |
Fiscal Years Ended | | 12/31/23 | | | 12/31/24 | |
Audit Fees | | $ | 19,400 | | | $ | 23,700 | |
Audit-Related Fees(1) | | $ | 0 | | | $ | 0 | |
Tax Fees(2) | | $ | 0 | | | $ | 0 | |
All Other Fees(3) | | $ | 0 | | | $ | 0 | |
| | | | | | | | |
Total | | $ | 19,400 | | | $ | 23,700 | |
| | | | | | | | |
Eaton Vance Growth Fund
| | | | | | | | |
Fiscal Years Ended | | 12/31/23 | | | 12/31/24 | |
Audit Fees | | $ | 30,900 | | | $ | 35,100 | |
Audit-Related Fees(1) | | $ | 0 | | | $ | 0 | |
Tax Fees(2) | | $ | 0 | | | $ | 0 | |
All Other Fees(3) | | $ | 0 | | | $ | 0 | |
| | | | | | | | |
Total | | $ | 30,900 | | | $ | 35,100 | |
| | | | | | | | |
Eaton Vance Large-Cap Value Fund
| | | | | | | | |
Fiscal Years Ended | | 12/31/23 | | | 12/31/24 | |
Audit Fees | | $ | 43,600 | | | $ | 49,600 | |
Audit-Related Fees(1) | | $ | 0 | | | $ | 0 | |
Tax Fees(2) | | $ | 0 | | | $ | 0 | |
All Other Fees(3) | | $ | 0 | | | $ | 0 | |
| | | | | | | | |
Total | | $ | 43,600 | | | $ | 49,600 | |
| | | | | | | | |
Eaton Vance Small-Cap Fund
| | | | | | | | |
Fiscal Years Ended | | 12/31/23 | | | 12/31/24 | |
Audit Fees | | $ | 31,900 | | | $ | 35,100 | |
Audit-Related Fees(1) | | $ | 0 | | | $ | 0 | |
Tax Fees(2) | | $ | 0 | | | $ | 0 | |
All Other Fees(3) | | $ | 0 | | | $ | 0 | |
| | | | | | | | |
Total | | $ | 31,900 | | | $ | 35,100 | |
| | | | | | | | |
| (1) | Audit-related fees consist of the aggregate fees billed for assurance and related services that are reasonably related to the performance of the audit of the registrant’s financial statements and are not reported under the category of audit fees. |
| (2) | Tax fees consist of the aggregate fees billed for professional services rendered by the principal accountant relating to tax compliance, tax advice, and tax planning and specifically include fees for tax return preparation and other related tax compliance/planning matters. |
| (3) | All other fees consist of the aggregate fees billed for products and services provided by the principal accountant other than audit, audit-related, and tax services. |
The various Series comprising the Trust have varying fiscal year ends (October 31 and December 31). The following table presents the aggregate audit, audit-related, tax, and other fees billed to all of the Series in the Trust by D&T for the last two fiscal years of each Series.
| | | | | | | | | | | | | | | | |
Fiscal Years Ended | | 10/31/23 | | | 12/31/23 | | | 10/31/24 | | | 12/31/24 | |
Audit Fees | | $ | 26,900 | | | $ | 216,300 | | | $ | 23,700 | | | $ | 255,000 | |
Audit-Related Fees(1) | | $ | 0 | | | $ | 0 | | | $ | 0 | | | $ | 0 | |
Tax Fees(2) | | $ | 0 | | | $ | 0 | | | $ | 0 | | | $ | 0 | |
All Other Fees(3) | | $ | 0 | | | $ | 0 | | | $ | 0 | | | $ | 0 | |
| | | | | | | | | | | | | | | | |
Total | | $ | 26,900 | | | $ | 216,300 | | | $ | 23,700 | | | $ | 255,000 | |
| | | | | | | | | | | | | | | | |
| (1) | Audit-related fees consist of the aggregate fees billed for assurance and related services that are reasonably related to the performance of the audit of the registrant’s financial statements and are not reported under the category of audit fees. |
| (2) | Tax fees consist of the aggregate fees billed for professional services rendered by the principal accountant relating to tax compliance, tax advice, and tax planning and specifically include fees for tax return preparation and other related tax compliance/planning matters. |
| (3) | All other fees consist of the aggregate fees billed for products and services provided by the principal accountant other than audit, audit-related, and tax services. |
(e)(1) The registrant’s audit committee has adopted policies and procedures relating to the pre-approval of services provided by the registrant’s principal accountant (the “Pre-Approval Policies”). The Pre-Approval Policies establish a framework intended to assist the audit committee in the proper discharge of its pre-approval responsibilities. As a general matter, the Pre-Approval Policies (i) specify certain types of audit, audit-related, tax, and other services determined to be pre-approved by the audit committee; and (ii) delineate specific procedures governing the mechanics of the pre-approval process, including the approval and monitoring of audit and non-audit service fees. Unless a service is specifically pre-approved under the Pre-Approval Policies, it must be separately pre-approved by the audit committee.
The Pre-Approval Policies and the types of audit and non-audit services pre-approved therein must be reviewed and ratified by the registrant’s audit committee at least annually. The registrant’s audit committee maintains full responsibility for the appointment, compensation, and oversight of the work of the registrant’s principal accountant.
(e)(2) No services described in paragraphs (b)-(d) above were approved by the registrant’s audit committee pursuant to the “de minimis exception” set forth in Rule 2-01(c)(7)(i)(C) of Regulation S-X.
(f) Not applicable.
(g) The following table presents (i) the aggregate non-audit fees (i.e., fees for audit-related, tax, and other services) billed for services rendered to all of the Series in the Trust by D&T for the last two fiscal years of each Series; and (ii) the aggregate non-audit fees (i.e., fees for audit-related, tax, and other services) billed for services rendered to the Eaton Vance organization by D&T for the last 2 fiscal years of each Series.
| | | | | | | | | | | | | | | | |
Fiscal Years Ended | | 10/31/23 | | | 12/31/23 | | | 10/31/24 | | | 12/31/24 | |
Registrant(1) | | $ | 0 | | | $ | 0 | | | $ | 0 | | | $ | 0 | |
Eaton Vance(2) | | $ | 0 | | | $ | 0 | | | $ | 18,490 | | | $ | 18,490 | |
| (1) | Includes all of the Series of the Trust. During the fiscal years reported above, certain of the Funds were “feeder” funds in a “master-feeder” fund structure or funds of funds. |
| (2) | Various subsidiaries of Morgan Stanley act in either an investment advisory and/or service provider capacity with respect to the Series and/or their respective “master” funds (if applicable). |
(h) The registrant’s audit committee has considered whether the provision by the registrant’s principal accountant of non-audit services to the registrant’s investment adviser and any entity controlling, controlled by, or under common control with the adviser that provides ongoing services to the registrant that were not pre-approved pursuant to Rule 2-01(c)(7)(ii) of Regulation S-X is compatible with maintaining the principal accountant’s independence.
(i) Not applicable.
(j) Not applicable.
| Item 5. | Audit Committee of Listed Registrants |
Not applicable.
| Item 6. | Schedule of Investments |
| (a) | Please see schedule of investments contained in the Financial Statements and Financial Highlights included under Item 7 of this Form N-CSR. |
| Item 7. | Financial Statements and Financial Highlights for Open-End Management Investment Companies |
Eaton Vance
Balanced Fund
Annual Financial Statements and
Additional Information
December 31, 2024
This report must be preceded or accompanied by a current summary prospectus or prospectus. Before investing, investors should consider carefully the investment objective, risks, and charges and expenses of a mutual fund. This and other important information is contained in the prospectus and/or statement of additional information, which can be obtained by calling 1-800-262-1122 or from a financial intermediary. Prospective investors should read the prospectus carefully before investing.
Annual Financial Statements and Additional Information December 31, 2024
Eaton Vance
Balanced Fund
Items 8, 9 and 11 of Form N-CSR are Not Applicable. For Item 10 of Form N-CSR, see Item 7.
Eaton Vance
Balanced Fund
December 31, 2024
Statement of Assets and Liabilities
| | December 31, 2024 |
| Assets | |
Investment in Core Bond Portfolio, at value
(identified cost, $390,895,207) | $364,555,004 |
Investment in Stock Portfolio, at value
(identified cost, $371,318,764) | 648,383,227 |
| Receivable for Fund shares sold | 1,511,305 |
| Total assets | $1,014,449,536 |
| Liabilities | |
| Payable for Fund shares redeemed | $753,207 |
| Payable to affiliates: | |
| Administration fee | 34,795 |
| Distribution and service fees | 221,665 |
| Trustees' fees | 125 |
| Payable for transfer and dividend disbursing agent fees | 119,240 |
| Accrued expenses | 130,074 |
| Total liabilities | $1,259,106 |
| Net Assets | $1,013,190,430 |
| Sources of Net Assets | |
| Paid-in capital | $715,302,937 |
| Distributable earnings | 297,887,493 |
| Net Assets | $1,013,190,430 |
| Class A Shares | |
| Net Assets | $481,330,062 |
| Shares Outstanding | 40,810,401 |
Net Asset Value and Redemption Price Per Share
(net assets ÷ shares of beneficial interest outstanding) | $11.79 |
Maximum Offering Price Per Share
(100 ÷ 94.75 of net asset value per share) | $12.44 |
| Class C Shares | |
| Net Assets | $127,559,669 |
| Shares Outstanding | 10,748,185 |
Net Asset Value and Offering Price Per Share*
(net assets ÷ shares of beneficial interest outstanding) | $11.87 |
| Class I Shares | |
| Net Assets | $379,081,934 |
| Shares Outstanding | 32,118,924 |
Net Asset Value, Offering Price and Redemption Price Per Share
(net assets ÷ shares of beneficial interest outstanding) | $11.80 |
| Class R Shares | |
| Net Assets | $16,662,246 |
| Shares Outstanding | 1,419,603 |
Net Asset Value, Offering Price and Redemption Price Per Share
(net assets ÷ shares of beneficial interest outstanding) | $11.74 |
1
See Notes to Financial Statements.
Eaton Vance
Balanced Fund
December 31, 2024
Statement of Assets and Liabilities — continued
| | December 31, 2024 |
| Class R6 Shares | |
| Net Assets | $8,556,519 |
| Shares Outstanding | 724,843 |
Net Asset Value, Offering Price and Redemption Price Per Share
(net assets ÷ shares of beneficial interest outstanding) | $11.80 |
| On sales of $50,000 or more, the offering price of Class A shares is reduced. |
| * | Redemption price per share is equal to the net asset value less any applicable contingent deferred sales charge. |
2
See Notes to Financial Statements.
Eaton Vance
Balanced Fund
December 31, 2024
| | Year Ended |
| | December 31, 2024 |
| Investment Income | |
| Dividend income allocated from Portfolios (net of foreign taxes withheld of $36,762) | $6,175,427 |
| Interest income allocated from Portfolios | 15,022,872 |
| Expenses allocated from Portfolios | (5,463,618) |
| Total investment income from Portfolios | $15,734,681 |
| Expenses | |
| Administration fee | $375,826 |
| Distribution and service fees: | |
| Class A | 1,116,866 |
| Class C | 1,378,155 |
| Class R | 77,888 |
| Trustees’ fees and expenses | 500 |
| Custodian fee | 58,817 |
| Transfer and dividend disbursing agent fees | 560,072 |
| Legal and accounting services | 82,841 |
| Printing and postage | 62,384 |
| Registration fees | 101,830 |
| Miscellaneous | 21,756 |
| Total expenses | $3,836,935 |
| Net investment income | $11,897,746 |
| Realized and Unrealized Gain (Loss) from Portfolios | |
| Net realized gain (loss): | |
| Investment transactions | $55,631,683 |
| Futures contracts | (2,419,513) |
| Foreign currency transactions | (40) |
| Net realized gain | $53,212,130 |
| Change in unrealized appreciation (depreciation): | |
| Investments | $98,728,627 |
| Futures contracts | (684,139) |
| Foreign currency | (119) |
| Net change in unrealized appreciation (depreciation) | $98,044,369 |
| Net realized and unrealized gain | $151,256,499 |
| Net increase in net assets from operations | $163,154,245 |
3
See Notes to Financial Statements.
Eaton Vance
Balanced Fund
December 31, 2024
Statements of Changes in Net Assets
| | Year Ended December 31, |
| | 2024 | 2023 |
| Increase (Decrease) in Net Assets | | |
| From operations: | | |
| Net investment income | $11,897,746 | $11,974,431 |
| Net realized gain | 53,212,130 | 25,992,720 |
| Net change in unrealized appreciation (depreciation) | 98,044,369 | 84,880,364 |
| Net increase in net assets from operations | $163,154,245 | $122,847,515 |
| Distributions to shareholders: | | |
| Class A | $(26,591,914) | $(7,921,538) |
| Class C | (6,288,759) | (2,086,519) |
| Class I | (21,418,638) | (6,656,672) |
| Class R | (889,053) | (259,027) |
| Class R6 | (496,014) | (150,942) |
| Total distributions to shareholders | $(55,684,378) | $(17,074,698) |
| Transactions in shares of beneficial interest: | | |
| Class A | $34,400,766 | $(2,382,199) |
| Class C | (36,974,183) | (56,876,573) |
| Class I | 58,641,560 | (34,519,562) |
| Class R | 719,094 | (488,453) |
| Class R6 | 564,678 | 1,765,045 |
| Net increase (decrease) in net assets from Fund share transactions | $57,351,915 | $(92,501,742) |
| Net increase in net assets | $164,821,782 | $13,271,075 |
| Net Assets | | |
| At beginning of year | $848,368,648 | $835,097,573 |
| At end of year | $1,013,190,430 | $848,368,648 |
4
See Notes to Financial Statements.
Eaton Vance
Balanced Fund
December 31, 2024
| | Class A |
| | Year Ended December 31, |
| | 2024 | 2023 | 2022 | 2021 | 2020 |
| Net asset value — Beginning of year | $10.44 | $9.19 | $11.50 | $10.93 | $9.85 |
| Income (Loss) From Operations | | | | | |
| Net investment income(1) | $0.15 | $0.15 | $0.12 | $0.09 | $0.11 |
| Net realized and unrealized gain (loss) | 1.88 | 1.31 | (1.90) | 1.43 | 1.27 |
| Total income (loss) from operations | $2.03 | $1.46 | $(1.78) | $1.52 | $1.38 |
| Less Distributions | | | | | |
| From net investment income | $(0.15) | $(0.16) | $(0.13) | $(0.13) | $(0.12) |
| From net realized gain | (0.53) | (0.05) | (0.40) | (0.82) | (0.18) |
| Total distributions | $(0.68) | $(0.21) | $(0.53) | $(0.95) | $(0.30) |
| Portfolio transaction fee, net(1) | $— | $— | $(0.00)(2) | $(0.00)(2) | $0.00(2) |
| Net asset value — End of year | $11.79 | $10.44 | $9.19 | $11.50 | $10.93 |
| Total Return(3) | 19.46% | 16.05% | (15.58)% | 14.01% | 14.20% |
| Ratios/Supplemental Data | | | | | |
| Net assets, end of year (000’s omitted) | $481,330 | $395,907 | $350,731 | $448,684 | $391,745 |
| Ratios (as a percentage of average daily net assets):(4)(5) | | | | | |
| Total expenses | 0.98% | 0.98% | 0.97% | 0.95% | 0.96% |
| Net expenses | 0.97%(6) | 0.98%(6) | 0.97%(6) | 0.95% | 0.96% |
| Net investment income | 1.29% | 1.50% | 1.15% | 0.73% | 1.10% |
| Portfolio Turnover of the Fund(7) | 5% | 2% | 7% | 7% | 11% |
| (1) | Computed using average shares outstanding. |
| (2) | Amount is less than $0.005 or $(0.005), as applicable. |
| (3) | Returns are historical and are calculated by determining the percentage change in net asset value with all distributions reinvested and do not reflect the effect of sales charges. |
| (4) | Includes the Fund’s share of the Portfolios’ allocated expenses. |
| (5) | Total expenses do not reflect amounts reimbursed and/or waived by the adviser of the Portfolios. Net expenses are net of all reductions and represent the net expenses paid by the Fund. |
| (6) | Includes a reduction by the investment adviser of a portion of the Portfolios’ adviser fee due to the Portfolios’ investment in the Liquidity Fund and in other affiliated funds, if applicable (equal to less than 0.005% of average daily net assets for the years ended December 31, 2024, 2023 and 2022). |
| (7) | Percentage is based on the Fund’s contributions to and withdrawals from the Portfolios and excludes the investment activity of the Portfolios. |
5
See Notes to Financial Statements.
Eaton Vance
Balanced Fund
December 31, 2024
Financial Highlights — continued
| | Class C |
| | Year Ended December 31, |
| | 2024 | 2023 | 2022 | 2021 | 2020 |
| Net asset value — Beginning of year | $10.50 | $9.24 | $11.55 | $10.97 | $9.90 |
| Income (Loss) From Operations | | | | | |
| Net investment income (loss)(1) | $0.06 | $0.07 | $0.04 | $(0.00)(2) | $0.04 |
| Net realized and unrealized gain (loss) | 1.90 | 1.32 | (1.90) | 1.44 | 1.25 |
| Total income (loss) from operations | $1.96 | $1.39 | $(1.86) | $1.44 | $1.29 |
| Less Distributions | | | | | |
| From net investment income | $(0.06) | $(0.08) | $(0.05) | $(0.04) | $(0.04) |
| From net realized gain | (0.53) | (0.05) | (0.40) | (0.82) | (0.18) |
| Total distributions | $(0.59) | $(0.13) | $(0.45) | $(0.86) | $(0.22) |
| Portfolio transaction fee, net(1) | $— | $— | $(0.00)(2) | $(0.00)(2) | $0.00(2) |
| Net asset value — End of year | $11.87 | $10.50 | $9.24 | $11.55 | $10.97 |
| Total Return(3) | 18.63% | 15.15% | (16.16)% | 13.21% | 13.21% |
| Ratios/Supplemental Data | | | | | |
| Net assets, end of year (000’s omitted) | $127,560 | $146,923 | $182,999 | $258,309 | $248,249 |
| Ratios (as a percentage of average daily net assets):(4)(5) | | | | | |
| Total expenses | 1.73% | 1.73% | 1.72% | 1.70% | 1.71% |
| Net expenses | 1.72%(6) | 1.73%(6) | 1.72%(6) | 1.70% | 1.71% |
| Net investment income (loss) | 0.54% | 0.74% | 0.39% | (0.02)% | 0.36% |
| Portfolio Turnover of the Fund(7) | 5% | 2% | 7% | 7% | 11% |
| (1) | Computed using average shares outstanding. |
| (2) | Amount is less than $0.005 or $(0.005), as applicable. |
| (3) | Returns are historical and are calculated by determining the percentage change in net asset value with all distributions reinvested and do not reflect the effect of sales charges. |
| (4) | Includes the Fund’s share of the Portfolios’ allocated expenses. |
| (5) | Total expenses do not reflect amounts reimbursed and/or waived by the adviser of the Portfolios. Net expenses are net of all reductions and represent the net expenses paid by the Fund. |
| (6) | Includes a reduction by the investment adviser of a portion of the Portfolios’ adviser fee due to the Portfolios’ investment in the Liquidity Fund and in other affiliated funds, if applicable (equal to less than 0.005% of average daily net assets for the years ended December 31, 2024, 2023 and 2022). |
| (7) | Percentage is based on the Fund’s contributions to and withdrawals from the Portfolios and excludes the investment activity of the Portfolios. |
6
See Notes to Financial Statements.
Eaton Vance
Balanced Fund
December 31, 2024
Financial Highlights — continued
| | Class I |
| | Year Ended December 31, |
| | 2024 | 2023 | 2022 | 2021 | 2020 |
| Net asset value — Beginning of year | $10.45 | $9.20 | $11.50 | $10.93 | $9.86 |
| Income (Loss) From Operations | | | | | |
| Net investment income(1) | $0.18 | $0.17 | $0.14 | $0.11 | $0.13 |
| Net realized and unrealized gain (loss) | 1.88 | 1.31 | (1.88) | 1.43 | 1.26 |
| Total income (loss) from operations | $2.06 | $1.48 | $(1.74) | $1.54 | $1.39 |
| Less Distributions | | | | | |
| From net investment income | $(0.18) | $(0.18) | $(0.16) | $(0.15) | $(0.14) |
| From net realized gain | (0.53) | (0.05) | (0.40) | (0.82) | (0.18) |
| Total distributions | $(0.71) | $(0.23) | $(0.56) | $(0.97) | $(0.32) |
| Portfolio transaction fee, net(1) | $— | $— | $(0.00)(2) | $(0.00)(2) | $0.00(2) |
| Net asset value — End of year | $11.80 | $10.45 | $9.20 | $11.50 | $10.93 |
| Total Return(3) | 19.74% | 16.32% | (15.27)% | 14.28% | 14.36% |
| Ratios/Supplemental Data | | | | | |
| Net assets, end of year (000’s omitted) | $379,082 | $284,307 | $283,882 | $409,900 | $399,991 |
| Ratios (as a percentage of average daily net assets):(4)(5) | | | | | |
| Total expenses | 0.73% | 0.73% | 0.72% | 0.70% | 0.71% |
| Net expenses | 0.72%(6) | 0.73%(6) | 0.72%(6) | 0.70% | 0.71% |
| Net investment income | 1.54% | 1.75% | 1.39% | 0.98% | 1.34% |
| Portfolio Turnover of the Fund(7) | 5% | 2% | 7% | 7% | 11% |
| (1) | Computed using average shares outstanding. |
| (2) | Amount is less than $0.005 or $(0.005), as applicable. |
| (3) | Returns are historical and are calculated by determining the percentage change in net asset value with all distributions reinvested. |
| (4) | Includes the Fund’s share of the Portfolios’ allocated expenses. |
| (5) | Total expenses do not reflect amounts reimbursed and/or waived by the adviser of the Portfolios. Net expenses are net of all reductions and represent the net expenses paid by the Fund. |
| (6) | Includes a reduction by the investment adviser of a portion of the Portfolios’ adviser fee due to the Portfolios’ investment in the Liquidity Fund and in other affiliated funds, if applicable (equal to less than 0.005% of average daily net assets for the years ended December 31, 2024, 2023 and 2022). |
| (7) | Percentage is based on the Fund’s contributions to and withdrawals from the Portfolios and excludes the investment activity of the Portfolios. |
7
See Notes to Financial Statements.
Eaton Vance
Balanced Fund
December 31, 2024
Financial Highlights — continued
| | Class R |
| | Year Ended December 31, |
| | 2024 | 2023 | 2022 | 2021 | 2020 |
| Net asset value — Beginning of year | $10.40 | $9.15 | $11.45 | $10.89 | $9.82 |
| Income (Loss) From Operations | | | | | |
| Net investment income(1) | $0.12 | $0.12 | $0.09 | $0.06 | $0.08 |
| Net realized and unrealized gain (loss) | 1.88 | 1.31 | (1.88) | 1.42 | 1.26 |
| Total income (loss) from operations | $2.00 | $1.43 | $(1.79) | $1.48 | $1.34 |
| Less Distributions | | | | | |
| From net investment income | $(0.13) | $(0.13) | $(0.11) | $(0.10) | $(0.09) |
| From net realized gain | (0.53) | (0.05) | (0.40) | (0.82) | (0.18) |
| Total distributions | $(0.66) | $(0.18) | $(0.51) | $(0.92) | $(0.27) |
| Portfolio transaction fee, net(1) | $— | $— | $(0.00)(2) | $(0.00)(2) | $0.00(2) |
| Net asset value — End of year | $11.74 | $10.40 | $9.15 | $11.45 | $10.89 |
| Total Return(3) | 19.16% | 15.83% | (15.77)% | 13.71% | 13.89% |
| Ratios/Supplemental Data | | | | | |
| Net assets, end of year (000’s omitted) | $16,662 | $14,158 | $12,922 | $15,587 | $8,958 |
| Ratios (as a percentage of average daily net assets):(4)(5) | | | | | |
| Total expenses | 1.23% | 1.23% | 1.22% | 1.20% | 1.21% |
| Net expenses | 1.22%(6) | 1.23%(6) | 1.22%(6) | 1.20% | 1.21% |
| Net investment income | 1.04% | 1.25% | 0.90% | 0.47% | 0.84% |
| Portfolio Turnover of the Fund(7) | 5% | 2% | 7% | 7% | 11% |
| (1) | Computed using average shares outstanding. |
| (2) | Amount is less than $0.005 or $(0.005), as applicable. |
| (3) | Returns are historical and are calculated by determining the percentage change in net asset value with all distributions reinvested. |
| (4) | Includes the Fund’s share of the Portfolios’ allocated expenses. |
| (5) | Total expenses do not reflect amounts reimbursed and/or waived by the adviser of the Portfolios. Net expenses are net of all reductions and represent the net expenses paid by the Fund. |
| (6) | Includes a reduction by the investment adviser of a portion of the Portfolios’ adviser fee due to the Portfolios’ investment in the Liquidity Fund and in other affiliated funds, if applicable (equal to less than 0.005% of average daily net assets for the years ended December 31, 2024, 2023 and 2022). |
| (7) | Percentage is based on the Fund’s contributions to and withdrawals from the Portfolios and excludes the investment activity of the Portfolios. |
8
See Notes to Financial Statements.
Eaton Vance
Balanced Fund
December 31, 2024
Financial Highlights — continued
| | Class R6 |
| | Year Ended December 31, |
| | 2024 | 2023 | 2022 | 2021 | 2020 |
| Net asset value — Beginning of year | $10.45 | $9.20 | $11.51 | $10.93 | $9.86 |
| Income (Loss) From Operations | | | | | |
| Net investment income(1) | $0.18 | $0.18 | $0.15 | $0.12 | $0.14 |
| Net realized and unrealized gain (loss) | 1.89 | 1.31 | (1.90) | 1.44 | 1.26 |
| Total income (loss) from operations | $2.07 | $1.49 | $(1.75) | $1.56 | $1.40 |
| Less Distributions | | | | | |
| From net investment income | $(0.19) | $(0.19) | $(0.16) | $(0.16) | $(0.15) |
| From net realized gain | (0.53) | (0.05) | (0.40) | (0.82) | (0.18) |
| Total distributions | $(0.72) | $(0.24) | $(0.56) | $(0.98) | $(0.33) |
| Portfolio transaction fee, net(1) | $— | $— | $(0.00)(2) | $(0.00)(2) | $0.00(2) |
| Net asset value — End of year | $11.80 | $10.45 | $9.20 | $11.51 | $10.93 |
| Total Return(3) | 19.79% | 16.37% | (15.30)% | 14.42% | 14.41% |
| Ratios/Supplemental Data | | | | | |
| Net assets, end of year (000’s omitted) | $8,557 | $7,074 | $4,564 | $5,131 | $54,388 |
| Ratios (as a percentage of average daily net assets):(4)(5) | | | | | |
| Total expenses | 0.69% | 0.68% | 0.67% | 0.66% | 0.67% |
| Net expenses | 0.68%(6) | 0.68%(6) | 0.67%(6) | 0.66% | 0.67% |
| Net investment income | 1.58% | 1.80% | 1.45% | 1.02% | 1.39% |
| Portfolio Turnover of the Fund(7) | 5% | 2% | 7% | 7% | 11% |
| (1) | Computed using average shares outstanding. |
| (2) | Amount is less than $0.005 or $(0.005), as applicable. |
| (3) | Returns are historical and are calculated by determining the percentage change in net asset value with all distributions reinvested. |
| (4) | Includes the Fund’s share of the Portfolios’ allocated expenses. |
| (5) | Total expenses do not reflect amounts reimbursed and/or waived by the adviser of the Portfolios. Net expenses are net of all reductions and represent the net expenses paid by the Fund. |
| (6) | Includes a reduction by the investment adviser of a portion of the Portfolios’ adviser fee due to the Portfolios’ investment in the Liquidity Fund and in other affiliated funds, if applicable (equal to less than 0.005% of average daily net assets for the years ended December 31, 2024, 2023 and 2022). |
| (7) | Percentage is based on the Fund’s contributions to and withdrawals from the Portfolios and excludes the investment activity of the Portfolios. |
9
See Notes to Financial Statements.
Eaton Vance
Balanced Fund
December 31, 2024
Notes to Financial Statements
1 Significant Accounting Policies
Eaton Vance Balanced Fund (the Fund) is a diversified series of Eaton Vance Special Investment Trust (the Trust). The Trust is a Massachusetts business trust registered under the Investment Company Act of 1940, as amended (the 1940 Act), as an open-end management investment company. The Fund offers five classes of shares. Class A shares are generally sold subject to a sales charge imposed at time of purchase. Class C shares are sold at net asset value and are generally subject to a contingent deferred sales charge (see Note 5). Effective November 5, 2020, Class C shares automatically convert to Class A shares eight years after their purchase as described in the Fund’s prospectus. Class I, Class R and Class R6 shares are sold at net asset value and are not subject to a sales charge. Each class represents a pro rata interest in the Fund, but votes separately on class-specific matters and (as noted below) is subject to different expenses. Realized and unrealized gains and losses and net investment income and losses, other than class-specific expenses, are allocated daily to each class of shares based on the relative net assets of each class to the total net assets of the Fund. Sub-accounting, recordkeeping and similar administrative fees payable to financial intermediaries, which are a component of transfer and dividend disbursing agent fees on the Statement of Operations, are not allocated to Class R6 shares. Each class of shares differs in its distribution plan and certain other class-specific expenses. The Fund's investment objective is to provide current income and long-term growth of capital. The Fund currently pursues its objective by investing substantially all of its assets in interests in two portfolios managed by Eaton Vance Management (EVM) or its affiliates (the Portfolios), which are Massachusetts business trusts. The value of the Fund’s investments in the Portfolios reflects the Fund’s proportionate interest in their net assets. The Fund's proportionate interest in each of the Portfolio's net assets at December 31, 2024 were as follows: Core Bond Portfolio (62.7%) and Stock Portfolio (86.8%). The performance of the Fund is directly affected by the performance of the Portfolios. The financial statements of Stock Portfolio, including the portfolio of investments, are included elsewhere in this report and should be read in conjunction with the Fund’s financial statements. A copy of Core Bond Portfolio’s financial statements is available by calling Eaton Vance at 1-800-262-1122 or in the EDGAR database on the Securities and Exchange Commission’s website at www.sec.gov.
The following is a summary of significant accounting policies of the Fund. The policies are in conformity with accounting principles generally accepted in the United States of America (U.S. GAAP). The Fund is an investment company and follows accounting and reporting guidance in the Financial Accounting Standards Board (FASB) Accounting Standards Codification Topic 946.
A Investment Valuation—Valuation of securities by Stock Portfolio is discussed in Note 1A of the Portfolio's Notes to Financial Statements, which are included elsewhere in this report. Such policies are consistent with those of Core Bond Portfolio.
Additional valuation policies for Core Bond Portfolio (the Portfolio) are as follows:
Debt Obligations. Debt obligations are generally valued on the basis of valuations provided by third party pricing services, as derived from such services’ pricing models. Inputs to the models may include, but are not limited to, reported trades, executable bid and ask prices, broker/dealer quotations, prices or yields of securities with similar characteristics, interest rates, anticipated prepayments, benchmark curves or information pertaining to the issuer, as well as industry and economic events. The pricing services may use a matrix approach, which considers information regarding securities with similar characteristics to determine the valuation for a security. Short-term debt obligations purchased with a remaining maturity of sixty days or less for which a valuation from a third party pricing service is not readily available may be valued at amortized cost, which approximates fair value.
Preferred Securities. Preferred securities that are not listed or traded in the over-the-counter market are valued by a third party pricing service that uses various techniques that consider factors including, but not limited to, prices or yields of securities with similar characteristics, benchmark yields, broker/dealer quotes, quotes of underlying common stock, issuer spreads, as well as industry and economic events.
Senior Floating-Rate Loans. Interests in senior floating-rate loans (Senior Loans) for which reliable market quotations are readily available are valued generally at the average mean of bid and ask quotations obtained from a third party pricing service.
Derivatives. Futures contracts are valued at the closing settlement price established by the board of trade or exchange on which they are traded.
B Income—The Fund's net investment income or loss consists of the Fund's pro rata share of the net investment income or loss of the Portfolios, less all actual and accrued expenses of the Fund.
C Federal Taxes—The Fund's policy is to comply with the provisions of the Internal Revenue Code applicable to regulated investment companies and to distribute to shareholders each year substantially all of its net investment income, and all or substantially all of its net realized capital gains. Accordingly, no provision for federal income or excise tax is necessary.
As of December 31, 2024, the Fund had no uncertain tax positions that would require financial statement recognition, de-recognition, or disclosure. The Fund files a U.S. federal income tax return annually after its fiscal year-end, which is subject to examination by the Internal Revenue Service for a period of three years from the date of filing.
D Expenses—The majority of expenses of the Trust are directly identifiable to an individual fund. Expenses which are not readily identifiable to a specific fund are allocated taking into consideration, among other things, the nature and type of expense and the relative size of the funds.
Eaton Vance
Balanced Fund
December 31, 2024
Notes to Financial Statements — continued
E Use of Estimates—The preparation of the financial statements in conformity with U.S. GAAP requires management to make estimates and assumptions that affect the reported amounts of assets and liabilities at the date of the financial statements and the reported amounts of income and expense during the reporting period. Actual results could differ from those estimates.
F Indemnifications—Under the Trust’s organizational documents, its officers and Trustees may be indemnified against certain liabilities and expenses arising out of the performance of their duties to the Fund. Under Massachusetts law, if certain conditions prevail, shareholders of a Massachusetts business trust (such as the Trust) could be deemed to have personal liability for the obligations of the Trust. However, the Trust’s Declaration of Trust contains an express disclaimer of liability on the part of Fund shareholders and the By-laws provide that the Trust shall assume, upon request by the shareholder, the defense on behalf of any Fund shareholders. Moreover, the By-laws also provide for indemnification out of Fund property of any shareholder held personally liable solely by reason of being or having been a shareholder for all loss or expense arising from such liability. Additionally, in the normal course of business, the Fund enters into agreements with service providers that may contain indemnification clauses. The Fund’s maximum exposure under these arrangements is unknown as this would involve future claims that may be made against the Fund that have not yet occurred.
G Other—Investment transactions are accounted for on a trade date basis.
H Segment Reporting—During the year ended December 31, 2024, the Fund adopted FASB Accounting Standards Update No. 2023-07, Segment Reporting (Topic 280): Improvements to Reportable Segment Disclosures, (ASU 2023-07), which requires incremental disclosures related to a public entity’s reportable segments. The Fund operates as a single reportable segment, an investment company whose investment objective is included in Note 1. In connection with the adoption of ASU 2023-07, the Fund’s President has been designated as the Fund’s Chief Operating Decision Maker (CODM), who is responsible for assessing the performance of the Fund’s single segment and deciding how to allocate the segment’s resources. To perform this function, the CODM reviews the information in the Fund’s Financial Statements.
2 Distributions to Shareholders and Income Tax Information
It is the present policy of the Fund to make quarterly distributions of all or substantially all of its net investment income and to distribute annually all or substantially all of its net realized capital gains. Distributions to shareholders are recorded on the ex-dividend date. Distributions are declared separately for each class of shares. Shareholders may reinvest income and capital gain distributions in additional shares of the same class of the Fund at the net asset value as of the ex-dividend date or, at the election of the shareholder, receive distributions in cash. Distributions to shareholders are determined in accordance with income tax regulations, which may differ from U.S. GAAP. As required by U.S. GAAP, only distributions in excess of tax basis earnings and profits are reported in the financial statements as a return of capital. Permanent differences between book and tax accounting relating to distributions are reclassified to paid-in capital. For tax purposes, distributions from short-term capital gains are considered to be from ordinary income.
The tax character of distributions declared for the years ended December 31, 2024 and December 31, 2023 was as follows:
| | Year Ended December 31, |
| | 2024 | 2023 |
| Ordinary income | $14,220,901 | $12,494,004 |
| Long-term capital gains | $41,463,477 | $4,580,694 |
During the year ended December 31, 2024, distributable earnings was decreased by $3,319,668 and paid-in capital was increased by $3,319,668 due to the Fund’s use of equalization accounting. Tax equalization accounting allows the Fund to treat as a distribution that portion of redemption proceeds representing a redeeming shareholder’s portion of undistributed taxable income and net capital gains. These reclassifications had no effect on the net assets or net asset value per share of the Fund.
As of December 31, 2024, the components of distributable earnings (accumulated loss) on a tax basis were as follows:
| Undistributed long-term capital gains | $ 13,758,920 |
| Net unrealized appreciation | 284,128,573 |
| Distributable earnings | $297,887,493 |
Eaton Vance
Balanced Fund
December 31, 2024
Notes to Financial Statements — continued
3 Investment Adviser Fee and Other Transactions with Affiliates
The investment adviser fee is earned by Eaton Vance Management (EVM), an indirect, wholly-owned subsidiary of Morgan Stanley, as compensation for investment advisory services rendered to the Fund. The fee is computed at an annual rate based on the percentage of the Fund’s average daily net assets that are not invested in other investment companies for which EVM or its affiliates serve as investment adviser and receive an advisory fee as follows and is payable monthly:
For equity securities:
| Average Daily Net Assets | Annual Fee Rate |
| Up to $500 million | 0.600% |
| $500 million but less than $1 billion | 0.575% |
| $1 billion but less than $2.5 billion | 0.550% |
| $2.5 billion but less than $5 billion | 0.530% |
| $5 billion and over | 0.515% |
For income securities and cash:
| Average Daily Net Assets | Annual Fee Rate |
| Less than $1 billion | 0.450% |
| $1 billion up to $2 billion | 0.425% |
| $2 billion up to $5 billion | 0.415% |
| $5 billion and over | 0.405% |
For the year ended December 31, 2024, the Fund incurred no investment adviser fee on such assets. To the extent the Fund’s assets are invested in the Portfolios, the Fund is allocated its pro rata share of the Portfolios’ investment adviser fees. The Portfolios have engaged Boston Management and Research (BMR), an affiliate of EVM and an indirect, wholly-owned subsidiary of Morgan Stanley, to render investment advisory services. See Note 2 of the Portfolios’ Notes to Financial Statements. For the year ended December 31, 2024, the Fund’s allocated portion of investment adviser fees paid by the Portfolios amounted to $5,091,437 or 0.54% of the Fund’s average daily net assets. The administration fee is earned by EVM as compensation for administrative services rendered to the Fund. The fee is computed at an annual rate of 0.04% of the Fund’s average daily net assets. For the year ended December 31, 2024, the administration fee amounted to $375,826.
EVM provides sub-transfer agency and related services to the Fund pursuant to a Sub-Transfer Agency Support Services Agreement. For the year ended December 31, 2024, EVM earned $91,980 from the Fund pursuant to such agreement, which is included in transfer and dividend disbursing agent fees on the Statement of Operations. The Fund was informed that Eaton Vance Distributors, Inc. (EVD), an affiliate of EVM, received $41,481 as its portion of the sales charge on sales of Class A shares for the year ended December 31, 2024. The Fund was informed that Morgan Stanley affiliated broker-dealers, which may be deemed to be affiliates of EVM and EVD, also received a portion of the sales charge on sales of Class A shares for the year ended December 31, 2024 in the amount of $4,813. EVD also received distribution and service fees from Class A, Class C and Class R shares (see Note 4) and contingent deferred sales charges (see Note 5).
Trustees and officers of the Fund and the Portfolios who are members of EVM’s or BMR's organizations receive remuneration for their services to the Fund out of the investment adviser fee. Certain officers and Trustees of the Fund and the Portfolios are officers of the above organizations.
4 Distribution Plans
The Fund has in effect a distribution plan for Class A shares (Class A Plan) pursuant to Rule 12b-1 under the 1940 Act. Pursuant to the Class A Plan, the Fund pays EVD a distribution and service fee of 0.25% per annum of its average daily net assets attributable to Class A shares for distribution services and facilities provided to the Fund by EVD, as well as for personal services and/or the maintenance of shareholder accounts. Distribution and service fees paid or accrued to EVD for the year ended December 31, 2024 amounted to $1,116,866 for Class A shares.
The Fund also has in effect distribution plans for Class C shares (Class C Plan) and Class R shares (Class R Plan) pursuant to Rule 12b-1 under the 1940 Act. Pursuant to the Class C Plan, the Fund pays EVD amounts equal to 0.75% per annum of its average daily net assets attributable to Class C shares for providing ongoing distribution services and facilities to the Fund. For the year ended December 31, 2024, the Fund paid or accrued to EVD $1,033,616 for Class C shares.
Eaton Vance
Balanced Fund
December 31, 2024
Notes to Financial Statements — continued
The Class R Plan requires the Fund to pay EVD an amount up to 0.50% per annum of its average daily net assets attributable to Class R shares for providing ongoing distribution services and facilities to the Fund. The Trustees of the Trust have currently limited Class R distribution payments to 0.25% per annum of the average daily net assets attributable to Class R shares. For the year ended December 31, 2024, the Fund paid or accrued to EVD $38,944 for Class R shares.
Pursuant to the Class C and Class R Plans, the Fund also makes payments of service fees to EVD, financial intermediaries and other persons in amounts equal to 0.25% per annum of its average daily net assets attributable to that class. Service fees paid or accrued are for personal services and/or the maintenance of shareholder accounts. They are separate and distinct from the sales commissions and distribution fees payable to EVD. Service fees paid or accrued for the year ended December 31, 2024 amounted to $344,539 and $38,944 for Class C and Class R shares, respectively.
Distribution and service fees are subject to the limitations contained in the Financial Industry Regulatory Authority Rule 2341(d).
5 Contingent Deferred Sales Charges
A contingent deferred sales charge (CDSC) of 1% generally is imposed on redemptions of Class C shares made within 12 months of purchase. Class A shares may be subject to a 1% CDSC if redeemed within 12 months of purchase (depending on the circumstances of purchase). Generally, the CDSC is based upon the lower of the net asset value at date of redemption or date of purchase. No charge is levied on shares acquired by reinvestment of dividends or capital gain distributions. For the year ended December 31, 2024, the Fund was informed that EVD received $278 and $3,799 of CDSCs paid by Class A and Class C shareholders, respectively.
6 Investment Transactions
For the year ended December 31, 2024, increases and decreases in the Fund's investments in the Portfolios were as follows:
| Portfolio | Contributions | Withdrawals |
| Core Bond Portfolio | $35,329,859 | $13,829,905 |
| Stock Portfolio | 12,102,465 | 36,385,523 |
7 Shares of Beneficial Interest
The Fund’s Declaration of Trust permits the Trustees to issue an unlimited number of full and fractional shares of beneficial interest (without par value). Such shares may be issued in a number of different series (such as the Fund) and classes. Transactions in Fund shares, including direct exchanges pursuant to share class conversions, were as follows:
| | Year Ended
December 31, 2024 | | Year Ended
December 31, 2023 |
| | Shares | Amount | | Shares | Amount |
| Class A | | | | | |
| Sales | 6,276,541 | $72,932,529 | | 5,247,777 | $51,183,180 |
| Issued to shareholders electing to receive payments of distributions in Fund shares | 2,071,795 | 24,710,524 | | 732,879 | 7,213,576 |
| Redemptions | (5,449,587) | (63,242,287) | | (6,229,639) | (60,778,955) |
| Net increase (decrease) | 2,898,749 | $34,400,766 | | (248,983) | $(2,382,199) |
| Class C | | | | | |
| Sales | 1,937,226 | $22,748,791 | | 783,217 | $ 7,671,569 |
| Issued to shareholders electing to receive payments of distributions in Fund shares | 509,870 | 6,138,300 | | 206,249 | 2,046,818 |
| Redemptions | (5,687,761) | (65,861,274) | | (6,808,578) | (66,594,960) |
| Net decrease | (3,240,665) | $(36,974,183) | | (5,819,112) | $(56,876,573) |
Eaton Vance
Balanced Fund
December 31, 2024
Notes to Financial Statements — continued
| | Year Ended
December 31, 2024 | | Year Ended
December 31, 2023 |
| | Shares | Amount | | Shares | Amount |
| Class I | | | | | |
| Sales | 8,379,943 | $98,421,108 | | 4,423,506 | $42,912,161 |
| Issued to shareholders electing to receive payments of distributions in Fund shares | 1,641,231 | 19,564,677 | | 616,616 | 6,052,407 |
| Redemptions | (5,111,086) | (59,344,225) | | (8,702,084) | (83,484,130) |
| Net increase (decrease) | 4,910,088 | $58,641,560 | | (3,661,962) | $(34,519,562) |
| Class R | | | | | |
| Sales | 166,536 | $ 1,917,935 | | 271,074 | $ 2,625,867 |
| Issued to shareholders electing to receive payments of distributions in Fund shares | 74,849 | 889,053 | | 26,380 | 258,639 |
| Redemptions | (183,620) | (2,087,894) | | (347,826) | (3,372,959) |
| Net increase (decrease) | 57,765 | $ 719,094 | | (50,372) | $ (488,453) |
| Class R6 | | | | | |
| Sales | 282,909 | $ 3,289,767 | | 314,482 | $ 3,065,657 |
| Issued to shareholders electing to receive payments of distributions in Fund shares | 41,388 | 492,935 | | 15,277 | 150,661 |
| Redemptions | (276,344) | (3,218,024) | | (149,094) | (1,451,273) |
| Net increase | 47,953 | $ 564,678 | | 180,665 | $ 1,765,045 |
8 Fair Value Measurements
Under generally accepted accounting principles for fair value measurements, a three-tier hierarchy to prioritize the assumptions, referred to as inputs, is used in valuation techniques to measure fair value. The three-tier hierarchy of inputs is summarized in the three broad levels listed below.
| • | Level 1 – quoted prices in active markets for identical investments |
| • | Level 2 – other significant observable inputs (including quoted prices for similar investments, interest rates, prepayment speeds, credit risk, etc.) |
| • | Level 3 – significant unobservable inputs (including a fund's own assumptions in determining the fair value of investments) |
In cases where the inputs used to measure fair value fall in different levels of the fair value hierarchy, the level disclosed is determined based on the lowest level input that is significant to the fair value measurement in its entirety. The inputs or methodology used for valuing securities are not necessarily an indication of the risk associated with investing in those securities.
At December 31, 2024 and December 31, 2023, the Fund’s investment in Core Bond Portfolio, whose financial statements are not included but are available elsewhere as discussed in Note 1, and in Stock Portfolio were valued based on Level 1 inputs.
Eaton Vance
Balanced Fund
December 31, 2024
Report of Independent Registered Public Accounting Firm
To the Trustees of Eaton Vance Special Investment Trust and Shareholders of Eaton Vance Balanced Fund:
Opinion on the Financial Statements and Financial Highlights
We have audited the accompanying statement of assets and liabilities of Eaton Vance Balanced Fund (the “Fund”) (one of the funds constituting Eaton Vance Special Investment Trust), as of December 31, 2024, the related statement of operations for the year then ended, the statements of changes in net assets for each of the two years in the period then ended, the financial highlights for each of the five years in the period then ended, and the related notes. In our opinion, the financial statements and financial highlights present fairly, in all material respects, the financial position of the Fund as of December 31, 2024, and the results of its operations for the year then ended, the changes in its net assets for each of the two years in the period then ended, and the financial highlights for each of the five years in the period then ended, in conformity with accounting principles generally accepted in the United States of America.
Basis for Opinion
These financial statements and financial highlights are the responsibility of the Fund's management. Our responsibility is to express an opinion on the Fund's financial statements and financial highlights based on our audits. We are a public accounting firm registered with the Public Company Accounting Oversight Board (United States) (PCAOB) and are required to be independent with respect to the Fund in accordance with the U.S. federal securities laws and the applicable rules and regulations of the Securities and Exchange Commission and the PCAOB.
We conducted our audits in accordance with the standards of the PCAOB. Those standards require that we plan and perform the audit to obtain reasonable assurance about whether the financial statements and financial highlights are free of material misstatement, whether due to error or fraud. The Fund is not required to have, nor were we engaged to perform, an audit of its internal control over financial reporting. As part of our audits, we are required to obtain an understanding of internal control over financial reporting but not for the purpose of expressing an opinion on the effectiveness of the Fund’s internal control over financial reporting. Accordingly, we express no such opinion.
Our audits included performing procedures to assess the risks of material misstatement of the financial statements and financial highlights, whether due to error or fraud, and performing procedures that respond to those risks. Such procedures included examining, on a test basis, evidence regarding the amounts and disclosures in the financial statements and financial highlights. Our audits also included evaluating the accounting principles used and significant estimates made by management, as well as evaluating the overall presentation of the financial statements and financial highlights. We believe that our audits provide a reasonable basis for our opinion.
/s/ Deloitte & Touche LLP
Boston, Massachusetts
February 21, 2025
We have served as the auditor of one or more Eaton Vance investment companies since 1959.
Eaton Vance
Balanced Fund
December 31, 2024
Federal Tax Information (Unaudited)
The Form 1099-DIV you received in February 2025 showed the tax status of all distributions paid to your account in calendar year 2024. Shareholders are advised to consult their own tax adviser with respect to the tax consequences of their investment in the Fund. As required by the Internal Revenue Code and/or regulations, shareholders must be notified regarding the status of qualified dividend income for individuals, the dividends received deduction for corporations and capital gains dividends.
Qualified Dividend Income. For the fiscal year ended December 31, 2024, the Fund designates approximately $5,072,057, or up to the maximum amount of such dividends allowable pursuant to the Internal Revenue Code, as qualified dividend income eligible for the reduced tax rate of 15%.
Dividends Received Deduction. Corporate shareholders are generally entitled to take the dividends received deduction on the portion of the Fund’s dividend distribution that qualifies under tax law. For the Fund’s fiscal 2024 ordinary income dividends, 34.55% qualifies for the corporate dividends received deduction.
Capital Gains Dividends. The Fund hereby designates as a capital gain dividend with respect to the taxable year ended December 31, 2024, $47,606,484 or, if subsequently determined to be different, the net capital gain of such year.
Stock Portfolio
December 31, 2024
| Security | Shares | Value |
| Aerospace & Defense — 1.0% |
| HEICO Corp. | | 30,352 | $ 7,215,885 |
| | | | $ 7,215,885 |
| Automobiles — 0.5% |
| Tesla, Inc.(1) | | 9,359 | $ 3,779,539 |
| | | | $ 3,779,539 |
| Biotechnology — 1.7% |
| AbbVie, Inc. | | 71,817 | $ 12,761,881 |
| | | | $ 12,761,881 |
| Broadline Retail — 5.4% |
| Amazon.com, Inc.(1) | | 183,542 | $ 40,267,279 |
| | | | $ 40,267,279 |
| Building Products — 1.1% |
| Carrier Global Corp. | | 118,240 | $ 8,071,062 |
| | | | $ 8,071,062 |
| Capital Markets — 6.9% |
| Blue Owl Capital, Inc. | | 491,862 | $ 11,440,710 |
| Intercontinental Exchange, Inc. | | 63,466 | 9,457,069 |
| S&P Global, Inc. | | 21,712 | 10,813,228 |
| Stifel Financial Corp. | | 75,529 | 8,012,116 |
| Tradeweb Markets, Inc., Class A | | 91,859 | 12,026,180 |
| | | | $ 51,749,303 |
| Chemicals — 0.7% |
| Linde PLC | | 12,694 | $ 5,314,597 |
| | | | $ 5,314,597 |
| Commercial Services & Supplies — 1.1% |
| Waste Connections, Inc. | | 46,679 | $ 8,009,183 |
| | | | $ 8,009,183 |
| Communications Equipment — 0.6% |
| Arista Networks, Inc.(1) | | 38,144 | $ 4,216,056 |
| | | | $ 4,216,056 |
| Consumer Staples Distribution & Retail — 3.5% |
| BJ's Wholesale Club Holdings, Inc.(1) | | 140,026 | $ 12,511,323 |
| Security | Shares | Value |
| Consumer Staples Distribution & Retail (continued) |
| Walmart, Inc. | | 154,606 | $ 13,968,652 |
| | | | $ 26,479,975 |
| Containers & Packaging — 1.0% |
| AptarGroup, Inc. | | 45,687 | $ 7,177,428 |
| | | | $ 7,177,428 |
| Electrical Equipment — 1.5% |
| AMETEK, Inc. | | 62,095 | $ 11,193,245 |
| | | | $ 11,193,245 |
| Entertainment — 3.0% |
| Liberty Media Corp.-Liberty Formula One, Class C(1) | | 62,454 | $ 5,786,987 |
| Netflix, Inc.(1) | | 15,928 | 14,196,945 |
| Spotify Technology SA(1) | | 6,223 | 2,784,046 |
| | | | $ 22,767,978 |
| Financial Services — 4.2% |
| Mr. Cooper Group, Inc.(1) | | 48,914 | $ 4,696,233 |
| Shift4 Payments, Inc., Class A(1) | | 99,311 | 10,306,496 |
| Visa, Inc., Class A | | 51,136 | 16,161,021 |
| | | | $ 31,163,750 |
| Ground Transportation — 1.3% |
| Uber Technologies, Inc.(1) | | 160,369 | $ 9,673,458 |
| | | | $ 9,673,458 |
| Health Care Equipment & Supplies — 3.3% |
| Abbott Laboratories | | 65,340 | $ 7,390,607 |
| Edwards Lifesciences Corp.(1) | | 109,041 | 8,072,305 |
| Intuitive Surgical, Inc.(1) | | 17,537 | 9,153,613 |
| | | | $ 24,616,525 |
| Health Care Providers & Services — 1.8% |
| UnitedHealth Group, Inc. | | 26,786 | $ 13,549,966 |
| | | | $ 13,549,966 |
| Hotels, Restaurants & Leisure — 1.2% |
| Marriott International, Inc., Class A | | 32,568 | $ 9,084,518 |
| | | | $ 9,084,518 |
| Insurance — 3.3% |
| Allstate Corp. | | 78,799 | $ 15,191,659 |
| Arthur J. Gallagher & Co. | | 34,670 | 9,841,080 |
| | | | $ 25,032,739 |
17
See Notes to Financial Statements.
Stock Portfolio
December 31, 2024
Portfolio of Investments — continued
| Security | Shares | Value |
| Interactive Media & Services — 7.6% |
| Alphabet, Inc., Class C | | 176,101 | $ 33,536,674 |
| Meta Platforms, Inc., Class A | | 40,084 | 23,469,583 |
| | | | $ 57,006,257 |
| IT Services — 1.2% |
| Gartner, Inc.(1) | | 19,207 | $ 9,305,215 |
| | | | $ 9,305,215 |
| Life Sciences Tools & Services — 1.2% |
| Thermo Fisher Scientific, Inc. | | 16,954 | $ 8,819,979 |
| | | | $ 8,819,979 |
| Machinery — 0.9% |
| Parker-Hannifin Corp. | | 10,852 | $ 6,902,198 |
| | | | $ 6,902,198 |
| Media — 0.4% |
| Trade Desk, Inc., Class A(1) | | 28,793 | $ 3,384,041 |
| | | | $ 3,384,041 |
| Multi-Utilities — 0.8% |
| Sempra | | 66,143 | $ 5,802,064 |
| | | | $ 5,802,064 |
| Oil, Gas & Consumable Fuels — 2.1% |
| ConocoPhillips | | 155,432 | $ 15,414,191 |
| | | | $ 15,414,191 |
| Pharmaceuticals — 2.3% |
| Eli Lilly & Co. | | 22,594 | $ 17,442,568 |
| | | | $ 17,442,568 |
| Professional Services — 3.4% |
| Automatic Data Processing, Inc. | | 25,227 | $ 7,384,700 |
| Booz Allen Hamilton Holding Corp. | | 27,589 | 3,550,704 |
| TransUnion | | 156,526 | 14,511,525 |
| | | | $ 25,446,929 |
| Real Estate Management & Development — 2.4% |
| CoStar Group, Inc.(1) | | 103,889 | $ 7,437,414 |
| FirstService Corp. | | 58,700 | 10,625,874 |
| | | | $ 18,063,288 |
| Semiconductors & Semiconductor Equipment — 13.9% |
| Analog Devices, Inc. | | 43,602 | $ 9,263,681 |
| Security | Shares | Value |
| Semiconductors & Semiconductor Equipment (continued) |
| Broadcom, Inc. | | 117,401 | $ 27,218,248 |
| Lam Research Corp. | | 166,180 | 12,003,181 |
| NVIDIA Corp. | | 410,903 | 55,180,164 |
| | | | $103,665,274 |
| Software — 10.1% |
| Fair Isaac Corp.(1) | | 4,810 | $ 9,576,373 |
| Microsoft Corp. | | 134,763 | 56,802,605 |
| Palo Alto Networks, Inc.(1) | | 48,906 | 8,898,936 |
| | | | $ 75,277,914 |
| Specialty Retail — 2.7% |
| Burlington Stores, Inc.(1) | | 36,378 | $ 10,369,913 |
| TJX Cos., Inc. | | 78,543 | 9,488,780 |
| | | | $ 19,858,693 |
| Technology Hardware, Storage & Peripherals — 7.7% |
| Apple, Inc. | | 229,015 | $ 57,349,936 |
| | | | $ 57,349,936 |
Total Common Stocks
(identified cost $406,750,876) | | | $745,862,914 |
| Short-Term Investments — 0.2% |
| Security | Shares | Value |
| Morgan Stanley Institutional Liquidity Funds - Government Portfolio, Institutional Class, 4.43%(2) | | 1,361,413 | $ 1,361,413 |
Total Short-Term Investments
(identified cost $1,361,413) | | | $ 1,361,413 |
Total Investments — 100.0%
(identified cost $408,112,289) | | | $747,224,327 |
| Other Assets, Less Liabilities — (0.0)%(3) | | | $ (273,385) |
| Net Assets — 100.0% | | | $746,950,942 |
| The percentage shown for each investment category in the Portfolio of Investments is based on net assets. |
| (1) | Non-income producing security. |
| (2) | May be deemed to be an affiliated investment company (see Note 6). The rate shown is the annualized seven-day yield as of December 31, 2024. |
| (3) | Amount is less than (0.05)%. |
18
See Notes to Financial Statements.
Stock Portfolio
December 31, 2024
Statement of Assets and Liabilities
| | December 31, 2024 |
| Assets | |
| Unaffiliated investments, at value (identified cost $406,750,876) | $745,862,914 |
| Affiliated investments, at value (identified cost $1,361,413) | 1,361,413 |
| Dividends receivable | 269,739 |
| Dividends receivable from affiliated investments | 6,573 |
| Tax reclaims receivable | 20,182 |
| Trustees' deferred compensation plan | 67,529 |
| Total assets | $747,588,350 |
| Liabilities | |
| Payable to affiliates: | |
| Investment adviser fee | $384,054 |
| Trustees' fees | 10,961 |
| Trustees' deferred compensation plan | 67,529 |
| Payable for custodian fee | 104,486 |
| Payable for legal and accounting services | 48,311 |
| Accrued expenses | 22,067 |
| Total liabilities | $637,408 |
| Net Assets applicable to investors' interest in Portfolio | $746,950,942 |
19
See Notes to Financial Statements.
Stock Portfolio
December 31, 2024
| | Year Ended |
| | December 31, 2024 |
| Investment Income | |
| Dividend income (net of foreign taxes withheld of $29,617) | $5,907,690 |
| Dividend income from affiliated investments | 266,103 |
| Total investment income | $6,173,793 |
| Expenses | |
| Investment adviser fee | $4,134,015 |
| Trustees’ fees and expenses | 52,015 |
| Custodian fee | 169,665 |
| Legal and accounting services | 41,423 |
| Miscellaneous | 21,240 |
| Total expenses | $4,418,358 |
| Deduct: | |
| Waiver and/or reimbursement of expenses by affiliates | $7,458 |
| Total expense reductions | $7,458 |
| Net expenses | $4,410,900 |
| Net investment income | $1,762,893 |
| Realized and Unrealized Gain (Loss) | |
| Net realized gain (loss): | |
| Investment transactions | $68,213,188 |
| Foreign currency transactions | (47) |
| Net realized gain | $68,213,141 |
| Change in unrealized appreciation (depreciation): | |
| Investments | $112,518,034 |
| Foreign currency | (138) |
| Net change in unrealized appreciation (depreciation) | $112,517,896 |
| Net realized and unrealized gain | $180,731,037 |
| Net increase in net assets from operations | $182,493,930 |
20
See Notes to Financial Statements.
Stock Portfolio
December 31, 2024
Statements of Changes in Net Assets
| | Year Ended December 31, |
| | 2024 | 2023 |
| Increase (Decrease) in Net Assets | | |
| From operations: | | |
| Net investment income | $1,762,893 | $3,395,003 |
| Net realized gain | 68,213,141 | 45,840,944 |
| Net change in unrealized appreciation (depreciation) | 112,517,896 | 74,502,318 |
| Net increase in net assets from operations | $182,493,930 | $123,738,265 |
| Capital transactions: | | |
| Contributions | $33,145,342 | $11,099,572 |
| Withdrawals | (63,170,365) | (90,392,247) |
| Net decrease in net assets from capital transactions | $(30,025,023) | $(79,292,675) |
| Net increase in net assets | $152,468,907 | $44,445,590 |
| Net Assets | | |
| At beginning of year | $594,482,035 | $550,036,445 |
| At end of year | $746,950,942 | $594,482,035 |
21
See Notes to Financial Statements.
Stock Portfolio
December 31, 2024
| | Year Ended December 31, |
| Ratios/Supplemental Data | 2024 | 2023 | 2022 | 2021 | 2020 |
| Ratios (as a percentage of average daily net assets):(1) | | | | | |
| Total expenses | 0.63% | 0.64% | 0.64% | 0.63% | 0.64% |
| Net expenses | 0.63%(2) | 0.64%(2) | 0.64%(2) | 0.63% | 0.64% |
| Net investment income | 0.25% | 0.60% | 0.82% | 0.55% | 0.84% |
| Portfolio Turnover | 44% | 44% | 52% | 44% | 70% |
| Total Return | 30.99% | 24.43% | (16.49)% | 23.21% | 18.61% |
| Net assets, end of year (000’s omitted) | $746,951 | $594,482 | $550,036 | $871,310 | $804,446 |
| (1) | Total expenses do not reflect amounts reimbursed and/or waived by the adviser and certain of its affiliates, if applicable. Net expenses are net of all reductions and represent the net expenses paid by the Portfolio. |
| (2) | Includes a reduction by the investment adviser of a portion of its adviser fee due to the Portfolio’s investment in the Liquidity Fund (equal to less than 0.005% of average daily net assets for the years ended December 31, 2024, 2023 and 2022). |
22
See Notes to Financial Statements.
Stock Portfolio
December 31, 2024
Notes to Financial Statements
1 Significant Accounting Policies
Stock Portfolio (the Portfolio) is a Massachusetts business trust registered under the Investment Company Act of 1940, as amended (the 1940 Act), as a diversified, open-end management investment company. The Portfolio's investment objective is to achieve long-term capital appreciation by investing in a diversified portfolio of equity securities. The Declaration of Trust permits the Trustees to issue interests in the Portfolio. At December 31, 2024, Eaton Vance Stock Fund and Eaton Vance Balanced Fund held an interest of 13.2% and 86.8%, respectively, in the Portfolio.
The following is a summary of significant accounting policies of the Portfolio. The policies are in conformity with accounting principles generally accepted in the United States of America (U.S. GAAP). The Portfolio is an investment company and follows accounting and reporting guidance in the Financial Accounting Standards Board (FASB) Accounting Standards Codification Topic 946.
A Investment Valuation—The following methodologies are used to determine the market value or fair value of investments.
Equity Securities. Equity securities listed on a U.S. securities exchange generally are valued at the last sale or closing price on the day of valuation or, if no sales took place on such date, at the mean between the closing bid and ask prices on the exchange where such securities are principally traded. Equity securities listed on the NASDAQ National Market System are valued at the NASDAQ official closing price. Unlisted or listed securities for which closing sales prices or closing quotations are not available are valued at the mean between the latest available bid and ask prices.
Foreign Currencies. Foreign currencies are valued in U.S. dollars, based on foreign currency exchange rate quotations supplied by a third party pricing service. The pricing service uses a proprietary model to determine the exchange rate. Inputs to the model include reported trades and implied bid/ask spreads.
Other. Investments in management investment companies (including money market funds) that do not trade on an exchange are valued at the net asset value as of the close of each business day.
Fair Valuation. In connection with Rule 2a-5 of the 1940 Act, the Trustees have designated the Portfolio’s investment adviser as its valuation designee. Investments for which valuations or market quotations are not readily available or are deemed unreliable are valued by the investment adviser, as valuation designee, at fair value using methods that most fairly reflect the security’s “fair value”, which is the amount that the Portfolio might reasonably expect to receive for the security upon its current sale in the ordinary course. Each such determination is based on a consideration of relevant factors, which are likely to vary from one pricing context to another. These factors may include, but are not limited to, the type of security, the existence of any contractual restrictions on the security’s disposition, the price and extent of public trading in similar securities of the issuer or of comparable companies or entities, quotations or relevant information obtained from broker/dealers or other market participants, information obtained from the issuer, analysts, and/or the appropriate stock exchange (for exchange-traded securities), an analysis of the company’s or entity’s financial statements, and an evaluation of the forces that influence the issuer and the market(s) in which the security is purchased and sold.
B Investment Transactions—Investment transactions for financial statement purposes are accounted for on a trade date basis. Realized gains and losses on investments sold are determined on the basis of identified cost.
C Income—Dividend income is recorded on the ex-dividend date for dividends received in cash and/or securities. However, if the ex-dividend date has passed, certain dividends from foreign securities are recorded as the Portfolio is informed of the ex-dividend date. Withholding taxes on foreign dividends and capital gains have been provided for in accordance with the Portfolio’s understanding of the applicable countries’ tax rules and rates.
D Federal Taxes—The Portfolio has elected to be treated as a partnership for federal tax purposes. No provision is made by the Portfolio for federal or state taxes on any taxable income of the Portfolio because each investor in the Portfolio is ultimately responsible for the payment of any taxes on its share of taxable income. Since at least one of the Portfolio's investors is a regulated investment company that invests all or substantially all of its assets in the Portfolio, the Portfolio normally must satisfy the applicable source of income and diversification requirements (under the Internal Revenue Code) in order for its investors to satisfy them. The Portfolio will allocate, at least annually among its investors, each investor's distributive share of the Portfolio's net investment income, net realized capital gains and losses and any other items of income, gain, loss, deduction or credit.
As of December 31, 2024, the Portfolio had no uncertain tax positions that would require financial statement recognition, de-recognition, or disclosure. The Portfolio files a U.S. federal income tax return annually after its fiscal year-end, which is subject to examination by the Internal Revenue Service for a period of three years from the date of filing.
E Foreign Currency Translation—Other assets and liabilities initially expressed in foreign currencies are translated each business day into U.S. dollars based upon current exchange rates. Income and expenses denominated in foreign currencies are translated into U.S. dollars based upon currency exchange rates in effect on the respective dates of such transactions.
F Use of Estimates—The preparation of the financial statements in conformity with U.S. GAAP requires management to make estimates and assumptions that affect the reported amounts of assets and liabilities at the date of the financial statements and the reported amounts of income and expense during the reporting period. Actual results could differ from those estimates.
Stock Portfolio
December 31, 2024
Notes to Financial Statements — continued
G Indemnifications—Under the Portfolio’s organizational documents, its officers and Trustees may be indemnified against certain liabilities and expenses arising out of the performance of their duties to the Portfolio. Under Massachusetts law, if certain conditions prevail, interestholders in the Portfolio could be deemed to have personal liability for the obligations of the Portfolio. However, the Portfolio’s Declaration of Trust contains an express disclaimer of liability on the part of Portfolio interestholders. Additionally, in the normal course of business, the Portfolio enters into agreements with service providers that may contain indemnification clauses. The Portfolio’s maximum exposure under these arrangements is unknown as this would involve future claims that may be made against the Portfolio that have not yet occurred.
H Segment Reporting—During the year ended December 31, 2024, the Portfolio adopted FASB Accounting Standards Update No. 2023-07, Segment Reporting (Topic 280): Improvements to Reportable Segment Disclosures, (ASU 2023-07), which requires incremental disclosures related to a public entity’s reportable segments. The Portfolio operates as a single reportable segment, an investment company whose investment objective is included in Note 1. In connection with the adoption of ASU 2023-07, the Portfolio’s President has been designated as the Portfolio’s Chief Operating Decision Maker (CODM), who is responsible for assessing the performance of the Portfolio’s single segment and deciding how to allocate the segment’s resources. To perform this function, the CODM reviews the information in the Portfolio’s Financial Statements.
2 Investment Adviser Fee and Other Transactions with Affiliates
The investment adviser fee is earned by Boston Management and Research (BMR), an indirect, wholly-owned subsidiary of Morgan Stanley, as compensation for investment advisory services rendered to the Portfolio. The fee is computed at an annual rate as a percentage of the Portfolio’s average daily net assets as follows and is payable monthly:
| Average Daily Net Assets | Annual Fee Rate |
| Up to $500 million | 0.600% |
| $500 million but less than $1 billion | 0.575% |
| $1 billion but less than $2.5 billion | 0.550% |
| $2.5 billion but less than $5 billion | 0.530% |
| $5 billion and over | 0.515% |
For the year ended December 31, 2024, the Portfolio's investment adviser fee amounted to $4,134,015 or 0.59% of the Portfolio’s average daily net assets.
The Portfolio may invest in a money market fund, the Institutional Class of the Morgan Stanley Institutional Liquidity Funds - Government Portfolio (the “Liquidity Fund”), an open-end management investment company managed by Morgan Stanley Investment Management Inc., a wholly-owned subsidiary of Morgan Stanley. The investment adviser fee paid by the Portfolio is reduced by an amount equal to its pro rata share of the advisory and administration fees paid by the Portfolio due to its investment in the Liquidity Fund. For the year ended December 31, 2024, the investment adviser fee paid was reduced by $7,458 relating to the Portfolio's investment in the Liquidity Fund.
Trustees and officers of the Portfolio who are members of BMR’s organization receive remuneration for their services to the Portfolio out of the investment adviser fee. Trustees of the Portfolio who are not affiliated with the investment adviser may elect to defer receipt of all or a percentage of their annual fees in accordance with the terms of the Trustees Deferred Compensation Plan. Certain officers and Trustees of the Portfolio are officers of the above organization.
3 Purchases and Sales of Investments
Purchases and sales of investments, other than short-term obligations, aggregated $301,702,360 and $328,789,003, respectively, for the year ended December 31, 2024.
Stock Portfolio
December 31, 2024
Notes to Financial Statements — continued
4 Federal Income Tax Basis of Investments
The cost and unrealized appreciation (depreciation) of investments of the Portfolio at December 31, 2024, as determined on a federal income tax basis, were as follows:
| Aggregate cost | $413,064,757 |
| Gross unrealized appreciation | $338,878,697 |
| Gross unrealized depreciation | (4,719,127) |
| Net unrealized appreciation | $334,159,570 |
5 Line of Credit
The Portfolio participates with other portfolios and funds managed by BMR and its affiliates in a $650 million unsecured revolving line of credit agreement with a group of banks, which is in effect through October 21, 2025. Borrowings are made by the Portfolio solely for temporary purposes related to redemptions and other short-term cash needs. Interest is charged to the Portfolio based on its borrowings generally at an amount above either the Secured Overnight Financing Rate (SOFR) or Federal Funds rate. In addition, a fee computed at an annual rate of 0.15% on the daily unused portion of the line of credit is allocated among the participating portfolios and funds at the end of each quarter. In connection with the renewal of the agreement in October 2024, an arrangement fee of $150,000 was incurred that was allocated to the participating portfolios and funds. Because the line of credit is not available exclusively to the Portfolio, it may be unable to borrow some or all of its requested amounts at any particular time. The Portfolio did not have any significant borrowings or allocated fees during the year ended December 31, 2024.
6 Affiliated Investments
At December 31, 2024, the value of the Portfolio's investment in funds that may be deemed to be affiliated was $1,361,413, which represents 0.2% of the Portfolio's net assets. Transactions in such investments by the Portfolio for the year ended December 31, 2024 were as follows:
| Name | Value,
beginning
of period | Purchases | Sales
proceeds | Net realized
gain (loss) | Change in
unrealized
appreciation
(depreciation) | Value, end
of period | Dividend
income | Shares,
end of period |
| Short-Term Investments |
| Liquidity Fund | $2,428,547 | $115,605,406 | $(116,672,540) | $ — | $ — | $1,361,413 | $266,103 | 1,361,413 |
7 Fair Value Measurements
Under generally accepted accounting principles for fair value measurements, a three-tier hierarchy to prioritize the assumptions, referred to as inputs, is used in valuation techniques to measure fair value. The three-tier hierarchy of inputs is summarized in the three broad levels listed below.
| • | Level 1 – quoted prices in active markets for identical investments |
| • | Level 2 – other significant observable inputs (including quoted prices for similar investments, interest rates, prepayment speeds, credit risk, etc.) |
| • | Level 3 – significant unobservable inputs (including a fund's own assumptions in determining the fair value of investments) |
In cases where the inputs used to measure fair value fall in different levels of the fair value hierarchy, the level disclosed is determined based on the lowest level input that is significant to the fair value measurement in its entirety. The inputs or methodology used for valuing securities are not necessarily an indication of the risk associated with investing in those securities.
Stock Portfolio
December 31, 2024
Notes to Financial Statements — continued
At December 31, 2024, the hierarchy of inputs used in valuing the Portfolio's investments, which are carried at fair value, were as follows:
| Asset Description | Level 1 | Level 2 | Level 3 | Total |
| Common Stocks | $745,862,914* | $ — | $ — | $745,862,914 |
| Short-Term Investments | 1,361,413 | — | — | 1,361,413 |
| Total Investments | $ 747,224,327 | $ — | $ — | $747,224,327 |
| * | The level classification by major category of investments is the same as the category presentation in the Portfolio of Investments. |
Stock Portfolio
December 31, 2024
Report of Independent Registered Public Accounting Firm
To the Trustees and Investors of Stock Portfolio:
Opinion on the Financial Statements and Financial Highlights
We have audited the accompanying statement of assets and liabilities of Stock Portfolio (the “Portfolio”), including the portfolio of investments, as of December 31, 2024, the related statement of operations for the year then ended, the statements of changes in net assets for each of the two years in the period then ended, the financial highlights for each of the five years in the period then ended, and the related notes. In our opinion, the financial statements and financial highlights present fairly, in all material respects, the financial position of the Portfolio as of December 31, 2024, and the results of its operations for the year then ended, the changes in its net assets for each of the two years in the period then ended, and the financial highlights for each of the five years in the period then ended, in conformity with accounting principles generally accepted in the United States of America.
Basis for Opinion
These financial statements and financial highlights are the responsibility of the Portfolio's management. Our responsibility is to express an opinion on the Portfolio's financial statements and financial highlights based on our audits. We are a public accounting firm registered with the Public Company Accounting Oversight Board (United States) (PCAOB) and are required to be independent with respect to the Portfolio in accordance with the U.S. federal securities laws and the applicable rules and regulations of the Securities and Exchange Commission and the PCAOB.
We conducted our audits in accordance with the standards of the PCAOB. Those standards require that we plan and perform the audit to obtain reasonable assurance about whether the financial statements and financial highlights are free of material misstatement, whether due to error or fraud. The Portfolio is not required to have, nor were we engaged to perform, an audit of its internal control over financial reporting. As part of our audits, we are required to obtain an understanding of internal control over financial reporting but not for the purpose of expressing an opinion on the effectiveness of the Portfolio’s internal control over financial reporting. Accordingly, we express no such opinion.
Our audits included performing procedures to assess the risks of material misstatement of the financial statements and financial highlights, whether due to error or fraud, and performing procedures that respond to those risks. Such procedures included examining, on a test basis, evidence regarding the amounts and disclosures in the financial statements and financial highlights. Our audits also included evaluating the accounting principles used and significant estimates made by management, as well as evaluating the overall presentation of the financial statements and financial highlights. Our procedures included confirmation of securities owned as of December 31, 2024, by correspondence with the custodian and brokers; when replies were not received from brokers, we performed other auditing procedures. We believe that our audits provide a reasonable basis for our opinion.
/s/ Deloitte & Touche LLP
Boston, Massachusetts
February 21, 2025
We have served as the auditor of one or more Eaton Vance investment companies since 1959.
This Page Intentionally Left Blank
Eaton Vance
Core Bond Fund
Annual Financial Statements and
Additional Information
December 31, 2024
This report must be preceded or accompanied by a current summary prospectus or prospectus. Before investing, investors should consider carefully the investment objective, risks, and charges and expenses of a mutual fund. This and other important information is contained in the prospectus and/or statement of additional information, which can be obtained by calling 1-800-262-1122 or from a financial intermediary. Prospective investors should read the prospectus carefully before investing.
Annual Financial Statements and Additional Information December 31, 2024
Eaton Vance
Core Bond Fund
Items 8, 9 and 11 of Form N-CSR are Not Applicable. For Item 10 of Form N-CSR, see Item 7.
Eaton Vance
Core Bond Fund
December 31, 2024
Statement of Assets and Liabilities
| | December 31, 2024 |
| Assets | |
| Investment in Core Bond Portfolio, at value (identified cost $222,245,220) | $217,326,175 |
| Receivable for Fund shares sold | 642,096 |
| Receivable from affiliates | 16,580 |
| Total assets | $217,984,851 |
| Liabilities | |
| Payable for Fund shares redeemed | $151,298 |
| Distributions payable | 2,122 |
| Payable to affiliates: | |
| Distribution and service fees | 5,149 |
| Trustees' fees | 125 |
| Payable for custodian fee | 16,158 |
| Payable for transfer and dividend disbursing agent fees | 19,001 |
| Payable for legal and accounting services | 37,314 |
| Accrued expenses | 9,630 |
| Total liabilities | $240,797 |
| Net Assets | $217,744,054 |
| Sources of Net Assets | |
| Paid-in capital | $246,213,765 |
| Accumulated loss | (28,469,711) |
| Net Assets | $217,744,054 |
| Class A Shares | |
| Net Assets | $24,538,005 |
| Shares Outstanding | 2,897,911 |
Net Asset Value and Redemption Price Per Share
(net assets ÷ shares of beneficial interest outstanding) | $8.47 |
Maximum Offering Price Per Share
(100 ÷ 96.75 of net asset value per share) | $8.75 |
| Class I Shares | |
| Net Assets | $193,206,049 |
| Shares Outstanding | 22,854,804 |
Net Asset Value, Offering Price and Redemption Price Per Share
(net assets ÷ shares of beneficial interest outstanding) | $8.45 |
| On sales of $100,000 or more, the offering price of Class A shares is reduced. |
1
See Notes to Financial Statements.
Eaton Vance
Core Bond Fund
December 31, 2024
| | Year Ended |
| | December 31, 2024 |
| Investment Income | |
| Dividend income allocated from Portfolio (net of foreign taxes withheld of $8,695) | $680,353 |
| Interest income allocated from Portfolio | 12,327,305 |
| Expenses allocated from Portfolio | (1,346,935) |
| Total investment income from Portfolio | $11,660,723 |
| Expenses | |
| Distribution and service fees: | |
| Class A | $56,425 |
| Trustees’ fees and expenses | 500 |
| Custodian fee | 26,710 |
| Transfer and dividend disbursing agent fees | 75,390 |
| Legal and accounting services | 46,374 |
| Printing and postage | 18,646 |
| Registration fees | 44,350 |
| Miscellaneous | 11,329 |
| Total expenses | $279,724 |
| Deduct: | |
| Waiver and/or reimbursement of expenses by affiliates | $220,872 |
| Total expense reductions | $220,872 |
| Net expenses | $58,852 |
| Net investment income | $11,601,871 |
| Realized and Unrealized Gain (Loss) from Portfolio | |
| Net realized gain (loss): | |
| Investment transactions | $(2,738,597) |
| Futures contracts | (1,258,042) |
| Net realized loss | $(3,996,639) |
| Change in unrealized appreciation (depreciation): | |
| Investments | $985,326 |
| Futures contracts | (1,356,629) |
| Net change in unrealized appreciation (depreciation) | $(371,303) |
| Net realized and unrealized loss | $(4,367,942) |
| Net increase in net assets from operations | $7,233,929 |
2
See Notes to Financial Statements.
Eaton Vance
Core Bond Fund
December 31, 2024
Statements of Changes in Net Assets
| | Year Ended December 31, |
| | 2024 | 2023 |
| Increase (Decrease) in Net Assets | | |
| From operations: | | |
| Net investment income | $11,601,871 | $9,170,259 |
| Net realized loss | (3,996,639) | (9,898,881) |
| Net change in unrealized appreciation (depreciation) | (371,303) | 13,613,849 |
| Net increase in net assets from operations | $7,233,929 | $12,885,227 |
| Distributions to shareholders: | | |
| Class A | $(908,620) | $(587,259) |
| Class I | (10,751,925) | (8,970,700) |
| Total distributions to shareholders | $(11,660,545) | $(9,557,959) |
| Transactions in shares of beneficial interest: | | |
| Class A | $4,676,912 | $6,504,390 |
| Class I | (43,776,096) | 40,211,921 |
| Net increase (decrease) in net assets from Fund share transactions | $(39,099,184) | $46,716,311 |
| Net increase (decrease) in net assets | $(43,525,800) | $50,043,579 |
| Net Assets | | |
| At beginning of year | $261,269,854 | $211,226,275 |
| At end of year | $217,744,054 | $261,269,854 |
3
See Notes to Financial Statements.
Eaton Vance
Core Bond Fund
December 31, 2024
| | Class A |
| | Year Ended December 31, |
| | 2024 | 2023 | 2022 | 2021 | 2020 |
| Net asset value — Beginning of year | $8.58 | $8.41 | $9.97 | $10.26 | $10.01 |
| Income (Loss) From Operations | | | | | |
| Net investment income(1) | $0.34 | $0.30 | $0.20 | $0.18 | $0.23 |
| Net realized and unrealized gain (loss) | (0.11) | 0.18 | (1.52) | (0.14) | 0.55 |
| Total income (loss) from operations | $0.23 | $0.48 | $(1.32) | $0.04 | $0.78 |
| Less Distributions | | | | | |
| From net investment income | $(0.34) | $(0.31) | $(0.23) | $(0.21) | $(0.25) |
| From net realized gain | — | — | (0.01) | (0.12) | (0.28) |
| Total distributions | $(0.34) | $(0.31) | $(0.24) | $(0.33) | $(0.53) |
| Net asset value — End of year | $8.47 | $8.58 | $8.41 | $9.97 | $10.26 |
| Total Return(2) | 2.77% | 5.81% | (13.33)% | 0.36% | 7.88% |
| Ratios/Supplemental Data | | | | | |
| Net assets, end of year (000’s omitted) | $24,538 | $20,163 | $13,226 | $17,409 | $21,770 |
| Ratios (as a percentage of average daily net assets):(3)(4) | | | | | |
| Total expenses | 0.85% | 0.85% | 0.86% | 0.86% | 0.86% |
| Net expenses | 0.74%(5) | 0.74%(5) | 0.74%(5) | 0.74% | 0.74% |
| Net investment income | 4.00% | 3.52% | 2.25% | 1.81% | 2.23% |
| Portfolio Turnover of the Portfolio(6) | 375% | 227% | 102% | 122% | 93% |
| (1) | Computed using average shares outstanding. |
| (2) | Returns are historical and are calculated by determining the percentage change in net asset value with all distributions reinvested and do not reflect the effect of sales charges. |
| (3) | Total expenses do not reflect amounts reimbursed and/or waived by the adviser of the Portfolio and/or the administrator. Net expenses are net of all reductions and represent the net expenses paid by the Fund. |
| (4) | Includes the Fund’s share of the Portfolio’s allocated expenses. |
| (5) | Includes a reduction by the investment adviser of a portion of the Portfolio’s adviser fee due to the Portfolio’s investment in the Liquidity Fund and in other affiliated funds (equal to less than 0.01% of average daily net assets for the year ended December 31, 2024 and less than 0.005% of average daily net assets for the years ended December 31, 2023 and 2022). |
| (6) | Includes the effect of To Be Announced (TBA) transactions. |
4
See Notes to Financial Statements.
Eaton Vance
Core Bond Fund
December 31, 2024
Financial Highlights — continued
| | Class I |
| | Year Ended December 31, |
| | 2024 | 2023 | 2022 | 2021 | 2020 |
| Net asset value — Beginning of year | $8.57 | $8.40 | $9.96 | $10.24 | $9.99 |
| Income (Loss) From Operations | | | | | |
| Net investment income(1) | $0.36 | $0.32 | $0.23 | $0.21 | $0.25 |
| Net realized and unrealized gain (loss) | (0.12) | 0.18 | (1.53) | (0.14) | 0.55 |
| Total income (loss) from operations | $0.24 | $0.50 | $(1.30) | $0.07 | $0.80 |
| Less Distributions | | | | | |
| From net investment income | $(0.36) | $(0.33) | $(0.25) | $(0.23) | $(0.27) |
| From net realized gain | — | — | (0.01) | (0.12) | (0.28) |
| Total distributions | $(0.36) | $(0.33) | $(0.26) | $(0.35) | $(0.55) |
| Net asset value — End of year | $8.45 | $8.57 | $8.40 | $9.96 | $10.24 |
| Total Return(2) | 2.90% | 6.08% | (13.13)% | 0.71% | 8.16% |
| Ratios/Supplemental Data | | | | | |
| Net assets, end of year (000’s omitted) | $193,206 | $241,106 | $198,001 | $106,684 | $139,826 |
| Ratios (as a percentage of average daily net assets):(3)(4) | | | | | |
| Total expenses | 0.60% | 0.60% | 0.61% | 0.61% | 0.61% |
| Net expenses | 0.49%(5) | 0.49%(5) | 0.49%(5) | 0.49% | 0.49% |
| Net investment income | 4.25% | 3.75% | 2.57% | 2.06% | 2.47% |
| Portfolio Turnover of the Portfolio(6) | 375% | 227% | 102% | 122% | 93% |
| (1) | Computed using average shares outstanding. |
| (2) | Returns are historical and are calculated by determining the percentage change in net asset value with all distributions reinvested. |
| (3) | Total expenses do not reflect amounts reimbursed and/or waived by the adviser of the Portfolio and/or the administrator. Net expenses are net of all reductions and represent the net expenses paid by the Fund. |
| (4) | Includes the Fund’s share of the Portfolio’s allocated expenses. |
| (5) | Includes a reduction by the investment adviser of a portion of the Portfolio’s adviser fee due to the Portfolio’s investment in the Liquidity Fund and in other affiliated funds (equal to less than 0.01% of average daily net assets for the year ended December 31, 2024 and less than 0.005% of average daily net assets for the years ended December 31, 2023 and 2022). |
| (6) | Includes the effect of To Be Announced (TBA) transactions. |
5
See Notes to Financial Statements.
Eaton Vance
Core Bond Fund
December 31, 2024
Notes to Financial Statements
1 Significant Accounting Policies
Eaton Vance Core Bond Fund (the Fund) is a diversified series of Eaton Vance Special Investment Trust (the Trust). The Trust is a Massachusetts business trust registered under the Investment Company Act of 1940, as amended (the 1940 Act), as an open-end management investment company. The Fund offers two classes of shares. Class A shares are generally sold subject to a sales charge imposed at time of purchase. Class I shares are sold at net asset value and are not subject to a sales charge. Each class represents a pro rata interest in the Fund, but votes separately on class-specific matters and (as noted below) is subject to different expenses. Realized and unrealized gains and losses are allocated daily to each class of shares based on the relative net assets of each class to the total net assets of the Fund. Net investment income, other than class-specific expenses, is allocated daily to each class of shares based upon the ratio of the value of each class’s paid shares to the total value of all paid shares. Each class of shares differs in its distribution plan and certain other class-specific expenses. The Fund invests all of its investable assets in interests in Core Bond Portfolio (the Portfolio), a Massachusetts business trust, having the same investment objectives and policies as the Fund. The value of the Fund’s investment in the Portfolio reflects the Fund’s proportionate interest in the net assets of the Portfolio (37.3% at December 31, 2024). The performance of the Fund is directly affected by the performance of the Portfolio. The financial statements of the Portfolio, including the portfolio of investments, are included elsewhere in this report and should be read in conjunction with the Fund’s financial statements.
The following is a summary of significant accounting policies of the Fund. The policies are in conformity with accounting principles generally accepted in the United States of America (U.S. GAAP). The Fund is an investment company and follows accounting and reporting guidance in the Financial Accounting Standards Board (FASB) Accounting Standards Codification Topic 946.
A Investment Valuation—Valuation of securities by the Portfolio is discussed in Note 1A of the Portfolio's Notes to Financial Statements, which are included elsewhere in this report.
B Income—The Fund's net investment income or loss consists of the Fund's pro rata share of the net investment income or loss of the Portfolio, less all actual and accrued expenses of the Fund.
C Federal Taxes—The Fund's policy is to comply with the provisions of the Internal Revenue Code applicable to regulated investment companies and to distribute to shareholders each year substantially all of its net investment income, and all or substantially all of its net realized capital gains. Accordingly, no provision for federal income or excise tax is necessary.
As of December 31, 2024, the Fund had no uncertain tax positions that would require financial statement recognition, de-recognition, or disclosure. The Fund files a U.S. federal income tax return annually after its fiscal year-end, which is subject to examination by the Internal Revenue Service for a period of three years from the date of filing.
D Expenses—The majority of expenses of the Trust are directly identifiable to an individual fund. Expenses which are not readily identifiable to a specific fund are allocated taking into consideration, among other things, the nature and type of expense and the relative size of the funds.
E Use of Estimates—The preparation of the financial statements in conformity with U.S. GAAP requires management to make estimates and assumptions that affect the reported amounts of assets and liabilities at the date of the financial statements and the reported amounts of income and expense during the reporting period. Actual results could differ from those estimates.
F Indemnifications—Under the Trust’s organizational documents, its officers and Trustees may be indemnified against certain liabilities and expenses arising out of the performance of their duties to the Fund. Under Massachusetts law, if certain conditions prevail, shareholders of a Massachusetts business trust (such as the Trust) could be deemed to have personal liability for the obligations of the Trust. However, the Trust’s Declaration of Trust contains an express disclaimer of liability on the part of Fund shareholders and the By-laws provide that the Trust shall assume, upon request by the shareholder, the defense on behalf of any Fund shareholders. Moreover, the By-laws also provide for indemnification out of Fund property of any shareholder held personally liable solely by reason of being or having been a shareholder for all loss or expense arising from such liability. Additionally, in the normal course of business, the Fund enters into agreements with service providers that may contain indemnification clauses. The Fund’s maximum exposure under these arrangements is unknown as this would involve future claims that may be made against the Fund that have not yet occurred.
G Other—Investment transactions are accounted for on a trade date basis.
H Segment Reporting—During the year ended December 31, 2024, the Fund adopted FASB Accounting Standards Update No. 2023-07, Segment Reporting (Topic 280): Improvements to Reportable Segment Disclosures, (ASU 2023-07), which requires incremental disclosures related to a public entity’s reportable segments. The Fund operates as a single reportable segment, an investment company whose investment objectives are included in Note 1. In connection with the adoption of ASU 2023-07, the Fund’s President has been designated as the Fund’s Chief Operating Decision Maker (CODM), who is responsible for assessing the performance of the Fund’s single segment and deciding how to allocate the segment’s resources. To perform this function, the CODM reviews the information in the Fund’s Financial Statements.
Eaton Vance
Core Bond Fund
December 31, 2024
Notes to Financial Statements — continued
2 Distributions to Shareholders and Income Tax Information
The Fund declares dividends daily to shareholders of record at the time of declaration. Distributions are generally paid monthly. Distributions of realized capital gains are made at least annually. Distributions are declared separately for each class of shares. Shareholders may reinvest income and capital gain distributions in additional shares of the same class of the Fund at the net asset value as of the reinvestment date or, at the election of the shareholder, receive distributions in cash. Distributions to shareholders are determined in accordance with income tax regulations, which may differ from U.S. GAAP. As required by U.S. GAAP, only distributions in excess of tax basis earnings and profits are reported in the financial statements as a return of capital. Permanent differences between book and tax accounting relating to distributions are reclassified to paid-in capital. For tax purposes, distributions from short-term capital gains are considered to be from ordinary income.
The tax character of distributions declared for the years ended December 31, 2024 and December 31, 2023 was as follows:
| | Year Ended December 31, |
| | 2024 | 2023 |
| Ordinary income | $11,660,545 | $9,557,959 |
As of December 31, 2024, the components of distributable earnings (accumulated loss) on a tax basis were as follows:
| Undistributed ordinary income | $ 11,006 |
| Deferred capital losses | (18,229,393) |
| Net unrealized depreciation | (10,249,202) |
| Distributions payable | (2,122) |
| Accumulated loss | $(28,469,711) |
At December 31, 2024, the Fund, for federal income tax purposes, had deferred capital losses of $18,229,393 which would reduce its taxable income arising from future net realized gains on investment transactions, if any, to the extent permitted by the Internal Revenue Code, and thus would reduce the amount of distributions to shareholders, which would otherwise be necessary to relieve the Fund of any liability for federal income or excise tax. The deferred capital losses are treated as arising on the first day of the Fund’s next taxable year and retain the same short-term or long-term character as when originally deferred. Of the deferred capital losses at December 31, 2024, $4,186,398 are short-term and $14,042,995 are long-term.
3 Investment Adviser Fee and Other Transactions with Affiliates
The investment adviser fee is earned by Eaton Vance Management (EVM), an indirect, wholly-owned subsidiary of Morgan Stanley, as compensation for investment advisory services rendered to the Fund. The investment adviser fee is computed as a percentage of the Fund's average daily net assets that are not invested in other investment companies for which EVM or its affiliates serve as investment adviser and receive an advisory fee, at a per annum rate as follows and is payable monthly:
| Average Daily Net Assets | Annual Fee Rate |
| Up to $1 billion | 0.450% |
| $1 billion up to $2 billion | 0.425% |
| $2 billion up to $5 billion | 0.415% |
| $5 billion and over | 0.405% |
For the year ended December 31, 2024, the Fund incurred no investment adviser fee on such assets. To the extent the Fund’s assets are invested in the Portfolio, the Fund is allocated its share of the Portfolio’s investment adviser fee. The Portfolio has engaged Boston Management and Research (BMR) to render investment advisory services. See Note 2 of the Portfolio’s Notes to Financial Statements which are included elsewhere in this report. EVM also serves as the administrator of the Fund, but receives no compensation.
Eaton Vance
Core Bond Fund
December 31, 2024
Notes to Financial Statements — continued
EVM has agreed to reimburse the Fund’s expenses to the extent that total annual operating expenses (relating to ordinary operating expenses only and excluding such expenses as brokerage commissions, acquired fund fees and expenses of unaffiliated funds, borrowing costs, taxes or litigation expenses) exceed 0.74% and 0.49% of the Fund’s average daily net assets for Class A and Class I, respectively. This agreement may be changed or terminated after May 1, 2025. Pursuant to this agreement, EVM waived and/or reimbursed $220,872 of the Fund’s operating expenses for the year ended December 31, 2024.
EVM provides sub-transfer agency and related services to the Fund pursuant to a Sub-Transfer Agency Support Services Agreement. For the year ended December 31, 2024, EVM earned $5,938 from the Fund pursuant to such agreement, which is included in transfer and dividend disbursing agent fees on the Statement of Operations. The Fund was informed that Eaton Vance Distributors, Inc. (EVD), an affiliate of EVM and the Fund's principal underwriter, received $5,734 as its portion of the sales charge on sales of Class A shares for the year ended December 31, 2024. EVD also received distribution and service fees from Class A shares (see Note 4).
Trustees and officers of the Fund who are members of EVM’s or BMR's organizations receive remuneration for their services to the Fund out of the investment adviser fee. Certain officers and Trustees of the Fund and the Portfolio are officers of the above organizations.
4 Distribution Plan
The Fund has in effect a distribution plan for Class A shares (Class A Plan) pursuant to Rule 12b-1 under the 1940 Act. Pursuant to the Class A Plan, the Fund pays EVD a distribution and service fee of 0.25% per annum of its average daily net assets attributable to Class A shares for distribution services and facilities provided to the Fund by EVD, as well as for personal services and/or the maintenance of shareholder accounts. Distribution and service fees paid or accrued to EVD for the year ended December 31, 2024 amounted to $56,425 for Class A shares.
Distribution and service fees are subject to the limitations contained in the Financial Industry Regulatory Authority Rule 2341(d).
5 Contingent Deferred Sales Charges
Class A shares may be subject to a 0.75% contingent deferred sales charge (CDSC) if redeemed within 12 months of purchase (depending on the circumstances of purchase). Generally, the CDSC is based upon the lower of the net asset value at date of redemption or date of purchase. No charge is levied on shares acquired by reinvestment of dividends or capital gain distributions. For the year ended December 31, 2024, the Fund was informed that EVD received no CDSCs paid by Class A shareholders.
6 Investment Transactions
For the year ended December 31, 2024, increases and decreases in the Fund's investment in the Portfolio aggregated $94,860,602 and $144,646,942, respectively.
7 Shares of Beneficial Interest
The Fund’s Declaration of Trust permits the Trustees to issue an unlimited number of full and fractional shares of beneficial interest (without par value). Such shares may be issued in a number of different series (such as the Fund) and classes. Transactions in Fund shares were as follows:
| | Year Ended
December 31, 2024 | | Year Ended
December 31, 2023 |
| | Shares | Amount | | Shares | Amount |
| Class A | | | | | |
| Sales | 925,441 | $ 7,919,652 | | 1,093,871 | $ 9,163,386 |
| Issued to shareholders electing to receive payments of distributions in Fund shares | 103,906 | 885,293 | | 67,687 | 567,941 |
| Redemptions | (480,170) | (4,128,033) | | (384,946) | (3,226,937) |
| Net increase | 549,177 | $ 4,676,912 | | 776,612 | $ 6,504,390 |
Eaton Vance
Core Bond Fund
December 31, 2024
Notes to Financial Statements — continued
| | Year Ended
December 31, 2024 | | Year Ended
December 31, 2023 |
| | Shares | Amount | | Shares | Amount |
| Class I | | | | | |
| Sales | 14,087,713 | $121,161,128 | | 13,774,037 | $117,011,176 |
| Issued to shareholders electing to receive payments of distributions in Fund shares | 1,258,882 | 10,712,951 | | 1,069,261 | 8,966,403 |
| Redemptions | (20,618,150) | (175,650,175) | | (10,290,245) | (85,765,658) |
| Net increase (decrease) | (5,271,555) | $(43,776,096) | | 4,553,053 | $ 40,211,921 |
At December 31, 2024, donor advised and pooled income funds (established and maintained by a public charity) managed by EVM owned in the aggregate 33.2% of the value of the outstanding shares of the Fund.
Eaton Vance
Core Bond Fund
December 31, 2024
Report of Independent Registered Public Accounting Firm
To the Trustees of Eaton Vance Special Investment Trust and Shareholders of Eaton Vance Core Bond Fund:
Opinion on the Financial Statements and Financial Highlights
We have audited the accompanying statement of assets and liabilities of Eaton Vance Core Bond Fund (the "Fund") (one of the funds constituting Eaton Vance Special Investment Trust), as of December 31, 2024, the related statement of operations for the year then ended, the statements of changes in net assets for each of the two years in the period then ended, the financial highlights for each of the five years in the period then ended, and the related notes. In our opinion, the financial statements and financial highlights present fairly, in all material respects, the financial position of the Fund as of December 31, 2024, and the results of its operations for the year then ended, the changes in its net assets for each of the two years in the period then ended, and the financial highlights for each of the five years in the period then ended, in conformity with accounting principles generally accepted in the United States of America.
Basis for Opinion
These financial statements and financial highlights are the responsibility of the Fund's management. Our responsibility is to express an opinion on the Fund's financial statements and financial highlights based on our audits. We are a public accounting firm registered with the Public Company Accounting Oversight Board (United States) (PCAOB) and are required to be independent with respect to the Fund in accordance with the U.S. federal securities laws and the applicable rules and regulations of the Securities and Exchange Commission and the PCAOB.
We conducted our audits in accordance with the standards of the PCAOB. Those standards require that we plan and perform the audit to obtain reasonable assurance about whether the financial statements and financial highlights are free of material misstatement, whether due to error or fraud. The Fund is not required to have, nor were we engaged to perform, an audit of its internal control over financial reporting. As part of our audits, we are required to obtain an understanding of internal control over financial reporting but not for the purpose of expressing an opinion on the effectiveness of the Fund’s internal control over financial reporting. Accordingly, we express no such opinion.
Our audits included performing procedures to assess the risks of material misstatement of the financial statements and financial highlights, whether due to error or fraud, and performing procedures that respond to those risks. Such procedures included examining, on a test basis, evidence regarding the amounts and disclosures in the financial statements and financial highlights. Our audits also included evaluating the accounting principles used and significant estimates made by management, as well as evaluating the overall presentation of the financial statements and financial highlights. We believe that our audits provide a reasonable basis for our opinion.
/s/ Deloitte & Touche LLP
Boston, Massachusetts
February 21, 2025
We have served as the auditor of one or more Eaton Vance investment companies since 1959.
Eaton Vance
Core Bond Fund
December 31, 2024
Federal Tax Information (Unaudited)
The Form 1099-DIV you received in February 2025 showed the tax status of all distributions paid to your account in calendar year 2024. Shareholders are advised to consult their own tax adviser with respect to the tax consequences of their investment in the Fund. As required by the Internal Revenue Code and/or regulations, shareholders must be notified regarding the status of 163(j) interest dividends.
163(j) Interest Dividends. For the fiscal year ended December 31, 2024, the Fund designates 88.45% of distributions from net investment income as a 163(j) interest dividend.
Core Bond Portfolio
December 31, 2024
| Asset-Backed Securities — 14.1% |
| Security | Principal
Amount
(000's omitted) | Value |
| AASET Trust, Series 2024-1A, Class A1, 6.261%, 5/16/49(1) | $ | 2,029 | $ 2,048,684 |
| ACHV ABS Trust, Series 2024-3AL, Class B, 5.45%, 12/26/31(1) | | 2,302 | 2,306,599 |
| ACM Auto Trust, Series 2023-2A, Class A, 7.97%, 6/20/30(1) | | 286 | 287,668 |
| Chesapeake Funding II LLC, Series 2024-1A, Class A1, 5.52%, 5/15/36(1) | | 1,802 | 1,822,770 |
| Clarus Capital Funding LLC, Series 2024-1A, Class A2, 4.71%, 8/20/32(1) | | 1,750 | 1,744,595 |
| Cloud Capital Holdco LP, Series 2024-1A, Class A2, 5.781%, 11/22/49(1) | | 2,310 | 2,305,952 |
| Coinstar Funding LLC, Series 2017-1A, Class A2, 5.216%, 4/25/47(1) | | 1,188 | 1,069,669 |
| Crockett Partners Equipment Co. IIA LLC, Series 2024-1C, Class A, 6.05%, 1/20/31(1) | | 1,591 | 1,604,623 |
| DataBank Issuer LLC, Series 2021-2A, Class A2, 2.40%, 10/25/51(1) | | 1,186 | 1,121,650 |
| DB Master Finance LLC: | | | |
| Series 2017-1A, Class A2II, 4.03%, 11/20/47(1) | | 317 | 307,994 |
| Series 2021-1A, Class A2I, 2.045%, 11/20/51(1) | | 1,615 | 1,530,169 |
| Diamond Infrastructure Funding LLC: | | | |
| Series 2021-1A, Class A, 1.76%, 4/15/49(1) | | 3,760 | 3,514,837 |
| Series 2021-1A, Class C, 3.475%, 4/15/49(1) | | 313 | 291,000 |
| Enterprise Fleet Financing LLC: | | | |
| Series 2023-1, Class A2, 5.51%, 1/22/29(1) | | 1,560 | 1,568,278 |
| Series 2024-2, Class A2, 5.74%, 12/20/26(1) | | 2,260 | 2,279,633 |
| Falcon Aerospace Ltd., Series 2019-1, Class A, 3.597%, 9/15/39(1) | | 776 | 733,449 |
| FMC FMSR Issuer Trust, Series 2024-FT1, Class A, 6.559%, 9/25/29(1) | | 2,695 | 2,677,416 |
| FMC GMSR Issuer Trust, Series 2021-GT2, Class A, 3.85%, 10/25/26(1)(2) | | 1,225 | 1,136,469 |
| GLS Auto Select Receivables Trust, Series 2024-2A, Class A2, 5.58%, 6/17/30(1) | | 2,680 | 2,710,795 |
| Goto Foods Funding LLC, Series 2017-1A, Class A2II, 5.093%, 4/30/47(1) | | 925 | 912,405 |
| Horizon Aircraft Finance III Ltd., Series 2019-2, Class A, 3.425%, 11/15/39(1) | | 1,041 | 968,054 |
| Horizon Aircraft Finance IV Ltd., Series 2024-1, Class A, 5.375%, 9/15/49(1) | | 2,271 | 2,206,463 |
| Jersey Mike's Funding LLC, Series 2019-1A, Class A2, 4.433%, 2/15/50(1) | | 1,031 | 1,019,219 |
| JPMorgan Chase Bank NA, Series 2021-3, Class B, 0.76%, 2/26/29(1) | | 76 | 75,436 |
| LAD Auto Receivables Trust: | | | |
| Series 2023-1A, Class A2, 5.68%, 10/15/26(1) | | 51 | 50,590 |
| Series 2024-1A, Class A3, 5.23%, 1/18/28(1) | | 1,270 | 1,275,605 |
| Security | Principal
Amount
(000's omitted) | Value |
| Lunar Aircraft Ltd., Series 2020-1A, Class B, 4.335%, 2/15/45(1) | $ | 195 | $ 189,305 |
| Lunar Structured Aircraft Portfolio Notes, Series 2021-1, Class A, 2.636%, 10/15/46(1) | | 2,989 | 2,734,546 |
| Mercury Financial Credit Card Master Trust, Series 2024-2A, Class A, 6.56%, 7/20/29(1) | | 2,191 | 2,218,443 |
| MetroNet Infrastructure Issuer LLC, Series 2024-1A, Class A2, 6.23%, 4/20/54(1) | | 1,001 | 1,022,338 |
| Navigator Aviation Ltd., Series 2024-1, Class A, 5.40%, 8/15/49(1) | | 2,245 | 2,196,566 |
| Neighborly Issuer LLC, Series 2021-1A, Class A2, 3.584%, 4/30/51(1) | | 1,322 | 1,220,206 |
| NRZ Excess Spread-Collateralized Notes, Series 2021-GNT1, Class A, 3.474%, 11/25/26(1) | | 619 | 592,470 |
| Oportun Issuance Trust: | | | |
| Series 2021-B, Class A, 1.47%, 5/8/31(1) | | 943 | 913,369 |
| Series 2021-C, Class A, 2.18%, 10/8/31(1) | | 4,128 | 4,005,394 |
| Pagaya AI Debt Selection Trust: | | | |
| Series 2021-2, 3.00%, 1/25/29(1) | | 113 | 111,881 |
| Series 2021-HG1, Class A, 1.22%, 1/16/29(1) | | 44 | 43,897 |
| PEAC Solutions Receivables LLC: | | | |
| Series 2024-1A, Class A2, 5.79%, 6/21/27(1) | | 1,367 | 1,380,024 |
| Series 2024-2A, Class A2, 4.74%, 4/20/27(1) | | 1,345 | 1,342,468 |
| PFS Financing Corp., Series 2024-B, Class A, 4.95%, 2/15/29(1) | | 3,085 | 3,104,462 |
| PK Alift Loan Funding 3 LP, Series 2024-1, Class A1, 5.842%, 9/15/39(1) | | 1,084 | 1,090,892 |
| Planet Fitness Master Issuer LLC: | | | |
| Series 2019-1A, Class A2, 3.858%, 12/5/49(1) | | 988 | 911,022 |
| Series 2024-1A, Class A2I, 5.765%, 6/5/54(1) | | 1,504 | 1,513,073 |
| PNMAC GMSR Issuer Trust, Series 2024-GT1, Class A, 7.539%, (1 mo. SOFR + 3.20%), 3/25/29(1)(3) | | 2,100 | 2,129,281 |
| Retained Vantage Data Centers Issuer LLC, Series 2023-1A, Class A2A, 5.00%, 9/15/48(1) | | 2,184 | 2,151,148 |
| ServiceMaster Funding LLC: | | | |
| Series 2020-1, Class A2I, 2.841%, 1/30/51(1) | | 528 | 481,941 |
| Series 2020-1, Class A2II, 3.337%, 1/30/51(1) | | 616 | 523,628 |
| SERVPRO Master Issuer LLC, Series 2019-1A, Class A2, 3.882%, 10/25/49(1) | | 3,561 | 3,463,137 |
| Sonic Capital LLC, Series 2020-1A, Class A2I, 3.845%, 1/20/50(1) | | 1,751 | 1,690,848 |
| SpringCastle America Funding LLC, Series 2020-AA, Class A, 1.97%, 9/25/37(1) | | 579 | 532,137 |
| Subway Funding LLC, Series 2024-3A, Class A2I, 5.246%, 7/30/54(1) | | 822 | 801,761 |
| Sunnova Helios V Issuer LLC, Series 2021-A, Class A, 1.80%, 2/20/48(1) | | 213 | 156,529 |
| Sunnova Helios X Issuer LLC, Series 2022-C, Class B, 5.60%, 11/22/49(1) | | 1,247 | 1,164,899 |
12
See Notes to Financial Statements.
Core Bond Portfolio
December 31, 2024
Portfolio of Investments — continued
| Security | Principal
Amount
(000's omitted) | Value |
| Sunnova Helios XII Issuer LLC, Series 2023-B, Class A, 5.30%, 8/22/50(1) | $ | 1,810 | $ 1,748,062 |
| Sunnova Sol II Issuer LLC, Series 2020-2A, Class A, 2.73%, 11/1/55(1) | | 1,625 | 1,284,710 |
| Theorem Funding Trust, Series 2022-3A, Class A, 7.60%, 4/15/29(1) | | 122 | 122,546 |
| Vantage Data Centers Issuer LLC, Series 2021-1A, Class A2, 2.165%, 10/15/46(1) | | 869 | 824,390 |
| Vantage Data Centers LLC, Series 2020-2A, Class A2, 1.992%, 9/15/45(1) | | 2,220 | 2,027,722 |
| Willis Engine Structured Trust V: | | | |
| Series 2020-A, Class B, 4.212%, 3/15/45(1) | | 791 | 739,940 |
| Series 2020-A, Class C, 6.657%, 3/15/45(1) | | 141 | 138,434 |
Total Asset-Backed Securities
(identified cost $83,609,888) | | | $ 82,141,491 |
| Collateralized Mortgage Obligations — 2.5% |
| Security | Principal
Amount
(000's omitted) | Value |
| Bellemeade Re Ltd., Series 2021-3A, Class A2, 5.569%, (30-day SOFR Average + 1.00%), 9/25/31(1)(3) | $ | 830 | $ 831,718 |
| BFLD Mortgage Trust, Series 2024-VICT, Class A, 6.287%, (1 mo. SOFR + 1.89%), 7/15/41(1)(3) | | 1,797 | 1,804,736 |
| Cascade MH Asset Trust, Series 2022-MH1, Class A, 4.25% to 7/25/27, 8/25/54(1)(4) | | 1,441 | 1,381,204 |
| CHNGE Mortgage Trust, Series 2023-4, Class A1, 7.573% to 8/25/26, 9/25/58(1)(4) | | 1,044 | 1,066,786 |
| FARM Mortgage Trust, Series 2024-2, Class A, 5.196%, 8/1/54(1)(2) | | 1,315 | 1,270,638 |
| Federal Home Loan Mortgage Corp.: | | | |
| Series 5324, Class MZ, 6.00%, 7/25/53 | | 153 | 152,292 |
| Series 5483, Class FB, 5.999%, (30-day SOFR Average + 1.43%), 12/25/54(3) | | 3,556 | 3,561,706 |
| Federal Home Loan Mortgage Corp. STACR REMICS Trust, Series 2022-DNA2, Class M1A, 5.869%, (30-day SOFR Average + 1.30%), 2/25/42(1)(3) | | 505 | 508,094 |
| Federal National Mortgage Association: | | | |
| Series 2005-58, Class MA, 5.50%, 7/25/35 | | 36 | 35,875 |
| Series 2013-6, Class HD, 1.50%, 12/25/42 | | 46 | 40,017 |
| Series 2014-70, Class KP, 3.50%, 3/25/44 | | 233 | 222,927 |
| Federal National Mortgage Association Connecticut Avenue Securities, Series 2019-R06, Class 2B1, 8.433%, (30-day SOFR Average + 3.864%), 9/25/39(1)(3) | | 2,392 | 2,493,228 |
| Security | Principal
Amount
(000's omitted) | Value |
| Government National Mortgage Association: | | | |
| Series 2023-84, Class DL, 6.00%, 6/20/53 | $ | 635 | $ 644,484 |
| Series 2023-84, Class MW, 6.00%, 6/20/53 | | 653 | 662,455 |
Total Collateralized Mortgage Obligations
(identified cost $14,451,413) | | | $ 14,676,160 |
| Commercial Mortgage-Backed Securities — 8.8% |
| Security | Principal
Amount
(000's omitted) | Value |
| BAMLL Commercial Mortgage Securities Trust: | | | |
| Series 2019-BPR, Class DNM, 3.719%, 11/5/32(1)(2) | $ | 3,325 | $ 2,120,089 |
| Series 2019-BPR, Class FNM, 3.719%, 11/5/32(1)(2) | | 1,635 | 344,118 |
| BAMLL Trust, Series 2024-BHP, Class A, 6.747%, (1 mo. SOFR + 2.35%), 8/15/39(1)(3) | | 1,890 | 1,903,529 |
| BPR Trust: | | | |
| Series 2022-OANA, Class A, 6.295%, (1 mo. SOFR + 1.898%), 4/15/37(1)(3) | | 2,885 | 2,899,614 |
| Series 2022-SSP, Class A, 7.397%, (1 mo. SOFR + 3.00%), 5/15/39(1)(3) | | 1,280 | 1,286,720 |
| BX Commercial Mortgage Trust: | | | |
| Series 2021-VOLT, Class B, 5.462%, (1 mo. SOFR + 1.064%), 9/15/36(1)(3) | | 1,703 | 1,697,832 |
| Series 2021-VOLT, Class C, 5.612%, (1 mo. SOFR + 1.214%), 9/15/36(1)(3) | | 1,461 | 1,454,096 |
| Series 2021-VOLT, Class D, 6.162%, (1 mo. SOFR + 1.764%), 9/15/36(1)(3) | | 1,074 | 1,071,956 |
| CFCRE Commercial Mortgage Trust, Series 2016-C7, Class D, 4.363%, 12/10/54(1)(2) | | 2,000 | 1,659,059 |
| Extended Stay America Trust, Series 2021-ESH, Class C, 6.212%, (1 mo. SOFR + 1.814%), 7/15/38(1)(3) | | 2,412 | 2,417,096 |
| Federal National Mortgage Association: | | | |
| Series 2018-M4, Class A2, 3.057%, 3/25/28(2) | | 459 | 437,581 |
| Series 2019-M1, Class A2, 3.543%, 9/25/28(2) | | 2,314 | 2,227,688 |
| Series 2020-M1, Class A2, 2.444%, 10/25/29 | | 4,434 | 3,980,791 |
| Federal National Mortgage Association Multifamily Connecticut Avenue Securities Trust, Series 2020-01, Class M10, 8.433%, (30-day SOFR Average + 3.864%), 3/25/50(1)(3) | | 1,208 | 1,230,511 |
| FS Commercial Mortgage Trust, Series 2023-4SZN, Class A, 7.066%, 11/10/39(1) | | 1,139 | 1,186,725 |
| Great Wolf Trust, Series 2024-WOLF, Class A, 5.939%, (1 mo. SOFR + 1.542%), 3/15/39(1)(3) | | 2,369 | 2,376,007 |
| Hawaii Hotel Trust, Series 2019-MAUI, Class A, 5.845%, (1 mo. SOFR + 1.447%), 5/15/38(1)(3) | | 2,333 | 2,334,813 |
13
See Notes to Financial Statements.
Core Bond Portfolio
December 31, 2024
Portfolio of Investments — continued
| Security | Principal
Amount
(000's omitted) | Value |
| HLTN Commercial Mortgage Trust: | | | |
| Series 2024-DPLO, Class A, 6.039%, (1 mo. SOFR + 1.642%), 6/15/41(1)(3) | $ | 1,611 | $ 1,616,028 |
| Series 2024-DPLO, Class B, 6.388%, (1 mo. SOFR + 1.991%), 6/15/41(1)(3) | | 1,870 | 1,879,310 |
| JPMBB Commercial Mortgage Securities Trust: | | | |
| Series 2014-C22, Class D, 4.512%, 9/15/47(1)(2) | | 260 | 152,116 |
| Series 2014-C23, Class D, 4.049%, 9/15/47(1)(2) | | 2,000 | 1,726,384 |
| Series 2014-C25, Class D, 3.932%, 11/15/47(1)(2) | | 1,425 | 727,325 |
| JPMorgan Chase Commercial Mortgage Securities Trust: | | | |
| Series 2013-C13, Class D, 3.983%, 1/15/46(1)(2) | | 257 | 242,309 |
| Series 2021-MHC, Class C, 6.063%, (1 mo. SOFR + 1.664%), 4/15/38(1)(3) | | 2,425 | 2,424,757 |
| JW Commercial Mortgage Trust, Series 2024-MRCO, Class B, 6.338%, (1 mo. SOFR + 1.941%), 6/15/39(1)(3) | | 1,380 | 1,385,175 |
| Morgan Stanley Bank of America Merrill Lynch Trust, Series 2016-C29, Class C, 4.715%, 5/15/49(2)(5) | | 993 | 935,082 |
| Natixis Commercial Mortgage Securities Trust, Series 2018-FL1, Class C, 7.50%, (U.S. (Fed) Prime Rate), 6/15/35(1)(3) | | 5,000 | 2,235,119 |
| NYC Trust, Series 2024-3ELV, Class A, 6.388%, (1 mo. SOFR + 1.991%), 8/15/29(1)(3) | | 1,000 | 1,009,228 |
| ORL Trust, Series 2024-GLKS, Class A, 5.993%, (1 mo. SOFR + 1.493%), 12/15/39(1)(3) | | 2,081 | 2,088,802 |
| SDR Commercial Mortgage Trust, Series 2024-DSNY, Class A, 5.789%, (1 mo. SOFR + 1.392%), 5/15/39(1)(3) | | 872 | 872,903 |
| TX Trust, Series 2024-HOU, Class A, 5.989%, (1 mo. SOFR + 1.591%), 6/15/39(1)(3) | | 1,995 | 1,993,251 |
| TYSN Mortgage Trust, Series 2023-CRNR, Class A, 6.58%, 12/10/33(1)(2) | | 793 | 831,862 |
| Wells Fargo Commercial Mortgage Trust, Series 2016-C35, Class D, 3.142%, 7/15/48(1) | | 500 | 438,699 |
Total Commercial Mortgage-Backed Securities
(identified cost $57,712,656) | | | $ 51,186,575 |
| Security | Principal
Amount
(000's omitted) | Value |
| Aerospace & Defense — 0.3% |
| BAE Systems PLC, 5.30%, 3/26/34(1) | $ | 444 | $ 442,945 |
| Boeing Co., 6.528%, 5/1/34 | | 1,051 | 1,101,583 |
| | | | $ 1,544,528 |
| Security | Principal
Amount
(000's omitted) | Value |
| Air Transport — 0.4% |
| Delta Air Lines, Inc./SkyMiles IP Ltd., 4.75%, 10/20/28(1) | $ | 2,286 | $ 2,256,118 |
| | | | $ 2,256,118 |
| Airlines — 0.3% |
| AS Mileage Plan IP Ltd.: | | | |
| 5.021%, 10/20/29(1) | $ | 1,035 | $ 1,009,212 |
| 5.308%, 10/20/31(1) | | 530 | 517,799 |
| | | | $ 1,527,011 |
| Auto Manufacturers — 1.4% |
| Ford Motor Credit Co. LLC: | | | |
| 7.122%, 11/7/33 | $ | 508 | $ 530,449 |
| 7.20%, 6/10/30 | | 987 | 1,039,571 |
| 7.35%, 3/6/30 | | 2,213 | 2,344,450 |
| General Motors Financial Co., Inc.: | | | |
| 4.30%, 4/6/29 | | 1,154 | 1,115,347 |
| 5.80%, 1/7/29 | | 325 | 331,703 |
| 5.95%, 4/4/34 | | 619 | 622,545 |
| Toyota Motor Credit Corp., 4.65%, 1/5/29 | | 2,110 | 2,096,757 |
| | | | $ 8,080,822 |
| Banks — 10.4% |
| ABN AMRO Bank NV, 4.988% to 12/3/27, 12/3/28(1)(6) | $ | 1,300 | $ 1,297,734 |
| Banco Santander SA: | | | |
| 1.722% to 9/14/26, 9/14/27(6) | | 1,000 | 945,874 |
| 4.175% to 3/24/27, 3/24/28(6) | | 200 | 195,996 |
| 5.294%, 8/18/27 | | 400 | 402,587 |
| 6.35%, 3/14/34 | | 1,400 | 1,420,301 |
| Bank of America Corp.: | | | |
| 5.468% to 1/23/34, 1/23/35(6) | | 6,681 | 6,691,336 |
| 5.933% to 9/15/26, 9/15/27(6) | | 2,125 | 2,163,389 |
| Bank of Ireland Group PLC, 5.601% to 3/20/29, 3/20/30(1)(6) | | 700 | 706,956 |
| Barclays PLC: | | | |
| 5.088% to 6/20/29, 6/20/30(6) | | 1,600 | 1,559,580 |
| 6.496% to 9/13/26, 9/13/27(6) | | 1,129 | 1,156,553 |
| BBVA Bancomer SA: | | | |
| 1.875%, 9/18/25(1) | | 1,165 | 1,137,785 |
| 5.125% to 1/18/28, 1/18/33(1)(6) | | 1,000 | 930,967 |
| BNP Paribas SA: | | | |
| 5.125% to 1/13/28, 1/13/29(1)(6) | | 1,494 | 1,493,879 |
| 7.75% to 8/16/29(1)(6)(7) | | 787 | 806,498 |
| 9.25% to 11/17/27(1)(6)(7) | | 634 | 678,258 |
14
See Notes to Financial Statements.
Core Bond Portfolio
December 31, 2024
Portfolio of Investments — continued
| Security | Principal
Amount
(000's omitted) | Value |
| Banks (continued) |
| BPCE SA, 5.716% to 1/18/29, 1/18/30(1)(6) | $ | 1,710 | $ 1,719,495 |
| Brookfield Finance, Inc.: | | | |
| 5.675%, 1/15/35 | | 839 | 845,536 |
| 5.968%, 3/4/54 | | 955 | 966,238 |
| CaixaBank SA, 6.84% to 9/13/33, 9/13/34(1)(6) | | 1,062 | 1,129,944 |
| Citigroup, Inc., Series W, 4.00% to 12/10/25(6)(7) | | 1,090 | 1,063,975 |
| Danske Bank AS, 5.427% to 3/1/27, 3/1/28(1)(6) | | 985 | 993,819 |
| ING Groep NV, 5.55% to 3/19/34, 3/19/35(6) | | 1,493 | 1,484,789 |
| Intesa Sanpaolo SpA: | | | |
| 7.00%, 11/21/25(1) | | 269 | 273,655 |
| 8.248% to 11/21/32, 11/21/33(1)(6) | | 955 | 1,071,776 |
| JPMorgan Chase & Co.: | | | |
| 5.581% to 4/22/29, 4/22/30(6) | | 3,620 | 3,692,591 |
| 5.766% to 4/22/34, 4/22/35(6) | | 576 | 589,445 |
| KeyBank NA, 5.00%, 1/26/33 | | 1,396 | 1,339,464 |
| PNC Financial Services Group, Inc.: | | | |
| 5.401% to 7/23/34, 7/23/35(6) | | 175 | 173,729 |
| 5.492% to 5/14/29, 5/14/30(6) | | 2,969 | 3,011,827 |
| 6.875% to 10/20/33, 10/20/34(6) | | 2,225 | 2,429,680 |
| Societe Generale SA, 5.634% to 1/19/29, 1/19/30(1)(6) | | 2,841 | 2,836,967 |
| Swedbank AB, 6.136%, 9/12/26(1) | | 1,718 | 1,755,574 |
| Synchrony Bank, 5.40%, 8/22/25 | | 800 | 801,212 |
| Synovus Bank/Columbus, GA: | | | |
| 4.00% to 10/29/25, 10/29/30(6) | | 940 | 918,142 |
| 5.625%, 2/15/28 | | 750 | 751,571 |
| Texas Capital Bancshares, Inc., 4.00% to 5/6/26, 5/6/31(6) | | 605 | 581,307 |
| Toronto-Dominion Bank, 8.125% to 10/31/27, 10/31/82(6) | | 1,975 | 2,063,520 |
| U.S. Bancorp: | | | |
| 5.678% to 1/23/34, 1/23/35(6) | | 2,889 | 2,914,593 |
| 5.85% to 10/21/32, 10/21/33(6) | | 1,786 | 1,826,010 |
| UBS Group AG, 2.095% to 2/11/31, 2/11/32(1)(6) | | 1,246 | 1,028,826 |
| UniCredit SpA: | | | |
| 2.569% to 9/22/25, 9/22/26(1)(6) | | 785 | 769,978 |
| 5.459% to 6/30/30, 6/30/35(1)(6) | | 611 | 590,587 |
| Westpac New Zealand Ltd., 5.132%, 2/26/27(1) | | 1,182 | 1,190,843 |
| | | | $ 60,402,786 |
| Chemicals — 0.2% |
| Celanese U.S. Holdings LLC, 6.80%, 11/15/30 | $ | 1,090 | $ 1,128,831 |
| | | | $ 1,128,831 |
| Security | Principal
Amount
(000's omitted) | Value |
| Commercial Services — 0.3% |
| Ashtead Capital, Inc., 4.25%, 11/1/29(1) | $ | 1,152 | $ 1,092,897 |
| Ford Foundation, 2.415%, 6/1/50 | | 650 | 382,724 |
| | | | $ 1,475,621 |
| Computers — 0.3% |
| Kyndryl Holdings, Inc., 6.35%, 2/20/34 | $ | 1,593 | $ 1,658,158 |
| | | | $ 1,658,158 |
| Diversified Financial Services — 4.5% |
| Ally Financial, Inc.: | | | |
| 5.543% to 1/17/30, 1/17/31(6) | $ | 1,332 | $ 1,313,737 |
| 6.848% to 1/3/29, 1/3/30(6) | | 637 | 660,637 |
| 6.992% to 6/13/28, 6/13/29(6) | | 155 | 161,535 |
| BlueHub Loan Fund, Inc., 3.099%, 1/1/30 | | 3,160 | 2,891,917 |
| Charles Schwab Corp., 6.136% to 8/24/33, 8/24/34(6) | | 2,250 | 2,363,451 |
| CI Financial Corp., 3.20%, 12/17/30 | | 1,144 | 973,248 |
| Enact Holdings, Inc., 6.25%, 5/28/29 | | 2,425 | 2,472,680 |
| HA Sustainable Infrastructure Capital, Inc., 6.375%, 7/1/34(1) | | 4,009 | 3,906,320 |
| Jefferies Financial Group, Inc., 6.20%, 4/14/34 | | 1,287 | 1,327,079 |
| LPL Holdings, Inc.: | | | |
| 4.00%, 3/15/29(1) | | 1,247 | 1,182,904 |
| 6.00%, 5/20/34 | | 716 | 729,436 |
| Marex Group PLC, 6.404%, 11/4/29 | | 1,213 | 1,225,842 |
| Nuveen LLC, 5.85%, 4/15/34(1) | | 1,084 | 1,097,585 |
| Rocket Mortgage LLC/Rocket Mortgage Co-Issuer, Inc., 3.875%, 3/1/31(1) | | 1,733 | 1,511,041 |
| Stifel Financial Corp., 4.00%, 5/15/30 | | 1,333 | 1,259,115 |
| Synchrony Financial, 4.50%, 7/23/25 | | 1,765 | 1,758,476 |
| TPG Operating Group II LP, 5.875%, 3/5/34 | | 1,575 | 1,611,898 |
| | | | $ 26,446,901 |
| Electric — 1.3% |
| Engie SA, 5.625%, 4/10/34(1) | $ | 2,050 | $ 2,052,964 |
| NextEra Energy Capital Holdings, Inc., 5.25%, 3/15/34 | | 2,205 | 2,182,301 |
| Southern Co., Series B, 4.00% to 10/15/25, 1/15/51(6) | | 1,634 | 1,604,037 |
| Vistra Operations Co. LLC, 5.70%, 12/30/34(1) | | 1,665 | 1,648,566 |
| | | | $ 7,487,868 |
| Electronics — 0.2% |
| Arrow Electronics, Inc., 5.15%, 8/21/29 | $ | 1,035 | $ 1,031,192 |
| | | | $ 1,031,192 |
15
See Notes to Financial Statements.
Core Bond Portfolio
December 31, 2024
Portfolio of Investments — continued
| Security | Principal
Amount
(000's omitted) | Value |
| Entertainment — 0.2% |
| WarnerMedia Holdings, Inc., 4.279%, 3/15/32 | $ | 1,449 | $ 1,277,253 |
| | | | $ 1,277,253 |
| Foods — 0.3% |
| Kroger Co., 5.00%, 9/15/34 | $ | 695 | $ 673,509 |
| Smithfield Foods, Inc.: | | | |
| 2.625%, 9/13/31(1) | | 1,020 | 841,830 |
| 3.00%, 10/15/30(1) | | 210 | 181,852 |
| | | | $ 1,697,191 |
| Healthcare Services — 0.6% |
| Centene Corp.: | | | |
| 3.375%, 2/15/30 | $ | 2,359 | $ 2,102,588 |
| 4.25%, 12/15/27 | | 798 | 773,620 |
| LifePoint Health, Inc., 9.875%, 8/15/30(1) | | 830 | 896,572 |
| | | | $ 3,772,780 |
| Insurance — 2.0% |
| Alliant Holdings Intermediate LLC/Alliant Holdings Co-Issuer, 7.00%, 1/15/31(1) | $ | 900 | $ 904,501 |
| American National Group, Inc., 5.75%, 10/1/29 | | 1,065 | 1,067,038 |
| Athene Global Funding, 4.86%, 8/27/26(1) | | 2,332 | 2,330,798 |
| Corebridge Global Funding, 5.20%, 1/12/29(1) | | 2,065 | 2,077,710 |
| Global Atlantic Fin Co.: | | | |
| 3.125%, 6/15/31(1) | | 2,137 | 1,835,279 |
| 6.75%, 3/15/54(1) | | 1,993 | 2,025,286 |
| 7.95%, 6/15/33(1) | | 290 | 321,295 |
| Liberty Mutual Group, Inc., 4.125% to 9/15/26, 12/15/51(1)(6) | | 1,416 | 1,348,339 |
| | | | $ 11,910,246 |
| Lodging — 0.1% |
| Las Vegas Sands Corp., 6.00%, 8/15/29 | $ | 551 | $ 558,692 |
| | | | $ 558,692 |
| Machinery - Diversified — 0.1% |
| Westinghouse Air Brake Technologies Corp., 5.611%, 3/11/34 | $ | 868 | $ 879,953 |
| | | | $ 879,953 |
| Media — 0.4% |
| Charter Communications Operating LLC/Charter Communications Operating Capital, 4.80%, 3/1/50 | $ | 3,050 | $ 2,294,255 |
| | | | $ 2,294,255 |
| Security | Principal
Amount
(000's omitted) | Value |
| Mining — 0.3% |
| Novelis Corp., 4.75%, 1/30/30(1) | $ | 960 | $ 887,161 |
| South32 Treasury Ltd., 4.35%, 4/14/32(1) | | 1,003 | 919,660 |
| | | | $ 1,806,821 |
| Office & Business Equipment — 0.1% |
| CDW LLC/CDW Finance Corp., 3.276%, 12/1/28 | $ | 731 | $ 681,387 |
| | | | $ 681,387 |
| Oil and Gas — 0.3% |
| Diamondback Energy, Inc., 5.40%, 4/18/34 | $ | 769 | $ 756,576 |
| Parkland Corp., 4.625%, 5/1/30(1) | | 990 | 909,653 |
| | | | $ 1,666,229 |
| Pharmaceuticals — 0.6% |
| AbbVie, Inc., 5.50%, 3/15/64 | $ | 1,326 | $ 1,267,254 |
| Bristol-Myers Squibb Co., 5.65%, 2/22/64 | | 2,172 | 2,092,323 |
| | | | $ 3,359,577 |
| Pipelines — 0.3% |
| ONEOK, Inc., 6.05%, 9/1/33 | $ | 1,845 | $ 1,899,548 |
| | | | $ 1,899,548 |
| Real Estate Investment Trusts (REITs) — 2.1% |
| American Assets Trust LP, 3.375%, 2/1/31 | $ | 1,120 | $ 974,956 |
| COPT Defense Properties LP, 2.90%, 12/1/33 | | 1,887 | 1,516,866 |
| EPR Properties: | | | |
| 3.60%, 11/15/31 | | 250 | 218,853 |
| 3.75%, 8/15/29 | | 1,763 | 1,635,613 |
| 4.95%, 4/15/28 | | 838 | 824,581 |
| Extra Space Storage LP: | | | |
| 2.40%, 10/15/31 | | 1,413 | 1,176,445 |
| 2.55%, 6/1/31 | | 821 | 699,967 |
| 5.90%, 1/15/31 | | 1,175 | 1,212,564 |
| HAT Holdings I LLC/HAT Holdings II LLC, 3.75%, 9/15/30(1) | | 630 | 555,618 |
| Ventas Realty LP, 5.625%, 7/1/34 | | 1,856 | 1,869,736 |
| VICI Properties LP: | | | |
| 5.125%, 11/15/31 | | 495 | 483,192 |
| 5.75%, 4/1/34 | | 930 | 939,195 |
| | | | $ 12,107,586 |
| Retail — 0.2% |
| Sonic Automotive, Inc., 4.625%, 11/15/29(1) | $ | 980 | $ 905,676 |
| | | | $ 905,676 |
16
See Notes to Financial Statements.
Core Bond Portfolio
December 31, 2024
Portfolio of Investments — continued
| Security | Principal
Amount
(000's omitted) | Value |
| Semiconductors — 0.3% |
| Intel Corp., 4.90%, 8/5/52 | $ | 2,364 | $ 1,867,955 |
| | | | $ 1,867,955 |
| Software — 1.0% |
| Concentrix Corp., 6.60%, 8/2/28 | $ | 4,424 | $ 4,534,976 |
| Fiserv, Inc., 5.35%, 3/15/31 | | 1,080 | 1,098,196 |
| | | | $ 5,633,172 |
| Telecommunications — 0.2% |
| AT&T, Inc., 3.65%, 6/1/51 | $ | 992 | $ 701,225 |
| SES GLOBAL Americas Holdings, Inc., 5.30%, 3/25/44(1) | | 611 | 445,058 |
| SES SA, 5.30%, 4/4/43(1) | | 368 | 269,071 |
| | | | $ 1,415,354 |
Total Corporate Bonds
(identified cost $168,165,304) | | | $ 166,773,511 |
| Exchange-Traded Funds — 0.2% |
| Security | Shares | Value |
| Fixed-Income Funds — 0.2% |
| Eaton Vance Ultra-Short Income ETF(8) | | 25,000 | $ 1,267,250 |
Total Exchange-Traded Funds
(identified cost $1,269,750) | | | $ 1,267,250 |
| Security | Shares | Value |
| Real Estate Management & Development — 0.2% |
| Brookfield Property Partners LP, Series A, 5.75% | | 83,921 | $ 1,042,299 |
| | | | $ 1,042,299 |
| Wireless Telecommunication Services — 0.2% |
| U.S. Cellular Corp., 5.50% | | 42,377 | $ 948,397 |
| | | | $ 948,397 |
Total Preferred Stocks
(identified cost $3,157,450) | | | $ 1,990,696 |
| Taxable Municipal Obligations — 0.6% |
| Security | Principal
Amount
(000's omitted) | Value |
| Special Tax Revenue — 0.2% |
| California Health Facilities Financing Authority, (No Place Like Home Program), Social Bonds, 3.034%, 6/1/34 | $ | 1,430 | $ 1,215,901 |
| | | | $ 1,215,901 |
| Water and Sewer — 0.4% |
| Narragansett Bay Commission, RI, Wastewater System Revenue: | | | |
| Green Bonds, 2.094%, 9/1/30 | $ | 820 | $ 713,982 |
| Green Bonds, 2.184%, 9/1/31 | | 650 | 553,663 |
| Green Bonds, 2.264%, 9/1/32 | | 585 | 487,861 |
| Green Bonds, 2.344%, 9/1/33 | | 635 | 519,119 |
| | | | $ 2,274,625 |
Total Taxable Municipal Obligations
(identified cost $4,120,000) | | | $ 3,490,526 |
| U.S. Government Agency Mortgage-Backed Securities — 32.8% |
| Security | Principal
Amount
(000's omitted) | Value |
| Federal Home Loan Mortgage Corp.: | | | |
| 2.50%, 2/1/43 | $ | 562 | $ 483,476 |
| 3.00%, with various maturities to 2046 | | 2,502 | 2,188,017 |
| 3.50%, with various maturities to 2048 | | 2,353 | 2,135,545 |
| 4.00%, with various maturities to 2047 | | 1,848 | 1,724,060 |
| 4.50%, with various maturities to 2044 | | 583 | 566,237 |
| 5.50%, 6/1/41 | | 834 | 855,930 |
| 6.00%, 6/1/53 | | 309 | 311,413 |
| Federal National Mortgage Association: | | | |
| 2.50%, 3/1/47 | | 684 | 574,115 |
| 3.00%, 7/1/49 | | 701 | 604,582 |
| 3.50%, with various maturities to 2047 | | 3,695 | 3,357,207 |
| 4.00%, with various maturities to 2046 | | 1,255 | 1,169,415 |
| 4.50%, 2/1/44 | | 213 | 206,249 |
| 5.00%, 7/1/41 | | 192 | 191,918 |
| 5.50%, with various maturities to 2054 | | 13,093 | 12,927,463 |
| Government National Mortgage Association: | | | |
| 2.50%, with various maturities to 2051 | | 2,696 | 2,226,208 |
| 3.50%, 12/20/45 | | 798 | 723,416 |
| 5.50%, 6/20/53 | | 2,092 | 2,103,895 |
| 6.00%, with various maturities to 2053 | | 472 | 480,592 |
| 7.00%, 6/20/53 | | 847 | 883,047 |
17
See Notes to Financial Statements.
Core Bond Portfolio
December 31, 2024
Portfolio of Investments — continued
| Security | Principal
Amount
(000's omitted) | Value |
| Uniform Mortgage-Backed Security: | | | |
| 4.00%, 30-Year, TBA(9) | $ | 5,942 | $ 5,427,645 |
| 4.50%, 30-Year, TBA(9) | | 17,377 | 16,337,093 |
| 5.00%, 30-Year, TBA(9) | | 47,929 | 46,230,888 |
| 5.50%, 30-Year, TBA(9) | | 83,678 | 82,536,737 |
| 6.00%, 30-Year, TBA(9) | | 6,640 | 6,670,606 |
Total U.S. Government Agency Mortgage-Backed Securities
(identified cost $196,742,947) | | $ 190,915,754 |
| U.S. Treasury Obligations — 23.9% |
| Security | Principal
Amount
(000's omitted) | Value |
| U.S. Treasury Bonds: | | | |
| 1.375%, 8/15/50 | $ | 906 | $ 442,102 |
| 1.625%, 11/15/50 | | 6,770 | 3,531,791 |
| 1.875%, 11/15/51 | | 1,318 | 727,293 |
| 2.00%, 11/15/41 | | 8,644 | 5,808,648 |
| 2.00%, 8/15/51 | | 347 | 198,374 |
| 2.25%, 2/15/52 | | 3,332 | 2,020,903 |
| 2.375%, 2/15/42 | | 1,813 | 1,291,557 |
| 2.875%, 5/15/52 | | 1,099 | 768,823 |
| 3.00%, 8/15/52 | | 4,144 | 2,974,314 |
| 3.625%, 2/15/53 | | 1,113 | 904,894 |
| 3.625%, 5/15/53 | | 857 | 696,844 |
| 3.875%, 2/15/43 | | 2,631 | 2,322,432 |
| 4.00%, 11/15/42 | | 802 | 721,573 |
| 4.75%, 11/15/43 | | 735 | 726,149 |
| U.S. Treasury Notes: | | | |
| 0.375%, 11/30/25 | | 3,634 | 3,509,515 |
| 0.375%, 12/31/25 | | 28,291 | 27,244,769 |
| 0.375%, 1/31/26 | | 4,956 | 4,756,013 |
| 0.75%, 4/30/26 | | 4,821 | 4,605,523 |
| 1.125%, 2/29/28 | | 7,680 | 6,968,118 |
| 1.25%, 4/30/28 | | 3,455 | 3,130,838 |
| 1.875%, 2/28/27 | | 19,332 | 18,393,593 |
| 2.75%, 4/30/27 | | 18,000 | 17,404,741 |
| 2.875%, 11/30/25 | | 500 | 493,900 |
| 3.125%, 8/31/27 | | 3,713 | 3,606,653 |
| 3.50%, 1/31/28 | | 2,593 | 2,534,016 |
| 3.875%, 12/31/27 | | 2,000 | 1,977,395 |
| 4.125%, 9/30/27 | | 1,600 | 1,593,931 |
| 4.125%, 11/30/29 | | 16,000 | 15,820,721 |
| Security | Principal
Amount
(000's omitted) | Value |
| U.S. Treasury Notes: (continued) | | | |
| 4.375%, 8/15/26 | $ | 4,040 | $ 4,048,098 |
Total U.S. Treasury Obligations
(identified cost $151,823,790) | | | $ 139,223,521 |
| Short-Term Investments — 12.7% |
| Security | Shares | Value |
| Morgan Stanley Institutional Liquidity Funds - Government Portfolio, Institutional Class, 4.43%(10) | | 56,230,488 | $ 56,230,488 |
Total Affiliated Fund
(identified cost $56,230,488) | | | $ 56,230,488 |
| U.S. Treasury Obligations – 3.0% |
| Security | Principal
Amount
(000's omitted) | Value |
| U.S. Treasury Bills, 0.00%, 2/6/25 | | 17,683 | $ 17,610,576 |
Total U.S. Treasury Obligations
(identified cost $17,604,921) | | | $ 17,610,576 |
Total Short-Term Investments
(identified cost $73,835,409) | | | $ 73,841,064 |
Total Investments — 124.7%
(identified cost $754,888,607) | | | $ 725,506,548 |
| Other Assets, Less Liabilities — (24.7)% | | | $(143,625,164) |
| Net Assets — 100.0% | | | $ 581,881,384 |
| The percentage shown for each investment category in the Portfolio of Investments is based on net assets. |
| (1) | Security exempt from registration under Rule 144A of the Securities Act of 1933, as amended. These securities may be sold in certain transactions in reliance on an exemption from registration (normally to qualified institutional buyers). At December 31, 2024, the aggregate value of these securities is $189,890,579 or 32.6% of the Portfolio's net assets. |
| (2) | Weighted average fixed-rate coupon that changes/updates monthly. Rate shown is the rate at December 31, 2024. |
| (3) | Variable rate security. The stated interest rate represents the rate in effect at December 31, 2024. |
| (4) | Step coupon security. Interest rate represents the rate in effect at December 31, 2024. |
18
See Notes to Financial Statements.
Core Bond Portfolio
December 31, 2024
Portfolio of Investments — continued
| (5) | Represents an investment in an issuer that may be deemed to be an affiliate (see Note 7). |
| (6) | Security converts to variable rate after the indicated fixed-rate coupon period. |
| (7) | Perpetual security with no stated maturity date but may be subject to calls by the issuer. |
| (8) | Affiliated fund (see Note 7). |
| (9) | TBA (To Be Announced) securities are purchased on a forward commitment basis with an approximate principal amount and maturity date. The actual principal amount, which is not expected to differ significantly from the commitment amount, and maturity date are determined upon settlement. |
| (10) | May be deemed to be an affiliated investment company (see Note 7). The rate shown is the annualized seven-day yield as of December 31, 2024. |
| Futures Contracts |
| Description | Number of
Contracts | Position | Expiration
Date | Notional
Amount | Value/Unrealized
Appreciation
(Depreciation) |
| Interest Rate Futures | | | | | |
| U.S. 2-Year Treasury Note | 205 | Long | 3/31/25 | $42,149,922 | $ 11,585 |
| U.S. 5-Year Treasury Note | 652 | Long | 3/31/25 | 69,310,657 | (209,884) |
| U.S. 10-Year Treasury Note | 101 | Long | 3/20/25 | 10,983,750 | (95,936) |
| U.S. Long Treasury Bond | 216 | Long | 3/20/25 | 24,590,250 | (535,833) |
| U.S. Ultra 10-Year Treasury Note | 19 | Long | 3/20/25 | 2,114,938 | 7,407 |
| U.S. Ultra-Long Treasury Bond | (25) | Short | 3/20/25 | (2,972,656) | 30,275 |
| | | | | | $(792,386) |
| Abbreviations: |
| SOFR | – Secured Overnight Financing Rate |
| STACR | – Structured Agency Credit Risk |
| TBA | – To Be Announced |
19
See Notes to Financial Statements.
Core Bond Portfolio
December 31, 2024
Statement of Assets and Liabilities
| | December 31, 2024 |
| Assets | |
| Unaffiliated investments, at value (identified cost $696,339,323) | $667,073,728 |
| Affiliated investments, at value (identified cost $58,549,284) | 58,432,820 |
| Deposits for forward commitment securities | 2,510,000 |
| Deposits for derivatives collateral — futures contracts | 10,282,013 |
| Interest receivable | 4,277,948 |
| Interest and dividends receivable from affiliated investments | 242,854 |
| Receivable from affiliates | 35,096 |
| Trustees' deferred compensation plan | 61,283 |
| Total assets | $742,915,742 |
| Liabilities | |
| Payable for forward commitment securities | $160,297,450 |
| Payable for variation margin on open futures contracts | 134,194 |
| Due to custodian | 92,826 |
| Payable to affiliates: | |
| Investment adviser fee | 212,826 |
| Trustees' fees | 9,340 |
| Trustees' deferred compensation plan | 61,283 |
| Accrued expenses | 226,439 |
| Total liabilities | $161,034,358 |
| Net Assets applicable to investors' interest in Portfolio | $581,881,384 |
20
See Notes to Financial Statements.
Core Bond Portfolio
December 31, 2024
| | Year Ended |
| | December 31, 2024 |
| Investment Income | |
| Dividend income (net of foreign taxes withheld of $19,886) | $165,894 |
| Dividend income from affiliated investments | 1,355,267 |
| Interest income | 27,248,273 |
| Interest income from affiliated investments | 100,117 |
| Other income | 1,795 |
| Total investment income | $28,871,346 |
| Expenses | |
| Investment adviser fee | $2,757,557 |
| Trustees’ fees and expenses | 37,566 |
| Custodian fee | 199,302 |
| Legal and accounting services | 96,578 |
| Miscellaneous | 53,452 |
| Total expenses | $3,144,455 |
| Deduct: | |
| Waiver and/or reimbursement of expenses by affiliates | $144,202 |
| Total expense reductions | $144,202 |
| Net expenses | $3,000,253 |
| Net investment income | $25,871,093 |
| Realized and Unrealized Gain (Loss) | |
| Net realized gain (loss): | |
| Investment transactions | $(5,984,590) |
| Futures contracts | (3,677,556) |
| Net realized loss | $(9,662,146) |
| Change in unrealized appreciation (depreciation): | |
| Investments | $2,271,911 |
| Investments - affiliated investments | 88,783 |
| Futures contracts | (2,040,768) |
| Net change in unrealized appreciation (depreciation) | $319,926 |
| Net realized and unrealized loss | $(9,342,220) |
| Net increase in net assets from operations | $16,528,873 |
21
See Notes to Financial Statements.
Core Bond Portfolio
December 31, 2024
Statements of Changes in Net Assets
| | Year Ended December 31, |
| | 2024 | 2023 |
| Increase (Decrease) in Net Assets | | |
| From operations: | | |
| Net investment income | $25,871,093 | $22,160,888 |
| Net realized loss | (9,662,146) | (23,641,763) |
| Net change in unrealized appreciation (depreciation) | 319,926 | 34,122,291 |
| Net increase in net assets from operations | $16,528,873 | $32,641,416 |
| Capital transactions: | | |
| Contributions | $130,190,460 | $103,019,761 |
| Withdrawals | (158,476,847) | (113,522,022) |
| Net decrease in net assets from capital transactions | $(28,286,387) | $(10,502,261) |
| Net increase (decrease) in net assets | $(11,757,514) | $22,139,155 |
| Net Assets | | |
| At beginning of year | $593,638,898 | $571,499,743 |
| At end of year | $581,881,384 | $593,638,898 |
22
See Notes to Financial Statements.
Core Bond Portfolio
December 31, 2024
| | Year Ended December 31, |
| | 2024 | 2023 | 2022 | 2021 | 2020 |
| Ratios/Supplemental Data | | | | | |
| Ratios (as a percentage of average daily net assets):(1) | | | | | |
| Total expenses | 0.51% | 0.51% | 0.50% | 0.50% | 0.50% |
| Net expenses | 0.49%(2) | 0.49%(2) | 0.49%(2) | 0.49% | 0.49% |
| Net investment income | 4.22% | 3.74% | 2.58% | 2.06% | 2.46% |
| Portfolio Turnover(3) | 375% | 227% | 102% | 122% | 93% |
| Total Return | 2.90% | 6.08% | (13.13)% | 0.70% | 8.16% |
| Net assets, end of year (000’s omitted) | $581,881 | $593,639 | $571,500 | $570,872 | $575,953 |
| (1) | Total expenses do not reflect amounts reimbursed and/or waived by the adviser and certain of its affiliates, if applicable. Net expenses are net of all reductions and represent the net expenses paid by the Portfolio. |
| (2) | Includes a reduction by the investment adviser of a portion of its adviser fee due to the Portfolio’s investment in the Liquidity Fund and in other affiliated funds (equal to less than 0.01% of average daily net assets for the year ended December 31, 2024 and less than 0.005% of average daily net assets for the years ended December 31, 2023 and 2022). |
| (3) | Includes the effect of To Be Announced (TBA) transactions. |
Core Bond Portfolio
December 31, 2024
Notes to Financial Statements
1 Significant Accounting Policies
Core Bond Portfolio (the Portfolio) is a Massachusetts business trust registered under the Investment Company Act of 1940, as amended (the 1940 Act), as a diversified, open-end management investment company. The Portfolio’s investment objectives are to seek current income and total return. The Declaration of Trust permits the Trustees to issue interests in the Portfolio. At December 31, 2024, Eaton Vance Balanced Fund and Eaton Vance Core Bond Fund held an interest of 62.7% and 37.3%, respectively, in the Portfolio.
The following is a summary of significant accounting policies of the Portfolio. The policies are in conformity with accounting principles generally accepted in the United States of America (U.S. GAAP). The Portfolio is an investment company and follows accounting and reporting guidance in the Financial Accounting Standards Board (FASB) Accounting Standards Codification Topic 946.
A Investment Valuation—The following methodologies are used to determine the market value or fair value of investments.
Debt Obligations. Debt obligations are generally valued on the basis of valuations provided by third party pricing services, as derived from such services’ pricing models. Inputs to the models may include, but are not limited to, reported trades, executable bid and ask prices, broker/dealer quotations, prices or yields of securities with similar characteristics, interest rates, anticipated prepayments, benchmark curves or information pertaining to the issuer, as well as industry and economic events. The pricing services may use a matrix approach, which considers information regarding securities with similar characteristics to determine the valuation for a security. Short-term debt obligations purchased with a remaining maturity of sixty days or less for which a valuation from a third party pricing service is not readily available may be valued at amortized cost, which approximates fair value.
Equity Securities. Preferred securities and exchange-traded funds listed on a U.S. securities exchange generally are valued at the last sale or closing price on the day of valuation or, if no sales took place on such date, at the mean between the closing bid and ask prices on the exchange where such securities are principally traded. Preferred securities listed on the NASDAQ National Market System are valued at the NASDAQ official closing price. Preferred securities that are not listed or traded in the over-the-counter market are valued by a third party pricing service that uses various techniques that consider factors including, but not limited to, prices or yields of securities with similar characteristics, benchmark yields, broker/dealer quotes, quotes of underlying common stock, issuer spreads, as well as industry and economic events.
Derivatives. Futures contracts are valued at the closing settlement price established by the board of trade or exchange on which they are traded.
Other. Investments in management investment companies (including money market funds) that do not trade on an exchange are valued at the net asset value as of the close of each business day.
Fair Valuation. In connection with Rule 2a-5 of the 1940 Act, the Trustees have designated the Portfolio’s investment adviser as its valuation designee. Investments for which valuations or market quotations are not readily available or are deemed unreliable are valued by the investment adviser, as valuation designee, at fair value using methods that most fairly reflect the security’s “fair value”, which is the amount that the Portfolio might reasonably expect to receive for the security upon its current sale in the ordinary course. Each such determination is based on a consideration of relevant factors, which are likely to vary from one pricing context to another. These factors may include, but are not limited to, the type of security, the existence of any contractual restrictions on the security’s disposition, the price and extent of public trading in similar securities of the issuer or of comparable companies or entities, quotations or relevant information obtained from broker/dealers or other market participants, information obtained from the issuer, analysts, and/or the appropriate stock exchange (for exchange-traded securities), an analysis of the company’s or entity’s financial statements, and an evaluation of the forces that influence the issuer and the market(s) in which the security is purchased and sold.
B Investment Transactions—Investment transactions for financial statement purposes are accounted for on a trade date basis. Realized gains and losses on investments sold are determined on the basis of identified cost.
C Income—Interest income is recorded on the basis of interest accrued, adjusted for amortization of premium or accretion of discount. Dividend income is recorded on the ex-dividend date for dividends received in cash and/or securities. Withholding taxes on dividends have been provided for in accordance with the Portfolio’s understanding of the applicable countries’ tax rules and rates. Distributions from investment companies are recorded as dividend income, capital gains or return of capital based on the nature of the distribution.
D Federal Taxes—The Portfolio has elected to be treated as a partnership for federal tax purposes. No provision is made by the Portfolio for federal or state taxes on any taxable income of the Portfolio because each investor in the Portfolio is ultimately responsible for the payment of any taxes on its share of taxable income. Since at least one of the Portfolio's investors is a regulated investment company that invests all or substantially all of its assets in the Portfolio, the Portfolio normally must satisfy the applicable source of income and diversification requirements (under the Internal Revenue Code) in order for its investors to satisfy them. The Portfolio will allocate, at least annually among its investors, each investor's distributive share of the Portfolio's net investment income, net realized capital gains and losses and any other items of income, gain, loss, deduction or credit.
As of December 31, 2024, the Portfolio had no uncertain tax positions that would require financial statement recognition, de-recognition, or disclosure. The Portfolio files a U.S. federal income tax return annually after its fiscal year-end, which is subject to examination by the Internal Revenue Service for a period of three years from the date of filing.
Core Bond Portfolio
December 31, 2024
Notes to Financial Statements — continued
E Use of Estimates—The preparation of the financial statements in conformity with U.S. GAAP requires management to make estimates and assumptions that affect the reported amounts of assets and liabilities at the date of the financial statements and the reported amounts of income and expense during the reporting period. Actual results could differ from those estimates.
F Indemnifications—Under the Portfolio’s organizational documents, its officers and Trustees may be indemnified against certain liabilities and expenses arising out of the performance of their duties to the Portfolio. Under Massachusetts law, if certain conditions prevail, interestholders in the Portfolio could be deemed to have personal liability for the obligations of the Portfolio. However, the Portfolio’s Declaration of Trust contains an express disclaimer of liability on the part of Portfolio interestholders. Additionally, in the normal course of business, the Portfolio enters into agreements with service providers that may contain indemnification clauses. The Portfolio’s maximum exposure under these arrangements is unknown as this would involve future claims that may be made against the Portfolio that have not yet occurred.
G Futures Contracts—Upon entering into a futures contract, the Portfolio is required to deposit with the broker, either in cash or securities, an amount equal to a certain percentage of the contract amount (initial margin). Subsequent payments, known as variation margin, are made or received by the Portfolio each business day, depending on the daily fluctuations in the value of the underlying security and are recorded as unrealized gains or losses by the Portfolio. Gains (losses) are realized upon the expiration or closing of the futures contracts. Should market conditions change unexpectedly, the Portfolio may not achieve the anticipated benefits of the futures contracts and may realize a loss. Futures contracts have minimal counterparty risk as they are exchange traded and the clearinghouse for the exchange is substituted as the counterparty, guaranteeing counterparty performance.
H When-Issued Securities and Delayed Delivery Transactions—The Portfolio may purchase securities on a delayed delivery, when-issued or forward commitment basis, including TBA (To Be Announced) securities. Payment and delivery may take place after the customary settlement period for that security. At the time the transaction is negotiated, the price of the security that will be delivered is fixed. Securities purchased on a delayed delivery, when-issued or forward commitment basis are marked-to-market daily and begin earning interest on settlement date. Such security purchases are subject to the risk that when delivered they will be worth less than the agreed upon payment price. Losses may also arise if the counterparty does not perform under the contract. A forward purchase commitment may also be closed by entering into an offsetting commitment. If an offsetting commitment is entered into, the Portfolio will realize a gain or loss on investments based on the price established when the Portfolio entered into the commitment.
I Segment Reporting—During the year ended December 31, 2024, the Portfolio adopted FASB Accounting Standards Update No. 2023-07, Segment Reporting (Topic 280): Improvements to Reportable Segment Disclosures, (ASU 2023-07), which requires incremental disclosures related to a public entity’s reportable segments. The Portfolio operates as a single reportable segment, an investment company whose investment objectives are included in Note 1. In connection with the adoption of ASU 2023-07, the Portfolio’s President has been designated as the Portfolio’s Chief Operating Decision Maker (CODM), who is responsible for assessing the performance of the Portfolio’s single segment and deciding how to allocate the segment’s resources. To perform this function, the CODM reviews the information in the Portfolio’s Financial Statements.
2 Investment Adviser Fee and Other Transactions with Affiliates
The investment adviser fee is earned by Boston Management and Research (BMR), an indirect, wholly-owned subsidiary of Morgan Stanley, as compensation for investment advisory services rendered to the Portfolio. The fee is computed at an annual rate as a percentage of the Portfolio’s average daily net assets as follows and is payable monthly:
| Average Daily Net Assets | Annual Fee Rate |
| Up to $1 billion | 0.450% |
| $1 billion up to $2 billion | 0.425% |
| $2 billion up to $5 billion | 0.415% |
| $5 billion and over | 0.405% |
For the year ended December 31, 2024, the Portfolio's investment adviser fee amounted to $2,757,557 or 0.45% of the Portfolio’s average daily net assets. Pursuant to a voluntary expense reimbursement, BMR was allocated $104,884 of the Portfolio’s operating expenses for the year ended December 31, 2024. The Portfolio may invest in a money market fund, the Institutional Class of the Morgan Stanley Institutional Liquidity Funds - Government Portfolio (the “Liquidity Fund”), an open-end management investment company managed by Morgan Stanley Investment Management Inc., a wholly-owned subsidiary of Morgan Stanley, and in other affiliated funds. The investment adviser fee paid by the Portfolio is reduced by an amount equal to its pro rata share of the advisory and administration fees/advisory fees paid by the Portfolio due to its investment in the Liquidity Fund and in other affiliated funds. For the year ended December 31, 2024, the investment adviser fee paid was reduced by $39,318 relating to the Portfolio's investment in the Liquidity Fund and in other affiliated funds.
Core Bond Portfolio
December 31, 2024
Notes to Financial Statements — continued
Trustees and officers of the Portfolio who are members of BMR’s organization receive remuneration for their services to the Portfolio out of the investment adviser fee. Trustees of the Portfolio who are not affiliated with the investment adviser may elect to defer receipt of all or a percentage of their annual fees in accordance with the terms of the Trustees Deferred Compensation Plan. Certain officers and Trustees of the Portfolio are officers of the above organization.
3 Purchases and Sales of Investments
Purchases and sales of investments, other than short-term obligations and including maturities, paydowns and TBA transactions, for the year ended December 31, 2024 were as follows:
| | Purchases | Sales |
| Investments (non-U.S. Government) | $299,334,697 | $291,271,643 |
| U.S. Government and Agency Securities | 2,249,303,458 | 2,250,923,277 |
| | $2,548,638,155 | $2,542,194,920 |
4 Federal Income Tax Basis of Investments
The cost and unrealized appreciation (depreciation) of investments, including open derivative contracts, of the Portfolio at December 31, 2024, as determined on a federal income tax basis, were as follows:
| Aggregate cost | $755,785,918 |
| Gross unrealized appreciation | $2,891,840 |
| Gross unrealized depreciation | (33,171,210) |
| Net unrealized depreciation | $(30,279,370) |
5 Financial Instruments
The Portfolio may trade in financial instruments with off-balance sheet risk in the normal course of its investing activities. These financial instruments may include futures contracts and may involve, to a varying degree, elements of risk in excess of the amounts recognized for financial statement purposes. The notional or contractual amounts of these instruments represent the investment the Portfolio has in particular classes of financial instruments and do not necessarily represent the amounts potentially subject to risk. The measurement of the risks associated with these instruments is meaningful only when all related and offsetting transactions are considered. A summary of obligations under these financial instruments at December 31, 2024 is included in the Portfolio of Investments. At December 31, 2024, the Portfolio had sufficient cash and/or securities to cover commitments under these contracts.
The Portfolio is subject to interest rate risk in the normal course of pursuing its investment objectives. Because the Portfolio holds fixed-rate bonds, the value of these bonds may decrease if interest rates rise. The Portfolio enters into U.S. Treasury futures contracts to seek to hedge against fluctuations in interest rates.
The fair value of open derivative instruments (not considered to be hedging instruments for accounting disclosure purposes) and whose primary underlying risk exposure is interest rate risk at December 31, 2024 was as follows:
| | Fair Value |
| Derivative | Asset Derivative(1) | Liability Derivative(1) |
| Futures contracts | $49,267 | $(841,653) |
| (1) | Only the current day’s variation margin on open futures contracts is reported within the Statement of Assets and Liabilities as Receivable or Payable for variation margin on open futures contracts, as applicable. |
Core Bond Portfolio
December 31, 2024
Notes to Financial Statements — continued
The effect of derivative instruments (not considered to be hedging instruments for accounting disclosure purposes) on the Statement of Operations and whose primary underlying risk exposure is interest rate risk for the year ended December 31, 2024 was as follows:
| Derivative | Realized Gain (Loss)
on Derivatives Recognized
in Income(1) | Change in Unrealized
Appreciation (Depreciation) on
Derivatives Recognized in Income(2) |
| Futures contracts | $(3,677,556) | $(2,040,768) |
| (1) | Statement of Operations location: Net realized gain (loss): Futures contracts. |
| (2) | Statement of Operations location: Change in unrealized appreciation (depreciation): Futures contracts. |
The average notional cost of futures contracts outstanding during the year ended December 31, 2024, which is indicative of the volume of this derivative type, was approximately as follows:
Futures
Contracts — Long | Futures
Contracts — Short |
| $142,074,000 | $10,269,000 |
6 Line of Credit
The Portfolio participates with other portfolios and funds managed by BMR and its affiliates in a $650 million unsecured revolving line of credit agreement with a group of banks, which is in effect through October 21, 2025. Borrowings are made by the Portfolio solely for temporary purposes related to redemptions and other short-term cash needs. Interest is charged to the Portfolio based on its borrowings generally at an amount above either the Secured Overnight Financing Rate (SOFR) or Federal Funds rate. In addition, a fee computed at an annual rate of 0.15% on the daily unused portion of the line of credit is allocated among the participating portfolios and funds at the end of each quarter. In connection with the renewal of the agreement in October 2024, an arrangement fee of $150,000 was incurred that was allocated to the participating portfolios and funds. Because the line of credit is not available exclusively to the Portfolio, it may be unable to borrow some or all of its requested amounts at any particular time. The Portfolio did not have any significant borrowings or allocated fees during the year ended December 31, 2024.
7 Affiliated Investments
At December 31, 2024, the value of the Portfolio's investment in issuers and funds that may be deemed to be affiliated was $58,432,820, which represents 10.0% of the Portfolio's net assets. Transactions in such investments by the Portfolio for the year ended December 31, 2024 were as follows:
| Name | Value,
beginning
of period | Purchases | Sales
proceeds | Net realized
gain (loss) | Change in
unrealized
appreciation
(depreciation) | Value, end
of period | Interest/
Dividend
income | Principal
amount/
Shares, end
of period |
| Commercial Mortgage-Backed Securities | | | | | | | | |
| Morgan Stanley Bank of America Merrill Lynch Trust, Series 2016-C29, Class C, 4.715%, 5/15/49 | $ 883,072 | $ — | $ — | $ — | $52,010 | $ 935,082 | $ 47,617 | $ 993,200 |
| Morgan Stanley Capital I Trust, Series 2019-BPR, Class A, 7.318%, (1 mo. SOFR + 1.992%), 5/15/36 | 1,871,414 | — | (1,910,687) | — | 39,273 | — | 52,500 | — |
| Exchange-Traded Funds |
| Eaton Vance Ultra-Short Income ETF | — | 1,269,750 | — | — | (2,500) | 1,267,250 | 14,429 | 25,000 |
Core Bond Portfolio
December 31, 2024
Notes to Financial Statements — continued
| Name | Value,
beginning
of period | Purchases | Sales
proceeds | Net realized
gain (loss) | Change in
unrealized
appreciation
(depreciation) | Value, end
of period | Interest/
Dividend
income | Principal
amount/
Shares, end
of period |
| Short-Term Investments |
| Liquidity Fund | $16,240,414 | $338,232,401 | $(298,242,327) | $ — | $ — | $56,230,488 | $1,340,838 | 56,230,488 |
| Total | | | | $ — | $88,783 | $58,432,820 | $1,455,384 | |
8 Fair Value Measurements
Under generally accepted accounting principles for fair value measurements, a three-tier hierarchy to prioritize the assumptions, referred to as inputs, is used in valuation techniques to measure fair value. The three-tier hierarchy of inputs is summarized in the three broad levels listed below.
| • | Level 1 – quoted prices in active markets for identical investments |
| • | Level 2 – other significant observable inputs (including quoted prices for similar investments, interest rates, prepayment speeds, credit risk, etc.) |
| • | Level 3 – significant unobservable inputs (including a fund's own assumptions in determining the fair value of investments) |
In cases where the inputs used to measure fair value fall in different levels of the fair value hierarchy, the level disclosed is determined based on the lowest level input that is significant to the fair value measurement in its entirety. The inputs or methodology used for valuing securities are not necessarily an indication of the risk associated with investing in those securities.
At December 31, 2024, the hierarchy of inputs used in valuing the Portfolio’s investments and open derivative instruments, which are carried at fair value, were as follows:
| Asset Description | Level 1 | Level 2 | Level 3 | Total |
| Asset-Backed Securities | $ — | $ 82,141,491 | $ — | $ 82,141,491 |
| Collateralized Mortgage Obligations | — | 14,676,160 | — | 14,676,160 |
| Commercial Mortgage-Backed Securities | — | 51,186,575 | — | 51,186,575 |
| Corporate Bonds | — | 166,773,511 | — | 166,773,511 |
| Exchange-Traded Funds | 1,267,250 | — | — | 1,267,250 |
| Preferred Stocks | 1,990,696 | — | — | 1,990,696 |
| Taxable Municipal Obligations | — | 3,490,526 | — | 3,490,526 |
| U.S. Government Agency Mortgage-Backed Securities | — | 190,915,754 | — | 190,915,754 |
| U.S. Treasury Obligations | — | 139,223,521 | — | 139,223,521 |
| Short-Term Investments: | | | | |
| Affiliated Fund | 56,230,488 | — | — | 56,230,488 |
| U.S. Treasury Obligations | — | 17,610,576 | — | 17,610,576 |
| Total Investments | $59,488,434 | $666,018,114 | $ — | $725,506,548 |
| Futures Contracts | $ 49,267 | $ — | $ — | $ 49,267 |
| Total | $59,537,701 | $666,018,114 | $ — | $725,555,815 |
| Liability Description | | | | |
| Futures Contracts | $ (841,653) | $ — | $ — | $ (841,653) |
| Total | $ (841,653) | $ — | $ — | $ (841,653) |
Core Bond Portfolio
December 31, 2024
Report of Independent Registered Public Accounting Firm
To the Trustees and Investors of Core Bond Portfolio:
Opinion on the Financial Statements and Financial Highlights
We have audited the accompanying statement of assets and liabilities of Core Bond Portfolio (the “Portfolio”), including the portfolio of investments, as of December 31, 2024, the related statement of operations for the year then ended, the statements of changes in net assets for each of the two years in the period then ended, the financial highlights for each of the five years in the period then ended, and the related notes. In our opinion, the financial statements and financial highlights present fairly, in all material respects, the financial position of the Portfolio as of December 31, 2024, and the results of its operations for the year then ended, the changes in its net assets for each of the two years in the period then ended, and the financial highlights for each of the five years in the period then ended, in conformity with accounting principles generally accepted in the United States of America.
Basis for Opinion
These financial statements and financial highlights are the responsibility of the Portfolio’s management. Our responsibility is to express an opinion on the Portfolio’s financial statements and financial highlights based on our audits. We are a public accounting firm registered with the Public Company Accounting Oversight Board (United States) (PCAOB) and are required to be independent with respect to the Portfolio in accordance with the U.S. federal securities laws and the applicable rules and regulations of the Securities and Exchange Commission and the PCAOB.
We conducted our audits in accordance with the standards of the PCAOB. Those standards require that we plan and perform the audit to obtain reasonable assurance about whether the financial statements and financial highlights are free of material misstatement, whether due to error or fraud. The Portfolio is not required to have, nor were we engaged to perform, an audit of its internal control over financial reporting. As part of our audits, we are required to obtain an understanding of internal control over financial reporting but not for the purpose of expressing an opinion on the effectiveness of the Portfolio’s internal control over financial reporting. Accordingly, we express no such opinion.
Our audits included performing procedures to assess the risks of material misstatement of the financial statements and financial highlights, whether due to error or fraud, and performing procedures that respond to those risks. Such procedures included examining, on a test basis, evidence regarding the amounts and disclosures in the financial statements and financial highlights. Our audits also included evaluating the accounting principles used and significant estimates made by management, as well as evaluating the overall presentation of the financial statements and financial highlights. Our procedures included confirmation of securities owned as of December 31, 2024, by correspondence with the custodian and brokers; when replies were not received from brokers, we performed other auditing procedures. We believe that our audits provide a reasonable basis for our opinion.
/s/ Deloitte & Touche LLP
Boston, Massachusetts
February 21, 2025
We have served as the auditor of one or more Eaton Vance investment companies since 1959.
This Page Intentionally Left Blank
This Page Intentionally Left Blank
This Page Intentionally Left Blank
Eaton Vance
Greater India Fund
Annual Financial Statements and
Additional Information
December 31, 2024
This report must be preceded or accompanied by a current summary prospectus or prospectus. Before investing, investors should consider carefully the investment objective, risks, and charges and expenses of a mutual fund. This and other important information is contained in the prospectus and/or statement of additional information, which can be obtained by calling 1-800-262-1122 or from a financial intermediary. Prospective investors should read the prospectus carefully before investing.
Annual Financial Statements and Additional Information December 31, 2024
Eaton Vance
Greater India Fund
Items 8, 9 and 11 of Form N-CSR are Not Applicable. For Item 10 of Form N-CSR, see Item 7.
Eaton Vance
Greater India Fund
December 31, 2024
Statement of Assets and Liabilities
| | December 31, 2024 |
| Assets | |
| Investment in Greater India Portfolio, at value (identified cost $201,160,725) | $301,169,449 |
| Receivable for Fund shares sold | 92,238 |
| Total assets | $301,261,687 |
| Liabilities | |
| Payable for Fund shares redeemed | $151,469 |
| Payable to affiliates: | |
| Administration fee | 39,639 |
| Distribution and service fees | 45,133 |
| Trustees' fees | 125 |
| Payable for transfer and dividend disbursing agent fees | 48,543 |
| Payable for legal and accounting services | 36,347 |
| Payable for printing and postage | 17,939 |
| Accrued expenses | 16,789 |
| Total liabilities | $355,984 |
| Net Assets | $300,905,703 |
| Sources of Net Assets | |
| Paid-in capital | $198,384,447 |
| Distributable earnings | 102,521,256 |
| Net Assets | $300,905,703 |
| Class A Shares | |
| Net Assets | $166,399,194 |
| Shares Outstanding | 4,154,147 |
Net Asset Value and Redemption Price Per Share
(net assets ÷ shares of beneficial interest outstanding) | $40.06 |
Maximum Offering Price Per Share
(100 ÷ 94.75 of net asset value per share) | $42.28 |
| Class C Shares | |
| Net Assets | $10,084,881 |
| Shares Outstanding | 332,879 |
Net Asset Value and Offering Price Per Share*
(net assets ÷ shares of beneficial interest outstanding) | $30.30 |
| Class I Shares | |
| Net Assets | $124,421,628 |
| Shares Outstanding | 2,930,075 |
Net Asset Value, Offering Price and Redemption Price Per Share
(net assets ÷ shares of beneficial interest outstanding) | $42.46 |
| On sales of $50,000 or more, the offering price of Class A shares is reduced. |
| * | Redemption price per share is equal to the net asset value less any applicable contingent deferred sales charge. |
1
See Notes to Financial Statements.
Eaton Vance
Greater India Fund
December 31, 2024
| | Year Ended |
| | December 31, 2024 |
| Investment Income | |
| Dividend income allocated from Portfolio (net of foreign taxes withheld of $603,100) | $2,427,843 |
| Interest income allocated from Portfolio | 18,632 |
| Expenses allocated from Portfolio | (2,634,446) |
| Total investment loss from Portfolio | $(187,971) |
| Expenses | |
| Administration fee | $421,972 |
| Distribution and service fees: | |
| Class A | 416,779 |
| Class C | 90,851 |
| Trustees’ fees and expenses | 500 |
| Custodian fee | 26,132 |
| Transfer and dividend disbursing agent fees | 220,826 |
| Legal and accounting services | 59,508 |
| Printing and postage | 35,186 |
| Registration fees | 61,800 |
| Miscellaneous | 13,145 |
| Total expenses | $1,346,699 |
| Net investment loss | $(1,534,670) |
| Realized and Unrealized Gain (Loss) from Portfolio | |
| Net realized gain (loss): | |
| Investment transactions (net of foreign capital gains taxes of $2,776,528) | $12,631,941 |
| Futures contracts | 434,687 |
| Foreign currency transactions | (189,641) |
| Net realized gain | $12,876,987 |
| Change in unrealized appreciation (depreciation): | |
| Investments (including net increase in accrued foreign capital gains taxes of $8,627,321) | $29,766,933 |
| Futures contracts | (90,863) |
| Foreign currency | (6,515) |
| Net change in unrealized appreciation (depreciation) | $29,669,555 |
| Net realized and unrealized gain | $42,546,542 |
| Net increase in net assets from operations | $41,011,872 |
2
See Notes to Financial Statements.
Eaton Vance
Greater India Fund
December 31, 2024
Statements of Changes in Net Assets
| | Year Ended December 31, |
| | 2024 | 2023 |
| Increase (Decrease) in Net Assets | | |
| From operations: | | |
| Net investment loss | $(1,534,670) | $(1,092,379) |
| Net realized gain | 12,876,987 | 12,067,870 |
| Net change in unrealized appreciation (depreciation) | 29,669,555 | 29,355,254 |
| Net increase in net assets from operations | $41,011,872 | $40,330,745 |
| Distributions to shareholders: | | |
| Class A | $(6,623,679) | $(6,812,648) |
| Class C | (512,658) | (370,271) |
| Class I | (4,801,004) | (3,372,222) |
| Total distributions to shareholders | $(11,937,341) | $(10,555,141) |
| Transactions in shares of beneficial interest: | | |
| Class A | $1,846,895 | $(2,774,248) |
| Class C | 2,896,490 | 416,233 |
| Class I | 38,100,201 | 14,980,102 |
| Net increase in net assets from Fund share transactions | $42,843,586 | $12,622,087 |
| Net increase in net assets | $71,918,117 | $42,397,691 |
| Net Assets | | |
| At beginning of year | $228,987,586 | $186,589,895 |
| At end of year | $300,905,703 | $228,987,586 |
3
See Notes to Financial Statements.
Eaton Vance
Greater India Fund
December 31, 2024
| | Class A |
| | Year Ended December 31, |
| | 2024 | 2023 | 2022 | 2021 | 2020 |
| Net asset value — Beginning of year | $35.42 | $30.84 | $44.09 | $38.79 | $34.30 |
| Income (Loss) From Operations | | | | | |
| Net investment loss(1) | $(0.25) | $(0.19) | $(0.36) | $(0.43) | $(0.24) |
| Net realized and unrealized gain (loss) | 6.52 | 6.49 | (6.22) | 9.73 | 4.83 |
| Total income (loss) from operations | $6.27 | $6.30 | $(6.58) | $9.30 | $4.59 |
| Less Distributions | | | | | |
| From net investment income | $— | $— | $(0.76) | $— | $— |
| From net realized gain | (1.63) | (1.72) | (5.91) | (4.00) | (0.10) |
| Total distributions | $(1.63) | $(1.72) | $(6.67) | $(4.00) | $(0.10) |
| Net asset value — End of year | $40.06 | $35.42 | $30.84 | $44.09 | $38.79 |
| Total Return(2) | 17.51% | 20.60% | (15.54)% | 24.04% | 13.42% |
| Ratios/Supplemental Data | | | | | |
| Net assets, end of year (000’s omitted) | $166,399 | $145,561 | $129,752 | $181,368 | $155,011 |
| Ratios (as a percentage of average daily net assets):(3)(4) | | | | | |
| Total expenses | 1.48% | 1.55% | 1.57% | 1.54% | 1.56% |
| Net expenses | 1.48%(5) | 1.55%(5) | 1.57%(5) | 1.54% | 1.56% |
| Net investment loss | (0.62)% | (0.60)% | (0.93)% | (0.98)% | (0.75)% |
| Portfolio Turnover of the Portfolio | 22% | 34% | 17% | 33% | 26% |
| (1) | Computed using average shares outstanding. |
| (2) | Returns are historical and are calculated by determining the percentage change in net asset value with all distributions reinvested and do not reflect the effect of sales charges. |
| (3) | Total expenses do not reflect amounts reimbursed and/or waived by the adviser and certain of its affiliates, if applicable. Net expenses are net of all reductions and represent the net expenses paid by the Fund. |
| (4) | Includes the Fund’s share of the Portfolio's allocated expenses. |
| (5) | Includes a reduction by the investment adviser of a portion of the Portfolio’s adviser fee due to the Portfolio’s investment in the Liquidity Fund (equal to less than 0.005% of average daily net assets for the years ended December 31, 2024, 2023 and 2022). |
4
See Notes to Financial Statements.
Eaton Vance
Greater India Fund
December 31, 2024
Financial Highlights — continued
| | Class C |
| | Year Ended December 31, |
| | 2024 | 2023 | 2022 | 2021 | 2020 |
| Net asset value — Beginning of year | $27.32 | $24.30 | $36.39 | $32.81 | $29.23 |
| Income (Loss) From Operations | | | | | |
| Net investment loss(1) | $(0.42) | $(0.34) | $(0.52) | $(0.62) | $(0.39) |
| Net realized and unrealized gain (loss) | 5.03 | 5.08 | (5.07) | 8.20 | 4.07 |
| Total income (loss) from operations | $4.61 | $4.74 | $(5.59) | $7.58 | $3.68 |
| Less Distributions | | | | | |
| From net investment income | $— | $— | $(0.59) | $— | $— |
| From net realized gain | (1.63) | (1.72) | (5.91) | (4.00) | (0.10) |
| Total distributions | $(1.63) | $(1.72) | $(6.50) | $(4.00) | $(0.10) |
| Net asset value — End of year | $30.30 | $27.32 | $24.30 | $36.39 | $32.81 |
| Total Return(2) | 16.62% | 19.73% | (16.10)% | 23.17% | 12.64% |
| Ratios/Supplemental Data | | | | | |
| Net assets, end of year (000’s omitted) | $10,085 | $6,502 | $5,465 | $9,181 | $7,548 |
| Ratios (as a percentage of average daily net assets):(3)(4) | | | | | |
| Total expenses | 2.23% | 2.30% | 2.29% | 2.24% | 2.26% |
| Net expenses | 2.23%(5) | 2.30%(5) | 2.29%(5) | 2.24% | 2.26% |
| Net investment loss | (1.35)% | (1.35)% | (1.64)% | (1.69)% | (1.44)% |
| Portfolio Turnover of the Portfolio | 22% | 34% | 17% | 33% | 26% |
| (1) | Computed using average shares outstanding. |
| (2) | Returns are historical and are calculated by determining the percentage change in net asset value with all distributions reinvested and do not reflect the effect of sales charges. |
| (3) | Total expenses do not reflect amounts reimbursed and/or waived by the adviser and certain of its affiliates, if applicable. Net expenses are net of all reductions and represent the net expenses paid by the Fund. |
| (4) | Includes the Fund’s share of the Portfolio's allocated expenses. |
| (5) | Includes a reduction by the investment adviser of a portion of the Portfolio’s adviser fee due to the Portfolio’s investment in the Liquidity Fund (equal to less than 0.005% of average daily net assets for the years ended December 31, 2024, 2023 and 2022). |
5
See Notes to Financial Statements.
Eaton Vance
Greater India Fund
December 31, 2024
Financial Highlights — continued
| | Class I |
| | Year Ended December 31, |
| | 2024 | 2023 | 2022 | 2021 | 2020 |
| Net asset value — Beginning of year | $37.38 | $32.38 | $45.60 | $39.92 | $35.19 |
| Income (Loss) From Operations | | | | | |
| Net investment loss(1) | $(0.16) | $(0.12) | $(0.26) | $(0.30) | $(0.15) |
| Net realized and unrealized gain (loss) | 6.87 | 6.84 | (6.17) | 9.98 | 4.98 |
| Total income (loss) from operations | $6.71 | $6.72 | $(6.43) | $9.68 | $4.83 |
| Less Distributions | | | | | |
| From net investment income | $— | $— | $(0.88) | $— | $— |
| From net realized gain | (1.63) | (1.72) | (5.91) | (4.00) | (0.10) |
| Total distributions | $(1.63) | $(1.72) | $(6.79) | $(4.00) | $(0.10) |
| Net asset value — End of year | $42.46 | $37.38 | $32.38 | $45.60 | $39.92 |
| Total Return(2) | 17.77% | 20.92% | (14.66)% | 24.31% | 13.77% |
| Ratios/Supplemental Data | | | | | |
| Net assets, end of year (000’s omitted) | $124,422 | $76,924 | $51,372 | $96,220 | $66,744 |
| Ratios (as a percentage of average daily net assets):(3)(4) | | | | | |
| Total expenses | 1.23% | 1.30% | 1.28% | 1.24% | 1.26% |
| Net expenses | 1.23%(5) | 1.30%(5) | 1.28%(5) | 1.24% | 1.26% |
| Net investment loss | (0.36)% | (0.34)% | (0.64)% | (0.66)% | (0.45)% |
| Portfolio Turnover of the Portfolio | 22% | 34% | 17% | 33% | 26% |
| (1) | Computed using average shares outstanding. |
| (2) | Returns are historical and are calculated by determining the percentage change in net asset value with all distributions reinvested. |
| (3) | Total expenses do not reflect amounts reimbursed and/or waived by the adviser and certain of its affiliates, if applicable. Net expenses are net of all reductions and represent the net expenses paid by the Fund. |
| (4) | Includes the Fund’s share of the Portfolio's allocated expenses. |
| (5) | Includes a reduction by the investment adviser of a portion of the Portfolio’s adviser fee due to the Portfolio’s investment in the Liquidity Fund (equal to less than 0.005% of average daily net assets for the years ended December 31, 2024, 2023 and 2022). |
6
See Notes to Financial Statements.
Eaton Vance
Greater India Fund
December 31, 2024
Notes to Financial Statements
1 Significant Accounting Policies
Eaton Vance Greater India Fund (the Fund) is a non-diversified series of Eaton Vance Special Investment Trust (the Trust). The Trust is a Massachusetts business trust registered under the Investment Company Act of 1940, as amended (the 1940 Act), as an open-end management investment company. The Fund offers three classes of shares. Class A shares are generally sold subject to a sales charge imposed at time of purchase. Class C shares are sold at net asset value and are generally subject to a contingent deferred sales charge (see Note 5). Effective November 5, 2020, Class C shares automatically convert to Class A shares eight years after their purchase as described in the Fund’s prospectus. Class I shares are sold at net asset value and are not subject to a sales charge. Each class represents a pro rata interest in the Fund, but votes separately on class-specific matters and (as noted below) is subject to different expenses. Realized and unrealized gains and losses and net investment income and losses, other than class-specific expenses, are allocated daily to each class of shares based on the relative net assets of each class to the total net assets of the Fund. Each class of shares differs in its distribution plan and certain other class-specific expenses. The Fund invests all of its investable assets in interests in Greater India Portfolio (the Portfolio), a Massachusetts business trust, having the same investment objective and policies as the Fund. The value of the Fund’s investment in the Portfolio reflects the Fund’s proportionate interest in the net assets of the Portfolio (approximately 100% at December 31, 2024). The performance of the Fund is directly affected by the performance of the Portfolio. The financial statements of the Portfolio, including the portfolio of investments, are included elsewhere in this report and should be read in conjunction with the Fund’s financial statements.
The following is a summary of significant accounting policies of the Fund. The policies are in conformity with accounting principles generally accepted in the United States of America (U.S. GAAP). The Fund is an investment company and follows accounting and reporting guidance in the Financial Accounting Standards Board (FASB) Accounting Standards Codification Topic 946.
A Investment Valuation—Valuation of securities by the Portfolio is discussed in Note 1A of the Portfolio's Notes to Financial Statements, which are included elsewhere in this report.
B Income—The Fund's net investment income or loss consists of the Fund's pro rata share of the net investment income or loss of the Portfolio, less all actual and accrued expenses of the Fund.
C Federal and Other Taxes—The Fund’s policy is to comply with the provisions of the Internal Revenue Code applicable to regulated investment companies and to distribute to shareholders each year substantially all of its net investment income, and all or substantially all of its net realized capital gains. Accordingly, no provision for federal income or excise tax is necessary.
In addition to the requirements of the Internal Revenue Code, the Fund may also be required to recognize its pro rata share of the capital gains taxes incurred by the Portfolio. In doing so, the daily net asset value would reflect the Fund’s pro rata share of the estimated reserve for such taxes incurred by the Portfolio.
As of December 31, 2024, the Fund had no uncertain tax positions that would require financial statement recognition, de-recognition, or disclosure. The Fund files a U.S. federal income tax return annually after its fiscal year-end, which is subject to examination by the Internal Revenue Service for a period of three years from the date of filing.
D Expenses—The majority of expenses of the Trust are directly identifiable to an individual fund. Expenses which are not readily identifiable to a specific fund are allocated taking into consideration, among other things, the nature and type of expense and the relative size of the funds.
E Use of Estimates—The preparation of the financial statements in conformity with U.S. GAAP requires management to make estimates and assumptions that affect the reported amounts of assets and liabilities at the date of the financial statements and the reported amounts of income and expense during the reporting period. Actual results could differ from those estimates.
F Indemnifications—Under the Trust’s organizational documents, its officers and Trustees may be indemnified against certain liabilities and expenses arising out of the performance of their duties to the Fund. Under Massachusetts law, if certain conditions prevail, shareholders of a Massachusetts business trust (such as the Trust) could be deemed to have personal liability for the obligations of the Trust. However, the Trust’s Declaration of Trust contains an express disclaimer of liability on the part of Fund shareholders and the By-laws provide that the Trust shall assume, upon request by the shareholder, the defense on behalf of any Fund shareholders. Moreover, the By-laws also provide for indemnification out of Fund property of any shareholder held personally liable solely by reason of being or having been a shareholder for all loss or expense arising from such liability. Additionally, in the normal course of business, the Fund enters into agreements with service providers that may contain indemnification clauses. The Fund's maximum exposure under these arrangements is unknown as this would involve future claims that may be made against the Fund that have not yet occurred.
G Other—Investment transactions are accounted for on a trade date basis.
H Segment Reporting—During the year ended December 31, 2024, the Fund adopted FASB Accounting Standards Update No. 2023-07, Segment Reporting (Topic 280): Improvements to Reportable Segment Disclosures, (ASU 2023-07), which requires incremental disclosures related to a public entity’s reportable segments. The Fund operates as a single reportable segment, an investment company whose investment objective is included in Note 1. In connection with the adoption of ASU 2023-07, the Fund’s President has been designated as the Fund’s Chief Operating Decision Maker (CODM), who is
Eaton Vance
Greater India Fund
December 31, 2024
Notes to Financial Statements — continued
responsible for assessing the performance of the Fund’s single segment and deciding how to allocate the segment’s resources. To perform this function, the CODM reviews the information in the Fund’s Financial Statements.
2 Distributions to Shareholders and Income Tax Information
It is the present policy of the Fund to make at least one distribution annually (normally in December) of all or substantially all of its net investment income and to distribute annually all or substantially all of its net realized capital gains. Distributions to shareholders are recorded on the ex-dividend date. Distributions are declared separately for each class of shares. Shareholders may reinvest income and capital gain distributions in additional shares of the same class of the Fund at the net asset value as of the ex-dividend date or, at the election of the shareholder, receive distributions in cash. Distributions to shareholders are determined in accordance with income tax regulations, which may differ from U.S. GAAP. As required by U.S. GAAP, only distributions in excess of tax basis earnings and profits are reported in the financial statements as a return of capital. Permanent differences between book and tax accounting relating to distributions are reclassified to paid-in capital. For tax purposes, distributions from short-term capital gains are considered to be from ordinary income.
The tax character of distributions declared for the years ended December 31, 2024 and December 31, 2023 was as follows:
| | Year Ended December 31, |
| | 2024 | 2023 |
| Long-term capital gains | $11,937,341 | $10,555,141 |
During the year ended December 31, 2024, distributable earnings was increased by $690,237 and paid-in capital was decreased by $690,237 due to the Fund’s use of equalization accounting and differences between book and tax accounting for net operating losses. Tax equalization accounting allows the Fund to treat as a distribution that portion of redemption proceeds representing a redeeming shareholder’s portion of undistributed taxable income and net capital gains. These reclassifications had no effect on the net assets or net asset value per share of the Fund.
As of December 31, 2024, the components of distributable earnings (accumulated loss) on a tax basis were as follows:
| Undistributed long-term capital gains | $ 2,741,276 |
| Late year ordinary losses | (205,924) |
| Net unrealized appreciation | 99,985,904 |
| Distributable earnings | $102,521,256 |
At December 31, 2024, the Fund had a late year ordinary loss of $205,924 related to certain specified losses realized after October 31, 2024, which it has elected to defer to the following taxable year pursuant to income tax regulations.
3 Investment Adviser Fee and Other Transactions with Affiliates
The investment adviser fee is earned by Boston Management and Research (BMR), an indirect, wholly-owned subsidiary of Morgan Stanley, as compensation for investment advisory services rendered to the Fund. The fee is computed at an annual rate as a percentage of the Fund’s average daily net assets that are not invested in other investment companies for which BMR or its affiliates serve as investment adviser and receive an advisory fee as follows and is payable monthly:
| Average Daily Net Assets | Annual Fee Rate |
| Up to $500 million | 0.850% |
| $500 million but less than $1 billion | 0.800% |
| $1 billion but less than $2.5 billion | 0.775% |
| $2.5 billion but less than $5 billion | 0.750% |
| $5 billion and over | 0.730% |
For the year ended December 31, 2024, the Fund incurred no investment adviser fee on such assets. Pursuant to an investment sub-advisory agreement, BMR has delegated the investment management of the Fund to Goldman Sachs Asset Management, L.P. (GSAM). BMR pays GSAM a portion of its investment adviser fee for sub-advisory services provided to the Fund. To the extent the Fund’s assets are invested in the Portfolio, the Fund is allocated its
Eaton Vance
Greater India Fund
December 31, 2024
Notes to Financial Statements — continued
pro rata share of the Portfolio’s investment adviser fee. The Portfolio has engaged BMR to render investment advisory services. See Note 2 of the Portfolio’s Notes to Financial Statements which are included elsewhere in this report. The administration fee is earned by Eaton Vance Management (EVM), an affiliate of BMR and an indirect, wholly-owned subsidiary of Morgan Stanley, for administering the business affairs of the Fund and is computed at an annual rate of 0.15% of the Fund’s average daily net assets. For the year ended December 31, 2024, the administration fee amounted to $421,972.
EVM provides sub-transfer agency and related services to the Fund pursuant to a Sub-Transfer Agency Support Services Agreement. For the year ended December 31, 2024, EVM earned $28,254 from the Fund pursuant to such agreement, which is included in transfer and dividend disbursing agent fees on the Statement of Operations. The Fund was informed that Eaton Vance Distributors, Inc. (EVD), an affiliate of EVM and the Fund’s principal underwriter, received $22,606 as its portion of the sales charge on sales of Class A shares for the year ended December 31, 2024. EVD also received distribution and service fees from Class A and Class C shares (see Note 4) and contingent deferred sales charges (see Note 5).
Trustees and officers of the Fund who are members of EVM’s or BMR’s organizations receive remuneration for their services to the Fund out of the investment adviser fee and administration fee. Certain officers and Trustees of the Fund and the Portfolio are officers of the above organizations.
4 Distribution Plans
The Fund has in effect a distribution plan for Class A shares (Class A Plan) pursuant to Rule 12b-1 under the 1940 Act. Pursuant to the Class A Plan, the Fund pays EVD a distribution and service fee of 0.25% per annum of its average daily net assets attributable to Class A shares for distribution services and facilities provided to the Fund by EVD, as well as for personal services and/or the maintenance of shareholder accounts. Distribution and service fees paid or accrued to EVD for the year ended December 31, 2024 amounted to $416,779 for Class A shares.
The Fund also has in effect a distribution plan for Class C shares (Class C Plan) pursuant to Rule 12b-1 under the 1940 Act. Pursuant to the Class C Plan, the Fund pays EVD amounts equal to 0.75% per annum of its average daily net assets attributable to Class C shares for providing ongoing distribution services and facilities to the Fund. For the year ended December 31, 2024, the Fund paid or accrued to EVD $68,138 for Class C shares.
Pursuant to the Class C Plan, the Fund also makes payments of service fees to EVD, financial intermediaries and other persons in amounts equal to 0.25% per annum of its average daily net assets attributable to that class. Service fees paid or accrued are for personal services and/or the maintenance of shareholder accounts. They are separate and distinct from the sales commissions and distribution fees payable to EVD. Service fees paid or accrued for the year ended December 31, 2024 amounted to $22,713 for Class C shares.
Distribution and service fees are subject to the limitations contained in the Financial Industry Regulatory Authority Rule 2341(d).
5 Contingent Deferred Sales Charges
A contingent deferred sales charge (CDSC) of 1% generally is imposed on redemptions of Class C shares made within 12 months of purchase. Class A shares may be subject to a 1% CDSC if redeemed within 12 months of purchase (depending on the circumstances of purchase). Generally, the CDSC is based upon the lower of the net asset value at date of redemption or date of purchase. No charge is levied on shares acquired by reinvestment of dividends or capital gain distributions. For the year ended December 31, 2024, the Fund was informed that EVD received $1,166 of CDSCs paid by Class C shareholders and no CDSCs paid by Class A shareholders.
6 Investment Transactions
For the year ended December 31, 2024, increases and decreases in the Fund's investment in the Portfolio aggregated $61,937,101 and $32,332,036, respectively.
Eaton Vance
Greater India Fund
December 31, 2024
Notes to Financial Statements — continued
7 Shares of Beneficial Interest
The Fund’s Declaration of Trust permits the Trustees to issue an unlimited number of full and fractional shares of beneficial interest (without par value). Such shares may be issued in a number of different series (such as the Fund) and classes. Transactions in Fund shares, including direct exchanges pursuant to share class conversions, were as follows:
| | Year Ended
December 31, 2024 | | Year Ended
December 31, 2023 |
| | Shares | Amount | | Shares | Amount |
| Class A | | | | | |
| Sales | 419,468 | $16,844,920 | | 260,972 | $ 8,530,072 |
| Issued to shareholders electing to receive payments of distributions in Fund shares | 143,051 | 5,982,399 | | 178,735 | 6,128,812 |
| Redemptions | (517,574) | (20,980,424) | | (537,727) | (17,433,132) |
| Net increase (decrease) | 44,945 | $ 1,846,895 | | (98,020) | $(2,774,248) |
| Class C | | | | | |
| Sales | 99,750 | $ 3,047,765 | | 61,482 | $ 1,612,127 |
| Issued to shareholders electing to receive payments of distributions in Fund shares | 16,198 | 512,658 | | 13,994 | 370,271 |
| Redemptions | (21,094) | (663,933) | | (62,370) | (1,566,165) |
| Net increase | 94,854 | $ 2,896,490 | | 13,106 | $ 416,233 |
| Class I | | | | | |
| Sales | 1,658,451 | $71,825,685 | | 1,087,631 | $36,011,279 |
| Issued to shareholders electing to receive payments of distributions in Fund shares | 103,877 | 4,603,855 | | 87,371 | 3,161,086 |
| Redemptions | (890,185) | (38,329,339) | | (703,559) | (24,192,263) |
| Net increase | 872,143 | $38,100,201 | | 471,443 | $14,980,102 |
Eaton Vance
Greater India Fund
December 31, 2024
Report of Independent Registered Public Accounting Firm
To the Trustees of Eaton Vance Special Investment Trust and Shareholders of Eaton Vance Greater India Fund:
Opinion on the Financial Statements and Financial Highlights
We have audited the accompanying statement of assets and liabilities of Eaton Vance Greater India Fund (the “Fund”) (one of the funds constituting Eaton Vance Special Investment Trust), as of December 31, 2024, the related statement of operations for the year then ended, the statements of changes in net assets for each of the two years in the period then ended, the financial highlights for each of the five years in the period then ended, and the related notes. In our opinion, the financial statements and financial highlights present fairly, in all material respects, the financial position of the Fund as of December 31, 2024, and the results of its operations for the year then ended, the changes in its net assets for each of the two years in the period then ended, and the financial highlights for each of the five years in the period then ended, in conformity with accounting principles generally accepted in the United States of America.
Basis for Opinion
These financial statements and financial highlights are the responsibility of the Fund's management. Our responsibility is to express an opinion on the Fund's financial statements and financial highlights based on our audits. We are a public accounting firm registered with the Public Company Accounting Oversight Board (United States) (PCAOB) and are required to be independent with respect to the Fund in accordance with the U.S. federal securities laws and the applicable rules and regulations of the Securities and Exchange Commission and the PCAOB.
We conducted our audits in accordance with the standards of the PCAOB. Those standards require that we plan and perform the audit to obtain reasonable assurance about whether the financial statements and financial highlights are free of material misstatement, whether due to error or fraud. The Fund is not required to have, nor were we engaged to perform, an audit of its internal control over financial reporting. As part of our audits, we are required to obtain an understanding of internal control over financial reporting but not for the purpose of expressing an opinion on the effectiveness of the Fund’s internal control over financial reporting. Accordingly, we express no such opinion.
Our audits included performing procedures to assess the risks of material misstatement of the financial statements and financial highlights, whether due to error or fraud, and performing procedures that respond to those risks. Such procedures included examining, on a test basis, evidence regarding the amounts and disclosures in the financial statements and financial highlights. Our audits also included evaluating the accounting principles used and significant estimates made by management, as well as evaluating the overall presentation of the financial statements and financial highlights. We believe that our audits provide a reasonable basis for our opinion.
/s/ Deloitte & Touche LLP
Boston, Massachusetts
February 21, 2025
We have served as the auditor of one or more Eaton Vance investment companies since 1959.
Eaton Vance
Greater India Fund
December 31, 2024
Federal Tax Information (Unaudited)
The Form 1099-DIV you received in February 2025 showed the tax status of all distributions paid to your account in calendar year 2024. Shareholders are advised to consult their own tax adviser with respect to the tax consequences of their investment in the Fund. As required by the Internal Revenue Code and/or regulations, shareholders must be notified regarding the status of qualified dividend income for individuals, the foreign tax credit and capital gains dividends.
Qualified Dividend Income. For the fiscal year ended December 31, 2024, the Fund designates approximately $2,550,595, or up to the maximum amount of such dividends allowable pursuant to the Internal Revenue Code, as qualified dividend income eligible for the reduced tax rate of 15%.
Foreign Tax Credit. For the fiscal year ended December 31, 2024, the Fund paid foreign taxes of $3,372,587 and recognized foreign source income of $2,494,447.
Capital Gains Dividends. The Fund hereby designates as a capital gain dividend with respect to the taxable year ended December 31, 2024, $14,752,357 or, if subsequently determined to be different, the net capital gain of such year.
Greater India Portfolio
December 31, 2024
| Security | Shares | Value |
| India — 102.4% |
| Automobile Components — 2.2% |
| Samvardhana Motherson International Ltd. | | 2,263,729 | $ 4,109,641 |
| Sona BLW Precision Forgings Ltd.(1) | | 373,044 | 2,585,211 |
| | | | $ 6,694,852 |
| Automobiles — 7.5% |
| Hyundai Motor India Ltd.(2) | | 213,810 | $ 4,510,517 |
| Mahindra & Mahindra Ltd. | | 372,134 | 13,025,882 |
| Maruti Suzuki India Ltd. | | 12,909 | 1,632,905 |
| TVS Motor Co. Ltd. | | 127,029 | 3,506,744 |
| | | | $ 22,676,048 |
| Banks — 14.6% |
| AU Small Finance Bank Ltd.(1) | | 390,109 | $ 2,541,493 |
| Axis Bank Ltd. | | 851,714 | 10,561,346 |
| HDFC Bank Ltd. | | 126,174 | 2,609,317 |
| ICICI Bank Ltd. | | 1,777,600 | 26,560,577 |
| IDFC First Bank Ltd.(2) | | 2,260,974 | 1,663,469 |
| | | | $ 43,936,202 |
| Building Products — 0.5% |
| Kajaria Ceramics Ltd. | | 111,660 | $ 1,509,203 |
| | | | $ 1,509,203 |
| Capital Markets — 2.2% |
| 360 ONE WAM Ltd. | | 211,285 | $ 3,088,810 |
| Angel One Ltd. | | 31,059 | 1,059,284 |
| Nuvama Wealth Management Ltd. | | 30,541 | 2,467,711 |
| | | | $ 6,615,805 |
| Chemicals — 0.4% |
| Navin Fluorine International Ltd. | | 32,128 | $ 1,216,175 |
| | | | $ 1,216,175 |
| Construction & Engineering — 0.7% |
| Techno Electric & Engineering Co. Ltd. | | 115,623 | $ 2,113,821 |
| | | | $ 2,113,821 |
| Construction Materials — 1.0% |
| Shree Cement Ltd. | | 10,073 | $ 3,017,641 |
| | | | $ 3,017,641 |
| Security | Shares | Value |
| Consumer Finance — 5.5% |
| Bajaj Finance Ltd. | | 135,341 | $ 10,762,119 |
| Cholamandalam Investment & Finance Co. Ltd. | | 262,971 | 3,635,410 |
| Five-Star Business Finance Ltd.(2) | | 250,434 | 2,259,739 |
| | | | $ 16,657,268 |
| Consumer Staples Distribution & Retail — 0.4% |
| Medplus Health Services Ltd.(2) | | 127,157 | $ 1,232,461 |
| | | | $ 1,232,461 |
| Electrical Equipment — 1.9% |
| KEI Industries Ltd. | | 38,334 | $ 1,981,342 |
| Suzlon Energy Ltd.(2) | | 5,160,848 | 3,737,134 |
| | | | $ 5,718,476 |
| Financial Services — 2.4% |
| Jio Financial Services Ltd.(2) | | 1,052,129 | $ 3,660,551 |
| REC Ltd. | | 608,568 | 3,548,290 |
| | | | $ 7,208,841 |
| Food Products — 1.7% |
| Tata Consumer Products Ltd. | | 471,645 | $ 5,029,718 |
| | | | $ 5,029,718 |
| Health Care Providers & Services — 2.1% |
| Apollo Hospitals Enterprise Ltd. | | 75,793 | $ 6,449,251 |
| | | | $ 6,449,251 |
| Hotels, Restaurants & Leisure — 4.1% |
| Devyani International Ltd.(2) | | 611,229 | $ 1,299,732 |
| Zomato Ltd.(2) | | 3,419,775 | 11,077,882 |
| | | | $ 12,377,614 |
| Household Durables — 3.7% |
| Cello World Ltd. | | 95,468 | $ 842,247 |
| Dixon Technologies India Ltd. | | 40,110 | 8,381,249 |
| Whirlpool of India Ltd. | | 91,899 | 1,969,945 |
| | | | $ 11,193,441 |
| Independent Power and Renewable Electricity Producers — 3.5% |
| NHPC Ltd. | | 2,536,068 | $ 2,381,747 |
| NTPC Green Energy Ltd.(2) | | 1,977,060 | 2,937,171 |
| NTPC Ltd. | | 1,368,772 | 5,317,267 |
| | | | $ 10,636,185 |
13
See Notes to Financial Statements.
Greater India Portfolio
December 31, 2024
Portfolio of Investments — continued
| Security | Shares | Value |
| Industrial Conglomerates — 1.3% |
| Siemens Ltd. | | 49,280 | $ 3,752,977 |
| | | | $ 3,752,977 |
| Insurance — 3.6% |
| Go Digit General Insurance Ltd.(2) | | 498,425 | $ 1,850,190 |
| PB Fintech Ltd.(2) | | 174,259 | 4,278,023 |
| SBI Life Insurance Co. Ltd.(1) | | 291,428 | 4,722,565 |
| | | | $ 10,850,778 |
| Interactive Media & Services — 1.5% |
| Info Edge India Ltd. | | 43,007 | $ 4,348,717 |
| | | | $ 4,348,717 |
| IT Services — 12.0% |
| Coforge Ltd. | | 58,498 | $ 6,572,540 |
| Infosys Ltd. | | 955,253 | 20,925,324 |
| Persistent Systems Ltd. | | 77,824 | 5,850,174 |
| Zensar Technologies Ltd. | | 311,778 | 2,727,974 |
| | | | $ 36,076,012 |
| Metals & Mining — 4.6% |
| APL Apollo Tubes Ltd. | | 166,492 | $ 3,042,635 |
| Hindalco Industries Ltd. | | 845,342 | 5,932,051 |
| Vedanta Ltd. | | 924,480 | 4,790,612 |
| | | | $ 13,765,298 |
| Oil, Gas & Consumable Fuels — 2.6% |
| Reliance Industries Ltd. | | 547,464 | $ 7,753,515 |
| | | | $ 7,753,515 |
| Paper and Forest Products — 0.8% |
| Aditya Birla Real Estate Ltd. | | 84,904 | $ 2,485,557 |
| | | | $ 2,485,557 |
| Personal Care Products — 2.7% |
| Colgate-Palmolive (India) Ltd. | | 122,796 | $ 3,841,141 |
| Godrej Consumer Products Ltd. | | 348,511 | 4,396,988 |
| | | | $ 8,238,129 |
| Pharmaceuticals — 6.5% |
| Pfizer Ltd. | | 24,356 | $ 1,499,593 |
| Sun Pharmaceutical Industries Ltd. | | 533,461 | 11,739,804 |
| Suven Pharmaceuticals Ltd.(2) | | 133,333 | 1,771,070 |
| Torrent Pharmaceuticals Ltd. | | 112,149 | 4,395,848 |
| | | | $ 19,406,315 |
| Security | Shares | Value |
| Real Estate Management & Development — 1.9% |
| Godrej Properties Ltd.(2) | | 175,382 | $ 5,690,208 |
| | | | $ 5,690,208 |
| Specialty Retail — 4.0% |
| BrainBees Solutions Ltd.(2) | | 284,985 | $ 2,169,389 |
| Metro Brands Ltd. | | 81,175 | 1,151,595 |
| Trent Ltd. | | 106,688 | 8,851,916 |
| | | | $ 12,172,900 |
| Textiles, Apparel & Luxury Goods — 1.7% |
| Kalyan Jewellers India Ltd. | | 560,482 | $ 5,005,780 |
| | | | $ 5,005,780 |
| Wireless Telecommunication Services — 4.8% |
| Bharti Airtel Ltd. | | 785,600 | $ 14,545,905 |
| | | | $ 14,545,905 |
Total India
(identified cost $188,902,852) | | | $308,375,093 |
| United States — 1.7% |
| IT Services — 1.7% |
| Cognizant Technology Solutions Corp., Class A | | 65,127 | $ 5,008,266 |
Total United States
(identified cost $4,683,360) | | | $ 5,008,266 |
Total Common Stocks
(identified cost $193,586,212) | | | $313,383,359 |
| Short-Term Investments — 2.2% |
| Security | Shares | Value |
| Morgan Stanley Institutional Liquidity Funds - Government Portfolio, Institutional Class, 4.43%(3) | | 6,723,781 | $ 6,723,781 |
Total Short-Term Investments
(identified cost $6,723,781) | | | $ 6,723,781 |
Total Investments — 106.3%
(identified cost $200,309,993) | | | $320,107,140 |
| Other Assets, Less Liabilities — (6.3)% | | | $(18,934,287) |
| Net Assets — 100.0% | | | $301,172,853 |
14
See Notes to Financial Statements.
Greater India Portfolio
December 31, 2024
Portfolio of Investments — continued
| The percentage shown for each investment category in the Portfolio of Investments is based on net assets. |
| (1) | Security exempt from registration under Rule 144A of the Securities Act of 1933, as amended. These securities may be sold in certain transactions in reliance on an exemption from registration (normally to qualified institutional buyers). At December 31, 2024, the aggregate value of these securities is $9,849,269 or 3.3% of the Portfolio's net assets. |
| (2) | Non-income producing security. |
| (3) | May be deemed to be an affiliated investment company (see Note 7). The rate shown is the annualized seven-day yield as of December 31, 2024. |
| Futures Contracts |
| Description | Number of
Contracts | Position | Expiration
Date | Notional
Amount | Value/Unrealized
Appreciation
(Depreciation) |
| Equity Futures | | | | | |
| NSE IFSC Nifty 50 Index | 132 | Long | 1/30/25 | $6,261,929 | $(65,589) |
| | | | | | $(65,589) |
15
See Notes to Financial Statements.
Greater India Portfolio
December 31, 2024
Statement of Assets and Liabilities
| | December 31, 2024 |
| Assets | |
| Unaffiliated investments, at value (identified cost $193,586,212) | $313,383,359 |
| Affiliated investments, at value (identified cost $6,723,781) | 6,723,781 |
| Deposits for derivatives collateral — futures contracts | 363,000 |
| Foreign currency, at value (identified cost $712,833) | 706,074 |
| Dividends receivable | 64,636 |
| Dividends receivable from affiliated investments | 37,075 |
| Receivable for foreign taxes | 43,182 |
| Trustees' deferred compensation plan | 24,382 |
| Total assets | $321,345,489 |
| Liabilities | |
| Payable for variation margin on open futures contracts | $30,775 |
| Payable to affiliates: | |
| Investment adviser fee | 224,322 |
| Trustees' fees | 4,595 |
| Trustees' deferred compensation plan | 24,382 |
| Accrued foreign capital gains taxes | 19,771,667 |
| Accrued expenses | 116,895 |
| Total liabilities | $20,172,636 |
| Net Assets applicable to investors' interest in Portfolio | $301,172,853 |
16
See Notes to Financial Statements.
Greater India Portfolio
December 31, 2024
| | Year Ended |
| | December 31, 2024 |
| Investment Income | |
| Dividend income (net of foreign taxes withheld of $603,107) | $1,952,769 |
| Dividend income from affiliated investments | 475,102 |
| Interest income | 18,632 |
| Total investment income | $2,446,503 |
| Expenses | |
| Investment adviser fee | $2,392,983 |
| Trustees’ fees and expenses | 17,805 |
| Custodian fee | 125,890 |
| Legal and accounting services | 103,759 |
| Miscellaneous | 7,616 |
| Total expenses | $2,648,053 |
| Deduct: | |
| Waiver and/or reimbursement of expenses by affiliates | $13,578 |
| Total expense reductions | $13,578 |
| Net expenses | $2,634,475 |
| Net investment loss | $(187,972) |
| Realized and Unrealized Gain (Loss) | |
| Net realized gain (loss): | |
| Investment transactions (net of foreign capital gains taxes of $2,776,560) | $12,632,091 |
| Futures contracts | 434,692 |
| Foreign currency transactions | (189,643) |
| Net realized gain | $12,877,140 |
| Change in unrealized appreciation (depreciation): | |
| Investments (including net increase in accrued foreign capital gains taxes of $8,627,426) | $29,767,306 |
| Futures contracts | (90,864) |
| Foreign currency | (6,515) |
| Net change in unrealized appreciation (depreciation) | $29,669,927 |
| Net realized and unrealized gain | $42,547,067 |
| Net increase in net assets from operations | $42,359,095 |
17
See Notes to Financial Statements.
Greater India Portfolio
December 31, 2024
Statements of Changes in Net Assets
| | Year Ended December 31, |
| | 2024 | 2023 |
| Increase (Decrease) in Net Assets | | |
| From operations: | | |
| Net investment loss | $(187,972) | $(44,329) |
| Net realized gain | 12,877,140 | 12,068,019 |
| Net change in unrealized appreciation (depreciation) | 29,669,927 | 29,355,611 |
| Net increase in net assets from operations | $42,359,095 | $41,379,301 |
| Capital transactions: | | |
| Contributions | $61,937,101 | $31,982,220 |
| Withdrawals | (32,332,036) | (31,356,983) |
| Net increase in net assets from capital transactions | $29,605,065 | $625,237 |
| Net increase in net assets | $71,964,160 | $42,004,538 |
| Net Assets | | |
| At beginning of year | $229,208,693 | $187,204,155 |
| At end of year | $301,172,853 | $229,208,693 |
18
See Notes to Financial Statements.
Greater India Portfolio
December 31, 2024
| | Year Ended December 31, |
| Ratios/Supplemental Data | 2024 | 2023 | 2022 | 2021 | 2020 |
| Ratios (as a percentage of average daily net assets):(1) | | | | | |
| Total expenses | 0.93% | 0.97% | 0.97% | 0.95% | 0.93% |
| Net expenses | 0.93%(2) | 0.97%(2) | 0.97%(2) | 0.95% | 0.93% |
| Net investment loss | (0.07)% | (0.02)% | (0.32)% | (0.39)% | (0.12)% |
| Portfolio Turnover | 22% | 34% | 17% | 33% | 26% |
| Total Return | 18.15% | 21.29% | (14.39)% | 24.76% | 14.14% |
| Net assets, end of year (000’s omitted) | $301,173 | $229,209 | $187,204 | $284,153 | $229,025 |
| (1) | Total expenses do not reflect amounts reimbursed and/or waived by the adviser and certain of its affiliates, if applicable. Net expenses are net of all reductions and represent the net expenses paid by the Portfolio. |
| (2) | Includes a reduction by the investment adviser of a portion of its adviser fee due to the Portfolio’s investment in the Liquidity Fund (equal to less than 0.005% of average daily net assets for the years ended December 31, 2024, 2023 and 2022). |
19
See Notes to Financial Statements.
Greater India Portfolio
December 31, 2024
Notes to Financial Statements
1 Significant Accounting Policies
Greater India Portfolio (the Portfolio) is a Massachusetts business trust registered under the Investment Company Act of 1940, as amended (the 1940 Act), as a non-diversified, open-end management investment company. The Portfolio’s investment objective is to seek long-term capital appreciation. The Declaration of Trust permits the Trustees to issue interests in the Portfolio. At December 31, 2024, Eaton Vance Greater India Fund held an interest of approximately 100% in the Portfolio.
The following is a summary of significant accounting policies of the Portfolio. The policies are in conformity with accounting principles generally accepted in the United States of America (U.S. GAAP). The Portfolio is an investment company and follows accounting and reporting guidance in the Financial Accounting Standards Board (FASB) Accounting Standards Codification Topic 946.
A Investment Valuation—The following methodologies are used to determine the market value or fair value of investments.
Equity Securities. Equity securities listed on a U.S. securities exchange generally are valued at the last sale or closing price on the day of valuation or, if no sales took place on such date, at the mean between the closing bid and ask prices on the exchange where such securities are principally traded. Equity securities listed on the NASDAQ National Market System are valued at the NASDAQ official closing price. Unlisted or listed securities for which closing sales prices or closing quotations are not available are valued at the mean between the latest available bid and ask prices.
Derivatives. Futures contracts are valued at the closing settlement price established by the board of trade or exchange on which they are traded, with adjustments for fair valuation for certain foreign futures contracts as described below.
Foreign Securities, Futures Contracts and Currencies. Foreign securities, futures contracts and currencies are valued in U.S. dollars, based on foreign currency exchange rate quotations supplied by a third party pricing service. The pricing service uses a proprietary model to determine the exchange rate. Inputs to the model include reported trades and implied bid/ask spreads. The daily valuation of exchange-traded foreign securities and certain exchange-traded foreign futures contracts generally is determined as of the close of trading on the principal exchange on which such securities and contracts trade. Foreign ownership of shares of certain Indian companies may be subject to limitations. When foreign ownership of such an Indian company’s shares approaches the limitation, foreign investors may be willing to pay a premium to the local share price to acquire shares from other foreign investors. Such shares are valued at the closing price for foreign investors as provided by the exchange on which they trade. Events occurring after the close of trading on foreign exchanges may result in adjustments to the valuation of foreign securities and certain foreign futures contracts to more accurately reflect their fair value as of the close of regular trading on the New York Stock Exchange. When valuing foreign equity securities and foreign futures contracts that meet certain criteria, the Portfolio’s Trustees have approved the use of a fair value service that values such securities and foreign futures contracts to reflect market trading that occurs after the close of the applicable foreign markets of comparable securities or other instruments that have a strong correlation to the fair-valued securities and foreign futures contracts.
Other. Investments in management investment companies (including money market funds) that do not trade on an exchange are valued at the net asset value as of the close of each business day.
Fair Valuation. In connection with Rule 2a-5 of the 1940 Act, the Trustees have designated the Portfolio’s investment adviser as its valuation designee. Investments for which valuations or market quotations are not readily available or are deemed unreliable are valued by the investment adviser, as valuation designee, at fair value using methods that most fairly reflect the security’s “fair value”, which is the amount that the Portfolio might reasonably expect to receive for the security upon its current sale in the ordinary course. Each such determination is based on a consideration of relevant factors, which are likely to vary from one pricing context to another. These factors may include, but are not limited to, the type of security, the existence of any contractual restrictions on the security’s disposition, the price and extent of public trading in similar securities of the issuer or of comparable companies or entities, quotations or relevant information obtained from broker/dealers or other market participants, information obtained from the issuer, analysts, and/or the appropriate stock exchange (for exchange-traded securities), an analysis of the company’s or entity’s financial statements, and an evaluation of the forces that influence the issuer and the market(s) in which the security is purchased and sold.
B Investment Transactions—Investment transactions for financial statement purposes are accounted for on a trade date basis. Realized gains and losses on investments sold are determined on the basis of identified cost.
C Income—Dividend income is recorded on the ex-dividend date for dividends received in cash and/or securities. However, if the ex-dividend date has passed, certain dividends from foreign securities are recorded as the Portfolio is informed of the ex-dividend date. Withholding taxes on foreign dividends and capital gains have been provided for in accordance with the Portfolio's understanding of the applicable countries’ tax rules and rates. Interest income is accrued as earned.
D Federal and Other Taxes—The Portfolio has elected to be treated as a partnership for federal tax purposes. No provision is made by the Portfolio for federal or state taxes on any taxable income of the Portfolio because each investor in the Portfolio is ultimately responsible for the payment of any taxes on its share of taxable income. Since at least one of the Portfolio’s investors is a regulated investment company that invests all or substantially all of its assets in the Portfolio, the Portfolio normally must satisfy the applicable source of income and diversification requirements (under the Internal Revenue Code) in order for its investors to satisfy them. The Portfolio will allocate, at least annually among its investors, each investor’s distributive share of the Portfolio’s net investment income, net realized capital gains and losses and any other items of income, gain, loss, deduction or credit.
Greater India Portfolio
December 31, 2024
Notes to Financial Statements — continued
In addition to the requirements of the Internal Revenue Code, the Portfolio may also be subject to local taxes on the recognition of capital gains in India. In determining the daily net asset value, the Portfolio estimates the accrual for such taxes, if any, based on the unrealized appreciation on certain portfolio securities, historical effective tax rates on securities sold, and the availability of any realized losses in excess of gains that may be carried forward to offset future gains. Taxes attributable to unrealized appreciation are included in the change in unrealized appreciation (depreciation) on investments. Capital gains taxes on certain Indian securities sold at a gain are included in net realized gain (loss) on investments. As of December 31, 2024, the Portfolio for tax reporting in India had no accumulated losses available to be carried forward to offset future realized gains from the sale of Indian securities.
As of December 31, 2024, the Portfolio had no uncertain tax positions that would require financial statement recognition, de-recognition, or disclosure. The Portfolio files a U.S. federal income tax return annually after its fiscal year-end, which is subject to examination by the Internal Revenue Service for a period of three years from the date of filing. The Portfolio also files a tax return in India annually as of March 31st. Such tax returns are subject to examination by the Indian tax authorities for open years as determined by the statute of limitations, which is generally a period of up to 7 years after a tax return is filed.
E Foreign Currency Translation—Investment valuations, other assets, and liabilities initially expressed in foreign currencies are translated each business day into U.S. dollars based upon current exchange rates. Purchases and sales of foreign investment securities and income and expenses denominated in foreign currencies are translated into U.S. dollars based upon currency exchange rates in effect on the respective dates of such transactions. Recognized gains or losses on investment transactions attributable to changes in foreign currency exchange rates are recorded for financial statement purposes as net realized gains and losses on investments. That portion of unrealized gains and losses on investments that results from fluctuations in foreign currency exchange rates is not separately disclosed.
F Use of Estimates—The preparation of the financial statements in conformity with U.S. GAAP requires management to make estimates and assumptions that affect the reported amounts of assets and liabilities at the date of the financial statements and the reported amounts of income and expense during the reporting period. Actual results could differ from those estimates.
G Indemnifications—Under the Portfolio’s organizational documents, its officers and Trustees may be indemnified against certain liabilities and expenses arising out of the performance of their duties to the Portfolio. Under Massachusetts law, if certain conditions prevail, interestholders in the Portfolio could be deemed to have personal liability for the obligations of the Portfolio. However, the Portfolio’s Declaration of Trust contains an express disclaimer of liability on the part of Portfolio interestholders. Additionally, in the normal course of business, the Portfolio enters into agreements with service providers that may contain indemnification clauses. The Portfolio’s maximum exposure under these arrangements is unknown as this would involve future claims that may be made against the Portfolio that have not yet occurred.
H Futures Contracts—Upon entering into a futures contract, the Portfolio is required to deposit with the broker, either in cash or securities, an amount equal to a certain percentage of the contract amount (initial margin). Subsequent payments, known as variation margin, are made or received by the Portfolio each business day, depending on the daily fluctuations in the value of the underlying security or index, and are recorded as unrealized gains or losses by the Portfolio. Gains (losses) are realized upon the expiration or closing of the futures contracts. Should market conditions change unexpectedly, the Portfolio may not achieve the anticipated benefits of the futures contracts and may realize a loss. Futures contracts have minimal counterparty risk as they are exchange traded and the clearinghouse for the exchange is substituted as the counterparty, guaranteeing counterparty performance.
I Segment Reporting—During the year ended December 31, 2024, the Portfolio adopted FASB Accounting Standards Update No. 2023-07, Segment Reporting (Topic 280): Improvements to Reportable Segment Disclosures, (ASU 2023-07), which requires incremental disclosures related to a public entity’s reportable segments. The Portfolio operates as a single reportable segment, an investment company whose investment objective is included in Note 1. In connection with the adoption of ASU 2023-07, the Portfolio’s President has been designated as the Portfolio’s Chief Operating Decision Maker (CODM), who is responsible for assessing the performance of the Portfolio’s single segment and deciding how to allocate the segment’s resources. To perform this function, the CODM reviews the information in the Portfolio’s Financial Statements.
Greater India Portfolio
December 31, 2024
Notes to Financial Statements — continued
2 Investment Adviser Fee and Other Transactions with Affiliates
The investment adviser fee is earned by Boston Management and Research (BMR), an indirect, wholly-owned subsidiary of Morgan Stanley, as compensation for investment advisory services rendered to the Portfolio. The fee is computed at an annual rate as a percentage of average daily net assets as follows and is payable monthly:
| Average Daily Net Assets | Annual Fee Rate |
| Up to $500 million | 0.850% |
| $500 million but less than $1 billion | 0.800% |
| $1 billion but less than $2.5 billion | 0.775% |
| $2.5 billion but less than $5 billion | 0.750% |
| $5 billion and over | 0.730% |
For the year ended December 31, 2024, the investment adviser fee amounted to $2,392,983 or 0.85% of the Portfolio's average daily net assets. Pursuant to an investment sub-advisory agreement, BMR has delegated the investment management of the Portfolio to Goldman Sachs Asset Management, L.P. (GSAM). BMR pays GSAM a portion of its investment adviser fee for sub-advisory services provided to the Portfolio. The Portfolio may invest in a money market fund, the Institutional Class of the Morgan Stanley Institutional Liquidity Funds - Government Portfolio (the “Liquidity Fund”), an open-end management investment company managed by Morgan Stanley Investment Management Inc., a wholly-owned subsidiary of Morgan Stanley. The investment adviser fee paid by the Portfolio is reduced by an amount equal to its pro rata share of the advisory and administration fees paid by the Portfolio due to its investment in the Liquidity Fund. For the year ended December 31, 2024, the investment adviser fee paid was reduced by $13,578 relating to the Portfolio's investment in the Liquidity Fund.
Trustees and officers of the Portfolio who are members of BMR’s organization receive remuneration for their services to the Portfolio out of the investment adviser fee. Trustees of the Portfolio who are not affiliated with the investment adviser may elect to defer receipt of all or a percentage of their annual fees in accordance with the terms of the Trustees Deferred Compensation Plan. Certain officers and Trustees of the Portfolio are officers of BMR.
3 Purchases and Sales of Investments
Purchases and sales of investments, other than short-term obligations, aggregated $88,420,641 and $64,079,261, respectively, for the year ended December 31, 2024.
4 Federal Income Tax Basis of Investments
The cost and unrealized appreciation (depreciation) of investments, including open derivative contracts, of the Portfolio at December 31, 2024, as determined on a federal income tax basis, were as follows:
| Aggregate cost | $203,221,526 |
| Gross unrealized appreciation | $119,962,221 |
| Gross unrealized depreciation | (3,142,196) |
| Net unrealized appreciation | $116,820,025 |
5 Financial Instruments
The Portfolio may trade in financial instruments with off-balance sheet risk in the normal course of its investing activities. These financial instruments may include futures contracts and may involve, to a varying degree, elements of risk in excess of the amounts recognized for financial statement purposes. The notional or contractual amounts of these instruments represent the investment the Portfolio has in particular classes of financial instruments and do not necessarily represent the amounts potentially subject to risk. The measurement of the risks associated with these instruments is meaningful only when all related and offsetting transactions are considered. A summary of obligations under these financial instruments at December 31, 2024 is included in the Portfolio of Investments. At December 31, 2024, the Portfolio had sufficient cash and/or securities to cover commitments under these contracts.
The Portfolio is subject to equity price risk in the normal course of pursuing its investment objective. The Portfolio enters into equity index futures contracts to manage cash flows.
Greater India Portfolio
December 31, 2024
Notes to Financial Statements — continued
The fair value of open derivative instruments (not considered to be hedging instruments for accounting disclosure purposes) and whose primary underlying risk exposure is equity price risk at December 31, 2024 was as follows:
| | Fair Value |
| Derivative | Asset Derivative | Liability Derivative(1) |
| Futures contracts | $ — | $(65,589) |
| (1) | Only the current day's variation margin on open futures contracts is reported within the Statement of Assets and Liabilities as Receivable or Payable for variation margin on open futures contracts, as applicable. |
The effect of derivative instruments (not considered to be hedging instruments for accounting disclosure purposes) on the Statement of Operations and whose primary underlying risk exposure is equity price risk for the year ended December 31, 2024 was as follows:
| Derivative | Realized Gain (Loss)
on Derivatives Recognized
in Income(1) | Change in Unrealized
Appreciation (Depreciation) on
Derivatives Recognized in Income(2) |
| Futures contracts | $434,692 | $(90,864) |
| (1) | Statement of Operations location: Net realized gain (loss): Futures contracts. |
| (2) | Statement of Operations location: Change in unrealized appreciation (depreciation): Futures contracts. |
The average notional cost of futures contracts (long) outstanding during the year ended December 31, 2024, which is indicative of the volume of this derivative type, was approximately $7,767,000.
6 Line of Credit
The Portfolio participates with other portfolios and funds managed by BMR and its affiliates in a $650 million unsecured revolving line of credit agreement with a group of banks, which is in effect through October 21, 2025. Borrowings are made by the Portfolio solely for temporary purposes related to redemptions and other short-term cash needs. Interest is charged to the Portfolio based on its borrowings generally at an amount above either the Secured Overnight Financing Rate (SOFR) or Federal Funds rate. In addition, a fee computed at an annual rate of 0.15% on the daily unused portion of the line of credit is allocated among the participating portfolios and funds at the end of each quarter. In connection with the renewal of the agreement in October 2024, an arrangement fee of $150,000 was incurred that was allocated to the participating portfolios and funds. Because the line of credit is not available exclusively to the Portfolio, it may be unable to borrow some or all of its requested amounts at any particular time. The Portfolio did not have any significant borrowings or allocated fees during the year ended December 31, 2024.
7 Affiliated Investments
At December 31, 2024, the value of the Portfolio's investment in funds that may be deemed to be affiliated was $6,723,781, which represents 2.2% of the Portfolio's net assets. Transactions in such investments by the Portfolio for the year ended December 31, 2024 were as follows:
| Name | Value,
beginning
of period | Purchases | Sales
proceeds | Net realized
gain (loss) | Change in
unrealized
appreciation
(depreciation) | Value, end
of period | Dividend
income | Shares,
end of period |
| Short-Term Investments |
| Liquidity Fund | $5,091,586 | $95,678,692 | $(94,046,497) | $ — | $ — | $6,723,781 | $475,102 | 6,723,781 |
Greater India Portfolio
December 31, 2024
Notes to Financial Statements — continued
8 Fair Value Measurements
Under generally accepted accounting principles for fair value measurements, a three-tier hierarchy to prioritize the assumptions, referred to as inputs, is used in valuation techniques to measure fair value. The three-tier hierarchy of inputs is summarized in the three broad levels listed below.
| • | Level 1 – quoted prices in active markets for identical investments |
| • | Level 2 – other significant observable inputs (including quoted prices for similar investments, interest rates, prepayment speeds, credit risk, etc.) |
| • | Level 3 – significant unobservable inputs (including a fund's own assumptions in determining the fair value of investments) |
In cases where the inputs used to measure fair value fall in different levels of the fair value hierarchy, the level disclosed is determined based on the lowest level input that is significant to the fair value measurement in its entirety. The inputs or methodology used for valuing securities are not necessarily an indication of the risk associated with investing in those securities.
At December 31, 2024, the hierarchy of inputs used in valuing the Portfolio's investments and open derivative instruments, which are carried at fair value, were as follows:
| Asset Description | Level 1 | Level 2 | Level 3 | Total |
| Common Stocks: | | | | |
| Communication Services | $ — | $ 18,894,622 | $ — | $ 18,894,622 |
| Consumer Discretionary | 4,510,517 | 65,610,118 | — | 70,120,635 |
| Consumer Staples | — | 14,500,308 | — | 14,500,308 |
| Energy | — | 7,753,515 | — | 7,753,515 |
| Financials | — | 85,268,894 | — | 85,268,894 |
| Health Care | — | 25,855,566 | — | 25,855,566 |
| Industrials | — | 13,094,477 | — | 13,094,477 |
| Information Technology | 5,008,266 | 36,076,012 | — | 41,084,278 |
| Materials | — | 20,484,671 | — | 20,484,671 |
| Real Estate | — | 5,690,208 | — | 5,690,208 |
| Utilities | 2,937,171 | 7,699,014 | — | 10,636,185 |
| Total Common Stocks | $12,455,954 | $300,927,405* | $ — | $313,383,359 |
| Short-Term Investments | $ 6,723,781 | $ — | $ — | $ 6,723,781 |
| Total Investments | $19,179,735 | $ 300,927,405 | $ — | $320,107,140 |
| Liability Description | | | | |
| Futures Contracts | $ — | $ (65,589) | $ — | $ (65,589) |
| Total | $ — | $ (65,589) | $ — | $ (65,589) |
| * | Includes foreign equity securities whose values were adjusted to reflect market trading of comparable securities or other correlated instruments that occurred after the close of trading in their applicable foreign markets. |
9 Risks and Uncertainties
Risks Associated with Foreign Investments
Foreign investments can be adversely affected by political, economic and market developments abroad, including the imposition of economic and other sanctions by the United States or another country, and by acts of terrorism and war. There may be less publicly available information about foreign issuers because they may not be subject to reporting practices, requirements or regulations comparable to those to which United States companies are subject. Foreign markets may be smaller, less liquid and more volatile than the major markets in the United States. Trading in foreign markets typically involves higher expense than trading in the United States. The Portfolio may have difficulties enforcing its legal or contractual rights in a foreign country. Securities that trade or are denominated in currencies other than the U.S. dollar may be adversely affected by fluctuations in currency exchange rates.
Greater India Portfolio
December 31, 2024
Notes to Financial Statements — continued
Countries within the Indian sub-continent region are considered emerging market countries. The securities markets within the Indian sub-continent are undergoing a period of growth and change, which may result in trading or price volatility and difficulties in the settlement and recording of transactions, and in interpreting and applying relevant laws and regulations. The securities markets in these countries are comparatively underdeveloped and may be concentrated in certain sectors. In addition, governmental actions can have a significant effect on the economic conditions in the India region, which could adversely affect the value and liquidity of investments.
Greater India Portfolio
December 31, 2024
Report of Independent Registered Public Accounting Firm
To the Trustees and Investors of Greater India Portfolio:
Opinion on the Financial Statements and Financial Highlights
We have audited the accompanying statement of assets and liabilities of Greater India Portfolio (the “Portfolio”), including the portfolio of investments, as of December 31, 2024, the related statement of operations for the year then ended, the statements of changes in net assets for each of the two years in the period then ended, the financial highlights for each of the five years in the period then ended, and the related notes. In our opinion, the financial statements and financial highlights present fairly, in all material respects, the financial position of the Portfolio as of December 31, 2024, and the results of its operations for the year then ended, the changes in its net assets for each of the two years in the period then ended, and the financial highlights for each of the five years in the period then ended, in conformity with accounting principles generally accepted in the United States of America.
Basis for Opinion
These financial statements and financial highlights are the responsibility of the Portfolio's management. Our responsibility is to express an opinion on the Portfolio's financial statements and financial highlights based on our audits. We are a public accounting firm registered with the Public Company Accounting Oversight Board (United States) (PCAOB) and are required to be independent with respect to the Portfolio in accordance with the U.S. federal securities laws and the applicable rules and regulations of the Securities and Exchange Commission and the PCAOB.
We conducted our audits in accordance with the standards of the PCAOB. Those standards require that we plan and perform the audit to obtain reasonable assurance about whether the financial statements and financial highlights are free of material misstatement, whether due to error or fraud. The Portfolio is not required to have, nor were we engaged to perform, an audit of its internal control over financial reporting. As part of our audits, we are required to obtain an understanding of internal control over financial reporting but not for the purpose of expressing an opinion on the effectiveness of the Portfolio’s internal control over financial reporting. Accordingly, we express no such opinion.
Our audits included performing procedures to assess the risks of material misstatement of the financial statements and financial highlights, whether due to error or fraud, and performing procedures that respond to those risks. Such procedures included examining, on a test basis, evidence regarding the amounts and disclosures in the financial statements and financial highlights. Our audits also included evaluating the accounting principles used and significant estimates made by management, as well as evaluating the overall presentation of the financial statements and financial highlights. Our procedures included confirmation of securities owned as of December 31, 2024, by correspondence with the custodian and brokers; when replies were not received from brokers, we performed other auditing procedures. We believe that our audits provide a reasonable basis for our opinion.
/s/ Deloitte & Touche LLP
Boston, Massachusetts
February 21, 2025
We have served as the auditor of one or more Eaton Vance investment companies since 1959.
This Page Intentionally Left Blank
This Page Intentionally Left Blank
Eaton Vance
Dividend Builder Fund
Annual Financial Statements and
Additional Information
December 31, 2024
This report must be preceded or accompanied by a current summary prospectus or prospectus. Before investing, investors should consider carefully the investment objective, risks, and charges and expenses of a mutual fund. This and other important information is contained in the prospectus and/or statement of additional information, which can be obtained by calling 1-800-262-1122 or from a financial intermediary. Prospective investors should read the prospectus carefully before investing.
Annual Financial Statements and Additional Information December 31, 2024
Eaton Vance
Dividend Builder Fund
Items 8, 9 and 11 of Form N-CSR are Not Applicable. For Item 10 of Form N-CSR, see Item 7.
Eaton Vance
Dividend Builder Fund
December 31, 2024
| Security | Shares | Value |
| Aerospace & Defense — 1.4% |
| L3Harris Technologies, Inc. | | 58,500 | $ 12,301,380 |
| | | | $ 12,301,380 |
| Banks — 4.9% |
| JPMorgan Chase & Co. | | 113,000 | $ 27,087,230 |
| Truist Financial Corp. | | 386,800 | 16,779,384 |
| | | | $ 43,866,614 |
| Beverages — 1.6% |
| Coca-Cola Co. | | 235,300 | $ 14,649,778 |
| | | | $ 14,649,778 |
| Biotechnology — 3.1% |
| AbbVie, Inc. | | 86,800 | $ 15,424,360 |
| Gilead Sciences, Inc. | | 130,600 | 12,063,522 |
| | | | $ 27,487,882 |
| Building Products — 1.1% |
| Carrier Global Corp. | | 146,400 | $ 9,993,264 |
| | | | $ 9,993,264 |
| Capital Markets — 9.2% |
| Blackrock, Inc. | | 18,200 | $ 18,657,002 |
| Blue Owl Capital, Inc.(1) | | 770,300 | 17,917,178 |
| CME Group, Inc. | | 77,700 | 18,044,271 |
| Intercontinental Exchange, Inc. | | 91,700 | 13,664,217 |
| S&P Global, Inc. | | 28,500 | 14,193,855 |
| | | | $ 82,476,523 |
| Commercial Services & Supplies — 1.1% |
| Waste Management, Inc. | | 49,800 | $ 10,049,142 |
| | | | $ 10,049,142 |
| Consumer Staples Distribution & Retail — 2.2% |
| Walmart, Inc. | | 217,900 | $ 19,687,265 |
| | | | $ 19,687,265 |
| Containers & Packaging — 2.3% |
| International Paper Co.(1) | | 385,500 | $ 20,747,610 |
| | | | $ 20,747,610 |
| Security | Shares | Value |
| Diversified Telecommunication Services — 1.2% |
| TELUS Corp. | | 820,500 | $ 11,124,940 |
| | | | $ 11,124,940 |
| Electric Utilities — 2.0% |
| Xcel Energy, Inc. | | 264,700 | $ 17,872,544 |
| | | | $ 17,872,544 |
| Electrical Equipment — 1.2% |
| AMETEK, Inc. | | 58,900 | $ 10,617,314 |
| | | | $ 10,617,314 |
| Electronic Equipment, Instruments & Components — 2.6% |
| Amphenol Corp., Class A | | 180,600 | $ 12,542,670 |
| CDW Corp. | | 61,100 | 10,633,844 |
| | | | $ 23,176,514 |
| Financial Services — 2.0% |
| Fidelity National Information Services, Inc. | | 215,300 | $ 17,389,781 |
| | | | $ 17,389,781 |
| Food Products — 0.9% |
| Lamb Weston Holdings, Inc.(1) | | 122,800 | $ 8,206,724 |
| | | | $ 8,206,724 |
| Health Care Equipment & Supplies — 2.0% |
| Abbott Laboratories | | 156,900 | $ 17,746,959 |
| | | | $ 17,746,959 |
| Health Care Providers & Services — 2.3% |
| UnitedHealth Group, Inc. | | 40,600 | $ 20,537,916 |
| | | | $ 20,537,916 |
| Hotels, Restaurants & Leisure — 1.4% |
| Booking Holdings, Inc. | | 2,600 | $ 12,917,892 |
| | | | $ 12,917,892 |
| Household Products — 2.3% |
| Procter & Gamble Co. | | 122,200 | $ 20,486,830 |
| | | | $ 20,486,830 |
| Industrial Conglomerates — 2.0% |
| 3M Co. | | 141,000 | $ 18,201,690 |
| | | | $ 18,201,690 |
Eaton Vance
Dividend Builder Fund
December 31, 2024
Portfolio of Investments — continued
| Security | Shares | Value |
| Insurance — 6.3% |
| Allstate Corp. | | 65,400 | $ 12,608,466 |
| American Financial Group, Inc. | | 120,100 | 16,445,293 |
| Arthur J. Gallagher & Co. | | 36,800 | 10,445,680 |
| Fidelity National Financial, Inc. | | 296,800 | 16,662,352 |
| | | | $ 56,161,791 |
| Interactive Media & Services — 1.0% |
| Alphabet, Inc., Class A | | 46,400 | $ 8,783,520 |
| | | | $ 8,783,520 |
| Machinery — 1.4% |
| Parker-Hannifin Corp. | | 19,300 | $ 12,275,379 |
| | | | $ 12,275,379 |
| Media — 2.1% |
| Comcast Corp., Class A | | 330,300 | $ 12,396,159 |
| New York Times Co., Class A | | 126,500 | 6,584,325 |
| | | | $ 18,980,484 |
| Multi-Utilities — 2.0% |
| Sempra | | 206,300 | $ 18,096,636 |
| | | | $ 18,096,636 |
| Oil, Gas & Consumable Fuels — 5.9% |
| Chevron Corp. | | 205,100 | $ 29,706,684 |
| EOG Resources, Inc. | | 190,500 | 23,351,490 |
| | | | $ 53,058,174 |
| Pharmaceuticals — 5.5% |
| Bristol-Myers Squibb Co. | | 359,100 | $ 20,310,696 |
| Eli Lilly & Co. | | 5,900 | 4,554,800 |
| Johnson & Johnson | | 165,600 | 23,949,072 |
| | | | $ 48,814,568 |
| Professional Services — 4.1% |
| Automatic Data Processing, Inc. | | 61,400 | $ 17,973,622 |
| Booz Allen Hamilton Holding Corp. | | 64,700 | 8,326,890 |
| Broadridge Financial Solutions, Inc. | | 45,300 | 10,241,877 |
| | | | $ 36,542,389 |
| Semiconductors & Semiconductor Equipment — 11.3% |
| Analog Devices, Inc. | | 73,500 | $ 15,615,810 |
| Broadcom, Inc. | | 190,100 | 44,072,784 |
| Lam Research Corp. | | 230,000 | 16,612,900 |
| Security | Shares | Value |
| Semiconductors & Semiconductor Equipment (continued) |
| QUALCOMM, Inc. | | 96,100 | $ 14,762,882 |
| Texas Instruments, Inc. | | 54,700 | 10,256,797 |
| | | | $101,321,173 |
| Software — 5.3% |
| Microsoft Corp. | | 89,767 | $ 37,836,790 |
| Oracle Corp. | | 58,600 | 9,765,104 |
| | | | $ 47,601,894 |
| Specialized REITs — 1.9% |
| Lamar Advertising Co., Class A | | 135,700 | $ 16,520,118 |
| | | | $ 16,520,118 |
| Specialty Retail — 2.0% |
| Home Depot, Inc. | | 44,700 | $ 17,387,853 |
| | | | $ 17,387,853 |
| Technology Hardware, Storage & Peripherals — 1.4% |
| Apple, Inc. | | 49,300 | $ 12,345,706 |
| | | | $ 12,345,706 |
| Trading Companies & Distributors — 1.2% |
| Fastenal Co. | | 145,500 | $ 10,462,905 |
| | | | $ 10,462,905 |
| Wireless Telecommunication Services — 0.8% |
| T-Mobile U.S., Inc. | | 32,400 | $ 7,151,652 |
| | | | $ 7,151,652 |
Total Common Stocks
(identified cost $672,660,666) | | | $885,042,804 |
| Short-Term Investments — 1.0% |
| Security | Shares | Value |
| Morgan Stanley Institutional Liquidity Funds - Government Portfolio, Institutional Class, 4.43%(2) | | 8,579,891 | $ 8,579,891 |
Total Short-Term Investments
(identified cost $8,579,891) | | | $ 8,579,891 |
Total Investments — 100.0%
(identified cost $681,240,557) | | | $893,622,695 |
| Other Assets, Less Liabilities — 0.0%(3) | | | $ 120,769 |
| Net Assets — 100.0% | | | $893,743,464 |
Eaton Vance
Dividend Builder Fund
December 31, 2024
Portfolio of Investments — continued
| The percentage shown for each investment category in the Portfolio of Investments is based on net assets. |
| (1) | All or a portion of this security was on loan at December 31, 2024. The aggregate market value of securities on loan at December 31, 2024 was $36,229,728. |
| (2) | May be deemed to be an affiliated investment company (see Note 10). The rate shown is the annualized seven-day yield as of December 31, 2024. |
| (3) | Amount is less than 0.05%. |
| Abbreviations: |
| REITs | – Real Estate Investment Trusts |
Eaton Vance
Dividend Builder Fund
December 31, 2024
Statement of Assets and Liabilities
| | December 31, 2024 |
| Assets | |
| Unaffiliated investments, at value (identified cost $672,660,666) — including $36,229,728 of securities on loan | $885,042,804 |
| Affiliated investments, at value (identified cost $8,579,891) | 8,579,891 |
| Dividends receivable | 1,150,152 |
| Dividends receivable from affiliated investments | 26,318 |
| Receivable for Fund shares sold | 270,210 |
| Securities lending income receivable | 2,612 |
| Tax reclaims receivable | 13,200 |
| Trustees' deferred compensation plan | 223,446 |
| Total assets | $895,308,633 |
| Liabilities | |
| Payable for Fund shares redeemed | $320,299 |
| Payable to affiliates: | |
| Investment adviser fee | 495,328 |
| Distribution and service fees | 158,499 |
| Trustees' fees | 13,570 |
| Trustees' deferred compensation plan | 223,446 |
| Payable for custodian fee | 126,943 |
| Payable for transfer and dividend disbursing agent fees | 102,161 |
| Accrued expenses | 124,923 |
| Total liabilities | $1,565,169 |
| Net Assets | $893,743,464 |
| Sources of Net Assets | |
| Paid-in capital | $673,329,178 |
| Distributable earnings | 220,414,286 |
| Net Assets | $893,743,464 |
| Class A Shares | |
| Net Assets | $673,450,681 |
| Shares Outstanding | 42,509,848 |
Net Asset Value and Redemption Price Per Share
(net assets ÷ shares of beneficial interest outstanding) | $15.84 |
Maximum Offering Price Per Share
(100 ÷ 94.75 of net asset value per share) | $16.72 |
| Class C Shares | |
| Net Assets | $13,711,477 |
| Shares Outstanding | 856,403 |
Net Asset Value and Offering Price Per Share*
(net assets ÷ shares of beneficial interest outstanding) | $16.01 |
| Class I Shares | |
| Net Assets | $206,581,306 |
| Shares Outstanding | 13,057,579 |
Net Asset Value, Offering Price and Redemption Price Per Share
(net assets ÷ shares of beneficial interest outstanding) | $15.82 |
| On sales of $50,000 or more, the offering price of Class A shares is reduced. |
| * | Redemption price per share is equal to the net asset value less any applicable contingent deferred sales charge. |
4
See Notes to Financial Statements.
Eaton Vance
Dividend Builder Fund
December 31, 2024
| | Year Ended |
| | December 31, 2024 |
| Investment Income | |
| Dividend income (net of foreign taxes withheld of $121,196) | $23,043,900 |
| Dividend income from affiliated investments | 213,184 |
| Securities lending income, net | 14,715 |
| Other income | 248,345 |
| Total investment income | $23,520,144 |
| Expenses | |
| Investment adviser fee | $5,683,514 |
| Distribution and service fees: | |
| Class A | 1,687,921 |
| Class C | 150,153 |
| Trustees’ fees and expenses | 53,456 |
| Custodian fee | 217,158 |
| Transfer and dividend disbursing agent fees | 427,062 |
| Legal and accounting services | 91,550 |
| Printing and postage | 50,032 |
| Registration fees | 49,044 |
| Miscellaneous | 38,129 |
| Total expenses | $8,448,019 |
| Deduct: | |
| Waiver and/or reimbursement of expenses by affiliates | $6,139 |
| Total expense reductions | $6,139 |
| Net expenses | $8,441,880 |
| Net investment income | $15,078,264 |
| Realized and Unrealized Gain (Loss) | |
| Net realized gain (loss): | |
| Investment transactions | $56,060,263 |
| Foreign currency transactions | 23,702 |
| Net realized gain | $56,083,965 |
| Change in unrealized appreciation (depreciation): | |
| Investments | $49,032,982 |
| Foreign currency | (6,125) |
| Net change in unrealized appreciation (depreciation) | $49,026,857 |
| Net realized and unrealized gain | $105,110,822 |
| Net increase in net assets from operations | $120,189,086 |
5
See Notes to Financial Statements.
Eaton Vance
Dividend Builder Fund
December 31, 2024
Statements of Changes in Net Assets
| | Year Ended December 31, |
| | 2024 | 2023 |
| Increase (Decrease) in Net Assets | | |
| From operations: | | |
| Net investment income | $15,078,264 | $14,993,172 |
| Net realized gain | 56,083,965 | 18,625,322 |
| Net change in unrealized appreciation (depreciation) | 49,026,857 | 55,705,116 |
| Net increase in net assets from operations | $120,189,086 | $89,323,610 |
| Distributions to shareholders: | | |
| Class A | $(49,127,130) | $(21,380,850) |
| Class C | (916,865) | (422,329) |
| Class I | (15,445,833) | (6,744,252) |
| Total distributions to shareholders | $(65,489,828) | $(28,547,431) |
| Transactions in shares of beneficial interest: | | |
| Class A | $(19,607,175) | $(50,226,438) |
| Class C | (3,301,988) | (5,431,780) |
| Class I | 4,281,533 | (32,041,702) |
| Net decrease in net assets from Fund share transactions | $(18,627,630) | $(87,699,920) |
| Net increase (decrease) in net assets | $36,071,628 | $(26,923,741) |
| Net Assets | | |
| At beginning of year | $857,671,836 | $884,595,577 |
| At end of year | $893,743,464 | $857,671,836 |
6
See Notes to Financial Statements.
Eaton Vance
Dividend Builder Fund
December 31, 2024
| | Class A |
| | Year Ended December 31, |
| | 2024 | 2023 | 2022 | 2021 | 2020 |
| Net asset value — Beginning of year | $14.87 | $13.84 | $19.85 | $17.03 | $15.61 |
| Income (Loss) From Operations | | | | | |
| Net investment income(1) | $0.26 | $0.25 | $0.33 | $0.36 | $0.28 |
| Net realized and unrealized gain (loss) | 1.91 | 1.26 | (2.22) | 3.74 | 1.59 |
| Total income (loss) from operations | $2.17 | $1.51 | $(1.89) | $4.10 | $1.87 |
| Less Distributions | | | | | |
| From net investment income | $(0.27) | $(0.23) | $(0.34) | $(0.34) | $(0.26) |
| From net realized gain | (0.93) | (0.25) | (3.78) | (0.94) | (0.19) |
| Total distributions | $(1.20) | $(0.48) | $(4.12) | $(1.28) | $(0.45) |
| Net asset value — End of year | $15.84 | $14.87 | $13.84 | $19.85 | $17.03 |
| Total Return(2) | 14.51% | 11.16% | (9.75)% | 24.42% | 12.32% |
| Ratios/Supplemental Data | | | | | |
| Net assets, end of year (000’s omitted) | $673,451 | $650,959 | $655,476 | $821,560 | $725,569 |
| Ratios (as a percentage of average daily net assets):(3) | | | | | |
| Total expenses | 0.99% | 1.01% | 1.00% | 0.99% | 1.01% |
| Net expenses | 0.99%(4) | 1.01%(4) | 1.00%(4) | 0.99% | 1.01% |
| Net investment income | 1.65% | 1.74% | 1.85% | 1.89% | 1.83% |
| Portfolio Turnover | 50% | 49% | 57% | 74% | 81% |
| (1) | Computed using average shares outstanding. |
| (2) | Returns are historical and are calculated by determining the percentage change in net asset value with all distributions reinvested and do not reflect the effect of sales charges. |
| (3) | Total expenses do not reflect amounts reimbursed and/or waived by the adviser and certain of its affiliates, if applicable. Net expenses are net of all reductions and represent the net expenses paid by the Fund. |
| (4) | Includes a reduction by the investment adviser of a portion of its adviser fee due to the Fund’s investment in the Liquidity Fund (equal to less than 0.005% of average daily net assets for the years ended December 31, 2024, 2023 and 2022). |
7
See Notes to Financial Statements.
Eaton Vance
Dividend Builder Fund
December 31, 2024
Financial Highlights — continued
| | Class C |
| | Year Ended December 31, |
| | 2024 | 2023 | 2022 | 2021 | 2020 |
| Net asset value — Beginning of year | $15.02 | $13.98 | $19.99 | $17.15 | $15.71 |
| Income (Loss) From Operations | | | | | |
| Net investment income(1) | $0.15 | $0.14 | $0.20 | $0.22 | $0.17 |
| Net realized and unrealized gain (loss) | 1.92 | 1.28 | (2.23) | 3.76 | 1.60 |
| Total income (loss) from operations | $2.07 | $1.42 | $(2.03) | $3.98 | $1.77 |
| Less Distributions | | | | | |
| From net investment income | $(0.15) | $(0.13) | $(0.20) | $(0.20) | $(0.15) |
| From net realized gain | (0.93) | (0.25) | (3.78) | (0.94) | (0.18) |
| Total distributions | $(1.08) | $(0.38) | $(3.98) | $(1.14) | $(0.33) |
| Net asset value — End of year | $16.01 | $15.02 | $13.98 | $19.99 | $17.15 |
| Total Return(2) | 13.67% | 10.28% | (10.37)% | 23.43% | 11.51% |
| Ratios/Supplemental Data | | | | | |
| Net assets, end of year (000’s omitted) | $13,711 | $15,965 | $20,214 | $27,405 | $29,195 |
| Ratios (as a percentage of average daily net assets):(3) | | | | | |
| Total expenses | 1.74% | 1.76% | 1.75% | 1.74% | 1.76% |
| Net expenses | 1.74%(4) | 1.76%(4) | 1.75%(4) | 1.74% | 1.76% |
| Net investment income | 0.90% | 0.98% | 1.10% | 1.15% | 1.10% |
| Portfolio Turnover | 50% | 49% | 57% | 74% | 81% |
| (1) | Computed using average shares outstanding. |
| (2) | Returns are historical and are calculated by determining the percentage change in net asset value with all distributions reinvested and do not reflect the effect of sales charges. |
| (3) | Total expenses do not reflect amounts reimbursed and/or waived by the adviser and certain of its affiliates, if applicable. Net expenses are net of all reductions and represent the net expenses paid by the Fund. |
| (4) | Includes a reduction by the investment adviser of a portion of its adviser fee due to the Fund’s investment in the Liquidity Fund (equal to less than 0.005% of average daily net assets for the years ended December 31, 2024, 2023 and 2022). |
8
See Notes to Financial Statements.
Eaton Vance
Dividend Builder Fund
December 31, 2024
Financial Highlights — continued
| | Class I |
| | Year Ended December 31, |
| | 2024 | 2023 | 2022 | 2021 | 2020 |
| Net asset value — Beginning of year | $14.85 | $13.82 | $19.83 | $17.02 | $15.60 |
| Income (Loss) From Operations | | | | | |
| Net investment income(1) | $0.30 | $0.28 | $0.37 | $0.41 | $0.31 |
| Net realized and unrealized gain (loss) | 1.91 | 1.27 | (2.22) | 3.73 | 1.59 |
| Total income (loss) from operations | $2.21 | $1.55 | $(1.85) | $4.14 | $1.90 |
| Less Distributions | | | | | |
| From net investment income | $(0.31) | $(0.27) | $(0.38) | $(0.39) | $(0.30) |
| From net realized gain | (0.93) | (0.25) | (3.78) | (0.94) | (0.18) |
| Total distributions | $(1.24) | $(0.52) | $(4.16) | $(1.33) | $(0.48) |
| Net asset value — End of year | $15.82 | $14.85 | $13.82 | $19.83 | $17.02 |
| Total Return(2) | 14.82% | 11.46% | (9.54)% | 24.68% | 12.61% |
| Ratios/Supplemental Data | | | | | |
| Net assets, end of year (000’s omitted) | $206,581 | $190,748 | $208,906 | $239,294 | $196,896 |
| Ratios (as a percentage of average daily net assets):(3) | | | | | |
| Total expenses | 0.74% | 0.76% | 0.75% | 0.74% | 0.76% |
| Net expenses | 0.74%(4) | 0.76%(4) | 0.75%(4) | 0.74% | 0.76% |
| Net investment income | 1.91% | 2.00% | 2.11% | 2.14% | 2.08% |
| Portfolio Turnover | 50% | 49% | 57% | 74% | 81% |
| (1) | Computed using average shares outstanding. |
| (2) | Returns are historical and are calculated by determining the percentage change in net asset value with all distributions reinvested. |
| (3) | Total expenses do not reflect amounts reimbursed and/or waived by the adviser and certain of its affiliates, if applicable. Net expenses are net of all reductions and represent the net expenses paid by the Fund. |
| (4) | Includes a reduction by the investment adviser of a portion of its adviser fee due to the Fund’s investment in the Liquidity Fund (equal to less than 0.005% of average daily net assets for the years ended December 31, 2024, 2023 and 2022). |
9
See Notes to Financial Statements.
Eaton Vance
Dividend Builder Fund
December 31, 2024
Notes to Financial Statements
1 Significant Accounting Policies
Eaton Vance Dividend Builder Fund (the Fund) is a diversified series of Eaton Vance Special Investment Trust (the Trust). The Trust is a Massachusetts business trust registered under the Investment Company Act of 1940, as amended (the 1940 Act), as an open-end management investment company. The Fund’s investment objective is to seek total return. The Fund offers three classes of shares. Class A shares are generally sold subject to a sales charge imposed at time of purchase. Class C shares are sold at net asset value and are generally subject to a contingent deferred sales charge (see Note 5). Effective November 5, 2020, Class C shares automatically convert to Class A shares eight years after their purchase as described in the Fund’s prospectus. Class I shares are sold at net asset value and are not subject to a sales charge. Each class represents a pro rata interest in the Fund, but votes separately on class-specific matters and (as noted below) is subject to different expenses. Realized and unrealized gains and losses and net investment income and losses, other than class-specific expenses, are allocated daily to each class of shares based on the relative net assets of each class to the total net assets of the Fund. Each class of shares differs in its distribution plan and certain other class-specific expenses.
The following is a summary of significant accounting policies of the Fund. The policies are in conformity with accounting principles generally accepted in the United States of America (U.S. GAAP). The Fund is an investment company and follows accounting and reporting guidance in the Financial Accounting Standards Board (FASB) Accounting Standards Codification Topic 946.
A Investment Valuation—The following methodologies are used to determine the market value or fair value of investments.
Equity Securities. Equity securities listed on a U.S. securities exchange generally are valued at the last sale or closing price on the day of valuation or, if no sales took place on such date, at the mean between the closing bid and ask prices on the exchange where such securities are principally traded. Equity securities listed on the NASDAQ National Market System are valued at the NASDAQ official closing price. Unlisted or listed securities for which closing sales prices or closing quotations are not available are valued at the mean between the latest available bid and ask prices.
Foreign Securities and Currencies. Foreign securities and currencies are valued in U.S. dollars, based on foreign currency exchange rate quotations supplied by a third party pricing service. The pricing service uses a proprietary model to determine the exchange rate. Inputs to the model include reported trades and implied bid/ask spreads. The daily valuation of exchange-traded foreign securities generally is determined as of the close of trading on the principal exchange on which such securities trade. Events occurring after the close of trading on foreign exchanges may result in adjustments to the valuation of foreign securities to more accurately reflect their fair value as of the close of regular trading on the New York Stock Exchange. When valuing foreign equity securities that meet certain criteria, the Fund's Trustees have approved the use of a fair value service that values such securities to reflect market trading that occurs after the close of the applicable foreign markets of comparable securities or other instruments that have a strong correlation to the fair-valued securities.
Other. Investments in management investment companies (including money market funds) that do not trade on an exchange are valued at the net asset value as of the close of each business day.
Fair Valuation. In connection with Rule 2a-5 of the 1940 Act, the Trustees have designated the Fund’s investment adviser as its valuation designee. Investments for which valuations or market quotations are not readily available or are deemed unreliable are valued by the investment adviser, as valuation designee, at fair value using methods that most fairly reflect the security’s “fair value”, which is the amount that the Fund might reasonably expect to receive for the security upon its current sale in the ordinary course. Each such determination is based on a consideration of relevant factors, which are likely to vary from one pricing context to another. These factors may include, but are not limited to, the type of security, the existence of any contractual restrictions on the security’s disposition, the price and extent of public trading in similar securities of the issuer or of comparable companies or entities, quotations or relevant information obtained from broker/dealers or other market participants, information obtained from the issuer, analysts, and/or the appropriate stock exchange (for exchange-traded securities), an analysis of the company’s or entity’s financial statements, and an evaluation of the forces that influence the issuer and the market(s) in which the security is purchased and sold.
B Investment Transactions—Investment transactions for financial statement purposes are accounted for on a trade date basis. Realized gains and losses on investments sold are determined on the basis of identified cost.
C Income—Dividend income is recorded on the ex-dividend date for dividends received in cash and/or securities. However, if the ex-dividend date has passed, certain dividends from foreign securities are recorded as the Fund is informed of the ex-dividend date. Withholding taxes on foreign dividends and capital gains have been provided for in accordance with the Fund’s understanding of the applicable countries’ tax rules and rates. In consideration of recent decisions rendered by European courts, the Fund has filed additional tax reclaims for previously withheld taxes on dividends earned in certain European Union countries (the “EU reclaims”). These filings are subject to various administrative and judicial proceedings within these countries. Due to the uncertainty as to the ultimate resolution of these proceedings, the likelihood of receipt of these EU reclaims, and the potential timing of payment, the EU reclaims are recorded as income only when the likelihood of their receipt becomes certain. During the year ended December 31, 2024, the Fund received approximately $248,000 from Sweden for EU reclaims and interest thereon. Such amount is included in Other income on the Statement of Operations.
D Federal Taxes—The Fund's policy is to comply with the provisions of the Internal Revenue Code applicable to regulated investment companies and to distribute to shareholders each year substantially all of its net investment income, and all or substantially all of its net realized capital gains. Accordingly, no provision for federal income or excise tax is necessary.
Eaton Vance
Dividend Builder Fund
December 31, 2024
Notes to Financial Statements — continued
As of December 31, 2024, the Fund had no uncertain tax positions that would require financial statement recognition, de-recognition, or disclosure. The Fund files a U.S. federal income tax return annually after its fiscal year-end, which is subject to examination by the Internal Revenue Service for a period of three years from the date of filing.
E Expenses—The majority of expenses of the Trust are directly identifiable to an individual fund. Expenses which are not readily identifiable to a specific fund are allocated taking into consideration, among other things, the nature and type of expense and the relative size of the funds.
F Foreign Currency Translation—Investment valuations, other assets, and liabilities initially expressed in foreign currencies are translated each business day into U.S. dollars based upon current exchange rates. Purchases and sales of foreign investment securities and income and expenses denominated in foreign currencies are translated into U.S. dollars based upon currency exchange rates in effect on the respective dates of such transactions. Recognized gains or losses on investment transactions attributable to changes in foreign currency exchange rates are recorded for financial statement purposes as net realized gains and losses on investments. That portion of unrealized gains and losses on investments that results from fluctuations in foreign currency exchange rates is not separately disclosed.
G Use of Estimates—The preparation of the financial statements in conformity with U.S. GAAP requires management to make estimates and assumptions that affect the reported amounts of assets and liabilities at the date of the financial statements and the reported amounts of income and expense during the reporting period. Actual results could differ from those estimates.
H Indemnifications—Under the Trust’s organizational documents, its officers and Trustees may be indemnified against certain liabilities and expenses arising out of the performance of their duties to the Fund. Under Massachusetts law, if certain conditions prevail, shareholders of a Massachusetts business trust (such as the Trust) could be deemed to have personal liability for the obligations of the Trust. However, the Trust’s Declaration of Trust contains an express disclaimer of liability on the part of Fund shareholders and the By-laws provide that the Trust shall assume, upon request by the shareholder, the defense on behalf of any Trust shareholders. Moreover, the By-laws also provide for indemnification out of Fund property of any shareholder held personally liable solely by reason of being or having been a shareholder for all loss or expense arising from such liability. Additionally, in the normal course of business, the Fund enters into agreements with service providers that may contain indemnification clauses. The Fund’s maximum exposure under these arrangements is unknown as this would involve future claims that may be made against the Fund that have not yet occurred.
I Segment Reporting—During the year ended December 31, 2024, the Fund adopted FASB Accounting Standards Update No. 2023-07, Segment Reporting (Topic 280): Improvements to Reportable Segment Disclosures, (ASU 2023-07), which requires incremental disclosures related to a public entity’s reportable segments. The Fund operates as a single reportable segment, an investment company whose investment objective is included in Note 1. In connection with the adoption of ASU 2023-07, the Fund’s President has been designated as the Fund’s Chief Operating Decision Maker (CODM), who is responsible for assessing the performance of the Fund’s single segment and deciding how to allocate the segment’s resources. To perform this function, the CODM reviews the information in the Fund’s Financial Statements.
2 Distributions to Shareholders and Income Tax Information
It is the present policy of the Fund to make monthly distributions of all or substantially all of its net investment income and to distribute annually all or substantially all of its net realized capital gains. Distributions to shareholders are recorded on the ex-dividend date. Distributions are declared separately for each class of shares. Shareholders may reinvest income and capital gain distributions in additional shares of the same class of the Fund at the net asset value as of the ex-dividend date or, at the election of the shareholder, receive distributions in cash. Distributions to shareholders are determined in accordance with income tax regulations, which may differ from U.S. GAAP. As required by U.S. GAAP, only distributions in excess of tax basis earnings and profits are reported in the financial statements as a return of capital. Permanent differences between book and tax accounting relating to distributions are reclassified to paid-in capital. For tax purposes, distributions from short-term capital gains are considered to be from ordinary income.
The tax character of distributions declared for the years ended December 31, 2024 and December 31, 2023 was as follows:
| | Year Ended December 31, |
| | 2024 | 2023 |
| Ordinary income | $17,086,404 | $27,033,688 |
| Long-term capital gains | $48,403,424 | $1,513,743 |
During the year ended December 31, 2024, distributable earnings was decreased by $1,974,056 and paid-in capital was increased by $1,974,056 due to the Fund's use of equalization accounting. Tax equalization accounting allows the Fund to treat as a distribution that portion of redemption proceeds representing a redeeming shareholder's portion of undistributed taxable income and net capital gains.These reclassifications had no effect on the net assets or net asset value per share of the Fund.
Eaton Vance
Dividend Builder Fund
December 31, 2024
Notes to Financial Statements — continued
As of December 31, 2024, the components of distributable earnings (accumulated loss) on a tax basis were as follows:
| Undistributed ordinary income | $ 23,378 |
| Undistributed long-term capital gains | 8,488,874 |
| Net unrealized appreciation | 211,902,034 |
| Distributable earnings | $220,414,286 |
The cost and unrealized appreciation (depreciation) of investments of the Fund at December 31, 2024, as determined on a federal income tax basis, were as follows:
| Aggregate cost | $681,758,889 |
| Gross unrealized appreciation | $222,842,525 |
| Gross unrealized depreciation | (10,978,719) |
| Net unrealized appreciation | $211,863,806 |
3 Investment Adviser Fee and Other Transactions with Affiliates
The investment adviser fee is earned by Boston Management and Research (BMR), an indirect, wholly-owned subsidiary of Morgan Stanley, as compensation for investment advisory services rendered to the Fund. The fee is computed at an annual rate as a percentage of the Fund’s average daily net assets as follows and is payable monthly.
| Average Daily Net Assets | Annual Fee Rate |
| Up to $500 million | 0.6500% |
| $500 million but less than $1 billion | 0.6250% |
| $1 billion but less than $1.5 billion | 0.6000% |
| $1.5 billion but less than $2 billion | 0.5500% |
| $2 billion but less than $3 billion | 0.5000% |
| $3 billion and over | 0.4375% |
For the year ended December 31, 2024, the investment adviser fee amounted to $5,683,514 or 0.64% of the Fund’s average daily net assets. The Fund may invest in a money market fund, the Institutional Class of the Morgan Stanley Institutional Liquidity Funds - Government Portfolio (the “Liquidity Fund”), an open-end management investment company managed by Morgan Stanley Investment Management Inc., a wholly-owned subsidiary of Morgan Stanley. The investment adviser fee paid by the Fund is reduced by an amount equal to its pro rata share of the advisory and administration fees paid by the Fund due to its investment in the Liquidity Fund. For the year ended December 31, 2024, the investment adviser fee paid was reduced by $6,139 relating to the Fund’s investment in the Liquidity Fund.
Eaton Vance Management (EVM), an affiliate of BMR and an indirect, wholly-owned subsidiary of Morgan Stanley, serves as the administrator of the Fund, but receives no compensation. EVM provides sub-transfer agency and related services to the Fund pursuant to a Sub-Transfer Agency Support Services Agreement. For the year ended December 31, 2024, EVM earned $80,474 from the Fund pursuant to such agreement, which is included in transfer and dividend disbursing agent fees on the Statement of Operations. The Fund was informed that Eaton Vance Distributors, Inc. (EVD), an affiliate of EVM and the Fund’s principal underwriter, received $11,867 as its portion of the sales charge on sales of Class A shares for the year ended December 31, 2024. EVD also received distribution and service fees from Class A and Class C shares (see Note 4) and contingent deferred sales charges (see Note 5).
Trustees and officers of the Fund who are members of EVM’s or BMR’s organizations receive remuneration for their services to the Fund out of the investment adviser fee. Trustees of the Fund who are not affiliated with the investment adviser may elect to defer receipt of all or a percentage of their annual fees in accordance with the terms of the Trustees Deferred Compensation Plan. Certain officers and Trustees of the Fund are officers of the above organizations.
Eaton Vance
Dividend Builder Fund
December 31, 2024
Notes to Financial Statements — continued
4 Distribution Plans
The Fund has in effect a distribution plan for Class A shares (Class A Plan) pursuant to Rule 12b-1 under the 1940 Act. Pursuant to the Class A Plan, the Fund pays EVD a distribution and service fee of 0.25% per annum of its average daily net assets attributable to Class A shares for distribution services and facilities provided to the Fund by EVD, as well as for personal services and/or the maintenance of shareholder accounts. Distribution and service fees paid or accrued to EVD for the year ended December 31, 2024 amounted to $1,687,921 for Class A shares.
The Fund also has in effect a distribution plan for Class C shares (Class C Plan) pursuant to Rule 12b-1 under the 1940 Act. Pursuant to the Class C Plan, the Fund pays EVD amounts equal to 0.75% per annum of its average daily net assets attributable to Class C shares for providing ongoing distribution services and facilities to the Fund. For the year ended December 31, 2024, the Fund paid or accrued to EVD $112,615 for Class C shares.
Pursuant to the Class C Plan, the Fund also makes payments of service fees to EVD, financial intermediaries and other persons in amounts equal to 0.25% per annum of its average daily net assets attributable to that class. Service fees paid or accrued are for personal services and/or the maintenance of shareholder accounts. They are separate and distinct from the sales commissions and distribution fees payable to EVD. Service fees paid or accrued for the year ended December 31, 2024 amounted to $37,538 for Class C shares.
Distribution and service fees are subject to the limitations contained in the Financial Industry Regulatory Authority Rule 2341(d).
5 Contingent Deferred Sales Charges
A contingent deferred sales charge (CDSC) of 1% generally is imposed on redemptions of Class C shares made within 12 months of purchase. Class A shares may be subject to a 1% CDSC if redeemed within 12 months of purchase (depending on the circumstances of purchase). Generally, the CDSC is based upon the lower of the net asset value at date of redemption or date of purchase. No charge is levied on shares acquired by reinvestment of dividends or capital gain distributions. For the year ended December 31, 2024, the Fund was informed that EVD received $3,115 of CDSCs paid by Class C shareholders and no CDSCs paid by Class A shareholders.
6 Purchases and Sales of Investments
Purchases and sales of investments, other than short-term obligations, aggregated $442,808,406 and $510,364,579, respectively, for the year ended December 31, 2024.
7 Shares of Beneficial Interest
The Fund’s Declaration of Trust permits the Trustees to issue an unlimited number of full and fractional shares of beneficial interest (without par value). Such shares may be issued in a number of different series (such as the Fund) and classes. Transactions in Fund shares, including direct exchanges pursuant to share class conversions, were as follows:
| | Year Ended
December 31, 2024 | | Year Ended
December 31, 2023 |
| | Shares | Amount | | Shares | Amount |
| Class A | | | | | |
| Sales | 1,315,415 | $20,999,576 | | 1,180,743 | $16,620,433 |
| Issued to shareholders electing to receive payments of distributions in Fund shares | 2,605,502 | 42,192,703 | | 1,296,568 | 18,294,619 |
| Redemptions | (5,179,405) | (82,799,454) | | (6,066,763) | (85,141,490) |
| Net decrease | (1,258,488) | $(19,607,175) | | (3,589,452) | $(50,226,438) |
| Class C | | | | | |
| Sales | 142,656 | $ 2,300,306 | | 83,540 | $ 1,177,856 |
| Issued to shareholders electing to receive payments of distributions in Fund shares | 52,835 | 866,152 | | 28,216 | 403,013 |
| Redemptions | (401,797) | (6,468,446) | | (495,486) | (7,012,649) |
| Net decrease | (206,306) | $(3,301,988) | | (383,730) | $(5,431,780) |
Eaton Vance
Dividend Builder Fund
December 31, 2024
Notes to Financial Statements — continued
| | Year Ended
December 31, 2024 | | Year Ended
December 31, 2023 |
| | Shares | Amount | | Shares | Amount |
| Class I | | | | | |
| Sales | 1,627,354 | $26,350,578 | | 1,657,338 | $23,181,763 |
| Issued to shareholders electing to receive payments of distributions in Fund shares | 883,188 | 14,278,452 | | 445,880 | 6,277,951 |
| Redemptions | (2,294,366) | (36,347,497) | | (4,372,906) | (61,501,416) |
| Net increase (decrease) | 216,176 | $ 4,281,533 | | (2,269,688) | $(32,041,702) |
8 Line of Credit
The Fund participates with other portfolios and funds managed by BMR and its affiliates in a $650 million unsecured revolving line of credit agreement with a group of banks, which is in effect through October 21, 2025. Borrowings are made by the Fund solely for temporary purposes related to redemptions and other short-term cash needs. Interest is charged to the Fund based on its borrowings generally at an amount above either the Secured Overnight Financing Rate (SOFR) or Federal Funds rate. In addition, a fee computed at an annual rate of 0.15% on the daily unused portion of the line of credit is allocated among the participating portfolios and funds at the end of each quarter. In connection with the renewal of the agreement in October 2024, an arrangement fee of $150,000 was incurred that was allocated to the participating portfolios and funds. Because the line of credit is not available exclusively to the Fund, it may be unable to borrow some or all of its requested amounts at any particular time. The Fund did not have any significant borrowings or allocated fees during the year ended December 31, 2024.
9 Securities Lending Agreement
The Fund has established a securities lending agreement with State Street Bank and Trust Company (SSBT) as securities lending agent in which the Fund lends portfolio securities to qualified borrowers in exchange for collateral consisting of either cash or securities issued or guaranteed by the U.S. government or its agencies or instrumentalities in an amount at least equal to the market value of the securities on loan. The market value of securities loaned is determined daily and any additional required collateral is delivered to the Fund on the next business day. Cash collateral is invested in the State Street Navigator Securities Lending Government Money Market Portfolio, a money market fund registered under the 1940 Act. The Fund earns interest on the amount invested but it must pay (and at times receive from) the broker a loan rebate fee computed as a varying percentage of the collateral received. For security loans secured by non-cash collateral, the Fund earns a negotiated lending fee from the borrower. A portion of the income earned by the Fund from its investment of cash collateral, net of rebate fees, and lending fees received is allocated to SSBT for its services as lending agent and the portion allocated to the Fund is presented as securities lending income, net on the Statement of Operations. Non-cash collateral is held by the lending agent on behalf of the Fund and cannot be sold or re-pledged by the Fund; accordingly, such collateral is not reflected in the Statement of Assets and Liabilities.
The Fund is subject to possible delay in the recovery of loaned securities. Pursuant to the securities lending agreement, SSBT has provided indemnification to the Fund in the event of default by a borrower with respect to a loan. The Fund bears the risk of loss with respect to the investment of cash collateral.
At December 31, 2024, the value of the securities loaned and the value of the collateral received amounted to $36,229,728 and $37,019,104, respectively. Collateral received was comprised of U.S. Government and/or agencies securities. The securities lending transactions have no contractual maturity date and each of the Fund and borrower has the option to terminate a loan at any time.
10 Affiliated Investments
At December 31, 2024, the value of the Fund's investment in funds that may be deemed to be affiliated was $8,579,891, which represents 1.0% of the Fund's net assets. Transactions in such investments by the Fund for the year ended December 31, 2024 were as follows:
| Name | Value,
beginning
of period | Purchases | Sales
proceeds | Net realized
gain (loss) | Change in
unrealized
appreciation
(depreciation) | Value, end
of period | Dividend
income | Shares,
end of period |
| Short-Term Investments |
| Liquidity Fund | $9,065,154 | $115,865,039 | $(116,350,302) | $ — | $ — | $8,579,891 | $213,184 | 8,579,891 |
Eaton Vance
Dividend Builder Fund
December 31, 2024
Notes to Financial Statements — continued
11 Fair Value Measurements
Under generally accepted accounting principles for fair value measurements, a three-tier hierarchy to prioritize the assumptions, referred to as inputs, is used in valuation techniques to measure fair value. The three-tier hierarchy of inputs is summarized in the three broad levels listed below.
| • | Level 1 – quoted prices in active markets for identical investments |
| • | Level 2 – other significant observable inputs (including quoted prices for similar investments, interest rates, prepayment speeds, credit risk, etc.) |
| • | Level 3 – significant unobservable inputs (including a fund's own assumptions in determining the fair value of investments) |
In cases where the inputs used to measure fair value fall in different levels of the fair value hierarchy, the level disclosed is determined based on the lowest level input that is significant to the fair value measurement in its entirety. The inputs or methodology used for valuing securities are not necessarily an indication of the risk associated with investing in those securities.
At December 31, 2024, the hierarchy of inputs used in valuing the Fund's investments, which are carried at fair value, were as follows:
| Asset Description | Level 1 | Level 2 | Level 3 | Total |
| Common Stocks | $885,042,804* | $ — | $ — | $885,042,804 |
| Short-Term Investments | 8,579,891 | — | — | 8,579,891 |
| Total Investments | $ 893,622,695 | $ — | $ — | $893,622,695 |
| * | The level classification by major category of investments is the same as the category presentation in the Portfolio of Investments. |
Eaton Vance
Dividend Builder Fund
December 31, 2024
Report of Independent Registered Public Accounting Firm
To the Trustees of Eaton Vance Special Investment Trust and Shareholders of Eaton Vance Dividend Builder Fund:
Opinion on the Financial Statements and Financial Highlights
We have audited the accompanying statement of assets and liabilities of Eaton Vance Dividend Builder Fund (the “Fund”) (one of the funds constituting Eaton Vance Special Investment Trust), including the portfolio of investments, as of December 31, 2024, the related statement of operations for the year then ended, the statements of changes in net assets for each of the two years in the period then ended, the financial highlights for each of the five years in the period then ended, and the related notes. In our opinion, the financial statements and financial highlights present fairly, in all material respects, the financial position of the Fund as of December 31, 2024, and the results of its operations for the year then ended, the changes in its net assets for each of the two years in the period then ended, and the financial highlights for each of the five years in the period then ended, in conformity with accounting principles generally accepted in the United States of America.
Basis for Opinion
These financial statements and financial highlights are the responsibility of the Fund's management. Our responsibility is to express an opinion on the Fund's financial statements and financial highlights based on our audits. We are a public accounting firm registered with the Public Company Accounting Oversight Board (United States) (PCAOB) and are required to be independent with respect to the Fund in accordance with the U.S. federal securities laws and the applicable rules and regulations of the Securities and Exchange Commission and the PCAOB.
We conducted our audits in accordance with the standards of the PCAOB. Those standards require that we plan and perform the audit to obtain reasonable assurance about whether the financial statements and financial highlights are free of material misstatement, whether due to error or fraud. The Fund is not required to have, nor were we engaged to perform, an audit of its internal control over financial reporting. As part of our audits, we are required to obtain an understanding of internal control over financial reporting but not for the purpose of expressing an opinion on the effectiveness of the Fund’s internal control over financial reporting. Accordingly, we express no such opinion.
Our audits included performing procedures to assess the risks of material misstatement of the financial statements and financial highlights, whether due to error or fraud, and performing procedures that respond to those risks. Such procedures included examining, on a test basis, evidence regarding the amounts and disclosures in the financial statements and financial highlights. Our audits also included evaluating the accounting principles used and significant estimates made by management, as well as evaluating the overall presentation of the financial statements and financial highlights. Our procedures included confirmation of securities owned as of December 31, 2024, by correspondence with the custodian and brokers; when replies were not received from brokers, we performed other auditing procedures. We believe that our audits provide a reasonable basis for our opinion.
/s/ Deloitte & Touche LLP
Boston, Massachusetts
February 21, 2025
We have served as the auditor of one or more Eaton Vance investment companies since 1959.
Eaton Vance
Dividend Builder Fund
December 31, 2024
Federal Tax Information (Unaudited)
The Form 1099-DIV you received in February 2025 showed the tax status of all distributions paid to your account in calendar year 2024. Shareholders are advised to consult their own tax adviser with respect to the tax consequences of their investment in the Fund. As required by the Internal Revenue Code and/or regulations, shareholders must be notified regarding the status of qualified dividend income for individuals, the dividends received deduction for corporations and capital gains dividends.
Qualified Dividend Income. For the fiscal year ended December 31, 2024, the Fund designates approximately $21,503,870, or up to the maximum amount of such dividends allowable pursuant to the Internal Revenue Code, as qualified dividend income eligible for the reduced tax rate of 15%.
Dividends Received Deduction. Corporate shareholders are generally entitled to take the dividends received deduction on the portion of the Fund’s dividend distribution that qualifies under tax law. For the Fund’s fiscal 2024 ordinary income dividends, 100% qualifies for the corporate dividends received deduction.
Capital Gains Dividends. The Fund hereby designates as a capital gain dividend with respect to the taxable year ended December 31, 2024, $56,000,155 or, if subsequently determined to be different, the net capital gain of such year.
This Page Intentionally Left Blank
This Page Intentionally Left Blank
This Page Intentionally Left Blank
Eaton Vance
Growth Fund
Annual Financial Statements and
Additional Information
December 31, 2024
This report must be preceded or accompanied by a current summary prospectus or prospectus. Before investing, investors should consider carefully the investment objective, risks, and charges and expenses of a mutual fund. This and other important information is contained in the prospectus and/or statement of additional information, which can be obtained by calling 1-800-262-1122 or from a financial intermediary. Prospective investors should read the prospectus carefully before investing.
Annual Financial Statements and Additional Information December 31, 2024
Eaton Vance
Growth Fund
Items 8, 9 and 11 of Form N-CSR are Not Applicable. For Item 10 of Form N-CSR, see Item 7.
Eaton Vance
Growth Fund
December 31, 2024
| Security | Shares | Value |
| Aerospace & Defense — 0.9% |
| HEICO Corp. | | 15,666 | $ 3,724,435 |
| | | | $ 3,724,435 |
| Automobiles — 1.2% |
| Tesla, Inc.(1) | | 12,740 | $ 5,144,922 |
| | | | $ 5,144,922 |
| Beverages — 0.7% |
| Coca-Cola Co. | | 46,964 | $ 2,923,979 |
| | | | $ 2,923,979 |
| Broadline Retail — 8.7% |
| Amazon.com, Inc.(1) | | 170,736 | $ 37,457,771 |
| | | | $ 37,457,771 |
| Building Products — 1.0% |
| Trane Technologies PLC | | 12,064 | $ 4,455,838 |
| | | | $ 4,455,838 |
| Capital Markets — 2.9% |
| Blue Owl Capital, Inc.(2) | | 103,586 | $ 2,409,410 |
| Intercontinental Exchange, Inc. | | 13,566 | 2,021,470 |
| S&P Global, Inc. | | 7,045 | 3,508,621 |
| Tradeweb Markets, Inc., Class A | | 36,438 | 4,770,463 |
| | | | $ 12,709,964 |
| Commercial Services & Supplies — 1.9% |
| Copart, Inc.(1) | | 69,171 | $ 3,969,723 |
| Waste Connections, Inc. | | 25,403 | 4,358,647 |
| | | | $ 8,328,370 |
| Communications Equipment — 1.1% |
| Arista Networks, Inc.(1) | | 42,849 | $ 4,736,100 |
| | | | $ 4,736,100 |
| Consumer Staples Distribution & Retail — 3.6% |
| BJ's Wholesale Club Holdings, Inc.(1) | | 50,370 | $ 4,500,560 |
| Costco Wholesale Corp. | | 7,446 | 6,822,546 |
| Walmart, Inc. | | 45,505 | 4,111,377 |
| | | | $ 15,434,483 |
| Security | Shares | Value |
| Electrical Equipment — 1.2% |
| AMETEK, Inc. | | 28,153 | $ 5,074,860 |
| | | | $ 5,074,860 |
| Entertainment — 2.3% |
| Netflix, Inc.(1) | | 10,982 | $ 9,788,476 |
| | | | $ 9,788,476 |
| Financial Services — 3.0% |
| Shift4 Payments, Inc., Class A(1)(2) | | 53,212 | $ 5,522,341 |
| Visa, Inc., Class A | | 24,125 | 7,624,465 |
| | | | $ 13,146,806 |
| Ground Transportation — 0.8% |
| Uber Technologies, Inc.(1) | | 60,037 | $ 3,621,432 |
| | | | $ 3,621,432 |
| Health Care Equipment & Supplies — 1.9% |
| Edwards Lifesciences Corp.(1) | | 39,889 | $ 2,952,983 |
| Intuitive Surgical, Inc.(1) | | 9,986 | 5,212,292 |
| | | | $ 8,165,275 |
| Insurance — 0.6% |
| Arthur J. Gallagher & Co. | | 8,566 | $ 2,431,459 |
| | | | $ 2,431,459 |
| Interactive Media & Services — 11.8% |
| Alphabet, Inc., Class A | | 127,389 | $ 24,114,738 |
| Alphabet, Inc., Class C | | 59,875 | 11,402,595 |
| Meta Platforms, Inc., Class A | | 26,135 | 15,302,304 |
| | | | $ 50,819,637 |
| IT Services — 0.8% |
| Gartner, Inc.(1) | | 7,659 | $ 3,710,556 |
| | | | $ 3,710,556 |
| Life Sciences Tools & Services — 0.8% |
| Thermo Fisher Scientific, Inc. | | 6,862 | $ 3,569,818 |
| | | | $ 3,569,818 |
| Pharmaceuticals — 2.6% |
| Eli Lilly & Co. | | 14,557 | $ 11,238,004 |
| | | | $ 11,238,004 |
1
See Notes to Financial Statements.
Eaton Vance
Growth Fund
December 31, 2024
Portfolio of Investments — continued
| Security | Shares | Value |
| Professional Services — 1.0% |
| TransUnion | | 44,989 | $ 4,170,930 |
| | | | $ 4,170,930 |
| Real Estate Management & Development — 1.5% |
| CoStar Group, Inc.(1) | | 33,648 | $ 2,408,860 |
| FirstService Corp. | | 22,419 | 4,058,288 |
| | | | $ 6,467,148 |
| Semiconductors & Semiconductor Equipment — 19.2% |
| Analog Devices, Inc. | | 12,744 | $ 2,707,590 |
| Broadcom, Inc. | | 79,231 | 18,368,915 |
| Lam Research Corp. | | 101,734 | 7,348,247 |
| NVIDIA Corp. | | 407,349 | 54,702,897 |
| | | | $ 83,127,649 |
| Software — 18.1% |
| Adobe, Inc.(1) | | 15,137 | $ 6,731,121 |
| Constellation Software, Inc. | | 1,040 | 3,215,908 |
| Fair Isaac Corp.(1) | | 1,943 | 3,868,377 |
| Fortinet, Inc.(1) | | 43,939 | 4,151,357 |
| Intuit, Inc. | | 16,183 | 10,171,015 |
| Microsoft Corp. | | 92,656 | 39,054,504 |
| Nutanix, Inc., Class A(1) | | 51,859 | 3,172,734 |
| Salesforce, Inc. | | 23,318 | 7,795,907 |
| | | | $ 78,160,923 |
| Specialty Retail — 3.6% |
| Burlington Stores, Inc.(1) | | 9,746 | $ 2,778,195 |
| Home Depot, Inc. | | 7,352 | 2,859,854 |
| TJX Cos., Inc. | | 81,554 | 9,852,539 |
| | | | $ 15,490,588 |
| Technology Hardware, Storage & Peripherals — 8.1% |
| Apple, Inc. | | 140,574 | $ 35,202,541 |
| | | | $ 35,202,541 |
Total Common Stocks
(identified cost $146,023,823) | | | $429,101,964 |
| Short-Term Investments — 0.8% |
| Security | Shares | Value |
| Morgan Stanley Institutional Liquidity Funds - Government Portfolio, Institutional Class, 4.43%(3) | | 3,288,104 | $ 3,288,104 |
Total Short-Term Investments
(identified cost $3,288,104) | | | $ 3,288,104 |
Total Investments — 100.1%
(identified cost $149,311,927) | | | $432,390,068 |
| Other Assets, Less Liabilities — (0.1)% | | | $ (478,011) |
| Net Assets — 100.0% | | | $431,912,057 |
| The percentage shown for each investment category in the Portfolio of Investments is based on net assets. |
| (1) | Non-income producing security. |
| (2) | All or a portion of this security was on loan at December 31, 2024. The aggregate market value of securities on loan at December 31, 2024 was $859,847. |
| (3) | May be deemed to be an affiliated investment company (see Note 10). The rate shown is the annualized seven-day yield as of December 31, 2024. |
2
See Notes to Financial Statements.
Eaton Vance
Growth Fund
December 31, 2024
Statement of Assets and Liabilities
| | December 31, 2024 |
| Assets | |
| Unaffiliated investments, at value (identified cost $146,023,823) — including $859,847 of securities on loan | $429,101,964 |
| Affiliated investments, at value (identified cost $3,288,104) | 3,288,104 |
| Cash | 10,228 |
| Foreign currency, at value (identified cost $1,374) | 1,380 |
| Interest and dividends receivable | 55,552 |
| Dividends receivable from affiliated investments | 7,907 |
| Receivable for Fund shares sold | 41,315 |
| Securities lending income receivable | 341 |
| Tax reclaims receivable | 22,149 |
| Trustees' deferred compensation plan | 86,956 |
| Total assets | $432,615,896 |
| Liabilities | |
| Payable for Fund shares redeemed | $81,784 |
| Payable to affiliates: | |
| Investment adviser fee | 242,070 |
| Distribution and service fees | 80,600 |
| Trustees' fees | 6,715 |
| Trustees' deferred compensation plan | 86,956 |
| Payable for custodian fee | 59,774 |
| Payable for transfer and dividend disbursing agent fees | 70,966 |
| Payable for legal and accounting services | 49,480 |
| Accrued expenses | 25,494 |
| Total liabilities | $703,839 |
| Net Assets | $431,912,057 |
| Sources of Net Assets | |
| Paid-in capital | $140,929,055 |
| Distributable earnings | 290,983,002 |
| Net Assets | $431,912,057 |
| Class A Shares | |
| Net Assets | $333,367,778 |
| Shares Outstanding | 8,065,932 |
Net Asset Value and Redemption Price Per Share
(net assets ÷ shares of beneficial interest outstanding) | $41.33 |
Maximum Offering Price Per Share
(100 ÷ 94.75 of net asset value per share) | $43.62 |
| Class C Shares | |
| Net Assets | $6,705,890 |
| Shares Outstanding | 234,869 |
Net Asset Value and Offering Price Per Share*
(net assets ÷ shares of beneficial interest outstanding) | $28.55 |
| Class I Shares | |
| Net Assets | $85,894,133 |
| Shares Outstanding | 1,940,064 |
Net Asset Value, Offering Price and Redemption Price Per Share
(net assets ÷ shares of beneficial interest outstanding) | $44.27 |
3
See Notes to Financial Statements.
Eaton Vance
Growth Fund
December 31, 2024
Statement of Assets and Liabilities — continued
| | December 31, 2024 |
| Class R Shares | |
| Net Assets | $5,944,256 |
| Shares Outstanding | 153,113 |
Net Asset Value, Offering Price and Redemption Price Per Share
(net assets ÷ shares of beneficial interest outstanding) | $38.82 |
| On sales of $50,000 or more, the offering price of Class A shares is reduced. |
| * | Redemption price per share is equal to the net asset value less any applicable contingent deferred sales charge. |
4
See Notes to Financial Statements.
Eaton Vance
Growth Fund
December 31, 2024
| | Year Ended |
| | December 31, 2024 |
| Investment Income | |
| Dividend income (net of foreign taxes withheld of $17,207) | $2,180,259 |
| Dividend income from affiliated investments | 141,472 |
| Securities lending income, net | 4,796 |
| Total investment income | $2,326,527 |
| Expenses | |
| Investment adviser fee | $2,659,909 |
| Distribution and service fees: | |
| Class A | 780,491 |
| Class C | 75,088 |
| Class R | 13,826 |
| Trustees’ fees and expenses | 26,386 |
| Custodian fee | 97,996 |
| Transfer and dividend disbursing agent fees | 263,762 |
| Legal and accounting services | 62,732 |
| Printing and postage | 25,682 |
| Registration fees | 65,922 |
| Miscellaneous | 28,231 |
| Total expenses | $4,100,025 |
| Deduct: | |
| Waiver and/or reimbursement of expenses by affiliates | $4,041 |
| Total expense reductions | $4,041 |
| Net expenses | $4,095,984 |
| Net investment loss | $(1,769,457) |
| Realized and Unrealized Gain (Loss) | |
| Net realized gain (loss): | |
| Investment transactions | $38,237,689 |
| Foreign currency transactions | (391) |
| Net realized gain | $38,237,298 |
| Change in unrealized appreciation (depreciation): | |
| Investments | $77,289,623 |
| Foreign currency | 6 |
| Net change in unrealized appreciation (depreciation) | $77,289,629 |
| Net realized and unrealized gain | $115,526,927 |
| Net increase in net assets from operations | $113,757,470 |
5
See Notes to Financial Statements.
Eaton Vance
Growth Fund
December 31, 2024
Statements of Changes in Net Assets
| | Year Ended December 31, |
| | 2024 | 2023 |
| Increase (Decrease) in Net Assets | | |
| From operations: | | |
| Net investment loss | $(1,769,457) | $(702,397) |
| Net realized gain | 38,237,298 | 32,169,949 |
| Net change in unrealized appreciation (depreciation) | 77,289,629 | 73,009,310 |
| Net increase in net assets from operations | $113,757,470 | $104,476,862 |
| Distributions to shareholders: | | |
| Class A | $(22,149,175) | $(23,304,467) |
| Class C | (717,129) | (907,846) |
| Class I | (5,409,949) | (6,184,142) |
| Class R | (411,603) | (179,733) |
| Total distributions to shareholders | $(28,687,856) | $(30,576,188) |
| Transactions in shares of beneficial interest: | | |
| Class A | $(4,500,132) | $3,929,500 |
| Class C | (2,294,711) | (1,288,903) |
| Class I | (11,252,233) | 4,513,324 |
| Class R | 3,608,409 | (609,031) |
| Net increase (decrease) in net assets from Fund share transactions | $(14,438,667) | $6,544,890 |
| Net increase in net assets | $70,630,947 | $80,445,564 |
| Net Assets | | |
| At beginning of year | $361,281,110 | $280,835,546 |
| At end of year | $431,912,057 | $361,281,110 |
6
See Notes to Financial Statements.
Eaton Vance
Growth Fund
December 31, 2024
| | Class A |
| | Year Ended December 31, |
| | 2024 | 2023 | 2022 | 2021 | 2020 |
| Net asset value — Beginning of year | $33.35 | $26.40 | $39.59 | $35.93 | $28.13 |
| Income (Loss) From Operations | | | | | |
| Net investment loss(1) | $(0.19) | $(0.08) | $(0.02) | $(0.12) | $(0.10) |
| Net realized and unrealized gain (loss) | 11.08 | 10.08 | (11.65) | 7.14 | 10.41 |
| Total income (loss) from operations | $10.89 | $10.00 | $(11.67) | $7.02 | $10.31 |
| Less Distributions | | | | | |
| From net realized gain | $(2.91) | $(3.05) | $(1.52) | $(3.36) | $(2.51) |
| Total distributions | $(2.91) | $(3.05) | $(1.52) | $(3.36) | $(2.51) |
| Net asset value — End of year | $41.33 | $33.35 | $26.40 | $39.59 | $35.93 |
| Total Return(2) | 32.46% | 38.30% | (29.63)% | 19.62% | 37.16% |
| Ratios/Supplemental Data | | | | | |
| Net assets, end of year (000’s omitted) | $333,368 | $273,827 | $213,878 | $330,230 | $299,834 |
| Ratios (as a percentage of average daily net assets):(3) | | | | | |
| Total expenses | 1.04% | 1.07% | 1.08% | 1.05% | 1.09% |
| Net expenses | 1.04%(4) | 1.05%(4) | 1.05%(4) | 1.05% | 1.05% |
| Net investment loss | (0.47)% | (0.25)% | (0.08)% | (0.30)% | (0.32)% |
| Portfolio Turnover | 18% | 28% | 12% | 21% | 37% |
| (1) | Computed using average shares outstanding. |
| (2) | Returns are historical and are calculated by determining the percentage change in net asset value with all distributions reinvested and do not reflect the effect of sales charges. |
| (3) | Total expenses do not reflect amounts reimbursed and/or waived by the adviser and certain of its affiliates, if applicable. Net expenses are net of all reductions and represent the net expenses paid by the Fund. |
| (4) | Includes a reduction by the investment adviser of a portion of its adviser fee due to the Fund’s investment in the Liquidity Fund (equal to less than 0.005% of average daily net assets for the years ended December 31, 2024, 2023 and 2022). |
7
See Notes to Financial Statements.
Eaton Vance
Growth Fund
December 31, 2024
Financial Highlights — continued
| | Class C |
| | Year Ended December 31, |
| | 2024 | 2023 | 2022 | 2021 | 2020 |
| Net asset value — Beginning of year | $23.88 | $19.70 | $30.29 | $28.37 | $22.79 |
| Income (Loss) From Operations | | | | | |
| Net investment loss(1) | $(0.34) | $(0.23) | $(0.20) | $(0.33) | $(0.26) |
| Net realized and unrealized gain (loss) | 7.92 | 7.46 | (8.87) | 5.61 | 8.35 |
| Total income (loss) from operations | $7.58 | $7.23 | $(9.07) | $5.28 | $8.09 |
| Less Distributions | | | | | |
| From net realized gain | $(2.91) | $(3.05) | $(1.52) | $(3.36) | $(2.51) |
| Total distributions | $(2.91) | $(3.05) | $(1.52) | $(3.36) | $(2.51) |
| Net asset value — End of year | $28.55 | $23.88 | $19.70 | $30.29 | $28.37 |
| Total Return(2) | 31.46% | 37.26% | (30.15)% | 18.70% | 36.17% |
| Ratios/Supplemental Data | | | | | |
| Net assets, end of year (000’s omitted) | $6,706 | $7,643 | $7,354 | $14,409 | $16,026 |
| Ratios (as a percentage of average daily net assets):(3) | | | | | |
| Total expenses | 1.79% | 1.82% | 1.83% | 1.80% | 1.84% |
| Net expenses | 1.79%(4) | 1.80%(4) | 1.80%(4) | 1.80% | 1.80% |
| Net investment loss | (1.22)% | (1.00)% | (0.83)% | (1.05)% | (1.06)% |
| Portfolio Turnover | 18% | 28% | 12% | 21% | 37% |
| (1) | Computed using average shares outstanding. |
| (2) | Returns are historical and are calculated by determining the percentage change in net asset value with all distributions reinvested and do not reflect the effect of sales charges. |
| (3) | Total expenses do not reflect amounts reimbursed and/or waived by the adviser and certain of its affiliates, if applicable. Net expenses are net of all reductions and represent the net expenses paid by the Fund. |
| (4) | Includes a reduction by the investment adviser of a portion of its adviser fee due to the Fund’s investment in the Liquidity Fund (equal to less than 0.005% of average daily net assets for the years ended December 31, 2024, 2023 and 2022). |
8
See Notes to Financial Statements.
Eaton Vance
Growth Fund
December 31, 2024
Financial Highlights — continued
| | Class I |
| | Year Ended December 31, |
| | 2024 | 2023 | 2022 | 2021 | 2020 |
| Net asset value — Beginning of year | $35.49 | $27.87 | $41.58 | $37.50 | $29.20 |
| Income (Loss) From Operations | | | | | |
| Net investment income (loss)(1) | $(0.09) | $0.00(2) | $0.06 | $(0.02) | $(0.02) |
| Net realized and unrealized gain (loss) | 11.78 | 10.67 | (12.25) | 7.46 | 10.83 |
| Total income (loss) from operations | $11.69 | $10.67 | $(12.19) | $7.44 | $10.81 |
| Less Distributions | | | | | |
| From net realized gain | $(2.91) | $(3.05) | $(1.52) | $(3.36) | $(2.51) |
| Total distributions | $(2.91) | $(3.05) | $(1.52) | $(3.36) | $(2.51) |
| Net asset value — End of year | $44.27 | $35.49 | $27.87 | $41.58 | $37.50 |
| Total Return(3) | 32.76% | 38.69% | (29.47)% | 19.92% | 37.51% |
| Ratios/Supplemental Data | | | | | |
| Net assets, end of year (000’s omitted) | $85,894 | $77,753 | $57,481 | $100,423 | $82,887 |
| Ratios (as a percentage of average daily net assets):(4) | | | | | |
| Total expenses | 0.79% | 0.82% | 0.83% | 0.80% | 0.84% |
| Net expenses | 0.79%(5) | 0.80%(5) | 0.80%(5) | 0.80% | 0.80% |
| Net investment income (loss) | (0.22)% | 0.01% | 0.17% | (0.05)% | (0.07)% |
| Portfolio Turnover | 18% | 28% | 12% | 21% | 37% |
| (1) | Computed using average shares outstanding. |
| (2) | Amount is less than $0.005. |
| (3) | Returns are historical and are calculated by determining the percentage change in net asset value with all distributions reinvested. |
| (4) | Total expenses do not reflect amounts reimbursed and/or waived by the adviser and certain of its affiliates, if applicable. Net expenses are net of all reductions and represent the net expenses paid by the Fund. |
| (5) | Includes a reduction by the investment adviser of a portion of its adviser fee due to the Fund’s investment in the Liquidity Fund (equal to less than 0.005% of average daily net assets for the years ended December 31, 2024, 2023 and 2022). |
9
See Notes to Financial Statements.
Eaton Vance
Growth Fund
December 31, 2024
Financial Highlights — continued
| | Class R |
| | Year Ended December 31, |
| | 2024 | 2023 | 2022 | 2021 | 2020 |
| Net asset value — Beginning of year | $31.54 | $25.14 | $37.90 | $34.61 | $27.23 |
| Income (Loss) From Operations | | | | | |
| Net investment loss(1) | $(0.26) | $(0.15) | $(0.10) | $(0.21) | $(0.17) |
| Net realized and unrealized gain (loss) | 10.45 | 9.60 | (11.14) | 6.86 | 10.06 |
| Total income (loss) from operations | $10.19 | $9.45 | $(11.24) | $6.65 | $9.89 |
| Less Distributions | | | | | |
| From net realized gain | $(2.91) | $(3.05) | $(1.52) | $(3.36) | $(2.51) |
| Total distributions | $(2.91) | $(3.05) | $(1.52) | $(3.36) | $(2.51) |
| Net asset value — End of year | $38.82 | $31.54 | $25.14 | $37.90 | $34.61 |
| Total Return(2) | 32.10% | 38.03% | (29.82)% | 19.29% | 36.84% |
| Ratios/Supplemental Data | | | | | |
| Net assets, end of year (000’s omitted) | $5,944 | $2,057 | $2,123 | $3,020 | $2,501 |
| Ratios (as a percentage of average daily net assets):(3) | | | | | |
| Total expenses | 1.28% | 1.32% | 1.33% | 1.30% | 1.34% |
| Net expenses | 1.28%(4) | 1.30%(4) | 1.30%(4) | 1.30% | 1.30% |
| Net investment loss | (0.70)% | (0.50)% | (0.33)% | (0.56)% | (0.56)% |
| Portfolio Turnover | 18% | 28% | 12% | 21% | 37% |
| (1) | Computed using average shares outstanding. |
| (2) | Returns are historical and are calculated by determining the percentage change in net asset value with all distributions reinvested. |
| (3) | Total expenses do not reflect amounts reimbursed and/or waived by the adviser and certain of its affiliates, if applicable. Net expenses are net of all reductions and represent the net expenses paid by the Fund. |
| (4) | Includes a reduction by the investment adviser of a portion of its adviser fee due to the Fund’s investment in the Liquidity Fund (equal to less than 0.005% of average daily net assets for the years ended December 31, 2024, 2023 and 2022). |
10
See Notes to Financial Statements.
Eaton Vance
Growth Fund
December 31, 2024
Notes to Financial Statements
1 Significant Accounting Policies
Eaton Vance Growth Fund (the Fund) is a non-diversified series of Eaton Vance Special Investment Trust (the Trust). The Trust is a Massachusetts business trust registered under the Investment Company Act of 1940, as amended (the 1940 Act), as an open-end management investment company. The Fund’s investment objective is to seek total return. The Fund offers four classes of shares. Class A shares are generally sold subject to a sales charge imposed at time of purchase. Class C shares are sold at net asset value and are generally subject to a contingent deferred sales charge (see Note 5). Effective November 5, 2020, Class C shares automatically convert to Class A shares eight years after their purchase as described in the Fund’s prospectus. Class I and Class R shares are sold at net asset value and are not subject to a sales charge. Each class represents a pro rata interest in the Fund, but votes separately on class-specific matters and (as noted below) is subject to different expenses. Realized and unrealized gains and losses and net investment income and losses, other than class-specific expenses, are allocated daily to each class of shares based on the relative net assets of each class to the total net assets of the Fund. Each class of shares differs in its distribution plan and certain other class-specific expenses.
The following is a summary of significant accounting policies of the Fund. The policies are in conformity with accounting principles generally accepted in the United States of America (U.S. GAAP). The Fund is an investment company and follows accounting and reporting guidance in the Financial Accounting Standards Board (FASB) Accounting Standards Codification Topic 946.
A Investment Valuation—The following methodologies are used to determine the market value or fair value of investments.
Equity Securities. Equity securities listed on a U.S. securities exchange generally are valued at the last sale or closing price on the day of valuation or, if no sales took place on such date, at the mean between the closing bid and ask prices on the exchange where such securities are principally traded. Equity securities listed on the NASDAQ National Market System are valued at the NASDAQ official closing price. Unlisted or listed securities for which closing sales prices or closing quotations are not available are valued at the mean between the latest available bid and ask prices.
Foreign Currencies. Foreign currencies are valued in U.S. dollars, based on foreign currency exchange rate quotations supplied by a third party pricing service. The pricing service uses a proprietary model to determine the exchange rate. Inputs to the model include reported trades and implied bid/ask spreads.
Other. Investments in management investment companies (including money market funds) that do not trade on an exchange are valued at the net asset value as of the close of each business day.
Fair Valuation. In connection with Rule 2a-5 of the 1940 Act, the Trustees have designated the Fund’s investment adviser as its valuation designee. Investments for which valuations or market quotations are not readily available or are deemed unreliable are valued by the investment adviser, as valuation designee, at fair value using methods that most fairly reflect the security’s “fair value”, which is the amount that the Fund might reasonably expect to receive for the security upon its current sale in the ordinary course. Each such determination is based on a consideration of relevant factors, which are likely to vary from one pricing context to another. These factors may include, but are not limited to, the type of security, the existence of any contractual restrictions on the security’s disposition, the price and extent of public trading in similar securities of the issuer or of comparable companies or entities, quotations or relevant information obtained from broker/dealers or other market participants, information obtained from the issuer, analysts, and/or the appropriate stock exchange (for exchange-traded securities), an analysis of the company’s or entity’s financial statements, and an evaluation of the forces that influence the issuer and the market(s) in which the security is purchased and sold.
B Investment Transactions—Investment transactions for financial statement purposes are accounted for on a trade date basis. Realized gains and losses on investments sold are determined on the basis of identified cost.
C Income—Dividend income is recorded on the ex-dividend date for dividends received in cash and/or securities. However, if the ex-dividend date has passed, certain dividends from foreign securities are recorded as the Fund is informed of the ex-dividend date. Withholding taxes on foreign dividends and capital gains have been provided for in accordance with the Fund's understanding of the applicable countries’ tax rules and rates.
D Federal Taxes—The Fund's policy is to comply with the provisions of the Internal Revenue Code applicable to regulated investment companies and to distribute to shareholders each year substantially all of its net investment income, and all or substantially all of its net realized capital gains. Accordingly, no provision for federal income or excise tax is necessary.
As of December 31, 2024, the Fund had no uncertain tax positions that would require financial statement recognition, de-recognition, or disclosure. The Fund files a U.S. federal income tax return annually after its fiscal year-end, which is subject to examination by the Internal Revenue Service for a period of three years from the date of filing.
E Expenses—The majority of expenses of the Trust are directly identifiable to an individual fund. Expenses which are not readily identifiable to a specific fund are allocated taking into consideration, among other things, the nature and type of expense and the relative size of the funds.
F Foreign Currency Translation—Other assets and liabilities initially expressed in foreign currencies are translated each business day into U.S. dollars based upon current exchange rates. Income and expenses denominated in foreign currencies are translated into U.S. dollars based upon currency exchange rates in effect on the respective dates of such transactions.
Eaton Vance
Growth Fund
December 31, 2024
Notes to Financial Statements — continued
G Use of Estimates—The preparation of the financial statements in conformity with U.S. GAAP requires management to make estimates and assumptions that affect the reported amounts of assets and liabilities at the date of the financial statements and the reported amounts of income and expense during the reporting period. Actual results could differ from those estimates.
H Indemnifications—Under the Trust’s organizational documents, its officers and Trustees may be indemnified against certain liabilities and expenses arising out of the performance of their duties to the Fund. Under Massachusetts law, if certain conditions prevail, shareholders of a Massachusetts business trust (such as the Trust) could be deemed to have personal liability for the obligations of the Trust. However, the Trust’s Declaration of Trust contains an express disclaimer of liability on the part of Fund shareholders and the By-laws provide that the Trust shall assume, upon request by the shareholder, the defense on behalf of any Fund shareholders. Moreover, the By-laws also provide for indemnification out of Fund property of any shareholder held personally liable solely by reason of being or having been a shareholder for all loss or expense arising from such liability. Additionally, in the normal course of business, the Fund enters into agreements with service providers that may contain indemnification clauses. The Fund’s maximum exposure under these arrangements is unknown as this would involve future claims that may be made against the Fund that have not yet occurred.
I Segment Reporting—During the year ended December 31, 2024, the Fund adopted FASB Accounting Standards Update No. 2023-07, Segment Reporting (Topic 280): Improvements to Reportable Segment Disclosures, (ASU 2023-07), which requires incremental disclosures related to a public entity’s reportable segments. The Fund operates as a single reportable segment, an investment company whose investment objective is included in Note 1. In connection with the adoption of ASU 2023-07, the Fund’s President has been designated as the Fund’s Chief Operating Decision Maker (CODM), who is responsible for assessing the performance of the Fund’s single segment and deciding how to allocate the segment’s resources. To perform this function, the CODM reviews the information in the Fund’s Financial Statements.
2 Distributions to Shareholders and Income Tax Information
It is the present policy of the Fund to make at least one distribution annually (normally in December) of all or substantially all of its net investment income and to distribute annually all or substantially all of its net realized capital gains. Distributions to shareholders are recorded on the ex-dividend date. Distributions are declared separately for each class of shares. Shareholders may reinvest income and capital gain distributions in additional shares of the same class of the Fund at the net asset value as of the ex-dividend date or, at the election of the shareholder, receive distributions in cash. Distributions to shareholders are determined in accordance with income tax regulations, which may differ from U.S. GAAP. As required by U.S. GAAP, only distributions in excess of tax basis earnings and profits are reported in the financial statements as a return of capital. Permanent differences between book and tax accounting relating to distributions are reclassified to paid-in capital. For tax purposes, distributions from short-term capital gains are considered to be from ordinary income.
The tax character of distributions declared for the years ended December 31, 2024 and December 31, 2023 was as follows:
| | Year Ended December 31, |
| | 2024 | 2023 |
| Long-term capital gains | $28,687,856 | $30,576,188 |
During the year ended December 31, 2024, distributable earnings was decreased by $190,441 and paid-in capital was increased by $190,441 due to the Fund’s use of equalization accounting and differences between book and tax accounting for net operating losses. Tax equalization accounting allows the Fund to treat as a distribution that portion of redemption proceeds representing a redeeming shareholder’s portion of undistributed taxable income and net capital gains. These reclassifications had no effect on the net assets or net asset value per share of the Fund.
As of December 31, 2024, the components of distributable earnings (accumulated loss) on a tax basis were as follows:
| Undistributed long-term capital gains | $ 7,910,374 |
| Net unrealized appreciation | 283,072,628 |
| Distributable earnings | $290,983,002 |
Eaton Vance
Growth Fund
December 31, 2024
Notes to Financial Statements — continued
The cost and unrealized appreciation (depreciation) of investments of the Fund at December 31, 2024, as determined on a federal income tax basis, were as follows:
| Aggregate cost | $149,317,432 |
| Gross unrealized appreciation | $283,910,981 |
| Gross unrealized depreciation | (838,345) |
| Net unrealized appreciation | $283,072,636 |
3 Investment Adviser Fee and Other Transactions with Affiliates
The investment adviser fee is earned by Boston Management and Research (BMR), an indirect, wholly-owned subsidiary of Morgan Stanley, as compensation for investment advisory services rendered to the Fund. The investment adviser fee is computed at an annual rate as a percentage of the Fund’s average daily net assets as follows and is payable monthly:
| Average Daily Net Assets | Annual Fee Rate |
| Up to $500 million | 0.650% |
| $500 million but less than $1 billion | 0.625% |
| $1 billion but less than $2.5 billion | 0.600% |
| $2.5 billion and over | 0.575% |
For the year ended December 31, 2024, the Fund’s investment adviser fee amounted to $2,659,909 or 0.65% of the Fund’s average daily net assets. The Fund may invest in a money market fund, the Institutional Class of the Morgan Stanley Institutional Liquidity Funds - Government Portfolio (the “Liquidity Fund”), an open-end management investment company managed by Morgan Stanley Investment Management Inc., a wholly-owned subsidiary of Morgan Stanley. The investment adviser fee paid by the Fund is reduced by an amount equal to its pro rata share of the advisory and administration fees paid by the Fund due to its investment in the Liquidity Fund. For the year ended December 31, 2024, the investment adviser fee paid was reduced by $4,041 relating to the Fund’s investment in the Liquidity Fund.
Eaton Vance Management (EVM), an affiliate of BMR, serves as the administrator of the Fund, but receives no compensation. EVM has agreed to reimburse the Fund’s expenses to the extent that total annual operating expenses (relating to ordinary operating expenses only and excluding such expenses as brokerage commissions, acquired fund fees and expenses of unaffiliated funds, borrowing costs, taxes or litigation expenses) exceed 1.05%, 1.80%, 0.80% and 1.30% of the Fund’s average daily net assets for Class A, Class C, Class I and Class R, respectively. This agreement may be changed or terminated after May 1, 2025. Pursuant to this agreement, no operating expenses were waived and/or reimbursed by EVM for the year ended December 31, 2024.
EVM provides sub-transfer agency and related services to the Fund pursuant to a Sub-Transfer Agency Support Services Agreement. For the year ended December 31, 2024, EVM earned $68,530 from the Fund pursuant to such agreement, which is included in transfer and dividend disbursing agent fees on the Statement of Operations. The Fund was informed that Eaton Vance Distributors, Inc. (EVD), an affiliate of EVM and the Fund’s principal underwriter, received $6,592 as its portion of the sales charge on sales of Class A shares for the year ended December 31, 2024. The Fund was informed that Morgan Stanley affiliated broker-dealers, which may be deemed to be affiliates of EVM, BMR and EVD, also received a portion of the sales charge on sales of Class A shares for the year ended December 31, 2024 in the amount of $600. EVD also received distribution and service fees from Class A, Class C and Class R shares (see Note 4) and contingent deferred sales charges (see Note 5).
Trustees and officers of the Fund who are members of EVM’s or BMR’s organizations receive remuneration for their services to the Fund out of the investment adviser fee. Trustees of the Fund who are not affiliated with the investment adviser may elect to defer receipt of all or a percentage of their annual fees in accordance with the terms of the Trustees Deferred Compensation Plan. Certain officers and Trustees of the Fund are officers of the above organizations.
Eaton Vance
Growth Fund
December 31, 2024
Notes to Financial Statements — continued
4 Distribution Plans
The Fund has in effect a distribution plan for Class A shares (Class A Plan) pursuant to Rule 12b-1 under the 1940 Act. Pursuant to the Class A Plan, the Fund pays EVD a distribution and service fee of 0.25% per annum of its average daily net assets attributable to Class A shares for distribution services and facilities provided to the Fund by EVD, as well as for personal services and/or the maintenance of shareholder accounts. Distribution and service fees paid or accrued to EVD for the year ended December 31, 2024 amounted to $780,491 for Class A shares. The Fund also has in effect distribution plans for Class C shares (Class C Plan) and Class R shares (Class R Plan) pursuant to Rule 12b-1 under the 1940 Act. Pursuant to the Class C Plan, the Fund pays EVD amounts equal to 0.75% per annum of its average daily net assets attributable to Class C shares for providing ongoing distribution services and facilities to the Fund. For the year ended December 31, 2024, the Fund paid or accrued to EVD $56,316 for Class C shares. The Class R Plan requires the Fund to pay EVD an amount up to 0.50% per annum of its average daily net assets attributable to Class R shares for providing ongoing distribution services and facilities to the Fund. The Trustees of the Trust have currently limited Class R distribution payments to 0.25% per annum of the average daily net assets attributable to Class R shares. For the year ended December 31, 2024, the Fund paid or accrued to EVD $6,913 for Class R shares.
Pursuant to the Class C and Class R Plans, the Fund also makes payments of service fees to EVD, financial intermediaries and other persons in amounts equal to 0.25% per annum of its average daily net assets attributable to that class. Service fees paid or accrued are for personal services and/or the maintenance of shareholder accounts. They are separate and distinct from the sales commissions and distribution fees payable to EVD. Service fees paid or accrued for the year ended December 31, 2024 amounted to $18,772 and $6,913 for Class C and Class R shares, respectively.
Distribution and service fees are subject to the limitations contained in the Financial Industry Regulatory Authority Rule 2341(d).
5 Contingent Deferred Sales Charges
A contingent deferred sales charge (CDSC) of 1% generally is imposed on redemptions of Class C shares made within 12 months of purchase. Class A shares may be subject to a 1% CDSC if redeemed within 12 months of purchase (depending on the circumstances of purchase). Generally, the CDSC is based upon the lower of the net asset value at date of redemption or date of purchase. No charge is levied on shares acquired by reinvestment of dividends or capital gain distributions. For the year ended December 31, 2024, the Fund was informed that EVD received less than $100 and $480 of CDSCs paid by Class A and Class C shareholders, respectively.
6 Purchases and Sales of Investments
Purchases and sales of investments, other than short-term obligations, aggregated $71,053,436 and $117,876,720, respectively, for the year ended December 31, 2024.
7 Shares of Beneficial Interest
The Fund’s Declaration of Trust permits the Trustees to issue an unlimited number of full and fractional shares of beneficial interest (without par value). Such shares may be issued in a number of different series (such as the Fund) and classes. Transactions in Fund shares, including direct exchanges pursuant to share class conversions, were as follows:
| | Year Ended
December 31, 2024 | | Year Ended
December 31, 2023 |
| | Shares | Amount | | Shares | Amount |
| Class A | | | | | |
| Sales | 271,799 | $10,648,253 | | 280,082 | $ 8,921,366 |
| Issued to shareholders electing to receive payments of distributions in Fund shares | 486,098 | 20,552,223 | | 672,219 | 21,632,022 |
| Redemptions | (901,712) | (35,700,608) | | (845,290) | (26,623,888) |
| Net increase (decrease) | (143,815) | $(4,500,132) | | 107,011 | $ 3,929,500 |
Eaton Vance
Growth Fund
December 31, 2024
Notes to Financial Statements — continued
| | Year Ended
December 31, 2024 | | Year Ended
December 31, 2023 |
| | Shares | Amount | | Shares | Amount |
| Class C | | | | | |
| Sales | 45,651 | $ 1,282,478 | | 44,270 | $ 1,016,809 |
| Issued to shareholders electing to receive payments of distributions in Fund shares | 24,543 | 717,129 | | 39,309 | 906,076 |
| Redemptions | (155,345) | (4,294,318) | | (136,911) | (3,211,788) |
| Net decrease | (85,151) | $(2,294,711) | | (53,332) | $(1,288,903) |
| Class I | | | | | |
| Sales | 334,824 | $14,096,510 | | 408,707 | $13,727,080 |
| Issued to shareholders electing to receive payments of distributions in Fund shares | 115,420 | 5,226,229 | | 173,421 | 5,936,198 |
| Redemptions | (701,111) | (30,574,972) | | (453,624) | (15,149,954) |
| Net increase (decrease) | (250,867) | $(11,252,233) | | 128,504 | $ 4,513,324 |
| Class R | | | | | |
| Sales | 86,110 | $ 3,510,088 | | 8,099 | $ 239,530 |
| Issued to shareholders electing to receive payments of distributions in Fund shares | 10,120 | 401,975 | | 5,596 | 170,286 |
| Redemptions | (8,334) | (303,654) | | (32,917) | (1,018,847) |
| Net increase (decrease) | 87,896 | $ 3,608,409 | | (19,222) | $ (609,031) |
8 Line of Credit
The Fund participates with other portfolios and funds managed by BMR and its affiliates in a $650 million unsecured revolving line of credit agreement with a group of banks, which is in effect through October 21, 2025. Borrowings are made by the Fund solely for temporary purposes related to redemptions and other short-term cash needs. Interest is charged to the Fund based on its borrowings generally at an amount above either the Secured Overnight Financing Rate (SOFR) or Federal Funds rate. In addition, a fee computed at an annual rate of 0.15% on the daily unused portion of the line of credit is allocated among the participating portfolios and funds at the end of each quarter. In connection with the renewal of the agreement in October 2024, an arrangement fee of $150,000 was incurred that was allocated to the participating portfolios and funds. Because the line of credit is not available exclusively to the Fund, it may be unable to borrow some or all of its requested amounts at any particular time. The Fund did not have any significant borrowings or allocated fees during the year ended December 31, 2024.
9 Securities Lending Agreement
The Fund has established a securities lending agreement with State Street Bank and Trust Company (SSBT) as securities lending agent in which the Fund lends portfolio securities to qualified borrowers in exchange for collateral consisting of either cash or securities issued or guaranteed by the U.S. government or its agencies or instrumentalities in an amount at least equal to the market value of the securities on loan. The market value of securities loaned is determined daily and any additional required collateral is delivered to the Fund on the next business day. Cash collateral is invested in the State Street Navigator Securities Lending Government Money Market Portfolio, a money market fund registered under the 1940 Act. The Fund earns interest on the amount invested but it must pay (and at times receive from) the broker a loan rebate fee computed as a varying percentage of the collateral received. For security loans secured by non-cash collateral, the Fund earns a negotiated lending fee from the borrower. A portion of the income earned by the Fund from its investment of cash collateral, net of rebate fees, and lending fees received is allocated to SSBT for its services as lending agent and the portion allocated to the Fund is presented as securities lending income, net on the Statement of Operations. Non-cash collateral is held by the lending agent on behalf of the Fund and cannot be sold or re-pledged by the Fund; accordingly, such collateral is not reflected in the Statement of Assets and Liabilities.
The Fund is subject to possible delay in the recovery of loaned securities. Pursuant to the securities lending agreement, SSBT has provided indemnification to the Fund in the event of default by a borrower with respect to a loan. The Fund bears the risk of loss with respect to the investment of cash collateral.
Eaton Vance
Growth Fund
December 31, 2024
Notes to Financial Statements — continued
At December 31, 2024, the value of the securities loaned and the value of the collateral received, which exceeded the value of the securities loaned, amounted to $859,847 and $884,614, respectively. Collateral received was comprised of U.S. government and/or agencies securities. The securities lending transactions have no contractual maturity date and each of the Fund and borrower has the option to terminate a loan at any time.
10 Affiliated Investments
At December 31, 2024, the value of the Fund’s investment in funds that may be deemed to be affiliated was $3,288,104, which represents 0.8% of the Fund's net assets. Transactions in such investments by the Fund for the year ended December 31, 2024 were as follows:
| Name | Value,
beginning
of period | Purchases | Sales
proceeds | Net realized
gain (loss) | Change in
unrealized
appreciation
(depreciation) | Value, end
of period | Dividend
income | Shares,
end of period |
| Short-Term Investments |
| Liquidity Fund | $669,865 | $44,434,841 | $(41,816,602) | $ — | $ — | $3,288,104 | $141,472 | 3,288,104 |
11 Fair Value Measurements
Under generally accepted accounting principles for fair value measurements, a three-tier hierarchy to prioritize the assumptions, referred to as inputs, is used in valuation techniques to measure fair value. The three-tier hierarchy of inputs is summarized in the three broad levels listed below.
| • | Level 1 – quoted prices in active markets for identical investments |
| • | Level 2 – other significant observable inputs (including quoted prices for similar investments, interest rates, prepayment speeds, credit risk, etc.) |
| • | Level 3 – significant unobservable inputs (including a fund's own assumptions in determining the fair value of investments) |
In cases where the inputs used to measure fair value fall in different levels of the fair value hierarchy, the level disclosed is determined based on the lowest level input that is significant to the fair value measurement in its entirety. The inputs or methodology used for valuing securities are not necessarily an indication of the risk associated with investing in those securities.
At December 31, 2024, the hierarchy of inputs used in valuing the Fund's investments, which are carried at fair value, were as follows:
| Asset Description | Level 1 | Level 2 | Level 3 | Total |
| Common Stocks | $429,101,964* | $ — | $ — | $429,101,964 |
| Short-Term Investments | 3,288,104 | — | — | 3,288,104 |
| Total Investments | $ 432,390,068 | $ — | $ — | $432,390,068 |
| * | The level classification by major category of investments is the same as the category presentation in the Portfolio of Investments. |
Eaton Vance
Growth Fund
December 31, 2024
Report of Independent Registered Public Accounting Firm
To the Trustees of Eaton Vance Special Investment Trust and Shareholders of Eaton Vance Growth Fund:
Opinion on the Financial Statements and Financial Highlights
We have audited the accompanying statement of assets and liabilities of Eaton Vance Growth Fund (the “Fund”) (one of the funds constituting Eaton Vance Special Investment Trust), including the portfolio of investments, as of December 31, 2024, the related statement of operations for the year then ended, the statements of changes in net assets for each of the two years in the period then ended, the financial highlights for each of the five years in the period then ended, and the related notes. In our opinion, the financial statements and financial highlights present fairly, in all material respects, the financial position of the Fund as of December 31, 2024, and the results of its operations for the year then ended, the changes in its net assets for each of the two years in the period then ended, and the financial highlights for each of the five years in the period then ended, in conformity with accounting principles generally accepted in the United States of America.
Basis for Opinion
These financial statements and financial highlights are the responsibility of the Fund's management. Our responsibility is to express an opinion on the Fund's financial statements and financial highlights based on our audits. We are a public accounting firm registered with the Public Company Accounting Oversight Board (United States) (PCAOB) and are required to be independent with respect to the Fund in accordance with the U.S. federal securities laws and the applicable rules and regulations of the Securities and Exchange Commission and the PCAOB.
We conducted our audits in accordance with the standards of the PCAOB. Those standards require that we plan and perform the audit to obtain reasonable assurance about whether the financial statements and financial highlights are free of material misstatement, whether due to error or fraud. The Fund is not required to have, nor were we engaged to perform, an audit of its internal control over financial reporting. As part of our audits, we are required to obtain an understanding of internal control over financial reporting but not for the purpose of expressing an opinion on the effectiveness of the Fund’s internal control over financial reporting. Accordingly, we express no such opinion.
Our audits included performing procedures to assess the risks of material misstatement of the financial statements and financial highlights, whether due to error or fraud, and performing procedures that respond to those risks. Such procedures included examining, on a test basis, evidence regarding the amounts and disclosures in the financial statements and financial highlights. Our audits also included evaluating the accounting principles used and significant estimates made by management, as well as evaluating the overall presentation of the financial statements and financial highlights. Our procedures included confirmation of securities owned as of December 31, 2024, by correspondence with the custodian and brokers; when replies were not received from brokers, we performed other auditing procedures. We believe that our audits provide a reasonable basis for our opinion.
/s/ Deloitte & Touche LLP
Boston, Massachusetts
February 21, 2025
We have served as the auditor of one or more Eaton Vance investment companies since 1959.
Eaton Vance
Growth Fund
December 31, 2024
Federal Tax Information (Unaudited)
The Form 1099-DIV you received in February 2025 showed the tax status of all distributions paid to your account in calendar year 2024. Shareholders are advised to consult their own tax adviser with respect to the tax consequences of their investment in the Fund. As required by the Internal Revenue Code and/or regulations, shareholders must be notified regarding the status of capital gains dividends.
Capital Gains Dividends. The Fund hereby designates as a capital gain dividend with respect to the taxable year ended December 31, 2024, $38,220,379 or, if subsequently determined to be different, the net capital gain of such year.
This Page Intentionally Left Blank
This Page Intentionally Left Blank
Eaton Vance
Large-Cap Value Fund
Annual Financial Statements and
Additional Information
December 31, 2024
This report must be preceded or accompanied by a current summary prospectus or prospectus. Before investing, investors should consider carefully the investment objective, risks, and charges and expenses of a mutual fund. This and other important information is contained in the prospectus and/or statement of additional information, which can be obtained by calling 1-800-262-1122 or from a financial intermediary. Prospective investors should read the prospectus carefully before investing.
Annual Financial Statements and Additional Information December 31, 2024
Eaton Vance
Large-Cap Value Fund
Items 8, 9 and 11 of Form N-CSR are Not Applicable. For Item 10 of Form N-CSR, see Item 7.
Eaton Vance
Large-Cap Value Fund
December 31, 2024
| Security | Shares | Value |
| Aerospace & Defense — 1.0% |
| Huntington Ingalls Industries, Inc. | | 79,782 | $ 15,076,405 |
| | | | $ 15,076,405 |
| Air Freight & Logistics — 0.9% |
| United Parcel Service, Inc., Class B | | 102,658 | $ 12,945,174 |
| | | | $ 12,945,174 |
| Banks — 5.6% |
| Bank of America Corp. | | 834,457 | $ 36,674,385 |
| Wells Fargo & Co. | | 629,545 | 44,219,241 |
| | | | $ 80,893,626 |
| Beverages — 1.5% |
| Constellation Brands, Inc., Class A | | 96,433 | $ 21,311,693 |
| | | | $ 21,311,693 |
| Biotechnology — 4.9% |
| AbbVie, Inc. | | 199,537 | $ 35,457,725 |
| Gilead Sciences, Inc. | | 213,288 | 19,701,412 |
| Neurocrine Biosciences, Inc.(1) | | 113,056 | 15,432,144 |
| | | | $ 70,591,281 |
| Building Products — 1.9% |
| Johnson Controls International PLC | | 356,532 | $ 28,141,071 |
| | | | $ 28,141,071 |
| Capital Markets — 4.9% |
| Cboe Global Markets, Inc. | | 73,416 | $ 14,345,486 |
| Charles Schwab Corp. | | 303,451 | 22,458,408 |
| Interactive Brokers Group, Inc., Class A | | 147,312 | 26,025,611 |
| Tradeweb Markets, Inc., Class A | | 60,718 | 7,949,201 |
| | | | $ 70,778,706 |
| Chemicals — 2.6% |
| FMC Corp. | | 375,644 | $ 18,260,055 |
| Linde PLC | | 46,545 | 19,486,995 |
| | | | $ 37,747,050 |
| Communications Equipment — 2.6% |
| Cisco Systems, Inc. | | 628,841 | $ 37,227,387 |
| | | | $ 37,227,387 |
| Security | Shares | Value |
| Consumer Staples Distribution & Retail — 3.0% |
| BJ's Wholesale Club Holdings, Inc.(1) | | 279,323 | $ 24,957,510 |
| U.S. Foods Holding Corp.(1) | | 282,600 | 19,064,196 |
| | | | $ 44,021,706 |
| Containers & Packaging — 1.0% |
| Ball Corp. | | 264,420 | $ 14,577,475 |
| | | | $ 14,577,475 |
| Electric Utilities — 2.9% |
| NextEra Energy, Inc. | | 418,020 | $ 29,967,854 |
| Xcel Energy, Inc. | | 180,886 | 12,213,422 |
| | | | $ 42,181,276 |
| Electrical Equipment — 2.5% |
| Emerson Electric Co. | | 294,438 | $ 36,489,701 |
| | | | $ 36,489,701 |
| Energy Equipment & Services — 0.9% |
| Schlumberger NV | | 351,339 | $ 13,470,337 |
| | | | $ 13,470,337 |
| Entertainment — 2.8% |
| Walt Disney Co. | | 365,598 | $ 40,709,337 |
| | | | $ 40,709,337 |
| Food Products — 0.6% |
| Hershey Co. | | 49,348 | $ 8,357,084 |
| | | | $ 8,357,084 |
| Ground Transportation — 1.9% |
| CSX Corp. | | 836,002 | $ 26,977,785 |
| | | | $ 26,977,785 |
| Health Care Equipment & Supplies — 2.7% |
| Abbott Laboratories | | 170,569 | $ 19,293,060 |
| Boston Scientific Corp.(1) | | 224,388 | 20,042,336 |
| | | | $ 39,335,396 |
| Health Care Providers & Services — 3.3% |
| McKesson Corp. | | 23,496 | $ 13,390,605 |
| UnitedHealth Group, Inc. | | 68,985 | 34,896,752 |
| | | | $ 48,287,357 |
1
See Notes to Financial Statements.
Eaton Vance
Large-Cap Value Fund
December 31, 2024
Portfolio of Investments — continued
| Security | Shares | Value |
| Hotels, Restaurants & Leisure — 1.9% |
| McDonald's Corp. | | 95,950 | $ 27,814,945 |
| | | | $ 27,814,945 |
| Household Durables — 0.5% |
| Meritage Homes Corp. | | 42,287 | $ 6,504,586 |
| | | | $ 6,504,586 |
| Household Products — 1.8% |
| Clorox Co. | | 163,875 | $ 26,614,939 |
| | | | $ 26,614,939 |
| Industrial Conglomerates — 2.1% |
| 3M Co. | | 235,940 | $ 30,457,495 |
| | | | $ 30,457,495 |
| Industrial REITs — 1.4% |
| First Industrial Realty Trust, Inc. | | 411,674 | $ 20,637,218 |
| | | | $ 20,637,218 |
| Insurance — 8.3% |
| American International Group, Inc. | | 516,449 | $ 37,597,487 |
| Prudential PLC | | 1,525,600 | 12,107,191 |
| Reinsurance Group of America, Inc. | | 167,608 | 35,806,097 |
| Ryan Specialty Holdings, Inc. | | 137,629 | 8,830,277 |
| Travelers Cos., Inc. | | 108,726 | 26,191,006 |
| | | | $ 120,532,058 |
| Interactive Media & Services — 1.9% |
| Alphabet, Inc., Class A | | 144,554 | $ 27,364,072 |
| | | | $ 27,364,072 |
| Leisure Products — 1.3% |
| Hasbro, Inc. | | 331,259 | $ 18,520,691 |
| | | | $ 18,520,691 |
| Life Sciences Tools & Services — 3.5% |
| Mettler-Toledo International, Inc.(1) | | 16,062 | $ 19,654,748 |
| Thermo Fisher Scientific, Inc. | | 60,794 | 31,626,863 |
| | | | $ 51,281,611 |
| Machinery — 3.8% |
| Ingersoll Rand, Inc. | | 118,089 | $ 10,682,331 |
| Toro Co. | | 238,465 | 19,101,046 |
| Westinghouse Air Brake Technologies Corp. | | 130,678 | 24,775,242 |
| | | | $ 54,558,619 |
| Security | Shares | Value |
| Metals & Mining — 0.5% |
| Alcoa Corp. | | 200,502 | $ 7,574,966 |
| | | | $ 7,574,966 |
| Multi-Utilities — 2.9% |
| CMS Energy Corp. | | 340,662 | $ 22,705,122 |
| Sempra | | 219,757 | 19,277,084 |
| | | | $ 41,982,206 |
| Oil, Gas & Consumable Fuels — 5.8% |
| Chevron Corp. | | 186,008 | $ 26,941,399 |
| ConocoPhillips | | 253,187 | 25,108,555 |
| EOG Resources, Inc. | | 95,469 | 11,702,590 |
| EQT Corp. | | 239,954 | 11,064,279 |
| Targa Resources Corp. | | 51,149 | 9,130,096 |
| | | | $ 83,946,919 |
| Pharmaceuticals — 4.3% |
| Bristol-Myers Squibb Co. | | 734,107 | $ 41,521,092 |
| Zoetis, Inc. | | 129,191 | 21,049,090 |
| | | | $ 62,570,182 |
| Professional Services — 1.9% |
| Robert Half, Inc. | | 381,677 | $ 26,892,961 |
| | | | $ 26,892,961 |
| Residential REITs — 3.7% |
| Invitation Homes, Inc. | | 759,931 | $ 24,294,994 |
| Mid-America Apartment Communities, Inc. | | 187,403 | 28,966,882 |
| | | | $ 53,261,876 |
| Semiconductors & Semiconductor Equipment — 3.7% |
| Micron Technology, Inc. | | 352,223 | $ 29,643,088 |
| ON Semiconductor Corp.(1) | | 377,698 | 23,813,859 |
| | | | $ 53,456,947 |
| Software — 0.9% |
| NICE Ltd. ADR(1)(2) | | 75,217 | $ 12,774,855 |
| | | | $ 12,774,855 |
| Specialty Retail — 1.6% |
| Lithia Motors, Inc. | | 64,768 | $ 23,150,026 |
| | | | $ 23,150,026 |
Total Common Stocks
(identified cost $1,162,983,314) | | | $1,439,017,019 |
2
See Notes to Financial Statements.
Eaton Vance
Large-Cap Value Fund
December 31, 2024
Portfolio of Investments — continued
| Short-Term Investments — 0.8% |
| Security | Shares | Value |
| Morgan Stanley Institutional Liquidity Funds - Government Portfolio, Institutional Class, 4.43%(3) | | 10,834,635 | $ 10,834,635 |
Total Affiliated Fund
(identified cost $10,834,635) | | | $ 10,834,635 |
| Securities Lending Collateral — 0.1% |
| Security | Shares | Value |
| State Street Navigator Securities Lending Government Money Market Portfolio, 4.46%(4) | | 1,554,864 | $ 1,554,864 |
Total Securities Lending Collateral
(identified cost $1,554,864) | | | $ 1,554,864 |
Total Short-Term Investments
(identified cost $12,389,499) | | | $ 12,389,499 |
Total Investments — 100.1%
(identified cost $1,175,372,813) | | | $1,451,406,518 |
| Other Assets, Less Liabilities — (0.1)% | | | $ (2,047,453) |
| Net Assets — 100.0% | | | $1,449,359,065 |
| The percentage shown for each investment category in the Portfolio of Investments is based on net assets. |
| (1) | Non-income producing security. |
| (2) | All or a portion of this security was on loan at December 31, 2024. The aggregate market value of securities on loan at December 31, 2024 was $10,629,776. |
| (3) | May be deemed to be an affiliated investment company (see Note 10). The rate shown is the annualized seven-day yield as of December 31, 2024. |
| (4) | Represents investment of cash collateral received in connection with securities lending. |
| Abbreviations: |
| ADR | – American Depositary Receipt |
| REITs | – Real Estate Investment Trusts |
3
See Notes to Financial Statements.
Eaton Vance
Large-Cap Value Fund
December 31, 2024
Statement of Assets and Liabilities
| | December 31, 2024 |
| Assets | |
| Unaffiliated investments, at value (identified cost $1,164,538,178) — including $10,629,776 of securities on loan | $1,440,571,883 |
| Affiliated investments, at value (identified cost $10,834,635) | 10,834,635 |
| Dividends receivable | 1,314,465 |
| Dividends receivable from affiliated investments | 83,500 |
| Receivable for Fund shares sold | 497,893 |
| Securities lending income receivable | 2,225 |
| Tax reclaims receivable | 97,339 |
| Trustees' deferred compensation plan | 278,079 |
| Total assets | $1,453,680,019 |
| Liabilities | |
| Collateral for securities loaned | $1,554,864 |
| Payable for Fund shares redeemed | 941,130 |
| Payable to affiliates: | |
| Investment adviser fee | 790,356 |
| Distribution and service fees | 155,362 |
| Trustees' fees | 22,725 |
| Trustees' deferred compensation plan | 278,079 |
| Accrued expenses | 578,438 |
| Total liabilities | $4,320,954 |
| Net Assets | $1,449,359,065 |
| Sources of Net Assets | |
| Paid-in capital | $1,145,329,585 |
| Distributable earnings | 304,029,480 |
| Net Assets | $1,449,359,065 |
| Class A Shares | |
| Net Assets | $596,174,621 |
| Shares Outstanding | 23,494,965 |
Net Asset Value and Redemption Price Per Share
(net assets ÷ shares of beneficial interest outstanding) | $25.37 |
Maximum Offering Price Per Share
(100 ÷ 94.75 of net asset value per share) | $26.78 |
| Class C Shares | |
| Net Assets | $11,019,333 |
| Shares Outstanding | 431,348 |
Net Asset Value and Offering Price Per Share*
(net assets ÷ shares of beneficial interest outstanding) | $25.55 |
| Class I Shares | |
| Net Assets | $713,529,145 |
| Shares Outstanding | 27,969,593 |
Net Asset Value, Offering Price and Redemption Price Per Share
(net assets ÷ shares of beneficial interest outstanding) | $25.51 |
| Class R Shares | |
| Net Assets | $33,995,284 |
| Shares Outstanding | 1,344,035 |
Net Asset Value, Offering Price and Redemption Price Per Share
(net assets ÷ shares of beneficial interest outstanding) | $25.29 |
4
See Notes to Financial Statements.
Eaton Vance
Large-Cap Value Fund
December 31, 2024
Statement of Assets and Liabilities — continued
| | December 31, 2024 |
| Class R6 Shares | |
| Net Assets | $94,640,682 |
| Shares Outstanding | 3,707,157 |
Net Asset Value, Offering Price and Redemption Price Per Share
(net assets ÷ shares of beneficial interest outstanding) | $25.53 |
| On sales of $50,000 or more, the offering price of Class A shares is reduced. |
| * | Redemption price per share is equal to the net asset value less any applicable contingent deferred sales charge. |
5
See Notes to Financial Statements.
Eaton Vance
Large-Cap Value Fund
December 31, 2024
| | Year Ended |
| | December 31, 2024 |
| Investment Income | |
| Dividend income (net of foreign taxes withheld of $151,778) | $29,181,925 |
| Dividend income from affiliated investments | 901,602 |
| Securities lending income, net | 18,664 |
| Total investment income | $30,102,191 |
| Expenses | |
| Investment adviser fee | $9,274,556 |
| Distribution and service fees: | |
| Class A | 1,526,232 |
| Class C | 122,917 |
| Class R | 189,278 |
| Trustees’ fees and expenses | 90,412 |
| Custodian fee | 336,386 |
| Transfer and dividend disbursing agent fees | 923,488 |
| Legal and accounting services | 108,676 |
| Printing and postage | 86,215 |
| Registration fees | 78,190 |
| ReFlow liquidity program fees | 182,701 |
| Miscellaneous | 64,014 |
| Total expenses | $12,983,065 |
| Deduct: | |
| Waiver and/or reimbursement of expenses by affiliates | $25,315 |
| Total expense reductions | $25,315 |
| Net expenses | $12,957,750 |
| Net investment income | $17,144,441 |
| Realized and Unrealized Gain (Loss) | |
| Net realized gain (loss): | |
| Investment transactions | $142,829,727(1) |
| Foreign currency transactions | 8,801 |
| Net realized gain | $142,838,528 |
| Change in unrealized appreciation (depreciation): | |
| Investments | $3,222,086 |
| Foreign currency | (1,998) |
| Net change in unrealized appreciation (depreciation) | $3,220,088 |
| Net realized and unrealized gain | $146,058,616 |
| Net increase in net assets from operations | $163,203,057 |
| (1) | Includes $50,135,110 of net realized gains from redemptions in-kind. |
6
See Notes to Financial Statements.
Eaton Vance
Large-Cap Value Fund
December 31, 2024
Statements of Changes in Net Assets
| | Year Ended December 31, |
| | 2024 | 2023 |
| Increase (Decrease) in Net Assets | | |
| From operations: | | |
| Net investment income | $17,144,441 | $18,877,641 |
| Net realized gain | 142,838,528(1) | 41,858,175(2) |
| Net change in unrealized appreciation (depreciation) | 3,220,088 | 50,026,769 |
| Net increase in net assets from operations | $163,203,057 | $110,762,585 |
| Distributions to shareholders: | | |
| Class A | $(24,752,520) | $(17,578,680) |
| Class C | (370,397) | (284,835) |
| Class I | (31,229,859) | (22,919,839) |
| Class R | (1,371,378) | (1,046,392) |
| Class R6 | (4,246,109) | (3,272,059) |
| Total distributions to shareholders | $(61,970,263) | $(45,101,805) |
| Transactions in shares of beneficial interest: | | |
| Class A | $(42,636,588) | $(56,311,251) |
| Class C | (3,083,361) | (3,240,395) |
| Class I | (39,567,410) | (113,002,286) |
| Class R | (7,294,699) | (5,134,320) |
| Class R6 | (17,397,737) | (15,619,431) |
| Net decrease in net assets from Fund share transactions | $(109,979,795) | $(193,307,683) |
| Net decrease in net assets | $(8,747,001) | $(127,646,903) |
| Net Assets | | |
| At beginning of year | $1,458,106,066 | $1,585,752,969 |
| At end of year | $1,449,359,065 | $1,458,106,066 |
| (1) | Includes $50,135,110 of net realized gains from redemptions in-kind. |
| (2) | Includes $51,427,555 of net realized gains from redemptions in-kind. |
7
See Notes to Financial Statements.
Eaton Vance
Large-Cap Value Fund
December 31, 2024
| | Class A |
| | Year Ended December 31, |
| | 2024 | 2023 | 2022 | 2021 | 2020 |
| Net asset value — Beginning of year | $23.69 | $22.63 | $24.26 | $21.00 | $20.98 |
| Income (Loss) From Operations | | | | | |
| Net investment income(1) | $0.26 | $0.26 | $0.25 | $0.25 | $0.27 |
| Net realized and unrealized gain (loss) | 2.49 | 1.50 | (0.92) | 4.79 | 0.16(2) |
| Total income (loss) from operations | $2.75 | $1.76 | $(0.67) | $5.04 | $0.43 |
| Less Distributions | | | | | |
| From net investment income | $(0.26) | $(0.23) | $(0.25) | $(0.24) | $(0.26) |
| From net realized gain | (0.81) | (0.47) | (0.71) | (1.54) | (0.15) |
| Total distributions | $(1.07) | $(0.70) | $(0.96) | $(1.78) | $(0.41) |
| Net asset value — End of year | $25.37 | $23.69 | $22.63 | $24.26 | $21.00 |
| Total Return(3) | 11.49% | 7.92% | (2.78)% | 24.29% | 2.28% |
| Ratios/Supplemental Data | | | | | |
| Net assets, end of year (000’s omitted) | $596,175 | $597,094 | $626,604 | $699,076 | $630,544 |
| Ratios (as a percentage of average daily net assets):(4) | | | | | |
| Total expenses | 1.00% | 1.03% | 1.01% | 1.01% | 1.04% |
| Net expenses | 1.00%(5) | 1.03%(5) | 1.01%(5) | 1.01% | 1.04% |
| Net investment income | 1.02% | 1.12% | 1.06% | 1.07% | 1.48% |
| Portfolio Turnover | 75% | 68% | 65% | 56% | 65% |
| (1) | Computed using average shares outstanding. |
| (2) | The per share amount is not in accord with the net realized and unrealized gain (loss) for the period because of the timing of Fund share transactions and the amount of the per share realized and unrealized gains and losses at such time. |
| (3) | Returns are historical and are calculated by determining the percentage change in net asset value with all distributions reinvested and do not reflect the effect of sales charges. |
| (4) | Total expenses do not reflect amounts reimbursed and/or waived by the adviser and certain of its affiliates, if applicable. Net expenses are net of all reductions and represent the net expenses paid by the Fund. |
| (5) | Includes a reduction by the investment adviser of a portion of its adviser fee due to the Fund’s investment in the Liquidity Fund (equal to less than 0.005% of average daily net assets for the years ended December 31, 2024, 2023 and 2022). |
8
See Notes to Financial Statements.
Eaton Vance
Large-Cap Value Fund
December 31, 2024
Financial Highlights — continued
| | Class C |
| | Year Ended December 31, |
| | 2024 | 2023 | 2022 | 2021 | 2020 |
| Net asset value — Beginning of year | $23.84 | $22.76 | $24.39 | $21.10 | $21.05 |
| Income (Loss) From Operations | | | | | |
| Net investment income(1) | $0.07 | $0.08 | $0.07 | $0.07 | $0.14 |
| Net realized and unrealized gain (loss) | 2.51 | 1.52 | (0.93) | 4.82 | 0.15(2) |
| Total income (loss) from operations | $2.58 | $1.60 | $(0.86) | $4.89 | $0.29 |
| Less Distributions | | | | | |
| From net investment income | $(0.06) | $(0.05) | $(0.06) | $(0.06) | $(0.09) |
| From net realized gain | (0.81) | (0.47) | (0.71) | (1.54) | (0.15) |
| Total distributions | $(0.87) | $(0.52) | $(0.77) | $(1.60) | $(0.24) |
| Net asset value — End of year | $25.55 | $23.84 | $22.76 | $24.39 | $21.10 |
| Total Return(3) | 10.68% | 7.11% | (3.53)% | 23.39% | 1.52% |
| Ratios/Supplemental Data | | | | | |
| Net assets, end of year (000’s omitted) | $11,019 | $13,182 | $15,822 | $20,594 | $21,069 |
| Ratios (as a percentage of average daily net assets):(4) | | | | | |
| Total expenses | 1.75% | 1.78% | 1.77% | 1.76% | 1.79% |
| Net expenses | 1.75%(5) | 1.78%(5) | 1.77%(5) | 1.76% | 1.79% |
| Net investment income | 0.28% | 0.37% | 0.31% | 0.30% | 0.75% |
| Portfolio Turnover | 75% | 68% | 65% | 56% | 65% |
| (1) | Computed using average shares outstanding. |
| (2) | The per share amount is not in accord with the net realized and unrealized gain (loss) for the period because of the timing of Fund share transactions and the amount of the per share realized and unrealized gains and losses at such time. |
| (3) | Returns are historical and are calculated by determining the percentage change in net asset value with all distributions reinvested and do not reflect the effect of sales charges. |
| (4) | Total expenses do not reflect amounts reimbursed and/or waived by the adviser and certain of its affiliates, if applicable. Net expenses are net of all reductions and represent the net expenses paid by the Fund. |
| (5) | Includes a reduction by the investment adviser of a portion of its adviser fee due to the Fund’s investment in the Liquidity Fund (equal to less than 0.005% of average daily net assets for the years ended December 31, 2024, 2023 and 2022). |
9
See Notes to Financial Statements.
Eaton Vance
Large-Cap Value Fund
December 31, 2024
Financial Highlights — continued
| | Class I |
| | Year Ended December 31, |
| | 2024 | 2023 | 2022 | 2021 | 2020 |
| Net asset value — Beginning of year | $23.81 | $22.74 | $24.38 | $21.09 | $21.07 |
| Income (Loss) From Operations | | | | | |
| Net investment income(1) | $0.33 | $0.31 | $0.31 | $0.31 | $0.32 |
| Net realized and unrealized gain (loss) | 2.50 | 1.52 | (0.93) | 4.82 | 0.15(2) |
| Total income (loss) from operations | $2.83 | $1.83 | $(0.62) | $5.13 | $0.47 |
| Less Distributions | | | | | |
| From net investment income | $(0.32) | $(0.29) | $(0.31) | $(0.30) | $(0.30) |
| From net realized gain | (0.81) | (0.47) | (0.71) | (1.54) | (0.15) |
| Total distributions | $(1.13) | $(0.76) | $(1.02) | $(1.84) | $(0.45) |
| Net asset value — End of year | $25.51 | $23.81 | $22.74 | $24.38 | $21.09 |
| Total Return(3) | 11.79% | 8.20% | (2.56)% | 24.64% | 2.52% |
| Ratios/Supplemental Data | | | | | |
| Net assets, end of year (000’s omitted) | $713,529 | $704,292 | $786,104 | $841,350 | $768,930 |
| Ratios (as a percentage of average daily net assets):(4) | | | | | |
| Total expenses | 0.75% | 0.78% | 0.76% | 0.76% | 0.79% |
| Net expenses | 0.75%(5) | 0.78%(5) | 0.76%(5) | 0.76% | 0.79% |
| Net investment income | 1.28% | 1.37% | 1.32% | 1.31% | 1.72% |
| Portfolio Turnover | 75% | 68% | 65% | 56% | 65% |
| (1) | Computed using average shares outstanding. |
| (2) | The per share amount is not in accord with the net realized and unrealized gain (loss) for the period because of the timing of Fund share transactions and the amount of the per share realized and unrealized gains and losses at such time. |
| (3) | Returns are historical and are calculated by determining the percentage change in net asset value with all distributions reinvested. |
| (4) | Total expenses do not reflect amounts reimbursed and/or waived by the adviser and certain of its affiliates, if applicable. Net expenses are net of all reductions and represent the net expenses paid by the Fund. |
| (5) | Includes a reduction by the investment adviser of a portion of its adviser fee due to the Fund’s investment in the Liquidity Fund (equal to less than 0.005% of average daily net assets for the years ended December 31, 2024, 2023 and 2022). |
10
See Notes to Financial Statements.
Eaton Vance
Large-Cap Value Fund
December 31, 2024
Financial Highlights — continued
| | Class R |
| | Year Ended December 31, |
| | 2024 | 2023 | 2022 | 2021 | 2020 |
| Net asset value — Beginning of year | $23.62 | $22.56 | $24.19 | $20.94 | $20.92 |
| Income (Loss) From Operations | | | | | |
| Net investment income(1) | $0.20 | $0.20 | $0.19 | $0.19 | $0.23 |
| Net realized and unrealized gain (loss) | 2.47 | 1.50 | (0.92) | 4.78 | 0.15(2) |
| Total income (loss) from operations | $2.67 | $1.70 | $(0.73) | $4.97 | $0.38 |
| Less Distributions | | | | | |
| From net investment income | $(0.19) | $(0.17) | $(0.19) | $(0.18) | $(0.21) |
| From net realized gain | (0.81) | (0.47) | (0.71) | (1.54) | (0.15) |
| Total distributions | $(1.00) | $(0.64) | $(0.90) | $(1.72) | $(0.36) |
| Net asset value — End of year | $25.29 | $23.62 | $22.56 | $24.19 | $20.94 |
| Total Return(3) | 11.20% | 7.66% | (3.04)% | 24.01% | 2.03% |
| Ratios/Supplemental Data | | | | | |
| Net assets, end of year (000’s omitted) | $33,995 | $38,492 | $41,954 | $49,462 | $47,772 |
| Ratios (as a percentage of average daily net assets):(4) | | | | | |
| Total expenses | 1.25% | 1.28% | 1.26% | 1.26% | 1.29% |
| Net expenses | 1.25%(5) | 1.28%(5) | 1.26%(5) | 1.26% | 1.29% |
| Net investment income | 0.77% | 0.87% | 0.81% | 0.81% | 1.23% |
| Portfolio Turnover | 75% | 68% | 65% | 56% | 65% |
| (1) | Computed using average shares outstanding. |
| (2) | The per share amount is not in accord with the net realized and unrealized gain (loss) for the period because of the timing of Fund share transactions and the amount of the per share realized and unrealized gains and losses at such time. |
| (3) | Returns are historical and are calculated by determining the percentage change in net asset value with all distributions reinvested. |
| (4) | Total expenses do not reflect amounts reimbursed and/or waived by the adviser and certain of its affiliates, if applicable. Net expenses are net of all reductions and represent the net expenses paid by the Fund. |
| (5) | Includes a reduction by the investment adviser of a portion of its adviser fee due to the Fund’s investment in the Liquidity Fund (equal to less than 0.005% of average daily net assets for the years ended December 31, 2024, 2023 and 2022). |
11
See Notes to Financial Statements.
Eaton Vance
Large-Cap Value Fund
December 31, 2024
Financial Highlights — continued
| | Class R6 |
| | Year Ended December 31, |
| | 2024 | 2023 | 2022 | 2021 | 2020 |
| Net asset value — Beginning of year | $23.83 | $22.76 | $24.40 | $21.11 | $21.08 |
| Income (Loss) From Operations | | | | | |
| Net investment income(1) | $0.34 | $0.33 | $0.32 | $0.33 | $0.34 |
| Net realized and unrealized gain (loss) | 2.51 | 1.51 | (0.93) | 4.82 | 0.16(2) |
| Total income (loss) from operations | $2.85 | $1.84 | $(0.61) | $5.15 | $0.50 |
| Less Distributions | | | | | |
| From net investment income | $(0.34) | $(0.30) | $(0.32) | $(0.32) | $(0.32) |
| From net realized gain | (0.81) | (0.47) | (0.71) | (1.54) | (0.15) |
| Total distributions | $(1.15) | $(0.77) | $(1.03) | $(1.86) | $(0.47) |
| Net asset value — End of year | $25.53 | $23.83 | $22.76 | $24.40 | $21.11 |
| Total Return(3) | 11.85% | 8.26% | (2.50)% | 24.69% | 2.64% |
| Ratios/Supplemental Data | | | | | |
| Net assets, end of year (000’s omitted) | $94,641 | $105,046 | $115,269 | $96,311 | $68,343 |
| Ratios (as a percentage of average daily net assets):(4) | | | | | |
| Total expenses | 0.70% | 0.71% | 0.71% | 0.70% | 0.72% |
| Net expenses | 0.70%(5) | 0.71%(5) | 0.71%(5) | 0.70% | 0.72% |
| Net investment income | 1.33% | 1.44% | 1.38% | 1.39% | 1.80% |
| Portfolio Turnover | 75% | 68% | 65% | 56% | 65% |
| (1) | Computed using average shares outstanding. |
| (2) | The per share amount is not in accord with the net realized and unrealized gain (loss) for the period because of the timing of Fund share transactions and the amount of the per share realized and unrealized gains and losses at such time. |
| (3) | Returns are historical and are calculated by determining the percentage change in net asset value with all distributions reinvested. |
| (4) | Total expenses do not reflect amounts reimbursed and/or waived by the adviser and certain of its affiliates, if applicable. Net expenses are net of all reductions and represent the net expenses paid by the Fund. |
| (5) | Includes a reduction by the investment adviser of a portion of its adviser fee due to the Fund’s investment in the Liquidity Fund (equal to less than 0.005% of average daily net assets for the years ended December 31, 2024, 2023 and 2022). |
12
See Notes to Financial Statements.
Eaton Vance
Large-Cap Value Fund
December 31, 2024
Notes to Financial Statements
1 Significant Accounting Policies
Eaton Vance Large-Cap Value Fund (the Fund) is a diversified series of Eaton Vance Special Investment Trust (the Trust). The Trust is a Massachusetts business trust registered under the Investment Company Act of 1940, as amended (the 1940 Act), as an open-end management investment company. The Fund’s investment objective is to seek total return. The Fund offers five classes of shares. Class A shares are generally sold subject to a sales charge imposed at time of purchase. Class C shares are sold at net asset value and are generally subject to a contingent deferred sales charge (see Note 5). Effective November 5, 2020, Class C shares automatically convert to Class A shares eight years after their purchase as described in the Fund’s prospectus. Class I, Class R and Class R6 shares are sold at net asset value and are not subject to a sales charge.
Each class represents a pro rata interest in the Fund, but votes separately on class-specific matters and (as noted below) is subject to different expenses. Realized and unrealized gains and losses and net investment income and losses, other than class-specific expenses, are allocated daily to each class of shares based on the relative net assets of each class to the total net assets of the Fund. Sub-accounting, recordkeeping and similar administrative fees payable to financial intermediaries, which are a component of transfer and dividend disbursing agent fees on the Statement of Operations, are not allocated to Class R6 shares. Each class of shares differs in its distribution plan and certain other class-specific expenses.
The following is a summary of significant accounting policies of the Fund. The policies are in conformity with accounting principles generally accepted in the United States of America (U.S. GAAP). The Fund is an investment company and follows accounting and reporting guidance in the Financial Accounting Standards Board (FASB) Accounting Standards Codification Topic 946.
A Investment Valuation—The following methodologies are used to determine the market value or fair value of investments.
Equity Securities. Equity securities listed on a U.S. securities exchange generally are valued at the last sale or closing price on the day of valuation or, if no sales took place on such date, at the mean between the closing bid and ask prices on the exchange where such securities are principally traded. Equity securities listed on the NASDAQ National Market System are valued at the NASDAQ official closing price. Unlisted or listed securities for which closing sales prices or closing quotations are not available are valued at the mean between the latest available bid and ask prices.
Foreign Securities and Currencies. Foreign securities and currencies are valued in U.S. dollars, based on foreign currency exchange rate quotations supplied by a third party pricing service. The pricing service uses a proprietary model to determine the exchange rate. Inputs to the model include reported trades and implied bid/ask spreads. The daily valuation of exchange-traded foreign securities generally is determined as of the close of trading on the principal exchange on which such securities trade. Events occurring after the close of trading on foreign exchanges may result in adjustments to the valuation of foreign securities to more accurately reflect their fair value as of the close of regular trading on the New York Stock Exchange. When valuing foreign equity securities that meet certain criteria, the Fund's Trustees have approved the use of a fair value service that values such securities to reflect market trading that occurs after the close of the applicable foreign markets of comparable securities or other instruments that have a strong correlation to the fair-valued securities.
Other. Investments in management investment companies (including money market funds) that do not trade on an exchange are valued at the net asset value as of the close of each business day.
Fair Valuation. In connection with Rule 2a-5 of the 1940 Act, the Trustees have designated the Fund’s investment adviser as its valuation designee. Investments for which valuations or market quotations are not readily available or are deemed unreliable are valued by the investment adviser, as valuation designee, at fair value using methods that most fairly reflect the security’s “fair value”, which is the amount that the Fund might reasonably expect to receive for the security upon its current sale in the ordinary course. Each such determination is based on a consideration of relevant factors, which are likely to vary from one pricing context to another. These factors may include, but are not limited to, the type of security, the existence of any contractual restrictions on the security’s disposition, the price and extent of public trading in similar securities of the issuer or of comparable companies or entities, quotations or relevant information obtained from broker/dealers or other market participants, information obtained from the issuer, analysts, and/or the appropriate stock exchange (for exchange-traded securities), an analysis of the company’s or entity’s financial statements, and an evaluation of the forces that influence the issuer and the market(s) in which the security is purchased and sold.
B Investment Transactions—Investment transactions for financial statement purposes are accounted for on a trade date basis. Realized gains and losses on investments sold are determined on the basis of identified cost.
C Income—Dividend income is recorded on the ex-dividend date for dividends received in cash and/or securities. However, if the ex-dividend date has passed, certain dividends from foreign securities are recorded as the Fund is informed of the ex-dividend date. Withholding taxes on foreign dividends and capital gains have been provided for in accordance with the Fund's understanding of the applicable countries’ tax rules and rates. In consideration of recent decisions rendered by European courts, the Fund has filed additional tax reclaims for previously withheld taxes on dividends earned in certain European Union countries (the “EU reclaims”). These filings are subject to various administrative and judicial proceedings within these countries. Due to the uncertainty as to the ultimate resolution of these proceedings, the likelihood of receipt of these EU reclaims, and the potential timing of payment, the EU reclaims are recorded as income only when the likelihood of their receipt becomes certain.
Eaton Vance
Large-Cap Value Fund
December 31, 2024
Notes to Financial Statements — continued
D Federal Taxes—The Fund's policy is to comply with the provisions of the Internal Revenue Code applicable to regulated investment companies and to distribute to shareholders each year substantially all of its net investment income, and all or substantially all of its net realized capital gains. Accordingly, no provision for federal income or excise tax is necessary.
As of December 31, 2024, the Fund had no uncertain tax positions that would require financial statement recognition, de-recognition, or disclosure. The Fund files a U.S. federal income tax return annually after its fiscal year-end, which is subject to examination by the Internal Revenue Service for a period of three years from the date of filing.
E Expenses—The majority of expenses of the Trust are directly identifiable to an individual fund. Expenses which are not readily identifiable to a specific fund are allocated taking into consideration, among other things, the nature and type of expense and the relative size of the funds.
F Foreign Currency Translation—Investment valuations, other assets, and liabilities initially expressed in foreign currencies are translated each business day into U.S. dollars based upon current exchange rates. Purchases and sales of foreign investment securities and income and expenses denominated in foreign currencies are translated into U.S. dollars based upon currency exchange rates in effect on the respective dates of such transactions. Recognized gains or losses on investment transactions attributable to changes in foreign currency exchange rates are recorded for financial statement purposes as net realized gains and losses on investments. That portion of unrealized gains and losses on investments that results from fluctuations in foreign currency exchange rates is not separately disclosed.
G Use of Estimates—The preparation of the financial statements in conformity with U.S. GAAP requires management to make estimates and assumptions that affect the reported amounts of assets and liabilities at the date of the financial statements and the reported amounts of income and expense during the reporting period. Actual results could differ from those estimates.
H Indemnifications—Under the Trust’s organizational documents, its officers and Trustees may be indemnified against certain liabilities and expenses arising out of the performance of their duties to the Fund. Under Massachusetts law, if certain conditions prevail, shareholders of a Massachusetts business trust (such as the Trust) could be deemed to have personal liability for the obligations of the Trust. However, the Trust’s Declaration of Trust contains an express disclaimer of liability on the part of Fund shareholders and the By-laws provide that the Trust shall assume, upon request by the shareholder, the defense on behalf of any Fund shareholders. Moreover, the By-laws also provide for indemnification out of Fund property of any shareholder held personally liable solely by reason of being or having been a shareholder for all loss or expense arising from such liability. Additionally, in the normal course of business, the Fund enters into agreements with service providers that may contain indemnification clauses. The Fund’s maximum exposure under these arrangements is unknown as this would involve future claims that may be made against the Fund that have not yet occurred.
I Segment Reporting—During the year ended December 31, 2024, the Fund adopted FASB Accounting Standards Update No. 2023-07, Segment Reporting (Topic 280): Improvements to Reportable Segment Disclosures, (ASU 2023-07), which requires incremental disclosures related to a public entity’s reportable segments. The Fund operates as a single reportable segment, an investment company whose investment objective is included in Note 1. In connection with the adoption of ASU 2023-07, the Fund’s President has been designated as the Fund’s Chief Operating Decision Maker (CODM), who is responsible for assessing the performance of the Fund’s single segment and deciding how to allocate the segment’s resources. To perform this function, the CODM reviews the information in the Fund’s Financial Statements.
2 Distributions to Shareholders and Income Tax Information
It is the present policy of the Fund to make quarterly distributions of all or substantially all of its net investment income and to distribute annually all or substantially all of its net realized capital gains. Distributions to shareholders are recorded on the ex-dividend date. Distributions are declared separately for each class of shares. Shareholders may reinvest income and capital gain distributions in additional shares of the same class of the Fund at the net asset value as of the ex-dividend date or, at the election of the shareholder, receive distributions in cash. Distributions to shareholders are determined in accordance with income tax regulations, which may differ from U.S. GAAP. As required by U.S. GAAP, only distributions in excess of tax basis earnings and profits are reported in the financial statements as a return of capital. Permanent differences between book and tax accounting relating to distributions are reclassified to paid-in capital. For tax purposes, distributions from short-term capital gains are considered to be from ordinary income.
The tax character of distributions declared for the years ended December 31, 2024 and December 31, 2023 was as follows:
| | Year Ended December 31, |
| | 2024 | 2023 |
| Ordinary income | $16,623,326 | $17,015,957 |
| Long-term capital gains | $45,346,937 | $28,085,848 |
Eaton Vance
Large-Cap Value Fund
December 31, 2024
Notes to Financial Statements — continued
During the year ended December 31, 2024, distributable earnings was decreased by $55,620,215 and paid-in capital was increased by $55,620,215 due to the Fund’s use of equalization accounting and differences between book and tax accounting for redemptions in-kind. Tax equalization accounting allows the Fund to treat as a distribution that portion of redemption proceeds representing a redeeming shareholder’s portion of undistributed taxable income and net capital gains. These reclassifications had no effect on the net assets or net asset value per share of the Fund.
As of December 31, 2023, the components of distributable earnings (accumulated loss) on a tax basis were as follows:
| Undistributed ordinary income | $ 167,421 |
| Undistributed long-term capital gains | 32,759,973 |
| Net unrealized appreciation | 271,102,086 |
| Distributable earnings | $304,029,480 |
The cost and unrealized appreciation (depreciation) of investments of the Fund at December 31, 2024, as determined on a federal income tax basis, were as follows:
| Aggregate cost | $1,180,303,370 |
| Gross unrealized appreciation | $294,026,267 |
| Gross unrealized depreciation | (22,923,119) |
| Net unrealized appreciation | $271,103,148 |
3 Investment Adviser Fee and Other Transactions with Affiliates
The investment adviser fee is earned by Boston Management and Research (BMR), an indirect, wholly-owned subsidiary of Morgan Stanley, as compensation for investment advisory services rendered to the Fund. The fee is computed at an annual rate as a percentage of the Fund’s average daily net assets as follows and is payable monthly:
| Average Daily Net Assets | Annual Fee Rate |
| Up to $2 billion | 0.625% |
| $2 billion but less than $5 billion | 0.600% |
| $5 billion but less than $10 billion | 0.575% |
| $10 billion but less than $15 billion | 0.555% |
| $15 billion but less than $20 billion | 0.540% |
| $20 billion but less than $25 billion | 0.530% |
| $25 billion and over | 0.520% |
For the year ended December 31, 2024, the investment adviser fee amounted to $9,274,556 or 0.625% of the Fund’s average daily net assets. The Fund may invest in a money market fund, the Institutional Class of the Morgan Stanley Institutional Liquidity Funds - Government Portfolio (the “Liquidity Fund”), an open-end management investment company managed by Morgan Stanley Investment Management Inc., a wholly-owned subsidiary of Morgan Stanley. The investment adviser fee paid by the Fund is reduced by an amount equal to its pro rata share of the advisory and administration fees paid by the Fund due to its investment in the Liquidity Fund. For the year ended December 31, 2024, the investment adviser fee paid was reduced by $25,315 relating to the Fund’s investment in the Liquidity Fund. Eaton Vance Management (EVM), an affiliate of BMR and an indirect, wholly-owned subsidiary of Morgan Stanley, serves as the administrator of the Fund, but receives no compensation.
EVM provides sub-transfer agency and related services to the Fund pursuant to a Sub-Transfer Agency Support Services Agreement. For the year ended December 31, 2024, EVM earned $84,916 from the Fund pursuant to such agreement, which is included in transfer and dividend disbursing agent fees on the Statement of Operations. The Fund was informed that Eaton Vance Distributors, Inc. (EVD), an affiliate of EVM and the Fund’s principal underwriter, received $7,310 as its portion of the sales charge on sales of Class A shares for the year ended December 31, 2024. The Fund was informed that Morgan Stanley affiliated broker-dealers, which may be deemed to be affiliates of EVM, BMR and EVD, also received a portion of the sales charge on sales of Class A shares for the year ended December 31, 2024 in the amount of $5,079. EVD also received distribution and service fees from Class A, Class C and Class R shares (see Note 4) and contingent deferred sales charges (see Note 5).
Eaton Vance
Large-Cap Value Fund
December 31, 2024
Notes to Financial Statements — continued
Trustees and officers of the Fund who are members of EVM’s or BMR’s organizations receive remuneration for their services to the Fund out of the investment adviser fee. Trustees of the Fund who are not affiliated with the investment adviser may elect to defer receipt of all or a percentage of their annual fees in accordance with the terms of the Trustees Deferred Compensation Plan. Certain officers and Trustees of the Fund are officers of the above organizations.
4 Distribution Plans
The Fund has in effect a distribution plan for Class A shares (Class A Plan) pursuant to Rule 12b-1 under the 1940 Act. Pursuant to the Class A Plan, the Fund pays EVD a distribution and service fee of 0.25% per annum of its average daily net assets attributable to Class A shares for distribution services and facilities provided to the Fund by EVD, as well as for personal services and/or the maintenance of shareholder accounts. Distribution and service fees paid or accrued to EVD for the year ended December 31, 2024 amounted to $1,526,232 for Class A shares.
The Fund also has in effect distribution plans for Class C shares (Class C Plan) and Class R shares (Class R Plan) pursuant to Rule 12b-1 under the 1940 Act. Pursuant to the Class C Plan, the Fund pays EVD amounts equal to 0.75% per annum of its average daily net assets attributable to Class C shares for providing ongoing distribution services and facilities to the Fund. For the year ended December 31, 2024, the Fund paid or accrued to EVD $92,188 for Class C shares.
The Class R Plan requires the Fund to pay EVD an amount up to 0.50% per annum of its average daily net assets attributable to Class R shares for providing ongoing distribution services and facilities to the Fund. The Trustees of the Trust have currently limited Class R distribution payments to 0.25% per annum of the average daily net assets attributable to Class R shares. For the year ended December 31, 2024, the Fund paid or accrued to EVD $94,639 for Class R shares.
Pursuant to the Class C and Class R Plans, the Fund also makes payments of service fees to EVD, financial intermediaries and other persons in amounts equal to 0.25% per annum of its average daily net assets attributable to that class. Service fees paid or accrued are for personal services and/or the maintenance of shareholder accounts. They are separate and distinct from the sales commissions and distribution fees payable to EVD. Service fees paid or accrued for the year ended December 31, 2024 amounted to $30,729 and $94,639 for Class C and Class R shares, respectively.
Distribution and service fees are subject to the limitations contained in the Financial Industry Regulatory Authority Rule 2341(d).
5 Contingent Deferred Sales Charges
A contingent deferred sales charge (CDSC) of 1% generally is imposed on redemptions of Class C shares made within 12 months of purchase. Class A shares may be subject to a 1% CDSC if redeemed within 12 months of purchase (depending on the circumstances of purchase). Generally, the CDSC is based upon the lower of the net asset value at date of redemption or date of purchase. No charge is levied on shares acquired by reinvestment of dividends or capital gain distributions. For the year ended December 31, 2024, the Fund was informed that EVD received less than $100 and $424 of CDSCs paid by Class A and Class C shareholders, respectively.
6 Purchases and Sales of Investments
Purchases and sales of investments, other than short-term obligations and in-kind transactions, aggregated $1,099,297,283 and $1,132,851,005, respectively, for the year ended December 31, 2024. In-kind sales for the year ended December 31, 2024 aggregated $123,542,391.
Eaton Vance
Large-Cap Value Fund
December 31, 2024
Notes to Financial Statements — continued
7 Shares of Beneficial Interest
The Fund’s Declaration of Trust permits the Trustees to issue an unlimited number of full and fractional shares of beneficial interest (without par value). Such shares may be issued in a number of different series (such as the Fund) and classes. Sales and redemptions of Class I shares include shares purchased and redeemed in connection with the ReFlow liquidity program, a program designed to provide an alternative liquidity source for mutual funds experiencing net redemptions of their shares. Transactions in Fund shares, including direct exchanges pursuant to share class conversions, were as follows:
| | Year Ended
December 31, 2024 | | Year Ended
December 31, 2023 |
| | Shares | Amount | | Shares | Amount |
| Class A | | | | | |
| Sales | 882,327 | $ 22,473,256 | | 1,066,383 | $ 24,329,547 |
| Issued to shareholders electing to receive payments of distributions in Fund shares | 844,119 | 22,139,420 | | 694,393 | 15,722,094 |
| Redemptions | (3,432,321) | (87,249,264) | | (4,248,782) | (96,362,892) |
| Net decrease | (1,705,875) | $(42,636,588) | | (2,488,006) | $(56,311,251) |
| Class C | | | | | |
| Sales | 54,839 | $ 1,373,474 | | 88,828 | $ 2,048,686 |
| Issued to shareholders electing to receive payments of distributions in Fund shares | 12,630 | 335,843 | | 11,023 | 251,399 |
| Redemptions | (189,013) | (4,792,678) | | (242,186) | (5,540,480) |
| Net decrease | (121,544) | $ (3,083,361) | | (142,335) | $ (3,240,395) |
| Class I | | | | | |
| Sales | 8,094,249 | $206,654,149 | | 11,047,494 | $252,816,591 |
| Issued to shareholders electing to receive payments of distributions in Fund shares | 1,013,736 | 26,678,691 | | 865,082 | 19,677,957 |
| Redemptions | (10,711,991) | (272,900,250) | | (16,902,275) | (385,496,834) |
| Net decrease | (1,604,006) | $(39,567,410) | | (4,989,699) | $(113,002,286) |
| Class R | | | | | |
| Sales | 126,558 | $ 3,192,757 | | 178,546 | $ 4,053,377 |
| Issued to shareholders electing to receive payments of distributions in Fund shares | 52,378 | 1,371,379 | | 46,283 | 1,044,891 |
| Redemptions | (464,555) | (11,858,835) | | (454,814) | (10,232,588) |
| Net decrease | (285,619) | $ (7,294,699) | | (229,985) | $ (5,134,320) |
| Class R6 | | | | | |
| Sales | 348,872 | $ 9,015,591 | | 1,821,435 | $ 41,712,495 |
| Issued to shareholders electing to receive payments of distributions in Fund shares | 141,177 | 3,714,746 | | 128,718 | 2,931,489 |
| Redemptions | (1,190,423) | (30,128,074) | | (2,606,767) | (60,263,415) |
| Net decrease | (700,374) | $(17,397,737) | | (656,614) | $(15,619,431) |
Eaton Vance
Large-Cap Value Fund
December 31, 2024
Notes to Financial Statements — continued
8 Line of Credit
The Fund participates with other portfolios and funds managed by BMR and its affiliates in a $650 million unsecured revolving line of credit agreement with a group of banks, which is in effect through October 21, 2025. Borrowings are made by the Fund solely for temporary purposes related to redemptions and other short-term cash needs. Interest is charged to the Fund based on its borrowings generally at an amount above either the Secured Overnight Financing Rate (SOFR) or Federal Funds rate. In addition, a fee computed at an annual rate of 0.15% on the daily unused portion of the line of credit is allocated among the participating portfolios and funds at the end of each quarter. In connection with the renewal of the agreement in October 2024, an arrangement fee totaling $150,000 was incurred that was allocated to the participating portfolios and funds. Because the line of credit is not available exclusively to the Fund, it may be unable to borrow some or all of its requested amounts at any particular time. The Fund did not have any significant borrowings or allocated fees during the year ended December 31, 2024.
9 Securities Lending Agreement
The Fund has established a securities lending agreement with State Street Bank and Trust Company (SSBT) as securities lending agent in which the Fund lends portfolio securities to qualified borrowers in exchange for collateral consisting of either cash or securities issued or guaranteed by the U.S. government or its agencies or instrumentalities in an amount at least equal to the market value of the securities on loan. The market value of securities loaned is determined daily and any additional required collateral is delivered to the Fund on the next business day. Cash collateral is invested in the State Street Navigator Securities Lending Government Money Market Portfolio, a money market fund registered under the 1940 Act. The Fund earns interest on the amount invested but it must pay (and at times receive from) the broker a loan rebate fee computed as a varying percentage of the collateral received. For security loans secured by non-cash collateral, the Fund earns a negotiated lending fee from the borrower. A portion of the income earned by the Fund from its investment of cash collateral, net of rebate fees, and lending fees received is allocated to SSBT for its services as lending agent and the portion allocated to the Fund is presented as securities lending income, net on the Statement of Operations. Non-cash collateral is held by the lending agent on behalf of the Fund and cannot be sold or re-pledged by the Fund; accordingly, such collateral is not reflected in the Statement of Assets and Liabilities.
The Fund is subject to possible delay in the recovery of loaned securities. Pursuant to the securities lending agreement, SSBT has provided indemnification to the Fund in the event of default by a borrower with respect to a loan. The Fund bears the risk of loss with respect to the investment of cash collateral.
At December 31, 2024, the value of the securities loaned and the value of the collateral received, which exceeded the value of the securities loaned, amounted to $10,629,776 and $10,892,657, respectively. Collateral received was comprised of cash of $1,554,864 and U.S. government and/or agencies securities of $9,337,793. The securities lending transactions have no contractual maturity date and each of the Fund and borrower has the option to terminate a loan at any time.
The following table provides a breakdown of securities lending transactions accounted for as secured borrowings, the obligations by class of collateral pledged, and the remaining contractual maturity of those transactions as of December 31, 2024.
| | Remaining Contractual Maturity of the Transactions |
| | Overnight and
Continuous | <30 days | 30 to 90 days | >90 days | Total |
| Common Stocks | $1,554,864 | $ — | $ — | $ — | $1,554,864 |
The carrying amount of the liability for collateral for securities loaned at December 31, 2024 approximated its fair value. If measured at fair value, such liability would have been considered as Level 2 in the fair value hierarchy (see Note 11) at December 31, 2024.
10 Affiliated Investments
At December 31, 2024, the value of the Fund's investment in funds that may be deemed to be affiliated was $10,834,635, which represents 0.7% of the Fund's net assets. Transactions in such investments by the Fund for the year ended December 31, 2024 were as follows:
| Name | Value,
beginning
of period | Purchases | Sales
proceeds | Net realized
gain (loss) | Change in
unrealized
appreciation
(depreciation) | Value, end
of period | Dividend
income | Shares,
end of period |
| Short-Term Investments |
| Liquidity Fund | $6,634,055 | $455,690,358 | $(451,489,778) | $ — | $ — | $10,834,635 | $901,602 | 10,834,635 |
Eaton Vance
Large-Cap Value Fund
December 31, 2024
Notes to Financial Statements — continued
11 Fair Value Measurements
Under generally accepted accounting principles for fair value measurements, a three-tier hierarchy to prioritize the assumptions, referred to as inputs, is used in valuation techniques to measure fair value. The three-tier hierarchy of inputs is summarized in the three broad levels listed below.
| • | Level 1 – quoted prices in active markets for identical investments |
| • | Level 2 – other significant observable inputs (including quoted prices for similar investments, interest rates, prepayment speeds, credit risk, etc.) |
| • | Level 3 – significant unobservable inputs (including a fund's own assumptions in determining the fair value of investments) |
In cases where the inputs used to measure fair value fall in different levels of the fair value hierarchy, the level disclosed is determined based on the lowest level input that is significant to the fair value measurement in its entirety. The inputs or methodology used for valuing securities are not necessarily an indication of the risk associated with investing in those securities.
At December 31, 2024, the hierarchy of inputs used in valuing the Fund's investments, which are carried at fair value, were as follows:
| Asset Description | Level 1 | Level 2 | Level 3 | Total |
| Common Stocks: | | | | |
| Communication Services | $ 68,073,409 | $ — | $ — | $ 68,073,409 |
| Consumer Discretionary | 75,990,248 | — | — | 75,990,248 |
| Consumer Staples | 100,305,422 | — | — | 100,305,422 |
| Energy | 97,417,256 | — | — | 97,417,256 |
| Financials | 260,097,199 | 12,107,191 | — | 272,204,390 |
| Health Care | 272,065,827 | — | — | 272,065,827 |
| Industrials | 231,539,211 | — | — | 231,539,211 |
| Information Technology | 103,459,189 | — | — | 103,459,189 |
| Materials | 59,899,491 | — | — | 59,899,491 |
| Real Estate | 73,899,094 | — | — | 73,899,094 |
| Utilities | 84,163,482 | — | — | 84,163,482 |
| Total Common Stocks | $1,426,909,828 | $12,107,191* | $ — | $1,439,017,019 |
| Short-Term Investments: | | | | |
| Affiliated Fund | $ 10,834,635 | $ — | $ — | $ 10,834,635 |
| Securities Lending Collateral | 1,554,864 | — | — | 1,554,864 |
| Total Investments | $1,439,299,327 | $ 12,107,191 | $ — | $1,451,406,518 |
| * | Includes foreign equity securities whose values were adjusted to reflect market trading of comparable securities or other correlated instruments that occurred after the close of trading in their applicable foreign markets. |
Eaton Vance
Large-Cap Value Fund
December 31, 2024
Report of Independent Registered Public Accounting Firm
To the Trustees of Eaton Vance Special Investment Trust and Shareholders of Eaton Vance Large-Cap Value Fund:
Opinion on the Financial Statements and Financial Highlights
We have audited the accompanying statement of assets and liabilities of Eaton Vance Large-Cap Value Fund (the “Fund”) (one of the funds constituting Eaton Vance Special Investment Trust), including the portfolio of investments, as of December 31, 2024, the related statement of operations for the year then ended, the statements of changes in net assets for each of the two years in the period then ended, the financial highlights for each of the five years in the period then ended, and the related notes. In our opinion, the financial statements and financial highlights present fairly, in all material respects, the financial position of the Fund as of December 31, 2024, and the results of its operations for the year then ended, the changes in its net assets for each of the two years in the period then ended, and the financial highlights for each of the five years in the period then ended, in conformity with accounting principles generally accepted in the United States of America.
Basis for Opinion
These financial statements and financial highlights are the responsibility of the Fund's management. Our responsibility is to express an opinion on the Fund's financial statements and financial highlights based on our audits. We are a public accounting firm registered with the Public Company Accounting Oversight Board (United States) (PCAOB) and are required to be independent with respect to the Fund in accordance with the U.S. federal securities laws and the applicable rules and regulations of the Securities and Exchange Commission and the PCAOB.
We conducted our audits in accordance with the standards of the PCAOB. Those standards require that we plan and perform the audit to obtain reasonable assurance about whether the financial statements and financial highlights are free of material misstatement, whether due to error or fraud. The Fund is not required to have, nor were we engaged to perform, an audit of its internal control over financial reporting. As part of our audits, we are required to obtain an understanding of internal control over financial reporting but not for the purpose of expressing an opinion on the effectiveness of the Fund’s internal control over financial reporting. Accordingly, we express no such opinion.
Our audits included performing procedures to assess the risks of material misstatement of the financial statements and financial highlights, whether due to error or fraud, and performing procedures that respond to those risks. Such procedures included examining, on a test basis, evidence regarding the amounts and disclosures in the financial statements and financial highlights. Our audits also included evaluating the accounting principles used and significant estimates made by management, as well as evaluating the overall presentation of the financial statements and financial highlights. Our procedures included confirmation of securities owned as of December 31, 2024, by correspondence with the custodian and brokers; when replies were not received from brokers, we performed other auditing procedures. We believe that our audits provide a reasonable basis for our opinion.
/s/ Deloitte & Touche LLP
Boston, Massachusetts
February 21, 2025
We have served as the auditor of one or more Eaton Vance investment companies since 1959.
Eaton Vance
Large-Cap Value Fund
December 31, 2024
Federal Tax Information (Unaudited)
The Form 1099-DIV you received in February 2025 showed the tax status of all distributions paid to your account in calendar year 2024. Shareholders are advised to consult their own tax adviser with respect to the tax consequences of their investment in the Fund. As required by the Internal Revenue Code and/or regulations, shareholders must be notified regarding the status of qualified dividend income for individuals, the dividends received deduction for corporations and capital gains dividends.
Qualified Dividend Income. For the fiscal year ended December 31, 2024, the Fund designates approximately $25,748,724, or up to the maximum amount of such dividends allowable pursuant to the Internal Revenue Code, as qualified dividend income eligible for the reduced tax rate of 15%.
Dividends Received Deduction. Corporate shareholders are generally entitled to take the dividends received deduction on the portion of the Fund’s dividend distribution that qualifies under tax law. For the Fund’s fiscal 2024 ordinary income dividends, 100% qualifies for the corporate dividends received deduction.
Capital Gains Dividends. The Fund hereby designates as a capital gain dividend with respect to the taxable year ended December 31, 2024, $84,842,512 or, if subsequently determined to be different, the net capital gain of such year.
This Page Intentionally Left Blank
This Page Intentionally Left Blank
This Page Intentionally Left Blank
Eaton Vance
Small-Cap Fund
Annual Financial Statements and
Additional Information
December 31, 2024
This report must be preceded or accompanied by a current summary prospectus or prospectus. Before investing, investors should consider carefully the investment objective, risks, and charges and expenses of a mutual fund. This and other important information is contained in the prospectus and/or statement of additional information, which can be obtained by calling 1-800-262-1122 or from a financial intermediary. Prospective investors should read the prospectus carefully before investing.
Annual Financial Statements and Additional Information December 31, 2024
Eaton Vance
Small-Cap Fund
Items 8, 9 and 11 of Form N-CSR are Not Applicable. For Item 10 of Form N-CSR, see Item 7.
Eaton Vance
Small-Cap Fund
December 31, 2024
| Security | Shares | Value |
| Aerospace & Defense — 2.6% |
| Hexcel Corp. | | 26,265 | $ 1,646,816 |
| Woodward, Inc. | | 16,825 | 2,800,016 |
| | | | $ 4,446,832 |
| Automobile Components — 2.5% |
| Dorman Products, Inc.(1) | | 33,111 | $ 4,289,530 |
| | | | $ 4,289,530 |
| Banks — 10.4% |
| Commerce Bancshares, Inc. | | 80,548 | $ 5,018,946 |
| Community Financial System, Inc. | | 68,277 | 4,211,325 |
| First Financial Bankshares, Inc. | | 89,796 | 3,237,146 |
| SouthState Corp. | | 37,955 | 3,775,763 |
| Stock Yards Bancorp, Inc. | | 20,918 | 1,497,938 |
| | | | $ 17,741,118 |
| Building Products — 5.8% |
| AAON, Inc. | | 25,222 | $ 2,968,125 |
| AZEK Co., Inc.(1) | | 64,890 | 3,080,328 |
| CSW Industrials, Inc. | | 5,933 | 2,093,163 |
| Hayward Holdings, Inc.(1) | | 111,508 | 1,704,957 |
| | | | $ 9,846,573 |
| Capital Markets — 4.3% |
| Cohen & Steers, Inc. | | 36,275 | $ 3,349,633 |
| Stifel Financial Corp. | | 37,271 | 3,953,708 |
| | | | $ 7,303,341 |
| Chemicals — 2.4% |
| Balchem Corp. | | 10,053 | $ 1,638,589 |
| Quaker Chemical Corp. | | 17,596 | 2,476,813 |
| | | | $ 4,115,402 |
| Consumer Staples Distribution & Retail — 2.3% |
| Casey's General Stores, Inc. | | 1,946 | $ 771,064 |
| Chefs' Warehouse, Inc.(1) | | 17,963 | 885,935 |
| Performance Food Group Co.(1) | | 26,167 | 2,212,420 |
| | | | $ 3,869,419 |
| Security | Shares | Value |
| Containers & Packaging — 2.7% |
| AptarGroup, Inc. | | 29,382 | $ 4,615,912 |
| | | | $ 4,615,912 |
| Distributors — 0.8% |
| LKQ Corp. | | 35,541 | $ 1,306,132 |
| | | | $ 1,306,132 |
| Diversified Consumer Services — 1.0% |
| Bright Horizons Family Solutions, Inc.(1) | | 16,032 | $ 1,777,147 |
| | | | $ 1,777,147 |
| Diversified REITs — 2.7% |
| Essential Properties Realty Trust, Inc. | | 145,676 | $ 4,556,745 |
| | | | $ 4,556,745 |
| Electric Utilities — 2.2% |
| IDACORP, Inc. | | 33,564 | $ 3,667,874 |
| | | | $ 3,667,874 |
| Electronic Equipment, Instruments & Components — 1.6% |
| Badger Meter, Inc. | | 13,101 | $ 2,778,984 |
| | | | $ 2,778,984 |
| Financial Services — 1.2% |
| Euronet Worldwide, Inc.(1) | | 19,767 | $ 2,032,838 |
| | | | $ 2,032,838 |
| Food Products — 1.4% |
| J&J Snack Foods Corp. | | 10,744 | $ 1,666,717 |
| Lancaster Colony Corp. | | 4,328 | 749,350 |
| | | | $ 2,416,067 |
| Ground Transportation — 1.4% |
| Landstar System, Inc. | | 14,309 | $ 2,459,145 |
| | | | $ 2,459,145 |
| Health Care Equipment & Supplies — 1.7% |
| Integer Holdings Corp.(1) | | 15,160 | $ 2,009,003 |
| Neogen Corp.(1) | | 78,657 | 954,896 |
| | | | $ 2,963,899 |
| Health Care Providers & Services — 7.0% |
| Addus HomeCare Corp.(1) | | 28,036 | $ 3,514,313 |
| Chemed Corp. | | 5,660 | 2,998,668 |
1
See Notes to Financial Statements.
Eaton Vance
Small-Cap Fund
December 31, 2024
Portfolio of Investments — continued
| Security | Shares | Value |
| Health Care Providers & Services (continued) |
| Option Care Health, Inc.(1) | | 101,426 | $ 2,353,083 |
| U.S. Physical Therapy, Inc. | | 34,747 | 3,082,406 |
| | | | $ 11,948,470 |
| Hotels, Restaurants & Leisure — 5.6% |
| Aramark | | 86,433 | $ 3,224,815 |
| Choice Hotels International, Inc. | | 6,069 | 861,677 |
| Texas Roadhouse, Inc. | | 3,695 | 666,689 |
| Wyndham Hotels & Resorts, Inc. | | 48,023 | 4,840,238 |
| | | | $ 9,593,419 |
| Household Durables — 0.4% |
| Meritage Homes Corp. | | 4,626 | $ 711,571 |
| | | | $ 711,571 |
| Industrial REITs — 3.0% |
| EastGroup Properties, Inc. | | 17,132 | $ 2,749,515 |
| Terreno Realty Corp. | | 40,525 | 2,396,648 |
| | | | $ 5,146,163 |
| Insurance — 8.1% |
| AMERISAFE, Inc. | | 26,621 | $ 1,372,046 |
| First American Financial Corp. | | 25,047 | 1,563,935 |
| RLI Corp. | | 22,423 | 3,695,983 |
| Selective Insurance Group, Inc. | | 34,929 | 3,266,560 |
| White Mountains Insurance Group Ltd. | | 1,993 | 3,876,505 |
| | | | $ 13,775,029 |
| Machinery — 8.3% |
| Albany International Corp., Class A | | 32,428 | $ 2,593,267 |
| Atmus Filtration Technologies, Inc. | | 59,380 | 2,326,508 |
| Donaldson Co., Inc. | | 30,099 | 2,027,168 |
| ESCO Technologies, Inc. | | 17,497 | 2,330,775 |
| Franklin Electric Co., Inc. | | 23,853 | 2,324,475 |
| Middleby Corp.(1) | | 18,532 | 2,510,160 |
| | | | $ 14,112,353 |
| Media — 0.5% |
| John Wiley & Sons, Inc., Class A | | 19,817 | $ 866,201 |
| | | | $ 866,201 |
| Professional Services — 2.8% |
| CBIZ, Inc.(1) | | 59,083 | $ 4,834,762 |
| | | | $ 4,834,762 |
| Security | Shares | Value |
| Semiconductors & Semiconductor Equipment — 2.6% |
| Allegro MicroSystems, Inc.(1) | | 77,182 | $ 1,687,199 |
| Diodes, Inc.(1) | | 31,106 | 1,918,307 |
| Universal Display Corp. | | 5,331 | 779,392 |
| | | | $ 4,384,898 |
| Software — 4.9% |
| CCC Intelligent Solutions Holdings, Inc.(1) | | 242,942 | $ 2,849,710 |
| Clearwater Analytics Holdings, Inc., Class A(1) | | 61,958 | 1,705,084 |
| nCino, Inc.(1) | | 23,438 | 787,048 |
| Progress Software Corp. | | 24,816 | 1,616,762 |
| SPS Commerce, Inc.(1) | | 8,045 | 1,480,200 |
| | | | $ 8,438,804 |
| Specialized REITs — 0.9% |
| CubeSmart | | 36,837 | $ 1,578,466 |
| | | | $ 1,578,466 |
| Specialty Retail — 3.5% |
| Group 1 Automotive, Inc. | | 4,513 | $ 1,902,139 |
| RH(1) | | 2,662 | 1,047,737 |
| Valvoline, Inc.(1) | | 81,985 | 2,966,217 |
| | | | $ 5,916,093 |
| Textiles, Apparel & Luxury Goods — 0.3% |
| Steven Madden Ltd. | | 9,860 | $ 419,247 |
| | | | $ 419,247 |
| Trading Companies & Distributors — 3.1% |
| Core & Main, Inc., Class A(1) | | 80,106 | $ 4,078,197 |
| Herc Holdings, Inc. | | 6,122 | 1,159,078 |
| | | | $ 5,237,275 |
Total Common Stocks
(identified cost $128,716,578) | | | $167,149,709 |
2
See Notes to Financial Statements.
Eaton Vance
Small-Cap Fund
December 31, 2024
Portfolio of Investments — continued
| Short-Term Investments — 2.1% |
| Security | Shares | Value |
| Morgan Stanley Institutional Liquidity Funds - Government Portfolio, Institutional Class, 4.43%(2) | | 3,597,661 | $ 3,597,661 |
Total Short-Term Investments
(identified cost $3,597,661) | | | $ 3,597,661 |
Total Investments — 100.1%
(identified cost $132,314,239) | | | $170,747,370 |
| Other Assets, Less Liabilities — (0.1)% | | | $ (110,762) |
| Net Assets — 100.0% | | | $170,636,608 |
| The percentage shown for each investment category in the Portfolio of Investments is based on net assets. |
| (1) | Non-income producing security. |
| (2) | May be deemed to be an affiliated investment company (see Note 9). The rate shown is the annualized seven-day yield as of December 31, 2024. |
| Abbreviations: |
| REITs | – Real Estate Investment Trusts |
3
See Notes to Financial Statements.
Eaton Vance
Small-Cap Fund
December 31, 2024
Statement of Assets and Liabilities
| | December 31, 2024 |
| Assets | |
| Unaffiliated investments, at value (identified cost $128,716,578) | $167,149,709 |
| Affiliated investments, at value (identified cost $3,597,661) | 3,597,661 |
| Dividends receivable | 167,255 |
| Dividends receivable from affiliated investments | 12,464 |
| Receivable for Fund shares sold | 61,397 |
| Receivable from affiliates | 26,938 |
| Trustees' deferred compensation plan | 18,772 |
| Total assets | $171,034,196 |
| Liabilities | |
| Payable for Fund shares redeemed | $107,995 |
| Payable to affiliates: | |
| Investment adviser fee | 112,104 |
| Administration fee | 22,501 |
| Distribution and service fees | 11,345 |
| Trustees' fees | 2,578 |
| Trustees' deferred compensation plan | 18,772 |
| Payable for custodian fee | 27,691 |
| Payable for transfer and dividend disbursing agent fees | 32,502 |
| Payable for legal and accounting services | 44,935 |
| Accrued expenses | 17,165 |
| Total liabilities | $397,588 |
| Net Assets | $170,636,608 |
| Sources of Net Assets | |
| Paid-in capital | $130,234,220 |
| Distributable earnings | 40,402,388 |
| Net Assets | $170,636,608 |
| Class A Shares | |
| Net Assets | $26,663,574 |
| Shares Outstanding | 1,730,385 |
Net Asset Value and Redemption Price Per Share
(net assets ÷ shares of beneficial interest outstanding) | $15.41 |
Maximum Offering Price Per Share
(100 ÷ 94.75 of net asset value per share) | $16.26 |
| Class C Shares | |
| Net Assets | $5,146,319 |
| Shares Outstanding | 454,043 |
Net Asset Value and Offering Price Per Share*
(net assets ÷ shares of beneficial interest outstanding) | $11.33 |
| Class I Shares | |
| Net Assets | $136,856,032 |
| Shares Outstanding | 7,676,232 |
Net Asset Value, Offering Price and Redemption Price Per Share
(net assets ÷ shares of beneficial interest outstanding) | $17.83 |
4
See Notes to Financial Statements.
Eaton Vance
Small-Cap Fund
December 31, 2024
Statement of Assets and Liabilities — continued
| | December 31, 2024 |
| Class R Shares | |
| Net Assets | $1,970,683 |
| Shares Outstanding | 136,759 |
Net Asset Value, Offering Price and Redemption Price Per Share
(net assets ÷ shares of beneficial interest outstanding) | $14.41 |
| On sales of $50,000 or more, the offering price of Class A shares is reduced. |
| * | Redemption price per share is equal to the net asset value less any applicable contingent deferred sales charge. |
5
See Notes to Financial Statements.
Eaton Vance
Small-Cap Fund
December 31, 2024
| | Year Ended |
| | December 31, 2024 |
| Investment Income | |
| Dividend income | $2,046,058 |
| Dividend income from affiliated investments | 151,774 |
| Total investment income | $2,197,832 |
| Expenses | |
| Investment adviser fee | $1,238,083 |
| Administration fee | 247,617 |
| Distribution and service fees: | |
| Class A | 63,368 |
| Class C | 48,607 |
| Class R | 7,080 |
| Trustees’ fees and expenses | 10,367 |
| Custodian fee | 47,219 |
| Transfer and dividend disbursing agent fees | 139,465 |
| Legal and accounting services | 53,580 |
| Printing and postage | 22,384 |
| Registration fees | 62,496 |
| Miscellaneous | 18,907 |
| Total expenses | $1,959,173 |
| Deduct: | |
| Waiver and/or reimbursement of expenses by affiliates | $257,479 |
| Total expense reductions | $257,479 |
| Net expenses | $1,701,694 |
| Net investment income | $496,138 |
| Realized and Unrealized Gain (Loss) | |
| Net realized gain (loss): | |
| Investment transactions | $7,283,735 |
| Net realized gain | $7,283,735 |
| Change in unrealized appreciation (depreciation): | |
| Investments | $10,851,249 |
| Net change in unrealized appreciation (depreciation) | $10,851,249 |
| Net realized and unrealized gain | $18,134,984 |
| Net increase in net assets from operations | $18,631,122 |
6
See Notes to Financial Statements.
Eaton Vance
Small-Cap Fund
December 31, 2024
Statements of Changes in Net Assets
| | Year Ended December 31, |
| | 2024 | 2023 |
| Increase (Decrease) in Net Assets | | |
| From operations: | | |
| Net investment income | $496,138 | $450,681 |
| Net realized gain | 7,283,735 | 2,351,334 |
| Net change in unrealized appreciation (depreciation) | 10,851,249 | 12,763,011 |
| Net increase in net assets from operations | $18,631,122 | $15,565,026 |
| Distributions to shareholders: | | |
| Class A | $(680,887) | $(154,952) |
| Class C | (170,710) | (33,613) |
| Class I | (3,331,054) | (990,384) |
| Class R | (60,736) | (3,353) |
| Total distributions to shareholders | $(4,243,387) | $(1,182,302) |
| Transactions in shares of beneficial interest: | | |
| Class A | $516,394 | $299,740 |
| Class C | 340,200 | 834,998 |
| Class I | 10,320 | 11,471,668 |
| Class R | 946,896 | 454,713 |
| Net increase in net assets from Fund share transactions | $1,813,810 | $13,061,119 |
| Net increase in net assets | $16,201,545 | $27,443,843 |
| Net Assets | | |
| At beginning of year | $154,435,063 | $126,991,220 |
| At end of year | $170,636,608 | $154,435,063 |
7
See Notes to Financial Statements.
Eaton Vance
Small-Cap Fund
December 31, 2024
| | Class A |
| | Year Ended December 31, |
| | 2024 | 2023 | 2022 | 2021 | 2020 |
| Net asset value — Beginning of year | $14.11 | $12.77 | $15.59 | $14.69 | $13.19 |
| Income (Loss) From Operations | | | | | |
| Net investment income (loss)(1) | $0.02 | $0.02 | $(0.00)(2) | $(0.04) | $0.00(2) |
| Net realized and unrealized gain (loss) | 1.69 | 1.42 | (2.41) | 3.10 | 1.66 |
| Total income (loss) from operations | $1.71 | $1.44 | $(2.41) | $3.06 | $1.66 |
| Less Distributions | | | | | |
| From net investment income | $(0.02) | $(0.02) | $— | $— | $— |
| From net realized gain | (0.39) | (0.08) | (0.41) | (2.16) | (0.16) |
| Total distributions | $(0.41) | $(0.10) | $(0.41) | $(2.16) | $(0.16) |
| Net asset value — End of year | $15.41 | $14.11 | $12.77 | $15.59 | $14.69 |
| Total Return(3) | 11.93% | 11.28% | (15.53)% | 21.18% | 12.73% |
| Ratios/Supplemental Data | | | | | |
| Net assets, end of year (000’s omitted) | $26,664 | $24,053 | $21,475 | $28,882 | $26,683 |
| Ratios (as a percentage of average daily net assets):(4) | | | | | |
| Total expenses | 1.36% | 1.38% | 1.39% | 1.38% | 1.46% |
| Net expenses | 1.21%(5) | 1.21%(5) | 1.21%(5) | 1.21% | 1.21% |
| Net investment income (loss) | 0.12% | 0.14% | (0.02)% | (0.25)% | 0.01% |
| Portfolio Turnover | 38% | 42% | 53% | 55% | 71% |
| (1) | Computed using average shares outstanding. |
| (2) | Amount is less than $0.005 or $(0.005), as applicable. |
| (3) | Returns are historical and are calculated by determining the percentage change in net asset value with all distributions reinvested and do not reflect the effect of sales charges. |
| (4) | Total expenses do not reflect amounts reimbursed and/or waived by the adviser and certain of its affiliates, if applicable. Net expenses are net of all reductions and represent the net expenses paid by the Fund. |
| (5) | Includes a reduction by the investment adviser of a portion of its adviser fee due to the Fund’s investment in the Liquidity Fund (equal to less than 0.005% of average daily net assets for the years ended December 31, 2024, 2023 and 2022). |
8
See Notes to Financial Statements.
Eaton Vance
Small-Cap Fund
December 31, 2024
Financial Highlights — continued
| | Class C |
| | Year Ended December 31, |
| | 2024 | 2023 | 2022 | 2021 | 2020 |
| Net asset value — Beginning of year | $10.53 | $9.61 | $11.88 | $11.63 | $10.55 |
| Income (Loss) From Operations | | | | | |
| Net investment loss(1) | $(0.07) | $(0.06) | $(0.08) | $(0.13) | $(0.07) |
| Net realized and unrealized gain (loss) | 1.26 | 1.06 | (1.83) | 2.44 | 1.31 |
| Total income (loss) from operations | $1.19 | $1.00 | $(1.91) | $2.31 | $1.24 |
| Less Distributions | | | | | |
| From net realized gain | $(0.39) | $(0.08) | $(0.36) | $(2.06) | $(0.16) |
| Total distributions | $(0.39) | $(0.08) | $(0.36) | $(2.06) | $(0.16) |
| Net asset value — End of year | $11.33 | $10.53 | $9.61 | $11.88 | $11.63 |
| Total Return(2) | 11.06% | 10.46% | (16.17)% | 20.25% | 11.93% |
| Ratios/Supplemental Data | | | | | |
| Net assets, end of year (000’s omitted) | $5,146 | $4,469 | $3,299 | $3,254 | $3,517 |
| Ratios (as a percentage of average daily net assets):(3) | | | | | |
| Total expenses | 2.11% | 2.13% | 2.14% | 2.13% | 2.21% |
| Net expenses | 1.96%(4) | 1.96%(4) | 1.96%(4) | 1.96% | 1.96% |
| Net investment loss | (0.62)% | (0.59)% | (0.74)% | (1.01)% | (0.76)% |
| Portfolio Turnover | 38% | 42% | 53% | 55% | 71% |
| (1) | Computed using average shares outstanding. |
| (2) | Returns are historical and are calculated by determining the percentage change in net asset value with all distributions reinvested and do not reflect the effect of sales charges. |
| (3) | Total expenses do not reflect amounts reimbursed and/or waived by the adviser and certain of its affiliates, if applicable. Net expenses are net of all reductions and represent the net expenses paid by the Fund. |
| (4) | Includes a reduction by the investment adviser of a portion of its adviser fee due to the Fund’s investment in the Liquidity Fund (equal to less than 0.005% of average daily net assets for the years ended December 31, 2024, 2023 and 2022). |
9
See Notes to Financial Statements.
Eaton Vance
Small-Cap Fund
December 31, 2024
Financial Highlights — continued
| | Class I |
| | Year Ended December 31, |
| | 2024 | 2023 | 2022 | 2021 | 2020 |
| Net asset value — Beginning of year | $16.26 | $14.70 | $17.87 | $16.57 | $14.83 |
| Income (Loss) From Operations | | | | | |
| Net investment income(1) | $0.06 | $0.06 | $0.04 | $0.00(2) | $0.04 |
| Net realized and unrealized gain (loss) | 1.96 | 1.63 | (2.76) | 3.51 | 1.87 |
| Total income (loss) from operations | $2.02 | $1.69 | $(2.72) | $3.51 | $1.91 |
| Less Distributions | | | | | |
| From net investment income | $(0.06) | $(0.05) | $(0.02) | $(0.02) | $(0.01) |
| From net realized gain | (0.39) | (0.08) | (0.43) | (2.19) | (0.16) |
| Total distributions | $(0.45) | $(0.13) | $(0.45) | $(2.21) | $(0.17) |
| Net asset value — End of year | $17.83 | $16.26 | $14.70 | $17.87 | $16.57 |
| Total Return(3) | 12.23% | 11.54% | (15.31)% | 21.46% | 13.05% |
| Ratios/Supplemental Data | | | | | |
| Net assets, end of year (000’s omitted) | $136,856 | $124,995 | $101,802 | $111,052 | $82,716 |
| Ratios (as a percentage of average daily net assets):(4) | | | | | |
| Total expenses | 1.11% | 1.13% | 1.14% | 1.13% | 1.21% |
| Net expenses | 0.96%(5) | 0.96%(5) | 0.96%(5) | 0.96% | 0.96% |
| Net investment income | 0.37% | 0.40% | 0.25% | 0.01% | 0.27% |
| Portfolio Turnover | 38% | 42% | 53% | 55% | 71% |
| (1) | Computed using average shares outstanding. |
| (2) | Amount is less than $0.005. |
| (3) | Returns are historical and are calculated by determining the percentage change in net asset value with all distributions reinvested. |
| (4) | Total expenses do not reflect amounts reimbursed and/or waived by the adviser and certain of its affiliates, if applicable. Net expenses are net of all reductions and represent the net expenses paid by the Fund. |
| (5) | Includes a reduction by the investment adviser of a portion of its adviser fee due to the Fund’s investment in the Liquidity Fund (equal to less than 0.005% of average daily net assets for the years ended December 31, 2024, 2023 and 2022). |
10
See Notes to Financial Statements.
Eaton Vance
Small-Cap Fund
December 31, 2024
Financial Highlights — continued
| | Class R |
| | Year Ended December 31, |
| | 2024 | 2023 | 2022 | 2021 | 2020 |
| Net asset value — Beginning of year | $13.25 | $12.01 | $14.69 | $13.93 | $12.54 |
| Income (Loss) From Operations | | | | | |
| Net investment loss(1) | $(0.01) | $(0.01) | $(0.03) | $(0.08) | $(0.03) |
| Net realized and unrealized gain (loss) | 1.57 | 1.33 | (2.27) | 2.93 | 1.58 |
| Total income (loss) from operations | $1.56 | $1.32 | $(2.30) | $2.85 | $1.55 |
| Less Distributions | | | | | |
| From net investment income | $(0.01) | $— | $— | $— | $— |
| From net realized gain | (0.39) | (0.08) | (0.38) | (2.09) | (0.16) |
| Total distributions | $(0.40) | $(0.08) | $(0.38) | $(2.09) | $(0.16) |
| Net asset value — End of year | $14.41 | $13.25 | $12.01 | $14.69 | $13.93 |
| Total Return(2) | 11.61% | 11.03% | (15.73)% | 20.82% | 12.51% |
| Ratios/Supplemental Data | | | | | |
| Net assets, end of year (000’s omitted) | $1,971 | $917 | $414 | $455 | $569 |
| Ratios (as a percentage of average daily net assets):(3) | | | | | |
| Total expenses | 1.61% | 1.63% | 1.64% | 1.63% | 1.71% |
| Net expenses | 1.46%(4) | 1.46%(4) | 1.46%(4) | 1.46% | 1.46% |
| Net investment loss | (0.07)% | (0.10)% | (0.25)% | (0.53)% | (0.25)% |
| Portfolio Turnover | 38% | 42% | 53% | 55% | 71% |
| (1) | Computed using average shares outstanding. |
| (2) | Returns are historical and are calculated by determining the percentage change in net asset value with all distributions reinvested. |
| (3) | Total expenses do not reflect amounts reimbursed and/or waived by the adviser and certain of its affiliates, if applicable. Net expenses are net of all reductions and represent the net expenses paid by the Fund. |
| (4) | Includes a reduction by the investment adviser of a portion of its adviser fee due to the Fund’s investment in the Liquidity Fund (equal to less than 0.005% of average daily net assets for the years ended December 31, 2024, 2023 and 2022). |
11
See Notes to Financial Statements.
Eaton Vance
Small-Cap Fund
December 31, 2024
Notes to Financial Statements
1 Significant Accounting Policies
Eaton Vance Small-Cap Fund (the Fund) is a diversified series of Eaton Vance Special Investment Trust (the Trust). The Trust is a Massachusetts business trust registered under the Investment Company Act of 1940, as amended (the 1940 Act), as an open-end management investment company. The Fund’s investment objective is to seek long-term capital appreciation. The Fund offers four classes of shares. Class A shares are generally sold subject to a sales charge imposed at time of purchase. Class C shares are sold at net asset value and are generally subject to a contingent deferred sales charge (see Note 5). Effective November 5, 2020, Class C shares automatically convert to Class A shares eight years after their purchase as described in the Fund’s prospectus. Class I and Class R shares are sold at net asset value and are not subject to a sales charge. Each class represents a pro rata interest in the Fund, but votes separately on class-specific matters and (as noted below) is subject to different expenses. Realized and unrealized gains and losses and net investment income and losses, other than class-specific expenses, are allocated daily to each class of shares based on the relative net assets of each class to the total net assets of the Fund. Each class of shares differs in its distribution plan and certain other class-specific expenses.
The following is a summary of significant accounting policies of the Fund. The policies are in conformity with accounting principles generally accepted in the United States of America (U.S. GAAP). The Fund is an investment company and follows accounting and reporting guidance in the Financial Accounting Standards Board (FASB) Accounting Standards Codification Topic 946.
A Investment Valuation—The following methodologies are used to determine the market value or fair value of investments.
Equity Securities. Equity securities listed on a U.S. securities exchange generally are valued at the last sale or closing price on the day of valuation or, if no sales took place on such date, at the mean between the closing bid and ask prices on the exchange where such securities are principally traded. Equity securities listed on the NASDAQ National Market System are valued at the NASDAQ official closing price. Unlisted or listed securities for which closing sales prices or closing quotations are not available are valued at the mean between the latest available bid and ask prices.
Other. Investments in management investment companies (including money market funds) that do not trade on an exchange are valued at the net asset value as of the close of each business day.
Fair Valuation. In connection with Rule 2a-5 of the 1940 Act, the Trustees have designated the Fund’s investment adviser as its valuation designee. Investments for which valuations or market quotations are not readily available or are deemed unreliable are valued by the investment adviser, as valuation designee, at fair value using methods that most fairly reflect the security’s “fair value”, which is the amount that the Fund might reasonably expect to receive for the security upon its current sale in the ordinary course. Each such determination is based on a consideration of relevant factors, which are likely to vary from one pricing context to another. These factors may include, but are not limited to, the type of security, the existence of any contractual restrictions on the security’s disposition, the price and extent of public trading in similar securities of the issuer or of comparable companies or entities, quotations or relevant information obtained from broker/dealers or other market participants, information obtained from the issuer, analysts, and/or the appropriate stock exchange (for exchange-traded securities), an analysis of the company’s or entity’s financial statements, and an evaluation of the forces that influence the issuer and the market(s) in which the security is purchased and sold.
B Investment Transactions—Investment transactions for financial statement purposes are accounted for on a trade date basis. Realized gains and losses on investments sold are determined on the basis of identified cost.
C Income—Dividend income is recorded on the ex-dividend date for dividends received in cash and/or securities.
D Federal Taxes—The Fund's policy is to comply with the provisions of the Internal Revenue Code applicable to regulated investment companies and to distribute to shareholders each year substantially all of its net investment income, and all or substantially all of its net realized capital gains. Accordingly, no provision for federal income or excise tax is necessary.
As of December 31, 2024, the Fund had no uncertain tax positions that would require financial statement recognition, de-recognition, or disclosure. The Fund files a U.S. federal income tax return annually after its fiscal year-end, which is subject to examination by the Internal Revenue Service for a period of three years from the date of filing.
E Expenses—The majority of expenses of the Trust are directly identifiable to an individual fund. Expenses which are not readily identifiable to a specific fund are allocated taking into consideration, among other things, the nature and type of expense and the relative size of the funds.
F Use of Estimates—The preparation of the financial statements in conformity with U.S. GAAP requires management to make estimates and assumptions that affect the reported amounts of assets and liabilities at the date of the financial statements and the reported amounts of income and expense during the reporting period. Actual results could differ from those estimates.
G Indemnifications—Under the Trust’s organizational documents, its officers and Trustees may be indemnified against certain liabilities and expenses arising out of the performance of their duties to the Fund. Under Massachusetts law, if certain conditions prevail, shareholders of a Massachusetts business trust (such as the Trust) could be deemed to have personal liability for the obligations of the Trust. However, the Trust’s Declaration of Trust contains an express disclaimer of liability on the part of Fund shareholders and the By-laws provide that the Trust shall assume, upon request by the shareholder, the defense on behalf of any Fund shareholders. Moreover, the By-laws also provide for indemnification out of Fund property of any shareholder held personally liable solely by reason of being or having been a shareholder for all loss or expense arising from such liability. Additionally, in the normal course of business,
Eaton Vance
Small-Cap Fund
December 31, 2024
Notes to Financial Statements — continued
the Fund enters into agreements with service providers that may contain indemnification clauses. The Fund’s maximum exposure under these arrangements is unknown as this would involve future claims that may be made against the Fund that have not yet occurred.
H Segment Reporting—During the year ended December 31, 2024, the Fund adopted FASB Accounting Standards Update No. 2023-07, Segment Reporting (Topic 280): Improvements to Reportable Segment Disclosures, (ASU 2023-07), which requires incremental disclosures related to a public entity’s reportable segments. The Fund operates as a single reportable segment, an investment company whose investment objective is included in Note 1. In connection with the adoption of ASU 2023-07, the Fund’s President has been designated as the Fund’s Chief Operating Decision Maker (CODM), who is responsible for assessing the performance of the Fund’s single segment and deciding how to allocate the segment’s resources. To perform this function, the CODM reviews the information in the Fund’s Financial Statements.
2 Distributions to Shareholders and Income Tax Information
It is the present policy of the Fund to make at least one distribution annually (normally in December) of all or substantially all of its net investment income and to distribute annually all or substantially all of its net realized capital gains. Distributions to shareholders are recorded on the ex-dividend date. Distributions are declared separately for each class of shares. Shareholders may reinvest income and capital gain distributions in additional shares of the same class of the Fund at the net asset value as of the ex-dividend date or, at the election of the shareholder, receive distributions in cash. Distributions to shareholders are determined in accordance with income tax regulations, which may differ from U.S. GAAP. As required by U.S. GAAP, only distributions in excess of tax basis earnings and profits are reported in the financial statements as a return of capital. Permanent differences between book and tax accounting relating to distributions are reclassified to paid-in capital. For tax purposes, distributions from short-term capital gains are considered to be from ordinary income.
The tax character of distributions declared for the years ended December 31, 2024 and December 31, 2023 was as follows:
| | Year Ended December 31, |
| | 2024 | 2023 |
| Ordinary income | $460,256 | $383,393 |
| Long-term capital gains | $3,783,131 | $798,909 |
During the year ended December 31, 2024, distributable earnings was decreased by $743,821 and paid-in capital was increased by $743,821 due to the Fund’s use of equalization accounting. Tax equalization accounting allows the Fund to treat as a distribution that portion of redemption proceeds representing a redeeming shareholder’s portion of undistributed taxable income and net capital gains. These reclassifications had no effect on the net assets or net asset value per share of the Fund.
As of December 31, 2024, the components of distributable earnings (accumulated loss) on a tax basis were as follows:
| Undistributed ordinary income | $ 19,296 |
| Undistributed long-term capital gains | 3,326,202 |
| Net unrealized appreciation | 37,056,890 |
| Distributable earnings | $40,402,388 |
The cost and unrealized appreciation (depreciation) of investments of the Fund at December 31, 2024, as determined on a federal income tax basis, were as follows:
| Aggregate cost | $133,690,480 |
| Gross unrealized appreciation | $41,373,833 |
| Gross unrealized depreciation | (4,316,943) |
| Net unrealized appreciation | $37,056,890 |
Eaton Vance
Small-Cap Fund
December 31, 2024
Notes to Financial Statements — continued
3 Investment Adviser Fee and Other Transactions with Affiliates
The investment adviser fee is earned by Boston Management and Research (BMR), an indirect, wholly-owned subsidiary of Morgan Stanley, as compensation for investment advisory services rendered to the Fund. The fee is computed at an annual rate as a percentage of the Fund’s average daily net assets as follows and is payable monthly:
| Average Daily Net Assets | Annual Fee Rate |
| Up to $500 million | 0.7500% |
| $500 million but less than $1 billion | 0.6875% |
| $1 billion but less than $1.5 billion | 0.6250% |
| $1.5 billion but less than $2 billion | 0.5625% |
| $2 billion but less than $3 billion | 0.5000% |
| $3 billion and over | 0.4375% |
For the year ended December 31, 2024, the Fund’s investment adviser fee amounted to $1,238,083 or 0.75% of the Fund’s average daily net assets. The Fund may invest in a money market fund, the Institutional Class of the Morgan Stanley Institutional Liquidity Funds - Government Portfolio (the “Liquidity Fund”), an open-end management investment company managed by Morgan Stanley Investment Management Inc., a wholly-owned subsidiary of Morgan Stanley. The investment adviser fee paid by the Fund is reduced by an amount equal to its pro rata share of the advisory and administration fees paid by the Fund due to its investment in the Liquidity Fund. For the year ended December 31, 2024, the investment adviser fee paid was reduced by $4,293 relating to the Fund’s investment in the Liquidity Fund.
The administration fee is earned by Eaton Vance Management (EVM), an affiliate of BMR and an indirect, wholly-owned subsidiary of Morgan Stanley, as compensation for administrative services rendered to the Fund. The fee is computed at an annual rate of 0.15% of the Fund’s average daily net assets. For the year ended December 31, 2024, the administration fee amounted to $247,617.
EVM has agreed to reimburse the Fund's expenses to the extent that total annual operating expenses (relating to ordinary operating expenses only and excluding expenses such as brokerage commissions, acquired fund fees and expenses of unaffiliated funds, borrowing costs, taxes or litigation expenses) exceed 1.21%, 1.96%, 0.96% and 1.46% of the Fund's average daily net assets for Class A, Class C, Class I and Class R, respectively. This agreement may be changed or terminated after May 1, 2025. Pursuant to this agreement, EVM waived and/or reimbursed $253,186 of the Fund's operating expenses for the year ended December 31, 2024.
EVM provides sub-transfer agency and related services to the Fund pursuant to a Sub-Transfer Agency Support Services Agreement. For the year ended December 31, 2024, EVM earned $9,601 from the Fund pursuant to such agreement, which is included in transfer and dividend disbursing agent fees on the Statement of Operations. The Fund was informed that Eaton Vance Distributors, Inc. (EVD), an affiliate of EVM and the Fund’s principal underwriter, received $10,167 as its portion of the sales charge on sales of Class A shares for the year ended December 31, 2024. The Fund was informed that Morgan Stanley affiliated broker-dealers, which may be deemed to be affiliates of EVM, BMR and EVD, also received a portion of the sales charge on sales of Class A shares for the year ended December 31, 2024 in the amount of $4,700. EVD also received distribution and service fees from Class A, Class C and Class R shares (see Note 4).
Trustees and officers of the Fund who are members of EVM’s or BMR’s organizations receive remuneration for their services to the Fund out of the investment adviser fee. Trustees of the Fund who are not affiliated with the investment adviser may elect to defer receipt of all or a percentage of their annual fees in accordance with the terms of the Trustees Deferred Compensation Plan. Certain officers and Trustees of the Fund are officers of the above organizations.
4 Distribution Plans
The Fund has in effect a distribution plan for Class A shares (Class A Plan) pursuant to Rule 12b-1 under the 1940 Act. Pursuant to the Class A Plan, the Fund pays EVD a distribution and service fee of 0.25% per annum of its average daily net assets attributable to Class A shares for distribution services and facilities provided to the Fund by EVD, as well as for personal services and/or the maintenance of shareholder accounts. Distribution and service fees paid or accrued to EVD for the year ended December 31, 2024 amounted to $63,368 for Class A shares.
The Fund also has in effect distribution plans for Class C shares (Class C Plan) and Class R shares (Class R Plan) pursuant to Rule 12b-1 under the 1940 Act. Pursuant to the Class C Plan, the Fund pays EVD amounts equal to 0.75% per annum of its average daily net assets attributable to Class C shares for providing ongoing distribution services and facilities to the Fund. For the year ended December 31, 2024, the Fund paid or accrued to EVD $36,455 for Class C shares.
Eaton Vance
Small-Cap Fund
December 31, 2024
Notes to Financial Statements — continued
The Class R Plan requires the Fund to pay EVD an amount up to 0.50% per annum of its average daily net assets attributable to Class R shares for providing ongoing distribution services and facilities to the Fund. The Trustees of the Trust have currently limited Class R distribution payments to 0.25% per annum of the average daily net assets attributable to Class R shares. For the year ended December 31, 2024, the Fund paid or accrued to EVD $3,540 for Class R shares.
Pursuant to the Class C and Class R Plans, the Fund also makes payments of service fees to EVD, financial intermediaries and other persons in amounts equal to 0.25% per annum of its average daily net assets attributable to that class. Service fees paid or accrued are for personal services and/or the maintenance of shareholder accounts. They are separate and distinct from the sales commissions and distribution fees payable to EVD. Service fees paid or accrued for the year ended December 31, 2024 amounted to $12,152 and $3,540 for Class C and Class R shares, respectively.
Distribution and service fees are subject to the limitations contained in the Financial Industry Regulatory Authority Rule 2341(d).
5 Contingent Deferred Sales Charges
A contingent deferred sales charge (CDSC) of 1% generally is imposed on redemptions of Class C shares made within 12 months of purchase. Class A shares may be subject to a 1% CDSC if redeemed within 12 months of purchase (depending on the circumstances of purchase). Generally, the CDSC is based upon the lower of the net asset value at date of redemption or date of purchase. No charge is levied on shares acquired by reinvestment of dividends or capital gain distributions. For the year ended December 31, 2024, the Fund was informed that EVD received $454 of CDSCs paid by Class C shareholders and no CDSCs paid by Class A shareholders.
6 Purchases and Sales of Investments
Purchases and sales of investments, other than short-term obligations, aggregated $61,387,598 and $66,088,285, respectively, for the year ended December 31, 2024.
7 Shares of Beneficial Interest
The Fund’s Declaration of Trust permits the Trustees to issue an unlimited number of full and fractional shares of beneficial interest (without par value). Such shares may be issued in a number of different series (such as the Fund) and classes. Transactions in Fund shares, including direct exchanges pursuant to share class conversions, were as follows:
| | Year Ended
December 31, 2024 | | Year Ended
December 31, 2023 |
| | Shares | Amount | | Shares | Amount |
| Class A | | | | | |
| Sales | 307,778 | $ 4,610,508 | | 271,873 | $ 3,715,678 |
| Issued to shareholders electing to receive payments of distributions in Fund shares | 40,551 | 659,764 | | 11,173 | 149,716 |
| Redemptions | (322,449) | (4,753,878) | | (260,690) | (3,565,654) |
| Net increase | 25,880 | $ 516,394 | | 22,356 | $ 299,740 |
| Class C | | | | | |
| Sales | 100,984 | $ 1,111,134 | | 119,883 | $ 1,231,338 |
| Issued to shareholders electing to receive payments of distributions in Fund shares | 14,249 | 170,710 | | 3,358 | 33,613 |
| Redemptions | (85,531) | (941,644) | | (42,249) | (429,953) |
| Net increase | 29,702 | $ 340,200 | | 80,992 | $ 834,998 |
Eaton Vance
Small-Cap Fund
December 31, 2024
Notes to Financial Statements — continued
| | Year Ended
December 31, 2024 | | Year Ended
December 31, 2023 |
| | Shares | Amount | | Shares | Amount |
| Class I | | | | | |
| Sales | 2,210,087 | $37,560,688 | | 2,304,439 | $35,547,563 |
| Issued to shareholders electing to receive payments of distributions in Fund shares | 175,360 | 3,302,026 | | 62,815 | 970,486 |
| Redemptions | (2,394,453) | (40,852,394) | | (1,609,362) | (25,046,381) |
| Net increase (decrease) | (9,006) | $ 10,320 | | 757,892 | $11,471,668 |
| Class R | | | | | |
| Sales | 103,036 | $ 1,445,652 | | 49,905 | $ 649,748 |
| Issued to shareholders electing to receive payments of distributions in Fund shares | 3,991 | 60,736 | | 266 | 3,353 |
| Redemptions | (39,493) | (559,492) | | (15,431) | (198,388) |
| Net increase | 67,534 | $ 946,896 | | 34,740 | $ 454,713 |
8 Line of Credit
The Fund participates with other portfolios and funds managed by EVM and its affiliates in a $650 million unsecured revolving line of credit agreement with a group of banks, which is in effect through October 21, 2025. Borrowings are made by the Fund solely for temporary purposes related to redemptions and other short-term cash needs. Interest is charged to the Fund based on its borrowings generally at an amount above either the Secured Overnight Financing Rate (SOFR) or Federal Funds rate. In addition, a fee computed at an annual rate of 0.15% on the daily unused portion of the line of credit is allocated among the participating portfolios and funds at the end of each quarter. In connection with the renewal of the agreement in October 2024, an arrangement fee $150,000 was incurred that was allocated to the participating portfolios and funds. Because the line of credit is not available exclusively to the Fund, it may be unable to borrow some or all of its requested amounts at any particular time. The Fund did not have any significant borrowings or allocated fees during the year ended December 31, 2024.
9 Affiliated Investments
At December 31, 2024, the value of the Fund's investment in funds that may be deemed to be affiliated was $3,597,661, which represents 2.1% of the Fund's net assets. Transactions in such investments by the Fund for the year ended December 31, 2024 were as follows:
| Name | Value,
beginning
of period | Purchases | Sales
proceeds | Net realized
gain (loss) | Change in
unrealized
appreciation
(depreciation) | Value, end
of period | Dividend
income | Shares,
end of period |
| Short-Term Investments |
| Liquidity Fund | $823,913 | $57,295,957 | $(54,522,209) | $ — | $ — | $3,597,661 | $151,774 | 3,597,661 |
10 Fair Value Measurements
Under generally accepted accounting principles for fair value measurements, a three-tier hierarchy to prioritize the assumptions, referred to as inputs, is used in valuation techniques to measure fair value. The three-tier hierarchy of inputs is summarized in the three broad levels listed below.
| • | Level 1 – quoted prices in active markets for identical investments |
| • | Level 2 – other significant observable inputs (including quoted prices for similar investments, interest rates, prepayment speeds, credit risk, etc.) |
| • | Level 3 – significant unobservable inputs (including a fund's own assumptions in determining the fair value of investments) |
Eaton Vance
Small-Cap Fund
December 31, 2024
Notes to Financial Statements — continued
In cases where the inputs used to measure fair value fall in different levels of the fair value hierarchy, the level disclosed is determined based on the lowest level input that is significant to the fair value measurement in its entirety. The inputs or methodology used for valuing securities are not necessarily an indication of the risk associated with investing in those securities.
At December 31, 2024, the hierarchy of inputs used in valuing the Fund's investments, which are carried at fair value, were as follows:
| Asset Description | Level 1 | Level 2 | Level 3 | Total |
| Common Stocks | $167,149,709* | $ — | $ — | $167,149,709 |
| Short-Term Investments | 3,597,661 | — | — | 3,597,661 |
| Total Investments | $ 170,747,370 | $ — | $ — | $170,747,370 |
| * | The level classification by major category of investments is the same as the category presentation in the Portfolio of Investments. |
Eaton Vance
Small-Cap Fund
December 31, 2024
Report of Independent Registered Public Accounting Firm
To the Trustees of Eaton Vance Special Investment Trust and Shareholders of Eaton Vance Small-Cap Fund:
Opinion on the Financial Statements and Financial Highlights
We have audited the accompanying statement of assets and liabilities of Eaton Vance Small-Cap Fund (the “Fund”) (one of the funds constituting Eaton Vance Special Investment Trust), including the portfolio of investments, as of December 31, 2024, the related statement of operations for the year then ended, the statements of changes in net assets for each of the two years in the period then ended, the financial highlights for each of the five years in the period then ended, and the related notes. In our opinion, the financial statements and financial highlights present fairly, in all material respects, the financial position of the Fund as of December 31, 2024, and the results of its operations for the year then ended, the changes in its net assets for each of the two years in the period then ended, and the financial highlights for each of the five years in the period then ended, in conformity with accounting principles generally accepted in the United States of America.
Basis for Opinion
These financial statements and financial highlights are the responsibility of the Fund's management. Our responsibility is to express an opinion on the Fund's financial statements and financial highlights based on our audits. We are a public accounting firm registered with the Public Company Accounting Oversight Board (United States) (PCAOB) and are required to be independent with respect to the Fund in accordance with the U.S. federal securities laws and the applicable rules and regulations of the Securities and Exchange Commission and the PCAOB.
We conducted our audits in accordance with the standards of the PCAOB. Those standards require that we plan and perform the audit to obtain reasonable assurance about whether the financial statements and financial highlights are free of material misstatement, whether due to error or fraud. The Fund is not required to have, nor were we engaged to perform, an audit of its internal control over financial reporting. As part of our audits, we are required to obtain an understanding of internal control over financial reporting but not for the purpose of expressing an opinion on the effectiveness of the Fund’s internal control over financial reporting. Accordingly, we express no such opinion.
Our audits included performing procedures to assess the risks of material misstatement of the financial statements and financial highlights, whether due to error or fraud, and performing procedures that respond to those risks. Such procedures included examining, on a test basis, evidence regarding the amounts and disclosures in the financial statements and financial highlights. Our audits also included evaluating the accounting principles used and significant estimates made by management, as well as evaluating the overall presentation of the financial statements and financial highlights. Our procedures included confirmation of securities owned as of December 31, 2024, by correspondence with the custodian and brokers; when replies were not received from brokers, we performed other auditing procedures. We believe that our audits provide a reasonable basis for our opinion.
/s/ Deloitte & Touche LLP
Boston, Massachusetts
February 21, 2025
We have served as the auditor of one or more Eaton Vance investment companies since 1959.
Eaton Vance
Small-Cap Fund
December 31, 2024
Federal Tax Information (Unaudited)
The Form 1099-DIV you received in February 2025 showed the tax status of all distributions paid to your account in calendar year 2024. Shareholders are advised to consult their own tax adviser with respect to the tax consequences of their investment in the Fund. As required by the Internal Revenue Code and/or regulations, shareholders must be notified regarding the status of qualified dividend income for individuals, the dividends received deduction for corporations and capital gains dividends.
Qualified Dividend Income. For the fiscal year ended December 31, 2024, the Fund designates approximately $1,534,143, or up to the maximum amount of such dividends allowable pursuant to the Internal Revenue Code, as qualified dividend income eligible for the reduced tax rate of 15%.
Dividends Received Deduction. Corporate shareholders are generally entitled to take the dividends received deduction on the portion of the Fund’s dividend distribution that qualifies under tax law. For the Fund’s fiscal 2024 ordinary income dividends, 100% qualifies for the corporate dividends received deduction.
Capital Gains Dividends. The Fund hereby designates as a capital gain dividend with respect to the taxable year ended December 31, 2024, $6,760,292 or, if subsequently determined to be different, the net capital gain of such year.
This Page Intentionally Left Blank
| Item 8. | Changes in and Disagreements with Accountants for Open-End Management Investment Companies |
Not applicable.
| Item 9. | Proxy Disclosures for Open-End Management Investment Companies |
Not applicable.
| Item 10. | Remuneration Paid to Directors, Officers, and Others of Open-End Management Investment Companies |
The information is disclosed as part of the Financial Statements included in Item 7 of this Form N-CSR.
| Item 11. | Statement Regarding Basis for Approval of Investment Advisory Contract |
Not applicable.
| Item 12. | Disclosure of Proxy Voting Policies and Procedures for Closed-End Management Investment Companies |
Not applicable.
| Item 13. | Portfolio Managers of Closed-End Management Investment Companies |
Not applicable.
| Item 14. | Purchases of Equity Securities by Closed-End Management Investment Company and Affiliated Purchasers |
Not applicable.
| Item 15. | Submission of Matters to a Vote of Security Holders |
There have been no material changes to the procedures by which shareholders may recommend nominee to the Fund’s Board of Trustees since the Fund last provided disclosure in response to this item.
| Item 16. | Controls and Procedures |
| (a) | It is the conclusion of the registrant’s principal executive officer and principal financial officer that the effectiveness of the registrant’s current disclosure controls and procedures (such disclosure controls and procedures having been evaluated within 90 days of the date of this filing) provide reasonable assurance that the information required to be disclosed by the registrant has been recorded, processed, summarized and reported within the time period specified in the Commission’s rules and forms and that the information required to be disclosed by the registrant has been accumulated and communicated to the registrant’s principal executive officer and principal financial officer in order to allow timely decisions regarding required disclosure. |
| (b) | There have been no changes in the registrant’s internal control over financial reporting during the period covered by this report that has materially affected, or is reasonably likely to materially affect, the registrant’s internal control over financial reporting. |
| Item 17. | Disclosure of Securities Lending Activities for Closed-End Management Investment Companies |
Not applicable.
| Item 18. | Recovery of Erroneously Awarded Compensation |
Not applicable.
| (a)(1) | Registrant’s Code of Ethics – Not applicable (please see Item 2). |
Signatures
Pursuant to the requirements of the Securities Exchange Act of 1934 and the Investment Company Act of 1940, the registrant has duly caused this report to be signed on its behalf by the undersigned, thereunto duly authorized.
Eaton Vance Special Investment Trust
| | |
| By: | | /s/ Kenneth A. Topping |
| | Kenneth A. Topping |
| | Principal Executive Officer |
| |
| Date: | | February 26, 2025 |
Pursuant to the requirements of the Securities Exchange Act of 1934 and the Investment Company Act of 1940, this report has been signed below by the following persons on behalf of the registrant and in the capacities and on the dates indicated.
| | |
| By: | | /s/ James F. Kirchner |
| | James F. Kirchner |
| | Principal Financial Officer |
| |
| Date: | | February 26, 2025 |
| | |
| By: | | /s/ Kenneth A. Topping |
| | Kenneth A. Topping |
| | Principal Executive Officer |
| |
| Date: | | February 26, 2025 |