LAW OFFICE
EDWARD FACKENTHAL
ONE MONTGOMERY PLAZA, SUITE 209
NORRISTOWN, PENNSYLVANIA 19401
PHONE: (610) 279-3370
FAX: (610) 279-0696
E-MAIL: edwardfackenthal@cs.com
January 27, 2010
U.S. Securities and Exchange Commission
Division of Investment Management
100 F Street, N.E.
Washington, DC 20549
Att’n Vincent DiStefano
Re: NRM Investment Co. - File No. 811-02955
Dear Mr. DiStefano:
Following late December 2009 comments to the Registrant’s 485APOS filing, we have restated the filing in its entirety; it is intended to be submitted in February as Amendment No. 37. Before submitting, I set forth or attach for your additional comment, if any, parts of the redraft. They are:
1. Part of Part A of the filing: SEC’s comment was in reference to the footnote to the Annual Fund Operating Expenses, namely the explanation of the difference between the percentage the Registrant is obligated to pay to its investment adviser and the actual amount paid during the reporting period. The chart is unchanged and the footnote has been changed to meet the comment. They are as follows:
| Annual Fund Operating Expenses | ||
| (Expenses deducted from the Fund’s assets) | ||
| Management Expenses | .29%1 | |
| 12b-1 Distribution Fees | None | |
| Other Expenses | 1.11% | |
| Total Annual Fund Operating Expenses | 1.40% |
1The percentage generally corresponds to the Fund’s contract with its investment advisor at an annual rate of .30% of the Fund’s portfolio value, payable quarterly, the -.01% difference in the chart being accounted for by value changes from quarter to quarter within the year and the differences between portfolio and net asset values.
2. The greater part of the December comments referred to fulfilling the requirements of 23(b) and (d) of the instructions. I attach a file responsive to this. The new filing will have updated consents by counsel and the auditor.
3. With the new 485APOS filing there will be an amended NCSR filing that will contain the financials as before with the addition of the materials in 2 above. The filing will have the SOA 906 certification as well.
4. Note that the Registrant did file its fidelity bond with the SEC.
Please let me hear from you to the effect that the foregoing changes are suitable or that additional comments are forthcoming, so that I may arrange, promptly, for the new filings.
With the assumption that Registrant’s amendment 36 became effective according to an acceleration request, the Registrant hereby represents to the SEC that it will not assert the effectiveness as a defense in any subsequent action under the Federal Securities laws brought by the SEC or any other party.
| Very truly yours, | |
| /s/Edward Fackenthal | |
| Edward Fackenthal |
Management of the Fund
The Fund is managed by its Board of Directors with the authority and responsibilities enumerated in the Pennsylvania Business Corporation Law of 1988. The Board appoints the Company's officers. The directors and officers of the Company and their addresses and principal occupations during the past five years are as follows:
Name, Address and Age | Position with Fund | During Past Five Years |
John H. McCoy* 280 Abrahams Lane Villanova, PA 19035 87 Years Old | Director, Chairman, President, Treasurer | **Former President of National Rolling Mills, Inc., a steel rolling plant. Prior thereto, he was President and Director of National Rolling Mills Co. |
Raymond H. Welsh 1735 Market Street, 36th floor, Philadelphia, Pennsylvania 19103 77 Years Old | Director | Senior vice president of UBS Financial Services, Inc. |
Joseph Fabrizio 423 Weldon Drive West Chester, Pa., 19380 51 Years Old | Director | C.P.A. for Rainer and Co., an accounting firm. |
Anthony B. Fisher 116 Glenn Road Ardmore, Pennsylvania 19003 57 Years Old | Director, Secretary | Principle of Risnychok and Associates Inc., an insurance agency specializing in surety and property and casualty insurance to the construction industry. |
George W. Connell* #3 Radnor Corporate Ctr. Suite 450 100 Matsonford Road Radnor, PA 19087 72 Years Old | Director | Vice Chairman, Director and sole shareholder of HFS, the Company's investment adviser; Vice Chairman and sole shareholder of The Haverford Trust Company; CEO and Director of Haverford Trust Securities, a broker-dealer subsidiary of The Haverford Trust Company. |
* Interested Director – Mr. McCoy owns a majority of the shares of the Company and Mr. Connell is the Principal of the Company’s Investment Adviser.
**Retired for more than five years.
Anthony Fisher is Secretary and has been an elected board member since December 2008; earlier in 2008 he was an appointed interim board member. George W. Connell is the principal officer of Haverford Financial Services, Inc., the Company’s investment adviser. Mr. Connell has been a member since 1992. Raymond Welsh has been an elected board member since December 2008; earlier in 2008 he was an appointed interim board member. Mr. Fabrizio has been a board member since 2007. John H. McCoy is President and Treasurer and has been a board member since the outset of the Fund in 1979. All directors stand for election yearly and are elected for a one-year term. Officers serve for indefinite terms at the discretion of the directors.
The Statement of Additional Information forming part of the Fund’s registration statement includes additional information about the Registrant and its directors. It is available, without charge, upon request, by calling Edward Fackenthal, counsel for the Company, collect, at (610) 279-3370, or email request to him at edwardfackenthal@cs.com.
Management’s Discussion of the Fund’s Performance
The past year in fixed income markets began with turmoil and volatility beyond any recent experience. During the month of September 2008, the markets experienced the seizure of Fannie Mae and Freddie Mac followed by the failure of Lehman Brothers and Washington Mutual as well as the rescues of AIG and Merrill Lynch. The Federal Reserve reacted with an inter-meeting move to 1.50% on October 8, 2008. The easing culminated with a move to an unprecedented 0 to 0.25% Federal Funds rate on December 16, 2008. These easing moves were combined with several strong qualitative easing moves designed to support the markets and restore what were effectively frozen credit markets. The Congress passed the Obama Administration’s stimulus bill adding more than $700 billion fiscal stimulus to counter the weak economy. Included in many other policy actions were the expansion of the Federal Reserve’s balance sheet by a trillion dollars to purchase US Treasury and Mortgage-backed Securities and the creation of a facility to purchase $700 billion in troubled assets while also investing capital directly into banks. While all of these actions were put into place in a relatively quick time, it would obviously take more time to see the impacts. There was a subsequent scare in early-March 2009 that the cumulative moves were not sufficient. This set the stage for recovering asset values in the credit markets, particularly securities of financial institutions.
During the past year, the benchmark ten-year Treasury has ranged from a high of 4.08% in October of 2008 to a low of 2.05% in December of 2008. As of August 31, 2009, the ten-year Treasury yield was 3.40%. The Treasury yield curve steepened during the year, reflecting extremely low short-term rates. The yield curve from one to ten years steepened from 165 basis points (bps) to 297 bps. The municipal yield curve similarly steepened from 204 bps to 276 bps. Credit concerns put even the highest quality municipal issues under pressure, resulting in rising long term yields even as the Federal Reserve lowered short-term rates. A notable impact on the municipal bond market was a sharp decline in the creditworthiness of the monoline bond insurers. In early 2008, the senior, unsecured debt of MBIA and AMBAC were rated Aa3/AA- and Aa3/AA, respectively. By August 2009 they were rated Ba3/BB- and Ca/CC, respectively. While these drops in credit quality were primarily related to losses stemming from sub-prime mortgage-backed issues and other structured securities, there were profound effects on the municipal bond market. New issues were now sold without depending on credit enhancement from the insurers. In the secondary market, there has been effectively no liquidity for issuers who had not procured an underlying rating whose issues were therefore solely reliant on the insurance for a credit rating.
The NRM portfolio has declined by 9.20% during the year. The Lehman 5-year Municipal Bond Index was up 6.95% over the same time period and The Merrill Lynch Index of DRD Eligible Preferred Stock declined 35.78%. (Please note that QDI and DRD are terms that describe the same dividend tax treatment to investors.) The Merrill Lynch Index had declined 68.15% from Fiscal Year-end 2008 through March 9, 2009. The subsequent recovery is an example of the improvement in financial securities discussed above. A benchmark index weighted 60% of the Barclays 5-year Municipal Index and 40% of the Merrill Lynch Preferred Stock, DRD Eligible would have returned a decline of 10.14% for the period. The municipal bond holdings have a duration of 4.08, very comparable to the Index at 4.09 as of Fiscal Year-end. The quality of the municipal holdings remains strong at A+.
Going forward, we will continue to look to add incremental yield and after-tax income for the shareholders of NRM through a top-down analysis of the economic and inflation outlooks and the resulting policy actions that impact interest rates. This is combined with sector allocation and individual security selection within the sectors employed by NRM to achieve the desired portfolio.
The following is a line graph that compares the initial and subsequent account values at the end of each of the most recently completed ten fiscal years of the Fund. It assumes a $10,000 initial investment at the beginning of the first fiscal year and an appropriate broad-based securities market index for the same period.
The next is a table providing the Fund’s average annual total returns for the 1-5- and 10-year periods as of the end of the last day of the most recent fiscal year.
NRM Investment Company Total Return Calculation Through August 31, 2009* | |||||||
Annualized Return NRM | Ending Redeemable Value $1000 Invested | ||||||
| 1 year | -9.20% | $ | 908.00 | ||||
| 5 year | -1,59% | $ | 923.22 | ||||
| 10 year | -1.24% | $ | 1,131.17 | ||||
*Respecting the foregoing graph and table, past performance does not predict future performance and they do not reflect the deduction of taxes that a shareholder would pay on fund distributions or the redemption of fund shares.
Expense Example
As a shareholder of the Fund, you incur ongoing costs including management fees and other Fund expenses. This example is intended to help you understand your ongoing costs (in dollars) of investing in the Fund and to compare these costs with the ongoing costs of investing in other mutual funds. The example is based on an investment of $1,000 invested at the beginning of the period and held for the entire period of March 1, 2009 to August 31, 2009.
Actual Expenses
The first line of the table below provides information about actual account values and actual expenses. You may use the information in this line, together with the amount you invested, to estimate the expenses that you paid over the period. Simply divide your account value by $1,000 (for example, an $8,600 account value divided by $1,000 = 8.6), then multiply the result by the number in the first line under the heading entitled “Expenses Paid During Period” to estimate the expenses you paid on your account during this period.
Hypothetical Example for Comparison Purposes
The second line of the table below provides information about hypothetical account values and hypothetical expenses based on the Fund’s actual expense ratio and an assumed rate of return of 5% per year before expenses, which is not the Fund’s actual return. The hypothetical account values and expenses may not be used to estimate the actual ending account balance or expenses you paid for the period. You may use this information to compare the ongoing costs of investing in the Fund and other funds. To do so, compare this 5% hypothetical example with the 5% hypothetical examples that appear in the shareholder reports of the other funds.
Beginning Account Value on March 1, 2009 | Ending Account Value on August 31, 2009 | Expenses Paid During Period* of March 1, 2009 to August 31. 2009 | |||||
| Actual | $1,000 | $1,289.30 | $8.44 | ||||
Hypothetical (5% return before expenses) | $1,000 | $1,025.21 | $6.71 |
*Expenses are equal to the Fund’s annualized expense ratio of 1.31%, multiplied by the average account value over the period, multiplied by 184/365 (to reflect the one-half year period). The Example assumes that the $1,000 was invested at the net asset value per share determined at the close of business on February 28, 2009.
Graphical Representation of Holdings
 | Portfolio Review NRM INVESTMENT COMPANY August 31, 2009 |
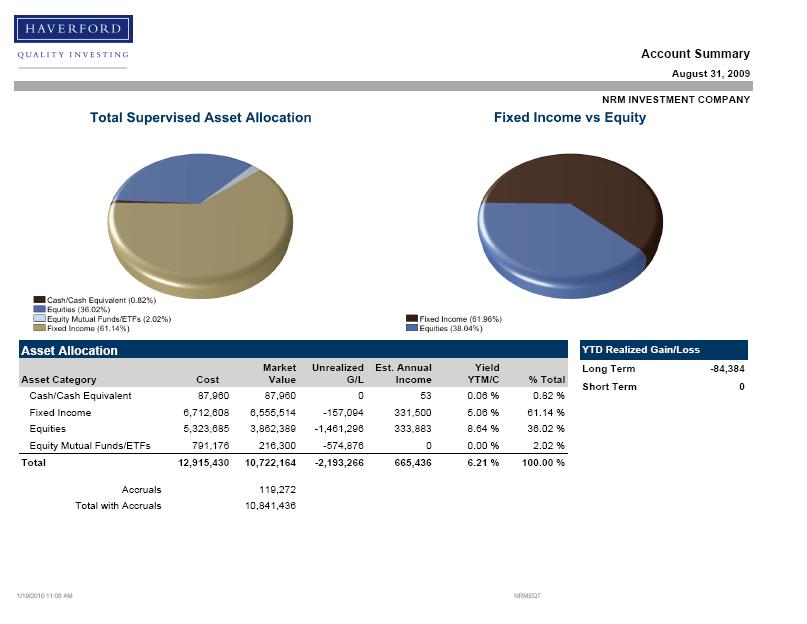 | Account Summary August 31, 2009 NRM INVESTMENT COMPANY Asset Allocation Asset Category Cost Market Value G/L Income YTM/C Unrealized Est. Annual Yield % Total Long Term -84,384 Short Term Cash/Cash Equivalent 87,960 87,960 0 53 0.06 % 0.82 % Fixed Income 6,712,608 6,555,514 -157,094 331,500 5.06 % 61.14 % Equities 5,323,685 3,862,389 -1,461,296 333,883 8.64 % 36.02 % Equity Mutual Funds/ETFs 791,176 216,300 -574,876 0 0.00 % 2.02 % YTD Realized Gain/Loss Total 12,915,430 10,722,164 -2,193,266 665,436 6.21 % 100.00 % Accruals 119,272 Total with Accruals 10,841,436 1/19/2010 11:06 AM NRMEQT |
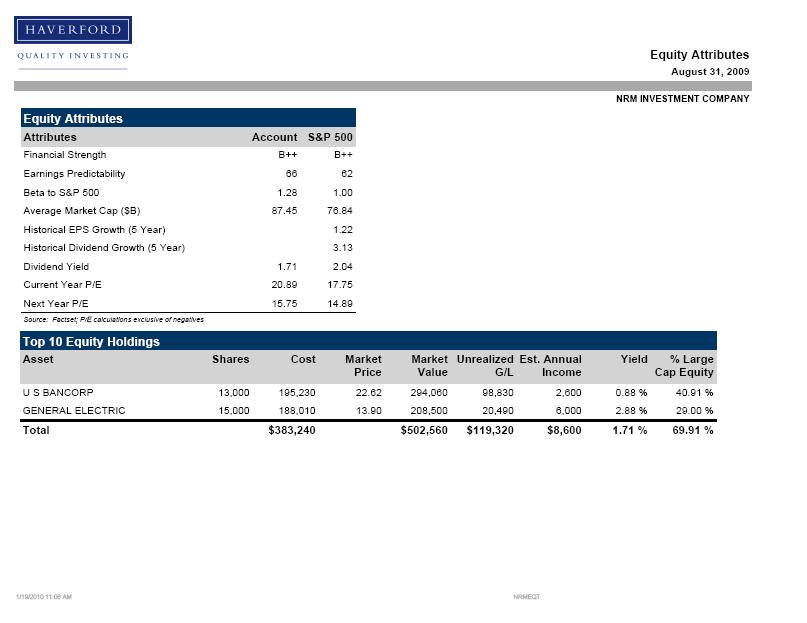 | Equity Attributes August 31, 2009 NRM INVESTMENT COMPANY Equity Attributes Attributes Account S&P 500 Financial Strength B++ B++ Earnings Predictability 66 62 Beta to S&P 500 1.28 1.00 Average Market Cap ($B) 87.45 76.84 Historical EPS Growth (5 Year) 1.22 Historical Dividend Growth (5 Year) 3.13 Dividend Yield 1.71 2.04 Current Year P/E 20.89 17.75 Next Year P/E 15.75 14.89 Source: Factset; P/E calculations exclusive of negatives Top 10 Equity Holdings Asset Shares Cost Market Market Unrealized Est. Annual Yield % Large Price Value G/L Income Cap Equity U S BANCORP 13,000 195,230 22.62 294,060 98,830 2,600 0.88 % 40.91 % GENERAL ELECTRIC 15,000 188,010 13.90 208,500 20,490 6,000 2.88 % 29.00 % Total $383,240 $502,560 $119,320 $8,600 1.71 % 69.91 % 1/19/2010 11:06 AM NRMEQT |
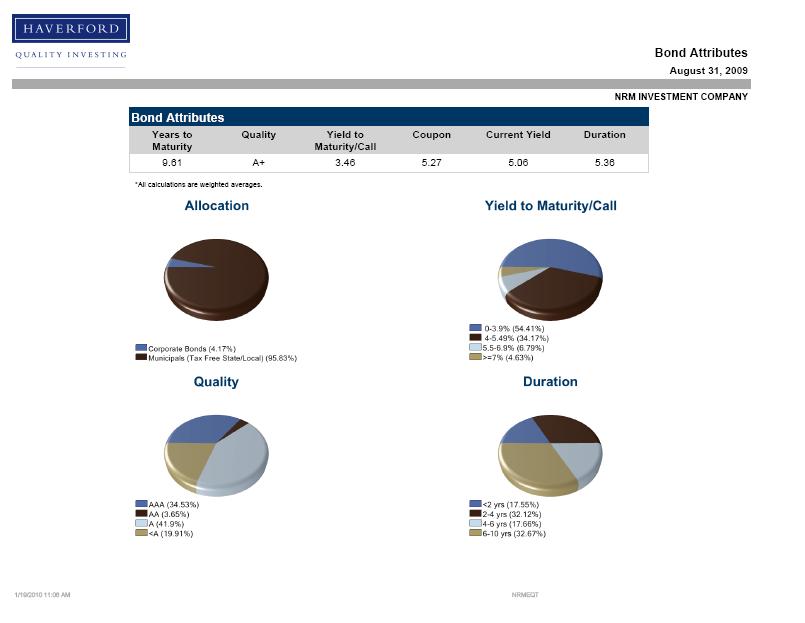 | Bond Attributes August 31, 2009 NRM INVESTMENT COMPANY Bond Attributes Years to Maturity Quality Yield to Maturity/Call Coupon Current Yield Duration 9.61 A+ 3.46 5.27 5.06 5.36 *All calculations are weighted averages. 1/19/2010 11:06 AM NRMEQT |
Availability of Quarterly Portfolio Schedule
The Fund files its complete schedule of portfolio holdings with the Commission for the first and third quarters of each fiscal year on Form N-Q. The Fund’s Forms N-Q are available on the Commissions website at http://www.sec.gov and may be reviewed and copied at the Commission’s Public Reference Room in Washington, DC. Information on the operation of the Public Reference Room may be obtained by calling 1-800-SEC-0330.
Proxy Voting
A description of the policies and procedures that the Fund uses to determine how to vote proxies relating to portfolio securities and how the Fund voted proxies relating to portfolio securities during the most recent 12 month period ended June 30 are available without charge, upon request, by calling Eileen Chambers who represents the Fund’s investment advisor toll free at 888-995-5995 and may also be found on the Commission.