UNITED STATES
SECURITIES AND EXCHANGE COMMISSION
Washington, D.C. 20549
FORM N-CSR
CERTIFIED SHAREHOLDER REPORT OF REGISTERED
MANAGEMENT INVESTMENT COMPANIES
MANAGEMENT INVESTMENT COMPANIES
Investment Company Act file number: 811 02995
Exact name of registrant as specified in charter: NRM Investment Company
Address of principal executive offices: NRM Investment Company, 280 Abrahams Lane, Villanova, Pa., 19085
Name and address of agent for service: John H. McCoy, President, NRM Investment Company, 280 Abrahams Lane, Villanova, Pa., 19085
Registrant’s Telephone Number: (610) 995-0322
Date of fiscal year end: August 31
Date of Reporting Period: Period ending August 31, 2011
ITEM 1 - REPORTS TO STOCKHOLDERS
A copy of the report transmitted to shareholders pursuant to Rule 30e-1 under the Investment Company Act is attached hereto.
ITEM 2 - CODE OF ETHICS
At its annual meeting of December 17, 2010 the Company restated its Ethics Code to assure full compliance with the mandate of SEC Rule 17j-1 under the Investment Company Act. Included in the expanded code are disclosure procedures by access persons and reporting to the Board of quarterly activity. A copy of the restatement is attached hereto. There have been no amendments since its restatement and no waivers were granted.
A copy of the Company’s Ethics Code will be provided, without charge, upon request to any interested person by telephoning the Company’s assistant secretary, Edward Fackenthal, 484 318 7979, or contacting him by email at efackenthal@aol.com.
ITEM 3. - AUDIT COMMITTEE FINANCIAL EXPERT
The Board of Directors does not have an audit committee and accordingly the entire board oversees the Registrant’s accounting and financial reporting processes including the audits of its financial statements. The board employs an outside accountant responsible for normal bookkeeping, tax preparation and recordkeeping, and employs a firm of independent auditors to report on internal controls and certify its financial records on an annual basis. The bookkeeper and outside auditor both qualify as financial experts. The outside accountant and auditor are engaged on behalf of the Registrant by the Company’s president and their engagements are ratified yearly by the shareholders. The outside auditor provides no services for the Registrant’s investment adviser. Note: two members of the five-member board of directors own 95.4% of its shares. Registrant has no salaried employees to otherwise fulfill the role of financial expert.
ITEM 4. ACCOUNTANT FEES AND SERVICES
August 31 fiscal years:
| 2010 | 2011 | |||||||
| (a) Audit fees* | 32,869 | 25,258 | ||||||
| (b) Related fees | 0 | 00 | ||||||
| (c) (d) Tax & other fees* | 7,200 | 7,600 | ||||||
* This represents the fees charged by the Fund’s auditors for services employed in preparing the annual report to shareholders and for statutory and regulatory filings.
** This charge represents the annual retainer for the services of the Fund’s regularly employed accountant who is responsible for the recording of day to day Fund activities including tax services as well as tax planning and advice.
ITEM 5. - Registrant is not a listed issuer.
ITEM 6 - SCHEDULE OF INVESTMENTS
The information is included as part of the report to shareholders filed under Item 1 of this report and attached hereto.
ITEMS 7, 8, 9 – PROXY VOTING POLICIES
AND PURCHASES OF EQUITY SECURITIES
The information requested is not applicable to this open-end company.
ITEM 10 – SUBMISSION OF MATTERS
TO A VOTE OF SECURITY HOLDERS
There have been no material changes to the procedures by which directors are nominated.
ITEM – 11 CONTROLS AND PROCEDURES
The Fund operates through its five-member board of directors sitting as an executive committee of the whole; the board members receive only nominal director’s fees. The Fund has no employees other than its officers none of whom receives compensation in such role. (The Assistant Secretary to the Fund is its counsel who receives compensation only for legal work, not in his role as a Fund officer.) The Fund engages independent contractors to provide investment, financial and custodial services. The Fund’s principal executive and financial officer is its major shareholder and one of the five directors. In his view the following controls and procedures are effective to comply with the Regulations under the Investment Company Act.
Portfolio Procedures
1. The Investment Advisor has discretion in investing the Fund’s portfolio but only within the guidelines established by the Board of Directors, and those who are authorized to execute investment transactions act only on direction by the Board or Advisor.
2. Any significant inflows or outflows of cash will be brought to the President’s attention to confirm that a related purchase or sale of securities or other disbursement was authorized by him.
Investment Custody and Shareholder Services
All transactions with shareholders and the custody of the Fund’s securities are performed by an independent corporate custodian. Any changes to these functions must be authorized by the Board of Directors.
Accounting and Reporting
1. The recording, summarizing and reporting of all financial data is performed by a CPA who is independent of the buying and selling of securities as well as the disbursement of the Fund’s cash and transfer of the Fund’s assets.
2. Upon discovery, the CPA will bring any unusual transaction directly to the President and/or Board’s attention.
3. The CPA will provide directly to the Board of Directors a Statement of Net Assets and a Statement of Operations in accordance with generally accepted accounting principles within ten business days of each month end.
Item 12 – Exhibits
Exhibit to Item 1
Report Transmitted to Shareholders
NRM Investment Company
Annual Report
August 31, 2011
| NRM Investment Company |
| Annual Report |
| August 31, 2011 |
Table of Contents
| Page No. | ||
| Total Returns | 1 | |
| Performance at a Glance | 1 | |
| Advisor’s Report | 1 | |
| Performance Summary | 3 | |
| Financial Statements: | ||
| Report of Independent Registered Public Accounting Firm | 6 | |
| Schedule of Investments | 7 | |
| Statement of Assets and Liabilities | 11 | |
| Statement of Operations | 12 | |
| Statement of Changes in Net Assets | 13 | |
| Financial Highlights | 14 | |
| Notes to Financial Statements | 15 | |
| Fund’s Expenses | 21 |
| NRM Investment Company |
Total Returns
Year Ended August 31, 2011
| Total Return | ||||
| NRM Investment Company | 11.59 | % | ||
Composite Index1 | 6.66 | % | ||
| 1 | 60% Barclays 5 Yr Muni / 40% ML PFD Stock DRD Eligible (9/1/09 to 7/31/10) 60% Barclays 5 Yr Muni / 20% S&P 500/ 20% CPI (8/1/09 to 8/31/11) |
Performance at a Glance
| Distributions Per Share | ||||||||||||||||
Starting Share Price | Ending Share Price | Income Dividends | Capital Gains | |||||||||||||
| NRM Investment Company | $ | 3.25 | $ | 3.53 | $ | 0.094 | $ | 0.00 | ||||||||
Advisor’s Report
The past year was marked by an economy that continued an uneven pattern of slow growth. Repeating its experience from 2010, the economy slowed its rate of growth during the summer months after slightly better results earlier in the calendar year. Unemployment remained stubbornly high. The Federal Reserve maintained its Federal Funds policy target at the 0 to 0.25% rate initiated in December 2008. In the FOMC’s own words, they expect that the rate will remain at this exceptionally low level for an extended period. They further elaborated that this policy could well continue for another two years, until perhaps mid-2013. The summer also saw a divisive Congressional battle regarding raising the US debt ceiling combined with S&P’s downgrade of the US Treasury debt. Concerns over European sovereign debt also weighed heavily on the markets. These concerns drove investors to seek the safety of US Treasury issues despite the downgrade and continuing annual deficits of approximately $1 trillion. As an example of the volatility produced by these sharp shifts in sentiment, the yield on the benchmark 10-year Treasury note rose from 2.47% at the end of the prior fiscal year to 3.74% in February 2011 before falling to 2.22% at fiscal yearend 2011. Investors bid up the price of precious metals and other hard assets in response to these concerns and volatility. The benefit to the portfolio from the improvement in asset prices is discussed below.
The Fund’s total portfolio performance for the fiscal year ended August 31, 2011 was 11.59%. This was positively impacted by the inclusion of common equity securities for the period. The portfolio’s equity holdings returned 30.70% for the twelve month period. This performance exceeded the S&P 500 Index performance of 18.50% for the period primarily due to the portfolio’s exposure to stocks and funds tied to the metals, mining and natural resources sector. As an indication of that sector’s performance for the period, the spot market price of Gold rose 46.4% to $1826.10/oz at the end of the fiscal year from $1247.45/oz on August 31, 2010. The balance of the equity holdings, representing 27.1% of investments, is comprised of large-cap, dividend paying stocks. For the fiscal year, these holdings returned approximately 19.7%, also exceeding the return of the benchmark S&P 500 Index.
| NRM Investment Company |
Advisor’s Report (continued)
The portfolio performance for the fiscal year was impacted by a defensive positioning in the portfolio’s municipal bond holdings. The municipal bond holdings returned 2.88% compared to 3.61% for the benchmark Barclays Capital 5-year Municipal Bond Index. The recent six month period was heavily influenced by a recovery from the negative sentiment regarding credit and budget pressures on state and local governments that had weighed heavily on the first half of the fiscal year. The defensive posture achieved its objective of reduced volatility, outperforming the benchmark during a period when the market was weak and underperforming when the market rebounded. We expect to maintain this defensive posture while interest rates remain at historically low levels.
Looking forward, we believe the portfolio’s combination of a defensively postured bond portfolio and an equity portfolio comprised of high quality, dividend-paying stocks and stocks with exposure to natural resources will result in performance consistent with the objectives of the Board of Directors.
2
| NRM Investment Company |
Performance Summary
The following is a line graph that compares the initial and subsequent account values at the end of each of the most recently completed ten fiscal years of the Fund. It assumes a $10,000 initial investment at the beginning of the first fiscal year and an appropriate broad-based securities market index for the same period.
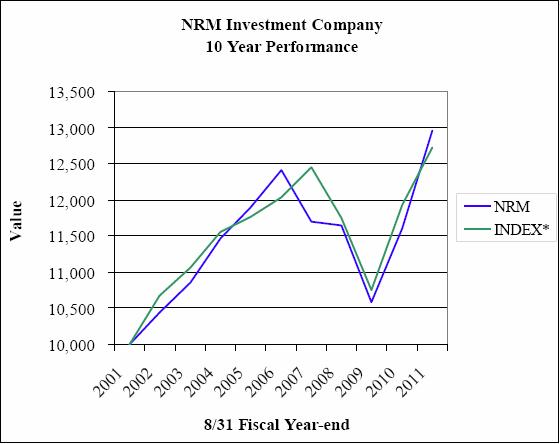
| * Index key | |
| Prior to 2008: | 100% Barclays 5 Yr Muni |
| 2008 thru 7/31/10: | 60% Barclays 5 Yr Muni / 40% ML PFD Stock DRD Eligible |
| Beginning 7/31/10: | 60% Barclays 5 Yr Muni/ 20% S&P500/20% CPI |
3
| NRM Investment Company |
Performance Summary - Continued
The bar chart and table shown below provide some indication of the risks of investing in the Fund by showing changes in the Fund’s performance from year to year and by showing how the Fund’s average annual returns for 1, 5, and 10 years compared with those of broad-based securities market indexes. How the Fund has performed in the past (both before and after taxes) is not necessarily an indication of how the Fund will perform in the future.
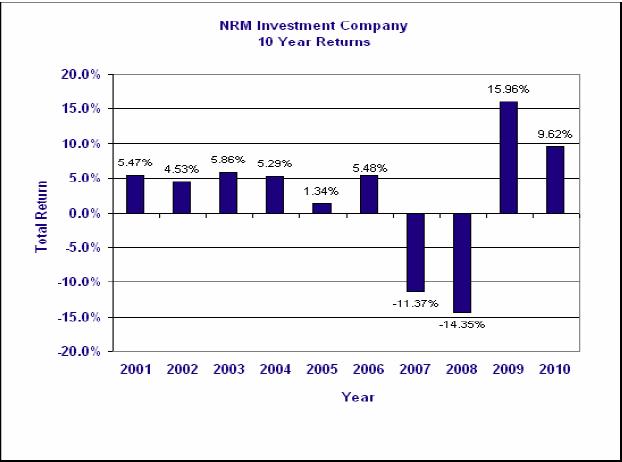
| During the 10 year period shown in the bar chart, the highest annual return was 15.96% (year ended 12/31/09) and the lowest annual return was -14.35% (year ended 12/31/08). |
| During the 10 year period shown in the bar chart, the highest quarterly return was 17.34% (quarter ended 6/30/09) and the lowest quarterly return was -14.87% (quarter ended 9/30/08). |
For the nine month period ending 9/30/11, the Company had a total return of 2.62%
4
| NRM Investment Company |
Performance Summary - Continued
Average Annual Total returns for Periods Ended December 31, 2010
| 1 year | 5 years | 10 years | ||||||||||
| Return Before Taxes | 9.62 | % | .35 | % | 2.40 | % | ||||||
| Return After Taxes on Distributions | 9.04 | % | .26 | % | 1.90 | % | ||||||
| Return After Taxes on Distributions and redemption of Fund Shares | 13.19 | % | -9.35 | % | 4.21 | % | ||||||
Comparative indexes (reflecting no deductions for fees, expenses or taxes) | ||||||||||||
Barclays 5 year Municipal Bond Index | 3.40 | % | 5.00 | % | 4.81 | % | ||||||
| Merrill Lynch Preferred Stock DRD Eligible Index | 11.41 | % | -10.70 | % | -2.82 | % | ||||||
| CPI | 1.36 | % | 2.14 | % | 2.35 | % | ||||||
| S&P 500 | 15.06 | % | 2.29 | % | 1.41 | % | ||||||
Composite Index1 | 8.32 | % | .84 | % | 2.71 | % | ||||||
1 60% Barclays 5 Yr Muni /20% S&P 500/20% CPI. This blend of indexes was used for the period beginning July 31, 2010. 60% Barclays 5 Yr Muni/ 40% ML PFD Stock DRD Eligible. These indexes were used to compare the Company’s results with established benchmarks for asset categories similar to the Company’s investments through July 31, 2010 . The results were blended to reflect the proportions of like-kind investments the Company held in its 2008 portfolio through July 31, 2010. Prior to 2008 the benchmark was 100% Barclays 5 Yr Muni. The Company selected Merrill Lynch Preferred DRD (Dividend Received Deduction) Eligible as a benchmark as the nearest equivalent to the pass-through treatment the Company shareholders received for QDI (Qualified Dividend Income) from the bulk of its preferred shares it held July 31, 2010.
After Tax returns are calculated using the historical highest individual federal marginal income tax rates that do not reflect the impact of state and local taxes. Actual after-tax returns depend on an investor’s tax situation and may differ from those shown and are not relevant to investors who hold their fund shares through tax-deferred arrangements, such as 401K plans or individual retirement accounts and certain annuities.
5
 | ||
| CERTIFIED PUBLIC ACCOUNTANTS | ||
ROBERT F. SANVILLE, CPA MICHAEL T. BARANOWSKY, CPA JOHN P. TOWNSEND, CPA | 1514 OLD YORK ROAD ABINGTON, PA 19001 (215) 884-8460 • (215) 884-8686 FAX | MEMBERS OF AMERICAN INSTITUTE OF CERTIFIED PUBLIC ACCOUNTANTS PENNSYLVANIA INSTITUTE OF CERTIFIED PUBLIC ACCOUNTANTS |
140 EAST 45TH STREET NEW YORK, NY 10017 (212) 661-3115 • (646) 227-0268 FAX | ||
REPORT OF INDEPENDENT REGISTERED PUBLIC ACCOUNTING FIRM
To the Shareholders and Board of Directors
of NRM Investment Company
of NRM Investment Company
We have audited the accompanying statement of assets and liabilities of NRM Investment Company (the “Fund”), including the schedule of investments as of August 31, 2011 and the related statements of operations, changes in net assets and financial highlights for the year ended. These financial statements are the responsibility of the Fund’s management. Our responsibility is to express an opinion on these financial statements and financial highlights based on our audit. The statement of changes in net assets and the financial highlights for the year ended August 31, 2010 and the financial highlights for each of the four years in the period then ended were audited by other auditors whose report date October 29, 2010 expressed an unqualified opinion on those statements.
We conducted our audit in accordance with the standards of the Public Company Accounting Oversight Board (United States). Those standards require that we plan and perform the audit to obtain reasonable assurance about whether the financial statements and financial highlights are free of material misstatement. An audit includes examining, on a test basis, evidence supporting the amounts and disclosures in the financial statements and financial highlights. An audit also includes assessing the accounting principles used and significant estimates made by management, as well as evaluating the overall financial statement presentation. Our procedures included confirmation of securities owned at August 31, 2011, by correspondence with the custodian. We believe that our audit provides a reasonable basis for our opinion.
In our opinion, the financial statements and financial highlights referred to above present fairly, in all material respects, the financial position of NRM Investment Company as of August 31, 2011, the results of its operations for the year then ended, changes in net assets and financial highlights for the year then ended in conformity with accounting principles generally accepted in the United States of America
 | ||
| Abington, Pennsylvania | ||
| October 27, 2011 | ||
6
| NRM Investment Company |
Schedule of Investments
August 31, 2011
| Principal Amount or Shares | Fair Value | |||||||
Municipal Bonds – 53.7% | ||||||||
| General Obligation Bonds – 11.4% | ||||||||
| Pittsburgh, Pennsylvania, 5.00%, due 9/1/12, callable 3/1/12 at 100 (AMBAC) | 250,000 | $ | 255,330 | |||||
| Philadelphia, Pennsylvania School District, 5.625%, due 8/1/15, callable 8/1/12 at 100 (FGIC) | 300,000 | 314,616 | ||||||
| Pittsburgh, Pennsylvania, Refunding, 5.25%, due 9/1/16 | 100,000 | 113,923 | ||||||
| Puerto Rico, 5.50%, due 7/1/17 | 250,000 | 279,455 | ||||||
| Will County, Illinois, 5.0%, due 11/15/24 | 100,000 | 107,175 | ||||||
| Richland County, South Carolina Broad River Sewer System, 5.375%, due 3/1/30, callable 3/1/13 | 250,000 | 262,068 | ||||||
| Total General Obligation Bonds | 1,332,567 | |||||||
| Housing Finance Agency Bonds - 1.7% | ||||||||
| Louisiana LOC Government Environmental Facilities Community Development Authority, Multi-family Housing, 4.25%, due 4/15/39, put 4/15/16 at 100.00 | 185,000 | 191,817 | ||||||
| Total Housing Finance Agency Bonds | 191,817 | |||||||
| Other Revenue Bonds – 40.6% | ||||||||
| Parkland, Pennsylvania School District, 5.375%, due 9/1/15 (FGIC) | 170,000 | 197,832 | ||||||
| Allegheny County, Pennsylvania Industrial Development Authority, 5.00%, due 11/1/11 (MBIA) | 100,000 | 100,623 | ||||||
| Pennsylvania Infrastructure Investment Authority, 5.00%, due 9/1/12 | 500,000 | 523,480 | ||||||
| Pennsylvania State Higher Educational Facilities Authority, 5.50%, prerefunded 1/01/16 | 350,000 | 374,091 | ||||||
| Philadelphia, Pennsylvania Wastewater, 5.00%, due 7/1/14 | 250,000 | 278,098 | ||||||
| Pennsylvania State Turnpike Commission, 5.25%, due 12/1/14, callable 12/1/10 at 100 (AMBAC) | 155,000 | 155,493 | ||||||
| St. Louis Missouri Municipal Finance Corporation, Leasehold Revenue (County Justice Center), 5.25%, due 2/15/15, callable 2/15/12 at 100 (AMBAC) | 50,000 | 50,656 | ||||||
| Pennsylvania State Turnpike Commission, 5.25%, due 12/1/15, callable 12/1/10 at 100 (AMBAC) | 140,000 | 140,438 | ||||||
| Allegheny County Sanitation Authority, Sewer Revenue, 5.00%, due 12/1/23, callable 12/1/15 at 100 | 300,000 | 319,992 | ||||||
The accompanying Notes are an integral part of these financial statements.
7
| NRM Investment Company |
Schedule of Investments (Continued)
August 31, 2011
Principal Amount or Shares | Fair Value | |||||||
| Municipal Bonds – 53.7% (Continued) | ||||||||
| Other Revenue Bonds – 40.6% (Continued) | ||||||||
| Allegheny County, Pennsylvania Higher Educational Building Authority, 5.50%, due 3/1/16, callable 6/15/12 at 100 (AMBAC) | 150,000 | $ | 171,517 | |||||
| Pennsylvania State Higher Educational Facilities Authority, 5.00%, due 6/15/16, callable 6/15/12 at 100 (AMBAC) | 100,000 | 103,095 | ||||||
| Chester County, Pennsylvania Health and Educational Authority (Devereux), 5.00%, due 11/1/18 | 405,000 | 428,502 | ||||||
| New York State Dorm Authority, 5.00%, due 7/01/17, callable 7/01/16 at 100 (SIENA) | 200,000 | 221,508 | ||||||
| Tobacco Settlement Financial Corporation, New Jersey, 5.00%, due 6/1/19 , callable 6/1/17 at 100 | 200,000 | 200,478 | ||||||
| Pennsylvania State Public School Building Authority, 5.00%, due 5/15/22 | 150,000 | 157,895 | ||||||
| Pennsylvania State Higher Educational Facilities Authority (University of Pennsylvania Health System), 4.75%, due 8/15/22, callable 8/15/19 at 100 | 150,000 | 160,749 | ||||||
| Spring Texas Independent School District, 5.00%, due 8/15/26, callable 08/15/14 | 280,000 | 294,680 | ||||||
| North Carolina Medical Care Community Mortgage Revenue (Chatham Hospital), 5.25%, due 8/1/26, callable 2/1/17 at 100 (MBIA) | 230,000 | 234,536 | ||||||
| Virginia Port Facilities Authority, 4.50%, due 7/1/30, callable 7/1/19 at 100 | 200,000 | 205,160 | ||||||
| Pennsylvania State Higher Educational Facilities Authority (St. Joseph University), 5.75%, due 11/1/30, callable 11/1/20 at 100 | 400,000 | 414,240 | ||||||
| Total Other Revenue Bonds | 4,733,063 | |||||||
| Total Municipal Bonds (Cost $6,091,009) | 6,257,447 | |||||||
| Common Stocks – 25.4% | ||||||||
| Consumer Discretionary – 3.5% | ||||||||
| Genuine Parts Co. | 1,700 | 93,534 | ||||||
| Home Depot Inc. | 2,400 | 80,112 | ||||||
| McDonalds Corp. | 1,100 | 99,451 | ||||||
| VF Corp. | 1,150 | 134,619 | ||||||
| Total Consumer Discretionary | 407,716 | |||||||
The accompanying Notes are an integral part of these financial statements.
8
| NRM Investment Company |
Schedule of Investments (Continued)
August 31, 2011
Principal Amount or Shares | Fair Value | |||||||
| Common Stocks (Continued) – 25.4% | ||||||||
| Consumer Staples – 3.9% | ||||||||
| Altria Group, Inc. | 5,600 | $ | 152,264 | |||||
| Kimberly Clark Corp. | 1,950 | 134,862 | ||||||
| Kraft Foods Inc., Class A | 2,500 | 87,550 | ||||||
| Procter & Gamble Co. | 1,250 | 79,600 | ||||||
| Total Consumer Staples | 454,276 | |||||||
| Energy – 3.2% | ||||||||
| Conocophillips | 1,550 | 105,508 | ||||||
| Royal Dutch Shell, PLC, ADR | 2,000 | 134,100 | ||||||
| Total Fina Elf SA, ADR | 2,750 | 134,860 | ||||||
| Total Energy | 374,468 | |||||||
| Financials – 2.0% | ||||||||
| Blackrock, Inc. | 500 | 82,375 | ||||||
| M&T Bank Corp. | 800 | 60,856 | ||||||
| NYSE Euronext | 3,500 | 95,480 | ||||||
| Total Financials | 238,711 | |||||||
| Health Care – 3.7% | ||||||||
| Bristol Myers Squibb Co. | 3,650 | 108,588 | ||||||
| Glaxosmithkline PLC, ADR | 3,200 | 137,056 | ||||||
| Johnson & Johnson | 1,000 | 65,800 | ||||||
| Merck & Co., Inc. | 3,700 | 122,451 | ||||||
| Total Health Care | 433,895 | |||||||
| Industrials – 3.7% | ||||||||
| Caterpillar, Inc. | 1,000 | 91,000 | ||||||
| Eaton Corp. | 2,500 | 107,375 | ||||||
| General Electric Co. | 3,600 | 58,716 | ||||||
| Norfolk Southern Corp. | 700 | 47,376 | ||||||
| United Parcel Service, Inc. Class B | 150 | 10,109 | ||||||
| Waste Management Inc. | 3,400 | 112,336 | ||||||
| Total Industrials | 426,912 | |||||||
| Information Technology – 1.1% | ||||||||
| Automatic Data Processing, Inc. | 800 | 40,024 | ||||||
| Intel Corp. | 4,500 | 90,585 | ||||||
| Total Information Technology | 130,609 | |||||||
The accompanying Notes are an integral part of these financial statements.
9
| NRM Investment Company |
Schedule of Investments (Continued)
August 31, 2011
| Principal Amount or Shares | Fair Value | |||||||
| Common Stocks (Continued) – 25.4% | ||||||||
| Materials – 1.0% | ||||||||
| Air Products & Chemicals, Inc. | 500 | $ | 40,935 | |||||
| DuPont E.I. DeNemours & Co. | 1,500 | 72,405 | ||||||
| Total Materials | 113,340 | |||||||
| Telecommunications – 1.3% | ||||||||
| AT & T, Inc. | 2,800 | 79,744 | ||||||
| Verizon Communications | 1,900 | 68,714 | ||||||
| Total Telecommunications | 148,458 | |||||||
| Utilities – 2.0% | ||||||||
| Consolidated Edison, Inc. | 2,350 | 132,093 | ||||||
| Exelon Corp. | 2,250 | 97,020 | ||||||
| Total Utilities | 229,113 | |||||||
| Total Common Stocks (Cost $2,659,991) | 2,957,498 | |||||||
| Exchange Traded Funds – 9.9% | ||||||||
| Ishares Comex Gold Trust* | 28,040 | 499,673 | ||||||
| SPDR Gold Trust* | 2,875 | 510,945 | ||||||
| JPMorgan Chase & Co Aleran ML ETN | 4,100 | 145,509 | ||||||
| Total Exchange Traded Funds (Cost $803,815) | 1,156,127 | |||||||
| Mutual Funds – 7.5% | ||||||||
| Pimco Real Return Strategy Fund | 45,538 | 420,323 | ||||||
| Vanguard Precious Metals & Mining Fund | 17,096 | 451,689 | ||||||
| Total Mutual Funds (Cost $688,758) | 872,012 | |||||||
| Real Estate Investment Trusts – 1.7% | ||||||||
| Capital Trust, Inc.* (Cost $765,147) | 70,000 | 203,700 | ||||||
| Short-Term Investments - at Cost Approximating Fair Value - 1.8% | ||||||||
| Federated Pennsylvania Municipal Cash Trust #8 – (Cost $205,820) | 205,820 | 205,820 | ||||||
| Total Investments – 100% (Cost $11,214,540) | $ | 11,652,604 | ||||||
* Represents non-income producing security during the period.
The accompanying Notes are an integral part of these financial statements.
10
| NRM Investment Company |
Statement of Assets and Liabilities
August 31, 2011
| Assets | ||||
| Investments at fair value (cost $11,214,540) | $ | 11,652,604 | ||
| Interest and dividends receivable | 96,121 | |||
| Prepaid expenses | 2,642 | |||
| Total Assets | 11,751,367 | |||
| Liabilities | ||||
| Due to advisor | 5,706 | |||
| Accrued expenses and other liabilities | 33,510 | |||
| Total Liabilities | 39,216 | |||
| Net Assets, Applicable to 3,318,414 Outstanding Shares, Equivalent to $3.53 a Share | $ | 11,712,151 | ||
| Net Assets consist of: | ||||
| Capital Stock | $ | 33,184 | ||
| Paid-in capital | 13,067,169 | |||
| Accumulated undistributed net investment income | 6,388 | |||
| Accumulated realized loss on investments | (1,832,654 | ) | ||
| Unrealized appreciation of investments | 438,064 | |||
| Net Assets | $ | 11,712,151 | ||
The accompanying Notes are an integral part of these financial statements.
11
| NRM Investment Company |
Statement of Operations
Year Ended August 31, 2011
Year Ended August 31, 2011
| Investment Income | ||||
| Interest | $ | 253,893 | ||
| Dividends (net of $2,414 foreign taxes withheld) | 192,541 | |||
| 446,434 | ||||
| Expenses | ||||
| Investment advisory fees | 33,550 | |||
| Custodian fees | 16,650 | |||
| Transfer and dividend disbursing agent fees | 4,600 | |||
| Legal and professional fees | 63,208 | |||
| Registration fees | 350 | |||
| Directors’ fees | 6,400 | |||
| Insurance | 1,808 | |||
| Capital stock tax | 2,533 | |||
| Miscellaneous | 5,200 | |||
| Total Expenses | 134,299 | |||
| Net Investment Income | 312,135 | |||
| Realized and Unrealized Gain (Loss) on Investments | ||||
| Net realized gain from investment transactions | 145,865 | |||
| Capital gain distributions received from portfolio companies | 4,345 | |||
| Net unrealized appreciation of investments | 783,362 | |||
| Net Realized and Unrealized Gain on Investments | 933,572 | |||
| Net Increase in Net Assets Resulting from Operations | $ | 1,245,707 | ||
The accompanying Notes are an integral part of these financial statements.
12
| NRM Investment Company |
Statements of Changes in Net Assets
Years Ended August 31, 2011 and 2010
| 2011 | 2010 | |||||||
| Increase (Decrease) in Net Assets from Operations | ||||||||
| Net investment income | $ | 312,135 | $ | 403,825 | ||||
| Net realized gain(loss) from investment transactions | 145,865 | (985,719 | ) | |||||
| Capital gain distributions received from portfolio companies | 4,345 | - | ||||||
| Net unrealized appreciation (depreciation) of investments | 783,362 | 1,622,695 | ||||||
| Net Increase (Decrease) in Net Assets Resulting from Operations | 1,245,707 | 1,040,801 | ||||||
| Distributions to Shareholders | (311,933 | ) | (401,100 | ) | ||||
| Capital Share Transactions | (658,126 | ) | 54 | |||||
| Total Increase in Net Assets | 275,648 | 639,755 | ||||||
| Net Assets - Beginning of Year | 11,436,503 | 10,796,748 | ||||||
| Net Assets - End of Year (includes undistributed net investment income $6,388 and $6,186, respectively) | $ | 11,712,151 | $ | 11,436,503 | ||||
The accompanying Notes are an integral part of these financial statements.
13
| NRM Investment Company |
Financial Highlights
Years Ended August 31, 2011, 2010, 2009, 2008, and 2007
| 2011 | 2010 | 2009 | 2008 | 2007 | ||||||||||||||||
Per Share Data (for a share outstanding throughout the indicated year) | ||||||||||||||||||||
| Net asset value, beginning of year | $ | 3.25 | $ | 3.069 | $ | 3.480 | $ | 3.551 | $ | 3.938 | ||||||||||
| Net investment income (loss) (a) | .094 | .114 | .138 | .321 | (.131 | ) | ||||||||||||||
| Net realized and unrealized gain (loss) on investments | .279 | .181 | (.454 | ) | (.336 | ) | (.088 | ) | ||||||||||||
| Total from Investment Operations | .373 | .295 | (.316 | ) | (.015 | ) | (.219 | ) | ||||||||||||
| Less distributions: | ||||||||||||||||||||
| Dividends from capital gains | - | - | - | - | (.025 | ) | ||||||||||||||
| Dividends from net tax-exempt income | (.053 | ) | (.052 | ) | (.045 | ) | (.024 | ) | (.064 | ) | ||||||||||
| Dividends from net taxable income | (.041 | ) | (.062 | ) | (.050 | ) | (.032 | ) | (.079 | ) | ||||||||||
| Total Distributions | (.094 | ) | (.114 | ) | (.095 | ) | (.056 | ) | (.168 | ) | ||||||||||
| Net Asset Value, End of Year | $ | 3.53 | $ | 3.250 | $ | 3.069 | $ | 3.480 | $ | 3.551 | ||||||||||
| Total Return (Loss) (b) | 11.59 | % | 9.71 | % | (9.20 | %) | (0.37 | %) | (5.79 | %) | ||||||||||
| Ratios/Supplemental Data | ||||||||||||||||||||
| Net assets, end of year (in thousands) | $ | 11,712 | $ | 11,437 | $ | 10,797 | $ | 12,557 | $ | 12,815 | ||||||||||
| Ratio of expenses to average net assets | 1.17 | % | 1.39 | % | 1.40 | % | 1.33 | %* | 8.62 | % | ||||||||||
| Ratio of net investment income (loss) to average net assets | 2.73 | % | 3.58 | % | 4.70 | % | 9.23 | % | (3.43 | %) | ||||||||||
| Portfolio turnover rate | 19.58 | % | 38.07 | % | 17.27 | % | 9.27 | % | 18.00 | % | ||||||||||
(a) Per share net investment income(loss) has been determined using the average shares method.
(b) Assumes reinvestment of all dividends and distributions.
* Excludes the recovery of environmental claims and related costs.
The accompanying Notes are an integral part of these financial statements.
14
| NRM Investment Company |
| August 31, 2011 |
Notes to Financial Statements
Note 1 - Nature of Business and Significant Accounting Policies
| Nature of Business | ||
| NRM Investment Company (the “Fund”) is registered under the Investment Company Act of 1940, as amended, as a diversified, open-end management investment company. The investment objective of the Fund is to maximize and distribute income and gains on a current basis. Its secondary objective is preservation of capital. The Fund generally invests in both bond and equity markets and is subject to the risks and uncertainty inherent therein. | ||
| The following is a summary of significant accounting policies consistently followed by the Fund in the preparation of its financial statements. These policies are in conformity with accounting principles generally accepted in the United States of America. | ||
| Valuation of Investments | ||
| Investments in securities (other than debt securities maturing in 60 days or less) traded in the over-the-counter market, and listed securities for which no sale was reported on the last business day of the year, are valued based on prices furnished by a pricing service. This service determines the valuations using a matrix pricing system based on common bond features such as coupon rate, quality and expected maturity dates. Securities for which market quotations are not readily available are valued by the investment advisor under the supervision and responsibility of the Fund’s Board of Directors. Investments in securities that are traded on a national securities exchange are valued at the closing prices. Short-term investments are valued at amortized cost, which approximates fair value. | ||
| Investment Transactions and Related Investment Income | ||
| Investment transactions are accounted for on the date the securities are purchased or sold (trade date). Realized gains and losses from investment transactions are reported on the basis of identified cost for both financial and federal income tax purposes. Interest income is recorded on the accrual basis for both financial and income tax reporting. Dividend income is recognized on the ex-dividend date. In computing investment income, the Fund amortizes premiums over the life of the security, unless said premium is in excess of any call price, in which case the excess is amortized to the earliest call date. Discounts are accreted over the life of the security. Withholding taxes on foreign dividends have been provided for in accordance with the Fund’s understanding of the applicable country’s tax rules and rates. | ||
| Transactions with Shareholders | ||
| Fund shares are sold and redeemed at the net asset value. Transactions of these shares are recorded on the trade date. Dividends and distributions are recorded by the Fund on the ex-dividend date. | ||
| Federal Income Taxes | ||
| It is the Fund’s policy to comply with the requirements of the Internal Revenue Code applicable to regulated investment companies and distribute substantially all of its net investment income and realized net gain from investment transactions to its shareholders and, accordingly, no provision has been made for federal income taxes. | ||
15
| NRM Investment Company |
| August 31, 2011 |
Notes to Financial Statements
Note 1 - Nature of Business and Significant Accounting Policies - Continued
| Federal Income Taxes - Continued | ||
| Under ASC 740-10, Income Tax Risks, the Fund recognizes the tax benefits of certain tax positions only where the position is “more likely than not” to be sustained assuming examination by authorities. GAAP requires management of the Fund to analyze all open tax years, fiscal years 2008-2011, as defined by IRS statute of limitations for all major industries, including federal tax authorities and certain state tax authorities. As of and during the period ended August 31, 2011, the Fund did not have a liability for any unrecognized tax benefits. The Fund has no examinations in progress and is not aware of any tax positions for which it is reasonably possible that the total tax amounts of unrecognized tax benefits will significantly change in the next twelve months. | ||
| Estimates | ||
| The preparation of financial statements in conformity with accounting principles generally accepted in the United States of America requires management to make estimates and assumptions that affect the reported amounts of assets and liabilities and disclosure of contingent assets and liabilities at the date of the financial statements and the reported amounts of increases and decreases in net assets from operations during the reporting period. Actual results could differ from those estimates. | ||
Note 2 - Investment Advisor and Management Fees and Other Transactions with Affiliates
Advisory Agreement - The Fund has an Investment Advisory Agreement with Haverford Financial Services, Inc. (“the Advisor”). The Advisor manages the Fund’s investments and business affairs subject to the supervision of the Board of Directors. Under the Investment Advisory Agreement, the Fund compensates the Advisor for its investment advisory services at the annual rate of 0.30% of the Fund’s net assets, payable in advance, on a quarterly basis, based upon the net assets of the Fund as of the last day of the previous calendar quarter. The Fund is responsible for its own operating expenses. The Advisor earned $33,550 in advisory fees for the year ended August 31, 2011 and the Fund owed the Advisor $5,706 at August 31, 2011. | |
Other Transactions with Affiliates - The Chief Executive Officer of the Advisor is on the Board of Directors of the Fund. The beneficial ownership, either directly or indirectly, or more than 25% of the voting securities of a fund creates a presumption of control of the fund, under Section 2 (a) (9) of the 1940 Act. As of August 31, 2011, the Fund’s President and Chairman of the Board held approximately 84.91% of the outstanding shares of the Fund and may be deemed to control the Fund. | |
| Note 3 - Purchases and Sales of Investment Securities | |
| Cost of purchases and proceeds from sales and maturities of investment securities, other than short-term investments, aggregated $2,183,717 and $2,233,753, respectively, during the year ended August 31, 2011. | |
16
| NRM Investment Company |
| August 31, 2011 |
Notes to Financial Statements
Note 4 -Fair Value Measurements
| The Fund adopted guidance on fair value measurements, issued by the Financial Accounting Standards Board (FASB) ASC 820-10, “Fair Value Measurements”. ASC 820-10 establishes a fair value hierarchy that prioritizes the inputs to valuation methods used to measure fair value. The hierarchy gives the highest priority to unadjusted quoted prices in active markets for identical assets or liabilities (Level 1 measurements) and the lowest priority to unobservable inputs (Level 3 measurements). The three levels of fair value hierarchy under ASC 820-10 are as follows: | |
Level 1 – Unadjusted quoted prices in active markets that are accessible at the measurement date for identical unrestricted assets or liabilities. | |
Level 2- Quoted prices in markets that are not active, or inputs that are observable either directly or indirectly, for substantially the full term of the asset or liability. | |
Level 3- Prices or valuation techniques that require inputs that are both significant to fair value measurement and unobservable (i.e. support with little or no market value activity). | |
| For financial assets measured at fair value on a recurring basis, the fair value measurement by the level within the fair value hierarchy used as at August 31, 2011 are as follows: |
| Description | Total | (Level 1-Quoted Prices in Active Markets for Identical Assets) | (Level 2-Significant Other Observable Inputs) | (Level 3-Significant Unobservable Inputs) | ||||||||||||
| Municipal Bonds | $ | 6,257,447 | $ | - | $ | 6,257,447 | $ | - | ||||||||
| Common Stocks | 2,957,498 | 2,957,498 | - | - | ||||||||||||
| Exchange Traded Funds | 1,156,127 | 1,156,127 | - | - | ||||||||||||
| Mutual Funds | 872,012 | 872,012 | - | - | ||||||||||||
| Real Estate Investment Trusts | 203,700 | 203,700 | - | - | ||||||||||||
| Short-Term Investments | 205,820 | 205,820 | - | - | ||||||||||||
| Total | $ | 11,652,604 | $ | 5,395,157 | $ | 6,257,447 | $ | - | ||||||||
| The Fund did not hold any Level 3 securities during the period. | ||||||||||||||||
17
| NRM Investment Company |
| Notes to Financial Statements |
Note 5 - Environmental Liability
| The Fund operated a steel processing factory between 1974 and 1979. During this period, it disposed of a relatively harmless chemical waste product consisting of a weak ferrous chloride solution. The independent transporters represented that its destination was at an approved site. Following various investigations beginning in the 1980’s and continuing to the present, the United States Environmental Protection Agency (EPA) determined that property on Broad Street in Doylestown, Pa. was used as an unapproved disposal site for many hazardous chemicals. In March 2008, it designated the site, called Chem-Fab, a National Priority “Super Fund” site requiring environmental remediation. Among the chemicals supposedly deposited there was ferrous chloride. Operations at Chem-Fab included ferrous chloride of greater strength than the Fund’s waste product. The EPA, supported by what it deems to be relevant documents and a witness statement, determined that the Fund and three others were responsible parties for disposal at Chem-Fab, and pursuant to statutory authorization, invited the four to participate in investigation and remediation. The expected cleanup cost for the site is uncertain but has been estimated at $5,000,000. | |
| The Fund believes the EPA evidence of the Fund’s connection with the Chem-Fab site is weak and that any ferrous chloride of the kind the Fund produced and that may have been taken there caused no environmental harm. Based thereon, the Fund’s board of directors declined the invitation to remediate. On July 10, 2009, EPA acknowledged the refusal (as well as the refusals of the other three), indicating it would conduct an investigation and remediation study without outside participation. There has been no further contact from the EPA. | |
| The EPA, if it persists in its position that the Fund was in any way responsible, may bring formal action for reimbursement. Although the Fund will defend vigorously any such action that might be brought, counsel, at this early stage of the investigation, is unable to evaluate the risk other than to say it is serious and for the indefinite future should be regarded as material. | |
| Note 6 - Transactions in Capital Stock and Components of Net Assets | |
| Transactions in fund shares were as follows: | |
| Year Ended | Year Ended | |||||||||||||||
| August 31, 2011 | August 31, 2010 | |||||||||||||||
| Shares | Amount | Shares | Amount | |||||||||||||
| Shares issued | 63 | $ | 216 | - | $ | - | ||||||||||
| Shares issued in reinvestment of dividends | 12 | 41 | 19 | 59 | ||||||||||||
| Shares redeemed | (200,110 | ) | (658,383 | ) | (1 | ) | (5 | ) | ||||||||
| Net (Decrease) Increase | (200,035 | ) | $ | (658,126 | ) | 18 | $ | 54 | ||||||||
18
| NRM Investment Company |
| Notes to Financial Statements |
Note 7 - Tax Matters
| As of August 31, 2011, the tax basis components of distributable earnings, unrealized appreciation (depreciation) and tax cost of investment securities were as follows: |
| Undistributed ordinary income | $ | 6,854 | ||
| Capital loss carry forward* | ||||
| Expiring 8/31/2017 | $ | (846,935 | ) | |
| Expiring 8/31/2018 | (985,719 | ) | ||
| $ | (1,832,654 | ) | ||
| Gross unrealized appreciation on investment securities | $ | 1,049,541 | ||
| Gross unrealized depreciation on investment securities | (611,477 | ) | ||
| Net unrealized appreciation on investment securities | $ | 438,064 | ||
| Cost of investment securities (including short-term investments) | $ | 11,214,540 |
| * The capital loss carryforward will be used to offset any capital gains realized by the Fund in future years through the expiration date. The Fund will not make distributions from capital gains while a capital loss carryforward remains. | |
| Permanent book and tax differences relating to shareholder distributions may result in reclassifications to paid in capital and may affect the per-share allocation between net investment income and realized and unrealized gain/loss. Undistributed net investment income and accumulated undistributed net realized gain/loss on investment transactions may include temporary book and tax differences which reverse in subsequent periods. Any taxable income or gain remaining at fiscal year end is distributed in the following year. | |
| The tax character of distributions paid are as follows during the years ended August 31, 2011 and August 31, 2010: |
| 2011 | 2010 | |||||||
| Distributions paid from: | ||||||||
| Tax-exempt interest and dividends | $ | 173,638 | $ | 182,522 | ||||
| Taxable qualified dividends | 72,357 | 218,578 | ||||||
| Taxable ordinary dividends | 65,938 | - | ||||||
| Long-term capital gains | - | - | ||||||
| $ | 311,933 | $ | 401,100 | |||||
Note 8 - Subsequent Events
Management has evaluated the impact of all subsequent events through the date the financial statements were issued and has determined that there were no subsequent events requiring recognition or disclosure in these financial statements.
19
| NRM Investment Company |
Notes to Financial Statements
Note 9 - Concentration of Credit Risk
| During the current period, the Fund had cash balances in excess of federally insured limits. | |
| Note 10 - Cash and Cash Equivalents | |
| The Fund considers all short-term liquid investments with a maturity of three months or less when purchased to be cash equivalents. | |
| In the normal course of business, the Fund’s marketable securities transactions, money balances and marketable security positions are transacted with a broker. The Fund is subject to credit risk to the extent any broker with which it conducts business is unable to fulfill contractual obligations on its behalf. The Fund monitors the financial condition of such brokers and does not anticipate any losses from these counterparties. | |
| Note 11 - New Accounting Pronouncement | |
| In May 2011 the Financial Accounting Standards Board issued Accounting Standards Update (“ASU”) No. 2011-04 “Amendments to Achieve Common Fair Value Measurement and Disclosure Requirements in U.S. Generally Accepted Accounting Principles (“GAAP”) and International Financial Reporting Standards (“IFRS”). ASU 2011-04 includes common requirements for measurement of and disclosure about fair value between U.S. GAAP and IFRS. ASU 2011-04 will require reporting entities to disclose additional information for fair value measurements categorized within Level 3 of the fair value hierarchy. In addition, ASU 2011-04 will require reporting entities to make disclosures about amounts and reasons for all transfers in and out of Level 1 and Level 2 fair value measurements. The new and revised disclosures are effective for interim and annual reporting periods beginning after December 15, 2011. Management is currently evaluating the implications of ASU No. 2011-04 and its impact on the financial statements. | |
20
| NRM Investment Company |
Fund’s Expenses
Fees and Expenses
The following table describes the fees and expenses you may pay if you by and hold shares of the Fund. As is the case with all mutual funds, transaction costs incurred by the Fund for buying and selling securities are not reflected in the table. However, these costs are reflected in the investment performance figures included in the prospectus. The expenses shown in the following table are based on those incurred in the fiscal year ended August 31, 2011:
| Shareholder Fees | ||||
| (Fees paid directly from your investment) | ||||
| Sales Charge (Load) imposed on Purchases | None | |||
| Purchase Fee | None | |||
| Sales Charge (Load) imposed on Reinvested Dividends | None | |||
| Redemption Fees | None | |||
| Account Service Fees | None | |||
| Annual Fund Operating Expenses | ||||
| (Expenses deducted from the Fund’s assets) | ||||
| Management Expenses | .29 | % | ||
| 12b-l Distribution Fees | None | |||
| Other Expenses | .88 | % | ||
| Total Annual Fund Operating Expenses | 1.17 | % | ||
Example: This example is intended to help you compare the cost of investing in the Fund with the cost of investing in other mutual funds. The example assumes that you invest $10,000 in the Fund for the time periods indicated and then redeem all of your shares at the end of those periods. The Example also assumes that your investment has a 5% return each year and that the Fund’s operating expenses remain the same. Although your actual costs may be higher or lower, based on these assumptions your costs would be:
| One Year | Three Years | Five Years | Ten Years | ||||||||||||
| $ | 122.85 | $ | 382.62 | $ | 662.36 | $ | 1,459.06 | ||||||||
This example should not be considered a representation of past or future expenses or performance. Actual expenses may be greater or less than those shown.
21
SIGNATURES
Pursuant to the requirements of the Securities Exchange Act of 1934 and the Investment Company Act of 1940, the registrant has duly caused this report to be signed on its behalf by the undersigned, thereunto duly authorized.
| Registrant: NRM Investment Company | |||
| By: | /s/ John H. McCoy | ||
| John H. McCoy, President and Treasurer | |||
| Date: | 10/31/11 | ||
Pursuant to the requirements of the Securities Exchange Act of 1934 and the Investment Company Act of 1940, this report has been signed below by the following persons on behalf of the registrant and in the capacities and on the dates indicated.
| By: | /s/ John H. McCoy | ||
| John H. McCoy, President and Treasurer | |||
| Date: | 10/31/11 | ||
| By: | /s/ Edward Fackenthal | ||
| Edward Fackenthal, Counsel and Assistant Secretary | |||
| Date: | 10/31/11 | ||