UNITED STATES
SECURITIES AND EXCHANGE COMMISSION
Washington, D.C. 20549
FORM N-CSR
CERTIFIED SHAREHOLDER REPORT OF REGISTERED
MANAGEMENT INVESTMENT COMPANIES
Investment Company Act File Number: 811-02958
| T. Rowe Price International Funds, Inc. |
| (Exact name of registrant as specified in charter) |
| 100 East Pratt Street, Baltimore, MD 21202 |
| (Address of principal executive offices) |
| David Oestreicher |
| 100 East Pratt Street, Baltimore, MD 21202 |
| (Name and address of agent for service) |
Registrant’s telephone number, including area code: (410) 345-2000
Date of fiscal year end: December 31
Date of reporting period: June 30, 2021
 |
| Global Consumer Fund | June 30, 2021 |
| PGLOX | Investor Class |
| T. ROWE PRICE GLOBAL CONSUMER FUND |
HIGHLIGHTS
| ■ | The Global Consumer Fund returned 8.33% for the six-month period ended June 30, 2021, outperforming its benchmark, the MSCI All Country World Index Consumer Discretionary & Consumer Staples ex Automobile & Components Net. |
| ■ | Fund performance was aided by a number of idiosyncratic bets informed by our in-depth research, as well as our focus on finding attractive investments in non-U.S. markets. |
| ■ | We have kept the portfolio tilted toward trends that have been accelerated by the coronavirus pandemic while still selectively adding exposure to reopening stocks at affordable valuations. |
| ■ | In our view, much of the post-pandemic reopening optimism has already been priced into equity valuations. That fact, combined with the inevitable growth deceleration set to occur in markets where the recovery first began, creates a tricky environment for stock pickers. However, we continue to see many attractive opportunities given our broad global opportunity set. |

Log in to your account at troweprice.com for more information.
*Certain mutual fund accounts that are assessed an annual account service fee can also save money by switching to e-delivery.
CIO Market Commentary
Dear Shareholder
Global stock markets produced strong returns during the first half of 2021, while rising yields weighed on returns in some bond sectors. Investor sentiment was buoyed by the reopening of developed market economies, unprecedented fiscal and monetary stimulus, and expectations that the economy would benefit from a release of pent-up demand.
All major global and regional equity benchmarks recorded positive results during the period. Developed market stocks generally outperformed emerging markets, while in the U.S., small-cap equities outpaced large-caps and value performed better than growth. The large-cap S&P 500 Index returned 15% and finished the period at a record high. The energy sector, which was the worst performer in 2020, was the leader for the six-month period amid a sharp increase in oil prices. Financial stocks also produced strong results as banks benefited from an increase in long-term interest rates, while the real estate sector was helped by a rollback in many pandemic-related restrictions. Utilities underperformed with slight gains.
Fiscal and monetary support remained a key factor in providing a positive backdrop for markets. President Joe Biden signed the $1.9 trillion American Rescue Plan Act into law in March, and the Federal Reserve kept its short-term lending rates near zero. However, as a result of strong economic growth, central bank policymakers revised their outlook in a somewhat less dovish direction near the end of the period and indicated that rate hikes could commence in 2023, which was earlier than previously expected.
The economic recovery was evident in a variety of indicators. According to the latest estimate, U.S. gross domestic product grew at an annualized rate of 6.4% in the first quarter of 2021 following 4.3% growth in the fourth quarter of 2020. Weekly jobless claims declined throughout the period to new pandemic-era lows, although the monthly nonfarm payroll report disappointed at times as employers struggled to fill positions. Meanwhile, overall profits for companies in the S&P 500 rose by nearly 53% year over year in the first quarter, according to FactSet—the best showing since late 2009.
However, less favorably, inflation concerns led to some volatility in the equity market and caused a sharp rise in longer-term Treasury yields in the first quarter. (Bond prices and yields move in opposite directions.) While inflation measures were above the Fed’s 2% long-term inflation target toward the end of our reporting period—core consumer prices, for example, recorded their largest annual increase (3.8%) since 1992 in May—investors seemed to accept the Fed’s determination that rising price pressures were due to transitory factors arising from the reopening of the global economy.
Longer-term Treasury yields trended lower as inflation expectations began to wane later in the period, but they still finished significantly higher than they were at the end of 2020. Rising yields were a headwind for many fixed income investors; however, high yield bonds, which are less sensitive to interest rate changes, produced solid results, and investment-grade corporate bonds also performed well amid solid corporate fundamentals.
As we look ahead, the central question for investors—assuming the economy’s recovery from the pandemic continues apace—is whether the returns on financial assets will be as robust. Valuations are elevated in nearly all asset classes, and, in some areas, there are clear signs of speculation. That said, a transformed global economic landscape is generating potential opportunities as well as risks. Post-pandemic trends have the potential to create both winners and losers, giving active portfolio managers greater scope to seek excess returns. It is not an easy environment to invest in, but our investment teams remain rooted in company fundamentals and focused on the long term, and they will continue to apply strong fundamental analysis as they seek out the best investments for your portfolio.
Thank you for your continued confidence in T. Rowe Price.
Sincerely,

Robert Sharps
Group Chief Investment Officer
Management’s Discussion of Fund Performance
INVESTMENT OBJECTIVE
The fund seeks to provide long-term growth of capital.
FUND COMMENTARY
How did the fund perform in the past six months?
The Global Consumer Fund returned 8.33% for the six-month period ended June 30, 2021, outperforming its benchmark, the MSCI All Country World Index Consumer Discretionary & Consumer Staples ex Automobile & Components Net. (Past performance cannot guarantee future results.)

What factors influenced the fund’s performance?
Fund performance was aided by a number of idiosyncratic bets informed by our in-depth research. For example, early in the year, we initiated a position in Coca-Cola. Many consumer staples names had been left behind in the rotation toward recovery stocks, and we viewed Coca-Cola as a solid recovery play due largely to its on-premise exposure. The name subsequently generated a strong relative contribution, benefiting from a recovery in food service during the reopening. Similarly, our new position in Macy’s contributed as the stock rose on sequential earnings improvement. Our private investment in Figs, a direct-to-consumer health care apparel and lifestyle brand, paid off after its shares skyrocketed following the company’s initial public offering. Investors appeared attracted to the name’s strong growth potential and unique positioning within an innovation-starved market. (Please refer to the fund’s portfolio of investments for a complete list of holdings and the amount each represents in the portfolio.)
Our commitment to finding compelling investments in non-U.S. markets also added value. China Feihe, an investment holding company that produces and sells infant milk, contributed through much of the period before we eliminated the name on relative strength. In Japan, shares of Seven & i Holdings, the country’s largest retail conglomerate, posted strong gains on reopening trading. Davide Campari-Milano is an Italian producer of spirits. The name rallied on optimism surrounding pent-up demand for nightlife and other experience-focused stocks. We are encouraged by the improving performance of its brand portfolio, which should translate into a topline growth acceleration and expanded margins over time.
Stocks focused on the housing and home goods markets were another source of strength. While the mix of short-term and longer-term secular catalysts in the housing market makes this a challenging area for stock pickers, we have continued to play the medium-term opportunity through bets in NVR and RH. As the fourth-largest homebuilder in America, NVR benefited early in the period amid robust homebuilding orders and finished as a solid relative contributor. Luxury furniture retailer RH gained on strong earnings, and markets appear pleased with the company’s efforts to elevate the brand and expand margins.
On the negative side, notable detractors fell into several categories. A mistimed investment in Clorox detracted from relative results. While we continue to believe in the durability of the underlying business, the stock was an outsized coronavirus pandemic beneficiary and faces a tough setup and challenging earnings comparisons. Our underweight to home goods retailer Home Depot was a headwind as the stock posted strong gains. Investor expectations were muted coming out of a record year for do-it-yourself demand, but the stock’s solid earnings report prompted renewed confidence in the name. A combination of several bets in the Chinese internet space, including Alibaba Group Holding and Meituan, detracted amid mounting regulatory headwinds in the region. We pared our Chinese exposure on reduced risk/reward potential.
How is the fund positioned?
Our goal is to identify structural share gainers positioned to earn improving returns in consumer industries globally.
In the first half of 2021, we saw a widening, broadening growth market governed by transitory factors such as fiscal and monetary stimulus. We also continued to experience a factor tilt toward value stocks, a trade that began late in 2020. This backdrop created opportunities to add traditional growth names at attractive relative valuations. For example, we added to our position in lululemon athletica on weakness, as the athletic apparel brand was buffeted in the value rotation. We continue to like lululemon athletica’s long-term growth potential as we expect the name to emerge as one of the premier athleisure brands globally, thanks to its brand strength, leading online penetration, and a continued focus on health and wellness trends globally. Similarly, we added to Chipotle Mexican Grill on a pullback in the stock. We believe that the company should continue to gain strength on the back of new products, a greater marketing presence, digital sales growth, and the expansion of the drive-through “Chipotlane” store format.

We also looked for creative ways to participate in the reopening trade. We purchased shares of Samsonite International, the largest global travel luggage company, which we see as a secular share gainer in a highly fragmented market. MGM Resorts International is highly levered to the Las Vegas casino market, where the post-pandemic recovery has lagged relative to other regional casino markets. We initiated a stake during the period. We also increased the portfolio’s position in Capri Holdings, the global fashion and accessories group that owns the Michael Kors, Versace, and Jimmy Choo brands. We like the company’s cost restructuring efforts and diversified portfolio, with exposure to both affordable luxury and true luxury segments. Amusement park operator Cedar Fair trades at a relative discount to peers and is a name we view as a solid reopening play, and we grew our position.
Another way we were able to add affordable growth was by focusing on regions that have lagged behind in the global recovery from the coronavirus pandemic. For instance, we initiated a position in CTS Eventim, which is Europe’s largest company for live music events. While investors have discounted the name amid concerns over Europe’s vaccine rollout, we believe that the pace and slope of the eventual recovery in live music events is currently underappreciated by the market. Whitbread is the largest hotel owner in the UK. The name traded lower as investors contended with the prospect of a delayed summer tourist season.
What is portfolio management’s outlook?
As consumer-focused investors, we are encouraged by signs of resilience that have been on display since the beginning of the coronavirus pandemic. Personal savings rates and household balance sheets have soared amid record amounts of fiscal and monetary stimulus, and we are starting to see signs of pent-up consumer demand working its way through the system. However, much of this information has already been priced into equity valuations. That fact, combined with the inevitable growth deceleration set to occur in markets where the recovery first began, creates a tricky environment for stock pickers.
On an individual equity level, we are extremely mindful of quality. In our view, many lower-quality businesses have been bid up amid reopening trade optimism. Once the recovery cycle peaks and equity valuations begin to recede, those businesses whose valuations are not supported by fundamentals could sell off. By focusing on quality, we aim to avoid being exposed to these companies.
In our view, the pandemic accelerated many secular trends that were already in place, pulling forward years of demand in a span of months. However, we believe that many of the consumer habits adopted during the coronavirus pandemic will prove to be “sticky”—that is, they are here to stay. We have kept the portfolio tilted toward these sticky behaviors while still selectively adding exposure to reopening stocks at affordable valuations. Overall, we continue to see many attractive opportunities given our broad global opportunity set.
Effective July 1, 2021, Vivian Si will join Jason Nogueira as a co-portfolio manager of the fund and cochair of the fund’s Investment Advisory Committee. Effective October 1, 2021, Mr. Nogueira will step down as a co-portfolio manager of the fund and cochair of the fund’s Investment Advisory Committee and Ms. Si will remain as portfolio manager of the fund and chair of the fund’s Investment Advisory Committee. Ms. Si joined T. Rowe Price in 2012 and her investment experience dates from that time. She has served as an investment analyst with the firm for the past five years.
The views expressed reflect the opinions of T. Rowe Price as of the date of this report and are subject to change based on changes in market, economic, or other conditions. These views are not intended to be a forecast of future events and are no guarantee of future results.
RISKS OF INVESTING IN THE FUND
Market conditions
The value of investments held by the fund may decline, sometimes rapidly or unpredictably, due to factors affecting certain issuers, particular industries or sectors, or the overall markets. Rapid or unexpected changes in market conditions could cause the fund to liquidate its holdings at inopportune times or at a loss or depressed value. The value of a particular holding may decrease due to developments related to that issuer but also due to general market conditions, including real or perceived economic developments—such as changes in interest rates, credit quality, inflation, or currency rates—or generally adverse investor sentiment. The value of a holding may also decline due to factors that negatively affect a particular industry or sector—such as labor shortages, increased production costs, or competitive conditions. In addition, local, regional, or global events—such as war, acts of terrorism, political and social unrest, regulatory changes, recessions, shifts in monetary or trade policies, natural or environmental disasters, and the spread of infectious diseases or other public health issues—could have a significant negative impact on securities markets and the fund’s investments. Unpredictable events—such as natural disasters, pandemics, and widespread health crises—may lead to unexpected suspensions or closures of securities exchanges, travel restrictions or quarantines, and an extended adverse impact on global market conditions.
Consumer-related companies
Securities of companies in the same industry may decline in price at the same time due to industry-specific developments, since these companies may share common characteristics and are more likely to react similarly to industry-specific market or economic developments. Since the fund focuses its investments on consumer companies, it is less diversified than stock funds investing in a broader range of industries and, therefore, could experience significant volatility.
The potential for wide variation in performance reflects the special risks associated with companies in the continually evolving consumer discretionary and staples sectors. Consumer companies can be significantly affected by business cycles and general economic trends; capital spending levels; demographic and product trends; marketing campaigns; competitive pricing; labor relations; fluctuating component and commodity prices; legislation, government regulation, and import controls; interest rates; and environmental factors relating to manufacturing, including liability arising from environmental damage. Earnings disappointments and intense worldwide competition for market share can result in sharp price declines.
When the economy is growing, the consumer discretionary sector may outperform the consumer staples sector, but the opposite may be true during periods of worsening economic conditions. The consumer discretionary sector tends to be more cyclical and is highly dependent on overall consumer confidence and spending habits. Consumer discretionary stocks can be particularly affected by several factors, including changing consumer preferences, demographics, marketing, levels of disposable household income and spending, and the risk that discretionary products may rapidly become obsolete or fall out of favor with consumers. The consumer staples sector as a whole tends to be less susceptible to recessions and periods of slow growth but is subject to the risk that products or services that were once in demand may no longer be considered essential by consumers. Consumer staples stocks can be particularly affected by, among other things, social trends (such as food or diet fads), the depletion of resources and the prices of raw materials, intense competition, and government regulations that adversely impact production methods or profitability.
For a more thorough discussion of risks, please see the fund’s prospectus.
BENCHMARK INFORMATION
Note: MSCI makes no express or implied warranties or representations and shall have no liability whatsoever with respect to any MSCI data contained herein. The MSCI data may not be further redistributed or used as a basis for other indices or any securities or financial products. This report is not approved, reviewed, or produced by MSCI.
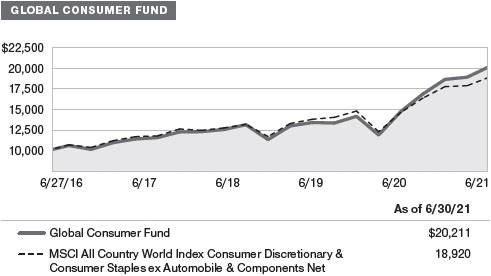
GROWTH OF $10,000
This chart shows the value of a hypothetical $10,000 investment in the fund over the past 10 fiscal year periods or since inception (for funds lacking 10-year records). The result is compared with benchmarks, which include a broad-based market index and may also include a peer group average or index. Market indexes do not include expenses, which are deducted from fund returns as well as mutual fund averages and indexes.
AVERAGE ANNUAL COMPOUND TOTAL RETURN

EXPENSE RATIO

FUND EXPENSE EXAMPLE
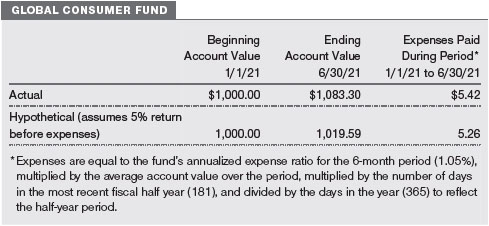
As a mutual fund shareholder, you may incur two types of costs: (1) transaction costs, such as redemption fees or sales loads, and (2) ongoing costs, including management fees, distribution and service (12b-1) fees, and other fund expenses. The following example is intended to help you understand your ongoing costs (in dollars) of investing in the fund and to compare these costs with the ongoing costs of investing in other mutual funds. The example is based on an investment of $1,000 invested at the beginning of the most recent six-month period and held for the entire period.
Actual Expenses
The first line of the following table (Actual) provides information about actual account values and expenses based on the fund’s actual returns. You may use the information on this line, together with your account balance, to estimate the expenses that you paid over the period. Simply divide your account value by $1,000 (for example, an $8,600 account value divided by $1,000 = 8.6), then multiply the result by the number on the first line under the heading “Expenses Paid During Period” to estimate the expenses you paid on your account during this period.
Hypothetical Example for Comparison Purposes
The information on the second line of the table (Hypothetical) is based on hypothetical account values and expenses derived from the fund’s actual expense ratio and an assumed 5% per year rate of return before expenses (not the fund’s actual return). You may compare the ongoing costs of investing in the fund with other funds by contrasting this 5% hypothetical example and the 5% hypothetical examples that appear in the shareholder reports of the other funds. The hypothetical account values and expenses may not be used to estimate the actual ending account balance or expenses you paid for the period.
Note: T. Rowe Price charges an annual account service fee of $20, generally for accounts with less than $10,000. The fee is waived for any investor whose T. Rowe Price mutual fund accounts total $50,000 or more; accounts electing to receive electronic delivery of account statements, transaction confirmations, prospectuses, and shareholder reports; or accounts of an investor who is a T. Rowe Price Personal Services or Enhanced Personal Services client (enrollment in these programs generally requires T. Rowe Price assets of at least $250,000). This fee is not included in the accompanying table. If you are subject to the fee, keep it in mind when you are estimating the ongoing expenses of investing in the fund and when comparing the expenses of this fund with other funds.
You should also be aware that the expenses shown in the table highlight only your ongoing costs and do not reflect any transaction costs, such as redemption fees or sales loads. Therefore, the second line of the table is useful in comparing ongoing costs only and will not help you determine the relative total costs of owning different funds. To the extent a fund charges transaction costs, however, the total cost of owning that fund is higher.
Unaudited


The accompanying notes are an integral part of these financial statements.
June 30, 2021 (Unaudited)


The accompanying notes are an integral part of these financial statements.
June 30, 2021 (Unaudited)

The accompanying notes are an integral part of these financial statements.
Unaudited

The accompanying notes are an integral part of these financial statements.
Unaudited

The accompanying notes are an integral part of these financial statements.
Unaudited
| NOTES TO FINANCIAL STATEMENTS |
T. Rowe Price International Funds, Inc. (the corporation) is registered under the Investment Company Act of 1940 (the 1940 Act). The Global Consumer Fund (the fund) is a nondiversified, open-end management investment company established by the corporation. The fund seeks to provide long-term growth of capital.
NOTE 1 - SIGNIFICANT ACCOUNTING POLICIES
Basis of Preparation The fund is an investment company and follows accounting and reporting guidance in the Financial Accounting Standards Board (FASB) Accounting Standards Codification Topic 946 (ASC 946). The accompanying financial statements were prepared in accordance with accounting principles generally accepted in the United States of America (GAAP), including, but not limited to, ASC 946. GAAP requires the use of estimates made by management. Management believes that estimates and valuations are appropriate; however, actual results may differ from those estimates, and the valuations reflected in the accompanying financial statements may differ from the value ultimately realized upon sale or maturity.
Investment Transactions, Investment Income, and Distributions Investment transactions are accounted for on the trade date basis. Income and expenses are recorded on the accrual basis. Realized gains and losses are reported on the identified cost basis. Income tax-related interest and penalties, if incurred, are recorded as income tax expense. Dividends received from mutual fund investments are reflected as dividend income; capital gain distributions are reflected as realized gain/loss. Dividend income and capital gain distributions are recorded on the ex-dividend date. Non-cash dividends, if any, are recorded at the fair market value of the asset received. Distributions to shareholders are recorded on the ex-dividend date. Income distributions, if any, are declared and paid annually. A capital gain distribution may also be declared and paid by the fund annually.
Currency Translation Assets, including investments, and liabilities denominated in foreign currencies are translated into U.S. dollar values each day at the prevailing exchange rate, using the mean of the bid and asked prices of such currencies against U.S. dollars as provided by an outside pricing service. Purchases and sales of securities, income, and expenses are translated into U.S. dollars at the prevailing exchange rate on the respective date of such transaction. The effect of changes in foreign currency exchange rates on realized and unrealized security gains and losses is not bifurcated from the portion attributable to changes in market prices.
Capital Transactions Each investor’s interest in the net assets of the fund is represented by fund shares. The fund’s net asset value (NAV) per share is computed at the close of the New York Stock Exchange (NYSE), normally 4 p.m. ET, each day the NYSE is open for business. However, the NAV per share may be calculated at a time other than the normal close of the NYSE if trading on the NYSE is restricted, if the NYSE closes earlier, or as may be permitted by the SEC. Purchases and redemptions of fund shares are transacted at the next-computed NAV per share, after receipt of the transaction order by T. Rowe Price Associates, Inc., or its agents.
Indemnification In the normal course of business, the fund may provide indemnification in connection with its officers and directors, service providers, and/or private company investments. The fund’s maximum exposure under these arrangements is unknown; however, the risk of material loss is currently considered to be remote.
NOTE 2 - VALUATION
Fair Value The fund’s financial instruments are valued at the close of the NYSE and are reported at fair value, which GAAP defines as the price that would be received to sell an asset or paid to transfer a liability in an orderly transaction between market participants at the measurement date. The T. Rowe Price Valuation Committee (the Valuation Committee) is an internal committee that has been delegated certain responsibilities by the fund’s Board of Directors (the Board) to ensure that financial instruments are appropriately priced at fair value in accordance with GAAP and the 1940 Act. Subject to oversight by the Board, the Valuation Committee develops and oversees pricing-related policies and procedures and approves all fair value determinations. Specifically, the Valuation Committee establishes policies and procedures used in valuing financial instruments, including those which cannot be valued in accordance with normal procedures or using pricing vendors; determines pricing techniques, sources, and persons eligible to effect fair value pricing actions; evaluates the services and performance of the pricing vendors; oversees the pricing process to ensure policies and procedures are being followed; and provides guidance on internal controls and valuation-related matters. The Valuation Committee provides periodic reporting to the Board on valuation matters.
Various valuation techniques and inputs are used to determine the fair value of financial instruments. GAAP establishes the following fair value hierarchy that categorizes the inputs used to measure fair value:
Level 1 – quoted prices (unadjusted) in active markets for identical financial instruments that the fund can access at the reporting date
Level 2 – inputs other than Level 1 quoted prices that are observable, either directly or indirectly (including, but not limited to, quoted prices for similar financial instruments in active markets, quoted prices for identical or similar financial instruments in inactive markets, interest rates and yield curves, implied volatilities, and credit spreads)
Level 3 – unobservable inputs (including the fund's own assumptions in determining fair value)
Observable inputs are developed using market data, such as publicly available information about actual events or transactions, and reflect the assumptions that market participants would use to price the financial instrument. Unobservable inputs are those for which market data are not available and are developed using the best information available about the assumptions that market participants would use to price the financial instrument. GAAP requires valuation techniques to maximize the use of relevant observable inputs and minimize the use of unobservable inputs. When multiple inputs are used to derive fair value, the financial instrument is assigned to the level within the fair value hierarchy based on the lowest-level input that is significant to the fair value of the financial instrument. Input levels are not necessarily an indication of the risk or liquidity associated with financial instruments at that level but rather the degree of judgment used in determining those values.
Valuation Techniques Equity securities, including exchange-traded funds, listed or regularly traded on a securities exchange or in the over-the-counter (OTC) market are valued at the last quoted sale price or, for certain markets, the official closing price at the time the valuations are made. OTC Bulletin Board securities are valued at the mean of the closing bid and asked prices. A security that is listed or traded on more than one exchange is valued at the quotation on the exchange determined to be the primary market for such security. Listed securities not traded on a particular day are valued at the mean of the closing bid and asked prices for domestic securities and the last quoted sale or closing price for international securities.
The last quoted prices of non-U.S. equity securities may be adjusted to reflect the fair value of such securities at the close of the NYSE, if the fund determines that developments between the close of a foreign market and the close of the NYSE will affect the value of some or all of its portfolio securities. Each business day, the fund uses information from outside pricing services to evaluate and, if appropriate, decide whether it is necessary to adjust quoted prices to reflect fair value by reviewing a variety of factors, including developments in foreign markets, the performance of U.S. securities markets, and the performance of instruments trading in U.S. markets that represent foreign securities and baskets of foreign securities. The fund uses outside pricing services to provide it with quoted prices and information to evaluate or adjust those prices. The fund cannot predict how often it will use quoted prices and how often it will determine it necessary to adjust those prices to reflect fair value.
Investments in mutual funds are valued at the mutual fund’s closing NAV per share on the day of valuation. Assets and liabilities other than financial instruments, including short-term receivables and payables, are carried at cost, or estimated realizable value, if less, which approximates fair value.
Investments for which market quotations or market-based valuations are not readily available or deemed unreliable are valued at fair value as determined in good faith by the Valuation Committee, in accordance with fair valuation policies and procedures. The objective of any fair value pricing determination is to arrive at a price that could reasonably be expected from a current sale. Financial instruments fair valued by the Valuation Committee are primarily private placements, restricted securities, warrants, rights, and other securities that are not publicly traded. Factors used in determining fair value vary by type of investment and may include market or investment specific considerations. The Valuation Committee typically will afford greatest weight to actual prices in arm’s length transactions, to the extent they represent orderly transactions between market participants, transaction information can be reliably obtained, and prices are deemed representative of fair value. However, the Valuation Committee may also consider other valuation methods such as market-based valuation multiples; a discount or premium from market value of a similar, freely traded security of the same issuer; discounted cash flows; yield to maturity; or some combination. Fair value determinations are reviewed on a regular basis and updated as information becomes available, including actual purchase and sale transactions of the investment. Because any fair value determination involves a significant amount of judgment, there is a degree of subjectivity inherent in such pricing decisions, and fair value prices determined by the Valuation Committee could differ from those of other market participants.
Valuation Inputs The following table summarizes the fund’s financial instruments, based on the inputs used to determine their fair values on June 30, 2021 (for further detail by category, please refer to the accompanying Portfolio of Investments):

Following is a reconciliation of the fund’s Level 3 holdings for the six months ended June 30, 2021. Gain (loss) reflects both realized and change in unrealized gain/loss on Level 3 holdings during the period, if any, and is included on the accompanying Statement of Operations. The change in unrealized gain/loss on Level 3 instruments held at June 30, 2021, totaled $862,000 for the six months ended June 30, 2021.

NOTE 3 - OTHER INVESTMENT TRANSACTIONS
Consistent with its investment objective, the fund engages in the following practices to manage exposure to certain risks and/or to enhance performance. The investment objective, policies, program, and risk factors of the fund are described more fully in the fund’s prospectus and Statement of Additional Information.
Restricted Securities The fund invests in securities that are subject to legal or contractual restrictions on resale. Prompt sale of such securities at an acceptable price may be difficult and may involve substantial delays and additional costs.
Securities Lending The fund may lend its securities to approved borrowers to earn additional income. Its securities lending activities are administered by a lending agent in accordance with a securities lending agreement. Security loans generally do not have stated maturity dates, and the fund may recall a security at any time. The fund receives collateral in the form of cash or U.S. government securities. Collateral is maintained over the life of the loan in an amount not less than the value of loaned securities; any additional collateral required due to changes in security values is delivered to the fund the next business day. Cash collateral is invested in accordance with investment guidelines approved by fund management. Additionally, the lending agent indemnifies the fund against losses resulting from borrower default. Although risk is mitigated by the collateral and indemnification, the fund could experience a delay in recovering its securities and a possible loss of income or value if the borrower fails to return the securities, collateral investments decline in value, and the lending agent fails to perform. Securities lending revenue consists of earnings on invested collateral and borrowing fees, net of any rebates to the borrower, compensation to the lending agent, and other administrative costs. In accordance with GAAP, investments made with cash collateral are reflected in the accompanying financial statements, but collateral received in the form of securities is not. At June 30, 2021, the value of loaned securities was $53,000; the value of cash collateral and related investments was $56,000.
Other Purchases and sales of portfolio securities other than short-term securities aggregated $42,332,000 and $33,685,000, respectively, for the six months ended June 30, 2021.
NOTE 4 - FEDERAL INCOME TAXES
No provision for federal income taxes is required since the fund intends to continue to qualify as a regulated investment company under Subchapter M of the Internal Revenue Code and distribute to shareholders all of its taxable income and gains. Distributions determined in accordance with federal income tax regulations may differ in amount or character from net investment income and realized gains for financial reporting purposes. Financial reporting records are adjusted for permanent book/tax differences to reflect tax character but are not adjusted for temporary differences. The amount and character of tax-basis distributions and composition of net assets are finalized at fiscal year-end; accordingly, tax-basis balances have not been determined as of the date of this report.
The fund intends to retain realized gains to the extent of available capital loss carryforwards. Net realized capital losses may be carried forward indefinitely to offset future realized capital gains. As of December 31, 2020, the fund had $3,000 of available capital loss carryforwards.
At June 30, 2021, the cost of investments for federal income tax purposes was $80,125,000. Net unrealized gain aggregated $23,929,000 at period-end, of which $25,106,000 related to appreciated investments and $1,177,000 related to depreciated investments.
NOTE 5 - RELATED PARTY TRANSACTIONS
The fund is managed by T. Rowe Price Associates, Inc. (Price Associates), a wholly owned subsidiary of T. Rowe Price Group, Inc. (Price Group). The investment management agreement between the fund and Price Associates provides for an annual investment management fee, which is computed daily and paid monthly. The fee consists of an individual fund fee, equal to 0.40% of the fund’s average daily net assets, and a group fee. The group fee rate is calculated based on the combined net assets of certain mutual funds sponsored by Price Associates (the group) applied to a graduated fee schedule, with rates ranging from 0.48% for the first $1 billion of assets to 0.260% for assets in excess of $845 billion. The fund’s group fee is determined by applying the group fee rate to the fund’s average daily net assets. The fee is computed daily and paid monthly. At June 30, 2021, the effective annual group fee rate was 0.28%.
The fund is subject to a contractual expense limitation through the expense limitation date indicated in the table below. During the limitation period, Price Associates is required to waive its management fee or pay any expenses (excluding interest; expenses related to borrowings, taxes, and brokerage; and other non-recurring expenses permitted by the investment management agreement) that would otherwise cause the class’s ratio of annualized total expenses to average net assets (net expense ratio) to exceed its expense limitation. The class is required to repay Price Associates for expenses previously waived/paid to the extent the class’s net assets grow or expenses decline sufficiently to allow repayment without causing the class’s net expense ratio (after the repayment is taken into account) to exceed the lesser of: (1) the expense limitation in place at the time such amounts were waived; or (2) the class’s current expense limitation. However, no repayment will be made more than three years after the date of a payment or waiver.
Pursuant to this agreement, expenses were waived/paid by and/or repaid to Price Associates during the six months ended June 30, 2021 as indicated in the table below. Including this amount, expenses previously waived/paid by Price Associates in the amount of $481,000 remain subject to repayment by the fund at June 30, 2021. Any repayment of expenses previously waived/paid by Price Associates during the period would be included in the net investment income and expense ratios presented on the accompanying Financial Highlights.

In addition, the fund has entered into service agreements with Price Associates and two wholly owned subsidiaries of Price Associates, each an affiliate of the fund (collectively, Price). Price Associates provides certain accounting and administrative services to the fund. T. Rowe Price Services, Inc. provides shareholder and administrative services in its capacity as the fund’s transfer and dividend-disbursing agent. T. Rowe Price Retirement Plan Services, Inc. provides subaccounting and recordkeeping services for certain retirement accounts invested in the fund. For the six months ended June 30, 2021, expenses incurred pursuant to these service agreements were $35,000 for Price Associates; $33,000 for T. Rowe Price Services, Inc.; and $2,000 for T. Rowe Price Retirement Plan Services, Inc. All amounts due to and due from Price, exclusive of investment management fees payable, are presented net on the accompanying Statement of Assets and Liabilities.
The fund may invest its cash reserves in certain open-end management investment companies managed by Price Associates and considered affiliates of the fund: the T. Rowe Price Government Reserve Fund or the T. Rowe Price Treasury Reserve Fund, organized as money market funds, or the T. Rowe Price Short-Term Fund, a short-term bond fund (collectively, the Price Reserve Funds). The Price Reserve Funds are offered as short-term investment options to mutual funds, trusts, and other accounts managed by Price Associates or its affiliates and are not available for direct purchase by members of the public. Cash collateral from securities lending is invested in the T. Rowe Price Short-Term Fund. The Price Reserve Funds pay no investment management fees.
The fund may participate in securities purchase and sale transactions with other funds or accounts advised by Price Associates (cross trades), in accordance with procedures adopted by the fund’s Board and Securities and Exchange Commission rules, which require, among other things, that such purchase and sale cross trades be effected at the independent current market price of the security. During the six months ended June 30, 2021, the fund had no purchases or sales cross trades with other funds or accounts advised by Price Associates.
Effective January 1, 2020, Price Associates has voluntarily agreed to reimburse the fund from its own resources on a monthly basis for the cost of investment research embedded in the cost of the fund’s securities trades. This agreement may be rescinded at any time. For the six months ended June 30, 2021, this reimbursement amounted to $3,000, which is included in Net realized gain (loss) on Securities in the Statement of Operations.
NOTE 6 - OTHER MATTERS
Unpredictable events such as environmental or natural disasters, war, terrorism, pandemics, outbreaks of infectious diseases, and similar public health threats may significantly affect the economy and the markets and issuers in which a fund invests. Certain events may cause instability across global markets, including reduced liquidity and disruptions in trading markets, while some events may affect certain geographic regions, countries, sectors, and industries more significantly than others, and exacerbate other pre-existing political, social, and economic risks. During 2020, a novel strain of coronavirus (COVID-19) resulted in disruptions to global business activity and caused significant volatility and declines in global financial markets.
These types of events, such as the global pandemic caused by COVID-19, may also cause widespread fear and uncertainty, and result in, among other things: enhanced health screenings, quarantines, cancellations, and travel restrictions, including border closings; disruptions to business operations and supply chains and customer activity; exchange trading suspensions and closures, and overall reduced liquidity of securities, derivatives, and commodities trading markets; reductions in consumer demand and economic output; and significant challenges in healthcare service preparation and delivery. The fund could be negatively impacted if the value of a portfolio holding were harmed by such political or economic conditions or events. In addition, the operations of the fund, its investment advisers, and the fund’s service providers may be significantly impacted, or even temporarily halted, as a result of any impairment to their information technology and other operation systems, extensive employee illnesses or unavailability, government quarantine measures, and restrictions on travel or meetings and other factors related to public emergencies.
Governmental and quasi-governmental authorities and regulators have in the past responded to major economic disruptions with a variety of significant fiscal and monetary policy changes, including but not limited to, direct capital infusions into companies, new monetary programs, and dramatically lower interest rates. An unexpected or quick reversal of these policies, or the ineffectiveness of these policies, could negatively impact overall investor sentiment and further increase volatility in securities markets.
INFORMATION ON PROXY VOTING POLICIES, PROCEDURES, AND RECORDS
A description of the policies and procedures used by T. Rowe Price funds to determine how to vote proxies relating to portfolio securities is available in each fund’s Statement of Additional Information. You may request this document by calling 1-800-225-5132 or by accessing the SEC’s website, sec.gov.
The description of our proxy voting policies and procedures is also available on our corporate website. To access it, please visit the following Web page:
https://www.troweprice.com/corporate/en/utility/policies.html
Scroll down to the section near the bottom of the page that says, “Proxy Voting Policies.” Click on the Proxy Voting Policies link in the shaded box.
Each fund’s most recent annual proxy voting record is available on our website and through the SEC’s website. To access it through T. Rowe Price, visit the website location shown above, and scroll down to the section near the bottom of the page that says, “Proxy Voting Records.” Click on the Proxy Voting Records link in the shaded box.
HOW TO OBTAIN QUARTERLY PORTFOLIO HOLDINGS
The fund files a complete schedule of portfolio holdings with the Securities and Exchange Commission (SEC) for the first and third quarters of each fiscal year as an exhibit to its reports on Form N-PORT. The fund’s reports on Form N-PORT are available electronically on the SEC’s website (sec.gov). In addition, most T. Rowe Price funds disclose their first and third fiscal quarter-end holdings on troweprice.com.
APPROVAL OF INVESTMENT MANAGEMENT AGREEMENT
Each year, the fund’s Board of Directors (Board) considers the continuation of the investment management agreement (Advisory Contract) between the fund and its investment advisor, T. Rowe Price Associates, Inc. (Advisor). In that regard, at a meeting held on March 8–9, 2021 (Meeting), the Board, including all of the fund’s independent directors, approved the continuation of the fund’s Advisory Contract. At the Meeting, the Board considered the factors and reached the conclusions described below relating to the selection of the Advisor and the approval of the Advisory Contract. The independent directors were assisted in their evaluation of the Advisory Contract by independent legal counsel from whom they received separate legal advice and with whom they met separately.
In providing information to the Board, the Advisor was guided by a detailed set of requests for information submitted by independent legal counsel on behalf of the independent directors. In considering and approving the Advisory Contract, the Board considered the information it believed was relevant, including, but not limited to, the information discussed below. The Board considered not only the specific information presented in connection with the Meeting but also the knowledge gained over time through interaction with the Advisor about various topics. The Board meets regularly and, at each of its meetings, covers an extensive agenda of topics and materials and considers factors that are relevant to its annual consideration of the renewal of the T. Rowe Price funds’ advisory contracts, including performance and the services and support provided to the funds and their shareholders.
Services Provided by the Advisor
The Board considered the nature, quality, and extent of the services provided to the fund by the Advisor. These services included, but were not limited to, directing the fund’s investments in accordance with its investment program and the overall management of the fund’s portfolio, as well as a variety of related activities such as financial, investment operations, and administrative services; compliance; maintaining the fund’s records and registrations; and shareholder communications. The Board also reviewed the background and experience of the Advisor’s senior management team and investment personnel involved in the management of the fund, as well as the Advisor’s compliance record. The Board concluded that it was satisfied with the nature, quality, and extent of the services provided by the Advisor.
Investment Performance of the Fund
The Board took into account discussions with the Advisor and reports that it receives throughout the year relating to fund performance. In connection with the Meeting, the Board reviewed the fund’s net annualized total returns for the one-, two-, three-, and four-year periods as of September 30, 2020, and compared these returns with the performance of a peer group of funds with similar investment programs and a wide variety of other previously agreed-upon comparable performance measures and market data, including those supplied by Broadridge, which is an independent provider of mutual fund data.
On the basis of this evaluation and the Board’s ongoing review of investment results, and factoring in the relative market conditions during certain of the performance periods, the Board concluded that the fund’s performance was satisfactory.
Costs, Benefits, Profits, and Economies of Scale
The Board reviewed detailed information regarding the revenues received by the Advisor under the Advisory Contract and other direct and indirect benefits that the Advisor (and its affiliates) may have realized from its relationship with the fund. In considering soft-dollar arrangements pursuant to which research may be received from broker-dealers that execute the fund’s portfolio transactions, the Board noted that the Advisor bears the cost of research services for all client accounts that it advises, including the T. Rowe Price funds. The Board received information on the estimated costs incurred and profits realized by the Advisor from managing the T. Rowe Price funds. While the Board did not review information regarding profits realized from managing the fund in particular because the fund had either not achieved sufficient portfolio asset size or not recognized sufficient revenues to produce meaningful profit margin percentages, the Board concluded that the Advisor’s profits were reasonable in light of the services provided to the T. Rowe Price funds.
The Board also considered whether the fund benefits under the fee levels set forth in the Advisory Contract from any economies of scale realized by the Advisor. Under the Advisory Contract, the fund pays a fee to the Advisor for investment management services composed of two components—a group fee rate based on the combined average net assets of most of the T. Rowe Price funds (including the fund) that declines at certain asset levels and an individual fund fee rate based on the fund’s average daily net assets—and the fund pays its own expenses of operations (subject to a contractual expense limitation). The Board concluded that the advisory fee structure for the fund continued to provide for a reasonable sharing of benefits from any economies of scale with the fund’s investors.
Fees and Expenses
The Board was provided with information regarding industry trends in management fees and expenses. Among other things, the Board reviewed data for peer groups that were compiled by Broadridge, which compared: (i) contractual management fees, total expenses, actual management fees, and nonmanagement expenses of the Investor Class of the fund with a group of competitor funds selected by Broadridge (Expense Group) and (ii) total expenses, actual management fees, and nonmanagement expenses of the Investor Class of the fund with a broader set of funds within the Lipper investment classification (Expense Universe). The Board considered the fund’s contractual management fee rate, actual management fee rate (which reflects the management fees actually received from the fund by the Advisor after any applicable waivers, reductions, or reimbursements), operating expenses, and total expenses (which reflect the net total expense ratio of the fund after any waivers, reductions, or reimbursements) in comparison with the information for the Broadridge peer groups. Broadridge generally constructed the peer groups by seeking the most comparable funds based on similar investment classifications and objectives, expense structure, asset size, and operating components and attributes and ranked funds into quintiles, with the first quintile representing the funds with the lowest relative expenses and the fifth quintile representing the funds with the highest relative expenses, although there were not sufficient funds in the Expense Group to meaningfully rank within quintiles. The information provided to the Board indicated that the fund’s contractual management fee ranked second out of three funds (Expense Group), the fund’s actual management fee rate ranked first out of three funds (Expense Group) and in the first quintile (Expense Universe), and the fund’s total expenses ranked second out of three funds (Expense Group) and in the fourth quintile (Expense Universe).
The Board also reviewed the fee schedules for other investment portfolios with similar mandates that are advised or subadvised by the Advisor and its affiliates, including separately managed accounts for institutional and individual investors; subadvised funds; and other sponsored investment portfolios, including collective investment trusts and pooled vehicles that are organized and offered to investors outside the United States. Management provided the Board with information about the Advisor’s responsibilities and services provided to subadvisory and other institutional account clients, including information about how the requirements and economics of the institutional business are fundamentally different from those of the proprietary mutual fund business. The Board considered information showing that the Advisor’s mutual fund business is generally more complex from a business and compliance perspective than its institutional account business and considered various relevant factors, such as the broader scope of operations and oversight, more extensive shareholder communication infrastructure, greater asset flows, heightened business risks, and differences in applicable laws and regulations associated with the Advisor’s proprietary mutual fund business. In assessing the reasonableness of the fund’s management fee rate, the Board considered the differences in the nature of the services required for the Advisor to manage its mutual fund business versus managing a discrete pool of assets as a subadvisor to another institution’s mutual fund or for an institutional account and that the Advisor generally performs significant additional services and assumes greater risk in managing the fund and other T. Rowe Price funds than it does for institutional account clients, including subadvised funds.
On the basis of the information provided and the factors considered, the Board concluded that the fees paid by the fund under the Advisory Contract are reasonable.
Approval of the Advisory Contract
As noted, the Board approved the continuation of the Advisory Contract. No single factor was considered in isolation or to be determinative to the decision. Rather, the Board concluded, in light of a weighting and balancing of all factors considered, that it was in the best interests of the fund and its shareholders for the Board to approve the continuation of the Advisory Contract (including the fees to be charged for services thereunder).
Item 1. (b) Notice pursuant to Rule 30e-3.
Not applicable.
Item 2. Code of Ethics.
A code of ethics, as defined in Item 2 of Form N-CSR, applicable to its principal executive officer, principal financial officer, principal accounting officer or controller, or persons performing similar functions is filed as an exhibit to the registrant’s annual Form N-CSR. No substantive amendments were approved or waivers were granted to this code of ethics during the registrant’s most recent fiscal half-year.
Item 3. Audit Committee Financial Expert.
Disclosure required in registrant’s annual Form N-CSR.
Item 4. Principal Accountant Fees and Services.
Disclosure required in registrant’s annual Form N-CSR.
Item 5. Audit Committee of Listed Registrants.
Not applicable.
Item 6. Investments.
(a) Not applicable. The complete schedule of investments is included in Item 1 of this Form N-CSR.
(b) Not applicable.
Item 7. Disclosure of Proxy Voting Policies and Procedures for Closed-End Management Investment Companies.
Not applicable.
Item 8. Portfolio Managers of Closed-End Management Investment Companies.
Not applicable.
Item 9. Purchases of Equity Securities by Closed-End Management Investment Company and Affiliated Purchasers.
Not applicable.
Item 10. Submission of Matters to a Vote of Security Holders.
There has been no change to the procedures by which shareholders may recommend nominees to the registrant’s board of directors.
Item 11. Controls and Procedures.
(a) The registrant’s principal executive officer and principal financial officer have evaluated the registrant’s disclosure controls and procedures within 90 days of this filing and have concluded that the registrant’s disclosure controls and procedures were effective, as of that date, in ensuring that information required to be disclosed by the registrant in this Form N-CSR was recorded, processed, summarized, and reported timely.
(b) The registrant’s principal executive officer and principal financial officer are aware of no change in the registrant’s internal control over financial reporting that occurred during the period covered by this report that has materially affected, or is reasonably likely to materially affect, the registrant’s internal control over financial reporting.
Item 12. Disclosure of Securities Lending Activities for Closed-End Management Investment Companies.
Not applicable.
Item 13. Exhibits.
(a)(1) The registrant’s code of ethics pursuant to Item 2 of Form N-CSR is filed with the registrant’s annual Form N-CSR.
(3) Written solicitation to repurchase securities issued by closed-end companies: not applicable.
SIGNATURES
Pursuant to the requirements of the Securities Exchange Act of 1934 and the Investment Company Act of 1940, the registrant has duly caused this report to be signed on its behalf by the undersigned, thereunto duly authorized.
T. Rowe Price International Funds, Inc.
| By | /s/ David Oestreicher | |||||
| David Oestreicher | ||||||
| Principal Executive Officer | ||||||
| Date | August 17, 2021 | |||||
Pursuant to the requirements of the Securities Exchange Act of 1934 and the Investment Company Act of 1940, this report has been signed below by the following persons on behalf of the registrant and in the capacities and on the dates indicated.
| By | /s/ David Oestreicher | |||||
| David Oestreicher | ||||||
| Principal Executive Officer | ||||||
| Date | August 17, 2021 | |||||
| By | /s/ Alan S. Dupski | |||||
| Alan S. Dupski | ||||||
| Principal Financial Officer | ||||||
| Date | August 17, 2021 | |||||