UNITED STATES
SECURITIES AND EXCHANGE COMMISSION
Washington, D.C. 20549
FORM N-CSR
CERTIFIED SHAREHOLDER REPORT OF REGISTERED
MANAGEMENT INVESTMENT COMPANIES
Investment Company Act File Number: 811-02958
| T. Rowe Price International Funds, Inc. |
|
| (Exact name of registrant as specified in charter) |
| |
| 100 East Pratt Street, Baltimore, MD 21202 |
|
| (Address of principal executive offices) |
| |
| David Oestreicher |
| 100 East Pratt Street, Baltimore, MD 21202 |
|
| (Name and address of agent for service) |
Registrant’s telephone number, including area code: (410) 345-2000
Date of fiscal year end: October 31
Date of reporting period: April 30, 2022
Item 1. Reports to Shareholders
(a) Report pursuant to Rule 30e-1.
| PRJPX | Investor Class |
| RJAIX | I Class |
| TRZJX | Z Class |
HIGHLIGHTS
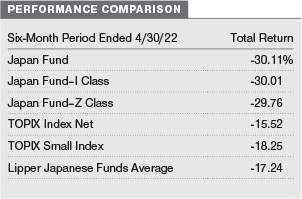
| ■ | The fund underperformed its benchmark, the TOPIX Index Net, and its Lipper peer group average, during the six-month period ended April 30, 2022. |
| | |
| ■ | Stock selection proved to be weak against a backdrop of continued “risk off” sentiment, a rotation from growth into value, and a widening of the small-cap discount relative to large-cap. Our choice of securities and overweight allocation in information technology (IT) and services dragged the most, while stock picks in automobiles and transportation equipment also detracted. In contrast, security selection and our underweight position in construction and materials, as well as our below-benchmark allocation to electric appliances and precision instruments, boosted relative returns. |
| | |
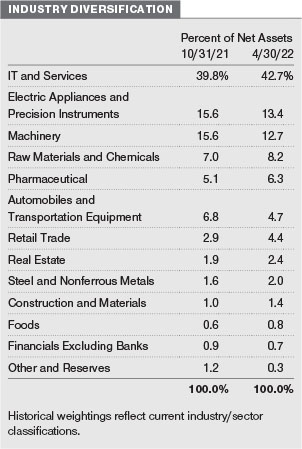
| ■ | The fund’s biggest overweight positions are in the IT and services and machinery sectors. The largest below-benchmark allocations are to electric appliances and precision instruments, commercial and wholesale trade, and banks. Despite the challenging environment, we have not looked to reposition the fund, and we retain conviction in the majority small-cap, quality-growth companies that we hold. |
| | |
| ■ | Japan’s equity market is trading at a discount to its longer-term average valuations. In our view, the bad news has been priced in, and with the domestic economy open, border restrictions gradually set to ease, and the eventual return of Chinese and global activity stimulating the economy, we see an attractive long-term investment opportunity in Japanese equities. |

Log in to your account at troweprice.com for more information.
*Certain mutual fund accounts that are assessed an annual account service fee can also save money by switching to e-delivery.
Market Commentary
Dear Shareholder
Global stock markets produced negative returns during the first half of your fund’s fiscal year, the six-month period ended April 30, 2022, while rising bond yields weighed on returns for fixed income investors. Fears concerning new coronavirus variants, rising interest rates, and soaring inflation caused bouts of volatility throughout the period. These concerns were compounded by Russia’s invasion of Ukraine in February, sending markets around the world into correction territory.
All major global and regional equity benchmarks receded during the period. Value shares extended their recent outperformance of growth stocks as equity investors turned risk averse. Although most sectors finished in the red, energy stocks registered exceptional returns as oil prices jumped in response to Russia’s invasion and the ensuing commodity supply crunch. A strong U.S. dollar weighed on returns for U.S. investors in most international markets. Across the style spectrum, developed markets held up better than emerging markets.
In November 2021, the emergence of the omicron variant of the coronavirus prompted worries about the economic outlook and the potential that a resurgence in cases could lead to further supply chain disruptions. While omicron variant trends and restrictions eased in most regions early in 2022, China continued to pursue a “zero-COVID” policy, resulting in large-scale lockdowns and industrial production disruptions.
In February 2022, markets were caught further by surprise when Russia launched a large-scale military offensive into Ukraine. The strong sanctions on Russia that followed raised concerns about supply chains that were already stressed by the coronavirus pandemic. On March 8, the White House announced that the U.S. was cutting off all oil imports from Russia. In response, oil prices surged to their highest level in a decade.
Concerns over inflation intensified over much of the period, driven in part by events in Ukraine and China. Along with supply chain problems, the release of pent-up demand for travel, recreation, and other services also pushed prices higher. In the U.S., consumer prices rose 8.5% in March versus the year before—the highest annual reading since December 1981—driven by accelerating energy and food prices.
Elevated inflation caused global monetary policy to take a hawkish turn. In the U.S., Federal Reserve officials began tapering the central bank’s monthly purchases of Treasuries and agency mortgage-backed securities in November. In March, the Fed approved its first interest rate hike in more than three years and signaled an accelerating pace of rate increases ahead. In Europe, the Bank of England raised its key interest rate three times in a row between December and March, while the European Central Bank indicated in March that it could end its asset purchase program as soon as the third quarter of 2022.
Bond indexes were broadly negative as yields rose across the Treasury yield curve amid surging inflation and expectations of aggressive monetary tightening. (Bond yields and prices move in opposite directions.) Investment-grade corporate bonds experienced significant losses, while municipal bonds suffered through their worst quarter in more than 40 years at the start of 2022 and finished the period lower. Late in the period, multiple portions of the Treasury yield curve inverted briefly, raising fears of a looming recession.
The challenges global markets face are complex and could drive market volatility for some time. Investors will be closely monitoring the Fed’s actions as the central bank attempts to use interest rate hikes to tame inflation without stifling economic growth. Meanwhile, the ongoing geopolitical and humanitarian crisis in Ukraine continues to disrupt supply chains, increase inflationary pressures, and dampen consumer confidence.
During challenging times like these, I am heartened by our firm’s long-term focus and time-tested investment approach. I also recognize that market volatility and sector rotation historically have presented very good opportunities for active investors. I remain confident in the ability of our global research organization to uncover compelling investment ideas that can help deliver superior long-term risk-adjusted performance as market conditions normalize.
Thank you for your continued confidence in T. Rowe Price.
Sincerely,

Robert Sharps
CEO and President
Management’s Discussion of Fund Performance
INVESTMENT OBJECTIVE
The fund seeks long-term growth of capital through investments in common stocks of companies located (or with primary operations) in Japan.
FUND COMMENTARY
How did the fund perform in the past six months?
The Japan Fund returned -30.11% in the six-month period ended April 30, 2022. As shown in the Performance Comparison table, the fund under-performed its benchmark, the TOPIX Index Net, and the Lipper Japanese Funds Average. (Returns for I and Z Class shares varied slightly, reflecting their different fee structures. Past performance cannot guarantee future results.)
What factors influenced the fund’s performance?
The fund underperformed its benchmark as stock selection proved to be weak against a backdrop of continued “risk off ” sentiment, a rotation from growth into value, and a widening of the small-cap discount relative to large-cap. Our choice of securities and overweight allocation in information technology (IT) and services dragged the most, while stock picks in automobiles and transportation equipment also detracted. In contrast, security selection and our underweight position in construction and materials, as well as our below-benchmark allocation to electric appliances and precision instruments, boosted relative returns.
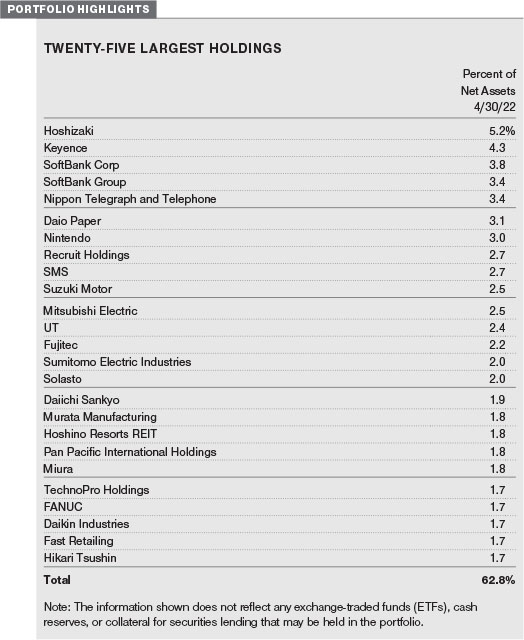
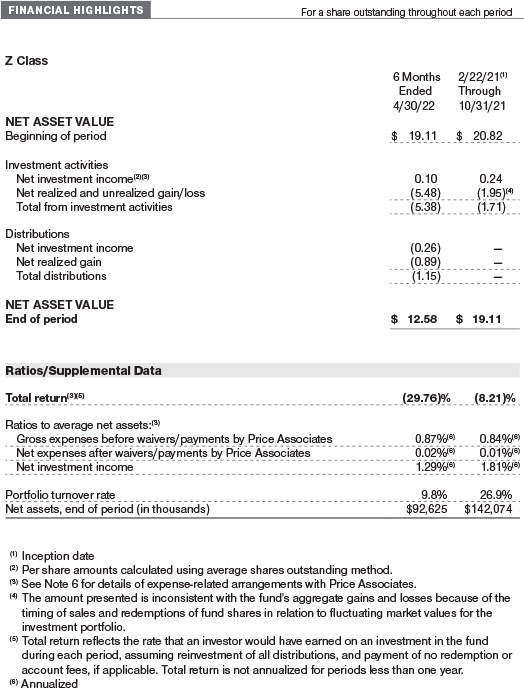
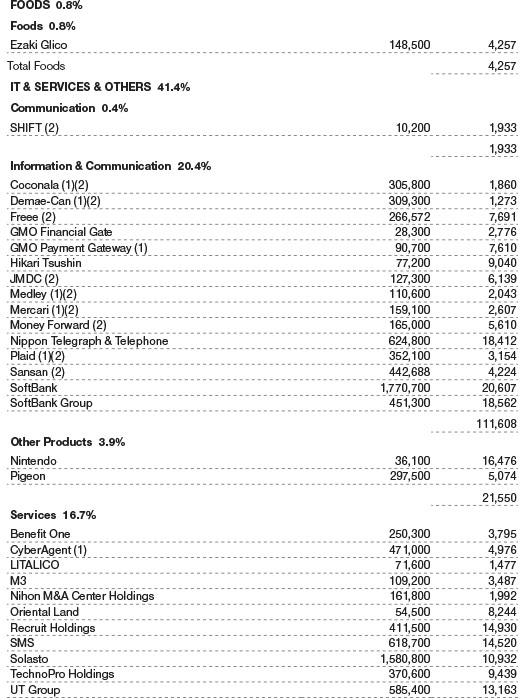
Within IT, typically higher-growth, longer-duration stocks—which are more sensitive to a rising interest rate environment—suffered amid expectations of aggressive monetary policy tightening by the U.S. Federal Reserve (Fed). As a result, our exposure to IT companies, including software-as-a-service providers Free and Money Forward and e-commerce leader Mercari, held back relative performance. Telecommunications company Nippon Telegraph and Telephone weathered the sector headwinds, however, and continued to generate steady earnings-per-share growth due to its solid balance sheet and defensive earnings from dominant market share in both fixed line and mobile. (Please refer to the portfolio of investments for a complete list of holdings and the amount each represents in the portfolio.)
In the automobiles and transportation equipment sector, Suzuki Motor lagged. The carmaker has relatively weak pricing power, making it difficult to pass on raw materials cost increases to its customers, and its Indian subsidiary Maruti may suffer as higher oil prices weigh on consumption in India. Over the long term, however, we expect the company to continue benefiting from increasing automotive penetration in India and solid management execution. Shares of truck manufacturer Hino Motors fell sharply in March on news that the emissions and fuel economy testing procedures on some of its engines had been fraudulent. We believe that the market response was disproportionate given the size of the fine received by the company and continue to monitor the situation.
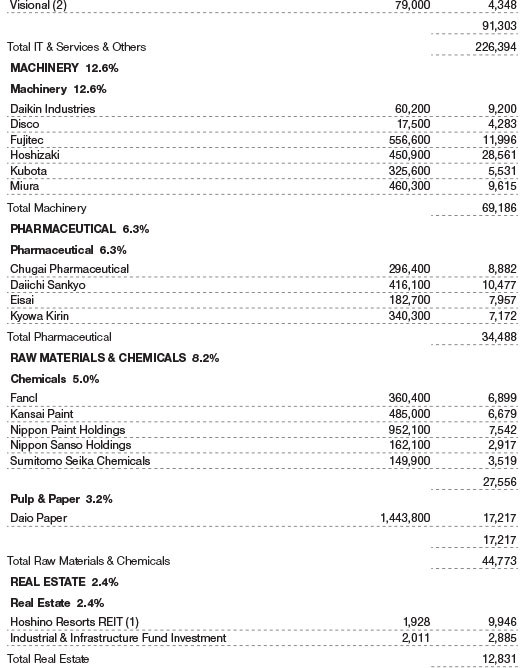
Industrial sectors faced the headwinds of aggressive Fed tightening, China’s COVID-19 lockdowns, and slowing economic growth globally. Within machinery, our exposure to boiler manufacturer Miura and Daikin Industries, a producer of air conditioners, detracted. We believe that these companies’ fundamentals remain strong and that the price action is not justified. There were pockets of strength in the sector, however. Elevator manufacturer Fujitec performed strongly. After being targeted by activist investors, the company announced a large share buyback and raised its medium-term return-on-equity target.
Similarly, the electric appliances and precision instruments sector struggled amid concerns about aggressive monetary policy tightening by the Fed and the buildup of inflationary pressure in the global economy. Our below-benchmark allocation was beneficial, although these gains were mostly offset by our stock selection. Our avoidance of Sony added to relative returns. The technology conglomerate reported third-quarter results that were broadly better than expected, but the reemergence of some concerns about its gaming business weighed on the shares. It is trading at or near a peak multiple, and expectations are very high. Not holding Nidec was also beneficial. The electric motor producer’s third-quarter earnings missed estimates due to weakness in its core auto and appliance, commercial, and industrial divisions.
How is the fund positioned?
The fund’s biggest overweight positions are in the IT and services and machinery industries. The largest below-benchmark allocations are to electric appliances and precision instruments, commercial and wholesale trade, and banks.
Despite the challenging environment, we have not looked to reposition the fund, and we retain conviction in the majority small-cap, quality-growth companies that we hold.
Some trading activity toward the end of the review period was mostly aimed at reducing overall portfolio risk, or beta. In April, we marginally trimmed our exposure to the machinery sector and took some longer-term profits amid the challenging backdrop posed to this segment in particular by the strict coronavirus lockdowns in China.
We added four new positions over the last six months. Pharmaceutical company Daiichi Sankyo has antibody drug conjugate (ADC) technology that has shown very promising results in the treatment of breast and lung cancer. Our thesis is that the ADC technology has broad applicability beyond the initial indication of late-stage breast cancer, including, over the medium to long term, pan-tumor applicability. We believe this should drive a transformation of Daiichi Sankyo into a long-term growth story.
M3, a provider of digital-based solutions for multiple health care industry subsectors, is best known for its marketing support business for pharmaceutical companies. We believe it is well positioned to benefit from secular growth in the digitalization/outsourcing of sales and marketing spending by pharmaceutical companies.
Shift started as a software testing company but is expanding into IT services more broadly and is underpinned by sound corporate fundamentals, in our view.
Nihon M&A Center is principally involved in the merger and acquisition brokerage business. Its shares suffered as a result of the broader sell-off in growth stocks, providing us with an attractive entry point.
Conversely, we eliminated our stakes in Takeda Pharmaceutical and SMC, an automatic-control equipment company. We exited Takeda Pharmaceutical following a high-profile research and development failure and due to a lack of meaningful pipeline catalysts on the horizon.
In the case of SMC, corporate fundamentals had peaked and the shares had become too expensive, in our view.
What is portfolio management’s outlook?
Japan has been a poor performer over the past 18 months, as a slow COVID-19 vaccination rollout and concerns about easing global growth have weighed on the market. More recently, the increasingly weaker yen—down 12% versus the U.S. dollar over the last six months, according to RIMES/MSCI data—has impacted portfolio returns as this benefits companies with a larger proportion of overseas earnings but poses a strong headwind for importers. With the yen at 20-year lows due to a divergence in monetary policies (i.e., the Bank of Japan remains highly accommodative, while the Fed and other central banks are tightening policy), the currency could strengthen if inflation stabilizes in the U.S. and picks up in Japan.
We have seen a rerating of banks and deep cyclical industries like steel in Japan to which we have limited exposure. Longer term, we believe that these companies will struggle to make their cost of capital and generate durable investment growth and that further upside potential is limited.
Our portfolio’s performance has been hindered by our overweight in small-cap stocks, which have lagged amid investors’ flight to assets perceived as safer. To us, small-caps represent the future of Japan and, in a country of low growth, are managing to grow durably and take market share. Japan lags on digitalization and faces the challenge of an aging population, and we believe that small-cap companies play an important role in addressing these issues. Among these are companies that are embracing e-commerce, payments, cloud accounting, and recruitment platforms.
Japan’s equity market is trading at a discount to its longer-term average valuations. In our view, the bad news has been priced in, and with the domestic economy open, border restrictions gradually set to ease, and the eventual return of Chinese and global activity stimulating the economy, we see an attractive long-term investment opportunity in Japanese equities.
The views expressed reflect the opinions of T. Rowe Price as of the date of this report and are subject to change based on changes in market, economic, or other conditions. These views are not intended to be a forecast of future events and are no guarantee of future results.
RISKS OF INTERNATIONAL INVESTING
Funds that invest overseas generally carry more risk than funds that invest strictly in U.S. assets. Funds investing in a single country or limited geographic region tend to be riskier than more diversified funds. Risks can result from varying stages of economic and political development; differing regulatory environments, trading days, and accounting standards; and higher transaction costs of non-U.S. markets. Non-U.S. investments are also subject to currency risk, or a decline in the value of a foreign currency versus the U.S. dollar, which reduces the dollar value of securities denominated in that currency.
For a thorough discussion of risks, please see the fund’s prospectus.
BENCHMARK INFORMATION
Portions of the mutual fund information contained in this report were supplied by Lipper, a Refinitiv Company, subject to the following: Copyright 2022 © Refinitiv. All rights reserved. Any copying, republication or redistribution of Lipper content is expressly prohibited without the prior written consent of Lipper. Lipper shall not be liable for any errors or delays in the content, or for any actions taken in reliance thereon.
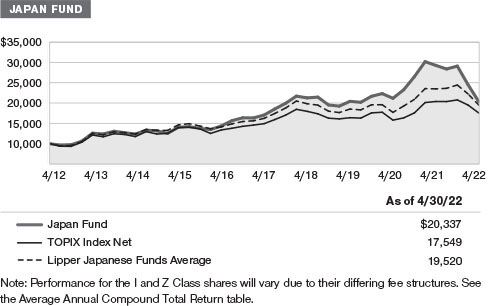
GROWTH OF $10,000
This chart shows the value of a hypothetical $10,000 investment in the fund over the past 10 fiscal year periods or since inception (for funds lacking 10-year records). The result is compared with benchmarks, which include a broad-based market index and may also include a peer group average or index. Market indexes do not include expenses, which are deducted from fund returns as well as mutual fund averages and indexes.
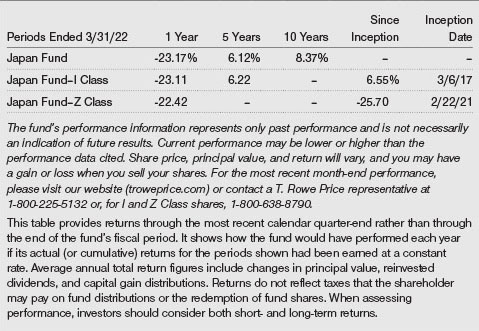
AVERAGE ANNUAL COMPOUND TOTAL RETURN

EXPENSE RATIO
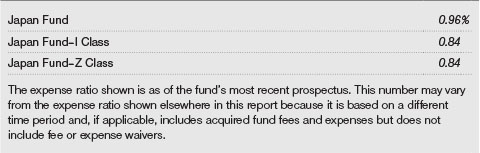
FUND EXPENSE EXAMPLE
As a mutual fund shareholder, you may incur two types of costs: (1) transaction costs, such as redemption fees or sales loads, and (2) ongoing costs, including management fees, distribution and service (12b-1) fees, and other fund expenses. The following example is intended to help you understand your ongoing costs (in dollars) of investing in the fund and to compare these costs with the ongoing costs of investing in other mutual funds. The example is based on an investment of $1,000 invested at the beginning of the most recent six-month period and held for the entire period.
Please note that the fund has three share classes: The original share class (Investor Class) charges no distribution and service (12b-1) fee, I Class shares are also available to institutionally oriented clients and impose no 12b-1 or administrative fee payment, and Z Class shares are offered only to funds advised by T. Rowe Price and other advisory clients of T. Rowe Price or its affiliates that are subject to a contractual fee for investment management services and impose no 12b-1 fee or administrative fee payment. Each share class is presented separately in the table.
Actual Expenses
The first line of the following table (Actual) provides information about actual account values and expenses based on the fund’s actual returns. You may use the information on this line, together with your account balance, to estimate the expenses that you paid over the period. Simply divide your account value by $1,000 (for example, an $8,600 account value divided by $1,000 = 8.6), then multiply the result by the number on the first line under the heading “Expenses Paid During Period” to estimate the expenses you paid on your account during this period.
Hypothetical Example for Comparison Purposes
The information on the second line of the table (Hypothetical) is based on hypothetical account values and expenses derived from the fund’s actual expense ratio and an assumed 5% per year rate of return before expenses (not the fund’s actual return). You may compare the ongoing costs of investing in the fund with other funds by contrasting this 5% hypothetical example and the 5% hypothetical examples that appear in the shareholder reports of the other funds. The hypothetical account values and expenses may not be used to estimate the actual ending account balance or expenses you paid for the period.
Note: T. Rowe Price charges an annual account service fee of $20, generally for accounts with less than $10,000. The fee is waived for any investor whose T. Rowe Price mutual fund accounts total $50,000 or more; accounts electing to receive electronic delivery of account statements, transaction confirmations, prospectuses, and shareholder reports; or accounts of an investor who is a T. Rowe Price Personal Services or Enhanced Personal Services client (enrollment in these programs generally requires T. Rowe Price assets of at least $250,000). This fee is not included in the accompanying table. If you are subject to the fee, keep it in mind when you are estimating the ongoing expenses of investing in the fund and when comparing the expenses of this fund with other funds.
You should also be aware that the expenses shown in the table highlight only your ongoing costs and do not reflect any transaction costs, such as redemption fees or sales loads. Therefore, the second line of the table is useful in comparing ongoing costs only and will not help you determine the relative total costs of owning different funds. To the extent a fund charges transaction costs, however, the total cost of owning that fund is higher.

QUARTER-END RETURNS
Unaudited
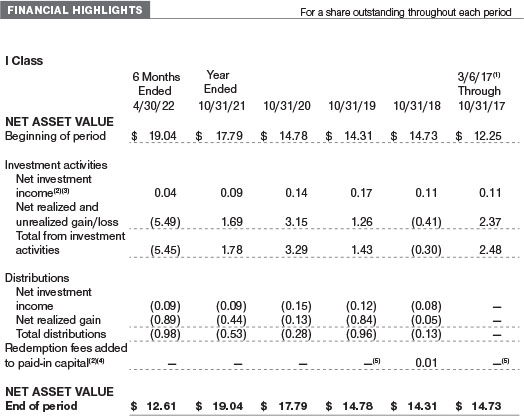
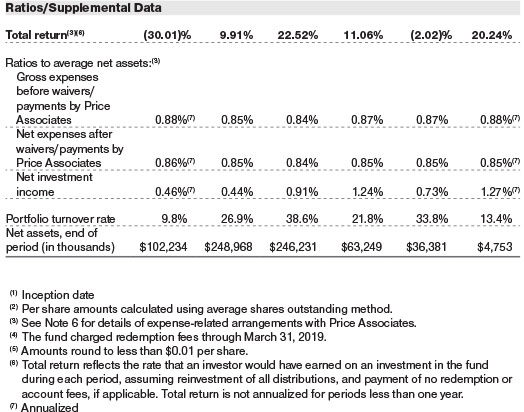
The accompanying notes are an integral part of these financial statements.
Unaudited
The accompanying notes are an integral part of these financial statements.
Unaudited
The accompanying notes are an integral part of these financial statements.
April 30, 2022 (Unaudited)


The accompanying notes are an integral part of these financial statements.
April 30, 2022 (Unaudited)
The accompanying notes are an integral part of these financial statements.
Unaudited

The accompanying notes are an integral part of these financial statements.
Unaudited
The accompanying notes are an integral part of these financial statements.
Unaudited
| NOTES TO FINANCIAL STATEMENTS |
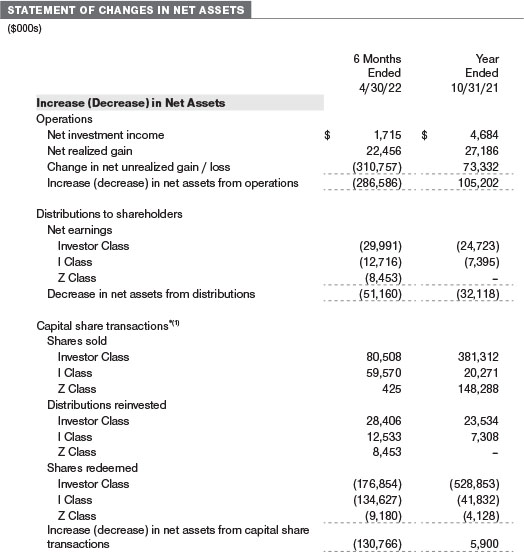
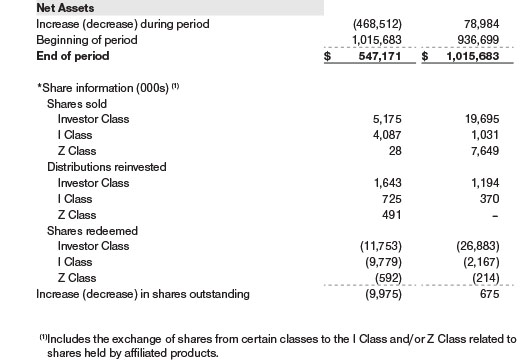
T. Rowe Price International Funds, Inc. (the corporation) is registered under the Investment Company Act of 1940 (the 1940 Act). The Japan Fund (the fund) is a diversified, open-end management investment company established by the corporation. The fund seeks long-term growth of capital through investments in common stocks of companies located (or with primary operations) in Japan. The fund has three classes of shares: the Japan Fund (Investor Class), the Japan Fund–I Class (I Class) and the Japan Fund–Z Class (Z Class). I Class shares require a $500,000 initial investment minimum, although the minimum generally is waived or reduced for financial intermediaries, eligible retirement plans, and certain other accounts. Prior to November 15, 2021, the initial investment minimum was $1 million and was generally waived for financial intermediaries, eligible retirement plans, and other certain accounts. As a result of the reduction in the I Class minimum, certain assets transferred from the Investor Class to the I Class. This transfer of shares from Investor Class to I Class is reflected in the Statement of Changes in Net Assets within the Capital shares transactions as Shares redeemed and Shares sold, respectively. The Z Class is only available to funds advised by T. Rowe Price Associates, Inc. and its affiliates and other clients that are subject to a contractual fee for investment management services. Each class has exclusive voting rights on matters related solely to that class; separate voting rights on matters that relate to all classes; and, in all other respects, the same rights and obligations as the other classes.
NOTE 1 - SIGNIFICANT ACCOUNTING POLICIES
Basis of Preparation The fund is an investment company and follows accounting and reporting guidance in the Financial Accounting Standards Board (FASB) Accounting Standards Codification Topic 946 (ASC 946). The accompanying financial statements were prepared in accordance with accounting principles generally accepted in the United States of America (GAAP), including, but not limited to, ASC 946. GAAP requires the use of estimates made by management. Management believes that estimates and valuations are appropriate; however, actual results may differ from those estimates, and the valuations reflected in the accompanying financial statements may differ from the value ultimately realized upon sale or maturity.
Investment Transactions, Investment Income, and Distributions Investment transactions are accounted for on the trade date basis. Income and expenses are recorded on the accrual basis. Realized gains and losses are reported on the identified cost basis. Income tax-related interest and penalties, if incurred, are recorded as income tax expense. Dividends received from mutual fund investments are reflected as dividend income; capital gain distributions are reflected as realized gain/loss. Dividend income and capital gain distributions are recorded on the ex-dividend date. Non-cash dividends, if any, are recorded at the fair market value of the asset received. Distributions to shareholders are recorded on the ex-dividend date. Income distributions, if any, are declared and paid by each class annually. A capital gain distribution may also be declared and paid by the fund annually.
Currency Translation Assets, including investments, and liabilities denominated in foreign currencies are translated into U.S. dollar values each day at the prevailing exchange rate, using the mean of the bid and asked prices of such currencies against U.S. dollars as provided by an outside pricing service. Purchases and sales of securities, income, and expenses are translated into U.S. dollars at the prevailing exchange rate on the respective date of such transaction. The effect of changes in foreign currency exchange rates on realized and unrealized security gains and losses is not bifurcated from the portion attributable to changes in market prices.
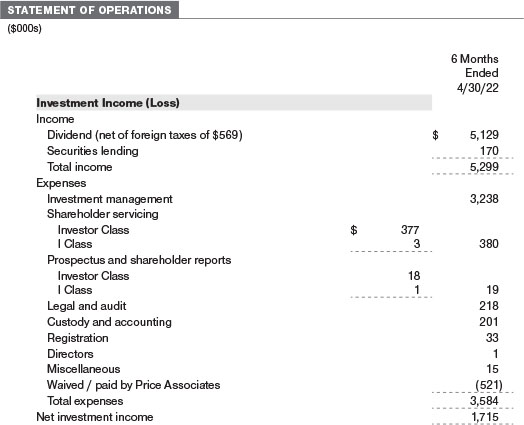
Class Accounting Shareholder servicing, prospectus, and shareholder report expenses incurred by each class are charged directly to the class to which they relate. Expenses common to all classes, investment income, and realized and unrealized gains and losses are allocated to the classes based upon the relative daily net assets of each class.
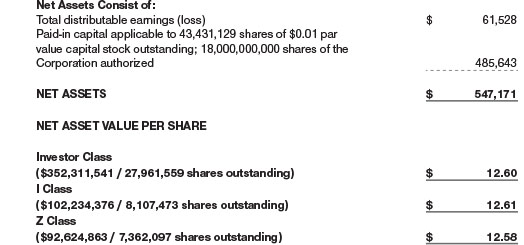
Capital Transactions Each investor’s interest in the net assets of the fund is represented by fund shares. The fund’s net asset value (NAV) per share is computed at the close of the New York Stock Exchange (NYSE), normally 4 p.m. ET, each day the NYSE is open for business. However, the NAV per share may be calculated at a time other than the normal close of the NYSE if trading on the NYSE is restricted, if the NYSE closes earlier, or as may be permitted by the SEC. Purchases and redemptions of fund shares are transacted at the next-computed NAV per share, after receipt of the transaction order by T. Rowe Price Associates, Inc., or its agents.
Indemnification In the normal course of business, the fund may provide indemnification in connection with its officers and directors, service providers, and/or private company investments. The fund’s maximum exposure under these arrangements is unknown; however, the risk of material loss is currently considered to be remote.
NOTE 2 - VALUATION
Fair Value The fund’s financial instruments are valued at the close of the NYSE and are reported at fair value, which GAAP defines as the price that would be received to sell an asset or paid to transfer a liability in an orderly transaction between market participants at the measurement date. The T. Rowe Price Valuation Committee (the Valuation Committee) is an internal committee that has been delegated certain responsibilities by the fund’s Board of Directors (the Board) to ensure that financial instruments are appropriately priced at fair value in accordance with GAAP and the 1940 Act. Subject to oversight by the Board, the Valuation Committee develops and oversees pricing-related policies and procedures and approves all fair value determinations. Specifically, the Valuation Committee establishes policies and procedures used in valuing financial instruments, including those which cannot be valued in accordance with normal procedures or using pricing vendors; determines pricing techniques, sources, and persons eligible to effect fair value pricing actions; evaluates the services and performance of the pricing vendors; oversees the pricing process to ensure policies and procedures are being followed; and provides guidance on internal controls and valuation-related matters. The Valuation Committee provides periodic reporting to the Board on valuation matters.
Various valuation techniques and inputs are used to determine the fair value of financial instruments. GAAP establishes the following fair value hierarchy that categorizes the inputs used to measure fair value:
Level 1 – quoted prices (unadjusted) in active markets for identical financial instruments that the fund can access at the reporting date
Level 2 – inputs other than Level 1 quoted prices that are observable, either directly or indirectly (including, but not limited to, quoted prices for similar financial instruments in active markets, quoted prices for identical or similar financial instruments in inactive markets, interest rates and yield curves, implied volatilities, and credit spreads)
Level 3 – unobservable inputs (including the fund’s own assumptions in determining fair value)
Observable inputs are developed using market data, such as publicly available information about actual events or transactions, and reflect the assumptions that market participants would use to price the financial instrument. Unobservable inputs are those for which market data are not available and are developed using the best information available about the assumptions that market participants would use to price the financial instrument. GAAP requires valuation techniques to maximize the use of relevant observable inputs and minimize the use of unobservable inputs. When multiple inputs are used to derive fair value, the financial instrument is assigned to the level within the fair value hierarchy based on the lowest-level input that is significant to the fair value of the financial instrument. Input levels are not necessarily an indication of the risk or liquidity associated with financial instruments at that level but rather the degree of judgment used in determining those values.
Valuation Techniques Equity securities, including exchange-traded funds, listed or regularly traded on a securities exchange or in the over-the-counter (OTC) market are valued at the last quoted sale price or, for certain markets, the official closing price at the time the valuations are made. OTC Bulletin Board securities are valued at the mean of the closing bid and asked prices. A security that is listed or traded on more than one exchange is valued at the quotation on the exchange determined to be the primary market for such security. Listed securities not traded on a particular day are valued at the mean of the closing bid and asked prices for domestic securities and the last quoted sale or closing price for international securities.
The last quoted prices of non-U.S. equity securities may be adjusted to reflect the fair value of such securities at the close of the NYSE, if the fund determines that developments between the close of a foreign market and the close of the NYSE will affect the value of some or all of its portfolio securities. Each business day, the fund uses information from outside pricing services to evaluate and, if appropriate, decide whether it is necessary to adjust quoted prices to reflect fair value by reviewing a variety of factors, including developments in foreign markets, the performance of U.S. securities markets, and the performance of instruments trading in U.S. markets that represent foreign securities and baskets of foreign securities. The fund uses outside pricing services to provide it with quoted prices and information to evaluate or adjust those prices. The fund cannot predict how often it will use quoted prices and how often it will determine it necessary to adjust those prices to reflect fair value.
Investments in mutual funds are valued at the mutual fund’s closing NAV per share on the day of valuation. Assets and liabilities other than financial instruments, including short-term receivables and payables, are carried at cost, or estimated realizable value, if less, which approximates fair value.
Investments for which market quotations or market-based valuations are not readily available or deemed unreliable are valued at fair value as determined in good faith by the Valuation Committee, in accordance with fair valuation policies and procedures. The objective of any fair value pricing determination is to arrive at a price that could reasonably be expected from a current sale. Financial instruments fair valued by the Valuation Committee are primarily private placements, restricted securities, warrants, rights, and other securities that are not publicly traded. Factors used in determining fair value vary by type of investment and may include market or investment specific considerations. The Valuation Committee typically will afford greatest weight to actual prices in arm’s length transactions, to the extent they represent orderly transactions between market participants, transaction information can be reliably obtained, and prices are deemed representative of fair value. However, the Valuation Committee may also consider other valuation methods such as market-based valuation multiples; a discount or premium from market value of a similar, freely traded security of the same issuer; discounted cash flows; yield to maturity; or some combination. Fair value determinations are reviewed on a regular basis and updated as information becomes available, including actual purchase and sale transactions of the investment. Because any fair value determination involves a significant amount of judgment, there is a degree of subjectivity inherent in such pricing decisions, and fair value prices determined by the Valuation Committee could differ from those of other market participants.
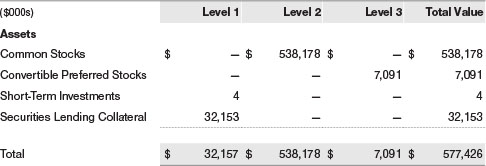
Valuation Inputs The following table summarizes the fund’s financial instruments, based on the inputs used to determine their fair values on April 30, 2022 (for further detail by category, please refer to the accompanying Portfolio of Investments):
Following is a reconciliation of the fund’s Level 3 holdings for the six months ended April 30, 2022. Gain (loss) reflects both realized and change in unrealized gain/loss on Level 3 holdings during the period, if any, and is included on the accompanying Statement of Operations. The change in unrealized gain/loss on Level 3 instruments held at April 30, 2022, totaled $(1,816,000) for the six months ended April 30, 2022.
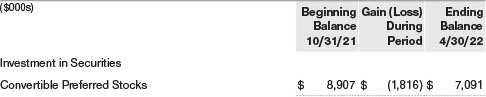
The fund’s Level 3 investments have been valued using unadjusted inputs that have not been internally developed by the fund, including third-party transactions and indicative broker quotations. As a result, there were no unobservable inputs that have been internally developed by the fund in determining the fair value of investments as of April 30, 2022.
NOTE 3 - OTHER INVESTMENT TRANSACTIONS
Consistent with its investment objective, the fund engages in the following practices to manage exposure to certain risks and/or to enhance performance. The investment objective, policies, program, and risk factors of the fund are described more fully in the fund’s prospectus and Statement of Additional Information.
Restricted Securities The fund invests in securities that are subject to legal or contractual restrictions on resale. Prompt sale of such securities at an acceptable price may be difficult and may involve substantial delays and additional costs.
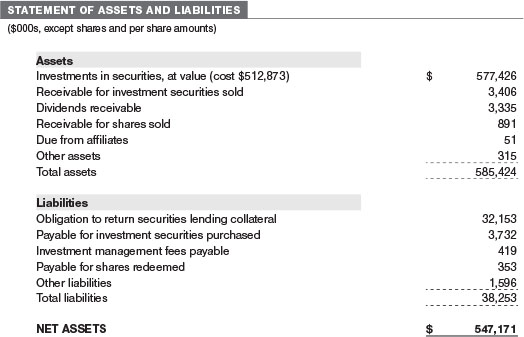
Securities Lending The fund may lend its securities to approved borrowers to earn additional income. Its securities lending activities are administered by a lending agent in accordance with a securities lending agreement. Security loans generally do not have stated maturity dates, and the fund may recall a security at any time. The fund receives collateral in the form of cash or U.S. government securities. Collateral is maintained over the life of the loan in an amount not less than the value of loaned securities; any additional collateral required due to changes in security values is delivered to the fund the next business day. Cash collateral is invested in accordance with investment guidelines approved by fund management. Additionally, the lending agent indemnifies the fund against losses resulting from borrower default. Although risk is mitigated by the collateral and indemnification, the fund could experience a delay in recovering its securities and a possible loss of income or value if the borrower fails to return the securities, collateral investments decline in value, and the lending agent fails to perform. Securities lending revenue consists of earnings on invested collateral and borrowing fees, net of any rebates to the borrower, compensation to the lending agent, and other administrative costs. In accordance with GAAP, investments made with cash collateral are reflected in the accompanying financial statements, but collateral received in the form of securities is not. At April 30, 2022, the value of loaned securities was $30,382,000; the value of cash collateral and related investments was $32,153,000.
Other Purchases and sales of portfolio securities other than short-term securities aggregated $79,263,000 and $249,839,000, respectively, for the six months ended April 30, 2022.
NOTE 4 - FEDERAL INCOME TAXES
No provision for federal income taxes is required since the fund intends to continue to qualify as a regulated investment company under Subchapter M of the Internal Revenue Code and distribute to shareholders all of its taxable income and gains. Distributions determined in accordance with federal income tax regulations may differ in amount or character from net investment income and realized gains for financial reporting purposes. Financial reporting records are adjusted for permanent book/tax differences to reflect tax character but are not adjusted for temporary differences. The amount and character of tax-basis distributions and composition of net assets are finalized at fiscal year-end; accordingly, tax-basis balances have not been determined as of the date of this report.
At April 30, 2022, the cost of investments for federal income tax purposes was $518,227,000. Net unrealized gain aggregated $58,990,000 at period-end, of which $125,831,000 related to appreciated investments and $66,841,000 related to depreciated investments.
NOTE 5 - FOREIGN TAXES
The fund is subject to foreign income taxes imposed by certain countries in which it invests. Additionally, capital gains realized upon disposition of securities issued in or by certain foreign countries are subject to capital gains tax imposed by those countries. All taxes are computed in accordance with the applicable foreign tax law, and, to the extent permitted, capital losses are used to offset capital gains. Taxes attributable to income are accrued by the fund as a reduction of income. Current and deferred tax expense attributable to capital gains is reflected as a component of realized or change in unrealized gain/loss on securities in the accompanying financial statements. To the extent that the fund has country specific capital loss carryforwards, such carryforwards are applied against net unrealized gains when determining the deferred tax liability. Any deferred tax liability incurred by the fund is included in either Other liabilities or Deferred tax liability on the accompanying Statement of Assets and Liabilities.
NOTE 6 - RELATED PARTY TRANSACTIONS
The fund is managed by T. Rowe Price Associates, Inc. (Price Associates), a wholly owned subsidiary of T. Rowe Price Group, Inc. (Price Group). Price Associates has entered into a sub-advisory agreement(s) with one or more of its wholly owned subsidiaries, to provide investment advisory services to the fund. The investment management agreement between the fund and Price Associates provides for an annual investment management fee, which is computed daily and paid monthly. The fee consists of an individual fund fee, equal to 0.50% of the fund’s average daily net assets, and a group fee. The group fee rate is calculated based on the combined net assets of certain mutual funds sponsored by Price Associates (the group) applied to a graduated fee schedule, with rates ranging from 0.48% for the first $1 billion of assets to 0.260% for assets in excess of $845 billion. The fund’s group fee is determined by applying the group fee rate to the fund’s average daily net assets. The fee is computed daily and paid monthly. At April 30, 2022, the effective annual group fee rate was 0.28%.
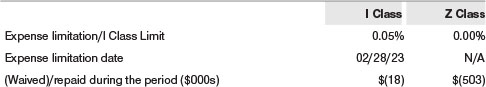
The I Class is subject to an operating expense limitation (I Class Limit) pursuant to which Price Associates is contractually required to pay all operating expenses of the I Class, excluding management fees; interest; expenses related to borrowings, taxes, and brokerage; and other non-recurring expenses permitted by the investment management agreement, to the extent such operating expenses, on an annualized basis, exceed the I Class Limit. This agreement will continue through the expense limitation date indicated in the table below, and may be renewed, revised, or revoked only with approval of the fund’s Board. The I Class is required to repay Price Associates for expenses previously paid to the extent the class’s net assets grow or expenses decline sufficiently to allow repayment without causing the class’s operating expenses (after the repayment is taken into account) to exceed the lesser of: (1) the I Class Limit in place at the time such amounts were paid; or (2) the current I Class Limit. However, no repayment will be made more than three years after the date of a payment or waiver.
The Z Class is also subject to a contractual expense limitation agreement whereby Price Associates has agreed to waive and/or bear all of the Z Class’ expenses (excluding interest; expenses related to borrowings, taxes, and brokerage; and nonrecurring expenses) in their entirety. This fee waiver and/or expense reimbursement arrangement is expected to remain in place indefinitely, and the agreement may only be amended or terminated with approval by the fund’s Board. Expenses of the fund waived/paid by the manager are not subject to later repayment by the fund.
Pursuant to this agreement, expenses were waived/paid by and/or repaid to Price Associates during the six months ended April 30, 2022 as indicated in the table below and remain subject to repayment by the fund. Any repayment of expenses previously waived/paid by Price Associates during the period would be included in the net investment income and expense ratios presented on the accompanying Financial Highlights.
In addition, the fund has entered into service agreements with Price Associates and two wholly owned subsidiaries of Price Associates, each an affiliate of the fund (collectively, Price). Price Associates provides certain accounting and administrative services to the fund. T. Rowe Price Services, Inc. provides shareholder and administrative services in its capacity as the fund’s transfer and dividend-disbursing agent. T. Rowe Price Retirement Plan Services, Inc. provides subaccounting and recordkeeping services for certain retirement accounts invested in the Investor Class. For the six months ended April 30, 2022, expenses incurred pursuant to these service agreements were $53,000 for Price Associates; $158,000 for T. Rowe Price Services, Inc.; and $5,000 for T. Rowe Price Retirement Plan Services, Inc. All amounts due to and due from Price, exclusive of investment management fees payable, are presented net on the accompanying Statement of Assets and Liabilities.
Mutual funds, trusts, and other accounts managed by Price Associates or its affiliates (collectively, Price Funds and accounts) may invest in the fund. No Price fund or account may invest for the purpose of exercising management or control over the fund. At April 30, 2022, approximately 100% of the Z Class’s outstanding shares were held by Price Funds and accounts.
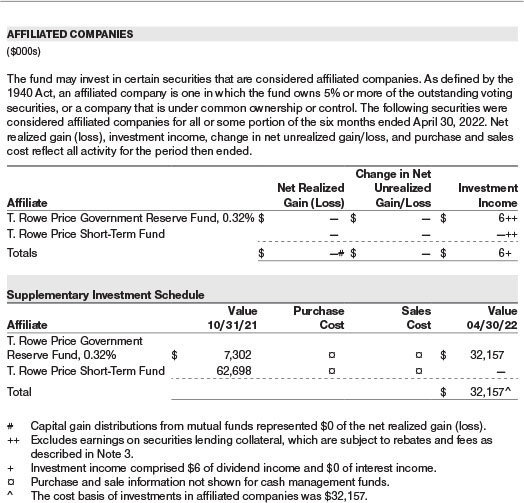
The fund may invest its cash reserves in certain open-end management investment companies managed by Price Associates and considered affiliates of the fund: the T. Rowe Price Government Reserve Fund or the T. Rowe Price Treasury Reserve Fund, organized as money market funds, or the T. Rowe Price Short-Term Fund, a short-term bond fund (collectively, the Price Reserve Funds). The Price Reserve Funds are offered as short-term investment options to mutual funds, trusts, and other accounts managed by Price Associates or its affiliates and are not available for direct purchase by members of the public. Cash collateral from securities lending, if any, is invested in the T. Rowe Price Government Reserve Fund; prior to December 13, 2021, the cash collateral from securities lending was invested in the T. Rowe Price Short-Term Fund. The Price Reserve Funds pay no investment management fees.
The fund may participate in securities purchase and sale transactions with other funds or accounts advised by Price Associates (cross trades), in accordance with procedures adopted by the fund’s Board and Securities and Exchange Commission rules, which require, among other things, that such purchase and sale cross trades be effected at the independent current market price of the security. During the six months ended April 30, 2022, the fund had no purchases or sales cross trades with other funds or accounts advised by Price Associates.
NOTE 7 - BORROWING
To provide temporary liquidity, the fund may borrow from other T. Rowe Price-sponsored mutual funds under an interfund borrowing program developed and managed by Price Associates. The program permits the borrowing and lending of cash at rates beneficial to both the borrowing and lending funds. Pursuant to program guidelines, loans totaling 10% or more of a borrowing fund’s total assets require collateralization at 102% of the value of the loan; loans of less than 10% are unsecured. During the six months ended April 30, 2022, the fund incurred $8,000 in interest expense related to outstanding borrowings on nine days in the average amount of $18,367,000 and at an average annual rate of 1.67%. At April 30, 2022, there were no borrowings outstanding.
NOTE 8 - OTHER MATTERS
Unpredictable events such as environmental or natural disasters, war, terrorism, pandemics, outbreaks of infectious diseases, and similar public health threats may significantly affect the economy and the markets and issuers in which a fund invests. Certain events may cause instability across global markets, including reduced liquidity and disruptions in trading markets, while some events may affect certain geographic regions, countries, sectors, and industries more significantly than others, and exacerbate other pre-existing political, social, and economic risks. Since 2020, a novel strain of coronavirus (COVID-19) has resulted in disruptions to global business activity and caused significant volatility and declines in global financial markets. In February 2022, Russian forces entered Ukraine and commenced an armed conflict. Economic sanctions have since been imposed on Russia and certain of its citizens, including the exclusion of Russia from the SWIFT global payments network. As a result, Russian-related stocks and debt have since suffered significant declines in value. The duration of the coronavirus outbreak and the Russian-Ukraine conflict, and their effects on the financial markets, cannot be determined with certainty. The fund’s performance could be negatively impacted if the value of a portfolio holding were harmed by these and such other events. Management is actively monitoring these events.
INFORMATION ON PROXY VOTING POLICIES, PROCEDURES, AND RECORDS
A description of the policies and procedures used by T. Rowe Price funds to determine how to vote proxies relating to portfolio securities is available in each fund’s Statement of Additional Information. You may request this document by calling 1-800-225-5132 or by accessing the SEC’s website, sec.gov.
The description of our proxy voting policies and procedures is also available on our corporate website. To access it, please visit the following Web page:
https://www.troweprice.com/corporate/en/utility/policies.html
Scroll down to the section near the bottom of the page that says, “Proxy Voting Policies.” Click on the Proxy Voting Policies link in the shaded box.
Each fund’s most recent annual proxy voting record is available on our website and through the SEC’s website. To access it through T. Rowe Price, visit the website location shown above, and scroll down to the section near the bottom of the page that says, “Proxy Voting Records.” Click on the Proxy Voting Records link in the shaded box.
HOW TO OBTAIN QUARTERLY PORTFOLIO HOLDINGS
The fund files a complete schedule of portfolio holdings with the Securities and Exchange Commission (SEC) for the first and third quarters of each fiscal year as an exhibit to its reports on Form N-PORT. The fund’s reports on Form N-PORT are available electronically on the SEC’s website (sec.gov). In addition, most T. Rowe Price funds disclose their first and third fiscal quarter-end holdings on troweprice.com.
APPROVAL OF INVESTMENT MANAGEMENT AGREEMENT AND SUBADVISORY AGREEMENT
Each year, the fund’s Board of Directors (Board) considers the continuation of the investment management agreement (Advisory Contract) between the fund and its investment adviser, T. Rowe Price Associates, Inc. (Adviser), as well as the investment subadvisory agreement (Subadvisory Contract) that the Adviser has entered into with T. Rowe Price Japan, Inc. (Subadviser), on behalf of the fund. In that regard, at a meeting held on March 7–8, 2022 (Meeting), the Board, including all of the fund’s independent directors, approved the fund’s Advisory Contract and Subadvisory Contract. At the Meeting, the Board considered the factors and reached the conclusions described below relating to the selection of the Adviser and Subadviser and the approval of the Advisory Contract and Subadvisory Contract. The independent directors were assisted in their evaluation of the Advisory Contract and Subadvisory Contract by independent legal counsel from whom they received separate legal advice and with whom they met separately.
In providing information to the Board, the Adviser was guided by a detailed set of requests for information submitted by independent legal counsel on behalf of the independent directors. In considering and approving the Advisory Contract and Subadvisory Contract, the Board considered the information it believed was relevant, including, but not limited to, the information discussed below. The Board considered not only the specific information presented in connection with the Meeting but also the knowledge gained over time through interaction with the Adviser and Subadviser about various topics. The Board meets regularly and, at each of its meetings, covers an extensive agenda of topics and materials and considers factors that are relevant to its annual consideration of the renewal of the T. Rowe Price funds’ advisory contracts, including performance and the services and support provided to the funds and their shareholders.
Services Provided by the Adviser and Subadviser
The Board considered the nature, quality, and extent of the services provided to the fund by the Adviser and Subadviser. These services included, but were not limited to, directing the fund’s investments in accordance with its investment program and the overall management of the fund’s portfolio, as well as a variety of related activities such as financial, investment operations, and administrative services; compliance; maintaining the fund’s records and registrations; and shareholder communications. The Board also reviewed the background and experience of the Adviser’s and Subadviser’s senior management teams and investment personnel involved in the management of the fund, as well as the Adviser’s compliance record. The Board concluded that it was satisfied with the nature, quality, and extent of the services provided by the Adviser and Subadviser.
Investment Performance of the Fund
The Board took into account discussions with the Adviser and reports that it receives throughout the year relating to fund performance. In connection with the Meeting, the Board reviewed the fund’s total returns for various periods through December 31, 2021, and compared these returns with the performance of a peer group of funds with similar investment programs and a wide variety of other previously agreed-upon comparable performance measures and market data, including relative performance information as of September 30, 2021, supplied by Broadridge, which is an independent provider of mutual fund data.
On the basis of this evaluation and the Board’s ongoing review of investment results, and factoring in the relative market conditions during certain of the performance periods, the Board concluded that the fund’s performance was satisfactory.
Costs, Benefits, Profits, and Economies of Scale
The Board reviewed detailed information regarding the revenues received by the Adviser under the Advisory Contract and other direct and indirect benefits that the Adviser (and its affiliates) may have realized from its relationship with the fund. In considering soft-dollar arrangements pursuant to which research may be received from broker-dealers that execute the fund’s portfolio transactions, the Board noted that the Adviser bears the cost of research services for all client accounts that it advises, including the T. Rowe Price funds. The Board received information on the estimated costs incurred and profits realized by the Adviser from managing the T. Rowe Price funds. The Board also reviewed estimates of the profits realized from managing the fund in particular, and the Board concluded that the Adviser’s profits were reasonable in light of the services provided to the fund.
The Board also considered whether the fund benefits under the fee levels set forth in the Advisory Contract or otherwise from any economies of scale realized by the Adviser. Under the Advisory Contract, the fund pays a fee to the Adviser for investment management services composed of two components—a group fee rate based on the combined average net assets of most of the T. Rowe Price funds (including the fund) that declines at certain asset levels and an individual fund fee rate based on the fund’s average daily net assets—and the fund pays its own expenses of operations. Under the Subadvisory Contract, the Adviser may pay the Subadviser up to 60% of the advisory fees that the Adviser receives from the fund. The Board concluded that the advisory fee structure for the fund continued to provide for a reasonable sharing of benefits from any economies of scale with the fund’s investors.
Fees and Expenses
The Board was provided with information regarding industry trends in management fees and expenses. Among other things, the Board reviewed data for peer groups that were compiled by Broadridge, which compared: (i) contractual management fees, actual management fees, nonmanagement expenses, and total expenses of the Investor Class of the fund with a group of competitor funds selected by Broadridge (Expense Group) and (ii) actual management fees, nonmanagement expenses, and total expenses of the Investor Class of the fund with a broader set of funds within the Lipper investment classification (Expense Universe). The Board considered the fund’s contractual management fee rate, actual management fee rate (which reflects the management fees actually received from the fund by the Adviser after any applicable waivers, reductions, or reimbursements), operating expenses, and total expenses (which reflect the net total expense ratio of the fund after any waivers, reductions, or reimbursements) in comparison with the information for the Broadridge peer groups. Broadridge generally constructed the peer groups by seeking the most comparable funds based on similar investment classifications and objectives, expense structure, asset size, and operating components and attributes and ranked funds into quintiles, with the first quintile representing the funds with the lowest relative expenses and the fifth quintile representing the funds with the highest relative expenses. The information provided to the Board indicated that the fund’s contractual management fee ranked in the second quintile (Expense Group), the fund’s actual management fee rate ranked in the first quintile (Expense Group and Expense Universe), and the fund’s total expenses ranked in the first quintile (Expense Group and Expense Universe).
The Board also reviewed the fee schedules for other investment portfolios with similar mandates that are advised or subadvised by the Adviser and its affiliates, including separately managed accounts for institutional and individual investors; subadvised funds; and other sponsored investment portfolios, including collective investment trusts and pooled vehicles organized and offered to investors outside the United States. Management provided the Board with information about the Adviser’s responsibilities and services provided to subadvisory and other institutional account clients, including information about how the requirements and economics of the institutional business are fundamentally different from those of the proprietary mutual fund business. The Board considered information showing that the Adviser’s mutual fund business is generally more complex from a business and compliance perspective than its institutional account business and considered various relevant factors, such as the broader scope of operations and oversight, more extensive shareholder communication infrastructure, greater asset flows, heightened business risks, and differences in applicable laws and regulations associated with the Adviser’s proprietary mutual fund business. In assessing the reasonableness of the fund’s management fee rate, the Board considered the differences in the nature of the services required for the Adviser to manage its mutual fund business versus managing a discrete pool of assets as a subadviser to another institution’s mutual fund or for an institutional account and that the Adviser generally performs significant additional services and assumes greater risk in managing the fund and other T. Rowe Price funds than it does for institutional account clients, including subadvised funds.
On the basis of the information provided and the factors considered, the Board concluded that the fees paid by the fund under the Advisory Contract are reasonable.
Approval of the Advisory Contract and Subadvisory Contract
As noted, the Board approved the continuation of the Advisory Contract and Subadvisory Contract. No single factor was considered in isolation or to be determinative to the decision. Rather, the Board concluded, in light of a weighting and balancing of all factors considered, that it was in the best interests of the fund and its shareholders for the Board to approve the continuation of the Advisory Contract and Subadvisory Contract (including the fees to be charged for services thereunder).
Item 1. (b) Notice pursuant to Rule 30e-3.
Not applicable.
Item 2. Code of Ethics.
A code of ethics, as defined in Item 2 of Form N-CSR, applicable to its principal executive officer, principal financial officer, principal accounting officer or controller, or persons performing similar functions is filed as an exhibit to the registrant’s annual Form N-CSR. No substantive amendments were approved or waivers were granted to this code of ethics during the registrant’s most recent fiscal half-year.
Item 3. Audit Committee Financial Expert.
Disclosure required in registrant’s annual Form N-CSR.
Item 4. Principal Accountant Fees and Services.
Disclosure required in registrant’s annual Form N-CSR.
Item 5. Audit Committee of Listed Registrants.
Not applicable.
Item 6. Investments.
(a) Not applicable. The complete schedule of investments is included in Item 1 of this Form N-CSR.
(b) Not applicable.
Item 7. Disclosure of Proxy Voting Policies and Procedures for Closed-End Management Investment Companies.
Not applicable.
Item 8. Portfolio Managers of Closed-End Management Investment Companies.
Not applicable.
Item 9. Purchases of Equity Securities by Closed-End Management Investment Company and Affiliated Purchasers.
Not applicable.
Item 10. Submission of Matters to a Vote of Security Holders.
There has been no change to the procedures by which shareholders may recommend nominees to the registrant’s board of directors.
Item 11. Controls and Procedures.
(a) The registrant’s principal executive officer and principal financial officer have evaluated the registrant’s disclosure controls and procedures within 90 days of this filing and have concluded that the registrant’s disclosure controls and procedures were effective, as of that date, in ensuring that information required to be disclosed by the registrant in this Form N-CSR was recorded, processed, summarized, and reported timely.
(b) The registrant’s principal executive officer and principal financial officer are aware of no change in the registrant’s internal control over financial reporting that occurred during the period covered by this report that has materially affected, or is reasonably likely to materially affect, the registrant’s internal control over financial reporting.
Item 12. Disclosure of Securities Lending Activities for Closed-End Management Investment Companies.
Not applicable.
Item 13. Exhibits.
(a)(1) The registrant’s code of ethics pursuant to Item 2 of Form N-CSR is filed with the registrant’s annual Form N-CSR.
(2) Separate certifications by the registrant’s principal executive officer and principal financial officer, pursuant to Section 302 of the Sarbanes-Oxley Act of 2002 and required by Rule 30a-2(a) under the Investment Company Act of 1940, are attached.
(3) Written solicitation to repurchase securities issued by closed-end companies: not applicable.
(b) A certification by the registrant’s principal executive officer and principal financial officer, pursuant to Section 906 of the Sarbanes-Oxley Act of 2002 and required by Rule 30a-2(b) under the Investment Company Act of 1940, is attached.
SIGNATURES
Pursuant to the requirements of the Securities Exchange Act of 1934 and the Investment Company Act of 1940, the registrant has duly caused this report to be signed on its behalf by the undersigned, thereunto duly authorized.
T. Rowe Price International Funds, Inc.
| | By | /s/ David Oestreicher |
| | | David Oestreicher |
| | | Principal Executive Officer |
| | | |
| Date | | June 16, 2022 | | |
Pursuant to the requirements of the Securities Exchange Act of 1934 and the Investment Company Act of 1940, this report has been signed below by the following persons on behalf of the registrant and in the capacities and on the dates indicated.
| | By | /s/ David Oestreicher |
| | | David Oestreicher |
| | | Principal Executive Officer |
| | | |
| Date | | June 16, 2022 | | |
| | | | | |
| | | |
| | By | /s/ Alan S. Dupski |
| | | Alan S. Dupski |
| | | Principal Financial Officer |
| | | |
| Date | | June 16, 2022 | | |