UNITED STATES
SECURITIES AND EXCHANGE COMMISSION
Washington, D.C. 20549
FORM N-CSR
CERTIFIED SHAREHOLDER REPORT OF REGISTERED
MANAGEMENT INVESTMENT COMPANIES
Investment Company Act File Number: 811-02958
| T. Rowe Price International Funds, Inc. |
|
| (Exact name of registrant as specified in charter) |
| |
| 100 East Pratt Street, Baltimore, MD 21202 |
|
| (Address of principal executive offices) |
| |
| David Oestreicher |
| 100 East Pratt Street, Baltimore, MD 21202 |
|
| (Name and address of agent for service) |
Registrant’s telephone number, including area code: (410) 345-2000
Date of fiscal year end: December 31
Date of reporting period: June 30, 2022
Item 1. Reports to Shareholders
(a) Report pursuant to Rule 30e-1.
| Global Consumer Fund | June 30, 2022 |
| T. ROWE PRICE Global Consumer Fund |
|
HIGHLIGHTS
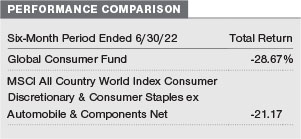
| ■ | The Global Consumer Fund underperformed its benchmark, the MSCI All Country World Index Consumer Discretionary & Consumer Staples ex Automobile & Components Net, for the six months ended June 30, 2022. |
| | |
| ■ | Fund performance was hindered by ongoing supply and demand imbalances, lockdowns in China that impacted several names, the Russia-Ukraine conflict that led to much higher commodity costs, and a more challenged economic environment. |
| | |
| ■ | We have kept the portfolio tilted toward more durable assets, and the consumer discretionary sleeve is more defensively positioned given the composition of the names we hold. |
| | |
| ■ | Going into the second half of 2022, we expect the lack of incremental stimulus to lead to moderating demand within the consumer space, with various cost pressures continuing to weigh on profitability. In a moderating demand environment, we believe that individual stock selection matters more than ever. |

Log in to your account at troweprice.com for more information.
*Certain mutual fund accounts that are assessed an annual account service fee can also save money by switching to e-delivery.
Market Commentary
Dear Shareholder
Major stock and bond indexes produced sharply negative results during the first half of 2022 as investors contended with persistently high inflation, tightening financial conditions, and slowing growth.
After reaching an all-time high on January 3, the S&P 500 Index finished the period down about 20%, the worst first half of a calendar year for the index since 1970. Double-digit losses were common in equity markets around the globe, and bond investors also faced a historically tough environment amid a sharp rise in interest rates.
Value shares outperformed growth stocks as equity investors turned risk averse and rising rates put downward pressure on growth stock valuations. Emerging markets stocks held up somewhat better than shares in developed markets due to the strong performance of some oil-exporting countries. Meanwhile, the U.S. dollar strengthened during the period, which weighed on returns for U.S. investors in international securities.
Within the S&P 500, energy was the only bright spot, gaining more than 30% as oil prices jumped in response to Russia’s invasion of Ukraine and the ensuing commodity supply crunch. Typically defensive shares, such as utilities, consumer staples, and health care, finished in negative territory but held up relatively well. The consumer discretionary, communication services, and information technology sectors were the weakest performers. Shares of some major retailers fell sharply following earnings misses driven in part by overstocked inventories.
Inflation remained the leading concern for investors throughout the period. Despite hopes in 2021 that the problem was transitory, and later expectations that inflation would peak in the spring, headline consumer prices continued to grind higher throughout the first half of 2022. The war in Ukraine exacerbated already existing supply chain problems, and other factors, such as the impact of the fiscal and monetary stimulus enacted during the pandemic and strong consumer demand, also pushed prices higher. The May consumer price index report (the last to be issued during our reporting period) showed prices increasing 8.6% over the 12-month period, the largest jump since late 1981.
In response, the Federal Reserve, which at the end of 2021 had forecast that only three 25-basis-point (0.25 percentage point) rate hikes would be necessary in all of 2022, rapidly shifted in a hawkish direction and executed three rate increases in the first six months of the year. The policy moves included hikes of 25, 50, and 75 basis points—the largest single increase since 1994—increasing the central bank’s short-term lending benchmark from near zero to a target range of 1.50% to 1.75% by the end of June. In addition, the Fed ended the purchases of Treasuries and agency mortgage-backed securities that it had begun to support the economy early in the pandemic and started reducing its balance sheet in June.
Longer-term bond yields also increased considerably as the Fed tightened monetary policy, with the yield on the benchmark 10-year U.S. Treasury note reaching 3.49% on June 14, its highest level in more than a decade. (Bond prices and yields move in opposite directions.) Higher mortgage rates led to signs of cooling in the housing market.
The economy continued to add jobs during the period, and other indicators pointed to a slowing but still expanding economy. However, the University of Michigan consumer sentiment index dropped in June to its lowest level since records began in 1978 as higher inflation expectations undermined confidence.
Looking ahead, investors are likely to remain focused on whether the Fed can tame inflation without sending the economy into recession, a backdrop that could produce continued volatility. We believe this environment makes skilled active management a critical tool for identifying risks and opportunities, and our investment teams will continue to use fundamental research to identify companies that can add value to your portfolio over the long term.
Thank you for your continued confidence in T. Rowe Price.
Sincerely,

Robert Sharps
CEO and President
Management’s Discussion of Fund Performance
INVESTMENT OBJECTIVE
The fund seeks to provide long-term growth of capital.
FUND COMMENTARY
How did the fund perform in the past six months?
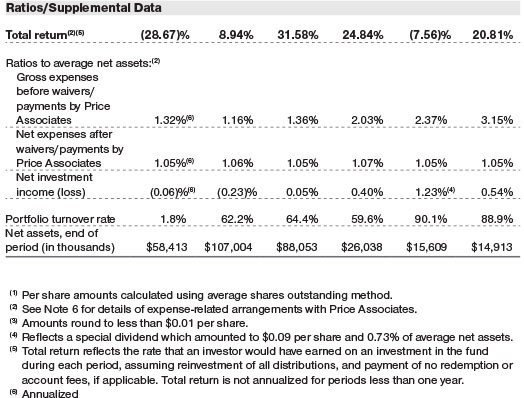
The Global Consumer Fund returned -28.67% for the six-month period ended June 30, 2022, underperforming its benchmark, the MSCI All Country World Index Consumer Discretionary & Consumer Staples ex Automobile & Components Net. (Past performance cannot guarantee future results.)
What factors influenced the fund’s performance?
The fund underperformed its benchmark over the six-month period, with relative performance primarily weighed down by names in the automobiles industry. However, companies within the multiline retail group added value.
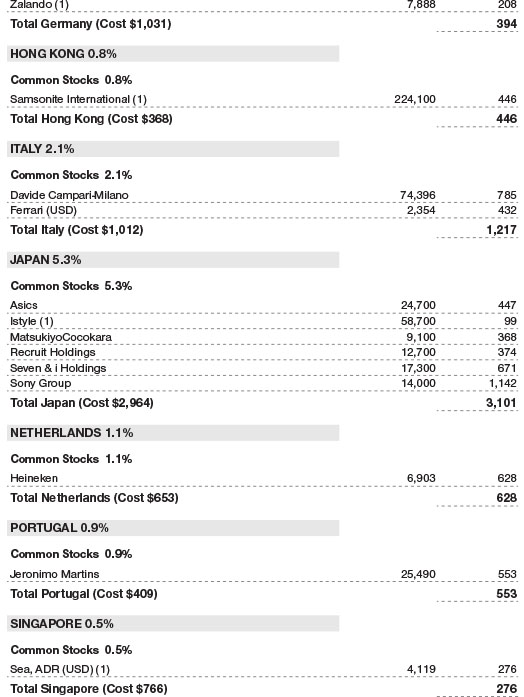
Within the portfolio, absolute contributors were largely consumer staples and consumer staples-adjacent companies that tended to be more defensive. Coca-Cola continued to benefit from a rebound in on-premise consumption following lockdown periods earlier in the pandemic, when the company was hurt by closed restaurants and an increase in takeout food orders. The company also saw growth in gross profit margin despite higher input costs, labor, and transportation, which speaks to Coca-Cola’s ability to pass through price increases to the consumer without a decrease in demand. Coca-Cola also maintained sales and earnings guidance despite the suspension of operations in Russia and Ukraine and lost sales from the lockdowns in China. (Please refer to the fund’s portfolio of investments for a complete list of holdings and the amount each represents in the portfolio.)
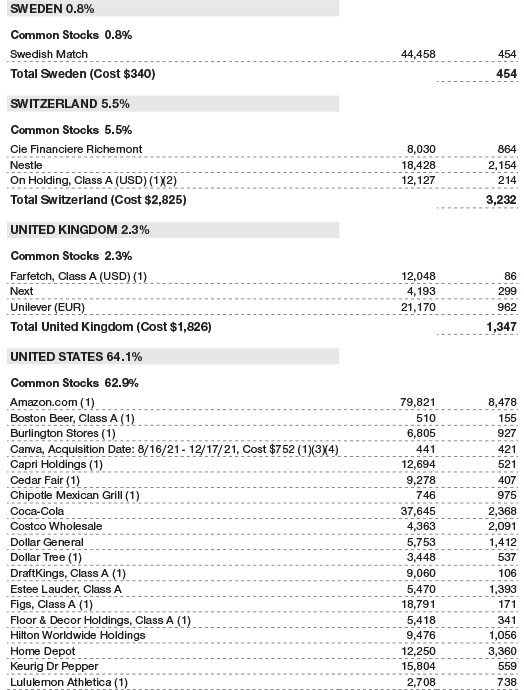
Our holding in Swedish Match, a multinational tobacco company, also added value to the portfolio. The company’s stock jumped following an acquisition offer from Philip Morris International to purchase the company for nearly $16 billion. The deal would allow Philip Morris International to leverage Zyn—Swedish Match’s tobacco-free nicotine pouches, which are gaining steam rapidly in Scandinavia and the U.S.—and further establish its position in the cigarette alternative market.
Elsewhere in the portfolio, discount retailers Dollar Tree and Dollar General benefited as consumers sought to stretch their dollars amid the inflationary environment. Dollar Tree posted earnings above consensus, and this upside was largely driven by the store’s 25% price increase. This uptick in prices led to an increase in basket size but a decline in traffic. Management is also making efforts to replace standard Dollar Tree items with “greater value” products, which should improve the likelihood of the price increase’s sustainability. Dollar General also reported earnings and revenue that beat estimates and same-store sales that exceeded expectations amid the worsening economic backdrop.
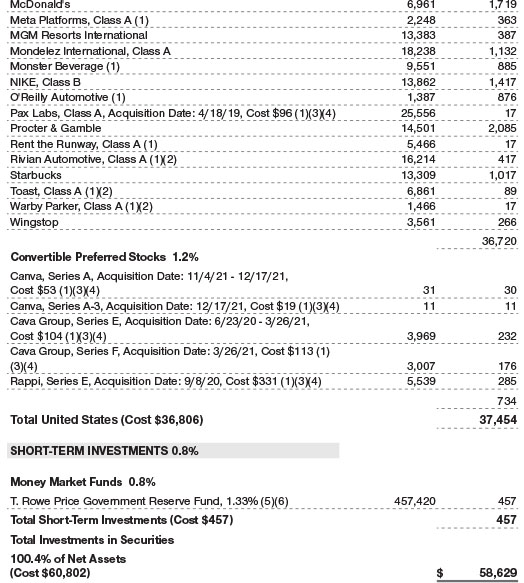
Notable absolute detractors from performance came from several industries and were largely consumer discretionary COVID-19 beneficiaries from 2020 and 2021 where demand is normalizing as we move into a post-pandemic environment. Amazon.com gave up a significant amount of its pandemic gains over the period as the broader market sold off. Tech stocks were hit particularly hard as the expectation for stunted cash flows grew amid rising interest rates, leading investors to rotate out of growth stocks into more defensive positioning. Amazon also reported its slowest growth period versus pandemic highs, and forward guidance fell short of consensus expectations. Leading home improvement retailer Home Depot continued to deliver above-expectation results despite consumer spending shifting away from discretionary toward staples. However, falling home sales and rising mortgage rates negatively impacted investor sentiment and the stock. In automotives, Rivian Automotive had a rough first half of 2022. Shares fell in March when the company missed earnings expectations. Amid broad-based industry struggles with supply chain issues, the stock dipped when Chief Executive Officer RJ Scaringe warned that limited battery supply would present challenges to expanding electric vehicle production. Later in the quarter, the stock price fell further on reports that Ford intended to sell 8 million shares of Rivian Automotive.
How is the fund positioned?
Our goal is to identify structural share gainers positioned to earn improving returns in consumer industries globally.
During the first half of the year, we targeted select tactical trades to create a more concentrated fund with high-conviction names and more meaningful bets that would position the portfolio for a sustained global recovery.
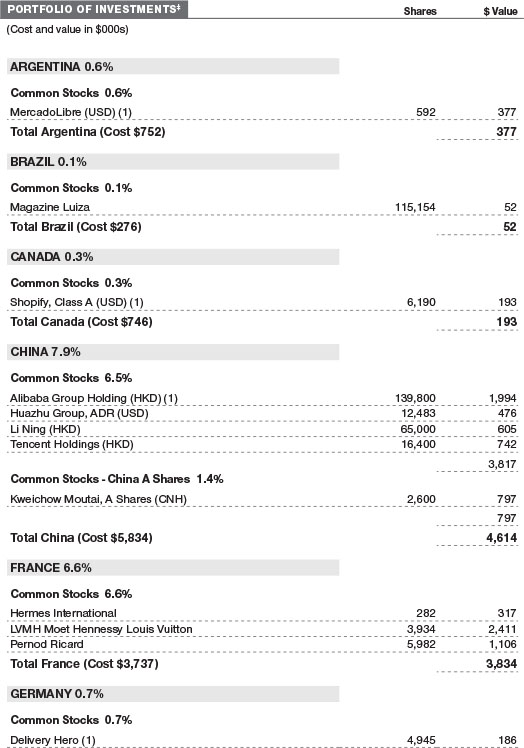
Notable purchases during the period were from a variety of subsectors. We initiated a position in Hermes International after the stock pulled back earlier in the year. Hermes International is one of the best luxury brands globally and has been on our watchlist, but its previous outperformance made valuation expensive. However, the company underperformed LVMH Moet Hennessy Louis Vuitton for several months, making valuation more compelling and serving as the catalyst for a reallocation of basis points from LVMH Moet Hennessy Louis Vuitton into Hermes International. We also purchased shares of Warby Parker, which is disrupting the eyewear industry within the health care sector, although its business model is closely aligned to retail. Additionally, in an effort to adjust the risk profile of the portfolio, we swapped some of our higher-beta names into more defensive stocks. We bought shares of household products company Procter & Gamble, reducing our underweight, and food and drink conglomerate Nestle.
Our sales during the period also extended across many areas of the market and were executed with risk management in mind as the market rotated away from high-growth names. We eliminated U.S. internet retail names Wayfair and The RealReal, both of which were COVID-19 beneficiaries that were giving back market share gains at a rapid clip and had elevated risk to their earnings. We also exited our position in ASOS, a European online and brick-and-mortar retailer. Similarly, amid current inflationary pressures, ASOS divested gains from the height of the pandemic.
What is portfolio management’s outlook?
After going through a period of extraordinarily strong demand in 2021, driven by unprecedented levels of fiscal and monetary stimulus, the speed and magnitude of growth and earnings normalization post-pandemic of COVID-19 beneficiaries was more rapid than expected. As consumer spending shifted away from discretionary ideas and toward staples like rent, food, and energy amid inflation and rising interest rates, consumer discretionary stocks dropped significantly, while consumer staples remained relatively flat.
As we move further into the year, our broader concern is the health of the consumer, as high oil, gas, and heating prices directly impact the consumer’s discretionary spending power, particularly in Europe due to its proximity to and dependence on Russian energy. Further, while we are uncertain about the depth of a potential recession, the market has already priced in some of the recession risk, and we are searching for signs that we have reached the bottom of the cycle so we can take advantage of future economic growth. As always, we will continue to focus on high-quality businesses that are on the right side of change, have a durable competitive moat, and can compound value over time.
The views expressed reflect the opinions of T. Rowe Price as of the date of this report and are subject to change based on changes in market, economic, or other conditions. These views are not intended to be a forecast of future events and are no guarantee of future results.
RISKS OF INVESTING IN THE FUND
Market conditions
The value of investments held by the fund may decline, sometimes rapidly or unpredictably, due to factors affecting certain issuers, particular industries or sectors, or the overall markets. Rapid or unexpected changes in market conditions could cause the fund to liquidate its holdings at inopportune times or at a loss or depressed value. The value of a particular holding may decrease due to developments related to that issuer, but also due to general market conditions, including real or perceived economic developments such as changes in interest rates, credit quality, inflation, or currency rates, or generally adverse investor sentiment. The value of a holding may also decline due to factors that negatively affect a particular industry or sector, such as labor shortages, increased production costs, or competitive conditions. In addition, local, regional, or global events such as war, acts of terrorism, political and social unrest, regulatory changes, recessions, shifts in monetary or trade policies, natural or environmental disasters, and the spread of infectious diseases or other public health issues could have a significant negative impact on securities markets and the fund’s investments. Unpredictable events such as natural disasters, pandemics, and widespread health crises may lead to unexpected suspensions or closures of securities exchanges, travel restrictions or quarantines, and an extended adverse impact on global market conditions.
Consumer-related companies
Securities of companies in the same industry may decline in price at the same time due to industry-specific developments since these companies may share common characteristics and are more likely to react similarly to industry-specific market or economic developments. Since the fund focuses its investments on consumer companies, it is less diversified than stock funds investing in a broader range of industries and, therefore, could experience significant volatility.
The potential for wide variation in performance reflects the special risks associated with companies in the continually evolving consumer discretionary and staples sectors. Consumer companies can be significantly affected by business cycles and general economic trends; capital spending levels; demographic and product trends; marketing campaigns; competitive pricing; labor relations; fluctuating component and commodity prices; legislation, government regulation, and import controls; interest rates; and environmental factors relating to manufacturing, including liability arising from environmental damage. Earnings disappointments and intense worldwide competition for market share can result in sharp price declines.
When the economy is growing, the consumer discretionary sector may outperform the consumer staples sector, but the opposite may be true during periods of worsening economic conditions. The consumer discretionary sector tends to be more cyclical and is highly dependent on overall consumer confidence and spending habits. Consumer discretionary stocks can be particularly affected by several factors, including changing consumer preferences, demographics, marketing, levels of disposable household income and spending, and the risk that discretionary products may rapidly become obsolete or fall out of favor with consumers. The consumer staples sector as a whole tends to be less susceptible to recessions and periods of slow growth but is subject to the risk that products or services that were once in demand may no longer be considered essential by consumers. Consumer staples stocks can be particularly affected by, among other things, social trends (such as food or diet fads), the depletion of resources and the prices of raw materials, intense competition, and government regulations that adversely impact production methods or profitability.
For a more thorough discussion of risks, please see the fund’s prospectus.
BENCHMARK INFORMATION
Source: MSCI. MSCI and its affiliates and third party sources and providers (collectively, “MSCI”) makes no express or implied warranties or representations and shall have no liability whatsoever with respect to any MSCI data contained herein. The MSCI data may not be further redistributed or used as a basis for other indices or any securities or financial products. This report is not approved, reviewed, or produced by MSCI. Historical MSCI data and analysis should not be taken as an indication or guarantee of any future performance analysis, forecast or prediction. None of the MSCI data is intended to constitute investment advice or a recommendation to make (or refrain from making) any kind of investment decision and may not be relied on as such.
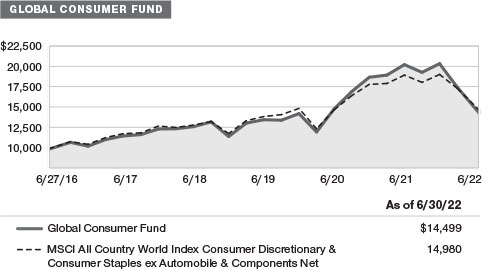
GROWTH OF $10,000
This chart shows the value of a hypothetical $10,000 investment in the fund over the past 10 fiscal year periods or since inception (for funds lacking 10-year records). The result is compared with benchmarks, which include a broad-based market index and may also include a peer group average or index. Market indexes do not include expenses, which are deducted from fund returns as well as mutual fund averages and indexes.
AVERAGE ANNUAL COMPOUND TOTAL RETURN

EXPENSE RATIO
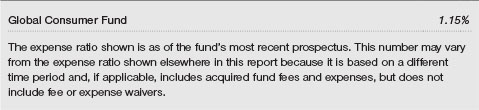
FUND EXPENSE EXAMPLE
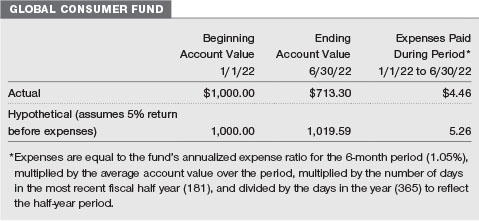
As a mutual fund shareholder, you may incur two types of costs: (1) transaction costs, such as redemption fees or sales loads, and (2) ongoing costs, including management fees, distribution and service (12b-1) fees, and other fund expenses. The following example is intended to help you understand your ongoing costs (in dollars) of investing in the fund and to compare these costs with the ongoing costs of investing in other mutual funds. The example is based on an investment of $1,000 invested at the beginning of the most recent six-month period and held for the entire period.
Actual Expenses
The first line of the following table (Actual) provides information about actual account values and expenses based on the fund’s actual returns. You may use the information on this line, together with your account balance, to estimate the expenses that you paid over the period. Simply divide your account value by $1,000 (for example, an $8,600 account value divided by $1,000 = 8.6), then multiply the result by the number on the first line under the heading “Expenses Paid During Period” to estimate the expenses you paid on your account during this period.
Hypothetical Example for Comparison Purposes
The information on the second line of the table (Hypothetical) is based on hypothetical account values and expenses derived from the fund’s actual expense ratio and an assumed 5% per year rate of return before expenses (not the fund’s actual return). You may compare the ongoing costs of investing in the fund with other funds by contrasting this 5% hypothetical example and the 5% hypothetical examples that appear in the shareholder reports of the other funds. The hypothetical account values and expenses may not be used to estimate the actual ending account balance or expenses you paid for the period.
Note: T. Rowe Price charges an annual account service fee of $20, generally for accounts with less than $10,000. The fee is waived for any investor whose T. Rowe Price mutual fund accounts total $50,000 or more; accounts electing to receive electronic delivery of account statements, transaction confirmations, prospectuses, and shareholder reports; or accounts of an investor who is a T. Rowe Price Personal Services or Enhanced Personal Services client (enrollment in these programs generally requires T. Rowe Price assets of at least $250,000). This fee is not included in the accompanying table. If you are subject to the fee, keep it in mind when you are estimating the ongoing expenses of investing in the fund and when comparing the expenses of this fund with other funds.
You should also be aware that the expenses shown in the table highlight only your ongoing costs and do not reflect any transaction costs, such as redemption fees or sales loads. Therefore, the second line of the table is useful in comparing ongoing costs only and will not help you determine the relative total costs of owning different funds. To the extent a fund charges transaction costs, however, the total cost of owning that fund is higher.
Unaudited

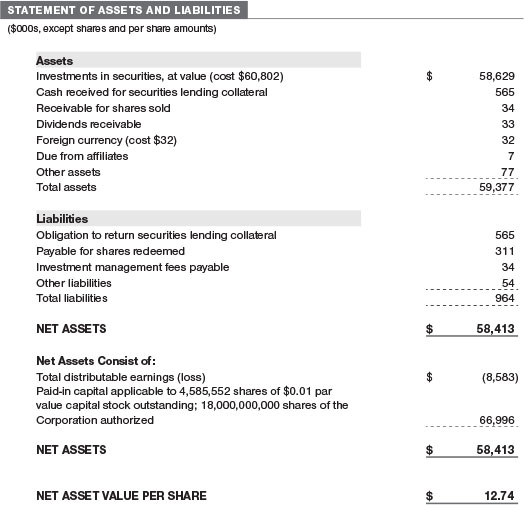
The accompanying notes are an integral part of these financial statements.
June 30, 2022 (Unaudited)
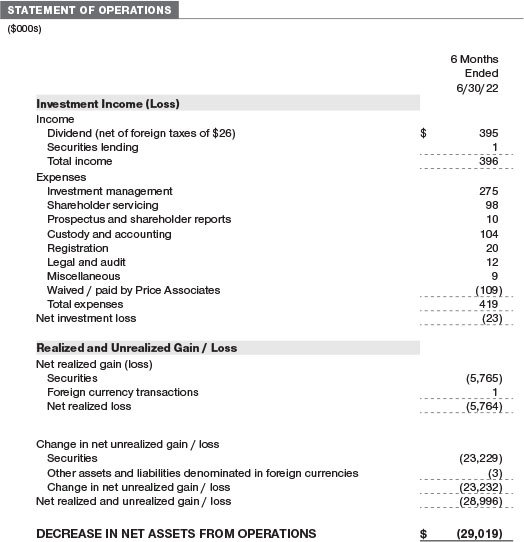
The accompanying notes are an integral part of these financial statements.
June 30, 2022 (Unaudited)
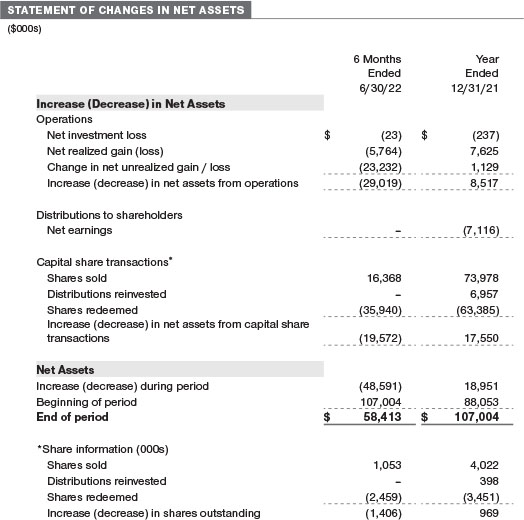
The accompanying notes are an integral part of these financial statements.
Unaudited
The accompanying notes are an integral part of these financial statements.
Unaudited
The accompanying notes are an integral part of these financial statements.
Unaudited
| NOTES TO FINANCIAL STATEMENTS |
T. Rowe Price International Funds, Inc. (the corporation) is registered under the Investment Company Act of 1940 (the 1940 Act). The Global Consumer Fund (the fund) is a nondiversified, open-end management investment company established by the corporation. The fund seeks to provide long-term growth of capital.
NOTE 1 - SIGNIFICANT ACCOUNTING POLICIES
Basis of Preparation The fund is an investment company and follows accounting and reporting guidance in the Financial Accounting Standards Board (FASB) Accounting Standards Codification Topic 946 (ASC 946). The accompanying financial statements were prepared in accordance with accounting principles generally accepted in the United States of America (GAAP), including, but not limited to, ASC 946. GAAP requires the use of estimates made by management. Management believes that estimates and valuations are appropriate; however, actual results may differ from those estimates, and the valuations reflected in the accompanying financial statements may differ from the value ultimately realized upon sale or maturity.
Investment Transactions, Investment Income, and Distributions Investment transactions are accounted for on the trade date basis. Income and expenses are recorded on the accrual basis. Realized gains and losses are reported on the identified cost basis. Income tax-related interest and penalties, if incurred, are recorded as income tax expense. Dividends received from mutual fund investments are reflected as dividend income; capital gain distributions are reflected as realized gain/loss. Dividend income and capital gain distributions are recorded on the ex-dividend date. Earnings on investments recognized as partnerships for federal income tax purposes reflect the tax character of such earnings. Non-cash dividends, if any, are recorded at the fair market value of the asset received. Distributions to shareholders are recorded on the ex-dividend date. Income distributions, if any, are declared and paid annually. A capital gain distribution may also be declared and paid by the fund annually.
Currency Translation Assets, including investments, and liabilities denominated in foreign currencies are translated into U.S. dollar values each day at the prevailing exchange rate, using the mean of the bid and asked prices of such currencies against U.S. dollars as provided by an outside pricing service. Purchases and sales of securities, income, and expenses are translated into U.S. dollars at the prevailing exchange rate on the respective date of such transaction. The effect of changes in foreign currency exchange rates on realized and unrealized security gains and losses is not bifurcated from the portion attributable to changes in market prices.
Capital Transactions Each investor’s interest in the net assets of the fund is represented by fund shares. The fund’s net asset value (NAV) per share is computed at the close of the New York Stock Exchange (NYSE), normally 4 p.m. ET, each day the NYSE is open for business. However, the NAV per share may be calculated at a time other than the normal close of the NYSE if trading on the NYSE is restricted, if the NYSE closes earlier, or as may be permitted by the SEC. Purchases and redemptions of fund shares are transacted at the next-computed NAV per share, after receipt of the transaction order by T. Rowe Price Associates, Inc., or its agents.
Indemnification In the normal course of business, the fund may provide indemnification in connection with its officers and directors, service providers, and/or private company investments. The fund’s maximum exposure under these arrangements is unknown; however, the risk of material loss is currently considered to be remote.
NOTE 2 - VALUATION
Fair Value The fund’s financial instruments are valued at the close of the NYSE and are reported at fair value, which GAAP defines as the price that would be received to sell an asset or paid to transfer a liability in an orderly transaction between market participants at the measurement date. The T. Rowe Price Valuation Committee (the Valuation Committee) is an internal committee that has been delegated certain responsibilities by the fund’s Board of Directors (the Board) to ensure that financial instruments are appropriately priced at fair value in accordance with GAAP and the 1940 Act. Subject to oversight by the Board, the Valuation Committee develops and oversees pricing-related policies and procedures and approves all fair value determinations. Specifically, the Valuation Committee establishes policies and procedures used in valuing financial instruments, including those which cannot be valued in accordance with normal procedures or using pricing vendors; determines pricing techniques, sources, and persons eligible to effect fair value pricing actions; evaluates the services and performance of the pricing vendors; oversees the pricing process to ensure policies and procedures are being followed; and provides guidance on internal controls and valuation-related matters. The Valuation Committee provides periodic reporting to the Board on valuation matters.
Various valuation techniques and inputs are used to determine the fair value of financial instruments. GAAP establishes the following fair value hierarchy that categorizes the inputs used to measure fair value:
Level 1 – quoted prices (unadjusted) in active markets for identical financial instruments that the fund can access at the reporting date
Level 2 – inputs other than Level 1 quoted prices that are observable, either directly or indirectly (including, but not limited to, quoted prices for similar financial instruments in active markets, quoted prices for identical or similar financial instruments in inactive markets, interest rates and yield curves, implied volatilities, and credit spreads)
Level 3 – unobservable inputs (including the fund’s own assumptions in determining fair value)
Observable inputs are developed using market data, such as publicly available information about actual events or transactions, and reflect the assumptions that market participants would use to price the financial instrument. Unobservable inputs are those for which market data are not available and are developed using the best information available about the assumptions that market participants would use to price the financial instrument. GAAP requires valuation techniques to maximize the use of relevant observable inputs and minimize the use of unobservable inputs. When multiple inputs are used to derive fair value, the financial instrument is assigned to the level within the fair value hierarchy based on the lowest-level input that is significant to the fair value of the financial instrument. Input levels are not necessarily an indication of the risk or liquidity associated with financial instruments at that level but rather the degree of judgment used in determining those values.
Valuation Techniques Equity securities, including exchange-traded funds, listed or regularly traded on a securities exchange or in the over-the-counter (OTC) market are valued at the last quoted sale price or, for certain markets, the official closing price at the time the valuations are made. OTC Bulletin Board securities are valued at the mean of the closing bid and asked prices. A security that is listed or traded on more than one exchange is valued at the quotation on the exchange determined to be the primary market for such security. Listed securities not traded on a particular day are valued at the mean of the closing bid and asked prices for domestic securities and the last quoted sale or closing price for international securities.
The last quoted prices of non-U.S. equity securities may be adjusted to reflect the fair value of such securities at the close of the NYSE, if the fund determines that developments between the close of a foreign market and the close of the NYSE will affect the value of some or all of its portfolio securities. Each business day, the fund uses information from outside pricing services to evaluate and, if appropriate, decide whether it is necessary to adjust quoted prices to reflect fair value by reviewing a variety of factors, including developments in foreign markets, the performance of U.S. securities markets, and the performance of instruments trading in U.S. markets that represent foreign securities and baskets of foreign securities. The fund uses outside pricing services to provide it with quoted prices and information to evaluate or adjust those prices. The fund cannot predict how often it will use quoted prices and how often it will determine it necessary to adjust those prices to reflect fair value.
Investments in mutual funds are valued at the mutual fund’s closing NAV per share on the day of valuation. Assets and liabilities other than financial instruments, including short-term receivables and payables, are carried at cost, or estimated realizable value, if less, which approximates fair value.
Investments for which market quotations or market-based valuations are not readily available or deemed unreliable are valued at fair value as determined in good faith by the Valuation Committee, in accordance with fair valuation policies and procedures. The objective of any fair value pricing determination is to arrive at a price that could reasonably be expected from a current sale. Financial instruments fair valued by the Valuation Committee are primarily private placements, restricted securities, warrants, rights, and other securities that are not publicly traded. Factors used in determining fair value vary by type of investment and may include market or investment specific considerations. The Valuation Committee typically will afford greatest weight to actual prices in arm’s length transactions, to the extent they represent orderly transactions between market participants, transaction information can be reliably obtained, and prices are deemed representative of fair value. However, the Valuation Committee may also consider other valuation methods such as market-based valuation multiples; a discount or premium from market value of a similar, freely traded security of the same issuer; discounted cash flows; yield to maturity; or some combination. Fair value determinations are reviewed on a regular basis and updated as information becomes available, including actual purchase and sale transactions of the investment. Because any fair value determination involves a significant amount of judgment, there is a degree of subjectivity inherent in such pricing decisions, and fair value prices determined by the Valuation Committee could differ from those of other market participants.
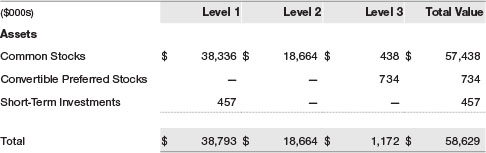
Valuation Inputs The following table summarizes the fund’s financial instruments, based on the inputs used to determine their fair values on June 30, 2022 (for further detail by category, please refer to the accompanying Portfolio of Investments):
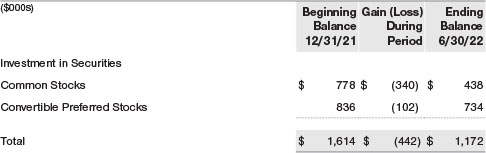
Following is a reconciliation of the fund’s Level 3 holdings for the six months ended June 30, 2022. Gain (loss) reflects both realized and change in unrealized gain/loss on Level 3 holdings during the period, if any, and is included on the accompanying Statement of Operations. The change in unrealized gain/loss on Level 3 instruments held at June 30, 2022, totaled $(442,000) for the six months ended June 30, 2022.
NOTE 3 - OTHER INVESTMENT TRANSACTIONS
Consistent with its investment objective, the fund engages in the following practices to manage exposure to certain risks and/or to enhance performance. The investment objective, policies, program, and risk factors of the fund are described more fully in the fund’s prospectus and Statement of Additional Information.
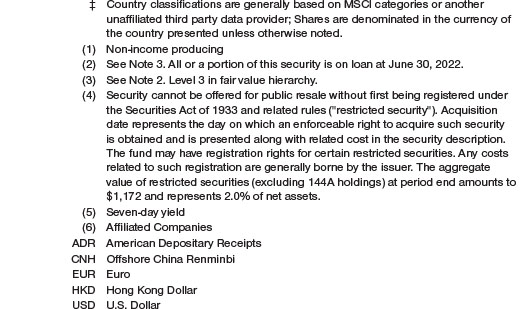
Restricted Securities The fund invests in securities that are subject to legal or contractual restrictions on resale. Prompt sale of such securities at an acceptable price may be difficult and may involve substantial delays and additional costs.
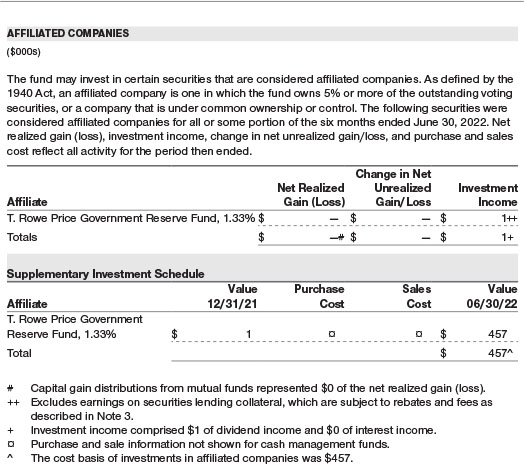
Securities Lending The fund may lend its securities to approved borrowers to earn additional income. Its securities lending activities are administered by a lending agent in accordance with a securities lending agreement. Security loans generally do not have stated maturity dates, and the fund may recall a security at any time. The fund receives collateral in the form of cash or U.S. government securities. Collateral is maintained over the life of the loan in an amount not less than the value of loaned securities; any additional collateral required due to changes in security values is delivered to the fund the next business day. Cash collateral is invested in accordance with investment guidelines approved by fund management. Additionally, the lending agent indemnifies the fund against losses resulting from borrower default. Although risk is mitigated by the collateral and indemnification, the fund could experience a delay in recovering its securities and a possible loss of income or value if the borrower fails to return the securities, collateral investments decline in value, and the lending agent fails to perform. Securities lending revenue consists of earnings on invested collateral and borrowing fees, net of any rebates to the borrower, compensation to the lending agent, and other administrative costs. In accordance with GAAP, investments made with cash collateral are reflected in the accompanying financial statements, but collateral received in the form of securities is not. At June 30, 2022, the value of loaned securities was $542,000; the value of cash collateral and related investments was $565,000.
Other Purchases and sales of portfolio securities other than short-term securities aggregated $1,438,000 and $21,856,000, respectively, for the six months ended June 30, 2022.
NOTE 4 - FEDERAL INCOME TAXES
No provision for federal income taxes is required since the fund intends to continue to qualify as a regulated investment company under Subchapter M of the Internal Revenue Code and distribute to shareholders all of its taxable income and gains. Distributions determined in accordance with federal income tax regulations may differ in amount or character from net investment income and realized gains for financial reporting purposes. Financial reporting records are adjusted for permanent book/tax differences to reflect tax character but are not adjusted for temporary differences. The amount and character of tax-basis distributions and composition of net assets are finalized at fiscal year-end; accordingly, tax-basis balances have not been determined as of the date of this report.
The fund intends to retain realized gains to the extent of available capital loss carryforwards. Net realized capital losses may be carried forward indefinitely to offset future realized capital gains. As of December 31, 2021, the fund had $1,000 of available capital loss carryforwards.
At June 30, 2022, the cost of investments for federal income tax purposes was $61,285,000. Net unrealized loss aggregated $2,658,000 at period-end, of which $6,561,000 related to appreciated investments and $9,219,000 related to depreciated investments.
NOTE 5 - FOREIGN TAXES
The fund is subject to foreign income taxes imposed by certain countries in which it invests. Additionally, capital gains realized upon disposition of securities issued in or by certain foreign countries are subject to capital gains tax imposed by those countries. All taxes are computed in accordance with the applicable foreign tax law, and, to the extent permitted, capital losses are used to offset capital gains. Taxes attributable to income are accrued by the fund as a reduction of income. Current and deferred tax expense attributable to capital gains is reflected as a component of realized or change in unrealized gain/loss on securities in the accompanying financial statements. To the extent that the fund has country specific capital loss carryforwards, such carryforwards are applied against net unrealized gains when determining the deferred tax liability. Any deferred tax liability incurred by the fund is included in either Other liabilities or Deferred tax liability on the accompanying Statement of Assets and Liabilities.
NOTE 6 - RELATED PARTY TRANSACTIONS
The fund is managed by T. Rowe Price Associates, Inc. (Price Associates), a wholly owned subsidiary of T. Rowe Price Group, Inc. (Price Group). The investment management agreement between the fund and Price Associates provides for an annual investment management fee, which is computed daily and paid monthly. The fee consists of an individual fund fee, equal to 0.40% of the fund’s average daily net assets, and a group fee. The group fee rate is calculated based on the combined net assets of certain mutual funds sponsored by Price Associates (the group) applied to a graduated fee schedule, with rates ranging from 0.48% for the first $1 billion of assets to 0.260% for assets in excess of $845 billion. The fund’s group fee is determined by applying the group fee rate to the fund’s average daily net assets. The fee is computed daily and paid monthly. At June 30, 2022, the effective annual group fee rate was 0.29%.
The fund is subject to a contractual expense limitation through the expense limitation date indicated in the table below. During the limitation period, Price Associates is required to waive its management fee and pay the fund for any expenses (excluding interest; expenses related to borrowings, taxes, and brokerage; and other non-recurring expenses permitted by the investment management agreement) that would otherwise cause the fund’s ratio of annualized total expenses to average net assets (net expense ratio) to exceed its expense limitation. The fund is required to repay Price Associates for expenses previously waived/paid to the extent its net assets grow or expenses decline sufficiently to allow repayment without causing the fund’s net expense ratio (after the repayment is taken into account) to exceed the lesser of: (1) the expense limitation in place at the time such amounts were waived; or (2) the fund’s current expense limitation. However, no repayment will be made more than three years after the date of a payment or waiver. Pursuant to this agreement, expenses were waived/paid by and/or repaid to Price Associates during the six months ended June 30, 2022 as indicated in the table below. Including this amount, expenses previously waived/paid by Price Associates in the amount of $453,000 remain subject to repayment by the fund at June 30, 2022. Any repayment of expenses previously waived/paid by Price Associates during the period would be included in the net investment income and expense ratios presented on the accompanying Financial Highlights.

In addition, the fund has entered into service agreements with Price Associates and two wholly owned subsidiaries of Price Associates, each an affiliate of the fund (collectively, Price). Price Associates provides certain accounting and administrative services to the fund. T. Rowe Price Services, Inc. provides shareholder and administrative services in its capacity as the fund’s transfer and dividend-disbursing agent. T. Rowe Price Retirement Plan Services, Inc. provides subaccounting and recordkeeping services for certain retirement accounts invested in the fund. For the six months ended June 30, 2022, expenses incurred pursuant to these service agreements were $53,000 for Price Associates; $49,000 for T. Rowe Price Services, Inc.; and $1,000 for T. Rowe Price Retirement Plan Services, Inc. All amounts due to and due from Price, exclusive of investment management fees payable, are presented net on the accompanying Statement of Assets and Liabilities.
The fund may invest its cash reserves in certain open-end management investment companies managed by Price Associates and considered affiliates of the fund: the T. Rowe Price Government Reserve Fund or the T. Rowe Price Treasury Reserve Fund, organized as money market funds, or the T. Rowe Price Short-Term Fund, a short-term bond fund (collectively, the Price Reserve Funds). The Price Reserve Funds are offered as short-term investment options to mutual funds, trusts, and other accounts managed by Price Associates or its affiliates and are not available for direct purchase by members of the public. Cash collateral from securities lending, if any, is invested in the T. Rowe Price Government Reserve Fund; prior to December 13, 2021, the cash collateral from securities lending was invested in the T. Rowe Price Short-Term Fund. The Price Reserve Funds pay no investment management fees.
The fund may participate in securities purchase and sale transactions with other funds or accounts advised by Price Associates (cross trades), in accordance with procedures adopted by the fund’s Board and Securities and Exchange Commission rules, which require, among other things, that such purchase and sale cross trades be effected at the independent current market price of the security. During the six months ended June 30, 2022, the fund had no purchases or sales cross trades with other funds or accounts advised by Price Associates.
Price Associates has voluntarily agreed to reimburse the fund from its own resources on a monthly basis for the cost of investment research embedded in the cost of the fund’s securities trades. This agreement may be rescinded at any time. For the six months ended June 30, 2022, this reimbursement amounted to less than $1,000.
NOTE 7 - OTHER MATTERS
Unpredictable events such as environmental or natural disasters, war, terrorism, pandemics, outbreaks of infectious diseases, and similar public health threats may significantly affect the economy and the markets and issuers in which a fund invests. Certain events may cause instability across global markets, including reduced liquidity and disruptions in trading markets, while some events may affect certain geographic regions, countries, sectors, and industries more significantly than others, and exacerbate other pre-existing political, social, and economic risks. Since 2020, a novel strain of coronavirus (COVID-19) has resulted in disruptions to global business activity and caused significant volatility and declines in global financial markets. In February 2022, Russian forces entered Ukraine and commenced an armed conflict leading to economic sanctions being imposed on Russia and certain of its citizens, creating impacts on Russian-related stocks and debt and greater volatility in global markets. These are recent examples of global events which may have an impact on the fund’s performance, which could be negatively impacted if the value of a portfolio holding were harmed by these and such other events. Management is actively monitoring the risks and financial impacts arising from these events.
INFORMATION ON PROXY VOTING POLICIES, PROCEDURES, AND RECORDS
A description of the policies and procedures used by T. Rowe Price funds to determine how to vote proxies relating to portfolio securities is available in each fund’s Statement of Additional Information. You may request this document by calling 1-800-225-5132 or by accessing the SEC’s website, sec.gov.
The description of our proxy voting policies and procedures is also available on our corporate website. To access it, please visit the following Web page:
https://www.troweprice.com/corporate/us/en/utility/policies.html
Scroll down to the section near the bottom of the page that says, “Proxy Voting Guidelines.” Click on the links in the shaded box.
Each fund’s most recent annual proxy voting record is available on our website and through the SEC’s website. To access it through T. Rowe Price, visit the website location shown above, and scroll down to the section near the bottom of the page that says, “Proxy Voting Records.” Click on the Proxy Voting Records link in the shaded box.
HOW TO OBTAIN QUARTERLY PORTFOLIO HOLDINGS
The fund files a complete schedule of portfolio holdings with the Securities and Exchange Commission (SEC) for the first and third quarters of each fiscal year as an exhibit to its reports on Form N-PORT. The fund’s reports on Form N-PORT are available electronically on the SEC’s website (sec.gov). In addition, most T. Rowe Price funds disclose their first and third fiscal quarter-end holdings on troweprice.com.
APPROVAL OF INVESTMENT MANAGEMENT AGREEMENT
Each year, the fund’s Board of Directors (Board) considers the continuation of the investment management agreement (Advisory Contract) between the fund and its investment adviser, T. Rowe Price Associates, Inc. (Adviser). In that regard, at a meeting held on March 7–8, 2022 (Meeting), the Board, including all of the fund’s independent directors, approved the continuation of the fund’s Advisory Contract. At the Meeting, the Board considered the factors and reached the conclusions described below relating to the selection of the Adviser and the approval of the Advisory Contract. The independent directors were assisted in their evaluation of the Advisory Contract by independent legal counsel from whom they received separate legal advice and with whom they met separately.
In providing information to the Board, the Adviser was guided by a detailed set of requests for information submitted by independent legal counsel on behalf of the independent directors. In considering and approving the Advisory Contract, the Board considered the information it believed was relevant, including, but not limited to, the information discussed below. The Board considered not only the specific information presented in connection with the Meeting but also the knowledge gained over time through interaction with the Adviser about various topics. The Board meets regularly and, at each of its meetings, covers an extensive agenda of topics and materials and considers factors that are relevant to its annual consideration of the renewal of the T. Rowe Price funds’ advisory contracts, including performance and the services and support provided to the funds and their shareholders.
Services Provided by the Adviser
The Board considered the nature, quality, and extent of the services provided to the fund by the Adviser. These services included, but were not limited to, directing the fund’s investments in accordance with its investment program and the overall management of the fund’s portfolio, as well as a variety of related activities such as financial, investment operations, and administrative services; compliance; maintaining the fund’s records and registrations; and shareholder communications. The Board also reviewed the background and experience of the Adviser’s senior management team and investment personnel involved in the management of the fund, as well as the Adviser’s compliance record. The Board concluded that it was satisfied with the nature, quality, and extent of the services provided by the Adviser.
Investment Performance of the Fund
The Board took into account discussions with the Adviser and reports that it receives throughout the year relating to fund performance. In connection with the Meeting, the Board reviewed the fund’s total returns for various periods through December 31, 2021, and compared these returns with the performance of a peer group of funds with similar investment programs and a wide variety of other previously agreed-upon comparable performance measures and market data, including relative performance information as of September 30, 2021, supplied by Broadridge, which is an independent provider of mutual fund data.
On the basis of this evaluation and the Board’s ongoing review of investment results, and factoring in the relative market conditions during certain of the performance periods, the Board concluded that the fund’s performance was satisfactory.
Costs, Benefits, Profits, and Economies of Scale
The Board reviewed detailed information regarding the revenues received by the Adviser under the Advisory Contract and other direct and indirect benefits that the Adviser (and its affiliates) may have realized from its relationship with the fund. In considering soft-dollar arrangements pursuant to which research may be received from broker-dealers that execute the fund’s portfolio transactions, the Board noted that the Adviser bears the cost of research services for all client accounts that it advises, including the T. Rowe Price funds. The Board received information on the estimated costs incurred and profits realized by the Adviser from managing the T. Rowe Price funds. While the Board did not review information regarding profits realized from managing the fund in particular because the fund had either not achieved sufficient portfolio asset size or not recognized sufficient revenues to produce meaningful profit margin percentages, the Board concluded that the Adviser’s profits were reasonable in light of the services provided to the T. Rowe Price funds.
The Board also considered whether the fund benefits under the fee levels set forth in the Advisory Contract or otherwise from any economies of scale realized by the Adviser. Under the Advisory Contract, the fund pays a fee to the Adviser for investment management services composed of two components—a group fee rate based on the combined average net assets of most of the T. Rowe Price funds (including the fund) that declines at certain asset levels and an individual fund fee rate based on the fund’s average daily net assets—and the fund pays its own expenses of operations (subject to contractual expense limitations). The Board concluded that the advisory fee structure for the fund continued to provide for a reasonable sharing of benefits from any economies of scale with the fund’s investors.
Fees and Expenses
The Board was provided with information regarding industry trends in management fees and expenses. Among other things, the Board reviewed data for peer groups that were compiled by Broadridge, which compared: (i) contractual management fees, actual management fees, nonmanagement expenses, and total expenses of the fund with a group of competitor funds selected by Broadridge (Expense Group) and (ii) actual management fees, nonmanagement expenses, and total expenses of the fund with a broader set of funds within the Lipper investment classification (Expense Universe). The Board considered the fund’s contractual management fee rate, actual management fee rate (which reflects the management fees actually received from the fund by the Adviser after any applicable waivers, reductions, or reimbursements), operating expenses, and total expenses (which reflect the net total expense ratio of the fund after any waivers, reductions, or reimbursements) in comparison with the information for the Broadridge peer groups. Broadridge generally constructed the peer groups by seeking the most comparable funds based on similar investment classifications and objectives, expense structure, asset size, and operating components and attributes and ranked funds into quintiles, with the first quintile representing the funds with the lowest relative expenses and the fifth quintile representing the funds with the highest relative expenses. There were not sufficient funds in the Expense Group or Expense Universe to rank within quintiles. The information provided to the Board indicated that the fund’s contractual management fee ranked second out of three funds (Expense Group), the fund’s actual management fee rate ranked first out of three funds (Expense Group) and first out of five funds (Expense Universe), and the fund’s total expenses ranked second out of three funds (Expense Group) and fourth out of five funds (Expense Universe).
The Board also reviewed the fee schedules for other investment portfolios with similar mandates that are advised or subadvised by the Adviser and its affiliates, including separately managed accounts for institutional and individual investors; subadvised funds; and other sponsored investment portfolios, including collective investment trusts and pooled vehicles organized and offered to investors outside the United States. Management provided the Board with information about the Adviser’s responsibilities and services provided to subadvisory and other institutional account clients, including information about how the requirements and economics of the institutional business are fundamentally different from those of the proprietary mutual fund business. The Board considered information showing that the Adviser’s mutual fund business is generally more complex from a business and compliance perspective than its institutional account business and considered various relevant factors, such as the broader scope of operations and oversight, more extensive shareholder communication infrastructure, greater asset flows, heightened business risks, and differences in applicable laws and regulations associated with the Adviser’s proprietary mutual fund business. In assessing the reasonableness of the fund’s management fee rate, the Board considered the differences in the nature of the services required for the Adviser to manage its mutual fund business versus managing a discrete pool of assets as a subadviser to another institution’s mutual fund or for an institutional account and that the Adviser generally performs significant additional services and assumes greater risk in managing the fund and other T. Rowe Price funds than it does for institutional account clients, including subadvised funds.
On the basis of the information provided and the factors considered, the Board concluded that the fees paid by the fund under the Advisory Contract are reasonable.
Approval of the Advisory Contract
As noted, the Board approved the continuation of the Advisory Contract. No single factor was considered in isolation or to be determinative to the decision. Rather, the Board concluded, in light of a weighting and balancing of all factors considered, that it was in the best interests of the fund and its shareholders for the Board to approve the continuation of the Advisory Contract (including the fees to be charged for services thereunder).
Item 1. (b) Notice pursuant to Rule 30e-3.
Not applicable.
Item 2. Code of Ethics.
A code of ethics, as defined in Item 2 of Form N-CSR, applicable to its principal executive officer, principal financial officer, principal accounting officer or controller, or persons performing similar functions is filed as an exhibit to the registrant’s annual Form N-CSR. No substantive amendments were approved or waivers were granted to this code of ethics during the registrant’s most recent fiscal half-year.
Item 3. Audit Committee Financial Expert.
Disclosure required in registrant’s annual Form N-CSR.
Item 4. Principal Accountant Fees and Services.
Disclosure required in registrant’s annual Form N-CSR.
Item 5. Audit Committee of Listed Registrants.
Not applicable.
Item 6. Investments.
(a) Not applicable. The complete schedule of investments is included in Item 1 of this Form N-CSR.
(b) Not applicable.
Item 7. Disclosure of Proxy Voting Policies and Procedures for Closed-End Management Investment Companies.
Not applicable.
Item 8. Portfolio Managers of Closed-End Management Investment Companies.
Not applicable.
Item 9. Purchases of Equity Securities by Closed-End Management Investment Company and Affiliated Purchasers.
Not applicable.
Item 10. Submission of Matters to a Vote of Security Holders.
There has been no change to the procedures by which shareholders may recommend nominees to the registrant’s board of directors.
Item 11. Controls and Procedures.
(a) The registrant’s principal executive officer and principal financial officer have evaluated the registrant’s disclosure controls and procedures within 90 days of this filing and have concluded that the registrant’s disclosure controls and procedures were effective, as of that date, in ensuring that information required to be disclosed by the registrant in this Form N-CSR was recorded, processed, summarized, and reported timely.
(b) The registrant’s principal executive officer and principal financial officer are aware of no change in the registrant’s internal control over financial reporting that occurred during the period covered by this report that has materially affected, or is reasonably likely to materially affect, the registrant’s internal control over financial reporting.
Item 12. Disclosure of Securities Lending Activities for Closed-End Management Investment Companies.
Not applicable.
Item 13. Exhibits.
(a)(1) The registrant’s code of ethics pursuant to Item 2 of Form N-CSR is filed with the registrant’s annual Form N-CSR.
(2) Separate certifications by the registrant’s principal executive officer and principal financial officer, pursuant to Section 302 of the Sarbanes-Oxley Act of 2002 and required by Rule 30a-2(a) under the Investment Company Act of 1940, are attached.
(3) Written solicitation to repurchase securities issued by closed-end companies: not applicable.
(b) A certification by the registrant’s principal executive officer and principal financial officer, pursuant to Section 906 of the Sarbanes-Oxley Act of 2002 and required by Rule 30a-2(b) under the Investment Company Act of 1940, is attached.
SIGNATURES
Pursuant to the requirements of the Securities Exchange Act of 1934 and the Investment Company Act of 1940, the registrant has duly caused this report to be signed on its behalf by the undersigned, thereunto duly authorized.
T. Rowe Price International Funds, Inc.
| By | | /s/ David Oestreicher |
| | | David Oestreicher |
| | | Principal Executive Officer |
| |
| Date | | August 17, 2022 | | | | |
Pursuant to the requirements of the Securities Exchange Act of 1934 and the Investment Company Act of 1940, this report has been signed below by the following persons on behalf of the registrant and in the capacities and on the dates indicated.
| By | | /s/ David Oestreicher |
| | | David Oestreicher |
| | | Principal Executive Officer |
| |
| Date | | August 17, 2022 | | | | |
| |
| |
| By | | /s/ Alan S. Dupski |
| | | Alan S. Dupski |
| | | Principal Financial Officer |
| |
| Date | | August 17, 2022 | | | | |