As filed with the Securities and Exchange Commission on 21 February 2025
UNITED STATES
SECURITIES AND EXCHANGE COMMISSION
Washington, D.C. 20549
_____________________________________
Form 20-F
_____________________________________
(Mark one)
o REGISTRATION STATEMENT PURSUANT TO SECTION 12(b) OR (g) OF THE SECURITIES EXCHANGE ACT OF 1934
OR
x ANNUAL REPORT PURSUANT TO SECTION 13 OR 15(d) OF THE SECURITIES EXCHANGE ACT OF 1934
For the fiscal year ended December 31, 2024
OR
o TRANSITION REPORT PURSUANT TO SECTION 13 OR 15(d) OF THE SECURITIES EXCHANGE ACT OF 1934
OR
o SHELL COMPANY REPORT PURSUANT TO SECTION 13 OR 15(d) OF THE SECURITIES EXCHANGE ACT OF 1934
Date of event requiring this shell company report . . . . . . . . . . . . . . . . . . .
For the transition period from ___________________________ to ___________________________
Commission file number 001-05146-01
KONINKLIJKE PHILIPS NV
(Exact name of Registrant as specified in its charter)
ROYAL PHILIPS
(Translation of Registrant's name into English)
The Netherlands
(Jurisdiction of incorporation or organization)
Philips Center, Amstelplein 2, 1096 BC Amsterdam, The Netherlands
(Address of principal executive offices)
Marnix van Ginneken, Chief ESG & Legal Officer
+31 2059 77232, marnix.van.ginneken@philips.com, Philips Center, Amstelplein 2, 1096 BC Amsterdam, The Netherlands
(Name, Telephone, Email and/or Facsimile number and Address of Company Contact Person)
Securities registered or to be registered pursuant to Section 12(b) of the Act.
| | | | | | | | |
| Title of each class | Trading Symbol(s) | Name of each exchange on which registered |
| Common Shares - par value EURO (EUR) 0.20 per share | PHG | New York Stock Exchange |
| | |
Securities registered or to be registered pursuant to Section 12(g) of the Act.
None
(Title of class)
Securities for which there is a reporting obligation pursuant to Section 15(d) of the Act.
None
(Title of class)
Indicate the number of outstanding shares of each of the issuer's classes of capital or common stock as of the close of the period covered by the annual report.
| | | | | |
| Class | Outstanding at December 31, 2024 |
| KONINKLIJKE PHILIPS NV | 925,009,074 |
| Common Shares par value EUR 0.20 per share | |
Indicate by check mark if the registrant is a well-known seasoned issuer, as defined in Rule 405 of the Securities Act. xYes o No
If this report is an annual or transition report, indicate by check mark if the registrant is not required to file reports pursuant to Section 13 or 15(d) of the Securities Exchange Act of 1934. o Yes x No
Note - Checking the box above will not relieve any registrant required to file reports pursuant to Section 13 or 15(d) of the Securities Exchange Act of 1934 from their obligations under those Sections.
Indicate by check mark whether the registrant (1) has filed all reports required to be filed by Section 13 or 15(d) of the Securities Exchange Act of 1934 during the preceding 12 months (or for such shorter period that the registrant was required to file such reports), and (2) has been subject to such filing requirements for the past 90 days. xYes o No
Indicate by check mark whether the registrant has submitted electronically every Interactive Data File required to be submitted pursuant to Rule 405 of Regulation S-T (§232.405 of this chapter) during the preceding 12 months (or for such shorter period that the registrant was required to submit such files). x Yes o No
Indicate by check mark whether the registrant is a large accelerated filer, an accelerated filer, a non-accelerated filer, or an emerging growth company. See definition of “large accelerated filer," "accelerated filer,” and "emerging growth company" in Rule 12b-2 of the Exchange Act.
Large Accelerated Filer x Accelerated filer o Non-accelerated filer o Emerging growth company o
If an emerging growth company that prepares its financial statements in accordance with U.S. GAAP, indicate by check mark if the registrant has elected not to use the extended transition period for complying with any new or revised financial accounting standards† provided pursuant to Section 13(a) of the Exchange Act. o
† The term “new or revised financial accounting standard” refers to any update issued by the Financial Accounting Standards Board to its Accounting Standards Codification after April 5, 2012.
Indicate by check mark whether the registrant has filed a report on and attestation to its management’s assessment of the
effectiveness of its internal control over financial reporting under Section 404(b) of the Sarbanes-Oxley Act (15 U.S.C.
7262(b)) by the registered public accounting firm that prepared or issued its audit report. x
If securities are registered pursuant to Section 12(b) of the Act, indicate by check mark whether the financial statements of the registrant included in the filing reflect the correction of an error to previously issued financial statements. o
Indicate by check mark whether any of those error corrections are restatements that required a recovery analysis of incentive- based compensation received by any of the registrant’s executive officers during the relevant recovery period pursuant to §240.10D-1(b). o
Indicate by check mark which basis of accounting the registrant has used to prepare the financial statements included in this filing:
| | | | | | | | | | | | | | |
U.S. GAAP o | | International Financial Reporting Standards as issued by the International Accounting Standards Board x | | Other o |
If “Other” has been checked in response to the previous question, indicate by check mark which financial statement item the registrant has elected to follow. o Item 17 o Item 18
If this is an annual report, indicate by check mark whether the registrant is a shell company (as defined in Rule 12b-2 of the Exchange Act). o Yes x No
Contents
1 Introduction
This document contains information required for the Annual Report on Form 20-F for the year ended December 31, 2024 of Koninklijke Philips N.V. (the 2024 Form 20-F). Reference is made to the Form 20-F cross reference table herein. Only the following information shall be deemed to be filed with the Securities and Exchange Commission (SEC) for any purpose (i) the information in this document that is referenced in the Form 20-F cross reference table, (ii) this introduction and the cautionary statement “forward-looking statements” on the next two pages and (iii) the Exhibits. Any additional information in this document which is not referenced in the Form 20-F cross reference table, or the Exhibits themselves, shall not be deemed to be so incorporated by reference, shall not be part of the 2024 Form 20-F and is furnished to the SEC for information only.
References to Philips
References to the Company or company, to Philips or the (Philips) Group or group, relate to Koninklijke Philips N.V. and its subsidiaries, as the context requires. Royal Philips refers to Koninklijke Philips N.V.
IFRS based information
The audited consolidated financial statements as of December 31, 2024 and 2023, and for each of the years in the three-year period ended December 31, 2024, included in the 2024 Form 20-F have been prepared in accordance with International Financial Reporting Standards (IFRS) as endorsed by the European Union (EU). All standards and interpretations issued by the International Accounting Standards Board (IASB) and the IFRS Interpretations Committee effective 2024 have been endorsed by the EU; consequently, the accounting policies applied by Philips also comply with IFRS as issued by the IASB. These accounting policies have been applied by group entities.
Use of non-IFRS information
In presenting and discussing the Philips financial position, operating results and cash flows, management uses certain financial measures that are not measures of financial performance or liquidity under IFRS (‘non-IFRS’). These non-IFRS measures should not be viewed in isolation as alternatives to the equivalent IFRS measure and should be used in conjunction with the most directly comparable IFRS measures. Non-IFRS measures do not have standardized meaning under IFRS and therefore may not be comparable to similar measures presented by other issuers. In this document, Philips reports the following non-IFRS measures: comparable sales growth; EBITA; Adjusted EBITA; Adjusted EBITDA; Adjusted income from continuing operations attributable to shareholders; Adjusted income from continuing operations attributable to shareholders per common share (in EUR) - diluted (Adjusted EPS); Free cash flow; Net debt : group equity ratio; and Organic Return on Invested Capital (ROIC).
A reconciliation of these non-IFRS measures to the most directly comparable IFRS measures is contained in this document. Reference is made in Reconciliation of non-IFRS information. ESG-related statements
Materiality, as used in the context of ESG, is distinct from, and should not be confused with, such term as defined in the Market Abuse Regulation or as defined for SEC reporting purposes. Any issues identified as material for purposes of ESG in this document, including the materiality assessment undertaken by Philips pursuant to the EU Corporate Sustainability Reporting Directive and the related European Sustainability Reporting Standards, are therefore not necessarily material as defined in the Market Abuse Regulation or for SEC reporting purposes.
Third-party market share data
Statements regarding market share, contained in this document, including those regarding Philips’ competitive position, are based on outside sources such as specialized research institutes, industry and dealer panels in combination with management estimates. Where full year information regarding 2024 is not yet available to Philips, market share statements may also be based on estimates and projections prepared by management and/or based on outside sources of information. Management's estimates of rankings are based on order intake or sales, depending on the business.
Documents on display
Philips’ SEC filings are publicly available through the SEC’s website at www.sec.gov. The SEC website contains reports, proxy and information statements, and other information regarding issuers that file electronically with the SEC. Philips’ internet address is www.philips.com/investor. The contents of any websites referred to herein shall not be considered a part of or incorporated by reference into this document.
Due to rounding, amounts may not add up precisely to the totals provided in this report.
2 Forward-looking statements
Pursuant to provisions of the United States Private Securities Litigation Reform Act of 1995, Philips is providing the following cautionary statement.
This document, including the information referred to in the Form 20-F cross reference table, contains certain forward-looking statements with respect to the financial condition, results of operations and business of Philips and certain of the plans and objectives of Philips with respect to these items, in particular, among other statements, certain statements in Item 4 “Information on the Company” with regard to management's views and objectives, market trends, market standing, product volumes, business risks, the statements in Item 5 “Operating and financial review and prospects” with regards to trends in results of operations, margins overall, market trends, risk management, exchange rates, the statements in Item 8 “Financial Information” relating to legal proceedings and goodwill and statements in Item 11 “Quantitative and qualitative disclosure about market risks” relating to risk caused by derivative positions, interest rate fluctuations and other financial exposure are forward-looking in nature. Forward-looking statements can be identified generally as those containing words such as “anticipates”, “assumes”, “believes”, “estimates”, “expects”, “should”, “will”, “will likely result”, “forecast”, “outlook”, “projects”, “may” or similar expressions. By their nature, these statements involve risk and uncertainty because they relate to future events and circumstances and there are many factors that could cause actual results and developments to differ materially from those expressed or implied by these statements.
These factors include but are not limited to: macro-economic and geopolitical changes including protectionism measures such as announced and proposed tariffs and retaliatory trade measures in response thereto; Philips’ ability to keep pace with the changing health technology environment; Philips’ ability to gain leadership in health informatics and artificial intelligence in response to developments in the health technology industry; integration of acquisitions and their delivery on business plans and value creation expectations; ability to meet expectations with respect to ESG-related matters; securing and maintaining Philips’ intellectual property rights, and unauthorized use of third-party intellectual property rights; failure of products and services to meet quality or security standards, adversely affecting patient safety and customer operations; the resilience of our supply chain; challenges in simplifying our organization and our ways of working; attracting and retaining personnel; breach of cybersecurity; challenges in driving operational excellence and speed in bringing innovations to market; treasury and financing risks; tax risks; reliability of internal controls; compliance with regulations and standards involving quality, product safety, (cyber) security and artificial intelligence; and compliance with business conduct rules and regulations including privacy, existing and upcoming ESG disclosure and due diligence requirements.
As a result, Philips’ actual future results may differ materially from the plans, goals and expectations set forth in such forward-looking statements. For a discussion of factors that could cause future results to differ from such forward-looking statements, reference is made to the information in Risk factors.
3 Form 20-F cross reference table
Only the following information shall be deemed to be filed with the Securities and Exchange Commission for any purpose (i) the information in this document that is referenced in the Form 20-F cross reference table, (ii) the Introduction and the cautionary statements concerning forward-looking statements of this report on pages 6-7, and (iii) the Exhibits. The content of Philips websites and other websites referenced herein should not be considered to be a part of or incorporated into the 2024 Form 20-F. Any additional information which is not referenced in the Form 20-F cross reference table or the Exhibits themselves shall not be deemed to be so incorporated by reference, shall not be part of the 2024 Form 20-F and is furnished to the Securities and Exchange Commission for information only.
The table below sets out the location in this document of the information required by SEC Form 20-F. The exact location is included in the column ‘Location in this document’. The page number refers to the starting page of the section for reference only (and is not intended to refer to the starting page of the specific subsection, if applicable).
| | | | | | | | |
| Item | Form 20-F caption | Location in this document |
| Part 1 | | |
| 1 | Identity of directors, senior management and advisors | Not applicable |
| 2 | Offer statistics and expected timetable | Not applicable |
| 3 | Key information | |
| | A [Reserved] | Not applicable |
| | |
| | B Capitalization and indebtedness | Not applicable |
| | |
| | C Reason for the offer and use of proceeds | Not applicable |
| | | |
| | D Risk factors | |
| | | |
| | | |
| | | |
| | | |
| 4 | Information on the Company | |
| | A History and development of the company | |
| | | |
| | | |
| | | |
| | | |
| | | |
| | | |
| | | |
| | | |
| | | |
| | | |
| | | |
| | | |
| | | |
| | B Business Overview | |
| | | |
| | | |
| | | |
| | | |
| | | |
| | | |
| | | |
| | |
| | | | | | | | |
| Item | Form 20-F caption | Location in this document |
| | C Organizational structure | |
| | | |
| | | |
| | | |
| | | |
| | D Property, plant and equipment | |
| | | |
| | | |
| | | |
| | | Note 19 – Provisions - Environmental provisions; Other provisions (provisions for decommissioning costs) |
| | | |
| 4A | Unresolved staff comments | Not applicable |
| 5 | Operating and financial review and prospects | |
| | A Operating results | |
| | | |
| | | |
| | | |
| | | |
| | | |
| | | |
| | | |
| | | |
| | | |
| | |
| | | |
| | |
| | | |
| | | |
| | | |
| | | |
| | | |
| | | |
| | | |
| | | |
| | | |
| | | |
| | | |
| | | |
| | | |
| | | |
| | | |
| | | |
| | B Liquidity and capital resources | |
| | | |
| | | |
| | |
| | | |
| | | |
| | | | | | | | |
| Item | Form 20-F caption | Location in this document |
| | | |
| | | |
| | | |
| | | |
| | | |
| | | |
| | | |
| | |
| | C Research and development, patents and licenses, etc. | |
| | | |
| | | |
| | | |
| | D Trend information | |
| | | |
| | | |
| | | |
| | | |
| | | |
| | E Critical accounting estimates | Not applicable |
| | | |
| 6 | Directors, senior management and employees | |
| | A Directors and senior management | |
| | | |
| | | |
| | | |
| | | |
| | | |
| | B Compensation | |
| | | |
| | | |
| | | |
| | | |
| | | |
| | C Board practices | |
| | | |
| | |
| | | |
| | | |
| | | |
| | | |
| | | |
| | D Employees | |
| | | |
| | | |
| | E Share ownership | |
| | | |
| | | | | | | | |
| Item | Form 20-F caption | Location in this document |
| | | |
| | | |
| | | |
| | | |
| | | |
| | | |
| | F Disclosure of registrant's action to recover erroneously awarded compensation | Not applicable |
| | |
| 7 | Major shareholders and related party transactions | |
| | A Major shareholders | |
| | | |
| | | |
| | | |
| | | |
| | B Related party transactions | |
| | | |
| | | |
| | | |
| | | |
| | C Interests of experts and counsel | Not applicable |
| | | |
| 8 | Financial information | |
| | A Consolidated statements and other financial information | |
| | | |
| | | |
| | B Significant changes | |
| | | |
| 9 | The offer and listing | |
| | A Offer and listing details | |
| | | |
| | B Plan of distribution | Not applicable |
| | | |
| | C Markets | |
| | | |
| | D Selling shareholders | Not applicable |
| | | |
| | E Dilution | Not applicable |
| | | |
| | F Expenses of the issue | Not applicable |
| | | |
| 10 | Additional information | |
| | A Share capital | Not applicable |
| | | |
| | B Memorandum and articles of association | |
| | | |
| | | |
| | | |
| | | |
| | | |
| | | | | | | | |
| Item | Form 20-F caption | Location in this document |
| | | |
| | |
| | C Material contracts | |
| | | |
| | | |
| | | |
| | | |
| | | |
| | | |
| | | |
| | | |
| | | |
| | | |
| | D Exchange controls | |
| | | |
| | | |
| | E Taxation | |
| | | |
| | F Dividends and paying agents | Not applicable |
| | | |
| | G Statements by experts | Not applicable |
| | | |
| | H Documents on display | |
| | | |
| | I Subsidiary information | Not applicable |
| | | |
| | J Annual Report to Security Holders | Not applicable |
| | | |
| 11 | Quantitative and qualitative disclosure about market risk | |
| | A Quantitative information about market risk | |
| | | |
| | | |
| | B Qualitative information about market risk | |
| | | |
| | | |
| | C Interim periods | Not applicable |
| | | |
| | D Safe harbor | |
| | | |
| | | |
| | E Smaller reporting companies | Not applicable |
| | | |
| 12 | Description of securities other than equity securities | |
| | A Debt securities | Not applicable |
| | | |
| | B Warrant and rights | Not applicable |
| | | |
| | C Other securities | Not applicable |
| | | |
| | | | | | | | |
| Item | Form 20-F caption | Location in this document |
| | D American depository shares | |
| | |
| Part 2 | | |
| 13 | Defaults, dividend arrearages and delinquencies | Not applicable |
| 14 | Material modifications to the rights of security holders and use of proceeds | Not applicable |
| 15 | Controls and procedures | |
| | A Disclosure controls and procedures | |
| | | |
| | B Management's Annual Report on internal control over financial reporting | |
| | | |
| | | |
| | C Attestation report of the registered public accounting firm | |
| | | |
| | | |
| | D Changes in internal control over financial reporting | |
| | | |
| 16A | Audit Committee Financial Expert | |
| 16B | Code of Ethics | |
| | | |
| 16C | Principal Accountant Fees and Services | |
| | | |
| | | |
| 16D | Exemptions from the Listing Standards for Audit Committees | Not applicable |
| 16E | Purchases of Equity Securities by the Issuer and Affiliated Purchasers | |
| | | |
| 16F | Change in Registrant’s Certifying Accountant | |
| | |
| 16G | Corporate Governance | |
| 16H | Mine Safety Disclosure | Not applicable |
| 16I | Disclosure regarding Foreign Jurisdictions that prevent inspections | Not applicable |
| 16J | Insider Trading Policies | |
| | |
| 16K | Cybersecurity | |
| Part 3 | | |
| 17 | Financial statements | Not applicable |
| 18 | Financial statements | |
| 19 | Exhibits | |
4 Our Management
4.1 Message from the CEO
Dear Stakeholder,
Around the world, patients are facing longer waiting times, and we continue to see rising costs and staff shortages, among other issues. I have seen the immense pressure healthcare professionals are under and feel a deep sense of responsibility to help address the challenges and to support them to care for more patients in a better way. In parallel, we see that people everywhere want to be empowered to take care of their own health and well-being.
At Philips, we want to contribute to healthcare professionals feeling supported and energized, instead of overloaded and overworked, and to help people lead healthier lives. As an innovation company, we are committed to improving healthcare and driving impact with care for patients, people and the planet through our deep technological insight and our meaningful innovations.
Strong partnerships and advances in AI*-enabled innovation are helping to drive real change – freeing up space and time for healthcare professionals to focus on their patients and empowering people to take care of their health and well-being. With our next-generation BlueSeal helium-free MRI system, for example, we are helping to expand access to quality imaging and improve care delivery across multiple settings, with SmartSpeed AI powering up to three-times faster scanning and up to 65% higher resolution images. In the home, our AI-powered Philips Avent Premium Connected Baby Monitor gives parents peace of mind by allowing them to keep a closer eye on their children.
We want to help deliver better care for more people across the world. But we know that some people are facing barriers to better health; in parts of the world the devastating consequences of ongoing war and conflict are impacting millions of lives every day. It makes me even more determined to do what we can so people everywhere can access the care they need.
Making progress on our three-year plan
In 2024, we made solid progress on our 2023-2025 operating plan. We believe we are on the right path, executing our focused strategy to improve people’s health and well-being through meaningful innovation, with patient safety and quality as our number one priority.
Reflecting our new operating model, Businesses are in the lead, driving quality and making impact through innovation, design and sustainability. We remain committed to scaling our AI-enabled innovations through excellence in execution and delivery, focusing on fewer, better-resourced initiatives. While we have made good progress, we have more to do.
Our results were negatively impacted in 2024 by deteriorated demand in China, due to subdued consumer confidence, leading to more cautious spending behavior. In addition, ongoing industry-wide anti-corruption initiatives have contributed to extended hospital procurement cycles. Given these factors, we adjusted our growth expectations for the year. Managing developments in China will remain a priority in 2025. Despite global uncertainties and slower growth, we delivered strong profitability improvement and cash flow, and further strengthened our balance sheet. We also made important progress on resolving the Philips Respironics recall. As an indication of the progress we are making, we returned to comparable order intake growth. And, some of our largest investors further expanded their investment in Philips, showing confidence in our future.
Focusing on our priorities
Our focus on patient safety is at the center of strengthening our fundamentals and fostering a culture that upholds quality. In our latest engagement survey, colleagues shared that they feel empowered to speak up and take action to support our commitment to patient safety and quality. While we acknowledge this progress, we remain diligent in continuing this work.
Looking at other areas of progress in 2024, Philips Respironics signed a consent decree, which, coupled with other significant milestones, such as the economic loss settlement and the settlement of personal injury and medical monitoring claims in the US, provided clarity on the way forward. We remain committed to rebuilding our position in Sleep & Respiratory Care while resolving the effects of the recall. We continue to work closely with the US Food and Drug Administration (FDA) and other regulators around the world.
We are concentrating on accelerating momentum, building on our industry-leading innovations, and continuing to improve execution. In our supply chain, we have made significant progress – addressing the components shortage and related risks, and reducing our lead times, in support of our drive to increase customer satisfaction. In addition, we are building in greater agility in our supply chain so we can respond, for example, to the potential impact of geopolitical tension or tariffs. We are also further simplifying our catalogs and products, and regionalizing to win locally.
In making sure we become a leaner, more agile and simpler organization – and therefore more competitive and resilient – we have made important strides with our move to an end-to-end Business-led model. We reduced approximately 10,000 roles from 2022 through the end of 2024. We focused on enhancing our team and culture with deep medtech experience and new leadership. This included the strengthening of our experienced and diverse Executive Committee by welcoming, among others, our new Chief Financial Officer, Charlotte Hanneman, and bringing in other proven leaders across Businesses, Regions and Functions.
*Artificial intelligence, defined in 10.8 Definitions and abbreviations
We are reinvigorating our culture of impact with care. We have shifted back to the workplace following a couple of years when some colleagues worked partly from home, with teams coming back together to build a stronger social fabric and support our thriving innovation culture. We believe we drive greater impact when we work together. In 2024, engagement across the company, as measured in our People Engagement Survey, increased 5 percentage points.
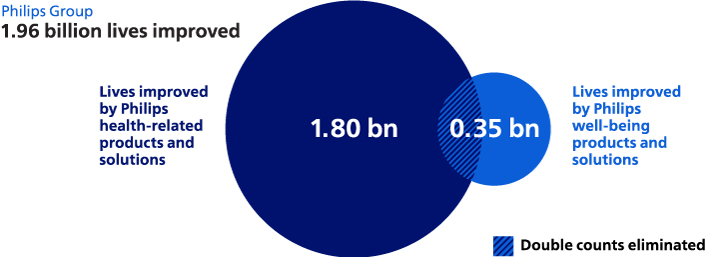
Our plans build on our strong heritage in social and environmental responsibility. In 2024, we improved the lives of 1.96 billion people and contributed to more sustainable healthcare, while ensuring a more sustainable consumer experience. This included, among other things, partnering with hospitals to support them with their own sustainability plans and expanding access to care in and outside the hospital. We have an enhanced and fully integrated approach to doing business responsibly and sustainably, for Philips and for our customers. And this is recognized. For example, our supplier sustainability approach featured in Fortune’s 2024 ‘Change the World’ rankings. In addition, Forbes recognized Philips as one of the world’s best employers. Our ESG commitments help drive our business results and our global impact, and create long-term value for our stakeholders.
Looking ahead
We remain focused on successfully executing our three-year plan and are determined to further build on our industry-leading innovations, improve our fundamentals, simplify how we work, and ensure we are more competitive and more agile. We continue to deepen our culture of impact with care with patient safety, quality and integrity at the heart.
We want to win and deliver better care for more people in a fast-moving, competitive world, where care provision is under pressure. By doing so, we aim to deliver profitable growth, expand our margins, and fulfill our cash and ESG commitments.
I would like to thank all our stakeholders for their ongoing trust, support, collaboration, and confidence. I also want to share special thanks to our employees, who show their passion and commitment every day, and to their families.
Reflecting the progress we have made in executing our plan, reducing risk and strengthening our balance sheet, along with the importance we attach to dividend stability, we propose to maintain the dividend at EUR 0.85 per share, to be in shares or cash at the option of the shareholder.
As I look ahead, I am excited about the opportunity to deliver better care for more people, working with our many partners for the benefit of patients, customers and consumers.
Roy Jakobs
Chief Executive Officer
4.2 Members of the Board of Management and Executive Committee
Royal Philips has a two-tier board structure consisting of a Board of Management and a Supervisory Board, each of which is accountable to the General Meeting of Shareholders for the fulfillment of its respective duties. The Board of Management is entrusted with the management of the company. The other members of the Executive Committee have been appointed to support the Board of Management in the fulfillment of its managerial duties. Please also refer to Board of Management and Executive Committee within the company's Corporate governance report. Members of the Board of Management
Roy Jakobs
Born 1974, Dutch and German
Chief Executive Officer (CEO)
Chairman of the Board of Management and the Executive Committee (since October 2022)
Roy joined Philips in 2010 and has held various global leadership positions across the company, starting as Chief Marketing & Strategy Officer for Philips Lighting. In 2012, he became Market Leader for Philips Middle East & Turkey, leading the Healthcare, Consumer, and Lighting businesses out of Dubai. Subsequently, he became global Business Leader of Domestic Appliances, based in Shanghai, in 2015. In 2018, Roy joined the Executive Committee as Chief Business Leader of the Personal Health businesses and in early 2020 he started as Chief Business Leader of Connected Care. As Chief Executive Officer and Chairman of the Board of Management and the Executive Committee, he also holds direct responsibility for Patient Safety and Quality, Medical Office, Internal Audit and Brand & Communications. Prior to his career at Philips, he held various management positions at Royal Dutch Shell and Reed Elsevier.
Charlotte Hanneman
Born 1978, Dutch
Executive Vice President
Member of the Board of Management (since October 2024)
Chief Financial Officer
Charlotte joined Philips in 2024 and is responsible for Finance, including Investor Relations and M&A, as well as Real Estate and Security. Before joining Philips, Charlotte worked as Controller and Head of Financial Planning & Analysis at global medical technology company Stryker. Prior to this, Charlotte held international finance leadership roles at several multinational healthcare companies.
Marnix van Ginneken
Born 1973, Dutch
Executive Vice President
Member of the Board of Management (since November 2017)
Chief ESG & Legal Officer
Marnix joined Philips in 2007 and became Chief Legal Officer of Royal Philips and member of the Executive Committee in 2014. In 2017 he was appointed to the Board of Management. He is responsible for driving ESG efforts across the company, including Group Sustainability. He is also responsible for Legal, Intellectual Property & Standards and Government and Public Affairs. Since January 1, 2024, he is Chairman of the Board of the Philips Foundation. In 2011, he was appointed Professor of International Corporate Governance at the Erasmus School of Law in Rotterdam. Before joining Philips, Marnix worked for Akzo Nobel and as an attorney in a private practice.
Other members of the Executive Committee
Willem Appelo
Born 1964, Dutch
Executive Vice President
Chief Operations Officer
Wim joined Philips in 2022, bringing over 30 years of experience in technology and the medical device technology industry in finance and supply chain management.
Steve C de Baca
Born 1968, American
Executive Vice President
Chief Patient Safety and Quality Officer
Steve joined Philips in 2023 and brings over 30 years of quality and regulatory affairs experience in the medical technology industry.
Jeff DiLullo
Born 1969, American
Executive Vice President
Chief Region Leader of Philips North America
Jeff joined Philips in 2019, drawing on more than 30 years of leadership experience in the US Army and the information technology industry.
Deeptha Khanna
Born 1976, Singaporean
Executive Vice President
Chief Business Leader Personal Health
Deeptha joined Philips in 2020. She has over 25 years of leadership experience working across Europe, US and Asia, on major global brands and across personal care and the consumer health industry.
Ling Liu
Born 1974, Chinese
Executive Vice President
Chief Region Leader of Philips Greater China
Ling joined Philips in 1998 and has more than 26 years’ experience in leadership roles in Greater China, the Netherlands and North America.
Bert van Meurs
Born 1961, Dutch
Executive Vice President
Chief Business Leader responsible for Diagnosis & Treatment
Bert joined Philips in 1985 and has more than 39 years of experience in the medical imaging and healthcare business.
Edwin Paalvast
Born 1963, Dutch
Executive Vice President
Chief of International Region
Edwin joined Philips in 2020 and brings more than 30 years of leadership experience in the technology industry.
Shez Partovi
Born 1967, Canadian
Executive Vice President
Chief Innovation & Strategy Officer
Shez joined Philips in 2021 and has more than 30 years of experience leading large health systems, cloud transformation, and artificial intelligence and machine learning initiatives in the healthcare, life sciences and genomics industries.
Heidi Sichien
Born 1974, Belgian
Executive Vice President
Chief People Officer
Heidi joined Philips in 2006 and brings over 18 years of experience in leadership roles in HR across many parts of the company.
Julia Strandberg
Born 1974, American
Executive Vice President
Chief Business Leader Connected Care
Julia joined Philips in 2023 and has 20 years of leadership experience in the medical technology industry.
This page reflects the composition of the Executive Committee as per December 31, 2024. For a current overview of the Executive Committee members, see also https://www.philips.com/a-w/about/executive-committee.html
5 Strategy
5.1 Strategic focus
Today, most healthcare systems are struggling to keep up with the ever-rising need for, and cost of, healthcare, while systemic staff shortages and financial resource constraints increase the pressure. Climate change is impacting both environmental and human health, compounding the stress on our healthcare systems and influencing consumer behavior. At the same time, in both the hospital and the home, emerging technologies and artificial intelligence are affecting our lives like never before.
At Philips, our purpose is to improve people’s health and well-being through meaningful innovation. As such, we see huge opportunities to make a difference through innovation, design, and sustainability – partnering with our healthcare customers to increase productivity and deliver better care for more people through our innovation platforms of monitoring, imaging, interventional and enterprise informatics. And, empowering more people to take care of their health and well-being through our personal health propositions.
Our plan: create value with sustainable impact
As a health technology company, Philips is committed to driving progressive value creation through a strategy of focused growth, scalable patient- and people-centric innovation, and reliable execution supported by our culture of impact with care.
Philips has significant strengths to build on. We have a portfolio of innovations in hardware, software, AI and services, supporting care in the hospital and in the home. We are the preferred strategic and innovation partner for many customers (including governmental entities) across the globe. And our strong heritage in environmental sustainability and social impact helps us make a difference globally and create long-term value for our stakeholders.
A strategy of focused growth
We operate in growing market segments, where attractive margins provide a foundation for sustainable value creation. To deliver on our strategy, we make clear business choices. We are concentrating our resources on 70% of our businesses where we have strong positions and believe we can accelerate growth and expand margins more quickly – Image Guided Therapy, Monitoring, Ultrasound, and Personal Health. In doing so, we focus on supporting clinical workflows in areas where we have domain leadership, such as cardiology, and that build on our deep strength in the intensive care unit and cath lab.
The focus for the remaining 30% of the businesses, such as Diagnostic Imaging and Enterprise Informatics, is achieving margin expansion by increasing productivity and scale, and by delivering operational excellence. Additionally, we aim to rebuild our position in Sleep & Respiratory Care after the progress made to resolve the effects of the Respironics recall.
Scalable patient- and people-centric innovation
At Philips, we’ve been innovating to improve lives for over 130 years. People’s needs are at the very heart of how we innovate and design for sustainable impact with a ‘safety and quality first’ mindset.
Innovation is our strength and will continue to be our core differentiator. Recent challenges in the healthcare industry have accelerated the adoption of technology. We are embracing these trends and have shifted our innovation closer to our customers. This starts with asking: What do people – in our case, patients and clinicians, nurses and technicians, consumers – really need? And how can we best support healthcare professionals with their workflow?
Emerging AI innovations have the potential to address pain points across operational and clinical workflows in healthcare. Philips has AI embedded across our portfolio, and we see significant opportunities to further leverage this technology to deliver more and better care.
In our Businesses, we focus our efforts and resources on fewer projects offering greater impact on patient outcomes and care providers’ clinical, operational and sustainability challenges. We take a long-term view, seeking to ensure the customer has the best experience with Philips throughout time. We do this by balancing new, breakthrough innovations and continuous optimized life cycle management, through upgrades and services, of Philips products and systems already deployed in care settings. With Research & Development mostly led by the Businesses, we bring together expertise across the product life cycle, from research through serviceability, with the aim of ensuring our innovations scale to drive maximum impact for our customers and consumers – delivering a superior experience and value, with minimum environmental impact.
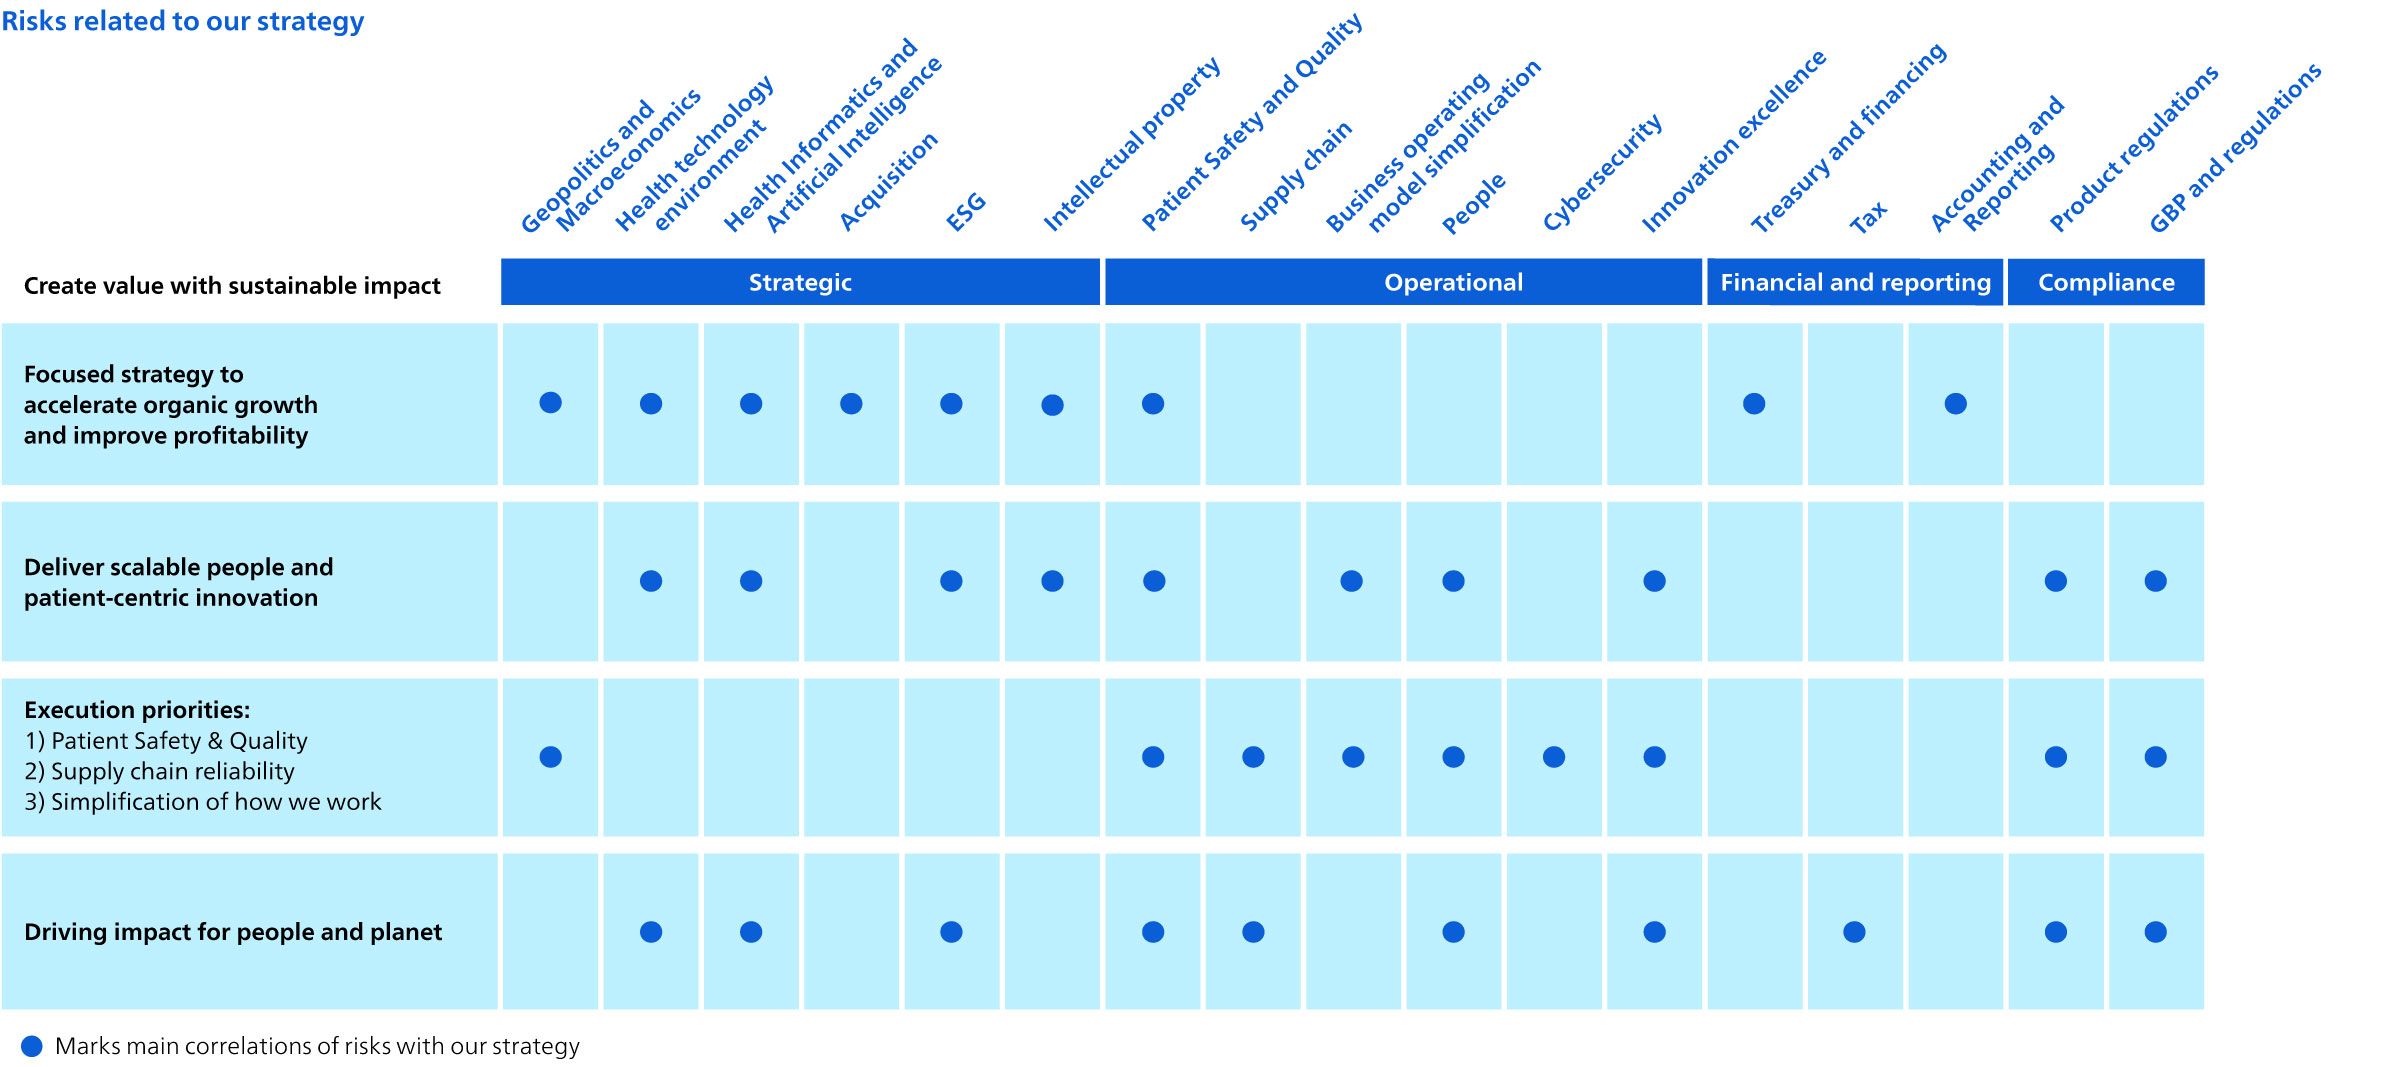
Execution priorities
Enabled by a culture of patient- and people-centricity, accountability and impact, supported by strong health technology capabilities, we see effective execution as the key value driver of our plan. We are focusing on:
•patient safety and quality – our highest priority
•end-to-end supply chain resilience
•a simplified operating model with an agile way of working
First, patient safety, quality and integrity is at the heart of our culture of impact with care. All employees have dedicated patient safety and quality objectives, and the Patient Safety and Quality organization champions stronger processes and more effective early warning systems in the
Businesses. The topic has high visibility at the Executive Committee level with the leadership of the Chief Patient Safety & Quality Officer and Chief Medical Officer. We invest in systems, capabilities and training to facilitate identification of potential patient safety or quality issues. We listen to patients through our advisory boards. And we are taking the learnings from the Respironics recall to improve our ability to correctly assess patient safety and provide quality of the highest standard across Philips and in delivery to patients, customers and consumers.
Second, alignment of procurement and supply chain to our Businesses has enabled us to improve the reliability of the delivery of our products, services and orders. A more regionalized supply chain ecosystem combined with dual sourcing can work effectively even when volatile conditions emerge in different parts of the world. We are paring down our product portfolio and making our platforms fit for the future, which includes pruning a long tail of smaller product lines and older generations of our products. We also have a dedicated team redesigning products and components to increase our resilience.
Finally, we are in the second year of implementing our simplified operating model to enable us to better serve patients, customers and consumers, as well as ensuring that our cost of organization remains competitive in an inflationary and cost-driven environment, and that we are more agile in responding to changes in the market. Prime accountability has been assigned to the Businesses, supported by lean Functions and Regions following tailored models, all guided by fewer KPIs and more focused targets. We will continue to simplify our operating model to adapt to the dynamic environment.
Driving impact for people and planet
We have operationalized our purpose by adopting a fully integrated approach to doing business responsibly and sustainably. We partner with stakeholders to drive environmental, social and governance (ESG) priorities and aim to make a global impact while focusing on three UN Sustainable Development Goals (SDGs):
•SDG 3 - Ensure healthy lives and promote well-being for all at all ages
•SDG 12 - Ensure sustainable consumption and production patterns
•SDG 13 - Take urgent action to combat climate change and its impacts
Acting responsibly toward the planet and society is part of our DNA. We believe that this is the best way for us to meet our business goals and create superior, long-term value for Philips’ stakeholders. Our 2021-2025 ESG program includes key ESG commitments that guide execution of the company strategy, setting challenging environmental and social targets, as well as the highest standards of governance. As an example, we aim to positively impact 2.5 billion lives per year by 2030, including 400 million in underserved communities.
Please refer to Environmental, Social and Governance for an overview of all our key ESG commitments, and for information on how we act and perform in the environmental and social dimensions and on the main elements of our governance framework. Our approach to risk management
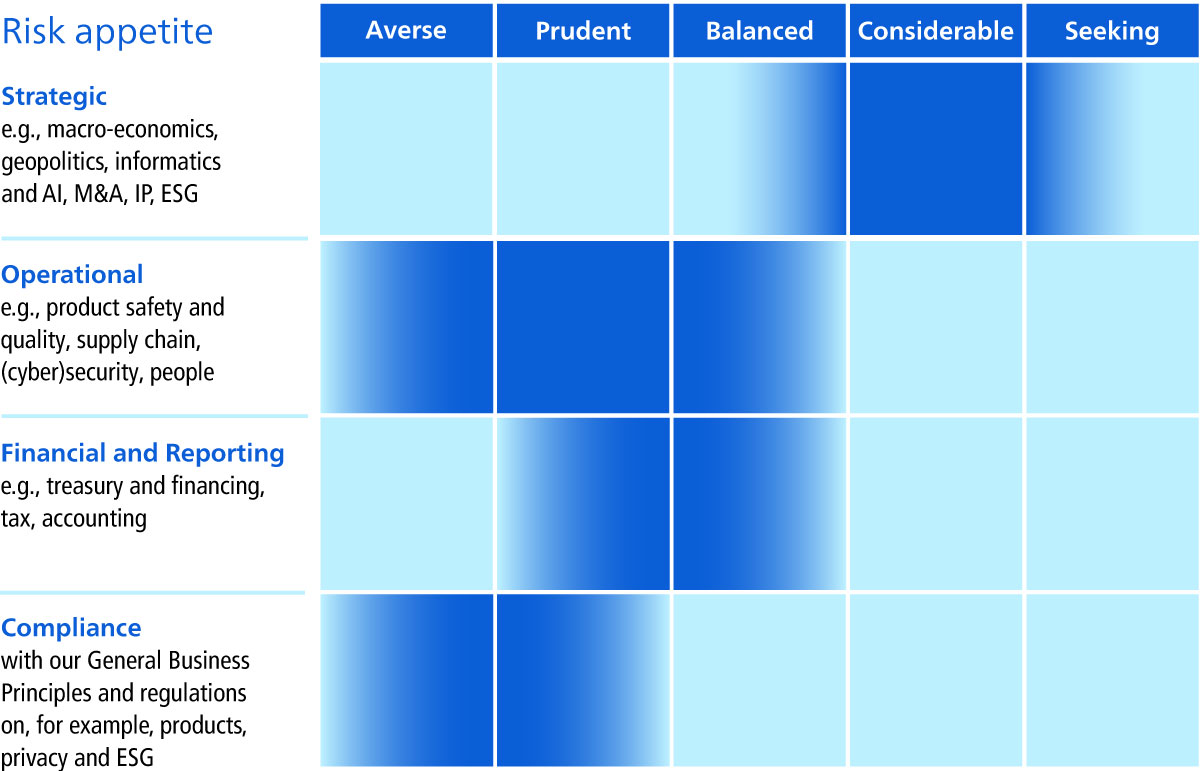
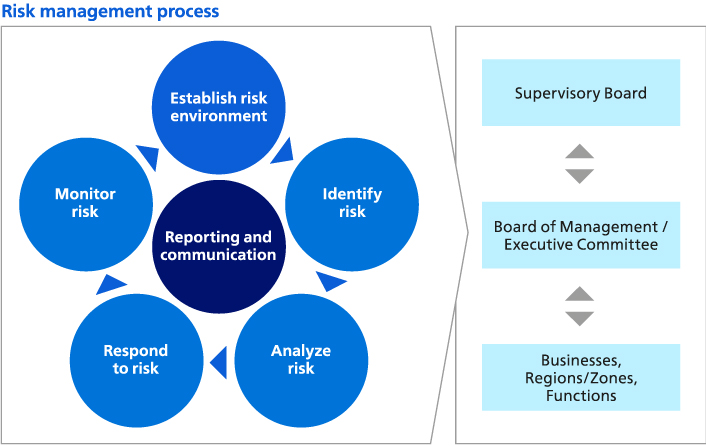
We approach risk management as a value-creating activity that is integral to innovation and entrepreneurship. It allows us to analyze the relationship between strategy and risk profile, to identify the specific risks that we face in executing our strategic plan to create value with sustainable impact, to analyze these risks, to set our risk appetite, and to implement balanced risk responses and monitor their effectiveness as an integral part of the Philips business planning and performance review cycle.
Refer to Risk management and internal control for more information, including our risk appetite and our risk management governance and process, and to Risk factors for a description of the material risk factors we have identified.
Delivering on our plan
With our global reach, market leadership positions, deep clinical and technological insights, and patient- and people-focused innovation, we believe Philips is well-positioned to help deliver real change across healthcare and personal health. Fueled by our purpose and supported by our culture of impact with care, we are empowered – and hold ourselves accountable – to create value with sustainable impact.
5.2 Business
5.2.1 Our Business structure
Koninklijke Philips N.V. (Royal Philips) is the parent company of the Philips Group. Philips' operating model grants end-to-end Businesses with single accountability in order to make the company more agile in its drive to create value with sustainable impact. The segments Diagnosis & Treatment, Connected Care and Personal Health are each responsible for the management of their business activity worldwide, and are made up of the six Businesses shown below. Additionally, Royal Philips identifies the segment Other.
| | | | | | | | | | | | | | | | | | | | | | | | | | | | | | |
| | | | | | | | | | |
| | | Philips Group | |
| Segments | | | Diagnosis &
Treatment | | Connected Care | | Personal Health | | Other | |
| | | | | | | | | | |
| | | | | | | | | | |
| Businesses | | | •Precision Diagnosis •Image Guided Therapy | | •Monitoring •Enterprise Informatics •Sleep & Respiratory Care | | •Personal Health | | | |
Philips Group
Total sales by reportable segment
| | | | | |
| 2024 |
| Diagnosis & Treatment | 49 | % |
| Connected Care | 29 | % |
| Personal Health | 19 | % |
| Other | 3 | % |
Diagnosis & Treatment segment
Our Diagnosis & Treatment Businesses create value through their portfolio of innovative AI-enabled solutions that support precision diagnosis and minimally invasive treatment in therapeutic areas such as cardiology, peripheral vascular, neurology, surgery, and oncology. With these solutions, we enable our customers to enhance care delivery, optimize workflow to improve productivity, and work toward their sustainability goals.
Serving diagnostic imaging markets globally, our strategy is to focus on more precise and predictive diagnoses, integrating our intelligent imaging systems with our industry-leading informatics solutions to optimize workflow efficiency, improve productivity and maximize lifetime value. We do this through smart diagnostic systems, connected workflow solutions, and integrated AI-supported diagnostics and pathway informatics that enable clinicians to select tailored care pathways with predictable outcomes for every patient, both inside and outside the hospital.
We also provide integrated solutions that combine imaging systems and advanced clinical software, as well as diagnostic and therapeutic devices and services to optimize minimally invasive interventional procedures with more effective treatment, better outcomes and higher productivity. Building upon our leading-edge Azurion platform, we address a range of interventional clinical segments with high procedural growth rates, such as coronary artery disease, peripheral artery and venous disease, electrophysiology, structural heart disease, interventional neuroradiology, and interventional oncology. We are driving further innovation to treat new and more complex patient pools, using clinical and economic evidence to foster the adoption of these solutions, and that translates into guidelines and reimbursement.
In 2024, we took action to address key optimization and expansion challenges faced by our Diagnosis & Treatment Business Units. In Diagnostic Imaging, with renewed leadership, we embarked on a clear strategy with a focus on those customers who are looking to optimize care delivery in the mid- and high-end segments. Significant progress was made in the execution of our plans to drive margin expansion in line with the company's strategy. We also streamlined and focused our portfolio with one cloud-enabled hardware stack.
In Image Guided Therapy (IGT), we continued to take actions to deliver on our ambition to accelerate growth and expand margins more quickly. The IGT Business Units focused on creating customer preference for our integrated interventional platform, with Systems, Devices and Software seamlessly joined in one simple workflow to innovate the procedure.
The Diagnosis & Treatment segment consists of the following Businesses.
•Precision Diagnosis – This Business offers a range of diagnostic imaging products and solutions to address some of providers’ biggest challenges, from staff shortages and burnout to workflow, and ultimately delivering better care for their patients.
•Diagnostic X-ray Business Unit – X-ray and fluoroscopy systems with associated software to optimize diagnostic imaging quality and improve efficiency and productivity for the hospital.
•Magnetic Resonance Imaging (MRI) Business Unit – comprehensive BlueSeal portfolio with helium-free-for-life operations, bundled with AI-enabled software to streamline workflows, optimize diagnostic quality, and improve patient experience.
•Computed Tomography (CT) Business Unit – advanced and efficient systems and software, including detector-based Spectral CT and systems equipped with advanced AI capabilities, for diagnosis, interventional procedures and screening, to help expand the standard of care.
•Ultrasound Business Unit – imaging solutions focused on supporting diagnosis, treatment planning and guidance for cardiac, general imaging, obstetrics/gynecology, and point-of-care applications enabled by proprietary AI software, advanced imaging technology and tele-ultrasound to efficiently and confidently deliver diagnostic images for even the most complex conditions.
•Image Guided Therapy – This Business includes a market-leading portfolio of integrated interventional imaging systems, smart devices, and disease-specific software as well as services and consulting.
•Image Guided Therapy Systems Business Unit – integrated interventional X-ray systems (fixed and mobile surgery) and software solutions, supported by AI, to perform a wide range of routine and complex interventional procedures, easily and confidently.
•Image Guided Therapy Devices Business Unit – interventional specialty devices and software to aid in the diagnosis, navigation, treatment and confirmation in minimally invasive interventional coronary, peripheral vascular and hearth rhythm management procedures. Complemented by seamless integration with Image Guided Therapy Systems.
Diagnosis & Treatment
Total sales by Business
| | | | | |
| 2024 |
Precision Diagnosis1 | 59 | % |
| Image Guided Therapy | 41 | % |
1of which Diagnostic Imaging 40%, Ultrasound 19%
Revenue is predominantly earned through the sale of products, leasing, customer services fees, recurring per-procedure fees for disposable devices, and software license fees. For certain offerings, per-study fees or outcome-based fees are earned over the contract term.
Sales channels are a mix of direct sales, especially in the larger markets, third-party distributors and online sales. This varies by product, market and price segment. Our sales organizations have an intimate knowledge of technologies and clinical applications, as well as the solutions necessary to meet the needs of our customers.
Sales in the Diagnosis & Treatment Businesses are generally higher in the second half of the year, largely due to the timing of customer spending patterns.
At year-end 2024, Diagnosis & Treatment had 24,544 employees worldwide.
2024 highlights
Precision Diagnosis
•Philips introduced helium-free operations in MRI, and since its launch in 2018, we have installed more than 1,500 BlueSeal systems globally in wide-ranging settings, including the world’s first helium-free mobile MRI units. Our next-generation BlueSeal with Smart Reading, launched at Radiological Society of North America annual meeting in 2024, boosts performance, saves time, and supports better patient outcomes, all while caring for the planet. With AI applications seamlessly integrated into our latest 1.5T BlueSeal scanner, we have applied AI to every aspect of the MRI workflow. BlueSeal magnets are lighter than others, allowing them to be installed in more places – or even transported in mobile units – creating the potential to expand quality access to MRI exams for patients in a more sustainable way.
•The next-generation AI-enabled cardiovascular ultrasound platform helps speed up cardiac ultrasound analysis with proven AI technology and reduces the burden on echocardiography labs, integrated into EPIQ CVx and Affiniti CVx ultrasound systems. With the latest transesophageal echocardiography (TEE) transducer, it is designed to serve more patients with improved overall comfort, with FDA 510(k) clearance. Philips has developed the smaller X11- 4t Mini 3D TEE transducer to serve more patients with this valuable imaging tool, helping physicians serve a wider range of patients, from small children to fragile adults.
•In General Imaging Ultrasound we launched the Elevate Release featuring the EPIQ Elite Elevate and Affiniti Elevate. More than 100 optimized pre-sets across multiple clinical applications deliver greater precision imaging and intuitive workflows to help boost clinical confidence. These innovative features also help to deliver an improved user and patient experience by automating image brightness and uniformity, and reducing button pushes by up to 54% with Next Gen Auto Scan.
Philips launched a series of leading AI-driven innovations across the diagnostic imaging portfolio.
•MR SmartSpeed is AI-based imaging technology that can increase imaging speed by up to a factor of three while providing up to 65% greater resolution to deliver outstanding image quality. It is compatible with 97% of clinical protocols to address the needs of a broad range of patients in various conditions.
•AI-powered quantitative reporting software from our partner icometrix was seamlessly integrated into the latest BlueSeal MR scanners through new Smart Reading capability, providing consistent and more accurate diagnoses.
•Fully AI-enabled CT 5300 with Precise Image reconstruction software results in reduced reading time and 80% lower radiation while delivering better image quality. Philips collaborates with Annalise.ai to evaluate streamlining workflows to prioritize time-sensitive cases.
•Powered with Smart Workflow, AI-enabled productivity features of DXR 7300 C reduce X-ray retakes with the Eleva Tube Head and enhance confident diagnosis with Philips UNIQUE 2 image processing.
Image Guided Therapy
•Major enhancements to Azurion, our Image Guided Therapy System, were designed to speed up and improve minimally invasive diagnosis and treatment of neurovascular patients. The new Azurion neuro biplane system features enhanced 2D and 3D imaging and X-ray detector positioning flexibility, building on the system’s capabilities to streamline neurovascular procedures to help care teams make the right decisions faster, treat more patients, and achieve better outcomes. It has been widely adopted at major healthcare institutions around the world, such as the Miami Cardiac & Vascular Institute in the United States (US), Osaka Police Hospital in Japan, and Leiden University Medical Center in the Netherlands.
•Our real-time 3D Intracardiac Echocardiography (ICE) Catheter – VeriSight Pro – is designed to give physicians more confidence and control during a variety of minimally invasive procedures in structural heart disease and electrophysiology. In 2024 we launched the first rollout of this technology outside the US, in Hong Kong, and it is expected to be an innovation to watch.
•Intravascular ultrasound (IVUS) and instantaneous wave-free ratio (iFR) technologies received top-level recognition in new European Society of Cardiology guidelines, reinforcing their role in optimizing coronary interventions and patient outcomes. The robust clinical evidence supporting the use of these technologies shows improved patient outcomes through numerous large-scale randomized trials like DEFINE FLAIR and iFR SWEDEHEART.
•Philips secured FDA approval for its new LumiGuide Navigation Wire, which uses fiber optic technology to reduce radiation for both patients and physicians during minimally invasive surgery. The company’s breakthrough Fiber Optic RealShape (FORS) technology marked the milestone of more than 1,000 patients treated using FORS technology since the first clinical use in 2020.
•The Zenition 90 Motorized, designed to deliver state-of-the-art image quality for complex vascular needs and clinical procedures, was launched. It has intuitive motorization for greater control and high power, as well as automated workflows for greater clinical efficiency.
Diagnosis & Treatment partnerships
Philips continues to work with health systems to adopt solutions that can improve workflow and ease the technology burden on staff, as well as improve patients’ experiences and outcomes and advance sustainability.
•Carilion Clinic’s Cardiovascular Institute in the US committed to adopt 11 specialized Philips interventional suites, allowing physicians to treat patients with complex conditions closer to where they live. Equipped with these new Philips solutions, the highly skilled medical staff will be able to continue handling complex cases or procedures that may not be available at surrounding healthcare facilities.
•A 2024 analysis confirmed that the collaboration with Champalimaud Foundation (Portugal) achieved a 24% emissions reduction in its first year. This is equivalent to 40 tonnes CO2e, a strong start to a strategic partnership aimed at halving the carbon footprint of Champalimaud’s diagnostic and interventional imaging equipment use by 2028.
•For the Japanese market, where cerebrovascular diseases are on the rise and place a heavy social burden on society, Philips has launched SmartCT 3.0, an application powered by AI and specialized for endovascular treatment with high image quality. Additionally, the first MR 7700 with clinical 3.0T scanner has been installed at Hamamatsu University Hospital. With high image quality and reduced scan time, it provides high accuracy, power, and endurance to support confident diagnosis for every patient.
Connected Care segment
With technology constantly advancing and becoming increasingly pervasive in healthcare, the Connected Care Businesses aim to connect and elevate care for all. Philips connects patients and caregivers across care settings, delivering clinical, operational and therapeutic solutions that help our customers deliver better health outcomes, improve the patient and staff experience, and lower the cost of care. In 2024, the global economic situation continued to put additional pressure on customer budgets, worsened staff shortages, and increased the need for solutions that enable more effective, sustainable and convenient care in hospital, clinics and the home – especially those enabled by strong informatics and AI.
With clinical depth and discovery, Philips Connected Care technologies help to cultivate a more accurate and complete view of the patient that drives better care for more people. The combination of advanced technological solutions and a co-creation approach allows Philips to be the clinical technology partner to its customers in their digital transformation, across the enterprise and at the level of the individual clinician, nurse and patient. As a clinical technology partner, we help our customers to unlock actionable insights from pools of medical imaging and patient monitoring data, through the use of advanced AI, to improve outcomes and drive productivity.
Philips’ open, interoperable platforms aggregate and leverage information from clinical devices, as well as patient and historical data, to support care providers in patient engagement, diagnostics, and patient monitoring in diverse settings.
The Connected Care segment consists of the following Businesses.
Monitoring – This Business spans in-hospital, ambulatory and home-based monitoring and diagnosis solutions and services supporting the patient journey, as well as continuous monitoring and workflow solutions fueled by advanced interoperability and patient insights.
•Hospital Patient Monitoring Business Unit – delivers acute patient management solutions to improve clinical and patient outcomes and achieve operational and economic efficiencies. Leveraging a strong presence in the operating theater and intensive care unit, Hospital Patient Monitoring offers vendor-neutral solutions to enhance customers’ experiences and improve patient outcomes with seamless patient data – generated from admission to discharge – that is turned into clinical insights, actionable at the right time and specific to targeted care settings.
•Ambulatory Monitoring & Diagnostics Business Unit – provides patient care management in ambulatory and home care settings through a suite of cardiac diagnostic and monitoring solutions to identify heart rhythm disorders, plus other disease states, supported by AI algorithms that orchestrate workflows and services across care settings to provide care virtually anywhere.
•Emergency Care Business Unit – plays a critical role in connected acute care management, both inside and outside the hospital, including cardiac resuscitation (e.g., automated external defibrillators) and emergency care solutions (devices, services, and digital/data solutions) for professional and consumer applications. On January 28, 2025, Philips announced an agreement to sell the Emergency Care Business Unit.
Enterprise Informatics – By combining our informatics propositions into one end-to-end Business, we can scale our software business, providing vendor-agnostic, integrated workflow solutions that convert data from our imaging and monitoring systems into clinical and operational insights.
•Radiology Informatics Business Unit – enables enterprise imaging across sites, specialties and technologies to simplify medical image management, facilitate effective collaboration and enhance patient care.
•Clinical Integration & Insights Business Unit – offers solutions that are seamlessly integrated into the customer workflow. These solutions enable vendor-neutral data capture from more than 1,000 device models and make sense of disparate data, providing insights at scale across the care pathway.
•Clinical Informatics Business Unit – delivers solutions for productivity, diagnostic confidence, and clinical decision support in the domains of digital pathology, advanced visualization and disease management solutions, specifically in radiology, cardiology, pathology and urology.
•Patient Care Informatics – aims to extend the reach of virtual care, support evidence-based practices, and provide actionable insights for continuous improvement, ensuring better health outcomes for patients globally. In 2024, we brought together EMR & Care Management and Cardiovascular Informatics to reflect shifts in the industry to drive not only data, but also to manage the entire patient journey. This combined portfolio consists of cardiovascular care, virtual care, electronic medical records, and acute care solutions.
Sleep & Respiratory Care – Working closely with clinical partners and Durable/Home Medical Equipment providers, Philips Respironics provides sleep and respiratory solutions to customers, clinicians and patients. This extends from ambulatory patient care solutions for obstructive sleep apnea, to solutions encompassing diagnostics, people-centric therapy, cloud-based connected propositions and care management services for patients with Chronic Obstructive Pulmonary Disease and respiratory conditions. Hospital Respiratory Care provides invasive and non-invasive ventilators for acute and sub-acute hospital environments; Home Respiratory Care supports chronic care management in the home.
Final agreement was reached on the terms of the Philips Respironics consent decree with the US Department of Justice and the US Food and Drug Administration (FDA), primarily focusing on Philips Respironics’ business operations in the US, including its manufacturing facilities in Murrysville and New Kensington, its service center in Mount Pleasant and its Sleep & Respiratory Care headquarters in the Greater Pittsburgh, Pennsylvania region.
The consent decree provides a clear path forward for the Sleep & Respiratory Care Business with defined actions, milestones and deliverables to demonstrate compliance with regulatory requirements and to restore the Business. As part of the agreement, the Business will prioritize completing the remediation of the sleep and respiratory care devices under Respironics’ voluntary June 2021 recall. More than 99% of the actionable registered CPAP and BiPAP sleep therapy devices have been remediated globally, while the remediation of the ventilators is ongoing in coordination with the relevant competent authorities. The Sleep & Respiratory Care Business must demonstrate continued compliance with the FDA’s Quality System Regulation. In the US, Philips Respironics will continue to service sleep and respiratory care devices already with healthcare providers and patients, and supply accessories, consumables, and replacement parts. Until the relevant requirements of the consent decree are met, Philips Respironics will not sell new CPAP or BiPAP sleep therapy devices or other respiratory care devices in the US. Outside the US, Philips Respironics will continue to provide new sleep and respiratory care devices, accessories, consumables, replacement parts, and services, subject to certain requirements.
Connected Care
Total sales by Business
| | | | | |
| 2024 |
| Monitoring | 58 | % |
| Enterprise Informatics | 23 | % |
| Sleep & Respiratory Care | 19 | % |
In 2024, we took action to address the key challenges faced by the Connected Care Business Units. We took steps to deploy a global expansion of channel sales and delivery to scale Enterprise Informatics solutions with partners, and are assessing our approach in areas where this has proven difficult, particularly in China, and in the Growth geographies in the International Region. We also worked on implementing the terms of
the Philips Respironics consent decree, which includes defined actions, milestones and deliverables.
In most of the Connected Care Businesses, revenue is earned through the sale of products and solutions, as well as services and software licenses. Where bundled offerings result in solutions for our customers, or offerings are based on the number of people being monitored, we see more usage-based earnings models. In the area of patient care management (Ambulatory Monitoring & Diagnostics Business Unit and Sleep & Respiratory Care Business), revenue is generated through clinical services, product sales and through rental models, whereby revenue is generated over time.
Sales channels include a mix of direct sales, partly paired with an online sales portal and distributors (varying by product, market and price segment). Our sales organizations have an intimate knowledge of clinical settings and patient-specific diagnosis and treatment. Philips collaborates with customers and partners to co-create solutions, drive commercial innovation and adapt to new models such as monitoring-as-a-service and software-as-a-service.
Sales in the Connected Care Businesses are generally higher in the second half of the year, largely due to customer spending patterns.
At year-end 2024, Connected Care had 16,829 employees worldwide.
2024 highlights
Monitoring
Philips and Bon Secours Mercy Health (BSMH), one of the largest Catholic health systems in the US, announced a multi-year strategic collaboration for patient monitoring. Putting BSMH clinicians in control, the collaboration aims to reduce the digital burden on staff and give them more time to spend with patients. This 10-year journey is designed to bring innovations that will transform care delivery. BSMH provides patients care more than 11 million times annually through its network of more than 1,200 care sites, 60,000 associates and 49 hospitals serving communities in Florida, Kentucky, Maryland, New York, Ohio, South Carolina and Virginia, as well as Ireland.
Philips signed multi-year partnerships for monitoring with several university hospitals in the Netherlands and will provide patient monitors for the new Grand Hôpital de Charleroi in Belgium, as well as roll out its ePatch and AI-driven analytics platform across 14 hospitals in Spain.
Jackson Health System, one of the largest public health systems in the US, announced results of a collaborative Life Cycle Assessment measuring the sustainability impact of transitioning to Philips’ next-generation monitoring solutions, which can help reduce carbon emissions by 685 tons of CO2e, or 47%, compared with previous systems. This significant reduction can allow the health system to save USD 1.2 million over a 10-year device lifetime. These findings suggest that patient monitoring can become part of an overall carbon reduction strategy for health systems.
Enterprise Informatics
In 2024, we expanded our strategic collaboration with Amazon Web Services (AWS) to offer Philips’ integrated diagnostics portfolio in the cloud, improving access to critical insights and driving better outcomes across clinical specialties. With more than 150 sites across North America and Latin America successfully transitioned to Philips HealthSuite Imaging on AWS, Philips and AWS are accelerating the migration of health systems to the cloud and expanding customer cloud migrations in Europe.
Also powered by AWS in 2024, Philips announced the launch of the Tasy EMR AI Virtual Assistant, designed to improve the efficiency and quality of healthcare delivery in Latin America by simplifying administrative tasks and improving the EMR experience so healthcare professionals can focus on what really matters – their patients. As part of a five-year partnership with ABC Medical Center in Mexico, Philips Tasy EMR software is being deployed as part of an interoperability solution, integrating more than 45 functionalities and 700 licenses and establishing a standardized, unified point between clinical and enterprise information systems.
Durham and Darlington NHS Foundation Trust, one of the largest integrated care providers in the United Kingdom, advanced its radiology and cardiology care with Philips PACS. This technology will provide a single view of patient records, providing more connected and coordinated care across not just the hospital sites but the entire North East and Cumbria region. This commitment marks yet another milestone in the 14-year partnership with the Trust, just one year after Durham became the first NHS Trust to co-develop a sustainability blueprint with Philips.
NYU Langone Health in the US launched a digital pathology program, offering unprecedented clarity for viewing tissue samples, enhancing collaboration and reducing diagnosis time while laying the foundation for advanced AI algorithms. This integrated, collaborative approach will serve as part of a drive to further enhance the patient experience through faster diagnosis and treatment, and improved outcomes.
Patient care and collaboration have been significantly improved in Vienna, Austria, as part of a renewed IT service agreement with Philips that includes solutions that centralize data and deliver insights. The ICCA patient data management system, which integrates patient data from monitors, laboratory data and other sources, has led to significant improvement in workflows and patient care in anesthesia, intensive care and general patient care at General Hospital of Vienna (Allgemeines Krankenhaus der Stadt Wien). At Vienna Health Group (Wiener Gesundheitsverbund), Philips Cardiovascular Workspace, a vendor-neutral system implemented in the adult and pediatric departments, helped improve patient care and internal operations.
Personal Health segment
Our Personal Health Business plays an important role in enabling healthy individual care routines with technology and solutions that support people’s long-term health and well-being. Through our Personal Health Business, we offer a broad range of solutions in various consumer price segments. Depending on the market, we offer an additional portfolio of locally relevant innovations and adjust our range to increase accessibility.
We aim to drive profitable growth through a focus on innovation across three key areas:
•reaching more people through consumer-driven product and solutions innovation
•ensuring the highest quality of consumer experience from pre-purchase consideration through to purchase and unboxing, all the way to end-of-use recycling
•expanding our ecosystem through partnerships with leading retailers and scaling new business models, such as try-and-buy and subscription services
A notable aspect of our commercial strategy is driving direct-to-consumer relationships and sales through consumer communities and our online store. We are also leveraging connectivity to enable new business models, and partnering with key players in the health ecosystem, such as insurance companies and healthcare professionals, to create more opportunities to support the health and well-being of consumers across the world. Through social media and digital innovation, we are engaging consumers in their health journey in new and impactful ways.
In Personal Health, improving lives also means caring for the planet, with a key focus on environmental sustainability. In 2024, we expanded our Philips Refurb Editions across select European markets to give products a second life, complete with the same two-year guarantee as new products. A flagship activation of this initiative took place during Black Friday in the Benelux region, where the team flipped the Philips.com online storefront to prioritize Refurb Editions products, only offering new product supply after refurbished items sold out. This effort reflects Personal Health’s commitment to driving a circular economy and exploring innovative ways to provide consumers with greater choices to live sustainably.
We offer mobile solutions to support parents and parents-to-be on a more informed, connected, and healthier journey to parenthood. The Philips Avent Pregnancy+ and Baby+ apps provide parents with supportive content through the critical first 1,000 days of their child’s life. Pregnancy+ features photo-realistic, interactive 3D fetal models and personalized daily content to enhance the pregnancy experience. It is the No. 1 worldwide pregnancy app, with more than 6.5 million monthly active users, available in 22 languages, and offering premium subscription options.
In 2024, we took action to address the key challenges faced by the Personal Health Business Units, including the external context of a volatile macro environment, especially in China. The Personal Health strategy focused on driving innovation at the core; improving agility in responding to market, retail customer and consumer needs; and more integrated planning with its top customers and in-demand items. In China in particular, Personal Health is not a typical mass consumer business, as our products offer a more personalized experience for customers, and we are also impacted by cautious spending behavior. Consumer sentiment in China is unlikely to change in the near-term. We intend to address the challenging macro-economic environment by building on our brands that have a strong position with locally relevant accelerators and customer partnerships, and we aim to complement this effort by expanding our growth outside of China.
The Personal Health segment consists of the following units.
Personal Health – To help people take greater control of their personal health and well-being we deliver sustainable, meaningful solutions that help them to take care of themselves and their families, for happier, healthier lives, today and tomorrow.
•Oral Healthcare Business Unit – power toothbrushes for a range of price segments, from entry-level, battery-operated toothbrushes for a young audience to premium power toothbrushes connected to the Sonicare app with in-app coaching; brush heads, which are also available as a subscription service; and products for interdental cleaning and for in-office and take-home teeth whitening.
•Mother and Child Care Business Unit – products to support parents and babies in the first 1,000 days, including infant feeding (breast pumps, baby bottles and sterilizers), connected baby monitors, and digital parental and women’s health solutions (Pregnancy+ and Baby+ apps).
•Personal Care Business Unit – grooming and beauty products ranging from entry-level to premium. The grooming portfolio includes shavers, OneBlade, groomers, trimmers and hair clippers, as well as premium solutions with SkinIQ technology, in-app coaching for a personalized shave, and blade subscriptions. The beauty portfolio includes devices to support skin care, hair care and hair removal, including Lumea premium intense pulsed light hair removal devices and solutions with the latest SenseIQ technology that sense and adapt for personalized care; these are also available through subscription models.
Personal Health
Total sales by Business
| | | | | |
| 2024 |
Personal Health1 | 100 | % |
1Of which Personal Care 54%, Oral Healthcare 34%, Mother and Child Care 12%
The revenue model is mainly based on product sale at the point in time the products are delivered to retailers and online platforms. We continue to increase revenue model diversity by expanding our business models, including direct-to-consumer, subscriptions, and try-and-buy offerings and services.
The Personal Health Business experiences seasonality, with higher sales around key events and holidays.
At year-end 2024, Personal Health employed 7,991 people worldwide.
2024 highlights
Further expanding the successful OneBlade product range, Philips launched OneBlade Intimate – the first shaving product designed for everyone, to protect the most sensitive skin. Philips also launched its newest On-The-Go Compact Shaver in Greater China, designed to combine portability and ease of use without compromising quality. Highlighting the quality of the innovation, the On-The-Go shaver is accompanying the China Antarctic expedition team on their journey to the South Pole.
Also in the Greater China market, Philips unveiled a series of new locally relevant innovations, which are designed to meet consumer needs across the Region, including the first medical-grade Philips Lumea 8000 Series IPL hair removal device with cooling technology, the limited edition Transformers-themed 5000, 7000 and 9000 series shavers, and the new Sonicare 5300 power toothbrush.
In North America, we launched the Philips Sonicare brand’s first at-home teeth whitening kit, a clinically proven solution developed by dentists, and debuted the new Philips One for Kids rechargeable toothbrush, helping children between 3 and 12 years old with healthier oral care routines. In Western Europe, Philips introduced its next-generation Sonicare technology in its new mid-range Sonicare Series 5000-7000, providing consumers with a superior, gentle and effective cleaning experience. The new range gives users a choice of features at different price points, encouraging them to make the switch from a manual toothbrush to achieve improved oral healthcare results.
The AI-powered Avent Premium Connected Baby Monitor – which offers scientifically proven cry translation as well as SenseIQ technology to track sleep, breathing and movements to support parents and give them peace of mind – had its global debut. And, in an effort to support parents in North America, we partnered with March of Dimes on Mom & Baby Mobile Health Centers, bringing care to underserved communities, and It Starts with Mom, an educational platform providing families with pregnancy resources.
Segment Other
In Other we report on the items Innovation & Strategy, IP Royalties, Central costs, and other small items. At year-end 2024, 18,459 people worldwide were working in these areas.
Innovation & Strategy
At Philips, we have set up our innovation teams to be as close to our customers and consumers as possible. The majority (90%) of our Research & Development (R&D) resources are embedded in our Business Units, where innovation teams can directly hear customer and consumer needs and work closely with other stakeholders to turn innovations into actual products. Innovation at Philips is organized to encourage innovation anywhere along the value chain – not just at the product ideation stage.
The remaining R&D resources (10%) are part of our central Innovation & Strategy organization. Within I&S, innovation teams focus on breakthrough ideas that are industry-shifting, and can advance a core product to fulfill the needs of a broad new customer segment. We do that from our four main innovation sites – Eindhoven (the Netherlands), Cambridge (US), Bangalore (India) and Shanghai (China) – and smaller innovation and research sites in the Regions. Our global footprint enables us to understand, anticipate and react to local markets and needs.
IP royalties
Philips Intellectual Property & Standards (IP&S) proactively pursues the creation of new intellectual property (IP) in close cooperation with Philips’ operating Businesses and Innovation & Strategy. IP&S is a leading industrial IP organization providing world-class IP solutions to Philips Businesses to support their growth, competitiveness and profitability.
Royal Philips’ IP portfolio currently consists of approximately 50,500 patent rights, 30,500 trademarks, 150,000 design rights and 3,200 domain names. Philips filed 700 new patents in 2024, with a strong focus on the growth areas in health technology services and solutions.
Philips earns substantial annual income from license fees and royalties.
Philips believes its business as a whole is not materially dependent on any particular third-party patent or license, or any particular group of third-party patents and licenses.
Central costs
Philips is present in 71 countries globally and has its corporate headquarters in Amsterdam, the Netherlands. Our real estate locations are spread around the globe, with key manufacturing and R&D sites in Europe, the Americas and Asia. The project to move the Philips headquarters to a new location in Amsterdam in 2025 progressed as planned.
We recharge the directly attributable part of the Functional costs to the Businesses. The remaining part is accounted for as ’central costs’, and includes costs related to the Executive Committee and Group Functions such as Strategy, Real Estate, Legal and Audit.
Other small items
Other small items refer to remaining items for intra-group services and legacy items relating to previously disposed businesses.
5.2.2 Our geographic structure
Our Regions
Geographically, our business is organized in three Regions: North America, Greater China and International Region (the latter consisting of Europe and Growth areas). Within our Regions, we further organize by Zones and Countries. The Regions' primary accountability is to manage customer intimacy, build and maintain relationships, and cultivate an understanding of customer needs, as well as carry out (strategic) account management, service delivery, and indirect partner management. They are also accountable for government relations and for providing local infrastructure needed to support Philips’ presence in a country (license to operate).
For financial reporting purposes, we report in four geographic areas based on similar economic characteristics: Western Europe, North America, Other mature geographies, and Growth geographies. Western Europe, North America and Other mature geographies are collectively grouped as Mature geographies in reporting on sales.
2024 highlights from our Regions
North America
In the biggest healthcare market in the world, our North America team focuses on developing strategic relationships with major health systems that provide care to hundreds of millions of people across the Region. We’re working with customers to solve some of the biggest challenges in healthcare, including the crisis around clinician burnout and improving access to care in rural and underserved communities. Bon Secours Mercy Health, NYU Langone Health, Northwell Health and Nicklaus Children’s Hospital are among the customers using solutions from across our industry-leading portfolio in 2024 to bring better care to more people in the Region.
Our work in 2024 built on our more than 50-year innovation relationship with the US Veteran’s Administration (VA), which serves 16 million veterans and leads the largest integrated healthcare delivery network in the country. More than 9 million veterans receive its healthcare services – and almost one-third of them live in rural areas with limited access to care. Our focus with the VA expanded the largest tele-critical care network in the US and accelerated the adoption of digital pathology to speed cancer care. We also continued our longstanding support of healthcare provided by the Department of Defense, deploying the Rapid Analysis of Threat Exposure algorithm (RATE), an early detector of pre-symptomatic infection, part of an effort to improve the readiness monitoring of active-duty military personnel.
Philips brings innovative business models and partnerships to solve specific challenges for customers, including programs to improve access to maternal care in partnership with federal and state government agencies and philanthropic organizations such as the March of Dimes. Philips North America is consistently recognized in third-party surveys as a great place to work.
Greater China
In Greater China Region, we’re committed to the strategy ‘in China, for China’, putting the focus on local innovation, manufacturing, services and partnership. This enables us to continue to deliver industry-leading innovations in our home and hospital portfolio. While demand from hospitals and consumers in China deteriorated in 2024 due to a challenging economic environment, China is a fundamentally attractive growth market for Philips with strong underlying demand. While in the long run China is expected to remain an important market and growth driver, we expect the level of sales in China to take time to recover. With this in mind, new leadership in the Region is putting emphasis on the strategy to create value to the local healthcare system while also empowering consumers to manage their health and well-being with locally relevant solutions.
In health systems, Philips advanced efforts in 2024 to deliver benefits to providers and patients, aligning with the national agenda of improving access and quality of care. With our latest innovations, we serve the needs identified by the Chinese government to further develop local hospitals and clinics. Among the offerings introduced in the China market: Spectral CT Plus, which provides physiology insights for precise diagnosis in cardiology and oncology, and the MR Elition AI, which triples patient throughput through AI-powered workflow optimization.
Leveraging our clinical insights and research capability in cardiology and neurology, we cemented partnerships with several hospitals – including Beijing Fuwai (China’s top cardiology hospital) and Zhangzhou Jiulongjiang Hospital (a top-tier private hospital) – with cross-modality solutions.
International
In 2024, we continued to pursue our global vision while addressing the distinct local needs and circumstances of our diverse customer base across International Region. We put renewed emphasis on building sustainable partnerships as we develop value propositions that attract more partners whose capacity can help better serve our customers. These strategic partnerships drive value creation and efficiency, as well as enable us to expand our reach into previously untouched customer territories, ensuring we deliver better care for more people across our Region.
For example, Philips signed a Memorandum of Understanding with Siloam Hospitals Group in Indonesia to advance AI capabilities and development in the healthcare sector in Indonesia. The strategic collaboration, in partnership with the Universitas Pelita Harapan (UPH) Medical Sciences Group, will focus on capacity building, knowledge sharing, and implementing advanced AI solutions. Leveraging Philips’ AI innovations, the collaboration will help transform clinical care and digital health, enhance healthcare delivery and make the healthcare infrastructure more sustainable.
We are advancing our go-to-market strategy for health systems by identifying and seizing new opportunities, strengthening our competitive positions, and providing improved support for customers and patients. The Personal Health Business remains vital in empowering individuals to adopt healthier care routines, providing innovative technologies and solutions that promote long-term health.
5.2.3 Supply chain and procurement
Philips runs an integrated supply chain tailored to customer needs, which encompasses supplier selection and management through procurement, manufacturing across all the industrial sites, logistics and warehousing operations, and customer installation, as well as demand/supply orchestration.
Like the rest of the industry, we remain exposed to continued geopolitical tensions around the world, as well as (sudden) changes in tariffs or other trade measures. Labor costs and availability remained a concern due to continued inflation in 2024 and scarcity of a skilled workforce. On the other hand, overall macro-economics showed improved availability of materials. As a result, the cost of key raw materials and energy showed a downward trend compared with 2023. The overall growth rate of inflation is slowing down.
Driving end-to-end supply chain reliability and agility
The supply chain plays an important role in improving our performance and delivering to our customers and consumers as promised. As part of our three-year plan, we initiated multiple interventions and planned longer-term programs to improve our execution capabilities and become more resilient in navigating volatility.
To further increase our responsiveness and our reliability in delivery, we continue to build a robust and efficient, more regionalized supply chain ecosystem, prioritizing service level and customer experience. In this ecosystem we carefully balance our manufacturing capabilities in-house, focusing on our strengths while leveraging suppliers’ specialized capabilities that support Philips' ambitions.
When selecting and evaluating supplier partners, we consider a wide-ranging set of factors including but not limited to business metrics such as quality, on-time delivery performance and cost. We use supplier classification models to identify critical suppliers, including those supplying materials, components and services that could influence the safety and performance of our products and solutions.
The Philips Supplier Quality Manual outlines Philips’ quality, regulatory, product, process and customer requirements. The standards outlined in this manual underpin agreements between suppliers and Philips, and guide compliance with Philips’ quality standards.
In 2024, we continued with our technology re-design, such as the redesign of printed circuit board assemblies, and dual sourcing efforts to further increase reliability of our supply chain, including safeguarding material flows and de-risking in a sustainable manner. We aim to maintain close relationships with our suppliers and conduct an ongoing dialogue with respect to our forecast.
Philips Group
Supplier spend analysis per geographic area in %
| | | | | |
| 2024 |
| Western Europe | 33 | % |
| North America | 33 | % |
| Other mature geographies | 5 | % |
| Mature geographies | 71 | % |
| Growth geographies | 29 | % |
| Philips Group | 100 | % |
6 Financial performance
6.1 Performance summary
The year 2024
•Sales amounted to EUR 18.0 billion, a decrease of 1% on a nominal basis. On a comparable basis*, sales increased 1%, on the back of solid growth in 2023. Growth in Mature Geographies was partly offset by the decline in China. Comparable sales* showed 1% growth in the Diagnosis & Treatment segment, 2% growth in the Connected Care segment, and 1% decline in the Personal Health segment due to the decline in China.
•Income from operations improved to EUR 529 million, mainly driven by higher gross margin and lower Respironics related items, partially offset by higher impairment charges.
•Net income amounted to a loss of EUR 698 million, mainly due to Respironics litigation provision charges of EUR 984 million, partly offset by Respironics insurance income of EUR 538 million, and tax expenses including deferred tax asset derecognition of EUR 941 million, compared to a loss of EUR 463 million in 2023.
•Adjusted EBITA* amounted to EUR 2,077 million, or 12% of sales, compared to 11% of sales in 2023. Connected Care and Personal Health segments showed an increase in Adjusted EBITA* margin, mainly driven by operational improvements and productivity actions, partly offset by cost inflation. Diagnosis & Treatment segment remained flat year over year.
•Net cash flows from operating activities amounted to EUR 1,569 million; free cash flow* amounted to EUR 906 million.
•Philips cancelled approximately 4.4 million shares acquired under its 2021 share repurchase program for capital reduction purposes.
For a discussion of our financial performance for the year ended December 31, 2023 compared to the year ended December 31, 2022, please see section “Financial Performance” in our Annual Report on Form 20-F for the year ended December 31, 2023, which we filed with the SEC on February 20, 2024.
Philips Group
Key data in millions of EUR unless otherwise stated
| | | | | | | | | |
| | 2023 | 2024 |
| Sales | | 18,169 | 18,021 |
| Nominal sales growth | | 2% | (1%) |
| Comparable sales growth¹ | | 6% | 1% |
| Impairment of goodwill | | (8) | |
| Income from operations | | (115) | 529 |
| as a % of sales | | (1%) | 3% |
| Financial expenses, net | | (314) | (282) |
| Investments in associates, net of income taxes | | (98) | (124) |
| Income tax (expense) benefit | | 73 | (963) |
| Income from continuing operations | | (454) | (840) |
| Discontinued operations, net of income taxes | | (10) | 142 |
| Net income | | (463) | (698) |
| Adjusted EBITA¹ | | 1,921 | 2,077 |
| as a % of sales | | 10.6% | 11.5% |
| Income from continuing operations attributable to shareholders² per common share (in EUR) - diluted | | (0.48) | (0.90) |
| Adjusted income from continuing operations attributable to shareholders² per common share (in EUR) - diluted¹ | | 1.21 | 1.39 |
2Shareholders in this table refers to shareholders of Koninklijke Philips N.V. Per share calculations have been adjusted retrospectively for all periods presented to reflect the issuance of shares for the share dividend in respect of 2023.
6.1.1 Factors impacting performance
The factors below are believed to have had a significant impact on Philips’ performance during the year.
Macro-economic landscape
In 2024, global economic growth is estimated to have improved marginally compared to 2023, but the economic situation in China weighed down growth across 2024. Global real GDP is estimated to have grown by 3.2% in 2024, compared with 2.8% in 2023. Oxford Economics expects world real GDP growth of 3.3% in 2025 excluding any impact of tariffs.
Simplified operating model
On January 30, 2023, Philips announced its plan to create value with sustainable impact, which is based on focused organic growth to deliver patient- and people-driven innovation at scale, with improved execution as a key value driver, prioritizing patient safety and quality, supply chain reliability and a simplified operating model. The introduction of a simplified operating model to increase agility and structurally lower the cost base by giving end-to-end accountability to the segments has continued to contribute positively to the results of operations.
Workforce reduction
By year-end 2024 Philips completed its previously announced plans to reduce its workforce by 10,000 roles globally by 2025. These reductions were focused on Corporate and Functions optimization and non-core activities. Workforce-related restructuring charges were EUR 106 million in 2024 and EUR 196 million in 2023.
Supply chain resilience
Limited availability and delays in the supply of certain components and products internationally – partly a consequence of the COVID pandemic and the Russia-Ukraine war – impacted the company's results in recent years. These supply chain constraints resulted in an increase in overall working capital, in particular inventories. In 2023, following significant actions to increase supply chain resilience and mitigate the impact of disruptions, our sales benefited from improved material availability and resolved shortages in components.
In 2024 the company stepped up efforts to make its supply chain more agile in order to increase speed of execution. In addition, the company is increasingly sourcing products in the market in which they are being sold to make the supply chain more agile, which we believe is an important part of the company's ability to cater to the demands in the healthcare market and minimize the impact of potential tariffs and retaliatory trade measures.
Geopolitical environment
The Russia-Ukraine war continues to put pressure on the global commodity landscape and supply chains, and contribute to higher levels of inflation. Philips’ operations in Russia and Ukraine on a combined basis represented less than 1% of group sales in both 2023 and 2024. Having substantially reduced its operations in Russia in 2022, the remaining activities were focused on the delivery of medical systems, devices, and spare parts to healthcare providers as well as delivery of a limited range of mother and baby products.
The ongoing situation in the Middle East further increases economic and political uncertainty. Philips is present in Israel with several subsidiaries, mainly in Diagnosis & Treatment and Connected Care, that are primarily involved in manufacturing and research and development activities.
6.1.2 Outlook
Philips remains focused on successfully executing its three-year plan to drive operational improvements and create value with sustainable impact, within a challenging macro environment. For 2025, Philips expects:
•1%-3% comparable sales growth, including a mid- to high-single-digit decline in China
•Adjusted EBITA margin increasing 30-80 bps to 11.8%-12.3%
•Free cash flow before payment of the USD 1.1 billion cash-out relating to the US medical monitoring and personal injury settlements will be at the lower end of the range of EUR 1.4 billion to EUR 1.6 billion. Net of this cash-out, free cash flow will be EUR 0.4 billion to EUR 0.6 billion.
We anticipate comparable sales growth to be back-end-loaded in the year, with a mid-single-digit decline in Q1 mainly due to lower demand in China and royalties phasing, with correspondingly lower Adjusted EBITA margin.
The outlook includes the impact of the recently announced US-China tariffs. It excludes ongoing Philips Respironics-related legal proceedings, including the investigation by the US Department of Justice.
6.2 Results of operations
Sales
Philips Group
Sales in millions of EUR unless otherwise stated
| | | | | | | | | | | | | | | | | | | | | | | |
| | | | | 2023 | | | 2024 | |
| | | | Sales | Nominal
sales
growth | Comparable
sales
growth¹ | Sales | Nominal
sales
growth | Comparable
sales
growth¹ |
| Diagnosis & Treatment | | | | 8,825 | | 6 | % | 11 | % | 8,790 | | 0 | % | 1 | % |
| Connected Care | | | | 5,138 | | (2 | %) | 1 | % | 5,134 | | 0 | % | 2 | % |
| Personal Health | | | | 3,602 | | (1 | %) | 3 | % | 3,486 | | (3 | %) | (1 | %) |
| Other | | | | 604 | | | | 611 | | | |
| Philips Group | | | | 18,169 | | 2 | % | 6 | % | 18,021 | | (1 | %) | 1 | % |
Group sales in 2024 amounted to EUR 18,021 million, 1% lower than in 2023 on a nominal basis. Considering a 2% negative currency effect and consolidation impact, comparable sales growth* was 1%. The negative currency effect was mainly due to depreciation of currencies against the euro, and affected all segments. In addition, Group sales were negatively impacted by China, mainly as a result of adverse market developments.
Comparable order intake increased to 1% in 2024, compared to a 6% decline in 2023. Comparable order intake is not a financial measure, but is presented when discussing the Philips Group's performance. For further details, refer to the Other Key Performance indicators section. Diagnosis & Treatment
In 2024, sales amounted to EUR 8,790 million, in line with the nominal sales in 2023. Considering a 2% negative currency effect and consolidation impact, comparable sales* increased by 1%. This was driven by mid-single-digit growth in Image-Guided Therapy, partly offset by a decline in Precision Diagnosis mainly due to the extended hospital procurement cycles as a result of the ongoing industry wide anti-corruption campaign in China.
Connected Care
In 2024, sales amounted to EUR 5,134 million, in line with the nominal sales in 2023. Considering a 2% negative currency effect and consolidation impact, comparable sales* increased by 2%. This growth was mainly driven by mid-single-digit growth in Enterprise Informatics, double-digit growth in Sleep & Respiratory Care, partly offset by a low-single-digit decline in Monitoring on the back of double-digit growth in 2023.
Personal Health
In 2024, sales amounted to EUR 3,486 million, 3% lower than in 2023 on a nominal basis. Considering a 2% negative currency effect and consolidation impact, growth in comparable sales was (1)%. This was mainly due to deteriorated demand in China due to cautious spending behavior, which offset growth in other geographies.
Other
In 2024, sales amounted to EUR 611 million, compared to EUR 604 million in 2023, mainly driven by higher royalty income.
Sales by geographic area
Philips Group
Sales by geographic area in millions of EUR unless otherwise stated
| | | | | | | | | | | | | | | | | | | | | | | |
| | | | | 2023 | | | 2024 | |
| | | | Sales | Nominal
sales
growth | Comparable
sales
growth¹ | Sales | Nominal
sales
growth | Comparable
sales
growth¹ |
| Western Europe | | | | 3,819 | | 6 | % | 7 | % | 3,978 | | 4 | % | 5 | % |
| North America | | | | 7,562 | | 0 | % | 3 | % | 7,655 | | 1 | % | 2 | % |
| Other mature geographies | | | | 1,626 | | (1 | %) | 7 | % | 1,526 | | (6 | %) | (1 | %) |
| Mature geographies | | | | 13,007 | | 1 | % | 4 | % | 13,159 | | 1 | % | 2 | % |
| Growth geographies | | | | 5,162 | | 3 | % | 10 | % | 4,863 | | (6 | %) | (2 | %) |
| Philips Group | | | | 18,169 | | 2 | % | 6 | % | 18,021 | | (1 | %) | 1 | % |
Sales in Western Europe increased year-on-year on a nominal and comparable basis* with double-digit growth in the Connected Care segment and low-single-digit growth in the Diagnosis & Treatment and the Personal Health segments. Sales in North America increased year-on-year on a nominal and comparable basis* with mid-single-digit growth in the Diagnosis & Treatment segment and low-single-digit growth in Connected Care segment, which was partly offset by a low-single-digit decline in the Personal Health segment. Sales in Other mature geographies decreased year-on-year, mainly due to lower sales in segment Other which was partly offset by low-single-digit comparable sales growth* in the Diagnosis & Treatment and the Personal Health segments. Connected Care segment sales growth in Other mature geographies was flat.
In Growth geographies in 2024 comparable sales growth* was negative in all segments mainly due to lower demand from consumers and health systems in China.
Cost of sales
Philips Group
Cost of sales components in millions of EUR unless otherwise stated
| | | | | | | | | | | | | | | | |
| | | 2023 | As a % of sales | 2024 | As a % of sales |
| Costs of materials used | | | 4,626 | | 25 | % | 4,213 | | 23 | % |
| Salaries and wages | | | 2,381 | | 13 | % | 2,313 | | 13 | % |
| Depreciation and amortization | | | 461 | | 3 | % | 609 | | 3 | % |
| Other manufacturing costs | | | 3,252 | | 18 | % | 3,113 | | 17 | % |
| Cost of sales | | | 10,721 | | 59 | % | 10,248 | | 57 | % |
Cost of sales includes only expenses directly or indirectly attributable to the sale of products or services, such as cost of materials used, salaries and wages, depreciation and amortization of assets used in manufacturing, and other manufacturing costs (such as repair and maintenance costs related to production, expenses incurred for shipping and handling of internal movements of goods, and other expenses related to manufacturing).
Philips’ cost of sales decreased by EUR 473 million to EUR 10,248 million in 2024 compared to EUR 10,721 million in 2023, and decreased as a percentage of sales, mainly due to decreased Cost of materials used by EUR 413 million in 2024, which was driven by productivity actions, lower restructuring, acquisition-related and other items and a favorable foreign currency impact. Other key factors influencing cost of sales were as follows:
•Salaries and wages decreased by EUR 68 million, mainly driven by productivity actions, lower restructuring charges and a favorable foreign currency impact, partly offset by cost inflation;
•Depreciation and amortization increased by EUR 148 million in 2024, mainly due to an intangible asset impairment charge;
•Other manufacturing costs decreased by EUR 139 million in 2024, driven by productivity actions and a favorable foreign currency impact, partly offset by cost inflation.
Gross margin
In 2024, Philips’ gross margin was EUR 7,773 million, or 43% of sales, compared to EUR 7,448 million, or 41% of sales, in 2023. The gross margin increased by EUR 325 million year-on-year, driven by operational improvements, productivity measures and lower restructuring, acquisition-related and other items, and a favorable foreign currency impact, partly offset by cost inflation.
Selling expenses
Selling expenses amounted to EUR 4,486 million, or 25% of sales, in 2024, compared to EUR 4,524 million, or 25% of sales, in 2023. Year-on-year selling expenses decreased by EUR 38 million, mainly driven by productivity actions, lower restructuring, acquisition-related and other items and a favorable foreign currency impact, partly offset by cost inflation.
General and administrative expenses
General and administrative expenses amounted to EUR 582 million, or 3% of sales, in 2024, compared to EUR 608 million, or 3% of sales, in 2023. Expenditure decreased year-on-year by EUR 26 million, mainly driven by productivity actions, lower restructuring, acquisition-related and other items and a favorable foreign currency impact, partly offset by cost inflation.
Research and development expenses
Research and development costs were EUR 1,747 million, or 10% of sales, in 2024, compared to EUR 1,890 million, or 10% of sales, in 2023. The costs decreased by EUR 143 million year-on-year, mainly driven by productivity actions, lower restructuring, acquisition-related and other charges and a favorable foreign currency impact, partly offset by cost inflation.
Philips Group
Research and development expenses in millions of EUR unless otherwise stated
| | | | | | | | | |
| | 2023 | 2024 |
| Diagnosis & Treatment | | 828 | | 899 | |
| Connected Care | | 663 | | 599 | |
| Personal Health | | 197 | | 190 | |
| Other | | 202 | | 59 | |
| Philips Group | | 1,890 | | 1,747 | |
| As a % of sales | | 10% | 10% |
Impairment of goodwill
In addition to the annual goodwill-impairment tests for Philips, trigger-based impairment tests were performed during the years 2024 and 2023. As a result of the tests, recorded goodwill impairments were EUR nil million in 2024 whereas in 2023 a EUR 8 million goodwill impairment was recognized for a business held for sale.
Restructuring, acquisition-related charges and other items
Restructuring, acquisition-related charges and other items were EUR 1,156 million in 2024, compared to EUR 1,739 million in 2023. Respironics related charges were EUR 691 million in 2024 compared to EUR 1,162 million in 2023. 2024 includes Respironics litigation provision charges of EUR 984 million, partly offset by Respironics insurance income of EUR 538 million.
Diagnosis & Treatment
Restructuring, acquisition-related and other charges in 2024 were EUR 202 million and included EUR 122 million restructuring charges, mainly related to workforce reduction and asset impairment, and EUR 45 million for quality remediation actions. Restructuring, acquisition-related and other charges in 2023 were EUR 210 million and include EUR 81 million charges in relation to quality remediation actions and EUR 73 million restructuring charges, mainly related to workforce reduction.
Connected Care
Restructuring, acquisition-related and other charges in 2024 were EUR 818 million and included charges of EUR 984 million Respironics litigation provision, EUR 133 million Respironics field-action running remediation costs and EUR 113 million in connection with the proposed Respironics consent decree, partly offset by EUR 538 million Respironics insurance income. Restructuring, acquisition-related and other charges in 2023 were EUR 1,390 million and include: charges of EUR 575 million Respironics litigation provision, EUR 224 million in connection with the proposed Respironics consent decree, and EUR 363 million Respironics field-action running remediation costs. In addition, it includes EUR 64 million restructuring charges, mainly related to workforce reduction, and charges in relation to quality remediation actions of EUR 94 million.
Personal Health
Restructuring, acquisition-related and other charges in 2024 were EUR 25 million, mainly for workforce reduction and asset-related impairments. Restructuring, acquisition-related and other charges in 2023 were EUR 31 million and include a EUR 23 million investment re-measurement loss and restructuring costs mainly related to workforce reduction of EUR 9 million.
Other
Restructuring, acquisition-related and other charges in 2024 were EUR 111 million, mainly for workforce reduction, lease termination and asset impairment charges. Restructuring, acquisition-related and other charges in 2023 were EUR 108 million and included EUR 140 million restructuring charges mainly related to workforce reduction and a gain of EUR 35 million due to a divestment.
Philips Group
Restructuring charges in millions of EUR
| | | | | | | | | |
| | 2023 | 2024 |
| Restructuring charges per segment: | | | |
| Diagnosis & Treatment | | 73 | | 122 | |
| Connected Care | | 64 | | 29 | |
| Personal Health | | 9 | | 25 | |
| Other | | 139 | | 91 | |
| Philips Group | | 285 | | 268 | |
| | | |
| Cost breakdown of restructuring charges: | | | |
| Provision for personnel lay-off costs | | 196 | | 106 | |
| Restructuring-related asset impairment | | 56 | | 134 | |
| Other restructuring-related costs | | 33 | | 29 | |
| Philips Group | | 285 | | 268 | |
In 2024, Philips continued general productivity actions aimed at simplifying the organization to streamline ways of working and reduce operating expenses. This included the further reduction of 2,000 roles, thereby completing the planned reduction of 10,000 roles globally across the organization by 2025 ahead of schedule. In addition, other restructuring projects were executed during the year, of which the most significant impacted the segments Other and Connected Care and mainly took place in the US and Netherlands.
For further information on restructuring, refer to Provisions. Philips Group
Acquisition-related charges in millions of EUR
| | | | | | | | | |
| | 2023 | 2024 |
| Diagnosis & Treatment | | 45 | | 34 | |
| Connected Care | | 51 | | 24 | |
| Philips Group | | 96 | | 58 | |
In 2024, acquisition-related charges in the Diagnosis & Treatment segment mainly related to the acquisition of Spectranetics, due to post-acquisition integration costs. The Connected Care segment recorded charges mainly related to the acquisition of BioTelemetry, due to post-acquisition integration costs. In 2023, acquisition-related charges in the Diagnosis & Treatment segment mainly related to the acquisition of Spectranetics, and in the Connected Care segment mainly related to the acquisition of BioTelemetry and Capsule Technologies, due to post-acquisition integration costs.
Philips Group
Other items in millions of EUR
| | | | | | | | | |
| | 2023 | 2024 |
| Diagnosis & Treatment | | 92 | | 45 | |
| Connected Care | | 1,275 | | 765 | |
| Personal Health | | 22 | | - | |
| Other | | (32) | | 20 | |
| Philips Group | | 1,358 | | 830 | |
| | | |
| Consisting of: | | | |
| Respironics litigation provision | | 575 | | 984 | |
| Respironics insurance income | | | (538) | |
| Respironics consent decree charges | | 363 | | 113 | |
| Respironics field-action running costs | | 224 | | 133 | |
| Respironics-related charges | | 1,162 | | 691 | |
| Quality actions | | 175 | | 123 | |
| | | |
| Provision for a legal matter | | 31 | | |
| | | |
| Investment re-measurement loss | | 23 | | |
| | | |
| Gain on divestment of business | | (35) | | |
| Remaining items | | 2 | | 16 | |
| Philips Group | | 1,358 | | 830 | |
In 2024 Respironics-related charges totaled EUR 691 million as the impact of the Respironics litigation provision was partly offset by Respironics insurance income in the Connected Care segment. In 2023 Respironics-related charges totaled EUR 1,162 million.
Income from operations (EBIT) and Adjusted EBITA* The following overview shows Income from operations and Adjusted EBITA* by segment. Philips Group
Income from operations and Adjusted EBITA1 in millions of EUR unless otherwise stated | | | | | | | | | | | | | | |
| Income from operations | As a % of sales | Adjusted EBITA¹ | As a % of sales |
| 2024 | | | | |
| Diagnosis & Treatment | 592 | | 7 | % | 1,018 | | 11.6 | % |
| Connected Care | (466) | | (9 | %) | 494 | | 9.6 | % |
| Personal Health | 544 | | 16 | % | 584 | | 16.8 | % |
| Other | (142) | | | (18) | | |
| Philips Group | 529 | | 3 | % | 2,077 | | 11.5 | % |
| 2023 | | | | |
| Diagnosis & Treatment | 721 | | 8 | % | 1,028 | | 11.6 | % |
| Connected Care | (1,199) | | (23 | %) | 369 | | 7.2 | % |
| Personal Health | 552 | | 15 | % | 597 | | 16.6 | % |
| Other | (190) | | | (73) | | |
| Philips Group | (115) | | (1 | %) | 1,921 | | 10.6 | % |
| | | | |
| | | | |
| | | | |
| | | | |
| | | | |
| | | | |
Income from operations amounted to EUR 529 million, or 3% of sales, in 2024, compared to a loss of EUR 115 million, or (1)% of sales, in 2023, mainly driven by higher gross margin and lower charges in restructuring, acquisition-related and other items in 2024. Adjusted EBITA* increased to EUR 2,077 million and the margin improved to 12%, compared to EUR 1,921 million and a margin of 11% in 2023, mainly driven by operational improvements and productivity actions. Amortization of acquired intangible assets was EUR 392 million in 2024 compared to EUR 298 million in 2023, which also included goodwill impairment charges of EUR 8 million.
Diagnosis & Treatment
Income from operations decreased to EUR 592 million in 2024, compared to EUR 721 million in 2023. This was mainly due to a value adjustment on current assets, and partly offset by an increase from pricing & productivity actions. Adjusted EBITA* remained stable at 11.6% of sales in 2024.
Amortization charges in 2024 were EUR 225 million and include the impairment of acquired intangible assets following product discontinuation. Amortization and goodwill impairment charges in 2023 were EUR 98 million and include EUR 89 million amortization charges and EUR 8 million goodwill impairment charges.
Connected Care
Income from operations improved to EUR (466) million in 2024, compared to EUR (1,199) million in 2023. 2024 was mainly driven by lower charges in relation to Respironics, operational improvements and pricing & productivity actions. Adjusted EBITA* improved to 9.6% of sales in 2024.
Amortization charges in 2024 were EUR 141 million, compared to EUR 178 million in 2023.
Personal Health
Income from operations decreased to EUR 544 million in 2024, compared to EUR 552 million in 2023. This was mainly due to lower sales as a result of the decline in China, partly offset by operational improvements and productivity actions. Adjusted EBITA* remained stable at 16.8% of sales in 2024.
Amortization charges in 2024 were EUR 15 million, compared to EUR 14 million in 2023.
Other
In Other we report on the items Innovation & Strategy, IP Royalties, Central costs and Other.
Income from operations amounted to a loss of EUR (142) million in 2024, compared to a loss of EUR (190) million in 2023. Adjusted EBITA* amounted to a loss of EUR (18) million, compared to a loss of EUR (73) million in 2023. The increase in Income from operations and Adjusted EBITA* was mainly driven by higher royalty income and lower costs.
Financial income and expenses
Financial income and expenses resulted in a net expense of EUR 282 million in 2024, compared to a net expense of EUR 314 million in 2023, mainly driven by higher interest income on cash and cash equivalents and higher net foreign exchange losses in 2023, partly offset by higher interest expenses and provision-related accretion costs.
Income taxes
Income tax expense increased to EUR 963 million in 2024, compared to an income tax benefit of EUR 73 million in 2023. The income tax expense increased by EUR 1,036 million year-on-year, mainly due to the de-recognition of deferred tax assets in the US and higher income before tax in 2024, as well as recognition of historical tax credits in 2023.
Investments in associates
Results related to investments in associates declined from a loss of EUR 98 million in 2023 to a loss of EUR 124 million in 2024. 2024 includes impairments of EUR 103 million and share of results of associates of EUR 20 million. 2023 includes impairments of EUR 58 million and share of results of associates of EUR 40 million.
Discontinued operations
In 2024 and 2023, Discontinued operations consisted primarily of the Domestic Appliances business and certain other divestments that were reported as discontinued operations. In 2024, Discontinued operations included a tax benefit of EUR 140 million relating to tax audit settlements of prior years. For further information, refer to Discontinued operations and assets classified as held for sale. Net income and earnings per share
Net income amounted to a loss of EUR 698 million in 2024, a decrease of EUR 235 million compared to 2023, mainly due to higher tax expenses partly offset by higher gross margin and lower Respironics related items. Net income is not allocated to segments, as certain income and expense line items are monitored on a centralized basis, resulting in them being shown on a Philips Group level only.
Income from continuing operations attributable to shareholders per common share (in EUR) - diluted, was EUR (0.90) in 2024, compared to EUR (0.48) in 2023. Adjusted income from continuing operations attributable to shareholders per common share (in EUR) - diluted* was EUR 1.39 in 2024, compared to EUR 1.21 in 2023.
Non-controlling interests
Net income attributable to non-controlling interests increased from EUR 2 million in 2023 to EUR 3 million in 2024.
6.3 Financial position
6.3.1 Acquisitions and divestments
In 2024, Philips did not make any acquisitions.
In 2024, Philips completed four divestments for net cash consideration of EUR 118 million. The divestments were not individually material.
In 2023, Philips completed one acquisition involving a total net cash outflow of EUR 53 million (total equity price and settlement of debt). The purchase price allocation was finalized in the second quarter of 2024.
In 2023, Philips completed six divestments for a cash consideration of EUR 80 million, notably Philips Pharma Solutions in the US.
6.3.2 Financing
Summary balance sheet information as of December 31, 2023 and 2024 is presented in the following table. For details refer to Consolidated balance sheets. Philips Group
Summary balance sheet information in millions of EUR
| | | | | | | | | |
| | 2023 | 2024 |
| Property, plant and equipment | | 2,483 | | 2,452 | |
| Intangible assets | | 13,067 | | 13,365 | |
| Investments and financial assets | | 1,050 | | 968 | |
| Deferred tax assets | | 2,627 | | 1,916 | |
| Inventories | | 3,491 | | 3,198 | |
| Receivables | | 4,146 | | 3,974 | |
| Other assets | | 672 | | 704 | |
| Payables | | (3,886) | | (3,531) | |
| Provisions | | (2,498) | | (2,972) | |
| Contract liabilities | | (2,278) | | (2,130) | |
| Other liabilities | | (993) | | (661) | |
| Net assets to be financed | | 17,881 | | 17,280 | |
| | | |
| Cash and cash equivalents | | 1,869 | | 2,401 | |
| Debt | | (7,689) | | (7,639) | |
Net debt¹ | | (5,820) | | (5,238) | |
| Non-controlling interests | | (33) | | (37) | |
| Shareholders’ equity | | (12,028) | | (12,006) | |
| Financing | | (17,881) | | (17,280) | |
6.3.3 Debt position
Total debt outstanding at the end of 2024 was EUR 7,639 million, compared with EUR 7,689 million at the end of 2023.
Philips Group
Total debt outstanding in millions of EUR
| | | | | | | | | |
| | 2023 | 2024 |
| Long-term debt | | 7,035 | | 7,113 | |
| Short-term debt | | 654 | | 526 | |
| Debt | | 7,689 | | 7,639 | |
Philips Group
Balance sheet changes in debt in millions of EUR
| | | | | | | | | |
| | 2023 | 2024 |
| New lease liabilities | | 233 | | 167 | |
| New borrowings long-term debt | | 544 | | 710 | |
| Repayments long-term debt incl. leases | | (754) | | (763) | |
| New borrowings (repayments) short-term debt | | 29 | | (30) | |
| Forward contracts entered (matured) | | (462) | | (248) | |
| Currency effects, consolidation changes and other | | (102) | | 114 | |
| Changes in debt | | (512) | | (50) | |
In 2024, total debt decreased by EUR 50 million compared to 2023. The decrease was primarily the result of repayment of existing debt and leases as well as the maturity of forward contracts related to the share buyback program and long-term incentive and employee stock purchase plans, partly offset by the issuance of principal amount of EUR 700 million fixed rate notes maturing in 2032. The remainder of proceeds from the new issuance will be used for the repayment of USD bond maturities in 2025. Changes in payment obligations from forward contracts relate to the maturity of EUR 167 million of share buyback forwards and EUR 146 million of forwards relating to long-term incentive and employee stock purchase plans. This was partially offset by new forwards for long-term incentive and employee stock purchase plans of EUR 65 million (as announced in August 2024).
In 2023, total debt decreased by EUR 512 million compared to 2022. The decrease mainly comes from maturing forward contracts related to the share buyback program and long-term incentive and employee stock purchase plans, and repayments of long-term debt including leases, partly offset by the issuance of EUR 500 million of fixed rate notes that mature in 2031.
At the end of 2024, long-term debt as a proportion of the total debt stood at 93% with an average remaining term (including current portion) of 5.9 years, compared to 91% and 6 years, respectively at the end of 2023.
For further information, please refer to Debt.
6.3.4 Shareholders’ equity
In 2024, shareholders’ equity decreased by EUR 23 million to EUR 12,006 million at year-end. The decrease was mainly due to the net loss attributable to shareholders of EUR 702 million and currency translation gains in equity of EUR 751 million, primarily due to the appreciation of the US dollar against the euro in 2024.
In 2023, shareholders’ equity decreased by EUR 1,220 million to EUR 12,028 million at year-end. The decrease was mainly due to the net loss attributable to shareholders of EUR 466 million and currency translation reductions in equity of EUR 604 million, primarily due to the depreciation of the US dollar against the euro in 2023.
Share capital structure
The number of issued common shares of Royal Philips as of December 31, 2024 was 939,939,384. At year-end 2024, the company held 14.9 million shares in treasury to cover obligations under long-term incentive plans. In 2024 (and earlier years), the company entered into several forward contracts to acquire its own shares, and as of December 31, 2024, the outstanding forward contracts related to 6.5 million shares. See below for more information on the shares that were acquired in the course of 2024. Philips issued 30.9 million shares in May 2024 in order to distribute the 2023 dividend. The company cancelled 4.4 million shares in June 2024.
The number of issued common shares of Royal Philips as of December 31, 2023 was 913,515,966. At year-end 2023, the company held 7.1 million shares in treasury to cover obligations under long-term incentive plans. In 2016, Philips purchased call options on its own shares to hedge options granted to employees up to 2013, and as of December 31, 2023, no such options remained outstanding. In 2023 (and earlier years), the company entered into several forward contracts to acquire its own shares, and as of December 31, 2023, the outstanding forward contracts related to 15.5 million shares. Philips issued 39.3 million shares in May 2023 in order to distribute the 2022 dividend. The company cancelled 15.1 million shares in December 2023.
Share repurchase methods for long-term incentive plans and capital reduction purposes
Historically, Philips uses different methods to repurchase shares in its own capital: (i) share buyback repurchases in the open market via an intermediary; (ii) repurchase of shares via forward contracts for future delivery of shares; and (iii) the unwinding of call options on own shares. During 2024, Philips used methods (i) and (ii) to repurchase shares for share-based compensation plans and method (ii) to repurchase shares for capital reduction purposes.
The open market transactions via an intermediary allow for buybacks during both open and closed periods.
For more information on share repurchase transactions entered into 2022, 2023, and 2024, refer to Equity.
Philips Group
Impact of share acquisitions and cancellations on share count in thousands of shares as of December 31
| | | | | | | | | | | | | | | | | |
| 2020 | 2021 | 2022 | 2023 | 2024 |
| Shares issued | 911,053 | 883,899 | 889,315 | 913,516 | 939,939 |
| Shares in treasury | 5,925 | 13,717 | 7,835 | 7,113 | 14,930 |
| Shares outstanding | 905,128 | 870,182 | 881,481 | 906,403 | 925,009 |
| Shares acquired | 8,670 | 45,486 | 5,081 | 15,964 | 13,718 |
| Shares cancelled | 3,810 | 33,500 | 8,758 | 15,134 | 4,437 |
Philips Group
Total number of shares repurchased in thousands of shares unless otherwise stated
| | | | | | | | | | | | | | | | | | | | | | | | | | |
| Share repurchases related to shares acquired for capital reduction | Average price paid per share in EUR | Shares acquired for LTI’s | Average price paid per share in EUR | Total number of shares purchased1 | Average price paid per share in EUR | Total number of shares purchased as part of publicly announced plans or programs2 3 4 | Approximate value of shares that may yet be purchased under the plans or programs in thousands of EUR6 |
| January 2024 | | | | | | | | 390,388 |
| February 2024 | | | | | | | | 390,388 |
| March 2024 | 2,216 | 37.61 | | | | 2,216 | 37.61 | | 2,216 | 297,069 |
| April 2024 | 2,221 | 37.51 | | | | 2,221 | 37.51 | | 2,221 | 213,736 |
| May 2024 | | | | | | | | 213,736 |
| June 2024 | | | | | | | | 213,736 |
| July 2024 | | | | | | | | 213,736 |
| August 2024 | | | 2,231 | 26.89 | | 2,231 | 26.89 | | 2,231 | 274,547 |
| September 2024 | | | | | | | | 274,547 |
| October 2024 | | | | | | | | 274,547 |
| November 2024 | | | 5,450 | 20.44 | | 5,450 | 20.44 | | 5,450 | 163,142 |
| December 2024 | | | 1,600 | 19.77 | | 1,600 | 19.77 | | 1,600 | 131,518 |
| Total | 4,437 | | 9,281 | | 13,718 | 26.95 | | 13,718 | 131,518 |
of which5) | | | | | | | | |
| purchased in the open market | | | 2,231 | | 2,231 | | 2,231 | |
| acquired through exercise of call options/settlement of forward contracts | 4,437 | | 7,050 | | 11,487 | | 11,487 | |
| To be acquired by settlement of forward contracts after December 31, 2024 | | | | | | | | 131,518 |
1All shares were purchased through publicly announced plans or programs.
2First, on January 29, 2020, Philips announced that it would repurchase up to 6 million shares to cover certain of its obligations arising from its long-term incentive and employee stock purchase plans. Under this program, Philips entered into three forward contracts to acquire 5 million shares for an amount of EUR 174 million with settlement dates varying between October 2021 and November 2022. On October 26, 2022, the original settlement date of two share tranches entered into under this program (in total 1.75 million shares) has been extended from November 23, 2022, to November 2023, and 2024, respectively. Second, on July 26, 2021, Philips announced a share buyback program for share cancellation purposes for an amount of up to EUR 1.5 billion. Consequently, in the third quarter of 2021 Philips entered into three forward contracts for an amount of EUR 731 million to acquire 19.6 million shares with settlement dates in 2022, 2023 and 2024. Philips executed the remainder of the program through open market purchases by an intermediary in the fourth quarter of 2021 (acquiring 21 million shares) and January 2022 (acquiring 0.8 million shares). Third, on June 13, 2022, Philips announced that it will repurchase up to 3.2 million shares to cover certain of its obligations arising from its long-term incentive and employee stock purchases plans. Under this program, Philips entered into two forward contracts for an amount of EUR 63 million to acquire 3.2 million shares with settlement dates in November 2024 and December 2024. Fourth, on June 14, 2023, Philips announced that it will repurchase up to 7.1 million shares to cover certain of its obligations arising from its long-term incentive and employee stock purchase plans. Under this program, Philips entered into three forward contracts for an amount of EUR 138 million to acquire 7.1 million shares with settlement dates varying between November 2024 and November 2025. Fifth, on August 5, 2024, Philips announced that it would repurchase shares for an amount of up to EUR 125 million to cover certain of its obligations arising from its long-term incentive plans. The repurchases were executed through a combination of open market purchases (in August 2024) and one forward contract for an amount of EUR 65 million to acquire 2.5 million shares with a settlement date in November 2026. For further details on these publicly announced plans or programs refer to Equity. 3Philips cancelled 4.4 million shares on June 17, 2024.
4In 2024, Philips did not determine to terminate any publicly announced plans or programs prior to expiration, or determine that it intends not to make any further purchases under any publicly announced plans or programs.
5As described above, Philips acquired shares via repurchase of shares via forward contracts for future delivery of shares and via repurchase in the open market.
6Approximate amount of shares to be purchased is calculated considering the present value of the forward purchase contract obligations.
6.4 Cashflow and liquidity
6.4.1 Cash flows
The movements in cash and cash equivalents balance for the years ended December 31, 2023 and 2024 are presented and explained in the following table.
Philips Group
Condensed consolidated cash flows in millions of EUR
| | | | | | | | | |
| | 2023 | 2024 |
| Beginning cash and cash equivalents balance | | 1,172 | | 1,869 | |
| Net cash flows from operating activities | | 2,136 | | 1,569 | |
| Net cash flows from investing activities | | | |
| Net capital expenditures | | (554) | | (663) | |
| Other cash flows from investing activities | | (82) | | 90 | |
| Net cash flows from financing activities | | | |
| Treasury shares transactions | | (662) | | (410) | |
| Changes in debt | | (181) | | (83) | |
| Dividend paid to shareholders of the company | | (2) | | (1) | |
| Other cash flow items | | (81) | | 43 | |
| Net cash flows from discontinued operations | | 123 | | (13) | |
| Ending cash and cash equivalents balance | | 1,869 | | 2,401 | |
Net cash flows from operating activities
Net cash flows from operating activities amounted to an inflow of EUR 1,569 million in 2024, compared to an inflow of EUR 2,136 million in 2023. This decrease is mainly due to the payments in connection with the Respironics economic loss settlement in the US and working capital outflows, partly offset by the Respironics insurance receipt. Free cash flow* amounted to a cash inflow of EUR 906 million in 2024, compared to an inflow of EUR 1,582 million in 2023.
Net cash flows from operating activities amounted to an inflow of EUR 2,136 million in 2023, compared to an outflow of EUR 173 million in 2022. This increase is mainly due to higher cash earnings and lower working capital, and includes a EUR 141 million payment related to the previously announced resolution of the economic loss class action in the US. Free cash flow* amounted to a cash inflow of EUR 1,582 million in 2023, compared to an outflow of EUR 961 million in 2022.
Net cash flows from investing activities
Net cash flows from investing activities consist of net capital expenditures and other cash flows from investing activities.
In 2024, other cash flows from investing activities amounted to a cash inflow of EUR 90 million, mainly due to proceeds from divested businesses and cash receipt with respect to foreign exchange derivative contracts.
In 2023, other cash flows from investing activities amounted to a cash outflow of EUR 82 million, mainly due to a new business acquisition and minority investments, partly offset by divestment proceeds.
Net cash flows from financing activities
Net cash flows from financing activities consist of treasury shares transactions, changes in debt, dividend paid and other cash flow items.
In 2024, treasury shares transactions mainly includes share repurchases as part of the EUR 1.5 billion share repurchase program for capital reduction purposes that were announced on July 26, 2021 and completed on April 12, 2024 as well as related withholding taxes, and share repurchases for long-term incentive plans, which resulted in EUR 410 million net cash outflow. Changes in debt mainly includes the new bond issuance of EUR 700 million and bond redemption of EUR 547 million, partly offset by debt repayments.
In 2023, treasury shares transactions mainly included the share buyback activities, which resulted in EUR 662 million net cash outflow. Changes in debt mainly includes new bonds issued of EUR 500 million and loan repayments amounting to EUR 500 million. The dividend was distributed fully in shares.
Other cash flow items
In 2024, Other cash flow item amounted to a inflow of 43 million, is due to foreign currency impact on the cash balance
In 2023, Other cash flow item amounted to a outflow of 81 million, is due to foreign currency impact on the cash balance
Net cash flows from discontinued operations
In 2024, net cash provided to discontinued operations was EUR 13 million, mainly related to the tax claims from the previously divested business.
In 2023, net cash provided by discontinued operations was EUR 123 million, mainly related to a refund received of advance tax payments of a previously disposed business.
6.4.2 Liquidity position
As of December 31, 2024, the Philips Group had access to available liquidity of EUR 3,405 million (2023: EUR 2,883 million) including cash and cash equivalents and a EUR 1 billion committed revolving credit facility, compared to gross debt of EUR 7,639 million (2023: EUR 7,689 million).
Philips Group
Liquidity position in millions of EUR
| | | | | | | | | |
| | 2023 | 2024 |
| Cash and cash equivalents | | 1,869 | | 2,401 | |
| Listed equity investments at fair value¹ | | 14 | | 4 | |
| Committed revolving credit facility | | 1,000 | | 1,000 | |
| Liquidity | | 2,883 | | 3,405 | |
| | | |
| Short-term debt | | (654) | | (526) | |
| Long-term debt | | (7,035) | | (7,113) | |
| Debt | | (7,689) | | (7,639) | |
| | | |
| Net available liquidity resources | | (4,806) | | (4,233) | |
In 2024, Philips extended the maturity of its EUR 1 billion committed revolving credit facility to 2029. The facility can be used for general group purposes, such as a backstop for its Commercial Paper Program.
Philips’ Commercial Paper Program amounts to USD 2.5 billion, under which commercial paper can be issued up to 364 days in tenor, both in the US and in Europe, in any major freely convertible currency. As of December 31, 2024, Philips had no commercial paper outstanding.
Philips established a Euro Medium Term Note (EMTN) program which facilitates the issuance of notes for a total amount of up to EUR 10 billion. In 2024, Philips issued EUR 700 million fixed rate notes due 2032 under the program for general corporate purposes, including the repayment of existing debt.
The company’s liquidity risk management procedures have not changed significantly during 2024. The access to existing lines of credit remains intact. These lines of credit, along with other financial risks to which Philips is exposed, are disclosed in Details of treasury and other financial risks. Further, with respect to potential claims related to the Respironics recall, please refer to Contingencies. Management continues to monitor the risks associated with such potential claims and its impact on liquidity position, if any. Philips’ existing long-term debt is rated BBB+ (with stable outlook) by Fitch, Baa1 (changed from negative to stable outlook in 2024) by Moody’s, and BBB+ (changed from negative to stable outlook in 2024) by Standard & Poor’s. As part of our capital allocation policy, our net debt position is managed with the intention of retaining our strong investment grade credit rating. Ratings are subject to change at any time and there is no assurance that Philips will be able to achieve this goal. Philips’ aim when managing the net debt position is dividend stability and a pay-out ratio of 40% to 50% of adjusted income from continuing operations attributable to shareholders. Philips’ outstanding long-term debt and credit facilities do not contain financial covenants. Adverse changes in the company’s ratings will not trigger automatic withdrawal of committed credit facilities or any acceleration in the outstanding long-term debt (provided that the USD-denominated bonds issued by Philips in March 2008 and 2012 contain a ‘Change of Control Triggering Event’ and the EUR-denominated bonds contain a ‘Change of Control Put Event’). A description of Philips’ credit facilities can be found in Debt.
Philips Group
Credit rating summary
| | | | | | | | | | | |
| Long-term | Short-term | Outlook |
| Fitch | BBB+ | | Stable |
| Moody’s | Baa1 | P-2 | Stable |
| Standard & Poor’s | BBB+ | A-2 | Stable |
Philips pools cash from subsidiaries to the extent legally and economically feasible. Cash not pooled remains available for local operational needs or general purposes. The company faces cross-border foreign exchange controls and/or other legal restrictions in a few countries, which could limit its ability to make these balances available on short notice for general use by the group.
Philips believes its current liquidity and direct access to capital markets is sufficient to meet its present financing needs.
6.4.3 Cash obligations
Contractual cash obligations
The following table presents a summary of the Group’s fixed contractual cash obligations and commitments as of December 31, 2024. These amounts are an estimate of future payments, which could change as a result of various factors such as a change in interest rates, foreign exchange, contractual provisions, as well as changes in our business strategy and needs. Therefore, the actual payments made in future periods may differ from those presented in the following table:
Philips Group
Contractual cash obligations1 2 in millions of EUR | | | | | | | | | | | | | | | | | |
| | Payments due by period |
| Total | Less than 1 year | 1-3 years | 3-5 years | After 5 years |
| Long-term debt | 7,168 | | | | 2,006 | | 1,338 | | 3,824 | |
| Short-term debt | 525 | | 525 | | | | |
| Interest on debt | 1,792 | | 197 | | 368 | | 325 | | 902 | |
| Derivative liabilities | 72 | | 64 | | 8 | | | |
| Purchase obligations³ | 1,161 | | 300 | | 307 | | 210 | | 344 | |
| Trade and other payables | 1,830 | | 1,830 | | | | |
| Contractual cash obligations | 12,548 | | 2,916 | | 2,689 | | 1,873 | | 5,070 | |
1Amounts in this table are undiscounted
2This table excludes post-employment benefit plan contribution commitments and income tax liabilities in respect of tax risks because it is not possible to make a reasonably reliable estimate of the actual period of cash settlement.
3Purchase obligations are agreements to purchase goods or services that are enforceable and legally binding for the Group. They specify all significant terms, including fixed or minimum quantities to be purchased, fixed, minimum or variable price provisions and the approximate timing of the transaction. They do not include open purchase orders or other commitments which do not specify all significant terms.
Debt includes forward contracts of EUR 142 million (nominal value) relating to the repurchase of shares to cover long-term incentive and employee stock purchase plans. In 2024, Philips entered into a forward contract for EUR 65 million that matures in 2026 relating to the repurchase of up to 2.5 million shares for long-term incentive and employee stock purchase plans.
Philips offers voluntary supply chain finance programs with third parties, which provide participating suppliers with the opportunity to factor their trade receivables at the sole discretion of both the suppliers and the third parties. Philips continues to recognize these liabilities as trade payables and settles them accordingly on the invoice maturity date based on the terms and conditions of these arrangements. As of December 31, 2024, approximately EUR 97 million (2023: EUR 114 million) of the Philips accounts payable were transferred under these arrangements.
Other cash commitments
The company and its subsidiaries sponsor post-employment benefit plans in many countries in accordance with legal requirements, customs and the local situation in the countries involved. For a discussion of the plans and expected cash outflows, please refer to Post-employment benefits. The company had various provisions by the end of 2024 which are expected to result in cash outflows in 2025. Refer to Provisions. Philips has contracts with investment funds where it committed itself to make, under certain conditions, capital contributions to these funds of an aggregated remaining amount of EUR 130 million (2023: EUR 153 million). Capital contributions already made to these investment funds are recorded as non-current financial assets.
Please refer to Dividend for information on the proposed dividend distribution.
Please refer to Equity for information on other Long-term incentive and employee stock purchase plans. Guarantees
Philips’ policy is to provide guarantees and other letters of support only in writing. Philips does not provide other forms of support. The total fair value of guarantees recognized on the balance sheet amounts to EUR nil million for both 2024 and 2023. Remaining off-balance-sheet business-related guarantees on behalf of third parties and associates amount to EUR 343 million as of December 31, 2024 (December 31, 2023: EUR 2 million). These mainly include bank guarantees secured for insurance companies to cover product liability-related cash flows related to the Respironics recall.
6.4.4 Dividend
Dividend policy
Philips’ dividend policy is aimed at dividend stability and a pay-out ratio of 40% to 50% of adjusted income from continuing operations attributable to shareholders*. Proposed distribution
A proposal will be submitted to the Annual General Meeting of Shareholders, to be held on May 8, 2025, to declare a distribution of EUR 0.85 per common share, in shares or cash at the option of the shareholder, against retained earnings.
If the above dividend proposal is adopted, the shares will be traded ex-dividend at the Euronext Amsterdam as of May 12, 2025, and at the New York Stock Exchange as of May 13, 2025. In compliance with the listing requirements of Euronext Amsterdam and the New York Stock Exchange, the dividend record date will be May 13, 2025.
Shareholders will be given the opportunity to make their choice between shares and cash between May 14 and June 2, 2025, for shares traded at the New York Stock Exchange, and between May 14 and June 3, 2025, for shares traded at Euronext Amsterdam. If no choice is made during this election period, the dividend will be distributed in shares.
Of the total dividend distribution to all shareholders (up to EUR 786 million), a maximum of 50% will be available for payment in cash. If shareholders in total elect to receive an aggregate amount of cash dividend that exceeds the maximum percentage of the total dividend amount, those shareholders who elected to receive their dividend in cash will receive their cash dividend on a pro-rata basis, the remainder being distributed in shares.
The number of share dividend rights entitled to one new common share will be determined based on the volume weighted average price of all traded common shares of Koninklijke Philips N.V. at Euronext Amsterdam on May 30, June 2 and June 3, 2025. The company will calculate the number of share dividend rights entitled to one new common share (the ratio), such that the gross dividend in shares will be approximately equal to EUR 0.85. The ratio and the number of shares to be issued will be announced on June 5, 2025. Delivery of new common shares and payment of the dividend, with settlement of fractions in cash, if required, will take place from June 6, 2025.
| | | | | | | | | | | |
| Ex-dividend date | Record date | Distribution from |
| Euronext Amsterdam | May 12, 2025 | May 13, 2025 | June 6, 2025 |
| New York Stock Exchange | May 13, 2025 | May 13, 2025 | June 6, 2025 |
Further details will be given in the agenda with explanatory notes for the 2025 Annual General Meeting of Shareholders. The proposed distribution and all dates mentioned remain provisional until then.
Dividend in shares distributed out of retained earnings is subject to 15% dividend withholding tax, but only in respect of the par value of the shares (EUR 0.20 per share). Shareholders are advised to consult their tax advisor on the applicable situation with respect to taxes on the dividend received.
Dividends and distributions per common share
The following table sets forth in euros the gross dividends on the common shares in the fiscal years indicated (from prior-year profit distribution) and such amounts as converted into US dollars and paid to holders of shares of the New York Registry:
Philips Group
Gross dividends on the common shares
| | | | | | | | | | | | | | | | | |
| 2020 ¹ | 2021 ¹ | 2022 ² | 2023 ² | 2024 ¹ |
| in EUR | 0.85 | | 0.85 | | 0.85 | | 0.85 | | 0.85 | |
| in USD | 0.95 | | 1.03 | | 0.90 | | 0.93 | | 0.92 | |
1In cash or shares at the election of shareholder.
2In shares only.
7 Environmental, Social and Governance
Philips has a long history of doing business sustainably, both in the environmental as well as the social dimension. This is not only a matter of responsible business, it also drives our company success and innovation. We have been recognized as a front-runner in the area of sustainability and for leading the way in, for example, climate action, tax transparency, supplier sustainability and sustainability reporting.
In this chapter, we explain how we act and perform in the environmental and social dimensions, and we describe the main elements of our governance framework.
Our reporting is aligned with the comprehensive and integrated Environmental, Social and Governance (ESG) commitments we have adopted for the period 2020-2025.
Our key ESG commitments
Environmental
We act responsibly toward our planet in line with UN SDGs 12 and 13.
We will maintain carbon neutrality and use 75% renewable energy in our operations by 2025. We have set ambitious targets to reduce CO₂ emissions in our entire value chain in line with a 1.5 °C global warming scenario (based on Science Based Targets).
We will generate 25% of our revenue from products, services and solutions contributing to circularity, and offer responsible take-back on all professional medical equipment by 2025.
We will embed circular practices at our sites and put zero waste to landfill by 2025.
We will design all new product introductions in line with our EcoDesign requirements by 2025, with ‘EcoHeroes’ accounting for 25% of hardware revenues.
We work with our suppliers to reduce the environmental footprint of our supply chain in line with a 1.5 °C global warming scenario (based on Science Based Targets).
We engage with our stakeholders and other companies to drive sustainability efforts addressing the United Nations Sustainable Development Goals.
Social
Our purpose is to improve people’s health and well-being through meaningful innovation, in line with UN SDG 3. We act responsibly toward society and partner with our stakeholders.
We aim to improve the health and well-being of 2.5 billion people per year by 2030, including 400 million people in underserved communities.
It is our strategy to lead with innovative solutions to deliver real change – helping our customers achieve better health outcomes, a better experience for patients and staff, and lower cost of care, as well as helping people take better care of their health.
We aim to be the best place to work for our employees, providing opportunities for learning and development, promoting an inclusive workplace that reflects the diversity of our community through fair hiring and promotion practices, and assuring a safe and healthy work environment. We pay at least a living wage and aim for employee engagement above the high-performance norm.
Through our supplier development program we will improve the lives of 1 million workers in our supply chain by 2025.
We actively engage with and support the communities in which we operate, e.g., through volunteering, internships, and STEM (Science, Technology, Engineering, Mathematics) initiatives.
We contribute to the Philips Foundation, an independent foundation (stichting) organized under Dutch law, which aims to provide access to quality healthcare for disadvantaged communities.
We consider our tax payments as a contribution to the communities in which we operate, as part of our social value creation.
Governance
We aim to deliver superior long-term value for our customers and shareholders, and seek to live up to the highest standards of ethics and governance in our culture and practices.
Our management structure and governance combine responsible leadership and independent supervision.
Our integrated operating model defines how we work together to delight our customers and achieve our company goals, leveraging our global scale and capabilities.
Enabling the delivery of patient-centric, safe, and high-quality care – the essence of patient safety and quality – is foundational to Philips’ purpose to improve the health and well-being of people through meaningful innovation.
Our remuneration policy is designed to focus employees throughout the Philips Group on pursuing our purpose and delivering on our strategy, and to motivate them to create superior, long-term stakeholder value. Our executive annual incentives and long-term incentive plan are partly based on ESG objectives.
Our General Business Principles set the minimum standard for our business conduct as a health technology company, for our individual employees and for our subsidiaries, and serve as a reference for the business conduct we expect from all our business partners.
Our risk management is designed to provide an appropriate level of assurance that strategic and operational objectives are met, legal requirements complied with, and the integrity of the company’s reporting and related disclosures are safeguarded.
We are transparent about our plans, activities, results and contributions to society (e.g., tax reporting, and engaging with shareholders, customers, business partners, governments and regulators through a variety of platforms).
ESG governance
The above is an overview of our current key ESG commitments. Through these commitments and the underlying ESG programs, metrics, road maps, goals and targets we specify and operationalize the ambitions in our 2020-2025 ESG plan. The Board of Management, including the Chief ESG & Legal Officer, is responsible for the design and management of our 2020-2025 ESG plan and typically convenes the Group Sustainability team and (where relevant) Business, Region or Function leaders four times per year on ESG matters. During these meetings, the Board of Management defines Philips’ ESG strategy, commitments, programs, action plans and policies, as well as oversees major transactions, monitors progress on ESG priorities, and takes corrective action where needed. Progress on ESG is communicated internally and externally on our results website on a quarterly basis and at least annually to the Executive Committee and the Supervisory Board. The ultimate oversight of the ESG dimensions, and their integration into the company’s overarching strategy, is a responsibility of the Supervisory Board as a whole because of the significance of ESG matters. While retaining this overall responsibility, the Supervisory Board is supported by the Audit Committee, which meets quarterly to discuss significant developments in impacts, risks and opportunities, developments in ESG reporting, and other relevant topics. Please refer to the Supervisory Board report for the Supervisory Board members with specific ESG and sustainability expertise, and the Supervisory Board's ESG-related activities during the year. The Supervisory Board as a whole has sufficient ESG and sustainability-related expertise relevant to the sector in which the company is operating, also considering the way we address impacts, risks and opportunities with respect to the material topics identified through our Double Materiality Assessment. Furthermore, both our Board of Management and our Supervisory Board leverage all relevant expertise through their direct access to the Group Sustainability team and (where relevant) external experts.
Nothing in our ESG commitments or other related statements should be read or construed to represent or imply a guarantee or any other legally enforceable obligation vis-à-vis our stakeholders. We do what is reasonable and practical, and we actively partner with our stakeholders to achieve our aspirational goals and targets, while acknowledging and weighing economic and practical constraints and other external factors that may limit our ability to control environmental and social impacts, in particular beyond our own operations. It is furthermore noted that our ESG efforts and our globally applying aspirational goals and targets, including but not limited to those related to diversity, inclusion and well-being, are subject to our compliance with local rules and regulations, some of which may conflict across jurisdictions.
7.1 Environmental
Our global operations and supply chain impact the environment, yet our greatest potential impact is in our downstream value chain through the sustainable design of our products and solutions. Through this work, we contribute to UN Sustainable Development Goals (SDG) 12 and 13.
This section provides an overview of key environmental indicators relevant to our ESG commitments. Our focus is on the material topics identified through our Double Materiality Assessment – climate change and resource use and circular economy – but we also address Biodiversity and Ecosystem Services as some rating agencies expect us to provide information on this.
7.1.1 Measuring our environmental impact
Philips has been performing Life Cycle Assessments (LCAs) since 1990. These LCAs provide insight into the lifetime environmental impact of our products. They are used to steer our EcoDesign efforts by reducing the environmental impact during the lifetime of our products and to grow our Green/EcoDesigned/EcoHero and Circular portfolio. Beyond that, for the eighth year, we have measured our environmental impact on society at large via an Environmental Profit & Loss (EP&L) statement, which includes the hidden environmental costs associated with our activities and products. It provides insights into the main environmental hotspots and innovation areas to reduce the environmental impact of our products and solutions.
The EP&L statement is based on LCA methodology, in which the environmental impacts are expressed in monetary terms using conversion factors developed by CE Delft. As we gain new insights and retrieve more and better data in the future, we will be able to enhance the methodology, use-cases and accuracy of results. For more information and details refer to our methodology document.
Environmental Profit & Loss statement 2024
Philips reduced its EP&L impact in 2024 to EUR 3.82 billion, compared with the EP&L impact of EUR 4.21 billion in 2023. This is mainly due to differences in sales mix.
The most significant environmental impact, 48% of the total, is related to the use of sold products, which is due to electricity consumption. Human toxicity (mainly linked to electricity generation), particulate matter formation, and climate change are the key environmental impact categories contributing to this result. The environmental costs include the environmental impact of the lifetime of the products that we put on the market in 2024, e.g., 10 years in the case of an MRI machine or five years in the case of a Sonicare toothbrush. Products identified as rentals are the only exception, with an energy consumption of one year. As we expand our EcoDesign activities, with the aim to have all our new product introductions in line with our EcoDesign requirements by 2025, we expect to better report on the environmental impact in the years to come.
Of the total 2024 impact, just EUR 272 million (7%) is directly related to Philips’ own operations, mainly driven by outbound logistics, followed by business travel. This impact is similar to 2023 (EUR 261 million) with the slight increase due to increased business travel.
Our materials and components supply chain, including raw materials supply, processing, waste, volatile organic compounds, and water, as well as packaging, has an environmental impact of some EUR 1.71 billion, which is 45% of our total environmental impact. The main contributors are the electronic components (including printed circuit boards), cables and metals used in our products. Through our Circular Economy and Supplier Sustainability programs we continue to focus on reducing the environmental impact caused by the materials we source and apply in our products. With the insights gained through the EP&L, we aim to optimize our climate impact by providing our Businesses with actionable insights.
Notes on the EP&L statement
•The definition of the use-case scenarios has a significant impact on the result, especially for consumer products, which have large sales volumes, long lifetimes and typically high energy consumption.
•The current EP&L statement only includes the hidden environmental costs. It does not yet include the benefits to society that Philips generates by improving people’s health and well-being through our products and solutions. We have a well-established methodology to calculate the number of lives we positively touch with our products and solutions. We aim to look into valuing these societal benefits in monetary terms in the future.
•The EcoInvent 3.9.1 data set was used for 2023 and 2024 reporting.
7.1.2 Climate change
Climate change has been a material topic for Philips for many years. Research from the Potsdam Institute for Climate Impact Research shows that over 4% of global Greenhouse Gas (GHG) emissions are caused by the healthcare sector. Therefore, we are taking action to rethink our business models and decouple economic growth from the impact we have on the environment. We believe large corporations should lead the transition to a low-carbon economy. This will not only reduce the impact on the environment but will also positively impact social and economic aspects. For example, transitioning from air to ocean freight frequently leads to cost savings, and designing energy efficient products can help hospitals reduce their operational expenditure.
Carbon neutral operations since 2020
During the COP21 United Nations Climate Conference in Paris in 2015, we committed to become carbon-neutral in our own operations, pursue all efforts to reduce our operational emissions, source all our electricity from 100% renewable sources, and offset all unavoidable emissions by year-end 2020. We delivered on a comprehensive program that included energy-efficiency improvements, on-site renewables, and Power Purchase Agreements, as well as transport mode shifts to low-carbon-emitting alternatives. As a result, we have significantly reduced our operational carbon footprint compared to the baseline 2020.
Since 2020, Philips has been carbon-neutral in its own operations (Scope 1, Scope 2, and Scope 3 - business travel and transportation & distribution). Although we prioritize carbon reduction, our comprehensive carbon offsetting program is still necessary to ensure carbon neutrality in our own operations.
Philips Group
Net operational carbon footprint in kilotonnes CO2-equivalent
| | | | | | | | | | | | | | | | | |
| Metric | 2020 | 2021 | 2022 | 2023 | 2024 |
| Gross operational carbon footprint | 518 | 519 | 438 | 418 | 474 |
| Carbon credits cancelled | 518 | 519 | 438 | 418 | 474 |
| Net operational carbon footprint | 0 | 0 | 0 | 0 | 0 |
In 2024, we experienced an increase in our operational carbon footprint compared with 2023. This has primarily been driven by increased air travel of our employees, for example to meet with customers, as well as a significant uplift of the air freight emission factors. We have introduced key performance indicators with the aim to reverse this development.
Reducing our value chain emissions
The majority of our environmental impact either resides downstream during the use phase or upstream as part of our purchased goods and services. Therefore, we are teaming up with both internal and external stakeholders to ensure we reduce our climate impact, not only in our operations, but throughout our value chain.
In 2024 we reduced our value chain emissions by 596,769 tonnes CO2-equivalent (CO2-e) compared with 2023 and 2,994,720 tonnes CO2-e compared with our 2020 Scope 3 baseline. This is primarily driven by differences in sales mix (reduction in sales of impactful products), energy efficiency improvements and reduction in purchased goods emissions.
Philips Group
Carbon emissions across Philips value chain in kilotonnes CO2-equivalent
2024
To continue to drive down our emissions across our value chain we remain focused on the following objectives:
•designing energy-efficient products and collaborating with our customers to reduce emissions during the use-phase
•minimizing our purchased goods emissions by adopting circular economy practices and transitioning to more sustainable materials
•collaborating with our suppliers to reduce emissions in our supply chain
•reducing emissions from logistics by optimizing route planning and exploring sustainable alternatives
•transitioning to lower carbon energy at our sites
Emissions are monitored and managed on at least a quarterly basis and reviewed on a Business-by-Business basis through key performance indicators.
Philips reports all its emissions in line with the Greenhouse Gas Protocol.
Recognition
Our efforts are acknowledged by CDP (formerly known as the Carbon Disclosure Project), a global NGO that assesses the greenhouse gas emission performance and management of reporting companies. In 2024, we were ranked on the CDP Climate Change ’A’ List for our continued climate performance and transparency for the 13th consecutive year.
Actions related to the achievement of our targets are governed by our Environmental policy, which incorporates input from Philips' regulatory, design, sustainability, supply chain, and operations stakeholders, as well as the voice of our customers.
7.1.3 Resource use and circular economy
A circular economy aims to decouple economic growth from the consumption of natural resources and ecosystems by optimizing their use, eliminating waste and pollution, and circulating products and materials for as long as possible, while giving natural systems the opportunity to regenerate themselves. The way we take, make and use materials not only impacts resource scarcity, but also has a significant impact on both climate and nature, as 45% of global GHG emissions come from the way products are made and used, and more than 90% of biodiversity loss stems from extraction and processing. Electronic waste is one of the fastest growing waste streams in the world. At the same time, the healthcare industry is also a resource-intense industry which, according to the Circularity Gap Report 2020, uses 10% of materials extracted globally, every year. Bringing this back to Philips’ impact on the planet, our use of materials accounts for 40% of our total environmental impact based on our EP&L methodology, which includes raw material supply, manufacturing, waste and packaging. Therefore, in addition to the use of renewable energy and energy efficiency, the transition to a circular economy will be essential to meet our global climate goals and to protect nature.
The Circular Economy program at Philips ran for the 12th year in 2024, building on more than 30 years’ experience of applying resource efficiency through our sustainability programs. Our ambition is to help our customers and consumers to ‘do more with less’ and drive the circular transformation across the value chain together with our partners. We apply Philips’ circularity principles ‘use less, use longer and use again’ across five strategic areas.
Circular Economy program: five strategic areas
Across these strategic areas for circularity, we have set ambitious targets to help us deliver on our commitments to generate 25% of our revenue from products, services and solutions contributing to circularity; design all new product introductions in line with our EcoDesign requirements; embed circular practices at our sites and put zero waste to landfill; and offer responsible take-back on all professional medical equipment by 2025.
In 2024, Philips increased its circular revenues to 24%, a step-up of 4 percentage points compared with the previous year, mainly driven by contributions from circular design. Philips also achieved 100% EcoDesigned new product introductions (NPIs). This is the first year of disclosing the results of this target.
In 2024, Philips achieved 94% circular materials management, compared with 91% in 2023. This is because of improved operational waste management, for instance through reuse of materials and through establishing new partnerships for previously non-recycled materials. We achieved our zero waste to landfill commitment in 2024 as we did in 2023, with 0.0% waste to landfill.
In 2024, Philips continued to ‘close the loop’ on large medical equipment while also extending the commitment to small medical equipment. As a result, Philips has reclaimed more than 8,600 systems and pieces of equipment in 2024. This is a decrease compared with 2023, mainly affected by fewer Philips systems and equipment made available, influenced also by market conditions.
Beyond Philips' 2025 circularity targets, we also look at the impact of the targets on our material flows. There, we do not only look at the total weight of materials from products, parts and packaging that we deliver to customers and consumers, but also how we help to optimize products while in use and what happens to them at end-of-use (see accompanying visual).
Philips leverages partnerships to help scale the circular economy globally. For example, we are a key member of the Global Circularity Protocol led by the World Business Council for Sustainable Development. Together with UN Environment Program One Planet Network, we use a global business framework to set targets, measure and disclose progress on circularity. We are also a long-standing partner of the Ellen MacArthur Foundation.
Philips’ circular journey is furthermore closely connected with the developments around regulations, metrics and reporting. Together with other companies, Philips is actively supporting global and national governments in creating impactful and practical laws, regulations, and guidelines. For instance, we have a leading role in the Dutch Circular Economy Agenda.
EcoDesign
We see a growing demand from our customers, including hospitals and retailers, to help them reduce the environmental impact of their own operations and beyond. To support their environmental ambitions, we are working to reduce the environmental impact of our products over the total life cycle. However, the development and use of our products and services incorporating AI may require more energy than similar products or services not incorporating AI. As a product’s environmental impact is influenced by decisions made at the design stage, embedding EcoDesign in our product development cycle is essential.
The EcoDesign program focuses on four areas – energy, substances, circularity and packaging – aiming to increase energy efficiency, avoid the use of hazardous substances, optimize the use of materials and improve packaging across the product life cycle.
In 2024, 100% of our NPIs were EcoDesigned, driven by full adoption of the EcoDesign requirements for hardware NPIs in our Business Units. Our EcoHero revenues amounted to 21.9% compared with 15.9% in 2023. Historically, most EcoHero contributions relate to improvements in energy use. In 2024, packaging and circularity (weight reduction and sustainable materials) were the fastest growing contributors.
In addition to these target metrics, we also measure Green Innovation Spend and Green Revenues. Investments in Green Innovation in 2024 amounted to EUR 263 million compared with EUR 142 million in 2023, driven by projects that develop new EcoDesigned products and technologies, and by innovation projects that maintain existing EcoDesigned products. Green Revenues amounted to EUR 13.8 billion in 2024, or 76.4% of sales (compared with 70.5% in 2023). The results reflect the growth of our portfolio of Green and EcoDesigned products and services, and reporting improvements.
7.1.4 Other environmental information
Biodiversity and ecosystem services
Philips recognizes the importance of healthy ecosystems and biodiversity for our company, our employees, and society, even though we have not identified this as a material topic through our Double Materiality Assessment. Since 2021, Philips has a natural capital program, focusing on reducing our chemicals footprint and water consumption, and on improving biodiversity and ecosystem services.
By creating healthy ecosystems, the biodiversity and ecosystem services (BES) program supports the mitigation of nature and climate-related risks for our sites, as assessed in the Task Force on Climate-Related Financial Disclosures (TCFD) report.
In 2024, as part of the (BES) program, Philips evaluated the total area and ecological value of each manufacturing site, establishing a baseline to measure improvements in future years. Together with our partners, we are working to develop more advanced BES metrics suitable for industrial areas.
Philips Group
Biodiversity and ecosystem service improvements
| | | | | |
| Year | BES improvement |
| 2022 | •BES Ambassador training at our manufacturing sites •Manufacturing sites delivered some 80 potential measures to enhance biodiversity on-site •Tracked BES performance at our manufacturing sites with a ecosystem services mapping tool to identify ecosystems that provide services to our facilities |
| 2023 | •Implemented 23 biodiversity improvement measures selected for manufacturing sites •Completed activities, as planting native trees in India, creating flower gardens in China, and creating habitats for endangered bee species in Central America |
| 2024 | •Established an internal metric to drive biodiversity activities in manufacturing sites based on land-use •Implemented 16 BES improvements on 21,000 m2 in our manufacturing sites •Implemented four BES improvements impacting 35,000 m2 •Supporting and engaging with local communities |
Activities in and around our manufacturing sites consider the biome, endangered ecosystems, climate risks, local restrictions and needs of the community and employees. For example, in 2024, we re-designed the customer-facing entrance at our Colorado Springs site to only include drought resistant, native plants, as the site is in a water-stressed area. Our site in Zhuhai, China, we unsealed the parking lots to improve water permeation during heavy rains and therefore reduce flood and drought risks and improve soil health. Our site in Batam, Indonesia, engaged its employees and management in planting trees, which provide fruit to employees, blossoms to pollinators, and shade, and help reduce air pollution. The manufacturing site in Costa Rica supported a sanctuary for endangered wildlife, to combat biodiversity loss in rainforests. Employees around the world also engaged in clean-ups, and biodiversity workshops. Such efforts contribute not only to environmental goals but also to making Philips a 'best place to work', one of our ESG commitments.
Philips considers improving biodiversity on its own land as a important first step toward reducing biodiversity impact in other parts of its value chain.
By systematically quantifying and reducing the environmental impact of our operations, our supply chain and the use-phase of our products, we aim to actively protect and restore biodiversity loss.
7.2 Social
As a leading health technology company, it is our purpose to improve people’s health and well-being through meaningful innovation. Our people are key to delivering on our promise of impact with care – we aim to be the best place to work for people who share our passion.
7.2.1 Improving people’s lives
Lack of access to affordable, quality care is one of the most pressing issues of our time. Climate change is exacerbating this situation and putting the lives of millions of people at risk. At Philips, we are conscious of our responsibilities toward society and the planet. We aim to improve the lives of 2.5 billion people a year by 2030, including 400 million medically underserved individuals.
To ensure we remain on track to achieve this goal, we have developed an integrated approach that tells us how many lives have been improved by our products and solutions in a given year. We call this our lives improved model, and it helps us to track our performance on a country-by-country basis in line with UN SDG 3, allowing us to shape strategies 'to ensure healthy lives and promote well-being for all at all ages'. In 2024,
we improved the lives of 1.96 billion people, of which 242 million were in medically underserved communities. The increase in lives improved was mainly driven by our Monitoring, Enterprise Informatics and Image Guided Therapy businesses, as well as efforts by the teams in Greater China, Latin America, the Indian Subcontinent and the Middle East, Türkiye and Africa.
Philips understands that it is necessary to have a deep understanding of the relationship among all stakeholders and their specific needs in order to support underserved communities. By combining the strengths of Philips, Philips Ventures, Philips Foundation, and its partners, we aim to make a positive impact by providing access to effective and affordable healthcare for those in greatest need, and improve health outcomes for all. Philips' reported Lives improved results only include contributions by Philips Group.
For more information, please refer to Lives improved methodology.
Philips Group
Lives improved per Region/Zone
| | | | | | | | | | | |
| Lives improved (million) | Population (million) | Saturation rate (as % of population) |
| Asia-Pacific | 132 | 1,036 | 13 | % |
| Belgium, the Netherlands, Luxembourg | 25 | 30 | 83 | % |
| Central Eastern Europe | 78 | 155 | 50 | % |
| Germany, Austria, Switzerland | 83 | 102 | 81 | % |
| France | 44 | 69 | 64 | % |
| Greater China | 551 | 1,441 | 38 | % |
| Iberia | 46 | 58 | 79 | % |
| Italy, Israel, Greece | 46 | 81 | 57 | % |
| Indian Subcontinent | 106 | 1,652 | 6 | % |
| Japan | 52 | 125 | 42 | % |
| Latin America | 193 | 645 | 30 | % |
| Middle East, Türkiye, Africa | 120 | 1,805 | 7 | % |
| Nordics | 20 | 28 | 71 | % |
| North America | 367 | 375 | 98 | % |
| Russia, Central Asia | 53 | 252 | 21 | % |
| UK & Ireland | 41 | 74 | 55 | % |
7.2.2 Our organization, people and culture
In 2024, we have built upon the foundation laid in 2023. We have made significant strides in refining our operating model, and inspiring and generating commitment among our workforce. Our dedication to patients, customers, consumers and our people has strengthened, and we have evolved our organizational culture and capabilities.
Our People transformation goals for 2024 were threefold: renew our culture, increase leadership and people capabilities, and continue to simplify our ways of working to deliver our purpose and plan to create value with sustainable impact.
Our culture
In 2024, we introduced a new culture framework centered on 'impact with care' for patients, people and the planet. This framework focuses on patient safety, quality, and integrity, supported by four cornerstones: Clarity and Simplicity, Execution and Performance, Accountability and
Empowerment, and Learning and Collaboration. We remain committed to our transformation journey. We will continue to refine and strengthen our approach, ensuring that 'impact with care' becomes deeply ingrained in every aspect of our operations.
We recognize that embedding our culture happens by living it, and that small changes catalyze systemic shifts. A key achievement in this process was engaging 3,000 people leaders on our purpose, strategy, and culture, laying a strong foundation for organizational alignment. To support our transformation, we increased the visibility of key performance metrics across the organization, fostering transparency and accountability. We also launched a company-wide performance management system aligned with our new cultural cornerstones, improving goal clarity and accountability.
We attach great importance to the health and well-being of our workforce and to creating an environment of inclusion and belonging, where all employees feel psychologically safe. This is not only a matter of responsible business, it also drives our company success and innovation. When we embrace diverse perspectives and attract and retain engaged employees from a wide range of backgrounds, we create better products, services and solutions for our customers and communities.
We are also committed to being an equal-opportunity employer, ensuring that all hiring, promotions, and pay decisions are based solely on merit, qualifications and performance. We do not discriminate on the basis of factors as race, color, age, gender, religion, or any other status in our recruitment, hiring, training, promotion, compensation or employment practices.
Our People Engagement Survey saw increased participation, with a response rate of 84% (almost 58,000 employees). Despite the ongoing changes within the organization, we observed a positive trend in our Employee Engagement Index, with an increase of 5 percentage points to 78% in 2024. While this improvement is encouraging and indicates that the organization is adapting well to the changes, it is worth noting that this figure is still 2% below the high performance norm.
At Philips, we strive for an injury-free and illness-free work environment. Since 2016, the Total Recordable Cases (TRC) rate and Lost Workday Injury Case (LWIC) rate have been defined as key performance indicators. A recordable case is defined as a case where an injured employee undergoes medical treatment or sustains an occupational illness. LWICs are defined as occupational injury cases where an injured person is unable to work for one or more days after the injury. We set yearly TRC rate targets for the company, Businesses and manufacturing and R&D sites. We recorded 151 TRCs in 2024, a 12% reduction compared with 2023. The TRC rate decreased from 0.24 per 100 FTEs in 2023 to 0.21 in 2024. We also recorded 77 LWIC. This represents a 14% decrease compared with 90 in 2023. The LWIC rate decreased to 0.11 per 100 FTEs in 2024, compared with 0.12 in 2023.
Leadership and people capabilities
In terms of talent development, we have made significant progress. Internal mobility reached 30%, demonstrating our commitment to developing internal talent. Women now represent 33% of senior leadership positions, where our 2025 target is 35%. Overall employee turnover decreased to 14.8%, down from 17.6% in 2023, indicating improved retention strategies. Notably, we increased retention of top talent, with turnover in this group decreasing from 12.3% in 2023 to 6% in 2024. We also increased hiring for medtech and functional expertise to bolster our capabilities in critical areas. From a learning, engagement, and growth perspective, 3,164,129 hours of personal and professional development were formally registered in 2024.
Simplifying how we work
Nearing the end of the second year of our operating model, we made significant strides in refining our approach and addressing key areas for improvement. We remain focused on successfully executing our three-year plan and are determined to further build on our industry-leading innovations, improve our fundamentals, simplify how we work, and ensure we are more competitive and more agile. Our efforts focused on fine-tuning resources and decision rights, improving portfolio management, implementing integrated and customer-driven product management, advancing commercial excellence, and accelerating our service capabilities.
Innovation and impact remained at the forefront of our efforts. We initiated cross-functional innovation teams focused on patient-centric solutions.
Our focus on patient safety, quality, and integrity, coupled with our commitment to empowering our people and driving innovation, positions us strongly to achieve our goal of improving the lives of 2.5 billion people a year by 2030.
7.2.3 Employment
The total number of Philips employees was 66,678 at the end of 2024, compared with 69,656 at the end of 2023, a decrease of 2,978 employees. The total number of non-employees (contingent workers) in headcount at Philips at the end of 2024 was 1,741.
Philips Group
Employees per worker type in Headcount
| | | | | | | | |
| 2023 | 2024 |
| Philips employees | 68,039 | 66,678 |
| Contingent workers | 2,163 | 1,741 |
| Total | 70,202 | 68,419 |
By year-end 2024, Philips completed its previously announced plans to reduce its workforce by 10,000 roles globally by 2025. These reductions were part of our multi-year plan designed to create value with sustainable impact, and Philips sought to support those who were directly impacted by the reductions in finding new roles.
Subject to local country legislation, our support offers include:
•social plan or respective severance policy
•outplacement services and support through our Employee Assistance Program
•work placement agency, where applicable, for employment-to-employment support
•redeployment – where possible – as applicable by local legislation and in the context of the hiring restrictions
Philips Group
Employees per segment in FTEs at year-end
| | | | | | | | | | | |
| 2022 | 2023 | 2024 |
| Diagnosis & Treatment | 26,840 | 25,773 | 24,544 |
| Connected Care | 19,759 | 17,385 | 16,829 |
| Personal Health | 7,858 | 7,535 | 7,991 |
| Other | 22,777 | 18,963 | 18,459 |
| Philips Group | 77,233 | 69,656 | 67,823 |
Philips Group
Employment in FTEs at year-end
| | | | | | | | | | | |
| 2022 | 2023 | 2024 |
| Balance as of January 1 | 78,189 | 77,233 | 69,656 |
| Consolidation changes: | | | |
| Acquisitions | 87 | 27 | |
| Divestments | (33) | (353) | (227) |
| Other changes | (1,010) | (7,251) | (1,606) |
| Balance as of December 31 | 77,233 | 69,656 | 67,823 |
Geographic footprint
Approximately 56% (2023: 56%) of the Philips workforce is located in Mature geographies and 44% (2023: 44%) in Growth geographies. In 2024, the number of employees in Mature geographies decreased by 1,066. The number of employees in Growth geographies decreased by 768.
Philips Group
Employees per geographic area in FTEs at year-end
| | | | | | | | | | | |
| 2022 | 2023 | 2024 |
| Western Europe | 19,297 | 16,900 | 16,537 |
| North America | 20,618 | 18,094 | 17,544 |
| Other mature geographies | 4,576 | 4,105 | 3,952 |
| Mature geographies | 44,491 | 39,099 | 38,033 |
| Growth geographies | 32,742 | 30,558 | 29,790 |
| Philips Group | 77,233 | 69,656 | 67,823 |
In addition, the below table shows the spread of employees across countries where Philips has the highest presence in terms of headcount (at least 10% of the total employee population).
Philips Group
Employees headcount in countries representing at least 10% of total workforce
| | | | | |
| Country | Number of employees |
| USA | 16,639 |
| The Netherlands | 8,566 |
| India | 8,166 |
| China | 6,716 |
All reported employee data is actual and based on year-end numbers. Employees are defined as individuals who are in an employment relationship with the undertaking according to national law or practice.
Philips employees include permanent (with an undefined end-date contract) and temporary (with a defined end-date contract) employees. There is no non-guaranteed hours employment (without a guarantee of a minimum or fixed number of working hours) at Philips.
7.2.4 Human rights
Philips believes that companies have both the responsibility to respect human rights and the ability to protect them. Philips’ Human Rights Policy, General Business Principles, Supplier Sustainability Declaration and other relevant policies guide our actions, in line with the International Bill of Human Rights and the International Labor Organization’s Declaration on Fundamental Principles and Rights at Work.
Philips also follows the guidance in the UN Guiding Principles on Business and Human Rights and the Organization for Economic Co-operation and Development (OECD) Guidelines for Multinational Enterprises.
The Philips Board of Management is ultimately responsible for setting the human rights strategy and managing human rights. It is supported by a cross-functional project team, composed of a human rights manager and professionals from several Businesses, and it drives initiatives with oversight from the Human Rights Steering Committee, consisting of senior leaders from Integrated Supply Chain, Legal, People, and Group Sustainability.
In 2024, we continued to develop our due diligence strategy by conducting Human Rights Impact Assessments (HRIAs). Philips conducted HRIAs at its sites in China and Indonesia, living up to its commitment of conducting regular HRIAs at 100% of its at-risk sites. Philips intends to monitor the progress and findings from at-risk sites and take them on a continuous improvement journey regarding human rights topics.
Although the HRIA of selected sites is primarily focused on Philips' own operations, a derived deep-dive approach for certain suppliers has been established since 2022. For five suppliers, a focused assessment on human rights was conducted in 2024; this is distinct from the broader supplier sustainability assessment approach, which covers sustainability more holistically.
Our Human Rights Report contains detailed information regarding our progress, targets, and plans for continuous improvement.
7.2.5 Supplier sustainability
Sustainability is a focus for the Integrated Supply Chain Function, which is actively collaborating with our partners, whether these be component suppliers or energy or logistics providers. Close cooperation with our suppliers not only helps us deliver health technology innovations, but it also supports new approaches that help us minimize our environmental impact and maximize the social and economic value we create.
In 2024, our programs focused specifically on improving supplier sustainability performance, advancing human rights, responsibly sourcing minerals, and reducing the environmental footprint of our supply base by driving the adoption of Science Based Targets.
The sustainability performance of our suppliers is fully embedded in our procurement strategy and ways of working. We have a direct (tier 1) business relationship with approximately 4,400 product and component suppliers and 15,100 service providers. Social and environmental issues deeper in our supply chain also require us to intervene beyond tier 1 suppliers. We want to make a difference through sustainable supply management and responsible sourcing. This is more than just managing compliance – it is about collaborating with our supply partners to make a positive and lasting impact.
Through the Supplier Sustainability Performance program, our maturity-based approach to drive continuous improvement, we improved the lives of approximately 936,000 workers in our supply chain in 2024 (2023: 723,000). Collaborating with our strategic partners, we increased the number of deep-dives at tier 2 suppliers, actively supporting them to become more effective in their own sustainability engagement approaches toward their suppliers.
7.2.6 Philips Foundation
Stichting Philips Foundation, an independent foundation organized under Dutch law, is a registered charity established in 2014. In 2024, Royal Philips supported Philips Foundation with a contribution of EUR 6.7 million and provided the operating staff as well as the expert assistance of skilled volunteers in the execution of the Foundation’s programs.
Philips Foundation’s mission is to reduce healthcare inequality by providing access to quality healthcare for underserved communities through meaningful innovation. It does this through the provision and application of Philips’ healthcare expertise, innovation power, talent and resources, as well as through financial support. Together with key partners around the globe (e.g., nonprofit organizations, academic partners, and entrepreneurs), Philips Foundation seeks to identify challenges where a combination of healthcare technology expertise and partner experience can be used to create meaningful solutions that have a positive impact on people’s lives.
Philips Foundation works in projects (grant-based) and through impact investments (e.g., loans or equity). The instrument depends on the status and self-sustainability of the respective healthcare technology in serving more disadvantaged communities.
7.3 Governance
As reflected through our key commitments in the governance dimension, we aim to deliver superior long-term value for our customers and shareholders, and we seek to live up to the highest standards of ethics and governance in our culture and practices. Building on those commitments, this chapter describes the main elements of our governance framework that enable us to operationalize our purpose by adopting a fully integrated approach to doing business responsibly and sustainably.
7.3.1 Corporate governance
Management and oversight responsibilities and accountability within our company are ultimately guided by the corporate governance of the parent company of the Philips group, Koninklijke Philips N.V. (Royal Philips). Royal Philips is a company organized under Dutch law and its shares have been listed on the Amsterdam stock exchange (Euronext Amsterdam) and on the New York Stock Exchange.
Royal Philips has a two-tier board structure consisting of a Board of Management and a Supervisory Board, each of which is accountable to the General Meeting of Shareholders for the fulfillment of its respective duties. The members of the Board of Management, supported by the other members of the Executive Committee, drive the company’s management agenda and share responsibility for the continuity of the Philips group, focusing on sustainable long-term value creation. Our independent Supervisory Board supervises the Board of Management and the Executive Committee and advises them on general policies related to the activities of the company, including setting and executing the strategy of the Philips Group.
The company is governed by Dutch corporate and securities laws, its Articles of Association, and the Rules of Procedure of the Board of Management and the Executive Committee and of the Supervisory Board, respectively. Its corporate governance framework is also based on the Dutch Corporate Governance Code (dated December 20, 2022) and US laws and regulations applicable to Foreign Private Issuers.
In its Corporate governance report, the company addresses the main elements of its corporate governance structure, reports on how it applies the principles and best practices of the Dutch Corporate Governance Code, and provides the information required by the Dutch governmental Decree on Corporate Governance (Besluit inhoud bestuursverslag) and governmental Decree on Article 10 Takeover Directive (Besluit artikel 10 overnamerichtlijn). When deemed necessary in the interests of the company, the company may deviate from aspects of the company’s corporate governance structure, and any such deviations will be disclosed in the company’s Corporate governance report.
7.3.2 The Philips integrated operating model
Our operating model is designed to enable us to deliver on our purpose, driving impact and creating value for our stakeholders. And to do so responsibly and sustainably, ensuring patient safety, quality, compliance and integrity in everything we do. The model is intended to promote accountability and agility, based on the following fundamentals:
•We serve our customers and consumers with patient safety and quality at the core of everything we do.
•Our Business Units are in the lead and accountable for value creation through their value streams.
•Our Regions and Functions enable value stream execution.
•Our leaders and teams are empowered to prioritize and allocate their resources for impact.
Our operating model integrates five organizational elements. We ensure alignment of the elements to deliver on our strategic objectives, with clear accountability to drive flawless execution.
•Strategy
•Structure & Governance
•People & Culture
•Performance Management
•Policies, Processes, Systems & Data
The main governance aspects of our operating model are further explained below. More information on our strategic focus, as well as our approach to people and culture, can be found in Strategic Focus and Our Organization, people and culture, respectively. Structure and governance
In order to meet the needs of patients, customers and consumers, our empowered Business Units are supported by the Regions and Functions.
Business Units, Businesses and segments
Our Business Units are in the lead accountable for value creation through their value streams. Our Business Unit leaders have full accountability for meeting customer needs and their end-to-end P&L, including patient safety and quality and supply chain performance. Business Units are broken down into business categories, where relevant.
The Businesses are lean, and their leaders ensure consistent alignment among the Business Units’ strategies and goals. They also execute performance management toward the Business Units, including target setting.
Our segment leaders ensure strategic execution and focus cross-Business, and they are held accountable by the Board of Management for the results of their underlying Businesses/Business Units. The three segments are Diagnosis & Treatment, Connected Care and Personal Health, as also disclosed in our external reporting.
Regions
We are organized in three Regions: North America, Greater China and International Region (the latter consisting of Europe and Growth areas). Within our Regions, we further organize by Zones and countries. The Regions’ primary accountability is to manage customer intimacy, build and maintain relationships, and cultivate understanding of their needs, as well as carry out (strategic) account management, service delivery, and indirect partner management. They are also accountable for government relations and for providing the local infrastructure needed to support Philips’ presence in a country (license to operate).
Functions
Our Functions’ core objective is to drive excellence (for reasons of skill, scope and scale) across the organization. Functions deliver cost-effective services, ensure legal and regulatory requirements are met, and propose enterprise policies, standards, guidance and infrastructure, as well as build and share capabilities and expertise.
Performance management
We set ambitious targets and closely manage performance through a disciplined and focused operating cadence. Our performance management system is based on an annual planning cycle, in which we translate our vision and strategy into objectives and plans. The cycle starts with strategic planning, where we define our long-term ambitions, both financial and non-financial, and set our long-term priorities. Each year, Philips’ strategic plan is translated into an annual operating plan, underpinned with Business Unit plans. Detailed plans to achieve the company’s targets are cascaded into the organization and, ultimately, people’s personal objectives, making clear what performance and behaviors are expected from them.
Policies, processes, systems and data
The 'freedom within a frame' we offer our Business Units provides a framework of policies, processes, systems and data principles that apply throughout the organization. It allows them flexibility to adapt to specific requirements in order to meet specific Business Unit needs.
Enterprise-wide policies provide high-level mandatory rules that are applicable across the company and apply to all Philips employees. All enterprise-wide policies are maintained through a standard process and approved by the Board of Management. Function leaders can set more specific policies and standards within their mandate.
Philips’ processes are captured in our process framework, where we manage end-to-end connections and define the critical process elements (including the ‘what’ and ‘how’, roles and responsibilities, systems and data, and compliance requirements). The process framework provides the foundation for all our management systems, including quality, environmental, and health and safety, to ensure a compliant approach for processes, systems, data and competencies for a specific management area.
7.3.3 Patient safety, quality and regulatory
Enabling the delivery of patient-centric, safe, and high-quality care – the essence of patient safety and quality – is foundational to Philips’ purpose to improve the health and well-being of people through meaningful innovation. The Patient Safety and Quality organization brings together the quality and regulatory affairs functions as one unified team in close coordination with the Medical Office. This team is positioned to support the Philips organization in fostering the quality culture and implementing the capabilities, processes, and tools required for operating in the highly regulated healthcare technology industry. This structured approach promotes non-conformance management, high standards of product quality, and compliance. The Chief Patient Safety and Quality Officer is a member of the Philips Executive Committee and reports directly to the Chief Executive Officer.
Our processes are designed to address specific or potential negative impacts to patients, customers or consumers and include:
•maintaining effective Quality Management Systems
•tracking Corrective and Preventive Action (CAPA) performance and supporting those who are accountable for the performance and reporting results ultimately to the Board of Management
•performing external audits for compliance and standards certification
•performing internal audits
•having quarterly reviews by the Quality & Regulatory Committee of the Supervisory Board
As part of the complaint management framework, Philips investigates customer feedback as necessary, utilizing the CAPA approach to help address and resolve complaints. A centralized system collects, manages, addresses and stores feedback from customers.
Teams in all Businesses, Regions, and Functions foster a quality culture and mindset, where all employees are encouraged to speak up and share ideas for improving the safety and efficacy of our products. In October 2024, our employees took part in a dedicated Timeout for Patient Safety and Quality to solidify this personal commitment and planning. We also continued to strengthen the Patient Safety and Quality performance review meetings with each Business individually and in the aggregate. We set Patient Safety and Quality key performance indicators for the company in 2024, and Quality performance metrics are part of the remuneration of all Philips executives. Additionally, every Philips employee has a Patient Safety and Quality goal as part of annual people performance management.
Quality
We strive to continuously raise our performance to deliver safe and high-quality products, services, and solutions, which are compliant with quality and safety standards and all applicable laws. In 2024, we continued to simplify how we work and improve accountability and ownership, and further strengthened our engineering capabilities for product development in areas such as quality systems engineering, reliability and software design.
We further reduced the number of Quality Management Systems (QMS) in which we operate and continued our investment in systems, capabilities and training to reduce complexity and improve execution effectiveness.
Regulatory Affairs
Regulatory Affairs, with representation on the leadership team of each Business and Region, further strengthened internal governance and requirements for engagements with national government regulatory authorities, such as the US Food and Drug Administration (FDA), European Medicines Agency (EMA), China's National Medical Products Administration, notified bodies, and national competent authorities in the European Union (EU).
As a global business in a dynamic regulatory environment, Regulatory Affairs bolsters Philips’ compliance with evolving regulations related to innovations in areas such as artificial intelligence, healthcare informatics, and software design. Sought as strategic partners, the Regulatory Affairs team participated in international consensus standards groups alongside regulators and engaged with international regulators as invited experts and speakers at the International Medical Device Regulators Forum, Global Harmonization Working Party, and other meetings. Regulatory Affairs is working with the National Institutes of Health in the US to establish ethical applications of artificial intelligence in medical devices.
Medical Office
The Medical Office is a global team of medical and scientific experts working within and across Philips Businesses and is led by the Chief Medical Officer, who reports directly to the Chief Executive Officer. The role of the Medical Office is to help drive meaningful innovation through excellence in medical safety, medical affairs, health economics, and clinical research.
The Medical Office focuses on supporting our Businesses, navigating the intricacies of addressing patients’ and customers’ unmet needs across a variety of ecosystems, and looking across the entire product life cycle to help teams develop solutions that are safe, effective, and relevant for patients and healthcare providers.
The team is responsible for the design, generation, and sharing of clinical and economic evidence to show the value of our innovations in terms of enhancing the patient and care provider experience, improving patient outcomes, and increasing healthcare system productivity. The team collaborates with healthcare providers, and medical and scientific communities, as well as with private healthcare payers, governments and policy makers, to expand access to, and ensure widespread use of, our innovations.
In 2024, we expanded the Philips Medical Office, further enhancing our expertise in medical affairs, clinical research, medical safety and health economics and strengthening the voice of the patient and healthcare providers in the company. We implemented the Philips Safety Board as an independent cross-functional forum chaired by the Philips Chief Medical Officer to guide and support the Businesses on pre- and post-market product safety and risk evaluations.
The team continued our advocacy and investment combating non-communicable diseases, including cardiovascular disease and stroke, as well as radiation safety, medical device testing, and improved access to physician and staff training, among others. Our health economics team continued to contribute economic evidence to support innovation and expand access to high-quality care.
7.3.4 General Business Principles (GBP)
While pursuing our business objectives, we aim to be a responsible partner in society, acting with integrity towards our employees, customers, patients, business partners and shareholders, as well as the wider community in which we operate. To that end, our GBP – part of the Philips operating model – and their underlying policies incorporate and represent the fundamental principles by which all Philips Businesses and employees around the globe must abide. They set the minimum standard for our business conduct as a health technology company, for our individual employees and for our subsidiaries, and Philips rigorously enforces compliance. Our GBP also serve as a reference for the business conduct we expect from all our business partners.
The GBP were updated in 2024 to include legal developments and input from stakeholders, including internal Functions (e.g., Group Sustainability, People, Legal). The Universal Declaration of Human Rights, the UN Convention against Corruption and other standards served as a reference. The GBP include principles of doing business with integrity at work, integrity in the market, and professional integrity outside work. They set our integrity standard on inside information, aiming to prevent trading on or disclosure of non-public information, the publication of which would likely have a significant influence on the trading price of Philips securities or securities of companies that Philips is seeking to acquire. More specifically, Philips has adopted rules of conduct, governing the purchase, sale and other dispositions of Philips securities, that we believe are reasonably designed to promote compliance with applicable insider trading and other market abuse laws, rules and regulations (in particular the EU Market Abuse Regulation) and applicable listing standards. The rules of conduct apply to all employees, the members of the Board of Management and the Supervisory Board of Royal Philips. The GBP also include principles on conducting business with honesty and integrity, and they explicitly prohibit corrupt practices, acts of bribery and facilitation payments. More detailed guidance is included in the policy on Anti-Bribery and Anti-Corruption, which is explicitly referenced and forms an integral part of the GBP.
The GBP form an integral part of labor contracts and business partner agreements. Translations of the GBP are available in 30 languages, allowing almost every employee to read the GBP in their native language. Detailed underlying policies, manuals, training, and tools are in place to give employees practical guidance on how to apply and uphold the GBP in their daily work environment. Each year, employees reconfirm their commitment to the code of conduct after completing their GBP e-learning, and there is an additional annual signed commitment for executives. A similar signed commitment is in place for finance and procurement staff for their respective codes of conduct. The Philips Supervisory Board is trained annually on Philips GBP through a dedicated online course.
The Executive Committee is responsible for the effective deployment of the GBP and for promoting a culture of compliance and ethics within the company. At least twice a year, the Executive Committee and Audit Committee of the Supervisory Board are informed on relevant GBP metrics, cases, trends and learnings. Furthermore, each quarter, all of our key Regions convene market compliance committees dealing with GBP-related matters in the local context. They are also responsible for the design and execution of localized compliance plans that are tailored to their risks and organizational set-up, and regularly review the relevant compliance metrics for their respective market through dashboards delivered by the legal compliance monitoring team. The GBP program office, together with a worldwide network of GBP compliance officers, supports the implementation of GBP initiatives.
As part of our continuous effort to raise GBP awareness and foster dialogue throughout the organization, each year a global GBP communications and training plan is deployed, including structured dialogues led by managers where quality, integrity and speaking up are discussed. This is part of a company-wide initiative aimed at reinforcing a culture of dialogue using ethical dilemma case studies that are relevant to our workforce. Almost 54,200 (97%) of our assigned employees completed their yearly GBP e-learning. All Functions at risk (including those with customer-facing roles, such as sales and marketing, clinical and technical consultants and employees that provide customer-facing training) also receive, via tailored case studies, annual training. The training includes content on anti-bribery and anti-corruption practices and healthcare compliance. In 2024, these trainings were conducted through in-person training sessions. Of 13,000 at-risk employees, 78% were trained in 2024, with in-person sessions to continue in 2025 for the remaining employees.
The GBP monitoring and reporting program, part of our internal control framework, measures implementation of our GBP. In addition, we continue to expand the capabilities of our legal compliance monitoring team, serving our business customers as well as our compliance networks with actionable data, thus further improving our internal control framework.
The GBP are supported by Philips SpeakUp program. Philips SpeakUp program, and its underlying policies and procedures, aligns with relevant legislation on whistleblowing (including but not limited to Directive (EU) 2019/1937) to ensure reporters are protected from (attempted) retaliation. SpeakUp ensures standardized reporting and enables employees and third parties to escalate concerns 24/7. Concerns raised through this SpeakUp program are registered consistently in a single database hosted outside of Philips servers to ensure confidentiality and security of identity and information. Further details on how Philips ensures the protection of reporters of potential GBP violations, and ensures an independent and impartial review of concerns, can be found in the Philips SpeakUp Policy. Encouraging people to speak up through the available channels if they have a concern will continue to be a cornerstone of our GBP training, communications and awareness campaigns.
GBP compliance officers and SpeakUp investigators receive training on following up on SpeakUp concerns in line with Philips SpeakUp Policy and investigation guidelines. Specifically in 2024, we again focused on increasing awareness about integrity and on emphasizing the importance of speaking up. This built on the deployment in 2023 of our biennial Business Integrity Survey, in which more than 22,500 employees trusted us with their views and opinions on integrity within Philips. The results showed 79% of the respondents feel comfortable addressing concerns related to the GBP. The next Business Integrity Survey will be deployed in 2025, along with an updated GBP e-learning.
In 2024, a total of 805 concerns were reported via Philips SpeakUp (Ethics Line) and through our network of GBP compliance officers. This represents an increase of 5% from the total of 764 concerns in the previous reporting period (2023). This is a continuation of a year-on-year upward trend.
Through the Audit Committee of the Supervisory Board, the company also has procedures in place for the receipt, retention and treatment of complaints specifically relating to accounting, internal accounting controls, or auditing matters, enabling the confidential, anonymous submission of complaints.
7.3.5 Cybersecurity
Failure to meet cybersecurity standards may cause patient harm, negatively impact customer operations and their ability to provide healthcare, or provide unauthorized access to patient records and medical devices. Philips relies on information technology to operate and manage its Businesses, as well as store and process confidential data (relating to patients, employees, customers, intellectual property, suppliers and other partners). For a discussion of cybersecurity risks facing our business, see “Products and services may fail quality or security standards, which could adversely affect patient safety or customer operations" and “Philips could be exposed to a significant enterprise cybersecurity breach” in section Operational risks. As of the date of this Annual Report, we have not identified any breaches of cybersecurity or other related risk threats that have materially affected or are reasonably likely to materially affect our business. The aim of our security risk management is to protect the confidentiality, integrity, and availability of Philips products and services, and it is part of our broader risk management and internal control framework described in Risk management and internal control. The Board of Management is responsible for the design and management of Philips’ cybersecurity, which is ultimately overseen by the Supervisory Board (and specifically its Audit Committee). Quarterly reports on cybersecurity risks and incidents are prepared by the IT Audit & Risk Committee (consisting of representatives from the Group Security and Group IT Functions, Philips Internal Audit and the external auditor) and submitted to the Board of Management and the Supervisory Board. This reporting includes the overall risk level, relevant changes in the risk environment, challenges in reaching and/or maintaining current risk levels, and actual risk responses in the form of actions and owners. The Group Security Function maintains a security management framework, which includes processes, requirements and controls for the assessment, identification and management of material risks from, among others, cybersecurity threats. The framework, including cybersecurity policies and procedures, is designed to promote implementation of security requirements in all applicable processes, information processing systems and infrastructure pertaining to our products and services and our supporting and enabling Functions. The framework includes risk, vulnerability and penetration assessments; mandatory yearly security training for all employees (including phishing simulations for all employees multiple times a year); and monitoring and response activities for vulnerabilities identified in products, services and infrastructure.
Our Head of Group Security, reporting to our Chief Financial Officer, leads the Group Security Function in supporting the Board of Management in evaluating and setting the security strategy, issuing security policies, and evaluating the progress and effectiveness of the deployment of the company’s security management framework. Our Chief Information Security Officer, reporting to our Head of Group Security, has nearly 27 years of technology and information security management experience in the industry, including prior roles with the Dutch Government and multinationals in the consumer goods, manufacturing, chemical and food processing industries, in various roles ranging from chief information security officer to IT security officer and security architect. Our Chief Information Security Officer is informed of and monitors the prevention, detection, mitigation and remediation of cybersecurity incidents through the Global Security Operations Center.
Group Security is also responsible for addressing security risks, including monitoring cybersecurity threats and responding to cybersecurity incidents. The Philips Global Security Operations Center, with the leadership of the Chief Information Security Officer, is the hub for the prevention, detection, mitigation and remediation of cybersecurity incidents on global enterprise systems, supported by certain external services and periodic/intermittent assessments. The severity and materiality of incidents are assessed through a dedicated security incident reporting process and, if necessary, incidents are escalated to the major event team that may hand off to central crisis management and (potentially) to the Philips Disclosure Committee, which assesses the need for public disclosure of (material) incidents. When needed, incidents are further escalated to Global Crisis Management.
Additionally, in order to address the security risks associated with our suppliers and the services they provide, security controls are embedded in our procurement and supplier management processes, covering due diligence when engaging with new suppliers; contracting, monitoring and managing existing supplier relationships; and terminating supplier relationships. These security controls include assessing existing security certificates and assurances reports for the services in scope, validating suppliers’ answers to security questionnaires in due diligence, and ensuring that security schedules are part of the signed contracts.
7.3.6 Remuneration framework
Aligned with one of our key ESG commitments, the objectives of our remuneration framework are to focus employees throughout the Philips Group on pursuing our purpose and delivering on our strategy, and to motivate them to create superior, long-term stakeholder value. Thus, our remuneration framework is designed to support the company’s overall performance and our commitment to drive progressive value creation through a strategy of focused organic growth, scalable patient- and people-centric innovation, and reliable execution.
We aim to attract, retain and motivate world-class talent by offering market-competitive and fair compensation. We position ourselves competitively against our peers through external benchmarking, and we offer ranges that enable us to reward exceptional performance. We also set fair and internally consistent pay levels by taking into account internal relativities, and we are committed to equal pay and ensuring that all employees receive at least a living wage.
Employee share ownership is stimulated through our employee share purchase plan, to create alignment with shareholder value and to encourage employees to act as stewards and ambassadors of the company.
A part of remuneration of Philips executives is variable and linked to achieving our strategic imperatives through the criteria and targets included in the Annual and Long-Term Incentives. The achievement/payout of the Annual Incentive is partly based on a financial element (70% weight),
with financial performance metrics that are aligned with the strategic priorities for the year. The non-financial element of the Annual Incentive (30% weight) reflects the importance of factors relating to the company’s priorities (patient safety and quality, strengthening supply chain reliability, and the simplification of our operating model), as well as our Environmental, Social and Governance (ESG) performance. The achievement/vesting of LTI is also partly based (20% weight) on ESG objectives, reflecting the importance of ESG to our company and its increasing relevance to our stakeholders (as a strategic matter and in the context of our risk management), and to incentivize management’s focus on our policy objective to deliver superior, long-term value to our stakeholders, while acting responsibly towards our planet and society.
With respect to variable compensation, our employment contracts include claw back provisions. These allow us to recoup variable remuneration in case of (among others) violations of the Philips General Business Principles. This is one of the means to uphold ethical behavior.
The remuneration and benefit arrangements applicable to the broader executive and/or employee population in the Netherlands largely also apply to the members of the Board of Management. The remuneration of the individual members of the Board of Management is determined by the Supervisory Board, taking into account the Remuneration Policy for the Board of Management adopted by the General Meeting of Shareholders in 2024. A description of the composition of the remuneration paid and owed to the individual members of the Board of Management (and the Supervisory Board) is included in the Remuneration Report 2024.
7.3.7 Tax contribution
To fulfill our company purpose, a responsible tax approach is required. We fully acknowledge our societal role when it comes to paying taxes in the geographies where value is created. We consider our tax payments as a contribution to the communities in which we operate, and part of our social value creation.
Our approach to tax sets the standard for our conduct, by which individual employees, the company and its subsidiaries must abide. We consider tax in the context of the broader society, inspired by our stakeholder dialogues, human rights advocacy, international tax laws and regulations, relevant codes of conduct, and global initiatives of the Organization for Economic Cooperation and Development and the United Nations.
The Chief Financial Officer annually reviews, evaluates, approves and, where necessary, adjusts Philips’ approach to tax. Part of our approach is to acknowledge the importance of transparency in respect of our tax contributions. Philips supports and participates in transparency initiatives such as the Dow Jones Sustainability Index and the Tax Transparency Benchmark of the Dutch Association of Investors for Sustainable Development (VBDO). For the second year in a row, Philips scored full marks and has been awarded the winner of the Tax Transparency Benchmark by VBDO. The team had assessed the tax transparency practices of 51 Dutch companies and 65 EU listed companies from Belgium, Denmark, France, Germany, Italy, Spain, and Sweden. The expert jury appointed by VBDO especially complimented us for publishing a full Country Activity and Tax Report, including a narrative linking Philips’ business and activities to taxation. For example, Philips is one of the only companies in this year’s benchmark that explicitly mentioned the governance aspect of ESG in relation to tax. The jury also noted that in this report we have explicitly linked to the GRI 207 Tax Standard and went beyond to include information on environmental and social factors. Furthermore, the jury commended Philips for the clear description of the role taxes play within its value creation model. In addition, Philips scored a top score (100 out of 100) in the Tax Strategy section of the 2024 Dow Jones Sustainability Index.
The 2024 Country Activity and Tax Report is published on our website in addition to, and simultaneously with, the disclosures on tax included in this Annual Report.
Philips has a tax control framework that forms part of its standard set of Internal Controls over Financial Reporting (ICFR). Philips' tax position is therefore reflected in its financial statements and covered by the Board of Management's report on ICFR. For more on the board's conclusion regarding the effectiveness of ICFR refer to Risk management and internal control. Philips also endorses the ambitions expressed in the Tax Governance Code published by the Dutch employers organization VNO-NCW. We comply with the principles prescribed in the code, available at VNO-NCW, and we have touched upon the elements of this code in our Country Activity and Tax Report.
In 2024, Philips contributed to the communities where we operate through taxes paid (e.g., corporate income tax) and taxes collected (e.g., VAT). Philips' total tax contribution in 2024, amounting to EUR 3,263 million, is presented by tax type in the accompanying table. Please refer to our 2024 Country Activity and Tax Report for more details.
Philips Group
Total contribution 2024 per tax type in millions of EUR
| | | | | | | | | | | | | | | | | | | | |
| Corporate income tax paid | Customs duties | VAT¹ | Payroll tax | Other taxes | Total |
| Western Europe | 62 | 8 | 176 | 854 | 50 | 1,150 |
| North America | 42 | 39 | 122 | 796 | 9 | 1,007 |
| Other mature geographies | 18 | 3 | 69 | 117 | 1 | 208 |
| Growth geographies | 63 | 81 | 350 | 387 | 17 | 898 |
| Philips Group | 186 | 131 | 717 | 2,154 | 76 | 3,263 |
1Includes VAT, GST and sales tax.
7.3.8 Working with stakeholders and advocacy
Our stakeholder engagement helps us deliver on one of our key ESG commitments: to be transparent about our plans, activities, targets, results and contributions to society, and to engage with shareholders, customers, business partners, employees, academics, governments and regulators through a variety of platforms. Through our engagement efforts we pursue and foster an open, meaningful, effective, and informed dialogue regarding our activities and our internal and external stakeholders’ needs, concerns and expectations. We derive significant value from our stakeholders across all our activities and engage with, listen to and learn from them. We incorporate feedback on specific areas of our business into our planning, actions, targets, policies and disclosures. Please also refer to the Philips Stakeholder Engagement Policy available at our website.
The purpose of our advocacy efforts is to contribute to policy development and legislative processes and to support business opportunities in the areas relevant to Philips and its Businesses, for example: health system resilience policies and investment plans; ESG, particularly climate, circularity and green procurement; and digital health, such as AI, data protection, interoperability, cybersecurity, and technological sovereignty.
We participate in meetings and task forces as a member of organizations including the World Economic Forum, World Business Council for Sustainable Development (WBCSD), Responsible Business Alliance (RBA), European Financial Reporting Advisory Group (EFRAG), Dutch Sustainable Growth Coalition, the Ellen MacArthur Foundation, European Round Table for Industry, and the European Partnership for Responsible Minerals.
In organizing ourselves around customers and markets, we conduct dialogues to explore common ground for addressing societal challenges, building partnerships and jointly developing supporting ecosystems for our innovations around the world. We engage with the leading Dutch labor union (FNV) and a number of NGOs, including Enough, GoodElectronics, the Chinese Institute of Public and Environmental Affairs, UNICEF, Amnesty International, Greenpeace, Friends of the Earth, and WageIndicator. We also engage with a variety of investors, analysts, rating agencies, institutional advisory and other organizations, such as Eumedion, ISS, Glass Lewis, VEB and VBDO. Please also refer to Investor information. Customers (including consumers and end-users) are able to voice their concerns and indicate their trust during engagement processes. We invite our stakeholders to engage with us through our website, and we offer dedicated support for consumers and for healthcare professionals. On sustainability matters, including our sustainability reporting in this Annual Report, stakeholders may share their comments and questions via email (philips.sustainability@philips.com). Finally, Philips SpeakUp is available to all stakeholders when they believe their concern relates to a violation of the Philips General Business Principles and underlying policies. More information about Philips SpeakUp, including how Philips protects reporters from retaliation, can be found in General Business Principles (GBP).
7.3.9 Risk management and internal control
Risks related to our strategy
Philips’ exposure to risks is directly impacted by our strategy, as shown in the accompanying table.
A more detailed description can be found in Further information, Risk factors. We do not classify these risk categories in order of importance. It should be noted that although our risk management and internal control systems are designed with the intent to manage risks within our appetite, they cannot provide certainty that this is being achieved.
Risk appetite
We have set different levels of risk appetite, ranging from an averse to a seeking approach.
For more information on our risk appetite, refer to Risk factors. Key elements of our framework
The purpose of our risk management is to identify and analyze the risks Philips faces in executing its strategy and activities, to set the risk appetite of the company, to take appropriate risk responses, and to monitor the effectiveness of responses. Please refer to Risk factors, for a description of each material risk factor that we have identified in four main categories: strategic, operational, compliance and financial and reporting. The objective of our internal control framework is to maintain integrated management control of the company’s operations and reporting, and to safeguard compliance with applicable laws and regulations. As such, risk management and internal control form an integral part of our strategy-setting, business planning and performance review cycles. The governance and process that lie at the core of our enterprise risk management are described in more detail in the following sections. Complementary to our enterprise risk management process, Functions and departments (such as Accounting Reporting and Internal Controls, Legal, Sustainability, Patient Safety and Quality, Operations and Integrated Supply Chain, Finance, Tax, and Group Security) support the Executive Committee and management in specific risk areas. These Functions maintain and deploy designated frameworks, to manage, for example, risks related to business continuity, privacy compliance, environmental matters, insurance and tax.
It is important to note that our risk management and internal control framework cannot provide certainty as to the realization of our objectives, nor can they prevent all misstatements, inaccuracies, errors, fraud or non-compliance with rules and regulations. Also, we note that we may not be successful in deploying some or all of our mitigating actions effectively, or these actions may not achieve the anticipated effect.
Risk management governance
The Board of Management is ultimately responsible for identifying, analyzing and managing the risks Philips faces in executing its strategy and activities, for setting the risk appetite of the company, and for the design, implementation and maintenance of a fit-for-purpose risk management and control system. The system balances risk and opportunity in line with risk appetite, including the monitoring of its effectiveness. The Executive Committee, several experts, enterprise Functions and committees support the Board of Management in the discharge of its responsibilities.
The risk appetite is set by the Board of Management, reviewed at least annually and included in the Philips risk management policy. Risk-taking guidance is operationalized through tone from the top, our culture frame, our General Business Principles and our operating model – such as our strategic plans, performance targets, budgets, accountabilities and authority schedules, policies, management systems, process standards, control standards and our performance review cadence. Furthermore, risk appetite is effected through the risk management process described in this chapter.
The Executive Committee is primarily responsible for identifying and mitigating material risks to Philips. The Executive Committee is supported by the Enterprise Risk Management Support Team, consisting of experts on various categories of risk, through regular analysis of the enterprise risk profile and enhancement of the risk management framework. In addition, management across the company is responsible for identifying critical risks and implementing appropriate risk responses within their areas of responsibility.
Functions maintain and deploy frameworks and activities to structurally manage specific risk areas. To ensure clarity and alignment on the status of, and to make recommendations on, key risk areas these Functions have recurring items on the meeting agenda of the Board of Management. The Board of Management discusses the relevant topics with participation from relevant members of the Executive Committee and other senior executives and subject matter experts. Furthermore, dedicated reports on our key risk areas are shared and discussed with the Supervisory Board and external auditors in the relevant Audit & Risk Committees facilitated by Internal Audit.
The Internal Audit Function has an independent role to evaluate and improve the effectiveness of the organization's governance, risk management and internal controls. The Function assesses the quality of risk management and controls through the execution of a risk-based audit plan, as approved by the Board of Management and the Audit Committee of the Supervisory Board. The Board of Management and leadership from Businesses, Regions/Zones and key Functions meet quarterly with Internal Audit in Audit and Risk Committees to discuss strengths and weaknesses of risk management and controls – as evaluated by internal and external auditors and by means of other (self) assessments – and take corrective action where necessary.
The Disclosure Committee seeks to ensure that the company implements and maintains internal procedures for the timely collection, evaluation, and disclosure of information potentially subject to public disclosure under legal, regulatory and stock exchange requirements.
The Supervisory Board oversees and advises the Board of Management and the Executive Committee with respect to Philips’ risk management, including the identification of material risks in relation to the risk appetite of the company, the maintenance of internal business controls and risk management, and the compliance with applicable laws and regulations. At least once a year, the Supervisory Board discusses the general strategy of the company and the Philips Group, as well as the main risks associated with their business activities, and the results of the assessment by the Board of Management and the Executive Committee of the structure and operation of the systems of internal business controls and any significant changes therein. The Audit Committee and the Quality & Regulatory Committee of the Supervisory Board assist the full Supervisory Board in fulfilling its risk management oversight responsibilities. The Audit Committee reviews the quality of risk management and controls, and the reported findings of internal and external audits. The Quality & Regulatory Committee’s role particularly relates to the compliance of the company’s products (including software), services, and systems throughout their life cycle.
Enterprise risk management process
To develop a comprehensive overview of Philips’ risks, structured risk assessments take place according to the Philips risk management process standard, applying a top-down and bottom-up approach. Our process standard is designed based on Enterprise Risk Management: Integrating with Strategy and Performance (2017) from the Committee of Sponsoring Organizations of the Treadway Commission (COSO) and on ISO 31000 - Risk Management.
Philips enterprise risk management process
•At least once a year, senior management from Businesses, Zones/Regions and key Functions perform a risk assessment as part of their strategic plan update. Risk workshops are facilitated by Internal Audit with senior management across the company to further support these risk assessments. Twelve such risk workshops were held in 2024.
•At least quarterly, senior management discusses and monitors the risk profile and risk response effectiveness in its performance reviews and during Audit and Risk Committees, which cover all Businesses, Zones/Regions and selected Functions.
•During the quarterly Audit and Risk update session, the Board of Management discusses developments in the enterprise risk profile and management’s initiatives to improve risk responses.
•Each year the Executive Committee assesses the enterprise risk profile as an integral part of its strategy review and the potential risk impact versus risk appetite. The assessment also covers the effectiveness of the risk management framework and potential improvements thereto.
•Once a year, the updated risk profile and the risk management framework, including the outcomes of the annual Executive Committee risk workshop, are presented to the full Supervisory Board. The underlying risks and response plans are discussed at the end of the year with the Audit Committee of the Supervisory Board.
Next to our enterprise risk management, various Functions as referred to earlier in this section support the management of specific risk areas. In alignment with the Philips risk management process standard, these Functions maintain and deploy designated frameworks. Examples include but are not limited to security, privacy compliance, trade compliance, business continuity, occupational health, and safety and quality. Through specialist teams at the global, regional or local level, standards and requirements are defined and continuously improved, deployed, and monitored to ensure our employees are aware of and comply with these requirements.
We continuously seek to improve our risk management. The measures taken during 2024 to further strengthen risk management include:
•improved alignment or our risk dialogues with strategy execution and performance review dialogues
•further embedding of our governance and process, system and data requirements in the Philips operating model
•review of our enterprise policy framework
•strengthened our risk management capabilities via upgrades to our risk management tooling and use of data analytics
•created additional insights in risk dynamics, e.g., through risk interdependency analysis and risk velocity analysis using statistical scenario modelling
•continued efforts to standardize and simplify Philips' process standards, including controls. Additionally, further development of our regulatory landscape intelligence to enhance foresight in, and internal communication on, upcoming regulatory change.
•further automation of screening of business partner integrity and of transactions to ensure Export Control compliance
•continued analysis of global warming and weather scenarios on the geographical footprint of our facilities as well as suppliers’, in line with the recommendations of the Task Force on Climate-Related Financial Disclosures
Financial reporting and sustainability reporting
As part of its internal control framework, Philips has implemented a standard set of Internal Controls over Financial Reporting (ICFR). Philips has designed its ICFR framework based on the COSO Internal Control-Integrated Framework (2013). Together with Philips' established accounting
procedures, this standard control framework is designed to provide reasonable assurance that assets are safeguarded, that the books and records properly reflect transactions necessary to permit preparation of financial statements, that policies and procedures are carried out by qualified personnel, and that published financial statements are properly prepared and do not contain any material misstatements.
A structured monitoring process is deployed company-wide to assess, document, review and monitor compliance within ICFR. In each reporting unit, management is responsible for assessing the controls set for their business, risk profile and operations, and for completing the internal control statement certification statement. Deficiencies noted in the design and/or operating effectiveness of ICFR that were not remediated at year-end are reviewed by the Board of Management and the outcome is reported to the Supervisory Board.
Since 2012, Royal Philips engaged an external provider of assurance with respect to its sustainability reporting. Originally, our sustainability reporting and the audit thereof was referencing GRI Universal Standards and Philips-specific criteria. Over the years, Philips continued to develop its internal framework and included sustainability-related risks in its risk management processes. While preparing for the publication of a sustainability statement complying with the Corporate Sustainability Reporting Directive ((EU) 2022/2464) and related European Sustainability Reporting Standards, we leveraged the established ICFR framework and processes, and new sustainability related controls are being designed for internal and external sustainability reporting. We expect to fully implement such new controls in 2025.
8 Supervisory Board
8.1 Letter from the Chairman of the Supervisory Board
Dear Stakeholder,
Nearing the end of the second year of the three-year plan to create value with sustainable impact, Philips has made solid progress on its execution priorities, returned to order intake growth, and delivered strong margin and good cash performance, although sales growth was slower than initially expected. We remain confident in the company’s strategy and dedicated to ensuring Philips delivers patient safety and quality.
Within a challenging macro environment, Philips is focused on creating value out of its portfolio of leadership positions by driving operational improvements and scaling innovation leadership. Philips remains a preferred strategic and innovation partner for its customers, and as a result, has closed a number of sizeable innovation and technology partnerships across the world. Significant progress was made in resolving litigation, and Philips continues to be recognized for its ESG leadership.
Strengthening growth remains at the forefront of the agenda, but even as we see positive developments, we are mindful of the geopolitical landscape, and the impact the external environment has on the company’s performance. For this reason, it’s critical that Philips is sufficiently prepared to weather volatile conditions. Simplification efforts to strengthen agility and competitiveness are essential to achieving this.
The Supervisory Board remains fully committed to its responsibilities to supervise and advise management in leading the company toward a future of progressive value creation with sustainable impact. As explained in our Report, in 2024 we focused on patient safety and quality, the company’s performance and outlook, the long-term value acceleration strategy, and succession planning. We spent significant time on the company’s strategic focus on growth out of its portfolio, with leadership positions and scalable innovation, and improved execution as key value driver. China and North America markets received specific attention – China, given the uncertainties there that are expected to continue, and North America, given its size and strategic nature.
We see that Philips has a clear path forward for sustainable value creation, after reaching an important milestone with the agreement in the Respironics litigation. Under the settlement, Philips Respironics has agreed to pay a total of USD 1.1 billion. Philips Respironics also signed a consent decree, which was court-approved, and Philips concluded an agreement with insurers to cover Respironics recall-related product liability claims. This resolves the personal injury litigation and the medical monitoring class action to end the uncertainty associated with litigation in the US.
After welcoming Exor N.V. as a long-term minority investor in 2023, we were pleased to see Exor increase its stake in Philips in 2024, along with some other significant shareholders. As part of the relationship agreement formed in 2023, Philips also welcomed Benoît Ribadeau-Dumas as a new member of the Supervisory Board, with a four-year term beginning at the 2024 Annual General Meeting of Shareholders.
Looking to the future, we believe Philips is well-positioned to capture growth in attractive markets, enabling better care for more people through sustainable innovation. We remain committed to the plan to create value with sustainable impact and have confidence in the abilities of CEO Roy Jakobs and the management team to deliver on the full potential of the Businesses. The new member of the Board of Management, Chief Financial Officer Charlotte Hanneman, as well as the new Executive Committee members – Ling Liu, Chief Region Leader, Philips Greater China; Jie Xue, Chief Business Leader Precision Diagnosis; and Özlem Fidanci, Chief of International Region and Leader Growth Region – are already generating fresh energy and ideas, helping to build upon Philips’ strong foundation.
Together with my fellow members of the Supervisory Board, I look forward to providing continued oversight as Philips delivers on its purpose of improving people’s health and well-being through meaningful innovation. Thank you to our shareholders and key partners for your support, in 2024 and in the years to come.
Feike Sijbesma
Chairman of the Supervisory Board
8.2 Members of the Supervisory Board
In the two-tier corporate structure under Dutch law, the Supervisory Board is a separate body that is independent of the Board of Management and the company. The Supervisory Board supervises the policies, management and general affairs of Philips, and assists the Board of Management and the Executive Committee with advice where required or requested. Please also refer to Supervisory Board within the company's Corporate governance report. Born 1959, Dutch
Chairman of the Supervisory Board since May 2021
Chairman of the Corporate Governance and Nomination & Selection Committee
Member of the Supervisory Board since 2020; second term expires in 2028
Former CEO of Koninklijke DSM NV (Honorary Chairman) and former non-executive Director of Unilever NV. Co-Chair of the Global Climate Adaptation Center and Member of the Board of Trustees of the World Economic Forum.
Born 1957, Singaporean
Member of the Supervisory Board since 2021; first term expires in 2025
Former Group CEO of Singapore Telecommunications Limited and currently member of the Board of Directors of Prudential plc, Bharti Airtel Limited, Bharti Telecom Limited and Ayala Corporation. Member of the Council of Presidential Advisors of Singapore, the Securities Industry Council and the Dubai Financial Services Authority, Deputy Chairman of the Public Service Commission of Singapore.
Born 1957, British/Irish
Chairwoman of the Audit Committee
Member of the Supervisory Board since 2019; second term expires in 2027
Currently, member of the Supervisory Board and Chairwoman of the audit committee of Novartis AG and of Corbion N.V. Member of the advisory committee of Freya Holdco S.à r.l. Fellow of the Chartered Institute of Management Accountants. Former CFO and board member of Reckitt Benckiser Group PLC, former CFO of Brambles Ltd, former non-executive director and audit committee member at Delhaize Group, Nokia Corp., SABMiller PLC and Dunelm Group PLC. Former non-executive board member of the UK Ministry of Justice and of Her Majesty’s Courts and Tribunals Service (UK) and advisor to GBfoods SA and Affinity Petcare SA (subsidiaries of Agrolimen SA).
Born 1964, American
Member of the Supervisory Board since 2018; second term expires in 2026
Former President and Chief Executive Officer of Intermountain Healthcare and former Chief of International Business Development for Cleveland Clinic and Chief Executive Officer of Cleveland Clinic Abu Dhabi. Currently CEO HATCo (Health Assurance Transformation Company) at General Catalyst.
Born 1957, Austrian
Member of the Supervisory Board since 2020; second term expires in 2028
Former President and CEO of Siemens AG, President of Global Human Health and Member of the Executive Board of Merck & Co., President and CEO of GE Healthcare Bio-Sciences and member of GE’s Corporate Executive Council, CEO and Delegate of the Board of Directors of Renova Management AG. Currently member of the Board of Directors of Telefónica S.A. and CaixaBank S.A. and Chairman of the Supervisory Board of Telefónica Deutschland Holding AG, Non-Executive Director of Thyssen-Bornemisza Group AG and Doha Venture Capital LLC.
Born 1955, American
Member of the Supervisory Board since 2021; first term expires in 2025
Former CFO, President, Chairman and CEO of PepsiCo. Currently member of the Board of Directors and Chair of the Audit Committee of Amazon, Inc. Member of the International Board of Advisors of Temasek, member of the Board of Trustees of the Memorial Sloan Kettering Hospital, trustee of the national gallery of art.
Born 1969, American
Member of the Supervisory Board since 2022; first term expires in 2026
Former Chief Operating Officer at VMware and President at SAP. Currently CEO and President of Cohesity and member of the Board of Directors of Snyk.
Born 1953, British/American
Chairman of the Quality & Regulatory Committee
Member of the Supervisory Board since 2015; third term expires in 2025
Former Chairman and Chief Executive Officer of Allergan, Inc. and former Lead Director of Avery Dennison Corporation. Currently member of the Board of Directors of Alnylam Pharmaceuticals Inc., BioMarin Pharmaceutical Inc. and Pliant Therapeutics. Chairman of the Governing Board of London Business School, member of the Board of Trustees and Executive Committee of the California Institute of Technology, Vice President of the Ophthalmology Foundation and President of the Advisory Board of the Foundation of the American Academy of Ophthalmology.
Born 1972, French
Member of the Supervisory Board since 2024; first term expires in 2028
Former deputy CEO at SCOR, former Chief of Staff to the French Prime Minister, former CEO of Aerosystems, member of the Management Board of Zodiac Aerospace, former SEVP CGG Veritas and former CEO of Thales Underwater Systems. Currently Managing Director at Exor, member of the Board of Directors of Stellantis, Institut Merieux, Merieux Nutrisciences, bioMerieux, TagEnergy and Welltec. Member of the Board of Directors of Galileo Global Education and Cerba Healthcare.
Born 1962, Belgian
Vice-Chairman and Secretary
Chairman of the Remuneration Committee
Member of the Supervisory Board since 2018; second term expires in 2026
Former CEO of Virco, Chairman of Tibotec, worldwide Chair of Pharmaceuticals at Johnson & Johnson and Chief Scientific Officer & member of the Executive Committee at Johnson & Johnson. Currently CEO and Chairman of the Board of Directors of Galapagos NV.
Born 1966, Dutch
Member of the Supervisory Board since 2022; first term expires in 2026
CEO of PostNL, member of the Supervisory Board of ING Groep N.V., member of the Supervisory Board of Het Concertgebouw N.V. and member of the Advisory Board of Goldschmeding Foundation.
For a current overview of the Supervisory Board members, see also https://www.philips.com/a-w/about/supervisory-board.html
1member of the Audit Committee
2member of the Remuneration Committee
3member of the Corporate Governance and Nomination & Selection Committee
4member of the Quality & Regulatory Committee
8.3 Supervisory Board report
The Supervisory Board supervises, advises and challenges the Board of Management in performing their management tasks as well as setting and executing the strategy of the Philips Group with a focus on long-term and sustainable value acceleration and securing its business leadership positions. The members of the Supervisory Board act in the interests of Philips, its Businesses and all its stakeholders in accordance with good governance practices. This report includes a description of the Supervisory Board’s activities during the financial year 2024 and other relevant information on its composition and its functioning.
2024 focus areas and activities of the Supervisory Board
In 2024, the Supervisory Board’s focus was on patient safety and quality, the company’s performance and outlook, the long-term value acceleration strategy, and succession planning. The related near-term and longer-term actions were extensively reviewed and discussed with management, against the geopolitical background and the external environment in which the company operates, and the impact that the macro-economic outlook has on the company’s performance.
Patient safety and quality – Compared to 2023, the Supervisory Board gradually expanded its focus from the Respironics recall to the risks and challenges related to patient safety and quality across all Businesses. Patient safety and quality was a recurring agenda item for each of the (regular) meetings. The Supervisory Board challenged management to remain focused on the safety of patients as the main priority and driver, despite operational and supply challenges. In that context, the Supervisory Board reviewed the process framework for product design and production controls in the company (and other mitigation of quality related risks and challenges) and monitored progress on resolving product quality issues, site inspections, ongoing engagements with the US Food & Drug Administration (FDA) and other competent authorities globally, and the execution of the company-wide program to improve and foster a culture, behaviors and a mindset that puts patient safety and quality first.
The Supervisory Board was regularly updated on the management of the consequences of the Respironics recall. This oversight included, among other things, the settlement of personal injury and medical monitoring claims in the US; the agreement with the US Department of Justice (DOJ) and FDA on the Respironics consent decree; the continued execution of the economic loss class action settlement; the ongoing criminal and civil investigation by the DOJ’s Consumer Protection Branch and Civil Fraud Section; and the investigation by more than 30 US state Attorneys General into possible violations to state deceptive practices statutes; as well as the securities claims in the US and the Netherlands, and the SEC investigation.
Performance and outlook – The Supervisory Board reviewed and tracked progress on 2024 performance, including relevant key performance indicators, such as comparable order intake, comparable sales growth*, Adjusted EBITA* and free cash flow*. Despite the challenging geopolitical and macro-economic environment, the company delivered on its commitments regarding profitability, free cash flow and ESG, in line with guidance and consensus. The Supervisory Board engaged with management on the quarterly performance and outlook, in particularly on phasing and predictability of sales, the quality of earnings and margin improvement.
Value acceleration – In the course of 2024, the focus of the Supervisory Board moved from value creation to a strategy of value acceleration. The Supervisory Board reviewed and tracked progress on the execution of this strategy. In parallel, the Supervisory Board and management engaged in multiple deep-dive sessions on the company’s strategic focus on organic growth and scalable innovation with improved execution as key value driver, as well as the main priorities for each of the segments, Regions and Functions. Specific attention was given to the role of North America and China in the strategy moving forward, given the dynamics of these markets.
Succession planning – The Supervisory Board spent time in 2024 considering its composition, as well as the composition of the Board of Management and the Executive Committee. Attracting candidates with expertise in (consumer) health tech and artificial intelligence continues to be part of the Supervisory Board’s succession planning. Our report includes information on the composition of the Supervisory Board.
The Supervisory Board is very pleased with the appointment of Charlotte Hanneman, at the 2024 AGM, as member of the Board of Management, succeeding Abhijit Bhattacharya as Chief Financial Officer from October 1, 2024, and she has deepened the industry expertise of the Board of Management. The Supervisory Board is grateful to Mr Bhattacharya for his long-term service and leadership. Ling Liu (Chief Greater China Region) has been appointed as new member of the Executive Committee, effective July 1, 2024. Also Özlem Fidanci (Chief of International Region and Leader Growth Region) and Jie Xue (Chief Business Leader Precision Diagnosis) were appointed as new members of the Executive Committee, both effective January 1, 2025. Refer to Report of the Corporate Governance and Nomination & Selection Committee for more information. Other key matters that were reviewed and/or discussed during one or more meetings in the course of 2024 include
•Capital allocation, including the dividend policy and pay-out and the M&A framework, and specifically the company’s flexibility under its capital structure and credit ratings to pay dividends and to fund capital investments, including share repurchases and other corporate finance initiatives.
•The company’s liquidity position and leverage, including the measures taken to strengthen it in light of the financial performance of the company. These measures include the issue of bonds through the Euro Medium Term Note program in May 2024 with the purpose to repay EUR 700 million in existing debt due in 2024 and 2025.
•Geopolitical developments and their impact on Philips’ business, in particular the impact of the Russia-Ukraine war and the situations in Israel and the Middle East, on Philips employees and the (potential) implications on the continuity of Philips’ business in these countries, and the impact of additional tariffs proposed by the new US administration.
•The deterioration in market developments in the China consumer and professional health businesses.
•Regular review of the key performance indicator dashboard, tracking the performance of the 2024 indicators for the Executive Committee versus target.
•Philips’ annual management commitments, including the 2024 key performance indicators for the Executive Committee, the performance on such indicators, and the annual operating plan for 2024.
•Patient safety and quality compliance, systems and processes. The Supervisory Board was regularly updated on past and upcoming FDA inspections at various company sites, including the preparations for and outcomes of such inspections.
•Oversight of the adequacy of the company’s Internal Control over Financial Reporting.
•Enterprise risk management, including updates on and improvements to the relevant processes; the outcome of the annual risk assessment dialogue with the Executive Committee; and an update of the top risks faced by the Philips Group, including the possible impact of such risks, as well as control and mitigation measures. Refer to Risks related to our strategy. •Engagements with shareholders and institutional advisory firms on the revised Remuneration Policy for the Board of Management and the revised Remuneration Policy for the Supervisory Board as adopted at the 2024 Annual General Meeting of Shareholders.
•The company’s People strategy and priorities, employee engagement and retention of employees, review of talent management, leadership and talent development, leadership culture, and equal opportunities for all employees.
•Evaluation of the Board of Management and the Executive Committee and its members, based on the achievement of specific group and individual targets approved by the Supervisory Board at the beginning of the year, as well as the assessment of the main findings and conclusions of last year’s evaluation and the related follow-up.
•Philips’ Environmental, Social and Governance (ESG) approach, including an update on progress made with respect to the 2025 ESG key programs and sustainability commitments. The Supervisory Board was also further educated on requirements related to the company’s sustainability reporting, as well as relevant Dutch and EU regulatory developments. These include but are not limited to the impact on Philips of the EU Corporate Sustainability Reporting Directive (CSRD) and its pending implementation into Dutch law, and the European Corporate Sustainability Due Diligence Directive (CSDDD).Refer also to ESG governance regarding the Supervisory Board's responsibility for the oversight of the ESG dimensions. •The (re-)appointment of the external providers of assurance on the company’s sustainability statements for the years 2024 and 2025, respectively.
•Significant civil litigation claims against, and public investigations into, Philips.
•The agenda for the 2024 AGM (held on May 7, 2024) and the proposed agenda for the upcoming 2025 AGM (to be held on May 8, 2025).
•The market environment for global M&A activities that offered limited opportunities in 2024 driven by growing macro-economic challenges, inflationary pressure and elevated interest rates, as well as the company’s selective approach toward M&A going forward and the (business) performance of companies previously acquired by the company.
•The overall Philips IT landscape and related strategy, including IT simplification and experience improvement.
•The approach to information security, focused on protecting the company, its research and development, and production.
•The updated Tax policy, the expected impact of the OECD pillar One and pillar Two models, and the US Base Erosion and Anti-Abuse Tax (BEAT) liability on the company, as well as the Effective Tax Rate (ETR) over the period 2018-2023.
•The innovation and artificial intelligence strategy and roadmap of each Business.
The Supervisory Board reviewed Philips’ annual and interim financial statements, including information related to ESG, prior to publication.
Supervisory Board meetings and attendance
In 2024, the members of the Supervisory Board convened for seven regular meetings and three extraordinary meetings. Moreover, the Supervisory Board members collectively and individually interacted with members of the Board of Management, with members of the Executive Committee and with senior management outside the formal Supervisory Board meetings. The Chairman of the Supervisory Board and the CEO frequently had bilateral discussions about the company’s progress on a variety of matters.
The Supervisory Board meetings held in 2024 were generally very well attended. The committees of the Supervisory Board also convened regularly (see the separate reports of the committees below) and the committees reported back on their activities to the full Supervisory Board. In addition, the Supervisory Board and Committees held private meetings. The members of the Supervisory Board concluded that they devoted sufficient time to engage (proactively, if the circumstances so required) in their supervisory responsibilities.
In March 2024, two Supervisory Board members visited the European Congress of Radiology in Vienna, Austria, and in August 2024, one Supervisory Board member visited the European Society of Cardiology in London, UK. In June 2024, the Supervisory Board members visited Philips’ Personal Health site in Stamford, Connecticut, US. In September 2024, some Supervisory Board members visited Philips’ Diagnosis & Treatment manufacturing site in Best, the Netherlands.
Supervisory Board: composition, diversity and self-evaluation
The Supervisory Board is a separate corporate body that is independent of the Board of Management and the company. Its independent character is also reflected in the requirement that members of the Supervisory Board can be neither a member of the Board of Management nor an employee of the company. The Supervisory Board considers all its members to be independent under the Dutch Corporate Governance Code, except for one member (i.e., 91%), Benoît Ribadeau-Dumas, to whom the independence exception of best practice provision 2.1.7(iii) of the Dutch Corporate Governance Code is deemed to apply. Furthermore, the members of its Audit Committee are independent under the rules of the US Securities and Exchange Commission applicable to the Audit Committee.
The Supervisory Board currently consists of 11 members and retained critical knowledge and capabilities with the re-appointments of Feike Sijbesma (Chairman) and Peter Löscher, both for a term of four years as per the end of the 2024 AGM. Following a proposal from long-term shareholder Exor N.V., Benoît Ribadeau-Dumas was appointed at the 2024 AGM as a new member of the Supervisory Board, also for a term of four years as per the end of the 2024 AGM.
Anticipating the expiry of the third term of appointment of David Pyott, and his retirement from the Supervisory Board at the end of the 2025 AGM, the Supervisory Board was tasked with identifying a candidate with equivalent medtech and quality and regulatory affairs expertise. As a result, the agenda of the upcoming 2025 AGM will include a proposal to appoint Bob White as new member of the Supervisory Board. The first term of both Indra Nooyi and Chua Sock Koong will expire at the end of the 2025 AGM, and the agenda for that meeting will include proposals to re-appoint them.
The selection of candidates for appointment is always based on merit. The Supervisory Board also attaches value to diversity and has adopted a Diversity Policy to promote diversity at board level. For more information, please refer to Report of the Corporate Governance and Nomination & Selection Committee. The composition of the Supervisory Board furthermore follows its profile as included in the Rules of Procedure of the Supervisory Board. The profile aims for an appropriate combination of knowledge and experience among the members of the Supervisory Board, encompassing general management, international business, ESG and sustainability, (consumer) health and medical technology, patient safety, quality and regulatory, product development, finance and accounting, human resources, manufacturing and supply chain, information
technology and digital, marketing, and governmental and public affairs, all in relation to the global character of Philips’ Businesses. The Supervisory Board also aims for having members with different nationalities and (cultural) backgrounds, working experiences or otherwise diverse qualities, as well as one or more members who have held an executive or similar position in business or society no more than five years ago. The composition of the Supervisory Board shall furthermore be in accordance with the Dutch Corporate Governance Code best practice provisions on independence, and each member of the Supervisory Board shall be capable of assessing the broad outline of the overall policy of the company. The size of the Supervisory Board may vary as it considers appropriate to support its profile.
Any (re-)appointments of members of the Supervisory Board must meet the gender quota, as required by Dutch law, requiring that of the Supervisory Board members at least one-third are women and at least one-third are men. (For calculation purposes, a total number of board members that cannot be divided by three must be rounded up to the next number that can be divided by three.) Currently, the statutory quota is met, as out of 11 Supervisory Board members, four members are female and seven members are male. The quota will also be met upon the proposed re-appointments of Indra Nooyi and Chua Sock Koong, and appointment of Bob White as members of the Supervisory Board at the 2025 AGM.
In 2024, each member of the Supervisory Board completed a questionnaire to verify compliance with the applicable corporate governance rules and the Rules of Procedure of the Supervisory Board. The outcome of this survey was satisfactory. An independent external party facilitated the 2024 self-evaluation process for the Supervisory Board and its committees. This included drafting and submitting relevant questionnaires, interviewing members of the Supervisory Board and aggregating and reporting on the results. The members of the Board of Management also provided their input. The questionnaires covered various topics such as composition, size, skills and experience, geographical coverage and diversity of the Supervisory Board, the effectiveness of the Supervisory Board’s oversight of various aspects such as strategy, business performance, risk management, succession planning and people, and engagement with management. In addition, the questionnaire reflected on the company’s strategy, innovation, digital and AI developments, understanding of the market and stakeholder landscape, and continuous education. All members of the Supervisory Board were invited to share recommendations to improve the Supervisory Board’s functioning and ways of working going forward. Furthermore, the performance of the Chairman, of the other Supervisory Board members individually, and of the Supervisory Board’s committees was evaluated separately.
The reports on the evaluation were discussed in a meeting of the Supervisory Board and resulted in a collection of positive points to maintain as well as priorities for further improvement. The results of the self-evaluation indicated that the Supervisory Board is a well-functioning team of appropriate size that benefits from different expertise, background and international geographical representation. Progress has been made on all domains, in particular in terms of stakeholder understanding, risk and safety, oversight and the proximity to top talent and succession. The Supervisory Board has been bolstered by its relationship with long-term investor Exor N.V. as a strategic investor and the new member of the Supervisory Board that was appointed in 2024 following Exor’s proposal. The Supervisory Board members assessed they have struck the right balance between supporting and challenging management on the company's focus areas, which include setting the foundation and aspirations for the future and execution of the value acceleration strategy, patient safety and quality, culture, and senior executive succession planning. The Chairman of the Supervisory Board had several meetings with individual members of the Supervisory Board to discuss ways to further enhance the functioning of the Supervisory Board and its individual members going forward. The Chairman also discussed the evaluation of his own functioning with the Vice-Chairman.
Supervisory Board composition
| | | | | | | | | | | | | | | | | | | | | | | | | | | | | | | | | | | |
| Feike Sijbesma | Paul Stoffels | Chua Sock Koong | Liz Doherty | Marc Harrison | Peter Löscher | Indra Nooyi | Sanjay Poonen | David Pyott | Herna Verhagen | Benoît Ribadeau-Dumas |
| Year of birth | 1959 | 1962 | 1957 | 1957 | 1964 | 1957 | 1955 | 1969 | 1953 | 1966 | 1972 |
| Gender | Male | Male | Female | Female | Male | Male | Female | Male | Male | Female | Male |
| Nationality | Dutch | Belgian | Singaporean | British/Irish | American | Austrian | American | American | British/American | Dutch | French |
| Initial appointment date | 2020 | 2018 | 2021 | 2019 | 2018 | 2020 | 2021 | 2022 | 2015 | 2022 | 2024 |
| Date of (last) (re-)appointment | 2024 | 2022 | n/a | 2023 | 2022 | 2024 | n/a | n/a | 2023 | n/a | n/a |
| End of current term | 2028 | 2026 | 2025 | 2027 | 2026 | 2028 | 2025 | 2026 | 2025 | 2026 | 2028 |
| Independent | yes | yes | yes | yes | yes | yes | yes | yes | yes | yes | No |
| Committee memberships¹ | RC & CGNSC | RC & CGNSC | AC | AC | QRC | AC & QRC | CGNSC | RC | QRC | AC & RC | CGNSC |
| Attendance at Supervisory Board meetings | 10/10 (100%) | 10/10 (100%) | 10/10 (100%) | 10/10 (100%) | 10/10 (100%) | 9/10 (90%) | 9/10 (90%) | 9/10 (90%) | 7/10 (70%) | 9/10 (90%) | 5/10** (50%) |
| Attendance at committee meetings | RC 3/3 CGNSC 6/6 (100%) | RC 3/3 CGNSC 6/6 (100%) | AC 6/6 (100%) | AC 6/6 (100%) | QRC 5/5 (100%) | AC 6/6 QRC 5/5 (100%) | CGNSC 6/6 (100%) | AC 3/6*** (50%) RC 2/3*** (66.67%) | RC 1/3* (33.33%) QRC 5/5 (100%) | RC 3/3 (100%) AC 3/6*** (50%) | CGNSC (4/6)** (66.67%) |
| General management | yes | yes | yes | yes | yes | yes | yes | yes | yes | yes | yes |
| International business | yes | yes | yes | yes | yes | yes | yes | yes | yes | yes | yes |
| ESG & sustainability | yes | | | | | yes | yes | | | yes | |
| (Consumer) health and medical technology | yes | yes | | yes | yes | yes | | | yes | | |
| Patient safety, quality & regulatory and product development | | yes | | | yes | yes | | | yes | | |
| Finance and accounting | yes | yes | yes | yes | yes | yes | yes | yes | yes | yes | yes |
| Human Resources | yes | yes | yes | | yes | yes | yes | yes | yes | yes | yes |
| Manufacturing and supply chain | yes | yes | | yes | | yes | yes | | | | yes |
| Information technology and digital | yes | yes | yes | yes | yes | yes | yes | yes | | yes | |
| Marketing | yes | yes | | | | yes | yes | yes | yes | yes | |
| Governmental and public affairs | yes | yes | yes | yes | yes | yes | yes | | | yes | yes |
1CGNSC: Corporate Governance & Nomination and Selection Committee; AC: Audit Committee; RC: Remuneration Committee; QRC: Quality & Regulatory Committee
* Mr Pyott left the RC on June 1, 2024
** Mr Ribadeau-Dumas joined the Supervisory Board as observer as per March 1, 2024 and was appointed on May 7, 2024
*** Ms Verhagen joined the AC and Mr Poonen left as per June 1, 2024. Mr Poonen joined the RC as per June 1, 2024
Supervisory Board committees
While retaining overall responsibility, the Supervisory Board has assigned certain tasks to the three long-standing committees, also referred to in the Dutch Corporate Governance Code: the Corporate Governance and Nomination & Selection Committee, the Remuneration Committee and the Audit Committee. In 2015, the Supervisory Board also established the Quality & Regulatory Committee. The separate reports of these committees are part of this Supervisory Board report and are published below. The function of all of the Supervisory Board’s committees is to prepare the decision-making of the full Supervisory Board, and the committees currently have no independent or assigned powers. The full Supervisory Board retains overall responsibility for the activities of its committees.
In light of the significance of the ESG dimensions to Philips and their integration into the company’s overarching strategy, the Supervisory Board as a whole is conducting oversight and advising executive management on the company’s ESG approach.
Financial statements and sustainability report 2024
The financial statements of the company for 2024, as presented by the Board of Management, have been audited by EY Accountants B.V., the independent external auditor appointed by the General Meeting of Shareholders. We have approved these financial statements, and all individual members of the Supervisory Board have signed these documents (as did the members of the Board of Management). We have also approved the company’s sustainability statement for 2024.
Finally, we would like to express our thanks to the members of the Board of Management, the Executive Committee and all other employees for their continued contributions throughout 2024.
The Supervisory Board
Feike Sijbesma
Paul Stoffels
Chua Sock Koong
Liz Doherty
Marc Harrison
Peter Löscher
Indra Nooyi
Sanjay Poonen
David Pyott
Benoît Ribadeau-Dumas
Herna Verhagen
8.3.1 Report of the Corporate Governance and Nomination & Selection Committee
The Corporate Governance and Nomination & Selection Committee is chaired by Feike Sijbesma. Its other members are Paul Stoffels, Indra Nooyi and Benoît Ribadeau-Dumas. The Committee is responsible for the review of the overall corporate governance, and the selection criteria and appointment procedures for the Supervisory Board, Board of Management, the Executive Committee, and certain other key management positions. In 2024, the Committee held six meetings and all Committee members attended these meetings.
The Committee devoted time to the appointment or reappointment of candidates to fill current and future vacancies on the Supervisory Board. Following those consultations, it prepared decisions and advised the Supervisory Board, which resulted in the re-appointments of Feike Sijbesma and Peter Löscher and the appointment (following the proposal from long-term investor Exor N.V.) of Benoît Ribadeau-Dumas as members of the Supervisory Board at the 2024 Annual General Meeting of Shareholders (AGM). This also resulted in the proposal to appoint Bob White as new member of the Supervisory Board, to be included in the agenda for the upcoming 2025 AGM.
Under its responsibility for the selection criteria and appointment procedures for Philips’ senior management, the Committee reviewed the functioning of the Board of Management and its individual members, the Executive Committee succession plans, and emergency candidates for key roles in the company. The review and evaluation consist of periodical performance review meetings with the individual members of the Board of Management and the Executive Committee, and evaluation of the results of these meetings by the Committee. The main findings and conclusions from these reviews were also shared with the Supervisory Board and the Remuneration Committee and were taken into account in the performance evaluation of the Board of Management and Executive Committee members and the selection of succession candidates. Reference is made to 2024 Annual Incentive, setting out the performance review of the Board of Management members by the Remuneration Committee. The Committee devoted time in 2024 to the selection and/or appointment of candidates to fill other current and future vacancies on the Board of Management and the Executive Committee. This resulted in the appointment of Charlotte Hanneman as incoming Chief Financial Officer and a member of the Executive Committee as per June 1, 2024, and (at the 2024 AGM) her appointment as a member of the Board of Management as per October 1, 2024. This also resulted in the proposal, to be included in the agenda for the upcoming 2025 AGM, to re-appoint Marnix van Ginneken as a member of the Board of Management.
The Committee’s work furthermore resulted in the appointment of Ling Liu as a member of the Executive Committee, succeeding Andy Ho, in the role of Chief Region Leader, Philips Greater China, effective July 1, 2024. And effective January 1, 2025, two other new members of the Executive Committee were appointed. Özlem Fidanci succeeded Edwin Paalvast as Chief of International Region and Leader Growth Region. Jie Xue was appointed Chief Business Leader Precision Diagnosis, which had been under the extended leadership of Bert van Meurs (Chief Business Leader Image Guided Therapy). Bert and Jie are now jointly responsible for the Diagnosis & Treatment segment. The Committee also devoted time in 2024 to the selection and appointment of Filip Koek as the Head of Internal Audit as per September 1, 2024.
With respect to corporate governance matters, the Committee discussed recent developments in the Netherlands, and ESG reporting and due diligence developments in Europe. Finally, the Committee reviewed the Charter of the Corporate Governance and Nomination & Selection Committee and concluded it remains appropriate.
With respect to the productivity initiatives and other actions to improve the company’s performance (including the unfortunate but necessary reduction of roles), the Committee was updated by management on the impact on employees and the phased deployment approach, and members reviewed the simplification of the organization.
Diversity
The Diversity Policy for the Supervisory Board, Board of Management and Executive Committee was adopted in 2017 and revised in February 2023, and it is published on the company website. The Committee periodically assesses the Diversity Policy and the size and composition of the Supervisory Board and makes recommendations, if relevant, relating to the profile for the Supervisory Board.
Pursuant to the Diversity Policy, the selection of candidates for appointment is based on merit and its criteria aim to ensure that the Supervisory Board, the Board of Management and the Executive Committee have a sufficient diversity of views and the expertise needed for a good understanding of current affairs and longer-term risks and opportunities related to the company’s business. The nature and complexity of the company’s business is taken into account when assessing the optimal mix of perspectives, as well as the social and environmental context in which the company operates.
Effective 2022, Dutch law requires listed companies to set appropriate and ambitious gender diversity targets for the Board of Management and for a management level of a seniority to be determined by the company. To this end, the Diversity Policy includes the Supervisory Board’s aim that at least one-third of the members of the Board of Management and of the Executive Committee are women, and at least one-third are men. The composition of the Board of Management and the Executive Committee, respectively, currently meets this aim.
8.3.2 Report of the Remuneration Committee
The Remuneration Committee is chaired by Paul Stoffels. Its other members are Feike Sijbesma, Herna Verhagen and Sanjay Poonen, who replaced David Pyott on June 1, 2024. The Committee is responsible for preparing decisions of the Supervisory Board on the remuneration of individual members of the Board of Management and the Executive Committee, as well as the policies governing this remuneration. The annual cycle of the Remuneration Committee enables it to have an effective decision-making process supporting the determination, review and implementation of the Remuneration Policy. The Committee met three times in 2024. All Committee members were present during these meetings.
In performing its duties and responsibilities, the Remuneration Committee is assisted by an external consultant and an in-house remuneration expert. For a full overview of the responsibilities of the Committee, please refer to the Charter of the Remuneration Committee, as set forth in Chapter 3 of the Rules of Procedure of the Supervisory Board (which are published on the company’s website).
Following preparations that started in May 2023 and stakeholder engagements through a dedicated remuneration roadshow and other interactions, the Remuneration Committee submitted proposals at the AGM 2024 to adopt an amended Remuneration Policy for the Board of Management and an amended Remuneration Policy for the Supervisory Board. The Remuneration Committee was very thankful for the shareholders’ support, as these proposals were approved by a 96.07% and a 98.94% majority, respectively.
Please refer to the Remuneration report 2024 where the Supervisory Board provides a comprehensive overview, as prepared by the Remuneration Committee, of the remuneration paid and owed to the individual members of the Board of Management and the Supervisory Board in the year 2024.
8.3.3 Report of the Audit Committee
The Audit Committee is chaired by Liz Doherty. Its other members are Peter Löscher, Chua Sock Koong and Herna Verhagen, who replaced Sanjay Poonen on June 1, 2024. The Committee assists the Supervisory Board in fulfilling its supervisory responsibilities, including ensuring the integrity of the company’s financial statements, reviewing the company’s internal controls and overseeing the enterprise risk management process.
In 2024, the Audit Committee held five regular meetings and one extraordinary meeting, which were attended by all Audit Committee members and the Chairman of the Supervisory Board. The CEO, CFO, Chief ESG & Legal Officer, Head of Internal Audit, Chief Accounting Officer and external auditor (EY Accountants B.V.) were also invited and attended all regular meetings.
The Committee met separately in private sessions with the CEO, CFO, Head of Internal Audit and external auditor after the regular quarterly meeting of the Committee. Prior to the Committee meetings, the Audit Committee chair met one-on-one with the Group Treasurer as well as with each member of the management who regularly attend the Audit Committee meetings and with the external auditor.
The following overview highlights matters that were reviewed and/or discussed during Committee meetings in the course of, or with respect to, the financial year 2024:
•The company’s 2024 annual and interim financial statements and non-financial information (prior to publication), the restructuring provision, the FCO provisions, the goodwill impairment tests, deferred tax assets and legal matters. In each of the regular quarterly meetings of the Committee, the Committee reviewed the draft of the press release on the company’s annual or interim financial statements.
•Matters relating to accounting policies, financial risks, reporting, and compliance with accounting standards. Key accounting judgments were discussed in-depth, and treatments were challenged, as were quality of earnings. Compliance with statutory and legal requirements and regulations, particularly in the financial domain, was also reviewed. Furthermore, the Committee reviewed the goodwill impairment tests performed in the fourth quarter, risk management, tax matters, legal compliance, and developments in regulatory investigations, as well as legal proceedings, including antitrust investigations and related provisions. Important findings, Philips’ top and emerging areas of risk (including the internal auditor’s reporting thereon, and the Chief ESG & Legal Officer’s review of litigation and other claims, as well as material investigations, including those related to the Philips Respironics voluntary recall), and follow-up actions and appropriate measures were examined thoroughly.
•The company’s policy on business controls, legal compliance and the General Business Principles (including deployment). The Committee reviewed, discussed and monitored closely the company’s internal control certification processes, and in particular, compliance with section 404 of the US Sarbanes-Oxley Act and its requirements regarding assessment, review and monitoring of internal controls. It also discussed on a regular basis the developments in, and findings relating to, conduct resulting from investigations into alleged violations of the General Business Principles and, if required, any measures taken.
•The company’s cash flow generation, liquidity and financing headroom, and its ability under its capital structure and credit ratings to pay dividends and to fund capital investments, including share repurchases and other corporate finance initiatives.
•Specific finance topics, capital spending and the company’s debt financing strategy (including the issue of bonds through the Euro Medium Term Note program in May 2024 with the purpose to repay the EUR 700 million existing debt due in 2024 and 2025).
•A post-investment review of projects in the areas of information technology, Research & Development, real estate, operations and restructuring, and assessment of the actual spend and timing of such projects against the original budget and timing.
•The quarterly Internal Audit reports in which the Head of Internal Audit highlighted key findings of internal audits and fraud investigations by the Internal Audit Function in the previous quarter. The Committee discussed the adequacy of the remediation actions agreed with management and accountabilities for executing on these actions. In each meeting the Head of Internal Audit also presented the audit schedule for the upcoming quarter. Review and approval of the revised Internal Audit charter, annual audit plan and budget, audit scope, and its coverage in relation to the scope of the external audit, as well as the staffing, independence, performance and organizational structure of the Internal Audit Function. This includes the succession of the Internal Auditor in September 2024.
•The proposed 2024 external audit scope, including key audit areas, approach and fees, and non-audit services provided by the external auditor in conformity with the Philips Auditor Policy. Review and challenge of the independence as well as the professional fitness and good standing of the external auditor and its engagement partners. For information on the fees of the Group auditor, please refer to Audit fees in the note Income from operations. The Committee reviewed the transition plan as proposed by PricewaterhouseCoopers Accountants N.V. (PwC) to take over from EY Accountants B.V. as the company’s new external auditor of the financial report, starting on January 1, 2025, for a term of four years, and the appointment of the company's external assurance provider on the 2025 sustainability statement. •The company’s structure and system for compliance with export controls and international sanctions.
•Reviewing the quarterly reports on sustainability-related developments, including EU Corporate Sustainability Reporting Directive and EU Sustainability Reporting Standards, the company's progress on the implementation thereof, and the impact thereof on reporting by the Philips Group. The committee also discussed the level of assurance to be provided through the external audit of the sustainability statement.
•Philips’ information security risk approach (including cybersecurity), at an enterprise level as well as at product and service levels, comprising an update on the mitigation of cybersecurity risks and actions taken to comply with relevant laws and regulations including the Cybersecurity Risk Management, Strategy, Governance, and Incident Disclosure requirements issued by the US Securities and Exchange Commission (SEC).
In February 2025, the Committee reviewed, together with the other members of the Supervisory Board, the draft of the Annual Report 2024, as well as the key audit matters and the critical audit matters identified by the external auditor in relation to the 2024 financial statements included in the Annual Report 2024 and the Annual Report on Form 20-F, respectively. In February 2025, the Committee also reviewed the draft of the company’s 2024 Country Activity and Tax Report.
During each regular quarterly Audit Committee meeting, the Committee reviewed the quarterly report from the external auditor, in which the auditor set forth its findings and attention points during the relevant period. The Annual Audit Letter was circulated to the full Supervisory Board, and planned actions to address the items raised were discussed with management in the subsequent Audit Committee meetings as well as in private sessions with management.
Finally, the Committee reviewed and updated the Audit Committee Charter.
8.3.4 Report of the Quality & Regulatory Committee
The Quality & Regulatory Committee was established in view of the importance of patient safety and the quality of the company’s products, systems, services and solutions. The Committee provides broad oversight of compliance with the regulatory requirements that govern the development, manufacturing, marketing and servicing of the company’s products, systems, services and solutions. The Committee assists the Supervisory Board in fulfilling its oversight responsibilities in these areas. It is chaired by David Pyott and its members are Marc Harrison and Peter Löscher. As of June 1, 2024, Paul Stoffels also attended the meetings.
In 2024, the Committee held five meetings, and all Committee members attended these meetings. Quality related matters were a regular item on the agenda of the Supervisory Board meeting. The CEO, the Chief ESG & Legal Officer, the Chief Operations Officer, the Chief Patient Safety &
Quality Officer and the Chief Medical Officer were present during these meetings. The following overview indicates some of the matters that were discussed during meetings in the course of 2024.
•The progress on the company’s Quality & Regulatory strategy was tracked and reviewed. The Committee focused on the strategy to ensure the safety and efficacy of the company’s products and solutions for patients and customers. In that context, the Committee reviewed the status and progress of the company’s Patient Safety and Quality program, which includes enhancement of the engagement with regulators, ensuring sustainability and predictable performance, and the Patient Safety & Quality Culture Intervention. Specific attention was given to the Quality Management System (QMS) transformation to drive process simplification in a tailored manner and Product Quality Reviews (PQRs) to ensure the installed base meets patient safety and design control standards, as well as compliance requirements. For more information, please refer to Patient safety, quality and regulatory. •The Philips Respironics voluntary recall notification related to the sound abatement foam in certain sleep and respiratory care products (announced on June 14, 2021) in the company’s Sleep & Respiratory Care Business. Management regularly updated the Committee on the trend of the number of devices registered for remediation and on the progress of the repair-and-replace program for the affected devices, as well as actions taken to accelerate the remediation. The Committee reviewed aspects of this issue, such as the program governance to enable effective execution, and ongoing engagements with the FDA and the DOJ, among others, with respect to the 518(a) Notification order issued by the FDA on March 10, 2022, the investigation initiated by the DOJ to which Philips Respironics is subject, and the execution of the agreed consent decree. The Committee reviewed the engagements with other regulatory authorities globally. Furthermore, the Committee reviewed and discussed with management the engagement with and communication efforts to patients, physicians, customers and durable medical equipment providers; the testing program and its outcomes; and health hazard evaluations. The Committee also discussed the level of related field action provisions, as set out in more detail in the report of the Audit Committee above.
•Management updated the Committee regularly with respect to other quality issues (other than the Philips Respironics voluntary recall notification mentioned in the previous bullet), and the Committee reviewed the progress made with solving and closing such other issues.
•Review of progress in the transformation of the company’s Patient Safety & Quality Function, aimed at further strengthening expertise and capabilities within the Function, including upscaling Patient Safety & Quality talent at mid-level leadership positions.
•Review of the progress made with global initiatives around the transformation, standardization and simplification of the company’s structure and organizational processes relating to QMSs (the reduction of the current QMSs to one quarter versus the baseline), management systems, regulated manufacturing sites (legal manufacturers), Corrective and Preventive Action (CAPA) and complaint management.
•Review the implementation of a Patient Safety & Quality IT roadmap and ensure adoption of the IT and data enhancements.
•The status and outcome of Quality & Regulatory-related investigations and inspections by regulatory authorities and notified bodies globally across the organization. Management also regularly provided the Committee with an overview of upcoming scheduled inspections across company sites by the FDA, other regulatory authorities and notified bodies, and the actions taken to prepare for such inspections.
•Review of the product risk per Business based on a product assessment approach and remediation across the company, including findings resulting from internal audits.
•Review of the 2024 dashboard of Quality & Regulatory key performance indicators, showing the trend of performance. The Committee also reviewed the Quality & Regulatory key performance indicators for 2025.
8.4 Remuneration report 2024
Letter from the Remuneration Committee Chair
Dear Stakeholder,
On behalf of the Remuneration Committee, I am pleased to present the 2024 Remuneration Report, providing a comprehensive overview of the remuneration paid and owed to the individual members of the Board of Management and the Supervisory Board, respectively, in the financial year 2024. Charlotte Hanneman succeeded Abhijit Bhattacharya as CFO as of October 1, 2024, after having joined Philips on June 1, 2024, as a member of the Executive Committee, to start her introduction into the role. This Remuneration Report includes their respective remunerations in their capacity as members of the Board of Management.
Company performance in 2024 and incentive plan realization
Despite declines in demand in both consumer and health systems in China we returned to positive order growth and continued to drive margin expansion and cash-flow generation. Nearing the end of the second year of the three-year plan to create value with sustainable impact, Philips has made solid progress on its execution priorities, returned to order intake growth, and delivered strong margin and good cash performance, although sales growth was slower. Philips reached important milestones in the Respironics litigation, resolving the personal injury litigation and the medical monitoring class action. We believe this progress is being acknowledged, where long-term investor Exor increased its stake in Philips, along with some other significant investors.
For the awards granted under our Long-Term Incentive Plan in 2022, the company performance resulted in a realization above target for the sustainability objectives. For the relative Total Shareholder Return (TSR) and adjusted Earnings Per Share (EPS) metrics in our Long-Term Incentive Plan, however, there was a below-threshold performance since the start of the performance period in 2022. With respect to the financial metrics of the 2024 Annual Incentive, performance was at target for the Adjusted EBITA metric, below target for the free cash flow* metric, and below threshold for the comparable sales growth* metric. Please refer to our 2024 Remuneration Report for more details.
Other remuneration matters prepared by the Remuneration Committee
In 2024, we successfully introduced new remuneration policies for the Board of Management and the Supervisory Board, respectively. This process commenced in October 2023 with extensive engagement with stakeholders, including shareholders representing approximately 55% of the issued share capital, institutional advisory organizations, employees, and employee representative bodies. Their feedback was carefully incorporated to design policies that are competitive in the market and aligned with our strategic priorities and societal responsibilities. The 2024 Remuneration Policy for the Board of Management enhances the alignment between performance and remuneration, emphasizing both financial and non-financial outcomes, with an increased focus on patient safety and quality.
Looking ahead
The 2024 Remuneration Policy includes a potential increase of the Annual Incentive target to 120% (from 100%) for the CEO, and to 100% (from 80%) for the CFO and CLO enabling to reward at market median level for the Annual Incentive. As noted in the 2024 Remuneration Policy for the Board of Management, the Supervisory Board applied unchanged target levels for 2024, but it could (gradually) increase the Annual Incentive target levels as of 2025, subject to a performance trajectory by 2024 that gives the company a clear outlook to deliver on its 2025 targets. The Supervisory Board notes that in 2024, the company delivered on its commitments regarding profitability, free cash flow and ESG. Nevertheless, the Supervisory Board decided to maintain the current target levels for the Annual Incentives 2025 as well. The Supervisory Board notes that it intends to increase the Annual Incentive target levels towards the policy target maximum as of 2026.
I look forward to presenting our Remuneration report 2024 at our upcoming Annual General Meeting of Shareholders.
On behalf of the Remuneration Committee,
Paul Stoffels
Chairman of the Remuneration Committee
Introduction
In this Remuneration Report, the Supervisory Board provides a comprehensive overview, in accordance with article 2:135b of the Dutch Civil Code, of the remuneration paid and owed to the individual members of the Board of Management and the Supervisory Board, respectively, in the financial year 2024. The report will also be published as a stand-alone document on the company’s website after the 2025 Annual General Meeting of Shareholders, the agenda of which will include an advisory vote on this Remuneration Report.
Board of Management
Summary of the 2024 Remuneration Policy
The Remuneration Policy, which includes a Long-Term Incentive Plan, for the Board of Management (BoM) has been adopted at the Annual General Meeting of Shareholders held on May 7, 2024.
The objectives of the Remuneration Policy for members of the Board of Management are in line with those for Philips Executives throughout the Philips group: to focus them on pursuing our purpose to improve people’s health and well-being through meaningful innovation, and on delivering on our strategy, to motivate and retain them to create superior, long-term stakeholder value.
Main elements of the Remuneration Policy
| | | | | | | | | | | |
| Compensation element | Purpose and link to strategy | Operation | Policy Level |
| Total Direct Compensation | To support the Remuneration Policy’s objectives, the Total Direct Compensation includes a significant variable part in the form of an Annual Incentive (cash bonus) and Long-Term Incentive in the form of performance shares. As a result, a significant proportion of pay is ‘at risk’. | The Supervisory Board ensures that a competitive remuneration package for Board-level executive talent is maintained and benchmarked.
The positioning of Total Direct Compensation is reviewed against benchmark data on an annual basis and is recalibrated if and when required. To establish this benchmark, data research is carried out each year on the compensation levels in the Quantum Peer Group. | Total direct remuneration is aimed at or close to, the median of the Quantum Peer Group. |
| Annual Base Compensation | Fixed cash payments intended to attract and retain executives of the highest caliber and to reflect their experience and scope of responsibilities. | Annual Base Compensation levels and any adjustments made by the Supervisory Board are based on factors including the median of Quantum Peer Group data and performance and experience of the individual member.
The annual review date for the base salary is typically before April 1. | The individual salary levels are shown in this Remuneration Report. |
| Annual Incentive | Variable cash incentive of which achievement is tied to specific financial and non-financial targets derived from the company’s annual strategic plan. | The payout in any year relates to the achievements of the preceding year. Metrics and their weighting are disclosed ex-ante in the Remuneration Report and there will be no retroactive changes to the selection of metrics used in any given year once approved by the Supervisory Board and disclosed. | Policy (maximum) level:
President & CEO On-target: 120% Maximum: 240% of Annual Base Compensation.
Other BoM members On-target: 100% Maximum: 200% of Annual Base Compensation. |
| Long-Term Incentive | Variable equity incentive of achievement is tied to targets reflecting long-term stakeholder value creation and delivered in the form of performance shares. | The annual award size is set by reference to a multiple of base salary. The actual number of performance shares to be awarded is determined by reference to the average closing price of the Royal Philips share measured over the last month of the quarter preceding the actual grant of performance shares (the day of publication of the relevant quarterly results). Dependent upon the achievement of the performance conditions, cliff-vesting applies three years after the date of grant. During the vesting period, the value of dividends will be added to the performance shares in the form of shares. These dividend-equivalent shares will only be delivered to the extent that the award actually vests. | President & CEO Annual grant size: 200% of Annual Base Compensation.
Other BoM members Annual grant size: 150% of Annual Base Compensation. Maximum vesting opportunity is 200% of the number of performance shares granted. |
| Mandatory share ownership and holding requirement | To further align the interests of executives to those of stakeholders and to motivate the achievement of sustained performance. | The guideline for members of the Board of Management is to hold at least a minimum shareholding in the company. Until this level has been reached the members of the Board of Management are required to retain all after-tax shares derived from any Long-Term Incentive Plan. The shares granted under the Long-Term Incentive Plan shall be retained for a period of at least 5 years or until at least the end of their contract period if this period is shorter. The guideline does not require members of the Board of Management to purchase shares in order to reach the required share ownership level. | The minimum shareholding requirement is 400% of Annual Base Compensation for the CEO and 300% for other members of the Board of Management. |
| | | | | | | | | | | |
| Compensation element | Purpose and link to strategy | Operation | Policy Level |
| Pension | Participation in the Philips Flex ES pension plan in the Netherlands (applicable for all executives) combined with a fixed pension contribution intended to result into an appropriate level at retirement. | 1Defined Contribution plan with fixed contribution (applicable to all executives in the Netherlands – capped at EUR 137,800). 2Gross allowance of 25% of Annual Base Compensation exceeding EUR 137,800. | |
| Additional arrangements | To aid retention and remain competitive within the marketplace | Additional arrangements include expense and relocation allowances, medical insurance, accident insurance, Philips product arrangements and company car arrangements. The members of the Board of Management also benefit from coverage under the company’s Directors & Officers (D&O) liability insurance. The company does not grant personal loans to members of the Board of Management. | Cash value (grossed up) of the benefits received, which are in line with other Philips executives in the Netherlands. |
Peer Groups
We use a Quantum Peer Group for remuneration benchmarking purposes, and therefore we aim to ensure that it includes business competitors, with an emphasis on companies in the healthcare, technology-related or consumer products area, and other companies we compete with for executive talent. The Quantum Peer Group consists of predominantly Dutch and other European companies, plus a minority (up to 25%) of US-based global companies, of comparable size, complexity and international scope.
Philips Group
Quantum Peer Group 2024
| | | | | | | | | | | |
| European companies | | Dutch companies | US companies |
| Alcon | Lonza | Ahold Delhaize | Baxter |
| BAE Systems | Nokia | AkzoNobel | Becton Dickinson |
| Dräger | Reckitt Benckiser | ASML | Boston Scientific |
| Ericsson | Roche | Heineken | GE Healthcare |
| Fresenius Medical Care | Siemens Healthineers | | Medtronic |
| Getinge | Smith & Nephew | | Stryker |
| GSK | Thales | | |
In addition, we use a TSR Performance Peer Group to benchmark our relative Total Shareholder Return performance for LTI purposes and against our business peers in the health technology market and other markets in which we compete. The companies we have selected for this peer group include predominantly US-based healthcare companies. Given that a substantial number of relevant competitors are US-headquartered, the weighting of US-based healthcare companies is more notable than for the Quantum Peer Group.
Philips Group
TSR Performance Peer Group 2024
| | | | | | | | |
| US companies | European companies | Japanese companies |
| Baxter | Alcon | Canon |
| Becton Dickinson | Elekta | Terumo |
| Boston Scientific | Fresenius Medical Care | |
| Danaher | Getinge | |
| GE Healthcare | Reckitt Benckiser | |
| Hologic | Siemens Healthineers | |
| Johnson & Johnson | Smith & Nephew | |
| Medtronic | | |
| Resmed | | |
| Stryker | | |
The Remuneration Policy and the LTI Plan allow changes to the peer groups to be made by the Supervisory Board without further approval from the General Meeting of Shareholders in respect of up to three companies on an annual basis (for instance: following a delisting of a company or a merger of two peer companies), or six companies in total during the four years following adoption and approval of the Remuneration Policy and the LTI Plan respectively (or, if earlier, until the adoption or approval of a revised Remuneration Policy or revised LTI Plan).
Services agreements
The members of the Board of Management are engaged by means of a services agreement (overeenkomst van opdracht). Termination of the contract by either party is subject to six months’ notice period. The severance payment is set at a maximum of one year’s Annual Base Compensation. No severance payment is due if the agreement is terminated early on behalf of the Board of Management member or in the case
of urgent cause (dringende reden) as defined in article 7:678 and further of the Dutch Civil Code. The term of the services agreement is aligned with the term for which the relevant member has been appointed by the General Meeting of Shareholders (which is a maximum period of four years, it being understood that this period expires no later than at the end of the Annual General Meeting of Shareholders (AGM) held in the fourth year after the year of appointment).
Philips Group
Contract terms for current members 2024
| | | | | |
| end of term |
| Roy Jakobs | AGM 2026 |
| Charlotte Hanneman | AGM 2028 |
| Marnix van Ginneken | AGM 2025 |
Remuneration of the Board of Management in 2024
The Supervisory Board has determined the 2024 pay-outs to the members of the Board of Management, upon the proposal of the Remuneration Committee, in accordance with the 2024 Remuneration Policy.
The Remuneration Committee annually conducts a scenario analysis. This includes the calculation of remuneration under different scenarios, whereby different Philips performance assumptions and corporate actions are examined. The Supervisory Board concluded that the relationship between the strategic objectives and the chosen performance criteria for the 2024 Annual Incentive, as well as for the 2022 LTI grants, were adequate.
Annual Base Compensation
As part of the regular remuneration review, Annual Base Compensation for the members of the Board of Management is being reviewed every year. No increase was applied in 2023. This year, however, the Annual Base Compensation has been increased per April 1, 2024: for Roy Jakobs from EUR 1,200,000 to EUR 1,250,000, for former CFO Abhijit Bhattacharya from EUR 810,000 to EUR 840,000 and for Marnix van Ginneken from EUR 630,000 to EUR 660,000, respectively. This increase was made to move the total compensation level closer to the market median level, as well as to reflect internal relativities. The Annual Base Compensation of Charlotte Hanneman as new CFO was set at EUR 700,000.
2024 Annual Incentive
The Annual Incentive performance has been assessed based on company financial results as well as non-financial results. Details are as follows:
Financial element (70% weighting)
In line with the 2024 Remuneration Policy, the company sets financial performance metrics and targets in advance of the year for all members of the Board of Management. For the year 2024, the financial targets set at Group level cover Comparable Sales Growth*, Adjusted EBITA* and Free Cash Flow*. For the Comparable Sales Growth metric, the realized performance was below threshold performance level, which resulted in a 0% payout for this metric. For the adjusted EBITA metric, the realized performance was at target performance level, which resulted in a 100% payout for this metric. For the Free Cash Flow metric, the realized performance of 906 million EUR results in a 177.0% payout for this metric. The Supervisory Board and Board of Management have jointly decided to adjust for insurance reimbursements received and to lower the payout from 177.0% to 73.6% of target.
| | | | | | | | | | | | | | | | | | | | | | | |
| Financial performance metric | Weighting as % of target Annual Incentive | Assessment of performance | Weighted pay-out as % of target Annual Incentive |
| threshold performance | target performance | maximum performance | realized performance | resulting payout as % of target |
| Comparable Sales Growth¹ | 25 | % | 2.0 | % | 4.0 | % | 6.0 | % | 1.2 | % | - | % | - | % |
| Adjusted EBITA margin¹ | 25 | % | 10.5 | % | 11.5 | % | 13.5 | % | 11.5 | % | 100.0 | % | 25.0 | % |
| Free Cash Flow¹ | 20 | % | 375 | | 675 | | 975 | | 906 | | 73.6 | % | 14.7 | % |
| Total | 70 | % | | | | | | 39.7 | % |
Non-financial element (30% weighting)
The non-financial performance categories and objectives were set at the beginning of the year and disclosed in the 2023 remuneration report. As per remuneration policy, each selected performance category received an equal weighting. The Supervisory Board has assessed performance and granted a pay-out between 0% and 200% per selected category.
| | | | | | | | | | | | | | |
| Member of Board of Management | Performance category | Performance objective | Assessment of performance | Weighted pay-out as% of target
Annual Incentive |
| Roy Jakobs | Patient Safety & Quality | Drive Patient Safety & Quality as highest priority in the organization | Further strengthened our Patient Safety & Quality culture, capabilities and performance. Significant progress made on managing the recall, and addressing consent decree requirements. | 34.5% |
| Customer | Improve customer experience | Customer NPS significantly improved. |
| Improve supply chain reliability | On-time delivery of orders as per customer expectations significantly improved. |
| Strategy and Execution | Drive focused strategy to win in the market | Market share gains achieved in some Businesses. Solid progress on execution priorities, with opportunities to accelerate growth strategies. |
| Establish simplified, more agile operating model | Targets for operating model simplification and the headcount reduction plan were responsibly achieved. |
| ESG | Deliver on ESG Commitments | ESG index realization significantly ahead of target. Employee engagement significantly up ahead of target. Succession plans and talent development as per plan. |
| Charlotte Hanneman | Patient Safety & Quality | Drive Patient Safety & Quality as highest priority in the organization | Further strengthened our Patient Safety & Quality culture, capabilities and performance. Significant progress made on managing the recall, and addressing consent decree requirements. | 30.3% |
| Customer | Improve customer experience | Customer NPS significantly improved. |
| Improve financial forecasting | n/a |
| Strategy and Execution | Drive focused strategy to win in the market | Delivered on Cash- and Productivity programs as per plan |
| Establish simplified, more agile operating model | Targets for operating model simplification and the headcount reduction plan were responsibly achieved. |
| ESG | Deliver on ESG Commitments | ESG index realization significantly ahead of target. Employee engagement significantly up ahead of target. Succession plans and talent development as per plan. |
| Abhijit Bhattacharya | Patient Safety & Quality | Drive Patient Safety & Quality as highest priority in the organization | Further strengthened our Patient Safety & Quality culture, capabilities and performance. Significant progress made on managing the recall, and addressing consent decree requirements. | 30.3% |
| Customer | Improve customer experience | Customer NPS significantly improved. |
| Improve financial forecasting | Accuracy of sales forecast was insufficient. |
| Strategy and Execution | Drive focused strategy to win in the market | Delivered on Cash- and Productivity programs as per plan |
| Establish simplified, more agile operating model | Targets for operating model simplification and the headcount reduction plan were responsibly achieved. |
| ESG | Deliver on ESG Commitments | ESG index realization significantly ahead of target. Employee engagement significantly up ahead of target. Succession plans and talent development as per plan. |
| Marnix van Ginneken | Patient Safety & Quality | Drive Patient Safety & Quality as highest priority in the organization | Further strengthened our Patient Safety & Quality culture, capabilities and performance. Significant progress made on managing the recall, and addressing consent decree requirements. | 40.3% |
| Customer | Manage legal issues | Significant milestones achieved, such as the economic loss settlement and the resolution of the personal injury and medical monitoring litigation in the US related to the Respironics recall. |
| Strategy and Execution | Drive focused strategy to win in the market | Delivery on our value creation plan and legal & compliance commitments ahead of target. |
| Establish simplified, more agile operating model | Targets for operating model simplification and the headcount reduction plan were responsibly achieved. |
| ESG | Deliver on ESG Commitments | ESG index realization significantly ahead of target. Employee engagement significantly up ahead of target. Succession plans and talent development as per plan. |
Overall, this leads to the following total Annual Incentive realization:
Annual Incentive realization 2024
in EUR unless otherwise stated
| | | | | | | | | | | | | | | | | | | | |
| Annual incentive opportunity | Realized annual incentive |
| Target as a % of base compensation | Target Annual Incentive | Financial performance (weighted pay-out %) | Individual performance (weighted pay-out %) | Payout as % of target Annual Incentive¹ | Realized annual incentive |
| Roy Jakobs | 100 | % | 1,250,000 | | 40 | % | 35 | % | 74 | % | 927,750 | |
| Charlotte Hanneman | 80 | % | 140,491 | | 40 | % | 30 | % | 70 | % | 98,372 | |
| Abhijit Bhattacharya | 80 | % | 502,619 | | 40 | % | 30 | % | 70 | % | 351,934 | |
| Marnix van Ginneken | 80 | % | 528,000 | | 40 | % | 40 | % | 80 | % | 422,374 | |
1Note that figures may not add up due to rounding.
2025 Annual Incentive
Financial element (70% weighting):
For the year 2025, the following financial performance metrics are selected to ensure alignment with the key (strategic) priorities in the year:
•35% weighting: Comparable Sales Growth*
•20% weighting: Adjusted EBITA* margin
•15% weighting: Free Cash Flow*
Non-Financial element (30% weighting):
At the start of each year, two to four performance categories are selected from the following list, whereby each selected category receives an equal weighting:
•Patient Safety & Quality
•Customer
•Strategy and Execution
•ESG
For each selected category, one or more performance objectives are determined at the start of the year for each of the members of the Board of Management.
For the year 2025, the following categories and objectives were selected to ensure alignment with the key (strategic) priorities in the year:
| | | | | | | | | | | | | | |
| Performance category | Performance objective | Applicable for | Weighting | Measurement description |
| Patient Safety & Quality | Drive Patient Safety & Quality as highest priority in the organization | All members of Board of Management | 7.50% | This objective measures delivery on our company-wide program to strengthen our Patient Safety & Quality culture, capabilities and performance. Additionally, we measure the progress on the Respironics recall and delivery of the proposed consent decree commitments. |
| Customer | Improve market share and customer experience | Roy Jakobs | 7.50% | This objective is measured by the market share gain and by the on-time delivery of orders as per customer expectations. |
| Improve market share and customer experience | Charlotte Hanneman | This objective is measured by the market share gain and by a reliable forecast as per plan. |
| Manage legal issues | Marnix van Ginneken | Develop and manage litigation strategy and potential liabilities. |
| Strategy and Execution | Drive focused strategy to win in the market and simplify the operating model | All members of Board of Management | 7.50% | This objective measures delivery on our value creation plan and delivery on our operating model simplification plan. |
| ESG | Deliver on ESG Commitments | All members of Board of Management | 7.50% | This objective measures: - Performance on our ESG index (which includes various elements such as emission- and diversity targets) - Our capacity to grow talent and further improve employee engagement
|
2022 Long-Term Incentive
The 3-year performance period of the 2022 LTI grant, consisting of performance shares, ended on December 31, 2024. The realization of this grant is based on TSR achievement, adjusted EPS growth and sustainability objectives. The following performance achievement and vesting levels have been determined by the Supervisory Board in respect of the 2022 grant of performance shares:
Philips Group
Performance achievement and vesting levels
| | | | | | | | | | | |
| achievement | weighting | vesting level |
| TSR | 0 | % | 50 | % | 0 | % |
| EPS | 0 | % | 40 | % | 0 | % |
| Sustainability objectives | 150 | % | 10 | % | 15 | % |
| Total | | | 15 | % |
TSR (50% weighting)
A ranking approach to TSR applies with Philips itself included in the TSR Performance Peer Group. TSR scores are calculated based on a local currency approach and by taking a 3-month averaging period prior to the start and end of the 3-year performance period. The performance incentive pay-out zone is outlined in the following table, which results in zero vesting for performance below the 40th percentile and 200% vesting for performance levels above the 75th percentile. The incentive zone range has been constructed such that the average pay-out over time is expected to be approximately 100%.
Philips Group
Performance-incentive zone for TSR in %
| | | | | | | | | | | | | | | | | | | | | | | | | | | | | | | | |
| Position | 20-14 | 13 | 12 | 11 | 10 | 9 | 8 | 7 | 6 | 5-1 |
| Vesting % | 0 | 60 | 80 | 90 | 100 | 120 | 140 | 160 | 180 | 200 |
The TSR achieved by Philips during the performance period was (18.07%), using a start date of October 2021 and end date of December 2024. This resulted in Philips being positioned at rank 17 in the TSR performance peer group shown in the following table, resulting in a TSR achievement of 0%.
Following Oracle’s acquisition of Cerner (completed June 2022), the Supervisory Board adopted the approach of recognizing Cerner’s performance through the delisting date. As a proxy for future performance, reinvestment in an index of the remaining 19 peer companies was assumed (effectively retaining a peer group of 20 companies).
LTI Plan TSR realization 2022 grant: (18.07%)
| | | | | | | | |
| total return | rank number |
| General Electric | 188.13 | % | 1 |
| Canon | 109.69 | % | 2 |
| Boston Scientific | 109.49 | % | 3 |
| Stryker | 45.83 | % | 4 |
| Terumo | 25.61 | % | 5 |
| Cerner | 16.03 | % | 6 |
| Hologic | 6.28 | % | 7 |
| Alcon | 5.30 | % | 8 |
| Johnson & Johnson | 3.09 | % | 9 |
| Becton Dickinson | 0.82 | % | 10 |
| ResMed | (4.69 | %) | 11 |
| Danaher | (9.68 | %) | 12 |
| Reckitt Benckiser | (11.29 | %) | 13 |
| Siemens Healthineers | (12.07 | %) | 14 |
| Smith & Nephew | (12.55 | %) | 15 |
| Medtronic | (17.81 | %) | 16 |
| Philips | (18.07 | %) | 17 |
| Fresenius Medical Care | (23.62 | %) | 18 |
| Elekta | (30.87 | %) | 19 |
| Getinge | (49.05 | %) | 20 |
Adjusted EPS growth (40% weighting)
The LTI Plan EPS payouts and targets set at the beginning of the performance period were as follows:
Philips Group
LTI Plan EPS payouts
| | | | | | | | | | | | | | | | | |
| Below threshold | Threshold | Target | Maximum | Actual |
| LTI plan EPS (euro) | <1.19 | 1.19 | | 1.47 | | 1.69 | | (0.26) | |
| Vesting % | 0 | % | 40 | % | 100 | % | 200 | % | 0 | % |
In respect of the 2022 LTI grant, the LTI plan EPS is calculated based on a reported net income attributable to shareholders divided by the number of common shares outstanding (after deduction of treasury shares) on the day prior to the beginning of the performance period (to eliminate the impact of any share buyback, stock dividend, etc.), resulting in an EPS of EUR (0.97). Furthermore, as per the 2020 LTI Plan, the LTI Plan EPS includes adjustments to account for events that were not planned when targets were set or were outside management’s control such as the profit and loss impact of acquisitions and divestments (balance is neutral), the profit and loss impact of unhedged foreign exchange variations versus plan (positive adjustment), the profit and loss impact of legacy legal proceedings (positive impact) and the profit and loss impact of Respironics related charges (positive impact). Overall, this resulted in an LTI Plan EPS of EUR (0.26) based on adjusted net income from continuing operations, leading to a realization of 0% of target.
Philips Group
LTI Plan EPS realization in millions of EUR unless otherwise stated
| | | | | | | | |
| Net income | EPS (euro) |
| Income from continuing operations attributable to shareholders | (843) | | (0.97) | |
| Profit and loss impact of: | | |
| - Acquisitions and divestitures¹ | 1 | | 0.00 | |
| - Foreign exchange variations versus plan² | 108 | | 0.12 | |
| - Legacy legal proceedings³ | 327 | | 0.38 | |
| - Respironics related charges⁴ | 180 | | 0.21 | |
| Adjusted net income from continuing operations | (226) | | (0.26) |
1Profit and loss impact of acquisitions and divestments made after the start of the performance period is excluded.
2Impact of variations of unhedged volatile currencies compared to the performance period plan.
3Impact of Respironics litigation provision and Respironics legal insurance proceeds.
4Impact of Respironics field-action running costs and consent decree charges.
Sustainability objectives (10% weighting)
In order to further align the remuneration package for the Board of Management with our purpose and our ESG commitment, a sustainability criterion was introduced in the 2020 LTI Plan. Philips believes that ESG performance will improve the company’s performance as a whole and, therefore, that it should be explicitly linked to (long-term) remuneration. The criteria are based on three Sustainable Development Goals (SDGs) as defined by the United Nations that are included in Philips’ strategy on sustainability (no. 3, 12 and 13). These three SDGs are translated in five underlying objectives, which are measured against a specific target range.
At the beginning of the performance period, challenging target ranges are set for each of the five objectives. Based on a point-to-point method, performance achievement is measured at the end of the performance period (i.e., 3 years) versus the beginning of the performance period. The vesting level is determined based on the following scheme:
| | | | | |
| No. of measures achieved on or above target | Vesting % |
| 1 | 0% |
| 2 | 0% |
| 3 | 50%-100% |
| 4 | 100%-150% |
| 5 | 150%-200% |
The realized performance is described in the following table. As four out of five objectives are achieved within or better than target range, the vesting % lies between 100% and 150% of target. Based on the outperformance of the four objectives, the Supervisory Board has assessed that a vesting level of 150% would reflect an appropriate position within the vesting range.
| | | | | | | | | | | | | | |
| Sustainability category | Underlying objective | Target range | Realized performance | |
| Ensure healthy lives and promote well-being for all at all ages (SDG3) Lives Improved | Targeted # of Lives Improved in year 3 1 | 1.75 – 1.91 million | 1.96 million | Better than target range |
| Ensure sustainable consumption and production patterns (SDG12) Circularity | Targeted circular revenue in year 3 ² | 16.0% – 21.0% | 24.4% | Better than target range |
| Targeted waste to landfill in year 3 ³ | 3.5% – 0.1% | <0.01% | Better than target range |
| Targeted closing the loop in year 3 ⁴ | 28.0% – 36.0% | 19.5% | Below target range |
| Take urgent action to combat climate change and its impacts (SDG13) Carbon footprint | Targeted CO2 -equivalent (in kilotonnes) in year 3 | 612 – 549 kilotonnes CO2 | 474 kilotonnes CO2 | Better than target range |
1Lives Improved by Philips products, solutions and services and care to those in underserved markets.
2Revenue from products, services and solutions contributing to circularity (e.g. optimizing and re-using materials)
3Avoiding production of waste materials.
4Taking back healthcare equipment.
2025 Long-Term Incentive
The 2025 Long-Term Incentive grant consists of 100% performance shares of which vesting is subject to performance over a period of 3 years, whereby performance is measured based on the following performance metrics and weighting:
•40% weighting: Relative Total Shareholder Return (‘TSR’)
•40% weighting: Adjusted Earnings per Share growth* (‘EPS’) •20% weighting: ESG performance
ESG Performance (20% weighting)
At the start of each performance year, we select four ESG objectives in line with our long-term strategic priorities. There is no exhaustive list of objectives that can be selected. To ensure that all objectives are material, auditable and measurable, we only select objectives which are reported in our Annual Report (in preparation for the Corporate Sustainability Reporting Directive) and therefore are subject to assurance from our external provider of assurance with respect to the company's sustainability reporting. Furthermore, we make sure that in any measurement year, the ESG objectives do not overlap with our non-financial performance objectives for the Annual Incentive.
The objectives selected for the 2025 LTI grant are shown in the following table, including the rationale for selecting these objectives and more details on the measurement approach.
2025-2027
| | | | | | | | |
| ESG objective | Rationale | Measurement approach |
Targeted # of Lives Improved in year 3 1 | Ensure healthy lives and promote well-being for all at all ages
(SDG3) Lives Improved | We have a Lives Improved calculation methodology, which follows a three-step approach. 1) We first determine the installed base of our health- and well-being solutions, 2) We determine the number of touchpoints per product per year, and 3) To avoid double-counting, we eliminate all direct- and indirect double-counts between products and solutions. |
Targeted circular revenue in year 3 2 | Ensure sustainable consumption and production patterns
(SDG12) Circularity | Revenues generated through products and solutions that meet specific Circular Economy requirements (e.g. refurbished, reconditioned and remanufactured components). |
Targeted full value chain CO2-equivalent (in kilotonnes) in year 3 | Take urgent action to combat climate change and its impacts (SDG13) Carbon footprint | Total greenhouse gas emissions caused by Philips, expressed in kilotonnes CO2-equivalent, which is the sum of our Scope 1, 2 and material Scope 3 (at least 95% coverage) emissions according to the Greenhouse Gas Protocol. |
| Targeted People Engagement Score in year 3 | Retain an engaged workforce People Engagement Score | The People Engagement Score is the single measure of the overall level of employee engagement at Philips, measured on a bi-yearly basis. |
1Lives Improved by Philips products, solutions and services and care to those in underserved markets.
2Revenue from products, services and solutions contributing to circularity (e.g. optimizing and re-using materials)
Pension
The following pension arrangement is in place for the members of the Board of Management working under a services agreement governed by Dutch law:
•Flex ES Pension Plan in the Netherlands, which is a Collective Defined Contribution plan with a fixed contribution of (currently) 30.3% (including an own contribution of 2% - this was changed to 8% as of October 1, 2024) of the maximum pensionable salary of EUR 137,800 (effective January 1, 2024) minus the offset. The Flex ES Plan has a target retirement age of 68 and a target accrual rate of 1.85%;
•A gross Pension Allowance equal to 25% of the base compensation exceeding EUR 137,800.
Total remuneration costs in 2024
The following table gives an overview of the costs incurred by the company in 2024 and 2023 in relation to the remuneration of the Board of Management. Costs related to performance shares are based on accounting standards (IFRS), which prescribe that costs for each LTI grant are recognized over the full (multi-year) vesting period, proportionate to the relevant fiscal year. Therefore, the costs for any year reflect costs of multiple LTI grants, as opposed to the actual value for the holder of an LTI grant at the vesting date. Please refer to section 2022 Long-Term Incentive for more details on the actual vesting of the performance shares. Philips Group
Remuneration Board of Management 1) in EUR
| | | | | | | | | | | | | | | | | | | | | | | | | | | | | | | | |
| | | Accounting costs in the year |
| reported year | annual base compensation² | base compensation | realized annual incentive | performance shares³ | pension allowances⁴ | pension scheme costs | other compensation⁵ | total cost | Fixed-variable remuneration⁶ |
| R. Jakobs | 2024 | 1,250,000 | | 1,237,500 | | 927,750 | | 1,692,087 | | 274,925 | | 32,218 | | 83,870 | | 4,248,350 | | 38%-62% |
| 2023 | 1,200,000 | | 1,200,000 | | 2,004,480 | | 968,922 | | 267,798 | | 31,891 | | 109,256 | | 4,582,347 | | 35%-65% |
| Charlotte Hanneman | 2024 | 700,000 | | 175,545 | | 98,372 | | 104,606 | | 35,247 | | 7,775 | | 23,089 | | 444,633 | | 54%-46% |
| Abhijit Bhattacharya | 2024 | 840,000 | | 622,500 | | 351,934 | | 1,424,219 ⁶ | 129,788 | | 25,478 | | 963,596 ⁷ | 3,517,514 | | 50%-50% |
| 2023 | 810,000 | | 810,000 | | 1,075,939 | | 793,429 | | 197,133 | | 31,891 | | 94,516 | | 3,002,907 | | 38%-62% |
| Marnix van Ginneken | 2024 | 660,000 | | 652,500 | | 422,374 | | 740,101 | | 128,675 | | 32,218 | | 74,227 | | 2,050,095 | | 43%-57% |
| 2023 | 630,000 | | 630,000 | | 846,922 | | 614,840 | | 125,298 | | 31,891 | | 53,446 | | 2,302,397 | | 37%-63% |
| Total | 2024 | | 2,688,045 | | 1,800,429 | | 3,961,013 | | 568,635 | | 97,689 | | 1,144,781 | | 10,260,593 | | 44%-56% |
| 2023 | | 2,640,000 | | 3,927,341 | | 2,377,191 | | 590,228 | | 95,673 | | 257,218 | | 9,887,650 | | 36%-64% |
1Reference date for board membership is December 31, 2024.
2Annual Base Compensation as incurred in the year, base compensation increases are reflected proportionally.
3Costs of performance shares are based on accounting standards (IFRS) and do not reflect the value of performance shares at the vesting/release date.
4The stated amounts mainly concern (share of) allowances to members of the Board of Management that can be considered as remuneration. In a situation where such a share of an allowance can be considered as (indirect) remuneration (for example, private use of the company car), then the share is both valued and accounted for here. The method employed by the fiscal authorities is the starting point for the value stated.
5Fixed remuneration is determined as the sum of base compensation, pension allowances, pension scheme costs and other compensation. Variable remuneration is determined as the sum of realized annual incentive and performance shares.
6Accounting costs for 2024 include the additional costs for the accelerated accrual of the 2022 and 2023 LTI grant.
7Other compensation costs include the one-time severance payment of €840,000, which Abhijit Bhattacharya received in accordance with his employment agreement.
5-year development of CEO and Board of Management versus average employee remuneration costs compared to company performance
Internal pay ratios are a relevant input factor for determining the appropriateness of the implementation of the Remuneration Policy, as recognized in the Dutch Corporate Governance Code. Following the European Sustainability Reporting Standards (ESRS), this disclosure enhances transparency in income distribution and aligns with our commitment to fair remuneration practices. For the 2024 financial year, the ratio between the annual total compensation for the CEO, which is the highest paid individual, and the average annual total remuneration for an employee was 43:1. The ratio decreased from 46:1 in 2023. Furthermore, the ratio between the CEO and median annual total remuneration for all employees (excluding the highest-paid individual) was 48:1. Further details on the development of these amounts and ratios over time can be found in the following table. Please note that the amounts presented in the table reflect total remuneration costs to the company which differ from the actual payouts to the members of the Board of Management.
Philips Group
Remuneration costs in EUR
| | | | | | | | | | | | | | | | | |
| 2020 | 2021 | 2022 | 2023 | 2024 |
| Remuneration | | | | | |
| CEO Total Remuneration Costs (A)¹ | 6,153,067 | 5,452,299 | 5,133,659 | 4,582,347 | 4,248,350 |
| CFO Total Remuneration Costs | 3,007,990 | 2,652,864 | 1,896,081 | 3,002,907 | 3,517,514 |
| CLO Total Remuneration Costs | 2,203,160 | 2,029,054 | 1,416,837 | 2,302,397 | 2,050,095 |
| Average Employee (FTE) Total Remuneration Costs (B)² | 91,455 | 86,853 | 93,373 | 99,866 | 99,091 |
| Ratio A versus B⁴ | 67:1 | 63:1 | 55:1 | 46:1 | 43:1 |
| Median Employee Total Remuneration Costs (C)³ | | | | | 89,103 |
| Ratio A versus C⁴ | | | | | 48:1 |
| Company performance | | | | | |
| Annual TSR⁵ | 6.2 | % | (14.5 | %) | (60.0 | %) | 42.9 | % | 43.3 | % |
| Comparable Sales Growth%⁶ | 2.9 | % | (1.2 | %) | (2.8 | %) | 6.0 | % | 1.2 | % |
| Adjusted EBITA%⁶ | 13.2 | % | 12.0 | % | 7.4 | % | 10.6 | % | 11.5 | % |
| Free Cash Flow⁶ | 1,635 | 900 | (961) | 1,582 | 906 |
1For 2022, CEO refers to Frans van Houten for the period up to October 15, 2022, and to Roy Jakobs for the period from October 15, 2022, onwards. For 2020 and 2021, CEO refers to Frans van Houten.
2Based on Employee benefit expenses (EUR 6.6 billion) divided by the average number of employees (67,014 FTE) as reported in Income from operations. This results in an average annual total compensation cost of EUR 99,091 per employee.
3Median Employee Total Remuneration Costs are based on the full salary & wage expenses to the company, including base salary, social security, benefits in cash, benefits in kind, Annual Incentive and Long Term Incentives.
4A consideration when interpreting the ratios between CEO (i.e., highest paid individual) and average- and median employee remuneration is that the remuneration of the CEO is more heavily dependent on variable compensation than the remuneration of the typical employee at Philips. Furthermore, the costs of performance shares are based on accounting standards (IFRS) and the specific allocation of these costs to the year. As such, the total remuneration level and costs applicable to the CEO will vary more with Philips’ financial performance than the remuneration level and costs applicable to the typical employee. As a consequence, the ratio will increase when financial performance is strong and conversely decrease when financial performance is not as strong.
5Annual TSR was calculated in line with the method used for the LTI plan (i.e., based on reinvested dividends and 3-month averaging)
Historical LTI grants and holdings
Number of performance shares (holdings)
Under the LTI Plan the current members of the Board of Management were granted 246,822 performance shares in 2024. The following table provides an overview at end December 2024 of performance share grants.
Philips Group
Number of performance shares (holdings) in number of shares unless otherwise stated
| | | | | | | | | | | | | | | | | | | | | | | | | | | | | | | | | | | |
| grant date | number of shares originally granted | value at grant date | vesting date | end of holding period | unvested opening balance at Jan. 1, 2024 | number of shares awarded in 2024 | (dividend) shares awarded | number of shares vested in 2024 ¹ | value at vesting date in 2024 | unvested closing balance at Dec. 31, 2024 |
| Roy Jakobs | 4/30/2021 | 15,812 ² | 750,000 | 4/30/2024 | 4/30/2026 | 17,443 | - | 0 | 3,052 | 77,227 | 0 |
| 4/29/2022 | 37,630 ² | 930,000 | 4/29/2025 | 4/29/2027 | 40,754 | - | 1,394 | - | - | 42,148 |
| 10/28/2022 | 24,279 | 314,137 | 10/28/2025 | 10/28/2027 | 25,365 | - | 868 | - | - | 26,233 |
| 4/28/2023 | 124,538 | 2,400,000 | 4/28/2026 | 4/28/2028 | 130,109 | - | 4,451 | - | - | 134,560 |
| 7/5/2024 | 131,443 | 2,500,000 | 7/5/2027 | 7/5/2029 | - | 131,443 | 4,496 | 0 | 0 | 135,939 |
| Charlotte Hanneman | 7/29/2024 | 25,346 | 613,934 | 7/29/2027 | 7/29/2029 | - | 25,346 | 0 | - | 0 | 25,346 |
| 7/29/2024 | 37,982 | 920,000 | 7/29/2027 | 7/29/2029 | - | 37,982 | 0 | - | 0 | 37,982 |
| Abhijit Bhattacharya | 4/30/2021 | 25,141 | 1,192,500 | 4/30/2024 | 4/30/2026 | 27,734 | - | 0 | 4,853 | 122,790 | - |
| 4/29/2022 | 49,162 | 1,215,000 | 4/29/2025 | 4/29/2027 | 53,244 | - | 1,821 | - | - | 55,065 |
| 4/28/2023 | 63,047 | 1,215,000 | 4/28/2026 | 4/28/2028 | 65,867 | - | 2,253 | - | - | 68,120 |
| Marnix van Ginneken | 4/30/2021 | 19,448 | 922,500 | 4/30/2024 | 4/30/2026 | 21,454 | - | 0 | 3,754 | 94,985 | - |
| 4/29/2022 | 38,237 | 945,000 | 4/29/2025 | 4/29/2027 | 41,412 | - | 1,417 | - | - | 42,828 |
| 4/28/2023 | 49,037 | 945,000 | 4/28/2026 | 4/28/2028 | 51,231 | - | 1,752 | - | - | 52,983 |
| 7/5/2024 | 52,051 | 990,000 | 7/5/2027 | 7/5/2029 | - | 52,051 | 1,781 | 0 | 0 | 53,832 |
1The shares vested in 2024 are subject to a 2-year holding period
2Awarded before date of appointment as a member of the Board of Management
Share ownership guidelines
To further align the interests to those of stakeholders and to motivate the achievement of sustained performance, the members of the Board of Management are bound to a minimum shareholding requirement. The following table shows the minimum shareholding requirement, Annual Base Compensation, (vested) shares held and share ownership ratio of each Board of Management member as per December 31, 2024. Until the minimum shareholding requirement is reached, the members of the Board of Management are required to retain all after-tax performance shares that have vested, but they are not required to make additional share purchases.
Philips Group
Share ownership Board of Management
| | | | | | | | | | | | | | |
| Minimum shareholding requirement¹ | Annual Base Compensation | (Vested) shares held | Ownership ratio² |
| Roy Jakobs | 4.0x | 1,250,000 | 134,298 | 2.6x |
| Charlotte Hanneman | 3.0x | 700,000 | - | 0x |
| Marnix van Ginneken | 3.0x | 660,000 | 137,753 | 5.1x |
1As ratio of Annual Base Compensation
2The Ownership ratio is calculated by multiplying the total shares held by the share price of EUR 24.40 (based on the closing share price of December 31, 2024) and dividing this by the base compensation.
Remuneration of the Supervisory Board in 2024
Summary of the 2024 Remuneration Policy
Also the Remuneration Policy for the Supervisory Board has been adopted at the Annual General Meeting of Shareholders held on May 7, 2024.
The overarching objective of the 2024 Remuneration Policy for the Supervisory Board is to enable its members to fulfill their duties, acting independently: supervising the policies and management and the general affairs of Philips, and supporting the Board of Management and the Executive Committee with advice. Also the members of the Supervisory Board are guided by the company’s long-term interests, with due observance of the company’s mission, vision and strategy, taking into account the interests of shareholders and all other stakeholders.
As reflected in the profile of the Supervisory Board (as updated early 2024 and included in the Rules of Procedure of the Supervisory Board), the selection of candidates for appointment to the Supervisory Board will be based on merit. The profile aims for an appropriate combination of knowledge and experience among its members, encompassing a wide range of proficiencies and capabilities, all in relation to the global character of Philips’ Businesses. The Supervisory Board furthermore aims to have members with a diverse set of qualities, including different nationalities and (cultural) backgrounds.
To support the objectives mentioned above, the 2024 Remuneration Policy is aimed at attracting and retaining Supervisory Board members internationally, of the highest caliber and with experience and expertise relevant to our health technology Businesses.
To enable more gradual increases in the future, the 2024 Remuneration Policy includes the Supervisory Board’s intention to review the fee levels in principle every two years to monitor and take account of market developments and manage expectations from our key stakeholders. In these
reviews we will in principle apply a consistent approach using the same Quantum Peer Group for our Supervisory Board as is used for the Board of Management.
The following table provides an overview of the current remuneration structure. The fee levels were set below median market levels (and below the 25th percentile market level for the Chairman) paid in the Quantum Peer Group used in the 2024 Remuneration Policy for the Board of Management.
Philips Group
Remuneration Supervisory Board in EUR
| | | | | | | | | | | | | | | | | | | | |
| Fee type (amounts in EUR) | Chairman | Vice Chair | Member |
| 2024 | As of 2025 | 2024 | As of 2025 | 2024 | As of 2025 |
| Supervisory Board (annual fee) | 166,500 | 175,000 | 123,500 | 130,000 | 107,500 | 113,000 |
| Audit Committee | 29,000 | 30,500 | n.a. | 19,250 | 20,250 |
| Remuneration Committee | 22,500 | 23,750 | n.a. | 15,000 | 15,750 |
| Corporate Governance and Nomination & Selection Committee | 22,500 | 23,750 | n.a. | 15,000 | 15,750 |
| Quality and Regulatory Committee | 22,500 | 23,750 | n.a. | 15,000 | 15,750 |
In accordance with the Dutch Corporate Governance Code, the remuneration for the members of the Supervisory Board is not dependent on the results of the company and does not include any shares (or rights to shares). Nevertheless, members of the Supervisory Board are encouraged to hold shares in the company for the purpose of long-term investment to reflect their confidence in the future course of the company. The company does not grant personal loans to members of the Supervisory Board.
Attendance fees, entitlement to Philips product arrangements and fixed net expense allowances are as follows:
| | | | | | | | |
| Fee and reimbursement type (amounts in EUR) | Chairman | All members |
| Attendance fee per inter-European trip | 2,750 | 2,750 |
| Attendance fee per intercontinental trip | 5,500 | 5,500 |
| Entitlement to Philips product arrangement | 2,000 | 2,000 |
| Annual fixed net expense allowance | 11,345 | 2,269 |
| Other travel expenses | As reasonably incurred |
The members of the Supervisory Board benefit from coverage under the company’s Directors and Officers (D&O) liability insurance.
Remuneration of the Supervisory Board in 2024
The individual members of the Supervisory Board received, by virtue of the positions they held, the following remuneration in 2024:
Philips Group
Remuneration of the Supervisory Board in EUR
| | | | | | | | | | | | | | |
| membership | committees | other compensation¹ | total |
| F. Sijbesma | 166,500 | | 37,500 | | 28,945 | | 232,945 | |
| P.A. Stoffels | 123,500 | | 37,500 | | 13,269 | | 174,269 | |
| S.K. Chua | 107,500 | | 19,250 | | 26,107 | | 152,857 | |
| M.E. Doherty | 107,500 | | 29,000 | | 20,289 | | 156,789 | |
| A.M. Harrison | 107,500 | | 15,000 | | 7,769 | | 130,269 | |
| P. Löscher | 107,500 | | 34,250 | | 18,769 | | 160,519 | |
| I. Nooyi | 107,500 | | 15,000 | | 20,154 | | 142,654 | |
| S. Poonen | 107,500 | | 16,771 | | 19,267 | | 143,538 | |
| D. Pyott | 107,500 | | 28,750 | | 18,769 | | 155,019 | |
| B. Ribadeau-Dumas | 70,390 | | 9,822 | | 17,986 | | 98,198 | |
| H. Verhagen | 107,500 | | 26,229 | | 16,267 | | 149,996 | |
| Total | 1,220,390 | | 269,072 | | 207,592 | | 1,697,054 | |
1The amounts mentioned under other compensation relate to the fee for intercontinental travel, inter-European travel, the Philips product arrangement and the annual fixed net expense allowance.
9 Group financial statements
9.1 Controls and Procedures
9.1.1 Disclosures controls and procedures
The Company’s Chief Executive Officer and Chief Financial Officer have evaluated the effectiveness of the design and operation of the company’s disclosure controls and procedures (as defined in Rules 13a15(e) and 15d15(e) under the Securities Exchange Act of 1934) as of the end of the period covered by the Annual Report. Based on that evaluation, the Chief Executive Officer and Chief Financial Officer have concluded that these disclosure controls and procedures are effective as of December 31, 2024.
9.1.2 Management's annual report on internal control over financial reporting
The Board of Management of Koninklijke Philips N.V. (Royal Philips) is responsible for establishing and maintaining an adequate system of internal control over financial reporting (as such term is defined in Rule 13a-15 (f) under the US Securities Exchange Act). Internal control over financial reporting is a process to provide reasonable assurance regarding the reliability of our financial reporting for external purposes in accordance with IFRS as issued by the IASB.
Internal control over financial reporting includes maintaining records that, in reasonable detail, accurately and fairly reflect our transactions; providing reasonable assurance that transactions are recorded as necessary for preparation of our financial statements; providing reasonable assurance that receipts and expenditures of company assets are made in accordance with management authorization; and providing reasonable assurance that unauthorized acquisition, use or disposition of company assets that could have a material effect on our financial statements would be prevented or detected on a timely basis. Because of its inherent limitations, internal control over financial reporting is not intended to provide absolute assurance that a misstatement of our financial statements would be prevented or detected. Also, projections of any evaluation of the effectiveness of internal control over financial reporting to future periods are subject to the risk that the controls may become inadequate because of changes in conditions, or that the degree of compliance with the policies or procedures may deteriorate.
The Board of Management conducted an assessment of Royal Philips' internal control over financial reporting based on the “Internal Control Integrated Framework (2013)” established by the Committee of Sponsoring Organizations of the Treadway Commission (COSO).
Based on the Board of Management’s assessment of the effectiveness of Royal Philips' internal control over financial reporting as of December 31, 2024, it has concluded that, as of December 31, 2024, Royal Philips' internal control over Group financial reporting is considered effective.
9.1.3 Attestation report of the registered public accounting firm
The effectiveness of the Royal Philips’ internal control over financial reporting as of December 31, 2024, as included in this section Group financial statements, has been audited by EY Accountants B.V., an independent registered public accounting firm, as stated in their report which follows hereafter.
9.1.4 Changes in internal control over financial reporting
There were no changes in our internal control over financial reporting during 2024 that have materially affected, or are reasonably likely to materially affect, our internal control over financial reporting.
9.2 Reports of the independent auditor
9.3 Independent auditor’s report on internal control over financial reporting
Report of Independent Registered Public Accounting Firm
To: the Supervisory Board and Shareholders of Koninklijke Philips N.V.
Opinion on Internal Control over Financial Reporting
We have audited Koninklijke Philips N.V.’s internal control over financial reporting as of December 31, 2024, based on criteria established in Internal Control — Integrated Framework issued by the Committee of Sponsoring Organizations of the Treadway Commission (2013 framework) (the COSO criteria). In our opinion, Koninklijke Philips N.V. (the Company) maintained, in all material respects, effective internal control over financial reporting as of December 31, 2024, based on the COSO criteria.
We also have audited, in accordance with the standards of the Public Company Accounting Oversight Board (United States) (PCAOB), the consolidated balance sheets of the Company as of December 31, 2024 and 2023, the related consolidated statements of income, comprehensive income, cash flows and changes in equity for each of the three years in the period ended December 31, 2024, and the related notes and our report dated February 21, 2025 expressed an unqualified opinion thereon.
Basis for opinion
The Company’s management is responsible for maintaining effective internal control over financial reporting, and for its assessment of the effectiveness of internal control over financial reporting included in the accompanying section Management’s report on internal control, of this Annual Report. Our responsibility is to express an opinion on the Company’s internal control over financial reporting based on our audit. We are a public accounting firm registered with the PCAOB and are required to be independent with respect to the Company in accordance with the U.S. federal securities laws and the applicable rules and regulations of the Securities and Exchange Commission and the PCAOB.
We conducted our audit in accordance with the standards of the PCAOB. Those standards require that we plan and perform the audit to obtain reasonable assurance about whether effective internal control over financial reporting was maintained in all material respects.
Our audit included obtaining an understanding of internal control over financial reporting, assessing the risk that a material weakness exists, testing and evaluating the design and operating effectiveness of internal control based on the assessed risk, and performing such other procedures as we considered necessary in the circumstances. We believe that our audit provides a reasonable basis for our opinion.
Definition and Limitations of Internal Control over Financial Reporting
A company’s internal control over financial reporting is a process designed to provide reasonable assurance regarding the reliability of financial reporting and the preparation of financial statements for external purposes in accordance with generally accepted accounting principles. A company’s internal control over financial reporting includes those policies and procedures that (1) pertain to the maintenance of records that, in reasonable detail, accurately and fairly reflect the transactions and dispositions of the assets of the company; (2) provide reasonable assurance that transactions are recorded as necessary to permit preparation of financial statements in accordance with generally accepted accounting principles, and that receipts and expenditures of the company are being made only in accordance with authorizations of management and directors of the company; and (3) provide reasonable assurance regarding prevention or timely detection of unauthorized acquisition, use, or disposition of the company’s assets that could have a material effect on the financial statements.
Because of its inherent limitations, internal control over financial reporting may not prevent or detect misstatements. Also, projections of any evaluation of effectiveness to future periods are subject to the risk that controls may become inadequate because of changes in conditions, or that the degree of compliance with the policies or procedures may deteriorate.
EY Accountants B.V
/s/ EY Accountants B.V.
Amsterdam, the Netherlands
February 21, 2025
9.4 Independent auditor’s report on the consolidated financial statements
Report of Independent Registered Public Accounting Firm
To: the Supervisory Board and Shareholders of Koninklijke Philips N.V.
Opinion on the Financial Statements
We have audited the accompanying consolidated balance sheets of Koninklijke Philips N.V. (Philips, or the Company) as of December 31, 2024 and 2023, the related consolidated statements of income, comprehensive income, cash flows and changes in equity for each of the three years in the period ended December 31, 2024, and the related notes (collectively referred to as the group financial statements). In our opinion, the group financial statements present fairly, in all material respects, the financial position of the Company at December 31, 2024 and 2023, and the results of its operations and its cash flows for each of the three years in the period ended December 31, 2024, in conformity with International Financial Reporting Standards as issued by the International Accounting Standards Board.
We have also audited, in accordance with the standards of the Public Company Accounting Oversight Board (United States) (PCAOB), the Company's internal control over financial reporting as of December 31, 2024, based on criteria established in Internal Control-Integrated Framework issued by the Committee of Sponsoring Organizations of the Treadway Commission (2013 framework), and our report dated February 21, 2025 expressed an unqualified opinion thereon.
Basis for Opinion
These financial statements are the responsibility of the Company‘s management. Our responsibility is to express an opinion on the Company‘s financial statements based on our audits. We are a public accounting firm registered with the PCAOB and are required to be independent with respect to the Company in accordance with the US federal securities laws and the applicable rules and regulations of the Securities and Exchange Commission and the PCAOB.
We conducted our audits in accordance with the standards of the PCAOB. Those standards require that we plan and perform the audit to obtain reasonable assurance about whether the financial statements are free of material misstatement, whether due to error or fraud. Our audits included performing procedures to assess the risks of material misstatement of the financial statements, whether due to error or fraud, and performing procedures that respond to those risks. Such procedures included examining, on a test basis, evidence regarding the amounts and disclosures in the financial statements. Our audits also included evaluating the accounting principles used and significant estimates made by management, as well as evaluating the overall presentation of the financial statements. We believe that our audits provide a reasonable basis for our opinion.
Critical audit matters
The critical audit matters communicated below are matters arising from the current period audit of the financial statements that were communicated or required to be communicated to the Audit Committee and that: (1) relate to accounts or disclosures that are material to the financial statements and (2) involved our especially challenging, subjective or complex judgments. The communication of critical audit matters does not alter in any way our opinion on the financial statements, taken as a whole, and we are not, by communicating the critical audit matters below, providing separate opinions on the critical audit matters or on the accounts or disclosures to which they relate.
| | | | | |
| Measurement of provisions and disclosures for legal claims, litigations and contingent liabilities |
| Description of the Matter | The Company and certain of its group companies and former group companies are involved as a party in legal proceedings, including regulatory and other governmental proceedings, as well as being investigated by governmental authorities for alleged non-compliance with laws and regulations. As more fully described in Note 19, Provisions, and Note 24, Contingencies, this includes legal claims, and litigation related to the Respironics recall and discussions with and information provided to the Department of Justice (DoJ), certain United States' State Attorneys General and the Securities and Exchange Commission (SEC) regarding ongoing investigations.
In Note 24, the Company has disclosed present obligations with a probable outflow of economic resources where the amount cannot be reliably estimated, as well as certain possible obligations arising from past events.
The Company recognizes provisions for legal claims and litigation when it has a present obligation, it is probable that an outflow of economic benefits will be required to settle the obligation, and the amount can be estimated reliably. At December 31, 2024, the provision balance recorded for these obligations is EUR 1,079 million. A significant portion of this balance is derived from a settlement in relation to the personal injury and medical monitoring class action complaints in the United States (US) for which the Company recorded a provision of EUR 984 million in 2024.
Auditing the provisions for legal claims and litigation, and the disclosure for provisions and contingent liabilities is complex due to the judgment applied by management in predicting the outcome of the matters and estimating the potential impact if the outcomes are unfavorable and the amounts involved are, or can be, material to the group financial statements as a whole.
|
| How We Addressed the Matter in Our Audit | Our audit procedures included, amongst others, evaluating the appropriateness of the Company’s accounting policies related to provisions and disclosures for legal claims, litigations, and contingent liabilities in accordance with IAS 37 Provisions, contingent liabilities, and contingent assets, and whether the accounting policies have been applied consistently or whether changes, if any, are appropriate in the circumstances.
We obtained an understanding, evaluated the design and tested the operating effectiveness of the Company’s controls relating to the identification and evaluation of legal claims, litigation and investigations, and the measurement and continuous re-assessment of the related provisions, contingent liabilities, and disclosures. To evaluate the potential impact of these matters and test the Company’s estimate of provisions for legal claims and litigation and the disclosure for provisions and contingent liabilities our procedures included, among others, discussion of the legal claims, litigation and investigations with both internal and external legal counsel and receiving confirmation letters from both internal and external legal counsel involved in these matters. We also discussed the allegations with the Company’s finance department, inspected relevant correspondence with authorities, and inspected the minutes of the meetings of the Audit Committee, Supervisory Board, Board of Management and Executive Committee. For claims settled during the year, we read the related settlement agreements and agreed the cash payments to these, as appropriate.
Specifically related to ongoing investigations into alleged non-compliance with laws and regulations regarding events leading to the Respironics recall, we were supported by forensic specialists and legal specialists in assessing certain technical aspects of the alleged non-compliance matters, legal claims, and litigation. To assess the completeness of the provisions and contingent liabilities, we reviewed publicly available information, such as press releases, notifications issued by regulatory bodies, media reports and publications. For the personal injury litigation and medical monitoring class action settlement in the US, we obtained the settlement agreement and agreed the terms and conditions to the amount recorded for the provision.
We evaluated the adequacy of the Company’s disclosure for provisions for legal claims and litigation, and contingent liabilities, as included in the group financial statements. |
| | | | | |
| Recognition of deferred tax assets in the United States |
| Description of the Matter | The net deferred tax assets of EUR 1,835 million consist of deferred tax assets of EUR 1,916 million and deferred tax liabilities of EUR 81 million. As more fully described in Note 8, Income taxes, of the total deferred tax assets of EUR 1,916 million as of December 31, 2024, EUR 1,188 million is recognized in respect of entities in various countries where there have been tax losses in the current or preceding financial year, primarily the United States (US).
Deferred tax assets are recognized for unused tax losses, tax credits and deductible temporary differences to the extent that it is probable that there will be future taxable profits against which these can be utilized. Determining whether such taxable profits are probable involves significant judgment, which includes but is not limited to, the availability and timing of reversal of offsetting deferred tax liabilities, the projection of available future tax profits and the expected period of recovery.
Auditing the recognition of deferred tax assets in the US was complex because it involved significant judgment and management assumptions related to projections used to determine future taxable income, which were derived from the Company’s strategic plan, and estimation uncertainty in determining the expected period of recovery. |
| How We Addressed the Matter in Our Audit | We obtained an understanding, evaluated the design, and tested the operating effectiveness of controls over the recognition of deferred tax assets in the US. This included controls over management’s process related to the assessment of the model used to project future taxable income, the assumptions used in the income projections, and controls over the mathematical accuracy of the calculation.
To evaluate management’s recognition of the US deferred tax assets, we performed procedures to test the projections of future taxable income, based on the Company’s strategic plan, including assessment of the historical accuracy of management’s forecasting assumptions. We also benchmarked the projections of future taxable income to industry trends, performed sensitivity analyses over the key forecasting inputs, evaluated the risk-adjusted scenarios, and tested the mathematical accuracy of management’s model.
With the assistance of our tax professionals, we assessed the reasonableness of the expected period of recovery by analyzing the timing and right of offset of certain deferred tax assets with deferred tax liabilities.
We also evaluated the adequacy of management’s disclosures around deferred tax assets as included in the group financial statements. |
/s/ EY Accountants B.V.
We have served as the Company‘s auditor since 2016.
Amsterdam, the Netherlands
February 21, 2025
9.5 Consolidated statements of income
Philips Group
Consolidated statements of income in millions of EUR
for the year ended December 31,
| | | | | | | | | | | | | | | | | | | | |
| | 2022 | | 2023 | | 2024 |
| 6 | Sales | 17,827 | | | 18,169 | | | 18,021 | |
| Cost of sales | (10,633) | | | (10,721) | | | (10,248) | |
| Gross margin | 7,194 | | | 7,448 | | | 7,773 | |
| Selling expenses | (4,621) | | | (4,524) | | | (4,486) | |
| General and administrative expenses | (671) | | | (608) | | | (582) | |
| Research and development expenses | (2,091) | | | (1,890) | | | (1,747) | |
| 11 | Impairment of goodwill | (1,357) | | | (8) | | | | |
| 6 | Other business income | 127 | | | 112 | | | 590 | |
| 6 | Other business expenses | (109) | | | (645) | | | (1,019) | |
| 6 | Income from operations | (1,529) | | | (115) | | | 529 | |
| 7 | Financial income | 58 | | | 63 | | | 105 | |
| 7 | Financial expenses | (258) | | | (376) | | | (387) | |
| Investments in associates, net of income taxes | (2) | | | (98) | | | (124) | |
| Income before taxes | (1,731) | | | (526) | | | 123 | |
| 8 | Income tax (expense) benefit | 113 | | | 73 | | | (963) | |
| Income from continuing operations | (1,618) | | | (454) | | | (840) | |
| Discontinued operations, net of income taxes | 13 | | | (10) | | | 142 | |
| 3 | Net income | (1,605) | | | (463) | | | (698) | |
| | | | | | |
| Attribution of net income: | | | | | |
| Net income attributable to shareholders of Koninklijke Philips N.V. | (1,608) | | | (466) | | | (702) | |
| Net income attributable to non-controlling interests | 3 | | | 2 | | | 3 | |
Philips Group
Earnings per common share attributable to shareholders of Koninklijke Philips N.V. in EUR
for the year ended December 31,
| | | | | | | | | | | | | | | | | |
| 2022 | | 2023 | | 2024 |
| Basic earnings per common share attributable to shareholders of Koninklijke Philips N.V.¹ | | | | | |
| Income from continuing operations | (1.70) | | | (0.48) | | | (0.90) | |
| Net income | (1.69) | | | (0.49) | | | (0.75) | |
| Diluted earnings per common share attributable to shareholders of Koninklijke Philips N.V.¹ | | | | | |
| Income from continuing operations | (1.70) | | | (0.48) | | | (0.90) | |
| Net income | (1.69) | | | (0.49) | | | (0.75) | |
1Per share calculations have been adjusted retrospectively for all periods presented to reflect the issuance of shares for the share dividend in respect of 2023.
Amounts may not add up due to rounding.
9.6 Consolidated statements of comprehensive income
Philips Group
Consolidated statements of comprehensive income in millions of EUR
for the year ended December 31,
| | | | | | | | | | | | | | | | | | | | |
| | 2022 | | 2023 | | 2024 |
| | | | | | |
| Net income for the period | (1,605) | | | (463) | | | (698) | |
| | | | | | |
| 20 | Pensions and other-post employment plans: | | | | | |
| Remeasurement, before tax | 101 | | | (26) | | | (18) | |
| 8 | Income tax effect on remeasurements | (20) | | | 3 | | | 12 | |
| | | | | | |
| Financial assets fair value through OCI: | | | | | |
| Net current-period change, before tax | (32) | | | (20) | | | (21) | |
| Income tax effect on net current-period change | 1 | | | 3 | | | 9 | |
| Total of items that will not be reclassified to Income Statement | 49 | | | (40) | | | (17) | |
| | | | | | |
| Currency translation differences: | | | | | |
| Net current period change, before tax | 748 | | | (579) | | | 768 | |
| 8 | Income tax effect on net current-period change | 2 | | | - | | | (8) | |
| Reclassification adjustment for (gain) loss realized | - | | | (26) | | | (7) | |
| | | | | | |
| Cash flow hedges: | | | | | |
| Net current-period change, before tax | (29) | | | 29 | | | 21 | |
| 8 | Income tax effect on net current-period change | (10) | | | (2) | | | 3 | |
| Reclassification adjustment for (gain) loss realized | 63 | | | (19) | | | (29) | |
| Total of items that are or may be reclassified to Income Statement | 774 | | | (597) | | | 748 | |
| | | | | | |
| Other comprehensive income for the period | 823 | | | (637) | | | 731 | |
| | | | | | |
| Total comprehensive income for the period | (782) | | | (1,100) | | | 33 | |
| | | | | | |
| Total comprehensive income (loss) attributable to: | | | | | |
| Shareholders of Koninklijke Philips N.V. | (786) | | | (1,101) | | | 27 | |
| Non-controlling interests | 4 | | | 1 | | | 6 | |
Amounts may not add up due to rounding.
9.7 Consolidated balance sheets
Philips Group
Consolidated balance sheets in millions of EUR
as of December 31,
| | | | | | | | | | | | | | | | | |
| | | 2023 | | 2024 |
| | | | | |
| | Non-current assets | | | |
| 2 | 10 | Property, plant and equipment | 2,483 | | | 2,452 | |
| 2 | 11 | Goodwill | 9,876 | | | 10,383 | |
| 2 | 12 | Intangible assets excluding goodwill | 3,190 | | | 2,982 | |
| 16 | Non-current receivables | 193 | | | 208 | |
| 5 | Investments in associates | 381 | | | 257 | |
| 13 | Other non-current financial assets | 619 | | | 631 | |
| 28 | Non-current derivative financial assets | 3 | | | 8 | |
| 8 | Deferred tax assets | 2,627 | | | 1,916 | |
| 14 | Other non-current assets | 93 | | | 118 | |
| | Total non-current assets | 19,466 | | | 18,955 | |
| | | | | |
| | Current assets | | | |
| 15 | Inventories | 3,491 | | | 3,198 | |
| 13 | Other current financial assets | 3 | | | 2 | |
| 14 | Other current assets | 500 | | | 586 | |
| 28 | Current derivative financial assets | 45 | | | 69 | |
| | Income tax receivable | 220 | | | 94 | |
| 16 | 25 | Current receivables | 3,733 | | | 3,672 | |
| 3 | Assets classified as held for sale | 79 | | | - | |
| 29 | Cash and cash equivalents | 1,869 | | | 2,401 | |
| | Total current assets | 9,940 | | | 10,022 | |
| | Total assets | 29,406 | | | 28,976 | |
| | | | | |
| 17 | Equity | | | |
| | Shareholders’ equity | 12,028 | | | 12,006 | |
| | Common shares | 183 | | | 188 | |
| | Capital in excess of par value | 5,827 | | | 6,654 | |
| | Reserves | 879 | | | 1,925 | |
| | Other | 5,139 | | | 3,239 | |
| 17 | Non-controlling interests | 33 | | | 37 | |
| | Group equity | 12,061 | | | 12,043 | |
| | | | | |
| | Non-current liabilities | | | |
| 18 | Long-term debt | 7,035 | | | 7,113 | |
| 28 | Non-current derivative financial liabilities | 3 | | | 4 | |
| 19 | 20 | Long-term provisions | 1,035 | | | 996 | |
| 8 | Deferred tax liabilities | 71 | | | 81 | |
| 22 | Non-current contract liabilities | 469 | | | 431 | |
| 8 | Non-current tax liabilities | 390 | | | 119 | |
| 22 | Other non-current liabilities | 54 | | | 45 | |
| | Total non-current liabilities | 9,058 | | | 8,787 | |
| | | | | |
| | Current liabilities | | | |
| 18 | Short-term debt | 654 | | | 526 | |
| 28 | Current derivative financial liabilities | 40 | | | 59 | |
| | Income tax payable | 83 | | | 71 | |
| 25 | Accounts payable | 1,917 | | | 1,830 | |
| 21 | Accrued liabilities | 1,887 | | | 1,630 | |
| 22 | Current contract liabilities | 1,809 | | | 1,699 | |
| 19 | 20 | Short-term provisions | 1,463 | | | 1,977 | |
| | Dividend payable | 11 | | | - | |
| | Liabilities directly associated with assets held for sale | 9 | | | - | |
| 22 | Other current liabilities | 414 | | | 354 | |
| | Total current liabilities | 8,287 | | | 8,146 | |
| | Total liabilities | 17,345 | | | 16,933 | |
| | Total liabilities and group equity | 29,406 | | | 28,976 | |
| | | | | |
Amounts may not add up due to rounding.
9.8 Consolidated statements of cash flows
Philips Group
Consolidated statements of cash flows in millions of EUR
for the year ended December 31,
| | | | | | | | | | | | | | | | | | | | | | | |
| | | 2022 | | 2023 | | 2024 |
| | Cash flows from operating activities | | | | | |
| | Net income (loss) | (1,605) | | | (463) | | | (698) | |
| | Results of discontinued operations, net of income tax | (13) | | | 10 | | | (142) | |
| | Adjustments to reconcile net income to net cash provided by (used for) operating activities: | | | | | |
| | Depreciation, amortization, and impairment of assets | 1,602 | | | 1,261 | | | 1,390 | |
| | Impairment of goodwill | 1,357 | | | 8 | | | | |
| | Share-based compensation | 95 | | | 88 | | | 96 | |
| | Net loss (gain) on sale of assets | (115) | | | (71) | | | (19) | |
| | Interest income | (25) | | | (46) | | | (81) | |
| | Interest expense on debt, borrowings, and other liabilities | 226 | | | 255 | | | 270 | |
| | Investments in associates, net of income taxes | 112 | | | 107 | | | 126 | |
| | Income tax expense (benefit) | (113) | | | (71) | | | 964 | |
| | Decrease (increase) in working capital | (862) | | | 913 | | | (355) | |
| | Decrease (increase) in receivables and other current assets | (342) | | | 298 | | | (1) | |
| | Decrease (Increase) in inventories | (572) | | | 257 | | | 230 | |
| | Increase (decrease) in accounts payable, accrued and other current liabilities | 52 | | | 358 | | | (583) | |
| | Decrease (increase) in non-current receivables and other assets | 1 | | | (33) | | | (5) | |
| | Increase (decrease) in other liabilities | (84) | | | (38) | | | (51) | |
| 19 | Increase (decrease) in provisions | (199) | | | 422 | | | 316 | |
| | Other items | (39) | | | 129 | | | 101 | |
| | Interest received | 15 | | | 53 | | | 83 | |
| | Interest paid | (205) | | | (250) | | | (261) | |
| | Dividends received from investments in associates | 12 | | | 13 | | | 8 | |
| | Income taxes paid | (333) | | | (152) | | | (173) | |
| | Net cash provided by (used for) operating activities | (173) | | | 2,136 | | | 1,569 | |
| | Cash flows from investing activities | | | | | |
| | Net capital expenditures | (788) | | | (554) | | | (663) | |
| | Purchase of intangible assets | (105) | | | (96) | | | (118) | |
| | Expenditures on development assets | (257) | | | (203) | | | (241) | |
| | Capital expenditures on property, plant and equipment | (444) | | | (345) | | | (317) | |
| | Proceeds from sales of property, plant and equipment | 18 | | | 90 | | | 13 | |
| 23 | Net proceeds from (cash used for) derivatives and current financial assets | (72) | | | (46) | | | 38 | |
| 23 | Purchase of other non-current financial assets | (116) | | | (92) | | | (123) | |
| 23 | Proceeds from other non-current financial assets | 78 | | | 48 | | | 57 | |
| 5 | 4 | Purchase of businesses, net of cash acquired | (712) | | | (73) | | | (8) | |
| | Net proceeds from sale of interests in businesses, net of cash disposed | 124 | | | 80 | | | 126 | |
| | Net cash provided by (used for) for investing activities | (1,487) | | | (636) | | | (573) | |
| | Cash flows from financing activities | | | | | |
| 23 | 18 | Proceeds from issuance (payments on) short-term debt | 47 | | | 29 | | | (30) | |
| 23 | 18 | Principal payments on current portion of long-term debt | (1,472) | | | (754) | | | (763) | |
| 23 | 18 | Proceeds from issuance of long-term debt | 2,516 | | | 544 | | | 710 | |
| | Re-issuance of treasury shares | 12 | | | - | | | - | |
| 17 | Purchase of treasury shares | (187) | | | (662) | | | (411) | |
| | Dividends paid to shareholders of Koninklijke Philips N.V. | (412) | | | (2) | | | (1) | |
| | Dividends paid to shareholders of non-controlling interests | (6) | | | (3) | | | (2) | |
| | Net cash provided by (used for) financing activities | 500 | | | (848) | | | (496) | |
| | Net cash provided by (used for) continuing operations | (1,160) | | | 652 | | | 500 | |
| 3 | Net cash provided by (used for) discontinued operations | (12) | | | 123 | | | (13) | |
| | Net cash provided by (used for) continuing and discontinued operations | (1,172) | | | 776 | | | 487 | |
| | Effect of changes in exchange rates on cash and cash equivalents | 41 | | | (79) | | | 45 | |
| | Cash and cash equivalents at the beginning of the period | 2,303 | | | 1,172 | | | 1,869 | |
| | Cash and cash equivalents at the end of the period | 1,172 | | | 1,869 | | | 2,401 | |
Amounts may not add up due to rounding.
9.9 Consolidated statements of changes in equity
Philips Group
Consolidated statements of changes in equity in millions of EUR
for the year ended December 31,
| | | | | | | | | | | | | | | | | | | | | | | | | | | | | | | | | | | | | | |
| Common shares | Capital in excess of par value | Fair value through OCI | Cash flow hedges | Currency translation differences | | Retained earnings | Treasury shares | | Total shareholders' equity | Non-controlling interests | Group equity |
| | | Reserves | | Other | | | | |
| | | | | | | | | | | | |
| Balance as of January 1, 2022 | 177 | 4,646 | (344) | (25) | 1,117 | | 9,344 | (476) | | 14,438 | 36 | 14,475 |
| Total comprehensive income (loss) | | | (32) | 23 | 749 | | (1,527) | | | (786) | 4 | (782) |
| Dividend distributed | 3 | 326 | | | | | (741) | | | (412) | (6) | (418) |
| Minority Buy-out | | | | | | | | | | | - | - |
| Transfer of result on disposal of equity investments at FVTOCI to retained earnings | | | | | | | 1 | | | - | | - |
| Purchase of treasury shares | | | | | | | - | (24) | | (24) | | (24) |
| Re-issuance of treasury shares | - | (43) | | | | | (28) | 77 | | 7 | | 7 |
| Forward contracts | | | | | | | 76 | (140) | | (64) | | (64) |
| Share call options | | | | | | | 5 | (12) | | (6) | | (6) |
| Cancellation of treasury shares | (2) | | | | | | (298) | 299 | | | | |
| Share-based compensation plans | | 95 | | | | | | | | 95 | | 95 |
| Income tax share-based compensation plans | | 1 | | | | | | | | 1 | | 1 |
| Balance as of December 31, 2022 | 178 | 5,025 | (376) | (2) | 1,866 | | 6,832 | (275) | | 13,249 | 34 | 13,283 |
| Total comprehensive income (loss) | | | (17) | 8 | (604) | | (488) | | | (1,101) | 1 | (1,100) |
| Dividend distributed | 8 | 741 | | | | | (816) | | | (68) | (3) | (70) |
| Minority Buy-out | | | | | | | | | | | - | - |
| Transfer of result on disposal of equity investments at FVTOCI to retained earnings | | | 4 | | | | (4) | | | - | | - |
| Purchase of treasury shares | | | | | | | - | - | | - | | - |
| Re-issuance of treasury shares | | (29) | | | | | (24) | 54 | | - | | - |
| Forward contracts | | | | | | | 465 | (608) | | (143) | | (143) |
| Share call options | | | | | | | - | - | | - | | - |
| Cancellation of treasury shares | (3) | | | | | | (563) | 566 | | | | |
| Share-based compensation plans | | 88 | | | | | | | | 88 | | 88 |
| Income tax share-based compensation plans | | 2 | | | | | | | | 2 | | 2 |
| | | | | | | | | | | | | | | | | | | | | | | | | | | | | | | | | | | | | | |
| Common shares | Capital in excess of par value | Fair value through OCI | Cash flow hedges | Currency translation differences | | Retained earnings | Treasury shares | | Total shareholders' equity | Non-controlling interests | Group equity |
| Balance as of December 31, 2023 | 183 | 5,827 | (390) | 6 | 1,263 | | 5,402 | (262) | | 12,028 | 33 | 12,061 |
| Total comprehensive income (loss) | | | (11) | (5) | 751 | | (707) | | | 27 | 6 | 33 |
| Dividend distributed | 6 | 762 | | | | | (799) | | | (31) | (2) | (32) |
| Transfer of result on disposal of equity investments at FVTOCI to retained earnings | | | 311 | | | | (313) | | | (2) | | (2) |
| Purchase of treasury shares | | | | | | | - | (60) | | (60) | | (60) |
| Re-issuance of treasury shares | | (36) | | | | | (18) | 54 | | - | | - |
| Forward contracts | | | | | | | 251 | (310) | | (59) | | (59) |
| | | | | | | | | | | | |
| Cancellation of treasury shares | (1) | | | | | | (166) | 167 | | | | |
| Share-based compensation plans | | 96 | | | | | | | | 96 | | 96 |
| Income tax share-based compensation plans | | 5 | | | | | | | | 5 | | 5 |
| Balance as of December 31, 2024 | 188 | 6,654 | (90) | 1 | 2,014 | | 3,650 | (411) | | 12,006 | 37 | 12,043 |
Amounts may not add up due to rounding.
9.10 Notes to the Consolidated financial statements
1 General information to the Consolidated financial statements
Reporting entity and its operations
Koninklijke Philips N.V. (‘Royal Philips’), incorporated and domiciled in the Netherlands, is a public limited liability company organized under Dutch Law. Philips is headquartered in Amsterdam, the Netherlands and has its registered address at High Tech Campus 52, 5656 AG Eindhoven, the Netherlands. The consolidated financial statements of Royal Philips as of December 31, 2024 comprise Royal Philips and its subsidiaries (together referred to as the 'company’ or ‘Philips’ or the 'Group’). Philips is a leading health technology company primarily involved in diagnostic imaging, image-guided therapy, patient monitoring and health informatics, as well as in consumer health and home care.
Basis of preparation
The Consolidated financial statements are:
•prepared in accordance with International Financial Reporting Standards (IFRS) as adopted by the European Union (EU) and comply with the statutory provisions of Part 9, Book 2 of the Dutch Civil Code. All standards and interpretations issued by the International Accounting Standards Board (IASB) and the IFRS Interpretations Committee effective 2024 have been endorsed by the EU; consequently, the accounting policies applied by Philips also comply with IFRS as issued by the IASB. These accounting policies have been applied by group entities
•authorized for issue by the Board of Management of Royal Philips on February 21, 2025
•prepared under the historical cost convention, unless otherwise indicated
•prepared on a going concern basis
•presented in euro, which is the presentation currency
•rounded to the nearest million euro unless stated otherwise
•subject to rounding, whereby amounts may not add up precisely to the totals provided
Accounting estimates and judgments
The preparation of these financial statements requires management to make a number of estimates and judgments that affect the application of accounting policies and the reported amounts of assets and liabilities, revenues and expenses, and the disclosure of contingent assets and liabilities. Amounts recognized are based on factors that are by default associated with uncertainty. Actual results may therefore differ from estimates. Estimates and underlying assumptions are reviewed on an ongoing basis. Revision to estimates are recognized prospectively. Where applicable, the estimates and judgments of specific financial statement items are described in the respective note to the consolidated financial statements.
The areas involving a higher degree of judgment and complexity in applying accounting principles and for which changes in the assumptions and estimates could result in significantly different results than those recorded in the consolidated financial statements are the following:
•judgment applied in determining reportable segments involves evaluating the information reviewed by the Chief Operating Decision-Maker (the Board of Management) to assess performance and allocate resources (Information by segment and main country) •determination of deferred tax assets for losses carried forward and uncertain tax positions (Income taxes) •assumptions used to determine the net realizable value of inventories (Inventories) •actuarial assumptions of future events that are used in calculating post-employment benefit expenses and liabilities (Post-employment benefits) •estimates and assumptions regarding the timing and the amount of outflow of resources, as well as estimating the likelihood of a potential outflow of resources and the ability to make a reliable estimate of the obligation relating to provisions and contingent liabilities (Provisions, Contingencies) The company regularly updates its significant assumptions and estimates to support the reported amounts of assets, liabilities, income and expenses.
Climate change
In preparing the consolidated financial statements, management has considered the impact of climate change, specifically the financial impact of Philips meeting its internal and external climate-related aims, the potential impact of climate- related risks, and the costs incurred to pro-actively manage such risks. These considerations did not have a material impact on the financial reporting judgments, estimates or assumptions. The financial impacts considered include specific climate mitigation measures, such as the use of lower-carbon energy sources, the cost of developing more sustainable product offerings, and expenses incurred to mitigate against the impact of extreme weather conditions. To meet its long-term Science Based Targets and reduce its full value chain emissions in line with a 1.5 °C global warming scenario, Philips has entered into a number of Power Purchase Agreements. Philips uses 100% electricity from renewable sources, mainly through long-term Power Purchase Agreements, thereby mitigating the impact of carbon taxes. The development of more sustainable products are covered through our EcoDesign program and
already included in our R&D expenses. The physical risk related to climate change on our sites resulting from our Task Force on Climate-Related Financial Disclosures assessment is currently considered limited.
Material accounting policies
The material accounting policies as generally applied throughout the financial statements are described below. Material accounting policies relating to specific financial statement items are described in the respective notes to the financial statements.
Basis of consolidation
The Consolidated financial statements comprise the financial statements of Koninklijke Philips N.V. and all subsidiaries that the company controls on a consolidated basis. Control exists when the company is exposed or has rights to variable returns from its involvement with the investee and the company has the ability to affect those returns through its power over the investee. Generally, there is a presumption that a majority of voting rights results in control. To support this presumption and in cases where Philips has less than a majority of the voting or similar rights of an investee, Philips considers all relevant facts and circumstances in assessing whether it has power over an investee, including the contractual arrangement(s) with the other vote holders of the investee, rights arising from other contractual arrangements and the company’s voting rights and potential voting rights. Subsidiaries are fully consolidated from the date that control commences until the date that control ceases. All intercompany balances and transactions have been eliminated in the Consolidated financial statements. Unrealized losses are eliminated in the same way as unrealized gains, but only to the extent that there is no evidence of impairment.
Foreign currency transactions
The financial statements of all group entities are measured using the currency of the primary economic environment in which the entity operates (functional currency). The euro (EUR) is the functional currency of the company and the presentation currency of the consolidated financial statements. Foreign currency transactions are converted into the functional currency using the exchange rates prevailing at transaction date or the valuation date in cases where items are remeasured. Gains and losses resulting from the settlement of foreign currency transactions and those resulting from the conversion of foreign currency denominated monetary assets and liabilities at period-end exchange rates are recognized in the Consolidated statements of income, except for qualifying cash flow hedges, qualifying net investment hedges and equity investments measured at fair value through OCI which are recognized in other comprehensive income.
All foreign exchange differences are presented as part of Cost of sales, apart from tax items and financial income and expense, which are recognized in the same line item as they relate to in the Consolidated statements of income.
Non-monetary assets and liabilities denominated in foreign currencies that are measured at fair value are retranslated to the functional currency using the exchange rate at the date the fair value was determined. Non-monetary items in a foreign currency that are measured based on historical cost are translated using the exchange rate at the transaction date.
Foreign operations
The assets and liabilities of foreign operations, including goodwill and fair value adjustments arising on acquisition, are translated to euros at the exchange rates prevailing at the reporting date. The income and expenses of foreign operations are translated to euros at the exchange rates prevailing at the dates of the transactions.
Foreign currency differences arising upon translation of foreign operations into euros are recognized in Other comprehensive income and presented as part of Currency translation differences in Equity. However, if the operation is not a wholly-owned subsidiary, the proportionate share of the translation difference is allocated to Non-controlling interests.
When a foreign operation is disposed of such that control, significant influence or joint control is lost, the cumulative amount in the Currency translation differences related to the foreign operation is reclassified to the Consolidated statements of income as part of the gain or loss on disposal. When the company disposes of only part of its interest in a subsidiary that includes a foreign operation while retaining control, the respective proportion of the cumulative amount is reattributed to Non-controlling interests. When the company disposes of only part of its investment in an associate or joint venture that includes a foreign operation while retaining significant influence or joint control, the relevant proportion of the cumulative amount is reclassified to the Consolidated statements of income.
New accounting policies effective in 2024
No new IFRS accounting standards or amendments to existing standards, effective in 2024, had a significant impact on the consolidated financial statements.
New accounting policies effective after 2024
The IASB has issued several IFRS accounting standards, or amendments to standards, with an effective date after 2024. Considerations relating to IFRS 18 Presentation and Disclosure in Financial Statements are set out below. The company has not early adopted any standards or amendments to existing standards. The company does not anticipate that the application of any other standards, or amendments to standards, will have a significant impact on the consolidated financial statements upon adoption.
IFRS 18 Presentation and Disclosure in Financial Statements
IFRS 18 was issued in April 2024 and is endorsed by the EU. It will supersede IAS 1 Presentation of Financial Statements. IFRS 18 introduces new requirements for presentation within the Consolidated statement of income, including specified totals and subtotals. Even though the new standard will not impact the recognition and measurement of items in the financial statements, the new standard requires entities to include additional defined subtotals to the Consolidated statement of income, disclosures about management-defined performance measures and is adding new principles for aggregation and disaggregation of information.
IFRS 18 is effective for reporting periods beginning on or after January 1, 2027. Retrospective application is required; therefore, comparative information will be restated in accordance with IFRS 18. Philips is currently assessing the detailed implications of applying the new standard on the group’s Consolidated financial statements.
Changes in presentation from the prior year
Accounting policies have been applied consistently for all periods presented in these consolidated financial statements. Certain prior-year amounts have been reclassified to conform to the current year presentation due to immaterial organizational changes.
Per share calculations have been adjusted retrospectively for all periods presented to reflect the issuance of shares for the share dividend in respect of 2023.
2 Information by segment and main country
Accounting policies
Segment accounting policies are the same as the accounting policies applied by the company. Operating segments are components of the company’s business activities about which separate financial information is available that is evaluated regularly by the Chief Operating Decision-Maker (the Board of Management of the company). The Board of Management decides how to allocate resources and assesses performance. Reportable segments comprise the operating segments Diagnosis & Treatment, Connected Care and Personal Health. Besides these reportable segments, segment Other contains Innovation & Strategy, IP Royalties, Central costs, and other small items.
Accounting estimates and judgments
Determining reportable segments requires significant judgment and involves evaluating the information which is reviewed by the Chief Operating Decision-Maker (the Board of Management) to assess performance and allocate resources, in accordance with IFRS 8 'Operating Segments'.
The Philips reportable segments are Diagnosis & Treatment, Connected Care and Personal Health, each being responsible for the management of its Businesses worldwide.
Philips focuses on improving people’s lives through meaningful innovation. The Diagnosis & Treatment segment unites the Businesses related to the goal of precision diagnosis and disease pathway selection, and the Businesses related to image-guided, minimally invasive treatment. The Connected Care segment focuses on patient care solutions, advanced informatics and analytics, and patient and workflow optimization inside and outside the hospital, and aims to unlock synergies from integrating and optimizing patient care pathways, and leveraging provider-payer-patient business models. The Personal Health segment focuses on healthy living and preventative care.
Philips has realigned the composition of its reportable segments effective from April 1, 2023. The most notable change is the shift of the previous Enterprise Diagnostic Informatics Business from the Diagnosis & Treatment segment to the Connected Care segment. This Business, together with other informatics solutions in the Connected Care segment, now forms the Enterprise Informatics Business. Accordingly, the 2022 comparative figures for the affected segments were previously restated. The realignment did not impact the presentation of the reportable segments or the key segmental performance measure, which continues to be Adjusted EBITA*.
Transactions between the segments are mainly related to components and parts included in the product portfolio of the other segments. The pricing of such transactions was at cost or determined on an arm’s length basis. Philips has no single external customer that represents 10% or more of sales. Sales by country is presented based on the country of seller.
Philips Group
Information on income statements in millions of EUR
| | | | | | | | | | | | | | |
| Sales | Sales including intercompany | Depreciation and amortization¹ | Adjusted EBITA |
| 2024 | | | | |
| Diagnosis & Treatment | 8,790 | | 9,269 | | (464) | | 1,018 | |
| Connected Care | 5,134 | | 5,163 | | (403) | | 494 | |
| Personal Health | 3,486 | | 3,566 | | (117) | | 584 | |
| Other | 611 | | 750 | | (406) | | (18) | |
| Inter-segment eliminations | | (726) | | | |
| Philips Group | 18,021 | | 18,021 | | (1,390) | | 2,077 | |
| | | | |
| 2023 | | | | |
| Diagnosis & Treatment | 8,825 | | 9,269 | | (306) | | 1,028 | |
| Connected Care | 5,138 | | 5,149 | | (445) | | 369 | |
| Personal Health | 3,602 | | 3,685 | | (115) | | 597 | |
| Other | 604 | | 413 | | (394) | | (73) | |
| Inter-segment eliminations | | (346) | | | |
| Philips Group | 18,169 | | 18,169 | | (1,261) | | 1,921 | |
| | | | | |
| 2022 | | | | |
| Diagnosis & Treatment | 8,303 | | 8,597 | | (417) | | 786 | |
| Connected Care | 5,268 | | 5,280 | | (646) | | 111 | |
| Personal Health | 3,626 | | 3,684 | | (132) | | 538 | |
| Other | 630 | | 715 | | (407) | | (118) | |
| Inter-segment eliminations | | (449) | | | |
| Philips Group | 17,827 | | 17,827 | | (1,602) | | 1,318 | |
The term Adjusted EBITA* is used to evaluate the performance of Philips and its segments. Adjusted EBITA* represents income from operations excluding amortization and impairment of acquired intangible assets and impairment of goodwill (EBITA) and excluding gains or losses from restructuring costs, acquisition-related charges and other items.
Adjusted EBITA* is not a recognized measure of financial performance under IFRS. Presented in the following tables are the reconciliations of Adjusted EBITA* to the most directly comparable IFRS measure, Net income, for the years indicated. Net income is not allocated to segments as certain income and expense line items are monitored on a centralized basis, resulting in them being shown on a Philips Group level only.
Philips Group
Reconciliation from net income to Adjusted EBITA* in millions of EUR
| | | | | | | | | | | | | | | | | |
| Philips Group | Diagnosis & Treatment | Connected Care | Personal Health | Other |
| 2024 | | | | | |
| Net Income | (698) | | | | | |
| Discontinued operations, net of income taxes | (142) | | | | | |
| Income tax expense (benefit) | 963 | | | | | |
| Investments in associates, net of income taxes | 124 | | | | | |
| Financial expenses | 387 | | | | | |
| Financial income | (105) | | | | | |
| Income from operations | 529 | | 592 | | (466) | | 544 | | (142) | |
| Amortization and impairment of acquired intangible assets | 392 | | 225 | | 141 | | 15 | | 12 | |
| | | | | |
| EBITA | 921 | | 817 | | (324) | | 559 | | (130) | |
| Restructuring and acquisition-related charges | 326 | | 157 | | 53 | | 25 | | 92 | |
| Other items: | 830 | | 45 | | 765 | | - | | 20 | |
| Respironics litigation provision | 984 | | | 984 | | | |
| Respironics insurance income | (538) | | | (538) | | | |
| Respironics field-action running costs | 133 | | | 133 | | | |
| Respironics consent decree charges | 113 | | | 113 | | | |
| Quality actions | 123 | | 45 | | 78 | | | |
| Remaining items | 16 | | | (4) | | - | | 20 | |
| Adjusted EBITA* | 2,077 | | 1,018 | | 494 | | 584 | | (18) | |
Philips Group
Reconciliation from net income to Adjusted EBITA* in millions of EUR
| | | | | | | | | | | | | | | | | |
| Philips Group | Diagnosis & Treatment | Connected Care | Personal Health | Other |
| 2023 | | | | | |
| Net Income | (463) | | | | | |
| Discontinued operations, net of income taxes | 10 | | | | | |
| Income tax expense (benefit) | (73) | | | | | |
| Investments in associates, net of income taxes | 98 | | | | | |
| Financial expenses | 376 | | | | | |
| Financial income | (63) | | | | | |
| Income from operations | (115) | | 721 | | (1,199) | | 552 | | (190) | |
| Amortization and impairment of acquired intangible assets | 290 | | 89 | | 178 | | 14 | | 9 | |
| Impairment of goodwill | 8 | | 8 | | - | | | |
| EBITA | 183 | | 818 | | (1,020) | | 567 | | (181) | |
| Restructuring and acquisition-related charges | 381 | | 118 | | 115 | | 9 | | 140 | |
| Other items: | 1,358 | | 92 | | 1,275 | | 22 | | (32) | |
| Respironics litigation provision | 575 | | | 575 | | | |
| Respironics field-action connected to the proposed consent decree | 363 | | | 363 | | | |
| Respironics field-action running costs | 224 | | | 224 | | | |
| Quality actions | 175 | | 81 | | 94 | | | |
| Provision for a legal matter | 31 | | | 31 | | | |
| Investment re-measurement loss | 23 | | | | 23 | | |
| Gain on divestment of business | (35) | | | | | (35) | |
| Remaining items | 2 | | 11 | | (12) | | (1) | | 3 | |
| Adjusted EBITA* | 1,921 | | 1,028 | | 369 | | 597 | | (73) | |
Philips Group
Reconciliation from net income to Adjusted EBITA* in millions of EUR
| | | | | | | | | | | | | | | | | |
| Philips Group | Diagnosis & Treatment | Connected Care | Personal Health | Other |
| 2022 | | | | | |
| Net Income | (1,605) | | | | | |
| Discontinued operations, net of income taxes | (13) | | | | | |
| Income tax expense (benefit) | (113) | | | | | |
| Investments in associates, net of income taxes | 2 | | | | | |
| Financial expenses | 258 | | | | | |
| Financial income | (58) | | | | | |
| Income from operations | (1,529) | | 536 | | (2,347) | | 515 | | (233) | |
| Amortization and impairment of acquired intangible assets | 363 | | 115 | | 226 | | 15 | | 8 | |
| Impairment of goodwill | 1,357 | | | 1,357 | | | |
| EBITA | 192 | | 650 | | (764) | | 531 | | (225) | |
| Restructuring and acquisition-related charges | 202 | | 3 | | 125 | | 11 | | 62 | |
| Other items: | 925 | | 133 | | 750 | | (4) | | 46 | |
| Respironics field-action connected to the proposed consent decree | 250 | | | 250 | | | |
| Respironics field-action running costs | 210 | | | 210 | | | |
| R&D project impairments | 134 | | 73 | | 59 | | 3 | | |
| Portfolio realignment charges | 109 | | | 109 | | | |
| Provision for public investigations tender irregularities | 60 | | 60 | | | | |
| Quality actions | 59 | | | 59 | | | |
| Impairment of assets in S&RC | 39 | | | 39 | | | |
| Remaining items | 63 | | - | | 24 | | (6) | | 46 | |
| Adjusted EBITA* | 1,318 | | 786 | | 111 | | 538 | | (118) | |
Philips Group
Main countries in millions of EUR
| | | | | | | | |
| Sales | Tangible and intangible assets¹ |
| 2024 | | |
| Netherlands | 2,506 | | 1,662 | |
| United States | 7,227 | | 11,607 | |
| China | 1,153 | | 250 | |
| Japan | 886 | | 396 | |
| Germany | 653 | | 392 | |
| Other countries | 5,596 | | 1,509 | |
| Total main countries | 18,021 | | 15,816 | |
| | | |
| 2023 | | |
| Netherlands | 2,390 | | 1,624 | |
| United States | 7,178 | | 11,410 | |
| China | 1,408 | | 234 | |
| Japan | 941 | | 407 | |
| Germany | 573 | | 348 | |
| Other countries | 5,679 | | 1,527 | |
| Total main countries | 18,169 | | 15,550 | |
| | | |
| 2022 | | |
| Netherlands | 2,021 | | 1,746 | |
| United States | 7,226 | | 12,087 | |
| China | 1,239 | | 260 | |
| Japan | 1,011 | | 436 | |
| Germany | 642 | | 323 | |
| Other countries | 5,688 | | 1,550 | |
| Total main countries | 17,827 | | 16,402 | |
1Consists of Property plant and equipment, Intangible assets excluding goodwill and Goodwill
3 Discontinued operations and assets classified as held for sale
Accounting policies
Assets classified as held-for-sale
Non-current assets (or disposal groups) are classified as held-for-sale if their carrying amounts are expected to be recovered through a sale transaction rather than through continuing use. Non-current assets (or disposal groups) classified as held-for-sale are measured at the lower of their carrying amount or the fair value less costs of disposal. Depreciation or amortization of an asset ceases when it is classified as held-for-sale. When non-current assets (or disposal groups) are classified as held-for-sale, comparative balances prior to such date are not represented in the Consolidated balance sheets.
Discontinued operations
A discontinued operation is a component of the company that has either been disposed of or is classified as held-for-sale and represents a separate major line of business or geographical area of operations or is a part of a single coordinated plan to dispose of a separate major line of business or geographical area of operations. Any gain or loss from disposal, together with the results of these operations until the date of disposal, are reported separately as discontinued operations in the Consolidated statements of income.
The financial information of discontinued operations is excluded from the respective captions in the Consolidated financial statements and related notes for all periods presented. Comparatives are re-presented for presentation of discontinued operations in the Consolidated statements of income and Consolidated statements of cash flows.
Accounting estimates and judgments
The determination of the fair value less costs of disposal involves the use of estimates and assumptions that tend to be uncertain. Circumstances to which these adjustments may relate include resolution of uncertainties that arise from the terms of the disposal transaction, such as the resolution of purchase price adjustments and indemnifications, resolution of uncertainties that arise from and are directly related to the operations of the component before its disposal, such as environmental and assurance-type product warranty obligations retained by the company, and the settlement of employee benefit plan obligations provided that the settlement is directly related to the disposal transaction.
In 2024 discontinued operations consist primarily of the Domestic Appliances business. In 2023 and 2022 discontinued operations consist of certain costs related to other divestments, which were previously reported as discontinued operations.
Philips Group
Discontinued operations, net of income taxes in millions of EUR
| | | | | | | | | | | |
| 2022 | 2023 | 2024 |
| Domestic Appliances | 3 | | (2) | | 140 | |
| Other | 10 | | (7) | | 2 | |
| Discontinued operations, net of income taxes | 13 | | (10) | | 142 | |
Discontinued operations: Domestic Appliances
In 2024, Discontinued operations related to the Domestic Appliances business included a tax benefit of EUR 140 million relating to tax audit settlements of prior years. Discontinued operations related to the Domestic Appliances business resulted in a net loss of EUR 2 million in 2023 and net gain of EUR 3 million in 2022.
Discontinued operations: Other
Certain costs related to other divestments, which were previously reported as discontinued operations, resulted in a net gain of EUR 2 million in 2024, a net loss of EUR 7 million in 2023 and a net gain of EUR 10 million in 2022.
Discontinued operations cash flows
The following table presents the net cash provided by (used for) discontinued operations reported in the Consolidated statements of cash flows.
Philips Group
Net cash provided by (used for) discontinued operations in millions of EUR
| | | | | | | | | | | |
| 2022 | 2023 | 2024 |
| Net cash provided by (used for) operating activities | (27) | | 123 | | (13) | |
| Net cash provided by (used for) investing activities | 15 | | | | | |
| Net cash provided by (used for) discontinued operations | (12) | | 123 | | (13) | |
In 2024, net cash used for discontinued operations was EUR 13 million and consisted primarily of cash flows related to the tax claims from the previously divested business.
In 2023, net cash provided by discontinued operations was EUR 123 million and consisted primarily of a refund received of advance tax payments related to a previously divested business.
In 2022, net cash used for discontinued operations was EUR 12 million and consisted primarily of cash flows related to the tax claims from the previously divested business.
Assets classified as held for sale
As of December 31, 2024, there were no assets held for sale.
As of December 31, 2023, assets held for sale primarily consisted of assets and liabilities of EUR 69 million, directly associated with a business held for sale.
4 Acquisitions and divestments
Accounting policies
Acquisitions
The company accounts for business combinations using the acquisition method when control is transferred to the group. The consideration transferred in the acquisition is generally measured at fair value, as are the identifiable net assets acquired and the liabilities assumed. Transaction costs are expensed as incurred. Any contingent consideration is measured at fair value at the acquisition date and is initially presented in Long-term provisions. When the timing and amount of the consideration become more certain, it is reclassified to Accrued liabilities. If the contingent consideration that meets the definition of a financial instrument is classified as equity, it is not remeasured and settlement is accounted for within equity. Otherwise, subsequent changes in the fair value of the contingent consideration are recognized in the Consolidated statements of income.
Changes to the initial fair value of the acquired assets and liabilities, based on new information about the circumstances at the acquisition date, can be made up to 12 months after the acquisition date.
Divestments
Upon loss of control, the company derecognizes the assets and liabilities of the subsidiary, any non-controlling interests and the other components of equity related to the subsidiary. Any surplus or deficit arising from the loss of control is recognized in the Consolidated statements of income. If the company retains any interest in the previous subsidiary, such interest is measured at fair value at the date the control is lost. Subsequently it is accounted for as either an equity-accounted investee (associate) or as a financial asset, depending on the level of influence retained. Further information on loss of control can be found in Discontinued operations and assets classified as held for sale. Accounting estimates and judgments
Intangible assets acquired in a business acquisition and the financial liability related to non-controlling interest are measured at fair value at the date of the acquisition.
To determine the fair value of intangible assets at the acquisition date, estimates and assumptions are required. The valuation of the identifiable intangible assets involves estimates of expected sales, earnings and/or future cash flows and require use of key assumptions such as discount rate, royalty rate and growth rates.
Estimates are also applied when determining the fair value of legal cases and tax positions in the acquired entity. The fair value is based on estimates of the likelihood, the expected timing and the amount of the potential cash outflow. Provisions for legal cases and non-income tax positions are recognized at fair value even if it is not probable that an outflow will be required to settle the obligation. After initial recognition and until the liability is settled, cancelled or expired, the liability is measured at the higher of the amount that would be recognized in accordance with IAS 37 'Provisions, contingent liabilities and contingent assets' and the initial liability amount. For income tax positions, the company applies IAS 12 'Income Taxes', which requires recognition of provisions only when the likelihood of cash outflow is considered probable.
2024
Acquisitions
Philips did not make any acquisitions in 2024.
Divestments
During 2024 Philips completed four divestments for net cash consideration of EUR 118 million, of which EUR 2 million is to be received in 2025. The result of these divestments amounted to a EUR 8 million gain, which is included in Other business income in the Consolidated statements of income. The divestments were not material.
2023
Acquisitions
On May 5, 2023, Philips completed one acquisition within the Ultrasound Business Unit to accelerate the growth of its Diagnosis & Treatment segment. The total equity purchase price and the settlement of debt, net of acquired cash, involved an amount of EUR 53 million. Including final purchase price adjustments processed in the course of 2024, the company recognized a contingent consideration of EUR 6 million at fair value, recognized as a Long-term provision, Goodwill of EUR 24 million, Other intangible assets of EUR 40 million and deferred tax asset and liability of EUR 5 million and EUR 2 million, respectively.
From the acquisition date through December 31, 2023, the contributions to sales to third parties and net income of the acquiree were not material. The sales and net income would not differ materially if the acquisition date had been January 1, 2023. Acquisition-related costs were recognized in General and administrative expenses and were not material.
Divestments
During 2023 Philips completed six divestments for net cash consideration of EUR 80 million and a gain of EUR 50 million, which is included in Other business income of the Consolidated statements of income. The divestments were not material.
5 Interests in entities
Accounting policies
Associates are all entities over which the company has significant influence, but not control or joint control. Significant influence is presumed with a shareholding of between 20% and 50% of the voting rights.
Investments in associates are accounted for using the equity method of accounting and are initially recognized at cost. The carrying amount of an investment in an associate includes the carrying amount of goodwill identified on acquisition. An impairment loss on such investment is allocated to the investment as a whole.
The company’s share of the net income of these associates is included in Investments in associates, net of income taxes, in the Consolidated statements of income, after adjustments to align the accounting policies with those of the company. Dilution gains and losses arising from investments in associates are recognized in the Consolidated statements of income as part of Investments in associates, net of income taxes. Impairment losses and gains or losses on sale of investments are recorded in the Consolidated statements of income, more specifically on the line item ’Investments in associates, net of income taxes’.
When the company’s share of losses exceeds its interest in an associate, the carrying amount of that interest is reduced to zero and recognition of further losses is discontinued except to the extent that the company has an obligation or made payments on behalf of the associate.
The nature of the company’s interests in its consolidated entities and associates, and the effects of those interests on the company’s financial position and financial performance are discussed below.
Group companies
Below is a list of subsidiaries as of December 31, 2024, that individually exceed 5% of either the consolidated group Sales, Income from operations or Income from continuing operations (before any intra-group eliminations) of Group legal entities. All of the entities are fully consolidated in the Group financial statements.
Philips Group
Interests in group companies in alphabetical order by country
December 31, 2024
| | | | | |
| Legal entity name | Principal country of business |
| Philips (China) Investment Company, Ltd. | China |
| Philips Medizin Systeme Böblingen GmbH | |
| Philips Consumer Lifestyle B.V. | Netherlands |
| Philips Medical Systems (Cleveland), Inc. | United States |
| Philips North America LLC | United States |
| Philips RS North America LLC | United States |
1Application of Sec. 264 (3) and Sec. 264b HGB (German Commercial Code) for fully consolidated legal entities: Philips GmbH, Hamburg; Philips Medical Systems DMC GmbH, Hamburg; Respironics Deutschland GmbH & Co.KG, München; Philips Medizin Systeme Hofheim-Wallau GmbH, Hamburg; Philips Medizin Systeme Böblingen GmbH, Böblingen; TomTec Imaging Systems GmbH, Unterschleißheim; PIP Verwaltungsgesellschaft mbH, Hamburg.
Information related to non-controlling interests
As of December 31, 2024, three consolidated subsidiaries are not wholly owned by Philips (December 31, 2023: four). In 2024, sales to third parties and Net income for these subsidiaries in aggregate are EUR 467 million (December 31, 2023: EUR 492 million) and EUR 10 million (December 31, 2023: EUR 27 million), respectively.
Investments in associates
Philips has investments in a number of associates. During 2024, Philips did not make any new investments in associates.
In 2024, Philips recognized its share of net results from associates, reporting a loss of EUR 20 million and an impairment of EUR 103 million. The most significant impairment was related to B-Soft Co., Ltd. (EUR 63 million), a Chinese IT provider for the medical and health sectors, largely due to adverse economic conditions in China. The net results from associates and impairment losses were recorded as part of Investments in associates, net of income taxes.
Cumulative translation adjustments related to investments in associates were EUR (10) million as of December 31, 2024 (2023: EUR (21) million).
Involvement with unconsolidated structured entities
Philips founded three Philips Medical Capital (PMC) entities, in the US, France and Germany, in which Philips holds a minority interest. Philips Medical Capital, LLC in the US is the most significant entity. PMC entities provide healthcare equipment financing and leasing services to Philips customers for diagnostic imaging equipment, patient monitoring equipment, and clinical IT systems.
The company concluded that it does not control, and therefore should not consolidate, the PMC entities. In the US, PMC operates as a subsidiary of De Lage Landen Financial Services, Inc. The same structure and treatment is applied to the PMC entities in the other countries, with other majority shareholders. Operating agreements are in place for all PMC entities, whereby acceptance of sales and financing transactions resides with the respective majority shareholder. After acceptance of a transaction by PMC, Philips transfers control and does not retain any obligations towards PMC or its customers, from the sales contracts.
As of December 31, 2024, Philips’ shareholding in Philips Medical Capital, LLC had a carrying value of EUR 31 million (December 31, 2023: EUR 27 million).
The company does not have any material exposures to losses from interests in unconsolidated structured entities other than the invested amounts.
6 Income from operations
Accounting policies
Revenue recognition
The company recognizes revenue when it transfers control over a good or service to a customer, in an amount that reflects the consideration (i.e., transaction price) to which the company expects to be entitled in exchange for the good or service. The consideration expected by the company may include fixed and/or variable amounts which can be impacted by sales returns, trade discounts and volume rebates. The company adjusts the consideration for the time value of money if the period between the transfer of the promised goods or services to the customer and payment by the customer exceeds six months.
Transfer of control varies depending on the individual terms of the contract of sale. For consumer-type products in the Personal Health segment, control is transferred when the product is shipped and delivered to the customer and title and risk have passed to the customer (depending on the delivery conditions) and acceptance of the product has been obtained.
Revenues from transactions relating to distinct goods or services are accounted for separately based on their relative stand-alone selling prices. The stand-alone selling price is the price that would be charged for the goods or service in a separate transaction under similar conditions to similar customers. The transaction price is determined (considering variable considerations) and allocated to performance obligations based on their relative stand-alone selling prices. These transactions mainly occur in the segments Diagnosis & Treatment and Connected Care and include arrangements that require subsequent installation and training activities to make distinct goods operable for the customer. As such, the related installation and training activities are part of equipment sales rather than separate performance obligations. Revenue is recognized when the performance obligation is satisfied, i.e., when the installation has been completed and the equipment is ready to be used by the customer in the way contractually agreed.
Variable consideration is included in the transaction price to the extent that it is highly probable that a significant reversal in the amount of cumulative revenue recognized will not occur once associated uncertainties are resolved. Such assessment is performed on each reporting date to check whether it is constrained. For products for which a right of return exists during a defined period, revenue recognition is determined based on the historical pattern of actual returns, or in cases where such information is not available, revenue recognition is postponed until the return period has lapsed. Return policies are typically based on customary return arrangements in local markets. A provision is recognized for assurance-
type product warranty at the time of revenue recognition and reflects the estimated costs of replacement and free-of-charge services that will be incurred by the company with respect to the products sold. For certain products, the customer has the option to purchase the warranty separately, which is considered a separate performance obligation on top of the assurance-type product warranty. For such warranties which provide distinct service, revenue recognition occurs on a straight-line basis over the extended warranty contract period. Occasionally, the company may offer a full or partial refund of consideration previously paid, for example as part of the resolution to warranty related matters. In such instances, a provision is recognized for the amounts expected to be refunded to customers, and remeasured at each reporting date to reflect changes in the estimated refunds, with a corresponding adjustment to revenue.
In the case of loss under a sales agreement, the loss is recognized immediately. Expenses incurred for sales commissions that are considered incremental to the contracts are recognized immediately in the consolidated statements of income as selling expenses as a practical expedient under IFRS 15 Revenue from Contracts with Customers.
Sale of goods
Revenues are recognized at a point in time when control of the goods passes to the buyer, based on the allocation of the transaction price to the performance obligation.
Revenue from services
Revenues are recognized over time as the company transfers control of the services to the customer, which is demonstrated by the customer simultaneously receiving and consuming the benefits provided by the company. The amount of revenues is measured by reference to the progress made toward complete satisfaction of the performance obligation, which in general is evenly over time. Service revenue related to repair and maintenance activities for goods sold is recognized ratably over the service period or as services are rendered.
Income from royalties
Royalty income from brand license arrangements and from intellectual property rights, such as technology licenses or patents, is recognized on an accrual basis in accordance with the substance of the relevant agreement.
Shipping and handling
Expenses incurred for shipping and handling are mainly recorded as cost of sales. When shipping and handling are part of a project and billed to the customer, then the related expenses are recorded as cost of sales. Shipping and handling related to sales to third parties are partly recorded as selling expenses. When shipping and handling billed to customers are considered a distinct and separate performance obligation, the fees are recognized as revenue and costs included in cost of sales.
Other business income (expenses)
Other business income (expenses) includes gains and losses on the sale of property, plant and equipment, gains and losses on the sale of businesses, and other gains and losses not related to the company’s operating activities.
Government grants
Grants from governments are recognized at their fair value when there is a reasonable assurance that the grant will be received and the company will comply with the conditions. Grants related to costs are deferred in the consolidated balance sheet and recognized in the consolidated statement of income as a reduction of the related costs that they are intended to compensate. Grants related to assets are deducted from the cost of the asset and presented net in the consolidated balance sheets.
Accounting estimates and judgments
Sales-related accruals
The company has sales promotions-related agreements with distributors and retailers designed to promote the sale of products. Among the programs are arrangements under which rebates and discounts can be earned by the distributors and retailers by attaining agreed upon sales levels, or for participating in specific marketing programs. Management estimates the sales-related accruals associated with these arrangements based on a combination of historical patterns and future expectations regarding which promotional targets are expected to be met by distributors and retailers. Accrued customer rebates are presented as other current liabilities, unless there is a right to offset against the respective accounts receivable.
A breakdown by nature of the income (loss) from operations is as follows:
Philips Group
Sales and costs by nature in millions of EUR
| | | | | | | | | | | |
| 2022 | 2023 | 2024 |
| Sales | 17,827 | | 18,169 | | 18,021 | |
| Costs of materials used | (4,320) | | (4,626) | | (4,213) | |
| Employee benefit expenses | (6,952) | | (6,903) | | (6,641) | |
| Depreciation and amortization¹ | (1,602) | | (1,261) | | (1,390) | |
| Impairment of goodwill | (1,357) | | (8) | | | |
| Shipping and handling | (756) | | (668) | | (623) | |
| Advertising and promotion | (739) | | (700) | | (791) | |
| Lease expenses | (39) | | (51) | | (54) | |
| Other operational costs | (3,609) | | (3,535) | | (3,351) | |
| Other business income (expenses) | 18 | | (533) | | (429) | |
| Income from operations | (1,529) | | (115) | | 529 | |
Sales composition and disaggregation
Philips Group
Sales composition in millions of EUR
| | | | | | | | | | | |
| 2022 | 2023 | 2024 |
| Goods | 12,139 | | 12,419 | | 12,198 | |
| Services | 4,878 | | 4,926 | | 5,003 | |
| Royalties | 419 | | 434 | | 466 | |
| Total sales from contracts with customers | 17,435 | | 17,779 | | 17,667 | |
| Sales from other sources | 391 | | 390 | | 354 | |
| Total sales | 17,827 | | 18,169 | | 18,021 | |
Total sales from other sources mainly relates to operating leases EUR 222 million (2023: EUR 234 million; 2022 : EUR 258 million). Sales represent revenue from external customers.
As of December 31, 2024, the aggregate amount of the transaction price allocated to remaining performance obligations from a sale of goods and services was EUR 15,632 million (2023:15,571 million). The company expects to recognize approximately 56% of the remaining performance obligations within 1 year. Revenue expected to be recognized beyond is mostly related to longer term customer service and software contracts.
Sales over time represent services and Other also includes royalties over time (2024: EUR 277 million; 2023: EUR 283 million; 2022: EUR 292 million).
Sales per geographic area are reported based on country of destination.
Philips Group
Disaggregation of Sales per segment in millions of EUR
| | | | | | | | | | | | | | | | | |
| 2024 |
| Sales at a point in time | Sales over time | Total sales from contracts with customers | Sales from other sources | Total sales |
| Diagnosis & Treatment | 5,655 | | 3,070 | | 8,725 | | 65 | | 8,790 | |
| Connected Care | 2,959 | | 1,886 | | 4,845 | | 289 | | 5,134 | |
| Personal Health | 3,471 | | 15 | | 3,486 | | | 3,486 | |
| Other | 300 | | 311 | | 611 | | | | 611 | |
| Philips Group | 12,385 | | 5,282 | | 17,667 | | 354 | | 18,021 | |
Philips Group
Disaggregation of Sales per segment in millions of EUR
| | | | | | | | | | | | | | | | | |
| 2023 |
| Sales at a point in time | Sales over time | Total sales from contracts with customers | Sales from other sources | Total sales |
| Diagnosis & Treatment | 5,768 | | 2,980 | | 8,749 | | 76 | | 8,825 | |
| Connected Care | 2,970 | | 1,854 | | 4,824 | | 314 | | 5,138 | |
| Personal Health | 3,586 | | 16 | | 3,602 | | | 3,602 | |
| Other | 245 | | 360 | | 604 | | - | | 604 | |
| Philips Group | 12,569 | | 5,210 | | 17,779 | | 390 | | 18,169 | |
Philips Group
Disaggregation of Sales per segment in millions of EUR
| | | | | | | | | | | | | | | | | |
| 2022 |
| Sales at a point in time | Sales over time | Total sales from contracts with customers | Sales from other sources | Total sales |
| Diagnosis & Treatment | 5,295 | | 2,954 | | 8,248 | | 55 | | 8,303 | |
| Connected Care | 3,079 | | 1,853 | | 4,932 | | 336 | | 5,268 | |
| Personal Health | 3,615 | | 11 | | 3,626 | | | 3,626 | |
| Other | 274 | | 353 | | 630 | | | | 630 | |
| Philips Group | 12,263 | | 5,172 | | 17,435 | | 391 | | 17,827 | |
Philips Group
Disaggregation of Sales per geographic area in millions of EUR
| | | | | | | | | | | | | | | | | |
| 2024 |
| Sales at a point in time | Sales over time | Total sales from contracts with customers | Sales from other sources | Total sales |
| Western Europe | 2,698 | | 1,254 | | 3,951 | | 28 | | 3,978 | |
| North America | 4,958 | | 2,602 | | 7,560 | | 93 | | 7,655 | |
| Other mature geographies | 893 | | 401 | | 1,294 | | 231 | | 1,526 | |
| Mature geographies | 8,549 | | 4,256 | | 12,805 | | 353 | | 13,159 | |
| Growth geographies | 3,836 | | 1,026 | | 4,861 | | 1 | | 4,863 | |
| Sales | 12,385 | | 5,282 | | 17,667 | | 354 | | 18,021 | |
Philips Group
Disaggregation of Sales per geographic area in millions of EUR
| | | | | | | | | | | | | | | | | |
| 2023 |
| Sales at a point in time | Sales over time | Total sales from contracts with customers | Sales from other sources | Total sales |
| Western Europe | 2,552 | | 1,221 | | 3,770 | | 49 | | 3,819 | |
| North America | 4,859 | | 2,608 | | 7,470 | | 92 | | 7,562 | |
| Other mature geographies | 980 | | 398 | | 1,378 | | 248 | | 1,626 | |
| Mature geographies | 8,392 | | 4,227 | | 12,618 | | 389 | | 13,007 | |
| Growth geographies | 4,177 | | 984 | | 5,161 | | 1 | | 5,162 | |
| Sales | 12,569 | | 5,210 | | 17,779 | | 390 | | 18,169 | |
Philips Group
Disaggregation of Sales per geographic area in millions of EUR
| | | | | | | | | | | | | | | | | |
| 2022 |
| Sales at a point in time | Sales over time | Total sales from contracts with customers | Sales from other sources | Total sales |
| Western Europe | 2,387 | | 1,183 | | 3,572 | | 31 | | 3,603 | |
| North America | 4,889 | | 2,612 | | 7,502 | | 86 | | 7,588 | |
| Other mature geographies | 972 | | 399 | | 1,369 | | 274 | | 1,643 | |
| Mature geographies | 8,248 | | 4,194 | | 12,443 | | 390 | | 12,833 | |
| Growth geographies | 4,015 | | 978 | | 4,992 | | 1 | | 4,993 | |
| Sales | 12,263 | | 5,172 | | 17,435 | | 391 | | 17,827 | |
Costs of materials used
Cost of materials used represents the inventory recognized in cost of sales.
Employee benefit expenses
Philips Group
Employee benefit expenses in millions of EUR
| | | | | | | | | | | |
| 2022 | 2023 | 2024 |
| Salaries and wages excluding share-based compensation | 5,594 | | 5,635 | | 5,356 | |
| Share-based compensation | 104 | | 97 | | 104 | |
| Post-employment benefit costs | 439 | | 402 | | 388 | |
| Other social security and similar charges: | | | |
| Required by law | 590 | | 567 | | 580 | |
| Voluntary | 225 | | 202 | | 211 | |
| Employee benefit expenses | 6,952 | | 6,903 | | 6,641 | |
The employee benefit expenses relate to employees who are working on the payroll of Philips, both with permanent and temporary contracts.
For details on the remuneration of the members of the Board of Management and the Supervisory Board, refer to Information on remuneration. Employees
The number (full-time equivalents, or FTEs) of employees by category at year-end is summarized as follows:
Philips Group
Employees by category in FTEs as of December 31
| | | | | | | | | | | |
| 2022 | 2023 | 2024 |
| Production | 30,689 | 28,640 | 27,478 |
| Research & development | 14,169 | 12,035 | 10,843 |
| Other | 29,082 | 26,818 | 27,795 |
| Employees | 73,941 | 67,493 | 66,116 |
| Third-party workers | 3,292 | 2,163 | 1,708 |
| Philips Group | 77,233 | 69,656 | 67,823 |
Employees consist of those persons working on the payroll of Philips and whose costs are reflected in employee benefit expenses. Other consists of employees in commercial, general and administrative functions. Third-party workers consist of personnel hired on a per-period basis, via external companies.
Philips Group
Employees by geographical location in average FTEs
| | | | | | | | | | | |
| 2022 | 2023 | 2024 |
| Netherlands | 11,180 | 9,794 | 8,844 |
| Other countries | 67,357 | 62,471 | 60,113 |
| Philips Group | 78,538 | 72,264 | 68,956 |
Depreciation and amortization
Depreciation of property, plant and equipment and amortization of intangible assets, including impairments, are as follows:
Philips Group
Depreciation and amortization1 in millions of EUR
| | | | | | | | | | | |
| 2022 | 2023 | 2024 |
| Depreciation of property, plant and equipment | 711 | | 689 | | 696 | |
| Amortization of software | 117 | | 98 | | 102 | |
| Amortization of acquired intangible assets | 363 | | 290 | | 392 | |
| Amortization of development costs | 411 | | 184 | | 199 | |
| Depreciation and amortization | 1,602 | | 1,261 | | 1,390 | |
Depreciation of property, plant and equipment is mainly included in cost of sales. Amortization of software is mainly included in general and administration expenses. Amortization of other intangible assets is included in selling expenses for brand names and customer relationships and is included in cost of sales for technology-based and other intangible assets. Amortization of development costs is included in research and development expenses.
Impairment of goodwill
There were no goodwill impairment charges in 2024. In 2023, a goodwill charge of EUR 8 million was recorded for the partial impairment of goodwill allocated to a business that was classified as held-for-sale as of December 31, 2023. For further information refer to Goodwill. Shipping and handling
Advertising and promotion
Lease expense
Lease expense relates to short-term and low value leases.
Other operational costs
Other operational costs contain items which are dissimilar in nature and individually insignificant in amount to disclose separately. These costs contain, among others, expenses for outsourcing services, mainly in Information Technology and Human Resources, third-party workers, consultants, warranty, patents, costs for travelling and external legal services. Government grants of EUR 91 million were recognized as a cost reduction in 2024 (2023: EUR 95 million; 2022: EUR 103 million). The grants mainly relate to research and development activities and business development.
Audit and audit-related fees
The following table shows the fees attributable to the fiscal years 2022, 2023 and 2024 for services rendered by the external auditors.
Philips Group
Audit and audit-related fees in millions of EUR
| | | | | | | | | | | | | | | | | | | | | | | | | | | | | |
| 2022 | 2023 | 2024 |
| EY NL¹ | EY Network | Total | EY NL¹ | EY Network | Total | EY NL¹ | EY Network | Total |
| Audit fees | 9.5 | | 5.6 | | 15.2 | | 9.9 | | 5.0 | | 14.9 | | 8.9 | | 5.5 | | 14.4 | |
| consolidated financial statements | 9.5 | 3.1 | 12.6 | 9.9 | 2.6 | 12.5 | 8.9 | 3.0 | 11.9 |
| statutory financial statements | | 2.5 | 2.5 | | 2.5 | 2.5 | | 2.5 | 2.5 |
Audit-related fees2 | 0.8 | | 0.2 | | 1.0 | | 0.9 | | 0.2 | | 1.1 | | 1.9 | | 0.3 | | 2.2 | |
| sustainability assurance | 0.6 | | 0.6 | 0.8 | | 0.8 | 1.6 | | 1.6 |
| other | 0.1 | 0.2 | 0.3 | 0.2 | 0.2 | 0.3 | 0.3 | 0.3 | 0.6 |
| Tax fees | | | | | | | | | |
| All other fees | | | | | | | | | |
| Fees | 10.3 | | 5.8 | | 16.2 | | 10.8 | | 5.2 | | 16.1 | | 10.8 | | 5.7 | | 16.6 | |
1EY Accountants B.V.
2Also known as Assurance fees
Other business income (expenses)
Other business income (expenses) consists of the following:
Philips Group
Other business income (expenses) in millions of EUR
| | | | | | | | | | | |
| 2022 | 2023 | 2024 |
| Result on disposal of businesses: | | | |
| income | 4 | | 50 | | 27 | |
| expenses | | | - | | (14) | |
| Result on disposal of fixed assets: | | | |
| income | 3 | | 12 | | 3 | |
| expenses | (1) | | (1) | | - | |
| Result on other remaining businesses: | | | |
| income | 121 | | 49 | | 560 | |
| expenses | (109) | | (643) | | (1,005) | |
| Other business income (expenses) | 18 | | (533) | | (429) | |
| Total other business income | 127 | | 112 | | 590 | |
| Total other business expenses | (109) | | (645) | | (1,019) | |
The result on disposal of businesses mainly relates to income (expense) in the respective periods for divestments of non-strategic businesses. For more information refer to Acquisitions and divestments. The result on disposal of fixed assets mainly relates to the sale of real estate assets.
The result on other remaining businesses mainly relates to the revaluation of contingent consideration and various legal matters. In 2024, Philips Respironics recorded a EUR 984 million provision in connection with the settlement of the Respironics personal injury and the medical monitoring claims in the US. Philips Respironics recorded insurance income of EUR 538 million in connection with the agreement with insurers to partially reimburse the Respironics recall-related product liability claims. For more information on contingent consideration, refer to Provisions.
7 Financial income and expenses
Accounting policies
Financial income and expenses are recognized on the accrual basis in the Consolidated statements of income. Interest income and expense are measured using the effective interest method. Dividend income is recognized in the consolidated statements of income on the date that the company’s right to receive payment is established, which in the case of quoted securities is normally the ex-dividend date.
Philips Group
Financial income and expenses in millions of EUR
| | | | | | | | | | | |
| 2022 | 2023 | 2024 |
| Interest income | 25 | | 46 | | 79 | |
| Interest income from loans and receivables | 7 | | 13 | | 12 | |
| Interest income from cash and cash equivalents | 18 | | 33 | | 67 | |
| Dividend income from financial assets | 3 | | 2 | | 3 | |
| Net gains from disposal of financial assets | | | | | 2 | |
| Net change in fair value of financial assets through profit or loss | 9 | | | | | |
| Other financial income | 20 | | 15 | | 21 | |
| Financial income | 58 | | 63 | | 105 | |
| Interest expense | (235) | | (277) | | (288) | |
| Interest expense on debt and borrowings | (200) | | (229) | | (231) | |
| Finance charges under lease contract | (25) | | (27) | | (37) | |
| Interest expense on pensions | (10) | | (21) | | (20) | |
| Provision-related accretion expenses | (9) | | (29) | | (49) | |
| Net foreign exchange gains (losses) | 9 | | (23) | | (7) | |
| Net change in fair value of financial assets through profit or loss | | (26) | | (18) | |
| Net change in fair value of derivatives | | | | (5) | |
| Other financial expenses | (24) | | (21) | | (20) | |
| Financial expenses | (258) | | (376) | | (387) | |
| Financial income and expenses, net | (200) | | (314) | | (282) | |
In 2024, financial income and expenses net decreased by EUR 32 million year-on-year, mainly due to higher interest income on cash and cash equivalents and net foreign exchange losses in 2023, partly offset by higher interest expenses and provision-related accretion costs. Net interest expense in 2024 was EUR 22 million lower than in 2023, mainly due to an increased cash position which was invested in short-term interest-bearing assets, partly offset by higher interest expenses. Interest expenses increased as a result of debt refinancing in 2024 and higher finance charges on lease contracts.
In 2023, financial income and expenses, net increased by EUR 114 million year-on-year, mainly due to fair value losses and net foreign exchange losses in 2023, compared with gains in 2022. The fair value losses mainly relate to Power Purchase Agreements for renewable energy, limited-life funds (mainly Gilde Healthcare) and other investments recognized at fair value through profit and loss. Furthermore, provision-related accretion expenses and net interest expense were higher in 2023 compared with 2022. Net interest expense in 2023 was EUR 21 million higher than in 2022, mainly due the issuance of new debt in 2022 and 2023 and the impact of increasing interest rates.
8 Income taxes
Accounting policies
Income taxes comprise current, non-current and deferred tax. Income tax is recognized in the Consolidated statements of income except to the extent that it relates to items recognized directly within equity or in other comprehensive income. Current tax is the expected taxes payable on the taxable income for the year, using tax rates enacted or substantively enacted at the reporting date, and any adjustment to tax payable in respect of previous years.
In cases where it is concluded it is not probable that tax authorities will accept a tax treatment, the effect of the uncertainty is reflected in the recognition and measurement of tax assets and liabilities or, alternatively, a provision is made for the amount that is expected to be settled, where this can be reasonably estimated. This assessment relies on estimates and assumptions and may involve a series of judgments about future events. New information may become available that causes the company to change its judgment regarding the adequacy of existing tax assets and liabilities. Such changes to tax assets and liabilities will impact the income tax expense in the period during which such a determination is made.
Deferred tax assets and liabilities are recognized, using the consolidated balance sheet method, for the expected tax consequences of temporary differences between the carrying amounts of assets and liabilities and the amounts used for taxation purposes. Deferred tax is not recognized for the following temporary differences: (a) the initial recognition of goodwill; or (b) the initial recognition of an asset or liability in a transaction which: (i) is not a business combination, (ii) at the time of transaction, affects neither accounting profit nor taxable profit (tax loss), (iii) at the time of the transaction, does not give rise to equal amounts of taxable and deductible differences; or (c) differences relating to investments in subsidiaries, joint ventures and associates where the reversal of the respective temporary difference can be controlled by the company and it is probable that it will not reverse in the foreseeable future. Deferred taxes are measured at the tax rates that are expected to be applied to
temporary differences when they reverse, based on the laws that have been enacted or substantively enacted by the reporting date. Deferred tax assets and liabilities are offset if there is a legally enforceable right to offset current tax liabilities and assets, and they relate to income taxes levied by the same tax authority on the same taxable entity or on different taxable entities, but the company intends to settle current tax liabilities and assets on a net basis or their tax assets and liabilities will be realized simultaneously.
A deferred tax asset is recognized for unused tax losses, tax credits and deductible temporary differences to the extent that it is probable that there will be future taxable profits against which they can be utilized. The ultimate realization of deferred tax assets is dependent upon the generation of future taxable income in the countries where the deferred tax assets originated and during the periods when the deferred tax assets become deductible. Management considers the scheduled reversal of deferred tax liabilities, projected future taxable income, and tax planning strategies in making this assessment.
Deferred tax liabilities for withholding taxes are recognized for subsidiaries in situations where the income is to be paid out as dividend in the foreseeable future and for undistributed earnings of unconsolidated companies to the extent that these withholding taxes are not expected to be refundable or deductible. Changes in tax rates and tax laws are reflected in the period when the change was enacted or substantively enacted by the reporting date.
Any subsequent adjustment to a tax asset or liability that originated in discontinued operations and for which no specific arrangements were made at the time of divestment, due to a change in the tax base or its measurement, is allocated to discontinued operations (i.e., backwards tracing). Examples are a tax rate change or change in retained assets or liabilities directly relating to the discontinued operation. Any subsequent change to the recognition of deferred tax assets is allocated to the component in which the taxable gain is or will be recognized. The above principles are applied to the extent the ‘discontinued operations’ are sufficiently separable from continuing operations.
Consistent with the IAS 12 amendment regarding Pillar Two taxation as issued by the IASB and adopted by the EU, Philips does not recognize and disclose deferred taxes arising from tax laws that implement Pillar Two model rules published by the Organization for Economic Co-operation and Development.
Accounting estimates and judgments
Deferred tax recoverability
Deferred tax assets are recognized to the extent that it is probable that there will be future taxable profits against which these can be utilized. Significant judgment is involved in determining whether such profits are probable. Management determines this on the basis of expected taxable profits arising from the reversal of recognized deferred tax liabilities, on appropriate tax planning opportunities to support business goals and on the basis of forecasts.
Uncertain tax positions
Uncertain tax positions are recognized as liabilities if and to the extent it is probable that additional tax will be due and the amount can be reliably measured. Significant judgment is involved in determining these positions.
The income tax expense of continuing operations amounts to EUR 963 million (2023: EUR 73 million tax benefit; 2022: EUR 113 million tax benefit).
The components of income before taxes and income tax expense are as follows:
Philips Group
Income tax expense in millions of EUR
| | | | | | | | | | | |
| 2022 | 2023 | 2024 |
| Income before taxes | (1,731) | | (526) | | 123 | |
| Investments in associates, net of income taxes | (2) | | (98) | | (124) | |
| Income before taxes excluding Investment in associates | (1,729) | | (429) | | 247 | |
| | | |
| Current tax (expense) benefit | (97) | | (201) | | (140) | |
| Deferred tax (expense) benefit | 210 | | 274 | | (823) | |
| Income tax (expense) benefit of continuing operations | 113 | | 73 | | (963) | |
Income tax expense of continuing operations excludes the tax benefit of the discontinued operations of EUR 143 million (2023: EUR 9 million benefit; 2022: EUR 18 million benefit), mainly related to the tax audit settlements of prior years.
The components of income tax expense of continuing operations are as follows:
Philips Group
Current income tax expense in millions of EUR
| | | | | | | | | | | |
| 2022 | 2023 | 2024 |
| Current year tax (expense) benefit | (111) | | (211) | | (150) | |
| Prior year tax (expense) benefit | 14 | | 10 | | 9 | |
| Current tax (expense) benefit | (97) | | (201) | | (140) | |
Philips Group
Deferred income tax expense in millions of EUR
| | | | | | | | | | | |
| 2022 | 2023 | 2024 |
| Recognition of previously unrecognized tax loss and credit carryforwards | 2 | | 72 | | 5 | |
| Unrecognized tax loss and credit carryforwards | (13) | | (41) | | (351) | |
| Changes to recognition of temporary differences | (4) | | (112) | | (602) | |
| Prior year tax (expense) benefit | (1) | | (2) | | (13) | |
| Tax rate changes | (18) | | 4 | | 2 | |
| Origination and reversal of temporary differences, tax losses and tax credits | 244 | | 353 | | 136 | |
| Deferred tax (expense) benefit | 210 | | 274 | | (823) | |
The increase in deferred tax expense in 2024 is mainly due to the de-recognition of deferred tax assets in the US.
Philips’ operations are subject to income taxes in various foreign jurisdictions. The statutory income tax rate varies per country, which results in a difference between the weighted average statutory income tax rate and the Netherlands’ statutory income tax rate of 25.8% (2023: 25.8%; 2022: 25.8%).
A reconciliation of the weighted average statutory income tax rate to the effective income tax rate of continuing operations is as follows:
Philips Group
Effective income tax rate in %
| | | | | | | | | | | |
| 2022 | 2023 | 2024 |
| Weighted average statutory income tax rate in % | 23.6 | | 22.0 | | 26.6 | |
| Recognition of previously unrecognized tax loss and credit carryforwards | 0.1 | | 16.8 | | (1.9) | |
| Unrecognized tax loss and credit carryforwards | (0.7) | | (9.6) | | 141.8 | |
| Changes to recognition of temporary differences | (0.2) | | (26.2) | | 243.6 | |
| Non-taxable income and tax incentives | 5.8 | | 22.8 | | (30.2) | |
| Non-deductible expenses | (22.9) | | (10.7) | | 10.0 | |
| Withholding and other taxes | (1.4) | | (5.1) | | 16.0 | |
| Tax rate changes | (1.0) | | 0.9 | | (0.9) | |
| Prior year tax | 0.7 | | 1.9 | | 1.2 | |
| Tax expense (benefit) due to change in uncertain tax treatments | 2.8 | | 2.3 | | (20.4) | |
| Others, net | (0.2) | | 1.9 | | 3.1 | |
| Effective income tax rate | 6.5 | | 17.0 | | 389.5 | |
The effective income tax rate in 2024 is higher than the weighted average statutory income tax rate, primarily due to the changes in the recognition of temporary differences and unrecognized tax loss and credit carryforwards. This specifically relates to the de-recognition of deferred tax assets associated with the Respironics litigation provision and carryforward losses along with temporary differences in the United States (EUR 941 million). This increase is partly offset by the release of uncertain tax positions and recurring tax incentives related to the innovation box regime in the Netherlands, R&D investments and export activities.
Global minimum tax (Pillar Two)
In December 2021, the OECD released model rules to introduce a global minimum corporate income tax rate of 15% applicable to multinational enterprise groups with global revenue over EUR 750 million (Pillar Two). The formal adoption of Council Directive (EU) 2022/2523 in December 2022 aims to achieve a coordinated implementation of Pillar Two in the EU Member States. The Dutch Government adopted the Minimum Tax Rate Act 2024 (MTR Act), in December 2023 and the Pillar Two legislation has been applicable in local law with effect from 2024 in the Netherlands, the EU and multiple other countries around the world. Therefore, Pillar Two applies to Philips from the financial year ending
December 31, 2024, and onward. Under this legislation, Philips is generally required to pay top-up taxes on profits if the related Pillar Two jurisdictional effective tax rate is less than 15%.
The current tax expense related to Pillar Two is EUR 1 million, resulting in an increase of ETR by 0.4%. This amount has been accounted for within the income taxes of the reporting period.
With reference to the income taxes accounting policy, Philips does not recognize and disclose deferred taxes arising from tax laws that implement Pillar Two model rules published by the Organization for Economic Co-operation and Development.
Deferred tax assets and liabilities
Deferred tax assets are recognized for temporary differences, unused tax losses, and unused tax credits to the extent that realization of the related tax benefits is probable. The ultimate realization of deferred tax assets is dependent upon the generation of future taxable income in the countries where the deferred tax assets originated and during the periods when the deferred tax assets become deductible. Management considers the scheduled reversal of deferred tax liabilities, projected future taxable income, and tax planning strategies in making this assessment.
Net deferred tax assets relating to the years 2024 and 2023, respectively, are presented in the following tables.
The net deferred tax assets of EUR 1,835 million (2023: EUR 2,556 million) consist of deferred tax assets of EUR 1,916 million (2023: EUR 2,627 million) and deferred tax liabilities of EUR 81 million (2023: EUR 71 million). Of the total deferred tax assets of EUR 1,916 million as of December 31, 2024 (2023: EUR 2,627 million), EUR 1,188 million (2023: EUR 1,676 million) is recognized with respect to entities in various countries where there have been tax losses in the current or preceding period, primarily the US. Based on Philips' assessment of the recoverability of the recognized deferred tax assets, the net decrease mainly relates to de-recognition of deferred tax assets on carryforward losses, intangible assets and other liabilities, which include provisions for Respironics litigation in the US. The decrease mainly results from updates to the company's long term income projections by jurisdiction, including the US.
Philips recognizes deferred tax assets only to the extent future tax profits are considered probable. For the recoverability assessment, the income projections were determined using similar methodology as used for goodwill impairment testing (for more information refer to note Goodwill). The company evaluated multiple risk-adjusted scenarios that support the assumption that it is probable that the results of future operations will generate sufficient taxable income to utilize the recognized tax losses as well the deductible temporary differences. The projections include forward-looking assumptions whereby the most recent available information was used to determine the expected period of recovery of the deferred tax assets. Relevant developments potentially impacting the period and probability of recovery are monitored closely. A change in enacted tax rates or a revision to risk-adjusted long term income projections by jurisdiction could have an impact on the measurement of deferred tax assets.
As of December 31, 2024, the temporary differences associated with investments, including potential income tax consequences on dividends, for which no deferred tax liabilities are recognized, aggregate to EUR 340 million (2023: EUR 444 million).
Philips Group
Deferred tax assets and liabilities in millions of EUR
| | | | | | | | | | | | | | | | | | | | |
| Balance as of January 1, 2024 | Recognized in income statement | Other¹ | Balance as of December 31, 2024 | Assets | Liabilities |
| Intangible assets | 679 | | (333) | | 26 | | 373 | | 533 | | (160) | |
| Property, plant and equipment | (88) | | 25 | | (1) | | (64) | | 39 | | (103) | |
| Inventories | 360 | | (9) | | 13 | | 364 | | 369 | | (5) | |
| Other assets | 184 | | (25) | | (9) | | 151 | | 207 | | (56) | |
| Pensions and other long-term employee benefits | 193 | | (61) | | 20 | | 152 | | 179 | | (27) | |
| Other liabilities | 496 | | (198) | | 20 | | 319 | | 365 | | (47) | |
| Deferred tax assets on tax loss carryforwards | 730 | | (222) | | 33 | | 541 | | 541 | | |
| Set-off deferred tax positions | | | | | (317) | | 317 | |
| Net deferred tax assets | 2,556 | | (823) | | 102 | | 1,835 | | 1,916 | | (81) | |
1Other includes the movements of assets and liabilities recognized in equity and OCI, which includes foreign currency translation differences, acquisitions and divestments.
Philips Group
Deferred tax assets and liabilities in millions of EUR
| | | | | | | | | | | | | | | | | | | | |
| Balance as of January 1, 2023 | Recognized in income statement | Other¹ | Balance as of December 31, 2023 | Assets | Liabilities |
| Intangible assets | 630 | | 61 | | (12) | | 679 | | 826 | | (147) | |
| Property, plant and equipment | (2) | | 18 | | (103) | | (88) | | 44 | | (132) | |
| Inventories | 464 | | (26) | | (78) | | 360 | | 363 | | (2) | |
| Other assets | 44 | | 20 | | 120 | | 184 | | 233 | | (48) | |
| Pensions and other employee benefits | 153 | | 69 | | (29) | | 193 | | 204 | | (11) | |
| Other liabilities | 483 | | (56) | | 69 | | 496 | | 521 | | (25) | |
| Deferred tax assets on tax loss carryforwards | 586 | | 188 | | (44) | | 730 | | 730 | | |
| Set-off deferred tax positions | | | | | (294) | | 294 | |
| Net deferred tax assets | 2,358 | | 274 | | (77) | | 2,556 | | 2,627 | | (71) | |
1Other includes the movements of assets and liabilities recognized in equity and OCI, which includes foreign currency translation differences, acquisitions and divestments.
As of December 31, 2024, the amount of deductible temporary differences for which no deferred tax asset has been recognized in the balance sheet was EUR 788 million (2023: EUR 125 million).
The company has available tax loss and credit carryforwards, which expire as follows:
Philips Group
Expiry years of net operating loss and credit carryforwards in millions of EUR
| | | | | | | | | | | | | | |
| Total balance as of December 31, 2023 | Unrecognized balance as of December 31, 2023 | Total balance as of December 31, 2024 | Unrecognized balance as of December 31, 2024 |
| Within 1 year | 17 | | 15 | | 21 | | 21 | |
| 1 to 2 years | 20 | | 16 | | 5 | | 4 | |
| 2 to 3 years | 7 | | 2 | | 6 | | 3 | |
| 3 to 4 years | 9 | | 5 | | 15 | | 6 | |
| 4 to 5 years | 38 | | 16 | | 146 | | 64 | |
| Later | 808 | | 81 | | 807 | | 771 | |
| Unlimited | 2,997 | | 1,231 | | 3,342 | | 1,695 | |
| Total | 3,896 | | 1,366 | | 4,342 | | 2,564 | |
The increase in the unrecognized balance as of December 31, 2024 mainly relates to the US.
Tax risks
Philips is exposed to tax risks and uncertainty over tax treatments. For particular tax treatments that are not expected to be accepted by tax authorities, Philips either recognizes a liability or reflects the uncertainty in the recognition and measurement of its current and deferred tax assets and tax attributes. For the measurement of the uncertainty, Philips uses the most likely amount or the expected value of the tax treatment. The expected liabilities resulting from the uncertain tax treatments are included in non-current tax liabilities (2024: EUR 116 million; 2023: EUR 390 million), and this decrease mainly relates to releases and settlements arising out of the tax audit settlements of prior years, in combination with higher tax losses or similar tax carryforwards that can be used if uncertain tax treatments were settled for the presumed amount at balance sheet date). The positions include, among others, the following:
Transfer pricing risks
Philips has issued transfer pricing directives, which are in accordance with international guidelines such as those of the Organization of Economic Co-operation and Development. In order to reduce the transfer pricing uncertainties, monitoring procedures are carried out by Group Tax to safeguard the correct implementation of the transfer pricing directives. However, tax disputes can arise due to inconsistent transfer pricing regimes and different views on 'at arm's length' pricing.
Tax risks on general and specific service agreements and licensing agreements
Due to the centralization of certain activities (such as research and development, IT and group Functions), costs are also centralized. As a consequence, these costs and/or revenues must be allocated to the beneficiaries, i.e., the various Philips entities. For that purpose, service contracts such as intra-group service agreements and licensing agreements are signed with a large number of group entities. Tax authorities review these intra-group service and licensing agreements, and may reject the implemented intra-group charges. Furthermore, buy in/out situations in the case of (de)mergers could affect the cost allocation resulting from the intra-group service agreements between countries. The same applies to the specific service agreements.
Tax risks due to disentanglements and acquisitions
When a subsidiary of Philips is disentangled, or a new company is acquired, tax risks may arise. Philips creates merger and acquisition (M&A) teams for these disentanglements or acquisitions. In addition to representatives from the involved business, these teams consist of specialists from various group Functions and are formed, among other things, to identify tax risks and to reduce potential tax claims.
Tax risks due to permanent establishments
A permanent establishment may arise when a Philips entity has activities in another country; tax claims could arise in both countries on the same income.
9 Earnings per share
Accounting policies
The company presents basic and diluted earnings per share (EPS) data for its common shares. Basic EPS is calculated by dividing the Net income (loss) attributable to shareholders by the weighted average number of common shares outstanding (after deduction of treasury shares) during the period. Diluted EPS is determined by adjusting the Net income (loss) attributable to shareholders and the weighted average number of common shares outstanding (after deduction of treasury shares) during the period, for the effects of all dilutive potential common shares, which comprise performance shares, restricted shares and share options granted under share-based compensation plans as well as forward contracts to repurchase shares.
Philips Group
Earnings per share in millions of EUR unless otherwise stated1
| | | | | | | | | | | |
| 2022 | 2023 | 2024 |
| Income from continuing operations | (1,618) | | (454) | | (840) | |
| Income from continuing operations attributable to shareholders | (1,622) | | (456) | | (843) | |
| Income from continuing operations attributable to non-controlling interests | 3 | | 2 | | 3 | |
| Income from discontinued operations | 13 | | (10) | | 142 | |
| Income from discontinued operations attributable to shareholders | 13 | | (10) | | 142 | |
| Net income | (1,605) | | (463) | | (698) | |
| Net income attributable to shareholders | (1,608) | | (466) | | (702) | |
| Net income attributable to non-controlling interests | 3 | | 2 | | 3 | |
| | | |
| Weighted average number of common shares outstanding (after deduction of treasury shares) during the period | 951,811,382 | 948,300,672 | 933,370,814 |
| Plus incremental shares from assumed conversions of: | | | |
| Share options | 25,506 | | 232,965 |
| Performance shares | 1,147,790 | 2,623,097 | 4,958,144 |
| Restricted shares | 1,986,538 | 2,574,738 | 3,898,844 |
| Forward contracts to repurchase shares | 17,611,920 | 15,511,844 | 1,835,048 |
| Dilutive potential common shares² | 20,771,753 | 20,709,680 | 10,925,002 |
| Diluted weighted average number of shares outstanding (after deduction of treasury shares) during the period | 951,811,382 | 948,300,672 | 933,370,814 |
| Basic earnings per common share attributable to shareholders (in EUR) | | | |
| Income from continuing operations | (1.70) | | (0.48) | | (0.90) | |
| Income from discontinued operations | 0.01 | | (0.01) | | 0.15 | |
| Net income | (1.69) | | (0.49) | | (0.75) | |
| Diluted earnings per common share attributable to shareholders (in EUR)² | | | |
| Income from continuing operations | (1.70) | | (0.48) | | (0.90) | |
| Income from discontinued operations | 0.01 | | (0.01) | | 0.15 | |
| Net income | (1.69) | | (0.49) | | (0.75) | |
| | | |
| Dividend distributed per common share in EUR | 0.85 | | 0.85 | | 0.85 | |
1Shareholders in this table refers to shareholders of Koninklijke Philips N.V. Per share calculations have been adjusted retrospectively for all periods presented to reflect the issuance of shares for the share dividend in respect of 2023.
2The dilutive potential common shares are not taken into account in the periods for which there is a loss, as the effect would be antidilutive.
Per-share calculations adjusted for share dividend
On May 7, 2024, the General Meeting of Shareholders approved a dividend of EUR 0.85 per common share, in shares only. The dividend was settled in May through the issuance of 30,860,582 new common shares. In accordance with IAS 33 Earnings Per Share, per share calculations have been adjusted retrospectively for all periods presented to reflect the issuance of shares for the share dividend with respect to 2023.
10 Property, plant and equipment
Accounting policies
Owned assets
The cost of property, plant and equipment comprise all directly attributable costs (including the cost of material and direct labor).
Depreciation is generally calculated using the straight-line method over the useful life of the asset. Land and assets under construction are not depreciated. When assets under construction are ready for their intended use, they are transferred to the relevant asset category and depreciation starts. All other property, plant and equipment items are depreciated over their estimated useful lives to their estimated residual values.
The estimated useful lives of property, plant and equipment are as follows:
Philips Group
Useful lives of property, plant and equipment
| | | | | |
| |
| Buildings | from 5 to 50 years |
| Machinery and installations | from 3 to 20 years |
| Other equipment | from 1 to 10 years |
Property, plant and equipment are reviewed for impairment whenever events or changes in circumstances indicate that the book value of the assets concerned may not be recoverable. An impairment loss is recognized for the amount by which the asset's book value exceeds their recoverable amount. Impairments are reversed if and to the extent that the impairment no longer exists. The recoverable amount is defined as the higher of the asset’s fair value less costs of disposal and its value in use.
Gains and losses on the sale of property, plant and equipment are included in other business income. Costs related to repair and maintenance activities are expensed in the period in which they are incurred unless they extend the asset's original lifetime or capacity.
Right-of-use assets
The company leases various items of real estate, vehicles and other equipment. The company determines whether an arrangement constitutes or contains a lease based on the substance of the arrangement at the lease inception. The arrangement constitutes or contains a lease if fulfillment is dependent on the use of a specific asset and the arrangement conveys a right to use the asset, even if that asset is not explicitly specified in the arrangement.
Company as a lessee
The company recognizes right-of-use assets and lease liabilities for leases with a term of more than 12 months if the underlying asset is not of low value. Payments for short-term and low-value leases are expensed over the lease term. Extension options are included in the lease term if their exercise is reasonably certain. Right-of-use assets are measured at cost less accumulated depreciation and impairment losses, adjusted for any remeasurements. Right-of-use assets are depreciated using the straight-line method over the shorter of the lease term and the useful life of the underlying assets.
Company as a lessor
When the company acts as a lessor, it determines at lease inception whether a lease is a finance lease or an operating lease. Leases in which the company does not transfer substantially all the risks and rewards incidental to ownership of an asset are classified as operating leases. The company recognizes lease payments received under operating leases as income on a straight-line basis over the lease term in the Consolidated statement of income.
Accounting estimates and judgments
Impairment of owned and right-of-use assets
Judgments are required, not only to determine whether there is an indication that an asset may be impaired, but also whether indications exist that impairment losses previously recognized may no longer exist or may have decreased (impairment reversal). After indications of impairment have been identified, estimates and assumptions are used in the determination of the recoverable amount of a fixed asset. These involve estimates of expected future cash flows (based on future growth rates and remaining useful life) and residual value assumptions, as well as discount rates to calculate the present value of the future cash flows.
Owned assets
Estimates are required to determine the (remaining) useful lives of fixed assets. Useful lives are determined based on an asset's age, the frequency of its use, repair and maintenance policy, technology changes in production and expected restructuring. The company estimates the expected residual value per asset item. The residual value is the higher of the asset's expected sales price (based on recent market transactions of similar sold items) and its material scrap value.
Right-of-use assets
Judgment is required to determine the lease term. The assessment of whether the company is reasonably certain to exercise extension options impacts the lease term, which could affect the amount of lease liabilities and right-of-use assets recognized.
Property, plant and equipment are fixed assets that are owned or right-of-use assets under a lease agreement. Owned and right-of-use assets are held for use in Philips' operating activities.
Philips Group
Property, plant and equipment in millions of EUR
| | | | | | | | |
| 2023 | 2024 |
| Owned assets | 1,565 | | 1,565 | |
| Right-of-use assets | 919 | | 886 | |
| Total | 2,483 | | 2,452 | |
Philips Group
Property, plant and equipment in millions of EUR
| | | | | | | | | | | | | | | | | | | | | | | | | | | | | | | |
| Owned assets | | Right-of-use assets | | Property, plant and equipment |
| Land and buildings | Machinery and installations | Other equipment | Assets under construction | Total | | Land and buildings | Other equipment | Total | | Total |
| Balance as of January 1, 2024 | | | | | | | | | | | |
| Cost | 1,114 | | 1,731 | | 1,404 | | 274 | | 4,521 | | | 1,425 | | 216 | | 1,641 | | | 6,162 | |
| Accumulated depreciation | (638) | | (1,278) | | (1,041) | | | | (2,957) | | | (619) | | (104) | | (722) | | | (3,679) | |
| Book value | 476 | | 453 | | 363 | | 274 | | 1,565 | | | 806 | | 113 | | 919 | | | 2,483 | |
| Additions | 2 | | 134 | | 76 | | 236 | | 448 | | | 101 | | 87 | | 189 | | | 637 | |
| Assets available for use | 12 | | 70 | | 140 | | (248) | | (26) | | | 26 | | - | | 26 | | | - | |
| Depreciation | (49) | | (191) | | (166) | | | | (406) | | | (146) | | (56) | | (202) | | | (608) | |
| Impairments | (14) | | (23) | | (28) | | - | | (65) | | | (23) | | - | | (23) | | | (89) | |
| | | | | | | | | | | |
| Reclassifications | 7 | | (6) | | 8 | | (1) | | 8 | | | (9) | | (3) | | (12) | | | (4) | |
| Translation differences and other | 20 | | 2 | | 9 | | 10 | | 41 | | | (6) | | (4) | | (10) | | | 31 | |
| Total change | (22) | | (13) | | 38 | | (3) | | 1 | | | (57) | | 24 | | (33) | | | (32) | |
| Balance as of December 31, 2024 | | | | | | | | | | | | |
| Cost | 1,151 | | 1,790 | | 1,527 | | 271 | | 4,738 | | | 1,462 | | 241 | | 1,702 | | | 6,441 | |
| Accumulated depreciation | (697) | | (1,350) | | (1,126) | | | | (3,173) | | | (712) | | (104) | | (816) | | | (3,989) | |
| Book value | 454 | | 440 | | 401 | | 271 | | 1,565 | | | 749 | | 137 | | 886 | | | 2,452 | |
Philips Group
Property, plant and equipment in millions of EUR
| | | | | | | | | | | | | | | | | | | | | | | | | | | | | | | |
| Owned assets | | Right-of-use assets | | Property, plant and equipment |
| Land and buildings | Machinery and installations | Other equipment | Assets under construction | Total | | Land and buildings | Other equipment | Total | | Total |
| Balance as of January 1, 2023 | | | | | | | | | | | |
| Cost | 1,135 | | 1,779 | | 1,454 | | 309 | | 4,676 | | | 1,365 | | 206 | | 1,571 | | | 6,247 | |
| Accumulated depreciation | (621) | | (1,291) | | (1,046) | | | | (2,958) | | | (543) | | (108) | | (651) | | | (3,609) | |
| Book value | 514 | | 488 | | 408 | | 309 | | 1,718 | | | 822 | | 98 | | 919 | | | 2,638 | |
| Additions | 1 | | 115 | | 77 | | 239 | | 433 | | | 175 | | 62 | | 236 | | | 669 | |
| Assets available for use | 20 | | 90 | | 144 | | (262) | | (8) | | | 2 | | 6 | | 8 | | | - | |
| Depreciation | (56) | | (196) | | (167) | | | | (420) | | | (150) | | (51) | | (201) | | | (621) | |
| Impairments | (5) | | (23) | | (17) | | - | | (45) | | | (23) | | - | | (23) | | | (68) | |
| Transfers to assets classified as held for sale | (1) | | (1) | | (45) | | | | (46) | | | (2) | | | | (2) | | | (48) | |
| Reclassifications | 15 | | 2 | | (17) | | (5) | | (6) | | | - | | 4 | | 4 | | | (2) | |
| Translation differences and other | (14) | | (22) | | (19) | | (7) | | (62) | | | (18) | | (5) | | (23) | | | (85) | |
| Total change | (39) | | (35) | | (45) | | (35) | | (154) | | | (16) | | 15 | | (1) | | | (154) | |
| Balance as of December 31, 2023 | | | | | | | | | | | |
| Cost | 1,114 | | 1,731 | | 1,404 | | 274 | | 4,521 | | | 1,425 | | 216 | | 1,641 | | | 6,162 | |
| Accumulated depreciation | (638) | | (1,278) | | (1,041) | | | | (2,957) | | | (619) | | (104) | | (722) | | | (3,679) | |
| Book value | 476 | | 453 | | 363 | | 274 | | 1,565 | | | 806 | | 113 | | 919 | | | 2,483 | |
Leasing activities
The company leases various items of real estate, vehicles and other equipment where it acts as a lessee. The company has multiple extension and termination options in a number of lease contracts. These are used to maximize operational flexibility in terms of managing the assets used in the company's operations. The options considered reasonably certain are part of lease liabilities. The company has no commitments to any leases not yet commenced in 2024 (2023: EUR 128 million). The company's lease contracts do not contain financial covenants.
The company enters into sale-and-leaseback transactions primarily for its Sleep & Respiratory Care Business. These transactions are accounted for at market value. The payments for these leases are considered in determining lease liabilities. Principal repayments are part of cash flows used for financing activities and interest payments are part of cash flows used for operating activities. The cash inflows arising from the sales transactions are part of cash flows provided by financing activities. Lease payments under sale-and-leaseback arrangements for 2024 were EUR 43 million (2023: EUR 55 million). The remaining minimum payment under sale-and-leaseback arrangements included in lease obligations above are as follows:
Philips Group
Remaining minimum payments under sale-and-leaseback arrangements in millions of EUR
| | | | | |
| |
| 2025 | 29 | |
| 2026 | 21 | |
| 2027 | 14 | |
| 2028 | 7 | |
| 2029 | 1 | |
| Thereafter | | |
11 Goodwill
Accounting policies
The measurement of goodwill at initial recognition is described in the Acquisitions and divestments note. Goodwill is subsequently measured at cost less accumulated impairment losses.
Goodwill is not amortized but is instead tested for impairment annually in the fourth quarter, or more frequently if indicators of potential impairment exist. Internal and external sources of information are considered to assess if there are indicators that an asset or groups of cash-generating units (CGUs) may be impaired. Goodwill is allocated to groups of CGUs and tested for impairment at the Business level (one level below segment), which represents the lowest level at which goodwill is monitored internally for management purposes. An impairment loss is recognized in the Consolidated statements of income whenever and to the extent that the carrying amount of a group of CGUs exceeds the recoverable amount for the group of CGUs, whichever is the greater, its value in use or its fair value less cost of disposal. Value in use is measured as the present value of future cash flows expected to be generated by the asset. Fair value less cost of disposal is measured as the amount obtained from the sale of an asset in an arm’s length transaction, less costs of disposal.
Accounting estimates and judgments
The cash flow projections used in the value in use calculations for goodwill impairment testing contain various judgments and estimations as described in the ‘key assumptions’ section.
The changes in 2023 and 2024 were as follows:
Philips Group
Goodwill in millions of EUR
| | | | | | | | | | | |
| 2023 | | 2024 |
| Balance as of January 1 | | | |
| Cost | 12,747 | | | 12,133 | |
| Impairments | (2,509) | | | (2,256) | |
| Book value | 10,238 | | | 9,876 | |
| | | |
| Acquisitions¹ | 24 | | | | |
| Impairments | (8) | | | | |
| Divestments and transfers to assets classified as held for sale² | (8) | | | (22) | |
| Translation differences and other | (370) | | | 528 | |
| Total change | (362) | | | 507 | |
| Balance as of December 31 | | | |
| Cost | 12,133 | | | 12,777 | |
| Impairments | (2,256) | | | (2,394) | |
| Book value | 9,876 | | | 10,383 | |
In 2024, goodwill increased by EUR 507 million, primarily as a result of translation differences.
Goodwill impairment testing
During 2024, there were no goodwill impairments recorded.
Goodwill allocated to the Businesses (groups of cash-generating units) as of December 31, 2024, is presented in the following table:
Philips Group
Goodwill by business in millions of EUR
| | | | | | | | | | | |
| 2023 | | 2024 |
| Monitoring | 3,964 | | | 4,194 | |
| Image-Guided Therapy | 3,044 | | | 3,216 | |
| Precision Diagnosis | 1,363 | | | 1,440 | |
| Sleep & Respiratory Care | 687 | | | 694 | |
| Personal Health | 483 | | | 509 | |
| Enterprise Informatics | 336 | | | 331 | |
| Book value | 9,876 | | | 10,383 | |
The carrying amount of each group of CGUs is compared to the recoverable amount of the group of CGUs. Unless otherwise noted, the recoverable amount for each group of CGUs is based on value-in-use calculations. Cash flow projections were determined using Philips management's internal forecasts that cover an initial forecast period from 2025 to 2027. Projections were extrapolated using the growth rates disclosed in the following table for an extrapolation period of 4 years (2028-2031), after which a terminal value was calculated per 2032. For the terminal value calculation, growth rates were capped at a historical long-term average growth rate. The company uses scenarios in the business
forecasting process and the most reasonable and supportable assumptions that represent management’s best estimate are used as the basis for the value-in-use calculations.
Key assumptions
Key assumptions used in the value-in-use calculations were compound sales growth rates, EBITA* in the terminal value and the rates used for discounting the projected cash flows.
The compound sales growth rate is the annualized steady nominal growth rate over the forecast period calculated with reference to the latest full year of actual sales as the base for the growth. The compound sales growth rate used to calculate the terminal value is only applied to the first year after the extrapolation period, after which no further growth is assumed for the terminal value calculation.
The compound sales growth rates and EBITA* used to estimate cash flows are based on past performance, external market growth assumptions and industry long-term growth averages. EBITA* for each group of CGUs is expected to increase over the projection period as a result of volume growth and cost efficiencies. By their nature, these assumptions involve risk and uncertainty because they relate to future events and circumstances and there are many factors that could cause actual results and developments to differ materially from the plans, goals and expectations set forth in these assumptions.
The rates used for discounting the projected cash flows in goodwill impairment testing is based on a weighted cost of capital (WACC), which in turn is based on business-specific inputs along with other inputs as mentioned below. The WACC is based on post-tax cost of equity and cost of debt, and is further calculated based on market data and inputs to accurately capture changes to the time value of money, such as the risk-free interest rate, the beta factor and country risk premium. In order to properly reflect the different risk-profiles of different businesses, a WACC is determined for each business. As such, the beta factor is determined based on a selection of peer companies, which can differ per business. Different businesses have different geographical footprints, resulting in business-specific inputs for variables like country risk. Philips performs the value-in-use calculations using post-tax cash flows and discount rate, the implicit pre-tax rate discount rate is derived from an iterative calculation for disclosure purposes.
The values assigned to the key assumptions used for the value-in-use calculations were as follows:
Philips Group
Key assumptions 2024
| | | | | | | | | | | | | | | | | | | | | | | |
| Compound sales growth rate | | |
| Initial forecast period | | Extrapolation period | | Used to calculate terminal value | | Pre-tax discount rates |
| Monitoring | 5.3 | % | | 4.7 | % | | 2.5 | % | | 9.1 | % |
| Image-Guided Therapy | 6.3 | % | | 5.0 | % | | 2.5 | % | | 9.7 | % |
| Precision Diagnosis | 2.4 | % | | 3.6 | % | | 2.5 | % | | 9.9 | % |
| Sleep & Respiratory Care | 10.1 | % | | 7.3 | % | | 2.5 | % | | 10.3 | % |
| Personal Health | 5.1 | % | | 4.2 | % | | 2.5 | % | | 9.9 | % |
| Enterprise Informatics | 4.4 | % | | 5.4 | % | | 2.5 | % | | 8.9 | % |
The assumptions used for the 2023 value-in-use calculations for cash-generating units to which a significant amount of goodwill was allocated were as follows:
Philips Group
Key assumptions 2023
| | | | | | | | | | | | | | | | | | | | | | | |
| Compound sales growth rate | | |
| Initial forecast period | | Extrapolation period | | Used to calculate terminal value | | Pre-tax discount rates |
| Monitoring | 8.2 | % | | 5.5 | % | | 2.5 | % | | 9.5 | % |
| Image-Guided Therapy | 7.9 | % | | 5.2 | % | | 2.5 | % | | 10.7 | % |
| Precision Diagnosis | 3.8 | % | | 3.4 | % | | 2.5 | % | | 10.4 | % |
| Sleep & Respiratory Care | 9.5 | % | | 9.3 | % | | 2.5 | % | | 10.8 | % |
| Personal Health | 5.0 | % | | 4.6 | % | | 2.5 | % | | 10.3 | % |
| Enterprise Informatics | 5.3 | % | | 5.8 | % | | 2.5 | % | | 9.0 | % |
Sensitivity to changes in assumptions
The results of the annual impairment tests of the groups of CGUs indicate that a reasonably possible change in key assumptions would not cause the value in use to fall to the level of the carrying value.
12 Intangible assets excluding goodwill
Accounting policies
Acquired finite-lived intangible assets are amortized using the straight-line method over their estimated useful life. The useful lives are evaluated annually. Intangible assets are initially capitalized at cost, with the exception of intangible assets acquired as part of a business combination, which are capitalized at their acquisition date fair value.
The company expenses all research costs as incurred. Expenditure on development activities, whereby research findings are applied to a plan or design for the production of new or substantially improved products and processes, is capitalized as an intangible asset if the product or process is technically and commercially feasible, the company has sufficient resources and the intention to complete development and can measure the attributable expenditure reliably.
The capitalized development expenditure comprises of all directly attributable costs (including the cost of materials and direct labor). Other development expenditures and expenditures on research activities are recognized in the Consolidated statements of income. Capitalized development expenditure is stated at cost less accumulated amortization and impairment losses. Amortization of capitalized development expenditure is charged to the Consolidated statements of income on a straight-line basis over the estimated useful lives of the intangible assets.
Philips Group
Expected useful lives of intangible assets excluding goodwill in years
| | | | | |
| |
| Brand names | 2-20 |
| Customer relationships | 2-25 |
| Technology | 3-20 |
| Other | 1-10 |
| Software | 1-10 |
| Product development | 3-10 |
The weighted average expected remaining life of brand names, customer relationships, technology and other intangible assets is 8.5 years as of December 31, 2024 (2023: 9.3 years).
Impairment of intangible assets not yet ready for use
Intangible assets not yet ready for use are not amortized but are tested for impairment annually and whenever impairment indicators require. In the case of intangible assets not yet ready for use, either internal or external sources of information are considered to assess if there are indicators that an asset or a CGU may be impaired.
Impairment of non-financial assets other than goodwill, intangible assets not yet ready for use, inventories and deferred tax assets
Non-financial assets other than goodwill, intangible assets not yet ready for use, inventories and deferred tax assets are reviewed for impairment whenever events or changes in circumstances indicate that the carrying amount of an asset may not be recoverable. Recoverability of assets to be held and used is assessed by a comparison of the carrying amount of an asset with the greater of its value in use and fair value less cost of disposal. Value in use is measured as the present value of future cash flows expected to be generated by the asset. Fair value less cost of disposal is measured as the amount obtained from a sale of an asset in an arm’s length transaction, less costs of disposal. If the carrying amount of an asset is deemed not recoverable, an impairment charge is recognized in the amount by which the carrying amount of the asset exceeds the recoverable amount. The review for impairment is carried out at the level where cash flows occur that are independent of other cash flows.
Impairment losses recognized in prior periods for intangible assets other than goodwill are assessed at each reporting date for any indications that the loss has decreased or no longer exists. An impairment loss is reversed if and to the extent that there has been a change in the estimates used to determine the recoverable amount. The loss is reversed only to the extent that the asset’s carrying amount does not exceed the carrying amount that would have been determined, net of depreciation or amortization, if no impairment loss had been recognized. Reversals of impairment are recognized in the Consolidated statements of income.
Accounting estimates and judgments
The cash flow projections used in the value in use calculations for intangible assets excluding goodwill contain various judgments and estimations. For intangible assets excluding goodwill, estimates are required to determine the (remaining) useful lives.
Philips Group
Intangible assets excluding goodwill in millions of EUR
| | | | | | | | | | | | | | | | | | | | | | | | | | |
| Brand names | Customer relationships | Technology | Product development | Product development in progress | Software | Other | Total |
| Balance as of January 1, 2024 | | | | | | | | |
| Cost | 629 | | 2,593 | | 2,908 | | 2,432 | | 635 | | 929 | | 139 | | 10,265 | |
| Amortization / impairments | (511) | | (1,718) | | (1,895) | | (2,096) | | (91) | | (662) | | (101) | | (7,075) | |
| Book value | 118 | | 875 | | 1,013 | | 336 | | 544 | | 267 | | 38 | | 3,190 | |
| | | | | | | | | |
| Additions | | | - | | 36 | | - | | 240 | | 85 | | - | | 361 | |
| Assets available for use | | | | | | | 266 | | (266) | | | | | | | |
| | | | | | | | |
| Amortization | (19) | | (92) | | (138) | | (162) | | | | (95) | | (1) | | (506) | |
| Impairments | (7) | | - | | (135) | | (13) | | (24) | | (7) | | (1) | | (188) | |
| Transfers to assets classified as held for sale | | | (11) | | | | | | | | | | 1 | | (10) | |
| Translation differences and other | 6 | | 51 | | 79 | | (9) | | 29 | | 15 | | (37) | | 134 | |
| Total change | (20) | | (52) | | (158) | | 82 | | (21) | | (3) | | (38) | | (208) | |
| | | | | | | | |
| Balance as of December 31, 2024 | | | | | | | | |
| Cost | 671 | | 2,722 | | 2,900 | | 2,659 | | 624 | | 984 | | - | | 10,559 | |
| Amortization / impairments | (573) | | (1,899) | | (2,044) | | (2,241) | | (101) | | (719) | | - | | (7,578) | |
| Book Value | 98 | | 823 | | 855 | | 418 | | 523 | | 265 | | - | | 2,982 | |
Philips Group
Intangible assets excluding goodwill in millions of EUR
| | | | | | | | | | | | | | | | | | | | | | | | | | |
| Brand names | Customer relationships | Technology | Product development | Product development in progress | Software | Other | Total |
| Balance as of January 1, 2023 | | | | | | | | |
| Cost | 647 | | 2,735 | | 2,947 | | 2,605 | | 648 | | 869 | | 152 | | 10,602 | |
| Amortization / impairments | (507) | | (1,665) | | (1,845) | | (2,212) | | (146) | | (589) | | (113) | | (7,077) | |
| Book value | 140 | | 1,070 | | 1,102 | | 393 | | 502 | | 280 | | 39 | | 3,526 | |
| | | | | | | | | |
| Additions | | | | | 33 | | - | | 214 | | 70 | | - | | 317 | |
| Assets available for use | | | | | | | 157 | | (157) | | | | - | | - | |
| Acquisitions | | | | | 40 | | - | | | | - | | | | 40 | |
| Amortization | (20) | | (137) | | (131) | | (169) | | | | (97) | | (1) | | (556) | |
| Impairments | | | - | | - | | (7) | | (7) | | (1) | | - | | (16) | |
| Transfers to assets classified as held for sale | (1) | | (20) | | | | | | (8) | | (2) | | - | | (32) | |
| Translation differences and other | (1) | | (37) | | (30) | | (38) | | 1 | | 18 | | - | | (87) | |
| Total change | (22) | | (195) | | (89) | | (57) | | 42 | | (13) | | (1) | | (335) | |
| | | | | | | | |
| Balance as of December 31, 2023 | | | | | | | | |
| Cost | 629 | | 2,593 | | 2,908 | | 2,432 | | 635 | | 929 | | 139 | | 10,265 | |
| Amortization / impairments | (511) | | (1,718) | | (1,895) | | (2,096) | | (91) | | (662) | | (101) | | (7,075) | |
| Book Value | 118 | | 875 | | 1,013 | | 336 | | 544 | | 267 | | 38 | | 3,190 | |
Philips did not make any acquisitions in 2024 (2023: acquisitions involved EUR 40 million of intangible assets). For more information, refer to Acquisitions and divestments.
Impairments in 2024 amounted to EUR 188 million (2023: EUR 16 million) and mainly relate to the impairment of acquired intangible assets following the decision to discontinue certain products in the Diagnosis & Treatment segment.
The company uses scenarios in the business forecasting process and the most reasonable and supportable assumptions which represent management’s best estimate are used as the basis for the value-in-use calculations.
The most notable intangible assets as of December 31, 2024 relate to the BioTelemetry customer relationships and technology with a carrying value of EUR 316 million and EUR 108 million and a remaining amortization period of 12 years and 8 years, respectively, and Spectranetics customer relationships and technology with a carrying value of EUR 256 million and EUR 164 million and a remaining amortization period of 13 years and 8 years, respectively. The most notable intangible assets as of December 31, 2023, relate to the BioTelemetry customer relationships and technology with value of EUR 327 million and EUR 123 million and a remaining amortization period of 13 years and 9 years, respectively, and Spectranetics customer relationships and technology with a carrying value of EUR 261 million and EUR 175 million and a remaining amortization period of 14 years and 9 years, respectively.
13 Other financial assets
Accounting policies
Classification and measurement of financial assets
The classification of financial assets at initial recognition depends on the financial asset’s contractual cash flow characteristics and the company’s business model for managing them.
The company initially measures a financial asset at its fair value plus, in the case of a financial asset not at fair value through profit or loss, transaction costs.
For the purposes of subsequent measurement, financial assets are classified into four categories:
•financial assets at amortized cost (debt instruments)
•financial assets at fair value through other comprehensive income (OCI) with recycling of cumulative gains and losses (debt instruments)
•financial assets designated at fair value through OCI with no recycling of cumulative gains and losses upon derecognition (equity instruments)
•financial assets at fair value through profit or loss (debt instruments and equity instruments)
Impairment of financial assets
The company recognizes a loss allowance for expected credit losses for trade receivables, contract assets, lease receivables, debt investments carried at amortized cost and fair value through other comprehensive income (FVTOCI).
At each balance sheet date, the company assesses whether there is objective evidence that a financial asset or a group of financial assets is impaired and recognizes a loss allowance for expected credit losses for financial assets measured at either amortized costs or at fair value through other comprehensive income. If, at the reporting date, the credit risk on a financial instrument has not increased significantly since initial recognition, the company measures the loss allowance for the financial instrument at an amount equal to 12 months of expected credit losses. If, at the reporting date, the credit risk on a financial instrument has increased significantly since initial recognition, the company measures the loss allowance for the financial instrument at an amount equal to the lifetime-expected credit losses. For all trade receivables, contract assets and lease receivables the company measures the loss allowance at an amount equal to lifetime-expected credit losses.
Accounting estimates and judgments
Financial assets classified at amortized cost and at fair value through OCI are subject to impairment assessment. The calculation of expected credit losses requires the company to apply significant judgment and make estimates and assumptions that involve significant uncertainty at the time they are made. Changes to these estimates and assumptions can result in significant changes to the timing and amount of expected credit losses to be recognized.
Other current financial assets
In 2024, Other current financial assets decreased from EUR 3 million to EUR 2 million (2023: decreased from EUR 11 million to EUR 3 million).
Other non-current financial assets
The company’s investments in Other non-current financial assets mainly consist of investments in common shares of companies in various industries and investments in limited life funds. The changes during 2024 and 2023 were as follows:
Philips Group
Other non-current financial assets in millions of EUR
| | | | | | | | | | | | | | | | | | | | | | | |
| Non-current financial assets at FVTP&L | | Non-current financial assets at FVTOCI | | Non-current financial assets at Amortized cost | | Total |
| Balance as of January 1, 2024 | 284 | | | 258 | | | 77 | | | 619 | |
| Changes: | | | | | | | |
| Acquisitions/additions | 76 | | | 6 | | | 65 | | | 147 | |
| Sales/redemptions/reductions | (31) | | | (14) | | | (11) | | | (56) | |
| Value adjustment through OCI | | | | (23) | | | | | | (23) | |
| Value adjustment through P&L | (25) | | | | | | 1 | | | (23) | |
| Translation differences and other | 8 | | | 12 | | | (4) | | | 16 | |
| Reclassification | (25) | | | 4 | | | (27) | | | (47) | |
| Balance as of December 31, 2024 | 288 | | | 242 | | | 102 | | | 631 | |
Philips Group
Other non-current financial assets in millions of EUR
| | | | | | | | | | | | | | | | | | | | | | | |
| Non-current financial assets at FVTP&L | | Non-current financial assets at FVTOCI | | Non-current financial assets at Amortized cost | | Total |
| Balance as of January 1, 2023 | 322 | | | 284 | | | 54 | | | 660 | |
| Changes: | | | | | | | |
| Acquisitions/additions | 71 | | | 14 | | | 20 | | | 105 | |
| Sales/redemptions/reductions | (33) | | | (14) | | | (11) | | | (58) | |
| | | | | | | |
| Value adjustment through OCI | | | | (17) | | | | | (17) | |
| Value adjustment through P&L | (39) | | | | | - | | | (39) | |
| Translation differences and other | (29) | | | (14) | | | (1) | | | (44) | |
| Reclassifications | (8) | | | 5 | | | 15 | | | 12 | |
| Balance as of December 31, 2023 | 284 | | | 258 | | | 77 | | | 619 | |
As of December 31, 2024, equity investments of EUR 222 million (2023: EUR 231 million) are accounted under the FVTOCI category based on the company's election at initial recognition mainly because such investments are neither held for trading purposes nor primarily for their increase in value and the elected presentation is considered to reflect the nature and purpose of the investment.
14 Other assets
Accounting policies
The company recognizes contract assets for revenue earned from installation services because the receipt of consideration is conditional on successful completion of the installation. Upon completion of the installation and acceptance by the customer, the amount recognized as contract assets is reclassified to trade receivables.
Other assets are measured at amortized cost minus any impairment losses.
Other non-current assets
Other non-current assets as of December 31, 2024, were EUR 118 million (2023: EUR 93 million), mainly includes prepaid expenses.
Other current assets
Other current assets as of December 31, 2024, totaled EUR 586 million (2023: EUR 500 million), primarily contract assets of EUR 349 million (2023: EUR 297 million) and prepaid expenses of EUR 238 million (2023: EUR 197 million) mainly related to Diagnosis & Treatment Businesses and Connected Care Businesses.
15 Inventories
Accounting policies
Inventories are stated at the lower of cost or net realizable value. The cost of inventories comprises all costs of purchase, costs of conversion and other costs incurred in bringing the inventories to their present location and condition. The costs of conversion of inventories include direct labor and fixed and variable production overheads, considering the stage of completion and the normal capacity of production facilities. Costs of idle facility and abnormal waste are expensed. The cost of inventories is determined using the first-in, first-out (FIFO) method. The write-down of inventories to net realizable value is included in cost of sales.
Accounting estimates and judgments
Inventory is reduced for the estimated losses due to obsolescence. This reduction is determined for groups of products based on sales in the recent past and/or expected future demand.
Inventories are summarized as follows:
Philips Group
Inventories in millions of EUR
| | | | | | | | | | | |
| 2023 | | 2024 |
| Raw materials and supplies | 1,309 | | 1,344 |
| Work in process | 552 | | 414 |
| Finished goods | 1,629 | | 1,439 |
| Inventories | 3,491 | | 3,198 |
In 2024, overall global inventories have operationally decreased by EUR 293 million with the increase in finished goods and decrease in other categories.
The write-down of inventories to net realizable value was EUR 230 million in 2024 and EUR 339 million in 2023.
16 Receivables
Accounting policies
Receivables are initially measured at fair value and are subsequently measured at amortized cost if held within a business model with the objective to collect the contractual cash flows or at fair value through OCI if held within a business model with the objective of both holding to collect contractual cash flows and selling. Receivables are measured less any impairment losses.
Receivables are derecognized when the company has transferred substantially all risks and rewards, which includes transactions in which the company enters into factoring transactions, or if the company does not retain control over the receivables.
Accounting estimates
Receivables are subject to impairment assessment, which involves estimating expected credit losses. Refer to Other financial assets for accounting policies on impairment of financial assets. Non-current receivables
Non-current receivables are associated mainly with customer financing in the Diagnosis & Treatment Businesses amounting (net of allowance) to EUR 81 million (2023: EUR 102 million), insurance receivables in the US amounting to EUR 33 million (2023: EUR 33 million) and income tax receivables amounting to EUR 36 million (2023: EUR 8 million).
Philips has leasing activities where it acts as lessor. In such arrangements, Philips provides the customer with a right to use of medical equipment in exchange for a series of payments. Residual values of assets under lease form an insignificant part of the carrying amount of those assets. Residual values are influenced by asset market prices and are therefore subject to management estimation. Residual values are at least reassessed on an annual basis, or more often when necessary. Reassessments are based on a combination of realization of assets sold, expert knowledge and judgment of local markets. In order to reduce residual value risk exposures there may be residual value guarantees or purchase options embedded in the customer contract. Credit risk for lease receivables is reviewed regularly and mitigated, for example, by retaining a security interest in the leased asset.
Current receivables
Current receivables of EUR 3,672 million (2023: EUR 3,733 million) as of December 31, 2024, included trade accounts receivable (net of allowance) of EUR 3,513 million (2023: EUR 3,546 million), accounts receivable other of EUR 134 million (2023: EUR 170 million), and accounts receivable from investments in associates of EUR 25 million (2023: EUR 18 million).
The trade accounts receivable, net, per segment are as follows:
Philips Group
Trade accounts receivable, net in millions of EUR
| | | | | | | | | | | |
| 2023 | | 2024 |
| Diagnosis & Treatment | 1,688 | | | 1,687 | |
| Connected Care | 1,105 | | | 1,064 | |
| Personal Health | 576 | | | 575 | |
| Other | 177 | | | 187 | |
| Trade accounts receivable, net | 3,546 | | | 3,513 | |
The aging analysis of trade accounts receivable, net, representing current and overdue but not fully impaired receivables, is as follows:
Philips Group
Aging analysis in millions of EUR
| | | | | | | | | | | |
| 2023 | | 2024 |
| Current | 3,132 | | | 3,154 | |
| Overdue 1-30 days | 117 | | | 141 | |
| Overdue 31-180 days | 234 | | | 194 | |
| Overdue more than 180 days | 63 | | | 24 | |
| Trade accounts receivable, net | 3,546 | | | 3,513 | |
The changes in the allowance for doubtful accounts receivable are as follows:
Philips Group
Allowance for accounts receivable in millions of EUR
| | | | | | | | | | | |
| 2023 | | 2024 |
| Balance as of January 1 | 226 | | | 216 | |
| Additions charged to expense | 27 | | | 112 | |
| Deductions from allowance¹ | (26) | | | (88) | |
| Transfer to assets held for sale | (1) | | | - | |
| Other movements | (10) | | | 5 | |
| Balance as of December 31 | 216 | | | 245 | |
1Write-offs for which an allowance was previously provided.
The allowance for doubtful accounts receivable has been primarily established for receivables that are past due. Additions and deductions in the allowance include the impact of changes in estimates for certain Connected Care receivables. The allowance presented also includes the allowance for Non-current customer finance receivables of EUR 8 million (2023: EUR 8 million). Other movements in the current period are mainly related to foreign currency valuations.
Included in the above balances as of December 31, 2024, are allowances for individually impaired receivables of EUR 239 million (2023: EUR 210 million).
17 Equity
Accounting policies
Common shares are classified as equity. Incremental costs directly attributable to the issuance of shares are recognized as a deduction from equity. Where the company repurchases the company’s equity share capital (treasury shares), the consideration paid, including any directly attributable incremental transaction costs (net of income taxes), is deducted from shareholders’ equity until such treasury shares are cancelled or reissued.
Where such treasury shares are subsequently reissued, any consideration received, net of any directly attributable incremental transaction costs and the related income tax effects, is included in shareholders’ equity.
Call options on own shares are treated as equity instruments.
Dividends are recognized as a liability in the period in which they are declared and approved by shareholders. The income tax consequences of dividends are recognized when a liability to pay the dividend is recognized.
Common shares
As of December 31, 2024, authorized common shares consist of 2 billion shares (December 31, 2023: 2 billion; December 31, 2022: 2 billion), and the issued and fully paid share capital consists of 939,939,384 common shares, each share having a par value of EUR 0.20 (December 31, 2023: 913,515,966; December 31, 2022: 889,315,082).
Preference shares
As a means to protect the company against (an attempt at) an unsolicited takeover or other attempt to exert (de facto) control of the company, the ‘Stichting Preferente Aandelen Philips’ has been granted the right to acquire preference shares in the company. As of December 31, 2024, no such right has been exercised and no preference shares have been issued. Authorized preference shares consist of 2 billion shares as of December 31, 2024 (December 31, 2023: 2 billion; December 31, 2022: 2 billion).
Options, restricted and performance shares
Under its share-based compensation plans, the company granted stock options on its common shares and other conditional rights to receive common shares in the future such as restricted shares and performance shares (refer to Share-based compensation). Treasury shares
In connection with the company’s share repurchase programs, shares which have been repurchased and are held in Treasury for the purpose of (i) delivery under share-based compensation plans upon exercise of options, or vesting of restricted or performance shares, and (ii) capital reduction, are accounted for as a reduction of shareholders’ equity. Treasury shares are recorded at cost, representing the market price on the acquisition date. When treasury shares are delivered by the company under its share-based compensation plans, such shares are removed from treasury shares on a first-in, first-out (FIFO) basis.
When treasury shares are delivered by the company upon exercise of options, the difference between the cost and the cash received is recorded in retained earnings. When treasury shares are delivered by the company upon vesting of restricted shares or performance shares (granted under the company’s share-based compensation plans), the difference between the market price of the shares and the cost is recorded in retained earnings, and the market price is recorded in capital in excess of par value.
The following table shows the movements in the outstanding number of shares over the last three years:
Philips Group
Outstanding number of shares
| | | | | | | | | | | | | | | | | |
| 2022 | | 2023 | | 2024 |
| Balance as of January 1 | 870,182,445 | | 881,480,527 | | 906,403,156 |
| Dividend distributed | 14,174,568 | | 39,334,938 | | 30,860,582 |
| Purchase of treasury shares | (5,080,693) | | (15,964,445) | | (13,718,391) |
| Delivery of treasury shares | 2,204,207 | | 1,552,136 | | 1,463,727 |
| Balance as of December 31 | 881,480,527 | | 906,403,156 | | 925,009,074 |
The following table reflects transactions that took place in relation to former and current share-based compensation plans:
Philips Group
Transactions related to share-based compensation plans
| | | | | | | | | | | | | | | | | |
| 2022 | | 2023 | | 2024 |
| Shares acquired | 2,142,445 | | 3,000,000 | | 9,281,227 |
| Average market price | EUR 31.76 | | EUR 41.59 | | EUR 21.88 |
| Amount paid | EUR 68 million | | EUR 125 million | | EUR 203 million |
| Shares delivered | 2,204,207 | | 1,552,136 | | 1,463,727 |
| Average price (FIFO) | EUR 35.16 | | EUR 34.59 | | EUR 37.14 |
| Cost of delivered shares | EUR 77 million | | EUR 54 million | | EUR 54 million |
| Total shares in treasury at year-end | 5,664,946 | | 7,112,810 | | 14,930,310 |
| Total cost | EUR 191 million | | EUR 262 million | | EUR 411 million |
| | | | | |
The following transactions took place for capital reduction purposes:
Philips Group
Transactions related to capital reduction
| | | | | | | | | | | | | | | | | |
| 2022 | | 2023 | | 2024 |
| Shares acquired | 2,938,248 | | 12,964,445 | | 4,437,164 |
| Average market price | EUR 36.61 | | EUR 37.25 | | EUR 37.56 |
| Amount paid | EUR 108 million | | EUR 483 million | | EUR 167 million |
| Cancellation of treasury shares (shares) | 8,758,455 | | 15,134,054 | | 4,437,164 |
| Cancellation of treasury shares (EUR) | EUR 299 million | | EUR 566 million | | EUR 167 million |
| Total shares in treasury at year-end | 2,169,609 | | | | |
| Total cost | EUR 83 million | | | | |
Share purchase transactions related to employee option and share plans, as well as transactions related to the reduction of share capital, involved a cash outflow of EUR 451 million in 2024. In 2024, we settled withholding tax liability for an amount of EUR 41 million relating to the dividend distribution in 2023 (EUR 11 million) and in 2024 (EUR 29 million).
Share repurchase methods for share-based remuneration plans and capital reduction purposes
Philips uses different methods to repurchase shares in its own capital: (i) share buyback repurchases in the open market via an intermediary; (ii) repurchase of shares via forward contracts for future delivery of shares; and (iii) the unwinding of call options on own shares. During 2024, Philips used methods (i) and (ii) to repurchase shares for share-based compensation plans and method (ii) to repurchase shares for capital reduction purposes.
Forward contracts to repurchase shares and open market repurchases of shares
For share-based compensation plans
On August 5, 2024, Philips announced that it would repurchase shares for an amount of up to EUR 125 million to cover certain of its obligations arising from its Long-Term Incentive plans. The repurchases were executed through a combination of open market purchases by an intermediary (in August 2024 acquiring 2.2 million shares which resulted in a EUR 60 million increase in retained earnings against treasury shares) and one forward contract for an amount of EUR 65 million to acquire 2.5 million shares with a settlement date in November 2026 and a weighted average forward price of EUR 26.40.
On June 14, 2023, Royal Philips announced that it will repurchase up to 7.1 million shares to cover certain of its obligations arising from its Long-Term Incentive and employee stock purchases plans. Under this program, Philips entered into one forward contract for an amount of EUR 138 million to acquire 7.1 million shares with settlement dates varying between November 2024 and November 2025 and a weighted average forward price of EUR 19.43. As of December 31, 2024, a total of 3.1 million shares under this program were acquired (settled in the fourth quarter of 2024). This resulted in a EUR 57 million increase in retained earnings against treasury shares.
On June 13, 2022, Royal Philips announced that it will repurchase up to 3.2 million shares to cover certain of its obligations arising from its Long-Term Incentive and employee stock purchases plans. Under this program, Philips entered into one forward contract for an amount of EUR 63 million to acquire 3.2 million shares with settlement dates in November 2024 and December 2024 and a weighted average forward price of EUR 19.75. As of December 31, 2024, all shares under this program were acquired (settled in the fourth quarter of 2024). This resulted in a EUR 63 million increase in retained earnings against treasury shares.
On January 29, 2020, Philips announced that it will repurchase up to 6 million shares to cover certain of its obligations arising from its Long-Term Incentive and employee stock purchase plans. Under this program, Philips entered into three forward contracts to acquire in total 5 million for an amount of EUR 174 million to acquire with settlement dates varying between October 2021 and November 2022 and a weighted average
forward price of EUR 34.85. On October 26, 2022, the original settlement date of two tranches entered into under this program (in total 1.75 million shares) has been extended from November 23, 2022 to November 2023, and November 2024, respectively. As of December 31, 2024, a total of 5 million shares (December 31, 2023: 4.3 million shares) under this program were acquired (settled in the fourth quarter of 2021, 2022, 2023, and 2024). This resulted in a EUR 23 million (2023: EUR 35 million) increase in retained earnings against treasury shares.
As of December 31, 2024, the remaining forward contracts to cover obligations under share-based compensation plans related to 6.5 million shares (December 31, 2023: 11.1 million shares) and amounted to EUR 142 million (December 31, 2023: EUR 224 million).
For capital reduction
On July 26, 2021, Philips announced a share buyback program for share cancellation purposes for an amount of up to EUR 1.5 billion. Consequently, in the third quarter of 2021 Philips entered into three forward contracts for an amount of EUR 731 million to acquire 20 million shares with settlement dates in 2022, 2023 and 2024 and a weighted average forward price of EUR 37.36. Philips executed the remainder of the program through open market purchases by an intermediary in the fourth quarter of 2021 (acquiring 21 million shares) and January 2022 (acquiring 0.8 million shares). This resulted in a EUR 781 million increase in retained earnings against treasury shares. As of December 31, 2024, Philips completed the program announced in 2021 and as a result a total of 19.6 million (December 31, 2023: 15.1 million) shares were acquired (in the fourth quarter of 2022, second, third and fourth quarters of 2023, and first and second quarters of 2024). This resulted in a EUR 167 million increase in retained earnings against treasury shares (2023: EUR 483 million including dividend adjustment).
As of December 31, 2024, there were no remaining forward contracts entered into for capital reduction purposes. As of December 31, 2023, the remaining forward contracts entered into for capital reduction purposes related to 4.4 million shares and amounted to EUR 167 million.
Shares cancellation
In June 2024, Philips completed the cancellation of 4.4 million of its common shares (with a cost price of EUR 167 million). The cancelled shares were acquired as part of Philips’ EUR 1.5 billion share repurchase program announced on July 26, 2021.
Dividend distribution
2024
In May 2024, Philips distributed a dividend of EUR 0.85 per common share, representing a total value of EUR 768 million (including costs). The dividend was distributed in the form of shares only, resulting in the issuance of 30,860,582 new common shares. Per share calculations have been adjusted retrospectively for all periods presented to reflect the issuance of shares for the share dividend in respect of 2023. Further reference is made to Earnings per share. A proposal will be submitted to the 2025 Annual General Meeting of Shareholders to pay a dividend of EUR 0.85 per common share, in shares or cash at the option of the shareholder, against retained earnings for 2024.
2023
In May 2023, Philips distributed a dividend of EUR 0.85 per common share, representing a total value of EUR 749 million (including costs). The dividend was distributed in the form of shares only, resulting in the issuance of 39,334,938 new common shares.
2022
In May 2022, Philips distributed a dividend of EUR 0.85 per common share, representing a total value of EUR 741 million (including costs). Shareholders could elect for a cash dividend or a share dividend. Approximately 45% of the shareholders elected for a share dividend, resulting in the issuance of 14,174,568 new common shares. The settlement of the cash dividend involved an amount of EUR 411 million (including costs).
Limitations in the distribution of shareholders’ equity
As of December 31, 2024, pursuant to Dutch law, certain limitations exist relating to the distribution of shareholders’ equity of EUR 3,254 million. Such limitations relate to common shares of EUR 188 million, as well as to legal reserves required by Dutch law included under retained earnings of EUR 1,052 million and unrealized currency translation differences of EUR 2,014 million. The unrealized gain related to cash flow hedges of EUR 1 million and unrealized loss related to fair value through OCI financial assets of EUR 90 million qualify as revaluation reserves and reduce the distributable amount due to the fact that these reserves are negative.
The legal reserves required by Dutch law of EUR 1,052 million included under retained earnings relates to any legal or economic restrictions on the ability of affiliated companies to transfer funds to the parent company in the form of dividends.
As of December 31, 2023, these limitations in distributable amounts were EUR 2,435 million and related to common shares of EUR 183 million, as well as to legal reserves required by Dutch law included under retained earnings of EUR 990 million and unrealized currency translation differences of EUR 1,263 million. The unrealized losses related to fair value through OCI financial assets of EUR 390 million and unrealized loss related to cash flow hedges of EUR 6 million qualify as a revaluation reserve and reduce the distributable amount due to the fact that this reserve is negative.
Non-controlling interests
Non-controlling interests relate to minority stakes held by third parties in consolidated group companies.
Capital management
Philips manages capital based upon the IFRS measures, net cash provided by operating activities and net cash used for investing activities as well as the non-IFRS measure net debt. The definition of this non-IFRS measure and a reconciliation to the IFRS measure is included below.
Net debt is defined as the sum of long and short-term debt minus cash and cash equivalents. Group equity is defined as the sum of shareholders’ equity and non-controlling interests. This measure is used by Philips Treasury management and investment analysts to evaluate financial strength and funding requirements. The Philips net debt position is managed with the intention of retaining the current strong investment grade credit rating. Furthermore, Philips’ dividend policy is aimed at dividend stability and a pay-out ratio of 40% to 50% of Adjusted income from continuing operations attributable to shareholders (reconciliation to the most directly comparable IFRS measure, Net income, is provided at the end of this note).
Philips Group
Composition of net debt and group equity in millions of EUR unless otherwise stated
| | | | | | | | | | | | | | | | | |
| 2022 | | 2023 | | 2024 |
| Long-term debt | 7,270 | | | 7,035 | | | 7,113 | |
| Short-term debt | 931 | | | 654 | | | 526 | |
| Total debt | 8,201 | | | 7,689 | | | 7,639 | |
| Cash and cash equivalents | 1,172 | | | 1,869 | | | 2,401 | |
| Net debt | 7,028 | | | 5,820 | | | 5,238 | |
| Shareholders’ equity | 13,249 | | | 12,028 | | | 12,006 | |
| Non-controlling interests | 34 | | | 33 | | | 37 | |
| Group equity | 13,283 | | | 12,061 | | | 12,043 | |
| Net debt : group equity ratio | 35:65 | | 33:67 | | 30:70 |
Adjusted income from continuing operations attributable to shareholders is not a recognized measure of financial performance under IFRS. The reconciliation of Adjusted income from continuing operations attributable to shareholders to the most directly comparable IFRS measure, Net income, is included in the following table.
Philips Group
Adjusted income from continuing operations attributable to shareholders1 in millions of EUR
| | | | | | | | | | | | | |
| 2022 | | 2023 | | 2024 |
| Net income | (1,605) | | | (463) | | | (698) | |
| Discontinued operations, net of income taxes | (13) | | | 10 | | | (142) | |
| Income from continuing operations | (1,618) | | | (454) | | | (840) | |
| Income from continuing operations attributable to non-controlling interests | (3) | | | (2) | | | (3) | |
| Income from continuing operations attributable to shareholders¹ | (1,622) | | | (456) | | | (843) | |
| Adjustments for: | | | | | |
| Amortization and impairment of acquired intangible assets | 363 | | | 290 | | | 392 | |
| Impairment of goodwill | 1,357 | | | 8 | | | |
| Restructuring costs and acquisition-related charges | 202 | | | 381 | | | 326 | |
| Other items: | 925 | | | 1,358 | | | 830 | |
| Respironics litigation provision | | | 575 | | | 984 | |
| Respironics insurance income | | | | | (538) | |
| Respironics consent decree charges | 250 | | | 363 | | | 113 | |
| Respironics field-action running costs | 210 | | | 224 | | | 133 | |
| Quality actions | 59 | | | 175 | | | 123 | |
| R&D project impairments | 134 | | | | | |
| Portfolio realignment charges | 109 | | | | | |
| Impairment of assets in S&RC | 39 | | | | | |
| Provision for public investigations tender irregularities | 60 | | | | | |
| Provision for a legal matter | | | 31 | | | |
| Investment re-measurement loss | | | 23 | | | |
| Loss (gain) on divestment of business | | | (35) | | | |
| Remaining items | 63 | | | 2 | | | 16 | |
| Net finance income/expenses | (4) | | | 18 | | | 23 | |
| Tax impact on adjusting items² | (376) | | | (450) | | | (370) | |
| Tax effect of derecognition of US deferred tax asset | | | | | 941 | |
Adjusted Income from continuing operations attributable to shareholders1 | 845 | | 1,148 | | 1,300 |
1Shareholders in this table refers to shareholders of Koninklijke Philips N.V.
2Includes deferred tax assets derecognized in the line below.
18 Debt
Accounting policies
Debt
Debt is initially measured at fair value net of directly attributable transaction costs. Subsequently, debt is measured at amortized cost using the effective interest rate method. Amortized cost is calculated by taking into account any discount or premium on acquisition and fees or costs that are an integral part of the effective interest rate. Debt is derecognized when the obligation under the liability is discharged, cancelled or has expired.
Lease liabilities
Lease liabilities are measured at the present value of the lease payments due over the lease term, generally discounted using the incremental borrowing rate. Lease liabilities are subsequently measured at amortized cost using the effective interest method. Lease liabilities are remeasured in case of modifications or reassessments of the lease.
Philips has a USD 2.5 billion Commercial Paper Program and a EUR 1 billion committed standby revolving credit facility that can be used for general group purposes. As of December 31, 2024, Philips did not have any loans outstanding under either facility. These facilities do not have a material adverse change clause, have no financial covenants and no credit-rating-related acceleration possibilities.
Philips established a Euro Medium-Term Note (EMTN) program, a framework that facilitates the issuance of notes for a total amount up to EUR 10 billion. In 2024, Philips issued EUR 700 million fixed rate notes due 2032 under the EMTN program for general corporate purposes, including the repayment of the 2025 EUR Bonds and other floating rate debt. As of December 31, 2024, Philips has EUR 3.7 billion (2023: EUR 3.3 billion) fixed rate notes outstanding under the EMTN program.
The provisions applicable to all USD-denominated corporate bonds issued by the company in March 2008 and March 2012 (due 2038 and 2042) contain a ‘Change of Control Triggering Event’. If the company would experience such an event with respect to a series of corporate bonds the company might be required to offer to purchase the bonds that are still outstanding at a purchase price equal to 101% of their principal amount, plus accrued and unpaid interest, if any. Furthermore, the conditions applicable to the EUR-denominated corporate bonds issued since 2018 contain a similar provision (‘Change of Control Put Event’). Upon the occurrence of such an event, the company might be required to redeem or purchase any of such bonds at their principal amount together with interest accrued. Philips’ outstanding long-term debt does not contain financial covenants.
As of December 31, 2024, debt includes forward contracts of EUR 142 million (nominal value) relating to the repurchase of shares to cover long-term incentive and employee stock purchase plans, with maturity dates in the fourth quarter of 2025 (EUR 77 million) and the fourth quarter of 2026 (EUR 65 million).
In 2023, Philips issued EUR 500 million of fixed rate notes under the company’s EMTN program that mature in 2031 and used the proceeds for general corporate purposes, including the repayment of EUR 500 million that was outstanding under the credit facility entered into in the fourth quarter of 2022. In 2023, Philips entered into a total amount of EUR 138 million forward contracts relating to the company’s long-term incentive plans. These forwards partly matured in the fourth quarter of 2024 (EUR 61 million) with the remainder maturing in 2025 (EUR 77 million). In addition, a total of EUR 125 million forward contracts relating to the Long-Term Incentive and employee stock purchase plans and EUR 481 million of forwards related to the share buyback program announced in 2021 matured throughout 2023.
Long-term debt
The following tables present information about the long-term debt outstanding, its maturity and average interest rates in 2024 and 2023.
Philips Group
Long-term debt in millions of EUR unless otherwise stated
| | | | | | | | | | | | | | | | | | | | | | | |
| 2024 |
| Amount outstanding | Current portion | Non-current portion | Between 1 and 5 years | Amount due after 5 years | Average remaining term (in years) | Average rate of interest |
| USD bonds | 1,408 | | 131 | | 1,276 | | 122 | | 1,154 | | 12.3 | 6.3 | % |
| EUR bonds | 4,917 | | | 4,917 | | 2,639 | | 2,278 | | 4.7 | 2.3 | % |
| Forward contracts | 148 | | 82 | | 66 | | 66 | | | 1.3 | 1.2 | % |
| Lease liabilities | 1,073 | | 219 | | 854 | | 506 | | 347 | | 3.8 | 3.7 | % |
| Bank borrowings | 1 | | 1 | | 1 | | 1 | | | 1.5 | 1.0 | % |
| Other long-term debt | - | | - | | - | | - | | - | | 3.2 | 1.2 | % |
| Long-term debt | 7,546 | | 434 | | 7,113 | | 3,333 | | 3,779 | | 5.9 | 3.2 | % |
Philips Group
Long-term debt in millions of EUR unless otherwise stated
| | | | | | | | | | | | | | | | | | | | | | | | | | | | | | | | | | | | | | | | | |
| 2023 |
| Amount outstanding | | Current portion | | Non-current portion | | Between 1 and 5 years | | Amount due after 5 years | | Average remaining term (in years) | | Average rate of interest |
| USD bonds | 1,325 | | | | | 1,325 | | | 240 | | | 1,085 | | | 13.3 | | 6.3 | % |
| EUR bonds | 4,569 | | | | | 4,569 | | | 2,335 | | | 2,234 | | | 5.1 | | 2.0 | % |
| Forward contracts | 396 | | | 321 | | | 76 | | | 76 | | | | | 0.8 | | 1.4 | % |
| Lease liabilities | 1,074 | | | 211 | | | 864 | | | 505 | | | 358 | | | 3.9 | | 3.1 | % |
| Bank borrowings | 203 | | | 1 | | | 201 | | | 201 | | | | | 1.2 | | 4.2 | % |
| Other long-term debt | - | | | - | | | - | | | - | | | - | | | 7.4 | | 1.2 | % |
| Long-term debt | 7,568 | | | 532 | | | 7,035 | | | 3,357 | | | 3,678 | | | 6.0 | | 2.9 | % |
Bonds
The following table presents the amount outstanding and effective rate of bonds.
Philips Group
Unsecured Bonds in millions of EUR unless otherwise stated
| | | | | | | | | | | | | | | | | |
| Effective rate | | 2023 | | 2024 |
| Unsecured EUR Bonds | | | | | |
| Due 30/03/2025; 1 3/8% | 1.509 | % | | 346 | | | |
| Due 22/05/2026; 1/2% | 0.608 | % | | 750 | | | 750 | |
| Due 05/05/2027; 1 7/8% | 2.049 | % | | 750 | | | 750 | |
| Due 02/05/2028; 1 3/8% | 1.523 | % | | 500 | | | 500 | |
| Due 05/11/2029; 2 1/8% | 2.441 | % | | 650 | | | 650 | |
| Due 30/03/2030; 2% | 2.128 | % | | 500 | | | 500 | |
| Due 08/09/2031; 4 2/8% | 4.330 | % | | 500 | | | 500 | |
| Due 31/05/2032; 3 3/4% | 4.043 | % | | | | 700 | |
| Due 05/05/2033; 2 5/8% | 2.710 | % | | 600 | | | 600 | |
| Unsecured USD Bonds | | | | | |
| Due 15/05/2025; 7 3/4% | 7.429 | % | | 49 | | | 52 | |
| Due 15/05/2025; 7 1/8% | 6.794 | % | | 75 | | | 79 | |
| Due 01/06/2026; 7 1/5% | 6.885 | % | | 114 | | | 121 | |
| Due 03/11/2038; 6 7/8% | 7.210 | % | | 657 | | | 697 | |
| Due 15/03/2042; 5% | 5.273 | % | | 452 | | | 480 | |
| Adjustments¹ | | | (47) | | | (55) | |
| Unsecured Bonds | | | 5,894 | | | 6,324 | |
1Adjustments related to both EUR and USD bonds and concern bond discounts, premium and transaction costs.
Leases
The following table presents a reconciliation between the total of future minimum lease payments and their present value.
Philips Group
Lease liabilities in millions of EUR
| | | | | | | | | | | | | | | | | | | | | | | | | | | | | | | | | | | |
| 2023 | | 2024 |
| Future minimum lease payments | | Interest | | Present value of minimum lease payments | | Future minimum lease payments | | Interest | | Present value of minimum lease payments |
| Less than one year | 239 | | | 28 | | | 211 | | | 255 | | | 35 | | | 219 | |
| Between one and five years | 572 | | | 67 | | | 505 | | | 592 | | | 85 | | | 506 | |
| More than five years | 388 | | | 30 | | | 358 | | | 385 | | | 38 | | | 347 | |
| Lease liabilities | 1,200 | | | 125 | | | 1,074 | | | 1,232 | | | 159 | | | 1,073 | |
Short-term debt
Philips Group
Short-term debt in millions of EUR
| | | | | | | | | | | |
| 2023 | | 2024 |
| Short-term bank borrowings | 122 | | | 92 | |
| Current portion of long-term debt | 532 | | | 434 | |
| Short-term debt | 654 | | | 526 | |
During 2024, the weighted average interest rate on the bank borrowings was 9.3% (2023: 8.6%). This increase was mainly driven by higher interest rate environments across various countries globally.
19 Provisions
Accounting policies
A provision is a liability of uncertain timing or amount. Provisions are recognized if, as a result of a past event, the company has a present legal or constructive obligation, it is probable that an outflow of economic benefits will be required to settle the obligation and the amount can be estimated reliably. Provisions are measured at the present value of the expenditures expected to be required to settle the obligation using a pre-tax discount rate that reflects current market assessments of the time value of money. The increase in the provision due to passage of time (accretion) is recognized as interest expense.
Restructuring-related provisions
Provisions for severance and termination benefits are recognized for those costs only when the company has a detailed formal plan for the restructuring and has raised a valid expectation with those affected that it will carry out the restructuring by starting to implement that plan or announcing its main features to those affected by it. Before a provision is established, the company recognizes any impairment loss on the assets associated with the restructuring.
Accounting estimates and judgments
By their nature, the recognition of provisions requires estimates and assumptions regarding the timing and the amount of outflow of resources. The main estimates include:
•Product warranty provisions – the provisions for assurance-type product warranty reflect the estimated costs of replacement and free-of-charge services that will be incurred by the company with respect to products sold and include costs to execute quality remediation and related field actions (including the Respironics field action). These require management to make estimates and assumptions about items such as quantities and the portion of products to be remediated through replacement, repair or (partial) refund.
•Environmental provisions – provisions for environmental remediation can change significantly due to the emergence of additional information regarding the extent or nature of the contamination, the need to utilize alternative technologies, actions by regulatory authorities as well as changes in judgments and discount rates. The impact of climate change is also considered when assessing whether Philips has a present legal or constructive obligation, particularly in relation to fines, penalties and commitments to reduce greenhouse gas emissions.
•Legal provisions – provisions for legal claims and investigations reflect the best estimate of the outflow of resources, supported by internal and external legal counsel, when it is probable that such outflow of resources will be required to settle an obligation.
•Contingent consideration provisions – the provision for contingent consideration reflects the fair value of the expected payment to former shareholders of an acquired company for the exchange of control if specified future events occur or conditions are met, such as the achievement of certain regulatory milestones or the achievement of certain commercial milestones. The provision for contingent consideration can change significantly due to changes in the estimated achievement of milestones and changes in discount rates. Changes in fair value of the contingent consideration liability are reflected in other business income (expenses).
Philips Group
Provisions in millions of EUR
| | | | | | | | | | | | | | | | | | | | | | | | | | | | | | | | | | | | | | | | | | | | | | | |
| Post-employment benefits | | Product warranty | | Environmental | | Restructuring-related | | Legal | | Contingent consideration | | Other | | Total |
| Current | | | | 624 | | | 22 | | | 102 | | | 477 | | | 57 | | | 181 | | | 1,463 | |
| Non-current | 558 | | | 67 | | | 80 | | | 14 | | | 10 | | | 58 | | | 248 | | | 1,035 | |
| Balance as of December 31, 2023 | 558 | | | 692 | | | 102 | | | 116 | | | 487 | | | 115 | | | 429 | | | 2,498 | |
| | | | | | | | | | | | | | | |
| Additions | 81 | | | 439 | | | 9 | | | 131 | | | 1,015 | | | 5 | | | 185 | | | 1,865 | |
| Utilizations | (76) | | | (507) | | | (15) | | | (127) | | | (477) | | | (9) | | | (124) | | | (1,336) | |
| Releases | (5) | | | (15) | | | - | | | (26) | | | (28) | | | (3) | | | (35) | | | (113) | |
| Accretion | | | | | | 5 | | | | | 38 | | | 3 | | | (1) | | | 45 | |
| | | | | | | | | | | | | | | |
| Changes in discount rate | | | | | | (7) | | | | | | | | | - | | | (8) | |
| Translation differences and other | 2 | | | (24) | | | 4 | | | (1) | | | 44 | | | 3 | | | (8) | | | 21 | |
| Total change | 3 | | | (107) | | | (5) | | | (23) | | | 592 | | | (2) | | | 16 | | | 474 | |
| | | | | | | | | | | | | | | |
| Current | | | | 522 | | | 20 | | | 77 | | | 1,066 | | | 61 | | | 229 | | | 1,977 | |
| Non-current | 560 | | | 63 | | | 76 | | | 16 | | | 13 | | | 52 | | | 216 | | | 996 | |
| Balance as of December 31, 2024 | 560 | | | 585 | | | 96 | | | 94 | | | 1,079 | | | 113 | | | 446 | | | 2,972 | |
Philips Group
Provisions in millions of EUR
| | | | | | | | | | | | | | | | | | | | | | | | | | | | | | | | | | | | | | | | | | | | | | | |
| Post-employment benefits | | Product
warranty | | Environmental | | Restructuring-related | | Legal | | Contingent
consideration | | Other | | Total |
| Current | | | | 653 | | | 20 | | | 134 | | | 74 | | | 23 | | | 112 | | | 1,018 | |
| Non-current | 546 | | | 80 | | | 83 | | | 6 | | | 14 | | | 89 | | | 279 | | | 1,097 | |
| Balance as of December 31, 2022 | 546 | | | 733 | | | 104 | | | 140 | | | 89 | | | 113 | | | 390 | | | 2,115 | |
| | | | | | | | | | | | | | | |
| Additions | 112 | | | 553 | | | 18 | | | 263 | | | 644 | | | 24 | | | 223 | | | 1,836 | |
| Utilizations | (91) | | | (553) | | | (14) | | | (219) | | | (235) | | | (20) | | | (134) | | | (1,266) | |
| Releases | (10) | | | (20) | | | (2) | | | (67) | | | (10) | | | (7) | | | (45) | | | (159) | |
| Accretion | | | | | | | 5 | | | | | | 23 | | | 1 | | | (3) | | | 25 | |
| Acquisitions | | | | | | | | | | | | | | | | 6 | | | | | | 6 | |
| Changes in discount rate | | | | | | | (6) | | | | | | | | | | | | | | | (6) | |
| Translation differences and other | - | | | (22) | | | (3) | | | (2) | | | (23) | | | (2) | | | (1) | | | (53) | |
| Total change | 12 | | | (42) | | | (2) | | | (24) | | | 399 | | | 2 | | | 39 | | | 383 | |
| | | | | | | | | | | | | | | |
| Current | | | | 624 | | | 22 | | | 102 | | | 477 | | | 57 | | | 181 | | | 1,463 | |
| Non-current | 558 | | | 67 | | | 80 | | | 14 | | | 10 | | | 58 | | | 248 | | | 1,035 | |
| Balance as of December 31, 2023 | 558 | | | 692 | | | 102 | | | 116 | | | 487 | | | 115 | | | 429 | | | 2,498 | |
Post-employment benefits
Product warranty provisions
Product warranty provisions include costs to execute quality remediation and related field actions, as well as the field action provision in connection with the Philips Respironics voluntary recall notification which is explained separately below.The company expects the provisions to be utilized mainly within 2025.
Additions in 2024 include quality remediation and related field actions of EUR 137 million and EUR 139 million in the Diagnosis & Treatment and Connected Care segments, respectively, mainly for the following matters:
Trilogy EVO and Trilogy EV300
In September 2024, Philips issued a field safety notice to customers of its Trilogy EVO and Trilogy EV300 ventilators, regarding a potential contamination issue when the ventilator is used in combination with in-line nebulizers. This notification was updated in November 2024 with additional customer instructions. Philips is in the process of commencing the necessary remediation actions.
Respironics field-action provision
On June 14, 2021, Philips subsidiary Philips Respironics initiated a voluntary recall notification in the US and field safety notice outside the US for certain sleep and respiratory care products related to the polyester-based polyurethane (PE-PUR) sound abatement foam in these devices. The remediation is progressing globally. The total number of units expected to be remediated as of December 31, 2024 is 5.1 million (2023: 5.6 million) devices globally. The decrease in units is mainly due to current insights regarding the number of units that are not expected to be returned to Philips or where key data collection efforts to perform remediation have been exhausted.
Philips has recognized a provision based on Philips’ best estimate of the costs to repair, replace or refund devices, subject to the Respironics field action. The provision is related to the cost to repair, replace or provide financial compensation for affected devices and includes, among others, the costs for the remaining production, the cost of intensified communication with physicians and patients, material costs, labor cost and logistics, as well as costs relating to financial compensation provided to customers under the field action. The provision does not include any product liability costs or other claims.
Philips Group
Respironics field-action provision in millions of EUR
| | | | | | | | |
| 2023 | 2024 |
| Balance as of January 1 | 390 | 334 |
| Additions | 240 | 30 |
| Utilizations | (285) | (220) |
| Translation differences and other | (10) | (14) |
| Balance as of December 31 | 334 | 130 |
Utilizations for the year reflect the costs incurred in executing the remediation during the year.
The completion of the field action continues to be subject to uncertainty, which requires management to make estimates and assumptions about items such as quantities and the portion to be replaced, repaired and subject to financial compensation. An increase in the assumption for the financial compensation portion by 10 percentage points could have the effect of increasing the provision by an estimated EUR 18 million. Actual outcomes in future periods may differ from these estimates and affect the company’s results of operations, financial position and cash flows.
Further to the above, field-action running remediation costs during the year of EUR 133 million (2023: EUR 224 million, 2022: EUR 210 million), such as testing, external advisory and regulatory response and additional right-of-return and warranty provisions, have been incurred.
Philips and its affiliates are defendants in a number of consumer class action lawsuits from users of the affected devices and a number of individual personal injury and other compensation claims. For legal matters including claims refer to the legal provisions section of this note as well as Contingencies. Environmental provisions
The environmental provisions include accrued costs recorded with respect to environmental remediation in various countries. In the US, subsidiaries of the company have been named as potentially responsible parties in state and federal proceedings for the clean-up of certain sites.
The additions and the releases of the provisions originate from additional insights in relation to factors like the estimated cost of remediation, changes in regulatory requirements and efficiencies in completion of various site work phases.
Approximately EUR 65 million of the long-term provision is expected to be utilized after one to five years, with the remainder after five years. For more details on the environmental remediation refer to Contingencies. Restructuring-related provisions
Philips Group
Restructuring-related provisions in millions of EUR
| | | | | | | | | |
| December 31, 2023 | | December 31, 2024 |
| Diagnosis & Treatment | 36 | | | 34 | |
| Connected Care | 18 | | | 19 | |
| Personal Health | 7 | | | 15 | |
| Other | 56 | | | 26 | |
| Philips Group | 116 | | | 94 | |
In 2024, the most significant restructuring projects impacted segments Other and Connected Care and mainly took place in the US and the Netherlands. The restructuring comprised mainly product portfolio rationalization and the reorganization of global support functions. The company expects the provisions to be utilized mainly within the next year.
In 2024, Philips continued general productivity actions aimed at simplifying the organization as part of its multi-year plan designed to create value with sustainable impact. This included the further reduction of 2,000 roles, thereby completing the planned reduction of 10,000 roles globally across the organization by 2025 ahead of schedule. Severance and termination-related costs of EUR 140 million were recorded in 2023.
Legal provisions
The company and certain of its group companies and former group companies are involved as a party in legal proceedings, including regulatory and other governmental proceedings.
Additions mainly relate to the legal provision in connection with the settlement of Respironics personal injury and medical monitoring claims in the US of EUR 982 million (discounted). Under the settlement Philips Respironics has agreed to pay a total of USD 1.1 billion. Most of the related payments are expected in 2025. In the first half of 2024 Philips Respironics recorded insurance income of EUR 538 million in connection with the agreement with insurers to partially reimburse the Respironics recall related product liability claims. This amount was paid in full to the company in 2024.
Utilizations of EUR 477 million mainly relate to the economic loss class action settlement in the US that was paid in 2024.
For details of other legal matters, including regulatory and other governmental proceedings, refer to Contingencies. The company expects the provisions to be utilized mainly within the next three years.
Contingent consideration provisions
There is no material movement in 2024 and approximately EUR 21 million of the long-term provision is expected to be utilized within the next three years, with the remainder after four years.
Other provisions
The main elements of other provisions are:
Philips Group
Other provisions in millions of EUR unless otherwise stated
| | | | | | | | | | | |
| 2023 | | 2024 |
| Other long-term employee benefits | 77 | | | 80 | |
| Self-insurance | 63 | | | 60 | |
| Non-income taxes / social security | 51 | | | 48 | |
| Rights of return | 39 | | | 44 | |
| Decommissioning costs | 34 | | | 37 | |
| Onerous contracts | 76 | | | 66 | |
| Remaining | 89 | | | 111 | |
| Balance as of December 31 | 429 | | | 446 | |
Onerous contracts reflect non-cancellable commitments on supplies for which no future demand or alternative usage has been identified.
Remaining provisions relate to a variety of positions, for example provision for disability of employees and provision for royalty obligations.
Releases in 2023 and 2024 are due to the reassessment of the positions in other provisions throughout the year.
The company expects the other provisions to be utilized mainly within the next five years.
20 Post-employment benefits
Accounting policies
Defined contribution plans
A defined contribution plan is a post-employment benefit plan for which the company pays fixed contributions into a separate entity and will have no legal or constructive obligation to pay further amounts. Obligations for contributions to defined contribution pension plans are recognized as an employee benefit expense in the Consolidated statements of income in the periods during which services are rendered by employees.
Defined benefit plans
A defined benefit plan is a post-employment benefit plan that is not a defined contribution plan. Defined benefit plans define an amount of pension benefit that an employee will receive after retirement. That pension benefit typically depends on several factors such as years of service, age and salary.
The net pension asset or liability recognized in the Consolidated balance sheets in respect of defined benefit plans is the fair value of plan assets less the present value of the projected defined benefit obligation at the balance sheet date. The defined benefit obligation is calculated annually by qualified actuaries using the projected unit credit method. Recognized assets are limited to the present value of any reductions in future contributions or any future refunds. The net pension liability is presented as a long-term provision; no distinction is made for the short-term portion.
For the company’s major plans, a full discount rate curve of high-quality corporate bonds is used to determine the defined benefit obligation, where available. The curves are based on the Mercer Yield Curve methodology, which uses data of corporate bonds rated AA or equivalent. For the other plans the Mercer Yield Curve/Mercer Methodology has also been used taking into account the cash flows as much as possible in case there is a deep market in corporate bonds. For plans in countries without a deep corporate bond market, the discount rate is based on government bonds and the plan’s maturity.
Pension costs with respect to defined benefit plans primarily represent the increase of the actuarial present value of the obligation for post-employment benefits based on employee service during the year and the interest on the net recognized asset or liability with respect to employee service in previous years.
Remeasurements of the net defined benefit asset or liability comprise actuarial gains and losses, the return on plan assets (excluding interest) and the effect of the asset ceiling (excluding interest). The company recognizes all remeasurements in Other comprehensive income.
Past service costs arising from the introduction of a change to the benefit payable under a plan or a significant reduction of the number of employees covered by a plan (curtailment) are recognized in full in the Consolidated statements of income.
Short-term employee benefit obligations are measured on an undiscounted basis and are expensed as the related service is provided. The company recognizes a liability and an expense for bonuses and incentives based on a formula that takes into consideration the profit attributable to the company’s shareholders after certain adjustments.
The company’s net obligation with respect to other long-term employee benefits is the amount of future benefit that employees have earned in return for their service in the current and prior periods, such as jubilee entitlements. That benefit is discounted to determine its present value. Remeasurements are recognized in the Consolidated statements of income in the period in which they arise.
Further information on other long-term employee benefits can be found in Provisions in the Other provisions section. Accounting estimates and judgments
To make the actuarial calculations for the valuation of defined benefit obligations, assumptions are needed for interest rates, healthcare cost increases, future pension increases, life expectancy and employee turnover rates. The actuarial calculations are made by external actuaries based on inputs from observable market data, such as corporate bond returns and yield curves to determine the discount rates to apply, mortality tables to determine life expectancy and inflation rates to determine future salary and pension growth assumptions.
Employee post-employment benefit plans have been established in many countries in accordance with the legal requirements, customs and the local practice in the countries involved. The larger part of post-employment benefits are company pension plans, of which some are funded and some are unfunded. All funded post-employment benefit plans are considered to be related parties.
Most employees who take part in a company pension plan are covered by defined contribution (DC) pension plans. The main DC plans are in the Netherlands and the US. The company also sponsors a number of defined benefit (DB) pension plans. The benefits provided by these plans are based on employees’ years of service and compensation levels.
The company also sponsors a limited number of DB retiree medical plans. The benefits provided by these plans typically cover a part of the healthcare costs after retirement. None of these plans are individually significant to the company and are therefore not further separately disclosed.
The larger funded DB and DC plans are governed by independent Trustees who have a legal obligation to protect the interests of all plan members and operate under the local regulatory framework.
The DB plans in Germany and the US make up most of the defined benefit obligation (DBO) and the net position. The company also has DB plans in the rest of the world; however these are individually not significant to the company and do not have a significantly different risk profile that would warrant separate disclosure.
The adjacent table provides a breakdown of the present value of the funded and unfunded DBO, the fair value of plan assets and the net position in Germany, the US and in other countries. The table also provides the value of reimbursement rights.
Philips Group
Post-employment benefits in millions of EUR
| | | | | | | | | | | | | | | | | | | | | | | | | | | | | | | | | | | | | | | | | | | | | | | |
| Germany | | United States | | Other countries | | Total |
| 2023 | | 2024 | | 2023 | | 2024 | | 2023 | | 2024 | | 2023 | | 2024 |
| Present value of funded DBO | (511) | | | (531) | | | (404) | | | (416) | | | (182) | | | (205) | | | (1,097) | | | (1,152) | |
| Present value of unfunded DBO | (253) | | | (242) | | | (118) | | | (131) | | | (137) | | | (134) | | | (508) | | | (507) | |
| Total present value of DBO | (764) | | | (773) | | | (522) | | | (547) | | | (319) | | | (339) | | | (1,605) | | | (1,659) | |
| Fair value of plan assets | 481 | | | 496 | | | 442 | | | 465 | | | 166 | | | 189 | | | 1,089 | | | 1,150 | |
| Asset ceiling | | | | | | | | | | | (1) | | | | | (1) | |
| Net position | (283) | | | (277) | | | (80) | | | (82) | | | (153) | | | (151) | | | (516) | | | (510) | |
| | | | | | | | | | | | | | | |
| Value of reimbursement rights | | | | | | | | | 8 | | | 7 | | | 8 | | | 7 | |
The classification of the net position is as follows:
Philips Group
Classification net position in millions of EUR
| | | | | | | | | | | | | | | | | | | | | | | | | | | | | | | | | | | | | | | | | | | | | | | |
| Germany | | United States | | Other countries | | Total |
| 2023 | | 2024 | | 2023 | | 2024 | | 2023 | | 2024 | | 2023 | | 2024 |
| Total asset for plans in a surplus | - | | | - | | | 39 | | | 49 | | | 2 | | | 1 | | | 41 | | | 50 | |
| Total liability for plans in a deficit | (283) | | | (277) | | | (118) | | | (131) | | | (156) | | | (152) | | | (558) | | | (560) | |
| Net position | (283) | | | (277) | | | (80) | | | (82) | | | (153) | | | (151) | | | (516) | | | (510) | |
Germany
The company has several DB plans in Germany, some of which are unfunded. The plan assets of the funded DB plans in Germany are held in a legally separate pension trust.
Due to the relatively high level of social security in Germany, the company’s pension plans mainly provide benefits for the higher earners. The plans are open for future pension accrual. Indexation is mandatory due to legal requirements. Some of the German plans have a DC design, but are accounted for as DB plans due to a legal minimum return requirement.
Company pension commitments in Germany are largely protected against employer bankruptcy via the “Pensions-Sicherungs-Verein” which charges a fee to all German companies providing pension promises.
Philips is one of the sponsors of Philips Pensionskasse VVaG in Germany, which is a multi-employer plan. The plan is classified and accounted for as a DC plan.
United States
The US DB pension plans are closed plans without future pension accrual. For the funding of any deficit in the US plan the Group adheres to the minimum funding requirements of the US Pension Protection Act.
The assets of the US funded pension plans are in Trusts governed by fiduciaries. The non-qualified pension plans that cover accrual above the maximum salary of the funded qualified plan are unfunded.
The company’s qualified pension commitments in the US are covered via the Pension Benefit Guaranty Corporation, which charges a fee to US companies providing DB pension plans. The fee is also dependent on the amount of unfunded vested liabilities.
Philips has announced to plan participants the intent to fully terminate the US qualified defined benefit pension plans in 2025. The announcements made did not impact the accounting for these plans during 2024 and the anticipated settlement, if and when completed, is not expected to have a material impact to the company’s results or cash flows in 2025.
Risks related to DB plans
DB plans expose the company to various demographic and economic risks such as longevity risk, investment risks, currency and interest rate risk and in some cases inflation risk. The latter plays a role in the assumed wage increase but more importantly in some countries where indexation of pensions is mandatory.
The company has an active de-risking strategy in which it constantly looks for opportunities to reduce the risks associated with its DB plans. Liability-driven investment strategies, lump sum cash-out options, buy-ins, buy-outs and a change to DC are examples of the strategy.
Investment policy in the largest pension plans
Plan assets are managed in legally separate pension trusts, primarily overseen by independent trustees, who bear full responsibility for and have complete discretion over the investment strategy for these plan assets. The plan assets of the Philips pension plans are invested in well-diversified portfolios. For most plans, the interest rate sensitivity of the fixed income portfolio is closely aligned with that of the plan’s pension liabilities. Contributions from the sponsoring company are primarily directed toward increasing the fixed income allocation. Additionally, in most investment strategies, any structural improvement in the plan's funded ratio over time is used to further reduce the interest rate mismatch between the plan assets and the pension liabilities.
Summary of pre-tax costs for post-employment benefits and reconciliations
The adjacent table contains the total of current and past service costs, administration costs and settlement results as included in Income from operations and the interest cost as included in Financial expenses.
Philips Group
Pre-tax costs for post-employment benefits in millions of EUR
| | | | | | | | | | | | | | | | | |
| 2022 | | 2023 | | 2024 |
| Defined benefit plans | 50 | | | 47 | | | 43 | |
| - included in income from operations | 39 | | | 25 | | | 23 | |
| - included in financial expense | 10 | | | 21 | | | 20 | |
| - included in Discontinued operations | | | | | |
| Defined contribution plans | 400 | | | 376 | | | 365 | |
| - included in income from operations | 400 | | | 376 | | | 365 | |
| - included in Discontinued operations | | | | | |
| Post-employment benefits costs | 449 | | | 423 | | | 408 | |
Summary of the reconciliations for the DBO and plan assets
The adjacent tables contain the reconciliations for the DBO and plan assets.
Philips Group
Defined benefit obligations in millions of EUR
| | | | | | | | | | | |
| 2023 | | 2024 |
| Balance as of January 1 | 1,621 | | | 1,605 | |
| Service cost | 32 | | | 29 | |
| Interest cost | 71 | | | 65 | |
| Employee contributions | 3 | | | 4 | |
| Actuarial (gains) / losses | | | |
| - demographic assumptions | | | |
| - financial assumptions | 48 | | | 20 | |
| - experience adjustment | 2 | | | 9 | |
| (Negative) past service cost | (9) | | | (7) | |
| Settlements | 2 | | | 1 | |
| Benefits paid from plan | (104) | | | (63) | |
| Benefits paid directly by employer | (39) | | | (36) | |
| Translation differences and other | (22) | | | 32 | |
| Balance as of December 31 | 1,605 | | | 1,659 | |
Philips Group
Plan assets in millions of EUR
| | | | | | | | | | | |
| 2023 | | 2024 |
| Balance as of January 1 | 1,122 | | | 1,089 | |
| Interest income on plan assets | 49 | | | 45 | |
| Admin expenses paid | (1) | | | (1) | |
| Return on plan assets excluding interest income | 23 | | | 13 | |
| Employee contributions | 3 | | | 4 | |
| Employer contributions | 14 | | | 30 | |
| Settlements | | | |
| Benefits paid from plan | (104) | | | (63) | |
| Translation differences and other | (17) | | | 33 | |
| Balance as of December 31 | 1,089 | | | 1,150 | |
The past service costs in 2024 mainly relate to the retiree medical plans in Brazil and the pension plan in Switzerland. The past service costs in 2023 mainly relate to the retiree medical plans in Brazil.
Plan assets allocation
The asset allocation in the company’s DB plans as of December 31, 2024, was as follows:
Philips Group
Plan assets allocation in millions of EUR
| | | | | | | | | | | |
| 2023 | | 2024 |
| Assets quoted in active markets | | | |
| - Debt securities | 513 | | | 460 | |
| - Equity securities | | | 12 | |
- Other1 | 182 | | | 431 | |
| | | |
| Assets not quoted in active markets | | | |
| - Debt securities | | | | |
| - Equity securities | 31 | | | | |
| - Other¹ | 363 | | | 247 | |
| Total assets | 1,089 | | | 1,150 | |
1Other assets are primarily composed of cash and cash equivalents, real estate, investment funds, and assets managed by insurance companies.
The plan assets in 2024 contain 22% (2023: 36%) unquoted plan assets. Plan assets in 2024 do not include property occupied by or financial instruments issued by the company.
Assumptions
The mortality tables used for the company’s largest DB plans are:
Germany: Heubeck-Richttafeln 2018 Generational, assuming 93% of mortality rates for male retirees between ages 60 and 85.
US: PRI-2012 Generational with MP2021 improvement scale + white collar adjustment.
The weighted averages of the assumptions used to calculate the DBO were as follows:
Philips Group
Assumptions used for defined benefit obligations in %
as of December 31,
| | | | | | | | | | | | | | | | | | | | | | | | | | | | | | | | | | | | | | | | | | | | | | | |
| Germany | | United States | | Other countries | | Total |
| 2023 | | 2024 | | 2023 | | 2024 | | 2023 | | 2024 | | 2023 | | 2024 |
| Discount rate | 3.7 | % | | 3.3 | % | | 5.0 | % | | 5.1 | % | | 4.9 | % | | 4.2 | % | | 4.3 | % | | 4.0 | % |
| Inflation rate | 2.0 | % | | 2.0 | % | | 2.3 | % | | 2.3 | % | | 2.5 | % | | 2.2 | % | | 2.2 | % | | 2.1 | % |
| Salary increase | 2.8 | % | | 2.8 | % | | 0.0 | % | | 0.0 | % | | 4.3 | % | | 4.4 | % | | 3.0 | % | | 3.1 | % |
Sensitivity analysis
The following table illustrates the approximate impact on the DBO from movements in key assumptions. The DBO was recalculated using a change in the assumptions of 1% which overall is considered a reasonably possible change. The impact on the DBO because of changes in discount rate is normally accompanied by offsetting movements in plan assets, especially when using matching strategies.
The average duration in years of the DBO of the DB plans is 10 (Germany: 11, US: 8, and other countries: 10) as of December 31, 2024 (2023: 10).
Philips Group
Sensitivity of key assumptions in millions of EUR
| | | | | | | | | | | |
| 2023 | | 2024 |
| Increase | | | |
| Discount rate (1% movement) | (123) | | | (123) | |
| Pension increase (1% movement) | 60 | | | 60 | |
| Salary increase (1% movement) | 12 | | | 14 | |
| Longevity¹ | 32 | | | 34 | |
| Decrease | | | |
| Discount rate (1% movement) | 147 | | | 150 | |
| Pension increase (1% movement) | (52) | | | (52) | |
| Salary increase (1% movement) | (11) | | | (12) | |
| Longevity¹ | (22) | | | (24) | |
1The mortality table (i.e. longevity) also impacts the DBO. The above sensitivity table illustrates the impact on the DBO of a further 10% decrease / increase in the assumed rates of mortality for the company’s major plans. A 10% decrease / increase in assumed mortality rates equals a change of life expectancy by 0.5 - 1 year.
Cash flows and costs in 2025
Cash outflows in relation to post-employment benefits are estimated to amount to EUR 421 million in 2025, consisting of:
•EUR 24 million employer contributions to DB plans (Germany: EUR 11 million, US: EUR 0 million, other countries: EUR 13 million);
•EUR 45 million cash outflows in relation to DB plans (Germany: EUR 21 million, US: EUR 10 million, Other Countries: EUR 14 million); and
•EUR 352 million employer contributions to DC plans (Netherlands: EUR 142 million, US: EUR 144 million, Other Countries: EUR 66 million).
The service and administration cost for 2025 is expected to amount to EUR 33 million for DB plans. The net interest cost for 2025 for the DB plans is expected to amount to EUR 18 million. The cost for DC pension plans in 2025 is equal to the expected DC cash flow.
21 Accrued liabilities
Accounting policies
Accrued liabilities are initially measured at fair value and subsequently at amortized cost and are derecognized when the obligation under the liability is discharged, cancelled or has expired.
Accrued liabilities are summarized as follows:
Philips Group
Accrued liabilities in millions of EUR
| | | | | | | | | | | |
| 2023 | | 2024 |
| Personnel-related costs: | | | |
| - Salaries and wages | 791 | | | 601 | |
| - Accrued holiday entitlements | 96 | | | 95 | |
| - Other personnel-related costs | 93 | | | 101 | |
| Fixed-asset-related costs: | | | |
| - Gas, water, electricity, rent and other | 43 | | | 41 | |
| Communication and IT costs | 61 | | | 55 | |
| Distribution costs | 99 | | | 95 | |
| Sales-related costs: | | | |
| - Commission payable | 12 | | | 16 | |
| - Advertising and marketing-related costs | 133 | | | 120 | |
| - Other sales-related costs | 20 | | | 15 | |
| Material-related costs | 138 | | | 124 | |
| Interest-related accruals | 76 | | | 83 | |
| Other accrued liabilities | 324 | | | 283 | |
| Accrued liabilities | 1,887 | | | 1,630 | |
22 Other liabilities
Accounting policies
Other liabilities are initially measured at fair value and subsequently at amortized cost and are derecognized when the obligation under the liability is discharged, cancelled or has expired.
The company recognizes contract liabilities if a payment is received or a payment is due (whichever is earlier) from a customer before the company transfers the related goods or services. Contract liabilities are recognized as revenue when the company performs under the contract (i.e., transfers control of the related goods or services to the customer).
Other non-current liabilities
Non-current liabilities were EUR 45 million as of December 31, 2024 (December 31, 2023: EUR 54 million).
Non-current liabilities are associated mainly with indemnification and non-current accruals.
Other current liabilities
Other current liabilities are summarized as follows:
Philips Group
Other current liabilities in millions of EUR
| | | | | | | | | | | |
| 2023 | | 2024 |
| Accrued customer rebates | 186 | | | 169 | |
| Other taxes including social security premiums | 129 | | | 115 | |
| Other liabilities | 98 | | | 70 | |
| Other current liabilities | 414 | | | 354 | |
Contract liabilities
Non-current contract liabilities were EUR 431 million as of December 31, 2024 (December 31, 2023: EUR 469 million) and current contract liabilities were EUR 1,699 million as of December 31, 2024 (December 31, 2023: EUR 1,809 million).
The current contract liabilities decreased by EUR 109 million, which is mainly driven by an decrease in deferred balances for customer service contracts.
The current contract liabilities as of December 31, 2023, resulted in revenue recognized of EUR 1,809 million in 2024.
23 Cash flow statement supplementary information
Accounting policies
Cash and cash equivalents
Cash and cash equivalents include all cash balances, certain money market funds and short-term highly liquid investments with an original maturity of three months or less that are readily convertible into known amounts of cash. Bank overdrafts are included in borrowings in current liabilities.
Cash flow statements
The cash flow statement is prepared using the indirect method. Cash flows related to interest and tax are included in operating activities. Assets and liabilities acquired as part of a business combination are included in investing activities (net of cash acquired). Dividends paid to shareholders are included in financing activities. Dividends received are included in operating activities.
Cash flows arising from transactions in a foreign currency are translated into the company’s functional currency using the exchange rate at the date of the cash flow. Cash flows from derivative instruments that are accounted for as cash flow hedges are classified in the same category as the cash flows from the hedged items. Cash flows from other derivative instruments are classified as investing cash flows.
Income taxes
Income taxes in 2023 include EUR 2 million of interest related to uncertain tax positions.
Cash paid for leases
In 2024, gross lease payments of EUR 252 million (2023: EUR 271 million; 2022: EUR 316 million) included interest of EUR 37 million (2023: EUR 27 million; 2022: EUR 25 million).
Net cash used for derivatives and current financial assets
In 2024, a total of EUR 38 million cash was received with respect to foreign exchange derivative contracts related to activities for liquidity management and with respect to the purchase and proceeds from current financial assets (2023: EUR 46 million outflow; 2022: EUR 72 million outflow).
Purchase and proceeds from non-current financial assets
In 2024, the net cash outflow is EUR 66 million. In 2023, the net cash outflow is EUR 44 million. In 2022, the net cash outflow is EUR 38 million.
Reconciliation of liabilities arising from financing activities
Certain items in the statements of cash flows do not correspond to the differences between the balance sheet amounts for the respective items, principally because of the effects of translation differences and consolidation changes.
Philips Group
Reconciliation of liabilities arising from financing activities in millions of EUR
| | | | | | | | | | | | | | | | | | | | | | | | | | | | | |
| Balance as of December 31, 2023 | | Cash flow | | Currency effects and consolidation changes | | Other¹ | | Balance as of December 31, 2024 |
| Long term debt² | 7,567 | | | (53) | | | 107 | | | (74) | | | 7,546 | |
| EUR bonds | 4,569 | | | 340 | | | | | 8 | | | 4,917 | |
| USD bonds | 1,325 | | | | | 83 | | | | | | 1,408 | |
| Leases | 1,074 | | | (192) | | | 24 | | | 167 | | | 1,073 | |
| Forward contracts³ | 396 | | | | | | | (248) | | | 148 | |
| Bank borrowings | 203 | | | (201) | | | | | (1) | | | 1 | |
| Other long-term debt | | | | | | | | | | | | | | |
| Short term debt² | 122 | | | (30) | | | 1 | | | | | | 92 | |
| Short-term bank borrowings | 122 | | | (31) | | | 1 | | | | | 92 | |
| Other short-term loans | - | | | 1 | | | | | | | | | 1 | |
| Equity | (656) | | | (413) | | | | | 516 | | | (554) | |
| Dividend payable | | | | (3) | | | | | 3 | | | | |
| Forward contracts³ | (394) | | | | | | | | 251 | | | (143) | |
| Treasury shares⁴ | (262) | | | (410) | | | | | 262 | | | (411) | |
| Total | | | (496) | | | | | | | |
1Besides non-cash, other includes interest paid on leases, which is part of cash flows from operating activities
2In this table, current portion of long-term debt is included in long-term debt (and excluded from short-term debt).
3The forward contracts are related to the share buyback program and LTI plans
4Cash flow in 2024 includes withholding tax for share buyback amounting to EUR 41 million.
Philips Group
Reconciliation of liabilities arising from financing activities in millions of EUR
| | | | | | | | | | | | | | | | | | | | | | | | | | | | | |
| Balance as of December 31, 2022 | | Cash flow | | Currency effects and consolidation changes | | Other¹ | | Balance as of December 31, 2023 |
| Long term debt² | 8,111 | | | (210) | | | (96) | | | (238) | | | 7,567 | |
| EUR bonds | 4,061 | | | 497 | | | | | 11 | | | 4,569 | |
| USD bonds | 1,378 | | | | | (53) | | | | | 1,325 | |
| Leases | 1,082 | | | (200) | | | (42) | | | 235 | | | 1,074 | |
| Forward contracts³ | 858 | | | | | | | (462) | | | 396 | |
| Bank borrowings | 705 | | | (502) | | | | | | | 203 | |
| Other long-term debt | 28 | | | (5) | | | (1) | | | (22) | | | | |
| Short term debt² | 89 | | | 29 | | | 3 | | | | | 122 | |
| Short-term bank borrowings | 89 | | | 46 | | | (14) | | | | | 122 | |
| Other short-term loans | | | (17) | | | 17 | | | | | - | |
| Equity | (1,133) | | | (666) | | | | | 1,143 | | | (656) | |
| Dividend payable | | | (4) | | | | | 4 | | | | |
| Forward contracts³ | (858) | | | | | | | | 465 | | | (394) | |
| Treasury shares | (275) | | | (662) | | | | | 675 | | | (262) | |
| Total | | | (848) | | | | | | | |
1Besides non-cash, other includes interest paid on finance leases, which is part of cash flows from operating activities
2In this table, current portion of long-term debt is included in long-term debt (and excluded from short-term debt).
3The forward contracts are related to the share buyback program and LTI plans
4Cash flow in 2023 includes withholding tax for share buyback amounting to EUR 55 million.
24 Contingencies
Accounting policies
Contingent liabilities
A contingent liability is a liability of uncertain timing and amount. Contingencies are not recognized in the balance sheet because they are dependent on the occurrence or non-occurrence of one or more uncertain future events not wholly within the control of the company or because the risk of loss is estimated to be possible but not probable or because the amount cannot be measured reliably. Pursuant to IAS 37, Provisions,
Contingent Liabilities and Contingent Assets, certain information is not disclosed for legal proceedings for which the company concludes that disclosure can be expected to seriously prejudice the outcome of the matter.
Contingent assets
Contingent assets are disclosed if the inflow of economic benefits is probable, but not virtually certain. If the inflow of economic benefits becomes virtually certain, the asset would no longer be contingent and its recognition appropriate.
Financial guarantees
Philips’ policy is to provide guarantees and other letters of support only in writing. Philips does not stand by other forms of support. The company recognizes a liability at the fair value of the obligation at the inception of a financial guarantee contract. The guarantee is subsequently measured at the higher of the best estimate of the obligation or the amount initially recognized less, when appropriate, cumulative amortization.
Accounting estimates and judgments
Significant judgment is required to determine the likelihood of a potential outflow of resources. In addition, judgment is involved in determining whether the amount of an obligation can be measured with sufficient reliability. Contingencies involve inherent uncertainties including, but not limited to, court rulings, negotiations between affected parties, governmental actions, tax and environmental remediation. Contingent assets require management to apply judgment, especially to estimate the likelihood of the inflow of economic benefits and timing of recognition.
Guarantees
The total fair value of guarantees recognized on the balance sheet amounts to EUR nil million for both 2024 and 2023. Remaining off-balance-sheet business related guarantees on behalf of third parties and associates as of December 31, 2024, amounted to EUR 343 million (December 31, 2023: EUR 2 million). These mainly include bank guarantees secured for insurance companies to cover product liability-related cash flows related to the Respironics recall.
Environmental remediation
The company and its subsidiaries are subject to environmental laws and regulations. Under these laws, the company and/or its subsidiaries may be required to remediate the effects of certain manufacturing activities on the environment.
Legal proceedings
The company and certain of its group companies and former group companies are involved as a party in legal proceedings, regulatory and other governmental proceedings, including discussions on potential remedial actions, relating to such matters as competition issues, commercial transactions, product liability, participations, and environmental pollution.
While it is not feasible to predict or determine the outcome of all pending or threatened legal proceedings, regulatory and governmental proceedings, the company is of the opinion that the cases described below may have, or have had in the recent past, a significant impact on the company’s consolidated financial position, results of operations and cash flows.
Public investigations
In February 2023, the company received a statement of objections from the French Competition Authority (FCA) initiating a formal investigation to verify whether the company and certain other manufacturers of small domestic appliances breached antitrust rules in France in the period 2009-2014 through the alleged exchange of commercially sensitive information. The FCA issued its decision in December 2024, in which it closed the case by concluding that the company did not violate antitrust rules in France.
Respironics recall
On June 14, 2021, Philips subsidiary Philips RS North America LLC (Philips Respironics) issued a voluntary recall notification in the United States and field safety notice outside the United States for specific Philips Respironics CPAP, Bi-Level PAP, and mechanical ventilator devices (the “Recalled Devices”).
Consent Decree
On August 26, 2021, the US Food and Drug Administration (FDA) commenced an inspection of the Philips Respironics manufacturing facility in Murrysville, Pennsylvania, and provided Philips Respironics with its preliminary inspectional observations on November 9, 2021. In the first half of 2024, Philips Respironics reached an agreement with the US Department of Justice (DoJ), acting on behalf of the FDA, regarding the terms of a consent decree to resolve the identified issues in relation to the inspection. The consent decree was entered by the court in April 2024.
DOJ investigation; state Attorneys General investigation
Philips Respironics and certain of Philips' subsidiaries in the US continue to cooperate with a criminal and civil investigation triggered by a subpoena received from the DOJ in 2022 to provide information related to events leading to the Respironics recall. In addition, the same entities are cooperating with an investigation initiated in 2024 by certain US state Attorneys General into trade practices related to the products subject of the Respironics recall. While the outflow of economic resources in connection with these investigations is assessed as probable, given the current stage of the investigations, the company is not able to reliably estimate the financial impact.
Product liability claims
Following the voluntary recall notification, a number of civil complaints have been filed in several jurisdictions against Philips Respironics and certain of its affiliates (including the company) generally alleging economic loss, personal injury and/or the potential for personal injury allegedly caused by the recalled devices.
In the US, consumer and commercial class action lawsuits have been filed alleging economic loss and medical monitoring claims. Individual personal injury lawsuits have also been filed. On October 8, 2021, a Multi-District Litigation (MDL) in the US District Court for the Western District of Pennsylvania was formed, and most of these class action and personal injury lawsuits have been consolidated in the MDL for pre-trial proceedings.
On September 7, 2023, Philips Respironics reached agreement on a class action settlement in relation to the economic loss class action complaint, for which the company recorded a EUR 575 million provision in the first quarter of 2023. Under the agreement, which became final in May 2024, the Philips defendants agreed to provide predefined cash awards to all eligible participants in the US depending on the type of device, extended warranties on all remediated devices provided as part of Respironics’ recall program, and an additional cash award if they return the recalled device to Philips Respironics. The settlement also provides for compensation for individuals who acquired replacement devices in the market after the recall and prior to the announcement of the settlement. The settlement also provides for compensation to private insurers and other third-party payers. The claims period concluded on August 9, 2024, and since then, the Claims Administrator has been processing claims, calculating relevant payment amounts, and making payments to eligible class members.
On May 9, 2024, Philips Respironics reached agreement on a class action settlement in relation to the medical monitoring class action complaint. Under the agreement, which became final in January 2025, the Philips defendants agreed to pay USD 25 million into a Qualified Settlement Fund for the benefit of eligible class members. The USD 25 million amount is a fixed cap on the amount of the settlement and will be used to fund, among other things, research related to the advancement of public knowledge regarding the detection, diagnosis, and treatment of those injuries alleged to have been caused by use of the recalled devices.
Also on May 9, 2024, Philips Respironics reached agreement on a private settlement in relation to US personal injury claims. Under the agreement, the Philips defendants have agreed (subject to a termination right) to pay USD 1.075 billion to consist of USD 25 million in notice and administrative costs and USD 1.050 billion into a Personal Injury Settlement Fund. The settlement is an opt-in agreement, by which eligible claimants would release all of their personal injury claims in exchange for participation in the Personal Injury Settlement Fund. To participate in the settlement, an eligible claimant must have experienced a qualifying injury. The Philips parties had the right to terminate the settlement if less than 95% of eligible claimants would register for the settlement by the registration deadline on January 31, 2025. As at the registration deadline registrations exceeded 95%, the settlement has now become final with payment expected in the first half of 2025. For any individuals who declined to participate in, or are ineligible for, the settlement, and who wish to litigate their personal injury claims, they will need to identify themselves after the registration deadline and then comply with court orders imposing certain discovery obligations on them, including with respect to early disclosure of their evidence on causation.
Philips Respironics and certain of its affiliates (including the company) continue to be defendants in consumer class action lawsuits in Australia, Canada and Israel and collective or group actions in Chile, France, Germany, Italy and the Netherlands alleging economic loss and/or personal injury.
While the company believes it is probable that ongoing lawsuits will in the aggregate lead to an outflow of economic resources for Philips Respironics or other Philips entities, given the significant uncertainty regarding the nature of the relevant events and potential obligations, the company is not currently able to reliably estimate the amount of the obligation associated with these various lawsuits. The final outcome of the lawsuits and the remaining cost to resolve them cannot currently be determined due to a number of variables, including the early stages of some of these proceedings and uncertainty regarding the number of remaining claimants, their allegations, and their alleged injuries. The courts have not yet been asked to decide the question of whether any of the claimed injuries could have been caused by use of the recalled devices.
In 2024, the company and its insurance carriers reached an agreement on the basis of which the insurance carriers agreed to contribute EUR 540 million to cover product liability-related cash flows related to the Respironics recall. This amount was paid in full to the company in 2024.
Securities claims
On August 16, 2021, a securities class action complaint was filed against the company, its former CEO and its former CFO in the US District Court for the Eastern District of New York alleging violations of the Securities Exchange Act of 1934 causing damage to investors. On September 23, 2024, following amendments to the complaint, the court issued a decision dismissing all claims against the company’s former CFO and the former head of Philips Respironics but denying in part the motion to dismiss with respect to the company and its former CEO. The Court narrowed the class period and dismissed all claims based on statements made before 2018. The Court also dismissed all claims relating to certain categories of alleged misstatements. On October 28, 2024, the company and its former CEO moved for reconsideration of that portion of the decision denying their motion, and that motion was pending as of December 31, 2024.
In the Netherlands, six different parties (including European Investors – VEB and Deminor Litigation Funding) representing both retail and institutional investors have approached the company, holding the company and its directors liable for alleged misstatements and failures to make
timely disclosures in relation to the Respironics recall. As of December 31, 2024, one party has filed a civil complaint with the Amsterdam District Court.
It is the company’s assessment that it is possible but not probable that these cases could lead to a certain outflow of economic resources. The company is not able to reliably estimate the financial impact, if any. An adverse outcome of these cases could have a material impact on the company’s consolidated financial position, results of operations and cash flows.
SEC investigation
Following earlier requests for information from the US Securities and Exchange Commission (SEC), in March 2024, the company received a subpoena from the SEC relating to the Respironics Recall and compliance with relevant securities laws. The investigation is not an indication that the SEC or its staff have determined that any violations of law have occurred. The company is fully cooperating with the investigation.It is the company's assessment that it is possible but not probable that this investigation could lead to certain outflow of resources. The company is not able to reliably estimate the financial impact, if any.
Other claims
On October 12, 2021, SoClean, a company offering ozone-based cleaning products for sleep devices, filed a lawsuit in the US against the company and certain of its affiliates alleging that the defendants’ statements about the potential adverse effect ozone cleaning may have on the recalled devices has significantly damaged its business. Philips believes that the claim is without merit and will vigorously defend itself. In November 2023, the court ruled on one of the motions to dismiss filed by defendants and partially dismissed some of SoClean’s claims. On January 4, 2024, Philips and its affiliates filed their answer and counterclaims against SoClean and one of its affiliates. In October 2024, the court partially dismissed some of the counterclaims. Philips and its affiliates are also pursuing claims against SoClean and one of its affiliates for contribution for personal injury settlement costs and/or personal injury liability incurred by the company or its affiliates. SoClean and its affiliate have sought to dismiss those claims, but the court has not yet reached a decision.
In addition, some of Philips Respironics’ business partners, such as distributors and durable medical equipment providers, have filed or threatened to file claims alleging economic losses suffered as a consequence of the voluntary recall. Philips Respironics is engaging with certain of its business partners on the level of compensation they allege to be entitled to under Philips Respironics’ replacement program of the recalled devices. As of December 31, 2024, most of these claims have been resolved.
It is the company’s assessment that it is possible but not probable that these cases could lead to a certain outflow of economic resources. The company is not able to reliably estimate the financial impact, if any. In the event of an adverse outcome, these matters could have a material impact on the company’s consolidated financial position, results of operations and cash flows.
To date, other than for the economic loss, medical monitoring and personal injury settlements discussed above, no provisions have been recorded for the litigation and investigations in the US and Canada associated with the Respironics field action.
Other
In the second half of 2023, Electro Medical Systems S.A., a manufacturer of, among others, medical devices for dental prophylaxis, filed a lawsuit against the company alleging that the company materially breached its duties under a cooperation agreement entered into between the parties in 2016, claiming damages in excess of EUR 300 million, alleging loss of profit and lost increase in brand value. Philips disagrees with the allegations and has submitted its statement of defense in June 2024. The first Court hearing is expected to take place in the first half of 2025.
Miscellaneous
25 Related-party transactions
In the normal course of business, Philips purchases and sells goods and services from/to various related parties in which Philips typically holds between 20% and 50% equity interest and has significant influence. These transactions are generally conducted with terms comparable to transactions with third parties.
Philips Group
Related-party transactions in millions of EUR
| | | | | | | | | | | | | | | | | |
| 2022 | | 2023 | | 2024 |
| Sales of goods and services | 111 | | | 106 | | | 89 | |
| Purchases of goods and services | 46 | | | 42 | | | 50 | |
| Receivables from related parties | 55 | | | 18 | | | 25 | |
| Payables to related parties | 2 | | | 2 | | | 2 | |
The above table includes sales transactions between Philips and PMC of EUR 88 million in 2024 (2023: EUR 87 million; 2022: EUR 101 million), under which PMC has leased the equipment to the ultimate customer. In addition, as part of its S&RC operations in the US, Philips Medical
Capital LLC funded durable medical equipment (DMEs) providers, through loans and leases. PMC-funded transactions these DMEs entered into with Philips amount to EUR 75 million in 2024 (2023: EUR 117 million; 2022: EUR 117 million). The associated costs of these funding transactions are borne by the ultimate customer and settled directly with Philips Medical Capital LLC. Philips Medical Capital LLC, a Pennsylvania limited liability company, is owned 60% by De Lage Landen Financial Services, Inc. (DLL) and 40% by Philips Electronics North America Corporation (Philips).
On August 14, 2023, it was announced that Exor N.V. acquired a 15% minority stake in Philips shares and entered into a relationship agreement with the company. Pursuant to the relationship agreement with the company, Exor N.V. proposed one member to the Supervisory Board, who was confirmed at the 2024 Annual General Meeting of Shareholders on May 7, 2024. From this date, Exor is considered a related party for reporting purposes. For remuneration details of Benoît Ribadeau-Dumas as the Exor nominee see Information on remuneration. Exor has agreed to maintain its shareholding of at least 15% up to 20% for three years from August 13, 2023. Philips did not have other reportable transactions with Exor during the period ended December 31, 2024. In light of the composition of the Executive Committee, the company considers the members of the Executive Committee and the Supervisory Board to be the key management personnel as defined in IAS 24 Related Party Disclosures.
For remuneration details of the Executive Committee, the Board of Management and the Supervisory Board see Information on remuneration.
26 Share-based compensation
Accounting policies
Philips share-based compensation is an equity-settled plan made of restricted and performance shares. The restricted shares are subject to a three-year service condition and the performance shares include both market and non-market-based performance conditions, in addition to a three-year service condition. These shares are awarded to the Executive Committee and senior management.
The grant date fair value of market-based performance shares is determined through a Monte Carlo valuation model. The grant date fair value of non-market-based performance shares and restricted shares is determined as the share price at the grant date as participants receive notional dividends throughout the vesting period. The costs of share-based compensation plans are revised for expected performance (non-market-based performance shares) and forfeiture and are spread evenly over the service period.
Share-based compensation is recognized over the service period as personnel expense in the consolidated statement of income, with a corresponding increase to equity.
Accounting estimates and judgments
The use of a valuation model to determine market-based performance share fair value requires estimates for the expected volatility of the Philips share price and correlation among input variables.
At each reporting date, Philips calculates the expected realization of the non-market-based performance targets and revises the expected share-based compensation expense. The cumulative effect is recorded in the consolidated statement of income with a corresponding adjustment in equity.
No expense is recognized for awards that do not ultimately vest because non-market performance and/or service conditions have not been met.
The purpose of the share-based compensation plans is to align the interests of management with those of shareholders by providing incentives to improve the company’s performance on a long-term basis, thereby increasing shareholder value.
The company has the following plans:
•performance shares: rights to receive common shares in the future based on performance and service conditions
•restricted shares: rights to receive common shares in the future based on a service condition
•options on its common shares
Since 2013 the Board of Management and other members of the Executive Committee are only granted performance shares*. Performance shares as well as restricted shares can be granted to executives, certain selected employees and new employees. Prior to 2013, options were also granted.
Under the terms of employee stock purchase plans established by the company in various countries, employees are eligible to purchase a limited number of Philips shares at discounted prices through payroll withholdings.
Share-based compensation costs were EUR 104 million (2023: EUR 97 million; 2022: EUR 104 million). This includes the employee stock purchase plan of EUR 8 million, which is not a share-based compensation that affects equity. In the Consolidated statements of changes in equity EUR 96 million is recognized in 2024 and represents the costs of the share-based compensation plans. The amount recognized as an expense is adjusted for forfeitures. USD-denominated performance shares, restricted shares and options are granted to employees in the US only.
Performance shares
The performance is measured over a three-year performance period. The performance shares have three performance conditions: relative Total Shareholders’ Return (TSR) compared to a peer group of 20 companies including Philips (2023: 20 companies; 2022: 20 companies, 2021: 20 companies); adjusted Earnings Per Share growth** (EPS); and a sustainability criterion. The criterion is based on three Sustainable Development Goals (SDG) as defined by the United Nations that are included in Philips’ strategy on sustainability (refer to Environment, Social and Governance). The performance conditions are weighted as follows: TSR 50%, EPS 40% and SDG 10% (applicable for 2021, 2022 and 2023 plans). As of 2024 the performance conditions are weighted as follows: TSR 40%, EPS 40% and SDG 20%. The performance shares vest three years after the grant date. The number of performance shares that will vest is dependent on achieving the performance conditions provided that the grantee is still employed with the company.
The amount recognized as an expense is adjusted for actual performance of adjusted EPS growth** and the actual realization of the SDGs, since these are non-market performance conditions. It is not adjusted for non-vesting or extra vesting of performance shares due to a relative TSR performance that differs from the performance anticipated at the grant date, since this is a market-based performance condition. The fair value of the performance shares is measured based on Monte Carlo simulation, which takes into account dividend payments between the grant date and the vesting date by including reinvested dividends as well as the market conditions expected to impact relative Total Shareholders’ Return performance in relation to selected peers. The following weighted-average assumptions were used for the 2024 grants:
•risk-free rate: 2.72%
•expected share price volatility: 39%
The assumptions were used for these calculations only and do not necessarily represent an indication of management’s expectation of future developments for other purposes. The company has based its volatility assumptions on historical experience measured over a 10-year period.
A summary of the status of the company’s performance share plans as of December 31, 2024, and changes during the year are presented in the following table:
Philips Group
Performance shares
| | | | | | | | | | | | | | |
| 2023 | 2024 |
| Shares | Weighted average grant-date fair value | Shares | Weighted average grant-date fair value |
| EUR-denominated | | | | |
| Outstanding as of January 1 | 4,385,837 | 33.13 | | 5,392,035 | 27.22 | |
| Granted | 2,299,280 | 23.65 | | 2,265,462 | 28.94 | |
| Notional dividends¹ | 240,977 | 27.15 | | 218,782 | 24.35 | |
| Vested/Issued | (154,987) | 44.08 | | (169,524) | 50.30 | |
| Forfeited | (489,295) | 27.05 | | (451,052) | 25.07 | |
| Adjusted quantity² | (889,777) | 44.27 | | (788,865) | 50.65 | |
| Outstanding as of December 31 | 5,392,035 | 27.22 | | 6,466,838 | 24.41 | |
| | | | |
| USD-denominated | | | | |
| Outstanding as of January 1 | 2,749,983 | 36.66 | | 3,261,048 | 29.73 | |
| Granted | 1,667,812 | 25.96 | | 1,733,891 | 31.07 | |
| Notional dividends¹ | 152,750 | 29.78 | | 142,892 | 26.85 | |
| Vested/Issued | (121,760) | 48.33 | | (80,151) | 61.37 | |
| Forfeited | (596,846) | 28.95 | | (489,195) | 28.35 | |
| Adjusted quantity² | (590,890) | 48.28 | | (377,857) | 61.37 | |
| Outstanding as of December 31 | 3,261,048 | 29.73 | | 4,190,628 | 26.89 | |
1Dividend declared in 2024 on outstanding shares.
2Adjusted quantity includes the adjustments made to Performance shares outstanding due to updates on the actual TSR, EPS, and SDG.
As of December 31, 2024, a total of EUR 128 million of unrecognized compensation costs relate to non-vested performance shares (as of December 31, 2023 EUR 102 million; as of December 31, 2022 EUR 103 million). These costs are expected to be recognized over a weighted-average period of 2.0 years.
Restricted shares
The fair value of restricted shares is equal to the share price at grant date. The company issues restricted shares that, in general, have a three-year cliff-vesting period provided that the grantee is still employed with the company.
A summary of the status of the company’s restricted shares as of December 31, 2024, and changes during the year are presented in the following table:
Philips Group
Restricted shares
| | | | | | | | | | | | | | |
| 2023 | 2024 |
| Shares | Weighted average grant-date fair value | Shares | Weighted average grant-date fair value |
| EUR-denominated | | | | |
| Outstanding as of January 1 | 2,321,250 | 30.73 | | 2,995,252 | 23.39 | |
| Granted | 1,471,975 | 16.35 | | 1,367,380 | 22.64 | |
| Notional dividends¹ | 135,791 | 27.98 | | 52,481 | 22.57 | |
| Vested/Issued | (595,796) | 35.07 | | (627,855) | 35.10 | |
| Forfeited | (337,968) | 24.46 | | (263,352) | 21.06 | |
| Outstanding as of December 31 | 2,995,252 | 23.39 | | 3,523,906 | 21.17 | |
| | | | |
| USD-denominated | | | | |
| Outstanding as of January 1 | 2,345,263 | 33.87 | | 2,654,193 | 26.04 | |
| Granted | 1,284,761 | 17.72 | | 1,460,620 | 24.59 | |
| Notional dividends¹ | 126,498 | 31.12 | | 48,774 | 24.33 | |
| Vested/Issued | (679,430) | 37.83 | | (582,404) | 40.51 | |
| Forfeited | (422,899) | 26.79 | | (253,953) | 23.43 | |
| Outstanding as of December 31 | 2,654,193 | 26.04 | | 3,327,230 | 23.04 | |
1Dividend declared in 2024 on outstanding shares.
As of December 31, 2024, a total of EUR 73 million of unrecognized compensation costs relate to non-vested restricted shares (as of December 31, 2023 EUR 63 million; as of December 31, 2022 EUR 72 million). These costs are expected to be recognized over a weighted-average period of 1.9 years.
Option plans
Retention option plan
In April 2023, the company granted non-recurring retention options that expire after 10 years. These options vest after two years, provided that the grantee is still employed with the company.
The fair value of the options under this plan is measured based on Black-Scholes-Merton option pricing model. The expected life of the options is calculated as the average between vesting period (two years) and the total contractual life (10 years).
The following tables summarize information about the company’s options as of December 31, 2024, and changes during the year:
Philips Group
Options on EUR-denominated listed share
| | | | | | | | |
| Options | Weighted average exercise price |
| Outstanding as of January 1, 2024 | 3,660,000 | 22.16 | |
| Exercised | (3,793) | 22.16 |
| Forfeited | (259,668) | 22.16 |
| Outstanding as of December 31, 2024 | 3,396,539 | 22.16 |
The total intrinsic value of EUR-denominated options exercised during 2024 was EUR 15,475. Cash received during 2024 from exercises under the company’s options plans amounted to EUR 84,053. As of December 31, 2024, there were 39,983 options exercisable with a weighted
average remaining contractual term of 0.4 years and total intrinsic value of EUR 89,562.
The weighted average remaining contractual term for options outstanding as of December 31, 2024, was 8.1 years.
Philips Group
Options on USD-denominated listed share
| | | | | | | | |
| Options | Weighted average exercise price |
| Outstanding as of January 1, 2024 | 1,929,000 | 24.42 | |
| Forfeited | (291,236) | 24.42 |
| Outstanding as of December 31, 2024 | 1,637,764 | 24.42 |
There were no exercisable USD-denominated options as of December 31, 2024. The weighted average remaining contractual term for options outstanding as of December 31, 2024, was 8.0 years.
As of December 31, 2024, a total of EUR 2 million of unrecognized compensation costs relate to outstanding options. These costs are expected to be recognized over a weighted-average period of 0.3 years.
Philips Group
Outstanding options in millions of EUR unless otherwise stated
| | | | | | | | | | | |
| Number of options | Intrinsic value | Weighted average remaining contractual term in years |
| EUR-denominated | | | |
| 20-25 | 3,396,539 | 8 | 8.1 |
| Outstanding options | 3,396,539 | 8 | 8.1 |
| | | |
| USD-denominated | | | |
| 20-25 | 1,637,764 | 1 | 8.0 |
| Outstanding options | 1,637,764 | 1 | 8.0 |
*Executive Committee members can receive restricted share rights as a sign-on LTI awards upon hiring.
**The definition of this non-IFRS measure and a reconciliation to the IFRS measure is included in Equity.
27 Information on remuneration
Remuneration of the Executive Committee
In 2024, the total remuneration costs relating to the Executive Committee (consisting of 15 members throughout the year, including the members of the Board of Management) amounted to EUR 32.0 million (2023: EUR 32.8 million; 2022: EUR 25.6 million) and consisted of the elements in the following table.
Philips Group
Remuneration costs of the Executive Committee1 in EUR
| | | | | | | | | | | |
| 2022 | 2023 | 2024 |
| Base salary/Base compensation | 9,528,279 | 8,729,458 | 9,362,765 |
| Annual incentive² | 208,370 | 11,405,130 | 5,292,388 |
| Performance shares³ | 11,242,581 | 7,272,815 | 12,673,614 |
| Stock options | | 13,358 | 90,503 |
| Restricted share rights³ | 1,191,529 | 1,907,511 | 999,374 |
| Pension allowances⁴ | 1,949,204 | 1,346,937 | 1,197,695 |
| Pension scheme costs | 288,179 | 260,554 | 269,092 |
| Other compensation⁵ | 1,216,163 | 1,900,224 | 2,136,668 |
| Total | 25,624,305 | 32,835,987 | 32,022,099 |
1The Executive Committee consisted of 13 members as per December 31, 2024 (2023: 13 members; 2022: 13 members).
2The annual incentives are related to the performance in the year reported, which are paid out in the subsequent year.
3Costs of performance shares and restricted share rights are based on accounting standards (IFRS) and do not reflect the value of performance shares at the vesting/release date.
4Pension allowances are gross taxable allowances paid to the Executive Committee members in the Netherlands. These allowances are part of the pension arrangement.
5The stated amounts mainly concern (share of) allowances to members of the Executive Committee that can be considered as remuneration. In a situation where such a share of an allowance can be considered as (indirect) remuneration (for example, private use of the company car), then the share is both valued and accounted for here. The method employed by the fiscal authorities is the starting point for the value stated.
Remuneration of the Board of Management
In 2024, the total remuneration costs relating to the members of the Board of Management amounted to EUR 10.3 million (2023: EUR 9.9 million; 2022: EUR 8.5 million). See the following table.
Philips Group
Remuneration costs of individual members of the Board of Management in EUR
| | | | | | | | | | | | | | | | | | | | | | | | | | |
| Base compensation/salary | Annual incentive¹ | Performance shares² | Restricted share rights² | Pension allowances | Pension scheme costs | Other compensation³ | Total costs |
| 2024 | | | | | | | | |
| R. Jakobs | 1,237,500 | | 927,750 | | 1,692,087 | | | 274,925 | | 32,218 | | 83,870 | | 4,248,350 | |
| C. Hanneman⁴ | 175,545 | | 98,372 | | 104,606 | | | 35,247 | | 7,775 | | 23,089 | | 444,633 | |
| A. Bhattacharya | 622,500 | | 351,934 | | 1,424,219 | | | 129,788 | | 25,478 | | 963,596 | | 3,517,514 | |
| M.J. van Ginneken | 652,500 | | 422,374 | | 740,101 | | | 128,675 | | 32,218 | | 74,227 | | 2,050,095 | |
| 2,688,045 | | 1,800,429 | | 3,961,013 | | | 568,635 | | 97,689 | | 1,144,781 | | 10,260,593 | |
| | | | | | | | |
| 2023 | | | | | | | | |
| R. Jakobs | 1,200,000 | | 2,004,480 | | 968,922 | | | 267,798 | | 31,891 | | 109,256 | | 4,582,347 | |
| A. Bhattacharya | 810,000 | | 1,075,939 | | 793,429 | | | 197,133 | | 31,891 | | 94,516 | | 3,002,907 | |
| M.J. van Ginneken | 630,000 | | 846,922 | | 614,840 | | | 125,298 | | 31,891 | | 53,446 | | 2,302,397 | |
| 2,640,000 | | 3,927,341 | | 2,377,191 | | | 590,228 | | 95,673 | | 257,218 | | 9,887,650 | |
| | | | | | | | |
| 2022 | | | | | | | | |
| R. Jakobs⁵ | 256,438 | | | 112,737 | | | 57,973 | | 6,012 | | 11,507 | | 444,667 | |
| F.A. van Houten⁵ | 1,041,849 | | 208,370 | | 2,930,068 | | | 444,051 | | 22,121 | | 42,533 | | 4,688,992 | |
| A. Bhattacharya | 806,250 | | | 763,140 | | | 237,250 | | 28,133 | | 61,308 | | 1,896,081 | |
| M.J. van Ginneken | 626,250 | | | 585,490 | | | 141,622 | | 28,133 | | 35,343 | | 1,416,837 | |
| 2,730,788 | | 208,370 | | 4,391,434 | | | 880,896 | | 84,398 | | 150,691 | | 8,446,577 | |
1The annual incentives are related to the performance in the year reported, which are paid out in the subsequent year.
2Costs of performance shares and restricted share rights are based on accounting standards (IFRS) and do not reflect the value of performance shares at the vesting/release date
3The stated amounts mainly concern (share of) allowances to members of the Board of Management that can be considered as remuneration. In a situation where such a share of an allowance can be considered as (indirect) remuneration (for example, private use of the company car), then the share is both valued and accounted for here. The method employed by the fiscal authorities is the starting point for the value stated.
4As per October 1, 2024, Charlotte Hanneman was appointed as CFO of the company. This table includes actual costs incurred as of this date and until the end of the year.
5As per October 15, 2022, Roy Jakobs was appointed as CEO of the company. The table includes actual costs incurred in respect of the remuneration received by Frans van Houten and Roy Jakobs, respectively, as CEO.
The accumulated annual pension entitlements and the pension costs of individual members of the Board of Management are as follows:
Philips Group
Accumulated annual pension entitlements and pension-related costs in EUR unless otherwise stated
| | | | | | | | | | | |
| Age as of December 31, 2024 | Accumulated annual pension as of December 31, 2024 | Total pension related costs |
| R. Jakobs | 50 | 60,886 | | 307,143 | |
| C. Hanneman | 46 | 1,298 | | 100,072 | |
| M.J. van Ginneken | 51 | 58,167 | | 160,894 | |
| Pension costs | | | 568,109 | |
When pension rights are granted to members of the Board of Management, necessary payments (if insured) and all necessary provisions are made in accordance with the applicable accounting principles. In 2024, no (additional) pension benefits were granted to former members of the Board of Management.
Remuneration of the Supervisory Board
The remuneration of the members of the Supervisory Board amounted to EUR 1.7 million (2023: EUR 1.5 million; 2022: EUR 1.5 million). Former members received no remuneration.
The members of the Supervisory Board do not receive any share-based remuneration. Therefore, as of December 31, 2024, the members of the Supervisory Board held no stock options, performance shares or restricted shares.
The individual members of the Supervisory Board received, by virtue of the positions they held, the following remuneration:
Philips Group
Remuneration of the Supervisory Board in EUR
| | | | | | | | | | | | | | |
| Membership | Committees | Other compensation¹ | Total |
| 2024 | | | | |
| F. Sijbesma | 166,500 | | 37,500 | | 28,945 | | 232,945 | |
| P.A.M. Stoffels | 123,500 | | 37,500 | | 13,269 | | 174,269 | |
| S.K. Chua | 107,500 | | 19,250 | | 26,107 | | 152,857 | |
| M.E. Doherty | 107,500 | | 29,000 | | 20,289 | | 156,789 | |
| A.M. Harrison | 107,500 | | 15,000 | | 7,769 | | 130,269 | |
| P. Löscher | 107,500 | | 34,250 | | 18,769 | | 160,519 | |
| I. Nooyi | 107,500 | | 15,000 | | 20,154 | | 142,654 | |
| S. Poonen | 107,500 | | 16,771 | | 19,267 | | 143,538 | |
| D.E.I. Pyott | 107,500 | | 28,750 | | 18,769 | | 155,019 | |
| B. Ribadeau-Dumas | 70,390 | | 9,822 | | 17,986 | | 98,198 | |
| H. Verhagen | 107,500 | | 26,229 | | 16,267 | | 149,996 | |
| 1,220,390 | | 269,072 | | 207,592 | | 1,697,054 | |
| 2023 | | | | |
| F. Sijbesma | 155,000 | | 35,000 | | 16,345 | | 206,345 | |
| P.A.M. Stoffels | 115,000 | | 35,000 | | 22,269 | | 172,269 | |
| S.K. Chua | 100,000 | | 18,000 | | 22,269 | | 140,269 | |
| M.E. Doherty | 100,000 | | 27,000 | | 27,269 | | 154,269 | |
| A.M. Harrison | 100,000 | | 14,000 | | 19,769 | | 133,769 | |
| P. Löscher | 100,000 | | 32,000 | | 17,269 | | 149,269 | |
| I. Nooyi | 100,000 | | 14,000 | | 17,269 | | 131,269 | |
| S. Poonen | 100,000 | | 18,000 | | 19,769 | | 137,769 | |
| D.E.I. Pyott | 100,000 | | 35,000 | | 19,769 | | 154,769 | |
| H. Verhagen | 100,000 | | 14,000 | | 7,269 | | 121,269 | |
| 1,070,000 | | 242,000 | | 189,266 | | 1,501,266 | |
| 2022 | | | | |
| F. Sijbesma | 155,000 | | 35,000 | | 16,345 | | 206,345 | |
| P.A.M. Stoffels | 115,000 | | 35,000 | | 27,269 | | 177,269 | |
| S.K. Chua | 100,000 | | 18,000 | | 22,269 | | 140,269 | |
| N. Dhawan | 35,616 | | 6,411 | | 5,808 | | 47,836 | |
| M.E. Doherty | 100,000 | | 27,000 | | 24,769 | | 151,769 | |
| A.M. Harrison | 100,000 | | 14,000 | | 12,269 | | 126,269 | |
| P. Löscher | 100,000 | | 32,000 | | 24,769 | | 156,769 | |
| I. Nooyi | 100,000 | | 14,000 | | 17,269 | | 131,269 | |
| S. Poonen | 100,000 | | 18,000 | | 17,269 | | 135,269 | |
| D.E.I. Pyott | 100,000 | | 35,000 | | 17,269 | | 152,269 | |
| H. Verhagen | 100,000 | | 14,000 | | 7,269 | | 121,269 | |
| 1,105,616 | | 248,411 | | 192,574 | | 1,546,602 | |
1The amounts mentioned under other compensation relate to the fee for intercontinental travel, inter-European travel, the Philips product arrangement and the annual fixed net expense allowance.
Supervisory Board members’ and Board of Management members’ interests in Philips shares
Members of the Supervisory Board and of the Board of Management are prohibited from writing call and put options or similar derivatives of Philips securities.
Philips Group
Shares held by Board members1 2 in number of shares
| | | | | | | | |
| December 31, 2023 | December 31, 2024 |
| R. Jakobs | 126,809 | 134,298 |
| M.J. van Ginneken | 129,447 | 137,753 |
| P. Stoffels | 17,759 | 18,366 |
| S. Poonen | 3,133 | 3,240 |
| I. Nooyi | 3,238 | 3,348 |
| D. Pyott | 19,848 | 20,526 |
| S.K. Chua | 2,089 | 2,160 |
| F. Sijbesma | 25,000 | 25,854 |
| M. Harrison | 1,567 | 1,620 |
| P. Löscher | 21,658 | 22,398 |
1Reference date for board membership is December 31, 2024.
2The total shares held by the members of the Board of Management is less than 1% of the company's issued share capital.
28 Fair value of financial assets and liabilities
Accounting policies
Fair value hierarchy
For financial reporting purposes, financial instruments are categorized into Level 1, 2 or 3, based on the degree to which the inputs to the fair value measurements are observable and the significance of the inputs to the fair value measurement in its entirety, which are as follows:
•Level 1 – inputs are quoted prices (unadjusted) for identical assets or liabilities in active markets that the company can access at the measurement date.
•Level 2 – all significant inputs (other than quoted prices included within Level 1) are observable for the asset or liability, either directly (as prices) or indirectly (derived from prices).
•Level 3 – one or more of the significant inputs are not based on observable market data, such as third-party pricing information without adjustments, for the asset or liability.
Transfers between levels of the fair value hierarchy are recognized at the end of the reporting period during which the change has occurred.
Offsetting and master netting agreements
Financial assets and liabilities are offset and the net amount is reported in the balance sheet when, and only when, the company currently has a legally enforceable right to set-off the amounts and the group intends either to settle them on a net basis or to realize the asset and settle the liability simultaneously.
Accounting estimates and judgments
Determining the fair value of financial instruments requires the use of estimates according to the method applied for each type of financial asset of liability. The estimated fair value of financial instruments has been determined by the company using available market information and appropriate valuation methods. The estimates presented are not necessarily indicative of the amounts that will ultimately be realized by the company upon maturity or disposal. The use of different market assumptions and/or estimation methods may have a material effect on the estimated fair value amounts.
Specific valuation techniques used to value financial instruments include:
Level 1
Instruments included in level 1 are composed primarily of listed equity investments classified as financial assets carried at fair value through profit or loss or carried at fair value through other comprehensive income (OCI). The fair value of financial instruments traded in active markets is based on quoted market prices at the balance sheet date. A market is regarded as active if quoted prices are readily and regularly available from an exchange, dealer, broker, industry group, pricing service, or regulatory agency, and those prices represent actual and regularly occurring market transactions on an arm’s length basis.
Level 2
The fair value of financial instruments that are not traded in an active market (for example, over-the-counter derivatives or convertible bond instruments) is determined by using valuation techniques. These valuation techniques maximize the use of observable market data where it is available and rely as little as possible on entity-specific estimates. If all significant inputs required to fair value an instrument are based on
observable market data, the instrument is included in level 2. The fair value of derivatives is calculated as the present value of the estimated future cash flows based on observable interest yield curves, basis spread and foreign exchange rates. The valuation of convertible bond instruments uses observable market quoted data for the options and present value calculations using observable yield curves for the fair value of the bonds.
The fair value of debt is estimated on the basis of the quoted market prices for certain issuances, or on the basis of discounted cash flow analysis using market rates plus Philips’ spread for the particular tenors of the borrowing arrangement. Accrued interest is not included within the carrying amount or estimated fair value of debt.
Level 3
If one or more of the significant inputs are not based on observable market data, such as third-party pricing information without adjustments, the instrument is included in level 3.
The fair value of contingent consideration is dependent on the terms of the respective acquisition agreement that may require Philips to pay additional consideration to former shareholders if specified future events occur or conditions are met, such as the achievement of certain regulatory milestones or the achievement of certain commercial milestones. The fair value of the contingent consideration provision is generally determined using a probability-weighted and a risk-adjusted approach to estimate the achievement of future regulatory and commercial milestones, respectively. The discount rates used in the risk adjusted approach reflect the inherent risk related to achieving the commercial milestones. Both regulatory and commercial milestones are discounted for the time value of money at risk-free rates. The fair value measurement is based on management’s estimates and assumptions and hence classified as Level 3 in the fair value hierarchy.
The following tables show the carrying amounts and fair values of financial assets and financial liabilities, including their levels in the fair value hierarchy. Fair value information for financial assets and financial liabilities not carried at fair value is not included if the carrying amount is a reasonable approximation of fair value.
Philips Group
Fair value of financial assets and liabilities in millions of EUR | | | | | | | | | | | | | | | | | | | | | | | |
| 2023 | 2024 |
| Carrying amount | Estimated fair value¹ | Carrying amount | Estimated fair value¹ | Level 1 | Level 2 | Level 3 |
| December 31 | | | | | | | |
| | | | | | | |
| Financial assets | | | | | | | |
| Carried at fair value: | | | | | | | |
| Debt instruments | 226 | | 226 | | 231 | | 231 | | | | 231 | |
| Equity instruments | 2 | | 2 | | 3 | | 3 | | | | 2 | |
| Other financial assets | 56 | | 56 | | 54 | | 54 | | | 53 | | - | |
| Financial assets carried at FVTP&L | 284 | | 284 | | 288 | | 288 | | | 53 | | 234 | |
| Debt instruments | 27 | | 27 | | 21 | | 21 | | | 20 | | |
| Equity instruments | 231 | | 231 | | 222 | | 222 | | 4 | | | 218 | |
| Current financial assets | 3 | | 3 | | 2 | | 2 | | | | 2 | |
| | | | | | | |
| Receivables - current | 32 | | 32 | | | | | | |
| Receivables - non-current | | | | | | | | | |
| Financial assets carried at FVTOCI | 293 | | 293 | | 244 | | 244 | | 4 | | 20 | | 220 | |
| Derivative financial instruments | 48 | | 48 | | 77 | | 77 | | | 72 | | 6 | |
| Financial assets carried at fair value | 624 | | 624 | | 609 | | 609 | | 4 | | 146 | | 460 | |
| | | | | | | |
| Carried at (amortized) cost: | | | | | | | |
| Cash and cash equivalents | 1,869 | | | 2,401 | | | | | |
| Loans and receivables: | | | | | | | |
| Current loans receivables | - | | | - | | | | | |
| Other non-current loans and receivables | 77 | | | 102 | | | | | |
| Receivables - current | 3,701 | | | 3,672 | | | | | |
| Receivables - non-current | 193 | | | 208 | | | | | |
| Financial assets carried at (amortized) cost | 5,840 | | | 6,382 | | | | | |
| Total financial assets | 6,465 | | | 6,992 | | | | | |
| | | | | | | |
| Financial liabilities | | | | | | | |
| Carried at fair value: | | | | | | | |
| Contingent consideration | (115) | | (115) | | (113) | | (113) | | | | (113) | |
| Financial liabilities carried at FVTP&L | (115) | | (115) | | (113) | | (113) | | | | (113) | |
| Derivative financial instruments | (43) | | (43) | | (63) | | (63) | | | (63) | | |
| Financial liabilities carried at fair value | (158) | | (158) | | (176) | | (176) | | | (63) | | (113) | |
| | | | | | | |
| Carried at (amortized) cost: | | | | | | | |
| Accounts payable | (1,917) | | | (1,830) | | | | | |
| Interest accrual | (76) | | | (83) | | | | | |
| Debt (Corporate bonds and leases) | (6,969) | | (6,798) | | (7,397) | | (7,363) | | (6,290) | | (1,073) | | |
| Debt (excluding corporate bonds and leases) | (721) | | | (241) | | | | | |
| Financial liabilities carried at (amortized) cost | (9,682) | | | (9,551) | | | | | |
| Total financial liabilities | (9,840) | | | (9,728) | | | | | |
1For cash and cash equivalents, loans and receivables, accounts payable, interest accrual and debt (excluding corporate bonds and leases), the carrying amounts approximate fair value because of the nature of these instruments (including maturity and interest conditions) and therefore fair value information is not included in the table above.
The following table shows the reconciliation from the beginning balance to the end balance for Level 3 fair value measurements.
Philips Group
Reconciliation of Level 3 fair value measurements in millions of EUR | | | | | | | | | | | | | | |
| 2023 | 2024 |
| Financial assets | Financial liabilities | Financial assets | Financial liabilities |
| Balance as of January 1 | 549 | | 113 | | 503 | | 115 | |
| Acquisitions | | 6 | | | |
| Purchase | 85 | | | 86 | | |
| Sales | (56) | | | (48) | | |
| Utilizations | | (20) | | | (9) | |
| Recognized in profit and loss: | | | | |
| other business income | | 16 | | | 2 | |
| financial income and expenses¹ | (43) | | 1 | | (23) | | 3 | |
| Recognized in other comprehensive income² | (40) | | (2) | | (8) | | 3 | |
| Receivables held to collect and sell | 6 | | | (32) | | |
| Reclassification | | 1 | | (18) | | - | |
| Balance as of December 31 | 503 | | 115 | | 460 | | 113 | |
2Includes translation differences
Offsetting and master netting agreements
Transactions in derivatives are subject to master netting and set-off agreements. In the case of certain termination events, under the terms of the master agreement, Philips can terminate the outstanding transactions and aggregate their positive and negative values to arrive at a single net termination sum (or close-out amount). This contractual right is subject to the following:
•The right may be limited by local law if the counterparty is subject to bankruptcy proceedings.
•The right applies on a bilateral basis.
Philips Group
Financial assets subject to offsetting, enforceable master netting arrangements or similar agreements in millions of EUR
| | | | | | | | |
| 2023 | 2024 |
| Derivatives | | |
| Gross amounts of recognized financial assets | 48 | | 72 | |
| Gross amounts of recognized financial liabilities offset in the balance sheet | | |
| Net amounts of financial assets presented in the balance sheet | 48 | | 72 | |
| | |
| Related amounts not offset in the balance sheet | | |
| Financial instruments | (34) | | (45) | |
| Net amount | 13 | | 27 | |
Philips Group
Financial liabilities subject to offsetting, enforceable master netting arrangements or similar agreements in millions of EUR
| | | | | | | | |
| 2023 | 2024 |
| Derivatives | | |
| Gross amounts of recognized financial liabilities | (43) | | (63) | |
| Gross amounts of recognized financial assets offset in the balance sheet | | |
| Net amounts of financial liabilities presented in the balance sheet | (43) | | (63) | |
| | |
| Related amounts not offset in the balance sheet | | |
| Financial instruments | 34 | | 45 | |
| Net amount | (9) | | (18) | |
29 Details of treasury and other financial risks
Accounting policies
Derivative financial instruments, including hedge accounting
The company uses derivative financial instruments principally to manage its foreign currency risks and, to a more limited extent, interest rate and commodity price risks. All derivative financial instruments are accounted for at the trade date and classified as current or non-current assets or liabilities based on the maturity date or the early termination date. The company measures all derivative financial instruments at fair value that is derived from the market prices of the instruments, calculated on the basis of the present value of the estimated future cash flows based on observable interest yield curves, basis spread, credit spreads and foreign exchange rates, or derived from option pricing models, as appropriate. Gains or losses arising from changes in fair value of derivatives are recognized in the Consolidated statements of income, except for derivatives that are highly effective and qualify for cash flow or net investment hedge accounting.
Changes in the fair value of a derivative that is highly effective and that is designated and qualifies as a cash flow hedge are recorded in other comprehensive income (OCI) until the Consolidated statements of income are affected by the variability in cash flows of the designated hedged item. To the extent that the hedge is ineffective, changes in the fair value are recognized in the Consolidated statements of income.
Changes in the fair value of foreign exchange forward contracts attributable to forward points and changes in the time value of the option contracts are deferred in the cash flow hedges reserve within equity. The deferred amounts are recognized in the Consolidated statements of income against the related hedged transaction when it occurs.
The company formally assesses, both at the hedge’s inception and on an ongoing basis, whether the derivatives that are used in hedging transactions are highly effective in offsetting changes in fair values or cash flows of hedged items. When it is established that a derivative is not highly effective as a hedge or that it has ceased to be a highly effective hedge, the company discontinues hedge accounting prospectively. When hedge accounting is discontinued because a forecasted transaction is expected not to occur, the company continues to carry the derivative on the Consolidated balance sheets at its fair value, and gains and losses that were accumulated in OCI are recognized immediately in the same line item as they relate to in the Consolidated statements of income.
Foreign currency differences arising upon retranslation of financial instruments designated as a hedge of a net investment in a foreign operation are recognized directly in the currency translation differences reserve through OCI, to the extent that the hedge is effective. To the extent that the hedge is ineffective, such differences are recognized in the Consolidated statements of income.
Accounting estimates and judgments
Financial assets are subject to impairment assessment, which involves estimating expected credit losses. Refer to Other financial assets for accounting policies on impairment of financial assets. Philips is exposed to several types of financial risks which are further analyzed below. Philips does not purchase or hold derivative financial instruments for speculative purposes. Information regarding financial instruments is included in Fair value of financial assets and liabilities. Liquidity risk
Liquidity risk is the risk that an entity will encounter difficulty in meeting obligations associated with financial liabilities.
Liquidity risk for the group is monitored through the Treasury liquidity committee, which tracks the development of the actual cash flow position for the group and uses input from a number of sources in order to forecast the overall liquidity position on both short and longer term basis. Philips invests surplus cash in short-term deposits with appropriate maturities and money market funds to ensure sufficient liquidity is available to meet liabilities when due and in money market funds.
The rating of the company’s debt by major rating agencies may improve or deteriorate. As a result, Philips’ future borrowing capacity may be influenced and its financing costs may fluctuate. Philips has various sources to mitigate the liquidity risk for the group. As of December 31, 2024 Philips had EUR 2,401 million in cash and cash equivalents (2023: EUR 1,869 million), which includes short-term deposits of EUR 1,946 million (2023: EUR 1,399 million). Cash and cash equivalents include all cash balances, money market funds and short-term highly liquid investments with an original maturity of three months or less that are readily convertible into known amounts of cash. Philips pools cash from subsidiaries to the extent legally and economically feasible; cash not pooled remains available for the company’s operational or investment needs.
Philips faces cross-border foreign exchange controls and/or other legal restrictions in a few countries that could limit its ability to make these balances available on short notice for general use by the group.
Philips has a USD 2.5 billion Commercial Paper Program and a EUR 1 billion committed standby revolving credit facility that can be used for general group purposes. As of December 31, 2024, Philips did not have any loans outstanding under either facility. These facilities do not have a material adverse change clause, have no financial covenants and have no credit-rating-related acceleration possibilities.
Philips established a Euro Medium-Term Note (EMTN) program, a framework that facilitates the issuance of notes for a total amount up to EUR 10 billion. In 2024, Philips issued EUR 700 million fixed rate notes due 2032 under the EMTN program for general corporate purposes, including the repayment of the 2025 EUR Bonds and floating rate debt. As of December 31, 2024, Philips has EUR 3.7 billion (2023: EUR 3.3 billion) fixed rates notes outstanding under the EMTN program. For a description of Philips’ credit facilities, refer to Debt. In addition to cash and cash equivalents, as of December 31, 2024, Philips also held EUR 4 million (2023: EUR 14 million) of listed (level 1) equity investments at fair value (classified as other non-current financial assets).
The following table presents a summary of the Group’s fixed contractual cash obligations and commitments as of December 31, 2024. These amounts are an estimate of future payments which could change as a result of various factors such as a change in interest rates, foreign exchange, and contractual provisions, as well as changes in business strategy and needs. Therefore, the actual payments made in future periods may vary from those presented in the following table:
Philips Group
Contractual cash obligations1 2 in millions of EUR
| | | | | | | | | | | | | | | | | |
| | Payments due by period |
| Total | Less than 1 year | 1-3 years | 3-5 years | After 5 years |
| Long-term debt | 7,168 | | | | 2,006 | | 1,338 | | 3,824 | |
| Short-term debt | 525 | | 525 | | | | |
| Interest on debt | 1,792 | | 197 | | 368 | | 325 | | 902 | |
| Derivative liabilities | 72 | | 64 | | 8 | | | |
| Purchase obligations³ | 1,161 | | 300 | | 307 | | 210 | | 344 | |
| Trade and other payables | 1,830 | | 1,830 | | | | |
| Contractual cash obligations | 12,548 | | 2,916 | | 2,689 | | 1,873 | | 5,070 | |
1Amounts in this table are undiscounted.
2This table excludes post-employment benefit plan contribution commitments and income tax liabilities in respect of tax risks because it is not possible to make a reasonably reliable estimate of the actual period of cash settlement.
3Purchase obligations are agreements to purchase goods or services that are enforceable and legally binding for the Group. They specify all significant terms, including fixed or minimum quantities to be purchased, fixed, minimum or variable price provisions and the approximate timing of the transaction. They do not include open purchase orders or other commitments which do not specify all significant terms.
Philips has contracts with investment funds where it committed itself to make, under certain conditions, capital contributions to these funds of an aggregated remaining amount of EUR 130 million (2023: EUR 153 million). As of December 31, 2024, capital contributions already made to these investment funds are recorded as non-current financial assets.
Philips offers voluntary supply chain finance programs for certain US Dollar, Euro and Swedish Krona third parties which provide participating suppliers the opportunity to factor their trade receivables at the sole discretion of both the suppliers and the third parties. Philips continues to recognize these liabilities as trade payables and settles them accordingly on the invoice maturity date based on the terms and conditions of those arrangements. As of December 31, 2024, approximately EUR 97 million (2023: EUR 114 million) of the Philips account payable were transferred under these arrangements.
Philips Group
Carrying amount of financial liabilities1 in millions of EUR
| | | | | |
| 2024 |
| Presented in accounts payables: | 97 |
| - of which suppliers have received payment from finance provider | 85 |
Philips Group
Range of payment due dates
| | | | | |
| 2024 |
| Liabilities that are part of the arrangements | 30 -135 days |
| Comparable trade payables that are not part of the arrangements | 0 -135 days |
1There were no material business combinations or foreign exchange differences during the year.
With respect to the Respironics field action, please refer to Contingencies. The management continues to monitor the risks associated with such potential claims and its impact on liquidity position, if any. Currency risk
Currency risk is the risk that reported financial performance or the fair value or future cash flows of a financial instrument will fluctuate because of changes in foreign exchange rates. Philips operates in many countries and currencies and therefore currency fluctuations may impact Philips’ financial results. Philips is exposed to currency risk in the following areas:
•transaction exposures, related to anticipated sales and purchases and on-balance-sheet receivables/payables resulting from such transactions
•translation exposure of foreign-currency intercompany and external debt and deposits
•translation exposure of net income in foreign entities
•translation exposure of foreign-currency-denominated equity invested in consolidated companies
•translation exposure to equity interests in non-functional-currency investments in associates and other non-current financial assets
It is Philips’ policy to reduce the potential year-on-year volatility caused by foreign-currency movements on its net earnings by hedging the anticipated net exposure of foreign currencies resulting from foreign-currency sales and purchases. In general, net anticipated exposures for the Group are hedged during a period of 15 months in layers of 20% up to a maximum hedge of 80%. Philips’ policy requires significant committed foreign currency exposures to be fully hedged, generally using forwards. However, not every foreign currency can or shall be hedged as there may be regulatory barriers or prohibitive hedging cost preventing Philips from effectively and/or efficiently hedging its currency exposures. As a result, hedging activities cannot and will not eliminate all currency risks for anticipated and committed transaction exposures.
The following table outlines the estimated nominal value in millions of EUR for committed and anticipated transaction exposure and related hedges for Philips’ most significant currency exposures consolidated as of December 31, 2024:
Philips Group
Estimated transaction exposure and related hedges in millions of EUR
| | | | | | | | | | | | | | |
| Sales/Receivables | Purchases/Payable |
| Exposure | Hedges | Exposure | Hedges |
| Balance as of December 31, 2024 | | | | |
| Exposure currency | | | | |
| USD | 2,071 | | (1,669) | | (1,163) | | 1,049 | |
| JPY | 527 | | (300) | | (7) | | 7 | |
| GBP | 259 | | (161) | | (15) | | 14 | |
| CNY | 442 | | (312) | | (209) | | 209 | |
| PLN | 95 | | (62) | | (1) | | 1 | |
| CAD | 236 | | (134) | | | |
| AUD | 177 | | (104) | | | |
| CHF | 144 | | (85) | | | | | |
| KRW | 126 | | (83) | | | |
| ILS | 12 | | (8) | | (204) | | 121 | |
| EUR | 160 | | (158) | | (121) | | 121 | |
| Others | 169 | | (113) | | (23) | | 23 | |
| Total 2024 | 4,420 | | (3,188) | | (1,743) | | 1,543 | |
| Total 2023 | 4,287 | | (3,185) | | (1,346) | | 1,173 | |
Philips uses foreign exchange spot and forward contracts, as well as zero cost collars in hedging the exposure. The derivatives related to transactions are, for hedge accounting purposes, split into hedges of on-balance-sheet accounts receivable/payable and forecasted sales and purchases. Changes in the value of on-balance-sheet foreign-currency accounts receivable/payable, as well as the changes in the fair value of the hedges related to these exposures, are reported in the income statement under costs of sales. Hedges related to forecasted transactions, where hedge accounting is applied, are accounted for as cash flow hedges. The results from such hedges are deferred in other comprehensive income within equity to the extent that the hedge is effective. As of December 31, 2024, a gain of EUR 1 million was deferred in equity as a result of these hedges (2023: EUR 6 million gain). The result deferred in equity will be released to earnings mostly during 2025 at the time when the related hedged transactions affect the income statement. During 2024, nil (2023 nil) was recorded in the Consolidated statement of income as a result of ineffectiveness on certain anticipated cash flow hedges. Ineffectiveness arises when anticipated exposures are no longer expected to be highly probable. During 2024, a gain of EUR 29 million (2023 EUR 19 million gain) included in the cash flow hedges reserve in equity pertaining to changes in fair value of foreign exchange forward and option contracts was released to income statement.
The total net fair value of hedges related to transaction exposure as of December 31, 2024, was an unrealized loss of EUR 2 million. The estimated impact of a 10% increase of value of the EUR is estimated to be EUR 122 million. The following table contains an overview of the instantaneous 10% increase in the value of EUR against major currencies.
Philips Group
Estimated impact of 10% increase of value of the EUR on the fair value of hedges in millions of EUR
| | | | | | | | |
| 2023 | 2024 |
| USD | 64 | | 63 | |
| JPY | 15 | | 13 | |
| GBP | 16 | | 13 | |
| CHF | 5 | | 7 | |
| PLN | 1 | | 1 | |
| RUB | - | | 1 | |
The EUR 122 million increase includes a gain of EUR 34 million that would impact the income statement, which would largely offset the opposite revaluation effect on the underlying accounts receivable and payable, and the remaining gain of EUR 88 million would be recognized in equity to the extent that the cash flow hedges were effective.
Foreign exchange exposure also arises as a result of inter-company loans and deposits. Where the company enters into such arrangements, the financing is generally provided in the functional currency of the subsidiary entity. The currency of the company’s external funding and liquid assets is matched with the required financing of subsidiaries, either directly through external foreign currency loans and deposits, or synthetically by using foreign exchange derivatives, including cross currency interest rate swaps and foreign exchange forward contracts. In certain cases where group companies may also have external foreign currency debt or liquid assets, these exposures are also hedged through the use of foreign exchange derivatives. Changes in the fair value of hedges related to this exposure are recognized within financial income and expenses in the statements of income. When such loans would be considered part of the net investment in the subsidiary, net investment hedging would be applied.
Translation exposure of foreign-currency equity invested in consolidated entities is generally not hedged. If a hedge is entered into, it is accounted for as a net investment hedge. Net current-period change, before tax, of the currency translation reserve of positive EUR 768 million mainly relates to the development of the USD versus the EUR. As of December 31, 2024, a weakening of USD by 10% versus the EUR would result in a decrease in the currency translation reserve in equity of approximately EUR 1,275 million, while a strengthening of USD by 10% versus the EUR would result in an increase in the currency translation reserve in equity of approximately EUR 1,558 million. Refer to the country risk paragraph for countries with significant foreign currency denominated equity invested.
As of December 31, 2024, external bond funding for a nominal value of USD 1,466 million (liability at book value: EUR 1,408 million) was designated as a net investment hedge of financing investments in foreign operations for an equal amount. During 2024, no ineffectiveness was recognized in the income statement on net investment hedges arising from counterparty and own credit risk.
As of December 31, 2024, an instantaneous 10% increase in the value of the EUR against all currencies would lead to an decrease of EUR 106 million in the value of the derivatives, including a EUR 50 million decrease related to the USD.
As of December 31, 2023, external bond funding for a nominal value of USD 1,474 million (liability at book value: EUR 1,325 million) were designated as a net investment hedge of financing investments in foreign operations for an equal amount. During 2023 a total loss of EUR 2 million was recognized in the income statement as ineffectiveness on net investment hedges, arising from counterparty and own credit risk.
As of December 31, 2023, an instantaneous 10% increase in the value of the EUR against all currencies would lead to an decrease of EUR 52 million in the value of the derivatives, including a EUR 11 million increase related to the USD.
Generally Philips does not hedge the foreign exchange exposure arising from equity interests in non-functional-currency investments in associates and other non-current financial assets.
Interest rate risk
Interest rate risk is the risk that the fair value or future cash flows of a financial instrument will fluctuate because of changes in market interest rates. As of December 31, 2024, Philips had outstanding debt of EUR 7,639 million (2023: EUR 7,689 million), which constitutes an inherent interest rate risk with potential negative impact on financial results. As of December 31, 2024, Philips held EUR 2,401 million in cash and cash equivalents (2023: EUR 1,869 million), and had total long-term debt of EUR 7,113 million (2023: EUR 7,035 million) and total short-term debt of EUR 526 million (2023: EUR 654 million). As of December 31, 2024, Philips had a ratio of fixed-rate long-term debt to total outstanding debt of approximately 93% compared to 89% one year earlier. Philips debt has a long maturity profile with an average tenor of long-term debt of 5.9 years with maturities up to 2042.
The following table provides the impact of a 1% increase/decrease of interest rates on the fair value of the debt and the annualized net interest expenses.
Philips Group
Interest rate sensitivity in millions of EUR
| | | | | | | | |
| 2023 | 2024 |
| Impact 1% interest rate increase on fair value of fixed-rate long-term debt¹ ² | (283) | | (304) | |
| Impact 1% interest rate decrease on fair value of fixed-rate long-term debt¹ ² | 284 | | 304 | |
| Impact 1% interest rate increase on annualized net interest expense³ | 15 | | 23 | |
1The sensitivity analysis conducted shows that if long-term interest rates were to increase/decrease instantaneously by 1% from their level of December 31, 2024, with all other variables (including foreign exchange rates) held constant.
2Fixed-rate long-term debt is excluding forward contracts.
3The impact is based on the outstanding net floating-rate position as of December 31, 2024.
Equity price risk
Equity price risk is the risk that the fair value or future cash flows of a financial instrument will fluctuate because of changes in equity prices.
Philips is a shareholder in some publicly listed companies and as a result is exposed to potential financial loss through movements in their share prices. The aggregate equity price exposure in such financial assets amounted to approximately EUR 4 million as of December 31, 2024 (2023: EUR 14 million). Philips does not hold derivatives in the above-mentioned listed companies. Philips also has shareholdings in several privately-owned companies amounting to EUR 220 million, mainly consisting of minority stakes in companies in various industries. As a result, Philips is exposed to potential value adjustments.
Commodity price risk
Commodity price risk is the risk that the fair value or future cash flows of a financial instrument will fluctuate because of changes in commodity prices.
Philips is a purchaser of certain base metals, precious metals and energy. Philips may hedge certain commodity price risks using derivative instruments to minimize significant, unanticipated earnings fluctuations caused by commodity price volatility. As of December 31, 2024 Philips had financial commodity derivatives outstanding to the value of EUR 6 million (2023: nil).
Credit risk
Credit risk represents the loss that would be recognized at the reporting date, if counterparties failed completely to perform their payment obligations as contracted. Credit risk is present within Philips trade receivables and contract assets. To have better insights into the credit exposures, Philips performs ongoing evaluations of the financial and non-financial condition of its customers and adjusts credit limits when appropriate. In instances where the creditworthiness of a customer is determined not to be sufficient to grant the credit limit required, there are a number of mitigation tools that can be utilized to close the gap, including reducing payment terms, cash on delivery, pre-payments and pledges on assets.
Philips invests available cash and cash equivalents with various financial institutions and is exposed to credit risk with these counterparties. Philips is also exposed to credit risks in the event of non-performance by financial institutions with respect to financial derivative instruments. Philips actively manages concentration risk and on a daily basis measures the potential loss under certain stress scenarios, should a financial institution default. These worst-case scenario losses are monitored and limited by the company.
The company does not enter into any financial derivative instruments to protect against default by financial institutions. However, where possible the company requires all financial institutions with which it deals in derivative transactions to complete legally enforceable netting agreements under an International Swap Dealers Association master agreement or otherwise prior to trading, and whenever possible, to have a strong credit rating. Philips also regularly monitors the development of the credit risk of its financial counterparties. Wherever possible, cash is invested and financial transactions are concluded with financial institutions with strong credit ratings or with governments or government-backed institutions.
The following table shows the number of financial institutions with credit rating A- and above with which Philips has cash at hand and short-term deposits above EUR 10 million as of December 31, 2024.
Philips Group
Credit risk with number of counterparties for deposits above EUR 10 million
| | | | | | | | | | | |
| 10-100 million | 100-500 million | 500 million and above |
| AAA rated bank counterparties | | 2 | |
| AA- rated bank counterparties | 1 | | |
| A+ rated bank counterparties | 1 | 4 | |
| A rated bank counterparties | 2 | 2 | |
| A- rated bank counterparties | 2 | 2 | |
| Total | 6 | 10 | |
Country risk
Country risk is the risk that political, legal, or economic developments in a single country could adversely impact performance. The country risk per country is defined as the sum of the equity of all subsidiaries and associated companies in country cross-border transactions, such as intercompany loans, accounts receivable from third parties and intercompany accounts receivable. The country risk is monitored on a regular basis.
As of December 31, 2024, the company had country risk exposure of EUR 13.6 billion in the United States, EUR 2.3 billion in the Netherlands, EUR 872 million in China (including Hong Kong). Other countries higher than EUR 500 million are United Kingdom EUR 787 million, Japan EUR 635 million and Germany EUR 625 million. Other countries with significant exposure are: Israel EUR 301 million, Singapore EUR 221 million, and India EUR 226 million. The degree of risk of a country is taken into account when new investments are considered. The company does not, however, use financial derivative instruments to hedge country risk.
The impact of hyperinflation is also routinely assessed and was not material for the periods presented.
Other insurable risks
Philips is insured for a broad range of losses by global insurance policies in the areas of property damage/business interruption, general and product liability, transport, directors’ and officers’ liability, employment practice liability, crime and cybersecurity. The counterparty risk related to the insurance companies participating in the above-mentioned global insurance policies is actively managed. As a rule, Philips only selects insurance companies with a financial strength of at least A-. Throughout the year the counterparty risk is monitored on a regular basis.
To lower exposures and to avoid potential losses, Philips has a global Risk Engineering program in place. The main focus of this program is on property damage and business interruption risks including company interdependencies. Regular on-site assessments take place at Philips locations and business-critical suppliers by risk engineers of the insurer in order to provide an accurate assessment of the potential loss and its impact. The results of these assessments are shared across the company’s stakeholders. On-site assessments are carried out against the predefined Risk Engineering standards, which are agreed between Philips and the insurers. Recommendations are made in a Risk Improvement report and are monitored centrally. This is the basis for decision-making by the local management of the business as to which recommendations will be implemented.
For all policies, deductibles are in place, which vary from EUR 0 million to EUR 10 million per occurrence, and this variance is designed to differentiate between the existing risk categories within Philips. Above a first layer of working deductibles, Philips operates its own re-insurance captive, which during 2024 retained EUR 25 million per claim and EUR 50 million in the annual aggregate for general, product, professional liability, and marine cargo claims and EUR 15 million aggregate for cyber.
New contracts were signed effective December 31, 2024, for the coming year, whereby the re-insurance captive retention remained the same.
30 Subsequent events
On January 28, 2025, Philips announced that it has signed an agreement to sell its Emergency Care Business Unit, which is part of the Connected Care segment, to Bridgefield Capital. The transaction is subject to the satisfaction of certain closing conditions and receipt of regulatory approval, and is expected to be completed in the second half of 2025.
10 Further information
10.1 Corporate governance report
10.1.1 Introduction
Management and oversight responsibilities and accountability within our company are ultimately guided by the corporate governance of the parent company of the Philips group, Koninklijke Philips N.V. (Royal Philips). Royal Philips is a company organized under Dutch law and its shares have been listed on the Amsterdam stock exchange (Euronext Amsterdam) since 1912. Furthermore, its shares have been traded in the United States since 1962 and have been listed on the New York Stock Exchange since 1987.
Royal Philips has a two-tier board structure consisting of a Board of Management and a Supervisory Board, each of which is accountable to the General Meeting of Shareholders for the fulfillment of its respective duties. The members of the Board of Management, supported by the other members of the Executive Committee drive the company’s management agenda and share responsibility for the continuity of the Philips group, focusing on sustainable long-term value creation. Our independent Supervisory Board supervises the Board of Management and the Executive Committee and advises them on general policies related to the activities of the company, including setting and executing the strategy of the Philips group. These responsibilities include the oversight of the Environmental, Social and Governance (ESG) dimensions and their integration into the company’s overarching strategy, which is a responsibility of the Supervisory Board as a whole because of their significance.
The company is governed by Dutch corporate and securities laws, its Articles of Association, and the Rules of Procedure of the Board of Management and the Executive Committee and of the Supervisory Board, respectively. Its corporate governance framework is also based on the Dutch Corporate Governance Code (dated December 20, 2022) and US laws and regulations applicable to Foreign Private Issuers.
In this Corporate governance report, the company addresses the main elements of its corporate governance structure, reports on how it applies the principles and best practices of the Dutch Corporate Governance Code, and provides the information required by the Dutch governmental Decree on Corporate Governance (Besluit inhoud bestuursverslag) and governmental Decree on Article 10 Takeover Directive (Besluit artikel 10 overnamerichtlijn). When deemed necessary in the interests of the company, the company may deviate from aspects of the company’s corporate governance structure, and any such deviations will be disclosed in the company’s Corporate governance report.
In compliance with the Dutch Corporate Governance Code, other parts of the management report (within the meaning of article 2:391 of the Dutch Civil Code) included in the Annual Report address the strategy and culture of Philips aimed at sustainable long-term value creation. As described in more detail in Strategic focus, Philips’ strategy is driven by our purpose: to improve people’s health and well-being through meaningful innovation. The Message from the CEO explains how this strategy was executed in 2024; refer also to Financial performance. Furthermore, reference is made to the Philips integrated operating model, which, among others, includes standards for behaviors, quality, and integrity within Philips.
10.1.2 Board of Management and Executive Committee
Introduction
The Board of Management is entrusted with the management of the company. Certain key officers have been appointed to support the Board of Management in the fulfillment of its managerial duties. The members of the Board of Management and these key officers together constitute the Executive Committee, which currently consists of 13 members. In this Corporate governance report, wherever the Executive Committee is mentioned, this also includes the members of the Board of Management, unless the context requires otherwise. Please refer to Board of Management and Executive Committee for an overview of the current members. Under the chairmanship of the President/Chief Executive Officer (CEO), and supported by the other members of the Executive Committee, the members of the Board of Management drive the company’s management agenda and share responsibility for the continuity of the Philips group. Please refer to the Rules of Procedure of the Board of Management and the Executive Committee, which are published on the company’s website, for a description of further responsibilities and tasks, as well as procedures for meetings, resolutions, and minutes.
In fulfilling their duties, the members of the Board of Management and Executive Committee are guided by the interests of the company and its affiliated enterprise, taking into account the interests of its stakeholders. The Board of Management and the Executive Committee have adopted a division of responsibilities based on the Functions and Businesses, each of which is monitored and reviewed by the individual members. The Board of Management is accountable for the actions and decisions of the Executive Committee and has ultimate responsibility for the company’s external reporting (including reporting to the shareholders of the company).
The Board of Management and the Executive Committee are supervised by the Supervisory Board. Members of the Board of Management and the Executive Committee will be present in the meetings of the Supervisory Board, if so invited. In addition, the CEO and other members of the Board of Management (and if needed, the other members of the Executive Committee) meet on a regular basis with the Chairman and other members of the Supervisory Board. The Board of Management and the Executive Committee are required to keep the Supervisory Board informed of all facts and developments concerning Philips that the Supervisory Board may need to be aware of in order to function as required and to properly carry out its duties.
Certain important decisions of the Board of Management require Supervisory Board approval, including decisions concerning: the operational and financial objectives of the company and the strategy designed to achieve these objectives; the issue, repurchase or cancellation of shares; and major acquisitions or divestments.
Appointment and composition
Members of the Board of Management, including the CEO, are appointed by the General Meeting of Shareholders upon a binding recommendation drawn up by the Supervisory Board after consultation with the CEO. This binding recommendation may be overruled by a resolution of the General Meeting of Shareholders adopted by a simple majority of the votes cast and representing at least one-third of the issued share capital. If a simple majority of the votes cast is in favor of the resolution to overrule the binding recommendation, but such majority does not represent at least one-third of the issued share capital, a new meeting may be convened, at which the resolution may be passed by a simple majority of the votes cast, regardless of the portion of the issued share capital represented by such majority. In the event that a binding recommendation has been overruled, a new binding recommendation shall be submitted to the General Meeting of Shareholders. If such second binding recommendation has been overruled, the General Meeting of Shareholders shall be free to appoint a board member.
The CEO and the other members of the Board of Management are appointed for a (maximum) term of four years, it being understood that this term expires at the closing of the General Meeting of Shareholders to be held in the fourth calendar year after the year of their appointment or, if applicable, at a later retirement date or other contractual termination date in the fourth year, unless the General Meeting of Shareholders resolves otherwise. The same applies in the case of re-appointment, which is possible for consecutive terms of (a maximum of) four years. A (re-)appointment schedule for the Board of Management is published on the company’s website.
Pursuant to Dutch law, the members of the Board of Management are engaged by means of a services agreement (overeenkomst van opdracht). The term of the services agreement is aligned with the term for which the relevant member has been appointed by the General Meeting of Shareholders. In the event of termination of the services agreement by the company, severance payment is limited to a maximum of one year’s base salary. The services agreements provide no additional termination benefits.
Members of the Board of Management may be suspended by the Supervisory Board and by the General Meeting of Shareholders, and members of the Board of Management may be dismissed by the General Meeting of Shareholders (in each case in accordance with the Articles of Association). A shareholders’ resolution to suspend or dismiss a member of the Board of Management, other than a resolution proposed by the Board of Management or the Supervisory Board, may only be adopted by a simple majority of the votes cast, representing at least one-third of the issued share capital. The other members of the Executive Committee are appointed, suspended and dismissed by the CEO, subject to approval by the Supervisory Board.
10.1.3 Supervisory Board
Introduction
The Supervisory Board oversees the policies, management and general affairs of Philips, and assists the Board of Management and the Executive Committee with advice on general policies related to the activities of the company. In fulfilling their duties, the members of the Supervisory Board shall be guided by the interests of the company and its affiliated enterprise, taking into account the interests of its stakeholders.
In the two-tier corporate structure under Dutch law, the Supervisory Board is a separate body that is independent of the Board of Management and the company. Its independent character is also reflected in the requirement that members of the Supervisory Board can be neither a member of the Board of Management nor an employee of the company. Currently, the Supervisory Board as a whole is considered independent, as 10 out of 11 members are independent under the Dutch Corporate Governance Code, and for Mr Ribadeau-Dumas the independence exception of best practice provision 2.1.7(iii) of the Dutch Corporate Governance Code is deemed to apply. Furthermore, all members of its Audit Committee are independent under the rules of the US Securities and Exchange Commission, applicable to the Audit Committee.
The Supervisory Board must approve certain important decisions of the Board of Management, including decisions concerning the operational, business and financial objectives of the company and the strategy designed to achieve these objectives; the issue, repurchase or cancellation of shares; and major acquisitions or divestments. The Supervisory Board and its individual members each have a responsibility to request from the Board of Management, the Executive Committee and the external auditor all information that the Supervisory Board needs in order to be able to carry out its duties properly as a supervisory body.
Please refer to the Rules of Procedure of the Supervisory Board, which are published on the company’s website, for a description of further responsibilities and tasks, as well as procedures for meetings, resolutions and minutes.
In its report (included in the company’s Annual Report), the Supervisory Board describes the composition and functioning of the Supervisory Board and its committees, their activities in the financial year, the number of committee meetings held and the main items discussed. Please refer to Supervisory Board report. Please also refer to Members of the Supervisory Board for an overview of the current members of the Supervisory Board.
Appointment and composition
Members of the Supervisory Board are appointed by the General Meeting of Shareholders upon a binding recommendation drawn up by the Supervisory Board. This binding recommendation may be overruled by a resolution of the General Meeting of Shareholders adopted by a simple majority of the votes cast and representing at least one-third of the issued share capital. If a simple majority of the votes cast is in favor of the resolution to overrule the binding recommendation, but such majority does not represent at least one-third of the issued share capital, a new meeting may be convened. At this new meeting the resolution may be passed by a simple majority of the votes cast, regardless of the portion of the issued share capital represented by such majority. In the event that a binding recommendation has been overruled, a new binding recommendation shall be submitted to the General Meeting of Shareholders. If such second binding recommendation has been overruled, the General Meeting of Shareholders shall be free to appoint a board member.
The term of appointment of members of the Supervisory Board expires at the closing of the General Meeting of Shareholders to be held after a period of four years following their appointment. There is no age limit requiring the retirement of board members.
In line with the Dutch Corporate Governance Code, members of the Supervisory Board are eligible for re-appointment for a fixed term of four years once, and may subsequently be re-appointed for a period of two years, which appointment may be extended by at most two years. The report of the Supervisory Board must state the reasons for any re-appointment beyond an eight-year period.
A (re-)appointment schedule for the Supervisory Board is published on the company’s website.
Members of the Supervisory Board may be suspended or dismissed by the General Meeting of Shareholders in accordance with the Articles of Association. A resolution to suspend or dismiss a member of the Supervisory Board, other than a resolution proposed by the Supervisory Board, may only be adopted by a simple majority of the votes cast, representing at least one third of the issued share capital.
Candidates for appointment to the Supervisory Board are selected taking into account the company’s Diversity Policy, which is published on the company’s website. The Supervisory Board’s composition furthermore follows the profile included in the Rules of Procedure of the Supervisory Board, and the size of the board may vary as it considers appropriate to support its profile. Please refer to Supervisory Board report by the Members of the Supervisory Board. Typically, newly appointed members of the Supervisory Board follow an induction program and interact with Executive Committee members for deep-dives on matters such as strategy, finance and investor relations, quality, governance, legal, sustainability and digitization. Effective 2022, Dutch law provides a mandatory gender quota, requiring that at least one-third of the Supervisory Board members are women and at least one-third men (for calculation purposes, a total number of board members that cannot be divided by three must be rounded up to the next number that can be divided by three). The quota is applicable to (i) the appointment of new Supervisory Board members, and (ii) the re-appointment of acting board members after eight years following their initial appointment. Except in certain exceptional circumstances, any appointment or re-appointment resulting in a Supervisory Board composition that does not meet (or no longer meets) the quota, will be invalid (null and void).
As announced on August 14, 2023, Philips and Exor N.V. entered into a Relationship Agreement on August 13, 2023, which has been published on the company's website. The relationship agreement includes Exor’s commitment to be a long-term minority investor in Philips and its right to propose one member to the Supervisory Board. In this context, it is noted that, for as long as Exor has such nomination right pursuant to the relationship agreement, the independence exception of best practice provision 2.1.7(iii) of the Dutch Corporate Governance Code is deemed to apply to any Exor nominee that has been appointed upon such nomination in accordance with the Relationship Agreement.
Supervisory Board committees
The Supervisory Board, while retaining overall responsibility, has assigned certain tasks to four committees: the Corporate Governance and Nomination & Selection Committee, the Remuneration Committee, the Audit Committee, and the Quality & Regulatory Committee. Each committee reports to the full Supervisory Board. Please refer to the charters of the respective committees, which are published on the company’s website as part of the Rules of Procedure of the Supervisory Board, for a description of their responsibilities, composition, meetings and working procedures.
The Corporate Governance and Nomination & Selection Committee is responsible for preparing selection criteria and appointment procedures for members of the Supervisory Board, the Board of Management and the Executive Committee. The Committee makes proposals to the Supervisory Board for the (re)appointment of such members, and periodically assesses their functioning. The Committee also periodically assesses the Executive Committee succession planning and the Diversity Policy, and supervises the policy of the Executive Committee on the selection criteria and appointment procedures for Philips executives. At least once a year, the Committee reviews the corporate governance principles applicable to the company, and advises the Supervisory Board on any changes to these principles that it deems appropriate.
The Remuneration Committee is responsible for preparing decisions of the Supervisory Board on the remuneration of individual members of the Board of Management and the Executive Committee. The Committee prepares an annual remuneration report, which is published on the company’s website by the Supervisory Board ahead of the Annual General Meeting of Shareholders. In performing its duties and responsibilities, the Remuneration Committee is assisted by an external consultant and an in-house remuneration expert.
The Audit Committee assists the Supervisory Board in fulfilling its oversight responsibilities for: the integrity of the company’s financial statements; the financial and non-financial (ESG) reporting processes; the effectiveness (also in respect of the reporting process) of the risk management and internal controls framework; the internal and external audit process; the internal and external auditor’s qualifications, independence and performance; and the company’s process for monitoring compliance with laws and regulations and the General Business Principles (including related manuals, training and tools). It reviews the company’s annual and interim financial statements, including non-financial information, prior to publication and advises the Supervisory Board on the adequacy and appropriateness of internal control policies and internal audit programs and their findings. The Committee furthermore supervises the Internal Audit Function, maintains contact with and supervises the external auditor and prepares the nomination of the external auditor for appointment by the General Meeting of Shareholders.
The composition of the Audit Committee meets the relevant requirements under Dutch law and the applicable US rules. All of the members are considered to be independent and financially literate, and the Audit Committee as a whole has competence relevant to the sector in which the company is operating. In addition, Liz Doherty is designated as an Audit Committee financial expert, as defined under the regulations of the US Securities and Exchange Commission. The Supervisory Board considers the expertise and experience available in the Audit Committee, in conjunction with the possibility to take advice from internal and external experts and advisors, to be sufficient for the fulfillment of the tasks and responsibilities of the Audit Committee.
The Quality & Regulatory Committee has been established by the Supervisory Board in view of the central importance of the quality and (patient) safety of the company’s products, systems, services and software, as well as the development, testing, manufacturing, marketing and servicing thereof, and the regulatory requirements relating thereto. The Quality & Regulatory Committee assists the Supervisory Board in fulfilling its oversight responsibilities in this area, while recognizing that the Audit Committee assists the Supervisory Board in its oversight of other areas of regulatory, compliance and legal matters.
10.1.4 Other Board-related matters
Remuneration and share ownership
The remuneration of the individual members of the Board of Management is determined by the Supervisory Board, taking into account the remuneration policy adopted by the General Meeting of Shareholders. The remuneration of the individual members of the Supervisory Board is determined by the General Meeting of Shareholders, also on the basis of a remuneration policy.
The current remuneration policies for the Board of Management and the Supervisory Board, respectively, were adopted in 2024 and are published on the company’s website. Pursuant to Dutch law, the shareholders are entitled to vote on the adoption of the separate remuneration policies for the Board of Management and the Supervisory Board at the Annual General Meeting of Shareholders (at least) every four years. The adoption of a remuneration policy will require a special majority of three-quarters of the votes cast (as the Articles of Association do not provide for a lower majority).
A description of the composition of the remuneration paid and owed to the individual members of the Board of Management and the Supervisory Board is included in the annual remuneration report (as prepared by the Remuneration Committee, adopted by the Supervisory Board and published on the company’s website). Shareholders have an advisory vote at each Annual General Meeting of Shareholders on the remuneration report relating to the preceding financial year.
Pursuant to Dutch law, the Supervisory Board is authorized to reduce or eliminate unpaid bonuses awarded to members of the Board of Management if payment or delivery of the bonus would be unacceptable according to the principles of reasonableness and fairness. The company, which in this respect may also be represented by the Supervisory Board or a special representative appointed for this purpose by the General Meeting of Shareholders, may also request return of bonuses already paid or delivered insofar as these have been granted on the basis of incorrect information on the fulfillment of the relevant performance criteria or other conditions. Bonuses are broadly defined as ‘non-fixed’ (variable) remuneration – either in cash or in the form of share-based compensation – that is conditional in whole or in part on the achievement of certain targets or the occurrence of certain circumstances. The explanatory notes to the balance sheet shall report on any moderation and/or claim for repayment of Board of Management remuneration. No such reduction of unpaid bonuses or requests for repayment occurred during the financial year 2024.
In compliance with the Dutch Corporate Governance Code, the company does not grant personal loans to, or guarantees on behalf of, members of the Board of Management or the Supervisory Board. No such loans were granted and no such guarantees were issued in 2024, nor were any loans or guarantees outstanding as of December 31, 2024.
Also in compliance with the Dutch Corporate Governance Code, the Articles of Association provide that shares or rights to shares shall not be granted to members of the Supervisory Board.
Members of the Board of Management and the Supervisory Board may only hold shares in the company for the purpose of long-term investment and must refrain from short-term transactions in Philips securities. According to Philips’ internal rules of conduct with respect to inside information, members of the Board of Management and the Supervisory Board are only allowed to trade in Philips securities (including the exercise of stock options) during ‘windows’ of 20 business days following the publication of annual and quarterly results (provided further the person involved has no inside information regarding Philips at that time, unless an exemption is available). Furthermore, members of the Board of
Management and the Supervisory Board are prohibited from trading, directly or indirectly, in securities of any of the companies belonging to Philips’ peer group (as determined by the Supervisory Board) during one week preceding the disclosure of Philips’ annual or quarterly results.
Transactions in Philips shares carried out by members of the Board of Management and the Supervisory Board are reported to the Dutch Authority for the Financial Markets (AFM) in accordance with the EU Market Abuse Regulation and, if necessary, to other relevant authorities.
Indemnification
Unless Dutch law provides otherwise, the members of the Board of Management and of the Supervisory Board shall be reimbursed by the company for various costs and expenses, such as the reasonable costs of defending claims, as formalized in the Articles of Association. Under certain circumstances, described in the Articles of Association, such as an act or failure to act by a member of the Board of Management or a member of the Supervisory Board that can be characterized as intentional (opzettelijk), intentionally reckless (bewust roekeloos) or seriously culpable (ernstig verwijtbaar), there will be no entitlement to this reimbursement unless the law or the principles of reasonableness and fairness require otherwise. The company has also taken out liability insurance (D&O – Directors & Officers) for the persons concerned.
Diversity
The selection of candidates for appointment is always based on merit. Candidates for appointment to the Supervisory Board, the Board of Management and the Executive Committee are selected also taking into account the company’s Diversity Policy for the Supervisory Board, the Board of Management and the Executive Committee. This Diversity Policy aims at a sufficient diversity of views and the expertise needed for a good understanding of current affairs and longer-term risks and opportunities related to the Company’s business, and is published on the company’s website. Effective 2022, Dutch law provides that (re-)appointments of members of the Supervisory Board must be in accordance with a mandatory gender quota, requiring that at least one-third of the Supervisory Board members are women (and at least one-third are men). There are certain exceptions where the gender quota does not apply, such as the re-appointments within eight years of the initial appointment and (re-)appointments made in exceptional circumstances.
Philips’ commitment to Inclusion & Diversity is also reflected in the company-wide General Business Principles, the Inclusion & Diversity Policy and the Fair Employment Policy.
Conflicts of interest
Dutch law on conflicts of interest provides that members of the Board of Management or Supervisory Board may not participate in the adoption of resolutions if they have a direct or indirect personal conflict of interest with the company or related enterprise. If all members of the Board of Management have a conflict of interest, the resolution concerned will be considered by the Supervisory Board. If all members of the Supervisory Board have a conflict of interest, the resolution concerned must be considered by the General Meeting of Shareholders.
In compliance with the Dutch Corporate Governance Code, the company’s corporate governance includes rules to specify situations in which a potential or actual conflict may exist, procedures to avoid such conflicts of interest as much as possible, and procedures to deal with such conflicts should they arise. Relevant matters relating to conflicts of interest, if any, must be mentioned in the Annual Report (specifically the management report) for the financial year in question. No decision to enter into any such material transaction in which there is a conflict of interest with a member of the Board of Management or the Supervisory Board, or with any major shareholder (holding at least 10% of the company’s shares) was taken during the financial year 2024.
Outside directorships
In compliance with the Dutch Corporate Governance Code, members of the Board of Management require the approval of the Supervisory Board before they can accept a position as a member of a supervisory board or a position as a non-executive director on a one-tier board (Non-Executive Directorship) at another company. The Supervisory Board must be notified of other important positions (to be) held by a member of the Board of Management.
Dutch law provides for certain limitations on the number of Non-Executive Directorships a member of the Board of Management or Supervisory Board may hold. No member of the Board of Management shall hold more than two Non-Executive Directorships at ‘large’ companies (naamloze vennootschappen or besloten vennootschappen) or ‘large’ foundations (stichtingen), as defined under Dutch law, and no member of the Board of Management shall hold the position of chairman of another one-tier board or the position of chairman of another supervisory board. No member of the Supervisory Board shall hold more than five Non-Executive Directorships at such companies or foundations, with a position as chairman counting for two. During the financial year 2024 all members of the Board of Management and the Supervisory Board complied with the limitations described above in this paragraph.
10.1.5 General Meeting of Shareholders
Meetings
The Annual General Meeting of Shareholders shall be held no later than six months after the end of the financial year. The agenda for the meeting typically includes: an advisory vote on the remuneration report; discussion of the Annual Report; the adoption of the financial statements; policy on additions to reserves and dividends; any proposed dividends or other distributions; discharge of the members of the Board of Management and the Supervisory Board; and any other matters proposed by the Supervisory Board, the Board of Management or shareholders in accordance with Dutch law and the Articles of Association.
Shareholders’ meetings are convened by public notice via the company’s website, and registered shareholders are notified by letter or by electronic means of communication at least 42 days prior to the day of the relevant meeting. Shareholders who wish to exercise the rights attached to their shares in respect of a shareholders’ meeting are required to register for such meeting. Shareholders may attend a meeting in person, vote by proxy (via an independent third party) or grant a power of attorney to a third party to attend the meeting and vote on their behalf. Details on registration for meetings, attendance and proxy voting will be included in the notice convening the relevant meeting.
Pursuant to Dutch law, the record date for the exercise of voting rights and rights relating to shareholders’ meetings is set at the 28th day prior to the day of the relevant meeting. Shareholders registered on such date are entitled to attend the meeting and to exercise the other shareholder rights (at the relevant meeting) notwithstanding any subsequent sale of their shares after the record date.
In accordance with the Articles of Association and Dutch law, requests from shareholders for items to be included on the agenda will generally be honored, subject to the company’s rights to refuse to include the requested agenda item under Dutch law, provided that such requests are made in writing at least 60 days before a General Meeting of Shareholders to the Board of Management and the Supervisory Board by shareholders representing at least 1% of the company’s outstanding capital or, according to the official price list of Euronext Amsterdam, representing a value of at least EUR 50 million. Written requests may be submitted electronically and shall comply with the procedure stipulated by the Board of Management, which is posted on the company’s website.
Pursuant to Dutch law, shareholders requesting an item to be included on the agenda of a meeting have an obligation to disclose their full economic interest (i.e., long position and short position) to the company. The company has the obligation to publish such disclosures on its website.
Main powers of the General Meeting of Shareholders
The main powers of the General Meeting of Shareholders are:
•to appoint, suspend and dismiss members of the Board of Management and the Supervisory Board
•to adopt remuneration policies for the Board of Management and the Supervisory Board, to determine the remuneration of the individual members of the Supervisory Board and to approve long-term incentive (equity-based) plans for the Board of Management
•to adopt the annual accounts, to declare dividends and to discharge the Board of Management and the Supervisory Board from any liability in respect of the performance of their respective duties for the previous financial year
•to appoint the company’s external auditor
•to adopt amendments to the Articles of Association and proposals to dissolve or liquidate the company
•to issue shares or rights to shares
•to restrict or exclude pre-emptive rights of shareholders and to repurchase or cancel outstanding shares
•in accordance with Dutch law, to approve decisions of the Board of Management that are so far-reaching that they would greatly change the identity or nature of the company or the business
The company applies principle 4.1 of the Dutch Corporate Governance Code within the framework of the Articles of Association and Dutch law and in the manner described in this Corporate governance report. All issued and outstanding shares carry voting rights and each share confers the right to cast one vote in a shareholders’ meeting. Pursuant to Dutch law, no votes may be cast at a General Meeting of Shareholders in respect of shares that are held by the company. There are no special statutory rights attached to the shares of the company, and no restrictions on the voting rights of the company’s shares exist. Subject to certain exceptions provided by Dutch law and/or the Articles of Association, resolutions of the General Meeting of Shareholders are passed by an absolute majority of votes cast and do not require a quorum.
Share capital: issue and repurchase of (rights to) shares
The authorized share capital of the company amounts to EUR 800 million, divided into 2 billion common shares with a nominal value of 20 eurocents each and 2 billion preference shares also with a nominal value of 20 eurocents each. On December 31, 2024, the issued share capital amounted to EUR 187,987,876.80 divided into 939,939,384 common shares and no preference shares. All shares are fully paid-up. There are currently no limitations, either under Dutch law or the Articles of Association, to the transfer of the common shares.
Only Euroclear shares are traded on Euronext Amsterdam. Only New York Registry Shares are traded on the New York Stock Exchange. Pursuant to article 10:138(2) of the Dutch Civil Code, the laws of the State of New York are applicable to the proprietary regime with respect to the New York Registry Shares, which proprietary regime includes the requirements for a transfer of, or the creation of an in rem right in, such New York Registry Shares. Euroclear shares and New York Registry Shares may be exchanged for each other.
As per December 31, 2024, approximately 91% of the common shares were held through the system of Euroclear Nederland (Euroclear shares) and approximately 9% of the common shares were represented by New York Registry Shares issued in the name of approximately 765 holders of record. The latter include Cede & Co. Cede & Co acts as nominee for The Depository Trust Company, which holds the shares (indirectly) for individual investors as beneficiaries. Deutsche Bank Trust Company Americas is Philips’ New York transfer agent, registrar and dividend disbursing agent. Since certain shares are held by brokers and other nominees, these numbers may not be representative of the actual number of US beneficial holders or the number of New York Registry Shares beneficially held by US residents.
At the 2024 Annual General Meeting of Shareholders, it was resolved to authorize the Board of Management, subject to the approval of the Supervisory Board, to issue shares or to grant rights to acquire shares in the company, as well as to restrict or exclude the pre-emption right accruing to shareholders up to and including November 6, 2025. This authorization is limited to a maximum of 10% of the number of shares issued as of May 7, 2024.
In addition, at the 2024 Annual General Meeting of Shareholders, it was resolved to authorize the Board of Management, subject to the approval of the Supervisory Board, to acquire shares in the company within the limits of the Articles of Association and within a certain price range up to and including November 6, 2025. The maximum number of shares the company may hold will not exceed 10% of the issued share capital as of May 7, 2024. The number of shares may be increased by 10% of the issued capital as of that same date in connection with the execution of share repurchase programs for capital reduction programs.
10.1.6 Annual financial statements and external audit
The annual financial statements are prepared by the Board of Management and reviewed by the Supervisory Board upon the advice of its Audit Committee, taking into account the report of the external auditor. Upon approval by the Supervisory Board, the accounts are signed by all members of both the Board of Management and the Supervisory Board and are published together with the opinion of the external auditor. The Board of Management is responsible, under the supervision of the Supervisory Board, for the quality and completeness of such publicly disclosed financial reports. The annual financial statements are presented for discussion and adoption at the Annual General Meeting of Shareholders, to be convened subsequently.
The external auditor is appointed by the General Meeting of Shareholders in accordance with the Articles of Association. Philips’ external auditor, Ernst & Young Accountants LLP, an independent registered public accounting firm, was appointed by the General Meeting of Shareholders held on May 7, 2015, for a term of four years starting January 1, 2016, was re-appointed at the Annual General Meeting of Shareholders held on May 9, 2019, for a term of three years starting January 1, 2020, was re-appointed at the Annual General Meeting of Shareholders held on May 10, 2022, for a term of one year starting January 1, 2023, and was re-appointed at the Annual General Meeting of Shareholders held on May 9, 2023, for a term of one year starting January 1, 2024.
In 2023, following a competitive audit tender completed under the leadership of the Audit Committee in anticipation of the expiration of EY Accountants B.V.'s (the legal successor of Ernst & Young Accountants LLP) statutory audit mandate, the Supervisory Board, upon the recommendation of the Audit Committee, recommended the appointment of PricewaterhouseCoopers Accountants N.V. as the company’s new external auditor to the General Meeting of Shareholders. PricewaterhouseCoopers Accountants N.V., an independent registered public accounting firm, was appointed at the Annual General Meeting of Shareholders held on May 9, 2023, as the company’s new external auditor for a term of four years starting January 1, 2025. As a result, following completion of EY Accountants B.V.'s audit of our financial statements as of and for the year ended December 31, 2024, and the audit of the effectiveness of internal control over financial reporting as of December 31, 2024, PricewaterhouseCoopers Accountants N.V. will become Philips’ external auditor.
EY Accountants B.V.'s reports on our consolidated financial statements for each of the years ended December 31, 2024 and 2023, did not contain an adverse opinion or disclaimer of opinion, nor was any report qualified or modified as to uncertainty, audit scope or accounting principles.
During our two most recent fiscal years and the subsequent interim period through February 21, 2025, there were no disagreements with EY Accountants B.V. (or its legal predecessor), whether or not resolved, on any matter of accounting principles or practices, financial statement disclosure, or auditing scope or procedures, which disagreement, if not resolved to the satisfaction of EY Accountants B.V., would have caused EY Accountants B.V. to make a reference to the subject matter of the disagreement in connection with any reports it would have issued.
During our two most recent fiscal years and the subsequent interim period through February 21, 2025, there were no 'reportable events' as that term is defined in Item 16F(a)(1)(v) of Form 20-F.
We have provided EY Accountants B.V. with a copy of the foregoing disclosure, and we have requested that it furnish us with a letter addressed to the SEC stating whether or not it agrees with the above disclosures. A copy of this letter is filed as Exhibit 15(b) to this Form 20-F.
We did not consult PricewaterhouseCoopers Accountants N.V. during our two most recent fiscal years and the subsequent interim period through February 21, 2025 regarding (i) the application of accounting principles to a specific completed or contemplated transaction or the type of audit opinion that might be rendered on our financial statements; or (ii) any matter that was the subject of a disagreement as that term is used in Item 16F(a)(1)(iv) of Form 20-F or a 'reportable event' as described in Item 16F(a)(1)(v) of Form 20-F.
European and Dutch law requires the separation of audit and certain non-audit services. The external auditor may only provide audit and audit-related services and is prohibited from providing any other services. This is reflected in the Auditor Policy, which is published on the company’s website. The policy is also in line with (and in some ways stricter than) applicable US rules, under which the appointed external auditor must be independent from the company both in fact and appearance.
The Auditor Policy specifies certain audit services and audit-related services (also known as assurance services) that will or may be provided by the external auditor, and includes rules for the pre-approval by the Audit Committee of such services. Audit services must be pre-approved on the basis of the annual audit services engagement agreed with the external auditor. Proposed audit-related services may be pre-approved at the beginning of the year by the Audit Committee (annual pre-approval) or may be pre-approved during the year by the Audit Committee with respect to a particular engagement (specific pre-approval). The annual pre-approval is based on a detailed, itemized list of services to be provided, which is designed to ensure that there is no management discretion in determining whether a service has been approved, and to ensure that the Audit Committee is informed of each of the services it is pre-approving. Unless pre-approval with respect to a specific service has been given at the beginning of the year, each proposed service requires specific pre-approval during the year. Any annually pre-approved services where the fee for the engagement is expected to exceed pre-approved cost levels or budgeted amounts will also require specific pre-approval. The term of any annual pre-approval is 12 months from the date of the pre-approval unless the Audit Committee states otherwise. During 2024, there were no services provided to the company by the external auditor that were not pre-approved by the Audit Committee.
10.1.7 Stichting Preferente Aandelen Philips
Stichting Preferente Aandelen Philips, a foundation (stichting) organized under Dutch law, has been granted the right to acquire preference shares in the capital of Royal Philips, as stated in the company’s Articles of Association. In addition, the Foundation has the right to file a petition with the Enterprise Chamber of the Amsterdam Court of Appeal to commence an inquiry procedure within the meaning of article 2:344 of the Dutch Civil Code.
The object of the Foundation is to represent the interests of Royal Philips, the enterprises maintained by the company and its affiliated companies within the company’s group, in such a way that the interests of the company, these enterprises and all parties involved with them are safeguarded as effectively as possible, and that they are afforded maximum protection against influences which, in conflict with those interests, may undermine the autonomy and identity of Philips and those enterprises, and also to do anything related to the above ends or conducive to them. The Foundation's object includes the protection of Philips against (an attempt at) an unsolicited takeover or other attempt to exert (de facto) control of the company. The arrangement will allow Philips to determine its position in relation to the relevant third party (or parties) and its (their) plans, to seek alternatives and to defend the company’s interests and those of its stakeholders.
The mere notification that the Foundation exercises its right to acquire preference shares will result in such shares being effectively issued. The Foundation may exercise this right for as many preference shares as there are common shares in the company outstanding at that time. No preference shares have been issued as of December 31, 2024.
The members of the self-electing Board of the Foundation are Messrs J.P. de Kreij, J.V. Timmermans, J. van der Veer and P.N. Wakkie. No Philips Supervisory Board or Board of Management members or Philips officers are represented on the board of the Foundation.
Other protective measures
Other than the arrangements made with the Foundation referred to above, the company does not have any measures that exclusively or almost exclusively have the purpose of defending against unsolicited public offers for shares in the capital of the company. It should be noted that the Board of Management and the Supervisory Board remain under all circumstances authorized to exercise all powers vested in them to promote the interests of Philips.
The company has issued certain corporate bonds, the provisions of which contain a Change of Control Triggering Event or a Change of Control Put Event. Upon the occurrence of such events, the company might be required to offer to redeem or purchase any outstanding bonds at certain pre-determined prices. Please also refer to Debt. Furthermore, the Relationship Agreement entered into between the company and its long-term minority investor Exor N.V. (published on the company’s website) includes certain temporary lock-up obligations for Exor that fall away when any third party has ‘Acquired’ an ‘Interest’ of 50% or more in the company.
10.1.8 Major shareholders
The Dutch Act on Financial Supervision imposes an obligation on persons holding certain interests to disclose (inter alia) percentage holdings in the capital and/or voting rights in the company when such holdings reach, exceed or fall below 3, 5, 10, 15, 20, 25, 30, 40, 50, 60, 75 and 95 percent (as a result of an acquisition or disposal by a person, or as a result of a change in the company’s total number of voting rights or capital issued). Certain derivatives (settled in kind or in cash) are also taken into account when calculating the capital interest. The statutory obligation to disclose capital interest relates not only to gross long positions, but also to gross short positions. Required disclosures must be made to the Dutch Authority for the Financial Markets (AFM) without delay. The AFM then notifies the company of such disclosures and includes them in a register, which is published on the AFM’s website. Furthermore, an obligation to disclose (net) short positions is set out in the EU Regulation on Short Selling.
The AFM register shows the following notifications of substantial holdings and/or voting rights at or above the 3% threshold: Exor N.V.: substantial holding of 15.00% and 15.00% of the voting rights (August 13, 2023); Artisan Investments GP LLC: substantial holding of 10.01%
and 10.01% of the voting rights (June 28, 2024); BlackRock, Inc.: substantial holding of 4.38% and 5.56% of the voting rights (February 12, 2025); T. Rowe Price Group, Inc.: substantial holding of 3.05% and 3.04% of the voting rights (October 29, 2024), EdgePoint Investment Group Inc.: substantial holding of 0.00% and 3.10% of the voting rights (October 28, 2024).
Philips common shares are also listed on the New York Stock Exchange and registered under the Exchange Act. Pursuant to Sections 13(d) and 13(g) of the Exchange Act, any person or group of persons who, directly or indirectly, acquire or hold beneficial ownership of more than 5% of a covered class of equity securities of a listed issuer is required to publicly report their beneficial ownership by filing a Schedule 13D or 13G with the SEC. For the purposes of US reporting obligations, 'beneficial ownership' of an equity security means that a person has or shares the power, directly or indirectly, to vote or direct the voting of a security or dispose of or direct the disposition of a security.
On January 28, 2022, BlackRock, Inc. filed a Schedule 13G with the SEC indicating that, as of December 31, 2021, it beneficially owned 7.2% (63,499,693 shares) of the company’s common shares.
On January 25, 2023, BlackRock, Inc. filed a Schedule 13G with the SEC indicating that, as of December 31, 2022, it beneficially owned 8.8% (78,533,730 shares) of the company’s common shares.
On August 23, 2023, Exor N.V. and Giovanni Agnelli B.V. (which has a controlling equity interest in Exor) jointly filed a Schedule 13D with the SEC indicating that, as of August 14, 2023, they jointly beneficially owned 15.0% (139,297,503 shares) of the company’s common shares. On February 6, 2024, BlackRock, Inc. filed a Schedule 13G/A with the SEC indicating that, as of December 31, 2023, it beneficially owned 7.0% (64,219,051 shares) of the company’s common shares. On May 16, 2024, Exor N.V. and Giovanni Agnelli B.V. jointly filed a Schedule 13D/A with the SEC indicating that, as of May 14, 2024, they jointly beneficially owned 16.1% (145,567,520 shares) of the company’s common shares. On June 25, 2024, Exor N.V. and Giovanni Agnelli B.V. jointly filed a Schedule 13D/A with the SEC indicating that, as of June 21, 2024, they jointly beneficially owned 17.51% (163,717,857 shares) of the company’s common shares.
10.1.9 Corporate information
The company began as a limited partnership with the name Philips & Co in Eindhoven, the Netherlands, in 1891, and was converted into the company with limited liability N.V. Philips Gloeilampenfabrieken on September 11, 1912. The company’s name was changed to Philips Electronics N.V. on May 6, 1994, to Koninklijke Philips Electronics N.V. on April 1, 1998, and to Koninklijke Philips N.V. on May 15, 2013.
The majority of the shares in Royal Philips are held through the system maintained by the Dutch Central Securities Depository (Euroclear Nederland). In the past, Philips has also issued (physical) bearer share certificates ('Share Certificates'). A limited number of Share Certificates have not been surrendered yet, though the holders of Share Certificates are still entitled to a corresponding number of shares in Royal Philips. It is noted that, as a result of Dutch legislation that became effective in July 2019, the relevant shares were registered in the name of Royal Philips by operation of law per January 1, 2021. Owners of Share Certificates will continue to be entitled to a corresponding number of shares, but may not exercise the rights attached to such shares until they surrender their Share Certificates. Owners of Share Certificates may come forward to do so and to receive a corresponding number of shares until January 1, 2026, at the latest. As per January 2, 2026, entitlements attached to the Share Certificates not surrendered will expire by operation of law. For more information, please contact the Investor Relations department by email, investor.relations@philips.com, or telephone, +31-20-59 77222.
The statutory seat of the company is Eindhoven, the Netherlands, and the statutory list of all subsidiaries and affiliated companies, prepared in accordance with the relevant legal requirements (Dutch Civil Code, Book 2, articles 379 and 414), forms part of the notes to the financial statements and is deposited at the office of the Commercial Register in Eindhoven, the Netherlands (file no. 17001910). The executive offices of the company are located at the Philips Center, Amstelplein 2, 1096 BC Amsterdam, the Netherlands, telephone +31-20-59 77777.
10.1.10 Additional information
Articles of association
Set forth below is a summary of certain provisions of the Articles of Association of the company, applicable Dutch law and related company policies. This summary does not constitute legal advice regarding those matters and should not be regarded as such.
Object and purpose
The objects of the company are to establish, participate in, administer and finance legal entities, companies and other legal forms for the purpose of the manufacture and trading of electrical, electronic, mechanical or chemical products, the development and exploitation of technical and other expertise, including software, or for the purpose of other activities, and to do everything pertaining thereto or connected therewith, including the provision of security in particular for commitments of business undertakings which belong to its group, all this in the widest sense, as may also be conducive to the proper continuity of the collectivity of business undertakings, in the Netherlands and abroad, which are carried on by the company and the companies in which it directly or indirectly participates. These objects can be found in Article 2 of the Articles of Association.
Share capital
On December 31, 2024, the issued share capital amounted to EUR 187,987,876.80 divided into 939,939,384 common shares and no preference shares.
Voting rights
All issued and outstanding shares carry voting rights and each share confers the right to cast one vote in a shareholders’ meeting. Pursuant to Dutch law, no votes may be cast at a General Meeting of Shareholders in respect of shares which are held by the company. There are no special statutory rights attached to the shares of the company and no restrictions on the voting rights of the company’s shares exist. Major shareholders do not have different voting rights than other shareholders.
Dividends
A dividend will first be declared on preference shares out of net income. The Board of Management has the power to determine what portion of the net income shall be retained by way of reserve, subject to the approval of the Supervisory Board. The remainder of the net income, after reservations made, shall be available for distribution to holders of common shares subject to shareholder approval after year-end.
Liquidation rights
In the event of the dissolution and liquidation of the company, the assets remaining after payment of all debts and liquidation expenses are to be distributed in the following order of priority: to the holders of preference shares, the amount paid thereon, and the remainder to the holders of the common shares.
Preemptive rights
Shareholders have a pro rata preferential right of subscription to any common share issuance unless the right is restricted or excluded. If designated by the General Meeting of Shareholders, the Board of Management has the power to restrict or exclude the preferential subscription rights. A designation of the Board of Management will be effective for a specified period of up to five years and may be renewed. Currently, the Board of Management has been granted the power to restrict or exclude the preferential right of subscription up to and including November 6, 2025. If the Board of Management has not been designated, the General Meeting of Shareholders has the power to restrict or exclude such rights, upon the proposal of the Board of Management, which proposal must be approved by the Supervisory Board. Resolutions by the General Meeting of Shareholders referred to in this paragraph require approval of at least two-thirds of the votes cast if less than half of the issued share capital is represented at the meeting.
The foregoing provisions also apply to the issuance of rights to subscribe for shares.
General Meeting of Shareholders
The Annual General Meeting of Shareholders shall be held each year not later than June 30 and, at the Board of Management’s option, in Eindhoven, Amsterdam, The Hague, Rotterdam, Utrecht or Haarlemmermeer (including Schiphol airport); the notice convening the meeting shall inform the shareholders accordingly. Without prejudice to applicable laws and regulations, the Board of Management may resolve to give notice to holders of its listed and traded via a stock exchange shares via the company’s website and/or by other electronic means representing a public announcement, which announcement remains directly and permanently accessible until the General Meeting of Shareholders. Holders of registered shares shall be notified by letter, unless the Board of Management resolves to give notice to holders of registered shares by electronic means of communication by sending a legible and reproducible message to the address indicated by the shareholder to the company for such purpose provided the relevant shareholder has agreed hereto.
In principle, all shareholders are entitled to attend a General Meeting of Shareholders, to address the meeting and to vote, except for shares held in treasury by the company. They may exercise the aforementioned rights at a meeting only for the common shares which on the record date are registered in their name. The record date is published in the above announcement and is, pursuant to Dutch law, set as the 28th day prior to the day of the relevant meeting. Holders of registered shares must advise the company in writing of their intention to attend the General Meeting of Shareholders. Holders of shares listed and traded via a stock exchange who either in person or by proxy wish to attend the General Meeting of Shareholders, should notify ABN AMRO Bank N.V., which is acting as agent for the company. They must submit a confirmation by a participating institution, in which administration they are registered as holders of the shares, that such shares are registered and will remain registered in its administration up to and including the record date, whereupon the holder will receive an admission ticket for the General Meeting of Shareholders. Holders of shares who wish to attend by proxy have to submit the proxy at the same time. A participating institution is a bank or broker which, according to the Dutch Securities Depository Act (Wet giraal effectenverkeer), is an intermediary (intermediair) of the Dutch Central Securities Depository (Euroclear Nederland).
In connection with the General Meeting of Shareholders, the company does not solicit proxies within the United States.
The Articles of Association of the company provide that there are no quorum requirements to hold a General Meeting of Shareholders. Subject to certain exceptions provided by Dutch law and/or the Articles of Association, resolutions of the General Meeting of Shareholders are passed by an absolute majority of votes cast and do not require a quorum.
Limitations on right to hold or vote Common Shares
There are no limitations imposed by Dutch law or by the Articles of Association on the right of non-resident owners to hold or vote the Common Shares.
Exchange controls
Cash dividends paid in euros on Dutch registered shares and bearer shares may be officially transferred from the Netherlands and converted into any other currency without Dutch legal restrictions, except that for statistical purposes such payments and transactions must be reported to the Dutch Central Bank. Furthermore, no payments, including dividend payments, may be made to jurisdictions subject to sanctions adopted by the government of the Netherlands and implementing resolutions of the Security Council of the United Nations.
The Articles of Association of the company provide that cash distributions on New York Registry Shares shall be paid in US dollars, converted at the rate of exchange on the stock market of Euronext Amsterdam at the close of business on the day fixed and announced for that purpose by the Board of Management.
Significant differences in corporate governance practices
The corporate governance rules established by the New York Stock Exchange (NYSE) allow Foreign Private Issuers, such as Royal Philips, to follow home country practices on most corporate governance matters instead of those that apply to US domestic issuers, provided that they disclose any significant ways in which their corporate governance practices differ from those applying to listed US domestic issuers under the NYSE listing standards. The following paragraphs summarize what we believe to be the significant differences between certain Dutch practices on corporate governance matters and the corporate governance provisions applicable to US domestic issuers under the NYSE listing standards.
Dutch corporate governance code
The company is a company organized under Dutch law, with its Common Shares listed on Euronext Amsterdam, and is subject to the Dutch Corporate Governance Code of December 20, 2022 (the Dutch Corporate Governance Code). Philips’ New York Registry Shares, representing Common Shares of the company, are listed on the NYSE.
Board structure
The NYSE listing standards prescribe regularly scheduled executive sessions of non-executive directors. The company has a two-tier corporate structure consisting of a Board of Management consisting of executive directors under the supervision of a Supervisory Board consisting exclusively of non-executive directors. Members of the Board of Management and other officers and employees cannot simultaneously act as member of the Supervisory Board. The Supervisory Board must approve specified decisions of the Board of Management.
Independence of members of our Supervisory Board
The Dutch Corporate Governance Code sets forth certain best practices limiting the number of non-independent members of the Supervisory Board, and its committees. The Supervisory Board considers all its members to be independent under the Dutch Corporate Governance Code, except for Mr Ribadeau-Dumas to whom the independence exception of best practice provision 2.1.7(iii) of the Dutch Corporate Governance Code is deemed to apply. The definitions of independence under the Dutch Corporate Governance Code, however, differ in their details from the definitions of independence under the NYSE listing standards. In some cases the Dutch requirements are stricter than the NYSE listing standards, and in other cases the NYSE listing standards are the stricter of the two. The members of the Audit Committee of the Supervisory Board are also independent under the NYSE listing standards.
Committees of our Supervisory Board
The company has established four committees, consisting of members of the Supervisory Board only: the Audit Committee, the Remuneration Committee, the Corporate Governance and Nomination & Selection Committee and the Quality & Regulatory Committee. The roles, responsibilities and composition of these committees reflect the requirements of the Dutch Corporate Governance Code, the company’s Articles of Association and Dutch law, which differ from the NYSE listing standards in these respects. The role of each committee is to advise the Supervisory Board and to prepare the decision-making of the Supervisory Board. In principle, the entire Supervisory Board remains responsible for its decisions even if such decisions were prepared by one of the Supervisory Board’s committees.
The NYSE requires that, when an audit committee member of a listed US domestic issuer serves on four or more audit committees of public companies, the listed company should disclose (either on its website or in its Annual Report on Form 10-K) that the board of directors has determined that this simultaneous service would not impair the director’s service to the listed company. Dutch law does not require the company to make such a determination.
In accordance with the procedures laid down in the Philips Auditor Policy and as mandatorily required by Dutch law, the external auditor of the company is appointed by the General Meeting of Shareholders on the proposal of the Supervisory Board, after the latter has been advised by the Audit Committee and the Board of Management.
Equity compensation plans
The company complies with Dutch legal requirements regarding shareholder approval of equity compensation plans for the members of the Board of Management. Dutch law does not require shareholder approval of certain equity compensation plans for which the NYSE listing standards would require such approval. The company is subject to a Dutch requirement to seek shareholder approval for equity compensation plans for its members of the Board of Management.
Code of business conduct
The listing standards of the NYSE prescribe certain parameters for listed company codes of business conduct and ethics. The company has implemented the Philips General Business Principles, which are applicable to all employees, and a Financial Code of Ethics, which is applicable to all employees performing an accounting or financial function. Waivers granted to Senior (Financial) Officers (as defined in our Financial Code of Ethics) must be disclosed. In 2024 the company did not grant any waivers of the Financial Code of Ethics.
Related party transactions
The NYSE listing standards require certain transactions with related parties to be reviewed by a company’s audit committee or another independent body of the board of directors for potential conflicts of interest, and for the audit committee or other independent body to prohibit such a transaction if it determines it to be inconsistent with the interests of the company and its shareholders. However, Foreign Private Issuers can rely on home country practice with respect to review and approval of related party transactions. Philips has internal procedures in place to confirm that related party transactions are entered into at arm’s length and, if and to the extent required under Dutch law, to enable the Supervisory Board to assess the terms of significant related party transactions.
New York Registry Shares
Certain common shares of the company are registered in the register maintained by Deutsche Bank Trust Company Americas, as the New York transfer agent, registrar and dividend disbursing agent (the 'New York Transfer Agent'), pursuant to a Transfer Agent Agreement, dated July 16, 2018, between the New York Transfer Agent and the company (such common shares, 'New York Registry Shares'). As soon as practicable after receipt from the company, the New York Transfer Agent will provide holders of New York Registry Shares with a notice of any meeting or solicitation of consents or proxies with a notice prepared by the company stating (i) such information as is contained in such notice of meeting and any solicitation materials (or a summary thereof in English provided by the company), (ii) that each registered holder at the close of business on the record date set by the company therefore will be entitled, subject to any applicable provisions of Dutch law and the Articles of Association, to exercise the voting rights pertaining to the New York Registry Shares, and (iii) the manner in which such voting rights may be exercised. The New York Transfer Agent may, to the extent not prohibited by applicable law or by the requirements of the New York Stock Exchange, in lieu of distribution of the materials provided to it in connection with any meeting of, or solicitation of consents or proxies from, holders of common shares, distribute to the registered holders of New York Registry Shares a notice that provides such holders with, or otherwise publicizes to such holders, instructions on how to retrieve such materials or receive such materials upon request (i.e., by reference to a website containing the materials for retrieval or a contact for requesting copies of the materials).
10.2 Risk factors
Philips believes the risks set out below are the material risks affecting Philips and its securities. These risk factors may not, however, include all the risks that ultimately may affect Philips. Some risks not yet known to Philips, or currently believed not to be material, may ultimately have a major impact on Philips’ business, revenue, income, assets, liquidity, capital resources, reputation and/or ability to achieve its business and ESG objectives. Please note that this section is not intended to describe risks that have materialized, as these are addressed in other sections and referenced where relevant. Philips defines risks in four main categories: Strategic, Operational, Financial and reporting, and Compliance. Philips presents the risk factors within each category in order of current view of their expected significance. Compared to the previous year we have further prioritized risk factors relating to geopolitics and macro-economics and to artificial intelligence. We have continued high prioritization of risk factors related to patient safety and quality, supply chain, and the simplification of how we work. Although still relevant, we have de-emphasized risk factors related to global inflation. This does not mean that a lower-listed risk factor may not have a material and adverse impact on Philips’ business, revenue, income, assets, liquidity, capital resources, reputation, and/or ability to achieve its business and ESG objectives. Furthermore, other risk factors not listed below may ultimately prove to have more significant adverse consequences than the listed risk factors.
We aim to manage risk within our risk appetite. Pursuing strategic opportunities within the dynamics of the health technology industry typically requires a higher appetite towards the corresponding strategic risks. We may accept considerable strategic risks in a responsible way given the necessity to invest in research and development and to manage the portfolio of businesses to ensure we continually revitalize our offerings. For selected options with very high strategic impact, we may occasionally take a risk seeking approach subject to careful evaluation. Toward operational risks, we overall take a balanced-to-prudent approach, aiming to optimize productivity and minimize downside risks considering the need for continuity of the delivery of our products, services and sustainability commitments; efficient execution; and reliable and secure IT systems. Where operational risks may impact the quality of our products and services and the safety of patients, we take an averse approach. Regarding financial and reporting risks, we adopt a prudent-to-balanced approach aiming at the financial sustainability of the company, investor commitment and stakeholder trust. We manage these risks with the intention of retaining our current strong investment-grade credit rating. As Philips is committed to act with integrity always, we take an averse-to-prudent approach to any risk that would result in breach of compliance with our General Business Principles and mandatory laws and regulations.
10.2.1 Strategic risks
Philips’ global operations are exposed to geopolitical and macro-economic changes
Philips’ business and operations can be adversely impacted by unfavorable macro-economic conditions and geopolitical instability in global and individual markets. In 2024, Mature geographies accounted for 73% of Philips’ revenues, while Growth geographies accounted for the remaining 27%. While Mature geographies are currently the main source of Philips’ revenues, Growth geographies (excluding China) are an increasing source of revenues. Philips produces, sources, and designs its products and services mainly from the United States (US), the European Union (EU) – primarily the Netherlands, and China, and most of Philips’ assets are located in these geographies. Changes in politics and monetary, trade, tax policies and sanction laws in the US, the EU and China may trigger reactions and countermeasures and may also have an adverse impact on other markets in which Philips is active. Philips continues to expect global market conditions to remain highly uncertain and volatile due to geopolitical and macro-economic factors.
Philips observes an increasing trend of geopolitical tensions and deglobalization which intensifies protectionism. Examples of protectionism measures are trade policies, tariffs, custom duties, taxation, import or export controls and sanctions, local value creation and production requirements, technology and data storage and movement restrictions, talent mobility restrictions, nationalization of assets, and restrictions on repatriation of returns from foreign investments. Tariffs and other restrictions on imports announced and proposed by US President Donald Trump and his administration, and retaliatory trade measures in response thereto, have the potential to impact international trade relations and supply chains, with notable consequences for the EU. In addition, protectionism may increase general uncertainty on the development of local regulations that may result in proliferation of and changes to such regulations, causing the company to comply with disparate, evolving standards. Philips observes this trend in the major markets in which it operates and has a particular concern on the development of the US-China relationship and China’s drive to expand its global political footprint and become self-sufficient in critical technologies, including health-related ones. China's anti-corruption campaign may also negatively impact demand within the medical industry. If this trend continues, geopolitical relations deteriorate and economies decouple, then it is expected that existing global trade and investment restrictions will remain or increase. Further regulatory and compliance challenges for doing business globally may emerge and deteriorate, resulting in continued pressure on market growth and investments.
Uncertainty and challenges regarding various global macro-economic factors continue to persist. Examples of general factors potentially affecting Philips are an overall weakening economic growth and the trend of declining growth of the Chinese economy in particular, reduced government spending, declining customer and consumer confidence and spending, high inflation and interest rates, and the emergence of economic impacts related to the climate crisis. Although the ability to manage pandemics (for example, resurgences of COVID-19 or mutations thereof) has improved, pandemics may continue to affect Philips’ operations in the future. Examples of healthcare-specific potential factors include rising uncertainty over the future direction of public healthcare policy and the risk of declining public investment in healthcare ecosystems. These factors could affect customer demand and sales as well as our manufacturing costs, operating expenses (including wages), and other expenses. We may not be able to compensate for loss of sales through overall sales growth or manage increased costs by improving productivity and increasing our prices to offset increased costs in a timely manner, if at all, which could have a material impact on our revenue, gross margins, profitability and cash flows.
The Russia-Ukraine war has increased global economic and political uncertainty. Governments in the US, the UK, the EU, Canada, and Japan have each imposed export controls on certain products and sanctions on certain industry sectors and institutions in Russia, and additional controls and sanctions could be enacted in the future. Similarly, conflicts in Israel and the Middle East may further increase economic and political uncertainty and may affect the company’s results of operations, financial position and cash flows. Philips is present in Israel with several subsidiaries, mainly in Diagnosis & Treatment and Connected Care, that are primarily involved in manufacturing and research and development activities. The outcome of the recent elections in the US and the upcoming elections in certain member states of the EU could also have an impact on the course of these conflicts. The ongoing conflicts may heighten the impact of other risks factors described herein, including but not limited to: volatility in prices for transportation, energy, commodities and other raw materials; disruptions in the global supply chain; decreased customer and consumer confidence and spending; increased cyberattacks; intensified protectionism; political and social instability; increased exposure to foreign currency fluctuations; rising inflation and interest rates; and constraints, volatility or disruptions in the credit and capital markets. It is possible that the conflicts in Ukraine and Russia and the Middle East may escalate or expand and current or future sanctions and resulting geopolitical and macro-economic disruptions could be significant. We cannot predict the impact that conflicts may have on the global economy in the future.
Changes in geopolitical and macro-economic conditions are difficult to predict, and the factors described above, or other factors, may lead to adverse impacts on global trade levels and flows, economic growth, and financial markets and political stability, all of which could adversely affect the demand for, and supply of, Philips products and services. This may result in a material adverse impact on Philips’ business, financial condition, and operating results. These factors could also make it more difficult to budget and to make reliable financial forecasts, or could have a negative impact on Philips’ access to funding.
Philips may be unable to keep pace with the changing health technology environment
With Philips’ focus on health technology, our business model is transforming from transactional, product-focused business models to customer- and patient-centric, outcome-oriented business models, with multi-year customer partnerships enabled by a portfolio of innovative devices, solutions, platforms, insights and value-added services. If this transformation is not targeted at successful products and services or is made too slowly or is not successful, Philips may not meet the expectations of customers, patients or other stakeholders in the health technology business environment. We may face a loss of customer relevance, fail to capture growth, and lose market share. In addition, because of our health
technology focus, Philips may have a reduced ability to offset potential negative impacts (including, but not limited to, impacts on sales, operating results, liabilities, compliance, and financing) on its health technology business by other businesses through a more diversified portfolio. As a result of its focus on health technology, Philips is deepening customer engagement and entering into long-term solutions and services business arrangements, becoming more dependent on a number of key customers for long-term recurring revenues, thus increasing the risk that the loss of, or a significant reduction in, orders from one or more of our key customers could cause a significant decline in our revenues. As Philips looks to increase our use of indirect sales channels, Philips will increasingly rely on successfully leveraging new and existing partners to support customers and patients. Any of these factors may have a material adverse impact on Philips’ brand value and reputation, business, financial condition, and operating results. More specific health technology risks and their potential impacts are included in the Operational, Financial and Compliance risk sections below as well as in the note Contingencies. Philips may be unable to gain leadership in health informatics and artificial intelligence
New digital technologies and ways of conducting business are fundamentally changing the health technology industry, and thus our competitive business environment. A key industry trend is the shift toward cloud-based Software-as-a-Service (SaaS) business models and remotely upgradable, serviceable systems. These new types of offerings are enabled by hybrid cloud/on-premise digital platforms. Another trend is the application of (generative) artificial intelligence (AI) and machine learning technologies to drive quality and efficiency in clinical and operational workflows. Customers are seeking solutions that convert data from our imaging and monitoring systems into actionable insights within workflows.
Philips is expanding the use of AI in the development of its technologies and is increasingly incorporating AI capabilities in its products and services to improve customer experiences and drive efficiencies. The development of AI technologies is complex and Philips may fall behind established and new digital competitors if Philips does not develop the requisite capabilities to innovate its portfolio of AI-enabled products and services, adjust its business models and find ways to globally commercialize new products and services at scale and in a timely, competitive and ethically and legally compliant manner. This could result in an inability to satisfy customer and patient needs, thereby missing out on revenue and margin growth opportunities, which may have a material adverse impact on Philips’ business, financial condition and operating results.
Acquisitions could fail to deliver on Philips’ business plans and value creation expectations, and we may not be able to successfully integrate acquired operations
Although Philips focuses on organic growth to deliver patient- and people-driven innovation at scale, selected acquisitions remain part of Philips’ growth strategy. We may not be able to integrate acquisitions successfully or efficiently with our existing operations, culture and systems, which may expose Philips to risks in areas such as sales and service, logistics, quality, regulatory compliance, legal claims, information technology, and finance. Integration challenges may adversely impact the realization of value creation expectations. Transactions may incur significant costs, result in unforeseen operating difficulties, divert management attention from other business priorities, and may ultimately be unsuccessful. Cost savings expected to be implemented, or other assumptions underlying the business case relating to a particular acquisition, may not be realized. If we are unable to successfully define, or accomplish any of our objectives in respect of any of our new acquisitions, we may not realize the anticipated benefits of such acquisitions and we may experience lower than anticipated profits, or even incur losses. Acquisitions may also lead to a substantial increase in long-lived assets, including goodwill, which may later be subject to write-down or impairment if an acquired business does not perform as expected, which may have a material adverse effect on Philips’ earnings.
Philips may be unable to meet internal or external aims or expectations with respect to ESG-related matters
Environmental, Social and Governance (ESG) factors may directly and indirectly impact Philips Businesses or the business environment in which Philips operates. For instance, customers may choose products or services based on sustainability or other ESG criteria. At the same time, also ESG adverse sentiments exist among certain stakeholders, and we may face scrutiny, reputational risk, product boycotts, lawsuits or market access restrictions from these parties regarding our ESG-related initiatives. Philips may, from time to time, disclose ESG-related initiatives or aims in connection with the conduct of its business and operations. For example, Philips has adopted initiatives with respect to reducing greenhouse gas emissions in its supply chain. However, there is no guarantee that Philips will be able to implement such initiatives or meet such aims within anticipated timeframes, considering, for example, the technological limitations in the research and development process. Philips is also increasingly focused on products and services incorporating AI, and the development and use of our products and services incorporating AI may require more energy than similar products or services not incorporating AI. In addition, there is an increasing focus on ESG matters (both "pro-ESG" and "anti-ESG") from Philips stakeholders – including customers, consumers, employees, regulators, and investors, and those stakeholders may also have ESG-related expectations with respect to Philips’ business and operations. For example, customers may focus on ESG-related criteria in buying our products e.g., through green procurement standards.
Any inability by Philips to address concerns or meet expectations about ESG-related matters could negatively impact sentiment toward Philips, our products, and our brand. Improper or incorrect sustainability claims and low ESG scores could also potentially impact Philips' reputation and affect sales. There are an increasing number of regulatory and legislative initiatives in the EU and other jurisdictions to address ESG issues, which will (once implemented) require Philips to significantly increase the scope of mandatory ESG disclosures, and will introduce or extend a duty of care, requiring Philips to identify and act on adverse environmental and human rights impacts across the organization and operations, and potentially the entire value chain, beyond or different from our current efforts.
These regulatory and legislative initiatives, in turn, could also affect how customers or other stakeholders perceive our products or business operations. If our products or business operations do not meet the criteria for sustainability according to, for example, the EU Taxonomy Regulation (including the related delegated regulations) or any other similar regulations, this may negatively affect how customers or other stakeholders view Philips. Philips may fail to fulfill internal or external ESG-related initiatives, aims, goals, targets or expectations, or be perceived
to do so, or we may fail to report performance or developments adequately or accurately with respect to such initiatives, aims, goals, targets or expectations. In addition, Philips could be criticized or held responsible if the scope of its initiatives, aims, goals or targets regarding ESG matters is deemed insufficient. Any of these factors may have an adverse impact on Philips’ reputation and brand value, competitiveness, or on Philips’ business, financial condition and operating results.
Philips may be unable to secure and maintain intellectual property rights for its products and services or may infringe others’ intellectual property rights
Philips is dependent on its ability to obtain and maintain licenses and other intellectual property (IP) rights covering its products and services and its design and manufacturing processes. The IP portfolio is the result of an extensive IP generation process that could be influenced by a number of factors, including innovation and acquisitions. The value of the IP portfolio is dependent on the successful promotion and market acceptance of standards (co-)developed by Philips. This is particularly applicable to the segment ‘Other’, where licenses from Philips to third parties generate IP royalties and contribute to Philips’ results of operations. The timing of licenses from Philips to third parties and associated revenues from IP royalties are uncertain and may vary significantly from period to period. Additionally, royalties are often based on sales by third parties, creating an exposure to macro-economic effects and continuity of these third parties. A loss or impairment in connection with such licenses to third parties could have a material adverse impact on Philips’ financial condition and operating results. The use of artificial Intelligence AI in the development of our products and services could also cause loss of IP. The legal landscape and subsequent legal protection for the use of AI remains uncertain, and development of the law in this area could impact our ability to enforce our proprietary rights or protect against infringing uses. Philips is also exposed to the risk that a third party may claim to own IP rights to technology applied in Philips products and services. The use or adoption of AI technologies into our products and services may heighten the risk of exposure to claims of copyright infringement or other IP misappropriation. If any such claims of infringement of these IP rights are successful, Philips may be required to pay damages to such third parties or may incur other costs or losses.
10.2.2 Operational risks
Products and services may fail quality or security standards, which could adversely affect patient safety or customer operations
As a health technology company and innovator, our products and services must comply with the rules and regulations that govern our operations, processes, and ways of working. Risks associated with non-compliance to patient safety, quality, regulatory, or security standards can occur throughout the lifecycle of our products or services, inclusive of pre-market activities (such as product design, production and supplier quality activities) and post-market activities. As we increase the adoption of artificial intelligence (AI) to support our customers, we may become more exposed to the risks associated with the use of such technologies, such as lack of transparency, cybersecurity and data provenance, toxicity, bias and deficient or inaccurate outputs and other unintended consequences that are not easily detectable or are inconsistent with our policies and values. Consequences of identified risks include patient harm, negatively impacting customers' operations and healthcare professionals' ability to provide care, and unauthorized access to confidential data, including patient records and medical devices. In turn, these may result in damage to our brand, reputation, competitive disadvantage, legal liability and regulatory enforcement, all of which may have a material adverse impact on Philips’ business, reputation, financial condition, and operating results.
Philips may be unable to ensure a resilient supply chain
Most of Philips’ operations are conducted internationally, which exposes Philips to supply chain challenges and uncertainties. Philips produces and procures products and parts in various countries globally. The production and shipping of products and parts, whether from Philips or from third parties, could be interrupted and may face increasing costs by various external factors, such as regional conflicts (e.g., the Middle East), sanctions, tariffs or other trade measures, natural disasters, extreme weather events (the effects of which may be exacerbated by climate change), and geopolitical developments.
While macro trends around materials availability have improved in 2024, Philips medical systems stay in production for longer periods than the life cycle of their semi-conductors and require continuous rejuvenation of their electronic components. Philips may fail to timely obtain or replace such components from existing supplies, and alternative sources of components could involve significant costs and regulatory challenges and may not be available to us on reasonable terms, adversely affecting our business and financial performance.
Our suppliers and our third-party service providers may also be exposed to labor shortages and potentially worsening macro-economic and geopolitical trends, as well as both acute and chronic physical climate risks. These factors may cause business interruptions, property damage, and inventory loss, increasing lead times and adversely impacting our production capacity, which may negatively affect the delivery of products and services to customers, for example the postponement of equipment installations in hospitals. If Philips is not able to respond swiftly to those factors, this may result in an inability to deliver on customer needs, ultimately resulting in loss of revenue and margin.
Philips purchases raw materials, including rare-earth metals, copper, steel, aluminum, noble gases and oil-related products. Philips’ business depends on the availability of raw materials and energy, and there is no assurance that such raw materials and energy will be available for purchase in the future or available at current costs. Particularly, the introduction of more stringent regulatory or legislative measures to internalize negative externalities, such as the Carbon Border Adjustment Mechanism (CBAM), can be expected in response to the threats posed by climate change and environmental degradation. In this context, reference is also made to the EU Corporate Sustainability Due Diligence Directive (CSDDD) introducing or extending a duty of care, requiring Philips to identify and act on adverse environmental and human rights impacts across its supply chain. These initiatives have the potential to affect market dynamics (e.g., green premiums) and the availability of sustainable resources, which may, in turn, increase Philips’ costs associated with purchasing materials and components. The rise in global climate commitments and new
regulations on Energy Attribute Certificates (EACs) and Power Purchasing Agreements (PPAs) may also drive fluctuations in energy costs and affect the availability of EACs and PPAs.
Some commodities have been subject to volatile markets, and such volatility is expected to continue and costs to increase. Costs may also increase as a result of stricter climate-change-related laws and regulations. Such legislation could require investments in technology to reduce energy use and greenhouse gas emissions, beyond what we expect in our existing plans, or could result in additional and increased pricing for negative externalities (e.g., carbon pricing). If Philips is not able to compensate for increased costs of energy, (sub-)components, (raw) materials, and transportation – either by reducing reliance thereon or passing on increased costs to customers – then price increases could have a material adverse impact on Philips’ business, financial condition, and operating results.
Philips may increase its dependency on a concentration of external suppliers, as a result of the continuing process of creating a leaner supply base and launching initiatives to replace internal capabilities with outsourced products and services. These initiatives also need to be balanced with local-market value-creation requirements, including those relating to local manufacturing and data storage.
Although Philips works closely with its suppliers to avoid supply discontinuities, there can be no assurance that Philips will not encounter future supply issues, causing disruptions or unfavorable conditions. Furthermore, while the materials supply has improved in 2024, the challenges in our capability for the planning and synchronization of supply with demand continue, which, combined with a drive for inventory reduction and cash flow improvements, can lead to further materials running out of stock. That could have a material adverse impact on Philips’ business, financial condition and operating results.
Philips may face challenges in simplifying the organization and the ways of working
Having an integrated operating model promoting agility with clear accountability is a priority to improve the execution of our strategy. If we do not effectively simplify the organization and our ways of working, which include, but are not limited to, changes in structure and governance, policies, processes, IT systems and data, we may be limited in our ability to fully realize our business ambitions and to create with sustainable impact, meeting critical patient and customer needs, delivering integral value propositions, growing the business, and/or maintaining business continuity. Philips may need to undertake further changes and related restructuring in the future if the operating model ultimately proves to be wholly or partly unsuccessful.
To simplify ways of working and improve performance, Philips continuously seeks to create a more open, standardized, and cost-effective IT landscape. Approaches include outsourcing, off-shoring, integration, and consolidation of IT systems. These changes may elevate third-party dependency risks regarding the delivery of IT services, the availability of IT systems, and the functionality offered by IT systems. Although Philips has sought to strengthen security measures and quality controls related to these systems, these measures may prove to be insufficient or unsuccessful, which may lead to a material adverse impact on Philips’ business, financial condition, and operating results.
Philips is dependent on its people for leadership and specialized skills and may be unable to attract and retain personnel
The attraction and retention of talented employees is critical to Philips’ success, and the loss of employees with specialized skills could result in business interruptions, especially given the strong competition for talent in key capability segments. Philips is competing with other companies for the best talent and most sought-after skills, and there is no assurance of succeeding in attracting and retaining the highly qualified employees needed in the future. Wage inflation is increasing the competition for talent, as well as the cost of labor. This may negatively impact our ability to realize our plan for creating value with sustainable impact, and if we are unable to offset the increased costs of labor through higher selling prices and increased productivity, then rising costs could also have a material adverse impact on Philips’ business, financial condition and operating results.
Philips could be exposed to a significant enterprise cybersecurity breach
Philips relies on information technology to operate and manage its businesses, as well as store and process confidential data (relating to patients, employees, customers, intellectual property, suppliers and other partners). Philips products, solutions and services increasingly contain sophisticated and complex information technology, and the use of artificial intelligence (AI) capabilities may further heighten the risks related to cybersecurity attacks and other disruptions to information systems. The healthcare industry is subject to strict privacy, security and safety regulations. At the same time, geopolitical conflicts and criminal activity continue to drive increases in the number, and sophistication of, cyberattacks globally. Considering the general increase in cybercrime, our customers and other stakeholders are becoming more demanding regarding the cybersecurity of our products and services. As a global health technology company, Philips is inherently and increasingly exposed to the risk of cyberattacks and potential impact of attacks on (our) suppliers. Information systems may be damaged, disrupted (including the provision of services to customers), or shut down due to cyberattacks. In addition, breaches in the security of our systems (or the systems of our customers, suppliers, or other partners) could result in the misappropriation, destruction, or unauthorized disclosure of confidential information (including intellectual property) or personal data belonging to us or our employees, customers, suppliers or other partners. These risks are particularly significant with respect to the safety and medical records of patients. Cyberattacks may result in substantial costs and other negative consequences, which may include, but are not limited to, lost revenues, reputational damage, remediation and enhancement costs, penalties, and other liabilities to regulators, customers and other partners. Philips has not encountered any material breaches or other major cybersecurity incidents in 2024. While Philips deals with the operational threat of cybercrime on a continuous basis and has so far been able to prevent significant damage or significant monetary cost in taking corrective action, there can be no assurance that future cyberattacks will not result in material or other consequences than as described above, which may result in a material adverse impact on Philips’ business, financial condition and operating results.
Philips may face challenges to drive excellence and speed in bringing innovations to market
It is important that Philips delivers its innovations in close collaboration with its customers on a timely basis and at scale. The emergence of new low-cost competitors, particularly in Asia, the emergence of healthcare solutions with low-carbon environmental footprint, the continuously and rapidly changing field of artificial intelligence (AI) and data-driven solutions, and the increasing importance of product security and cybersecurity, further underlines the importance of improvements in the innovation process. Success in launching innovations depends on a number of factors, including development of value propositions, architecture and platform creation, product development, market acceptance, production, and delivery ramp-up. It is also dependent on addressing potential quality issues or other defects in the early stages of introduction, and on attracting and retaining skilled employees. Costs of developing new products and solutions may partially be reflected on Philips’ balance sheet and may be subject to write-down or impairment depending on the performance of such products or services. The significance and timing of such write-downs or impairments are uncertain, as is the ultimate commercial success of new product introductions. Accordingly, Philips cannot determine in advance the ultimate effect that innovations will have on its financial condition and operating results. If Philips fails to create and commercialize its innovations timely and at scale, it may lose market share and competitiveness, which could have a material adverse effect on its financial condition and operating results.
10.2.3 Financial and reporting risks
Philips is exposed to a variety of treasury and financing risks, including liquidity, currency, credit and country risk
Negative developments impacting the liquidity of global capital markets could affect Philips’ ability to raise or re-finance debt in the capital markets or could lead to significant increases in the cost of such borrowing in the future. If the markets expect a downgrade by the rating agencies, or if such a downgrade has actually taken place, this could increase the cost of borrowing, reduce our potential investor base and adversely affect our business.
Philips’ financing and liquidity position may also impact its ability to implement or complete any share-buyback program, or to distribute any dividends in accordance with its dividend policy or at all. Any announced share-buyback program or dividend policy may also be amended, suspended or terminated at any time, including at Philips’ discretion or as a result of applicable law, regulation or regulatory guidance, and any such amendment, suspension or termination could negatively affect the trading price of, increase trading price volatility of, or reduce the market liquidity of Philips shares or other securities. Additionally, any share-buyback program or distribution of dividend could diminish Philips’ cash or other reserves, which may impact its ability to finance future growth and to pursue potential future strategic opportunities. Any share-buyback program or dividend payment will depend on factors such as availability of financing, liquidity position, business outlook, cash flow requirements and financial performance, the state of the market and the general economic climate, and other factors, including tax and other regulatory considerations. Philips and its subsidiaries may also be subject to limitations on the distribution of shareholders’ equity under applicable law.
Philips operates in over 100 countries and its reported earnings and equity are therefore inevitably exposed to fluctuations in the exchange rates of foreign currencies against the euro. Philips’ sales and net investments in its foreign subsidiaries are sensitive in particular to movements in the US dollar, Japanese yen, Chinese renminbi, and a wide range of other currencies from developed and emerging economies. Philips’ sourcing and manufacturing spend is concentrated in the EU, the US and China. Income from operations is particularly sensitive to movements in currencies of countries where Philips has no or very small-scale manufacturing/local sourcing activities but significant sales of its products or services, such as Japan, Canada, Australia, the United Kingdom, and a range of emerging markets, such as Indonesia, India and Brazil.
In view of the long lifecycle of health technology solution sales and long-term strategic partnerships, the financial risk of counterparties with outstanding payment obligations creates exposure risks for Philips, particularly in relation to accounts receivable from customers, liquid assets, and the fair value of derivatives and insurance contracts with financial counterparties. A default by counterparties in such transactions can have a material adverse effect on Philips’ financial condition and operating results.
Contingent liabilities may have a significant impact on the company’s consolidated financial position, results of operations and cash flows. For an overview of current cases please refer to the note Contingencies. Philips is exposed to tax risks which could have a significant adverse financial impact
Philips is exposed to tax risks that could result in double taxation, penalties and interest payments. The source of the risks could originate from local tax laws and regulations as well as international and EU regulatory frameworks. These tax risks include transfer pricing risks on internal cross-border deliveries of goods and services, as well as tax risks relating to changes in the transfer pricing model. Examples of initiatives that may result in changing tax rules include, but are not limited to, the OECD/G20 Inclusive Framework to address the allocation of income to user markets (Pillar One) and a 15% minimum corporate income tax rate (Pillar Two). For Pillar One, it is too early to assess the potential impact as all regulations have not been released yet.
The formal adoption of the Council Directive (EU) 2022/2523 (the Pillar Two Directive) in December 2022 aims to achieve a coordinated implementation of Pillar Two in EU member states. The Dutch government adopted the Minimum Tax Rate Act 2024 (MTR Act) in December 2023 and the Pillar Two legislation has been applicable in local law with effect from 2024 in the Netherlands, the EU and multiple other countries around the world. However, US President Trump’s January 2025 Executive Order to withdraw from the OECD Pillar agreements brings uncertainty and potential risk of retaliatory tax measures.
As Philips maintains substance in the form of relevant assets and personnel in the countries in which it operates which is shown in our Country Activity and Tax Report, Philips meets the transitional safe harbor rules enacted by OECD in most countries and therefore exposure to taxation Pillar Two is currently limited. However, this is increasing Philips’ tax compliance burden significantly globally.
Furthermore, Philips is exposed to tax risks related to acquisition and divestment, permanent establishments, tax loss, interest and tax credits carried forward, and potential changes in tax law that could result in higher tax expenses and payments. The risks may have a significant impact on local financial tax results, which could adversely affect Philips’ financial condition and operating results. The value of the deferred tax assets, such as tax losses carried forward, is subject to the availability of sufficient taxable income within the tax loss-carry-forward period. Accordingly, there can be no absolute assurance that all deferred tax assets, such as (net) tax losses and credits carried forward, will be realized.
Potential tariffs and other restrictions on imports proposed by US President Trump and his administration, and retaliatory trade measures in response thereto, have the potential to impact international trade relations and supply chains, with notable consequences in the countries where we are present in. In addition, protectionism may increase general uncertainty on the development of local regulations in response to those measures. These uncertainties expose Philips to financial risk linked to increased trade defense measures resulting in additional tariffs and customs duties. Significant changes in import duties levied on the import of products could materially impact Philips.
Flaws in internal controls could adversely affect our financial reporting and management process
Accurate disclosures provide investors and other market professionals with significant information for a better understanding of Philips’ Businesses. Failures in internal controls or other issues with respect to Philips’ public disclosures, including disclosures with respect to cybersecurity risks and incidents, could create market uncertainty regarding the reliability of the information (including financial data) presented. This could have a negative impact on the price of Philips securities. In addition, the reliability of revenue and expenditure data is key for steering the Businesses and for managing top-line and bottom-line growth. The long life cycle of health technology solution sales, from order acceptance to accepted installation and servicing, together with the complexity of the accounting rules recognizing revenue in the accounts, presents a challenge in terms of ensuring consistent and correct application of the accounting rules throughout Philips’ global business. Significant changes in the way of working, such as the changes made to our operating model, restructuring, and shifting processes to remote Global Business Services locations, may have an adverse impact on the environment under which controls are executed, monitored, reviewed, and tested. Any flaws in internal controls, or regulatory or investor actions in connection with flaws in internal controls, could have a material adverse effect on Philips’ business, financial condition, operation results, reputation and brand.
10.2.4 Compliance risks
Philips products and services may be exposed to the risk of non-compliance with various regulations and standards involving quality, safety, and security
Our reputation and license to operate depend on our compliance with global regulations and standards. Operating in a highly regulated health-technology industry, our products and services, including parts and materials from suppliers, are subject to regulation by various government and regulatory agencies e.g., FDA (US), EMA (Europe), NMPA (China), MHRA (UK), ASNM (France), BfArM (Germany), and IGZ (the Netherlands). In the EU, the Medical Device Regulation (EU MDR) became effective in May 2021 and imposes significant additional pre-market and post-market requirements. The current EU MDR transitional provisions allow medical devices that were CE marked under the previous directives (MDD and AIMDD) to continue being placed on the market or put into service until 2027 or 2028 dependent upon the risk class of the equipment. Examples of other product-related regulations are the EU’s Waste from Electrical and Electronic Equipment (WEEE), Restriction of Hazardous Substances (RoHS), Registration, Evaluation, Authorization and Restriction of Chemicals (REACH) and Energy-using Products (EuP) regulations. We are subject to various domestic and foreign environmental laws and regulations, which are continuing to develop. Any failure to comply with such laws and regulations could jeopardize product quality, safety, and security or expose us to lawsuits, administrative penalties, and civil remedies, all of which may have a material adverse impact on Philips’ business, financial condition, and operating results.
Philips has observed an increase in safety and security requirements in new and upcoming legislation dealing with market access of consumer goods, medical devices, information and communication technology products, cloud services, and specific areas such as data protection, cybersecurity, AI, and supply chain.
The legal and regulatory environment relating to artificial intelligence (AI) is uncertain and rapidly evolving due to concerns about bias, discrimination, transparency, and security. Despite training and risk management efforts, AI models, particularly generative AI models, we use may produce output or take action that is incorrect, that reflects biases included in the data on which they are trained, that results in the release of private, confidential, or proprietary information, or that is otherwise harmful. The complexity of AI models may make it difficult to understand why they are generating particular outputs, increasing the challenges associated with assessing the proper operation of AI models, understanding and monitoring the capabilities of the AI models, reducing erroneous output, eliminating bias, and complying with regulations that require documentation or explanation of the basis on which decisions are made. Further, we may rely on AI models developed by third parties, and, to that extent, would be dependent in part on the manner in which those third parties develop and train their models, including risks arising from the inclusion of any unauthorized material in the training data for their models and the effectiveness of the steps these third parties have taken to limit the risks associated with the output of their models, matters over which we may have limited visibility. Any of these risks could expose us to liability or adverse legal or regulatory consequences, and harm our reputation and the public perception of our business or the effectiveness of our security measures.
Both regulators and customers require us to demonstrate legal compliance and adequate security management using national and international standards and associated certifications. Non-compliance with conditions imposed by regulatory authorities could result in product recalls, temporary product unavailability, stoppages at production facilities, remediation costs, fines, disgorgement of profits, and/or claims for damages. Product safety incidents or user concerns could jeopardize patient safety and/or trigger inspections by the FDA or other regulatory agencies, which, depending on the results of such inspections, could trigger the impacts described above, as well as other consequences. These issues could adversely impact Philips’ financial condition or operating results through lost revenue and cost of any required remedial actions, penalties or claims for damages. They could also negatively impact Philips’ reputation, brand, relationship with customers and market share. Philips is exposed to the ongoing impact of the Respironics voluntary recall/field action and related matters. Please refer to the section Patient safety, quality and regulatory and the note Contingencies. Philips is exposed to the risks of non-compliance with business conduct rules and regulations, including privacy and upcoming ESG disclosure and due diligence requirements
In the execution of its strategy, Philips could be exposed to the risk of non-compliance with business conduct rules and regulations and our General Business Principles, including, but not limited to, patient safety, quality, anti-bribery,anti-money laundering, sanctions, healthcare compliance, transparency, accountability and fairness in the development and use of artificial intelligence (AI) tools, privacy and data protection, as well as existing and upcoming ESG disclosure requirements and due diligence requirements. Examples of compliance risk areas include commission – and incentive payments to third parties and remuneration payments to agents, distributors, consultants and similar entities, as well as the acceptance of gifts, which may be considered in some markets to be normal local business practice. The use of AI and ongoing digitalization of Philips products and services, including its processing of personal data, increases the importance of compliance, and the risk of non-compliance, with privacy, data protection and similar laws. If we do not have sufficient rights to use the data on which AI relies or to the outputs produced by AI applications, we may incur liability through the violation of certain laws, third-party privacy or other rights or contracts to which we are a party. These risks could adversely affect Philips’ financial condition, reputation and brand and trigger the additional risk of exposure to governmental investigations, inquiries and legal proceedings and fines. There are an increasing number of regulatory and legislative initiatives in the EU and other jurisdictions to address ESG issues, which will (once implemented) require Philips to significantly increase the scope of mandatory ESG disclosures. Examples of these initiatives are the EU Corporate Sustainability Reporting Directive (CSRD) and European Sustainability Reporting Standards (ESRS), the European Carbon Border Adjustment Mechanism (CBAM), and the EU Deforestation Regulation. Regulatory and legislative initiatives such as the EU Corporate Sustainability Due Diligence Directive (CSDDD) and case-law developed by courts will introduce or extend a duty of care, requiring Philips to identify and act on adverse environmental and human rights impacts across the organization and operations, and potentially the entire value chain, beyond or different from our current efforts. Failure to meet these requirements could trigger the additional risk of exposure to inquiries from supervisory bodies and adversely affect Philips’ reputation or could adversely impact Philips’ financial condition or operating results through lost revenue and cost of any required remedial actions, penalties or claims for damages.
In addition, we may also face potentially conflicting supervisory directives, for example, as certain US regulatory and non-US authorities have prioritized ESG-related issues, while others have signaled pursuing potentially conflicting priorities. These circumstances, among others, may result in pressure from investors, unfavorable reputational impacts, including inaccurate perceptions or a misrepresentation of our actual ESG-related practices and diversion of management’s attention and resources. Any failure, or perceived failure, by us to adhere to our public statements, comply fully with developing interpretations of ESG-related laws and regulations (both “pro-ESG” and “anti-ESG”), or meet evolving and varied stakeholder expectations and standards could adversely affect Philips’ reputation or could adversely impact Philips’ financial condition or operating results through lost revenue and cost of any required remedial actions, penalties or claims for damages.
For further details, please refer to the sub-section Legal proceedings within the note Contingencies.
10.3 How we create value
The overview below is based on the International Integrated Reporting Council framework and includes resource inputs, value outcomes and societal impact across various financial and Environmental, Social and Governance (ESG) dimensions. For further information, refer to the chapters Financial performance, and Environmental, Social and Governance. Resource inputs
Human
•Employees 67,823, 120-plus nationalities
•Training 3,164,130 hours, 3,593,533 training completions
•29,790 employees in Growth geographies
Intellectual
•Invested in R&D EUR 1.7 billion (Green/EcoDesigned Innovation 263 million)
•Employees in R&D 10,843
Financial
•Equity EUR 12 billion
•Net debt* EUR 5.2 billion Manufacturing
•Employees in production 27,478
•Industrial sites 23, cost of materials used EUR 4.2 billion
•Total assets EUR 29 billion
•Capital expenditures on property, plant and equipment EUR 317 million
Natural
•Energy used in manufacturing 464,587 megawatt hours
•Water used 672,608 m3
•Closing the loop' on all our professional medical equipment by 2025
Social
•Philips Foundation
•Stakeholder engagement
•Volunteering policy
Value outcomes
Human
•Employee Engagement Index 78% favorable
•Sales per employee EUR 265,708
•Safety 151 Total Recordable Cases
Intellectual
•New patent filings 700
•Royalties EUR 466 million
•137 design awards for the Philips brand
Financial
•Comparable sales growth* 1%
•Adjusted EBITA* as a % of sales 11.5%
•Free cash flow* EUR 906 million
Manufacturing
•EUR 12.2 billion revenues from goods sold
Natural
•76.4% Green/EcoDesigned Revenues
•24.4% revenues from circular propositions
•Net CO2 emissions from own operations down to zero kilotonnes
•94 kilotonnes (estimated) from products, parts and packaging used to put products on the market
•Waste 20,157 tonnes, of which 94% recirculated
Social
•Brand value USD 11.5 billion (Interbrand)
•Partnerships with UNICEF, Red Cross, Amref and Ashoka
Societal impact
Human
•Employee benefit expenses EUR 6,641 million, all staff paid at least a Living Wage
•Appointed 54% of our roles from internal sources
•33% of leadership positions held by women
Intellectual
•Around 40% of revenues from new products and solutions introduced in the last three years
•Approximately 70% of sales from leadership positions
Financial
•Market capitalization EUR 23 billion at year-end
•Long-term credit rating BBB+1, Baa12, BBB+3 **
•Dividend EUR 768 million
Manufacturing
•100% electricity from renewable sources
Natural
•Environmental impact of Philips operations up to EUR 272 million
•All 23 industrial sites 'zero waste to landfill' at year-end 2024
•Full value chain CO2 reductions approved by the Science Based Targets initiative
Social
•1.96 billion lives improved, of which 242 million in underserved communities
•936,000 employees impacted at suppliers participating in the 'Beyond Auditing' program
•Total tax contribution EUR 3,263 million (taxes paid/withheld)
•Corporate income tax paid EUR 186 million
**1 Fitch, 2 Moody's, 3 S&P Global
| | | | | | | | |
Philips | Form 20-F 2024 | 192 | |
10.4 Reconciliation of non-IFRS information
In this Annual Report Philips presents certain financial measures when discussing Philips’ performance that are not measures of financial performance or liquidity under IFRS (‘non-IFRS’). These non-IFRS measures (also known as non-GAAP or alternative performance measures) are presented because management considers them important supplemental measures of Philips’ performance and believes that they are widely used in the industry in which Philips operates as a means of evaluating a company’s operating performance and liquidity. Philips believes that an understanding of its sales performance, profitability, financial strength and funding requirements is enhanced by reporting the following non-IFRS measures:
•comparable sales growth
•EBITA
•Adjusted EBITA
•Adjusted EBITDA
•adjusted income from continuing operations attributable to shareholders
•adjusted income from continuing operations attributable to shareholders per common share (in EUR) - diluted (Adjusted EPS)
•free cash flow
•net debt : group equity ratio
•Organic Return on Invested Capital (ROIC)
Non-IFRS measures do not have standardized meanings under IFRS and not all companies calculate non-IFRS measures in the same manner or on a consistent basis. As a result, these measures may not be comparable to measures used by other companies that have the same or similar names. Accordingly, undue reliance should not be placed on the non-IFRS measures contained in this Annual Report and they should not be considered as substitutes for sales, net income, net cash provided by operating activities or other financial measures computed in accordance with IFRS.
This chapter contains the definitions of the non-IFRS measures used in this Annual Report as well as reconciliations from the most directly comparable IFRS measures. The non-IFRS measures discussed in this Annual Report are cross referenced to this chapter. These non-IFRS measures should not be viewed in isolation or as alternatives to equivalent IFRS measures and should be used in conjunction with the most directly comparable IFRS measures.
The non-IFRS financial measures presented are not measures of financial performance or liquidity under IFRS, but measures used by management to monitor the underlying performance of Philips’ business and operations and, accordingly, they have not been audited or reviewed by Philips’ external auditors.
Additionally, Philips provides forward-looking targets for comparable sales growth, adjusted EBITA margin improvement, free cash flow and organic ROIC, which are non-IFRS financial measures. Philips has not provided a quantitative reconciliation of these targets to the most directly comparable IFRS measures because certain information needed to reconcile these non-IFRS financial measures to the most comparable IFRS financial measures are dependent on specific items or impacts which are not yet determined, are subject to uncertainty and variability in timing and amount due to their nature, are outside of Philips’ control, or cannot be predicted, including items and impacts such as currency exchange rates, acquisitions and disposals, legal and tax gains and losses and pension settlements, charges and costs such as impairments, restructuring and acquisition-related charges, amortization of intangible assets and net capital expenditures. Accordingly, reconciliations of these non-IFRS forward looking financial measures to the most directly comparable IFRS financial measures are not available without unreasonable effort. Such unavailable reconciling items could significantly impact the results of operations and financial condition.
Comparable sales growth
Comparable sales growth represents the period-on-period growth in sales excluding the effects of currency movements and changes in consolidation. As indicated in General information to the Consolidated financial statements, foreign currency sales and costs are translated into Philips’ presentation currency, the euro, at the exchange rates prevailing at the respective transaction dates. As a result of significant foreign currency sales and currency movements during the periods presented, the effects of translating foreign currency sales amounts into euros could have a material impact on the comparability of sales between periods. Therefore, these impacts are excluded when presenting comparable sales in euros by translating the foreign currency sales of the previous period and the current period into euros at the same average exchange rates. In addition, the years presented were affected by a number of acquisitions and divestments, as a result of which various activities were consolidated or deconsolidated. The effect of consolidation changes has also been excluded in arriving at the comparable sales. For the purpose of calculating comparable sales, when a previously consolidated entity is sold or control is lost, relevant sales of that entity for the corresponding prior year period are excluded. Similarly, when an entity is acquired and consolidated, relevant sales of that entity for the current year period are excluded. Comparable sales growth is presented for the Philips group, operating segments and geographic area. Philips believes that the presentation of comparable sales growth is meaningful for investors to evaluate the performance of Philips’ business activities over time. Comparable sales growth may be subject to limitations as an analytical tool for investors, because comparable sales growth figures are not adjusted for other effects, such as increases or decreases in prices or quantity/volume. In addition, interaction effects between currency movements and changes in consolidation are not taken into account.
Philips group
Sales growth composition by segment in %
| | | | | | | | | | | | | | |
| nominal growth | consolidation changes | currency effects | comparable growth |
| 2024 versus 2023 | | | | |
| Diagnosis & Treatment | (0.4) | 0.0 | 1.7 | 1.3 |
| Connected Care | (0.1) | 0.8 | 1.3 | 2.0 |
| Personal Health | (3.2) | 0.0 | 2.5 | (0.7) |
| Philips Group | (0.8) | 0.3 | 1.7 | 1.2 |
| | | | |
| 2023 versus 2022 | | | | |
| Diagnosis & Treatment | 6.3 | 0.2 | 4.5 | 11.0 |
| Connected Care | (2.5) | 0.3 | 3.3 | 1.1 |
| Personal Health | (0.7) | 0.0 | 3.9 | 3.2 |
| Philips Group | 1.9 | 0.2 | 3.9 | 6.0 |
| | | | |
| 2022 versus 2021 | | | | |
| Diagnosis & Treatment | 6.1 | 0.0 | (6.7) | (0.6) |
| Connected Care | (1.9) | 0.0 | (7.2) | (9.1) |
| Personal Health | 5.7 | 0.0 | (5.7) | 0.1 |
| Philips Group | 3.9 | (0.3) | (6.4) | (2.8) |
Philips Group
Sales growth composition by geographic area in %
| | | | | | | | | | | | | | |
| nominal growth | consolidation changes | currency effects | comparable growth |
| 2024 versus 2023 | | | | |
| Western Europe | 4.2 | 0.7 | (0.4) | 4.5 |
| North America | 1.2 | 0.4 | 0.5 | 2.2 |
| Other mature geographies | (6.2) | 0.1 | 5.0 | (1.1) |
| Mature geographies | 1.2 | 0.5 | 0.8 | 2.5 |
| Growth geographies | (5.8) | (0.1) | 3.8 | (2.1) |
| Philips Group | (0.8) | 0.3 | 1.7 | 1.2 |
| | | | |
| 2023 versus 2022 | | | | |
| Western Europe | 6.0 | 0.3 | 0.3 | 6.6 |
| North America | (0.3) | 0.2 | 2.7 | 2.5 |
| Other mature geographies | (1.0) | 0.1 | 8.2 | 7.3 |
| Mature geographies | 1.4 | 0.2 | 2.7 | 4.2 |
| Growth geographies | 3.4 | 0.2 | 6.9 | 10.5 |
| Philips Group | 1.9 | 0.2 | 3.9 | 6.0 |
| | | | |
| 2022 versus 2021 | | | | |
| Western Europe | (1.2) | (1.3) | (0.4) | (2.8) |
| North America | 11.9 | 0.2 | (12.4) | (0.3) |
| Other mature geographies | (3.0) | 0.0 | 2.5 | (0.5) |
| Mature geographies | 5.9 | (0.3) | (6.7) | (1.1) |
| Growth geographies | (0.8) | (0.1) | (5.9) | (6.9) |
| Philips Group | 3.9 | (0.3) | (6.4) | (2.8) |
EBITA and Adjusted EBITA
The term Adjusted EBITA is used to evaluate the performance of Philips and its segments. EBITA represents Income from operations excluding amortization and impairment of acquired intangible assets and impairment of goodwill. Adjusted EBITA represents EBITA excluding gains or losses from restructuring costs, acquisition-related charges and other items.
Restructuring costs are defined as the estimated costs of initiated reorganizations, the most significant of which have been approved by the Executive Committee, and which generally involve the realignment of certain parts of the industrial and commercial organization.
Acquisition-related charges are defined as costs that are directly triggered by the acquisition of a company, such as transaction costs, purchase accounting related costs and integration-related expenses.
Other items are defined as any individual item with an income statement impact (loss or gain) that is deemed by management to be both significant and incidental to normal business activity. This includes the following: litigation costs and settlements in favor of (or against) the company, gains (or losses) on sale of businesses or assets, remediation costs, impairment of assets, portfolio realignment charges, environmental charges and other items which are individually above an amount of EUR 20 million in a quarter, or an individual item which is above EUR 40 million across multiple quarters. Refer to Restructuring, acquisition-related charges and other items in the Results of operations section of Financial performance. Philips considers the use of Adjusted EBITA appropriate as Philips uses it as a measure of segment performance and as one of its strategic drivers to increase profitability through re-allocation of its resources towards opportunities offering more consistent and higher returns. This is done with the aim of making the underlying performance of the businesses more transparent.
EBITA excludes amortization and impairment of acquired intangible assets (which primarily relates to brand names, customer relationships and technology) and impairment of goodwill as Philips believes that such amounts are inconsistent in amount and frequency, are significantly impacted by the timing and/or size of acquisitions and do not factor into its decisions on allocation of its resources across segments. Although we exclude amortization and impairment of acquired intangible assets from the Adjusted EBITA measure, Philips believes that it is important for investors to understand that these acquired intangible assets contribute to revenue generation.
Philips believes Adjusted EBITA is useful to evaluate financial performance on a comparable basis over time by factoring out restructuring costs, acquisition-related charges and other incidental items which are not directly related to the operational performance of Philips Group or its segments.
Adjusted EBITA may be subject to limitations as an analytical tool for investors, as it excludes restructuring costs, acquisition-related charges and other incidental items and therefore does not reflect the expense associated with such items, which may be significant and have a significant effect on Philips’ net income.
Adjusted EBITA margin refers to Adjusted EBITA divided by sales expressed as a percentage.
Adjusted EBITA is not a recognized measure of financial performance under IFRS. The reconciliation of Adjusted EBITA to the most directly comparable IFRS measure, Net income, for the years indicated is presented in the following table. Net income is not allocated to segments as certain income and expense line items are monitored on a centralized basis, resulting in them being shown on a Philips Group level only.
Adjusted EBITDA
Adjusted EBITDA is defined as Income from operations excluding amortization and impairment of intangible assets, impairment of goodwill, depreciation and impairment of property, plant and equipment, restructuring costs, acquisition-related charges and other items.
Philips understands that Adjusted EBITDA is broadly used by analysts, rating agencies and investors in their evaluation of different companies because it excludes certain items that can vary widely across different industries or among companies within the same industry. Philips considers Adjusted EBITDA useful when comparing its performance to other companies in the HealthTech industry. However, Adjusted EBITDA may be subject to limitations as an analytical tool because of the range of items excluded and their significance in a given reporting period. Furthermore, comparisons with other companies may be complicated due to the absence of a standardized meaning and calculation framework. Philips management compensates for the limitations of using Adjusted EBITDA by using this measure to supplement IFRS results to provide a more complete understanding of the factors and trends affecting the business rather than IFRS results alone. In addition to the limitations noted above, Adjusted EBITDA excludes items that may be recurring in nature and should not be disregarded in the evaluation of performance. However, we believe it is useful to exclude such items to provide a supplemental analysis of current results and trends compared to other periods. This is because certain excluded items can vary significantly depending on specific underlying transactions or events. Also, the variability of such items may not relate specifically to ongoing operating results or trends and certain excluded items, while potentially recurring in future periods and may not be indicative of future results. Net income, for the years indicated is included in the following table. Net income is not allocated to segments as certain income and expense line items are monitored on a centralized basis, resulting in them being shown on a Philips Group level only.
Philips Group
Reconciliation of Net income to Adjusted EBITA and Adjusted EBITDA in millions of EUR
| | | | | | | | | | | | | | | | | |
| Philips Group | Diagnosis & Treatment | Connected Care | Personal Health | Other |
| 2024 | | | | | |
| Net Income | (698) | | | | | |
| Discontinued operations, net of income taxes | (142) | | | | | |
| Income tax expense (benefit) | 963 | | | | | |
| Investments in associates, net of income taxes | 124 | | | | | |
| Financial expenses | 387 | | | | | |
| Financial income | (105) | | | | | |
| Income from operations | 529 | | 592 | | (466) | | 544 | | (142) | |
| Amortization and impairment of acquired intangible assets | 392 | | 225 | | 141 | | 15 | | 12 | |
| | | | | |
| EBITA | 921 | | 817 | | (324) | | 559 | | (130) | |
| Restructuring and acquisition-related charges | 326 | | 157 | | 53 | | 25 | | 92 | |
| Other items: | 830 | | 45 | | 765 | | - | | 20 | |
| Respironics litigation provision | 984 | | | 984 | | | |
| Respironics insurance income | (538) | | | (538) | | | |
| Respironics field-action running remediation costs | 133 | | | 133 | | | - | |
| Respironics consent decree charges | 113 | | | 113 | | | |
| Quality remediation actions | 123 | | 45 | | 78 | | | |
| Remaining items | 16 | | | (4) | | - | | 20 | |
| Adjusted EBITA | 2,077 | | 1,018 | | 494 | | 584 | | (18) | |
| Depreciation, amortization and impairment of fixed assets and other intangible assets | 998 | 240 | 262 | 102 | 394 |
| Adding back impairment of fixed assets included in Restructuring and acquisition-related charges and Other items | (93) | (39) | (8) | (7) | (39) |
| Adjusted EBITDA | 2,982 | 1,219 | 747 | 679 | 337 |
Philips Group
Reconciliation of Net income to Adjusted EBITA and Adjusted EBITDA in millions of EUR
| | | | | | | | | | | | | | | | | |
| Philips Group | Diagnosis & Treatment | Connected Care | Personal Health | Other |
| 2023 | | | | | |
| Net Income | (463) | | | | | |
| Discontinued operations, net of income taxes | 10 | | | | | |
| Income tax expense (benefit) | (73) | | | | | |
| Investments in associates, net of income taxes | 98 | | | | | |
| Financial expenses | 376 | | | | | |
| Financial income | (63) | | | | | |
| Income from operations | (115) | | 721 | | (1,199) | | 552 | | (190) | |
| Amortization and impairment of acquired intangible assets | 290 | | 89 | | 178 | | 14 | | 9 | |
| Impairment of goodwill | 8 | | 8 | | - | | - | | - | |
| EBITA | 183 | | 818 | | (1,020) | | 567 | | (181) | |
| Restructuring and acquisition-related charges | 381 | | 118 | | 115 | | 9 | | 140 | |
| Other items: | 1,358 | | 92 | | 1,275 | | 22 | | (32) | |
| Respironics litigation provision | 575 | | | 575 | | | |
| Respironics field-action connected to the proposed consent decree | 363 | | | 363 | | | |
| Respironics field-action running remediation costs | 224 | | | 224 | | | |
| Quality remediation actions | 175 | | 81 | | 94 | | | |
| Provision for a legal matter | 31 | | | 31 | | | |
| Investment re-measurement loss | 23 | | | | 23 | | |
| Gain on divestment of business | (35) | | | | | (35) | |
| Remaining items | 2 | | 11 | | (12) | | (1) | | 3 | |
| Adjusted EBITA | 1,921 | | 1,028 | | 369 | | 597 | | (73) | |
| Depreciation, amortization and impairment of fixed assets and other intangible assets | 971 | | 217 | | 267 | | 101 | | 385 | |
| Adding back impairment of fixed assets included in Restructuring and acquisition-related charges and Other items | (47) | | (4) | | (14) | | - | | (30) | |
| Adjusted EBITDA | 2,845 | | 1,241 | | 623 | | 698 | | 283 | |
Philips Group
Reconciliation of Net income to Adjusted EBITA and Adjusted EBITDA in millions of EUR | | | | | | | | | | | | | | | | | |
| Philips Group | Diagnosis & Treatment | Connected Care | Personal Health | Other |
| 2022 | | | | | |
| Net Income | (1,605) | | | | | |
| Discontinued operations, net of income taxes | (13) | | | | | |
| Income tax expense (benefit) | (113) | | | | | |
| Investments in associates, net of income taxes | 2 | | | | | |
| Financial expenses | 258 | | | | | |
| Financial income | (58) | | | | | |
| Income from operations | (1,529) | | 536 | | (2,347) | | 515 | | (233) | |
| Amortization and impairment of acquired intangible assets | 363 | | 115 | | 226 | | 15 | | 8 | |
| Impairment of goodwill | 1,357 | | | 1,357 | | | |
| EBITA | 192 | | 651 | | (764) | | 530 | | (225) | |
| Restructuring and acquisition-related charges | 202 | | 3 | | 125 | | 11 | | 62 | |
| Other items: | 925 | | 133 | | 750 | | (4) | | 46 | |
| Respironics field-action connected to the proposed consent decree | 250 | | | 250 | | | |
| Respironics field-action running remediation costs | 210 | | | 210 | | | |
| R&D project impairments | 134 | | 73 | | 59 | | 3 | | |
| Portfolio realignment charges | 109 | | | 109 | | | |
| Impairments of assets in S&RC | 39 | | | 39 | | | |
| Provision for public investigations tender irregularities | 60 | | 60 | | | | |
| Quality remediation actions | 59 | | | 59 | | | |
| Remaining items | 63 | | - | | 24 | | (6) | | 46 | |
| Adjusted EBITA | 1,318 | | 787 | | 111 | | 537 | | (117) | |
| Depreciation, amortization and impairment of fixed assets and other intangible assets | 1239 | 302 | 420 | 117 | 400 |
| Adding back impairment of fixed assets included in Restructuring and acquisition-related charges and Other items | (252) | | (83) | | (136) | | (3) | | (30) | |
| Adjusted EBITDA | 2,305 | | 1,006 | | 394 | | 652 | | 253 | |
Adjusted income from continuing operations attributable to shareholders
The term Adjusted income from continuing operations attributable to shareholders represents income from continuing operations less continuing operations non-controlling interests, amortization and impairment of acquired intangible assets, impairment of goodwill, excluding gains or losses from restructuring costs and acquisition-related charges, other items, adjustments to net finance expenses, adjustments to investments in associates and adjustments to tax expense. Shareholders refers to shareholders of Koninklijke Philips N.V.
Restructuring costs, acquisition-related charges and other items are all defined in the EBITA and Adjusted EBITA section above.
Net finance expenses are defined as either the financial income or expense component of an individual item already identified to be excluded as part of the Adjusted income from continuing operations, fair value movements of equity investments in limited life funds recognized at fair value through profit or loss or a financial income or expense component with an income statement impact (gain or loss) that is deemed by management to be both significant and incidental to normal business activity.
The adjustments to tax expense include the tax impact on adjustments to income from continuing operations, as well as tax-only adjusting items (such as the derecognition of deferred tax assets).
Philips considers the use of Adjusted income from continuing operations attributable to shareholders appropriate as Philips uses it as the basis for the Adjusted income from continuing operations attributable to shareholders per common share (in EUR) - diluted, a non-IFRS measure.
Adjusted income from continuing operations attributable to shareholders may be subject to limitations as an analytical tool for investors, as it excludes certain items and therefore does not reflect the expense associated with such items, which may be significant and have a significant effect on Philips’ net income. Net income, for the years indicated is included in the following table. Net income is not allocated to segments as certain income and expense line items are monitored on a centralized basis, resulting in them being shown on a Philips Group level only.
Adjusted income from continuing operations attributable to shareholders is not a recognized measure of financial performance under IFRS. The reconciliation of Adjusted income from continuing operations attributable to shareholders to the most directly comparable IFRS measure, Net income, for the years indicated is included in the following table.
Adjusted income from continuing operations attributable to shareholders per common share (in EUR) - diluted (Adjusted EPS)
Adjusted income from continuing operations attributable to shareholders per common share (in EUR) - diluted is calculated by dividing the Adjusted income from continuing operations attributable to shareholders by the diluted weighted average number of shares (after deduction of treasury shares) outstanding during the period, as defined in General information to the Consolidated financial statements, earnings per share section. Philips considers the use of Adjusted income from continuing operations attributable to shareholders per common share (in EUR) - diluted appropriate as it is a measure that is useful when comparing its performance to other companies in the HealthTech industry. However, it may be subject to limitations as an analytical tool for investors, as it uses Adjusted income from continuing operations attributable to shareholders which has certain items excluded.
Adjusted income from continuing operations attributable to shareholders per common share (in EUR) - diluted is not a recognized measure of financial performance under IFRS. The most directly comparable IFRS measure, income from continuing operations attributable to shareholders per common share (in EUR) - diluted for the years indicated, is included in the following table.
Philips Group
Adjusted income from continuing operations attributable to shareholders1 in millions of EUR unless otherwise stated | | | | | | | | | | | |
| 2022 | 2023 | 2024 |
| Net income | (1,605) | | (463) | | (698) | |
| Discontinued operations, net of income taxes | (13) | | 10 | | (142) | |
| Income from continuing operations | (1,618) | | (454) | | (840) | |
| Income from continuing operations attributable to non-controlling interests | (3) | | (2) | | (3) | |
| Income from continuing operations attributable to shareholders¹ | (1,622) | | (456) | | (843) | |
| Adjustments for: | | | |
| Amortization and impairment of acquired intangible assets | 363 | | 290 | | 392 | |
| Impairment of goodwill | 1,357 | | 8 | | | |
| Restructuring costs and acquisition-related charges | 202 | | 381 | | 326 | |
| Other items: | 925 | | 1,358 | | 830 | |
| Respironics litigation provision | | 575 | | 984 | |
| Respironics insurance income | | | (538) | |
| Respironics consent decree charges | 250 | | 363 | | 113 | |
| Respironics field-action running costs | 210 | | 224 | | 133 | |
| Quality actions | 59 | | 175 | | 123 | |
| R&D project impairments | 134 | | | |
| Portfolio realignment charges | 109 | | | |
| Impairment of assets in S&RC | 39 | | | |
| Provision for public investigations tender irregularities | 60 | | | |
| Provision for a legal matter | | 31 | | |
| Investment re-measurement loss | | 23 | | |
| Loss (gain) on divestment of business | | (35) | | |
| Remaining items | 63 | | 2 | | 16 | |
| Net finance income/expenses | (4) | | 18 | | 23 | |
| Tax impact on adjusting items² | (376) | | (450) | | (370) | |
| Tax effect of derecognition of US deferred tax asset | | | 941 | |
Adjusted Income from continuing operations attributable to shareholders1 | 845 | | 1,148 | | 1,300 | |
| Earnings per common share: | | | |
| Income from continuing operations attributable to shareholders¹ per common share (in EUR) - diluted | (1.70) | | (0.48) | | (0.90) | |
| Adjusted income from continuing operations attributable to shareholders¹ per common share (in EUR) - diluted | 0.89 | | 1.21 | | 1.39 | |
1Shareholders refers to shareholders of Koninklijke Philips N.V. Per share calculations have been adjusted retrospectively for all periods presented to reflect the issuance of shares for the share dividend in respect of 2023.
2Includes deferred tax assets derecognized in the line below.
Free cash flow
Free cash flow is defined as net cash flows from operating activities minus net capital expenditures. Net capital expenditures are comprised of the purchase of intangible assets, expenditures on development assets, capital expenditures on property, plant and equipment and proceeds from sales of property, plant and equipment.
Philips discloses free cash flow as a supplemental non-IFRS financial measure, as Philips believes it is a meaningful measure to evaluate the performance of its business activities over time. Philips understands that free cash flow is broadly used by analysts, rating agencies and investors in assessing its performance. Philips also believes that the presentation of free cash flow provides useful information to investors regarding the cash generated by the Philips operations after deducting cash outflows for purchases of intangible assets, capitalization of product development, expenditures on development assets, capital expenditures on property, plant and equipment and proceeds from disposal of property, plant and equipment. Therefore, the measure gives an indication of the long-term cash generating ability of the business. In addition, because free cash flow is not impacted by purchases or sales of businesses and investments, it is generally less volatile than the total of net cash provided by (used for) operating activities and net cash provided by (used for) investing activities.
Free cash flow may be subject to limitations as an analytical tool for investors, as free cash flow is not a measure of cash generated by operations available exclusively for discretionary expenditures and Philips requires funds in addition to those required for capital expenditures for a wide variety of non-discretionary expenditures, such as payments on outstanding debt, dividend payments or other investing and financing activities. In addition, free cash flow does not reflect cash payments that may be required in future for costs already incurred, such as restructuring costs.
Philips Group
Composition of free cash flow in millions of EUR
| | | | | | | | | | | |
| 2022 | 2023 | 2024 |
| Net cash flows provided by operating activities | (173) | | 2,136 | | 1,569 | |
| Net capital expenditures: | (788) | | (554) | | (663) | |
| Purchase of intangible assets | (105) | | (96) | | (118) | |
| Expenditures on development assets | (257) | | (203) | | (241) | |
| Capital expenditures on property, plant and equipment | (444) | | (345) | | (317) | |
| Proceeds from disposals of property, plant and equipment | 18 | | 90 | | 13 | |
| Free cash flow | (961) | | 1,582 | | 906 | |
Net debt : group equity ratio
Net debt : group equity ratio is presented to express the financial strength of Philips. Net debt is defined as the sum of long- and short-term debt minus cash and cash equivalents. Group equity is defined as the sum of shareholders’ equity and non-controlling interests. This measure is used by Philips Treasury management and investment analysts to evaluate financial strength and funding requirements. This measure may be subject to limitations because cash and cash equivalents are used for various purposes, not only debt repayment. The net debt calculation deducts all cash and cash equivalents whereas these items are not necessarily available exclusively for debt repayment at any given time.
Philips Group
Composition of net debt to group equity in millions of EUR unless otherwise stated
| | | | | | | | | | | |
| 2022 | 2023 | 2024 |
| Long-term debt | 7,270 | | 7,035 | | 7,113 | |
| Short-term debt | 931 | | 654 | | 526 | |
| Total debt | 8,201 | | 7,689 | | 7,639 | |
| Cash and cash equivalents | 1,172 | | 1,869 | | 2,401 | |
| Net debt | 7,028 | | 5,820 | | 5,238 | |
| Shareholders’ equity | 13,249 | | 12,028 | | 12,006 | |
| Non-controlling interests | 34 | | 33 | | 37 | |
| Group equity | 13,283 | | 12,061 | | 12,043 | |
| Net debt : group equity ratio | 35:65 | 33:67 | 30:70 |
Organic Return on Invested Capital
Organic Return on Invested Capital (ROIC) is defined as organic return which includes income from operations for the year excluding the impact of: income or loss from operations of businesses acquired in the five year period prior to the measurement date; the related tax effects on such income or loss; certain other items; the tax impact on adjusting items and certain tax-only adjusting items determined by management to be material in nature and require separate disclosure, divided by average of the net operating capital at the end of each of the five quarters ending on the relevant measurement date excluding the average net operating capital at the end of each of the five quarters ending on the relevant measurement date of the businesses acquired in the five year period prior to the measurement date, expressed as a percentage.
Net operating capital is defined as tangible fixed assets, intangible fixed assets, including goodwill, inventories and receivable balances, minus payable balances and provisions, all as further defined below. Net operating capital is adjusted to exclude assets and liabilities of businesses acquired in the five year period prior to the relevant measurement date, and adjustments determined by management to be necessary for comparability.
Other items are defined as material in nature and require separate disclosure and have the same nature as the items excluded from Adjusted EBITA. In the years 2020-2022 these other items included legal provisions, pension settlements, results of divestments, remediation costs, impairment of assets and portfolio realignment charges. Refer to Restructuring, acquisition-related charges and other items Net income, Income from operations (EBIT) and Adjusted EBITA within the Results of operations section of Financial performance. Organic ROIC is calculated after taxes. The term Organic Return on Invested Capital (ROIC) is used by management to evaluate Philips’ efficiency at allocating the capital under its control to profitable investments and how well the company uses capital to generate returns. Philips believes that Organic ROIC provides useful information to investors because it excludes the impact of recently acquired businesses, giving a more accurate representation of how the Philips integrated operating model is leveraged to drive operational excellence and removes irregularity caused by various operating models of recently acquired businesses. Philips also believes that excluding certain items determined by management to be material in nature and requiring separate disclosure enhances comparability across several periods. Organic ROIC may be subject to limitations as an analytical tool for investors, as it excludes Income or Loss from operations of acquired businesses, the related tax effects on such income or loss, the tax impact on adjusting items and certain tax-only adjusting items, which may have a significant effect on ROIC. Organic ROIC is not a recognized measure of financial performance under IFRS.
The most comparable IFRS measure to Organic ROIC is Return on total assets, calculated as Income from operations for the year divided by total assets as of the end of the year.
Philips Group
Return on total assets in millions of EUR unless otherwise stated
| | | | | | | | | | | |
| 2022 | 2023 | 2024 |
| Income from operations | (1,529) | (115) | 529 |
| Total assets | 30,688 | 29,406 | 28,976 |
| Return on total assets (%) | (5.0 | %) | (0.4 | %) | 1.8 | % |
The reconciliation of Average Net operating capital and the reconciliation of Net income to Organic ROIC for the years ended December 31, 2022, 2023 and 2024 are included in the following tables.
Philips Group
Reconciliation of Average Net operating capital1 in millions of EUR
| | | | | | | | | | | |
| 2022 | 2023 | 2024 |
| Tangible fixed assets | 2,715 | | 2,553 | | 2,467 | |
| Intangible assets (including goodwill) | 14,684 | | 13,475 | | 13,175 | |
| Inventories | 3,999 | | 3,984 | | 3,499 | |
| Receivable balances² | 5,043 | | 4,981 | | 4,761 | |
| Payable balances³ | (7,129) | | (6,810) | | (6,440) | |
| Provisions⁴ | (2,313) | | (2,420) | | (2,909) | |
| Group Average Net operating capital | 16,999 | | 15,763 | | 14,554 | |
| Net operating capital of businesses acquired | (5,739) | | (4,081) | | (3,579) | |
| Average Net operating capital | 11,260 | | 11,681 | | 10,974 | |
1All line items represent the average of each of the five quarters ending before the relevant measurement date.
2Receivable balances consists of (Non-)Current receivables, Other (non-)current assets, (Non-)Current derivative financial assets and Income tax receivable.
3Payable balances consist of Accounts payable, Accrued liabilities, (Non-)Current contract liabilities, Other (Non-)current liabilities, (Non-) current derivative financial liabilities and (Non-)Current tax liabilities.
4Provisions consist of Long-term and Short-term provisions.
Philips Group
Reconciliation of Net Income to Organic ROIC in millions of EUR unless otherwise stated
| | | | | | | | | | | |
| 2022 | 2023 | 2024 |
| Net Income | (1,605) | | (463) | | (698) | |
| Discontinued operations, net of income taxes | (13) | | 10 | | (142) | |
| Income tax expense (benefit) | (113) | | (73) | | 963 | |
| Investments in associates, net of income taxes | 2 | | 98 | | 124 | |
| Financial expenses | 258 | | 376 | | 387 | |
| Financial income | (58) | | (63) | | (105) | |
| Income from operations | (1,529) | | (115) | | 529 | |
| Income tax (expense) benefit | 113 | | 73 | | (963) | |
| Loss from operations of businesses acquired | 178 | | 253 | | 174 | |
| Tax effects on loss from operations of businesses acquired | (45) | | (56) | | (41) | |
| Goodwill impairment | 1,357 | | 8 | | - | |
| Impairment of acquired intangible asset | | | 132 | |
| Other items: | 802 | | 1,181 | | 691 | |
| Respironics litigation provision | | 575 | | 984 | |
| Respironics insurance income | | | (538) | |
| Respironics consent decree charges | 250 | | 363 | | 113 | |
| Respironics field-action running costs | 210 | | 224 | | 133 | |
| R&D project impairments | 134 | | | |
| Portfolio realignment charges | 109 | | | |
| Impairment of assets in S&RC | 39 | | | |
| Provision for specified legal matters | 60 | | 31 | | |
| Investment re-measurement loss | | 23 | | |
| Loss (gain) on divestment of business | | (35) | | |
| Tax impact on adjusting item¹ | (169) | | (140) | | (165) | |
| Tax effect of derecognition of US deferred tax asset | | | 941 | |
| Organic return | 707 | | 1,204 | | 1,299 | |
| Average Net operating capital | 11,260 | | 11,681 | | 10,974 | |
| Organic ROIC (%) | 6.3% | 10.3% | 11.8% |
| | | |
1 Includes deferred tax assets derecognized in the line below. |
10.5 Other Key Performance Indicators
In addition to monitoring the IFRS and non-IFRS financial measures discussed under Financial performance, Philips management also uses the following other key performance indicators to monitor the performance of the business and to manage the business. Philips Group
Other Key Performance Indicators
| | | | | | | | | | | |
| 2022 | 2023 | 2024 |
| Lives improved, in billions | 1.81 | 1.88 | 1.96 |
| Operational carbon footprint, in kilotonnes CO₂-equivalent | 438 | 418 | 474 |
| Circular revenue | 18.1 | % | 20.0 | % | 24.4 | % |
| Waste to landfill | 0.0 | % | 0.0 | % | 0.0 | % |
| Closing the Loop | 35.3 | % | 20.5 | % | 19.5 | % |
| Comparable order intake | (3 | %) | (6 | %) | 1 | % |
Lives Improved
The purpose of Philips is to improve people’s health and well-being through meaningful innovation and we aim to improve the lives of 2 billion people a year by 2025, including 300 million in underserved communities, rising to 2.5 billion and 400 million respectively by 2030. We use Lives Improved as a measurement of our societal impact. In the course of 2021 we changed the definition of ‘lives improved’ (effective January 2021) to align more closely with our purpose. The new definition includes only products or solutions that contribute to people’s health and well-being, and no longer includes the contribution from our Green Products and Solutions that support a healthy ecosystem. Additionally, as we discontinued our Domestic Appliances business, we have removed the impact of this business from the Lives Improved results. The combined
impact of these changes resulted in an overall drop of 223 million lives improved in 2021. We calculate Lives Improved as the number of individual interactions for each product sold (based on market intelligence and statistical data) and multiply by the number of those products delivered in a year (eliminating double counting for multiple different product touches per individual). See Improving people’s lives for more information on Lives Improved. Operational Carbon Footprint
We aim to minimize our environmental impact and we use the Operational Carbon Footprint as one of the measurements of our impact. We define Operational Carbon Footprint as the total greenhouse gas emissions caused by an organization, event, product or person; expressed in kilotonnes CO2-equivalent. We calculate our Operational Carbon Footprint on a monthly basis and include industrial sites (manufacturing and assembly sites), non-industrial sites (offices, warehouses, IT centers and R&D facilities), business travel (lease and rental cars and airplane travel) and logistics (air, sea and road transport) See Climate change for more information on our Operational Carbon Footprint. Circular Revenues
Propositions that qualify for circular revenues must comply with the requirements for at least one of the circular revenue categories. These include, among others, products with low weight or containing a minimum threshold of recycled or bio-based plastics, as-a-service models, software running on cloud, telehealth, upgrades, lifetime extensions, and refurbished equipment.
Waste to Landfill
At Philips, as a responsible company, we strive to reduce our environmental impact. We define Waste to Landfill as total waste that is delivered for landfill and exclude one-time-only waste and waste delivered to landfill due to regulatory requirements. We calculate Waste to Landfill in kilotonnes per year. See Resource Use and circular economy for more information on Waste to Landfill. Closing the Loop
Closing the loop means we are embedding a policy to responsibly take back all professional medical equipment sold directly to customers as part of a trade-in offer or as a service at customer request. As part of the policy, we will ensure that equipment coming back to us is, where feasible, made available for refurbishment and/or parts recovery, or locally recycled in a certified way to ensure it does not end up in landfill. We monitor the impact of our policies by measuring the amount of equipment that we collect from our customers. We report on this as ‘reclaimed equipment’.
Philips believes that the five other key performance indicators described above (Lives Improved, Operational Carbon Footprint, Circular Revenues, Waste to Landfill and Closing the Loop) provide important information to investors and are important to understanding the long-term performance and prospects of the business. In addition, these other key performance indicators are also used for management compensation purposes. Members of the Board of Management are eligible for grants of performance shares under the Long-Term Incentive (LTI) Plan, and the vesting of the performance shares is subject to performance over a period of 3 years and based on certain criteria, including a 10% weighting for Sustainability Objectives, which Philips defines as the five other key performance indicators described above: Lives Improved, Carbon Footprint, Circular Revenues, Waste to Landfill and Closing the Loop. Philips believes that including these other key performance indicators in our remuneration policy encourages management to act responsibly and sustainably, supporting the company’s overall performance and enhancing the long-term value of the company. See Remuneration of the Board of Management in 2024 for more information on the Philips Long-Term Incentive (LTI) Plan. Philips currently intends to propose a 2025 Remuneration Policy for the Board of Management which would, among other things, provide for the vesting of performance shares subject to performance over a period of 3 years and based on certain criteria, including a 20% weighting for Sustainability Objectives, which would be defined under that plan as: Lives Improved, Carbon Footprint, Circular Revenues and Employee Engagement Index. The 2025 Remuneration Policy is subject to the approval of Philips shareholders at the 2025 AGM. See Remuneration of the Board of Management in 2024. For more information on the Philips Long-Term Incentive (LTI) Plans under the 2020 Remuneration Policy and the currently proposed 2025 Remuneration Policy. Comparable order intake
Comparable order intake represents the period-on-period growth, expressed as a percentage, in order intake excluding the effects of currency movements and changes in consolidation. Comparable order intake is reported for equipment and software in the Diagnoses & Treatment and Connected Care segments, and is defined as the total contractually committed value of equipment and software to be delivered within a specified timeframe, and is an approximation of expected future revenue growth in the respective Businesses. Comparable order intake does not derive from the financial statements and a quantitative reconciliation is thus not provided. In 2023, comparable order book was tracked for Businesses that represented approximately 40% of 2023 sales.
Effective in the first quarter of 2024, Philips revised the order intake policy to reflect the full contract value for software contracts that start generating revenue within an 18-month horizon, instead of only the next 18-months-to-revenue horizon. This change has been implemented to better align with the specific business model of our software businesses, simplify the order intake process, and better align with peers. Prior-period comparable order intake percentages have been restated accordingly. This revision did not resulted in any material changes to the order intake percentages for the periods presented. Philips believes this policy eliminates major variances in order intake growth and better reflects expected revenue in the short term from order intake booked in the reporting period.
Philips uses comparable order intake as an indicator of business activity and performance. Comparable order intake is not an alternative to revenue and may be subject to limitations as an analytical tool due to differences in amount and timing between booking orders and revenue recognition. Due to divergence in practice, other companies may calculate this or a similar measure (such as order backlog) differently and therefore comparisons between companies may be complicated.
Comparable order intake increased to 1% in 2024, compared to a 6% decline in 2023. Comparable order intake is presented when discussing Philips' group performance.
10.6 Taxation
Dutch taxation
The statements below are only a general summary of certain material Dutch tax consequences for holders of common shares that are non- residents of the Netherlands based on Dutch tax laws, presently in force, and the Tax Convention of December 18, 1992, as amended by the protocol that entered into force on December 28, 2004, between the United States of America and the Kingdom of the Netherlands (the US Tax Treaty) and are not to be read as extending by implication to matters not specifically referred to herein. For entity qualification rules, reference is made to the last paragraph of this statement. As to individual tax consequences, investors in common shares should consult their own professional tax advisor.
With respect to a holder of common shares that is an individual who receives income or derives capital gains from common shares and this income received or capital gains derived are attributable to past, present or future employment activities of such holder, the income of which is taxable in the Netherlands, the Dutch tax position is not discussed in this summary.
Dividend withholding tax
In general, a distribution to shareholders by a company resident in the Netherlands (such as the company) is subject to a withholding tax imposed by the Netherlands at a rate of 15%, which is withheld on the gross amount of the dividend. The term “dividends” for Dutch dividend withholding tax purposes includes, but is not limited to:
•distributions in cash or in kind, deemed and constructive distributions and repayments of paid-in capital not recognized for Dutch dividend withholding tax purposes
•liquidation proceeds, proceeds of redemption of ordinary shares, or, generally, consideration for the repurchase of ordinary shares in excess of the average paid-in capital of those ordinary shares recognized for Dutch dividend withholding tax purposes
•the nominal value of ordinary shares issued to a holder or an increase of the nominal value of ordinary shares, as the case may be, to the extent that it does not appear that a contribution to the capital recognized for Dutch dividend withholding tax purposes was made or will be made
•partial repayment of paid-in capital, recognized for Dutch dividend withholding tax purposes, if and to the extent that there are net profits (zuivere winst), within the meaning of the Dutch Dividend Withholding Tax Act 1965 (Wet op de Dividendbelasting 1965), unless the general meeting of shareholders has resolved in advance to make such payment and provided that the nominal value of the ordinary shares concerned has been reduced by a corresponding amount by way of an amendment of the article of association of the company
Relief at source is available to certain qualifying corporate holders of common shares if such common shares are attributable to a business carried out in the Netherlands, provided that such holder demonstrates that it is the beneficial owner of the dividend. Relief at source is available for dividend distributions to certain qualifying corporate holders of common shares resident in EU/EEA member states, and to certain qualifying corporate holders of common shares resident in non-EU/EEA states with which the Netherlands has concluded a tax treaty that includes a dividend article, provided that such holder demonstrates that it is the beneficial owner of the dividend unless such holder holds the common shares of the company with the primary aim or one of the primary aims to avoid the levy of Dutch dividend withholding tax from another person and the shareholding is put in place without valid commercial reasons that reflect economic reality.
Upon request and under certain conditions, certain qualifying non-resident individual and corporate holders of common shares resident in EU/EEA member states or in a qualifying non-EU/EEA state may be eligible for a refund of Dutch dividend withholding tax to the extent that the withholding tax levied is higher than the personal and corporate income tax which would have been due if they were resident in the Netherlands. However, this refund is not applicable when, based on the US Tax Treaty, the Dutch dividend withholding tax can be fully credited in the United States by the US holder.
Pursuant to the provisions of the US Tax Treaty, a reduced rate may be applicable in respect of dividends paid by the company to a beneficial owner holding directly 10% or more of the voting power of the company, if such owner is a company resident in the United States (as defined in the US Tax Treaty) and entitled to the benefits of the US Tax Treaty.
Pursuant to Dutch anti-dividend stripping legislation, a holder of common shares who is the recipient of dividends will in any case not be considered the beneficial owner of the dividends if (i) as a consequence of a combination of transactions, a person other than the recipient benefits, in full or in part, directly or indirectly, from the dividends; (ii) whereby such other person retains, directly or indirectly, an interest similar
to that in the common shares on which the dividends were paid; and (iii) that other person is entitled to a credit, reduction or refund of dividend withholding tax that is less than that of the recipient.
Dividends paid to qualifying exempt US pension trusts and qualifying exempt US organizations are, under certain conditions, exempt from Dutch withholding tax under the US Tax Treaty. Qualifying exempt US pension trusts normally remain subject to withholding at the rate of 15% and are required to file for a refund of the tax withheld. Only if certain conditions are fulfilled, such pension trusts may be eligible for relief at source upon payment of the dividend. However, for qualifying exempt US organizations no relief at source upon payment of the dividend is currently available; such exempt US organizations should apply for a refund of the 15% withholding tax withheld. Further, under certain circumstances, certain exempt organizations (e.g. pension funds) may be eligible for a refund of Dutch withholding tax upon their request pursuant to Dutch tax law.
From 1 January 2024 onwards, , provided certain conditions are met, such (US) organizations may be eligible for relief at source upon request.
The company may, with respect to certain dividends received from qualifying non-Dutch subsidiaries, credit taxes withheld from those dividends against the Dutch withholding tax imposed on certain qualifying dividends that are redistributed by the company, up to a maximum of the lesser of:
•3% of the amount of qualifying dividends redistributed by the company
•3% of the gross amount of certain qualifying dividends received by the company
The reduction is applied to the Dutch dividend withholding tax that the company must pay to the Dutch tax authorities and not to the Dutch dividend withholding tax that the Company must withhold.
From 1 January 2024 onwards, in addition to Dutch dividend withholding tax, Dutch conditional withholding tax may apply at a statutory rate of 25.8% on dividends to certain corporate holders in low-tax jurisdictions or in abuse situations, that are affiliated (gelieerd) to the company for the purpose of the Dutch Withholding Tax Act 2021 (Wet bronbelasting 2021). The term “dividends” for the conditional withholding tax is equal to the term “dividends” for dividend withholding tax purposes. Specific rules apply with respect to payment to hybrid entities.
Corporate holders subject to the conditional withholding tax on dividends are those that:
•are judged on circumstances or according to local regulations are established in a low-tax jurisdiction; if the benefit beneficiary is also established in a high-tax jurisdiction and certain conditions have been met, they will not be subject to tax
•are not established in a low-tax jurisdiction, but the benefits are allocated to a permanent establishment in that jurisdiction
•from a Dutch perspective are transparent and from the perspective of the country of the underlying participant are non-transparent (hybrid entity)
•from a Dutch perspective are non-transparent and from the perspective of the country of establishment are transparent (reverse hybrid entity)
•are not established in the Netherlands or a low-tax jurisdiction but there is an abuse situation. For there to be abuse, both the subjective test and the objective test must be met. The subjective test means that the main objective or one of the main objectives of the arrangement is to avoid withholding tax being imposed at another party. The objective test is met if there is an artificial arrangement or transaction (the arrangement is not set up based on valid business reasons that reflect economic reality).
As per January 1, 2025, a corporate shareholder is generally considered to be affiliated to the company i) if the corporate shareholder alone or together with other entities that belong to a qualifying unit hold a qualifying interest in the company, or ii) if the company alone or together with other entities that belong to qualifying unit hold a qualifying interest in the shareholder. There is a qualifying unit if the entities act jointly with the main purpose or one of the main purposes to avoid the levying of withholding. For the purpose of the Dutch Withholding Tax Act 2021 a qualifying interest is an interest in an entity with which the decisions can be influenced in such a way that the activities of an entity can be determined.
Income and capital gains
Income and capital gains derived from the common shares by a non-resident individual or non-resident corporate shareholder are generally not subject to Dutch income or corporation tax, unless (i) such income and gains are attributable to a (deemed) permanent establishment or (deemed) permanent representative of the shareholder in the Netherlands; or (ii) the shareholder is entitled to a share in the profits of an enterprise or (in the case of a non-resident corporate shareholder only) a co-entitlement to the net worth of an enterprise that is effectively managed in the Netherlands (other than by way of securities) and to which enterprise the common shares are attributable; or (iii) such income and capital gains are derived from a direct, indirect or deemed substantial participation in the share capital of the company, and, in the case of a non-resident individual shareholder, such substantial participation not being a business asset, and, in the case of a non-resident corporate shareholder only, it is being held with the primary aim or one of the primary aims to avoid the levy of income tax from another person and is put in place without valid commercial reasons that reflect economic reality; or (iv) in the case of a non-resident corporate shareholder, such shareholder is a resident of
Aruba, Curacao or Saint Martin with a permanent establishment or permanent representative in Bonaire, Eustatius or Saba to which the common shares are attributable and certain conditions are met; or (v) in the case of a non-resident individual, such individual derives income or capital gains from the common shares that are taxable as benefits from ‘miscellaneous activities’ in the Netherlands (resultaat uit overige werkzaamheden, as defined in the Dutch Income Tax Act 2001), which includes the performance of activities with respect to the common shares that exceed regular portfolio management.
In general, a holder of common shares has a substantial participation if he holds either directly or indirectly and either independently or jointly with his partner (as defined in the Dutch Income Tax Act 2001), the ownership of, or certain other rights over, at least 5% of the total issued share capital or total issued particular class of shares of the company or rights to acquire direct or indirect shares, whether or not already issued, that represent at any time 5% or more of the total issued capital (or the total issued particular class of shares) or the ownership of certain profit participating certificates that relate to 5% or more of the annual profit or to 5% or more of the liquidation proceeds. A shareholder will also have a substantial participation in the company if one or more of certain relatives of the shareholder hold a substantial participation in the company. A deemed substantial participation amongst others exists if (part of) a substantial participation has been disposed of, or is deemed to have been disposed of, on a nonrecognition basis.
Estate and gift taxes
No estate, inheritance or gift taxes are imposed by the Netherlands on the transfer or deemed transfer of common shares by way of gift by or on the death of a shareholder if, at the time of the death of the shareholder or the gift of the common shares (as the case may be), such shareholder is not a (deemed) resident of the Netherlands.
Inheritance or gift taxes (as the case may be) are due, however, if:
•such shareholder has Dutch nationality and has been a resident of the Netherlands at any time during the 10 years preceding the time of their death or gift
•such shareholder does not have Dutch nationality but has been a resident of the Netherlands at any time during the 12 months preceding the time of the gift (for Netherlands gift taxes only)
•in case of a gift of the shares under a condition precedent (opschortende voorwaarde) by an individual who at the time of the gift was not a (deemed) resident of the Netherlands, but such individual as (deemed) resident of the Netherlands at the time of fulfillment of the condition
Other taxes and duties
No Netherlands VAT and Netherlands registration tax, customs duty, stamp duty or other similar documentary tax or duty will be payable by a holder of common shares in connection with the holding or the disposal of the ordinary shares.
As from 1 January 2025 a new qualification form for foreign legal forms will take effect, which may be relevant for the qualification of holder of shares as a transparent vehicle or as an entity from a Dutch tax perspective. This new qualification policy consists of i) the discontinuation of the Netherlands open limited partnership (open commanditaire vennootschap), ii) changes to the definition of a mutual fund (fonds voor gemene rekening), iii) the enshrinement in law of the legal comparison method, iv) a new Decree on the Comparison of Foreign Legal Forms, and v) the introduction of a fixed and symmetrical qualification method for non-comparable legal forms.
United States federal taxation
This section describes the material United States federal income tax consequences to a US holder (as defined below) of owning common shares. It applies only if the common shares are held as capital assets for United States federal income tax purposes. This discussion addresses only United States federal income taxation and does not discuss all of the tax consequences that may be relevant to a US holder in light of its individual circumstances, including foreign, state or local tax consequences, estate and gift tax consequences, and tax consequences arising under the Medicare contribution tax on net investment income or the alternative minimum tax. This section does not apply to a member of a special class of holders subject to special rules, including:
•a dealer in securities
•a trader in securities that elects to use a mark-to-market method of accounting for securities holdings
•a tax-exempt organization
•a life insurance company
•a person that actually or constructively owns 10% or more of the combined voting power of our voting stock or of the total value of our stock
•a person that holds common shares as part of a straddle or a hedging or conversion transaction
•a person that purchases or sells common shares as part of a wash sale for tax purposes
•a person whose functional currency is not the US dollar
This section is based on the Internal Revenue Code of 1986, as amended, its legislative history, existing and proposed regulations, published rulings and court decisions, all as currently in effect, as well as on the US Tax Treaty. These authorities are subject to change, possibly on a retroactive basis.
If an entity or arrangement that is treated as a partnership for United States federal income tax purposes holds the common shares, the United States federal income tax treatment of a partner will generally depend on the status of the partner and the tax treatment of the partnership. A partner in a partnership holding the common shares should consult its tax advisor with regard to the United States federal income tax treatment of an investment in the common shares.
A US holder is defined as a beneficial owner of common shares that is, for US federal income tax purposes:
•a citizen or resident of the US
•a domestic corporation
•an estate whose income is subject to US federal income tax regardless of its source
•a trust if a United States court can exercise primary supervision over the trust’s administration and one or more United States persons are authorized to control all substantial decisions of the trust
A US holder should consult its own tax advisor regarding the United States federal, state and local tax consequences of owning and disposing of common shares in its particular circumstances.
The tax treatment of common shares will depend in part on whether or not we are classified as a passive foreign investment company, or PFIC, for US federal income tax purposes. Except as discussed below under “—PFIC Rules”, this discussion assumes that we are not classified as a PFIC for US federal income tax purposes.
Taxation of distributions
Under the United States federal income tax laws, the gross amount of any distribution paid in stock or cash out of our current or accumulated earnings and profits (as determined for United States federal income tax purposes), other than certain pro-rata distributions of our common shares, will be treated as a dividend that is subject to United States federal income taxation. For a non-corporate US holder, dividends paid that constitute qualified dividend income will be taxable at the preferential rates applicable to long-term capital gains, provided that the non-corporate US holder holds the common shares for more than 60 days during the 121-day period beginning 60 days before the ex-dividend date and provided it meets other holding period requirements. Dividends paid with respect to the common shares generally will be qualified dividend income provided that, in the year in which the dividend is received, the common shares are readily tradable on an established securities market in the United States. Our common shares are listed on the New York Stock Exchange and we therefore expect that dividends will be qualified dividend income. A US holder must include any Dutch tax withheld from the dividend payment in this gross amount even though it does not in fact receive it. The dividend is taxable to a US holder when it receives the dividend, actually or constructively. The dividend will not be eligible for the dividends-received deduction generally allowed to United States corporations in respect of dividends received from other United States corporations. For dividend payments made in euro, the amount of the dividend distribution that a US holder must include in its income will be the US dollar value of the euro payments made, determined at the spot euro/US dollar rate on the date the dividend is distributed, regardless of whether the payment is in fact converted into US dollars. Generally, any gain or loss resulting from currency exchange fluctuations during the period from the date the dividend is distributed to the date a US holder converts the payment into US dollars will be treated as ordinary income or loss and will not be eligible for the special tax rate applicable to qualified dividend income. The gain or loss generally will be income or loss from sources within the United States for foreign tax credit limitation purposes. Distributions in excess of current and accumulated earnings and profits, as determined for United States federal income tax purposes, will be treated as a non-taxable return of capital to the extent of a US holder’s basis in the common shares and thereafter as capital gain. However, we do not expect to calculate earnings and profits in accordance with United States federal income tax principles. Accordingly, US holders should expect to generally treat distributions we make as dividends.
Subject to certain limitations (including, but not limited to, those described in this paragraph), the Dutch tax withheld in accordance with the US Tax Treaty and paid over to the Netherlands will be creditable or deductible against a US holder’s United States federal income tax liability. However, the Dutch withholding tax may not be creditable or deductible to the extent that we reduce (as described above under “Dutch taxation - Dividend withholding tax”) the amount of withholding tax paid over to the Netherlands by crediting taxes withheld from certain dividends received by us. In addition, special rules apply in determining the foreign tax credit limitation with respect to dividends that are subject to the preferential tax rates. To the extent reduction or refund of the tax withheld is available under Dutch law, or under the US Tax Treaty, the amount of tax withheld that could have been reduced or that is refundable will not be eligible for credit against United States federal income tax liability. Dividends will generally be income from sources outside the United States, and will generally be “passive” income for purposes of computing the foreign tax credit allowable to the holder. In addition, to the extent an amount of Dutch tax withheld is contingent on the availability of a credit against the amount of income tax owed to another country, that amount of Dutch tax withheld will not be eligible for a credit against the US holder’s United States federal income tax liability.
Taxation of capital gains
A US holder that sells or otherwise disposes of its common shares will recognize capital gain or loss for United States federal income tax purposes equal to the difference between the US dollar value of the amount that it realizes and its tax basis, determined in US dollars, in its common shares. Capital gain of a non-corporate US holder is generally taxed at preferential rates where the property is held more than one year. The gain or loss will generally be income or loss from sources within the United States for foreign tax credit limitation purposes.
Passive Foreign Investment Company Rules
We believe that the common shares should currently not be treated as stock of a PFIC for United States federal income tax purposes, and we do not expect to become a PFIC in the foreseeable future. However, this conclusion is a factual determination that is made annually and thus may be subject to change. It is therefore possible that we could become a PFIC in a future taxable year. If we are treated as a PFIC, gain realized on the sale or other disposition of the common shares would in general not be treated as capital gain. Instead, unless a US holder elects to be taxed annually on a mark-to-market basis with respect to the common shares, a US holder would generally be treated as if it had realized such gain and certain “excess distributions” ratably over the holding period for the common shares and would be taxed at the highest tax rate in effect for each such year to which the gain was allocated, in addition to which an interest charge in respect of the tax attributable to each such year would apply. Any dividends received by a US holder will not be eligible for the special tax rates applicable to qualified dividend income if we are treated as a PFIC with respect to such US holder either in the taxable year of the distribution or the preceding taxable year, but instead will be taxable at rates applicable to ordinary income and subject to the excess distribution regime described above.
10.7 Investor information
10.7.1 Share information
Philips Group
Share information at year-end 2024
| | | | | |
| Share listings | Euronext Amsterdam, New York Stock Exchange |
| Ticker code | PHIA, PHG |
| No. of shares issued | 940 million |
| No. of shares issued and outstanding | 925 million |
| Market capitalization | EUR 23 billion |
| Industry classification | |
| MSCI: Health Care Equipment | 35101010 |
| ICB: Medical Equipment | 4535 |
| Members of indices | AEX, NYSE,
STOXX Europe 600 Healthcare,
MSCI Europe Health Care |
The following information is based on a shareholder base analysis carried out for investor relations purposes by an independent provider in December 2024.
Philips Group
Shareholders by region at year-end1 | | | | | |
| 2024 |
| United States | 40 | % |
| Netherlands | 18 | % |
| United Kingdom | 11 | % |
| Switzerland | 3 | % |
| Rest of Europe | 9 | % |
| Retail and Other² | 19 | % |
1Approximate split based on shareholders identified.
2No geography identified for Retail and Other.
Philips Group
Shareholders by style at year-end1 | | | | | |
| 2024 |
| Value | 50 | % |
| Index | 14 | % |
| GARP | 11 | % |
| Growth | 7 | % |
| Retail | 9 | % |
| Other | 7 | % |
| Hedge Fund | 2 | % |
1Approximate split based on shareholders identified.
10.7.2 Financial calendar
The financial calendar for the current year, which contains the publication dates of significant financial communications, is published on the company’s website https://www.philips.com/a-w/about/investor-relations/events.
2025 Annual General Meeting of Shareholders
The Agenda and the explanatory notes to the Agenda for the Annual General Meeting of Shareholders on May 8, 2025, will be published on the company’s website.
For the 2025 Annual General Meeting of Shareholders, a record date of April 10, 2025 will apply. Those persons who, on that date, hold shares in the company, and are registered as such in one of the registers designated by the Board of Management for the Annual General Meeting of Shareholders, will be entitled to participate in, and vote at, the meeting.
10.7.3 Investor contact
Shareholder services
Shareholders and other interested parties can make inquiries about the Annual Report 2024 to:
Royal Philips
Annual Report Office
Philips Center
Amstelplein 2
1096 BC Amsterdam, The Netherlands
Email: annual.report@philips.com
The Annual Report on Form 20-F is filed electronically with the US Securities and Exchange Commission.
Holders of shares listed on Euronext Amsterdam
Communications concerning share transfers, share certificates, dividends and change of address should be directed to:
ABN AMRO Bank N.V.
Department Equity Capital Markets/Corporate Broking and Issuer Services HQ7212
Gustav Mahlerlaan 10,
1082 PP Amsterdam, The Netherlands
Telephone: +31-20-628-6070
Email: corporate.broking@nl.abnamro.com
Holders of New York Registry shares
Communications concerning share transfers, share certificates, dividends and change of address should be directed to:
Deutsche Bank Trust Company Americas
C/O Equiniti Trust Company LLC
Peck Slip Station, PO Box 2050, New York NY 10272-2050
Telephone (toll-free US): +1-866-706-8374
Telephone (outside of US): +1-718-921-8137
Website: www.equiniti.com/us/ast-access
Email: adr@equiniti.com
International direct investment program
Royal Philips offers a Dividend Reinvestment and Direct Stock Purchase Plan designed for the US market. This program provides existing shareholders and interested investors with an economical and convenient way to purchase and sell Philips New York Registry shares (listed at the New York Stock Exchange) and to reinvest cash dividends. Deutsche Bank (the registrar of Philips NY Registry shares) has been authorized to implement and administer both plans for registered shareholders of and new investors in Philips NY Registry shares. Philips does not administer or sponsor the Program and assumes no obligation or liability for the operation of the plan. For further information on this program and for enrollment forms, contact:
Deutsche Bank Trust Company Americas
C/O Equiniti Trust Company LLC
PO Box 10027, Newark NJ 07101
Telephone (toll free US): +1-866-706-8374
Telephone (outside of US): +1-718-921-8137
Website: www.equiniti.com/us/ast-access
Email: adr@equiniti.com
Analysts’ coverage
Royal Philips is covered by approximately 20 analysts. For a list of our current analysts, please refer to: www.philips.com/a-w/about/investor/stock-info/analyst-coverage.html
How to reach us
Investor Relations contact
Royal Philips
Philips Center
Amstelplein 2
1096 BC Amsterdam, The Netherlands
Telephone: +31-20-59 77222
Website: www.philips.com/investor
Email: investor.relations@philips.com
Leandro Mazzoni
Head of Investor Relations
Telephone: +31-20-59 77222
Dorin Danu
Investor Relations Director
Telephone: +31-20-59 77055
Shav Sharipov
Investor Relations Director
Telephone: +31-20-59 77055
Sustainability contact
Royal Philips
High Tech Campus 34, 4th floor
5656 AE Eindhoven, The Netherlands
Website: www.philips.com/sustainability
Email: philips.sustainability@philips.com
Press Office contact
Royal Philips
Philips Center
Amstelplein 2
1096 BC Amsterdam, The Netherlands
Email: group.communications@philips.com
For media contacts please refer to:
https://www.philips.com/a-w/about/news-and-insights/media-contacts.html
Registered address
High Tech Campus 52, 5656 AG Eindhoven, The Netherlands
10.7.4 New York Registry Shares
Fees and Charges Payable by a Holder of New York Registry Shares
Deutsche Bank Trust Company Americas (“Deutsche Bank”), as the US registrar, transfer, dividend disbursement and shareholder servicing agent (“Agent”) under Philips’ New York Registry Share program (the “Program”), collects fees for the issuance, cancellation and/or transfer of New York Registry Shares directly from investors depositing ordinary shares or surrendering New York Registry Shares for the purpose of withdrawal or from intermediaries acting for them. The Agent collects fees for making distributions to investors by deducting those fees from the amounts distributed or by selling a portion of the distributable property to pay the fees.
The Agent may charge shareholders a fee of up to USD 5.00 per 100 shares for the exchange of New York Registry shares for shares and vice versa, for certain free distributions of shares and for shares issued upon exercise of rights, as well as for certain taxes, fees and expenses incurred in connection with issuances and cancellations. The Agent is also permitted to charge a distribution fee of USD 0.05 per share to holders of New York Registry Shares in connection with a corporate action or event unless certain fees are otherwise charged to Philips.
Fees and Payments made by the Agent to Philips
The Agent has agreed to reimburse certain expenses of Philips related to the Program and incurred by Philips in connection with the Program. The Agent has also agreed to waive certain fees for standard costs associated with the administration of the program.
The Agent has reimbursed EUR 549,634 directly to Philips in the year ended December 31, 2024. The Agent paid a total amount of EUR 185,311 directly to third parties in the year ended December 31, 2024.
Category of Expense paid directly to third parties in EUR
| | | | | |
| amount in the year ended December 31, 2024 |
| Reimbursement of Proxy Process Expenses | 58,846 | |
| Reimbursement of DTC lists | 230 | |
| Reimbursement of Scrip Dividend Expenses | 10,739 | |
| NYSE Listing Fee | 115,496 | |
| Expense paid directly to third parties | 185,311 | |
Under certain circumstances, including removal of the Agent or termination of the Program by Philips, Philips is required to repay the Agent certain amounts reimbursed and/or expenses paid to or on behalf of Philips.
10.8 Definitions and abbreviations
Actionable
In the context of the Respironics recall, actionable registrations are those that contain the necessary information needed to complete the remediation and are not awaiting further information, including from patient registrants.
Artificial Intelligence (AI)
While recognizing that Philips must abide by definitions of AI set by applicable regulations in different regions in the world, Philips applies the AI definition from the Organization for Economic Cooperation and Development (OECD): “An AI system is a machine-based system that, for explicit or implicit objectives, infers, from the input it receives, how to generate outputs such as predictions, content, recommendations, or decisions that can influence physical or virtual environments. Different AI systems vary in their levels of autonomy and adaptiveness after deployment.”
Biodiversity and Ecosystem services (BES)
Biodiversity is the variability among living organisms from all sources including terrestrial, marine and other aquatic ecosystems and the ecological complexes of which they are part. This includes diversity within species, between species and of ecosystems. Ecosystem services refers to the contributions of ecosystems to the benefits that are used in economic and other human activity.
Biome
Global-scale zones, generally defined by the type of plant life that they support in response to average rainfall and temperature patterns e.g. tundra, coral reefs or savannas.
Brominated flame retardants (BFR)
Brominated flame retardants are a group of chemicals that have an inhibitory effect on the ignition of combustible organic materials. Of the commercialized chemical flame retardants, the brominated variety are most widely used.
Business/Business Unit
In the Philips Operating Model, our three operating segments are made up of six Businesses, which are in turn comprised of 17 Business Units. See also the entry under Segment.
CO2-equivalent
CO2-equivalent or carbon dioxide equivalent is a quantity that describes, for a given mixture and amount of greenhouse gas, the amount of CO2 that would have the same global warming potential (GWP), when measured over a specified timescale (generally 100 years).
Circular economy
A circular economy aims to decouple economic growth from the consumption of natural resources by optimizing their use, eliminating waste and pollution, and circulating products and materials for as long as possible, while giving natural systems the opportunity to regenerate themselves.
Circular innovation
Innovation with the objective to create a product, service or solution contributing to circular practices.
Circular Materials Management
Circular Materials Management is a KPI for promoting an increase in the proportion of waste treated using waste management hierarchy levels that are circular: prevention, re-use, and recycling. Circular Materials Management % is the proportion of materials managed circularly in comparison to the total used materials baseline. The total used materials baseline is the total of both circular and linear waste, excluding linear disposal of waste that is required by law. Circular Materials Management includes recycling, re-use, prevention and other recovery (e.g. repurposing). It excludes all linear disposal, which is classified as waste to energy, incineration and landfill.
Circular Revenues
Circular Revenues are revenues from Philips products, services and solutions that contribute to circular practices. Circular revenues can be expressed as percentage % of the total Philips revenues.
Closing the Loop / reclaimed equipment
Closing the loop means we are embedding a policy to responsibly take back all professional medical equipment sold directly to customers as part of a trade-in offer or as a service at customer request. As part of the policy, we will ensure that equipment coming back to us is, where feasible, made available for refurbishment and/or parts recovery, or locally recycled in a certified way to ensure it does not end up in landfill. We monitor the impact of our policies by measuring the amount of equipment that we collect from our customers. We report on this as ‘reclaimed equipment’.
Dividend yield
The dividend yield is the annual dividend payment divided by Philips’ market capitalization. All references to dividend yield are as of December 31 of the previous year.
EcoDesigned Innovation
Innovation with the objective to create a technology improving environmental impact or and EcoDesigned product, service or solution.
EcoDesigned Products
An EcoDesigned Product must comply with all applicable legal requirements, Philips policies, and all stated EcoDesigned Product requirements in our four focal areas: Energy, Substances, Circularity and Packaging.
EcoHero Product
An EcoHero product meets all EcoDesign requirements applicable to new product introductions and outperforms in at least one of the focal areas of EcoDesign (Energy, Packaging, Substances and Circularity) either compared to their predecessor or relevant benchmarks, or meeting a set threshold, supported by a sustainability claim.
EcoHero Revenues
The revenue of products, services and solutions that meet the EcoHero requirements. EcoHero revenues can be expressed as percentage % of the total Philips Hardware revenues.
Employee Engagement Index
The Employee Engagement Index (EEI), a value outcome measure as part of the International Integrated Reporting Council framework, is measured at Philips by the People Engagement Survey. This survey provides the single measure of the overall level of employee engagement at Philips, the People Engagement Score, which is a combination of perceptions and attitudes related to employee satisfaction, commitment and advocacy.
Energy-using Products (EuP)
An energy-using product is a product that uses, generates, transfers or measures energy (electricity, gas, fossil fuel). Examples include boilers, computers, televisions, transformers, industrial fans and industrial furnaces.
Functions
In the Philips Operating Model, Businesses are supported by lean Functions. The Functions deliver cost-effective services, ensure legal and regulatory requirements are deployed, and propose Enterprise policies, standards, guidance and infrastructure, as well as providing capabilities and expertise (e.g., via Centers of Excellence).
Full-time equivalent employee (FTE)
Full-time equivalent is a way to measure a worker’s involvement in a project. An FTE of 1.0 means that the person is equivalent to a full-time worker, while an FTE of 0.5 signals that the worker works half-time.
Global Reporting Initiative (GRI)
The Global Reporting Initiative (GRI) is a network-based organization that pioneered the world’s most widely used sustainability reporting framework. GRI is committed to the framework’s continuous improvement and application worldwide. GRI’s core goals include the mainstreaming of disclosure on environmental, social and governance performance.
Green Innovation Spend
Green Innovation comprises all R&D activities directly contributing to the intended development and maintenance of EcoDesigned Innovation and Circular innovation.
Green Revenues
Green Revenues is revenues from EcoDesigned products, refurbished products, rentals, leases, as-a-service, upgrades and green services. Green revenue can be expressed as percentage % of the total Philips revenues.
Growth geographies
Growth geographies consists of the grouping 'Growth', which comprises the developing geographies Asia Pacific (excluding Japan, South Korea, Australia and New Zealand), Latin America, Central & Eastern Europe, Middle East & Turkey (excluding Israel) and Africa.
Hazardous substances
Hazardous substances are generally defined as substances posing imminent and substantial danger to public health and welfare or the environment.
Income from operations (EBIT)
Income from operations as reported on the IFRS consolidated statement of income. The term EBIT (earnings before interest and tax) has the same meaning as Income from operations.
Income from continuing operations
Income from continuing operations as reported on the IFRS consolidated statement of income, which is net income from continuing operations, or net income excluding discontinued operations.
Lean
The basic insight of Lean thinking is that if every person is trained to identify wasted time and effort in their own job and to better work together to improve processes by eliminating such waste, the resulting enterprise will deliver more value at less expense.
Lives improved by Philips
To calculate how many lives we are improving, market intelligence and statistical data on the number of people touched by the products contributing to the social or ecological dimension over the lifetime of a product are multiplied by the number of those products delivered in a year. After elimination of double counts – multiple different product touches per individual are only counted once – the number of lives improved by our innovative solutions is calculated.
Locate, Evaluate, Assess, and Prepare (LEAP)
Integrated approach for the assessment of nature related issues that involves four phases: Locate, Evaluate, Assess, and Prepare methodology to identify impact, dependencies, risks and opportunities on nature.
Long-term strategic partnership
Multi-year contractual agreement that represents a partnership to enable long-term collaboration.
Mature geographies
Mature geographies are the highly developed markets constituting three geographic areas: Western Europe, North America, and Other mature (including Japan, South Korea, Israel, Australia and New Zealand).
Natural capital
The stock of renewable and non-renewable natural resources (e.g. plants, animals, air, water, soils, minerals) that combine to yield a flow of benefits to people.
Nature
The natural world, with an emphasis on the diversity of living organisms (including people) and their interactions among themselves and with their environment.
Net Promoter Score
Net Promoter Score®, or NPS®, measures customer experience and predicts business growth. NPS is calculated by taking the answer to a key question on a 0-10 scale: How likely is it that you would recommend {brand} to a friend or colleague?
Respondents are grouped as follows:
•Promoters (score 9-10) are loyal enthusiasts who will keep buying and refer others, fueling growth.
•Passives (score 7-8) are satisfied but unenthusiastic customers who are vulnerable to competitive offerings.
•Detractors (score 0-6) are unhappy customers who can damage the brand and impede growth through negative word-of-mouth.
Subtracting the percentage of Detractors from the percentage of Promoters yields the Net Promoter Score, which can range from a low of -100 (if every customer is a Detractor) to a high of 100 (if every customer is a Promoter).
Operational carbon footprint
A carbon footprint is the total set of greenhouse gas emissions caused by an organization, event, product or person; usually expressed in kilotonnes CO2-equivalent. Philips' operational carbon footprint is calculated on a monthly basis and includes industrial sites (manufacturing and assembly sites), non-industrial sites (offices, warehouses, IT centers and R&D facilities), business travel (lease and rental cars and airplane travel) and logistics (air, sea and road transport).
Philips Lighting/Signify
References to 'Signify' in this Annual Report relate to Philips' former Lighting segment (prior to deconsolidation as from the end of November 2017 and when reported as discontinued operations), Philips Lighting N.V. (before or after such deconsolidation) or Signify N.V. (after its renaming in May 2018), as the context requires.
Polyvinyl chloride (PVC)
Polyvinyl chloride, better known as PVC or vinyl, is an inexpensive plastic so versatile it has become completely pervasive in modern society.
REACH
Registration, Evaluation, Authorization and Restriction of Chemicals (REACH;Regulation (EC) No 1907/2006) is a EU regulation that addresses the production and use (e.g. in products) of chemical substances, and their potential impact on both human health and the environment. This regulation is covered in the Philips Regulated Substances List.
Regulated Substance List
Philips Regulated Substances List (RSL) combines legal, industry, and voluntary Philips requirements regarding chemical substances used in Philips products and their packaging, either on a homogenous material level or present in the product as such. The RSL contains restricted and declarable substances.
Respironics recall
The voluntary recall notification in the US and field safety notice outside the United States for certain sleep and respiratory care products initiated by Philips Respironics in 2021.
Responsible Business Alliance (RBA)
The Responsible Business Alliance (formerly known as The Electronic Industry Citizenship Coalition (EICC)) was established in 2004 to promote a common code of conduct for the electronics and information and communications technology (ICT) industry. EICC now includes more than 100 global companies and their suppliers.
Restriction on Hazardous Substances (RoHS)
The RoHS Directive prohibits all new electrical and electronic equipment placed on the market in the European Economic Area from containing lead, mercury, cadmium, hexavalent chromium, poly-brominated biphenyls (PBB) or polybrominated diphenyl ethers (PBDE)and four phthalates (DEHP, DBP, BBP and DiHP), except in certain specific applications, in concentrations greater than the values decided by the European Commission. These values have been established as 0.01% by weight per homogeneous material for cadmium and 0.1% for the other nine substances. This regulation is covered in the Philips Regulated Substances List.
Segment
The Philips Operating Model identifies three operating segments – Diagnosis & Treatment, Connected Care and Personal Health – comprised of six Businesses and 17 Business Units, as well as segment Other. Other includes Innovation & Strategy, IP Royalties, Central Costs, and other small items. See also the entry under Business/Business Unit.
Solution
A combination of Philips (and 3rd-party) systems, devices, software, consumables and services, configured and delivered in a way to solve customer (segment)-specific needs and challenges.
Sustainable Development Goals
The Sustainable Development Goals (SDGs) are a collection of 17 global goals set by the United Nations. The broad goals are interrelated though each has its own targets. The SDGs cover a broad range of social and economic development issues. These include poverty, hunger, health, education, climate change, water, sanitation, energy, environment and social justice.
Sustainable Innovation
Innovation with the objective to create a sustainable product, service, or solution.
Sustainable product
Products and solutions that contribute to public health or to lowering the environmental footprint. Philips has distinct categories of sustainable products: healthy products (care, healthy living), circular products, EcoDesigned products.
VOC
Volatile organic compounds (VOCs) are organic chemicals that have a high vapor pressure at ordinary room temperature. Their high vapor pressure results from a low boiling point, which causes large numbers of molecules to evaporate or sublimate from the liquid or solid form of the compound and enter the surrounding air, a trait known as volatility.
Voluntary turnover
Voluntary turnover covers all employees who resigned of their own volition.
Waste Electrical and Electronic Equipment (WEEE)
The Waste Electrical and Electronic Equipment Directive (WEEE Directive) is the European Community directive on waste electrical and electronic equipment setting collection, recycling and recovery targets for all types of electrical goods. The directive imposes the responsibility for the disposal of waste electrical and electronic equipment on the manufacturers of such equipment.
Weighted Average Statutory Income Tax Rate (WASTR)
The reconciliation of the effective tax rate is based on the applicable statutory tax rate, which is a weighted average of all applicable jurisdictions. This weighted average statutory tax rate (WASTR) is the aggregation of the result before tax multiplied by the applicable statutory tax rate without adjustment for losses, divided by the group result before tax.
11 Exhibits
Index of Exhibits
| | | | | |
| English translation of the Articles of Association of the company (incorporated by reference to Exhibit 1 to the Annual Report on Form 20-F (File No. 001-05146-01) filed with the SEC on February 27, 2019) |
| Description of securities registered under Section 12 of the Exchange Act
(Incorporated by reference to Exhibit 2 to the Annual Report on Form 20-F (File No. 001-05146-01) filed with the SEC on February 25, 2020) |
| |
| Amended and Restated Trust Deed Related to a €10,000,000,000 Euro Medium Term Note Programme between the company and Citicorp Trustee Company Limited (as Trustee), dated March 8, 2024
Philips agrees to furnish copies of any or all other instruments under which the long-term debt securities of Philips or its subsidiaries are authorized to the SEC upon request. |
| |
| Exhibit 4 | |
| Services contract between the company and R.W.O. Jakobs (Incorporated by reference to Exhibit 4 (a) to the Annual Report on Form 20-F (File No. 001-05146-01) filed with the SEC on February 21, 2023) |
| |
| Services contract between the company and C.M. Hanneman |
| |
| Services contract between the company and M.J. van Ginneken
(Incorporated by reference to Exhibit 4 (c) to the Annual Report on Form 20-F (File No. 001-05146-01) filed with the SEC on February 22, 2022) |
| |
| Global Philips Performance Share Plan applicable to the Board of Management of Koninklijke Philips N.V.
(Incorporated by reference to Exhibit 4(d) to the Annual Report on Form 20-F (File No. 001-05146-01) filed with the SEC on February 23, 2021) |
| |
| Global Long-Term Incentive Plan for the Board of Management of Koninklijke Philips N.V. (2024) (Incorporated by reference to Exhibit 4.8 to the Post-Effective Amendment No. 4 to the Registration Statement on Form S-8 (File No. 333-186849) filed with the SEC on May 14, 2024) |
| Relationship Agreement between the company and Exor N.V. |
| Settlement agreement between Plaintiffs and Philips Defendants relating to US personal injury claims.* |
| List of Subsidiaries. |
| Rules of Conduct with respect to Trading in Royal Philips Securities |
| Certification of R.W.O. Jakobs filed pursuant to 17 CFR 240. 13a-14(a). |
| Certification of C.M. Hanneman filed pursuant to 17 CFR 240. 13a-14(a). |
| Certification of R.W.O. Jakobs furnished pursuant to 17 CFR 240. 13a-14(b). |
| Certification of C.M. Hanneman furnished pursuant to 17 CFR 240. 13a-14(b). |
| EY Consent of independent registered public accounting firm. |
| Acknowledgement letter from EY. |
| Clawback policy |
| 101.INS | XBRL Instance Document - the instance document does not appear in the Interactive Data File because its XBRL tags are embedded within the Inline XBRL document. |
| 101.SCH | XBRL Taxonomy Extension Schema Document. |
| 101.CAL | XBRL Taxonomy Extension Calculation Linkbase Document. |
| 101.DEF | XBRL Taxonomy Extension Definition Linkbase Document. |
| 101.LAB | XBRL Taxonomy Extension Label Linkbase Document. |
| 101.PRE | XBRL Taxonomy Extension Presentation Linkbase Document |
| |
| * Portions of this exhibit have been omitted pursuant to Instructions as to Exhibits of Form 20-F because the omitted information is not material. |
Signatures
The registrant hereby certifies that it meets all of the requirements for filing on Form 20-F and that it has duly caused and authorized the undersigned to sign this Annual Report on its behalf.
| | | | | |
KONINKLIJKE PHILIPS N.V.
(Registrant) |
| |
| /s/ R.W.O. Jakobs R.W.O. Jakobs (Chief Executive Officer, Chairman of the Board of Management and the Executive Committee) | /s/ C.M. Hanneman C.M. Hanneman (Chief Financial Officer, Member of the Board of Management and the Executive Committee) |
| |
| |
| Date: 21 February 2025 |