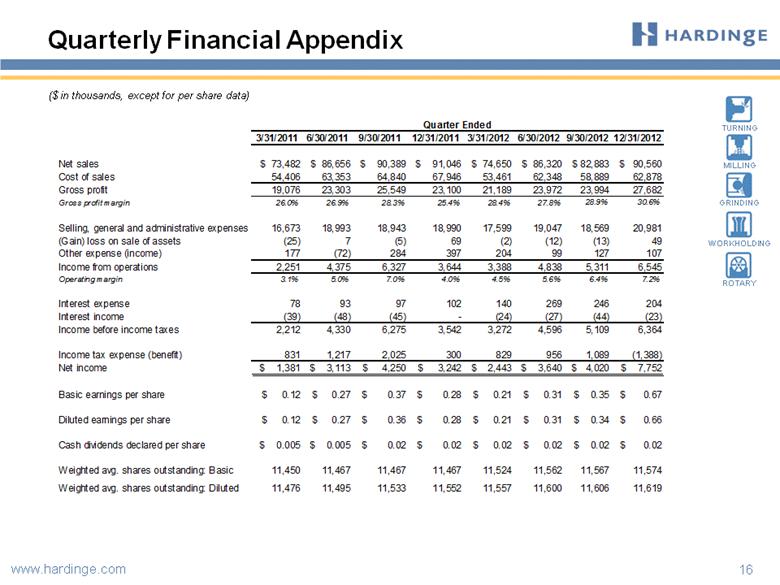
| Quarterly Financial Appendix 16 ($ in thousands, except for per share data) 3/31/2011 6/30/2011 9/30/2011 12/31/2011 3/31/2012 6/30/2012 9/30/2012 12/31/2012 Net sales $ 73,482 $ 86,656 $ 90,389 $ 91,046 $ 74,650 $ 86,320 $ 82,883 $ 90,560 Cost of sales 54,406 63,353 64,840 67,946 53,461 62,348 58,889 62,878 Gross profit 19,076 23,303 25,549 23,100 21,189 23,972 23,994 27,682 Gross profit margin 26.0% 26.9% 28.3% 25.4% 28.4% 27.8% 28.9% 30.6% Selling, general and administrative expenses 16,673 18,993 18,943 18,990 17,599 19,047 18,569 20,981 (Gain) loss on sale of assets (25) 7 (5) 69 (2) (12) (13) 49 Other expense (income) 177 (72) 284 397 204 99 127 107 Income from operations 2,251 4,375 6,327 3,644 3,388 4,838 5,311 6,545 Operating margin 3.1% 5.0% 7.0% 4.0% 4.5% 5.6% 6.4% 7.2% Interest expense 78 93 97 102 140 269 246 204 Interest income (39) (48) (45) - (24) (27) (44) (23) Income before income taxes 2,212 4,330 6,275 3,542 3,272 4,596 5,109 6,364 Income tax expense (benefit) 831 1,217 2,025 300 829 956 1,089 (1,388) Net income $ 1,381 $ 3,113 $ 4,250 $ 3,242 $ 2,443 $ 3,640 $ 4,020 $ 7,752 Basic earnings per share $ 0.12 $ 0.27 $ 0.37 $ 0.28 $ 0.21 $ 0.31 $ 0.35 $ 0.67 Diluted earnings per share $ 0.12 $ 0.27 $ 0.36 $ 0.28 $ 0.21 $ 0.31 $ 0.34 $ 0.66 Cash dividends declared per share $ 0.005 $ 0.005 $ 0.02 $ 0.02 $ 0.02 $ 0.02 $ 0.02 $ 0.02 Weighted avg. shares outstanding: Basic 11,450 11,467 11,467 11,467 11,524 11,562 11,567 11,574 Weighted avg. shares outstanding: Diluted 11,476 11,495 11,533 11,552 11,557 11,600 11,606 11,619 Quarter Ended |