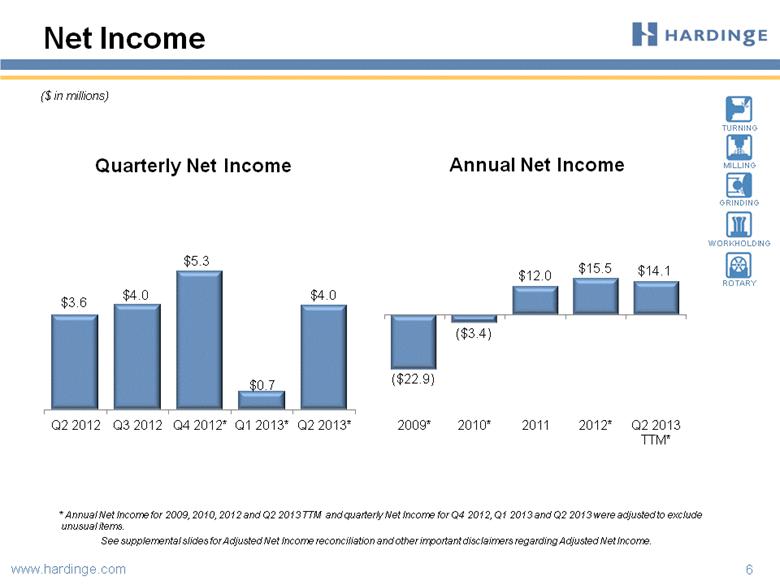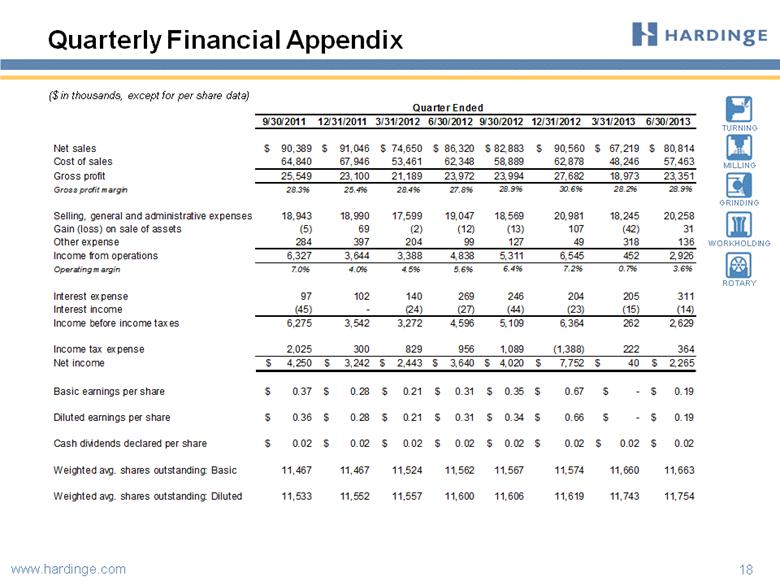
| Quarterly Financial Appendix 18 ($ in thousands, except for per share data) 9/30/2011 12/31/2011 3/31/2012 6/30/2012 9/30/2012 12/31/2012 3/31/2013 6/30/2013 Net sales $ 90,389 $ 91,046 $ 74,650 $ 86,320 $ 82,883 $ 90,560 $ 67,219 $ 80,814 Cost of sales 64,840 67,946 53,461 62,348 58,889 62,878 48,246 57,463 Gross profit 25,549 23,100 21,189 23,972 23,994 27,682 18,973 23,351 Gross profit margin 28.3% 25.4% 28.4% 27.8% 28.9% 30.6% 28.2% 28.9% Selling, general and administrative expenses 18,943 18,990 17,599 19,047 18,569 20,981 18,245 20,258 Gain (loss) on sale of assets (5) 69 (2) (12) (13) 107 (42) 31 Other expense 284 397 204 99 127 49 318 136 Income from operations 6,327 3,644 3,388 4,838 5,311 6,545 452 2,926 Operating margin 7.0% 4.0% 4.5% 5.6% 6.4% 7.2% 0.7% 3.6% Interest expense 97 102 140 269 246 204 205 311 Interest income (45) - (24) (27) (44) (23) (15) (14) Income before income taxes 6,275 3,542 3,272 4,596 5,109 6,364 262 2,629 Income tax expense 2,025 300 829 956 1,089 (1,388) 222 364 Net income $ 4,250 $ 3,242 $ 2,443 $ 3,640 $ 4,020 $ 7,752 $ 40 $ 2,265 Basic earnings per share $ 0.37 $ 0.28 $ 0.21 $ 0.31 $ 0.35 $ 0.67 $ - $ 0.19 Diluted earnings per share $ 0.36 $ 0.28 $ 0.21 $ 0.31 $ 0.34 $ 0.66 $ - $ 0.19 Cash dividends declared per share $ 0.02 $ 0.02 $ 0.02 $ 0.02 $ 0.02 $ 0.02 $ 0.02 $ 0.02 Weighted avg. shares outstanding: Basic 11,467 11,467 11,524 11,562 11,567 11,574 11,660 11,663 Weighted avg. shares outstanding: Diluted 11,533 11,552 11,557 11,600 11,606 11,619 11,743 11,754 Quarter Ended |