Exhibit 99.2

Link to searchable text of slide shown above

Link to searchable text of slide shown above
Link to searchable text of slide shown above

Link to searchable text of slide shown above

Link to searchable text of slide shown above

Link to searchable text of slide shown above

Link to searchable text of slide shown above

Link to searchable text of slide shown above

Link to searchable text of slide shown above
Link to searchable text of slide shown above

Link to searchable text of slide shown above

Link to searchable text of slide shown above

Link to searchable text of slide shown above

Link to searchable text of slide shown above

Link to searchable text of slide shown above
Link to searchable text of slide shown above

Link to searchable text of slide shown above

Link to searchable text of slide shown above
Link to searchable text of slide shown above

Link to searchable text of slide shown above

Link to searchable text of slide shown above
Link to searchable text of slide shown above

Link to searchable text of slide shown above
Link to searchable text of slide shown above

Link to searchable text of slide shown above

Link to searchable text of slide shown above
Searchable text section of graphics shown above
[LOGO]
La Quinta Corporation
Acquisition of The Marcus Corporation’s Limited Service Lodging Division
[LOGO]
Safe Harbor Statement
Certain matters discussed in this presentation may constitute “forward-looking statements” within the meaning of Section 27A of the Securities Act of 1933, Section 21E of the Securities Exchange Act of 1934 and the Private Securities Litigation Reform Act of 1995. Words such as “believes,” “anticipates,” “expects,” “intends,” “estimates,” “projects” and other similar expressions, which are predictions of or indicate future events and trends, typically identify forward-looking statements. Our forward-looking statements are subject to a number of risks and uncertainties, which could cause actual results or the timing of events to differ materially from those described in the forward-looking statements. Accordingly, we cannot assure you that the expectations set forth in these forward-looking statements will be attained. Some of the factors that could cause actual results or the timing of certain events to differ from those described in these forward-looking statements include, without limitation, our ability to successfully grow revenues (through our revenue initiatives, including our franchising program, our internet distribution initiatives and our frequent stayer program, or otherwise) and profitability of our lodging business and franchising program; concentration of our properties in certain geographic areas; our ability to realize sustained labor or other cost savings; the availability and costs of insurance for our properties and business; competition within the lodging industry, including in the franchising of the La Quinta brand; our ability to generate attractive rates of return on new lodging investments; the cyclicality of the lodging business; the impact of U.S. military action abroad and/or additional terrorist activities; the effects of a general economic slowdown, including decreases in consumer confidence and business spending, which may adversely affect our business and industry; interest rates; the ultimate outcome of litigation filed against us; the availability of capital for corporate purposes including for debt repayment, acquisitions and capital expenditures; the conditions of the capital markets in general; acquisition-related risks, including the ability to identify candidates that meet our financial and strategic criteria, successfully complete any acquisitions that we may enter into, and effectively integrate the business of any company that we may acquire; and other risks detailed from time to time in our filings with the Securities and Exchange Commission, including, without limitation, the risks described in our Joint Annual Report on Form 10-K filed with the Securities and Exchange Commission on March 15, 2004, in the section entitled “Certain Factors You Should Consider About Our Companies, Our Businesses and Our Securities.” We undertake no obligation to publicly update or revise any forward-looking statements, whether as a result of new information, future events or other changes
[LOGO]
2
Table of Contents
| ||
|
|
|
| ||
|
|
|
| ||
|
|
|
|
Overview of Transaction
Transaction Summary
Acquisition of limited service brands and real estate fits both strategic objectives.
• | Acquire 170 Baymont Inns & Suites | |||
|
|
|
| |
| • | 84 owned Baymont hotels | ||
| • | 84 franchised Baymont hotels | ||
| • | 1 joint venture Baymont hotel subject to partner’s right of first refusal or consent | ||
| • | 1 managed Baymont hotel | ||
|
|
|
| |
• | Acquire 7 owned Woodfield Suites | |||
|
|
|
| |
• | Acquire 1 owned Budgetel hotel | |||
|
|
|
| |
• | Purchase Price: |
| Approximately $395 million, subject to adjustments | |
|
|
|
| |
• | Structure: |
| Asset purchase for cash | |
|
|
|
| |
• | Estimated Closing Date: |
| Late summer or early fall | |
[LOGO]
5
Acquisition is expected to be accretive and create shareholder value.
• Excellent strategic/operational fit
• Integrate a comparable type of asset and a business that runs similarly to La Quinta
• Diversify real estate concentration
• Add to network value
• Expected to increase Marcus Corporation’s reported LTM 2/04 segment EBITDA of $31 million
• Reduce corporate overhead by $4 million
• Enhance revenue performance
• Reduce operating costs
• Invest capital to enhance selected assets
• Expected to generate unlevered cash-on-cash returns of 10-12% over the next 2-3 years
• Exceeds 9% returns that could be generated by repurchasing the Company’s preferred stock
• Purchased business at attractive multiple
• 12x pro forma EBITDA of $33 million
• La Quinta currently trades at 13x Adjusted EBITDA of $168 million
• Purchased real estate at average of $38,000 per key (approximately $36,000 per key for Baymont real estate alone)
• Baymont replacement cost estimated at $55,000 per key
• La Quinta trading at $60,000 per key
6
Creating Shareholder Value
Creating Shareholder Value
• Gain Well Maintained Asset Base
• Obtain Strong Brand
• Expand Geographic Distribution
• Provide Geographic Diversification
• Enhance Revenue Performance
• Improve Cost Structure
• Accelerate Franchising
• Benefit From Strong Lodging Environment
[LOGO]
8
Gain Well Maintained Asset Base
Approximately $75 million invested in assets over the last five years.
• Estimated replacement cost of approximately $560 million
• Properties have been maintained on a programmed capex cycle
[GRAPHIC]
9
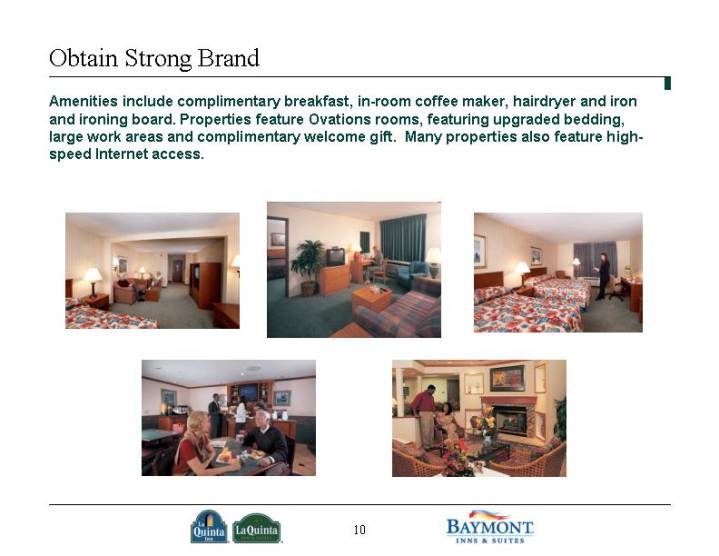
Obtain Strong Brand
Amenities include complimentary breakfast, in-room coffee maker, hairdryer and iron and ironing board. Properties feature Ovations rooms, featuring upgraded bedding, large work areas and complimentary welcome gift. Many properties also feature high-speed Internet access.
[GRAPHIC]
10
Expand Geographic Distribution
Expands La Quinta’s geographic footprint and provides a strong new presence in the Midwest.
[GRAPHIC]
11
Provide Geographic Diversification
Enhances La Quinta’s geographic diversity, reducing concentration in Texas while adding distribution in Wisconsin, Michigan and Illinois.
La Quinta
[CHART]
La Quinta / Baymont Pro Forma
[CHART]
12
Enhance Revenue Performance
La Quinta operates at an 18% RevPAR premium to Baymont.
CY 2003 RevPAR
[CHART]
CY 2003 Occupancy
[CHART]
CY 2003 Average Daily Rate
[CHART]
13
Implementing La Quinta’s systems and programs can lead to stronger Baymont revenue performance.
Sources of Revenue Synergies
|
| La Quinta |
| Baymont |
| ||
Improve Internet Productivity |
| 13 | % | 9 | % | ||
|
|
|
|
|
| ||
Leverage Loyalty Programs |
| 30 | % | 25 | % | ||
|
|
|
|
|
| ||
Improve Call Center Production |
| 16 | % | 6 | % | ||
|
|
|
|
|
| ||
Leverage La Quinta Salesforce |
|
|
|
|
| ||
National Salespeople |
| 15 |
| 7 |
| ||
Field Salespeople |
| 75 |
| 28 |
| ||
|
|
|
|
|
| ||
Utilize La Quinta Yield Management |
|
|
|
|
| ||
RevPAR |
| $ | 36.15 |
| $ | 30.63 |
|
RevPAR Penetration |
| runs at mkt. |
| runs at mkt. |
| ||
Based on calendar year 2003
14
Additional opportunities exist at both Baymont and La Quinta branded hotels to enhance revenue performance.
• Re-brand selected Baymonts and La Quintas
• Improve network value of both brands
• ROI driven decision to convert
• Bring greater resources to Baymont brand
• Revenue booking sources
• Unique training programs
• Strong operations support
• Owner/operator mentality
• Focus on quality and guest satisfaction
15
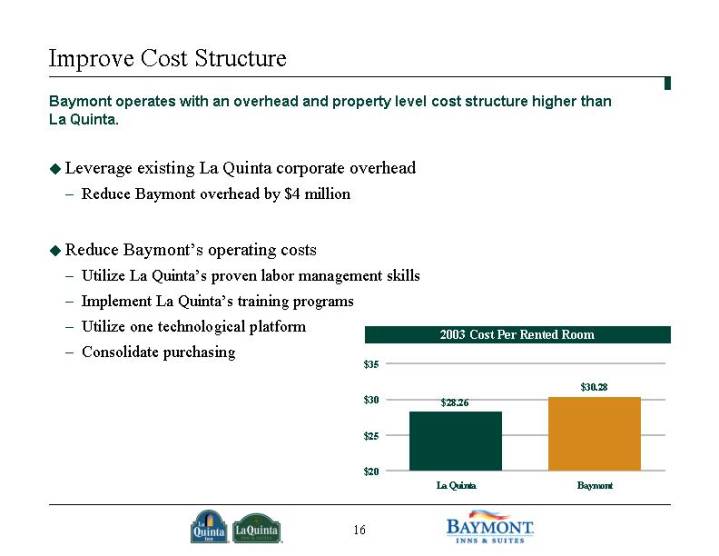
Improve Cost Structure
Baymont operates with an overhead and property level cost structure higher than La Quinta.
• Leverage existing La Quinta corporate overhead
• Reduce Baymont overhead by $4 million
• Reduce Baymont’s operating costs
• Utilize La Quinta’s proven labor management skills
• Implement La Quinta’s training programs
• Utilize one technological platform
• Consolidate purchasing
2003 Cost Per Rented Room
[CHART]
16
Accelerate Franchising
La Quinta has a strong track record of enhancing franchisee’s operating performance and growing a successful franchise program.
• Grow Baymont by at least 25 franchise hotels per year
• Grow La Quinta by at least 50 franchise hotels per year
Number of Franchised Hotels
[CHART]
17
Benefit From Strong Lodging Environment
Lodging industry fundamentals are strong.
• Supply growth at 10-year historic low
• RevPAR growth a result of occupancy gains and average rate growth
RevPAR and Supply Growth
[CHART]
Source: PricewaterhouseCoopers; Smith Travel Research
18
Financing Considerations
Sources & Uses
Sources | ||||
| ||||
Cash at 3/31/03 |
| $ | 291 |
|
Debt |
| 150 |
| |
|
|
|
| |
Total |
| $ | 441 |
|
Uses | ||||
| ||||
Purchase Price |
| $ | 395 |
|
Transaction & Financing Costs |
| 9 |
| |
Working Capital |
| 37 |
| |
|
|
|
| |
Total |
| $ | 441 |
|
$ in millions
[LOGO]
20
Financing Strategy
• Have obtained committed financing of $150 million
• Could be term bank loan or fixed/floating rate senior notes
• Can be upsized to $200 million
• Maintain strong balance sheet
• Preserve $150 million unfunded revolver
• Net Debt/Adjusted EBITDA increases to approximately 4.5x (same level that existed prior to Fall 2003 equity offering)
• Interest coverage ratios improve
21
Valuation / Return Analyses
Creating Shareholder Value
Acquisition is expected to be accretive and create shareholder value.
• Excellent strategic/operational fit
• Integrate a comparable type of asset and a business that runs similarly to La Quinta
• Diversify real estate concentration
• Add to network value
• Expected to increase Marcus Corporation’s reported LTM 2/04 segment EBITDA of $31 million
• Reduce corporate overhead by $4 million
• Enhance revenue performance
• Reduce operating costs
• Invest capital to enhance selected assets
• Expected to generate unlevered cash-on-cash returns of 10-12% over the next 2-3 years
• Exceeds 9% returns that could be generated by repurchasing the Company’s preferred stock
• Purchased business at attractive multiple
• 12x pro forma EBITDA of $33 million
• La Quinta currently trades at 13x Adjusted EBITDA of $168 million
• Purchased real estate at average of $38,000 per key (approximately $36,000 per key for Baymont real estate alone)
• Baymont replacement cost estimated at $55,000 per key
• La Quinta trading at $60,000 per key
[LOGO]
23
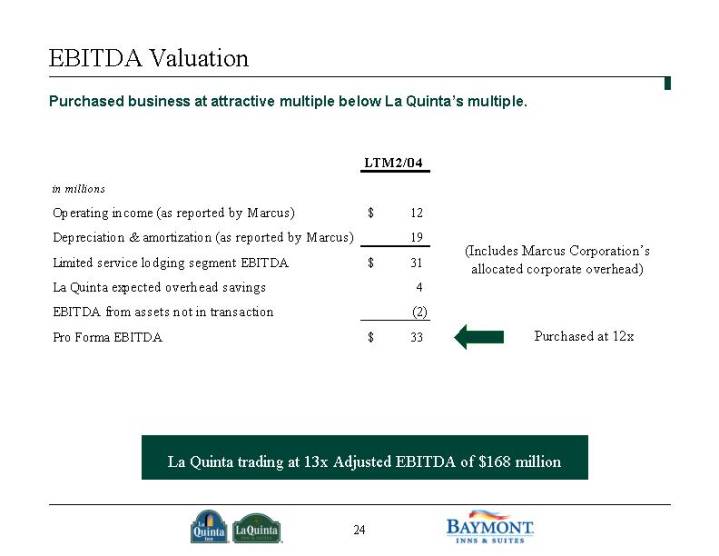
EBITDA Valuation
Purchased business at attractive multiple below La Quinta’s multiple.
in millions
|
| LTM 2/04 |
|
| ||
|
|
|
|
| ||
Operating income (as reported by Marcus) |
| $ | 12 |
|
| |
|
|
|
|
| ||
Depreciation & amortization (as reported by Marcus) |
| 19 |
|
| ||
|
|
|
|
| ||
Limited service lodging segment EBITDA |
| $ | 31 |
| (Includes Marcus Corporation’s | |
|
|
|
| allocated corporate overhead) | ||
La Quinta expected overhead savings |
| 4 |
|
| ||
|
|
|
|
| ||
EBITDA from assets not in transaction |
| (2 | ) |
| ||
|
|
|
|
| ||
Pro Forma EBITDA |
| $ | 33 |
| Purchased at 12x |
|
La Quinta trading at 13x Adjusted EBITDA of $168 million
24
Per Key Real Estate Valuation
Purchase real estate below replacement costs and private market sales.
• Purchasing Baymont real estate at average of $36,000 per key
• Below Baymont replacement cost of $55,000 per key
• Below other Baymont private market sales of $40,000 per key
• Below recent limited service sales of $46,000 per key
• Below current La Quinta trading of $60,000 per key
Private Market Transactions | ||||
|
|
|
| |
|
| Price Per Key |
| |
Baymont |
| $ | 39,556 |
|
Country |
| $ | 68,069 |
|
Hampton |
| $ | 45,465 |
|
Amerihost |
| $ | 45,342 |
|
Holiday Inn Express |
| $ | 45,048 |
|
Fairfield |
| $ | 44,231 |
|
Wingate |
| $ | 40,365 |
|
Comfort |
| $ | 39,268 |
|
Average |
| $ | 45,918 |
|
Private Market Transactions Source: International Hotel and Motel Broker Association
25
Positioned for Growth
[LOGO]