SECURITIES AND EXCHANGE COMMISSION
WASHINGTON, D. C. 20549
FORM 6-K
REPORT OF FOREIGN PRIVATE ISSUER
Pursuant to Rule 13a-16 or 15d-16 of
the Securities Exchange Act of 1934
For the month of MAY 2020
Commission File Number: 001-06439
SONY CORPORATION
(Translation of registrant's name into English)
1-7-1 KONAN, MINATO-KU, TOKYO, 108-0075, JAPAN
(Address of principal executive offices)
The registrant files annual reports under cover of Form 20-F.
Indicate by check mark whether the registrant files or will file annual reports under cover of Form 20-F or Form 40-F,
| Form 20-F X | Form 40-F __ |
Indicate by check mark whether the registrant by furnishing the information contained in this Form is also thereby furnishing the information to the Commission pursuant to Rule 12g3-2(b) under the Securities Exchange Act of 1934, Yes No X
If "Yes" is marked, indicate below the file number assigned to the registrant in connection with Rule 12g3-2(b):82-______
SIGNATURE
Pursuant to the requirements of the Securities Exchange Act of 1934, the registrant has duly caused this report to be signed on its behalf by the undersigned, thereunto duly authorized.
| SONY CORPORATION | |
| (Registrant) | |
| By: /s/ Hiroki Totoki | |
| (Signature) | |
| Hiroki Totoki | |
Senior Executive Vice President and | |
| Chief Financial Officer |
Date: May 13, 2020
List of materials
Documents attached hereto:
i) Press release: Financial Statements and Consolidated Financial Results for the Fiscal Year Ended March 31, 2020 And Outlook for the Fiscal Year Ending March 31, 2021
Financial Statements and Consolidated Financial Results
for the Fiscal Year Ended March 31, 2020
And
Outlook for the Fiscal Year Ending March 31, 2021
May 13, 2020
Sony Corporation
| Financial Statements (Unaudited) | F-1 |
| Consolidated Balance Sheets | F-1 |
| Consolidated Statements of Income (Fiscal year ended March 31) | F-2 |
| Consolidated Statements of Comprehensive Income (Fiscal year ended March 31) | F-2 |
| Consolidated Statements of Income (Three months ended March 31) | F-3 |
| Consolidated Statements of Comprehensive Income (Three months ended March 31) | F-3 |
| Consolidated Statements of Changes in Stockholders' Equity | F-4 |
Consolidated Statements of Cash Flows | F-5 |
| Notes to Consolidated Financial Statements | F-6 |
| -Business Segment Information | F-6 |
| -Going Concern Assumption | F-13 |
| -Accounting Policies and Other Information | F-13 |
| Consolidated Results for the Fiscal Year Ended March 31, 2020 | 1 |
| Outlook for the Fiscal Year Ending March 31, 2021 | 4 |
| Business Segment Information and Current View Regarding the Impact of the Spread of COVID-19 | 4 |
| Basic Views on Selection of Accounting Standards | 8 |
Supplemental Information (Estimate of Operating Income by Business Segment for the Fiscal Year Ending March 31, 2021) | 9 |
All amounts are presented on the basis of Generally Accepted Accounting Principles in the U.S. (“U.S. GAAP”).
Sony Corporation and its consolidated subsidiaries are together referred to as “Sony”.
| (Unaudited) | ||||||||||||
Consolidated Financial Statements | ||||||||||||
Consolidated Balance Sheets | ||||||||||||
| (Millions of yen) | ||||||||||||
| March 31 | March 31 | Change from | ||||||||||
| ASSETS | 2019 | 2020 | March 31, 2019 | |||||||||
| Current assets: | ||||||||||||
| Cash and cash equivalents | ¥ | 1,470,073 | ¥ | 1,512,357 | ¥ | +42,284 | ||||||
| Marketable securities | 1,324,538 | 1,847,772 | +523,234 | |||||||||
| Notes and accounts receivable, trade and contract assets | 1,091,242 | 1,028,793 | -62,449 | |||||||||
| Allowance for doubtful accounts | (25,440 | ) | (25,873 | ) | -433 | |||||||
| Inventories | 653,278 | 589,969 | -63,309 | |||||||||
| Other receivables | 223,620 | 188,106 | -35,514 | |||||||||
| Prepaid expenses and other current assets | 509,301 | 594,021 | +84,720 | |||||||||
| Total current assets | 5,246,612 | 5,735,145 | +488,533 | |||||||||
Film costs | 409,005 | 427,336 | +18,331 | |||||||||
Investments and advances: | ||||||||||||
| Affiliated companies | 163,365 | 207,922 | +44,557 | |||||||||
| Securities investments and other | 11,561,286 | 12,526,210 | +964,924 | |||||||||
| 11,724,651 | 12,734,132 | +1,009,481 | ||||||||||
Property, plant and equipment: | ||||||||||||
| Land | 83,992 | 81,482 | -2,510 | |||||||||
| Buildings | 664,157 | 659,556 | -4,601 | |||||||||
| Machinery and equipment | 1,585,382 | 1,725,720 | +140,338 | |||||||||
| Construction in progress | 39,208 | 76,391 | +37,183 | |||||||||
| 2,372,739 | 2,543,149 | +170,410 | ||||||||||
Less-Accumulated depreciation | 1,595,686 | 1,634,505 | +38,819 | |||||||||
| 777,053 | 908,644 | +131,591 | ||||||||||
Other assets: | ||||||||||||
| Operating lease right-of-use assets | – | 359,510 | +359,510 | |||||||||
| Finance lease right-of-use assets | – | 33,100 | +33,100 | |||||||||
| Intangibles, net | 917,966 | 906,310 | -11,656 | |||||||||
| Goodwill | 768,552 | 783,888 | +15,336 | |||||||||
| Deferred insurance acquisition costs | 595,265 | 600,901 | +5,636 | |||||||||
| Deferred income taxes | 202,486 | 210,372 | +7,886 | |||||||||
| Other | 339,996 | 340,005 | +9 | |||||||||
| 2,824,265 | 3,234,086 | +409,821 | ||||||||||
Total assets | ¥ | 20,981,586 | ¥ | 23,039,343 | ¥ | +2,057,757 | ||||||
| LIABILITIES AND EQUITY | ||||||||||||
Current liabilities: | ||||||||||||
Short-term borrowings | ¥ | 618,618 | ¥ | 810,176 | ¥ | +191,558 | ||||||
Current portion of long-term debt | 172,461 | 29,807 | -142,654 | |||||||||
Current portion of long-term operating lease liabilities | – | 68,942 | +68,942 | |||||||||
Notes and accounts payable, trade | 492,124 | 380,810 | -111,314 | |||||||||
Accounts payable, other and accrued expenses | 1,693,048 | 1,630,197 | -62,851 | |||||||||
Accrued income and other taxes | 135,226 | 145,996 | +10,770 | |||||||||
Deposits from customers in the banking business | 2,302,314 | 2,440,783 | +138,469 | |||||||||
Other | 666,024 | 733,732 | +67,708 | |||||||||
Total current liabilities | 6,079,815 | 6,240,443 | +160,628 | |||||||||
Long-term debt | 568,372 | 634,966 | +66,594 | |||||||||
Long-term operating lease liabilities | – | 314,836 | +314,836 | |||||||||
Accrued pension and severance costs | 384,232 | 324,655 | -59,577 | |||||||||
Deferred income taxes | 531,421 | 549,538 | +18,117 | |||||||||
Future insurance policy benefits and other | 5,642,671 | 6,246,047 | +603,376 | |||||||||
Policyholders’ account in the life insurance business | 3,048,202 | 3,642,271 | +594,069 | |||||||||
Other | 281,382 | 289,285 | +7,903 | |||||||||
Total liabilities | 16,536,095 | 18,242,041 | +1,705,946 | |||||||||
Redeemable noncontrolling interest | 8,801 | 7,767 | -1,034 | |||||||||
Equity: | ||||||||||||
Sony Corporation’s stockholders’ equity: | ||||||||||||
| Common stock | 874,291 | 880,214 | +5,923 | |||||||||
| Additional paid-in capital | 1,266,874 | 1,289,719 | +22,845 | |||||||||
| Retained earnings | 2,320,586 | 2,768,856 | +448,270 | |||||||||
| Accumulated other comprehensive income | (610,670 | ) | (580,980 | ) | +29,690 | |||||||
| Treasury stock, at cost | (104,704 | ) | (232,503 | ) | -127,799 | |||||||
| 3,746,377 | 4,125,306 | +378,929 | ||||||||||
Noncontrolling interests | 690,313 | 664,229 | -26,084 | |||||||||
Total equity | 4,436,690 | 4,789,535 | +352,845 | |||||||||
Total liabilities and equity | ¥ | 20,981,586 | ¥ | 23,039,343 | ¥ | +2,057,757 | ||||||
F-1
Consolidated Statements of Income | ||||||||||||
| (Millions of yen, except per share amounts) | ||||||||||||
| Fiscal year ended March 31 | ||||||||||||
| 2019 | 2020 | Change | ||||||||||
Sales and operating revenue: | ||||||||||||
| Net sales | ¥ | 7,306,235 | ¥ | 6,856,090 | ¥ | -450,145 | ||||||
| Financial services revenue | 1,274,708 | 1,299,847 | +25,139 | |||||||||
| Other operating revenue | 84,744 | 103,948 | +19,204 | |||||||||
| 8,665,687 | 8,259,885 | -405,802 | ||||||||||
| Cost of sales | 5,150,750 | 4,753,174 | -397,576 | |||||||||
| Selling, general and administrative | 1,576,825 | 1,502,625 | -74,200 | |||||||||
| Financial services expenses | 1,112,446 | 1,171,875 | +59,429 | |||||||||
| Other operating income, net | (71,568 | ) | (3,611 | ) | +67,957 | |||||||
| 7,768,453 | 7,424,063 | -344,390 | ||||||||||
Equity in net income (loss) of affiliated companies | (2,999 | ) | 9,637 | +12,636 | ||||||||
Operating income | 894,235 | 845,459 | -48,776 | |||||||||
Other income: | ||||||||||||
| Interest and dividends | 21,618 | 19,278 | -2,340 | |||||||||
| Gain on equity securities, net | 118,677 | – | -118,677 | |||||||||
| Other | 4,440 | 2,671 | -1,769 | |||||||||
| 144,735 | 21,949 | -122,786 | ||||||||||
Other expenses: | ||||||||||||
| Interest expenses | 12,467 | 11,090 | -1,377 | |||||||||
| Loss on equity securities, net | – | 20,180 | +20,180 | |||||||||
| Foreign exchange loss, net | 11,279 | 26,789 | +15,510 | |||||||||
| Loss on pension plan amendment | – | 6,358 | +6,358 | |||||||||
| Other | 3,576 | 3,541 | -35 | |||||||||
| 27,322 | 67,958 | +40,636 | ||||||||||
Income before income taxes | 1,011,648 | 799,450 | -212,198 | |||||||||
| Income taxes | 45,098 | 177,190 | +132,092 | |||||||||
Net income | 966,550 | 622,260 | -344,290 | |||||||||
| Less - Net income attributable to noncontrolling interests | 50,279 | 40,069 | -10,210 | |||||||||
Net income attributable to Sony Corporation’s stockholders | ¥ | 916,271 | ¥ | 582,191 | ¥ | -334,080 | ||||||
Per share data: | ||||||||||||
| Net income attributable to Sony Corporation’s stockholders | ||||||||||||
| — Basic | ¥ | 723.41 | ¥ | 471.64 | ¥ | -251.77 | ||||||
| — Diluted | 707.74 | 461.23 | -246.51 | |||||||||
Consolidated Statements of Comprehensive Income | ||||||||||||
| (Millions of yen) | ||||||||||||
| Fiscal year ended March 31 | ||||||||||||
| 2019 | 2020 | Change | ||||||||||
Net income | ¥ | 966,550 | ¥ | 622,260 | ¥ | -344,290 | ||||||
Other comprehensive income, net of tax – | ||||||||||||
| Unrealized gains on securities | 33,285 | 40,390 | +7,105 | |||||||||
| Unrealized gains on derivative instruments | 1,223 | 1,267 | +44 | |||||||||
| Pension liability adjustment | (13,960 | ) | 74,971 | +88,931 | ||||||||
| Foreign currency translation adjustments | 8,444 | (75,888 | ) | -84,332 | ||||||||
| Debt valuation adjustments | – | 3,032 | +3,032 | |||||||||
Total comprehensive income | 995,542 | 666,032 | -329,510 | |||||||||
| Less - Comprehensive income attributable to noncontrolling interests | 57,669 | 54,151 | -3,518 | |||||||||
Comprehensive income attributable to Sony Corporation’s stockholders | ¥ | 937,873 | ¥ | 611,881 | ¥ | -325,992 | ||||||
F-2
Consolidated Statements of Income | ||||||||||||
| (Millions of yen, except per share amounts) | ||||||||||||
| Three months ended March 31 | ||||||||||||
| 2019 | 2020 | Change | ||||||||||
| Sales and operating revenue: | ||||||||||||
| Net sales | ¥ | 1,674,178 | ¥ | 1,537,308 | ¥ | -136,870 | ||||||
| Financial services revenue | 428,345 | 184,556 | -243,789 | |||||||||
| Other operating revenue | 24,975 | 26,876 | +1,901 | |||||||||
| 2,127,498 | 1,748,740 | -378,758 | ||||||||||
| Costs and expenses: | ||||||||||||
| Cost of sales | 1,234,143 | 1,123,928 | -110,215 | |||||||||
| Selling, general and administrative | 399,910 | 397,510 | -2,400 | |||||||||
| Financial services expenses | 384,200 | 174,664 | -209,536 | |||||||||
| Other operating expense, net | 28,183 | 20,406 | -7,777 | |||||||||
| 2,046,436 | 1,716,508 | -329,928 | ||||||||||
| Equity in net income of affiliated companies | 1,668 | 3,215 | +1,547 | |||||||||
| Operating income | 82,730 | 35,447 | -47,283 | |||||||||
| Other income: | ||||||||||||
| Interest and dividends | 5,877 | 4,620 | -1,257 | |||||||||
| Gain on equity securities, net | 38,740 | - | -38,740 | |||||||||
| Other | 319 | 587 | +268 | |||||||||
| 44,936 | 5,207 | -39,729 | ||||||||||
| Other expenses: | ||||||||||||
| Interest expenses | 1,763 | 2,297 | +534 | |||||||||
| Loss on equity securities, net | - | 20,552 | +20,552 | |||||||||
| Foreign exchange loss, net | 12,453 | 17,413 | +4,960 | |||||||||
| Other | 816 | 4,375 | +3,559 | |||||||||
| 15,032 | 44,637 | +29,605 | ||||||||||
| Income (loss) before income taxes | 112,634 | (3,983 | ) | -116,617 | ||||||||
| Income taxes | 11,331 | (19,726 | ) | -31,057 | ||||||||
| Net income | 101,303 | 15,743 | -85,560 | |||||||||
| Less - Net income attributable to noncontrolling interests | 13,442 | 3,099 | -10,343 | |||||||||
| Net income attributable to Sony Corporation’s stockholders | ¥ | 87,861 | ¥ | 12,644 | ¥ | -75,217 | ||||||
| Per share data: | ||||||||||||
| Net income attributable to Sony Corporation’s stockholders | ||||||||||||
| — Basic | ¥ | 69.68 | ¥ | 10.33 | ¥ | -59.35 | ||||||
| — Diluted | 68.23 | 10.10 | -58.13 | |||||||||
Consolidated Statements of Comprehensive Income | ||||||||||||
| (Millions of yen) | ||||||||||||
| Three months ended March 31 | ||||||||||||
| 2019 | 2020 | Change | ||||||||||
| Net income | ¥ | 101,303 | ¥ | 15,743 | ¥ | -85,560 | ||||||
| Other comprehensive income, net of tax – | ||||||||||||
| Unrealized gains on securities | 29,365 | 25,633 | -3,732 | |||||||||
| Unrealized gains (losses) on derivative instruments | (18 | ) | 1,207 | +1,225 | ||||||||
| Pension liability adjustment | (21,045 | ) | (11,191 | ) | +9,854 | |||||||
| Foreign currency translation adjustments | 4,139 | (58,387 | ) | -62,526 | ||||||||
| Debt valuation adjustments | - | 3,032 | +3,032 | |||||||||
| Total comprehensive income (loss) | 113,744 | (23,963 | ) | -137,707 | ||||||||
| Less - Comprehensive income attributable to noncontrolling interests | 23,804 | 12,516 | -11,288 | |||||||||
| Comprehensive income (loss) attributable to Sony Corporation’s stockholders | ¥ | 89,940 | ¥ | (36,479 | ) | ¥ | -126,419 | |||||
F-3
Consolidated Statements of Changes in Stockholders' Equity | ||||||||||||||||||||||||||||||||
| (Millions of yen) | ||||||||||||||||||||||||||||||||
Common stock | Additional paid-in capital | Retained earnings | Accumulated other comprehensive income | Treasury stock, at cost | Sony Corporation’s stockholders’ equity | Noncontrolling interests | Total equity | |||||||||||||||||||||||||
Balance at March 31, 2018 | ¥ | 865,678 | ¥ | 1,282,577 | ¥ | 1,440,387 | ¥ | (616,746 | ) | ¥ | (4,530 | ) | ¥ | 2,967,366 | ¥ | 679,791 | ¥ | 3,647,157 | ||||||||||||||
Cumulative effect of newly adopted ASUs | 7,976 | (15,526 | ) | (7,550 | ) | 5,432 | (2,118 | ) | ||||||||||||||||||||||||
Issuance of new shares | 431 | 431 | 862 | 862 | ||||||||||||||||||||||||||||
Exercise of stock acquisition rights | 8,174 | 8,174 | 16,348 | 16,348 | ||||||||||||||||||||||||||||
Conversion of convertible bonds | 8 | 8 | 16 | 16 | ||||||||||||||||||||||||||||
Stock-based compensation | �� | 1,159 | 1,159 | 1,159 | ||||||||||||||||||||||||||||
Comprehensive income: | ||||||||||||||||||||||||||||||||
| Net income | 916,271 | 916,271 | 50,279 | 966,550 | ||||||||||||||||||||||||||||
| Other comprehensive income, net of tax | ||||||||||||||||||||||||||||||||
| Unrealized gains on securities | 24,370 | 24,370 | 8,915 | 33,285 | ||||||||||||||||||||||||||||
| Unrealized gains on derivative instruments | 1,223 | 1,223 | 1,223 | |||||||||||||||||||||||||||||
| Pension liability adjustment | (14,013 | ) | (14,013 | ) | 53 | (13,960 | ) | |||||||||||||||||||||||||
| Foreign currency translation adjustments | 10,022 | 10,022 | (1,578 | ) | 8,444 | |||||||||||||||||||||||||||
| Total comprehensive income | 937,873 | 57,669 | 995,542 | |||||||||||||||||||||||||||||
Stock issue costs, net of tax | (147 | ) | (147 | ) | (147 | ) | ||||||||||||||||||||||||||
Dividends declared | (44,048 | ) | (44,048 | ) | (28,961 | ) | (73,009 | ) | ||||||||||||||||||||||||
Purchase of treasury stock | (100,177 | ) | (100,177 | ) | (100,177 | ) | ||||||||||||||||||||||||||
Reissuance of treasury stock | 1 | 3 | 4 | 4 | ||||||||||||||||||||||||||||
Transactions with noncontrolling interests shareholders and other | (25,329 | ) | (25,329 | ) | (23,618 | ) | (48,947 | ) | ||||||||||||||||||||||||
Balance at March 31, 2019 | ¥ | 874,291 | 1,266,874 | 2,320,586 | (610,670 | ) | (104,704 | ) | 3,746,377 | 690,313 | 4,436,690 | |||||||||||||||||||||
In July 2018, Sony Corporation of America acquired from the Estate of Michael Jackson (the “Estate”) the 25.1% interest in Nile Acquisition LLC (“Nile”) held by the Estate. A total of 287.5 million U.S. dollars was paid to the Estate for the acquisition, which payment also includes reimbursement of various expenses and costs related to the acquisition. The difference between cash consideration paid of 287.5 million U.S. dollars and the carrying amount of the noncontrolling interests was recognized as a decrease to additional paid-in capital of 295.9 million U.S. dollars. As a result of the acquisition, Nile became a wholly-owned subsidiary of Sony.
| (Millions of yen) | ||||||||||||||||||||||||||||||||
Common stock | Additional paid-in capital | Retained earnings | Accumulated other comprehensive income | Treasury stock, at cost | Sony Corporation’s stockholders’ equity | Noncontrolling interests | Total equity | |||||||||||||||||||||||||
| Balance at March 31, 2019 | ¥ | 874,291 | ¥ | 1,266,874 | ¥ | 2,320,586 | ¥ | (610,670 | ) | ¥ | (104,704 | ) | ¥ | 3,746,377 | ¥ | 690,313 | ¥ | 4,436,690 | ||||||||||||||
Cumulative effect of ASU 2016-02 | (7,472 | ) | (7,472 | ) | (7,472 | ) | ||||||||||||||||||||||||||
| Issuance of new shares | 529 | 529 | 1,058 | 1,058 | ||||||||||||||||||||||||||||
| Exercise of stock acquisition rights | 5,179 | 5,180 | 10,359 | 10,359 | ||||||||||||||||||||||||||||
| Conversion of convertible bonds | 215 | 215 | 430 | 430 | ||||||||||||||||||||||||||||
| Stock-based compensation | 1,980 | 1,980 | 1,980 | |||||||||||||||||||||||||||||
Comprehensive income: | ||||||||||||||||||||||||||||||||
| Net income | 582,191 | 582,191 | 40,069 | 622,260 | ||||||||||||||||||||||||||||
| Other comprehensive income, net of tax | ||||||||||||||||||||||||||||||||
| Unrealized gains on securities | 26,156 | 26,156 | 14,234 | 40,390 | ||||||||||||||||||||||||||||
| Unrealized gains on derivative instruments | 1,267 | 1,267 | 1,267 | |||||||||||||||||||||||||||||
| Pension liability adjustment | 74,937 | 74,937 | 34 | 74,971 | ||||||||||||||||||||||||||||
| Foreign currency translation adjustments | (74,643 | ) | (74,643 | ) | (1,245 | ) | (75,888 | ) | ||||||||||||||||||||||||
| Debt valuation adjustments | 1,973 | 1,973 | 1,059 | 3,032 | ||||||||||||||||||||||||||||
| Total comprehensive income | 611,881 | 54,151 | 666,032 | |||||||||||||||||||||||||||||
Stock issue costs, net of tax | (80 | ) | (80 | ) | (80 | ) | ||||||||||||||||||||||||||
Dividends declared | (55,111 | ) | (55,111 | ) | (25,885 | ) | (80,996 | ) | ||||||||||||||||||||||||
Purchase of treasury stock | (200,211 | ) | (200,211 | ) | (200,211 | ) | ||||||||||||||||||||||||||
Reissuance of treasury stock | 0 | 2 | 2 | 2 | ||||||||||||||||||||||||||||
Cancellation of treasury stock | (1,072 | ) | (71,338 | ) | 72,410 | – | – | |||||||||||||||||||||||||
Transactions with noncontrolling interests shareholders and other | 16,093 | 16,093 | (54,350 | ) | (38,257 | ) | ||||||||||||||||||||||||||
Balance at March 31, 2020 | ¥ | 880,214 | 1,289,719 | 2,768,856 | (580,980 | ) | (232,503 | ) | 4,125,306 | 664,229 | 4,789,535 | |||||||||||||||||||||
On November 18, 2019, Sony, through a wholly-owned subsidiary in the Pictures segment, acquired AT&T Inc.’s (“AT&T”) 42% equity interest in Game Show Network, LLC (“Game Show Network”), a U.S.-based media network subsidiary. As a result of this acquisition, Game Show Network has become a wholly-owned subsidiary of Sony. Sony paid 53,992 million yen (496 million U.S. dollars) to AT&T, including 129 million U.S. dollars of dividends Sony distributed to AT&T prior to the acquisition. The difference between the cash paid and the carrying amount of the noncontrolling interests was recognized as an increase to additional paid-in capital.
F-4
Consolidated Statements of Cash Flows | ||||||||
| (Millions of yen) | ||||||||
| Fiscal year ended March 31 | ||||||||
| 2019 | 2020 | |||||||
Cash flows from operating activities: | ||||||||
| Net income | ¥ | 966,550 | ¥ | 622,260 | ||||
| Adjustments to reconcile net income to net cash provided by operating activities: | ||||||||
| Depreciation and amortization, including amortization of deferred insurance acquisition costs and contract costs | 374,026 | 416,642 | ||||||
| Amortization of film costs | 348,493 | 329,809 | ||||||
| Accrual for pension and severance costs, less payments | (33,631 | ) | 8,948 | |||||
| Other operating income, net | (71,568 | ) | (3,611 | ) | ||||
| (Gain) loss on securities investments, net (other than financial services business) | (118,630 | ) | 20,177 | |||||
| (Gain) loss on marketable securities and securities investments held in the financial services business, net | (66,383 | ) | 93,088 | |||||
| Deferred income taxes | (121,650 | ) | 4,799 | |||||
| Equity in net (income) loss of affiliated companies, net of dividends | 7,947 | (5,114 | ) | |||||
| Changes in assets and liabilities: | ||||||||
| Decrease in notes, accounts receivable, trade and contract assets | 1,144 | 62,654 | ||||||
| Decrease in inventories | 30,455 | 40,315 | ||||||
| Increase in film costs | (410,994 | ) | (361,194 | ) | ||||
| Increase (decrease) in notes and accounts payable, trade | 18,534 | (91,435 | ) | |||||
| Decrease in accrued income and other taxes | (20,039 | ) | (40,144 | ) | ||||
| Increase in future insurance policy benefits and other | 544,179 | 520,683 | ||||||
| Increase in deferred insurance acquisition costs | (88,807 | ) | (99,433 | ) | ||||
| Increase in marketable securities held in the life insurance business | (64,034 | ) | (124,270 | ) | ||||
| (Increase) decrease in other current assets | 16,576 | (37,286 | ) | |||||
| Increase (decrease) in other current liabilities | 56,723 | (27,083 | ) | |||||
| Other | (110,153 | ) | 19,940 | |||||
| Net cash provided by operating activities | 1,258,738 | 1,349,745 | ||||||
Cash flows from investing activities: | ||||||||
| Payments for purchases of fixed assets | (312,644 | ) | (439,761 | ) | ||||
| Proceeds from sales of fixed assets | 17,585 | 18,758 | ||||||
| Payments for investments and advances by financial services business | (1,078,250 | ) | (1,319,062 | ) | ||||
| Payments for investments and advances (other than financial services business) | (53,525 | ) | (48,853 | ) | ||||
| Proceeds from sales or return of investments and collections of advances by financial services business | 309,498 | 343,740 | ||||||
| Proceeds from sales or return of investments and collections of advances (other than financial services business) | 2,442 | 14,456 | ||||||
| Payment for EMI Music Publishing acquisition, net of cash acquired | (244,197 | ) | – | |||||
| Proceeds from sales of businesses | – | 12,816 | ||||||
| Proceeds related to sales of Spotify Technology S.A. Shares | 82,467 | – | ||||||
| Proceeds from sales of Olympus Corporation Shares | – | 80,357 | ||||||
| Other | (30,821 | ) | (14,729 | ) | ||||
| Net cash used in investing activities | (1,307,445 | ) | (1,352,278 | ) | ||||
Cash flows from financing activities: | ||||||||
| Proceeds from issuance of long-term debt | 94,351 | 118,447 | ||||||
| Payments of long-term debt | (382,671 | ) | (198,055 | ) | ||||
| Increase in short-term borrowings, net | 123,979 | 193,332 | ||||||
| Increase in deposits from customers in the financial services business, net | 246,945 | 258,720 | ||||||
| Dividends paid | (38,067 | ) | (49,574 | ) | ||||
| Payments for purchase of treasury stock | (100,177 | ) | (200,211 | ) | ||||
| Payment for purchase of noncontrolling interest in Nile Acquisition LLC | (32,041 | ) | – | |||||
| Payment for purchase of noncontrolling interest in Game Show Network, LLC | – | (39,894 | ) | |||||
| Other | (35,203 | ) | (17,107 | ) | ||||
| Net cash provided by (used in) financing activities | (122,884 | ) | 65,658 | |||||
Effect of exchange rate changes on cash and cash equivalents, including restricted | 52,465 | (21,643 | ) | |||||
Net increase (decrease) in cash and cash equivalents, including restricted | (119,126 | ) | 41,482 | |||||
Cash and cash equivalents, including restricted, at beginning of the fiscal year | 1,592,939 | 1,473,813 | ||||||
Cash and cash equivalents, including restricted, at end of the fiscal year | 1,473,813 | 1,515,295 | ||||||
| Less - restricted cash and cash equivalents, included in other current assets and other assets | 3,740 | 2,938 | ||||||
Cash and cash equivalents at end of the fiscal year | ¥ | 1,470,073 | ¥ | 1,512,357 | ||||
F-5
Notes to Consolidated Financial Statements | ||||||||||||
| Business Segment Information | ||||||||||||
| (Business Segments) | ||||||||||||
| (Millions of yen) | ||||||||||||
| Fiscal year ended March 31 | ||||||||||||
| Sales and operating revenue | 2019 | 2020 | Change | |||||||||
| Game & Network Services | ||||||||||||
| Customers | ¥ | 2,224,622 | ¥ | 1,919,760 | ¥ | -304,862 | ||||||
| Intersegment | 86,250 | 57,791 | -28,459 | |||||||||
| Total | 2,310,872 | 1,977,551 | -333,321 | |||||||||
| Music | ||||||||||||
| Customers | 795,025 | 838,592 | +43,567 | |||||||||
| Intersegment | 12,464 | 11,317 | -1,147 | |||||||||
| Total | 807,489 | 849,909 | +42,420 | |||||||||
| Pictures | ||||||||||||
| Customers | 985,270 | 1,010,714 | +25,444 | |||||||||
| Intersegment | 1,603 | 1,140 | -463 | |||||||||
| Total | 986,873 | 1,011,854 | +24,981 | |||||||||
| Electronics Products & Solutions | ||||||||||||
| Customers | 2,303,167 | 1,969,880 | -333,287 | |||||||||
| Intersegment | 17,461 | 21,388 | +3,927 | |||||||||
| Total | 2,320,628 | 1,991,268 | -329,360 | |||||||||
| Imaging & Sensing Solutions | ||||||||||||
| Customers | 770,622 | 985,259 | +214,637 | |||||||||
| Intersegment | 108,708 | 85,317 | -23,391 | |||||||||
| Total | 879,330 | 1,070,576 | +191,246 | |||||||||
| Financial Services | ||||||||||||
| Customers | 1,274,708 | 1,299,847 | +25,139 | |||||||||
| Intersegment | 7,831 | 7,901 | +70 | |||||||||
| Total | 1,282,539 | 1,307,748 | +25,209 | |||||||||
| All Other | ||||||||||||
| Customers | 299,806 | 214,999 | -84,807 | |||||||||
| Intersegment | 45,931 | 36,421 | -9,510 | |||||||||
| Total | 345,737 | 251,420 | -94,317 | |||||||||
| Corporate and elimination | (267,781 | ) | (200,441 | ) | +67,340 | |||||||
| Consolidated total | ¥ | 8,665,687 | ¥ | 8,259,885 | ¥ | -405,802 | ||||||
Game & Network Services (“G&NS”) intersegment amounts primarily consist of transactions with All Other.
Imaging & Sensing Solutions (“I&SS”) intersegment amounts primarily consist of transactions with the G&NS segment and the Electronics Products & Solutions (“EP&S”) segment.
All Other intersegment amounts primarily consist of transactions with the G&NS segment, the Music segment and the Pictures segment.
Corporate and elimination includes certain brand and patent royalty income.
| (Millions of yen) | ||||||||||||
| Fiscal year ended March 31 | ||||||||||||
| Operating income (loss) | 2019 | 2020 | Change | |||||||||
| Game & Network Services | ¥ | 311,092 | ¥ | 238,400 | ¥ | -72,692 | ||||||
| Music | 232,487 | 142,345 | -90,142 | |||||||||
| Pictures | 54,599 | 68,157 | +13,558 | |||||||||
| Electronics Products & Solutions | 76,508 | 87,276 | +10,768 | |||||||||
| Imaging & Sensing Solutions | 143,874 | 235,584 | +91,710 | |||||||||
| Financial Services | 161,477 | 129,597 | -31,880 | |||||||||
| All Other | (11,127 | ) | 16,288 | +27,415 | ||||||||
| Total | 968,910 | 917,647 | -51,263 | |||||||||
| Corporate and elimination | (74,675 | ) | (72,188 | ) | +2,487 | |||||||
| Consolidated total | ¥ | 894,235 | ¥ | 845,459 | ¥ | -48,776 | ||||||
Operating income (loss) is sales and operating revenue less costs and expenses, and includes equity in net income (loss) of affiliated companies.
The 2019 sales and operating revenue and operating income (loss) above has been reclassified to reflect the change in the business segment classification discussed on page F-14.
F-6
| (Business Segments) | ||||||||||||
| (Millions of yen) | ||||||||||||
| Three months ended March 31 | ||||||||||||
| Sales and operating revenue | 2019 | 2020 | Change | |||||||||
| Game & Network Services | ||||||||||||
| Customers | ¥ | 479,779 | ¥ | 423,388 | ¥ | -56,391 | ||||||
| Intersegment | 18,314 | 10,182 | -8,132 | |||||||||
| Total | 498,093 | 433,570 | -64,523 | |||||||||
| Music | ||||||||||||
| Customers | 211,736 | 207,951 | -3,785 | |||||||||
| Intersegment | 1,076 | 3,492 | +2,416 | |||||||||
| Total | 212,812 | 211,443 | -1,369 | |||||||||
| Pictures | ||||||||||||
| Customers | 293,682 | 328,866 | +35,184 | |||||||||
| Intersegment | 502 | 282 | -220 | |||||||||
| Total | 294,184 | 329,148 | +34,964 | |||||||||
| Electronics Products & Solutions | ||||||||||||
| Customers | 478,049 | 357,095 | -120,954 | |||||||||
| Intersegment | 5,342 | 6,330 | +988 | |||||||||
| Total | 483,391 | 363,425 | -119,966 | |||||||||
| Imaging & Sensing Solutions | ||||||||||||
| Customers | 169,556 | 210,689 | +41,133 | |||||||||
| Intersegment | 22,762 | 20,478 | -2,284 | |||||||||
| Total | 192,318 | 231,167 | +38,849 | |||||||||
| Financial Services | ||||||||||||
| Customers | 428,345 | 184,556 | -243,789 | |||||||||
| Intersegment | 1,950 | 1,848 | -102 | |||||||||
| Total | 430,295 | 186,404 | -243,891 | |||||||||
| All Other | ||||||||||||
| Customers | 61,667 | 33,295 | -28,372 | |||||||||
| Intersegment | 10,677 | 7,364 | -3,313 | |||||||||
| Total | 72,344 | 40,659 | -31,685 | |||||||||
| Corporate and elimination | (55,939 | ) | (47,076 | ) | +8,863 | |||||||
| Consolidated total | ¥ | 2,127,498 | ¥ | 1,748,740 | ¥ | -378,758 | ||||||
G&NS intersegment amounts primarily consist of transactions with All Other.
I&SS intersegment amounts primarily consist of transactions with the G&NS segment and the EP&S segment.
All Other intersegment amounts primarily consist of transactions with the G&NS segment, the Music segment and the Pictures segment.
Corporate and elimination includes certain brand and patent royalty income.
| (Millions of yen) | ||||||||||||
| Three months ended March 31 | ||||||||||||
| Operating income (loss) | 2019 | 2020 | Change | |||||||||
| Game & Network Services | ¥ | 63,938 | ¥ | 46,159 | ¥ | -17,779 | ||||||
| Music | 21,786 | 30,338 | +8,552 | |||||||||
| Pictures | 27,077 | 23,041 | -4,036 | |||||||||
| Electronics Products & Solutions | (38,871 | ) | (59,513 | ) | -20,642 | |||||||
| Imaging & Sensing Solutions | 20,299 | 34,496 | +14,197 | |||||||||
| Financial Services | 43,842 | 12,079 | -31,763 | |||||||||
| All Other | (22,567 | ) | (4,217 | ) | +18,350 | |||||||
| Total | 115,504 | 82,383 | -33,121 | |||||||||
| Corporate and elimination | (32,774 | ) | (46,936 | ) | -14,162 | |||||||
| Consolidated total | ¥ | 82,730 | ¥ | 35,447 | ¥ | -47,283 | ||||||
Operating income (loss) is sales and operating revenue less costs and expenses, and includes equity in net income (loss) of affiliated companies.
The 2019 sales and operating revenue and operating income (loss) above has been reclassified to reflect the change in the business segment classification discussed on page F-14.
F-7
(Sales to Customers by Product Category)
The following table is a breakdown of sales and operating revenue to external customers for each segment. Sony management views each segment as a single operating segment.
| (Millions of yen) | ||||||||||||
| Fiscal year ended March 31 | ||||||||||||
| Sales and operating revenue (to external customers) | 2019 | 2020 | Change | |||||||||
| Game & Network Services | ||||||||||||
| Digital Software and Add-on Content | ¥ | 1,102,231 | ¥ | 1,010,296 | ¥ | -91,935 | ||||||
| Network Services | 326,524 | 337,265 | +10,741 | |||||||||
| Hardware and Others | 795,867 | 572,199 | -223,668 | |||||||||
| Total | 2,224,622 | 1,919,760 | -304,862 | |||||||||
| Music | ||||||||||||
| Recorded Music - Streaming | 227,513 | 276,039 | +48,526 | |||||||||
| Recorded Music - Others | 199,413 | 191,114 | -8,299 | |||||||||
| Music Publishing | 106,666 | 157,478 | +50,812 | |||||||||
| Visual Media and Platform | 261,433 | 213,961 | -47,472 | |||||||||
| Total | 795,025 | 838,592 | +43,567 | |||||||||
| Pictures | ||||||||||||
| Motion Pictures | 436,017 | 475,061 | +39,044 | |||||||||
| Television Productions | 288,816 | 301,224 | +12,408 | |||||||||
| Media Networks | 260,437 | 234,429 | -26,008 | |||||||||
| Total | 985,270 | 1,010,714 | +25,444 | |||||||||
| Electronics Products & Solutions | ||||||||||||
| Televisions | 788,423 | 646,513 | -141,910 | |||||||||
| Audio and Video | 362,580 | 346,060 | -16,520 | |||||||||
| Still and Video Cameras | 421,506 | 384,142 | -37,364 | |||||||||
| Mobile Communications | 487,330 | 362,144 | -125,186 | |||||||||
| Other | 243,328 | 231,021 | -12,307 | |||||||||
| Total | 2,303,167 | 1,969,880 | -333,287 | |||||||||
| Imaging & Sensing Solutions | 770,622 | 985,259 | +214,637 | |||||||||
| Financial Services | 1,274,708 | 1,299,847 | +25,139 | |||||||||
| All Other | 299,806 | 214,999 | -84,807 | |||||||||
| Corporate | 12,467 | 20,834 | +8,367 | |||||||||
| Consolidated total | ¥ | 8,665,687 | ¥ | 8,259,885 | ¥ | -405,802 | ||||||
F-8
(Sales to Customers by Product Category)
| (Millions of yen) | ||||||||||||
| Three months ended March 31 | ||||||||||||
| Sales and operating revenue (to external customers) | 2019 | 2020 | Change | |||||||||
| Game & Network Services | ||||||||||||
| Digital Software and Add-on Content | ¥ | 265,116 | ¥ | 262,461 | ¥ | -2,655 | ||||||
| Network Services | 95,283 | 83,798 | -11,485 | |||||||||
| Hardware and Others | 119,380 | 77,129 | -42,251 | |||||||||
| Total | 479,779 | 423,388 | -56,391 | |||||||||
| Music | ||||||||||||
| Recorded Music - Streaming | 55,563 | 69,948 | +14,385 | |||||||||
| Recorded Music - Others | 48,811 | 47,102 | -1,709 | |||||||||
| Music Publishing | 35,392 | 40,065 | +4,673 | |||||||||
| Visual Media and Platform | 71,970 | 50,836 | -21,134 | |||||||||
| Total | 211,736 | 207,951 | -3,785 | |||||||||
| Pictures | ||||||||||||
| Motion Pictures | 117,796 | 152,475 | +34,679 | |||||||||
| Television Productions | 110,493 | 120,620 | +10,127 | |||||||||
| Media Networks | 65,393 | 55,771 | -9,622 | |||||||||
| Total | 293,682 | 328,866 | +35,184 | |||||||||
| Electronics Products & Solutions | ||||||||||||
| Televisions | 145,910 | 96,414 | -49,496 | |||||||||
| Audio and Video | 72,309 | 61,821 | -10,488 | |||||||||
| Still and Video Cameras | 82,449 | 62,251 | -20,198 | |||||||||
| Mobile Communications | 107,112 | 70,380 | -36,732 | |||||||||
| Other | 70,269 | 66,229 | -4,040 | |||||||||
| Total | 478,049 | 357,095 | -120,954 | |||||||||
| Imaging & Sensing Solutions | 169,556 | 210,689 | +41,133 | |||||||||
| Financial Services | 428,345 | 184,556 | -243,789 | |||||||||
| All Other | 61,667 | 33,295 | -28,372 | |||||||||
| Corporate | 4,684 | 2,900 | -1,784 | |||||||||
| Consolidated total | ¥ | 2,127,498 | ¥ | 1,748,740 | ¥ | -378,758 | ||||||
Sony has realigned its product category configuration in regard to the segmentation change. For further details, refer to Accounting Policies and Other Information in the Notes to Consolidated Financial Statements. Sony has also realigned its product category configuration in the Music segment with a more detailed breakdown in Recorded Music from the fourth quarter of the fiscal year ended March 31, 2020. In connection with these realignments, all prior period sales amounts by product category in the table above have been reclassified to conform to the current presentation.
In the G&NS segment, Digital Software and Add-on Content includes distribution of software titles and add-on content through network by Sony Interactive Entertainment; Network Services includes network services relating to game, video and music content; Hardware and Others includes home and portable game consoles, packaged software and peripheral devices. In the Music segment, Recorded Music - Streaming includes the distribution of digital recorded music by streaming; Recorded Music - Others includes the distribution of recorded music by physical media and digital download as well as revenue derived from artists’ live performances; Music Publishing includes the management and licensing of the words and music of songs; Visual Media and Platform includes the production and distribution of animation titles, including game applications based on the animation titles, and various service offerings for music and visual products. In the Pictures segment, Motion Pictures includes the worldwide production, acquisition and distribution of motion pictures and direct-to-video content; Television Productions includes the production, acquisition and distribution of television programming; Media Networks includes the operation of television and digital networks worldwide. In the EP&S segment, Televisions includes LCD and OLED televisions; Audio and Video includes Blu-ray disc players and recorders, home audio, headphones and memory-based portable audio devices; Still and Video Cameras includes interchangeable lens cameras, compact digital cameras, consumer video cameras and video cameras for broadcast; Mobile Communications includes smartphones and an internet-related service business; Other includes display products such as projectors and medical equipment.
Within the EP&S segment, the operating loss of Mobile Communications for the fiscal years ended March 31, 2019 and 2020 was (97,136) million yen and (21,057) million yen, respectively. In addition, the operating loss for the three months ended March 31, 2019 and 2020 was (41,062) million yen and (29,696) million yen, respectively.
F-9
(Condensed Financial Services Financial Statements)
The following schedules show unaudited condensed financial statements for the Financial Services segment and all other segments excluding Financial Services. These presentations are not in accordance with accounting principles generally accepted in the United States of America (“U.S. GAAP”), which is used by Sony to prepare its consolidated financial statements. However, because the Financial Services segment is different in nature from Sony’s other segments, Sony believes that a comparative presentation may be useful in understanding and analyzing Sony’s consolidated financial statements. Transactions between the Financial Services segment and Sony without the Financial Services segment, including noncontrolling interests, are included in those respective presentations, then eliminated in the consolidated figures shown below.
Condensed Balance Sheets | ||||||||||||||||||||||||
| (Millions of yen) | ||||||||||||||||||||||||
| Financial Services | Sony without Financial Services | Consolidated | ||||||||||||||||||||||
| March 31 | March 31 | March 31 | March 31 | March 31 | March 31 | |||||||||||||||||||
| 2019 | 2020 | 2019 | 2020 | 2019 | 2020 | |||||||||||||||||||
| ASSETS | ||||||||||||||||||||||||
| Current assets: | ||||||||||||||||||||||||
| Cash and cash equivalents | ¥ | 509,595 | ¥ | 550,039 | ¥ | 960,478 | ¥ | 962,318 | ¥ | 1,470,073 | ¥ | 1,512,357 | ||||||||||||
| Marketable securities | 1,324,538 | 1,847,772 | – | – | 1,324,538 | 1,847,772 | ||||||||||||||||||
| Notes and accounts receivable, trade and contract assets | 16,479 | 10,532 | 1,055,669 | 999,976 | 1,065,802 | 1,002,920 | ||||||||||||||||||
| Inventories | – | – | 653,278 | 589,969 | 653,278 | 589,969 | ||||||||||||||||||
| Other receivables | 63,921 | 73,117 | 159,758 | 115,100 | 223,620 | 188,106 | ||||||||||||||||||
| Prepaid expenses and other current assets | 133,214 | 181,247 | 376,778 | 413,496 | 509,301 | 594,021 | ||||||||||||||||||
| Total current assets | 2,047,747 | 2,662,707 | 3,205,961 | 3,080,859 | 5,246,612 | 5,735,145 | ||||||||||||||||||
Film costs | – | – | 409,005 | 427,336 | 409,005 | 427,336 | ||||||||||||||||||
Investments and advances | 11,400,938 | 12,457,977 | 399,696 | 351,936 | 11,724,651 | 12,734,132 | ||||||||||||||||||
Investments in Financial Services, at cost | – | – | 153,968 | 153,968 | – | – | ||||||||||||||||||
Property, plant and equipment | 22,920 | 18,247 | 752,847 | 890,640 | 777,053 | 908,644 | ||||||||||||||||||
Other assets: | ||||||||||||||||||||||||
| Right-of-use assets | – | 58,897 | – | 333,753 | – | 392,610 | ||||||||||||||||||
| Intangibles, net | 42,968 | 49,871 | 874,998 | 856,439 | 917,966 | 906,310 | ||||||||||||||||||
| Goodwill | 7,225 | 10,834 | 761,327 | 773,054 | 768,552 | 783,888 | ||||||||||||||||||
| Deferred insurance acquisition costs | 595,265 | 600,901 | – | – | 595,265 | 600,901 | ||||||||||||||||||
| Deferred income taxes | 3,533 | 10,365 | 198,953 | 200,021 | 202,486 | 210,372 | ||||||||||||||||||
| Other | 32,085 | 38,949 | 311,653 | 305,028 | 339,996 | 340,005 | ||||||||||||||||||
| 681,076 | 769,817 | 2,146,931 | 2,468,295 | 2,824,265 | 3,234,086 | |||||||||||||||||||
Total assets | ¥ | 14,152,681 | ¥ | 15,908,748 | ¥ | 7,068,408 | ¥ | 7,373,034 | ¥ | 20,981,586 | ¥ | 23,039,343 | ||||||||||||
| LIABILITIES AND EQUITY | ||||||||||||||||||||||||
| Current liabilities: | ||||||||||||||||||||||||
| Short-term borrowings | ¥ | 564,609 | ¥ | 758,737 | ¥ | 226,470 | ¥ | 81,246 | ¥ | 791,079 | ¥ | 839,983 | ||||||||||||
| Short-term operating lease liabilities | – | 9,363 | – | 59,595 | – | 68,942 | ||||||||||||||||||
| Notes and accounts payable, trade | – | – | 492,124 | 380,810 | 492,124 | 380,810 | ||||||||||||||||||
| Accounts payable, other and accrued expenses | 40,228 | 40,457 | 1,653,895 | 1,591,072 | 1,693,048 | 1,630,197 | ||||||||||||||||||
| Accrued income and other taxes | 19,655 | 22,825 | 115,571 | 123,171 | 135,226 | 145,996 | ||||||||||||||||||
| Deposits from customers in the banking business | 2,302,314 | 2,440,783 | – | – | 2,302,314 | 2,440,783 | ||||||||||||||||||
| Other | 197,123 | 226,455 | 474,926 | 514,368 | 666,024 | 733,732 | ||||||||||||||||||
Total current liabilities | 3,123,929 | 3,498,620 | 2,962,986 | 2,750,262 | 6,079,815 | 6,240,443 | ||||||||||||||||||
| Long-term debt | 235,761 | 240,143 | 336,349 | 398,793 | 568,372 | 634,966 | ||||||||||||||||||
| Long-term operating lease liabilities | – | 41,192 | – | 273,668 | – | 314,836 | ||||||||||||||||||
| Accrued pension and severance costs | 33,979 | 34,211 | 350,253 | 290,444 | 384,232 | 324,655 | ||||||||||||||||||
| Deferred income taxes | 355,356 | 391,883 | 176,065 | 173,022 | 531,421 | 549,538 | ||||||||||||||||||
| Future insurance policy benefits and other | 5,642,671 | 6,246,047 | – | – | 5,642,671 | 6,246,047 | ||||||||||||||||||
| Policyholders’ account in the life insurance business | 3,048,202 | 3,642,271 | – | – | 3,048,202 | 3,642,271 | ||||||||||||||||||
| Other | 15,488 | 21,843 | 288,164 | 289,574 | 281,382 | 289,285 | ||||||||||||||||||
| Total liabilities | 12,455,386 | 14,116,210 | 4,113,817 | 4,175,763 | 16,536,095 | 18,242,041 | ||||||||||||||||||
| Redeemable noncontrolling interest | – | – | 8,801 | 7,767 | 8,801 | 7,767 | ||||||||||||||||||
| Equity: | ||||||||||||||||||||||||
| Stockholders’ equity of Financial Services | 1,695,563 | 1,790,333 | – | – | – | – | ||||||||||||||||||
| Stockholders’ equity of Sony without Financial Services | – | – | 2,850,380 | 3,159,071 | – | – | ||||||||||||||||||
| Sony Corporation’s stockholders’ equity | – | – | – | – | 3,746,377 | 4,125,306 | ||||||||||||||||||
| Noncontrolling interests | 1,732 | 2,205 | 95,410 | 30,433 | 690,313 | 664,229 | ||||||||||||||||||
| Total equity | 1,697,295 | 1,792,538 | 2,945,790 | 3,189,504 | 4,436,690 | 4,789,535 | ||||||||||||||||||
| Total liabilities and equity | ¥ | 14,152,681 | ¥ | 15,908,748 | ¥ | 7,068,408 | ¥ | 7,373,034 | ¥ | 20,981,586 | ¥ | 23,039,343 | ||||||||||||
F-10
Condensed Statements of Income | ||||||||||||||||||||||||
| (Millions of yen) | ||||||||||||||||||||||||
| Fiscal year ended March 31 | ||||||||||||||||||||||||
| Financial Services | Sony without Financial Services | Consolidated | ||||||||||||||||||||||
| 2019 | 2020 | 2019 | 2020 | 2019 | 2020 | |||||||||||||||||||
| Financial services revenue | ¥ | 1,282,539 | ¥ | 1,307,748 | ¥ | – | ¥ | – | ¥ | 1,274,708 | ¥ | 1,299,847 | ||||||||||||
| Net sales and operating revenue | – | – | 7,396,401 | 6,965,971 | 7,390,979 | 6,960,038 | ||||||||||||||||||
| 1,282,539 | 1,307,748 | 7,396,401 | 6,965,971 | 8,665,687 | 8,259,885 | |||||||||||||||||||
| Cost of sales | – | – | 5,160,284 | 4,764,014 | 5,150,750 | 4,753,174 | ||||||||||||||||||
| Selling, general and administrative | – | – | 1,572,714 | 1,497,764 | 1,576,825 | 1,502,625 | ||||||||||||||||||
| Financial services expenses | 1,120,276 | 1,179,776 | – | – | 1,112,446 | 1,171,875 | ||||||||||||||||||
| Other operating (income) expense, net | 104 | (1,729 | ) | (71,672 | ) | (3,841 | ) | (71,568 | ) | (3,611 | ) | |||||||||||||
| 1,120,380 | 1,178,047 | 6,661,326 | 6,257,937 | 7,768,453 | 7,424,063 | |||||||||||||||||||
| Equity in net income (loss) of affiliated companies | (682 | ) | (104 | ) | (2,317 | ) | 9,741 | (2,999 | ) | 9,637 | ||||||||||||||
| Operating income | 161,477 | 129,597 | 732,758 | 717,775 | 894,235 | 845,459 | ||||||||||||||||||
| Other income (expenses), net | (73 | ) | (20 | ) | 133,929 | (28,299 | ) | 117,413 | (46,009 | ) | ||||||||||||||
| Income before income taxes | 161,404 | 129,577 | 866,687 | 689,476 | 1,011,648 | 799,450 | ||||||||||||||||||
| Income taxes | 44,763 | 36,311 | 335 | 141,552 | 45,098 | 177,190 | ||||||||||||||||||
| Net income | 116,641 | 93,266 | 866,352 | 547,924 | 966,550 | 622,260 | ||||||||||||||||||
| Less - Net income attributable to noncontrolling interests | 235 | 483 | 8,778 | 7,092 | 50,279 | 40,069 | ||||||||||||||||||
| Net income of Financial Services | ¥ | 116,406 | ¥ | 92,783 | ¥ | – | ¥ | – | ¥ | – | ¥ | – | ||||||||||||
| Net income of Sony without Financial Services | ¥ | – | ¥ | – | ¥ | 857,574 | ¥ | 540,832 | ¥ | – | ¥ | – | ||||||||||||
| Net income attributable to Sony Corporation's stockholders | ¥ | – | ¥ | – | ¥ | – | ¥ | – | ¥ | 916,271 | ¥ | 582,191 | ||||||||||||
| Three months ended March 31 | ||||||||||||||||||||||||
| Financial Services | Sony without Financial Services | Consolidated | ||||||||||||||||||||||
| 2019 | 2020 | 2019 | 2020 | 2019 | 2020 | |||||||||||||||||||
| Financial services revenue | ¥ | 430,295 | ¥ | 186,404 | ¥ | – | ¥ | – | ¥ | 428,345 | ¥ | 184,556 | ||||||||||||
| Net sales and operating revenue | – | – | 1,698,835 | 1,565,748 | 1,699,153 | 1,564,184 | ||||||||||||||||||
| 430,295 | 186,404 | 1,698,835 | 1,565,748 | 2,127,498 | 1,748,740 | |||||||||||||||||||
| Cost of sales | – | – | 1,234,482 | 1,126,454 | 1,234,143 | 1,123,928 | ||||||||||||||||||
| Selling, general and administrative | – | – | 399,255 | 396,580 | 399,910 | 397,510 | ||||||||||||||||||
| Financial services expenses | 386,148 | 176,513 | – | – | 384,200 | 174,664 | ||||||||||||||||||
| Other operating (income) expense, net | 53 | (1,771 | ) | 28,130 | 20,232 | 28,183 | 20,406 | |||||||||||||||||
| 386,201 | 174,742 | 1,661,867 | 1,543,266 | 2,046,436 | 1,716,508 | |||||||||||||||||||
| Equity in net income (loss) of affiliated companies | (252 | ) | 417 | 1,920 | 2,798 | 1,668 | 3,215 | |||||||||||||||||
| Operating income | 43,842 | 12,079 | 38,888 | 25,280 | 82,730 | 35,447 | ||||||||||||||||||
| Other income (expenses), net | (18 | ) | (5 | ) | 29,922 | (39,424 | ) | 29,904 | (39,430 | ) | ||||||||||||||
| Income (Loss) before income taxes | 43,824 | 12,074 | 68,810 | (14,144 | ) | 112,634 | (3,983 | ) | ||||||||||||||||
| Income taxes | 12,257 | 2,077 | (927 | ) | (21,129 | ) | 11,331 | (19,726 | ) | |||||||||||||||
| Net income | 31,567 | 9,997 | 69,737 | 6,985 | 101,303 | 15,743 | ||||||||||||||||||
Less - Net income (loss) attributable to noncontrolling interests | 51 | 224 | 2,382 | (625 | ) | 13,442 | 3,099 | |||||||||||||||||
| Net income of Financial Services | ¥ | 31,516 | ¥ | 9,773 | ¥ | – | ¥ | – | ¥ | – | ¥ | – | ||||||||||||
| Net income of Sony without Financial Services | ¥ | – | ¥ | – | ¥ | 67,355 | ¥ | 7,610 | ¥ | – | ¥ | – | ||||||||||||
| Net income attributable to Sony Corporation's stockholders | ¥ | – | ¥ | – | ¥ | – | ¥ | – | ¥ | 87,861 | ¥ | 12,644 | ||||||||||||
F-11
Condensed Statements of Cash Flows | ||||||||||||||||||||||||
| (Millions of yen) | ||||||||||||||||||||||||
| Fiscal year ended March 31 | ||||||||||||||||||||||||
| Financial Services | Sony without Financial Services | Consolidated | ||||||||||||||||||||||
| 2019 | 2020 | 2019 | 2020 | 2019 | 2020 | |||||||||||||||||||
Cash flows from operating activities: | ||||||||||||||||||||||||
| Net income (loss) | ¥ | 116,641 | ¥ | 93,266 | ¥ | 866,352 | ¥ | 547,924 | ¥ | 966,550 | ¥ | 622,260 | ||||||||||||
| Adjustments to reconcile net income (loss) to net cash provided by (used in) operating activities: | ||||||||||||||||||||||||
| Depreciation and amortization, including amortization of deferred insurance acquisition costs and contract costs | 91,179 | 106,667 | 282,847 | 309,975 | 374,026 | 416,642 | ||||||||||||||||||
| Amortization of film costs | – | – | 348,493 | 329,809 | 348,493 | 329,809 | ||||||||||||||||||
| Other operating (income) expense, net | 104 | (1,729 | ) | (71,672 | ) | (3,841 | ) | (71,568 | ) | (3,611 | ) | |||||||||||||
| (Gain) loss on marketable securities and securities investments, net | (66,383 | ) | 93,088 | (118,630 | ) | 20,177 | (185,013 | ) | 113,265 | |||||||||||||||
| Changes in assets and liabilities: | ||||||||||||||||||||||||
| (Increase) decrease in notes, accounts receivable, trade and contract assets | (867 | ) | 5,947 | 2,056 | 55,466 | 1,144 | 62,654 | |||||||||||||||||
| (Increase) decrease in inventories | – | – | 30,455 | 40,315 | 30,455 | 40,315 | ||||||||||||||||||
| (Increase) decrease in film costs | – | – | (410,994 | ) | (361,194 | ) | (410,994 | ) | (361,194 | ) | ||||||||||||||
| Increase (decrease) in notes and accounts payable, trade | – | – | 18,534 | (91,435 | ) | 18,534 | (91,435 | ) | ||||||||||||||||
| Increase (decrease) in future insurance policy benefits and other | 544,179 | 520,683 | – | – | 544,179 | 520,683 | ||||||||||||||||||
| (Increase) decrease in deferred insurance acquisition costs | (88,807 | ) | (99,433 | ) | – | – | (88,807 | ) | (99,433 | ) | ||||||||||||||
| (Increase) decrease in marketable securities held in the life insurance business | (64,034 | ) | (124,270 | ) | – | – | (64,034 | ) | (124,270 | ) | ||||||||||||||
| Other | (10,334 | ) | 10,021 | (194,002 | ) | (84,346 | ) | (204,227 | ) | (75,940 | ) | |||||||||||||
| Net cash provided by (used in) operating activities | 521,678 | 604,240 | 753,439 | 762,850 | 1,258,738 | 1,349,745 | ||||||||||||||||||
Cash flows from investing activities: | ||||||||||||||||||||||||
| Payments for purchases of fixed assets | (18,610 | ) | (21,822 | ) | (294,044 | ) | (420,149 | ) | (312,644 | ) | (439,761 | ) | ||||||||||||
| Payments for investments and advances | (1,078,250 | ) | (1,319,888 | ) | (53,525 | ) | (48,853 | ) | (1,131,775 | ) | (1,367,915 | ) | ||||||||||||
| Proceeds from sales or return of investments and collections of advances | 309,498 | 343,740 | 84,909 | 94,813 | 394,407 | 438,553 | ||||||||||||||||||
| Other | 287 | 8,873 | (257,719 | ) | 11,100 | (257,433 | ) | 16,845 | ||||||||||||||||
| Net cash provided by (used in) investing activities | (787,075 | ) | (989,097 | ) | (520,379 | ) | (363,089 | ) | (1,307,445 | ) | (1,352,278 | ) | ||||||||||||
Cash flows from financing activities: | ||||||||||||||||||||||||
| Increase (decrease) in borrowings, net | 160,902 | 193,709 | (325,247 | ) | (79,752 | ) | (164,341 | ) | 113,724 | |||||||||||||||
| Increase (decrease) in deposits from customers, net | 246,945 | 258,720 | – | – | 246,945 | 258,720 | ||||||||||||||||||
| Dividends paid | (26,100 | ) | (27,189 | ) | (38,067 | ) | (49,574 | ) | (38,067 | ) | (49,574 | ) | ||||||||||||
| Other | 112 | 61 | (157,799 | ) | (247,754 | ) | (167,421 | ) | (257,212 | ) | ||||||||||||||
Net cash provided by (used in) financing activities | 381,859 | 425,301 | (521,113 | ) | (377,080 | ) | (122,884 | ) | 65,658 | |||||||||||||||
Effect of exchange rate changes on cash and cash equivalents | – | – | 52,465 | (21,643 | ) | 52,465 | (21,643 | ) | ||||||||||||||||
| �� | ||||||||||||||||||||||||
Net increase (decrease) in cash and cash equivalents, including restricted | 116,462 | 40,444 | (235,588 | ) | 1,038 | (119,126 | ) | 41,482 | ||||||||||||||||
Cash and cash equivalents, including restricted, at beginning of the fiscal year | 393,133 | 509,595 | 1,199,806 | 964,218 | 1,592,939 | 1,473,813 | ||||||||||||||||||
Cash and cash equivalents, including restricted, at end of the fiscal year | 509,595 | 550,039 | 964,218 | 965,256 | 1,473,813 | 1,515,295 | ||||||||||||||||||
| Less - restricted cash and cash equivalents, included in other current assets and other assets | – | – | 3,740 | 2,938 | 3,740 | 2,938 | ||||||||||||||||||
Cash and cash equivalents at end of the fiscal year | ¥ | 509,595 | ¥ | 550,039 | ¥ | 960,478 | ¥ | 962,318 | ¥ | 1,470,073 | ¥ | 1,512,357 | ||||||||||||
F-12
Going Concern Assumption
Not Applicable
Accounting Policies and Other Information
(Recently adopted accounting pronouncements)
Leases
In February 2016, the Financial Accounting Standards Board (“FASB”) issued Accounting Standards Update (“ASU”) 2016-02, which amends the accounting guidance for leases. The ASU requires substantially all leases to be recognized on the balance sheet.
Sony has adopted this ASU effective April 1, 2019, on a modified retrospective basis with no restatement of comparative periods. Sony has elected the package of practical expedients for leases that expired or existed prior to the adoption date. As a result, Sony did not reassess whether any expired or existing contracts are or contain leases, the lease classification for any expired or existing leases, or whether initial direct costs for any existing leases qualify for capitalization. In addition, Sony has applied the short-term lease exception.
As a result of the adoption of this ASU, Sony recognized 316,923 million yen of operating lease right-of-use assets and 341,251 million yen of lease liabilities for operating leases on the consolidated balance sheets at April 1, 2019. This impact is mainly due to operating leases of real estate. The difference of 24,328 million yen between right-of-use assets and lease liabilities represents deferred rent for leases that existed as of the date of adoption, which was offset against the opening balance of operating lease right-of-use assets. Finance lease right-of-use assets which are included in property, plant and equipment in the consolidated balance sheets for the fiscal year ended March 31, 2019, are now presented as finance lease right-of-use assets from April 1, 2019 onward.
Targeted improvements to accounting for hedging activities
In August 2017, the FASB issued ASU 2017-12, which made targeted improvements to the accounting for hedging activities. The amendments in this update simplify certain aspects of hedge accounting for both non-financial and financial risks and better align the recognition and measurement of hedge results with an entity’s risk management activities. This ASU also amends certain presentation and disclosure requirements for hedging activities and changes how an entity assesses hedge effectiveness. This ASU was effective for Sony as of April 1, 2019. The adoption of this ASU did not have a material impact on Sony’s results of operations and financial position.
(Number of Consolidated Subsidiaries and Affiliated Companies)
As of March 31, 2020, Sony had 1,490 consolidated subsidiaries (including variable interest entities) and 140 affiliated companies accounted for under the equity method.
(Weighted-average Number of Outstanding Shares Used for the Computation of EPS of Common Stock)
| (Thousands of shares) | ||
| Fiscal year ended March 31 | ||
| Net income attributable to Sony Corporation’s stockholders | 2019 | 2020 |
| — Basic | 1,266,592 | 1,234,408 |
| — Diluted | 1,294,646 | 1,262,255 |
F-13
| (Thousands of shares) | ||
| Three months ended March 31 | ||
| Net income attributable to Sony Corporation’s stockholders | 2019 | 2020 |
| — Basic | 1,261,003 | 1,224,106 |
| — Diluted | 1,287,808 | 1,251,684 |
The dilutive effect in the weighted-average number of outstanding shares for the fiscal years ended March 31, 2019 and 2020, and for the three months ended March 31, 2019 and 2020 primarily resulted from convertible bonds which were issued in July 2015.
(Segmentation)
Sony realigned its business segments from the first quarter of the fiscal year ended March 31, 2020 to reflect modifications to the organizational structure of certain segments and a change in the Senior Executives in charge of certain segments as of April 1, 2019. In connection with this decision, the former Home Entertainment & Sound, Imaging Products & Solutions and Mobile Communications segments have been realigned as the Electronics Products & Solutions (“EP&S”) segment. In connection with this realignment, the sales and operating revenue and operating income (loss) of each segment for the fiscal year ended March 31, 2019 have been reclassified to conform to the presentation for the fiscal year ended March 31, 2020. In addition, the former Semiconductors segment has been renamed the Imaging & Sensing Solutions (“I&SS”) segment effective from the first quarter of the fiscal year ended March 31, 2020.
The G&NS segment includes network services businesses, the manufacture and sales of home gaming products and production and sales of software. The Music segment includes the Recorded Music, Music Publishing and Visual Media and Platform businesses. The Pictures segment includes the Motion Pictures, Television Productions and Media Networks businesses. The EP&S segment includes the Televisions business, the Audio and Video business, the Still and Video Cameras business, the smartphone business and Internet-related service business. The I&SS segment includes the image sensors business. The Financial Services segment primarily represents individual life insurance and non-life insurance businesses in the Japanese market and a bank business in Japan. All Other consists of various operating activities, including the disc manufacturing and recording media businesses. Sony’s products and services are generally unique to a single operating segment.
(Reclassifications)
Certain reclassifications of the financial statements and accompanying footnotes for the fiscal year and three months ended March 31, 2019 have been made to conform to the presentation for the fiscal year and three months ended March 31, 2020, respectively.
(Pension Plan Amendment)
From October 1, 2019, Sony Corporation and substantially all of its subsidiaries in Japan have amended their defined benefit pension plans and have implemented defined contribution plans for all employees other than those employees that had retired before the amendments. As a result, accrued pension and severance costs decreased 74,872 million yen and accumulated other comprehensive income increased 81,230 million yen in the consolidated balance sheets as of March 31, 2020. In addition, a loss on the pension plan amendment of 6,358 million yen was recorded in other expenses in the consolidated statements of income for the fiscal year ended March 31, 2020.
(Listing of SRE Holdings Corporation)
On December 19, 2019, SRE Holdings Corporation (“SRE”), Sony Corporation’s consolidated subsidiary, became a publicly listed company on the Tokyo Stock Exchange Mothers market (the “Listing”). Upon the Listing, Sony sold a portion of its shares of SRE, and shares issued by SRE were publicly offered (collectively, the “Sale”). Sony’s ownership of SRE’s total shares, which was 56.3% before the Sale, has decreased to 44.5% after the Sale. As a result, SRE has become an affiliate accounted for under the equity method of Sony Corporation. In connection with the Sale, Sony recorded a gain of 17,266 million yen, which consisted of both a remeasurement gain based on fair value for the shares Sony continues to hold after the Sale, and a realized gain for the sold shares, in other operating (income) loss, net in the consolidated statements of income for the fiscal year ended March 31, 2020.
F-14
Consolidated Results for the Fiscal Year Ended March 31, 2020
| (Billions of yen, except per share amounts) | ||||||||||||
| Fiscal Year ended March 31 | ||||||||||||
| 2019 | 2020 | Change | ||||||||||
Sales and operating revenue | ¥ | 8,665.7 | ¥ | 8,259.9 | ¥ | -405.8 | ||||||
Operating income | 894.2 | 845.5 | -48.8 | |||||||||
Income before income taxes | 1,011.6 | 799.5 | -212.2 | |||||||||
| Net income attributable to Sony Corporation’s stockholders | 916.3 | 582.2 | -334.1 | |||||||||
| Net income attributable to Sony Corporation’s stockholders per share of common stock: | ||||||||||||
- Basic | ¥ | 723.41 | ¥ | 471.64 | -251.77 | |||||||
- Diluted | 707.74 | 461.23 | -246.51 | |||||||||
| (Billions of yen, except per share amounts) | ||||||||||||
| Fiscal Year ended March 31 | ||||||||||||
| For all segments excluding the Financial Services segment | 2019 | 2020 | Change | |||||||||
| Net cash provided by operating activities | ¥ | 753.4 | ¥ | 762.9 | + 9.4 | |||||||
| Net cash used in investing activities | (520.4 | ) | (363.1 | ) | + 157.3 | |||||||
| Total | 233.1 | 399.8 | +166.7 | |||||||||
The average foreign exchange rates during the fiscal years ended March 31, 2019 and 2020 are presented below.
| Fiscal Year ended March 31 | |||||||||
| 2019 | 2020 | Change | |||||||
| The average rate of yen | |||||||||
| 1 U.S. dollar | ¥ | 110.9 | ¥ | 108.7 | 2.2 yen appreciation | ||||
| 1 Euro | 128.5 | 120.8 | 7.7 yen appreciation | ||||||
Sales and operating revenue (“Sales”) decreased 405.8 billion yen (5%) compared to the previous fiscal year (“year-on-year”) to 8 trillion 259.9 billion yen. On a constant currency basis, sales decreased approximately 3% year-on-year mainly due to significant decreases in sales in the Electronics Products & Solutions (“EP&S”) and the Game & Network Services (“G&NS”) segments, partially offset primarily by a significant increase in sales in the Imaging & Sensing Solutions (“I&SS”) segment. For further details about the impact of foreign exchange rate fluctuations on sales and operating income (loss), see Note on page 8. Sales in the current fiscal year also included 7.9 billion yen in patent royalty revenue resulting from the signing of a licensing agreement, recorded within Corporate and elimination.
Operating income decreased 48.8 billion yen year-on-year to 845.5 billion yen. This decrease was primarily due to significant decreases in operating income in the Music and G&NS segments, partially offset by significant increases in operating income mainly in the I&SS segment and All Other. Operating income for the current fiscal year as well as the previous fiscal year included the following factors:
Factors included in the current fiscal year operating income:
・ | Remeasurement and realized gains resulting from the public listing and sale of a portion of shares of SRE Holdings Corporation: 17.3 billion yen (All Other) |
・ | Realized and remeasurement gains resulting from the transfer of a portion of shares of NSF Engagement Corporation: 6.3 billion yen (Corporate and elimination) |
Factors included in the previous fiscal year operating income:
・ | Remeasurement gain resulting from Sony’s acquisition of the remaining approximately 60% equity interest in DH Publishing, L.P. (“EMI”), which owned and managed EMI Music Publishing: 116.9 billion yen (Music segment) |
・ | Impairment charge against long-lived assets: 19.2 billion yen (EP&S segment) |
・ | Impairment charge against long-lived assets and goodwill: 12.9 billion yen (All Other) |
1
During the current fiscal year, restructuring charges, net, decreased 8.1 billion yen year-on-year to 25.0 billion yen, primarily due to a year-on-year decrease in restructuring expenses in the Pictures segment. This amount is recorded as an operating expense included in the above-mentioned operating income.
Equity in net income (loss) of affiliated companies, recorded within operating income, was income of 9.6 billion yen, compared to a loss of 3.0 billion yen in the previous fiscal year. This improvement was mainly due to the absence of the 11.6 billion yen recording of equity in net loss for EMI, mainly due to expenses relating to warrants and management equity plans in connection with Sony’s acquisition of the remaining approximately 60% equity interest in EMI, recorded in the Music segment in the previous fiscal year.
The net effect of other income and expenses was an expense of 46.0 billion yen, compared to income of 117.4 billion yen in the previous fiscal year. This was mainly due to the absence of the 117.8 billion yen realized and unrealized gains resulting from the public listing and sale of certain shares of Spotify Technology S.A. (“Spotify”) recorded in the previous fiscal year, as well as the recording of a loss on equity securities, net, in the current fiscal year and a year-on-year increase in net foreign exchange losses.
Income before income taxes decreased 212.2 billion yen year-on-year to 799.5 billion yen.
During the current fiscal year, Sony recorded 177.2 billion yen of income tax expense, resulting in an effective tax rate of 22.2%, which was higher than the effective tax rate of 4.5% in the previous fiscal year. This higher effective tax rate was mainly due to the previous fiscal year’s reversal of 154.2 billion yen of valuation allowances against a significant portion of the deferred tax assets in the U.S. consolidated tax group and not recording income tax expense on the remeasurement gain for the equity interest in EMI.
In the Quarterly Financial Statements for the Third Quarter Ended December 31, 2019, Sony stated that as of March 31, 2019, it had an approximately 350 billion yen valuation allowance recorded against its Japan national net deferred tax assets attributable to Sony Corporation and its national tax filing group in Japan, and that it was reasonably possible that more than 50% of this valuation allowance could be reversed in the near future. However, as the spread of the Coronavirus Disease 2019 (“COVID-19”) has heightened uncertainties in regards to Sony’s future earnings forecast, the reversal of the valuation allowance was not realized in the fiscal year ended March 31, 2020.
Net income attributable to Sony Corporation’s stockholders, which deducts net income attributable to noncontrolling interests, decreased 334.1 billion yen year-on-year to 582.2 billion yen.
Cash Flows
For Consolidated Statements of Cash Flows, charts showing Sony’s cash flow information for all segments, all segments excluding the Financial Services segment and the Financial Services segment alone, please refer to pages F-5 and F-12.
Operating Activities: During the current fiscal year, there was a net cash inflow of 1 trillion 349.7 billion yen from operating activities, an increase of 91.0 billion yen year-on-year.
For all segments excluding the Financial Services segment, there was a net cash inflow of 762.9 billion yen, an increase of 9.4 billion yen year-on-year. This increase was primarily due to an increase in net income after taking into account non-cash adjustments (including depreciation and amortization, other operating (income) expense, net and (gain) loss on securities investments, net, as well as the impact of the reversal of valuation allowances against deferred tax assets in Sony Americas Holdings Inc. and its U.S. consolidated tax group in the previous fiscal year) as well as a larger year-on-year decrease in notes and accounts receivable, trade and contract assets. This increase in net cash inflow was partially offset by the negative impact of a decrease in accounts payable, trade compared to an increase in the previous fiscal year.
The Financial Services segment had a net cash inflow of 604.2 billion yen, an increase of 82.6 billion yen year-on-year. This increase was primarily due to a year-on-year increase in net income after taking into account non-cash adjustments such as depreciation and amortization, including amortization of deferred insurance acquisition costs and contract costs.
2
Investing Activities: During the current fiscal year, Sony used 1 trillion 352.3 billion yen of net cash in investing activities, an increase of 44.8 billion yen year-on-year.
For all segments excluding the Financial Services segment, there was a net cash outflow of 363.1 billion yen, a decrease of 157.3 billion yen year-on-year. This decrease was mainly due to the cash inflow from the sale of all of Sony’s shares of Olympus Corporation, as well as the absence of payment for the purchase of the approximately 60% equity interest of EMI that occurred in the previous fiscal year. This decrease in net cash outflow was partially offset by an increase in payments for purchases of fixed assets. Additionally, the previous fiscal year included net cash inflow resulting from the sale of certain shares of Spotify.
The Financial Services segment used 989.1 billion yen of net cash in investing activities, an increase of 202.0 billion yen year on year. This increase was mainly due to a year-on-year increase in payments for investments and advances carried out at Sony Life Insurance Co., Ltd. (“Sony Life”).
Financing Activities: Net cash inflow from financing activities during the current fiscal year was 65.7 billion yen, compared to net cash outflow of 122.9 billion yen in the previous fiscal year.
For all segments excluding the Financial Services segment, there was a 377.1 billion yen net cash outflow, a decrease of 144.0 billion yen year-on-year. This decrease was mainly due to the year-on-year decrease in the redemption of straight bonds and the repayment of long-term debt, as well as funds raised through the issuance of straight bonds in October 2019, partially offset by a payment related to the repurchase of shares of Sony’s own common stock (33,059,200 shares for a total purchase price of 200.0 billion yen) which was approved at the meeting of its Board of Directors held on May 16, 2019.
In the Financial Services segment, there was a 425.3 billion yen net cash inflow, an increase of 43.4 billion yen year on year. This increase was primarily due to an increase in short-term borrowings at Sony Life.
Total Cash and Cash Equivalents: Accounting for the above factors and the effect of fluctuations in foreign exchange rates, the total outstanding balance of cash and cash equivalents at March 31, 2020 was 1 trillion 512.4 billion yen. Cash and cash equivalents of all segments excluding the Financial Services segment was 962.3 billion yen at March 31, 2020, an increase of 1.8 billion yen compared with the balance as of March 31, 2019. Within the Financial Services segment, the outstanding balance of cash and cash equivalents was 550.0 billion yen at March 31, 2020, an increase of 40.4 billion yen compared with the balance as of March 31, 2019.
Liquidity Management
For Consolidated Balance Sheets and Condensed Balance Sheets for all segments, all segments excluding the Financial Services segment and the Financial Services segment alone, please refer to pages F-1 and F-10. Below is a discussion of Sony’s consolidated operations excluding the Financial Services segment, which secures liquidity on its own.
In order to reliably procure capital even when financial markets are in turmoil, Sony has managed its balance sheet with a high degree of financial discipline while closely monitoring its credit ratings. As of March 31, 2020, Sony maintained a strong financial foundation with an equity ratio of 42.8% excluding the Financial Services segment.
Sony has established a global cash management system to ensure liquidity. The total outstanding balance of cash and cash equivalents for consolidated Sony excluding the Financial Services segment at March 31, 2020 was 962.3 billion yen, which Sony considers a sufficient amount of cash on hand. In addition, as of April 1, 2020, Sony had approximately 570 billion yen in committed lines of credit from major banking institutions inside and outside of Japan, as well as an approximately 1 trillion yen commercial paper facility, none of which were being utilized as of May 13, 2020. Thus, Sony believes that it has sufficient liquidity.
Even in adverse conditions like the current severe deterioration in the economic environment, Sony is continuing to conduct business without significant overall disruption and believes that it has built a strong financial base that enables it to proactively take advantage of any growth opportunities that present themselves.
* * * * *
3
Outlook for the Fiscal Year Ending March 31, 2021
As uncertainties caused by the spread of COVID-19 have hindered Sony’s ability to reasonably forecast its future earnings, the forecast for both consolidated and business segment results for the fiscal year ending March 31, 2021 is currently undetermined. When it becomes possible to make a reasonable estimate, Sony will make an announcement in a timely manner.
* * * * *
Business Segment Information and Current View Regarding the Impact of the Spread of COVID-19
“Sales and operating revenue” in each business segment represents sales and operating revenue recorded before intersegment transactions are eliminated. “Operating income (loss)” in each business segment represents operating income (loss) reported before intersegment transactions are eliminated and excludes unallocated corporate expenses. For details regarding each segment’s product categories, please refer to page F-9.
| (Billions of yen) | ||||||||
March 31, 2019 Results | March 31, 2020 Results | |||||||
Game & Network Services (G&NS) | ||||||||
Sales and operating revenue | ¥ | 2,310.9 | ¥ | 1,977.6 | ||||
Operating income | 311.1 | 238.4 | ||||||
Music | ||||||||
Sales and operating revenue | 807.5 | 849.9 | ||||||
Operating income | 232.5 | 142.3 | ||||||
Pictures | ||||||||
Sales and operating revenue | 986.9 | 1,011.9 | ||||||
Operating income | 54.6 | 68.2 | ||||||
Electronics Products & Solutions (EP&S)* | ||||||||
Sales and operating revenue | 2,320.6 | 1,991.3 | ||||||
Operating income | 76.5 | 87.3 | ||||||
Imaging & Sensing Solutions (I&SS)** | ||||||||
Sales and operating revenue | 879.3 | 1,070.6 | ||||||
Operating income | 143.9 | 235.6 | ||||||
Financial Services | ||||||||
Financial services revenue | 1,282.5 | 1,307.7 | ||||||
Operating income | 161.5 | 129.6 | ||||||
All Other, Corporate and elimination | ||||||||
Operating loss | (85.8 | ) | (55.9 | ) | ||||
Consolidated | ||||||||
Sales and operating revenue | 8,665.7 | 8,259.9 | ||||||
Operating income | 894.2 | 845.5 | ||||||
* Sony realigned its business segments from the first quarter of the fiscal year ended March 31, 2020 to reflect modifications to the organizational structure of certain segments and a change in the Senior Executives in charge of certain segments as of April 1, 2019. In connection with this decision, the former Home Entertainment & Sound, Imaging Products & Solutions and Mobile Communications segments have been realigned as the Electronics Products & Solutions (EP&S) segment. The sales and operating income (loss) of each segment for the fiscal year ended March 31, 2019 have been reclassified to conform to the presentation for the fiscal year ended March 31,2020.
** The former Semiconductors segment has been renamed the Imaging & Sensing Solutions (I&SS) segment effective from the first quarter of the fiscal year ended March 31, 2020.
4
Conditions at Sony’s Manufacturing Plants Resulting from the Spread of COVID-19
Sony has four manufacturing plants located in China (two in Shanghai, one in Wuxi, Jiangsu, and one in Huizhou, Guangdong). All of these plants were shut down in accordance with local government mandates, from the beginning of the spring holidays on January 24 until February 9. From February 10, all four plants have re-started operations in increments. Supply chain issues remain, but operations are returning to the level they were before the spread of the virus. In accordance with a mandate by the local government, Sony shut down both of its in-house manufacturing plants in Malaysia (Kuala Lumpur and Penang) from March 18. From April 16, Sony partially re-started its Malaysia manufacturing operations after receiving approval from local authorities. Sony shut down its manufacturing plant in the U.K. (Wales) from March 26 in accordance with a mandate from the local government. From March 31, Sony partially re-started its U.K. manufacturing operations after receiving approval from local authorities under certain conditions. Business has been impacted by factors such as restrictions on the movement of people across national borders, making it difficult for Sony to send engineers to manufacturing hubs such as China and countries in Southeast Asia for the purpose of helping with new product launches or giving instructions on manufacturing.
Game & Network Services
Results for the fiscal year ended March 31, 2020
Sales decreased 333.3 billion yen (14%) year-on-year to 1 trillion 977.6 billion yen (a 12% decrease on a constant currency basis). This significant decrease was primarily due to a decrease in PlayStation®4 (“PS4”) hardware sales and game software sales, as well as the impact of foreign exchange rates, partially offset by an increase in sales for PlayStation®Plus (“PS Plus”).
Operating income decreased 72.7 billion yen year-on-year to 238.4 billion yen. This significant decrease was primarily due to the impact of the above-mentioned decrease in game software sales and the negative impact of foreign exchange rates, partially offset by the above-mentioned increase in sales for PS Plus and cost reductions. During the current fiscal year, there was a 12.2 billion yen negative impact from foreign exchange rate fluctuations.
Current View Regarding the Impact on the Business from the Spread of COVID-19
Although there has been a slight impact on production of PS4 hardware due to issues in the component supply chain, demand in the short-term is being addressed with current inventory and sales are trending well. Sales of game software that is downloaded from the network, as well as PS Plus and PlayStation Now (PS Now) subscriber numbers have significantly increased. Regarding the launch of PlayStation®5, although factors such as employees working from home and restrictions on international travel have presented some challenges in regards to part of the testing process and the qualification of production lines, development is progressing with the launch of the console scheduled for the 2020 holiday season. At this point in time major problems have not arisen in the game software development pipeline for Sony’s own first-party studios or its partners’ studios.
Music
On November 14, 2018, Sony acquired the entirety of the approximately 60% equity interest held by the investor consortium led by Mubadala Investment Company in EMI, resulting in EMI becoming a wholly-owned subsidiary of Sony. Financial results of EMI included in the Music segment for the fiscal year ended March 31, 2019 include equity earnings (loss) from April 1 through November 13, 2018 and sales and operating income (loss) from November 14, 2018 through March 31, 2019. Sales and operating income (loss) for the Music segment in the fiscal year ended March 31, 2020 include the financial results of EMI from April 1, 2019 onward.
The Music segment results include the yen-translated results of Sony Music Entertainment (“SME”), Sony/ATV Music Publishing (“Sony/ATV”) and EMI, all U.S.-based operations which aggregate the results of their worldwide subsidiaries on a U.S. dollar basis, and the results of Sony Music Entertainment (Japan) Inc., a Japan-based music company which aggregates its results in yen.
Results for the fiscal year ended March 31, 2020
Sales increased 42.4 billion yen (5%) year-on-year (a 7% increase on a constant currency basis) to 849.9 billion yen. This increase in sales was primarily due to higher sales for Music Publishing resulting from the consolidation of EMI, as well as higher sales for Recorded Music primarily due to an increase in streaming revenues, partially offset by lower Visual Media and Platform sales primarily due to lower sales for Fate/Grand Order, a mobile game application.
5
Operating income decreased 90.1 billion yen year-on-year to 142.3 billion yen. This significant decrease in operating income was primarily due to the absence of the recording of a 116.9 billion yen remeasurement gain resulting from the consolidation of EMI in the previous fiscal year, partially offset by the absence of the 11.6 billion yen recording of equity in net loss resulting from Sony’s acquisition of the remaining approximately 60% equity interest in EMI in the previous fiscal year, as well as the impact of the above-mentioned increase in sales.
Current View Regarding the Impact on the Business from the Spread of COVID-19
Around the world, but especially in the U.S., the release of new music is being delayed primarily due to some artists being unable to record songs and music videos. The impact on profitability from the delays in new music is limited at this time in the U.S. and other countries where the proportion of music that is streamed is high. But in countries like Japan and Germany, where the proportion of music that is streamed is relatively low, CDs and other packaged media sales are decreasing due to restrictions on going outside. Ticket revenue, merchandising revenue and video revenue are decreasing, as concerts and other events are being postponed and cancelled in Japan and other areas. Due to a global reduction in advertising spending, revenue from advertising-supported streaming services and revenue from the licensing of music in TV commercials is decreasing. Additionally, delays in the production of motion pictures and TV shows are causing a decline in music licensing revenue.
Pictures
The results presented in Pictures are a yen-translation of the results of Sony Pictures Entertainment Inc. (“SPE”), a U.S.-based operation that aggregates the results of its worldwide subsidiaries on a U.S. dollar basis. Management analyzes the results of SPE in U.S. dollars, so discussion of certain portions of its results is specified as being on “a U.S. dollar basis.”
Results for the fiscal year ended March 31, 2020
Sales increased 25.0 billion yen (3%) year-on-year (a 5% increase on a U.S. dollar basis) to 1 trillion 11.9 billion yen. The increase in sales on a U.S. dollar basis was primarily due to higher worldwide theatrical revenues, as the current fiscal year benefitted from the strong performances of Spider-Man: Far From Home, Jumanji: The Next Level and Bad Boys for Life and higher licensing revenues for Television Productions. These increases in sales were partially offset by a decrease in sales for Media Networks primarily due to the impact of the channel portfolio review that was undertaken in the previous fiscal year.
Operating income increased 13.6 billion yen year-on-year to 68.2 billion yen. This significant increase in operating income was primarily due to the benefit of the above-mentioned channel portfolio review and higher profit margins on Motion Pictures catalog titles. These increases were partially offset by lower profitability in Television Productions due to an increase in development expenses as well as higher costs as a result of an increase in the number of new programs produced for U.S. broadcast and cable networks. Operating income was also impacted by an increase in charges related to the channel portfolio review which totaled 17.0 billion yen in the current fiscal year as compared to 12.8 billion yen in the previous fiscal year.
Current View Regarding the Impact on the Business from the Spread of COVID-19
Box office revenue has been impacted by the closure of movie theaters around the world, and Sony has not been able to release a portion of its already completed titles in theaters. Due to restrictions on peoples’ movement, the production schedules of new motion pictures and television shows by Sony are significantly delayed around the world, especially in the U.S. As a result, in Motion Pictures, theatrical revenues and revenues generated after theatrical release, including home entertainment and television licensing sales, are expected to decrease. On the other hand, digital rental and sell-through revenues for films which Sony released theatrically prior to the spread of COVID-19 have been strong. In Television Productions, revenues are beginning to be impacted by delays in the delivery of shows to TV networks and digital distribution services. Due to a global reduction in advertising spending, advertising revenue in Media Networks is decreasing significantly, especially in India.
Box office revenue has been impacted by the closure of movie theaters around the world, and Sony has not been able to release a portion of its already completed titles in theaters. Due to restrictions on peoples’ movement, the production schedules of new motion pictures and television shows by Sony are significantly delayed around the world, especially in the U.S. As a result, in Motion Pictures, theatrical revenues and revenues generated after theatrical release, including home entertainment and television licensing sales, are expected to decrease. On the other hand, digital rental and sell-through revenues for films which Sony released theatrically prior to the spread of COVID-19 have been strong. In Television Productions, revenues are beginning to be impacted by delays in the delivery of shows to TV networks and digital distribution services. Due to a global reduction in advertising spending, advertising revenue in Media Networks is decreasing significantly, especially in India.
6
Electronics Products & Solutions
Results for the fiscal year ended March 31, 2020
Sales decreased 329.4 billion yen (14%) year-on-year to 1 trillion 991.3 billion yen (a 12% decrease on a constant currency basis). This significant decrease in sales was primarily due to a decrease in unit sales of smartphones and televisions, as well as the impact of foreign exchange rates.
Operating income increased 10.8 billion yen year-on-year to 87.3 billion yen. This increase in operating income was primarily due to reductions in operating costs mainly within Mobile Communications, as well as a decrease in impairment charges against long-lived assets in Mobile Communications, partially offset by the impact of the decrease in overall segment sales and the negative impact of foreign exchange rates. During the current fiscal year, there was a 23.0 billion yen negative impact from foreign exchange rate fluctuations.
Current View Regarding the Impact on the Business from the Spread of COVID-19
Of all the businesses in the Sony Group, Sony anticipates that the EP&S segment will be most impacted from COVID-19. Of the four major manufacturing sites for Sony’s TV business, production was ceased in stages from mid-March at the in-house factory in Malaysia and at the factories Sony outsources to in Mexico and Slovakia, pursuant to local government policy. These three factories have returned to partial production, but a portion of supply continues to be unable to meet demand. In China and Thailand, the factories owned by Sony that make digital cameras and smartphones are currently operating as usual. Some partner companies in Malaysia and the Philippines who supply components to several of Sony’s businesses have reduced their operations, causing a delay in the production of some Sony products due to component shortages. Due to the closure and shutdown of retail stores globally, retail sales have decreased significantly, with the deterioration in market conditions in Europe currently being the most severe. Sony’s television business is being significantly impacted in areas like India and Vietnam, which are substantial markets for the business, as well as in Europe. Sales and profit from digital cameras are being significantly impacted by a substantial slowdown in demand around the world.
Imaging & Sensing Solutions
Results for the fiscal year ended March 31, 2020
Sales increased 191.2 billion yen (22%) year-on-year (a 24% increase on a constant currency basis) to 1 trillion 70.6 billion yen. This significant increase in sales was primarily due to a significant increase in sales of image sensors for mobile products, resulting from an improvement in product mix as well as an increase in unit sales, partially offset by the impact of foreign exchange rates.
Operating income increased 91.7 billion yen year-on-year to 235.6 billion yen. This significant increase in operating income was primarily due to the impact of the above-mentioned increase in sales, partially offset by an increase in depreciation and amortization expenses as well as in research and development expenses and the negative impact of foreign exchange rates. During the current fiscal year, there was a 18.2 billion yen negative impact from foreign exchange rate fluctuations.
Current View Regarding the Impact on the Business from the Spread of COVID-19
As of today, there has been no major impact on Sony’s manufacturing plants in Japan, which are operating as usual. Sony also understands that factory operations and supply chains at most of its major mobile customers, to whom it sells its image sensors, have been recovering. On the other hand, Sony continues to monitor the extent to which the final outlet for Sony’s products, the smartphone market, may decelerate going forward.
As of today, there has been no major impact on Sony’s manufacturing plants in Japan, which are operating as usual. Sony also understands that factory operations and supply chains at most of its major mobile customers, to whom it sells its image sensors, have been recovering. On the other hand, Sony continues to monitor the extent to which the final outlet for Sony’s products, the smartphone market, may decelerate going forward.
7
Financial Services
The Financial Services segment results include Sony Financial Holdings Inc. (“SFH”) and SFH’s consolidated subsidiaries such as Sony Life, Sony Assurance Inc., and Sony Bank Inc. (“Sony Bank”). The results of Sony Life discussed in the Financial Services segment differ from the results that SFH and Sony Life disclose separately on a Japanese statutory basis.
Results for the fiscal year ended March 31, 2020
Financial services revenue increased 25.2 billion yen (2%) year-on-year to 1 trillion 307.7 billion yen. This increase in revenue was primarily due to an increase in insurance premium revenue mainly from single premium insurance, partially offset by a deterioration in net gains and losses on investments in the separate account, both at Sony Life. Revenue at Sony Life increased 28.6 billion yen year-on-year to 1 trillion 171.7 billion yen.
Operating income decreased 31.9 billion yen year-on-year to 129.6 billion yen, due to decreases in operating income at Sony Life and Sony Bank. Operating income at Sony Life decreased 22.1 billion yen year-on-year to 123.5 billion yen, mainly due to an increase in the provision of policy reserves and a deterioration in net gains and losses on investments, primarily driven by a decline in the stock market and lower interest rates. Operating income at Sony Bank decreased due to a deterioration in valuation gains and losses on securities.
Current View Regarding the Impact on the Business from the Spread of COVID-19
Pursuant to the announcement of a state of emergency by the Japanese government, all in-person sales activity of the life planners at Sony Life has stopped since April. If these conditions persist for a long period of time, there is a possibility that the profitability of Sony Life could be negatively impacted primarily as a result of a decrease in acquisitions of new insurance policies and an increase in expenses for various provisions. It is possible that, as has occurred in the past, fluctuations in the financial market could impact the financial results of this segment.
Pursuant to the announcement of a state of emergency by the Japanese government, all in-person sales activity of the life planners at Sony Life has stopped since April. If these conditions persist for a long period of time, there is a possibility that the profitability of Sony Life could be negatively impacted primarily as a result of a decrease in acquisitions of new insurance policies and an increase in expenses for various provisions. It is possible that, as has occurred in the past, fluctuations in the financial market could impact the financial results of this segment.
* * * * *
Basic Views on Selection of Accounting Standards
Sony’s consolidated financial statements are prepared in accordance with U.S. GAAP. Sony’s business is globally diversified and Sony believes that financial statements based on U.S. GAAP contribute to smooth communication with shareholders, investors, and other stakeholders inside and outside of Japan. Sony is considering whether to adopt International Financial Reporting Standards (“IFRS”) while closely monitoring the development of new accounting standards and the stance of regulatory bodies at home and abroad.
Note
Sales on a Constant Currency Basis and Impact of Foreign Exchange Rate Fluctuations
The descriptions of sales on a constant currency basis reflect sales calculated by applying the yen’s monthly average exchange rates from the same period of the previous fiscal year to local currency-denominated monthly sales in the relevant period of the current fiscal year. For SME, Sony/ATV and EMI in the Music segment, the constant currency amounts are calculated by applying the monthly average U.S. dollar / yen exchange rates after aggregation on a U.S. dollar basis.
The Pictures segment reflects the operations of SPE, a U.S.-based operation that aggregates the results of its worldwide subsidiaries in U.S. dollars. Because of this, the description of the year-on-year change in sales for the Pictures segment represents the change on a U.S. dollar basis.
The impact of foreign exchange rate fluctuations on sales is calculated by applying the change in the yen’s periodic weighted average exchange rate for the same period of the previous fiscal year from the relevant period of the current fiscal year to the major transactional currencies in which the sales are denominated. The impact of foreign exchange rate fluctuations on operating income (loss) is calculated by subtracting from the impact on sales the impact on cost of sales and selling, general and administrative expenses calculated by applying the same major transactional currencies calculation process to cost of sales and selling, general and administrative expenses as for the impact on sales. The I&SS segment enters into its own foreign exchange hedging transactions, and the impact of those transactions is included in the impact of foreign exchange rate fluctuations on operating income (loss) for that segment. Additionally, the impact of foreign exchange hedging transactions entered into by Mobile Communications during the previous fiscal year is included in the impact of foreign exchange rate fluctuations on operating income (loss) for the EP&S segment.
This information is not a substitute for Sony’s consolidated financial statements measured in accordance with U.S. GAAP. However, Sony believes that these disclosures provide additional useful analytical information to investors regarding the operating performance of Sony.
8
Supplemental Information
Estimate of Operating Income by Business Segment for the Fiscal Year Ending March 31, 2021
As mentioned above, because the spread of COVID-19 has hindered Sony’s ability to reasonably forecast its future earnings, the forecasts for both consolidated and business segment results for the fiscal year ending March 31, 2021 are currently undetermined. However, Sony has estimated operating income for each business segment based on certain assumptions. The results of this estimation excluding the Financial Services Segment are shown in the chart below, expressed as a percentage range of the level of operating income achieved in the fiscal year ended March 31, 2020.
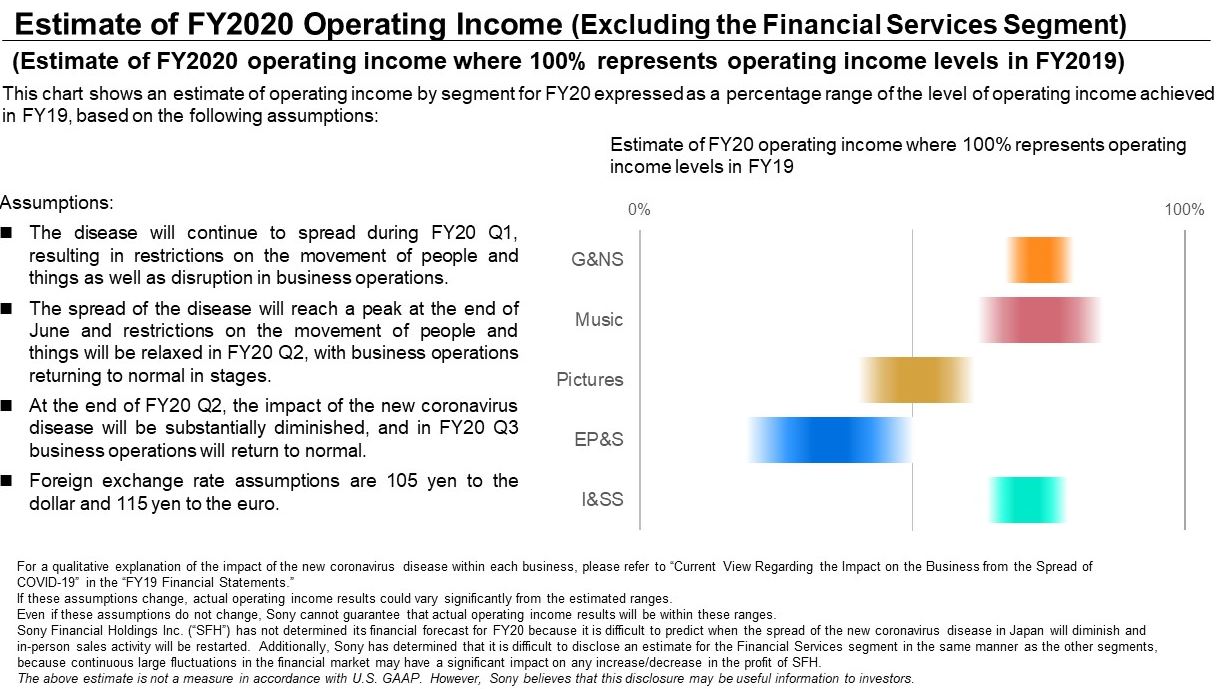
Based on these assumptions, consolidated operating income for the fiscal year ending March 31, 2021 is currently estimated to be at least 30% lower than the level achieved in the previous fiscal year.
9
Cautionary Statement
Statements made in this release with respect to Sony’s current plans, estimates, strategies and beliefs and other statements that are not historical facts are forward-looking statements about the future performance of Sony. Forward-looking statements include, but are not limited to, those statements using words such as “believe,” “expect,” “plans,” “strategy,” “prospects,” “forecast,” “estimate,” “project,” “anticipate,” “aim,” “intend,” “seek,” “may,” “might,” “could” or “should,” and words of similar meaning in connection with a discussion of future operations, financial performance, events or conditions. From time to time, oral or written forward-looking statements may also be included in other materials released to the public. These statements are based on management’s assumptions, judgments and beliefs in light of the information currently available to it. Sony cautions investors that a number of important risks and uncertainties could cause actual results to differ materially from those discussed in the forward-looking statements, and therefore investors should not place undue reliance on them. Investors also should not rely on any obligation of Sony to update or revise any forward-looking statements, whether as a result of new information, future events or otherwise. Sony disclaims any such obligation. Risks and uncertainties that might affect Sony include, but are not limited to:
(i) | Sony’s ability to maintain product quality and customer satisfaction with its products and services; |
(ii) | Sony’s ability to continue to design and develop and win acceptance of, as well as achieve sufficient cost reductions for, its products and services, including image sensors, game and network platforms, smartphones and televisions, which are offered in highly competitive markets characterized by severe price competition and continual new product and service introductions, rapid development in technology and subjective and changing customer preferences; |
(iii) | Sony’s ability to implement successful hardware, software, and content integration strategies, and to develop and implement successful sales and distribution strategies in light of new technologies and distribution platforms; |
(iv) | the effectiveness of Sony’s strategies and their execution, including but not limited to the success of Sony’s acquisitions, joint ventures, investments, capital expenditures, restructurings and other strategic initiatives; |
(v) | changes in laws, regulations and government policies in the markets in which Sony and its third-party suppliers, service providers and business partners operate, including those related to taxation, as well as growing consumer focus on corporate social responsibility; |
(vi) | Sony’s continued ability to identify the products, services and market trends with significant growth potential, to devote sufficient resources to research and development, to prioritize investments and capital expenditures correctly and to recoup its investments and capital expenditures, including those required for technology development and product capacity; |
(vii) | Sony’s reliance on external business partners, including for the procurement of parts, components, software and network services for its products or services, the manufacturing, marketing and distribution of its products, and its other business operations; |
(viii) | the global economic and political environment in which Sony operates and the economic and political conditions in Sony’s markets, particularly levels of consumer spending; |
(ix) | Sony’s ability to meet operational and liquidity needs as a result of significant volatility and disruption in the global financial markets or a ratings downgrade; |
(x) | Sony’s ability to forecast demands, manage timely procurement and control inventories; |
(xi) | foreign exchange rates, particularly between the yen and the U.S. dollar, the euro and other currencies in which Sony makes significant sales and incurs production costs, or in which Sony’s assets, liabilities and operating results are denominated; |
(xii) | Sony’s ability to recruit, retain and maintain productive relations with highly skilled personnel; |
(xiii) | Sony’s ability to prevent unauthorized use or theft of intellectual property rights, to obtain or renew licenses relating to intellectual property rights and to defend itself against claims that its products or services infringe the intellectual property rights owned by others; |
(xiv) | the impact of changes in interest rates and unfavorable conditions or developments (including market fluctuations or volatility) in the Japanese equity markets on the revenue and operating income of the Financial Services segment; |
(xv) | shifts in customer demand for financial services such as life insurance and Sony’s ability to conduct successful asset liability management in the Financial Services segment; |
(xvi) | risks related to catastrophic disasters, pandemic disease or similar events; |
(xvii) | the ability of Sony, its third-party service providers or business partners to anticipate and manage cybersecurity risk, including the risk of unauthorized access to Sony’s business information and the personally identifiable information of its employees and customers, potential business disruptions or financial losses; and |
(xviii) | the outcome of pending and/or future legal and/or regulatory proceedings. |
Risks and uncertainties also include the impact of any future events with material adverse impact. The continued impact of COVID-19 could heighten many of the risks and uncertainties noted above. Important information regarding risks and uncertainties is also set forth in Sony’s most recent Form 20-F, which is on file with the U.S. Securities and Exchange Commission.
10