Exhibit 99.1
| (NYSE:FLE) November 2006 |

| This presentation contains certain forward-looking statements and information based on the beliefs of Fleetwood’s management as well as assumptions made by, and information currently available to, Fleetwood’s management. Such statements reflect the current views of Fleetwood with respect to future events and are subject to certain risks, uncertainties, and assumptions, including risk factors identified in Fleetwood’s 10-K and other SEC filings. These risks and uncertainties include, without limitation, the lack of assurance that the Company will regain sustainable profitability in the foreseeable future; the Company’s ability to comply with financial covenants on existing debt obligations and to obtain future financing needed in order to execute its business strategies; the volatility of the Company’s stock price; the impact of ongoing weakness in the manufactured housing market and more recent weakness in the recreational vehicle market; the effect of global tensions, fuel prices, interest rates, and other factors on consumer confidence, which in turn may impact demand for Fleetwood’s products; the availability and cost of wholesale and retail financing for both manufactured housing and recreational vehicles; repurchase agreements with floorplan lenders, which could result in increased costs; the cyclical and seasonal nature of both the manufactured housing and recreational vehicle industries; potential increases in the frequency of product liability, wrongful death, class action, and other legal actions; expenses and uncertainties associated with the manufacturing, development and introduction of new products; the potential for excessive retail inventory levels in the manufactured housing and recreational vehicle industries; the highly competitive nature of our industries; and lack of acceptance of Fleetwood’s products.Actual results, events and performance may differ materially. Safe Harbor Statement |
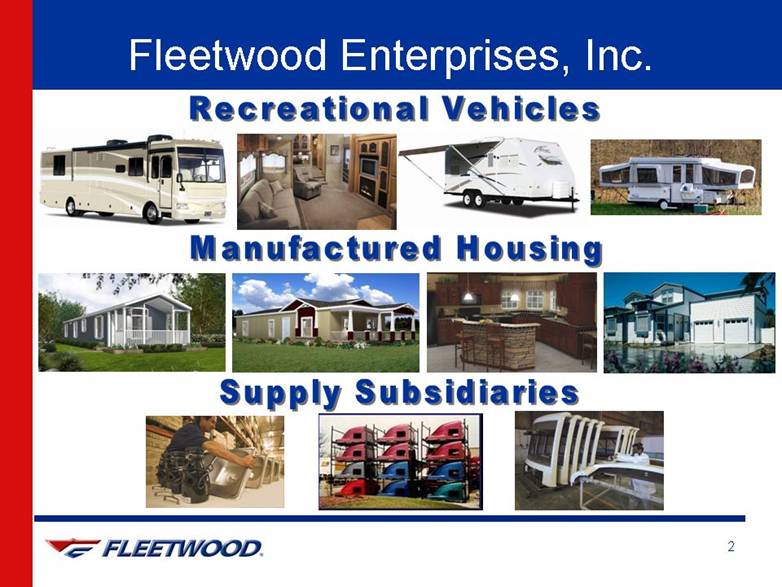
| Fleetwood Enterprises, Inc. |
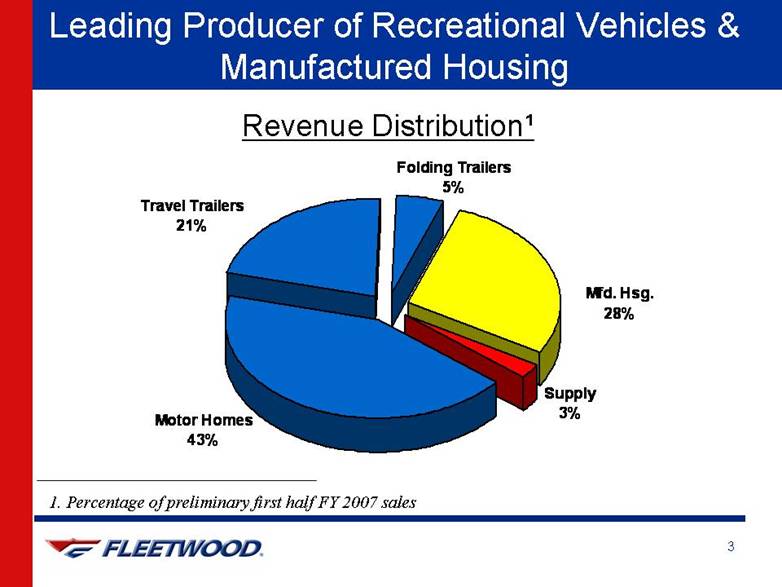
| Leading Producer of Recreational Vehicles & Manufactured Housing 1. Percentage of preliminary first half FY 2007 sales Revenue Distribution¹ Motor Homes43%Travel Trailers21%Mfd. Hsg.28%Folding Trailers5%Supply3% |
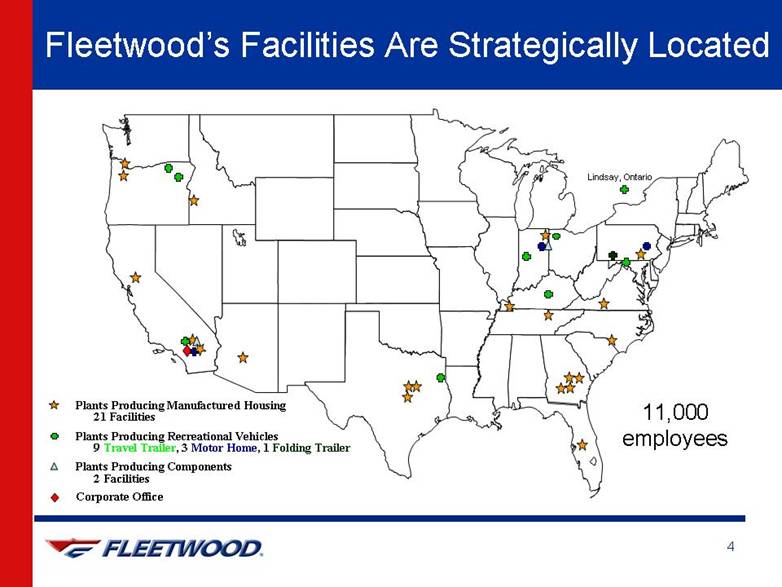
| Fleetwood’s Facilities Are Strategically Located Plants Producing Manufactured Housing 21 Facilities Plants Producing Recreational Vehicles 9 Travel Trailer, 3 Motor Home, 1 Folding Trailer Plants Producing Components 2 Facilities Corporate Office 11,000 employees |
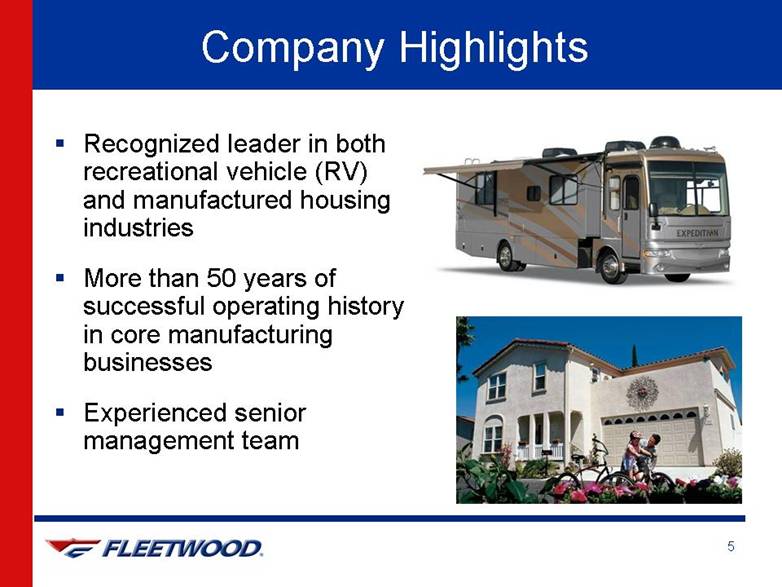
| Company Highlights Recognized leader in both recreational vehicle (RV) and manufactured housing industries More than 50 years of successful operating history in core manufacturing businesses Experienced senior management team |
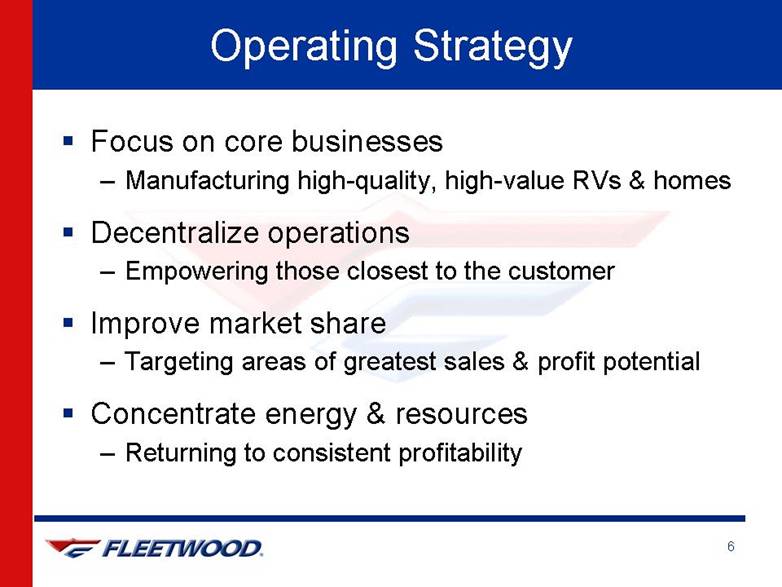
| Operating Strategy Focus on core businesses Manufacturing high-quality, high-value RVs & homes Decentralize operations Empowering those closest to the customer Improve market share Targeting areas of greatest sales & profit potential Concentrate energy & resources Returning to consistent profitability |
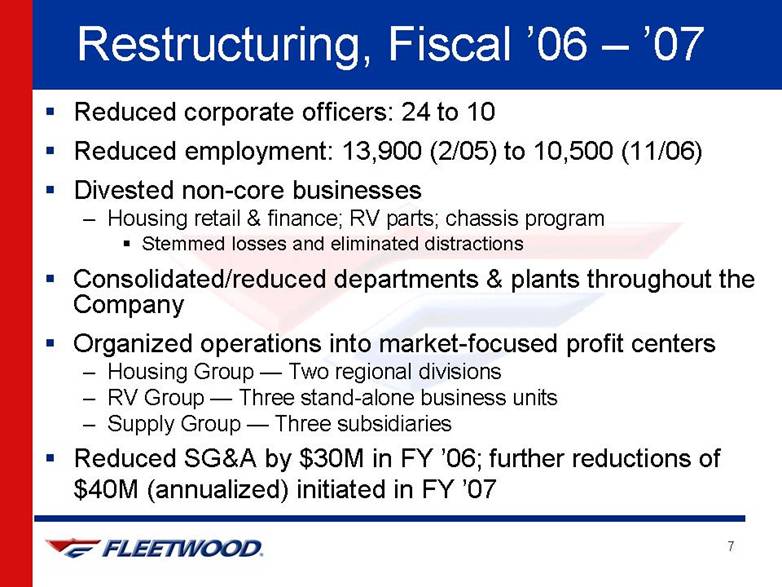
| Restructuring, Fiscal ’06 – ’07 Reduced corporate officers: 24 to 10 Reduced employment: 13,900 (2/05) to 10,500 (11/06) Divested non-core businesses Housing retail & finance; RV parts; chassis program Stemmed losses and eliminated distractions Consolidated/reduced departments & plants throughout the CompanyOrganized operations into market-focused profit centers Housing Group — Two regional divisions RV Group — Three stand-alone business units Supply Group — Three subsidiaries Reduced SG&A by $30M in FY ’06; further reductions of $40M (annualized) initiated in FY ’07 |
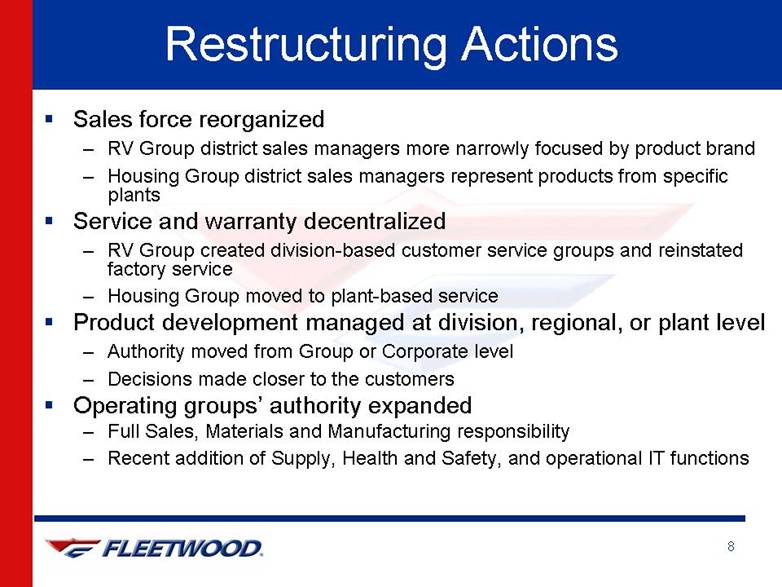
| Restructuring Actions Sales force reorganized RV Group district sales managers more narrowly focused by product brand Housing Group district sales managers represent products from specific plants Service and warranty decentralized RV Group created division-based customer service groups and reinstated factory service Housing Group moved to plant-based service Product development managed at division, regional, or plant level Authority moved from Group or Corporate level Decisions made closer to the customers Operating groups’ authority expanded Full Sales, Materials and Manufacturing responsibility Recent addition of Supply, Health and Safety, and operational IT functions |
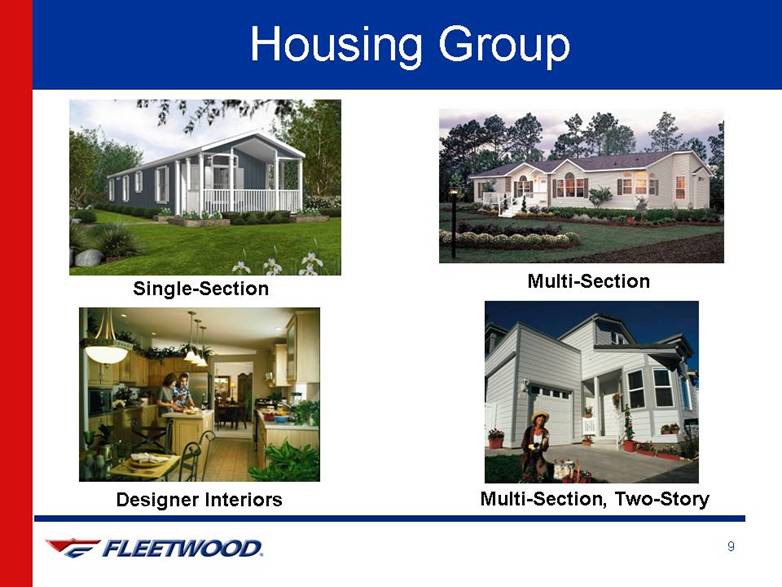
| Housing Group Single-Section Multi-Section Multi-Section, Two-Story Designer Interiors |
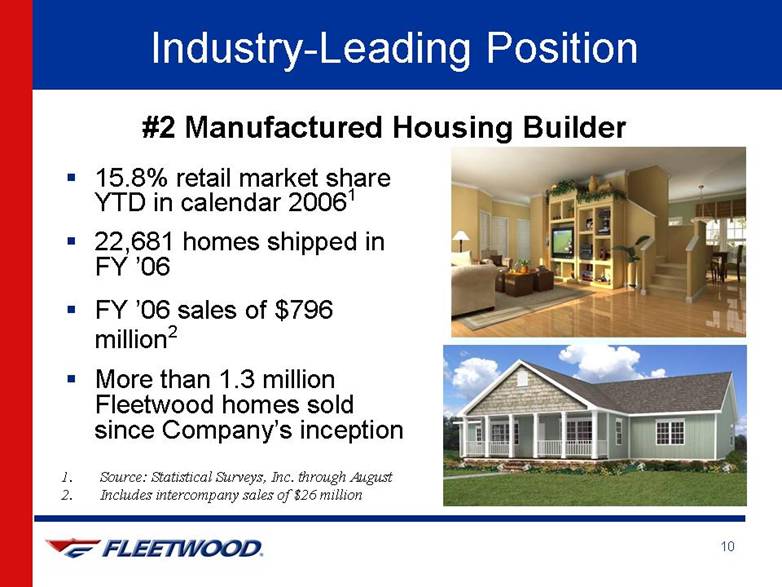
| Industry-Leading Position 15.8% retail market share YTD in calendar 20061 22,681 homes shipped in FY ’06 FY ’06 sales of $796 million2 More than 1.3 million Fleetwood homes sold since Company’s inception #2 Manufactured Housing BuilderSource: Statistical Surveys, Inc. through August Includes intercompany sales of $26 million |
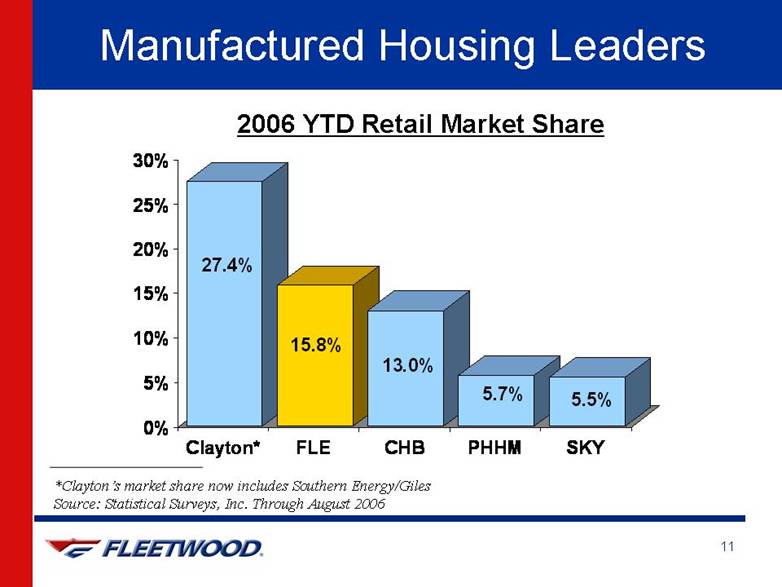
| Manufactured Housing Leaders *Clayton’s market share now includes Southern Energy/Giles Source: Statistical Surveys, Inc. Through August 20062006 YTD Retail Market Share27.4%15.8%13.0%5.7%5.5%0%5%10%15%20%25%30%Clayton*FLECHBPHHMSKY |
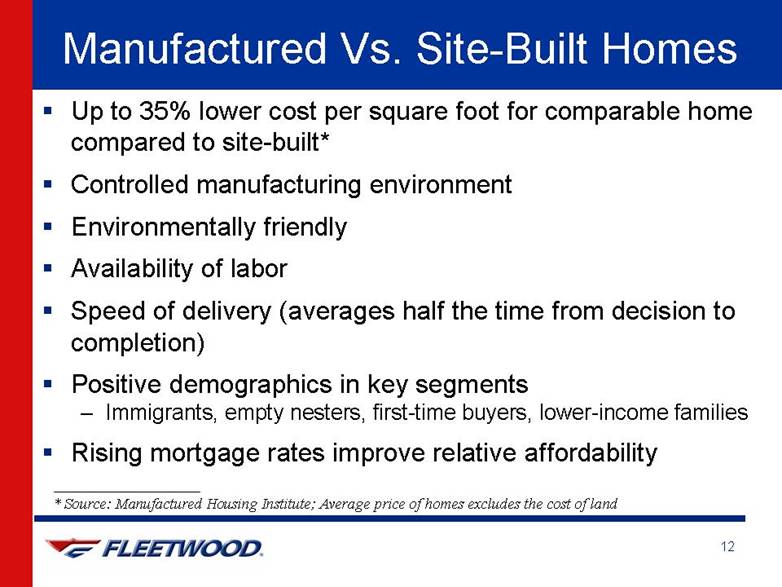
| Manufactured Vs. Site-Built Homes * Source: Manufactured Housing Institute; Average price of homes excludes the cost of land Up to 35% lower cost per square foot for comparable home compared to site-built* Controlled manufacturing environment Environmentally friendly Availability of labor Speed of delivery (averages half the time from decision to completion) Positive demographics in key segments Immigrants, empty nesters, first-time buyers, lower-income families Rising mortgage rates improve relative affordability |
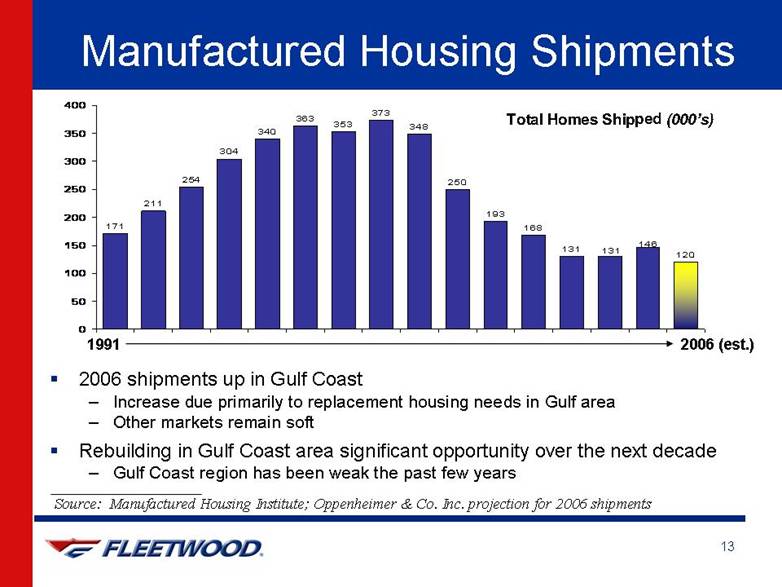
| Manufactured Housing Shipments Source: Manufactured Housing Institute; Oppenheimer & Co. Inc. projection for 2006 shipments Total Homes Shipped (000’s) 2006 shipments up in Gulf Coast Increase due primarily to replacement housing needs in Gulf area Other markets remain soft Rebuilding in Gulf Coast area significant opportunity over the next decade Gulf Coast region has been weak the past few years 1991 2006 (est.) 171211254304340363353373348250193168131120146131050100150200250300350400 |
| Foundation Set for Industry Recovery Reduced industry manufacturing capacity, retailer locations and retail inventory Repossession inventories peaked in 2003 High of 100,000+ Currently approximately 40,000 Solid demand for affordable housing Lenders gradually re-entering market |
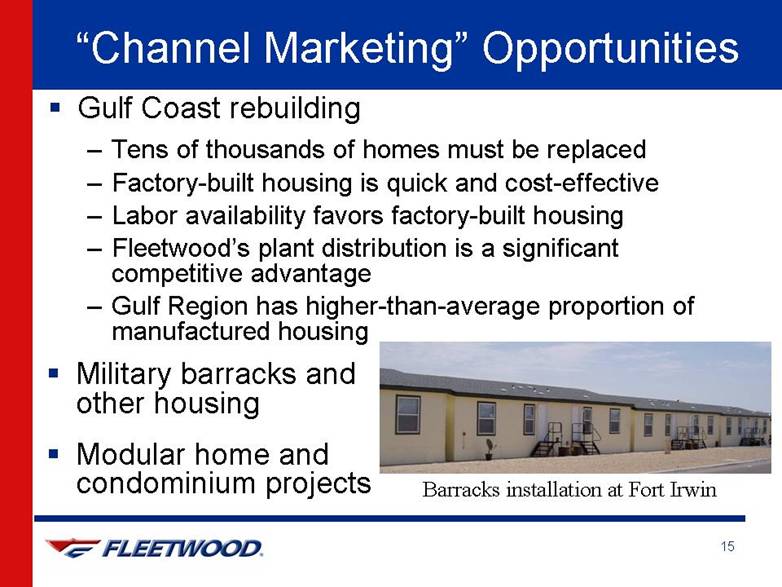
| “Channel Marketing” Opportunities Gulf Coast rebuilding Tens of thousands of homes must be replaced Factory-built housing is quick and cost-effective Labor availability favors factory-built housing Fleetwood’s plant distribution is a significant competitive advantage Gulf Region has higher-than-average proportion of manufactured housing Military barracks and other housing Modular home and condominium projects Barracks installation at Fort Irwin |
| Competitive Advantages Long-standing reputation for excellence 21 strategically located facilities Highly efficient labor force and procurement operationsAmple capacity (currently at 43% utilization) 1,200 strong, independent retailers Market diversification Strong in both multi-section and single-section markets Expanding modular presence |
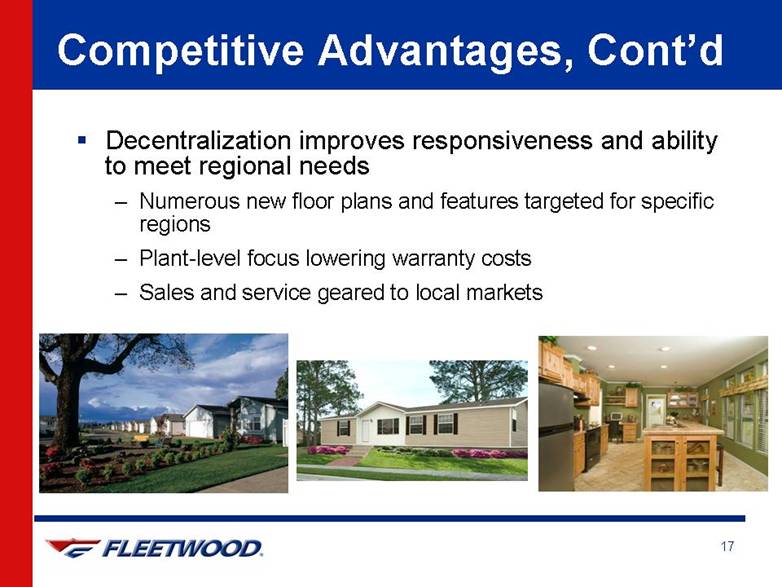
| Competitive Advantages, Cont’d Decentralization improves responsiveness and ability to meet regional needs Numerous new floor plans and features targeted for specific regions Plant-level focus lowering warranty costs Sales and service geared to local markets |
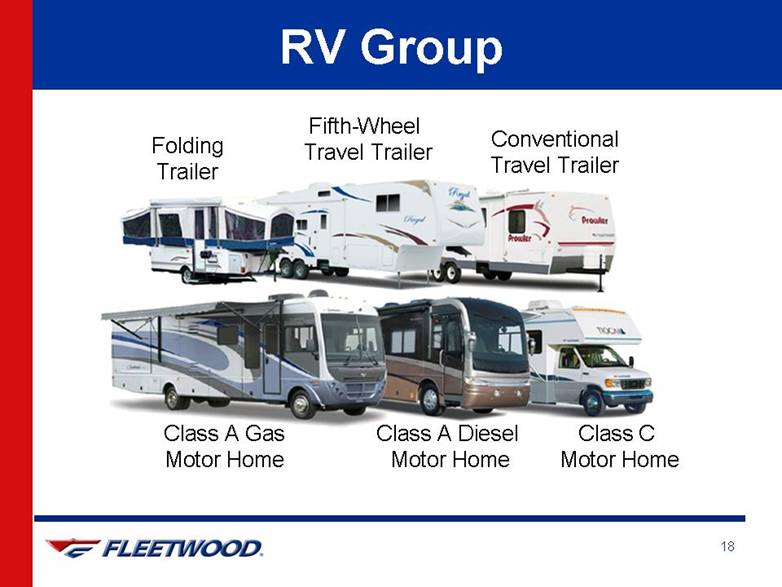
| Folding Trailer Conventional Travel Trailer Fifth-Wheel Travel Trailer Class A Gas Motor Home Class C Motor Home Class A Diesel Motor Home RV Group |
| Industry-Leading Position FY 2006 sales of $1.60 billion (second largest manufacturer in revenues); 54,574 units shippedMore than 1.7 million Fleetwood RVs sold since Company’s inception Strong, well-established dealer networks More than 1,000 independent dealers Source: Publicly available financial information |
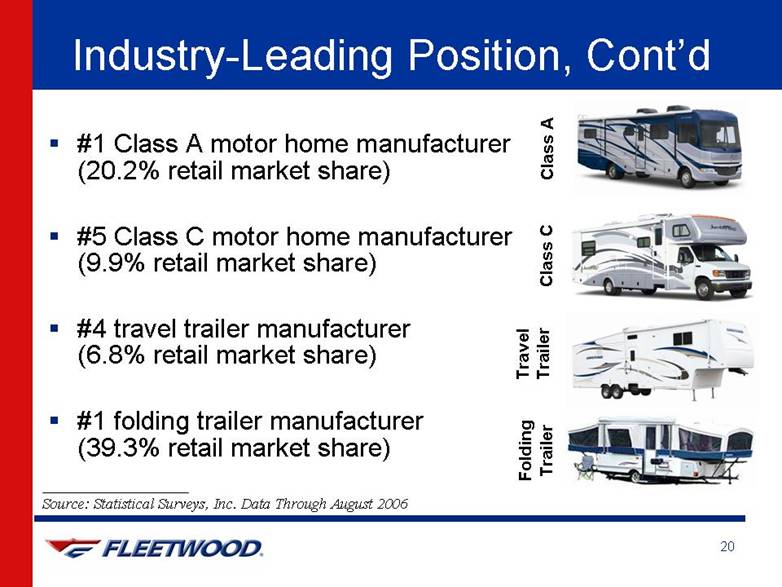
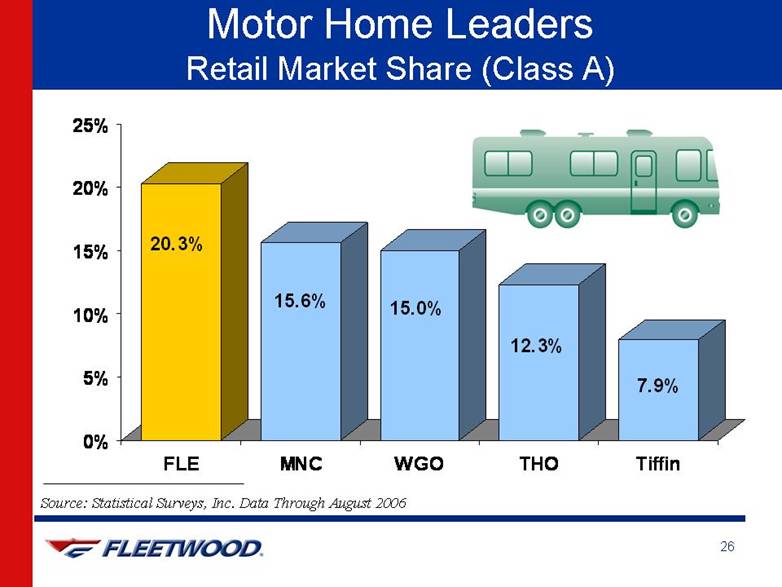
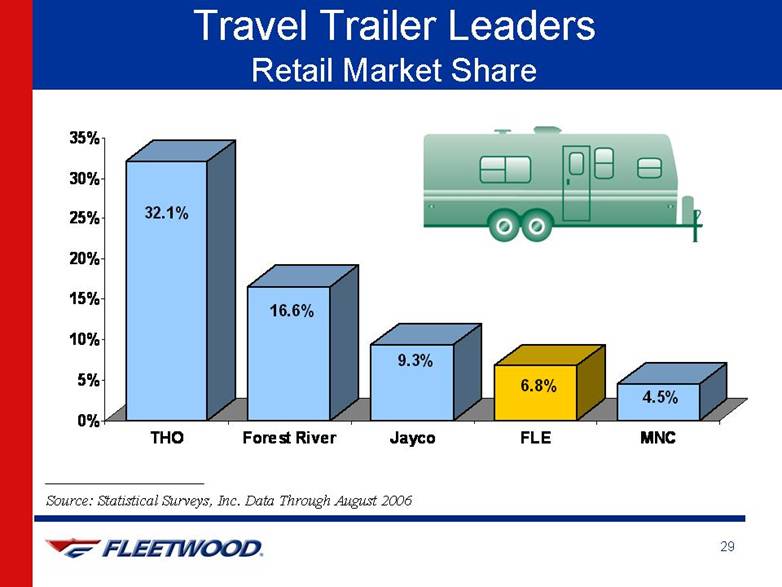
| Industry-Leading Position, Cont’d #1 Class A motor home manufacturer (20.2% retail market share) #5 Class C motor home manufacturer (9.9% retail market share) #4 travel trailer manufacturer (6.8% retail market share) #1 folding trailer manufacturer (39.3% retail market share) Source: Statistical Surveys, Inc. Data Through August 2006 Class A Class C Travel Trailer Folding Trailer |
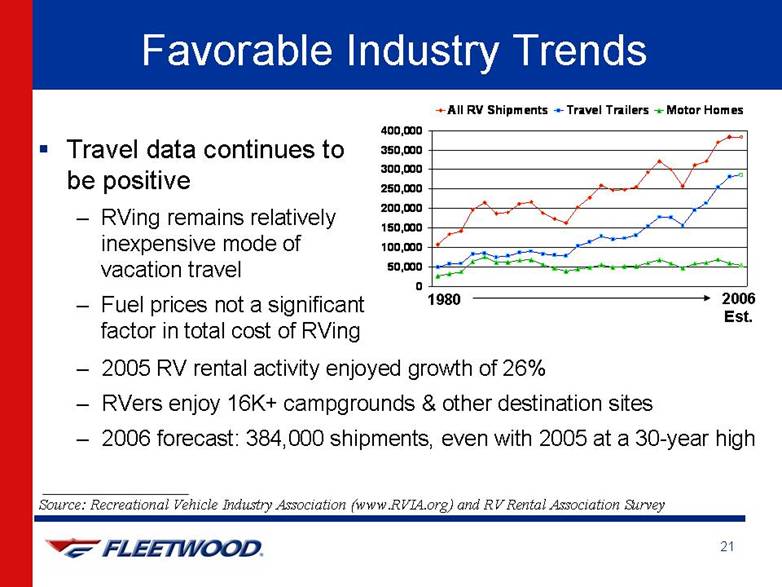
| Favorable Industry Trends Travel data continues to be positive RVing remains relatively inexpensive mode of vacation travel Fuel prices not a significant factor in total cost of RVingSource: Recreational Vehicle Industry Association (www.RVIA.org) and RV Rental Association Survey 2005 RV rental activity enjoyed growth of 26% RVers enjoy 16K+ campgrounds & other destination sites 2006 forecast: 384,000 shipments, even with 2005 at a 30-year high 1980 2006Est. 050,000100,000150,000200,000250,000300,000350,000400,000All RV ShipmentsTravel TrailersMotor Homes |
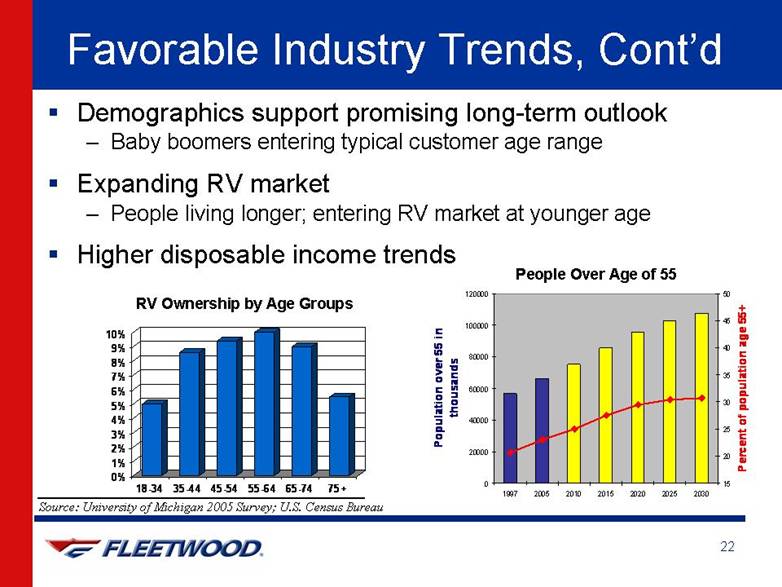
| Favorable Industry Trends, Cont’d Demographics support promising long-term outlook Baby boomers entering typical customer age range Expanding RV market People living longer; entering RV market at younger age Higher disposable income trends ___________________________ Source: University of Michigan 2005 Survey; U.S. Census Bureau People Over Age of 55RV Ownership by Age Groups0200004000060000800001000001200001997200520102015202020252030Population over 55 in thousands1520253035404550Percent of population age 55+0%1%2%3%4%5%6%7%8%9%10%18-3435-4445-5455-6465-7475+ |
| Motor Homes |

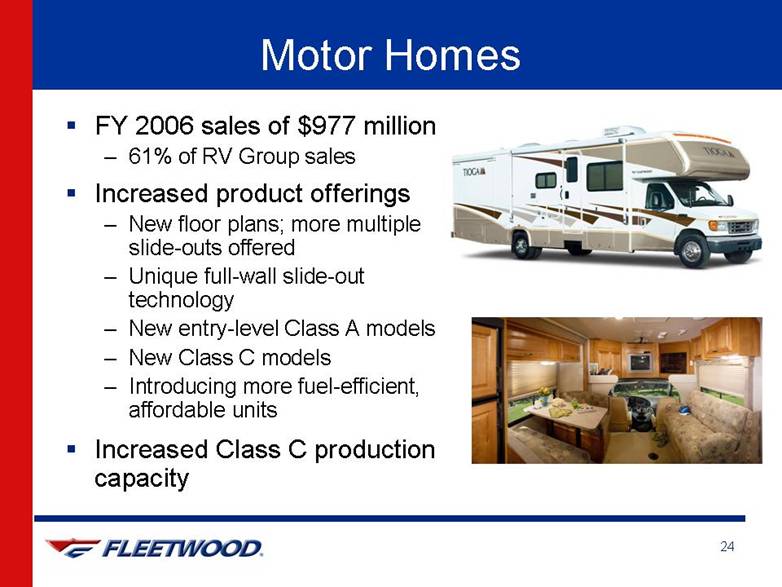
| Motor Homes FY 2006 sales of $977 million 61% of RV Group sales Increased product offerings New floor plans; more multiple slide-outs offered Unique full-wall slide-out technology New entry-level Class A models New Class C models Introducing more fuel-efficient, affordable units Increased Class C production capacity |
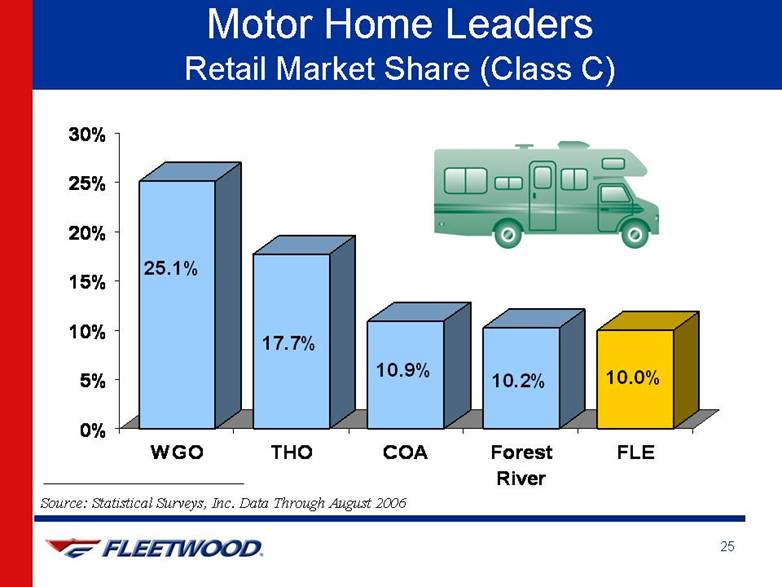
| Motor Home LeadersRetail Market Share (Class C) Source: Statistical Surveys, Inc. Data Through August 2006 25.1%17.7%10.9%10.2%10.0%0%5%10%15%20%25%30%WGOT HOCOAForestRiverFLE |
| Motor Home LeadersRetail Market Share (Class A) Source: Statistical Surveys, Inc. Data Through August 2006 20.3%15.6%15.0%12.3%7.9%0%5%10%15%20%25%FLEMNCWG OTHOTiffin |
| Travel Trailers |

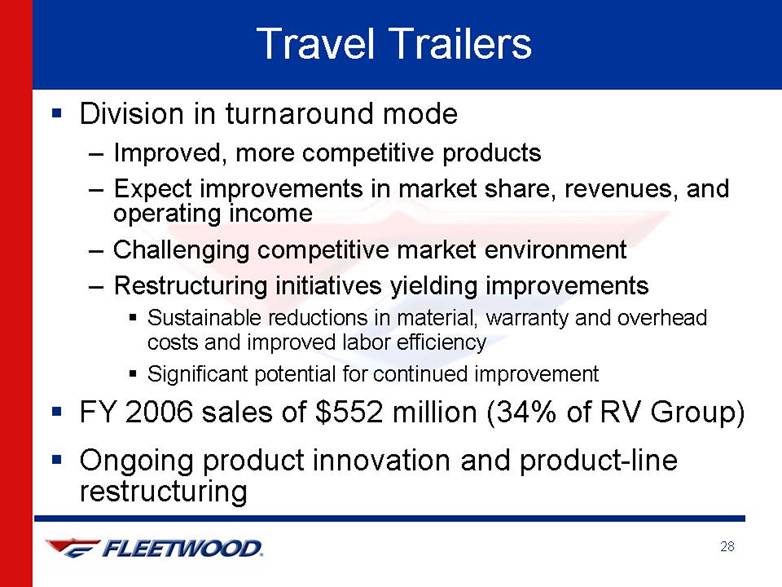
| Travel Trailers Division in turnaround mode Improved, more competitive products Expect improvements in market share, revenues, and operating income Challenging competitive market environment Restructuring initiatives yielding improvements Sustainable reductions in material, warranty and overhead costs and improved labor efficiency Significant potential for continued improvement FY 2006 sales of $552 million (34% of RV Group) Ongoing product innovation and product-line restructuring |
| Travel Trailer Leaders Retail Market Share Source: Statistical Surveys, Inc. Data Through August 2006 32.1%16.6%9.3%6.8%4.5%0%5%10%15%20%25%30%35%THOForest RiverJaycoFLEMNC |
| Folding Trailers New pictures coming from FFT |

| Folding Trailers Relatively small but important entry-level niche #1 market share position with 39% through August 2006 FY 2006 sales of $84 million (5% of RV sales) New product innovations Additional features and options More competitively priced, camping market-focused products Rationalized manufacturing process Second line added (improved efficiency) Improving but challenging market environment Source: Statistical Surveys, Inc. |
| Financial Overview |

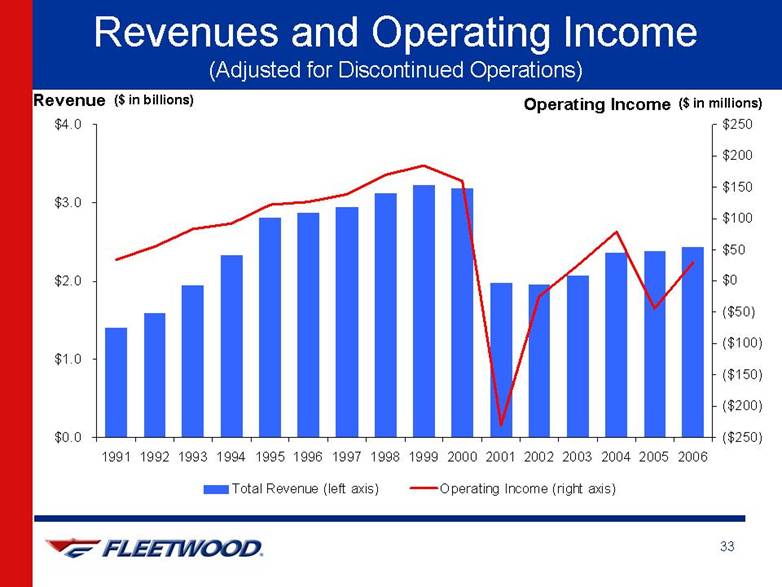
| Revenues and Operating Income(Adjusted for Discontinued Operations)Revenue Operating Income ($ in millions) ($ in billions) $0.0$1.0$2.0$3.0$4.01991199219931994199519961997199819992000200120022003200420052006($250)($200)($150)($100)($50)$0$50$100$150$200$250Total Revenue (left axis)Operating Income (right axis) |
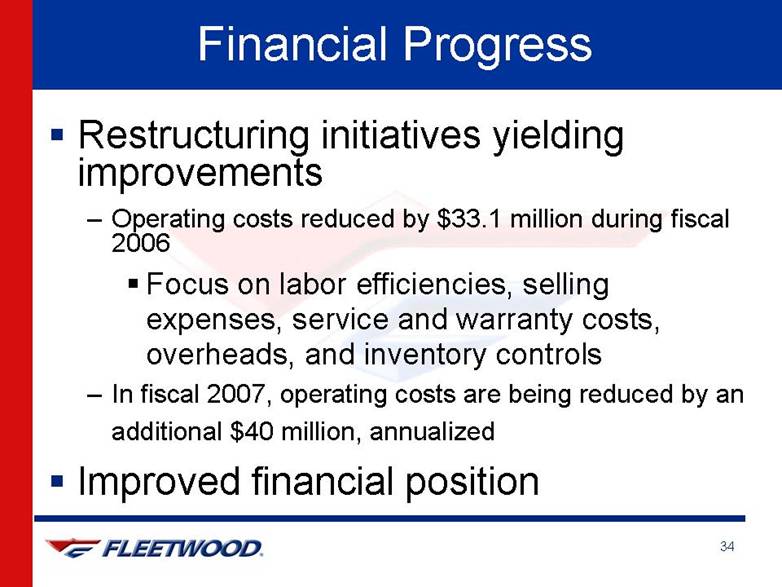
| Financial Progress Restructuring initiatives yielding improvements Operating costs reduced by $33.1 million during fiscal 2006 Focus on labor efficiencies, selling expenses, service and warranty costs, overheads, and inventory controls In fiscal 2007, operating costs are being reduced by an additional $40 million, annualizedImproved financial position |
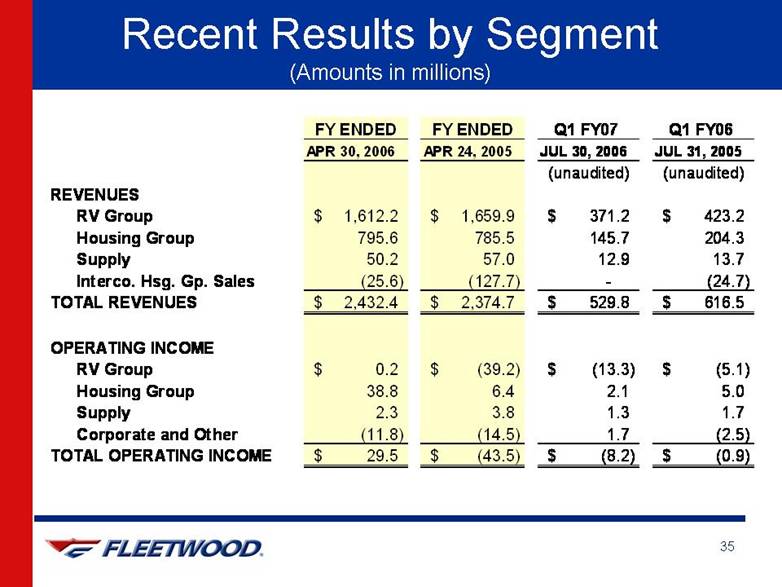
| Recent Results by Segment (Amounts in millions) FY ENDEDFY ENDEDQ1 FY07 Q1 FY06 APR 30, 2006APR 24, 2005JUL 30, 2006JUL 31, 2005(unaudited)(unaudited)REVENUESRV Group1,612.2$ 1,659.9$ 371.2$ 423.2$ Housing Group795.6785.5145.7204.3Supply50.257.012.913.7Interco. Hsg. Gp. Sales(25.6)(127.7)-(24.7)TOTAL REVENUES2,432.4$ 2,374.7$ 529.8$ 616.5$ OPERATING INCOMERV Group0.2$ (39.2)$ (13.3)$ (5.1)$ Housing Group38.86.42.15.0Supply2.33.81.31.7Corporate and Other(11.8)(14.5)1.7(2.5)TOTAL OPERATING INCOME29.5$ (43.5)$ (8.2)$ (0.9)$ |
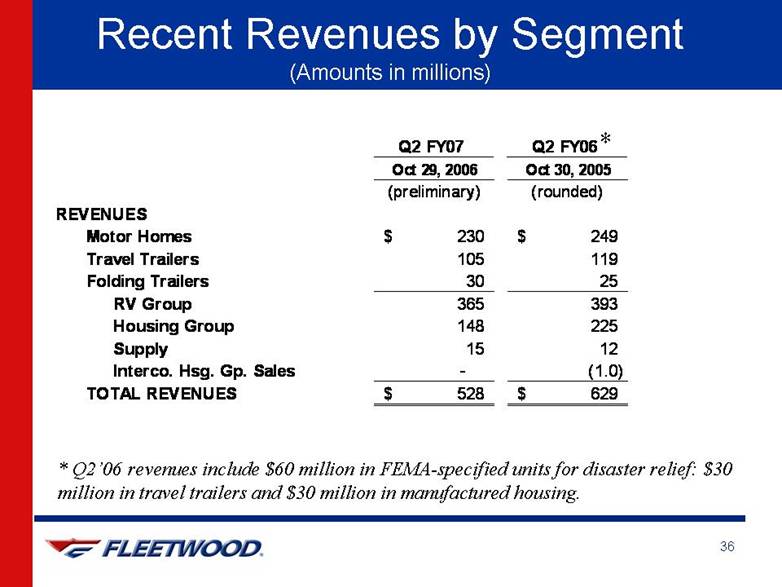
| Recent Revenues by Segment (Amounts in millions) * * Q2’06 revenues include $60 million in FEMA-specified units for disaster relief: $30 million in travel trailers and $30 million in manufactured housing. Q2 FY07 Q2 FY06 Oct 29, 2006Oct 30, 2005(preliminary)(rounded)REVENUESMotor Homes230$ 249$ Travel Trailers105119Folding Trailers3025RV Group365393Housing Group148225Supply1512Interco. Hsg. Gp. Sales-(1.0)TOTAL REVENUES528$ 629$ |
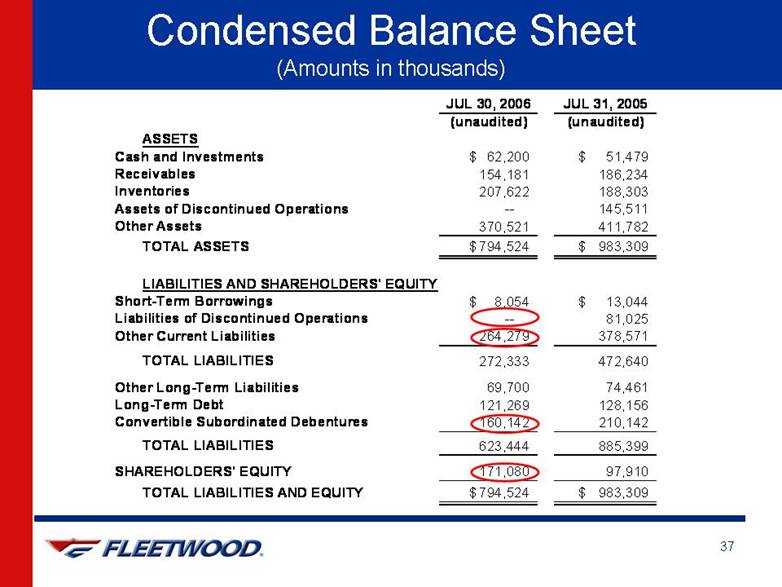
| Condensed Balance Sheet (Amounts in thousands) ASSETSCash and Investments62,200$ 51,479$ Receivables154,181186,234Inventories207,622188,303Assets of Discontinued Operations--145,511Other Assets370,521411,782TOTAL ASSETS794,524$983,309$ LIABILITIES AND SHAREHOLDERS' EQUITYShort-Term Borrowings8,054$ 13,044$ Liabilities of Discontinued Operations--81,025Other Current Liabilities264,279378,571TOTAL LIABILITIES272,333472,640Other Long-Term Liabilities69,70074,461Long-Term Debt121,269128,156Convertible Subordinated Debentures160,142210,142TOTAL LIABILITIES623,444885,399SHAREHOLDERS' EQUITY171,08097,910TOTAL LIABILITIES AND EQUITY794,524$983,309$ (unaudited)(unaudited)JUL 30, 2006JUL 31, 2005 |
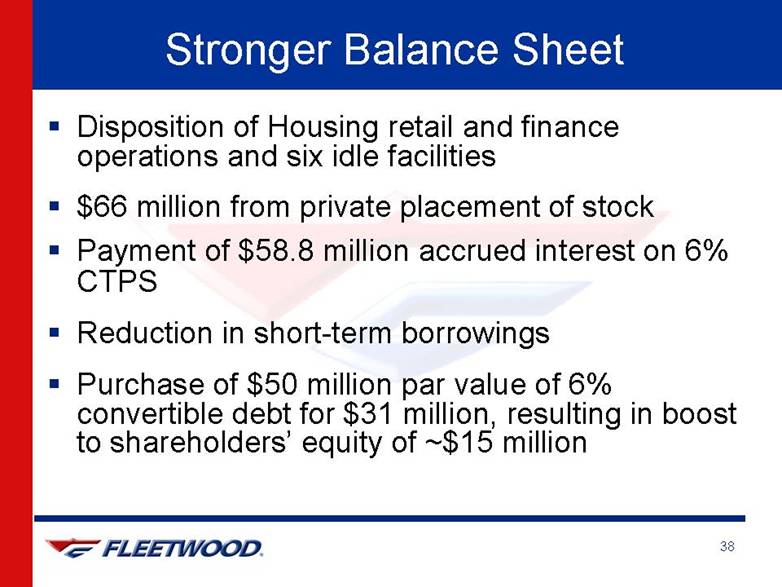
| Stronger Balance Sheet Disposition of Housing retail and finance operations and six idle facilities $66 million from private placement of stock Payment of $58.8 million accrued interest on 6% CTPS Reduction in short-term borrowings Purchase of $50 million par value of 6% convertible debt for $31 million, resulting in boost to shareholders’ equity of ~$15 million |
| Summary A leader in both the RV and manufactured housing industries, each with favorable demographic trends Focus on product innovation; quality manufacturing Improving prospects for consistent profitability Strengthened liquidity and balance sheet Upside potential as manufactured housing and RV markets turn |
| Questions? |