Exhibit 99.1
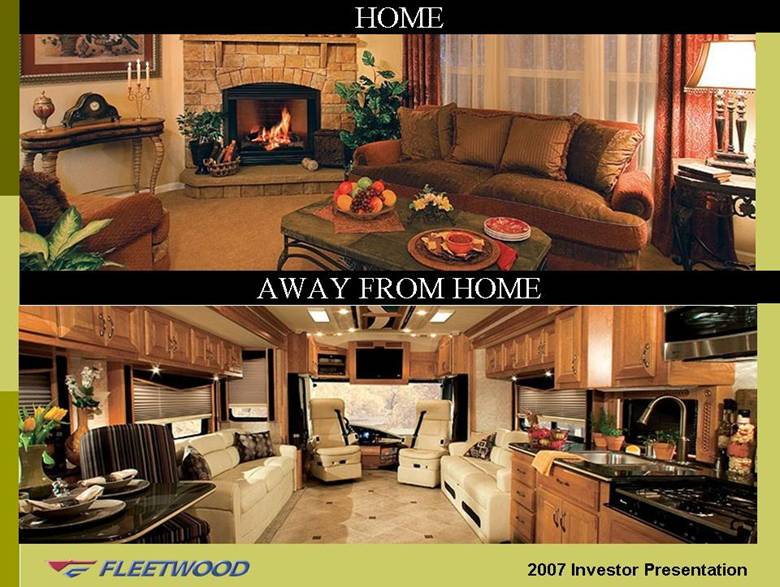
| 2007 Investor Presentation HOME AWAY FROM HOME |
| This presentation contains certain forward-looking statements and information based on the beliefs of Fleetwood’s management as well as assumptions made by, and information currently available to, Fleetwood’s management. Such statements reflect the current views of Fleetwood with respect to future events and are subject to certain risks, uncertainties, and assumptions, including risk factors identified in Fleetwood’s 10-K and other SEC filings. These risks and uncertainties include, without limitation, the lack of assurance that we will regain sustainable profitability in the foreseeable future; the effect of ongoing weakness in the manufactured housing market and more recent weakness in the recreational vehicle market; the effect of global tensions, employment statistics, volatile fuel prices, interest rates, stock market performance, availability of financing generally, and other factors that can have a negative impact on consumer confidence, which in turn may reduce demand for our products, particularly recreational vehicles; the availability and cost of wholesale and retail financing specifically for both manufactured housing and recreational vehicles; our ability to comply with financial tests and covenants on existing debt obligations; our ability to obtain the financing we will need in the future to execute our business strategies; the cyclical and seasonal nature of both the manufactured housing and recreational vehicle industries; expenses and uncertainties associated with the entry into new business segments or the manufacturing, development, and introduction of new products; the potential for excessive retail inventory levels in the manufactured housing and recreational vehicle industries; the volatility of our stock price; repurchase agreements with floorplan lenders, which could result in increased costs; potential increases in the frequency of product liability, wrongful death, class action, and other legal actions; and the highly competitive nature of our industries. Safe Harbor Statement |
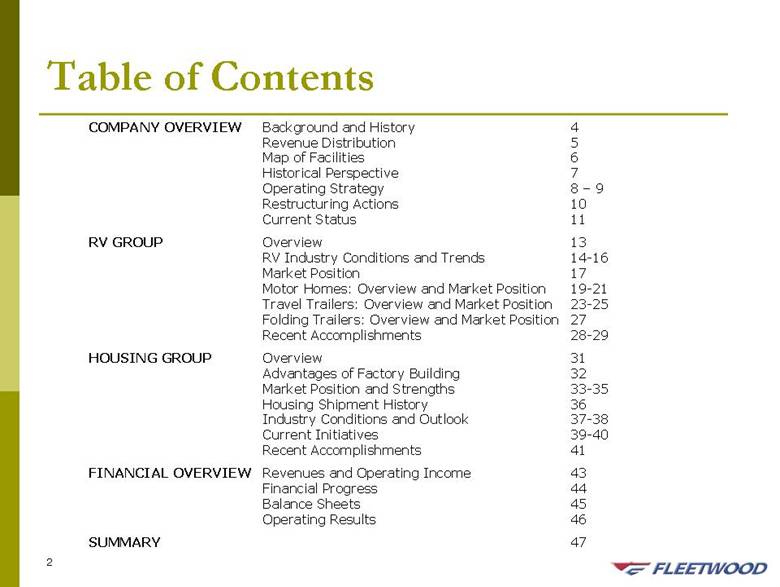
| Table of Contents COMPANY OVERVIEW Background and History 4 Revenue Distribution 5 Map of Facilities 6 Historical Perspective 7 Operating Strategy 8–9 Restructuring Actions 10 Current Status 11 RV GROUP Overview 13 RV Industry Conditions and Trends 14-16 Market Position 17 Motor Homes: Overview and Market Position 19-21 Travel Trailers: Overview and Market Position 23-25 Folding Trailers: Overview and Market Position 27 Recent Accomplishments 28-29 HOUSING GROUP Overview 31 Advantages of Factory Building 32 Market Position and Strengths 33-35 Housing Shipment History 36 Industry Conditions and Outlook 37-38 Current Initiatives 39-40 Recent Accomplishments 41 FINANCIAL OVERVIEW Revenues and Operating Income 43 Financial Progress 44 Balance Sheets 45 Operating Results 46 SUMMARY 47 |
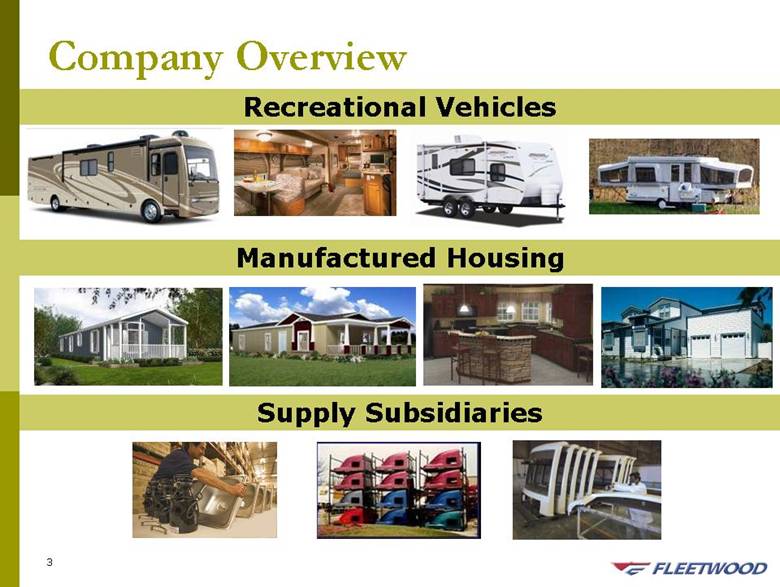
| Company Overview Manufactured Housing Recreational Vehicles Supply Subsidiaries |
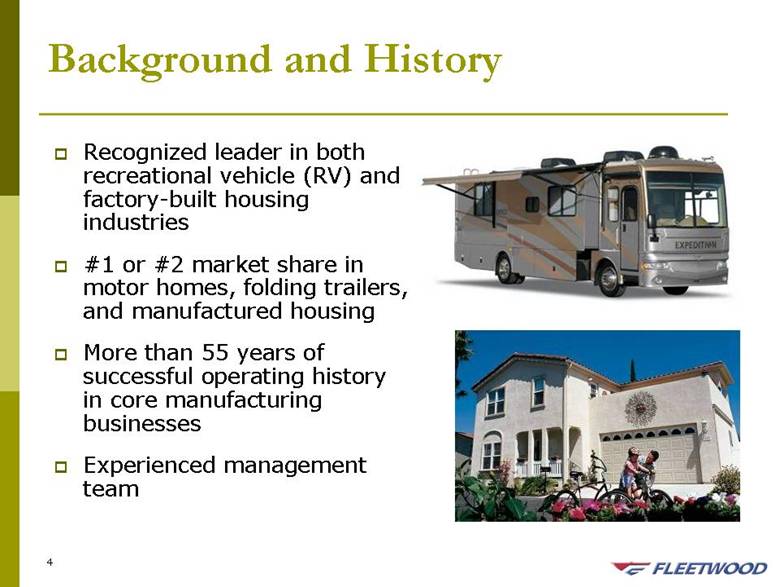
| Background and History Recognized leader in both recreational vehicle (RV) and factory-built housing industries #1 or #2 market share in motor homes, folding trailers, and manufactured housing More than 55 years of successful operating history in core manufacturing businesses Experienced management team |
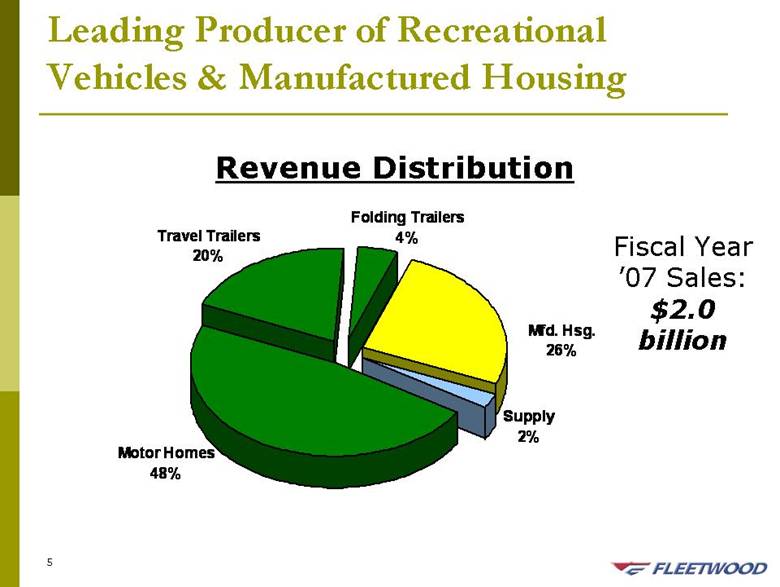
| Leading Producer of Recreational Vehicles & Manufactured Housing Revenue Distribution Fiscal Year ’07 Sales: $2.0 billion Motor Homes 48% Travel Trailers 20% Mfd. Hsg. 26% Folding Trailers 4% Supply 2% |
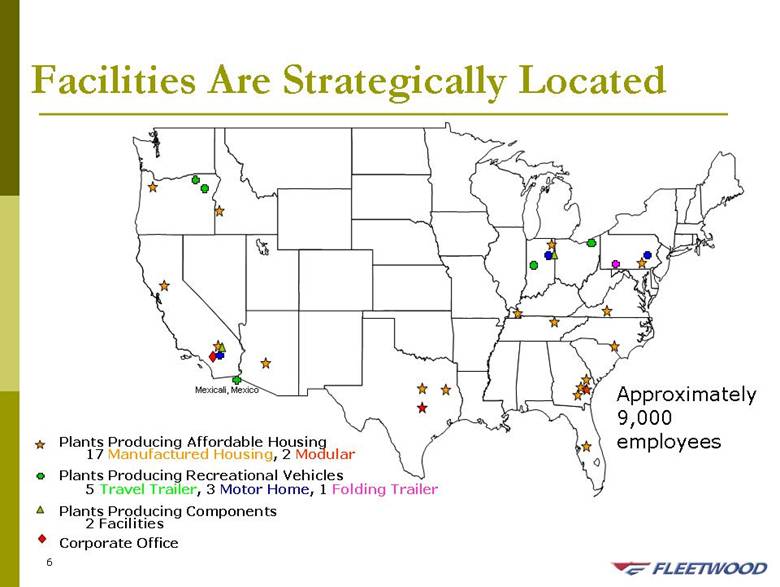
| Plants Producing Affordable Housing 17 Manufactured Housing, 2 Modular Plants Producing Recreational Vehicles 5 Travel Trailer, 3 Motor Home, 1 Folding Trailer Plants Producing Components 2 Facilities Corporate Office Approximately 9,000 employees Mexicali, Mexico Facilities Are Strategically Located |
| Historical Perspective In 1999 and 2000, a prolonged manufactured housing slump began, and the RV market experienced a sharp but brief downturn Prior management adopted centralized, functional operational structure The combination set off several years of net losses These results led to a series of management changes Current leadership in place since March 2005 Last two years in turnaround mode Significant progress made in organizational structure, products, operations, costs and balance sheet |
| Basic Operating Disciplines Enter only those fields of activity where we possess adequate competence and skills to excel Enter only the areas of greatest sales and profit potential within our chosen fields Maintain a competitive edge in our products, services and cost structure Require decision-making at the lowest appropriate level of authority Plan our growth of production capacity based on adequate demand and the availability of capable personnel Recognize that Fleetwood’s success depends upon developing competent, loyal associates |
| Operating Strategy Concentrate on core businesses Manufacturing high-quality, high-value RVs & homes Decentralize operations Empowering those closest to the customer Increase market share Targeting areas of greatest sales & profit potential Reduce costs/improve efficiencies Match manufacturing capacity to demand Focus energy & resources on regaining consistent profitability |
| Restructuring Actions Reduced corporate officers: 24 to 10 Divested non-core businesses to stem losses and/or eliminate distractions Housing retail & finance; RV parts; chassis program Closed or consolidated plant locations and realigned product mix where necessary to improve capacity utilization and labor efficiency Organized operations into market-focused profit centers Three stand-alone business units in RV Group; two regional divisions in Housing Group; and three subsidiaries in Supply Group Lowered SG&A by $33M in FY ’06; further reductions of $55M implemented in FY ’07 Reorganized sales force RV sales group aligned with brands; Housing sales group aligned by plant-specific products Decentralized service and warranty Pushed down authority for product development to division, regional or plant level from Group or Corporate level Decisions made closer to the customers Expanded business units’ authority to encompass sales, materials, manufacturing, environmental and operational IT functions |
| Current Status Major turnaround initiatives are largely in place Expect to see full annual impact of reductions in cost structure in fiscal 2008 Other changes will be ongoing Continued improvements in products, sales, manufacturing, service, etc. We expect positive financial impact to follow Immediate actions focused by business unit Initiatives to increase market share, improve volume and capacity utilization, and reach acceptable profitability in each business Strategic plans going forward Expansion of RV product offerings to cover additional price points and niches with significant profit potential Selective entry into modular housing market Aggressive sale of idle assets to bolster liquidity |
| RV Group |
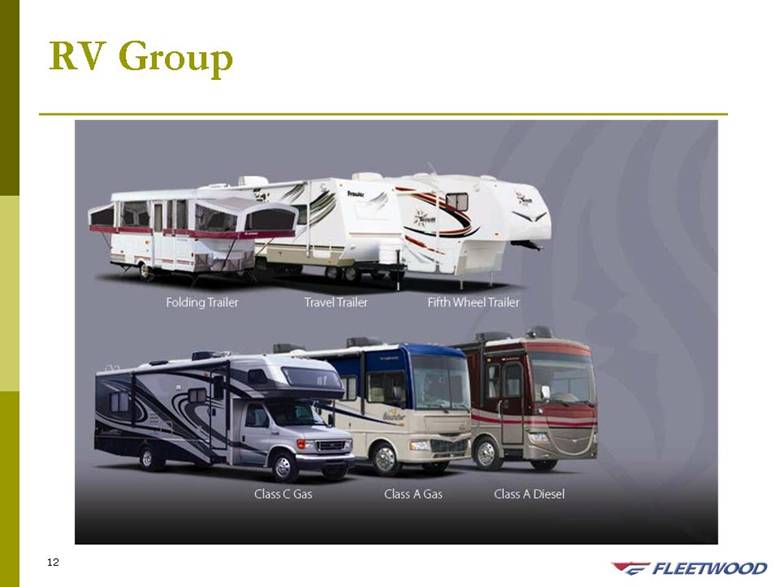
| RV Group Overview Fleetwood is a leading producer of recreational vehicles in North America The business is organized into three divisions: motor homes, travel trailers and folding trailers FY 2007 sales of $1.44 billion; 40,754 units shipped (third largest manufacturer overall) More than 1.7 million Fleetwood RVs sold since Company’s inception Strong, well-established dealer networks and brands More than 1,000 independent dealer locations |
| RV Industry Conditions Cyclical, seasonal industry Retail demand is highly correlated to leading economic indicators Consumer confidence, interest rates, fuel prices, etc. Wholesale shipment trends generally track retail demand, but are often exaggerated by changes in dealer inventory levels Levels are currently reasonable for motor homes, but are high for travel trailers Record shipment levels in recent years Positive demographic trends and a growing user base Uncertainty regarding fuel prices and interest rates impacted the motor home market beginning in calendar 2005 Travel trailer market was strong until the second half of 2006, when it began to show weakness RVIA outlook suggests that calendar 2007 will show YOY shipment improvement for motor homes and declines for travel trailers |
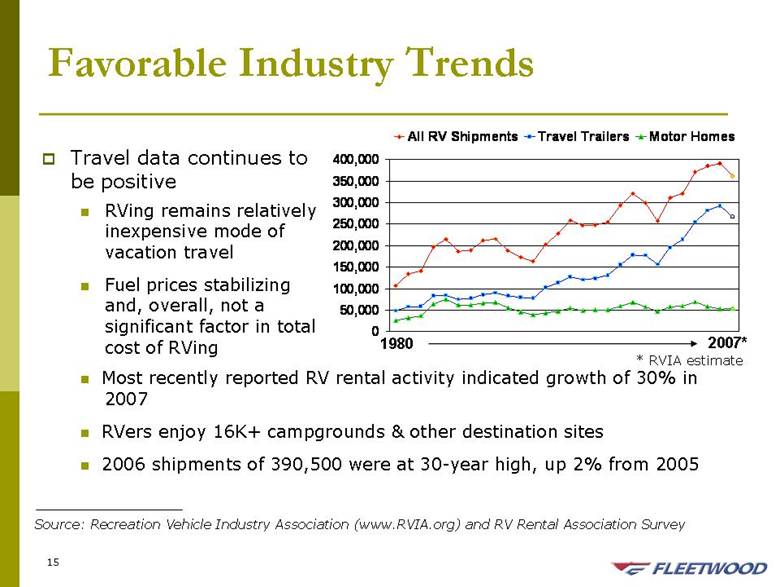
| Favorable Industry Trends Travel data continues to be positive RVing remains relatively inexpensive mode of vacation travel Fuel prices stabilizing and, overall, not a significant factor in total cost of RVing Source: Recreation Vehicle Industry Association (www.RVIA.org) and RV Rental Association Survey 1980 2007* * RVIA estimate 0 50,000 100,000 150,000 200,000 250,000 300,000 350,000 400,000 All RV Shipments Travel Trailers Motor Homes Most recently reported RV rental activity indicated growth of 30% in 2007 RVers enjoy 16K+ campgrounds & other destination sites 2006 shipments of 390,500 were at 30-year high, up 2% from 2005 |
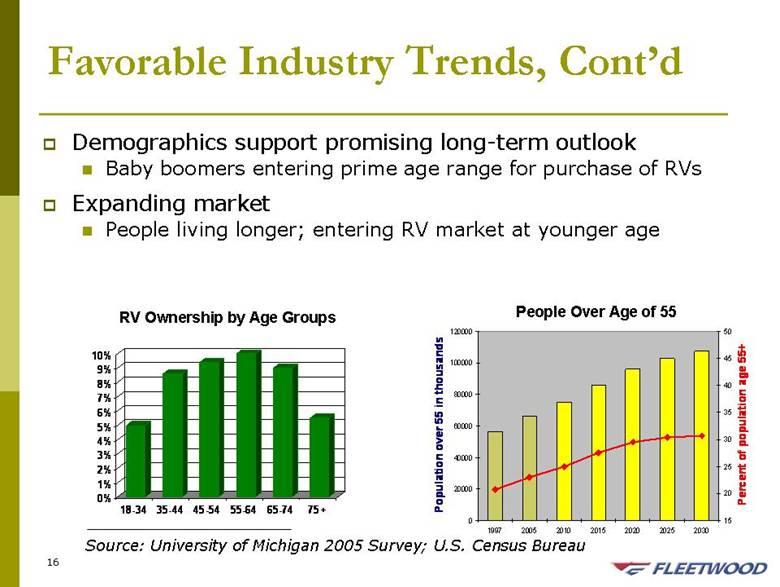
| Favorable Industry Trends, Cont’d Demographics support promising long-term outlook Baby boomers entering prime age range for purchase of RVs Expanding market People living longer; entering RV market at younger age People Over Age of 55 RV Ownership by Age Groups Source: University of Michigan 2005 Survey; U.S. Census Bureau |
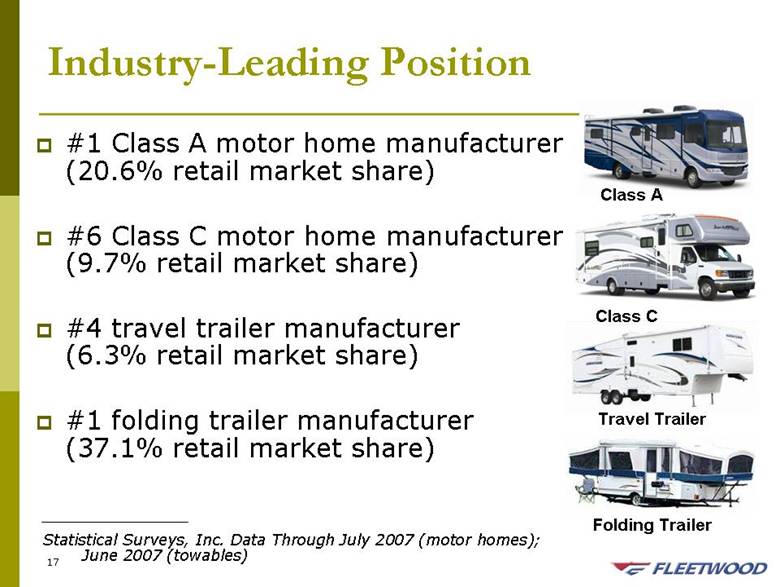
| Industry-Leading Position #1 Class A motor home manufacturer (20.6% retail market share) #6 Class C motor home manufacturer (9.7% retail market share) #4 travel trailer manufacturer (6.3% retail market share) #1 folding trailer manufacturer (37.1% retail market share) Statistical Surveys, Inc. Data Through July 2007 (motor homes); June 2007 (towables) Folding Trailer Travel Trailer Class C Class A |
| Motor Homes |
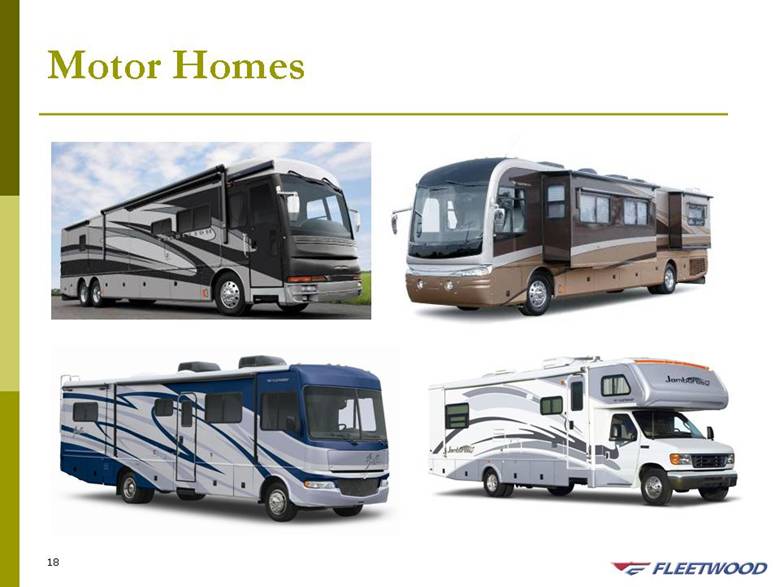
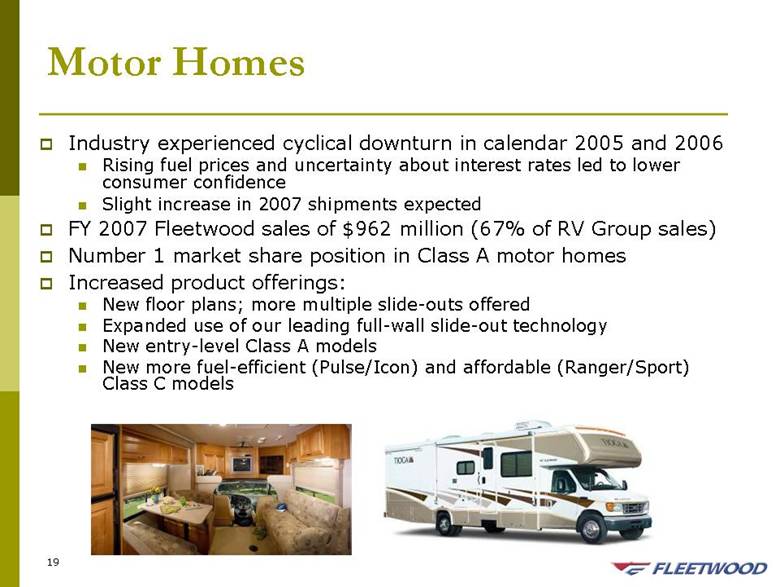
| Motor Homes Industry experienced cyclical downturn in calendar 2005 and 2006 Rising fuel prices and uncertainty about interest rates led to lower consumer confidence Slight increase in 2007 shipments expected FY 2007 Fleetwood sales of $962 million (67% of RV Group sales) Number 1 market share position in Class A motor homes Increased product offerings: New floor plans; more multiple slide-outs offered Expanded use of our leading full-wall slide-out technology New entry-level Class A models New more fuel-efficient (Pulse/Icon) and affordable (Ranger/Sport) Class C models |
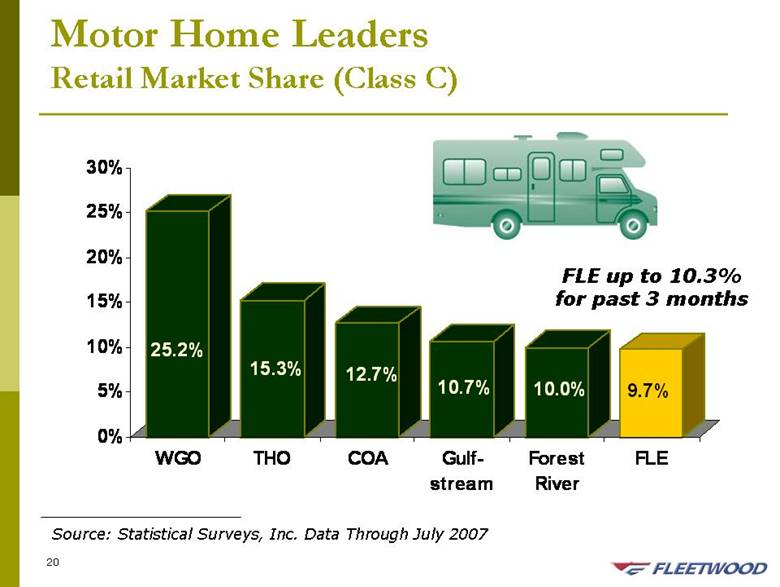
| Motor Home Leaders Retail Market Share (Class C) Source: Statistical Surveys, Inc. Data Through July 2007 FLE up to 10.3% for past 3 months 25.2% 15.3% 12.7% 10.7% 10.0% 9.7% 0% 5% 10% 15% 20% 25% 30% WGO THO COA Gulf-stream Forest River FLE |
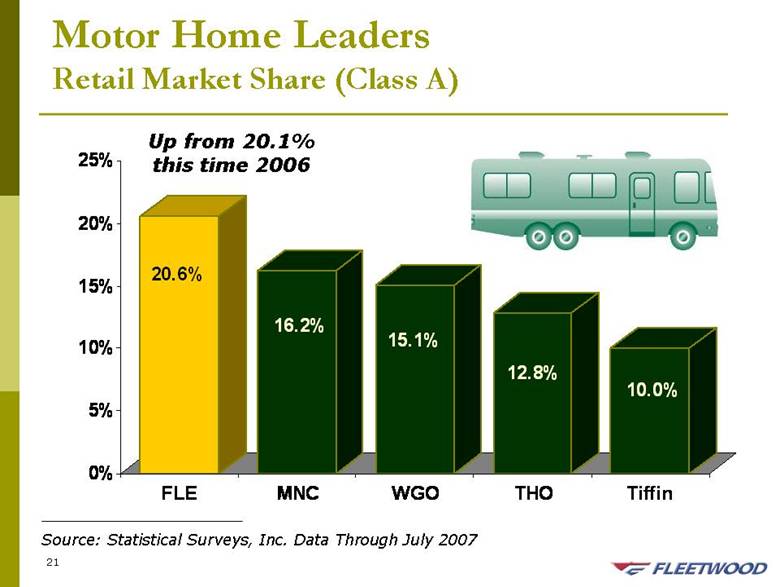
| Motor Home Leaders Retail Market Share (Class A) Source: Statistical Surveys, Inc. Data Through July 2007 Up from 20.1% this time 2006 20.6% 16.2% 15.1% 12.8% 10.0% 0% 5% 10% 15% 20% 25% FLE MNC WGO THO Tiffin |
| Travel Trailers |
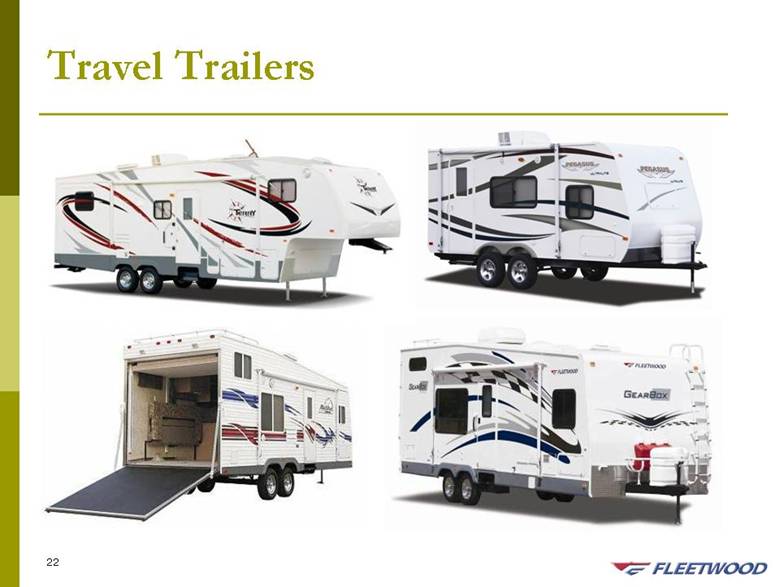
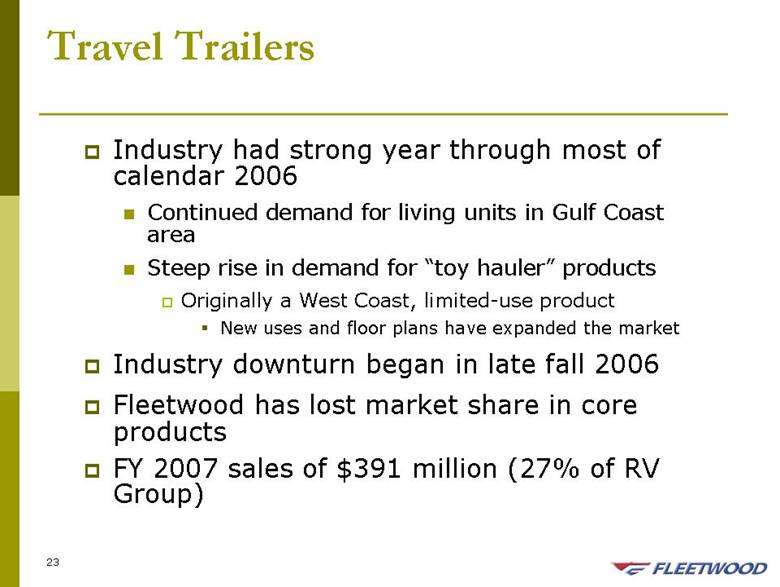
| Travel Trailers Industry had strong year through most of calendar 2006 Continued demand for living units in Gulf Coast area Steep rise in demand for “toy hauler” products Originally a West Coast, limited-use product New uses and floor plans have expanded the market Industry downturn began in late fall 2006 Fleetwood has lost market share in core products FY 2007 sales of $391 million (27% of RV Group) |
| Travel Trailers Division in turnaround mode Challenging competitive market environment Ongoing product innovation to provide improved, more competitive products New models introduced Spring ’07 New features Refreshed décors Bolder, more contemporary graphics Restructuring initiatives in process Redistributed product manufacturing throughout country to increase efficiencies Discontinued slower-turning floor plans and models Five underperforming plants closed New, more cost-efficient plant in Mexicali to build entry-level travel trailers Pursuing sustainable reductions in material, warranty and overhead costs; improved labor efficiency Improvements in capacity utilization, operating results, and revenues expected |
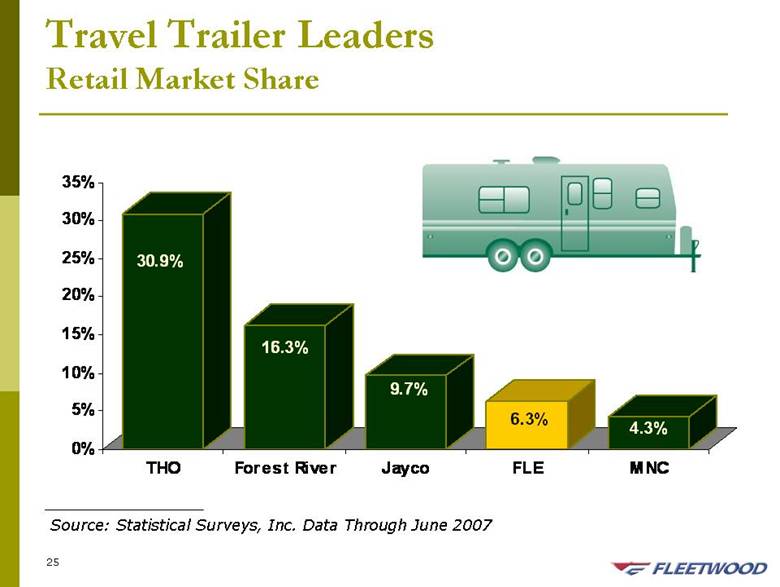
| Travel Trailer Leaders Retail Market Share Source: Statistical Surveys, Inc. Data Through June 2007 30.9% 16.3% 9.7% 6.3% 4.3% 0% 5% 10% 15% 20% 25% 30% 35% THO Forest River Jayco FLE MNC |
| Folding Trailers |
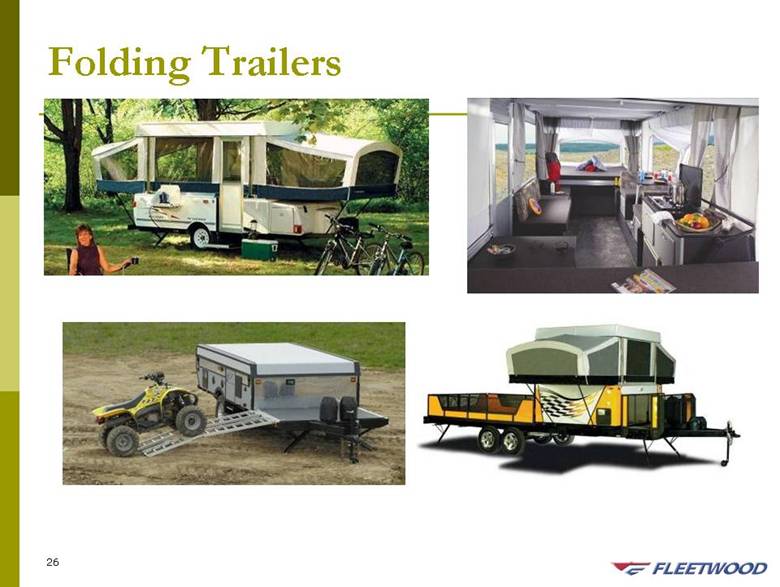
| Folding Trailers Relatively small entry-level niche #1 market share position with 37% through June 2007* FY 2007 sales of $89 million (6% of RV sales) New product innovations Additional features and options More competitively priced products, focusing on camping market Rationalized manufacturing process Second line added (improved efficiency) Reviewing outsourcing opportunities Challenging market environment * Source: Statistical Surveys, Inc. |
| Recent Accomplishments – RV Group Successful product introductions in most categories The Bounder brand has regained its position as the #1 Class A motor home brand in the country Motor home market share has held steady with minimal discounting in a competitive environment Introduced new motor home brands to fill gaps in Class C market and entry-level Class A’s Travel trailer market share slide has stabilized Decentralization of operations and decision making complete |
| Recent Accomplishments – RV Group Backlogs up significantly since end of Q1 in all 3 divisions after successful national dealer meeting Product planning and development process significantly improved Sales force responsible for fewer product lines with greater accountability Service and warranty expenses down Simplification of travel trailer plant production complete Plants have fewer product lines, wider geographic reach Goals: Fewer SKUs, higher labor efficiency, better quality Cont’d |
| Housing Group Single-Section Multi-Section Modular Designer Interiors |
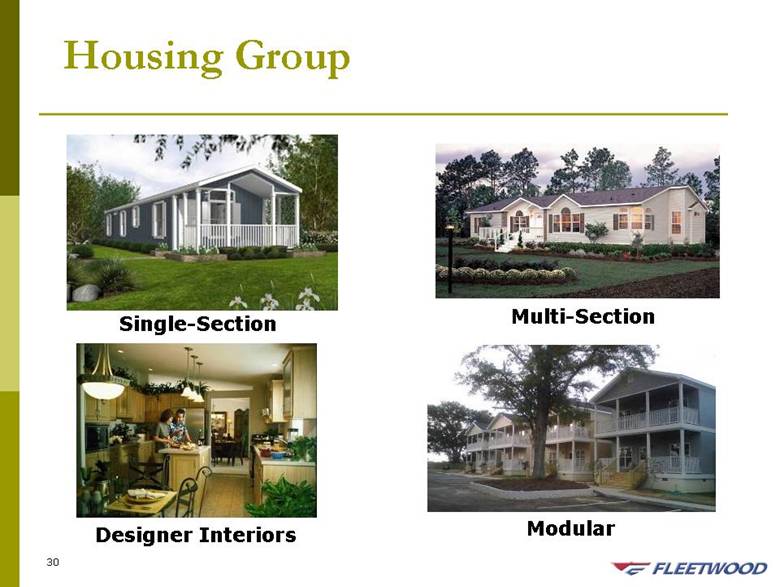
| Housing Group Overview Constructs factory-built single and multi-family homes Building in a factory provides advantages in cost, speed, labor efficiency and use of materials Manufactured housing business builds residential homes to the HUD code Homes are primarily distributed through traditional independent dealers New modular business — Trendsetter Homes — builds residential multi-family homes and military barracks Complies with model building codes adopted by states and municipalities, similar to site-built codes Distribution includes builders/developers and government, including military |
| Advantages of Factory Building Lower cost per square foot for similar home compared to site-built Speed of delivery (averages half the time from decision to completion) Availability of labor Controlled manufacturing environment More stable pricing More environmentally friendly Positive demographics in key segments Immigrants, empty nesters, first-time buyers, lower-income families |
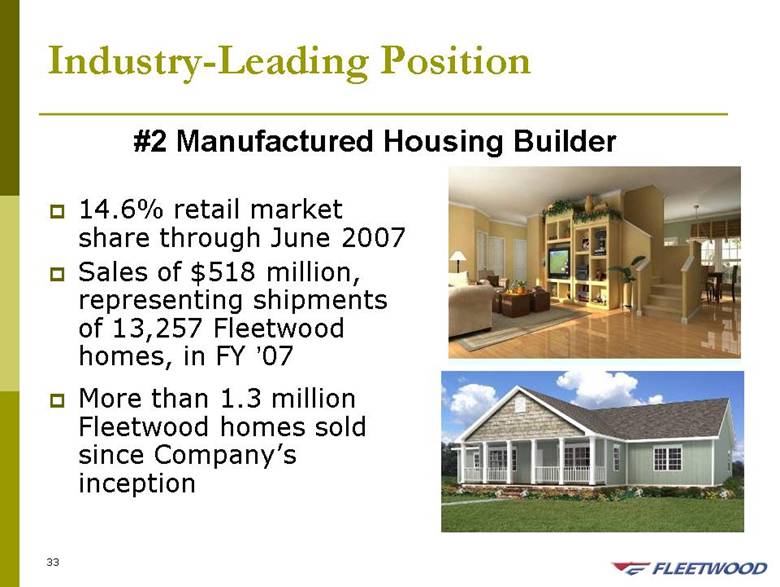
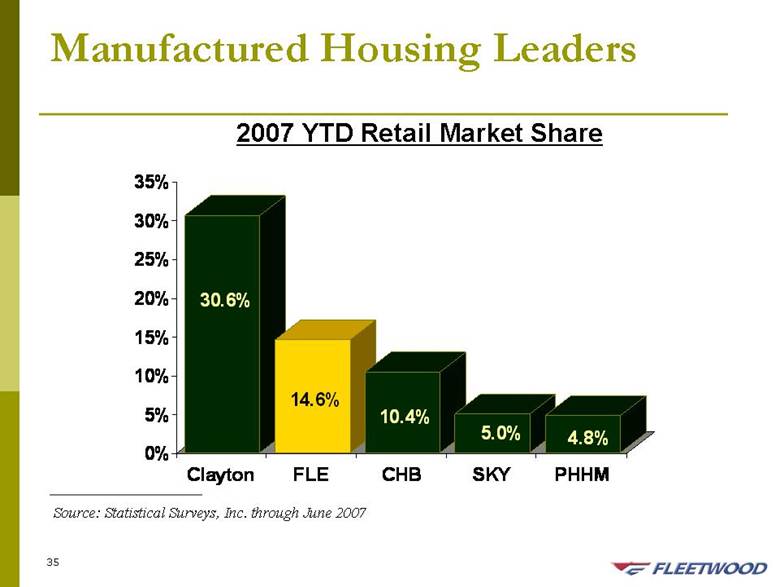
| Industry-Leading Position 14.6% retail market share through June 2007 Sales of $518 million, representing shipments of 13,257 Fleetwood homes, in FY ’07 More than 1.3 million Fleetwood homes sold since Company’s inception #2 Manufactured Housing Builder |
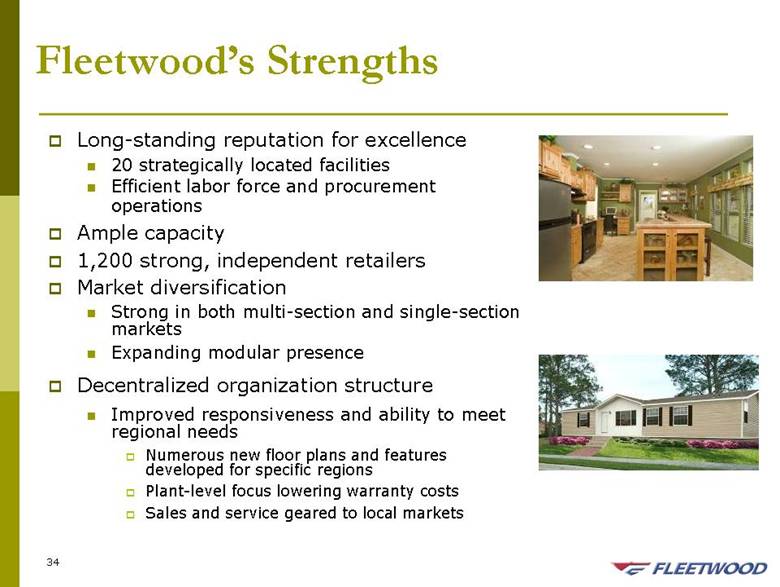
| Fleetwood’s Strengths Long-standing reputation for excellence 20 strategically located facilities Efficient labor force and procurement operations Ample capacity 1,200 strong, independent retailers Market diversification Strong in both multi-section and single-section markets Expanding modular presence Decentralized organization structure Improved responsiveness and ability to meet regional needs Numerous new floor plans and features developed for specific regions Plant-level focus lowering warranty costs Sales and service geared to local markets |
| Manufactured Housing Leaders Source: Statistical Surveys, Inc. through June 2007 2007 YTD Retail Market Share 30.6% 14.6% 10.4% 5.0% 4.8% 0% 5% 10% 15% 20% 25% 30% 35% Clayton FLE CHB SKY PHHM |
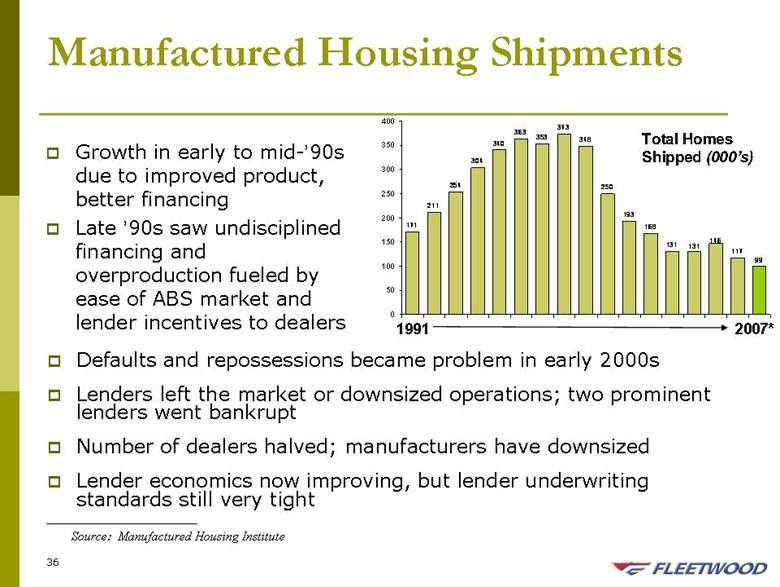
| Manufactured Housing Shipments Source: Manufactured Housing Institute Total Homes Shipped (000’s) Defaults and repossessions became problem in early 2000s Lenders left the market or downsized operations; two prominent lenders went bankrupt Number of dealers halved; manufacturers have downsized Lender economics now improving, but lender underwriting standards still very tight 1991 2007* Growth in early to mid-’90s due to improved product, better financing Late ’90s saw undisciplined financing and overproduction fueled by ease of ABS market and lender incentives to dealers 171 211 254 304 340 363 353 373 348 250 193 168 131 117 99 146 131 0 50 100 150 200 250 300 350 400 |
| Industry Conditions Manufactured housing loans still difficult to obtain Public information indicates that chattel, or personal property, lenders demand significantly higher FICO scores, higher interest rates, and higher down payments than mortgage lenders Land/home loan terms more competitive, but qualification still difficult Customers, often first-time homebuyers or seniors downsizing their homes, effectively priced out of market Reduced industry manufacturing capacity, dealer locations and retail inventory Solid demand for affordable housing but outlook suggests flat to moderate growth until glut of site-built foreclosures and developer inventories eases |
| Industry Outlook Constant, growing demand in U.S. for affordable housing, bolstered by need for replacement housing in Gulf Coast region Gulf Region has higher-than-average proportion of manufactured housing Reduced competition from repossessed manufactured homes Repossession inventories peaked in 2003 High of 100,000+ Currently less than 40,000 Tightening lending policies on site-built homes Favorable opportunities for potential lenders Declining vacancies and higher rents in apartments improve competitive position Continuing product improvements Aesthetics, functionality, durability and set-up all improved since industry peak and continue to be a focus Positive outlook for modular housing expansion in areas where Fleetwood is positioned |
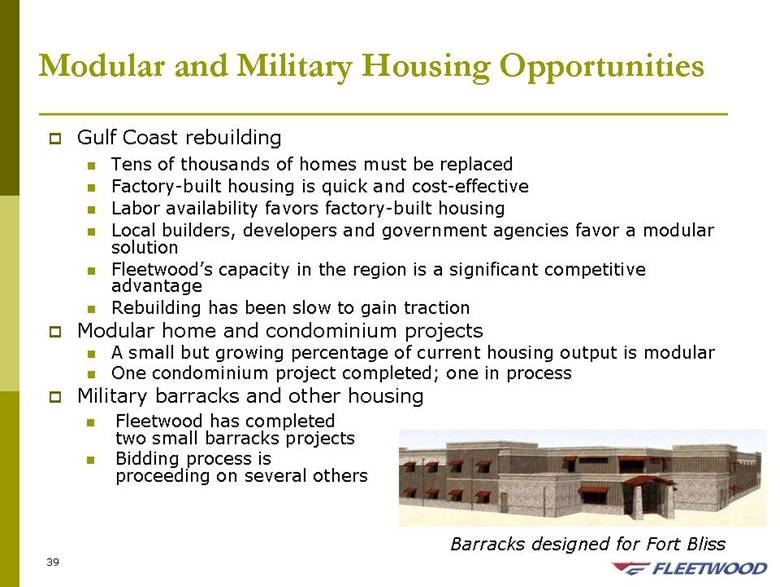
| Modular and Military Housing Opportunities Gulf Coast rebuilding Tens of thousands of homes must be replaced Factory-built housing is quick and cost-effective Labor availability favors factory-built housing Local builders, developers and government agencies favor a modular solution Fleetwood’s capacity in the region is a significant competitive advantage Rebuilding has been slow to gain traction Modular home and condominium projects A small but growing percentage of current housing output is modular One condominium project completed; one in process Military barracks and other housing Barracks designed for Fort Bliss Fleetwood has completed two small barracks projects Bidding process is proceeding on several others |
| Current Initiatives Priority on increasing market share, with accompanying higher volumes and improved labor efficiency Regional product development Local handling of service and warranty Closer relationships with distribution network Improved oversight of home set-up Improved quality and service Customer Satisfaction Index and Dealer Satisfaction Index provide objective measurement of progress Continued pursuit of modular housing opportunities |

| Recent Accomplishments – Housing Group Renewed focus on core manufacturing Sold unprofitable retail housing business as well as finance subsidiary in August 2005 Sale resulted in reduced market share Cost-cutting initiatives have been successful Three regional management teams consolidated into two Several plants within close proximity now sharing management teams Plants consolidated where access to geographic markets would not be lost New quality disciplines have resulted in fewer warranty claims Plant-based service/warranty has resulted in fewer and lower-cost claims Customer satisfaction and dealer satisfaction scores are up markedly over past 18 months |
| Financial Overview |
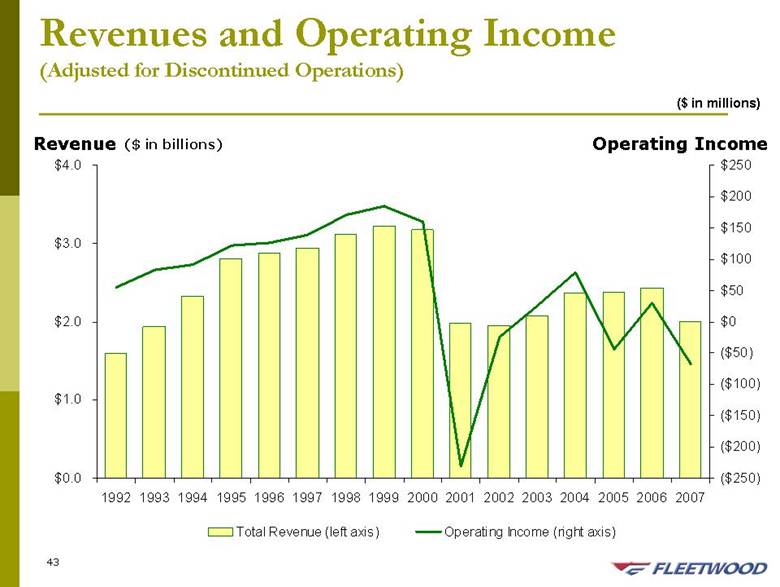
| Revenues and Operating Income (Adjusted for Discontinued Operations) Operating Income ($ in millions) Revenue ($ in billions) $0.0 $1.0 $2.0 $3.0 $4.0 1992 1993 1994 1995 1996 1997 1998 1999 2000 2001 2002 2003 2004 2005 2006 2007 ($250) ($200) ($150) ($100) ($50) $0 $50 $100 $150 $200 $250 Total Revenue (left axis) Operating Income (right axis) |
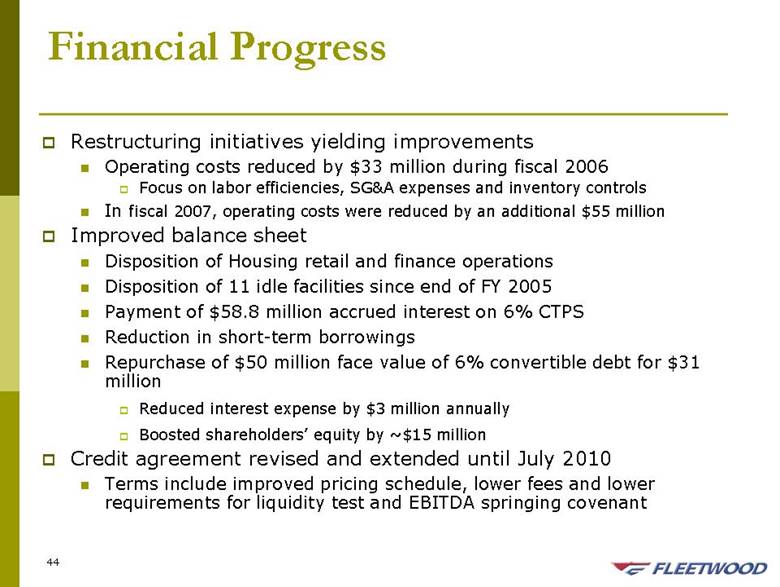
| Financial Progress Restructuring initiatives yielding improvements Operating costs reduced by $33 million during fiscal 2006 Focus on labor efficiencies, SG&A expenses and inventory controls In fiscal 2007, operating costs were reduced by an additional $55 million Improved balance sheet Disposition of Housing retail and finance operations Disposition of 11 idle facilities since end of FY 2005 Payment of $58.8 million accrued interest on 6% CTPS Reduction in short-term borrowings Repurchase of $50 million face value of 6% convertible debt for $31 million Reduced interest expense by $3 million annually Boosted shareholders’ equity by ~$15 million Credit agreement revised and extended until July 2010 Terms include improved pricing schedule, lower fees and lower requirements for liquidity test and EBITDA springing covenant |
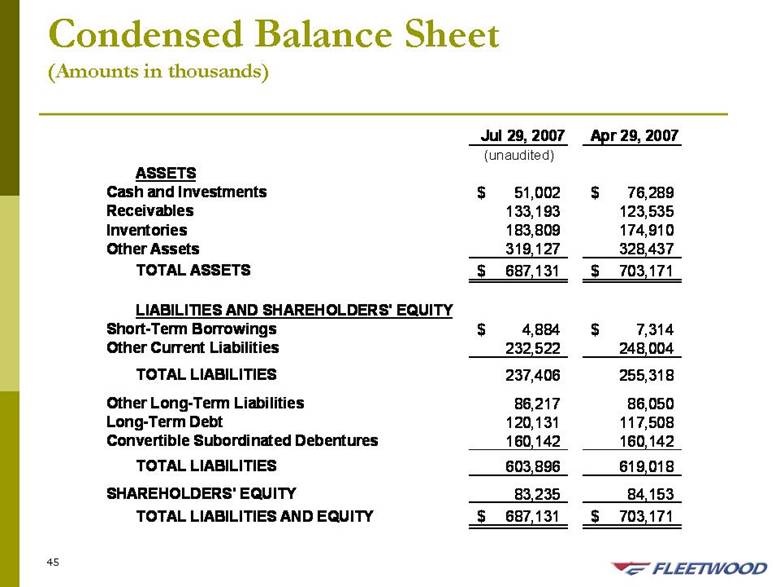
| Condensed Balance Sheet (Amounts in thousands) Jul 29, 2007 Apr 29, 2007 ASSETS Cash and Investments 51,002 $ 76,289 $ Receivables 133,193 123,535 Inventories 183,809 174,910 Other Assets 319,127 328,437 TOTAL ASSETS 687,131 $ 703,171 $ LIABILITIES AND SHAREHOLDERS' EQUITY Short-Term Borrowings 4,884 $ 7,314 $ Other Current Liabilities 232,522 248,004 TOTAL LIABILITIES 237,406 255,318 Other Long-Term Liabilities 86,217 86,050 Long-Term Debt 120,131 117,508 Convertible Subordinated Debentures 160,142 160,142 TOTAL LIABILITIES 603,896 619,018 SHAREHOLDERS' EQUITY 83,235 84,153 TOTAL LIABILITIES AND EQUITY 687,131 $ 703,171 $ (unaudited) |
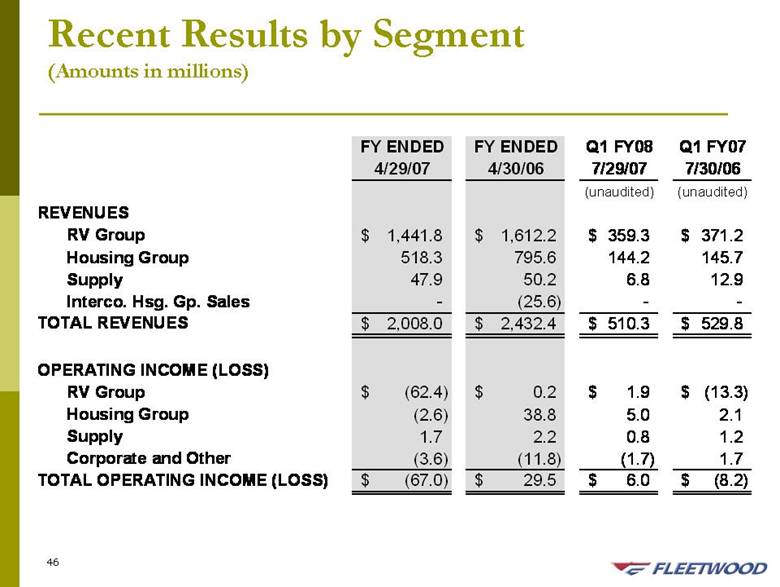
| Recent Results by Segment (Amounts in millions) FY ENDED FY ENDED Q1 FY08 Q1 FY07 4/29/07 4/30/06 7/29/07 7/30/06 (unaudited) (unaudited) REVENUES RV Group 1,441.8 $ 1,612.2 $ 359.3 $ 371.2 $ Housing Group 518.3 795.6 144.2 145.7 Supply 47.9 50.2 6.8 12.9 Interco. Hsg. Gp. Sales - (25.6) - - TOTAL REVENUES 2,008.0 $ 2,432.4 $ 510.3 $ 529.8 $ OPERATING INCOME (LOSS) RV Group (62.4) $ 0.2 $ 1.9 $ (13.3) $ Housing Group (2.6) 38.8 5.0 2.1 Supply 1.7 2.2 0.8 1.2 Corporate and Other (3.6) (11.8) (1.7) 1.7 TOTAL OPERATING INCOME (LOSS) (67.0) $ 29.5 $ 6.0 $ (8.2) $ |
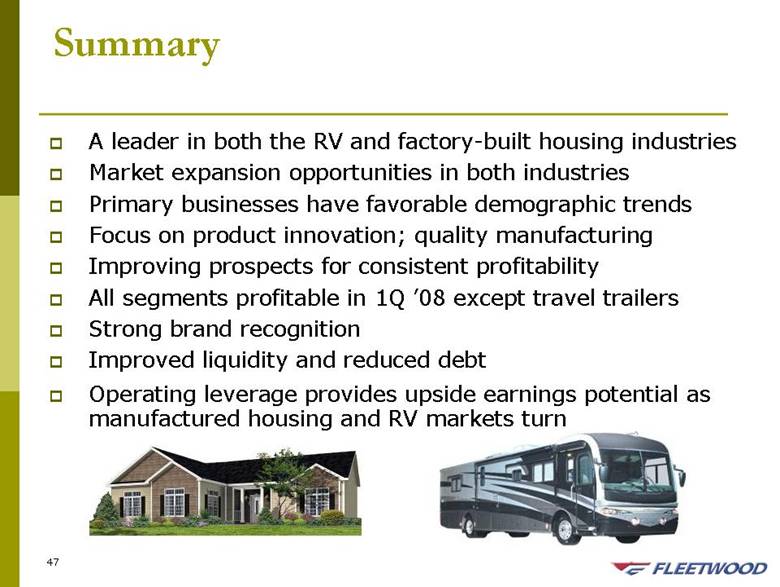
| Summary A leader in both the RV and factory-built housing industries Market expansion opportunities in both industries Primary businesses have favorable demographic trends Focus on product innovation; quality manufacturing Improving prospects for consistent profitability All segments profitable in 1Q ’08 except travel trailers Strong brand recognition Improved liquidity and reduced debt Operating leverage provides upside earnings potential as manufactured housing and RV markets turn |