Exhibit 99.1
Gold / / Copper Turnaround in Progress NYSE & TSX September 2020 Presentation By: Rob McEwen, Chief Owner & Chairman Peter Mah , Chief Operating Officer

MUX Cautionary Statement Executive Summary: If you are r isk adverse , don’t buy our shares. Past performance is unreliable in predicting the future. Unexpected events do happen and will change forecasts. MUX
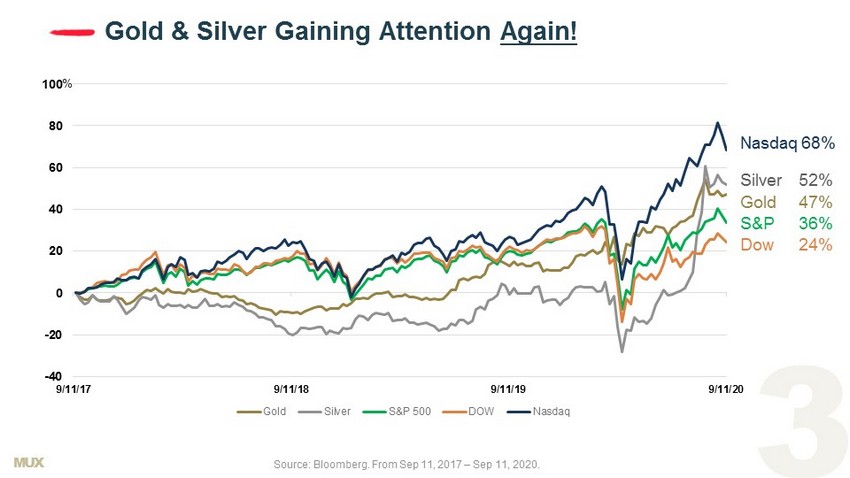
MUX -40 -20 0 20 40 60 80 100 9/11/17 9/11/18 9/11/19 9/11/20 Gold Silver S&P 500 DOW Nasdaq Gold & Silver Gaining Attention Again! Silver 52% % Source: Bloomberg. From Sep 11, 2017 – Sep 11 , 20 20 . Gold 47% S&P 36% Dow 24% Nasdaq 68%
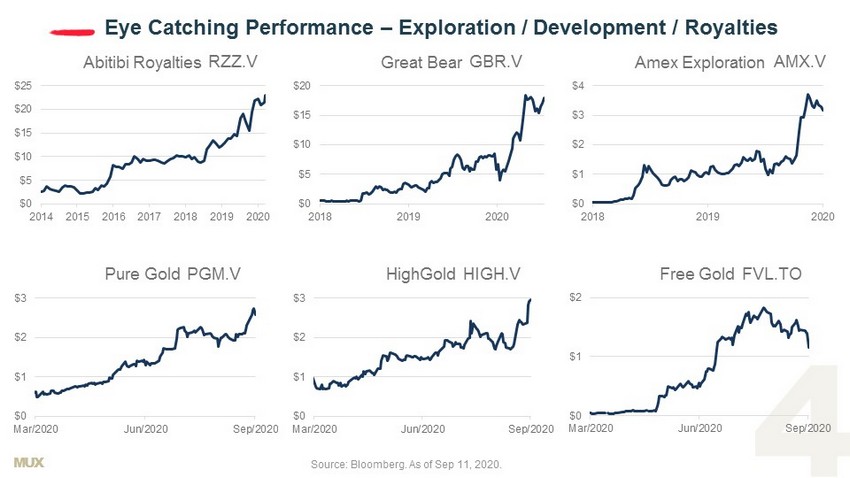
MUX $0 $1 $2 Mar/2020 Jun/2020 Sep/2020 Free Gold $0 $5 $10 $15 $20 $25 2014 2015 2016 2017 2018 2019 2020 Abitibi Royalties Eye Catching Performance – Exploration / Development / Royalties $0 $1 $2 $3 $4 2018 2019 2020 Amex Exploration $0 $5 $10 $15 $20 2018 2019 2020 Great Bear $0 $1 $2 $3 Mar/2020 Jun/2020 Sep/2020 Pure Gold $0 $1 $2 $3 Mar/2020 Jun/2020 Sep/2020 HighGold Source: Bloomberg. As of Sep 11, 2020. RZZ.V GBR.V AMX.V PGM.V HIGH.V FVL.TO

MUX $0.00 $1.00 $2.00 $3.00 $4.00 $5.00 $0 $10 $20 $30 $40 $50 $60 $70 Sep/2015 Sep/2016 Sep/2017 Sep/2018 Sep/2019 Sep/2020 GDXJ MUX Outperformed GDXJ Trouble Starts Big Gap = Opportunity MUX - Considerable Upside MUX vs GDXJ Sep 2015 – Sep 2020 GDXJ MUX Source: Bloomberg. From Sep 11, 2015 to Sep 11 , 20 20 .
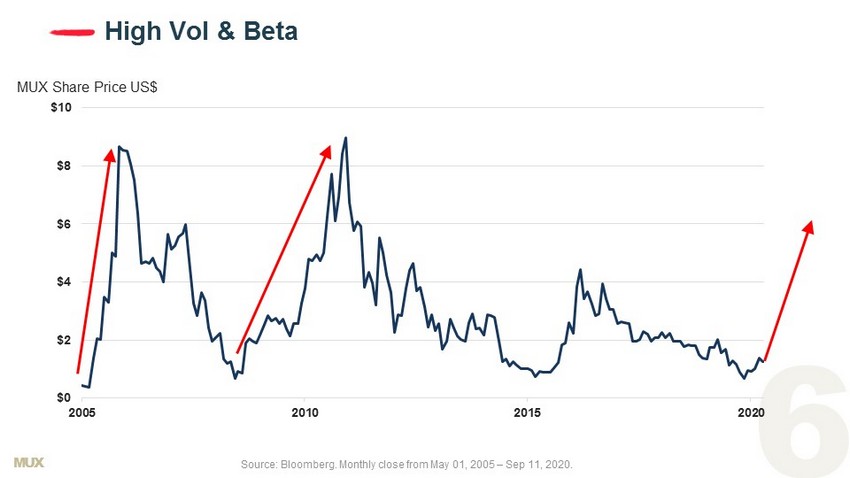
MUX $0 $2 $4 $6 $8 $10 2005 2010 2015 2020 High Vol & Beta Source: Bloomberg. Monthly close f rom May 01, 2005 – Sep 11 , 20 20 . MUX Share Price US$
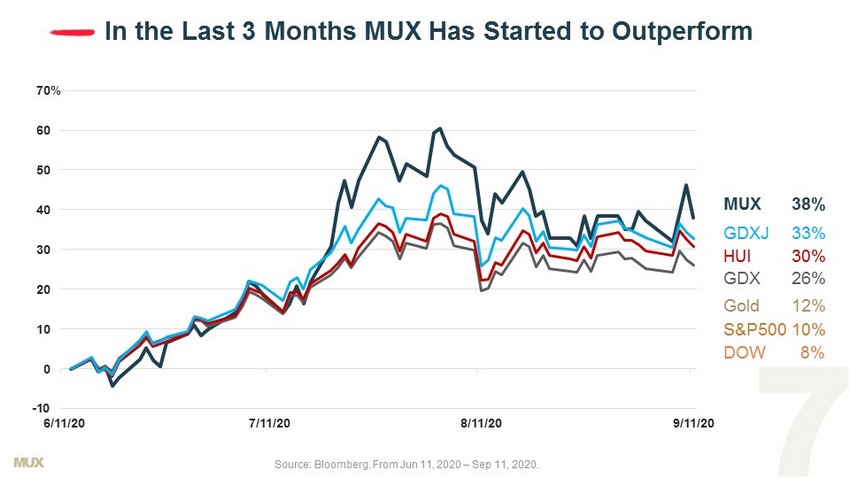
MUX -10 0 10 20 30 40 50 60 70 6/11/20 7/11/20 8/11/20 9/11/20 In the Last 3 Months MUX Has Started to Outperform % Source: Bloomberg. From Jun 11, 2020 – Sep 11 , 20 20 . Gold 12% S&P500 10% DOW 8% MUX 38% GDXJ 33% HUI 30% GDX 26%
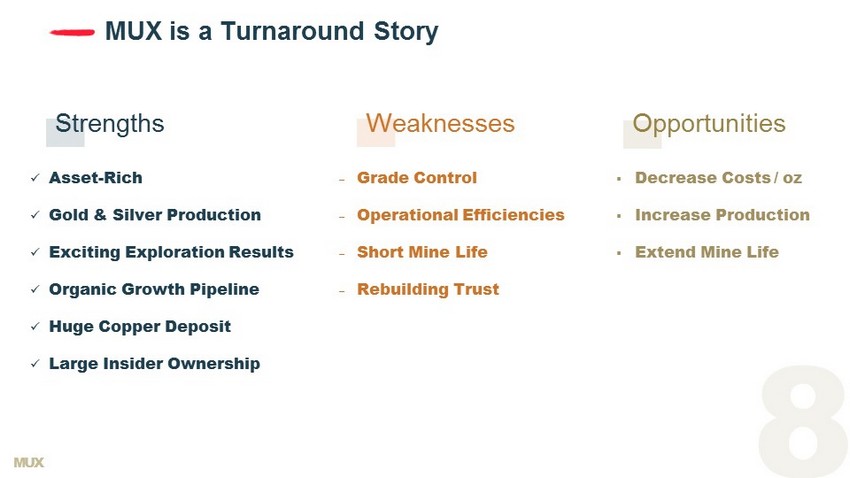
MUX Strengths x Asset - Rich x Gold & Silver Production x Exciting Exploration Results x Organic Growth Pipeline x Huge Copper Deposit x Large Insider Ownership Weaknesses - Grade Control - Operational Efficiencies - Short Mine Life - Rebuilding Trust Opportunities ▪ Decrease Costs / oz ▪ Increase Production ▪ Extend Mine Life MUX is a Turnaround Story
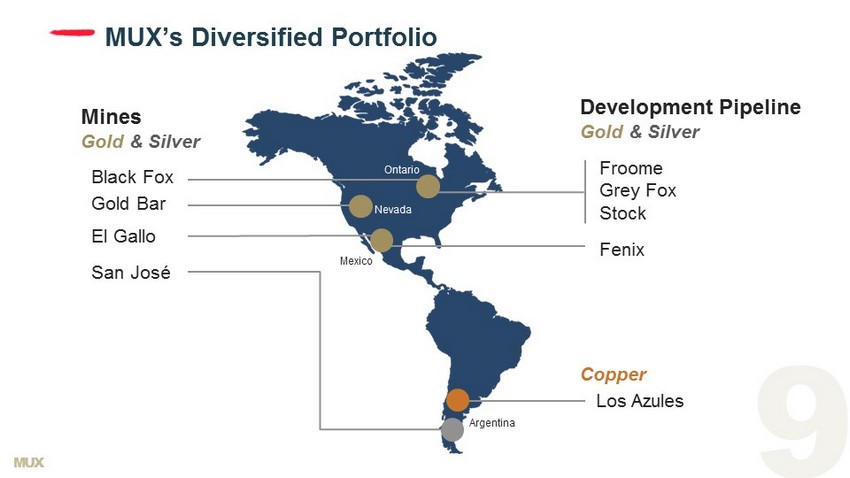
MUX MUX’s Diversified Portfolio Mines Gold & Silver Development Pipeline Gold & Silver Froome Grey Fox Stock Copper Los Azules Fenix Black Fox Argentina Mexico Nevada Ontario Gold Bar El Gallo San José
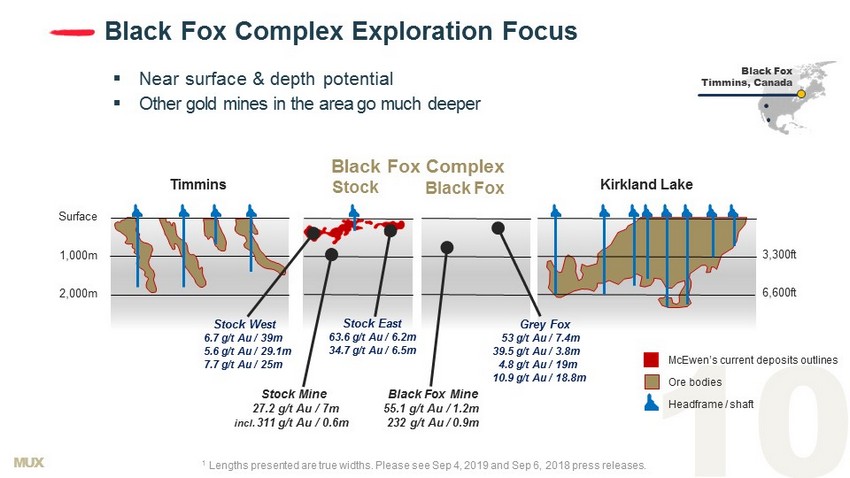
MUX 1 Lengths presented are true widths. Please see Sep 4, 2019 and Sep 6, 2018 press releases. McEwen’s current deposits outlines Ore bodies Headframe / shaft Black Fox Complex Kirkland Lake Timmins 1,000m 2,000m Surface 3,300ft 6,600ft Stock Black Fox Black Fox Complex Exploration Focus ▪ Near surface & depth potential ▪ Other gold mines in the area go much deeper Stock West 6.7 g/t Au / 39m 5.6 g/t Au / 29.1m 7.7 g/t Au / 25m Stock East 63.6 g/t Au / 6.2m 34.7 g/t Au / 6.5m Grey Fox 53 g/t Au / 7.4m 39.5 g/t Au / 3.8m 4.8 g/t Au / 19m 10.9 g/t Au / 18.8m Stock Mine 27.2 g/t Au / 7m incl. 311 g/t Au / 0.6m Black Fox Mine 55.1 g/t Au / 1.2m 232 g/t Au / 0.9m Black Fox Timmins, Canada
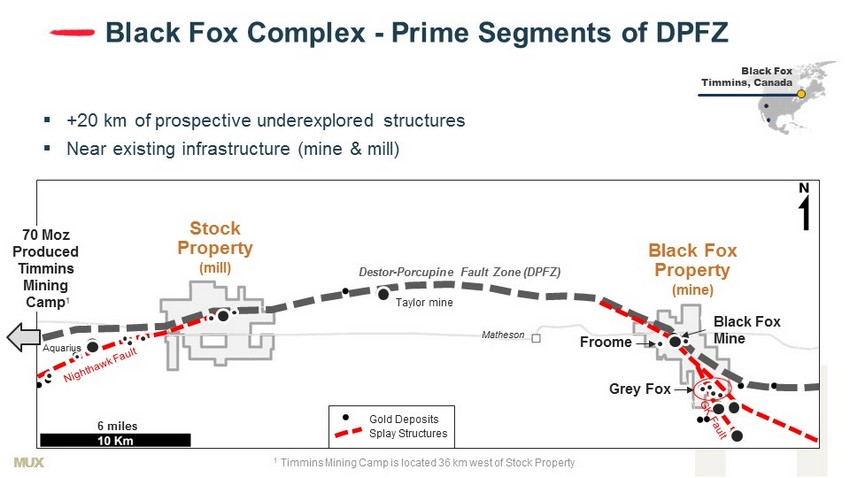
MUX ▪ +20 km of prospective underexplored structures ▪ Near existing infrastructure (mine & mill) Black Fox Complex - Prime Segments of DPFZ Black Fox Timmins, Canada Taylor mine Aquarius Matheson Destor - Porcupine Fault Zone (DPFZ) Grey Fox Stock Property (mill) Froome 70 Moz Produced Timmins Mining Camp 1 Gold Deposits Splay Structures Black Fox Property (mine) Black Fox Mine 1 Timmins Mining Camp is located 36 km west of Stock Property 6 miles
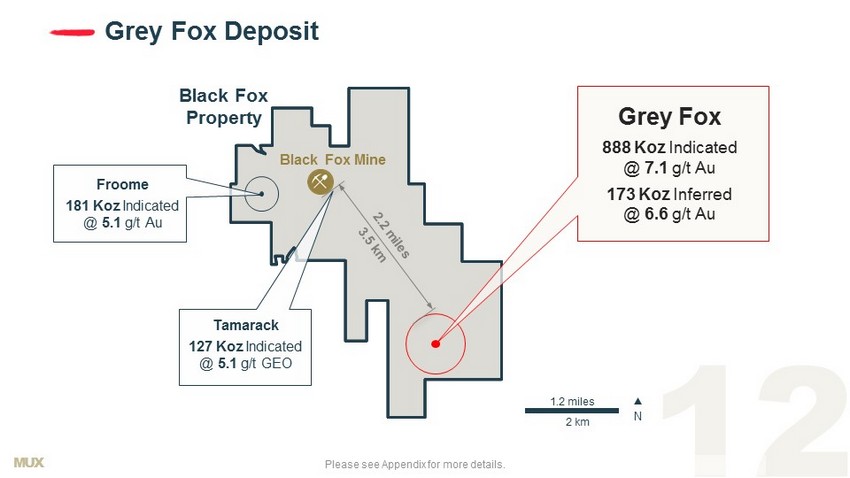
MUX 2 km 1.2 miles N Please see Appendix for more details. Grey Fox Deposit Black Fox Mine Froome 181 Koz Indicated @ 5.1 g/t Au Black Fox Property Grey Fox 888 Koz Indicated @ 7.1 g/t Au 173 Koz Inferred @ 6.6 g/t Au Tamarack 127 Koz Indicated @ 5.1 g/t GEO
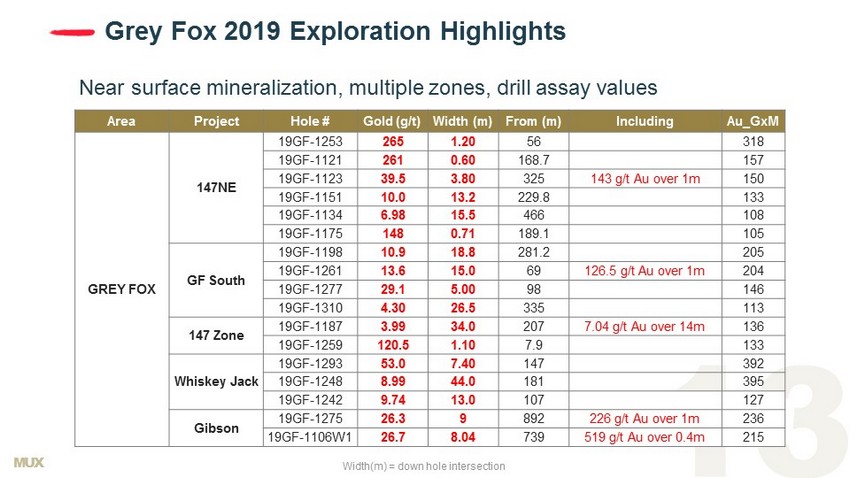
MUX Area Project Hole # Gold (g/t) Width (m) From (m) Including Au_GxM GREY FOX 147NE 19GF - 1253 265 1.20 56 318 19GF - 1121 261 0.60 168.7 157 19GF - 1123 39.5 3.80 325 143 g/t Au over 1m 150 19GF - 1151 10.0 13.2 229.8 133 19GF - 1134 6.98 15.5 466 108 19GF - 1175 148 0.71 189.1 105 GF South 19GF - 1198 10.9 18.8 281.2 205 19GF - 1261 13.6 15.0 69 126.5 g/t Au over 1m 204 19GF - 1277 29.1 5.00 98 146 19GF - 1310 4.30 26.5 335 113 147 Zone 19GF - 1187 3.99 34.0 207 7.04 g/t Au over 14m 136 19GF - 1259 120.5 1.10 7.9 133 Whiskey Jack 19GF - 1293 53.0 7.40 147 392 19GF - 1248 8.99 44.0 181 395 19GF - 1242 9.74 13.0 107 127 Gibson 19GF - 1275 26.3 9 892 226 g/t Au over 1m 236 19GF - 1106W1 26.7 8.04 739 519 g/t Au over 0.4m 215 Grey Fox 2019 Exploration Highlights Near surface mineralization, multiple zones, drill assay values Width(m) = down hole intersection
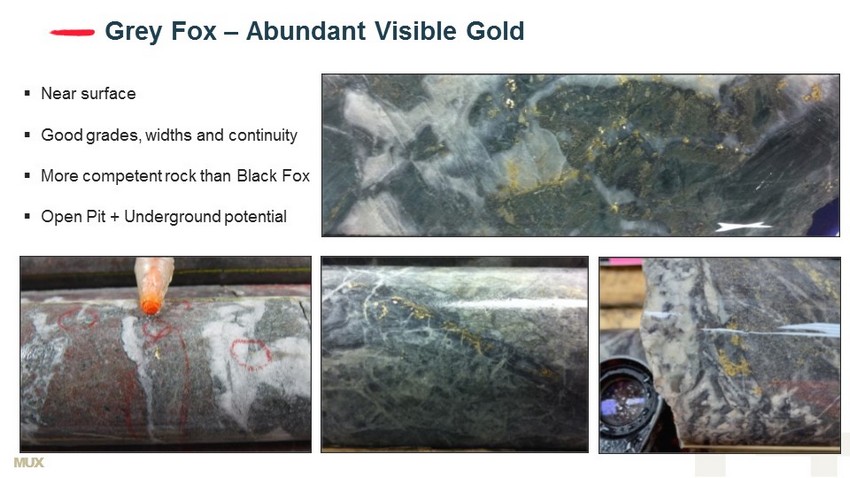
MUX Grey Fox – Abundant Visible Gold ▪ Near surface ▪ Good grades, widths and continuity ▪ More competent rock than Black Fox ▪ Open Pit + Underground potential
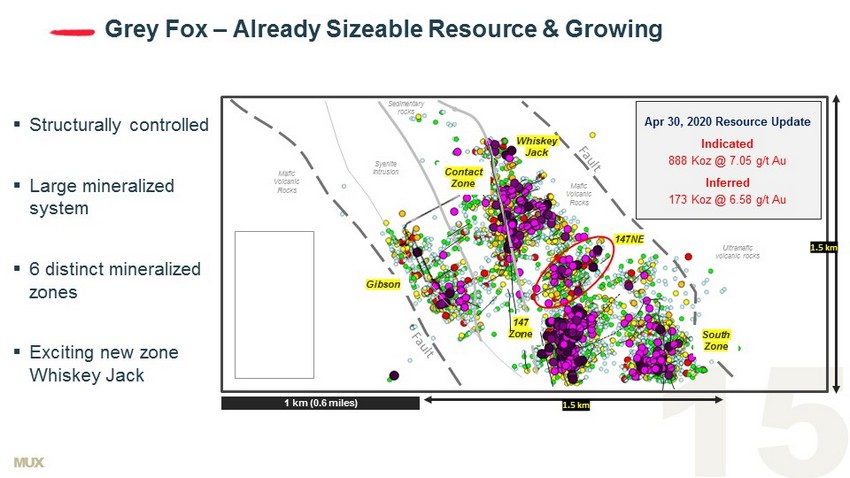
MUX 1 km (0.6 miles) 1.5 km 1.5 km Sedimentary rocks Syenite Intrusion Mafic Volcanic Rocks Mafic Volcanic Rocks 147 Zone Contact Zone Gibson South Zone 147NE Whiskey Jack Apr 30, 2020 Resource Update Indicated 888 Koz @ 7.05 g/t Au Inferred 173 Koz @ 6.58 g/t Au Ultramafic volcanic rocks Grey Fox – Already Sizeable Resource & Growing ▪ Structurally controlled ▪ Large mineralized system ▪ 6 distinct mineralized zones ▪ Exciting new zone Whiskey Jack
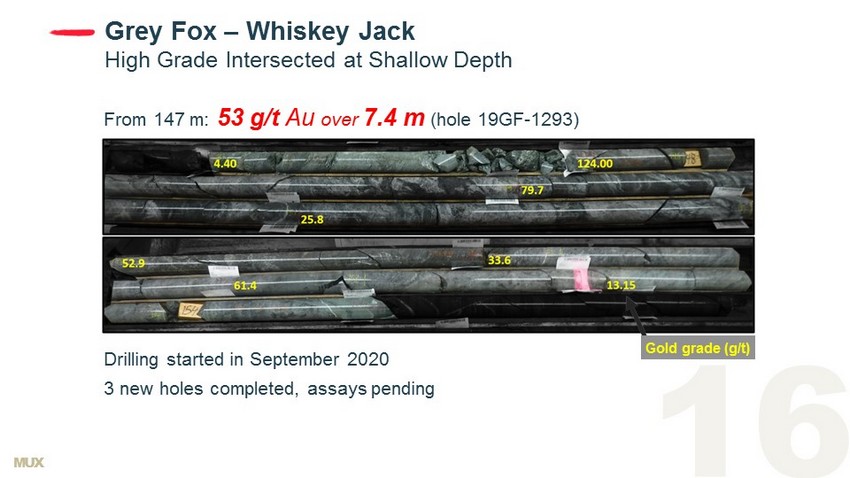
MUX From 147 m: 53 g/t Au over 7.4 m (hole 19GF - 1293) Grey Fox – Whiskey Jack High Grade Intersected at Shallow Depth Gold grade (g/t) Drilling started in September 2020 3 new holes completed, assays pending
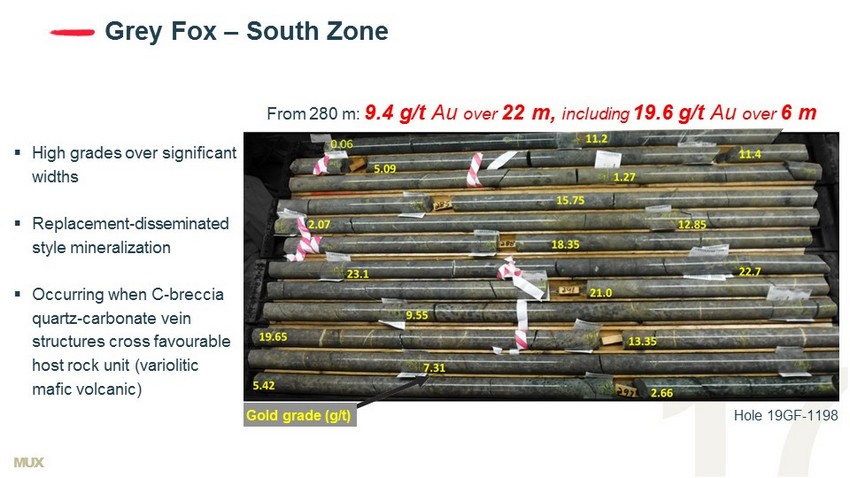
MUX Grey Fox – South Zone From 280 m: 9.4 g/t Au over 22 m, including 19.6 g/t Au over 6 m ▪ High grades over significant widths ▪ Replacement - disseminated style mineralization ▪ Occurring when C - breccia quartz - carbonate vein structures cross favourable host rock unit (variolitic mafic volcanic) Gold grade (g/t) Hole 19GF - 1198
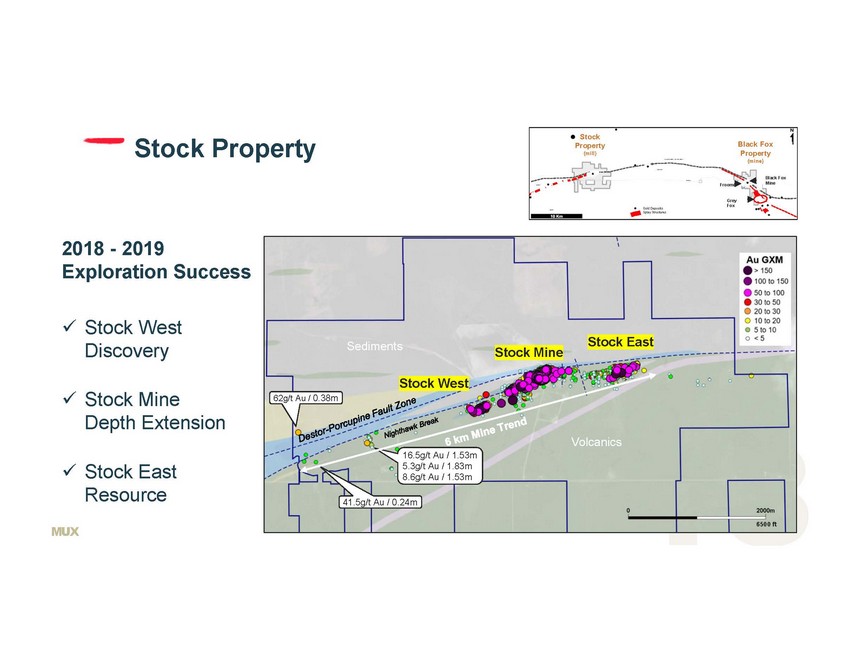
2018 - 2019 Exploration Success Stock Property 62g/t Au / 0.38m 41.5g/t Au / 0.24m 16.5g/t Au / 1.53m 5.3g/t Au / 1.83m 8.6g/t Au / 1.53m Sediments Volcanics Stock West Stock Mine Stock East 6500 ft x Stock West Discovery x Stock Mine Depth Extension x Stock East Resource Stock Property (mill) Froome Gold Deposits Splay Structures Black Fox Property (mine) Black Fox Mine
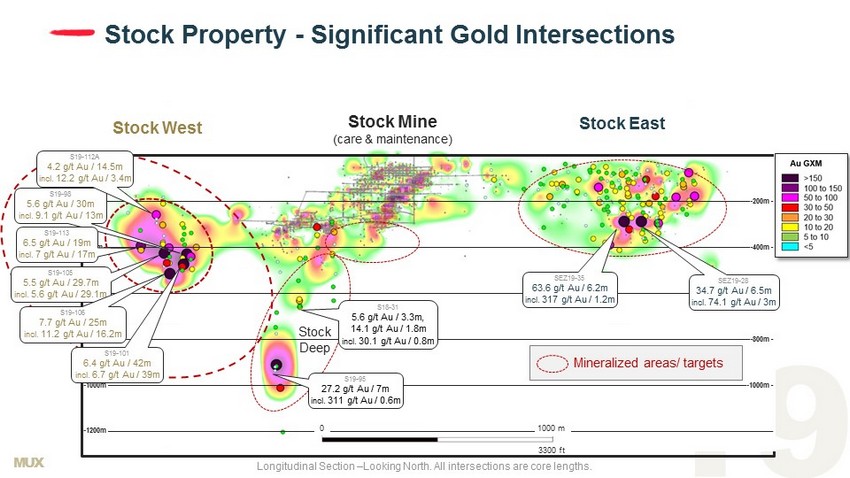
MUX - 200m - 400m - 600m - 800m - 1000m - 1200m - 200m - 400m - 600m - 800m - 1000m Stock Property - Significant Gold Intersections Stock West Stock Mine (care & maintenance) Stock East 1000 m 0 Mineralized areas/ targets S19 - 95 27.2 g/t Au / 7m incl. 311 g/t Au / 0.6m S18 - 31 5.6 g/t Au / 3.3m, 14.1 g/t Au / 1.8m incl. 30.1 g/t Au / 0.8m SEZ19 - 28 34.7 g/t Au / 6.5m incl. 74.1 g/t Au / 3m SEZ19 - 35 63.6 g/t Au / 6.2m incl. 317 g/t Au / 1.2m S19 - 98 5.6 g/t Au / 30m incl. 9.1 g/t Au / 13m S19 - 105 5.5 g/t Au / 29.7m incl. 5.6 g/t Au / 29.1m S19 - 106 7.7 g/t Au / 25m incl. 11.2 g/t Au / 16.2m S19 - 113 6.5 g/t Au / 19m incl. 7 g/t Au / 17m S19 - 112A 4.2 g/t Au / 14.5m incl. 12.2 g/t Au / 3.4m S19 - 101 6.4 g/t Au / 42m incl. 6.7 g/t Au / 39m Longitudinal Section – Looking North. All intersections are core lengths. 3300 ft Stock Deep
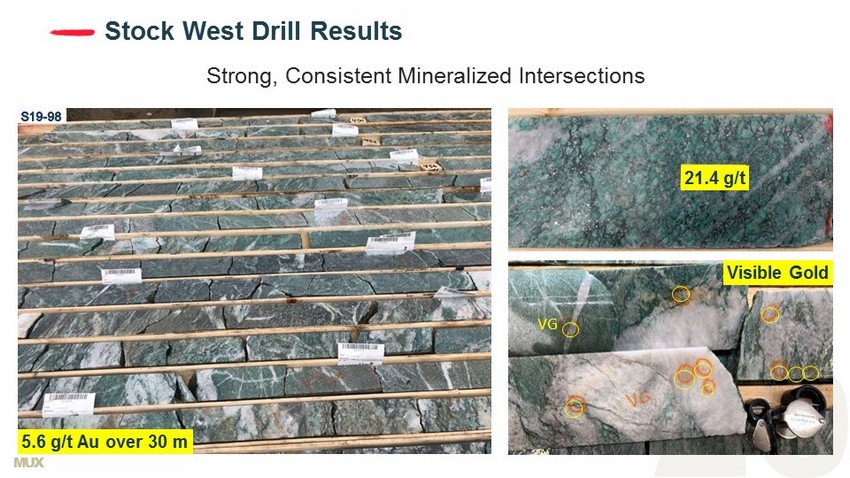
MUX Stock West Drill Results Strong, Consistent Mineralized Intersections VG 21.4 g/t Visible Gold 5.6 g/t Au over 30 m
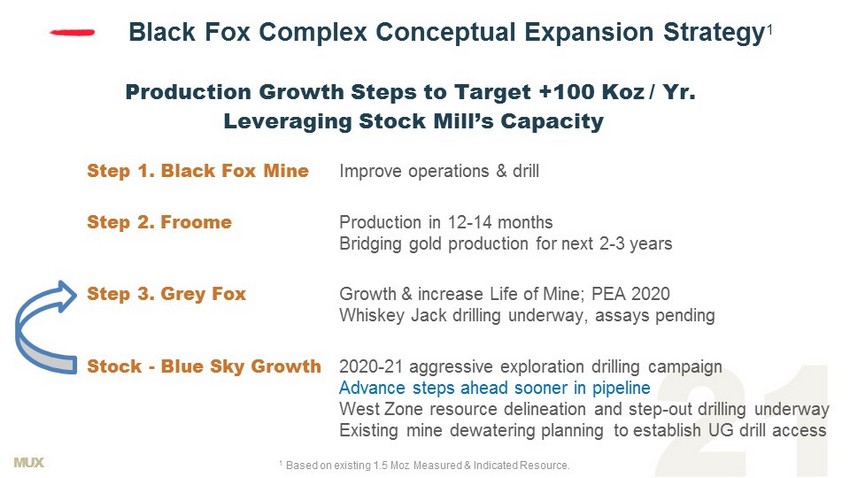
MUX Black Fox Complex Conceptual Expansion Strategy 1 Production Growth Steps to Target +100 Koz / Yr. Leveraging Stock Mill’s Capacity 1 Based on existing 1.5 Moz Measured & Indicated Resource. Step 1. Black Fox Mine Improve operations & drill Step 2. Froome Production in 12 - 14 months Bridging gold production for next 2 - 3 years Step 3. Grey Fox Growth & increase Life of Mine; PEA 2020 Whiskey Jack drilling underway, assays pending Stock - Blue Sky Growth 2020 - 21 aggressive exploration drilling campaign Advance steps ahead sooner in pipeline West Zone resource delineation and step - out drilling underway Existing mine dewatering planning to establish UG drill access
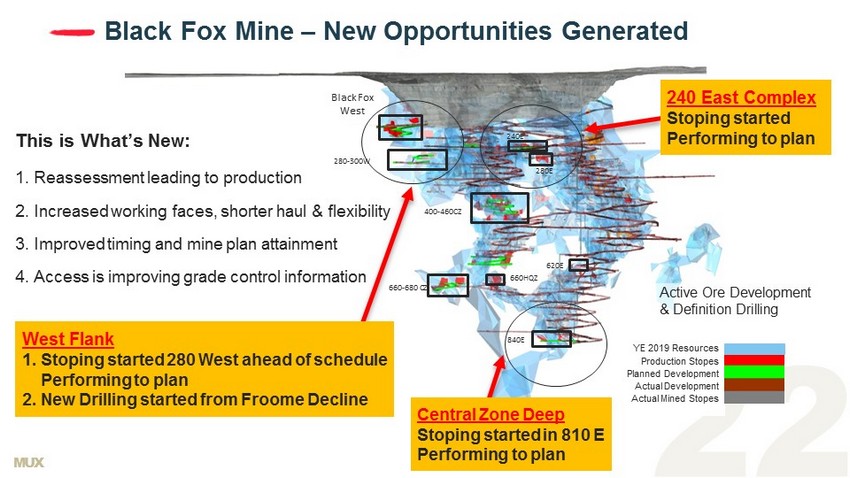
MUX 840E 660HQZ 660 - 680 CZ 400 - 460CZ Black Fox West 280 - 300W 280E 240E 620E YE 2019 Resources Production Stopes Planned Development Actual Development Actual Mined Stopes Black Fox Mine – New Opportunities Generated Active Ore Development & Definition Drilling This is What’s New: 1. Reassessment leading to production 2. Increased working faces, shorter haul & flexibility 3. Improved timing and mine plan attainment 4. Access is improving grade control information 240 East Complex Stoping started Performing to plan Central Zone Deep Stoping started in 810 E Performing to plan West Flank 1. Stoping started 280 West ahead of schedule Performing to plan 2. New Drilling started from Froome Decline
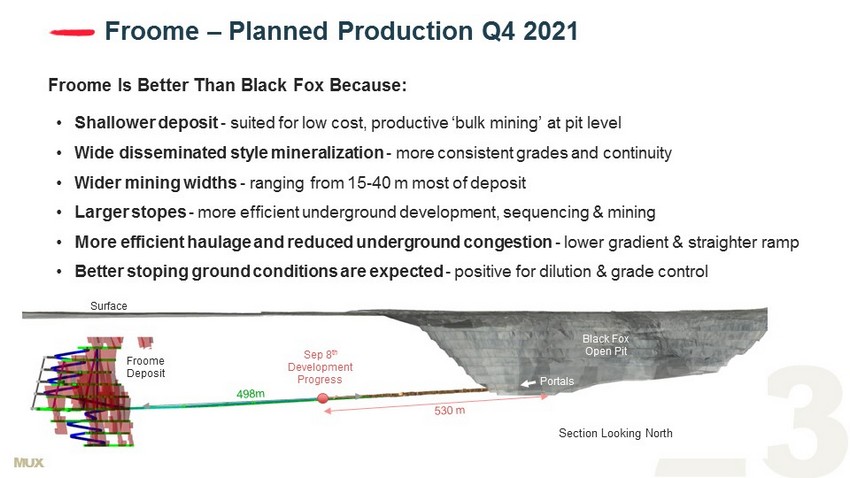
MUX Froome – Planned Production Q4 2021 Froome Is Better Than Black Fox Because: • Shallower deposit - suited for low cost, productive ‘bulk mining’ at pit level • Wide disseminated style mineralization - more consistent grades and continuity • Wider mining widths - ranging from 15 - 40 m most of deposit • Larger stopes - more efficient underground development, sequencing & mining • More efficient haulage and reduced underground congestion - lower gradient & straighter ramp • Better stoping ground conditions are expected - positive for dilution & grade control Section Looking North Sep 8 th Development Progress Portals Black Fox Open Pit Surface Froome Deposit

MUX Numbers in yellow represent grams per tonne values over sample length Froome Deposit – Typical Core Intersection Silicified metasediments cut by quartz - ankerite veinlets & breccias with up to 5% disseminated fine grained pyrite Shown below is an example core interval of the wide zone, favorable ground conditions expected From 127 m: 4.55 g/t Au over 53 m , incl. 8.92 g/t Au over 10.6 m (hole # 15PR - G031 ) Gold grade (g/t)
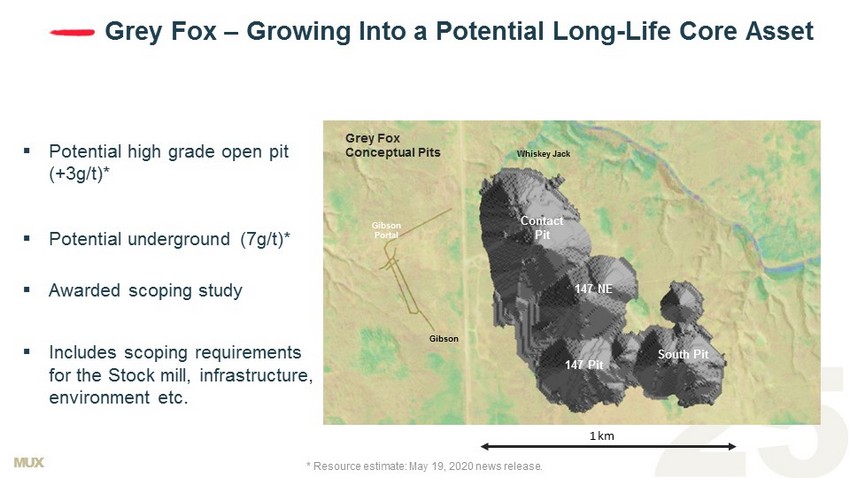
MUX Gibson Portal 147 NE Contact Pit 147 Pit Gibson South Pit 1 km Whiskey Jack NORTH ▪ Potential high grade open pit (+3g/t)* ▪ Potential underground (7g/t)* ▪ Awarded scoping study ▪ Includes scoping requirements for the Stock mill, infrastructure, environment etc. Grey Fox – Growing Into a Potential L ong - Life Core Asset Grey Fox Conceptual Pits * Resource estimate: May 19, 2020 news release.
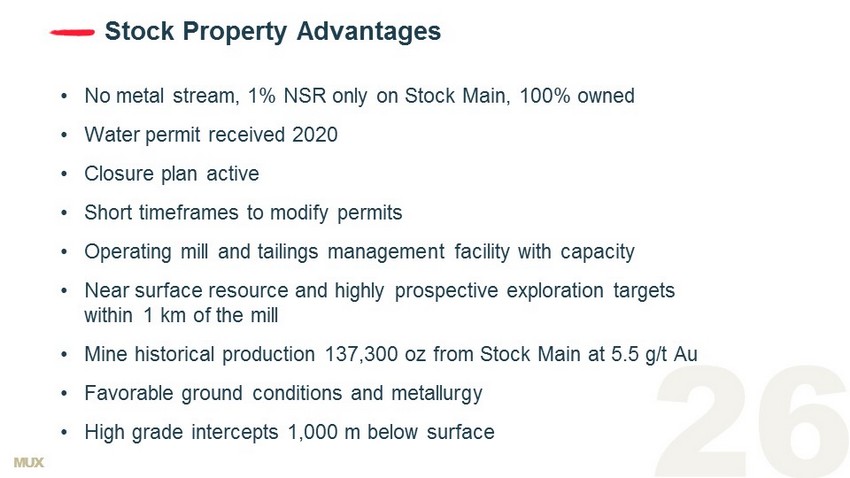
MUX Stock Property Advantages • No metal stream, 1% NSR only on Stock Main, 100% owned • Water permit received 2020 • Closure plan active • Short timeframes to modify permits • Operating mill and tailings management facility with capacity • Near surface resource and highly prospective exploration targets within 1 km of the mill • Mine historical production 137,300 oz from Stock Main at 5.5 g/t Au • Favorable ground conditions and metallurgy • High grade intercepts 1,000 m below surface

MUX Nevada, Prime Real Estate for Gold Cortez Nevada Gold Mines Cortez 50 Moz Au cluster 1 Fourmile Discovery Goldrush MUX Property NGM Property Faults Gold Bar Complex 20 k m 1 . Includes past production and current resources. Underexplored with Upside Potential x Surface near mine & deeper targets x Oxide & sulfide Legend Gold Bar Nevada, USA 12 miles N On Trend - Similar Geology Criteria Cortez & Gold Bar Large footprint, shallow oxide gold x Host rock, alteration, mineralization style x Major faults, structural traps x Intrusions x

MUX Old Gold Bar Gold Bar – Exploration Potential Gold Bar South Pot Canyon Gold Canyon Cabin Creek Pick ▪ Extensions of known deposits (Gold Bar and Gold Bar South) ▪ Follow - up on positive drill intersections ▪ Deeper targets – game - changer discovery potential Hunter Taurus Horse Canyon Rutabaga Gold Stone Ridge 6,100 m Gold Bar

MUX Gold Bar Operations – Ramp up Going Well Turnaround On - Track Q3 2020 x Recruitment key personnel nearly completed x Resource model and pit optimizations completed; mine plan and scheduling underway x Mining efficiencies improving x Operating on day and night shifts x Ramp - up of gold production progressing well trending slightly ahead of schedule x On target for positive cashflow in Q4 – Ore, grade and process control improvement plans underway – Asset management strategy and maintenance improvement plans underway – Reserve update in Q4 Gold Bar Nevada
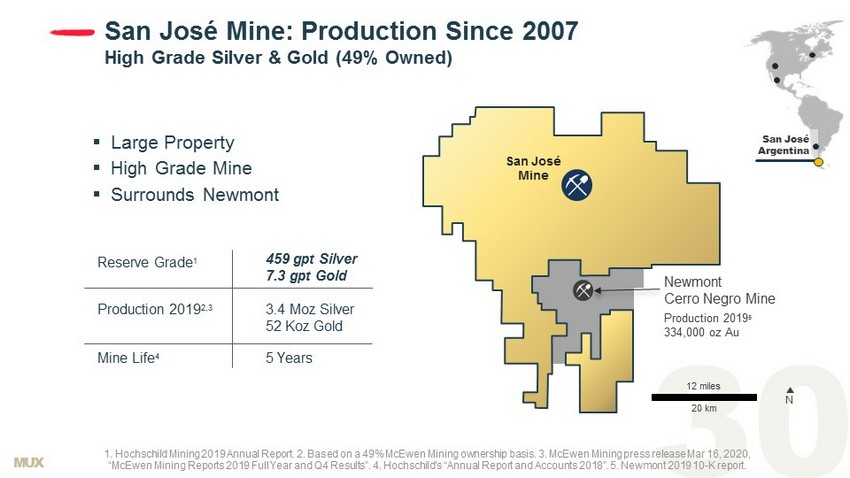
MUX San José Argentina 1. Hochschild Mining 2019 Annual Report. 2. Based on a 49% McEwen Mining ownership basis. 3. McEwen Mining press release Mar 16, 2020, “McEwen Mining Reports 2019 Full Year and Q4 Results". 4. Hochschild’s “Annual Report and Accounts 2018”. 5. Newmont 2019 10 - K r eport. San José Mine N Production 2019 5 334,000 oz Au 20 k m Newmont Cerro Negro Mine Reserve Grade 1 Production 2019 2,3 Mine Life 4 459 gpt Silver 7.3 gpt Gold 3.4 Moz Silver 52 Koz Gold 5 Years 12 miles San José Mine: Production Since 2007 High Grade Silver & Gold (49% Owned) ▪ Large Property ▪ High Grade Mine ▪ Surrounds Newmont
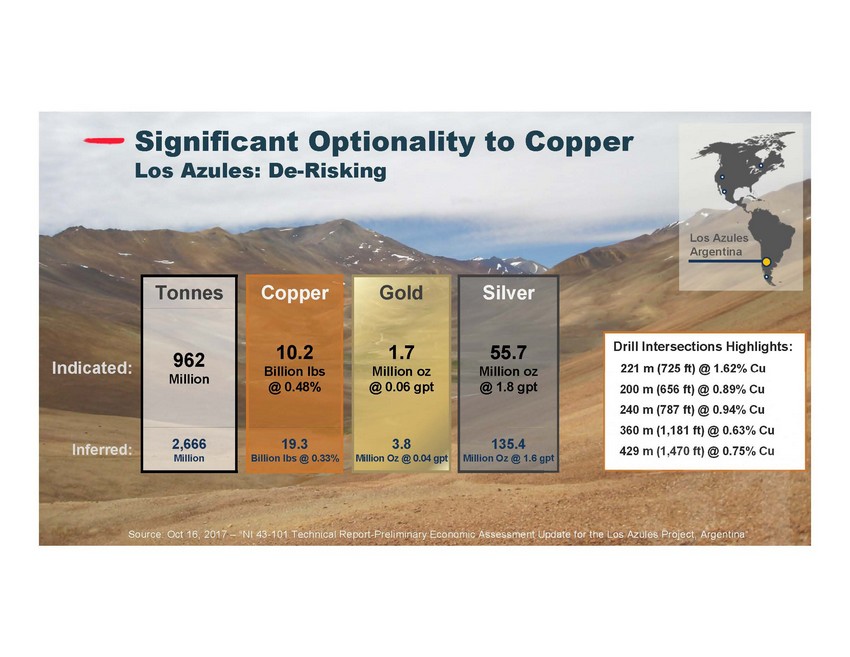
Significant Optionality to Copper Los Azules: De-Risking Drill Intersections Highlights: 221 m (725 ft) @ 1.62% Cu 200 m (656 ft) @ 0.89% Cu 240 m (787 ft) @ 0.94% Cu 360 m (1,181 ft) @ 0.63% Cu 429 m (1,470 ft) @ 0.75% Cu Los Azules Argentina Tonnes Copper Gold Silver Indicated: 962 Million 10.2 Billion lbs @ 0.48% 1.7 Million oz @ 0.06 gpt 55.7 Million oz @ 1.8 gpt Inferred: 2,666 Million 19.3 Billion lbs @ 0.33% 3.8 Million Oz @ 0.04 gpt 135.4 Million Oz @ 1.6 gpt Source: Oct 16, 2017 – “NI 43-101 Technical Report-Preliminary Economic Assessment Update for the Los Azules Project, Argentina”.
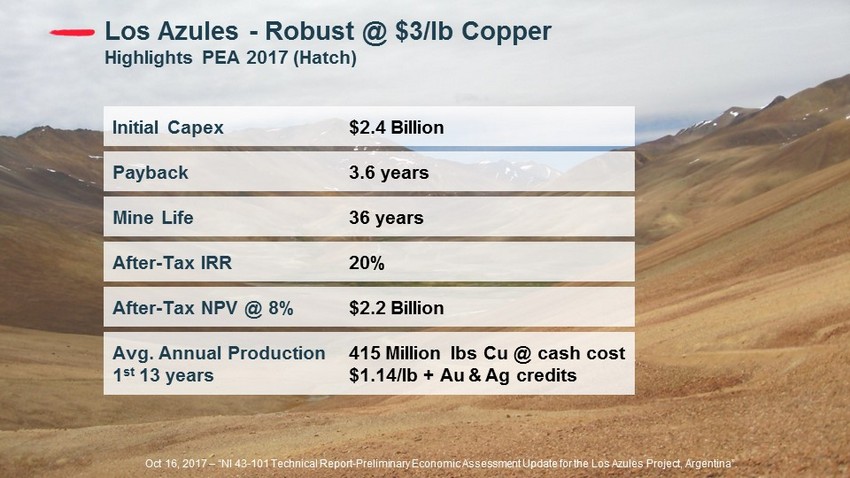
MUX Los Azules - Robust @ $3/lb Copper Highlights PEA 2017 (Hatch) Oct 16, 2017 – “NI 43 - 101 Technical Report - Preliminary Economic Assessment Update for the Los Azules Project, Argentina”. Initial Capex $2.4 Billion Payback Mine Life After - Tax IRR After - Tax NPV @ 8% Avg. Annual Production 1 st 13 years 3.6 years 36 years 20% $2.2 Billion 415 Million lbs Cu @ cash cost $1.14/ lb + Au & Ag credits
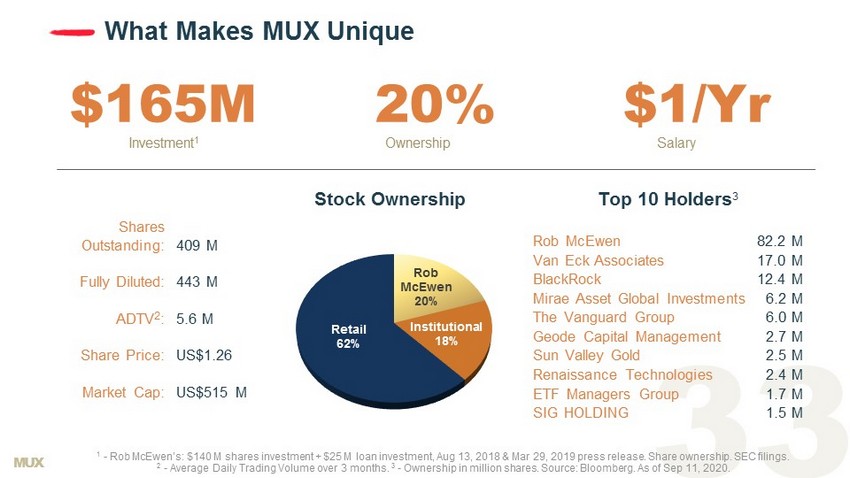
MUX What Makes MUX Unique $16 5 M 2 0 % $1/ Y r Investment 1 Ownership Salary Rob McEwen 20% Institutional 18% Retail 62% 1 - Rob McEwen’s: $1 40 M shares investment + $25 M loan investment, Aug 13, 2018 & Mar 29, 2019 press release. Share ownership. SEC filings. 2 - Average Daily Trading Volume over 3 months. 3 - Ownership in million shares. Source: Bloomberg. As of Sep 11, 2020. Rob McEwen 82.2 M Van Eck Associates 17.0 M BlackRock 12.4 M Mirae Asset Global Investments 6.2 M The Vanguard Group 6.0 M Geode Capital Management 2.7 M Sun Valley Gold 2.5 M Renaissance Technologies 2.4 M ETF Managers Group 1.7 M SIG HOLDING 1.5 M Shares Outstanding: Fully Diluted: ADTV 2 : Share Price: Market Cap: 409 M 443 M 5.6 M US$1.26 US$515 M Top 10 Holders 3 Stock Ownership
MUX Near Term Catalysts • Improving operational performance • Growth pipeline milestones - technical reports Q4 2020 – Black Fox Complex expansion PEA – Fenix Feasibility Study – Gold Bar Pick and South Resource & Reserve update • Exploration drill programs at Grey Fox and Stock

Appendix
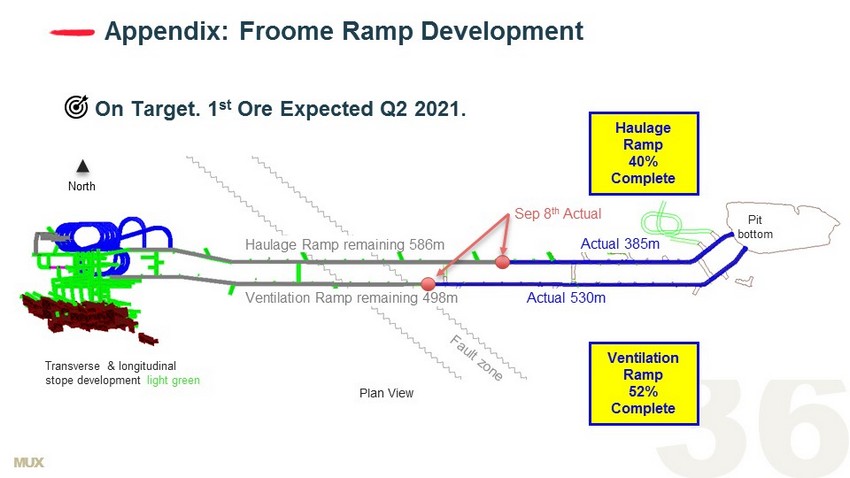
MUX Appendix: Froome Ramp Development On Target. 1 st Ore Expected Q2 2021. Black Fox Pit Actual 530m Actual 385m Ventilation Ramp remaining 498m Haulage Ramp remaining 586m Haulage Ramp 40% Complete Ventilation Ramp 52% Complete Sep 8 th Actual Plan View North Pit bottom Transverse & longitudinal stope development light green
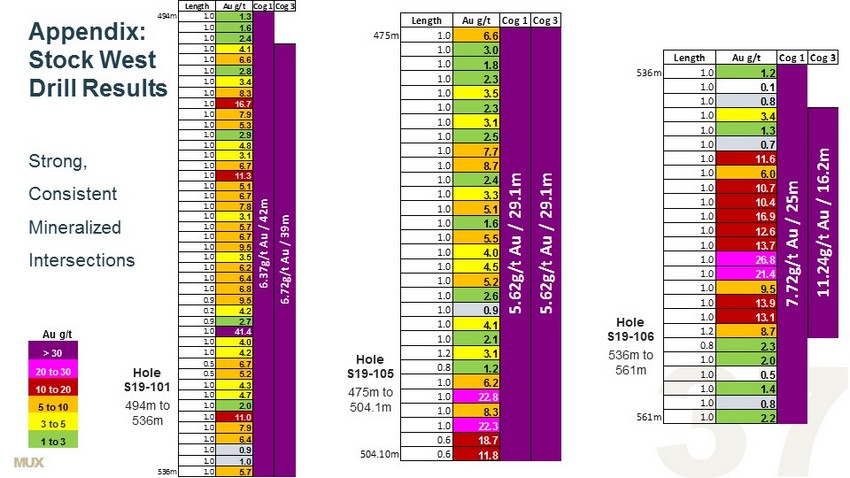
MUX Strong, Consistent Mineralized Intersections Length Au g/t Cog 1Cog 3 475m 1.0 6.6 1.0 3.0 1.0 1.8 1.0 2.3 1.0 3.5 1.0 2.3 1.0 3.1 1.0 2.5 1.0 7.7 1.0 8.7 1.0 2.4 1.0 3.3 1.0 5.1 1.0 1.6 1.0 5.5 1.0 4.0 1.0 4.5 1.0 5.2 1.0 2.6 1.0 0.9 1.0 4.1 1.0 2.1 1.2 3.1 0.8 1.2 1.0 6.2 1.0 22.8 1.0 8.3 1.0 22.3 0.6 18.7 504.10m 0.6 11.8 5.62g/t Au / 29.1m5.62g/t Au / 29.1m Length Au g/t Cog 1Cog 3 536m 1.0 1.2 1.0 0.1 1.0 0.8 1.0 3.4 1.0 1.3 1.0 0.7 1.0 11.6 1.0 6.0 1.0 10.7 1.0 10.4 1.0 16.9 1.0 12.6 1.0 13.7 1.0 26.8 1.0 21.4 1.0 9.5 1.0 13.9 1.0 13.1 1.2 8.7 0.8 2.3 1.0 2.0 1.0 0.5 1.0 1.4 1.0 0.8 561m 1.0 2.2 7.72g/t Au / 25m 11.24g/t Au / 16.2m Hole S19 - 106 536m to 561m Hole S19 - 101 494m to 536m Length Au g/t Cog 1Cog 3 494m 1.0 1.3 1.0 1.6 1.0 2.4 1.0 4.1 1.0 6.6 1.0 2.8 1.0 3.4 1.0 8.3 1.0 16.7 1.0 7.9 1.0 5.3 1.0 2.9 1.0 4.8 1.0 3.1 1.0 6.7 1.0 11.3 1.0 5.1 1.0 6.7 1.0 7.8 1.0 3.1 1.0 5.7 1.0 6.7 1.0 9.5 1.0 3.5 1.0 6.2 1.0 6.4 1.0 6.8 0.9 9.5 0.2 4.2 0.9 2.7 1.0 41.4 1.0 4.0 1.0 4.2 0.5 6.7 0.5 5.2 1.0 4.3 1.0 4.7 1.0 2.0 1.0 11.0 1.0 7.9 1.0 6.4 1.0 0.9 1.0 1.0 536m 1.0 5.7 6.37g/t Au / 42m 6.72g/t Au / 39m Hole S19 - 105 475m to 504.1m Au g/t > 30 20 to 30 10 to 20 5 to 10 3 to 5 1 to 3 Appendix: Stock West Drill Results
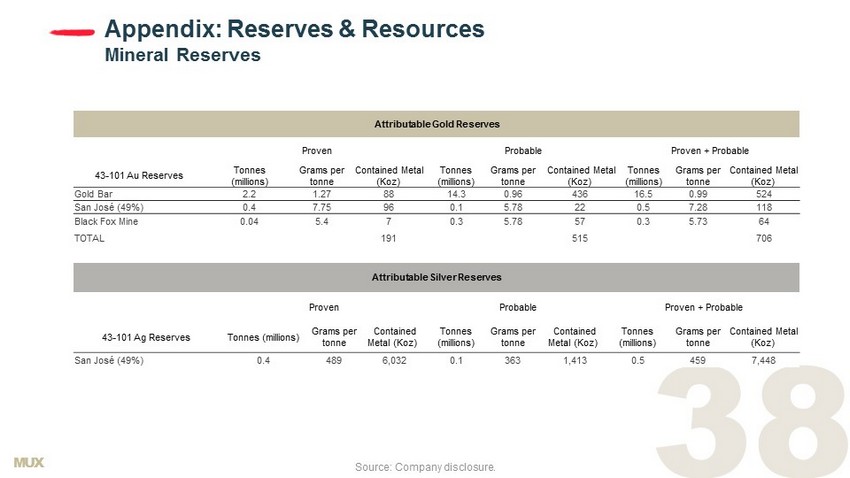
MUX Appendix: Reserves & Resources Mineral Reserves Source: Company disclosure. Attributable Gold Reserves Proven Probable Proven + Probable 43 - 101 Au Reserves Tonnes (millions) Grams per tonne Contained Metal (Koz) Tonnes (millions) Grams per tonne Contained Metal (Koz) Tonnes (millions) Grams per tonne Contained Metal (Koz) Gold Bar 2.2 1.27 88 14.3 0.96 436 16.5 0.99 524 San José (49%) 0.4 7.75 96 0.1 5.78 22 0.5 7.28 118 Black Fox Mine 0.04 5.4 7 0.3 5.78 57 0.3 5.73 64 TOTAL 191 515 706 Attributable Silver Reserves Proven Probable Proven + Probable 43 - 101 Ag Reserves Tonnes (millions) Grams per tonne Contained Metal (Koz) Tonnes (millions) Grams per tonne Contained Metal (Koz) Tonnes (millions) Grams per tonne Contained Metal (Koz) San José (49%) 0.4 489 6,032 0.1 363 1,413 0.5 459 7,448
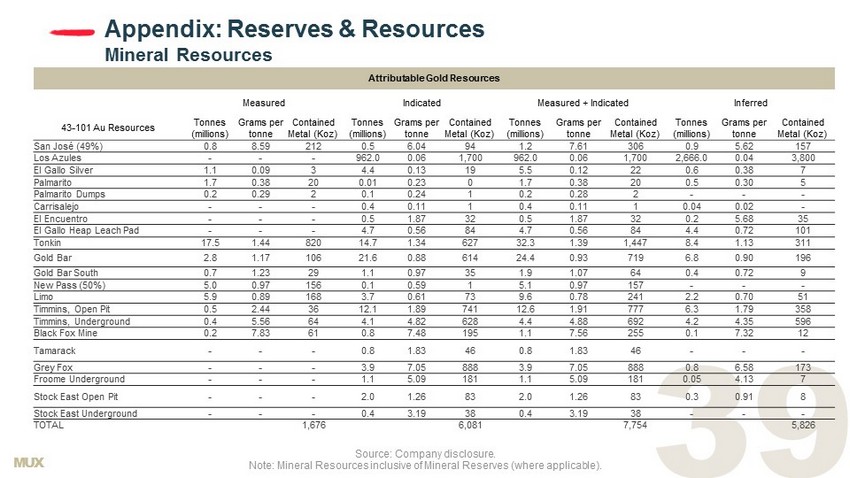
MUX Appendix: Reserves & Resources Mineral Resources Attributable Gold Resources Measured Indicated Measured + Indicated Inferred 43 - 101 Au Resources Tonnes (millions) Grams per tonne Contained Metal (Koz) Tonnes (millions) Grams per tonne Contained Metal (Koz) Tonnes (millions) Grams per tonne Contained Metal (Koz) Tonnes (millions) Grams per tonne Contained Metal (Koz) San José (49%) 0.8 8.59 212 0.5 6.04 94 1.2 7.61 306 0.9 5.62 157 Los Azules - - - 962.0 0.06 1,700 962.0 0.06 1,700 2,666.0 0.04 3,800 El Gallo Silver 1.1 0.09 3 4.4 0.13 19 5.5 0.12 22 0.6 0.38 7 Palmarito 1.7 0.38 20 0.01 0.23 0 1.7 0.38 20 0.5 0.30 5 Palmarito Dumps 0.2 0.29 2 0.1 0.24 1 0.2 0.28 2 - - - Carrisalejo - - - 0.4 0.11 1 0.4 0.11 1 0.04 0.02 - El Encuentro - - - 0.5 1.87 32 0.5 1.87 32 0.2 5.68 35 El Gallo Heap Leach Pad - - - 4.7 0.56 84 4.7 0.56 84 4.4 0.72 101 Tonkin 17.5 1.44 820 14.7 1.34 627 32.3 1.39 1,447 8.4 1.13 311 Gold Bar 2.8 1.17 106 21.6 0.88 614 24.4 0.93 719 6.8 0.90 196 Gold Bar South 0.7 1.23 29 1.1 0.97 35 1.9 1.07 64 0.4 0.72 9 New Pass (50%) 5.0 0.97 156 0.1 0.59 1 5.1 0.97 157 - - - Limo 5.9 0.89 168 3.7 0.61 73 9.6 0.78 241 2.2 0.70 51 Timmins, Open Pit 0.5 2.44 36 12.1 1.89 741 12.6 1.91 777 6.3 1.79 358 Timmins, Underground 0.4 5.56 64 4.1 4.82 628 4.4 4.88 692 4.2 4.35 596 Black Fox Mine 0.2 7.83 61 0.8 7.48 195 1.1 7.56 255 0.1 7.32 12 Tamarack - - - 0.8 1.83 46 0.8 1.83 46 - - - Grey Fox - - - 3 .9 7.05 8 88 3 .9 7.05 8 88 0.8 6.58 173 Froome Underground - - - 1.1 5.09 181 1.1 5.09 181 0.05 4.13 7 Stock East Open Pit - - - 2.0 1.26 83 2.0 1.26 83 0.3 0.91 8 Stock East Underground - - - 0.4 3.19 38 0.4 3.19 38 - - - TOTAL 1,676 6,081 7,754 5,826 Source: Company disclosure. Note: Mineral Resources inclusive of Mineral Reserves (where applicable).
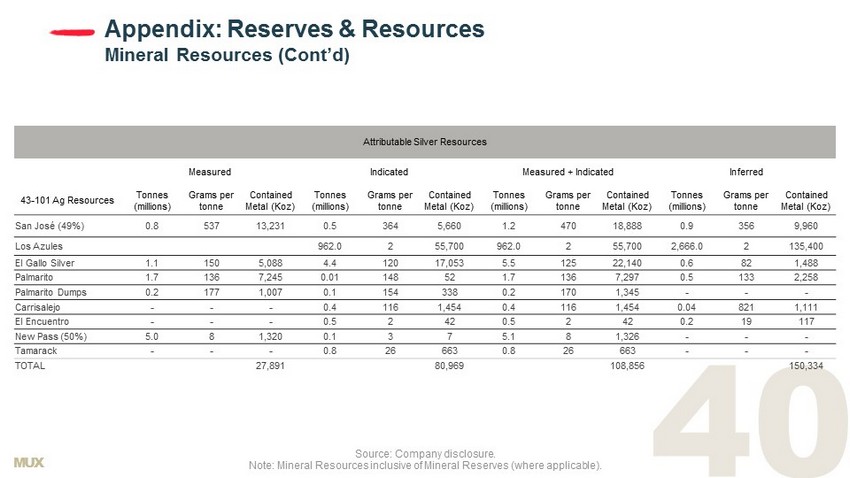
MUX Appendix: Reserves & Resources Mineral Resources (Cont’d) Source: Company disclosure. Note: Mineral Resources inclusive of Mineral Reserves (where applicable). Attributable Silver Resources Measured Indicated Measured + Indicated Inferred 43 - 101 Ag Resources Tonnes (millions) Grams per tonne Contained Metal (Koz) Tonnes (millions) Grams per tonne Contained Metal (Koz) Tonnes (millions) Grams per tonne Contained Metal (Koz) Tonnes (millions) Grams per tonne Contained Metal (Koz) San José (49%) 0.8 537 13,231 0.5 364 5,660 1.2 470 18,888 0.9 356 9,960 Los Azules 962.0 2 55,700 962.0 2 55,700 2,666.0 2 135,400 El Gallo Silver 1.1 150 5,088 4.4 120 17,053 5.5 125 22,140 0.6 82 1,488 Palmarito 1.7 136 7,245 0.01 148 52 1.7 136 7,297 0.5 133 2,258 Palmarito Dumps 0.2 177 1,007 0.1 154 338 0.2 170 1,345 - - - Carrisalejo - - - 0.4 116 1,454 0.4 116 1,454 0.04 821 1,111 El Encuentro - - - 0.5 2 42 0.5 2 42 0.2 19 117 New Pass (50%) 5.0 8 1,320 0.1 3 7 5.1 8 1,326 - - - Tamarack - - - 0.8 26 663 0.8 26 663 - - - TOTAL 27,891 80,969 108,856 150,334
MUX Appendix: Cautionary Note Regarding NON - GAAP Measures In this presentation, we have provided information prepared or calculated according to U . S . GAAP, as well as provided some non - U . S . GAAP ("non - GAAP") performance measures . Because the non - GAAP performance measures do not have any standardized meaning prescribed by U . S . GAAP, they may not be comparable to similar measures presented by other companies . Total Cash Costs per GEO, and All - in Sustaining Costs (“AISC”) per GEO . Total cash costs consist of mining, processing, on - site general and administrative costs, community and permitting costs related to current explorations, royalty costs, refining and treatment charges (for both doré and concentrate products), sales costs, export taxes and operational stripping costs . All - in sustaining cash costs consist of total cash costs (as described above), plus environmental rehabilitation costs, amortization of the asset retirement costs related to operating sites, sustaining exploration and development costs, and sustaining capital expenditures . In order to arrive at our consolidated all - in sustaining costs, we also include corporate general and administrative expenses . Depreciation is excluded from both total cash costs and all - in sustaining cash costs . For both total cash costs and all - in sustaining costs we include our attributable share of total cash costs from operations where we hold less than a 100 % economic share in the production, such as MSC, where we hold a 49 % interest . Total cash cost and all - in sustaining cash cost per GEO sold are calculated on a co - product basis by dividing the respective proportionate share of the total cash costs and all - in sustaining cash costs for the period attributable to each metal by the ounces of each respective metal sold . We use and report these measures to provide additional information regarding operational efficiencies both on a consolidated and an individual mine basis, and believe that these measures provide investors and analysts with useful information about our underlying costs of operations . A reconciliation to the nearest U . S . GAAP measure is provided in McEwen Mining's Annual Report on Form 10 - K for the year ended December 31 , 2019 . Earnings from Mining Operations The term Earnings from Mining Operations used in this presentation is a non - GAAP financial measure . We use and report this measure because we believe it provides investors and analysts with a useful measure of the underlying earnings from our mining operations . We define Earnings from Mining Operations as Gold and Silver Revenues from our El Gallo Mine, Black Fox Mine, and our 49 % attributable share of the San José Mine's Net Sales, less their respective Production Costs Applicable to Sales . To the extent that Production Costs Applicable to Sales may include depreciation and amortization expense related to the fair value increments on historical business acquisitions (fair value paid in excess of the carrying value of the underlying assets and liabilities assumed on the date of acquisition), we deduct this expense in order to arrive at Production Costs Applicable to Sales that only include depreciation and amortization expense incurred at the mine - site level . The San José Mine Net Sales and Production Costs Applicable to Sales are presented, on a 100 % basis, in Note 5 of McEwen Mining's Annual Report on Form 10 - K for the year ended December 31 , 2019 . Cash, Investments and Precious Metals The term cash, investments and precious metals used in this presentation is a non - GAAP financial measure . We report this measure to better understand our liquidity in each reporting period . Cash, investments and precious metals is calculated as the sum of cash, investments and ounces of doré held in inventory, valued at the London P . M . Fix spot price at the corresponding period . A reconciliation to the most directly comparable U . S . GAAP measure, Sales of Gold and Silver, is provided in McEwen Mining's Annual Report on Form 10 - K for the year ended December 31 , 2019 .