Exhibit 99.1
Reasons to Buy MUX 1. Surfacing Copper Value 2.Turnaround in Progress 3. Unique Insider Ownership All figures in US Dollars H.C. Wainwright Mining Conference Nov 30 - Dec 1, 2021

MUX MUX: Cautionary Statement This presentation and the information included herein do not constitute an offer to buy or the solicitation of an offer to subscribe for or to buy any of the securities described herein, nor shall there be any sale of these securities in any jurisdiction in which such offer, solicitation or sale would be unlawful prior to registration or qualification under the securities laws of any such jurisdiction . This presentation contains certain forward - looking statements and information, including "forward - looking statements" within the meaning of the Private Securities Litigation Reform Act of 1995 ("Forward - looking Statements") . The Forward - looking Statements are intended to be subject to the safe harbor provided by Section 27 a of the Securities Act of 1933 , Section 21 e of the Securities Exchange Act of 1934 and Private Securities Litigation Reform Act of 1995 . The Forward - looking Statements express, as at the date of this presentation, McEwen Mining Inc . (the "Company") estimates, forecasts, projections, expectations or beliefs as to future events and results . Forward - looking Statements are necessarily based upon a number of estimates and assumptions that, while considered reasonable by management, are inherently subject to significant business, economic and competitive uncertainties, risks and contingencies . There can be no assurance that such statements and information will prove to be accurate . Therefore, actual results and future events could differ materially from those anticipated in such statements and information . Risks and uncertainties that could cause results or future events to differ materially from current expectations expressed or implied by the Forward - looking Statements include, but are not limited to, factors associated with fluctuations in the market price of precious metals, mining industry risks, political, economic, social and security risks associated with foreign operations, the ability of the corporation to receive or receive in a timely manner permits or other approvals required in connection with operations, risks associated with the construction of mining operations and commencement of production and the projected costs thereof, risks related to litigation, the state of the capital markets, environmental risks and hazards, uncertainty as to calculation of mineral resources and reserves, risk of delisting from a public exchange, and other risks . Readers should not place undue reliance on Forward - looking Statements, which speak only as of the date hereof . The Company undertakes no obligation to reissue or update Forward - looking Statements as a result of new information or events after the date hereof, except as required by law . See McEwen Mining's Annual Report on Form 10 - K for the fiscal year ended December 31 , 2020 , the Quarterly Report on Form 10 - Q for the quarters ended March 31 , 2021 , June 30 , 2021 , September 30 , 2021 , and other filings with the Securities and Exchange Commission (the “SEC”), under the caption "Risk Factors", for additional information on risks, uncertainties and other factors relating to the Forward - looking Statements . All Forward - looking Statements made in this presentation are qualified by this cautionary statement . Unless otherwise stated, all currency information quoted in this presentation is in U . S . dollars . The technical contents of this presentation, including reserves, have been reviewed and approved by Peter Mah , P . Eng . , COO ; the exploration technical contents of this presentation including resources content have been reviewed and approved by Stephen McGibbon, EVP Exploration and Luke Willis, P . Geo . , Director of Resource Modelling ; both are Qualified Persons as defined by Canadian Securities Administrators National Instrument 43 - 101 "Standards of Disclosure for Mineral Projects" . Securities and Exchange Commission (“SEC”) . Definitions of terms under NI 43 - 101 differ materially from the definitions of those and related terms in Industry Guide 7 (“Industry Guide 7 ”) promulgated by the SEC . Under U . S . standards, mineralization may not be classified as a “Reserve” unless a determination has been made that the mineralization could be economically and legally produced or extracted at the time the reserve determination is made . Under Industry Guide 7 standards, a “Final” or “Bankable” feasibility study or other report is required to report reserves, the three - year historical average precious metals prices are used in any reserve or cash flow analysis to designate reserves and the primary environmental analysis or report must be filed with the appropriate government authority . One consequence of these differences is that “reserves” calculated in accordance with Canadian standards may not be “Reserves” under Industry Guide 7 standards . U . S . investors should be aware that the McEwen Mining properties with reserves as defined by Industry Guide 7 are the Black Fox mine, the Gold Bar project and the San Jose mine . All other properties do not have “Reserves” as defined by Industry Guide 7 and Investors are cautioned not to assume that any part or all the disclosed mineralized material will be confirmed or converted into Industry Guide 7 compliant “Reserves” . MUX

Surfacing Value Los Azules Project San Juan, Argentina
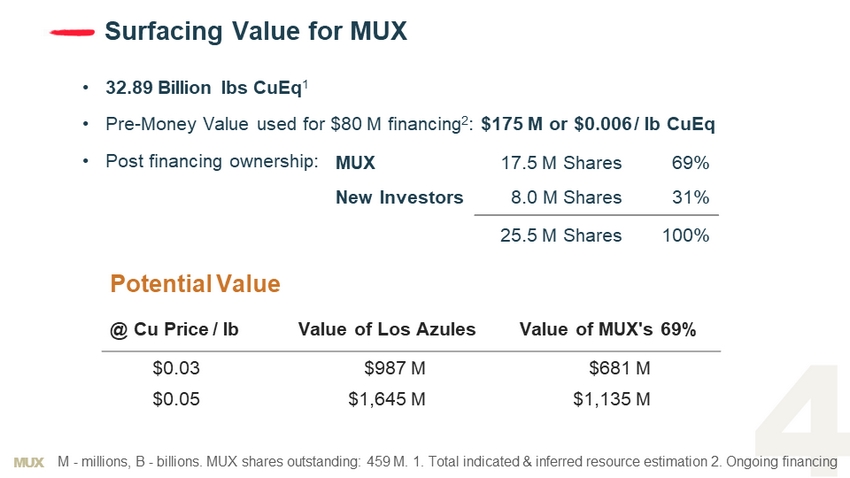
MUX Surfacing Value for MUX • 32.89 Billion lbs CuEq 1 • Pre - Money Value used for $80 M financing 2 : $175 M or $0.006 / lb CuEq • Post financing ownership: M - millions, B - billions. MUX shares outstanding: 459 M. 1. Total indicated & inferred resource estimation 2. Ongoing financin g Potential Value @ Cu Price / lb Value of Los Azules Value of MUX's 69% $0.03 $987 M $681 M $0.05 $1,645 M $1,135 M MUX 17.5 M Shares 69% New Investors 8.0 M Shares 31% 25.5 M Shares 100%
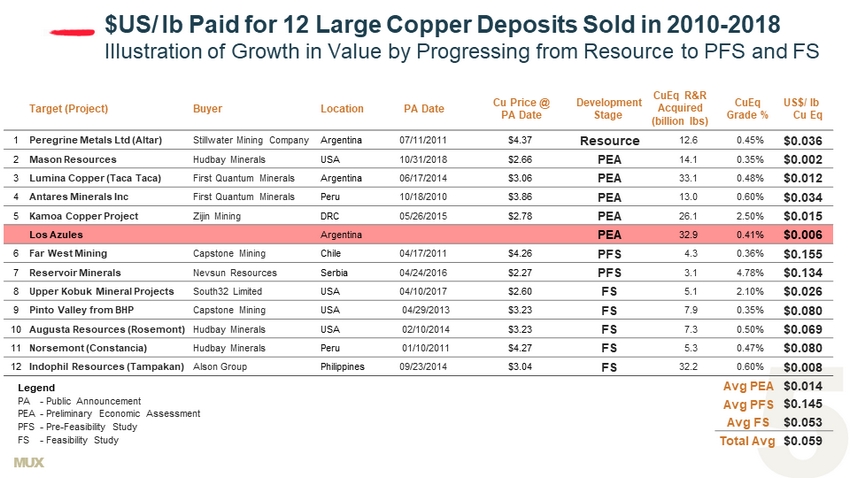
MUX Target (Project) Buyer Location PA Date Cu Price @ PA Date Development Stage CuEq R&R Acquired (billion lbs) CuEq Grade % US$/ lb Cu Eq 1 Peregrine Metals Ltd (Altar) Stillwater Mining Company Argentina 07/11/2011 $4.37 Resource 12.6 0.45% $0.036 2 Mason Resources Hudbay Minerals USA 10/31/2018 $2.66 PEA 14.1 0.35% $0.002 3 Lumina Copper (Taca Taca) First Quantum Minerals Argentina 06/17/2014 $3.06 PEA 33.1 0.48% $0.012 4 Antares Minerals Inc First Quantum Minerals Peru 10/18/2010 $3.86 PEA 13.0 0.60% $0.034 5 Kamoa Copper Project Zijin Mining DRC 05/26/2015 $2.78 PEA 26.1 2.50% $0.015 Los Azules Argentina PEA 32.9 0.41% $0.006 6 Far West Mining Capstone Mining Chile 04/17/2011 $4.26 PFS 4.3 0.36% $0.155 7 Reservoir Minerals Nevsun Resources Serbia 04/24/2016 $2.27 PFS 3.1 4.78% $0.134 8 Upper Kobuk Mineral Projects South32 Limited USA 04/10/2017 $2.60 FS 5.1 2.10% $0.026 9 Pinto Valley from BHP Capstone Mining USA 04/29/2013 $3.23 FS 7.9 0.35% $0.080 10 Augusta Resources (Rosemont) Hudbay Minerals USA 02/10/2014 $3.23 FS 7.3 0.50% $0.069 11 Norsemont (Constancia) Hudbay Minerals Peru 01/10/2011 $4.27 FS 5.3 0.47% $0.080 12 Indophil Resources (Tampakan) Alson Group Philippines 09/23/2014 $3.04 FS 32.2 0.60% $0.008 Avg PEA $0.014 Avg PFS $0.145 Avg FS $0.053 Total Avg $0.059 $US/ lb Paid for 12 Large Copper Deposits Sold in 2010 - 2018 Illustration of Growth in Value by Progressing from Resource to PFS and FS Legend PA - Public Announcement PEA - Preliminary Economic Assessment PFS - Pre - Feasibility Study FS - Feasibility Study
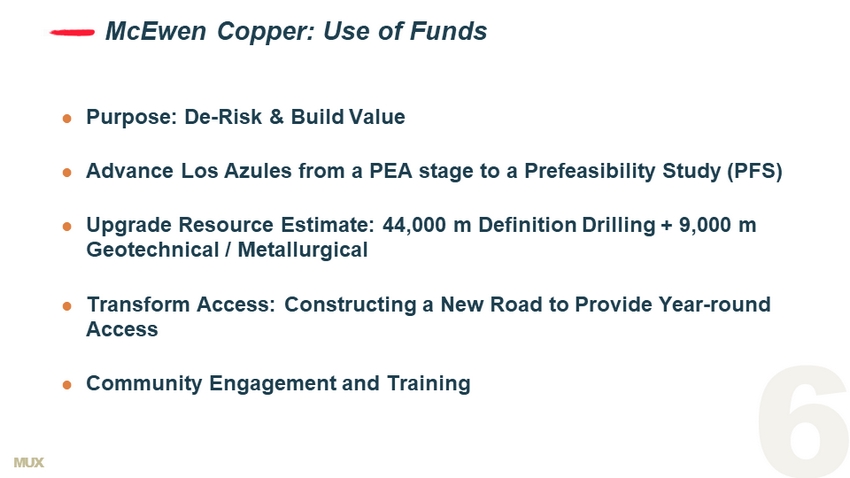
MUX McEwen Copper: Use of Funds Purpose: De - Risk & Build Value Advance Los Azules from a PEA stage to a Prefeasibility Study (PFS) Upgrade Resource Estimate: 44,000 m Definition Drilling + 9,000 m Geotechnical / Metallurgical Transform Access: Constructing a New Road to Provide Year - round Access Community Engagement and Training
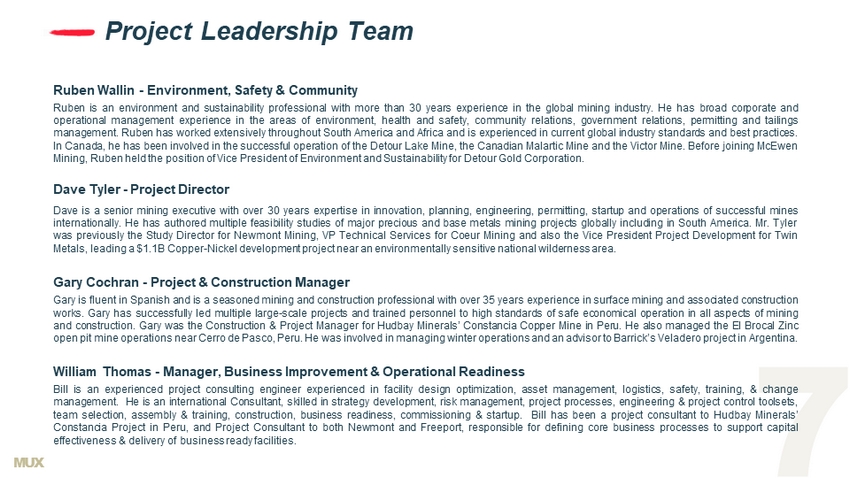
MUX Project Leadership Team Ruben Wallin - Environment, Safety & Community Ruben is an environment and sustainability professional with more than 30 years experience in the global mining industry . He has broad corporate and operational management experience in the areas of environment, health and safety, community relations, government relations, permitting and tailings management . Ruben has worked extensively throughout South America and Africa and is experienced in current global industry standards and best practices . In Canada, he has been involved in the successful operation of the Detour Lake Mine, the Canadian Malartic Mine and the Victor Mine . Before joining McEwen Mining, Ruben held the position of Vice President of Environment and Sustainability for Detour Gold Corporation . Dave Tyler - Project Director Dave is a senior mining executive with over 30 years expertise in innovation, planning, engineering, permitting, startup and operations of successful mines internationally . He has authored multiple feasibility studies of major precious and base metals mining projects globally including in South America . Mr . Tyler was previously the Study Director for Newmont Mining, VP Technical Services for Coeur Mining and also the Vice President Project Development for Twin Metals, leading a $ 1 . 1 B Copper - Nickel development project near an environmentally sensitive national wilderness area . Gary Cochran - Project & Construction Manager Gary is fluent in Spanish and is a seasoned mining and construction professional with over 35 years experience in surface mining and associated construction works . Gary has successfully led multiple large - scale projects and trained personnel to high standards of safe economical operation in all aspects of mining and construction . Gary was the Construction & Project Manager for Hudbay Minerals’ Constancia Copper Mine in Peru . He also managed the El Brocal Zinc open pit mine operations near Cerro de Pasco, Peru . He was involved in managing winter operations and an advisor to Barrick’s Veladero project in Argentina . William Thomas - Manager, Business Improvement & Operational Readiness Bill is an experienced project consulting engineer experienced in facility design optimization, asset management, logistics, safety, training, & change management . He is an international Consultant, skilled in strategy development, risk management, project processes, engineering & project control toolsets, team selection, assembly & training, construction, business readiness, commissioning & startup . Bill has been a project consultant to Hudbay Minerals’ Constancia Project in Peru, and Project Consultant to both Newmont and Freeport, responsible for defining core business processes to support capital effectiveness & delivery of business ready facilities .
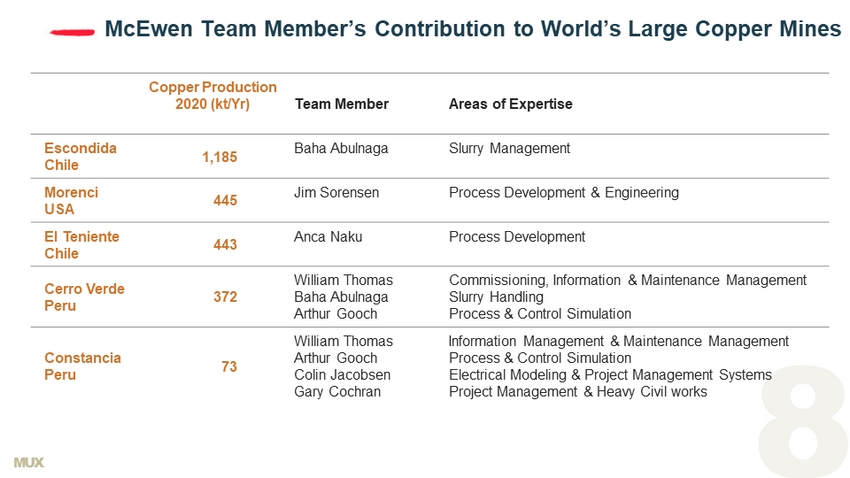
MUX McEwen Team Member’s Contribution to World’s Large Copper Mines Copper Production 2020 (kt/Yr) Team Member Areas of Expertise Escondida Chile 1,185 Baha Abulnaga Slurry Management Morenci USA 445 Jim Sorensen Process Development & Engineering El Teniente Chile 443 Anca Naku Process Development Cerro Verde Peru 372 William Thomas Baha Abulnaga Arthur Gooch Commissioning, Information & Maintenance Management Slurry Handling Process & Control Simulation Constancia Peru 73 William Thomas Arthur Gooch Colin Jacobsen Gary Cochran Information Management & Maintenance Management Process & Control Simulation Electrical Modeling & Project Management Systems Project Management & Heavy Civil works
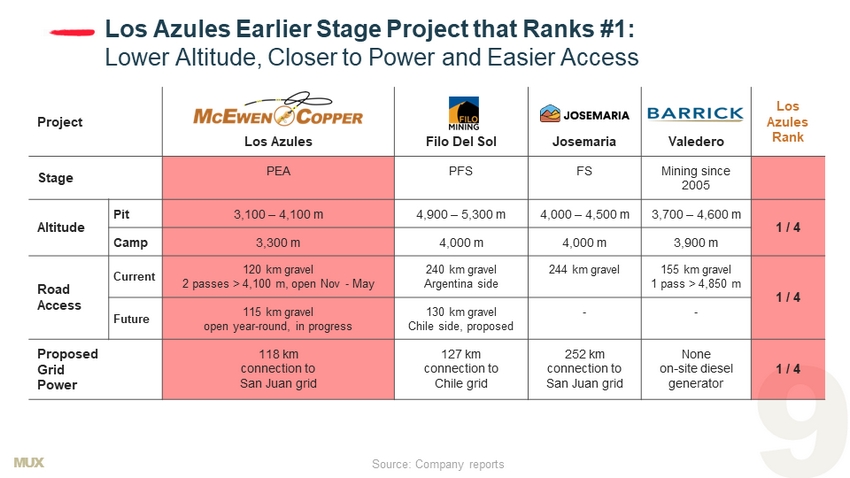
MUX Los Azules Earlier Stage Project that Ranks #1: Lower Altitude, Closer to Power and Easier Access Project Los Azules Rank Los Azules Filo Del Sol Josemaria Valedero Stage PEA PFS FS Mining since 2005 Altitude Pit 3,100 – 4,100 m 4,900 – 5,300 m 4,000 – 4,500 m 3,700 – 4,600 m 1 / 4 Camp 3,300 m 4,000 m 4,000 m 3,900 m Road Access Current 120 km gravel 2 passes > 4,100 m, open Nov - May 240 km gravel Argentina side 244 km gravel 155 km gravel 1 pass > 4,850 m 1 / 4 Future 115 km gravel open year - round, in progress 130 km gravel Chile side, proposed - - Proposed Grid Power 118 km connection to San Juan grid 127 km connection to Chile grid 252 km connection to San Juan grid None on - site diesel generator 1 / 4 Source: Company reports

MUX Los Azules : A Significant Copper Resource Source: Preliminary Economic Assessment (PEA) Oct 16, 2017 - “NI 43 - 101 Technical Report – Preliminary Economic Assessment Update for the Los Azules Project, Argentina” (Hatch). Conceptual Process Plant Indicated Inferred Animated Project Video: https://youtu.be/swTAsZlLxfI Ore tonnes Copper lbs Gold oz Silver oz Indicated 962 Million 10.2 Billion 0.48% 1.7 Million 0.06 g/t 55.7 Million 1.8 g/t Inferred 2,666 Million 19.3 Billion 0.33% 3.8 Million 0.04 g/t 135.4 Million 1.6 g/t
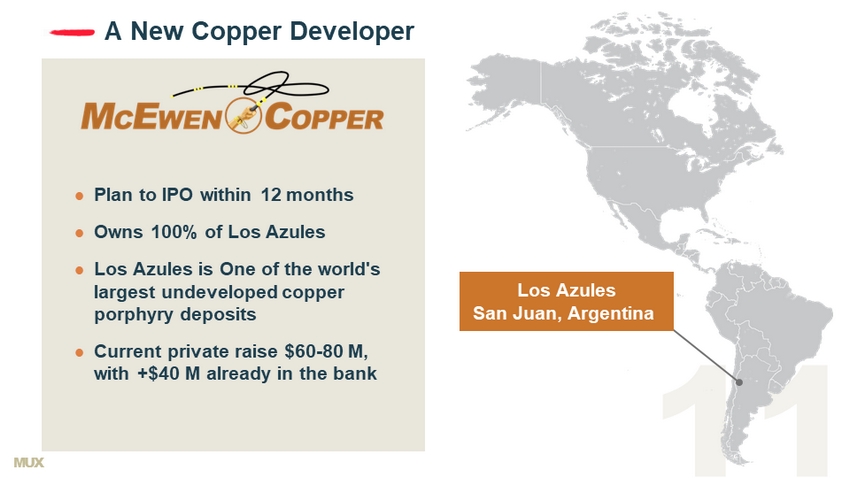
MUX A New Copper Developer Plan to IPO within 12 months Owns 100% of Los Azules Los Azules is One of the world's largest undeveloped copper porphyry deposits Current private raise $60 - 80 M, with +$40 M already in the bank Los Azules San Juan, Argentina
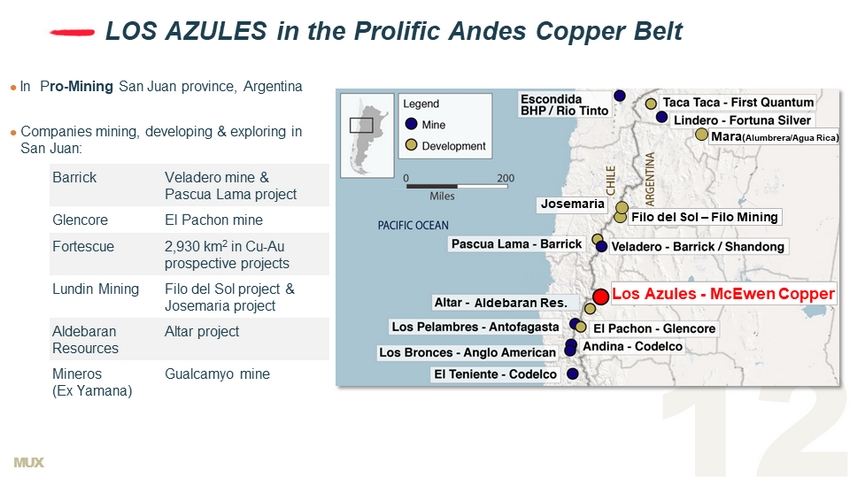
MUX LOS AZULES in the Prolific Andes Copper Belt Aldebaran Aldebaran Res. Filo del Sol – Filo Mining Josemaria Mara ( Alumbrera /Agua Rica ) Los Azules - McEwen Copper Barrick Veladero mine & Pascua Lama project Glencore El Pachon mine Fortescue 2,930 km 2 in Cu - Au prospective projects Lundin Mining Filo del Sol project & Josemaria project Aldebaran Resources Altar project Mineros (Ex Yamana ) Gualcamyo mine In P ro - Mining San Juan province, Argentina Companies mining, developing & exploring in San Juan:
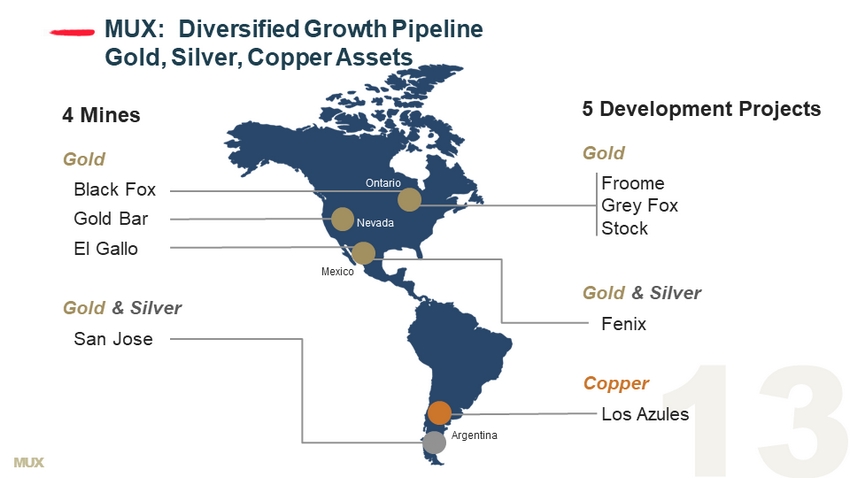
MUX Black Fox Gold Bar El Gallo MUX: Diversified Growth Pipeline Gold, Silver, Copper Assets Gold 5 Development Projects Froome Grey Fox Stock Copper Los Azules Fenix Argentina Mexico Nevada Ontario 4 Mines Gold Gold & Silver Gold & Silver San Jose
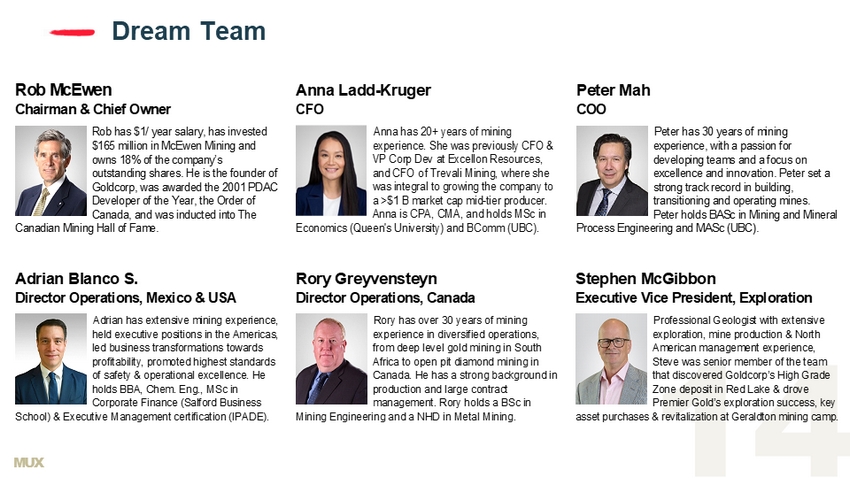
MUX Dream Team Rob McEwen Chairman & Chief Owner Rob has $1/ year salary, has invested $165 million in McEwen Mining and owns 18% of the company’s outstanding shares. He is the founder of Goldcorp, was awarded the 2001 PDAC Developer of the Year, the Order of Canada, and was inducted into The Canadian Mining Hall of Fame. Anna Ladd-Kruger CFO Anna has 20+ years of mining experience. She was previously CFO & VP Corp Dev at Excellon Resources, and CFO o f Trevali Mining, where she was integral to growing the company to a >$1 B market cap mid-tier producer. Anna is CPA, CMA, and holds MSc in Economics (Queen's University) and BComm (UBC). Peter Mah COO Peter has 30 years of mining experience, with a passion for developing teams and a focus on excellence and innovation. Peter set a strong track record in building, transitioning and operating mines. Peter holds BASc in Mining and Mineral Process Engineering and MASc (UBC). Stephen McGibbon Executive Vice President, Exploration Professional Geologist with extensive exploration, mine production & North American management experience, Steve was senior member of the team that discovered Goldcorp’s High Grade Zone deposit in Red Lake & drove Premier Gold’s exploration success, key asset purchases & revitalization at Geraldton mining camp. Adrian Blanco S. Director Operations, Mexico & USA Adrian has extensive mining experience, held executive positions in the Americas, led business transformations towards profitability, promoted highest standards of safety & operational excellence. He holds BBA, Chem. Eng., MSc in Corporate Finance (Salford Business School) & Executive Management certification (IPADE). Rory Greyvensteyn Director Operations, Canada Rory has over 30 years of mining experience in diversified operations, from deep level gold mining in South Africa to open pit diamond mining in Canada. He has a strong background in production and large contract management. Rory holds a BSc in Mining Engineering and a NHD in Metal Mining.
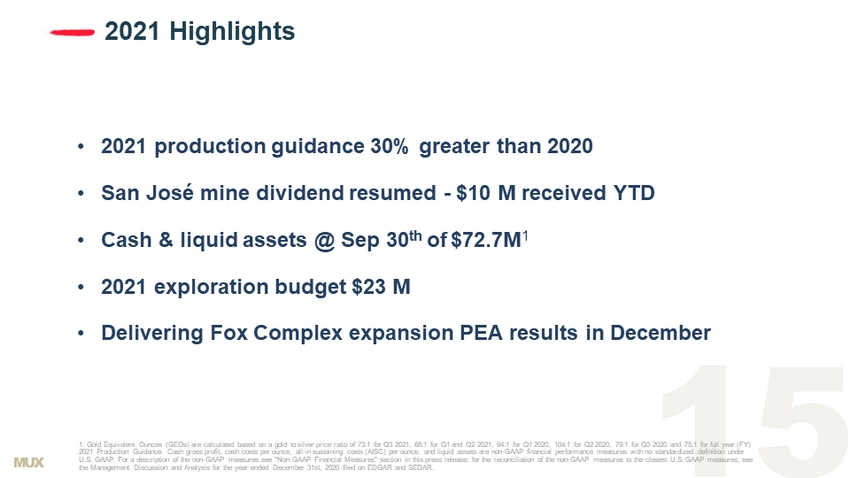
MUX 2021 Highlights 1. Gold Equivalent Ounces (GEOs) are calculated based on a gold to silver price ratio of 73:1 for Q3 2021, 68:1 for Q1 and Q2 20 21, 94:1 for Q1 2020, 104:1 for Q2 2020, 79:1 for Q3 2020 and 75:1 for full year (FY) 2021 Production Guidance. Cash gross profit, cash costs per ounce, all - in sustaining costs (AISC) per ounce, and liquid assets a re non - GAAP financial performance measures with no standardized definition under U.S. GAAP. For a description of the non - GAAP measures see "Non GAAP Financial Measures" section in this press release; for the r econciliation of the non - GAAP measures to the closest U.S. GAAP measures, see the Management Discussion and Analysis for the year ended December 31st, 2020 filed on EDGAR and SEDAR. • 2021 production guidance 30% greater than 2020 • San José mine dividend resumed - $10 M received YTD • Cash & liquid assets @ Sep 30 th of $72.7M 1 • 2021 exploration budget $23 M • Delivering Fox Complex expansion PEA results in December
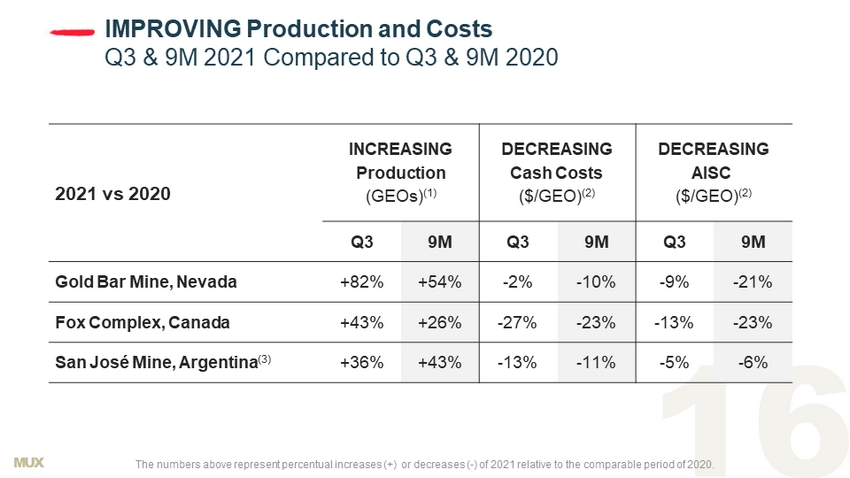
MUX IMPROVING Production and Costs Q3 & 9M 2021 Compared to Q3 & 9M 2020 2021 vs 2020 INCREASING Production (GEOs) (1) DECREASING Cash Costs ($/GEO) (2) DECREASING AISC ($/GEO) (2) Q3 9M Q3 9M Q3 9M Gold Bar Mine, Nevada +82% +54% - 2% - 10% - 9% - 21% Fox Complex, Canada +43% +26% - 27% - 23% - 13% - 23% San José Mine, Argentina (3) +36% +43% - 13% - 11% - 5% - 6% The numbers above represent percentual increases (+) or decreases ( - ) of 2021 relative to the comparable period of 2020.

MUX IMPROVED Liquidity Sep 30 th , 2021 vs Dec 31 st , 2020 (Millions of Dollars) Q3 2021 ended Sep 30 th , 2021 Q4 2020 ended Dec 31 st , 2020 Cash and cash equivalents 63.1 20.8 Liquid assets 72.7 25.9 Working capital 45.8 7.9 Debt principal 50.0 50.0
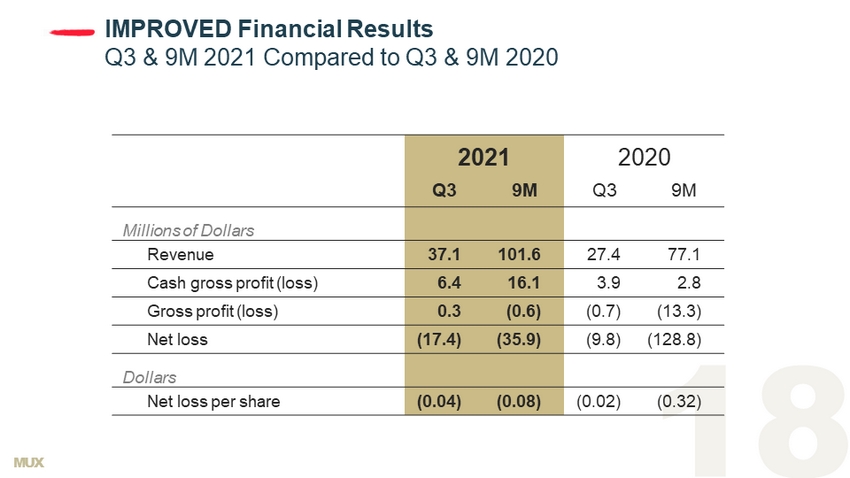
MUX IMPROVED Financial Results Q3 & 9M 2021 Compared to Q3 & 9M 2020 2021 2020 Q3 9M Q3 9M Millions of Dollars Revenue 37.1 101.6 27.4 77.1 Cash gross profit (loss) 6.4 16.1 3.9 2.8 Gross profit (loss) 0.3 (0.6) (0.7) (13.3) Net loss (17.4) (35.9) (9.8) (128.8) Dollars Net loss per share (0.04) (0.08) (0.02) (0.32)
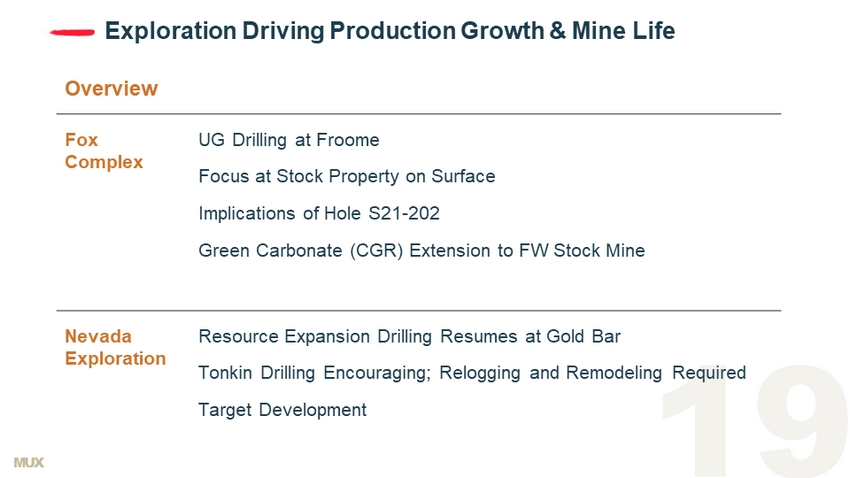
MUX Exploration Driving Production Growth & Mine Life Overview Fox Complex UG Drilling at Froome Focus at Stock Property on Surface Implications of Hole S21 - 202 Green Carbonate (CGR) Extension to FW Stock Mine Nevada Exploration Resource Expansion Drilling Resumes at Gold Bar Tonkin Drilling Encouraging; Relogging and Remodeling Required Target Development

MUX Fox Complex, Froome: Longer intercepts, Shallower Depth than Black Fox Long Section Looking North U/G Definition & Delineation 94 Definition holes = 77 significant results 37 Delineation holes = 23 significant results 76% Success Rate! Q4 Expansion Potential Above 140L & Below 200L
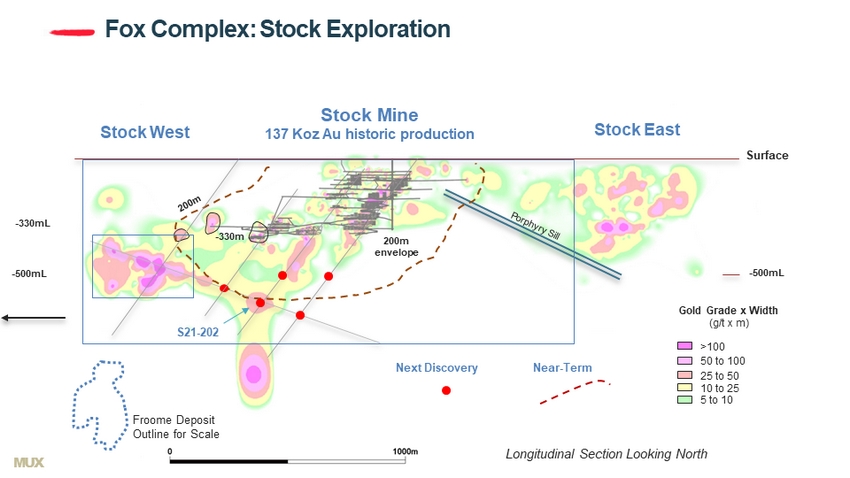
MUX Surface - 500mL Stock West Stock Mine 137 Koz Au historic production Longitudinal Section Looking North - 500mL - 330mL - 330m Fox Complex: Stock Exploration Gold Grade x Width (g/t x m) 50 to 100 25 to 50 10 to 25 5 to 10 >100 Stock East 200m envelope Next Discovery Near - Term S21 - 202 Froome Deposit Outline for Scale
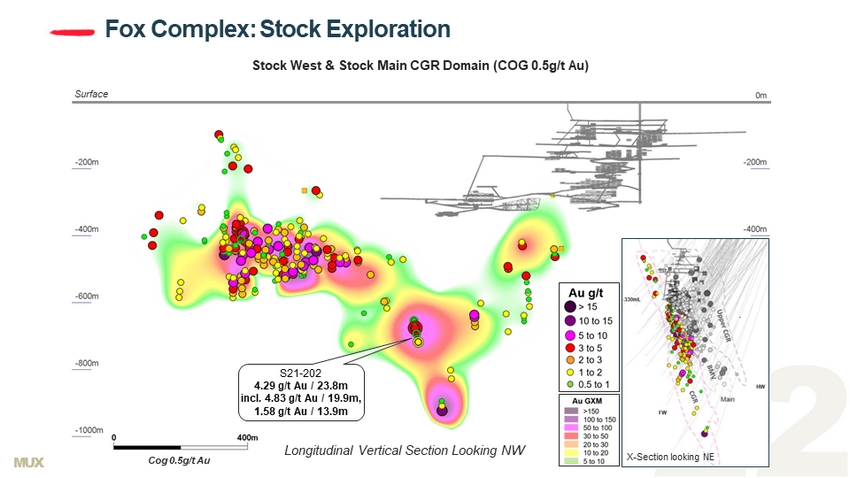
MUX Fox Complex: Stock Exploration Surface Stock West & Stock Main CGR Domain (COG 0.5g/t Au) Cog 0.5g/t Au S21 - 202 4.29 g/t Au / 23.8m incl. 4.83 g/t Au / 19.9m, 1.58 g/t Au / 13.9m X - Section looking NE Longitudinal Vertical Section Looking NW
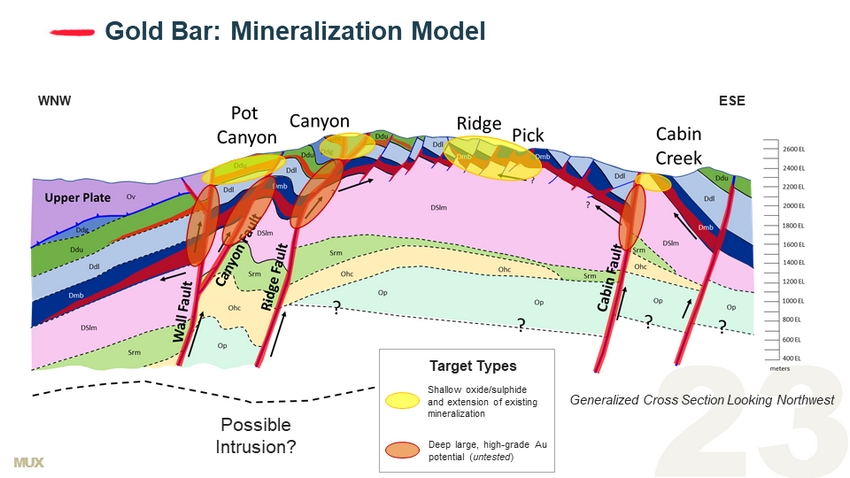
MUX Gold Bar: Mineralization Model WNW ESE Shallow oxide/sulphide and extension of existing mineralization Deep large, high - grade Au potential ( untested ) Target Types Generalized Cross Section Looking Northwest Possible Intrusion?
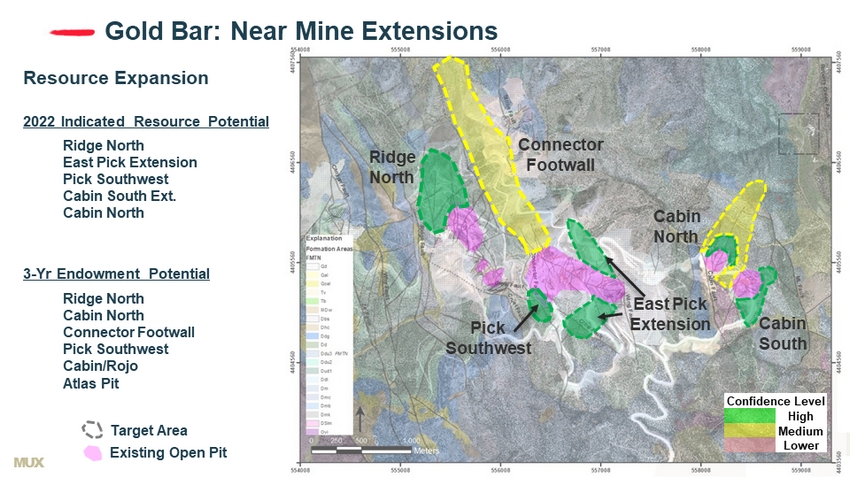
MUX Gold Bar: Near Mine Extensions Ridge North Connector Footwall Cabin North Cabin South Pick Southwest East Pick Extension Confidence Level High Medium Lower Resource Expansion 3 - Yr Endowment Potential Ridge North Cabin North Connector Footwall Pick Southwest Cabin/Rojo Atlas Pit Target Area Existing Open Pit 2022 Indicated Resource Potential Ridge North East Pick Extension Pick Southwest Cabin South Ext. Cabin North
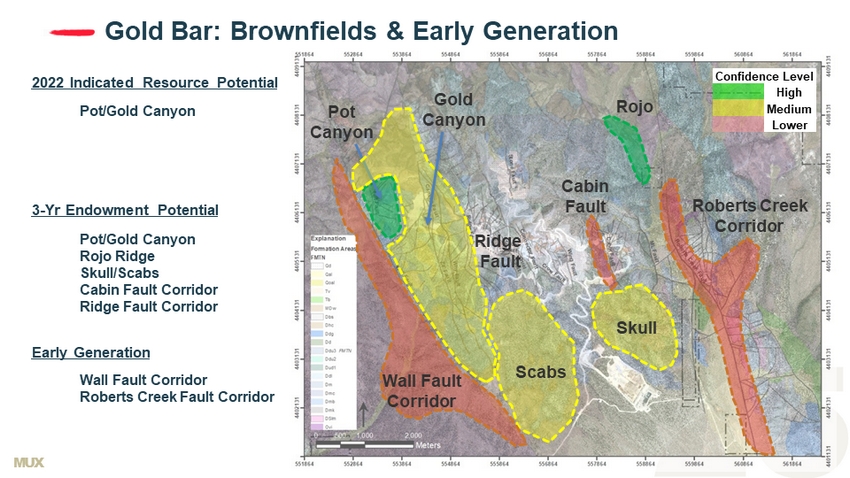
MUX Gold Bar: Brownfields & Early Generation Rojo Cabin Fault Skull Scabs Gold Canyon Roberts Creek Corridor Wall Fault Corridor Pot Canyon Ridge Fault Confidence Level High Medium Lower Pot/Gold Canyon Rojo Ridge Skull/Scabs Cabin Fault Corridor Ridge Fault Corridor Pot/Gold Canyon 2022 Indicated Resource Potential 3 - Yr Endowment Potential Early Generation Wall Fault Corridor Roberts Creek Fault Corridor
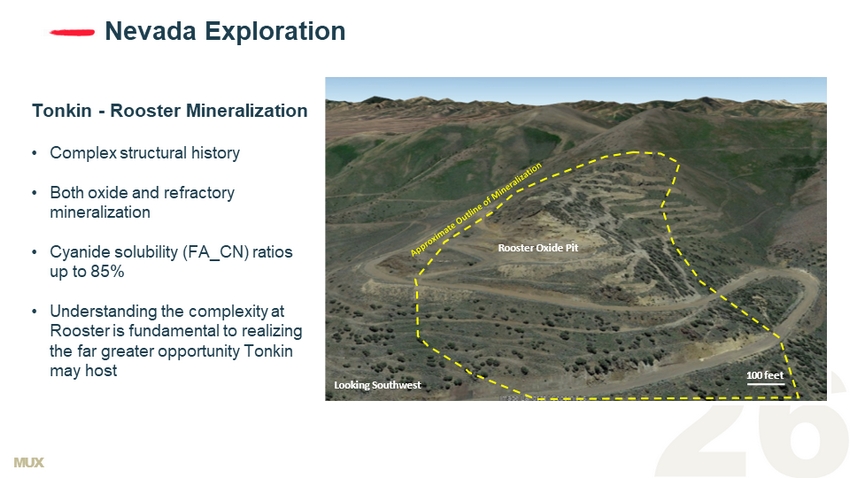
MUX Nevada Exploration Tonkin - Rooster Mineralization • Complex structural history • Both oxide and refractory mineralization • Cyanide solubility (FA_CN) ratios up to 85% • Understanding the complexity at Rooster is fundamental to realizing the far greater opportunity Tonkin may host ZŽŽƐƚĞƌKdžŝĚĞWŝƚ ϭϬϬ ĨĞĞƚ >ŽŽŬŝŶŐ^ŽƵƚŚǁĞƐƚ

MUX A CEO with a Financial Commitment $ 205 M 18 % $1/ Y r Investment 1 Ownership Salary Rob McEwen 18% Institutional 27% Retail 55% 1 - Rob McEwen’s investments: $1 40 million in McEwen Mining shares and $25 million (Aug 13, 2018 press release) , plus $40 million in McEwen Copper shares. 2 - Average Daily Trading Volume over 3 months. 3 - Holdings in million shares. Source: Bloomberg, Nov 22, 2021. Rob McEwen 82.2 M Van Eck Associates 22.8 M State Street Corp 14.1 M BlackRock 8.6 M Mirae Asset Global Investments 8.1 M Invesco Ltd 7.1 M Weiss Asset Management 6.8 M Vanguard 6.3 M Two Sigma Investments 6.1 M ETF Managers 4.7 M MUX Shares Top 10 Holders 3 Ownership Distribution Outstanding : 459 M Fully Diluted : 495 M ADTV 2 : 3.4 M Price : US$ 1.08 Market Cap : US$496 M
MUX For additional information: Rob McEwen Chairman and Chief Owner McEwen Mining & McEwen Copper rob@mcewenmining.com Tara Saratsiotis Executive Assistant to Rob McEwen tsaratsiotis@mcewenmining.com (647) 258 - 0395 x230 Contact Information Anna Ladd - Kruger Chief Financial Officer McEwen Mining & McEwen Copper akruger@mcewenmining.com Stefan Spears Vice President, Corporate Development stefan@mcewenmining.com (647) 408 - 1849
MUX Appendix

MUX Los Azules : Robust Preliminary Economics 1 Preliminary Economic Assessment (PEA) Oct 16 , 2017 - “NI 43 - 101 Technical Report - Preliminary Economic Assessment Update for the Los Azules Project, Argentina” (Hatch) . All project economic metrics are presented on a post - project approval basis (after completion of additional drilling, prefeasibility and feasibility studies) . All economic assessments are calculated at the Los Azules project level and do not include certain costs including corporate office, interest, financing and exploration expenses . Avg annual production 1 st 13 yrs Mine life Initial capex Base case Cu price Payback After - tax IRR After - tax NPV(8%) 415 Million lbs Cu @ $1.14/lb cash cost 36 yrs $2.4 Billion $3.00/ lb 3.6 yrs 20.1% $2.2 Billion Highlights of the 2017 Los Azules PEA 1 (Hatch Engineering)
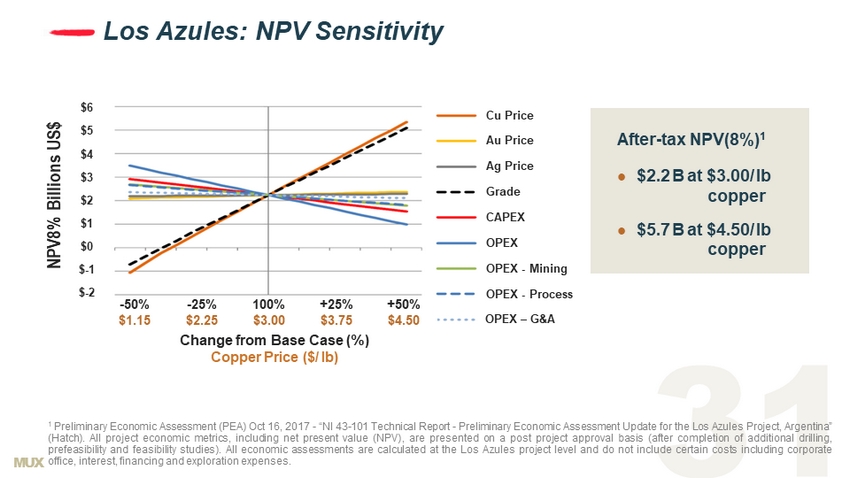
MUX Los Azules: NPV Sensitivity C hange from Base Case (%) Copper Price ($/ lb) - 50% - 25% 100% +25% +50% $1.15 $2.25 $3.00 $3.75 $4.50 $6 $5 $4 $3 $2 $1 Cu Price Au Price Ag Price Grade CAPEX OPEX OPEX - Mining OPEX - Process OPEX – G&A $0 $ - 1 $ - 2 NPV8% Billions US$ After - tax NPV(8%) 1 $2.2 B at $3.00/ lb copper $5.7 B at $4.50/ lb copper 1 Preliminary Economic Assessment (PEA) Oct 16 , 2017 - “NI 43 - 101 Technical Report - Preliminary Economic Assessment Update for the Los Azules Project, Argentina” (Hatch) . All project economic metrics, including net present value (NPV), are presented on a post project approval basis (after completion of additional drilling, prefeasibility and feasibility studies) . All economic assessments are calculated at the Los Azules project level and do not include certain costs including corporate office, interest, financing and exploration expenses .
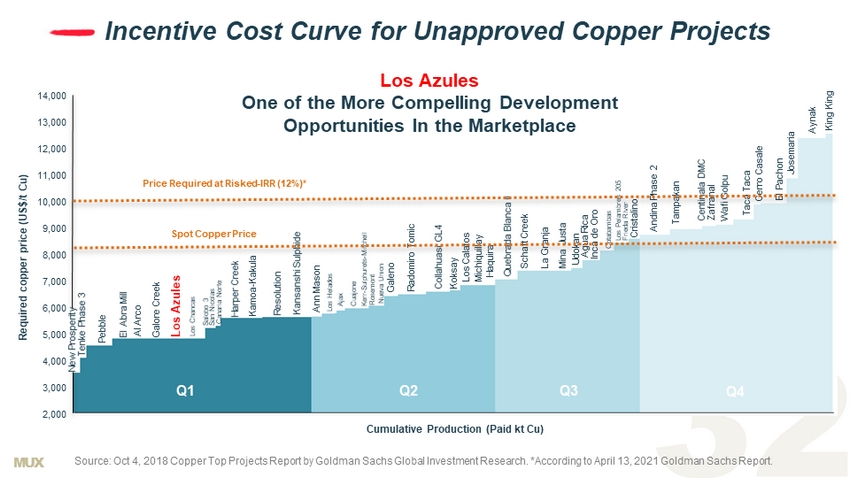
MUX 14,000 13,000 12,000 11,000 10,000 9,000 8,000 7,000 6,000 5,000 4,000 3,000 2,000 Incentive Cost Curve for Unapproved Copper Projects New Prosperity Tenke Phase 3 Pebble El Abra Mill Al Arco Galore Creek Los Azules Los Chancas Salobo 3 San Nicolas Canaria Norte Harper Creek Kamoa - Kakula Resolution Kansanshi Sulphide Ann Mason Los Helados Ajax Cuajone Kerr - Sulphurets - Mitchell Rosemont Nueva Union Galeno Radomiro Tomic Collahuasi GL4 Koksay Los Calatos Michiquillay Haquira Quebrada Blanca II Schaft Creek La Granja Mina Justa Udokan Inca de Oro Agua Rica Cotabambas Los Pelambres 205 Frieda RIver Cristalino Andina Phase 2 Tampakan Centinala DMC Zafranal Wafi Golpu Taca Taca Cerro Casale El Pachon Josemaria Aynak King King Required copper price (US$/t Cu) Cumulative Production (Paid kt Cu) Spot Copper Price Source: Oct 4, 2018 Copper Top Projects Report by Goldman Sachs Global Investment Research. *According to April 13, 2021 Gold man Sachs Report. Los Azules One of the More Compelling D evelopment O pportunities In the Marketplace Price Required at Risked - IRR (12%)* Q1 Q2 Q3 Q4
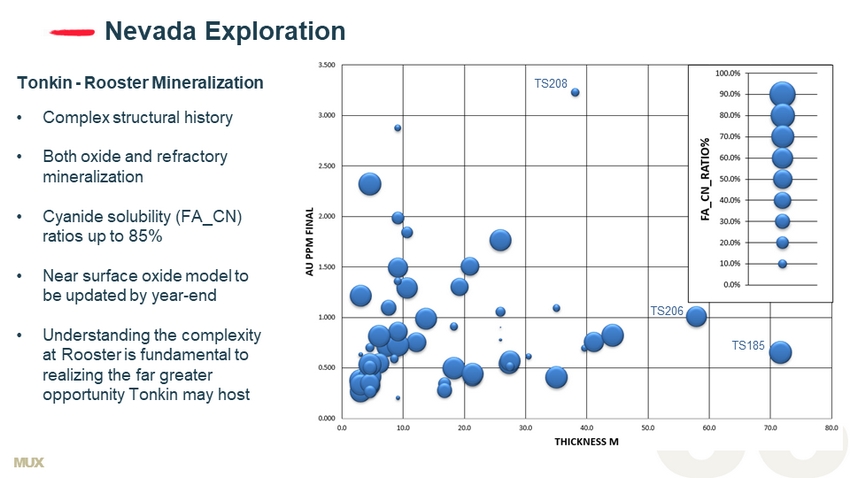
MUX Nevada Exploration Tonkin - Rooster Mineralization • Complex structural history • Both oxide and refractory mineralization • Cyanide solubility (FA_CN) ratios up to 85% • Near surface oxide model to be updated by year - end • Understanding the complexity at Rooster is fundamental to realizing the far greater opportunity Tonkin may host TS185 TS206 TS208
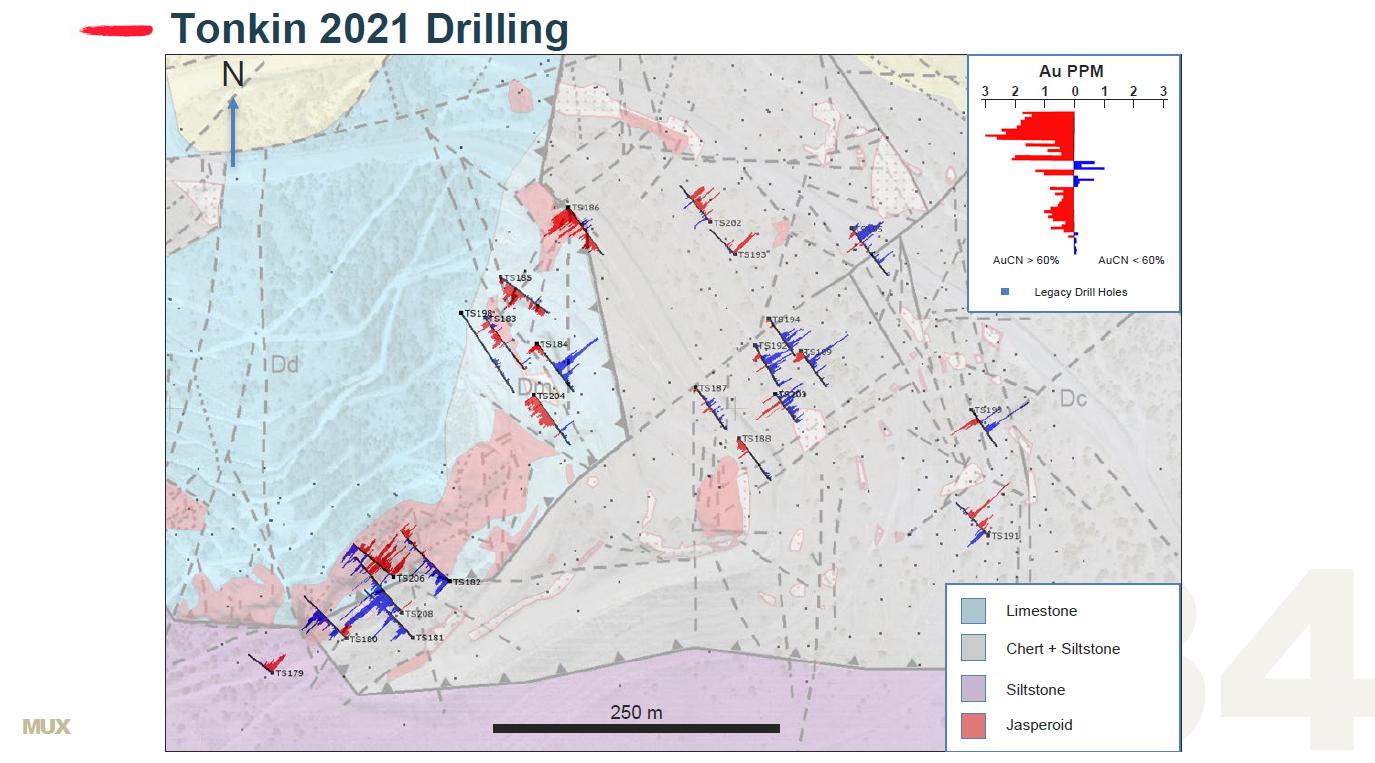
MUX Tonkin 2021 Drilling Au PPM AuCN < 60% 0 1 2 3 3 2 1 AuCN > 60% 250 m Legacy Drill Holes Limestone Chert + Siltstone Siltstone Jasperoid N
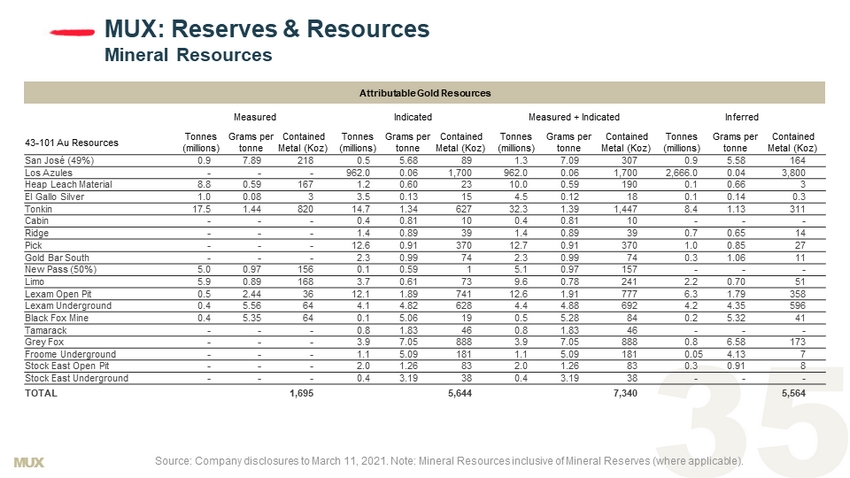
MUX MUX: Reserves & Resources Mineral Resources Attributable Gold Resources Measured Indicated Measured + Indicated Inferred 43 - 101 Au Resources Tonnes (millions) Grams per tonne Contained Metal (Koz) Tonnes (millions) Grams per tonne Contained Metal (Koz) Tonnes (millions) Grams per tonne Contained Metal (Koz) Tonnes (millions) Grams per tonne Contained Metal (Koz) San José (49%) 0.9 7.89 218 0.5 5.68 89 1.3 7.09 307 0.9 5.58 164 Los Azules - - - 962.0 0.06 1,700 962.0 0.06 1,700 2,666.0 0.04 3,800 Heap Leach Material 8.8 0.59 167 1.2 0.60 23 10.0 0.59 190 0.1 0.66 3 El Gallo Silver 1.0 0.08 3 3.5 0.13 15 4.5 0.12 18 0.1 0.14 0.3 Tonkin 17.5 1.44 820 14.7 1.34 627 32.3 1.39 1,447 8.4 1.13 311 Cabin - - - 0.4 0.81 10 0.4 0.81 10 - - - Ridge - - - 1.4 0.89 39 1.4 0.89 39 0.7 0.65 14 Pick - - - 12.6 0.91 370 12.7 0.91 370 1.0 0.85 27 Gold Bar South - - - 2.3 0.99 74 2.3 0.99 74 0.3 1.06 11 New Pass (50%) 5.0 0.97 156 0.1 0.59 1 5.1 0.97 157 - - - Limo 5.9 0.89 168 3.7 0.61 73 9.6 0.78 241 2.2 0.70 51 Lexam Open Pit 0.5 2.44 36 12.1 1.89 741 12.6 1.91 777 6.3 1.79 358 Lexam Underground 0.4 5.56 64 4.1 4.82 628 4.4 4.88 692 4.2 4.35 596 Black Fox Mine 0.4 5 .35 64 0.1 5.06 19 0.5 5.28 84 0.2 5.32 41 Tamarack - - - 0.8 1.83 46 0.8 1.83 46 - - - Grey Fox - - - 3.9 7.05 888 3.9 7.05 888 0.8 6.58 173 Froome Underground - - - 1.1 5.09 181 1.1 5.09 181 0.05 4.13 7 Stock East Open Pit - - - 2.0 1.26 83 2.0 1.26 83 0.3 0.91 8 Stock East Underground - - - 0.4 3.19 38 0.4 3.19 38 - - - TOTAL 1,695 5,644 7,340 5,564 Source: Company disclosures to March 11, 2021. Note: Mineral Resources inclusive of Mineral Reserves (where applicable).
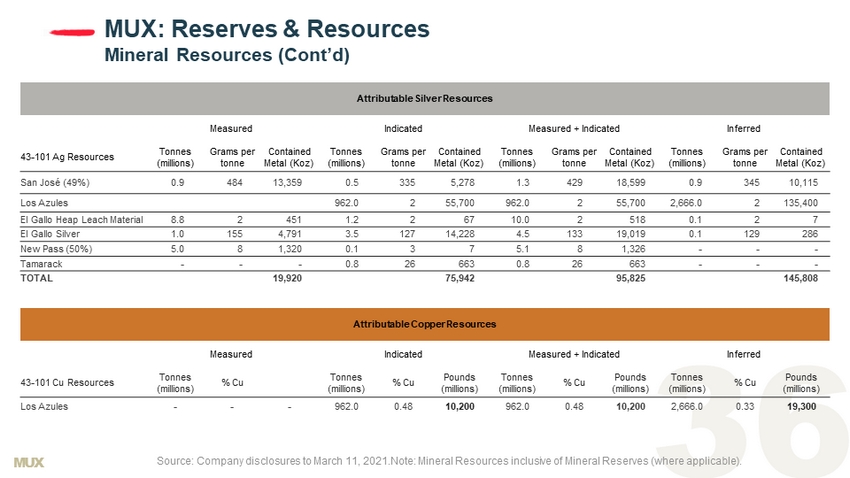
MUX MUX: Reserves & Resources Mineral Resources (Cont’d) Source: Company disclosures to March 11, 2021.Note: Mineral Resources inclusive of Mineral Reserves (where applicable). Attributable Silver Resources Measured Indicated Measured + Indicated Inferred 43 - 101 Ag Resources Tonnes (millions) Grams per tonne Contained Metal (Koz) Tonnes (millions) Grams per tonne Contained Metal (Koz) Tonnes (millions) Grams per tonne Contained Metal (Koz) Tonnes (millions) Grams per tonne Contained Metal (Koz) San José (49%) 0.9 4 84 13,359 0.5 335 5,278 1.3 429 18,599 0.9 345 1 0,115 Los Azules 962.0 2 55,700 962.0 2 55,700 2,666.0 2 135,400 El Gallo Heap Leach Material 8.8 2 451 1.2 2 67 10.0 2 518 0.1 2 7 El Gallo Silver 1.0 155 4,791 3.5 127 14,228 4.5 133 19,019 0.1 129 286 New Pass (50%) 5.0 8 1,320 0.1 3 7 5.1 8 1,326 - - - Tamarack - - - 0.8 26 663 0.8 26 663 - - - TOTAL 19,920 75,942 95,825 145,808 Attributable Copper Resources Measured Indicated Measured + Indicated Inferred 43 - 101 Cu Resources Tonnes (millions) % Cu Tonnes (millions) % Cu Pounds (millions) Tonnes (millions) % Cu Pounds (millions) Tonnes (millions) % Cu Pounds (millions) Los Azules - - - 962.0 0.48 10,200 962.0 0.48 10,200 2,666.0 0.33 19,300
MUX MUX: Cautionary Note Regarding NON - GAAP Measures In this presentation, we have provided information prepared or calculated according to U . S . GAAP, as well as provided some non - U . S . GAAP ("non - GAAP") performance measures . Because the non - GAAP performance measures do not have any standardized meaning prescribed by U . S . GAAP, they may not be comparable to similar measures presented by other companies . Total Cash Costs per GEO, and All - in Sustaining Costs (“AISC”) per GEO . Total cash costs consist of mining, processing, on - site general and administrative costs, community and permitting costs related to current explorations, royalty costs, refining and treatment charges (for both doré and concentrate products), sales costs, export taxes and operational stripping costs . All - in sustaining cash costs consist of total cash costs (as described above), plus environmental rehabilitation costs, amortization of the asset retirement costs related to operating sites, sustaining exploration and development costs, and sustaining capital expenditures . In order to arrive at our consolidated all - in sustaining costs, we also include corporate general and administrative expenses . Depreciation is excluded from both total cash costs and all - in sustaining cash costs . For both total cash costs and all - in sustaining costs we include our attributable share of total cash costs from operations where we hold less than a 100 % economic share in the production, such as MSC, where we hold a 49 % interest . Total cash cost and all - in sustaining cash cost per GEO sold are calculated on a co - product basis by dividing the respective proportionate share of the total cash costs and all - in sustaining cash costs for the period attributable to each metal by the ounces of each respective metal sold . We use and report these measures to provide additional information regarding operational efficiencies both on a consolidated and an individual mine basis, and believe that these measures provide investors and analysts with useful information about our underlying costs of operations . A reconciliation to the nearest U . S . GAAP measure is provided in McEwen Mining's Annual Report on Form 10 - K for the year ended December 31 , 2020 . Earnings from Mining Operations The term Earnings from Mining Operations used in this presentation is a non - GAAP financial measure . We use and report this measure because we believe it provides investors and analysts with a useful measure of the underlying earnings from our mining operations . We define Earnings from Mining Operations as Gold and Silver Revenues from our El Gallo Mine, Black Fox Mine, and our 49 % attributable share of the San José Mine's Net Sales, less their respective Production Costs Applicable to Sales . To the extent that Production Costs Applicable to Sales may include depreciation and amortization expense related to the fair value increments on historical business acquisitions (fair value paid in excess of the carrying value of the underlying assets and liabilities assumed on the date of acquisition), we deduct this expense in order to arrive at Production Costs Applicable to Sales that only include depreciation and amortization expense incurred at the mine - site level . The San José Mine Net Sales and Production Costs Applicable to Sales are presented, on a 100 % basis, in Note 5 of McEwen Mining's Annual Report on Form 10 - K for the year ended December 31 , 2020 . Cash, Investments and Precious Metals The term cash, investments and precious metals used in this presentation is a non - GAAP financial measure . We report this measure to better understand our liquidity in each reporting period . Cash, investments and precious metals is calculated as the sum of cash, investments and ounces of doré held in inventory, valued at the London P . M . Fix spot price at the corresponding period . A reconciliation to the most directly comparable U . S . GAAP measure, Sales of Gold and Silver, is provided in McEwen Mining's Annual Report on Form 10 - K for the year ended December 31 , 2020 .