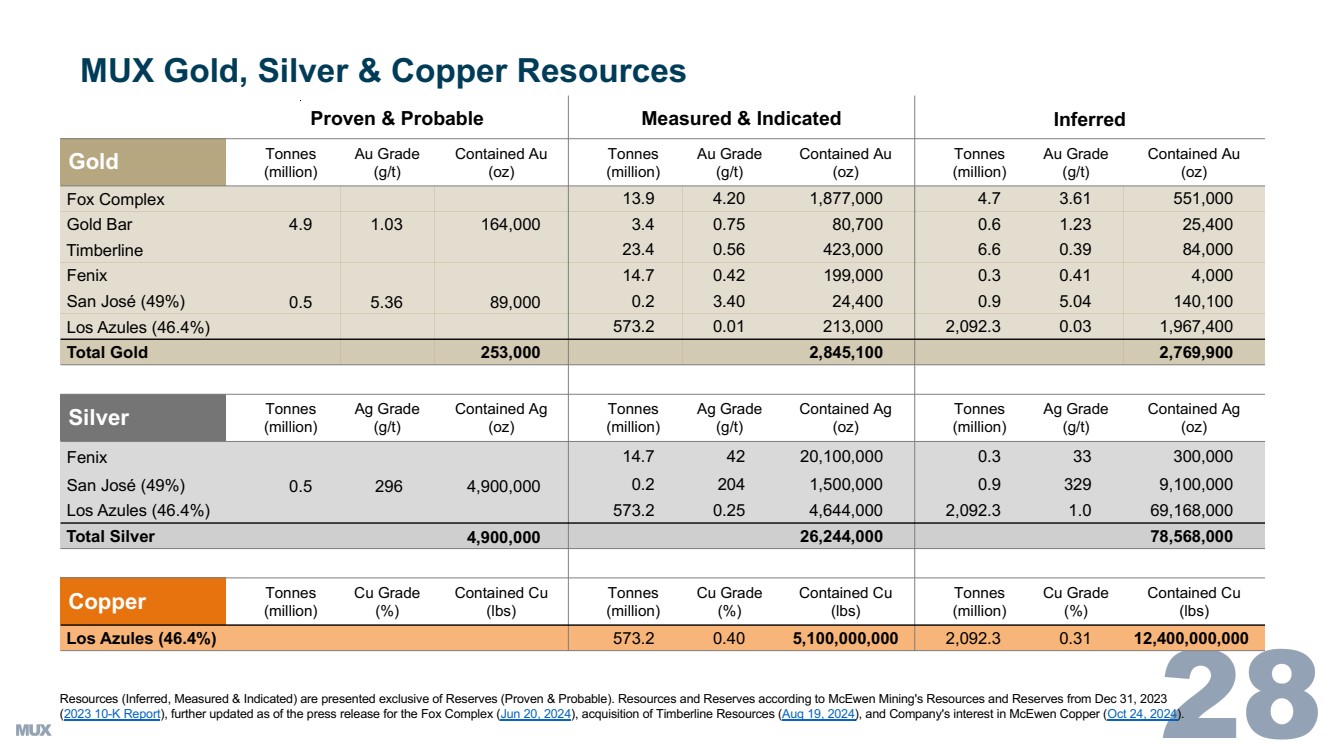
| MUX Gold, Silver & Copper Resources Proven & Probable Measured & Indicated Inferred Gold Tonnes (million) Au Grade (g/t) Contained Au (oz) Tonnes (million) Au Grade (g/t) Contained Au (oz) Tonnes (million) Au Grade (g/t) Contained Au (oz) Fox Complex 13.9 4.20 1,877,000 4.7 3.61 551,000 Gold Bar 4.9 1.03 164,000 3.4 0.75 80,700 0.6 1.23 25,400 Timberline 23.4 0.56 423,000 6.6 0.39 84,000 Fenix 14.7 0.42 199,000 0.3 0.41 4,000 San José (49%) 0.5 5.36 89,000 0.2 3.40 24,400 0.9 5.04 140,100 Los Azules (46.4%) 573.2 0.01 213,000 2,092.3 0.03 1,967,400 Total Gold 253,000 2,845,100 2,769,900 Silver Tonnes (million) Ag Grade (g/t) Contained Ag (oz) Tonnes (million) Ag Grade (g/t) Contained Ag (oz) Tonnes (million) Ag Grade (g/t) Contained Ag (oz) Fenix 14.7 42 20,100,000 0.3 33 300,000 San José (49%) 0.5 296 4,900,000 0.2 204 1,500,000 0.9 329 9,100,000 Los Azules (46.4%) 573.2 0.25 4,644,000 2,092.3 1.0 69,168,000 Total Silver 4,900,000 26,244,000 78,568,000 Copper Tonnes (million) Cu Grade (%) Contained Cu (lbs) Tonnes (million) Cu Grade (%) Contained Cu (lbs) Tonnes (million) Cu Grade (%) Contained Cu (lbs) Los Azules (46.4%) 573.2 0.40 5,100,000,000 2,092.3 0.31 12,400,000,000 Resources (Inferred, Measured & Indicated) are presented exclusive of Reserves (Proven & Probable). Resources and Reserves according to McEwen Mining's Resources and Reserves from Dec 31, 2023 (2023 10-K Report), further updated as of the press release for the Fox Complex (Jun 20, 2024), acquisition of Timberline Resources (Aug 19, 2024), and Company's interest in McEwen Copper (Oct 24, 2024). |