EARNINGS RELEASE FOR QUARTER ENDING SEPTEMBER 30, 2006
October 18, 2006
On September 21, 2006, First Busey Corporation and Main Street Trust, Inc. announced their intention to merge together to form the premier community bank in Central Illinois. The combined management teams are working diligently to ensure a seamless transition for our customers, shareholders and employees.
First Busey continues its expansionin the Central Illinois and Florida markets with the opening of three new banking centers during the summer of 2006. Based on strong growth opportunity in the Bloomington-Normal market, Busey Bank opened a full-service banking center in Normal, Illinois during June. Since its opening, this banking center has generated more than $10 million in deposits. Busey Bank, N.A. continued its expansion in Southwest Florida with the opening of two new banking centers in Ft. Myers and Cape Coral. As of September 30, these banking centers have generated $4.7 million in new deposits. The strong response to these new banking centers supports First Busey’s commitment to the Florida market.
Net incomeincreased $83,000 or 1.1% to $7,642,000 for the quarter ending September 30, 2006, as compared to $7,559,000 for the comparable period in 2005. For the quarter ending September 30, 2006, earnings per share on a fully-diluted basis were $0.36, the same as the comparable period in 2005. On a year-to-date basis, net income increased $1,173,000 or 5.8% to $21,544,000 as compared to $20,371,000 for the comparable period in 2005. For the nine-month period ending September 30, 2006, earnings per share on a fully-diluted basis were $1.00, an increase of $0.02 or 2.0% from $0.98 for the comparable period in 2005.
Net interest incomeincreased $927,000 or 5.0% to $19,401,000 in the third quarter of 2006 compared to $18,474,000 in the comparable quarter in 2005. Interest income increased $7,372,000 during the third quarter of 2006 compared to the same period in 2005 due primarily to loan growth combined with higher yields on investment securities and outstanding loans. Interest expense increased $6,445,000 during the third quarter of 2006 compared to the same period in 2005. The increase in interest expense reflects the combination of growth in deposits and a market-driven increase in deposit and borrowing rates.
Provision for loan losseswas $300,000 during the third quarter of 2006 compared to $650,000 in the comparable period of 2005. As a percentage of total outstanding loans, the allowance for loan losses was 1.24% as of September 30, 2006 and 1.32% as of September 30, 2005.
Non-interest incomeincreased $1,083,000 or 17.7% to $7,201,000 during the third quarter of 2006 compared to the same period in prior year. Growth in non-interest income is due primarily to growth in customer service fees and net security gains.
Non-interest expenseincreased $1,368,000 or 10.4% to $14,531,000 during the quarter ended September 30, 2006 compared to the same period in prior year, due primarily to increased operating costs and amortization expense associated with growth in the Florida market.
Three Months Ended | Nine Months Ended | |||||||||||||||
September 30, | September 30, | |||||||||||||||
2006 | 2005 | 2006 | 2005 | |||||||||||||
(in thousands, except per share data) | ||||||||||||||||
Earnings & Per Share Data | ||||||||||||||||
Net income | $ | 7,642 | $ | 7,559 | $ | 21,544 | $ | 20,371 | ||||||||
Basic earnings per share | 0.36 | 0.36 | 1.01 | 0.99 | ||||||||||||
Fully diluted earnings per share | 0.36 | 0.36 | 1.00 | 0.98 | ||||||||||||
Dividends per share | 0.16 | 0.14 | 0.48 | 0.42 | ||||||||||||
Average Balances | ||||||||||||||||
Assets | $ | 2,357,133 | $ | 2,154,818 | $ | 2,303,594 | $ | 2,049,798 | ||||||||
Investment securities | 318,725 | 316,687 | 325,112 | 318,090 | ||||||||||||
Loans | 1,855,980 | 1,663,366 | 1,799,137 | 1,567,303 | ||||||||||||
Earning assets | 2,180,102 | 1,997,671 | 2,129,932 | 1,906,871 | ||||||||||||
Deposits | 1,874,521 | 1,713,590 | 1,831,061 | 1,628,218 | ||||||||||||
Stockholders’ equity | 175,795 | 153,831 | 172,689 | 144,856 | ||||||||||||
Performance Ratios | ||||||||||||||||
Return on average assets | 1.29 | % | 1.39 | % | 1.25 | % | 1.33 | % | ||||||||
Return on average equity | 17.25 | % | 19.50 | % | 16.68 | % | 18.80 | % | ||||||||
Net interest margin | 3.63 | % | 3.75 | % | 3.69 | % | 3.72 | % | ||||||||
Efficiency ratio | 53.83 | % | 51.09 | % | 54.98 | % | 50.95 | % | ||||||||
Loan Performance | ||||||||||||||||
Net credit losses | $ | 140 | $ | 357 | $ | 638 | $ | 570 | ||||||||
Accruing loans 90+ days past due | 2,176 | 913 | 2,176 | 913 | ||||||||||||
Non-accrual loans | 4,144 | 1,656 | 4,144 | 1,656 | ||||||||||||
Foreclosed assets | 824 | 222 | 824 | 222 | ||||||||||||
September 30, | ||||||||
2006 | 2005 | |||||||
(in thousands, except per share data) | ||||||||
Assets | ||||||||
Cash and due from banks | $ | 52,341 | $ | 59,826 | ||||
Federal funds sold | 14,329 | 56,541 | ||||||
Investment securities | 324,887 | 333,444 | ||||||
Loans | 1,905,228 | 1,709,182 | ||||||
Less allowance for loan losses | (23,552 | ) | (22,620 | ) | ||||
Net loans | $ | 1,881,676 | $ | 1,686,562 | ||||
Premises and equipment, net | 41,304 | 36,994 | ||||||
Goodwill and other intangibles | 58,451 | 60,134 | ||||||
Other assets | 46,233 | 44,071 | ||||||
Total assets | $ | 2,419,221 | $ | 2,277,572 | ||||
Liabilities & Stockholders’ Equity | ||||||||
Non-interest bearing deposits | $ | 235,416 | $ | 256,933 | ||||
Interest-bearing deposits | 1,713,403 | 1,566,561 | ||||||
Total deposits | $ | 1,948,819 | $ | 1,823,494 | ||||
Federal funds purchased & securities sold under agreements to repurchase | 57,147 | 48,025 | ||||||
Short-term borrowings | 1,000 | 1,000 | ||||||
Long-term debt | 161,708 | 175,501 | ||||||
Junior subordinated debt owed to unconsolidated trusts | 55,000 | 50,000 | ||||||
Other liabilities | 15,870 | 14,362 | ||||||
Total liabilities | $ | 2,239,544 | $ | 2,112,382 | ||||
Common stock | $ | 22 | $ | 22 | ||||
Common stock to be issued | 8 | 495 | ||||||
Surplus | 45,548 | 44,435 | ||||||
Retained earnings | 141,024 | 126,150 | ||||||
Other comprehensive income | 6,863 | 7,296 | ||||||
Treasury stock | (11,729 | ) | (10,745 | ) | ||||
Unearned ESOP shares | (2,058 | ) | (2,456 | ) | ||||
Deferred compensation for stock grants | (1 | ) | (7 | ) | ||||
Total stockholders’ equity | $ | 179,677 | $ | 165,190 | ||||
Total liabilities & stockholders’ equity | $ | 2,419,221 | $ | 2,277,572 | ||||
Per Share Data | ||||||||
Book value per share | $ | 8.38 | $ | 7.70 | ||||
Tangible book value per share | $ | 5.65 | $ | 4.89 | ||||
Ending number of shares outstanding | 21,444,766 | 21,462,876 |
Three Months Ended | Nine Months Ended | |||||||||||||||
September 30, | September 30, | |||||||||||||||
2006 | 2005 | 2006 | 2005 | |||||||||||||
(in thousands, except per share data) | ||||||||||||||||
Interest and fees on loans | $ | 34,554 | $ | 27,670 | $ | 97,001 | $ | 75,453 | ||||||||
Interest on investment securities | 3,197 | 2,640 | 9,479 | 7,682 | ||||||||||||
Other interest income | 66 | 135 | 188 | 358 | ||||||||||||
Total interest income | $ | 37,817 | $ | 30,445 | $ | 106,668 | $ | 83,493 | ||||||||
Interest on deposits | $ | 14,553 | $ | 8,929 | $ | 38,597 | $ | 23,375 | ||||||||
Interest on short-term borrowings | 854 | 324 | 2,159 | 905 | ||||||||||||
Interest on long-term debt | 1,999 | 1,785 | 5,713 | 4,837 | ||||||||||||
Junior subordinated debt owed to unconsolidated trusts | 1,010 | 933 | 3,049 | 2,492 | ||||||||||||
Total interest expense | $ | 18,416 | $ | 11,971 | $ | 49,518 | $ | 31,609 | ||||||||
Net interest income | $ | 19,401 | $ | 18,474 | $ | 57,150 | $ | 51,884 | ||||||||
Provision for loans losses | 300 | 650 | 1,000 | 2,765 | ||||||||||||
Net interest income after provision | $ | 19,101 | $ | 17,824 | $ | 56,150 | $ | 49,119 | ||||||||
Trust fees | $ | 1,312 | $ | 1,366 | $ | 4,470 | $ | 4,277 | ||||||||
Commissions and brokers’ fees | 608 | 628 | 1,987 | 1,679 | ||||||||||||
Fees for customer services | 2,860 | 2,684 | 8,198 | 7,536 | ||||||||||||
Gain on sale of loans | 786 | 920 | 1,858 | 1,932 | ||||||||||||
Net security gains | 794 | (106 | ) | 1,880 | 306 | |||||||||||
Other | 841 | 626 | 1,885 | 1,907 | ||||||||||||
Total non-interest income | $ | 7,201 | $ | 6,118 | $ | 20,278 | $ | 17,637 | ||||||||
Salaries and wages | $ | 6,609 | $ | 6,062 | $ | 19,878 | $ | 16,697 | ||||||||
Employee benefits | 1,509 | 1,332 | 4,457 | 3,711 | ||||||||||||
Net occupancy expense | 1,310 | 1,255 | 3,814 | 3,323 | ||||||||||||
Furniture and equipment expense | 929 | 852 | 2,677 | 2,278 | ||||||||||||
Data processing expense | 450 | 429 | 1,344 | 1,496 | ||||||||||||
Amortization expense | 353 | 334 | 1,057 | 724 | ||||||||||||
Other operating expenses | 3,371 | 2,899 | 10,234 | 8,335 | ||||||||||||
Total non-interest expense | $ | 14,531 | $ | 13,163 | $ | 43,461 | $ | 36,564 | ||||||||
Income before income taxes | $ | 11,771 | $ | 10,779 | $ | 32,967 | $ | 30,192 | ||||||||
Income taxes | 4,129 | 3,220 | 11,423 | 9,821 | ||||||||||||
Net Income | $ | 7,642 | $ | 7,559 | $ | 21,544 | $ | 20,371 | ||||||||
Per Share Data | ||||||||||||||||
Basic earnings per share | $ | 0.36 | $ | 0.36 | $ | 1.01 | $ | 0.99 | ||||||||
Fully-diluted earnings per share | $ | 0.36 | $ | 0.36 | $ | 1.00 | $ | 0.98 | ||||||||
Diluted average shares outstanding | 21,441,315 | 21,130,157 | 21,444,888 | 20,745,085 |
First Busey Corporation is a financial holding company headquartered in Urbana, Illinois. First Busey Corporation has two wholly-owned banking subsidiaries with locations in three states. Busey Bank is headquartered in Urbana, Illinois and has twenty-two banking centers serving Champaign, McLean, Ford, Peoria, and Tazewell Counties in Illinois. Busey Bank also has a banking center in Indianapolis, Indiana, and a loan production office in Ft. Myers, Florida. On September 30, 2006, Busey Bank had total assets of $2.0 billion. On July 29, 2005, First Busey Corporation acquired Tarpon Coast Bancorp, Inc. and its primary subsidiary, Tarpon Coast National Bank, Port Charlotte, Florida. Busey Bank Florida and Tarpon Coast National Bank merged at the close of business on February 17, 2006, and the resultant bank is Busey Bank, N.A. Busey Bank N.A. is headquartered in Port Charlotte, Florida, with nine banking centers serving Lee, Charlotte, and Sarasota Counties in Southwest Florida. Busey Bank N.A. had total assets of $444 million as of September 30, 2006. Busey provides electronic delivery of financial services through Busey e-bank,www.busey.com.
Busey Investment Group is a wholly-owned subsidiary of First Busey Corporation and owns three subsidiaries. First Busey Trust & Investment Co. specializes in asset management and trust services. First Busey Securities, Inc. (member NASD/SIPC) is a full-service broker/dealer subsidiary. Busey Insurance Services, Inc. is a provider of personal insurance products. Busey Investment Group has approximately $2.4 billion in assets under care.
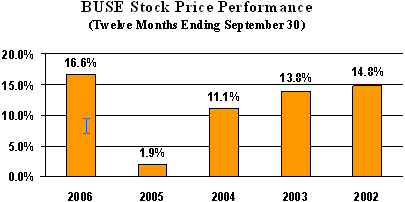
First Busey Corporation’s common stock is traded on the Nasdaq Stock Exchange under the symbol “BUSE.” First Busey Corporation has a repurchase program in effect under which it is authorized to purchase up to 750,000 shares of stock.