Exhibit 99.2
Expands into Saint Louis December 3, 2015
Special Note Concerning Forward-Looking Statements This document may contain forward-looking statements within the meaning of the Private Securities Litigation Reform Act of 1995 with respect to the financial condition, results of operations, plans, objectives, future performance and business of First Busey and Pulaski. Forward-looking statements, which may be based upon beliefs, expectations and assumptions of First Busey’s and Pulaski’s management and on information currently available to management, are generally identifiable by the use of words such as “believe,” “expect,” “anticipate,” “plan,” “intend,” “estimate,” “may,” “will,” “would,” “could,” “should” or other similar expressions. Additionally, all statements in this document, including forward-looking statements, speak only as of the date they are made, and neither First Busey nor Pulaski undertakes any obligation to update any statement in light of new information or future events. A number of factors, many of which are beyond the ability of First Busey and Pulaski to control or predict, could cause actual results to differ materially from those in its forward-looking statements.These factors include, among others, the following: (i) the possibility that any of the anticipated benefits of the proposed transaction between First Busey and Pulaski will not be realized or will not be realized within the expected time period; (ii) the risk that integration of operations of Pulaski with those of First Busey will be materially delayed or will be more costly or difficult than expected; (iii) the inability to complete the proposed transaction due to the failure of required stockholder approvals; (iv) the failure to satisfy other conditions to completion of the proposed transaction, including receipt of required regulatory and other approvals; (v) the failure of the proposed transaction to close for any other reason; (vi) the effect of the announcement of the transaction on customer relationships and operating results; (vii) the possibility that the transaction may be more expensive to complete than anticipated, including as a result of unexpected factors or events; (viii) the strength of the local and national economy; (ix) changes in state and federal laws, regulations and governmental policies concerning First Busey’s and Pulaski’s general business (including the impact of the Dodd-Frank Wall Street Reform and Consumer Protection Act and the extensive regulations to be promulgated thereunder, as well as the rules adopted by the federal bank regulatory agencies to implement Basel III); (x) changes in interest rates and prepayment rates of First Busey’s and Pulaski’s assets; (xi) increased competition in the financial services sector and the inability to attract new customers; (xii) changes in technology and the ability to develop and maintain secure and reliable electronic systems; (xiii) the loss of key executives or employees; (xiv) changes in consumer spending; (xv) unexpected results of acquisitions, including the acquisition of Pulaski; (xvi) unexpected outcomes of existing or new litigation involving First Busey or Pulaski; (xvii) the economic impact of any future terrorist threats or attacks; (xviii) the economic impact of exceptional weather occurrences such as tornadoes, hurricanes, floods, and blizzards; and (xix) changes in accounting policies and practices. These risks and uncertainties should be considered in evaluating forward-looking statements and undue reliance should not be placed on such statements. Additional information concerning First Busey and Pulaski and their business, including additional factors that could materially affect First Busey’s and Pulaski’s financial results, are included in First Busey’s and Pulaski’s filings with the SEC. 2
Additional Information First Busey will file a registration statement on Form S-4 with the SEC in connection with the proposed transaction. The registration statement will include a proxy statement of First Busey and Pulaski that also constitutes a prospectus of First Busey, which will be sent to the stockholders of each of First Busey and Pulaski. Stockholders are advised to read the proxy statement/prospectus when it becomes available because it will contain important information about First Busey, Pulaski and the proposed transaction. When filed, this document and other documents relating to the merger filed by First Busey and Pulaski can be obtained free of charge from the SEC’s website at www.sec.gov. These documents also can be obtained free of charge by accessing First Busey’s website at www.busey.com under the tab “Investor Relations” and then under “SEC Filings” or by accessing Pulaski’s website at www.pulaskibank.com under the tab “Our Story” and then under “Shareholder Relations” and “SEC Filings”. Alternatively, these documents, when available, can be obtained free of charge from First Busey upon written request to First Busey Corporation, Corporate Secretary, 100 W. University Avenue, Champaign, Illinois 61820 or by calling (217) 365-4544, or from Pulaski, upon written request to Pulaski Financial Corp., Corporate Secretary, 12300 Olive Boulevard, St. Louis, Missouri 63141 or by calling (314) 878-2210. Participants in this Transaction First Busey, Pulaski and certain of their respective directors and executive officers may be deemed to be participants in the solicitation of proxies from stockholders in connection with the proposed transaction under the rules of the SEC. Information about these participants may be found in the definitive proxy statement of First Busey relating to its 2015 Annual Meeting of Stockholders filed with the SEC by First Busey on April 17, 2015 and the definitive proxy statement of Pulaski relating to its 2015 Annual Meeting of Stockholders filed with the SEC on December 24, 2014. These definitive proxy statements can be obtained free of charge from the sources indicated above. Additional information regarding the interests of these participants statement/prospectus regarding the proposed transaction when it becomes available. will also be included in the proxy 3
Transaction Overview 4

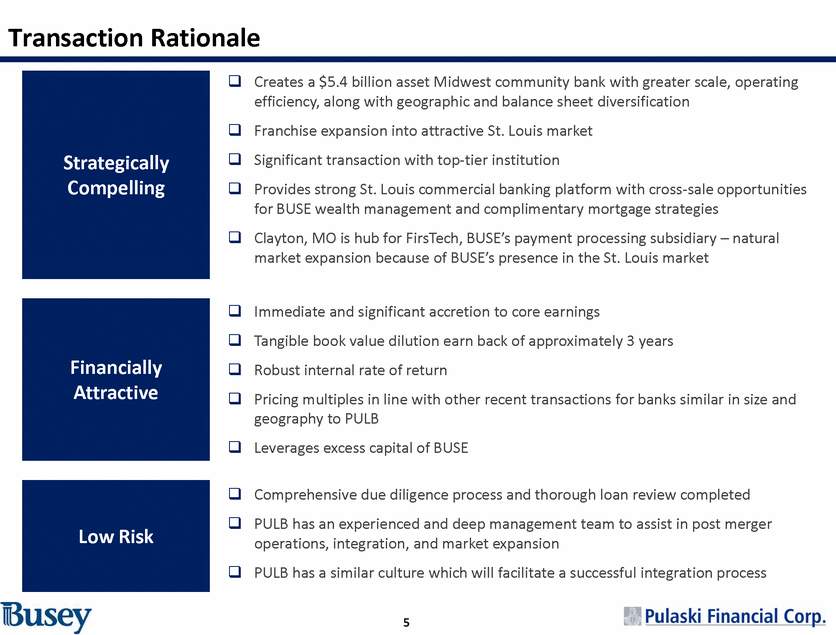
Transaction Rationale Creates a $5.4 billion asset Midwest community bank with greater scale, operating efficiency, along with geographic and balance sheet diversification Franchise expansion into attractive St. Louis market Significant transaction with top-tier institution Provides strong St. Louis commercial banking platform with cross-sale opportunities for BUSE wealth management and complimentary mortgage strategies Clayton, MO is hub for FirsTech, BUSE’s payment processing subsidiary – natural market expansion because of BUSE’s presence in the St. Louis market Immediate and significant accretion to core earnings Tangible book value dilution earn back of approximately 3 years Robust internal rate of return Pricing multiples in line with other recent transactions for banks similar in size and geography to PULB Leverages excess capital of BUSE Comprehensive due diligence process and thorough loan review completed PULB has an experienced and deep management team to assist in post merger operations, integration, and market expansion PULB has a similar culture which will facilitate a successful integration process 5 Low Risk Financially Attractive Strategically Compelling
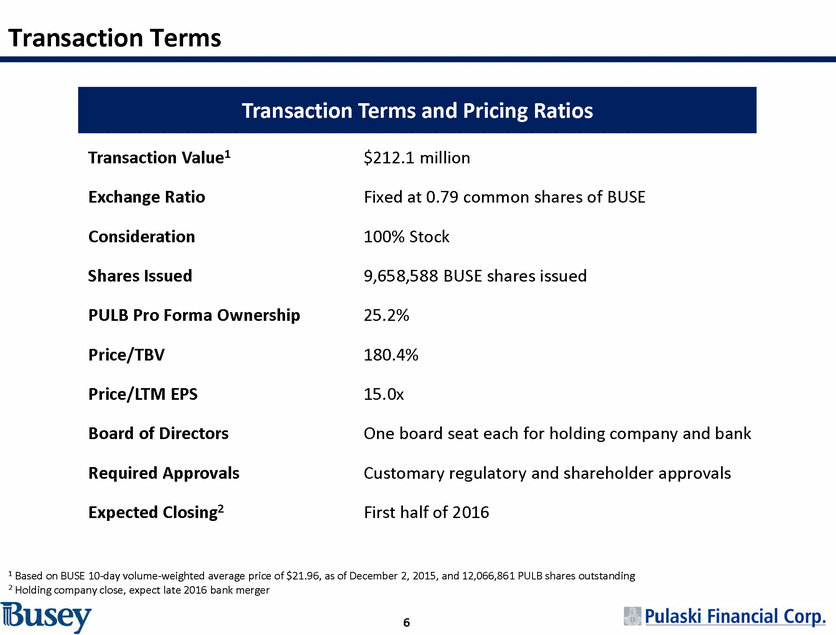
Transaction Terms Transaction Value1 $212.1 million Exchange Ratio Fixed at 0.79 common shares of BUSE Consideration 100% Stock Shares Issued 9,658,588 BUSE shares issued PULB Pro Forma Ownership 25.2% Price/TBV 180.4% Price/LTM EPS 15.0x Board of Directors One board seat each for holding company and bank Required Approvals Customary regulatory and shareholder approvals Expected Closing2 First half of 2016 1 Based on BUSE 10-day volume-weighted average price of $21.96, as of December 2, 2015, and 12,066,861 PULB shares outstanding 2 Holding company close, expect late 2016 bank merger 6 Transaction Terms and Pricing Ratios
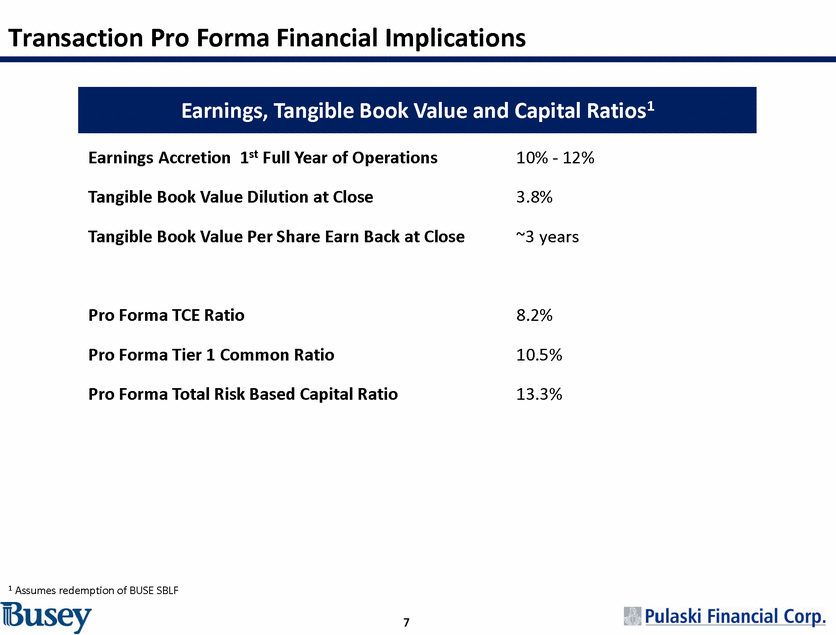
Transaction Pro Forma Financial Implications Earnings Accretion 1st Full Year of Operations 10% - 12% Tangible Book Value Dilution at Close 3.8% Tangible Book Value Per Share Earn Back at Close ~3 years Pro Forma TCE Ratio 8.2% Pro Forma Tier 1 Common Ratio 10.5% Pro Forma Total Risk Based Capital Ratio 13.3% 1 Assumes redemption of BUSE SBLF 7 Earnings, Tangible Book Value and Capital Ratios1
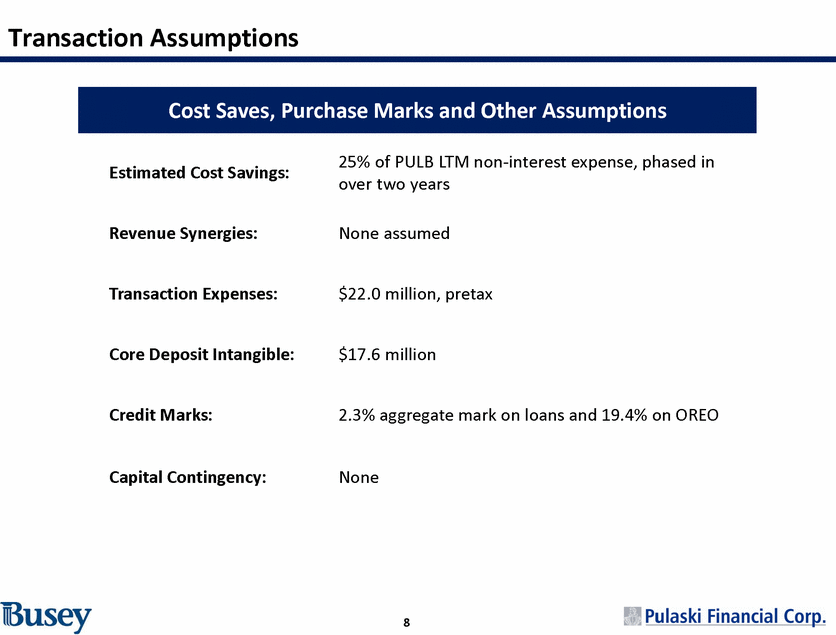
Transaction Assumptions 25% of PULB LTM non-interest expense, phased in over two years Estimated Cost Savings: Revenue Synergies: None assumed Transaction Expenses: $22.0 million, pretax Core Deposit Intangible: $17.6 million Credit Marks: 2.3% aggregate mark on loans and 19.4% on OREO Capital Contingency: None 8 Cost Saves, Purchase Marks and Other Assumptions
Due Diligence Review Thorough due diligence process to evaluate Pulaski’s credit portfolios Total $ Amount $31.0 M As a Percent of NPAs* 135.7% Loan review completed by internal BUSE team Loan Loss Reserve $15.8 M 60% of outstanding commercial loan balances reviewed Net Credit Mark $15.2 M All non-performing and classified credits reviewed OREO properties reviewed Large sample of performing credits reviewed * Excluding TDRs 9 Estimated Credit Mark Due Diligence Overview

Transaction Meets All M&A Disciplines High-density metro market with growth opportunities in commercial & wealth management Significant entry in the attractive St. Louis market, Midwest’s 4th largest MSA cost of deposits 39 bps, 93 year old institution 43% of PULB loans in C&I and Comm. RE, significant cross selling opportunities for BUSE wealth management product line Strong commercial lending platform Complementary culture Similar culture, efficient transition Immediately accretive to earnings excluding transaction costs, first full year accretion approximately 10% - 12% Accretive to EPS Conservative credit marks and reasonable cost saves 2.3% of total loans and over 100% of NPAs; 25% cost savings 1 As of September 30, 2015 10 Attractive TBV earn back periodApproximately 3 years Financial: Ability to enhance value of PULB’s strong Complimentary mortgage strategiesmortgage originations through cross selling BUSE retail and wealth management products Mature franchise with an attractive deposit baseMore than $1.1 billion deposits, 79% core, overall Key AttributesPULBRationale1 Franchise:
Pulaski Financial Corporation and Market Overview 11
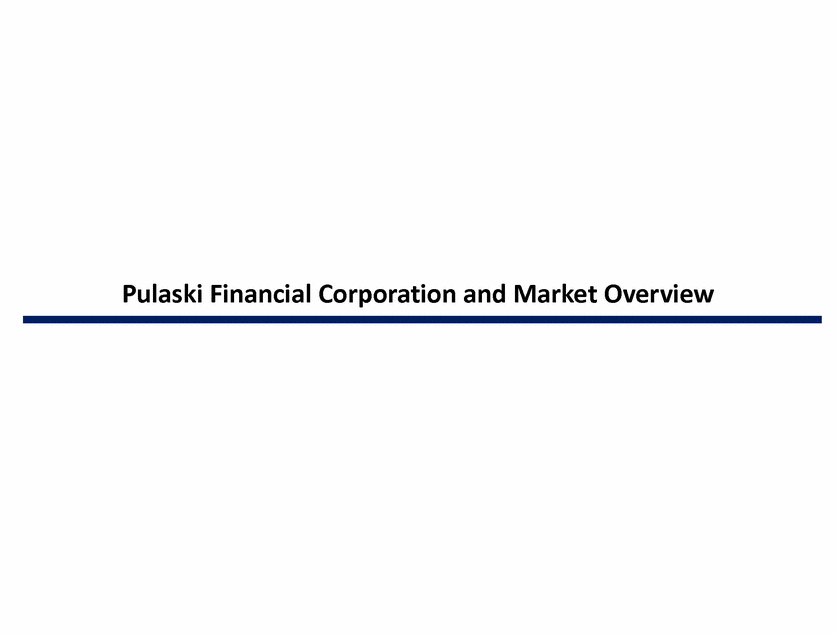
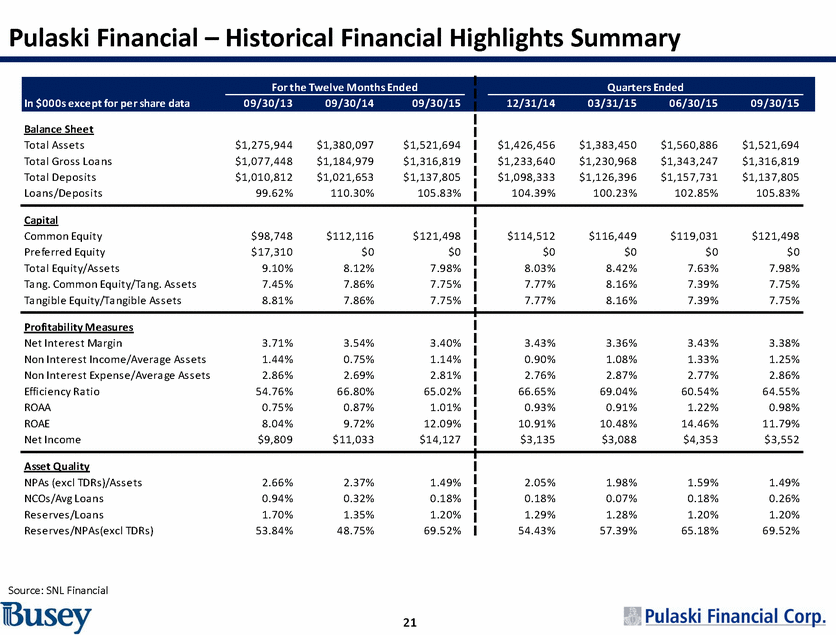
Corporate Overview – Pulaski Financial Corporation 93 year old, St. Louis based independent community bank founded in 1922 13 full-service branches all located in St. Louis MSA Leading mortgage originator in St. Louis and Kansas City Markets Balance Sheet: Assets: $1.5 billion Loans: $1.3 billion Deposits: $1.1 billion Tangible Common equity: $117.6 million Capital Ratios: TE/TA: 7.75% Leverage Ratio: 9.47% Total Risk-Based Capital Ratio: 11.99% Exceptional Asset Quality: NPAs/Assets (ex. TDRs): 1.49% Reserves/Loans: 1.20% Profitability: Net income: $14.1 million ROAA: 1.01% ROAE: 12.09% Net interest margin: 3.40% Financial data for fiscal year ended 9/30/15 Source: SNL Financial 12
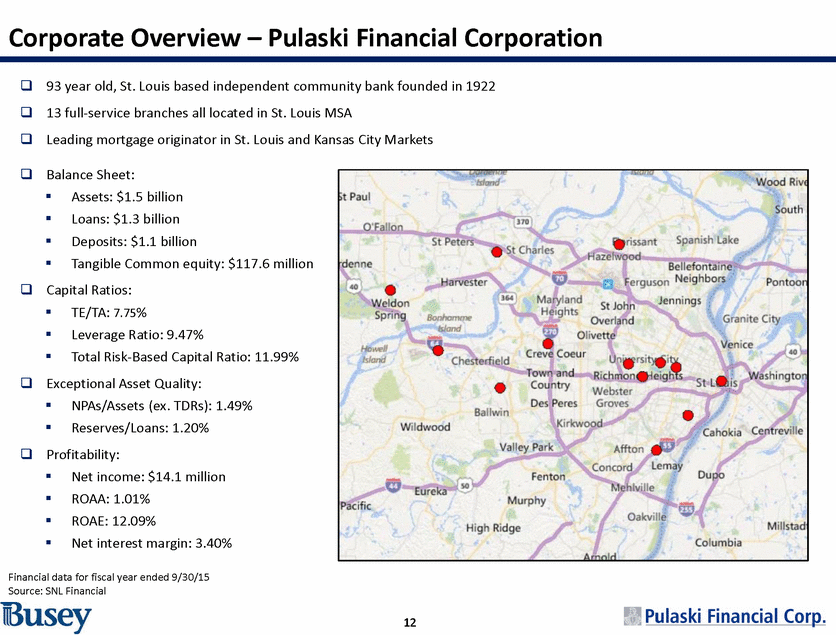
Pulaski Financial Deposit Market Share Branch Franchise 5th largest community bank in St. Louis market 1 2 3 4 5 6 7 8 9 10 11 12 U.S. Bancorp (MN) Bank of America Corp. (NC) Commerce Bancshares Inc. (MO) Regions Financial Corp. (AL) PNC Financial Services Group (PA) Enterprise Financial Services (MO) First Banks Inc. (MO) Fifth Third Bancorp (OH) Banc Ed Corp. (IL) Stupp Bros. Inc. (MO) UMB Financial Corp. (MO) Bank of Montreal 119 53 50 64 47 6 50 17 19 16 17 16 13,877,759 10,664,311 6,179,994 2,825,852 2,040,406 2,036,953 1,960,287 1,526,000 1,482,879 1,289,607 1,227,550 1,214,118 20.09 15.44 8.95 4.09 2.95 2.95 2.84 2.21 2.15 1.87 1.78 1.76 $90 million average deposits per location* 17.9% non-interest bearing* 0.39% total cost of deposits for quarter ended September 30, 2015 14 15 16 17 18 19 20 Central Bancompany Inc. (MO) First Co Bancorp Inc. (IL) Midland States Bancorp Inc. (IL) Reliance Bancshares Inc. (MO) CBX Corp. (IL) Jefferson County Bcshs Inc. (MO) Cass Information Systems (MO) 15 18 21 21 7 17 4 1,144,071 1,011,322 930,570 853,788 696,396 695,032 572,243 1.66 1.46 1.35 1.24 1.01 1.01 0.83 *At September 30, 2015 Source: SNL Financial 13 Market Total 914 69,083,714 100.00 13 Pulaski Financial Corp. (MO) 13 1,162,928 1.68 Saint Louis, MO-IL MSA June 30, 2015 TotalMarket # of Deposits Share Rank Institution Branches ($000) (%)
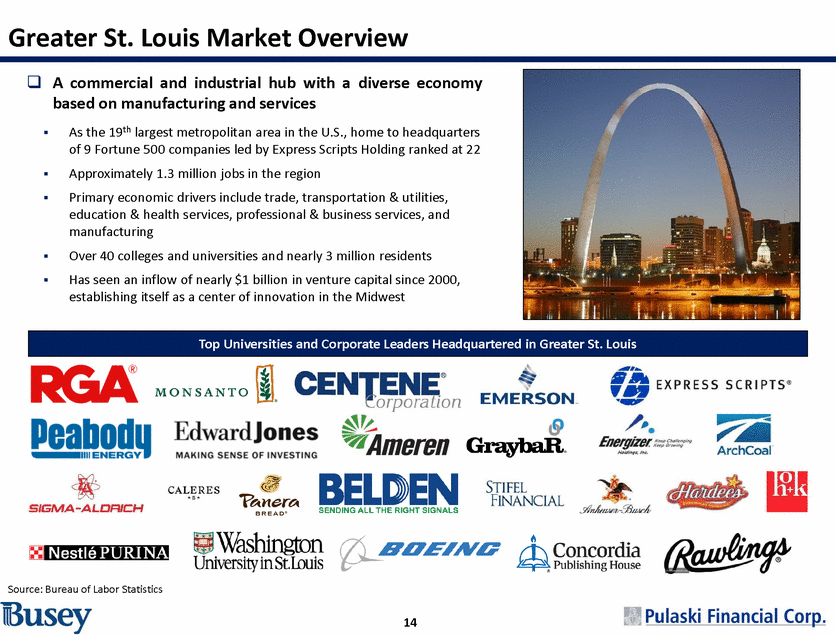
Greater St. Louis Market Overview A commercial and industrial hub with a diverse economy based on manufacturing and services As the 19th largest metropolitan area in the U.S., home to headquarters of 9 Fortune 500 companies led by Express Scripts Holding ranked at 22 Approximately 1.3 million jobs in the region Primary economic drivers include trade, transportation & utilities, education & health services, professional & business services, and manufacturing Over 40 colleges and universities and nearly 3 million residents Has seen an inflow of nearly $1 billion in venture capital since 2000, establishing itself as a center of innovation in the Midwest Source: Bureau of Labor Statistics 14 Top Universities and Corporate Leaders Headquartered in Greater St. Louis
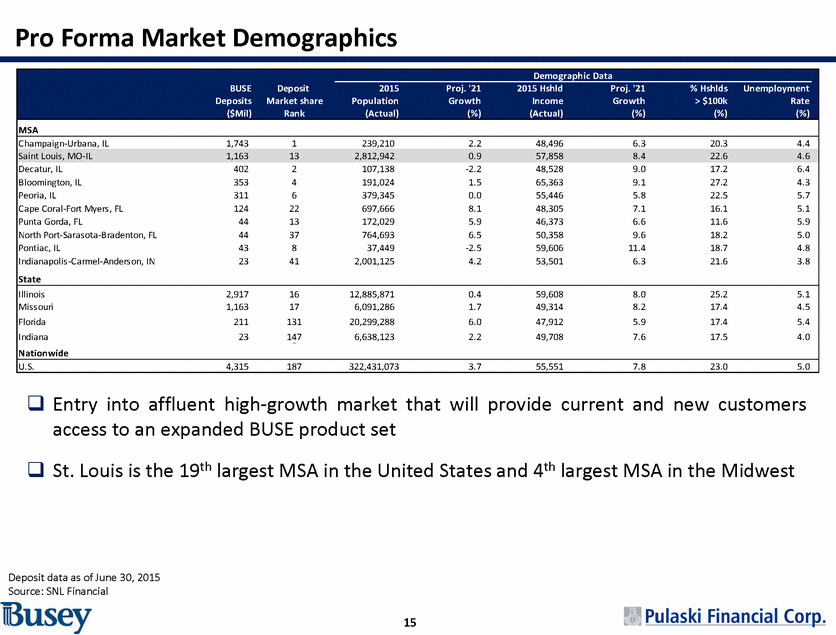
Pro Forma Market Demographics Entry into affluent high-growth market access to an expanded BUSE product set St. Louis is the 19th largest MSA in the United States and 4th largest MSA in the Midwest that will provide current and new customers Deposit data as of June 30, 2015 Source: SNL Financial 15 Demographic Data BUSE Deposit 2015 Proj. '21 2015 Hshld Proj. '21 % Hshlds Unemployment Deposits Market share Population Growth Income Growth > $100k Rate ($Mil) Rank (Actual) (%) (Actual) (%) (%) (%) MSA Champaign-Urbana, IL 1,743 1 239,210 2.2 48,496 6.3 20.3 4.4 Saint Louis, MO-IL 1,163 13 2,812,942 0.9 57,858 8.4 22.6 4.6 Decatur, IL 402 2 107,138 -2.2 48,528 9.0 17.2 6.4 Bloomington, IL 353 4 191,024 1.5 65,363 9.1 27.2 4.3 Peoria, IL 311 6 379,345 0.0 55,446 5.8 22.5 5.7 Cape Coral-Fort Myers, FL 124 22 697,666 8.1 48,305 7.1 16.1 5.1 Punta Gorda, FL 44 13 172,029 5.9 46,373 6.6 11.6 5.9 North Port-Sarasota-Bradenton, FL 44 37 764,693 6.5 50,358 9.6 18.2 5.0 Pontiac, IL 43 8 37,449 -2.5 59,606 11.4 18.7 4.8 Indianapolis-Carmel-Anderson, IN 23 41 2,001,125 4.2 53,501 6.3 21.6 3.8 State Illinois 2,917 16 12,885,871 0.4 59,608 8.0 25.2 5.1 Missouri 1,163 17 6,091,286 1.7 49,314 8.2 17.4 4.5 Florida 211 131 20,299,288 6.0 47,912 5.9 17.4 5.4 Indiana 23 147 6,638,123 2.2 49,708 7.6 17.5 4.0 Nationwide U.S. 4,315 187 322,431,073 3.7 55,551 7.8 23.0 5.0
Pro Forma Company Analysis 16
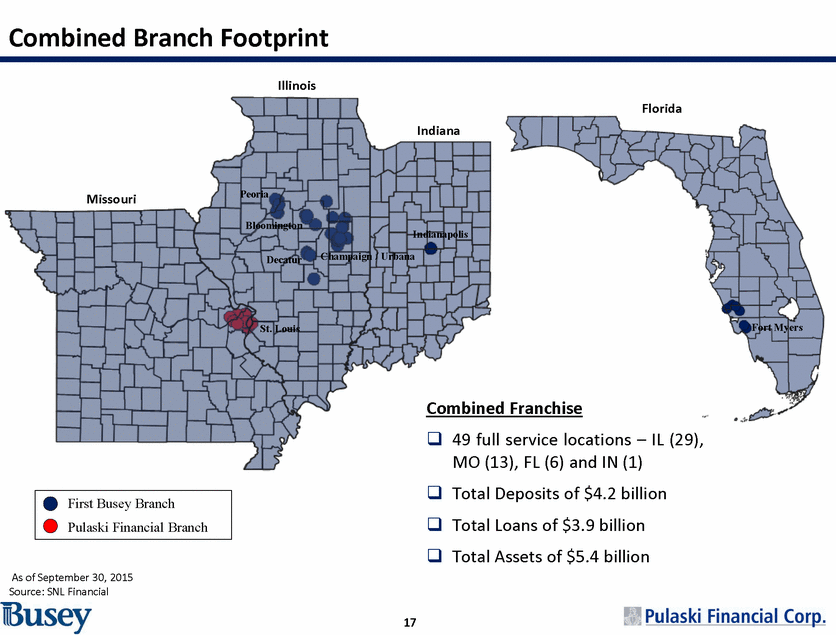
Combined Branch Footprint Illinois Florida Indiana Peoria Missouri Bloomington Indianapolis Champaign / Urbana Decatur Fort Myers St. Louis Combined Franchise 49 full service locations – IL (29), MO (13), FL (6) and IN (1) Total Deposits of $4.2 billion Total Loans of $3.9 billion Total Assets of $5.4 billion As of September 30, 2015 Source: SNL Financial 17 First Busey Branch Pulaski Financial Branch
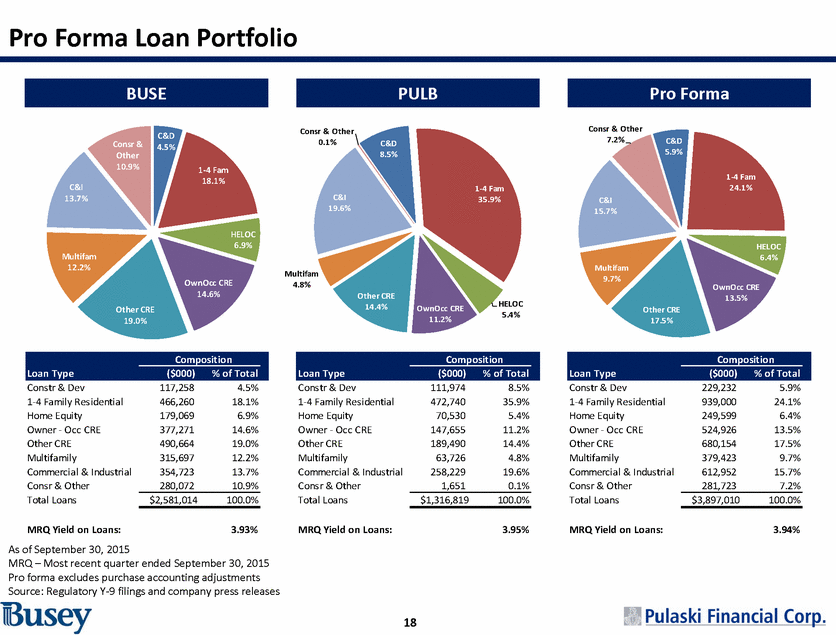
Pro Forma Loan Portfolio Consr & Other 7.2% Consr & Other 0.1% C&D .5% C& 5.9 Consr & Other 10.9% 8.5% 1-4 Fam 18.1% 1-4 Fam 24.1% C&I 13.7% 1-4 Fam 35.9% C&I 19.6% C&I 15.7 6.9% HELOC 6.4 Multifam 12.2% Multifam 9.7% Multifam 4.8% wnOcc CRE 14.6% OwnOcc CRE 13.5% Other CRE 14.4% HELOC 5.4% OwnOcc CRE 11.2% Other CRE 19.0% Other CRE 17.5% Constr & Dev 1-4 Family Residential Home Equity Owner - Occ CRE Other CRE Multifamily Commercial & Industrial Consr & Other Total Loans 117,258 466,260 179,069 377,271 490,664 315,697 354,723 4.5% 18.1% 6.9% 14.6% 19.0% 12.2% 13.7% Constr & Dev 1-4 Family Residential Home Equity Owner - Occ CRE Other CRE Multifamily Commercial & Industrial Consr & Other Total Loans 111,974 472,740 70,530 147,655 189,490 63,726 258,229 8.5% 35.9% 5.4% 11.2% 14.4% 4.8% 19.6% Constr & Dev 1-4 Family Residential Home Equity Owner - Occ CRE Other CRE Multifamily Commercial & Industrial Consr & Other Total Loans 229,232 939,000 249,599 524,926 680,154 379,423 612,952 5.9% 24.1% 6.4% 13.5% 17.5% 9.7% 15.7% 280,072 10.9% 1,651 0.1% 281,723 7.2% $2,581,014 100.0% $1,316,819 100.0% $3,897,010 100.0% MRQ Yield on Loans: As of September 30, 2015 3.93% MRQ Yield on Loans: 3.95% MRQ Yield on Loans: 3.94% MRQ – Most recent quarter ended September 30, 2015 Pro forma excludes purchase accounting adjustments Source: Regulatory Y-9 filings and company press releases 18 Composition Loan Type ($000) % of Total Composition Loan Type ($000) % of Total Composition Loan Type ($000) % of Total Pro Forma PULB BUSE
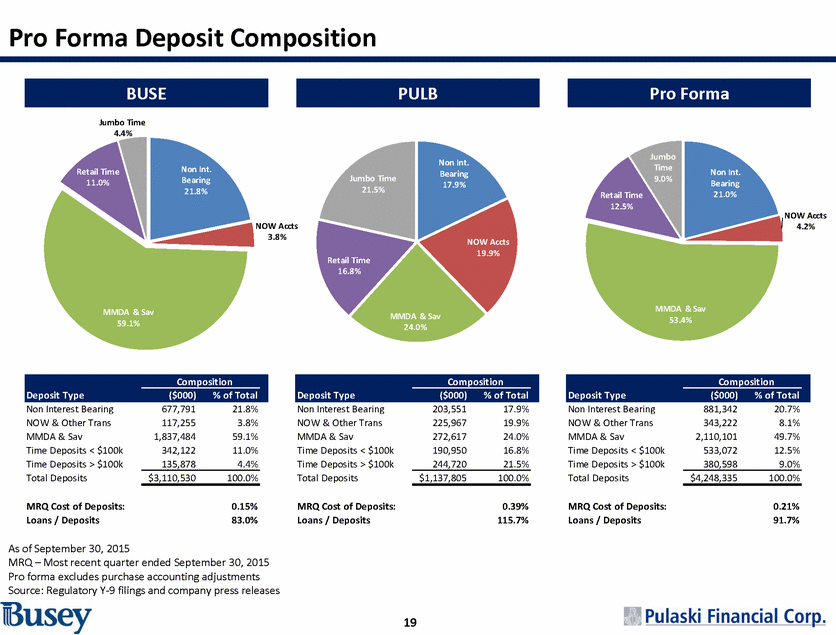
Pro Forma Deposit Composition Jumbo Time 4.4% Jumbo Time 9.0% Non Int. Bearing 17.9% Non Int. Bearing Retail Time 11.0% Non Int. Bearing 21.0% Jumbo Time 21.5% Retail T me 12.5 NOW Accts 4.2% NOW Accts 3.8% Accts 1 .9% Retail Time 16.8% MMDA & Sav 53.4% MMDA & Sav 59.1% A & Sav 24.0% Non Interest Bearing NOW & Other Trans MMDA & Sav Time Deposits < $100k Time Deposits > $100k Total Deposits 677,791 117,255 1,837,484 342,122 21.8% 3.8% 59.1% 11.0% Non Interest Bearing NOW & Other Trans MMDA & Sav Time Deposits < $100k Time Deposits > $100k Total Deposits 203,551 225,967 272,617 190,950 17.9% 19.9% 24.0% 16.8% Non Interest Bearing NOW & Other Trans MMDA & Sav Time Deposits < $100k Time Deposits > $100k Total Deposits 881,342 343,222 2,110,101 533,072 20.7% 8.1% 49.7% 12.5% 135,878 4.4% 244,720 21.5% 380,598 9.0% $3,110,530 100.0% $1,137,805 100.0% $4,248,335 100.0% MRQ Cost of Deposits: Loans / Deposits 0.15% 83.0% MRQ Cost of Deposits: Loans / Deposits 0.39% 115.7% MRQ Cost of Deposits: Loans / Deposits 0.21% 91.7% As of September 30, 2015 MRQ – Most recent quarter ended September 30, 2015 Pro forma excludes purchase accounting adjustments Source: Regulatory Y-9 filings and company press releases 19 Composition Deposit Type($000)% of Total Composition Deposit Type($000)% of Total Composition Deposit Type($000)% of Total Pro Forma PULB BUSE
Appendix 20
Pulaski Financial – Historical Financial Highlights Summary Source: SNL Financial 21 For the Twelve Months Ended In $000s except for per share data 09/30/13 09/30/14 09/30/15 Quarters Ended 12/31/14 03/31/15 06/30/15 09/30/15 Balance Sheet Tota l As s ets $1,275,944 $1,380,097 $1,521,694 Tota l Gros s Loa ns $1,077,448 $1,184,979 $1,316,819 Tota l Depos its $1,010,812 $1,021,653 $1,137,805 Loa ns /Depos its 99.62% 110.30% 105.83% $1,426,456 $1,383,450 $1,560,886 $1,521,694 $1,233,640 $1,230,968 $1,343,247 $1,316,819 $1,098,333 $1,126,396 $1,157,731 $1,137,805 104.39% 100.23% 102.85% 105.83% Capital Common Equity $98,748 $112,116 $121,498 Preferred Equity $17,310 $0 $0 Tota l Equity/As s ets 9.10% 8.12% 7.98% Ta ng. Common Equity/Ta ng. As s ets 7.45% 7.86% 7.75% Ta ngible Equity/Ta ngible As s ets 8.81% 7.86% 7.75% $114,512 $116,449 $119,031 $121,498 $0 $0 $0 $0 8.03% 8.42% 7.63% 7.98% 7.77% 8.16% 7.39% 7.75% 7.77% 8.16% 7.39% 7.75% Profitability Measures Net Interes t Ma rgin 3.71% 3.54% 3.40% Non Interes t Income/Avera ge As s ets 1.44% 0.75% 1.14% Non Interes t Expens e/Avera ge As s ets 2.86% 2.69% 2.81% Efficiency Ra tio 54.76% 66.80% 65.02% ROAA 0.75% 0.87% 1.01% ROAE 8.04% 9.72% 12.09% Net Income $9,809 $11,033 $14,127 3.43% 3.36% 3.43% 3.38% 0.90% 1.08% 1.33% 1.25% 2.76% 2.87% 2.77% 2.86% 66.65% 69.04% 60.54% 64.55% 0.93% 0.91% 1.22% 0.98% 10.91% 10.48% 14.46% 11.79% $3,135 $3,088 $4,353 $3,552 Asset Quality NPAs (excl TDRs )/As s ets 2.66% 2.37% 1.49% NCOs /Avg Loa ns 0.94% 0.32% 0.18% Res erves /Loa ns 1.70% 1.35% 1.20% Res erves /NPAs (excl TDRs ) 53.84% 48.75% 69.52% 2.05% 1.98% 1.59% 1.49% 0.18% 0.07% 0.18% 0.26% 1.29% 1.28% 1.20% 1.20% 54.43% 57.39% 65.18% 69.52%
