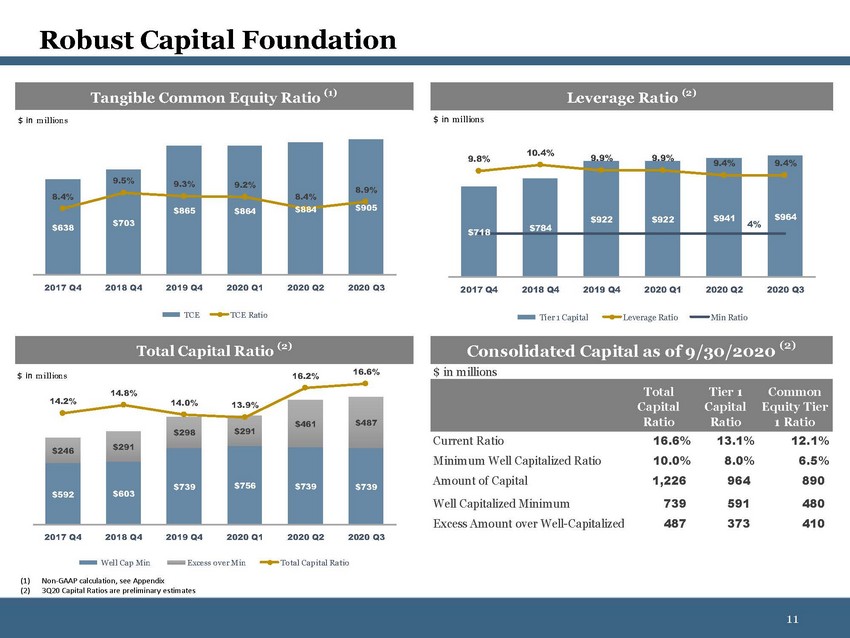
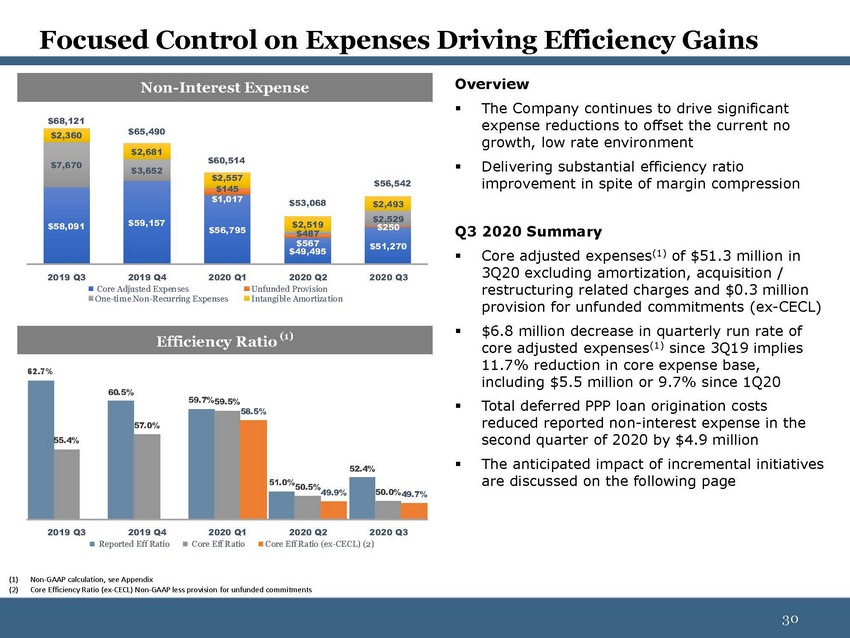
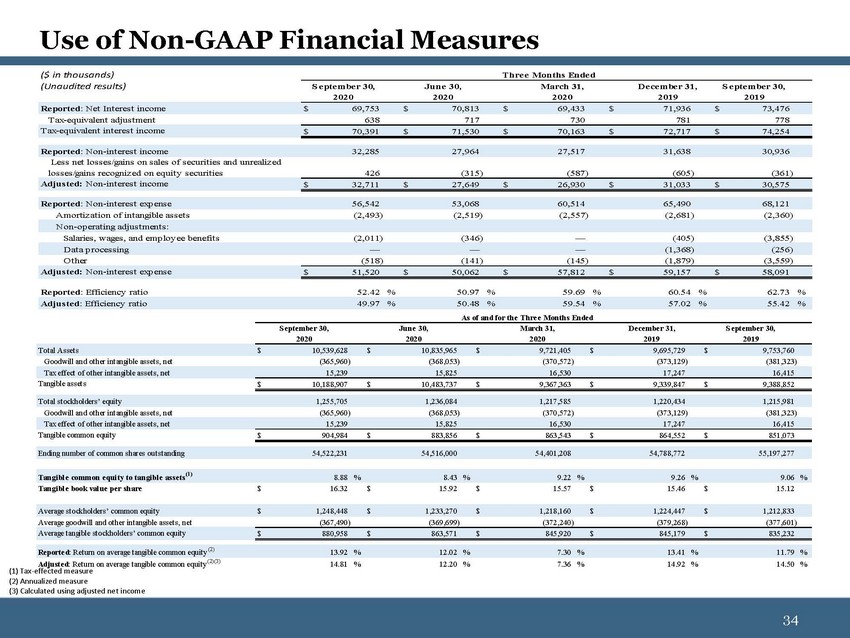
 | ($ in thousands) Thre e Months Ende d (Unaudited results) S e pte mbe r 30, June 30, March 31, De ce mbe r 31, S e pte mbe r 30, 20202020 2020 2019 2019 Re porte d: Net Int erest income $69,753$70,813$69,433$71,936$73,476 T ax-equivalent adjust ment 638717730781778 T ax-equivalent int erest income $70,391$71,530$70,163$72,717$74,254 Re porte d: Non-int erest income 32,28527,96427,51731,63830,936 Less net losses/gains on sales of securit ies and unrealiz ed losses/gains recogniz ed on equit y securit ies 426(315)(587)(605)(361) Adjuste d: Non-int erest income $32,711$27,649$26,930$31,033$30,575 Re porte d: Non-int erest exp ense 56,54253,06860,51465,49068,121 Amort iz at ion of int angible asset s(2,493) (2,519) (2,557) (2,681) (2,360) Non-op erat ing adjust ment s: Salaries, wages, and emp loy ee benefit s (2,011) (346) — (405) (3,855) Dat a p rocessing — — — (1,368) (256) Ot her (518) (141) (145) (1,879) (3,559) Adjuste d: Non-int erest exp ense $51,520$50,062$57,812$59,157$58,091 Re porte d: Efficiency rat io 52.42 %50.97 %59.69 %60.54 %62.73 % Adjuste d: Efficiency rat io 49.97 %50.48 %59.54 %57.02 %55.42 % As of and for the Thre e Months Ende d S eptember 30, June 30, 20202020 March 31, 2020 December 31, 2019 S eptember 30, 2019 Total Assets $ 10,539,628 $ 10,835,965 $ 9,721,405 $ 9,695,729 $ 9,753,760 Goodwill and other intangible assets, net (365,960) (368,053) (370,572) (373,129) (381,323) Tax effect of other intangible assets, net 15,239 15,825 16,530 17,247 16,415 Tangible assets $ 10,188,907 $ 10,483,737 $ 9,367,363 $ 9,339,847 $ 9,388,852 Total stockholders’ equity 1,255,705 1,236,084 1,217,585 1,220,434 1,215,981 Goodwill and other intangible assets, net (365,960) (368,053) (370,572) (373,129) (381,323) Tax effect of other intangible assets, net 15,239 15,825 16,530 17,247 16,415 Tangible common equity $ 904,984 $ 883,856 $ 863,543 $ 864,552 $ 851,073 Ending number of common shares outstanding 54,522,231 54,516,000 54,401,208 54,788,772 55,197,277 Tangible common equity to tangible assets(1) 8.88 % 8.43 % 9.22 % 9.26 % 9.06 % Tangible book value per share $ 16.32 $ 15.92 $ 15.57 $ 15.46 $ 15.12 Average stockholders’ common equity $ 1,248,448 $ 1,233,270 $ 1,218,160 $ 1,224,447 $ 1,212,833 Average goodwill and other intangible assets, net (367,490) (369,699) (372,240) (379,268) (377,601) Average tangible stockholders’ common equity $ 880,958 $ 863,571 $ 845,920 $ 845,179 $ 835,232 Reported: Return on average tangible common equity (2)13.92 % 12.02 % 7.30 % 13.41 % 11.79 % Adjusted: Return on average tangible common equity (2)(3)14.81 % 12.20 % 7.36 % 14.92 % 14.50 % (1) Tax-effected measure (2) Annualized measure |