Exhibit 99.2
 | 4Q20 QUARTERLY EARNINGS SUPPLEMENT January 26, 2021 |
 | Statements made in this document, other than those concerning historical financial information, may be considered forward-looking statements within the meaning of the Private Securities Litigation Reform Act of 1995 with respect to the financial condition, results of operations, plans, objectives, future performance and business of the Company. Forward-looking statements, which may be based upon beliefs, expectations and assumptions of the Company’s management and on information currently available to management, are generally identifiable by the use of words such as “believe,” “expect,” “anticipate,” “plan,” “intend,” “estimate,” “may,” “will,” “would,” “could,” “should” or other similar expressions. Additionally, all statements in this document, including forward-looking statements, speak only as of the date they are made, and the Company undertakes no obligation to update any statement in light of new information or future events. A number of factors, many of which are beyond the Company’s ability to control or predict, could cause actual results to differ materially from those in the Company’s forward-looking statements. These factors include, among others, the following: (i) the strength of the local, state, national and international economy (including the impact of the new presidential administration and the impact of tariffs, a U.S. withdrawal from or significant negotiation of trade agreements, trade wars and other changes in trade regulations); (ii) the economic impact of any future terrorist threats or attacks, widespread disease or pandemics (including the COVID-19 pandemic in the United States), or other adverse external events that could cause economic deterioration or instability in credit markets; (iii) changes in state and federal laws, regulations and governmental policies concerning the Company’s general business; (iv) changes in accounting policies and practices, including CECL, which changed how the Company estimates credit losses; (v) changes in interest rates and prepayment rates of the Company’s assets (including the impact of the London Inter-bank Offered Rate phase-out); (vi) increased competition in the financial services sector and the inability to attract new customers; (vii) changes in technology and the ability to develop and maintain secure and reliable electronic systems; (viii) the loss of key executives or associates; (ix) changes in consumer spending; (x) unexpected results of current and/or future acquisitions, which may include failure to realize the anticipated benefits of any acquisition and the possibility that the transaction costs may be greater than anticipated; (xi) unexpected outcomes of existing or new litigation involving the Company; and (xii) the economic impact of exceptional weather occurrences such as tornadoes, hurricanes, floods, and blizzards. These risks and uncertainties should be considered in evaluating forward-looking statements and undue reliance should not be placed on such statements. Additional information concerning the Company and its business, including additional factors that could materially affect its financial results, is included in the Company’s filings with the Securities and Exchange Commission. |
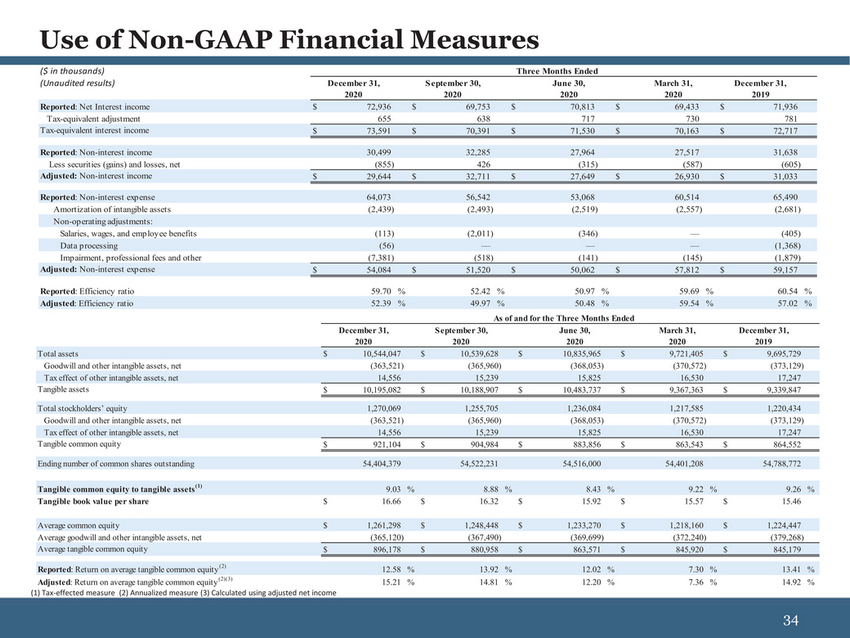
 | This document contains financial information determined other than in accordance with accounting principles generally accepted in the United States of America (“GAAP”). Management uses these “non-GAAP” measures in its analysis of the Company’s performance. Management also believes that these non-GAAP financial measures allow for better comparability of period to period operating performance. Additionally, the Company believes this information is utilized by regulators and market analysts to evaluate a company’s financial condition, and therefore, such information is useful to investors. These disclosures should not be viewed as a substitute for operating results determined in accordance with GAAP, nor are they necessarily comparable to non-GAAP performance measures that may be presented by other companies. A reconciliation of the non-GAAP measures used in this document to the most directly comparable GAAP measures is provided beginning on page 32 of this document. For more details on the Company’s non-GAAP measures, refer to the Company’s Annual Report on Form 10-K for the year ended December 31, 2019 and the Company’s Quarterly Report on Form 10-Q for the quarter ended September 30, 2020. |
 | [LOGO] |
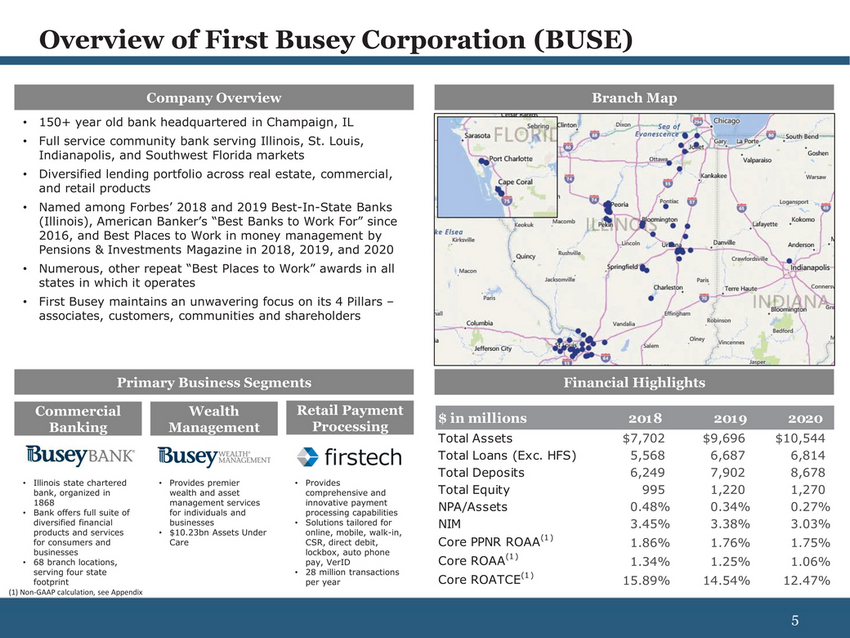 | Company OverviewBranch Map 150+ year old bank headquartered in Champaign, IL Full service community bank serving Illinois, St. Louis, Indianapolis, and Southwest Florida markets Diversified lending portfolio across real estate, commercial, and retail products Named among Forbes’ 2018 and 2019 Best-In-State Banks (Illinois), American Banker’s “Best Banks to Work For” since 2016, and Best Places to Work in money management by Pensions & Investments Magazine in 2018, 2019, and 2020 Numerous, other repeat “Best Places to Work” awards in all states in which it operates First Busey maintains an unwavering focus on its 4 Pillars – associates, customers, communities and shareholders Primary Business SegmentsFinancial Highlights Commercial Banking Wealth Management Retail Payment Processing Illinois state chartered bank, organized in 1868 Bank offers full suite of diversified financial products and services for consumers and businesses 68 branch locations, serving four state footprint Non-GAAP calculation, see Appendix Provides premier wealth and asset management services for individuals and businesses $10.23bn Assets Under Care Provides comprehensive and innovative payment processing capabilities Solutions tailored for online, mobile, walk-in, CSR, direct debit, lockbox, auto phone pay, VerID 28 million transactions per year $ in millions 2018 2019 2020 Total Assets $7,702 $9,696 $10,544 Total Loans (Exc. HFS) 5,568 6,687 6,814 Total Deposits 6,249 7,902 8,678 Total Equity 995 1,220 1,270 NPA/Assets 0.48% 0.34% 0.27% NIM 3.45% 3.38% 3.03% Core PPNR ROAA(1 ) 1.86% 1.76% 1.75% Core ROAA(1 ) 1.34% 1.25% 1.06% |
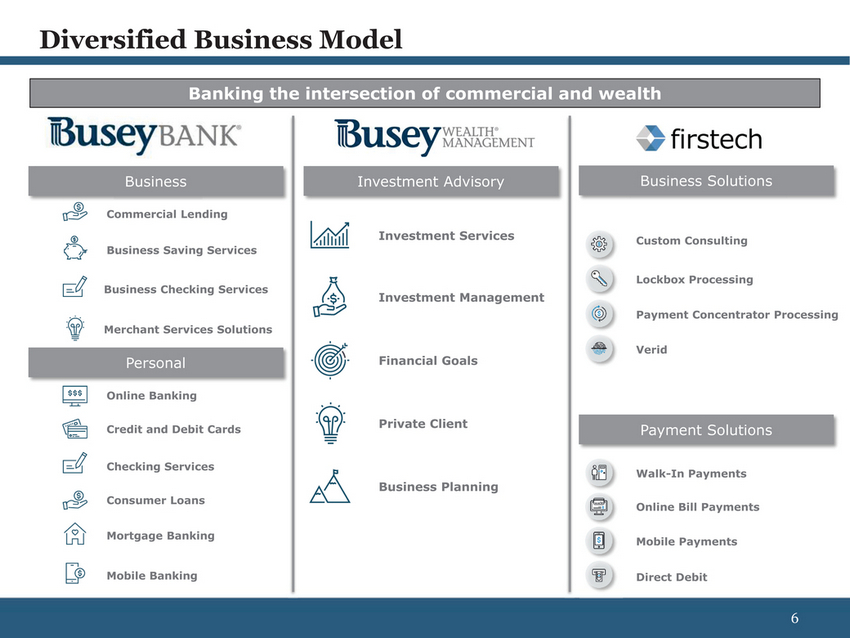 | Banking the intersection of commercial and wealth Business Investment Advisory Business Solutions Commercial Lending Business Saving Services Business Checking Services Merchant Services Solutions Personal Online Banking Credit and Debit Cards Checking Services Consumer Loans Mortgage Banking Investment Services Investment Management Financial Goals Private Client Business Planning Custom Consulting Lockbox Processing Payment Concentrator Processing Verid Payment Solutions Walk-In Payments Online Bill Payments Mobile Payments Mobile Banking Direct Debit 6 |
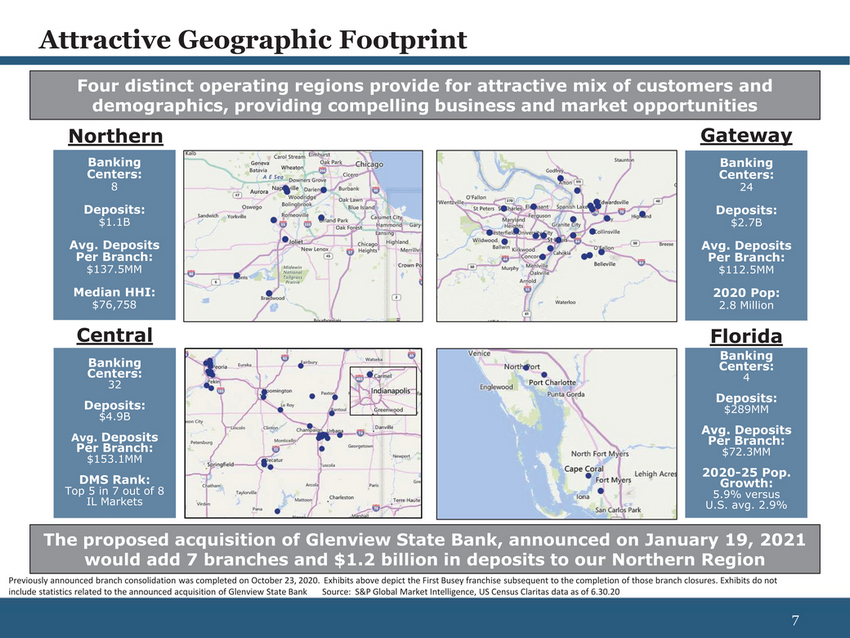 | Four distinct operating regions provide for attractive mix of customers and demographics, providing compelling business and market opportunities NorthernGateway Banking Centers: 8 Deposits: $1.1B Avg. Deposits Per Branch: $137.5MM Median HHI: $76,758 Banking Centers: 24 Deposits: $2.7B Avg. Deposits Per Branch: $112.5MM 2020 Pop: 2.8 Million CentralFlorida Banking Centers: 32 Deposits: $4.9B Avg. Deposits Per Branch: $153.1MM DMS Rank: Top 5 in 7 out of 8 IL Markets Banking Centers: 4 Deposits: $289MM Avg. Deposits Per Branch: $72.3MM 2020-25 Pop. Growth: 5.9% versus U.S. avg. 2.9% The proposed acquisition of Glenview State Bank, announced on January 19, 2021 would add 7 branches and $1.2 billion in deposits to our Northern Region Previously announced branch consolidation was completed on October 23, 2020. Exhibits above depict the First Busey franchise subsequent to the completion of those branch closures. Exhibits do not include statistics related to the announced acquisition of Glenview State Bank Source: S&P Global Market Intelligence, US Census Claritas data as of 6.30.20 |
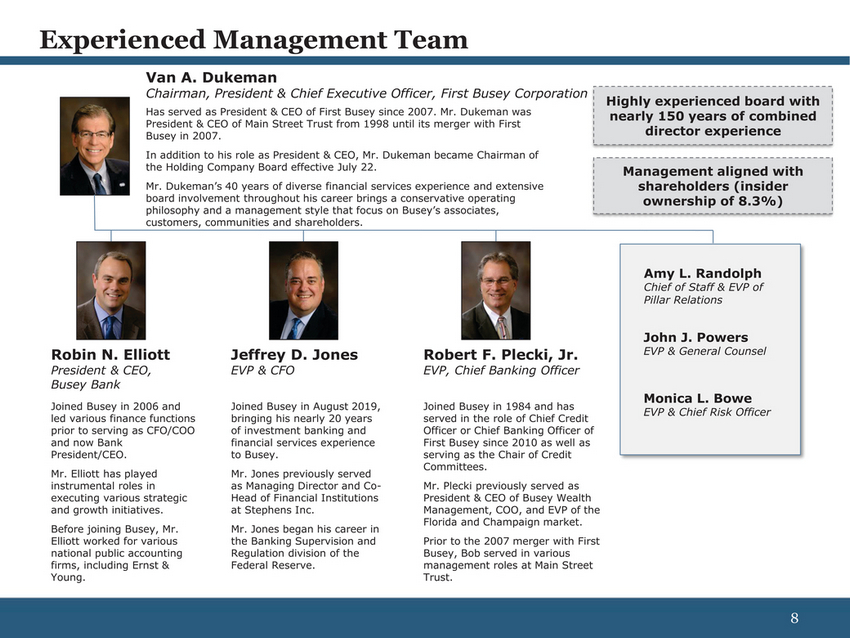 | Experienced Management Team Van A. Dukeman Chairman, President & Chief Executive Officer, First Busey Corporation Has served as President & CEO of First Busey since 2007. Mr. Dukeman was President & CEO of Main Street Trust from 1998 until its merger with First Busey in 2007. In addition to his role as President & CEO, Mr. Dukeman became Chairman of the Holding Company Board effective July 22. Mr. Dukeman’s 40 years of diverse financial services experience and extensive board involvement throughout his career brings a conservative operating philosophy and a management style that focus on Busey’s associates, customers, communities and shareholders. Highly experienced board with nearly 150 years of combined director experience Management aligned with shareholders (insider ownership of 8.3%) Amy L. Randolph Chief of Staff & EVP of Pillar Relations Robin N. Elliott President & CEO, Busey Bank Joined Busey in 2006 and led various finance functions prior to serving as CFO/COO and now Bank President/CEO. Mr. Elliott has played instrumental roles in executing various strategic and growth initiatives. Before joining Busey, Mr. Elliott worked for various national public accounting firms, including Ernst & Young. Jeffrey D. Jones EVP & CFO Joined Busey in August 2019, bringing his nearly 20 years of investment banking and financial services experience to Busey. Mr. Jones previously served as Managing Director and Co-Head of Financial Institutions at Stephens Inc. Mr. Jones began his career in the Banking Supervision and Regulation division of the Federal Reserve. Robert F. Plecki, Jr. EVP, Chief Banking Officer Joined Busey in 1984 and has served in the role of Chief Credit Officer or Chief Banking Officer of First Busey since 2010 as well as serving as the Chair of Credit Committees. Mr. Plecki previously served as President & CEO of Busey Wealth Management, COO, and EVP of the Florida and Champaign market. Prior to the 2007 merger with First Busey, Bob served in various management roles at Main Street Trust. John J. Powers EVP & General Counsel Monica L. Bowe EVP & Chief Risk Officer |
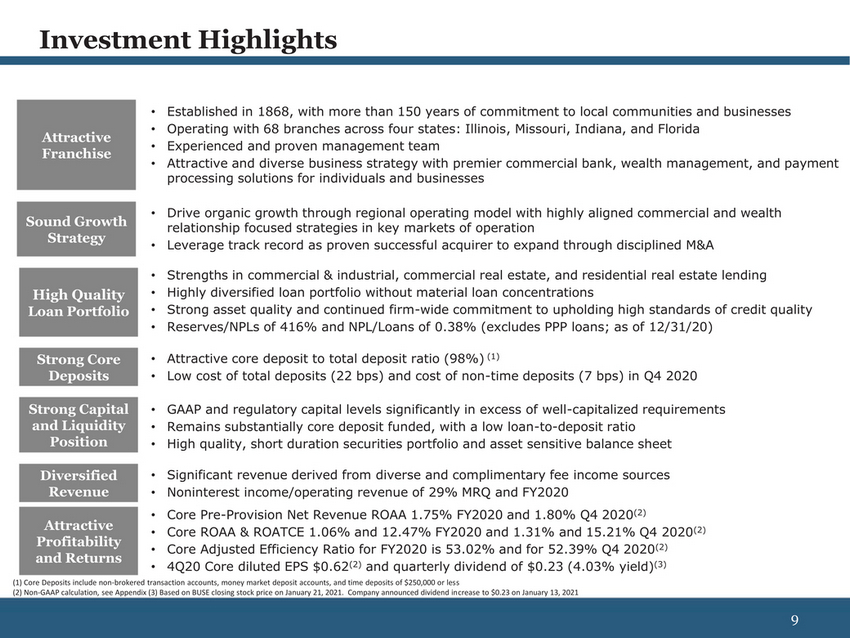 | Attractive Franchise Established in 1868, with more than 150 years of commitment to local communities and businesses Operating with 68 branches across four states: Illinois, Missouri, Indiana, and Florida Experienced and proven management team Attractive and diverse business strategy with premier commercial bank, wealth management, and payment processing solutions for individuals and businesses Sound Growth Strategy Drive organic growth through regional operating model with highly aligned commercial and wealth relationship focused strategies in key markets of operation Leverage track record as proven successful acquirer to expand through disciplined M&A High Quality Loan Portfolio Strengths in commercial & industrial, commercial real estate, and residential real estate lending Highly diversified loan portfolio without material loan concentrations Strong asset quality and continued firm-wide commitment to upholding high standards of credit quality Reserves/NPLs of 416% and NPL/Loans of 0.38% (excludes PPP loans; as of 12/31/20) Strong Core Deposits Attractive core deposit to total deposit ratio (98%) (1) Low cost of total deposits (22 bps) and cost of non-time deposits (7 bps) in Q4 2020 Strong Capital and Liquidity Position GAAP and regulatory capital levels significantly in excess of well-capitalized requirements Remains substantially core deposit funded, with a low loan-to-deposit ratio High quality, short duration securities portfolio and asset sensitive balance sheet Diversified Revenue Attractive Profitability and Returns Significant revenue derived from diverse and complimentary fee income sources Noninterest income/operating revenue of 29% MRQ and FY2020 Core Pre-Provision Net Revenue ROAA 1.75% FY2020 and 1.80% Q4 2020(2) • Core ROAA & ROATCE 1.06% and 12.47% FY2020 and 1.31% and 15.21% Q4 2020(2) Core Adjusted Efficiency Ratio for FY2020 is 53.02% and for 52.39% Q4 2020(2) 4Q20 Core diluted EPS $0.62(2) and quarterly dividend of $0.23 (4.03% yield)(3) Core Deposits include non-brokered transaction accounts, money market deposit accounts, and time deposits of $250,000 or less Non-GAAP calculation, see Appendix (3) Based on BUSE closing stock price on January 21, 2021. Company announced dividend increase to $0.23 on January 13, 2021 |
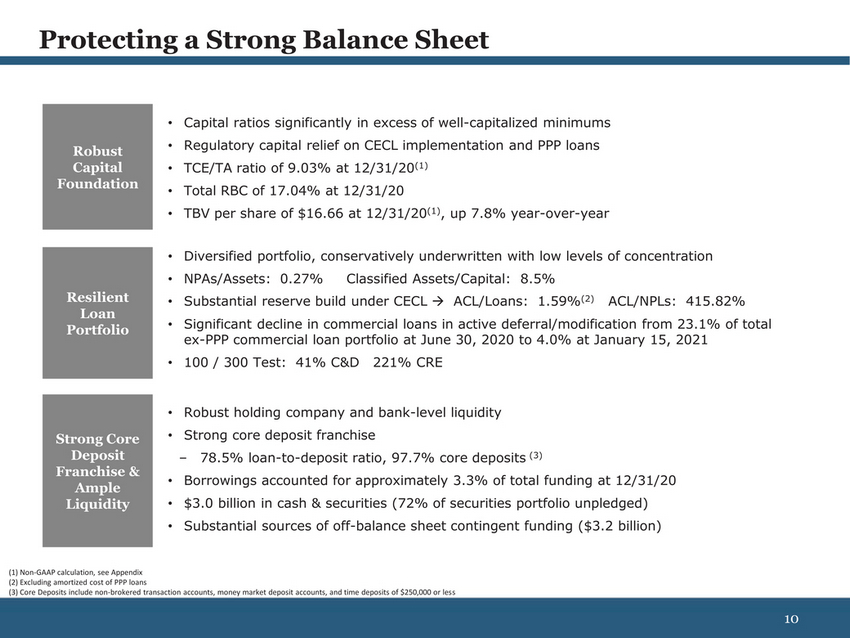 | Robust Capital Foundation Resilient Loan Portfolio Strong Core Deposit Franchise & Ample Liquidity Capital ratios significantly in excess of well-capitalized minimums Regulatory capital relief on CECL implementation and PPP loans • TCE/TA ratio of 9.03% at 12/31/20(1) • Total RBC of 17.04% at 12/31/20 TBV per share of $16.66 at 12/31/20(1), up 7.8% year-over-year Diversified portfolio, conservatively underwritten with low levels of concentration NPAs/Assets: 0.27%Classified Assets/Capital: 8.5% Substantial reserve build under CECL → ACL/Loans: 1.59%(2)ACL/NPLs: 415.82% Significant decline in commercial loans in active deferral/modification from 23.1% of total ex-PPP commercial loan portfolio at June 30, 2020 to 4.0% at January 15, 2021 • 100 / 300 Test: 41% C&D221% CRE Robust holding company and bank-level liquidity Strong core deposit franchise –78.5% loan-to-deposit ratio, 97.7% core deposits (3) Borrowings accounted for approximately 3.3% of total funding at 12/31/20 $3.0 billion in cash & securities (72% of securities portfolio unpledged) Substantial sources of off-balance sheet contingent funding ($3.2 billion) Non-GAAP calculation, see Appendix Excluding amortized cost of PPP loans Core Deposits include non-brokered transaction accounts, money market deposit accounts, and time deposits of $250,000 or less |
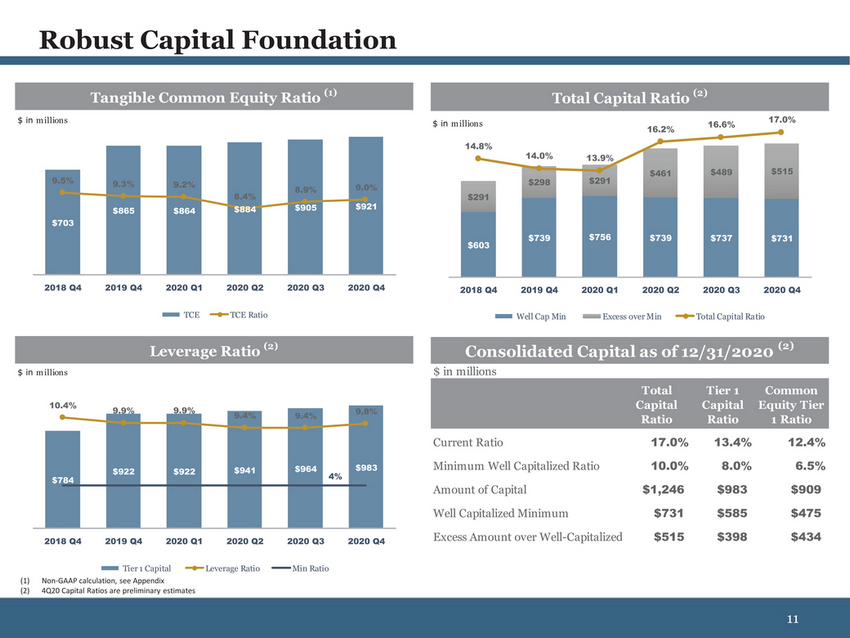 | $ in m illions Total Capital Ratio (2) $ in m illions $ in m illions 14.8% 14.0%13.9% 16.2%16.6% 17.0% 9.5%9.3%9.2% 8.4% 8.9%9.0% $291 $298$291 $461$489$515 $703 $865$864$884$905$921 $603 $739$756$739$737$731 2018 Q42019 Q42020 Q12020 Q22020 Q32020 Q4 2018 Q42019 Q42020 Q12020 Q22020 Q32020 Q4 TCETCE Ratio Well Cap MinExcess over MinTotal Capital Ratio $ in m illions Leverage Ratio (2) Consolidated Capital as of 12/31/2020 (2) $ in millions 10.4%9.9%9.9% 9.4%9.4%9.8% Total Capital Ratio Tier 1 Capital Ratio Common Equity Tier 1 Ratio $784 $922$922$941$964$983 4% Current Ratio17.0%13.4%12.4% Minimum Well Capitalized Ratio10.0%8.0%6.5% Amount of Capital$1,246$983$909 2018 Q42019 Q42020 Q12020 Q22020 Q32020 Q4 Well Capitalized Minimum$731$585$475 Excess Amount over Well-Capitalized$515$398$434 Tier 1 CapitalLeverage RatioMin Ratio Non-GAAP calculation, see Appendix 4Q20 Capital Ratios are preliminary estimates |
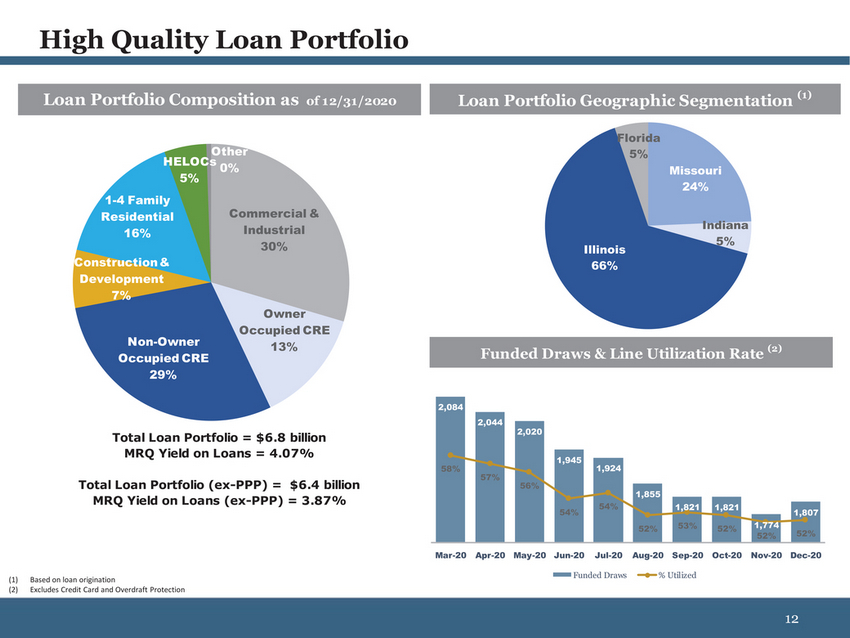 | Loan Portfolio Composition as of 12/31/2020 Loan Portfolio Geographic Segmentation (1) Other HELOCs 0% 5% Florida 5% Missouri 24% 1-4 Family Residential 16% Construction & Development 7% Non-Owner Commercial & Industrial 30% Owner Occupied CRE 13% Illinois 66% Indiana 5% Occupied CRE 29% Funded Draws & Line Utilization Rate (2) Total Loan Portfolio = $6.8 billion MRQ Yield on Loans = 4.07% Total Loan Portfolio (ex-PPP) = $6.4 billion MRQ Yield on Loans (ex-PPP) = 3.87% 2,084 58% 2,044 57% 2,020 56% 1,945 1,924 1,855 54% 54% 1,8211,821 52%53%52% 1,774 1,807 52%52% Based on loan origination Excludes Credit Card and Overdraft Protection Mar-20 Apr-20 May-20 Jun-20 Jul-20 Aug-20 Sep-20 Oct-20 Nov-20 Dec-20 Funded Draws% Utilized |
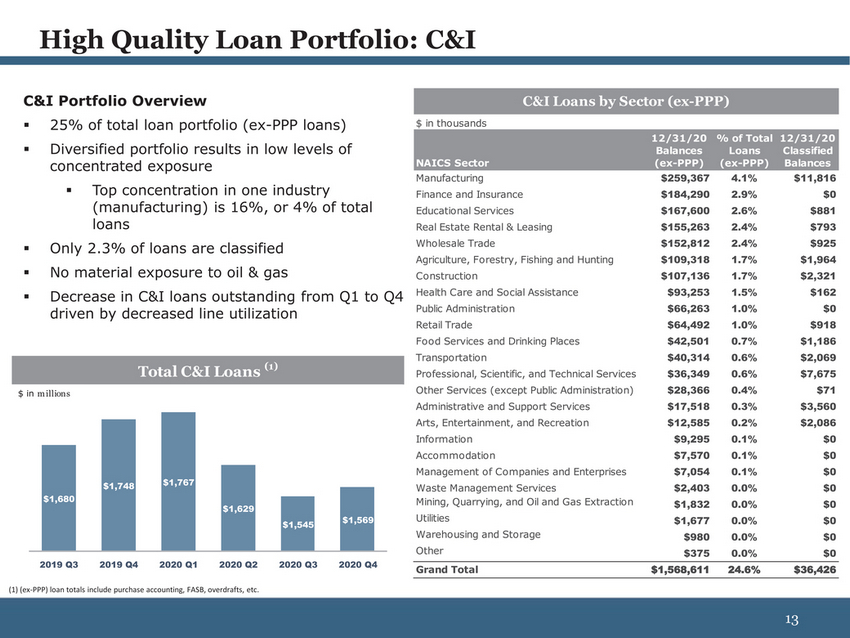 | C&I Portfolio Overview 25% of total loan portfolio (ex-PPP loans) C&I Loans by Sector (ex-PPP) $ in thousands Diversified portfolio results in low levels of concentrated exposure NAICS Sector 12/31/20 Balances (ex-PPP) % of Total Loans (ex-PPP) 12/31/20 Classified Balances Manufacturing$259,3674.1%$11,816 (manufacturing) is 16%, or 4% of total loans Only 2.3% of loans are classified No material exposure to oil & gas Decrease in C&I loans outstanding from Q1 to Q4 driven by decreased line utilization Total C&I Loans (1) $ in m illions $1,748$1,767 $1,680 $1,629 Educational Services $167,600 2.6% $881 Real Estate Rental & Leasing $155,263 2.4% $793 Wholesale Trade $152,812 2.4% $925 Agriculture, Forestry, Fishing and Hunting $109,318 1.7% $1,964 Construction $107,136 1.7% $2,321 Health Care and Social Assistance $93,253 1.5% $162 Public Administration $66,263 1.0% $0 Retail Trade $64,492 1.0% $918 Food Services and Drinking Places $42,501 0.7% $1,186 Transportation $40,314 0.6% $2,069 Professional, Scientific, and Technical Services $36,349 0.6% $7,675 Other Services (except Public Administration) $28,366 0.4% $71 Administrative and Support Services $17,518 0.3% $3,560 Arts, Entertainment, and Recreation $12,585 0.2% $2,086 Information $9,295 0.1% $0 Accommodation $7,570 0.1% $0 Management of Companies and Enterprises $7,054 0.1% $0 Waste Management Services $2,403 0.0% $0 Mining, Quarrying, and Oil and Gas Extraction $1,832 0.0% $0 $1,545$1,569 2019 Q32019 Q42020 Q12020 Q22020 Q32020 Q4 Utilities$1,6770.0%$0 Warehousing and Storage$9800.0%$0 Other$3750.0%$0 Grand Total$1,568,61124.6%$36,426 (ex-PPP) loan totals include purchase accounting, FASB, overdrafts, etc. |
##soft-
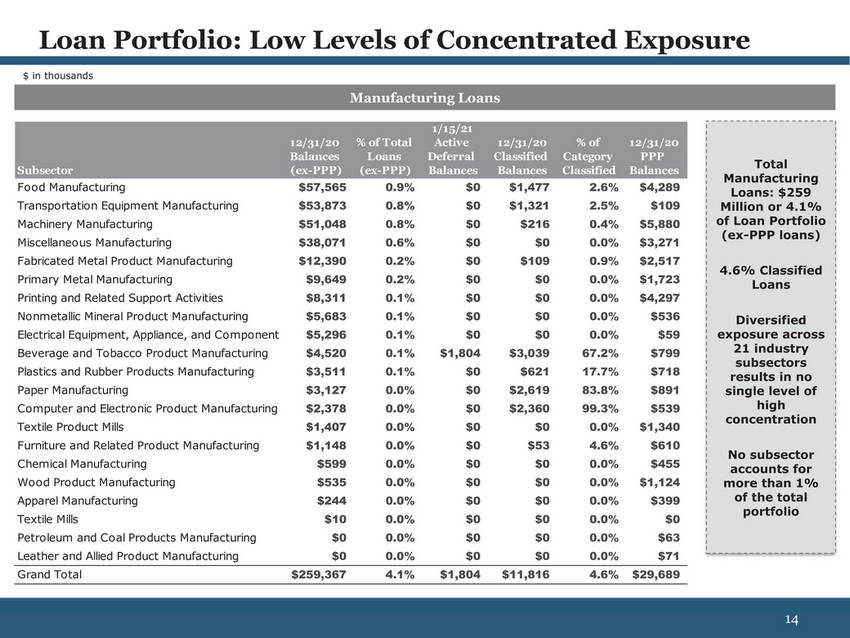 | Loan Portfolio: Low Levels of Concentrated Exposure $ in thousands Manufacturing Loans 1/15/21 12/31/20 % of Total Active 12/31/20 % of 12/31/20 Balances Loans Deferral Classified Category PPP Subsector(ex-PPP) (ex-PPP) Balances Balances Classified Balances Food Manufacturing $57,565 0.9% $0 $1,477 2.6% $4,289 Transportation Equipment Manufacturing $53,873 0.8% $0 $1,321 2.5% $109 Machinery Manufacturing $51,048 0.8% $0 $216 0.4% $5,880 Miscellaneous Manufacturing $38,071 0.6% $0 $0 0.0% $3,271 Fabricated Metal Product Manufacturing $12,390 0.2% $0 $109 0.9% $2,517 Primary Metal Manufacturing $9,649 0.2% $0 $0 0.0% $1,723 Printing and Related Support Activities $8,311 0.1% $0 $0 0.0% $4,297 Nonmetallic Mineral Product Manufacturing $5,683 0.1% $0 $0 0.0% $536 Electrical Equipment, Appliance, and Component $5,296 0.1% $0 $0 0.0% $59 Beverage and Tobacco Product Manufacturing $4,520 0.1% Plastics and Rubber Products Manufacturing $3,511 0.1% Paper Manufacturing $3,127 0.0% Computer and Electronic Product Manufacturing $2,378 0.0% Textile Product Mills $1,407 0.0% Furniture and Related Product Manufacturing $1,148 0.0% Chemical Manufacturing $599 0.0% Wood Product Manufacturing $535 0.0% Apparel Manufacturing $244 0.0% Textile Mills $10 0.0% Petroleum and Coal Products Manufacturing $0 0.0% Leather and Allied Product Manufacturing $0 0.0% Grand Total $259,367 4.1% $1,804 $3,039 67.2% $799 $0 $621 17.7% $718 $0 $2,619 83.8% $891 $0 $2,360 99.3% $539 $0 $0 0.0% $1,340 $0 $53 4.6% $610 $0 $0 0.0% $455 $0 $0 0.0% $1,124 $0 $0 0.0% $399 $0 $0 0.0% $0 $0 $0 0.0% $63 $0 $0 0.0% $71 $1,804 $11,816 4.6% $29,689 4.6% Classified Loans Diversified exposure across 21 industry subsectors results in no single level of high concentration No subsector accounts for more than 1% of the total portfolio |
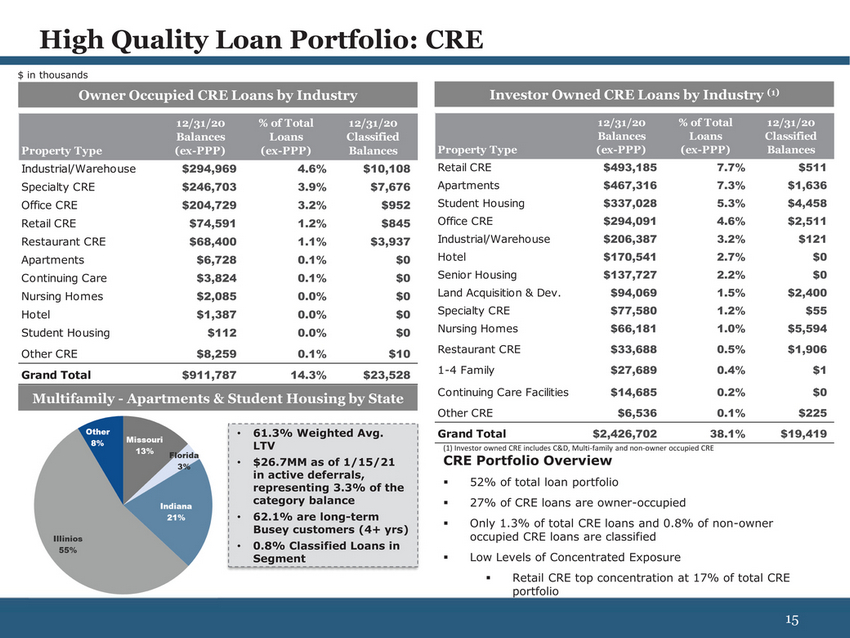 | High Quality Loan Portfolio: CRE $ in thousands Owner Occupied CRE Loans by Industry Investor Owned CRE Loans by Industry (1) Multifamily - Apartments & Student Housing by State 61.3% Weighted Avg. LTV •$26.7MM as of 1/15/21 in active deferrals, representing 3.3% of the category balance 62.1% are long-term Busey customers (4+ yrs) 0.8% Classified Loans in Segment Continuing Care Facilities$14,6850.2%$0 Other CRE$6,5360.1%$225 Grand Total$2,426,70238.1%$19,419 Investor owned CRE includes C&D, Multi-family and non-owner occupied CRE CRE Portfolio Overview 52% of total loan portfolio 27% of CRE loans are owner-occupied Only 1.3% of total CRE loans and 0.8% of non-owner occupied CRE loans are classified Low Levels of Concentrated Exposure Retail CRE top concentration at 17% of total CRE portfolio 15 |
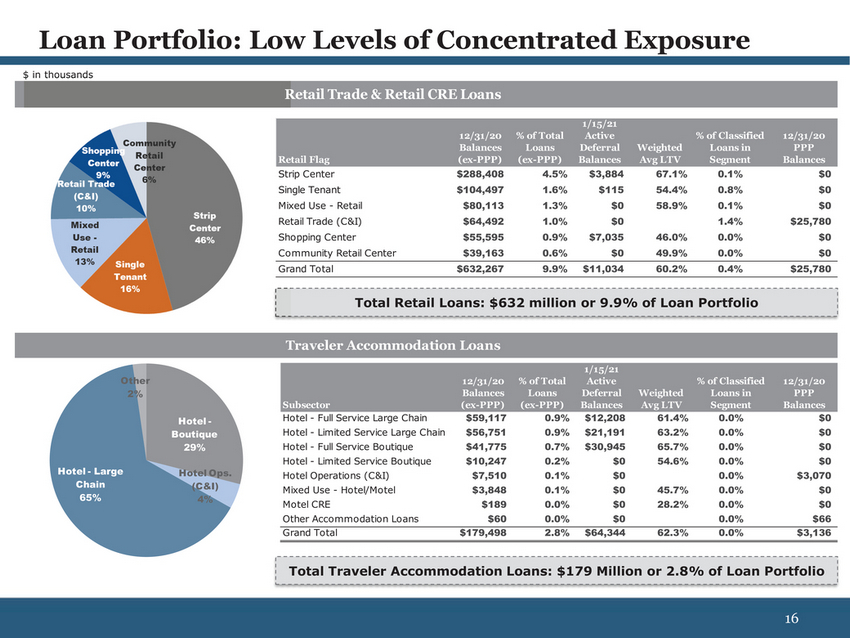 | $ in thousands Retail Trade & Retail CRE Loans Total Retail Loans: $632 million or 9.9% of Loan Portfolio Traveler Accommodation Loans Other 2% 12/31/20 Balances % of Total Loans 1/15/21 Active Deferral Weighted % of Classified Loans in 12/31/20 PPP Subsector (ex-PPP) (ex-PPP) Balances Avg LTV Segment Balances Hotel -Hotel - Full Service Large Chain $59,117 0.9% $12,208 61.4% 0.0% $0 BoutiqueHotel - Limited Service Large Chain $56,751 0.9% $21,191 63.2% 0.0% $0 29%Hotel - Full Service Boutique $41,775 0.7% $30,945 65.7% 0.0% $0 Hotel - Limited Service Boutique $10,247 0.2% $0 54.6% 0.0% $0 eHotel Ops.Hotel Operations (C&I)$7,5100.1%$00.0%$3,070 (C&I)Mixed Use - Hotel/Motel $3,848 0.1% $0 45.7% 0.0% $0 4%Motel CRE $189 0.0% $0 28.2% 0.0% $0 Other Accommodation Loans $60 0.0% $0 0.0% $66 Grand Total $179,498 2.8% $64,344 62.3% 0.0% $3,136 Total Traveler Accommodation Loans: $179 Million or 2.8% of Loan Portfolio 16 |
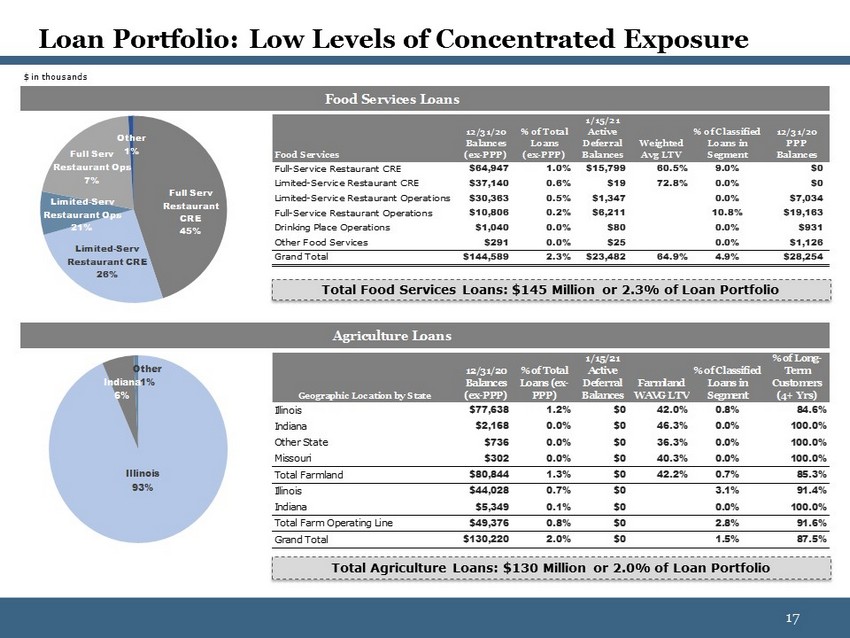 | $ in thousands Food Services 12/31/20 Balances (ex-PPP) % of Total Loans (ex-PPP) 1/15/21 Active Deferral Balances Weighted Avg LTV % of Classified Loans in Segment 12/31/20 PPP Balances Full-Service Restaurant CRE $64,947 1.0% $15,799 60.5% 9.0% $0 Limited-Service Restaurant CRE $37,140 0.6% $19 72.8% 0.0% $0 Limited-Service Restaurant Operations $30,363 0.5% $1,347 0.0% $7,034 Full-Service Restaurant Operations $10,806 0.2% $6,211 10.8% $19,163 Drinking Place Operations $1,040 0.0% $80 0.0% $931 Other Food Services $291 0.0% $25 0.0% $1,126 Full Serv Other 1% Restaurant Ops 7% Limited-Serv Restaurant Ops 21% Limited-Serv Restaurant CRE 26% Full Serv Restaurant CRE 45% Grand Total$144,5892.3% $23,48264.9%4.9%$28,254 Total Food Services Loans: $145 Million or 2.3% of Loan Portfolio Agriculture Loans Geographic Location by State QE Balances (ex-PPP) % of Total Loans (ex-PPP) Active Deferral Balances Farmland WAVG LTV % of Classified Loans in Segment % of Long-Term Customers (4+ Yrs) Illinois $77,638 1.2% $0 42.0% 0.8% 84.6% Indiana $2,168 0.0% $0 46.3% 0.0% 100.0% Other State $736 0.0% $0 36.3% 0.0% 100.0% Missouri $302 0.0% $0 40.3% 0.0% 100.0% Total Farmland $80,844 1.3% $0 42.2% 0.7% 85.3% Illinois $44,028 0.7% $0 3.1% 91.4% Indiana $5,349 0.1% $0 0.0% 100.0% Total Farm Operating Line $49,376 0.8% $0 2.8% 91.6% Grand Total $130,220 2.0% $0 1.5% 87.5% Indiana1% 6% Illinois 93% Total Agriculture Loans: $130 Million or 2.0% of Loan Portfolio |
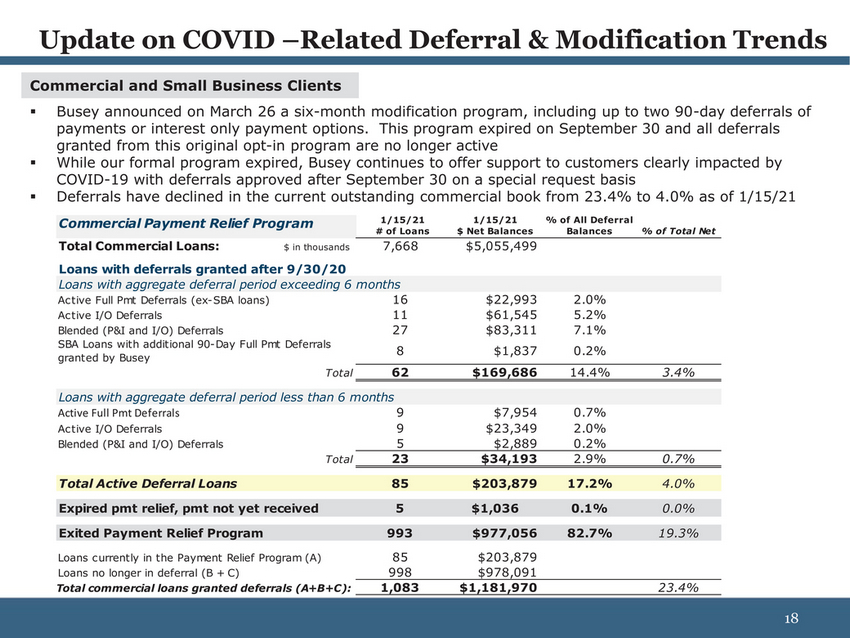 | Commercial and Small Business Clients Busey announced on March 26 a six-month modification program, including up to two 90-day deferrals of payments or interest only payment options. This program expired on September 30 and all deferrals granted from this original opt-in program are no longer active While our formal program expired, Busey continues to offer support to customers clearly impacted by COVID-19 with deferrals approved after September 30 on a special request basis Deferrals have declined in the current outstanding commercial book from 23.4% to 4.0% as of 1/15/21 Commercial Payment Relief Program1/15/21 # of Loans 1/15/21 $ Net Balances % of All Deferral Balances% of Total Net Total Commercial Loans:$ in thousands7,668$5,055,499 Loans with deferrals granted after 9/30/20 Loans with aggregate deferral period exceeding 6 months Blended (P&I and I/O) Deferrals5$2,8890.2% Total23$34,1932.9%0.7% Loans no longer in deferral (B + C)998$978,091 Total commercial loans granted deferrals (A+B+C):1,083$1,181,97023.4% |
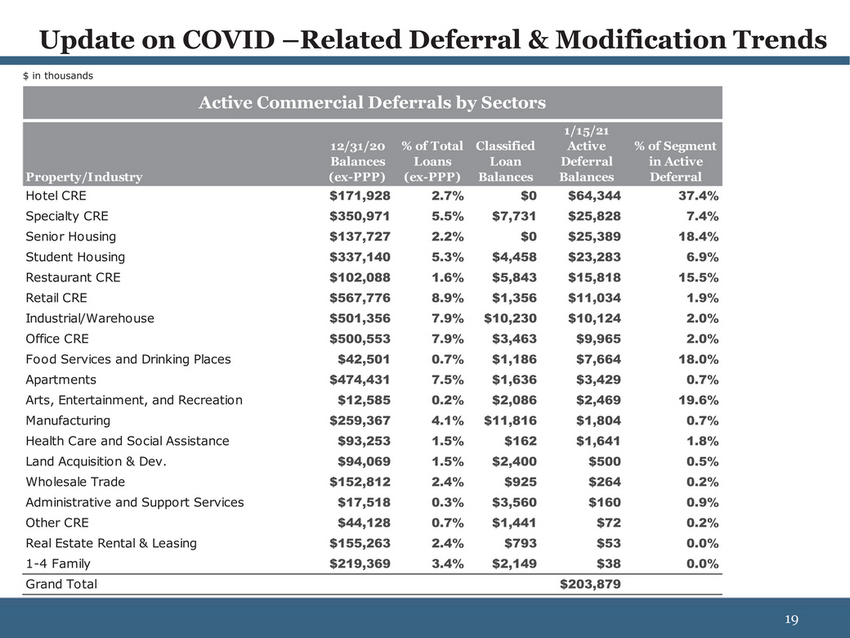 | $ in thousands Active Commercial Deferrals by Sectors |
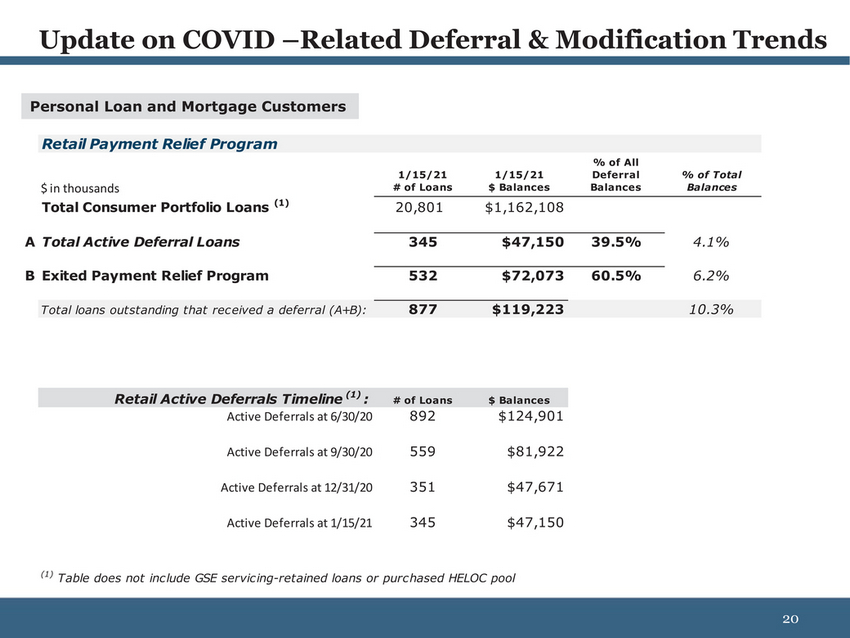 | Personal Loan and Mortgage Customers Retail Payment Relief Program 1/15/21 1/15/21 % of All Deferral % of Total $ in thousands # of Loans $ Balances Balances Balances Table does not inc lude GSE servic ing-retained loans or purc hased HELOC pool |
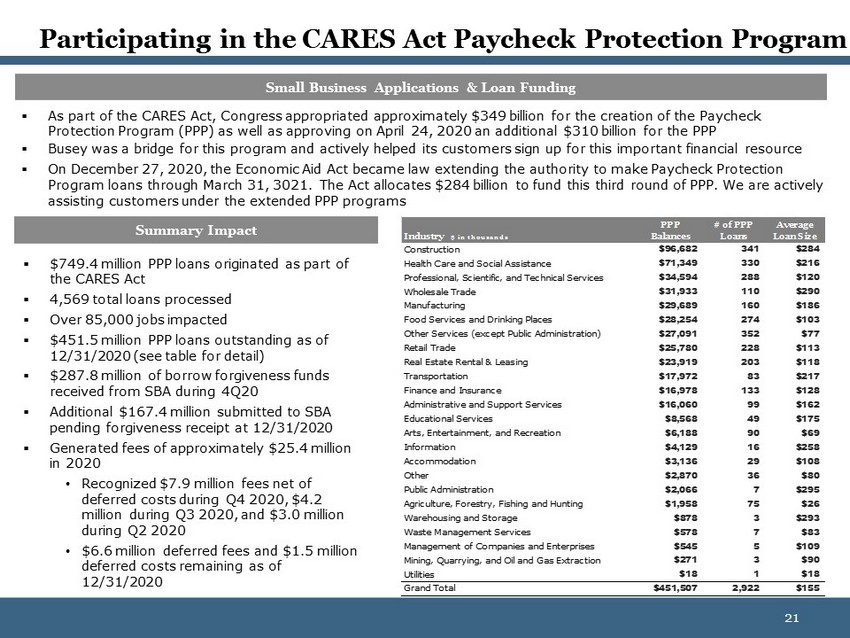 | Small Business Applications & Loan Funding As part of the CARES Act, Congress appropriated approximately $349 billion for the creation of the Paycheck Protection Program (PPP) as well as approving on April 24, 2020 an additional $310 billion for the PPP Busey was a bridge for this program and actively helped its customers sign up for this important financial resource On December 27, 2020, the Economic Aid Act became law extending the authority to make Paycheck Protection Program loans through March 31, 3021. The Act allocates $284 billion to fund this third round of PPP. We are actively assisting customers under the extended PPP programs Summary Impact Industry $ i n t h ou sa n ds PPP Balances # of PPP Loans Average Loan Size $749.4 million PPP loans originated as part of the CARES Act 4,569 total loans processed Over 85,000 jobs impacted $451.5 million PPP loans outstanding as of 12/31/2020 $287.8 million of borrow forgiveness funds received from SBA during 4Q20 Additional $167.4 million submitted to SBA pending forgiveness receipt at 12/31/2020 Generated fees of approximately $25.4 million in 2020 Recognized $7.9 million fees net of deferred costs during Q4 2020, $4.2 million during Q3 2020, and $3.0 million during Q2 2020 $6.6 million deferred fees and $1.5 million deferred costs remaining as of 12/31/2020 Construction $96,682 341 $284 Health Care and Social Assistance $71,349 330 $216 Professional, Scientific, and Technical Services $34,594 288 $120 Wholesale Trade $31,933 110 $290 Manufacturing $29,689 160 $186 Food Services and Drinking Places $28,254 274 $103 Other Services (except Public Administration) $27,091 352 $77 Retail Trade $25,780 228 $113 Real Estate Rental & Leasing $23,919 203 $118 Transportation $17,972 83 $217 Finance and Insurance $16,978 133 $128 Administrative and Support Services $16,060 99 $162 Educational Services $8,568 49 $175 Arts, Entertainment, and Recreation $6,188 90 $69 Information $4,129 16 $258 Accommodation $3,136 29 $108 Other $2,870 36 $80 Public Administration $2,066 7 $295 Agriculture, Forestry, Fishing and Hunting $1,958 75 $26 Warehousing and Storage $878 3 $293 Waste Management Services $578 7 $83 Management of Companies and Enterprises $545 5 $109 Mining, Quarrying, and Oil and Gas Extraction $271 3 $90 |
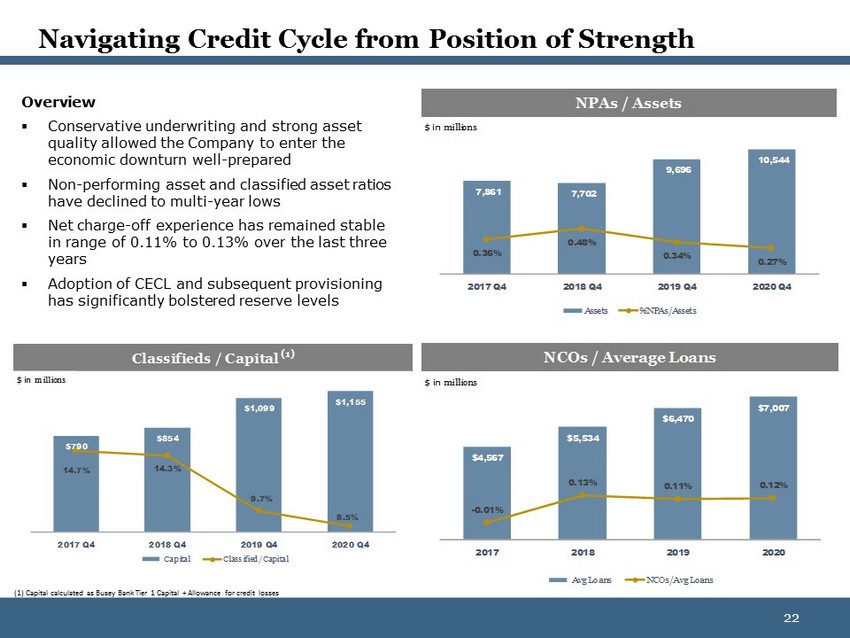 | Overview Conservative underwriting and strong asset quality allowed the Company to enter the economic downturn well-prepared Non-performing asset and classified asset ratios NPAs / Assets $ in m illions 10,544 9,696 have declined to multi-year lows Net charge-off experience has remained stable in range of 0.11% to 0.13% over the last three years 7,8617,702 0.48% 0.36% 0.34% 0.27% Adoption of CECL and subsequent provisioning has significantly bolstered reserve levels 2017 Q42018 Q42019 Q42020 Q4 Assets%NPAs/Assets $ in m illions Classifieds / Capital (1) $ in m illions NCOs / Average Loans $1,099 $1,155 $6,470 $7,007 $790 $854 $4,567 $5,534 14.7%14.3% 9.7% 8.5% -0.01% 0.13%0.11%0.12% 2017 Q42018 Q42019 Q42020 Q4 CapitalClassified/Capital 2017201820192020 (1) Capital calculated as Busey Bank Tier 1 Capital + Allowance for credit losses Avg LoansNCOs/Avg Loans 22 |
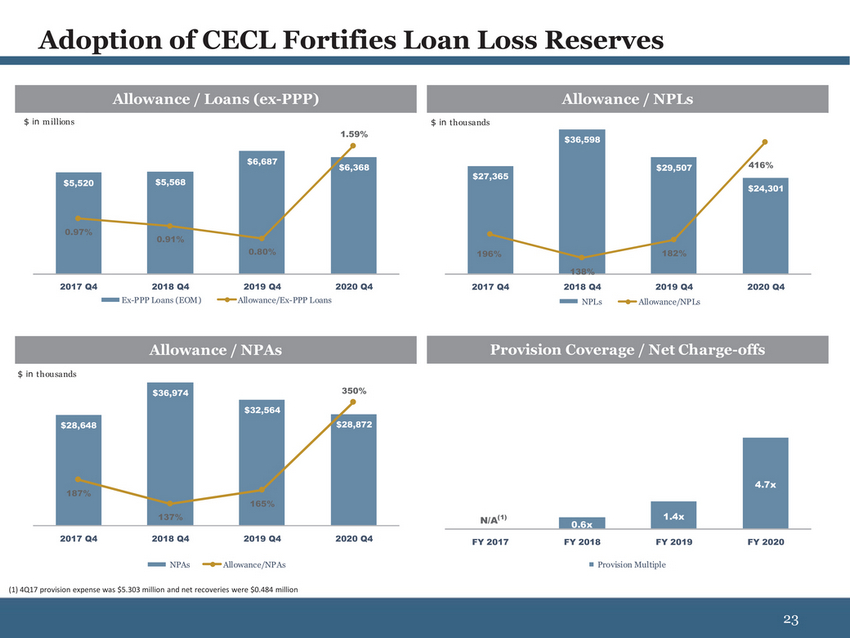 | Allowance / Loans (ex-PPP) Allowance / NPLs $ in m illions $5,520$5,568 1.59% $6,687 $6,368 $ in thou sands $27,365 $36,598 $29,507 416% $24,301 0.97% 0.91% 0.80% 196% 182% 2017 Q42018 Q42019 Q42020 Q4 Ex-PPP Loans (EOM)Allowance/Ex-PPP Loans 138% 2017 Q42018 Q42019 Q42020 Q4 NPLsAllowance/NPLs Allowance / NPAs Provision Coverage / Net Charge-offs $ in thou sands $36,974 350% $28,648 $32,564 $28,872 187% 137% 165% N/A(1) 0.6x 1.4x 4.7x 2017 Q42018 Q42019 Q42020 Q4 FY 2017FY 2018FY 2019FY 2020 NPAsAllowance/NPAs Provision Multiple |
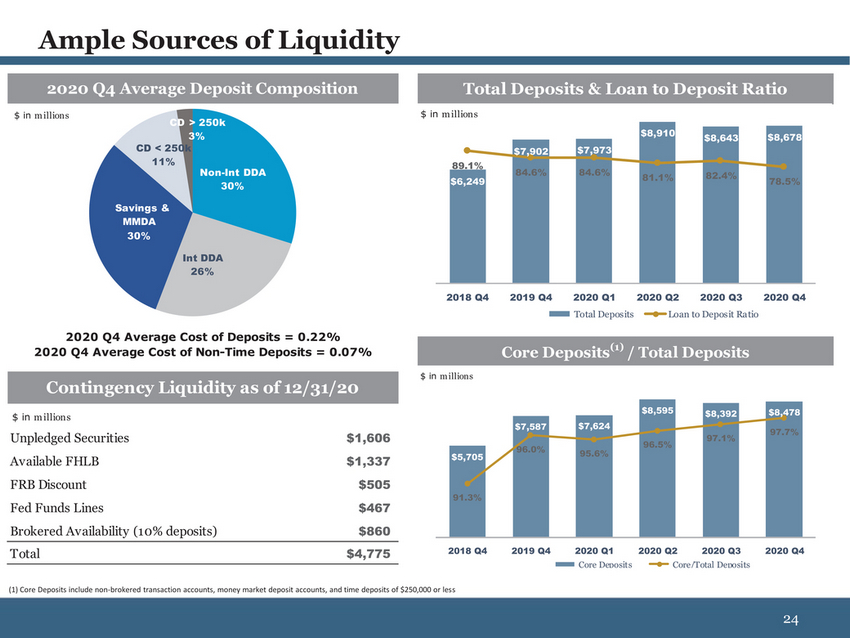 | 2020 Q4 Average Deposit Composition Total Deposits & Loan to Deposit Ratio $ in m illions CD > 250k 3% CD < 250k 11% $ in m illions 89.1% $7,902$7,973 $8,910$8,643$8,678 Non-Int DDA 30% $6,249 84.6%84.6%81.1%82.4% 78.5% Savings & MMDA 30% Int DDA 26% 2018 Q42019 Q42020 Q12020 Q22020 Q32020 Q4 Total DepositsLoan to Deposit Ratio 2020 Q4 Average Cost of Deposits = 0.22% 2020 Q4 Average Cost of Non-Time Deposits = 0.07% Core Deposits(1) / Total Deposits Contingency Liquidity as of 12/31/20 $ in m illions $ in m illions $5,705 $7,587$7,624 95.6% $8,595$8,392$8,478 97.7% 97.1% 96.5% Unpledged Securities $1,606 Available FHLB $1,337 FRB Discount $505 Fed Funds Lines $467 Brokered Availability (10% deposits) $860 Total $4,775 2018 Q42019 Q42020 Q12020 Q22020 Q32020 Q4 Core DepositsCore/Total Deposits |
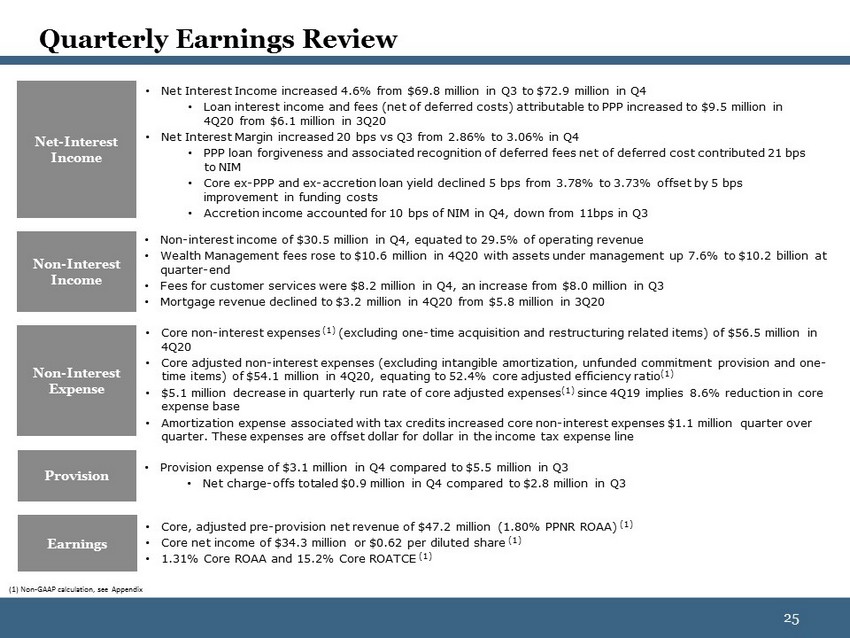 | Net-Interest Income Net Interest Income increased 4.6% from $69.8 million in Q3 to $72.9 million in Q4 Loan interest income and fees (net of deferred costs) attributable to PPP increased to $9.5 million in 4Q20 from $6.1 million in 3Q20 Net Interest Margin increased 20 bps vs Q3 from 2.86% to 3.06% in Q4 PPP loan forgiveness and associated recognition of deferred fees net of deferred cost contributed 21 bps to NIM Core ex-PPP and ex-accretion loan yield declined 5 bps from 3.78% to 3.73% offset by 5 bps improvement in funding costs Accretion income accounted for 10 bps of NIM in Q4, down from 11bps in Q3 Non-Interest Income Non-Interest Expense Earnings Non-interest income of $30.5 million in Q4, equated to 29% of operating revenue Wealth Management fees rose to $10.6 million in 4Q20 with assets under management up 7.6% to $10.2 billion at quarter-end Fees for customer services were $8.2 million in Q4, an increase from $8.0 million in Q3 Mortgage revenue declined to $3.2 million in 4Q20 from $5.8 million in 3Q20 Core non-interest expenses (1) (excluding one-time acquisition and restructuring related items) of $56.5 million in 4Q20 Core adjusted non-interest expenses (excluding intangible amortization, unfunded commitment provision and one-time items) of $54.1 million in 4Q20, equating to 52.4% core adjusted efficiency ratio(1) $5.1 million decrease in quarterly run rate of core adjusted expenses(1) since 4Q19 implies 8.6% reduction in core expense base Amortization expense associated with tax credits increased core non-interest expenses $1.1 million quarter over quarter. These expenses are offset dollar for dollar in the income tax expense line Core, adjusted pre-provision net revenue of $47.2 million (1.80% PPNR ROAA) (1) Core net income of $34.3 million or $0.62 per diluted share (1) 1.31% Core ROAA and 15.2% Core ROATCE (1) Provision Provision expense of $3.1 million in Q4 compared to $5.5 million in Q3 Net charge-offs totaled $0.9 million in Q4 compared to $2.8 million in Q3 |
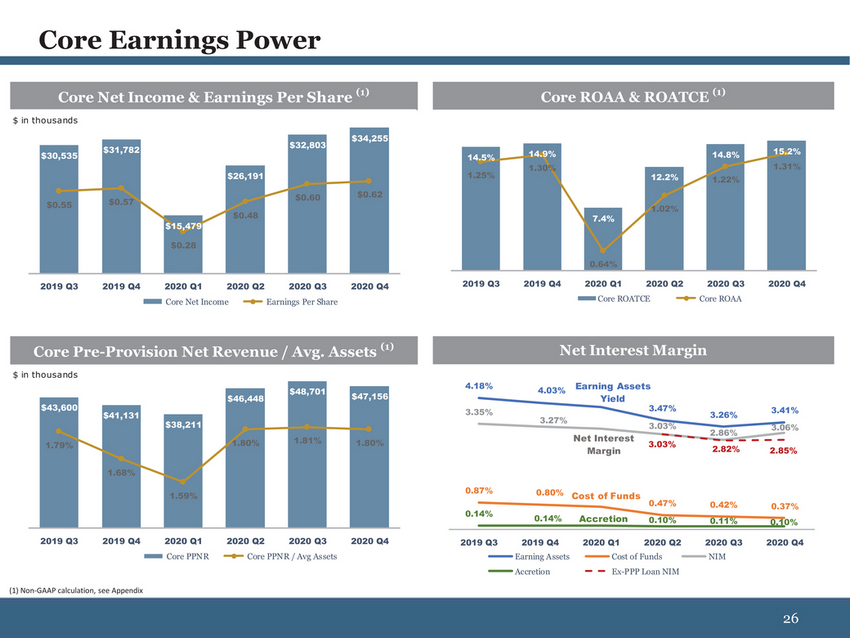 | Core Net Income & Earnings Per Share (1) Core ROAA & ROATCE (1) $ in thousands $31,782 $30,535 $26,191 $32,803 $34,255 14.5%14.9% 1.30% 1.25% 12.2% 14.8%15.2% 1.31% 1.22% $0.55$0.57 $15,479 $0.48 $0.60$0.62 7.4% 1.02% $0.28 0.64% 2019 Q32019 Q42020 Q12020 Q22020 Q32020 Q4 Core Net IncomeEarnings Per Share 2019 Q32019 Q42020 Q12020 Q22020 Q32020 Q4 Core ROATCECore ROAA Core Pre-Provision Net Revenue / Avg. Assets (1) Net Interest Margin $ in thousands $43,600 $41,131 $46,448 $48,701$47,156 4.18%4.03% 3.35% Earning Assets Yield 3.47% 3.26%3.41% $38,211 3.27% 3.03% 2.86%3.06% 1.79% 1.80%1.81%1.80% Net Interest Margin 3.03% 2.82%2.85% 1.68% 1.59% 0.87%0.80% 0.14%0.14% Cost of Funds Accretion 0.47%0.42%0.37% 0.11% 0.10% 2019 Q32019 Q42020 Q12020 Q22020 Q32020 Q4 Core PPNRCore PPNR / Avg Assets 2019 Q32019 Q42020 Q12020 Q22020 Q32020 Q4 Earning AssetsCost of FundsNIM Accretion Ex-PPP Loan NIM |
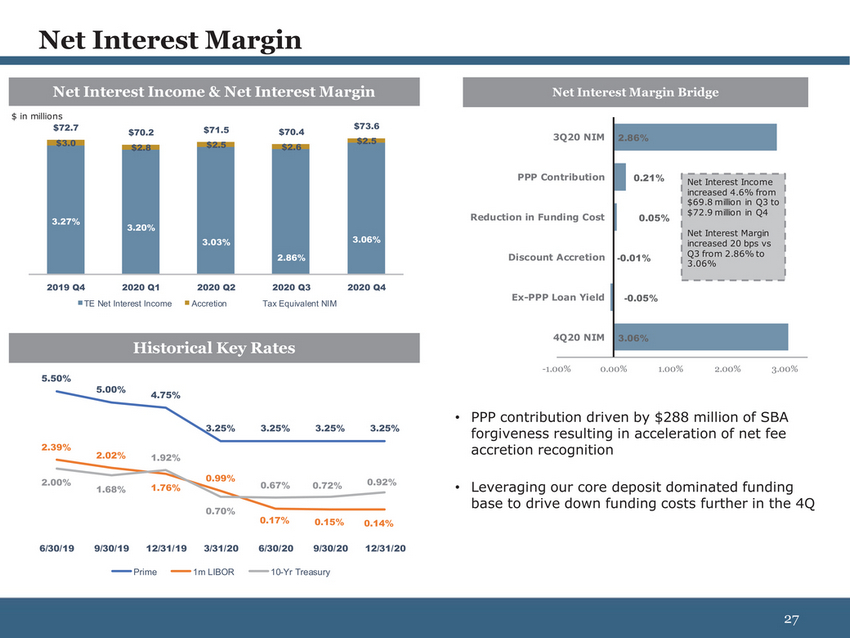 | Net Interest Income & Net Interest Margin Net Interest Margin Bridge $ in millions $72.7$70.2$71.5$70.4$73.6 $3.0$2.8$2.5$2.6$2.5 3Q20 NIM 2.86% 3.27% 3.20% 3.03% 2.86% 3.06% PPP Contribution Reduction in Funding Cost Discount Accretion 0.21% 0.05% -0.01% Net Interest Income increased 4.6% from $69.8 million in Q3 to $72.9 million in Q4 Net Interest Margin increased 20 bps vs Q3 from 2.86% to 3.06% 2019 Q42020 Q12020 Q22020 Q32020 Q4 TE Net Interest IncomeAccretionTax Equivalent NIM Ex-PPP Loan Yield -0.05% Historical Key Rates 4Q20 NIM 3.06% 5.50% 4.75% 3.25%3.25%3.25%3.25% -1.00%0.00%1.00%2.00%3.00% PPP contribution driven by $288 million of SBA forgiveness resulting in acceleration of net fee 2.39% 2.02% 1.92% accretion recognition 2.00% 1.68% 1.76% 0.99% 0.70% 0.67%0.72%0.92% 0.17%0.15%0.14% Leveraging our core deposit dominated funding base to drive down funding costs further in the 4Q 6/30/199/30/1912/31/193/31/206/30/209/30/2012/31/20 Prime1m LIBOR10-Yr Treasury |
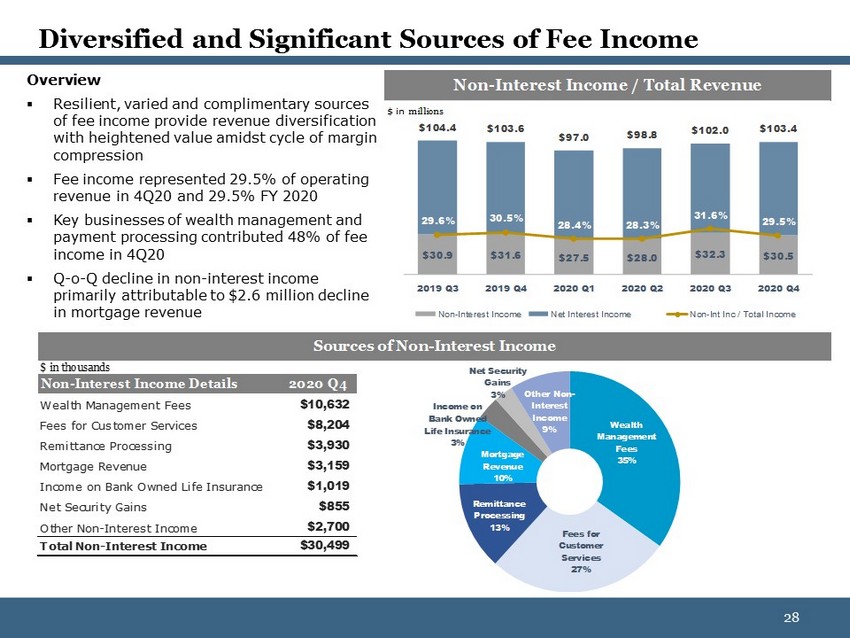 | Diversified and Significant Sources of Fee Income Overview Resilient, varied and complimentary sources of fee income provide revenue diversification with heightened value amidst cycle of margin compression Fee income represented 29% of operating revenue in 4Q20 and 29% FY 2020 Key businesses of wealth management and payment processing contributed 48% of fee income in 4Q20 Q-o-Q decline in non-interest income primarily attributable to $2.6 million decline in mortgage revenue Non-Interest Income / Total Revenue $ in m illions $102.0 $97.0$98.8 30%31%28%28%32%29% $30.9$31.6$27.5$28.0$32.3$30.5 2019 Q32019 Q42020 Q12020 Q22020 Q32020 Q4 Non-Interest IncomeNet Interest IncomeNon-Int Inc / Total Income Sources of Non-Interest Income $ in thousands Non-Interest Income Details 2020 Q4 Net Security Gains 3%Other Non-Wealth Management Fees$10,632 Fees for Customer Services$8,204 Remittance Processing$3,930 Mortgage Revenue$3,159 Income on Bank Owned Life Insurance$1,019 Net Security Gains$855 Other Non-Interest Income$2,700 Income on Bank Owned Life Insurance 3% Mortgage Revenue 10% Remittance Processing 13% Interest Income 9% Wealth Management Fees 35% Total Non-Interest Income$30,499 Fees for Customer Services 27% 28 |
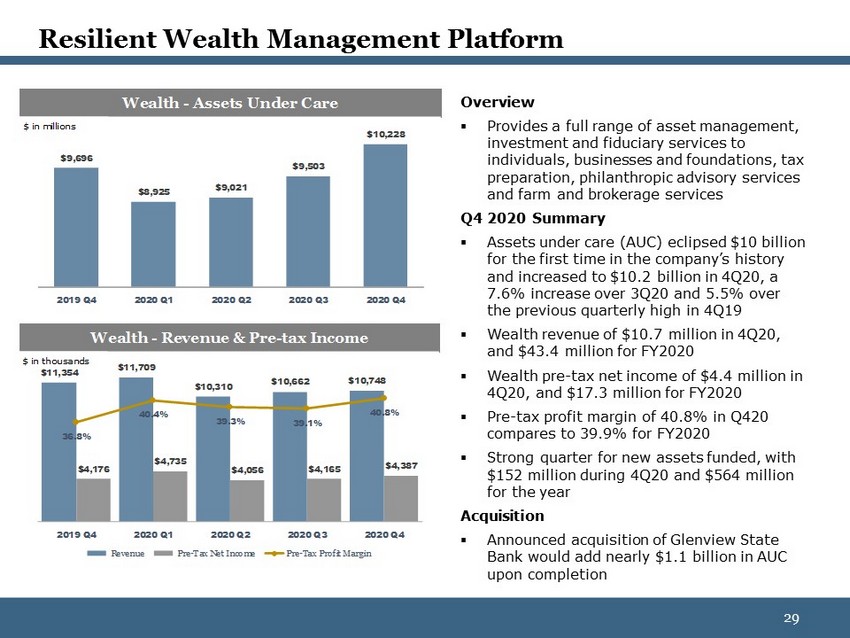 | Resilient Wealth Management Platform $ in millions $9,696 Wealth - Assets Under Care $9,503 $8,925$9,021 $10,228 Overview Provides a full range of asset management, investment and fiduciary services to individuals, businesses and foundations, tax preparation, philanthropic advisory services and farm and brokerage services Q4 2020 Summary Assets under care (ACU)eclipsed $10 billion for the first time in the company’s history and increased to $10.2 billion in 4Q20, a 7.6% increase over 3Q20 and 5.5% over 2019 Q42020 Q12020 Q22020 Q32020 Q4 Wealth - Revenue & Pre-tax Income $ in thousands the previous quarterly high in 4Q19 Wealth revenue of $10.7 million in 4Q20, and $43.4 million for FY2020 $11,354 $11,709 $10,310 $10,662$10,748 40.8% Wealth pre-tax net income of $4.4 million in 4Q20, and $17.3 million for FY2020 36.8% $4,176 40.4% 39.3%39.1% $4,735 $4,056$4,165$4,387 Pre-tax profit margin of 40.8% in Q420 compares to 39.9% for FY2020 Strong quarter for new assets funded, with $152 million during 4Q20 and $564 million for the year Acquisition 2019 Q42020 Q12020 Q22020 Q32020 Q4 RevenuePre-Tax Net IncomePre-Tax Profit Margin Announced acquisition of Glenview State Bank would add nearly $1.1 billion in AUC upon completion 29 |
##soft-pag
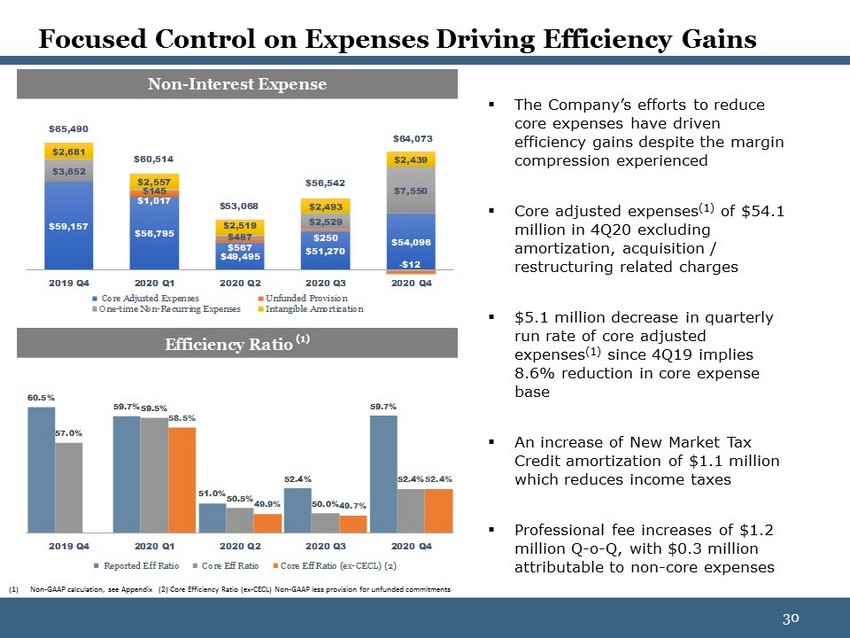 | Non-Interest Expense $65,490 $2,681 $3,652 $59,157 $60,514 $2,557 $145 $1,017 $56,795 $53,068 $2,519 $487 $567 $49,495 $56,542 $2,493 $2,529 $250 $51,270 $64,073 $2,439 $7,550 $54,096 -$12 The Company’s efforts to reduce core expenses have driven efficiency gains despite the margin compression experienced Core adjusted expenses(1) of $54.1 million in 4Q20 excluding amortization, acquisition / 2019 Q42020 Q12020 Q22020 Q32020 Q4 Core Adjusted ExpensesUnfunded Provision One-time Non-Recurring ExpensesIntangible Amortization Efficiency Ratio (1) 60.5% restructuring related charges $5.1 million decrease in quarterly run rate of core adjusted expenses(1) since 4Q19 implies 8.6% reduction in core expense base 57.0% 59.7%59.5% 58.5% 51.0%50.5% 49.9% 52.4% 50.0%49.7% 59.7% 52.4%52.4% An increase of New Market Tax Credit amortization of $1.1 million which reduces income taxes 2019 Q42020 Q12020 Q22020 Q32020 Q4 Reported Eff RatioCore Eff RatioCore Eff Ratio (ex-CECL) (2) Professional fee increases of $1.2 million Q-o-Q Non-GAAP calculation, see Appendix (2) Core Efficiency Ratio (ex-CECL) Non-GAAP less provision for unfunded commitments 30 |
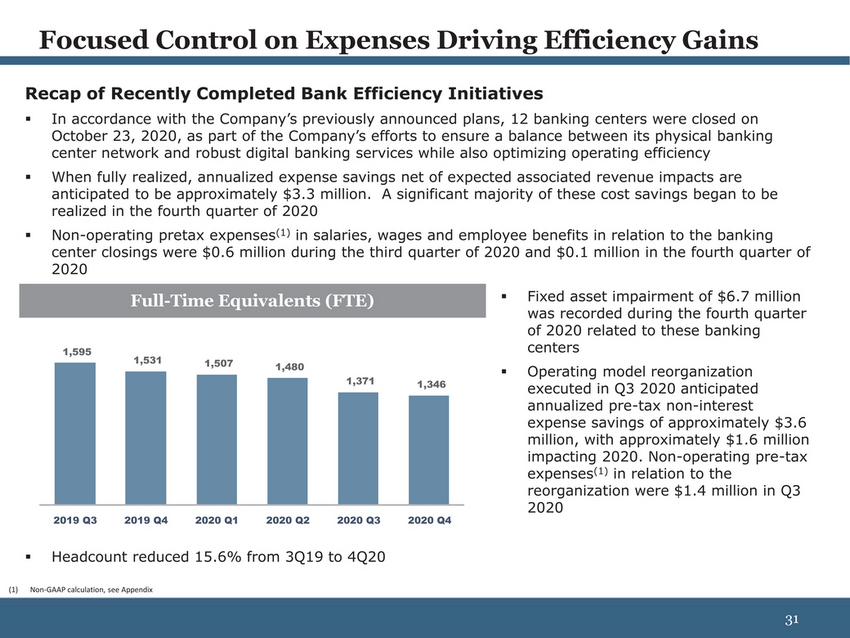 | Recap of Recently Completed Bank Efficiency Initiatives In accordance with the Company’s previously announced plans, 12 banking centers were closed on October 23, 2020, as part of the Company’s efforts to ensure a balance between its physical banking center network and robust digital banking services while also optimizing operating efficiency When fully realized, annualized expense savings net of expected associated revenue impacts are anticipated to be approximately $3.3 million. A significant majority of these cost savings began to be realized in the fourth quarter of 2020 Non-operating pretax expenses(1) in salaries, wages and employee benefits in relation to the banking center closings were $0.6 million during the third quarter of 2020 and $0.1 million in the fourth quarter of 2020 1,595 Full-Time Equivalents (FTE) 1,5311,5071,480 1,3711,346 Fixed asset impairment of $6.7 million was recorded during the fourth quarter of 2020 related to these banking centers Operating model reorganization executed in Q3 2020 anticipated annualized pre-tax non-interest expense savings of approximately $3.6 million, with approximately $1.6 million impacting 2020. Non-operating pre-tax expenses(1) in relation to the reorganization were $1.4 million in Q3 2020 2019 Q32019 Q42020 Q12020 Q22020 Q32020 Q4 Headcount reduced 15.6% from 3Q19 to 4Q20 Non-GAAP calculation, see Appendix 31 |
 | 32 APPENDIX 32 |
 | [LOGO] |
 | ($ in thousands) Thre e Months Ende d |
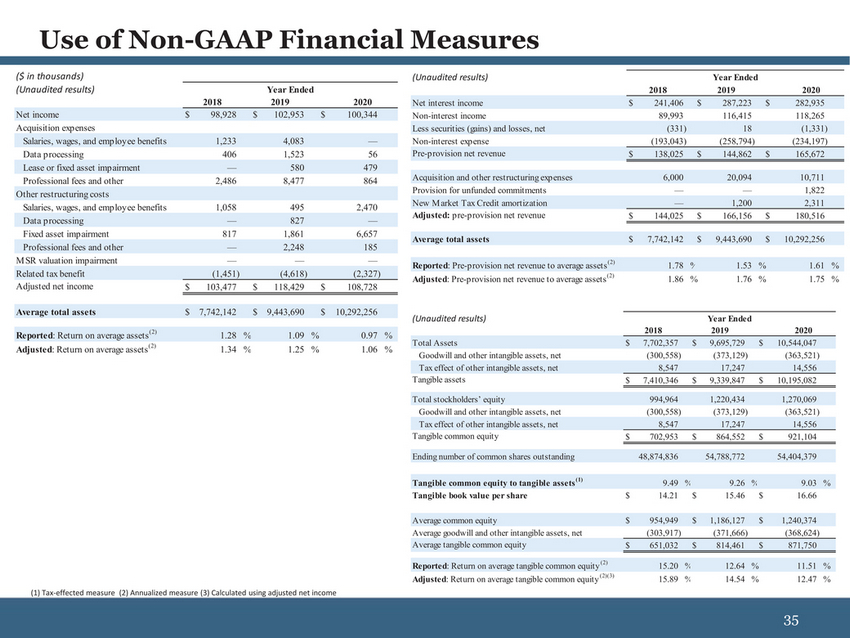 | Professional fees and other2,4868,477864 Other restructuring costs Adjusted net income$103,477$118,429$108,728 Average total assets$ 7,742,142$ 9,443,690$ 10,292,256 Reported: Return on average assets(2)1.28 %1.09 %0.97 % (2) Acquisition and other restructuring expenses 6,000 20,094 10,711 Provision for unfunded commitments — — 1,822 New M arket Tax Credit amortization — 1,200 2,311 Reported: Pre-provision net revenue to average assets(2) 1.78 % 1.53 % 1.61 % Adjusted: Pre-provision net revenue to average assets(2) 1.86 % 1.76 % 1.75 % Adjusted: Return on average assets 1.34 %1.25 %1.06 % (Unaudited results) Year Ended 2018 2019 2020 Total Assets $7,702,357 $9,695,729 $10,544,047 Goodwill and other intangible assets, net (300,558) (373,129) (363,521) Tax effect of other intangible assets, net 8,547 17,247 14,556 |