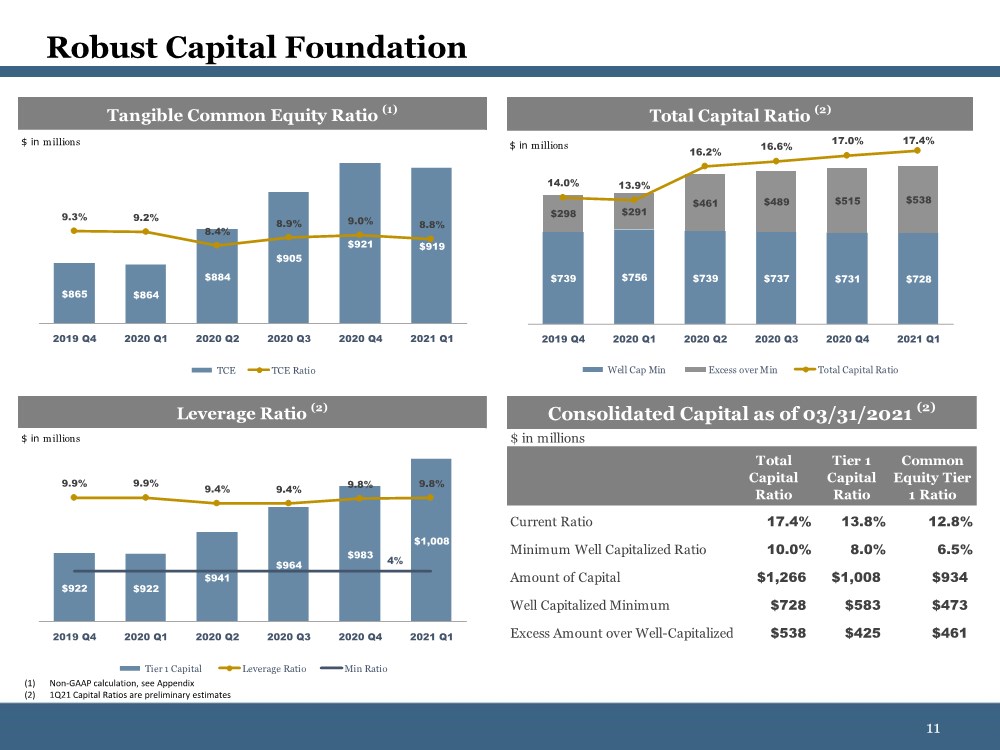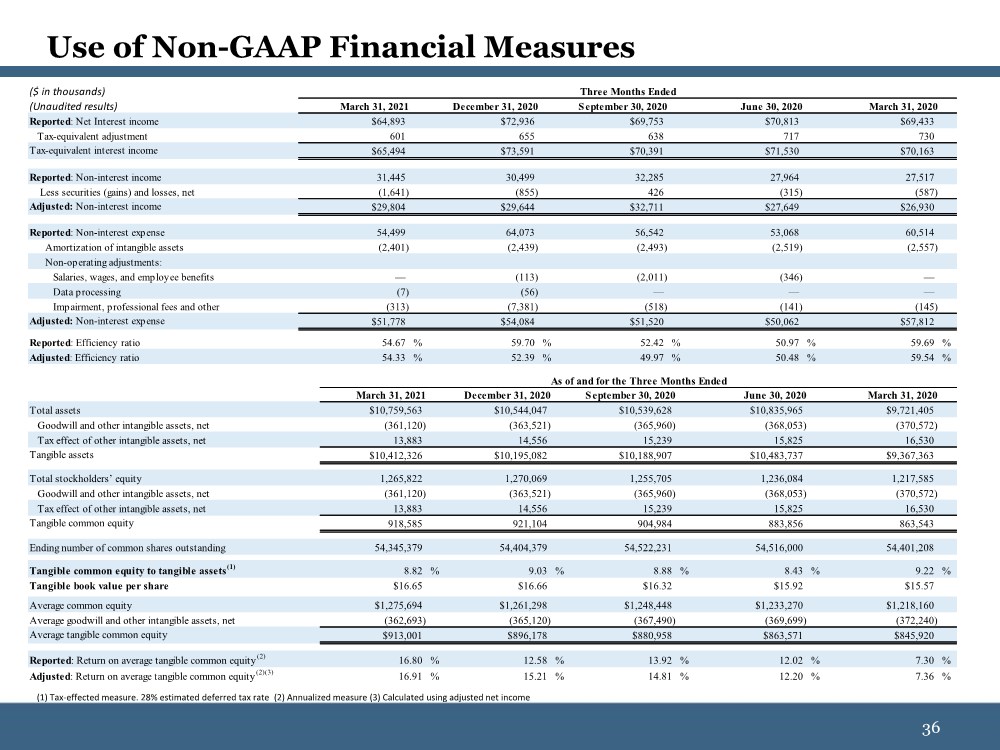
| 36 36 Use of Non-GAAP Financial Measures (1) Tax-effected measure. 28% estimated deferred tax rate (2) Annualized measure (3) Calculated using adjusted net income March 31, 2021 December 31, 2020 September 30, 2020 June 30, 2020 March 31, 2020 Total assets $10,759,563 $10,544,047 $10,539,628 $10,835,965 $9,721,405 Goodwill and other intangible assets, net (361,120) (363,521) (365,960) (368,053) (370,572) Tax effect of other intangible assets, net 13,883 14,556 15,239 15,825 16,530 Tangible assets $10,412,326 $10,195,082 $10,188,907 $10,483,737 $9,367,363 Total stockholders’ equity 1,265,822 1,270,069 1,255,705 1,236,084 1,217,585 Goodwill and other intangible assets, net (361,120) (363,521) (365,960) (368,053) (370,572) Tax effect of other intangible assets, net 13,883 14,556 15,239 15,825 16,530 Tangible common equity 918,585 921,104 904,984 883,856 863,543 Ending number of common shares outstanding 54,345,379 54,404,379 54,522,231 54,516,000 54,401,208 Tangible common equity to tangible assets(1) 8.82 % 9.03 % 8.88 % 8.43 % 9.22 % Tangible book value per share $16.65 $16.66 $16.32 $15.92 $15.57 Average common equity $1,275,694 $1,261,298 $1,248,448 $1,233,270 $1,218,160 Average goodwill and other intangible assets, net (362,693) (365,120) (367,490) (369,699) (372,240) Average tangible common equity $913,001 $896,178 $880,958 $863,571 $845,920 Reported: Return on average tangible common equity(2) 16.80 % 12.58 % 13.92 % 12.02 % 7.30 % Adjusted: Return on average tangible common equity(2)(3) 16.91 % 15.21 % 14.81 % 12.20 % 7.36 % As of and for the Three Months Ended ($ in thousands) (Unaudited results) March 31, 2021 December 31, 2020 September 30, 2020 June 30, 2020 March 31, 2020 Reported: Net Interest income $64,893 $72,936 $69,753 $70,813 $69,433 Tax-equivalent adjustment 601 655 638 717 730 Tax-equivalent interest income $65,494 $73,591 $70,391 $71,530 $70,163 Reported: Non-interest income 31,445 30,499 32,285 27,964 27,517 Less securities (gains) and losses, net (1,641) (855) 426 (315) (587) Adjusted: Non-interest income $29,804 $29,644 $32,711 $27,649 $26,930 Reported: Non-interest expense 54,499 64,073 56,542 53,068 60,514 Amortization of intangible assets (2,401) (2,439) (2,493) (2,519) (2,557) Non-operating adjustments: Salaries, wages, and employee benefits — (113) (2,011) (346) — Data processing (7) (56) — — — Impairment, professional fees and other (313) (7,381) (518) (141) (145) Adjusted: Non-interest expense $51,778 $54,084 $51,520 $50,062 $57,812 Reported: Efficiency ratio 54.67 % 59.70 % 52.42 % 50.97 % 59.69 % Adjusted: Efficiency ratio 54.33 % 52.39 % 49.97 % 50.48 % 59.54 % Three Months Ended |