Exhibit 99.2
| October 26, 2021 3Q21 QUARTERLY EARNINGS SUPPLEMENT |
| 2 2 Special Note Concerning Forward-LookingStatements Statements made in this document, other than those concerning historical financial information, may be considered forward - looking statements within the meaning of the Private Securities Litigation Reform Act of 1995 with respect to the financial condition, results of operations, plans, objectives, future performance and business of the Company. Forward -looking statements, which may be based upon beliefs, expectations and assumptions of the Company’s management and on information currently available to management, are generally identifiable by the use of words such as “believe,” “expect,” “anticipate,” “plan,” “intend,” “estimate,” “may,” “will,” “would,” “could,” “should” or other similar expressions. Additionally, all state ments in this document, including forward-looking statements, speak only as of the date they are made, and the Company undertakes no obligation to update any statement in light of new information or future events. A number of factors, many of which are beyon d the Company’s ability to control or predict, could cause actual results to differ materially from those in the Company’s forw ard- looking statements. These factors include, among others, the following: (i) the strength of the local, state, national and international economy (including the impact of the current presidential administration); (ii) the economic impact of any futu re terrorist threats or attacks, widespread disease or pandemics (including the COVID -19 pandemic), or other adverse external events that could cause economic deterioration or instability in credit markets; (iii) changes in state and federal laws, reg ulations and governmental policies concerning the Company’s general business; (iv) changes in accounting policies and practice; (v) changes in interest rates and prepayment rates of the Company’s assets (including the impact of The London Inter -bank Offered Rate phase-out); (vi) increased competition in the financial services sector and the inability to attract new customers; (vii) changes in technology and the ability to develop and maintain secure and reliable electronic systems; (viii) the loss of key executives or associates; (ix) changes in consumer spending; (x) unexpected results of current and/or future acquisitions, wh ich may include failure to realize the anticipated benefits of any acquisition and the possibility that transaction costs may be greater than anticipated; (xi) unexpected outcomes of existing or new litigation involving the Company; and (xii) the economic impactof exceptional weather occurrences such as tornadoes, hurricanes, floods, and blizzards. These risks and uncertainties should be considered in evaluating forward-looking statements and undue reliance should not be placed on such statements. Additional information concerning the Company and its business, including additional factors that could materially affect its financial results, is included in the Company’s filings with the Securities and Exchange Commission. |
| 3 3 Non-GAAP Financial Measures This document contains financial information determined other than in accordance with accounting principles generally accepted in the United States of America (“GAAP”). Management uses these “non-GAAP” measures in its analysis of the Company’s performance. Management also believes that these non-GAAP financial measures allow for better comparability of period to period operating performance. Additionally, the Company believes this information is utilized by regulators and market analysts to evaluate a company’s financial condition, and therefore, such information is useful to investors. These disclosures should not be viewed as a substitute for operating results determined in accordance with GAAP, nor are they necessarily comparable to non-GAAP performance measures that may be presented by other companies. A reconciliation of the non-GAAP measures used in this document to the most directly comparable GAAP measures is provided beginning on page 37 of this document. For more details on the Company’s non-GAAP measures, refer to the Company’s Quarterly Report on Form 10-Q for the quarter ended June 30, 2021. |
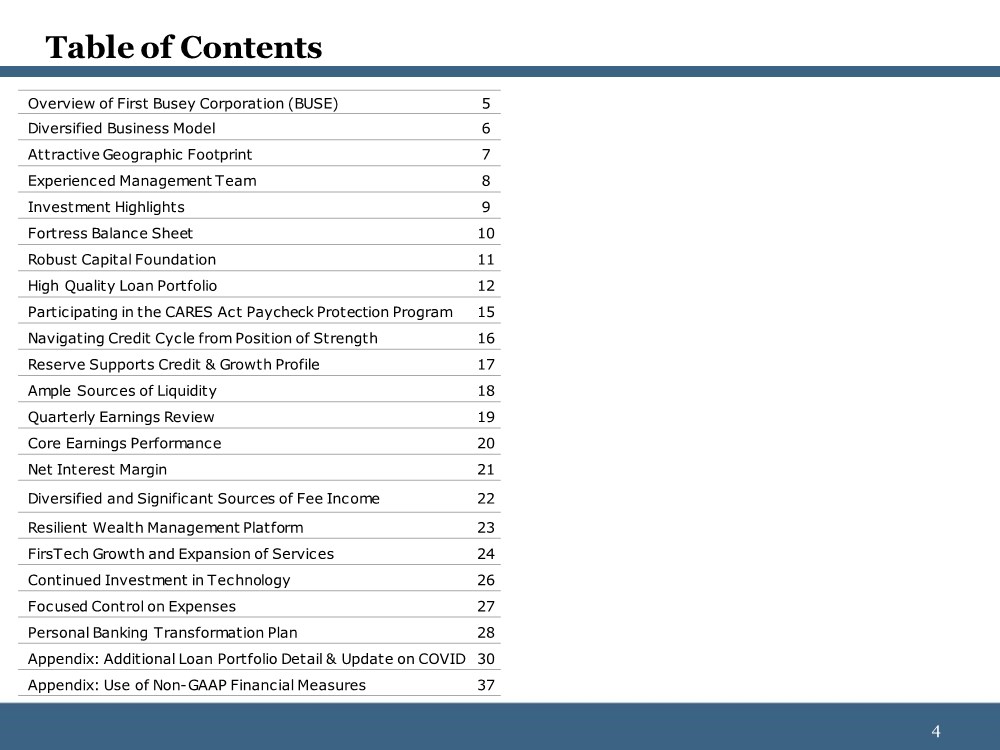
| 4 4 Table of Contents Overview of First Busey Corporation (BUSE) 5 Diversified Business Model 6 Attractive Geographic Footprint 7 Experienced Management Team 8 Investment Highlights 9 Fortress Balance Sheet 10 Robust Capital Foundation 11 High Quality Loan Portfolio 12 Participating in the CARES Act Paycheck Protection Program 15 Navigating Credit Cycle from Position of Strength 16 Reserve Supports Credit & Growth Profile 17 Ample Sources of Liquidity 18 Quarterly Earnings Review 19 Core Earnings Performance 20 Net Interest Margin 21 Diversified and Significant Sources of Fee Income 22 Resilient Wealth Management Platform 23 FirsTech Growth and Expansion of Services 24 Continued Investment in Technology 26 Focused Control on Expenses 27 Personal Banking Transformation Plan 28 Appendix: Additional Loan Portfolio Detail & Update on COVID 30 Appendix: Use of Non-GAAP Financial Measures 37 |
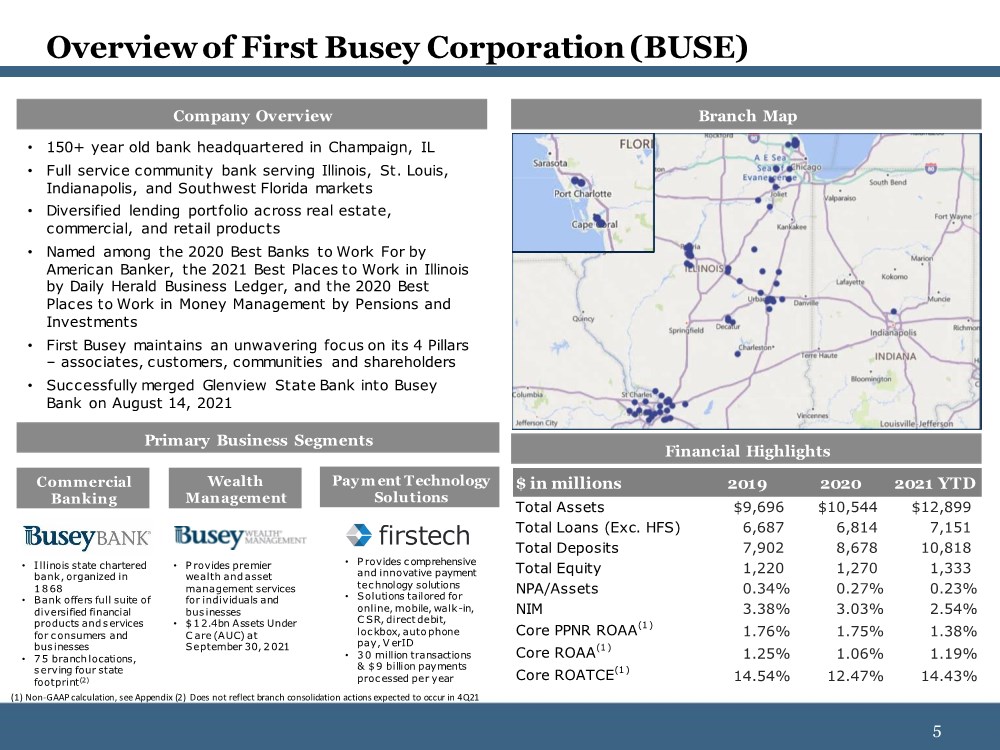
| 5 5 Overview of First Busey Corporation (BUSE) Company Overview Branch Map Primary Business Segments Financial Highlights Commercial Banking Wealth Management Paym ent Technology Solutions • I llinois state chartered bank, organized in 1 8 68 • Bank offers full suite of diversified financial products and services for consumers and bus inesses • 7 5 branch locations, s erving four state footprint(2) • P rovides premier wealth and asset management services for individuals and bus inesses • $1 2.4bn Assets Under C are (AUC) at September 30, 2021 • P rovides comprehensive and innovative payment tec hnology solutions • Solutions tailored for online, mobile, walk-in, C SR, direct debit, loc kbox, auto phone pay, V erID • 30 million transactions & $ 9 billion payments proc essed per year • 150+ year old bank headquartered in Champaign, IL • Full service community bank serving Illinois, St. Louis, Indianapolis, and Southwest Florida markets • Diversified lending portfolio across real estate, commercial, and retail products • Named among the 2020 Best Banks to Work For by American Banker, the 2021 Best Places to Work in Illinois by Daily Herald Business Ledger, and the 2020 Best Places to Work in Money Management by Pensions and Investments • First Busey maintains an unwavering focus on its 4 Pillars – associates, customers, communities and shareholders • Successfully merged Glenview State Bank into Busey Bank on August 14, 2021 (1) Non-GAAP calculation, see Appendix (2) Does not reflect branch consolidation actions expected to occur in 4Q21 $ in millions 2019 2020 2021 YTD Total Assets $9,696 $10,544 $12,899 Total Loans (Exc. HFS) 6,687 6,814 7,151 Total Deposits 7,902 8,678 10,818 Total Equity 1,220 1,270 1,333 NPA/Assets 0.34% 0.27% 0.23% NIM 3.38% 3.03% 2.54% Core PPNR ROAA(1 ) 1.76% 1.75% 1.38% Core ROAA(1 ) 1.25% 1.06% 1.19% Core ROATCE(1 ) 14.54% 12.47% 14.43% |
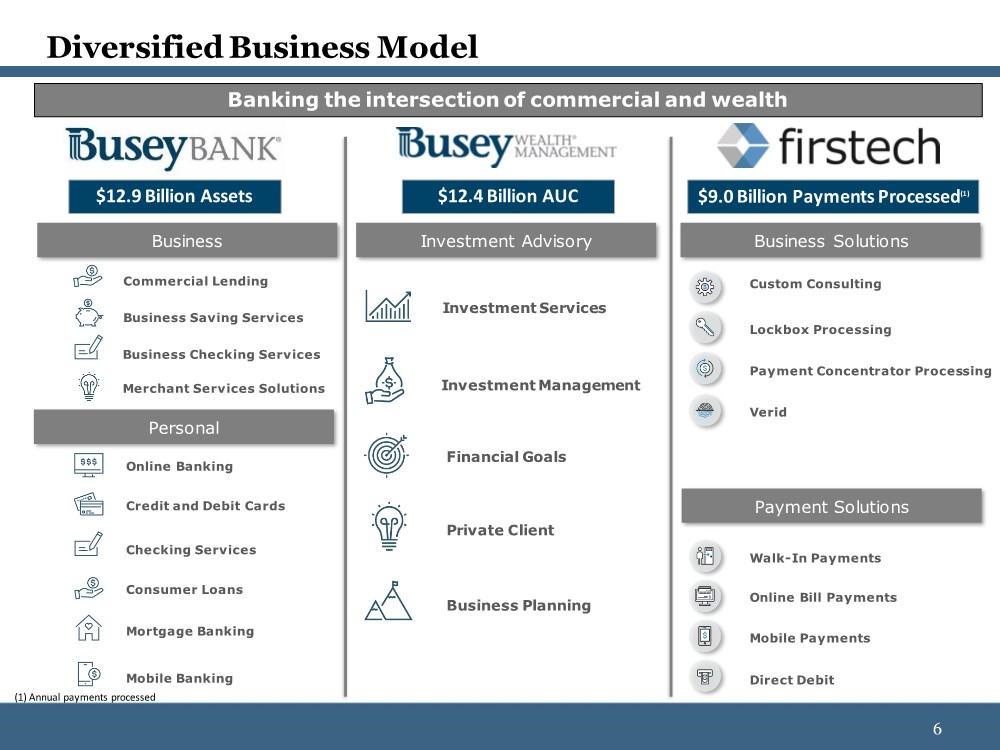
| 6 6 Online Banking Credit and Debit Cards Checking Services Consumer Loans Commercial Lending Business Saving Services Personal Business Mortgage Banking Mobile Banking Diversified Business Model Investment Services Investment Management Financial Goals Private Client Business Planning Business Checking Services Merchant Services Solutions Custom Consulting Lockbox Processing Payment Concentrator Processing Verid Walk-In Payments Online Bill Payments Mobile Payments Direct Debit Business Solutions Payment Solutions Investment Advisory Banking the intersection of commercial and wealth $12.9 Billion Assets $12.4 Billion AUC $9.0 Billion Payments Processed(1) (1) Annual payments processed |
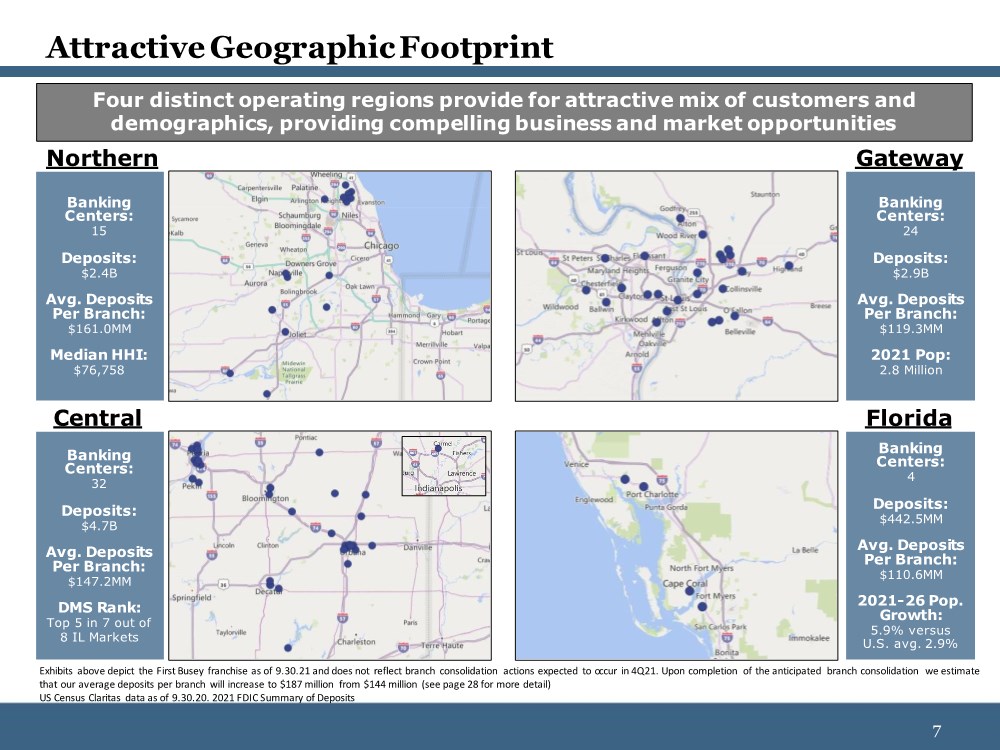
| 7 7 Banking Centers: 4 Deposits: $442.5MM Avg. Deposits Per Branch: $110.6MM 2021-26 Pop. Growth: 5.9% versus U.S. avg. 2.9% Banking Centers: 24 Deposits: $2.9B Avg. Deposits Per Branch: $119.3MM 2021 Pop: 2.8 Million Attractive Geographic Footprint Four distinct operating regions provide for attractive mix of customers and demographics, providing compelling business and market opportunities Northern Gateway Central Florida US Census Claritas data as of 9.30.20. 2021 FDIC Summary of Deposits Exhibits above depict the First Busey franchise as of 9.30.21 and does not reflect branch consolidation actions expected to occur in 4Q21. Upon completion of the anticipated branch consolidation we estimate that our average deposits per branch will increase to $187 million from $144 million (see page 28 for more detail) Banking Centers: 15 Deposits: $2.4B Avg. Deposits Per Branch: $161.0MM Median HHI: $76,758 Banking Centers: 32 Deposits: $4.7B Avg. Deposits Per Branch: $147.2MM DMS Rank: Top 5 in 7 out of 8 IL Markets |
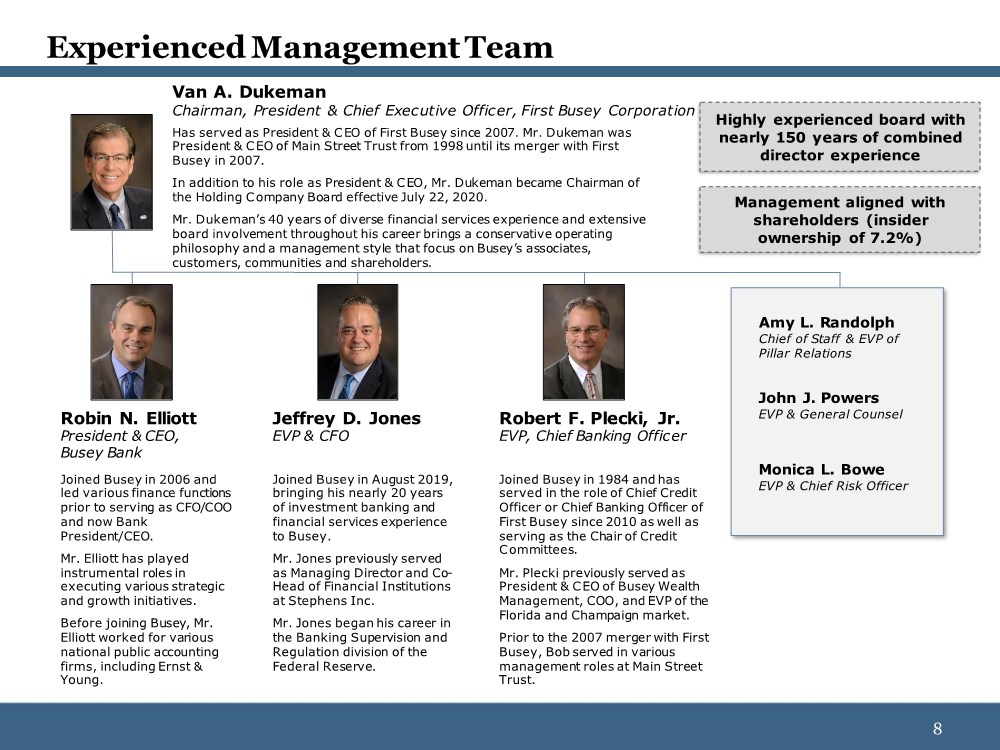
| 8 8 Experienced Management Team Van A. Dukeman Chairman, President & Chief Executive Officer, First Busey Corporation Robin N. Elliott President & CEO, Busey Bank Jeffrey D. Jones EVP & CFO Robert F. Plecki, Jr. EVP, Chief Banking Officer John J. Powers EVP & General Counsel Monica L. Bowe EVP & Chief Risk Officer Has served as President & CEO of First Busey since 2007. Mr. Dukeman was President & CEO of Main Street Trust from 1998 until its merger with First Busey in 2007. In addition to his role as President & CEO, Mr. Dukeman became Chairman of the Holding Company Board effective July 22, 2020. Mr. Dukeman’s 40 years of diverse financial services experience and extensive board involvement throughout his career brings a conservative operating philosophy and a management style that focus on Busey’s associates, customers, communities and shareholders. Joined Busey in 2006 and led various finance functions prior to serving as CFO/COO and now Bank President/CEO. Mr. Elliott has played instrumental roles in executing various strategic and growth initiatives. Before joining Busey, Mr. Elliott worked for various national public accounting firms, including Ernst & Young. Joined Busey in August 2019, bringing his nearly 20 years of investment banking and financial services experience to Busey. Mr. Jones previously served as Managing Director and Co- Head of Financial Institutions at Stephens Inc. Mr. Jones began his career in the Banking Supervision and Regulation division of the Federal Reserve. Joined Busey in 1984 and has served in the role of Chief Credit Officer or Chief Banking Officer of First Busey since 2010 as well as serving as the Chair of Credit Committees. Mr. Plecki previously served as President & CEO of Busey Wealth Management, COO, and EVP of the Florida and Champaign market. Prior to the 2007 merger with First Busey, Bob served in various management roles at Main Street Trust. Highly experienced board with nearly 150 years of combined director experience Management aligned with shareholders (insider ownership of 7.2%) Amy L. Randolph Chief of Staff & EVP of Pillar Relations |
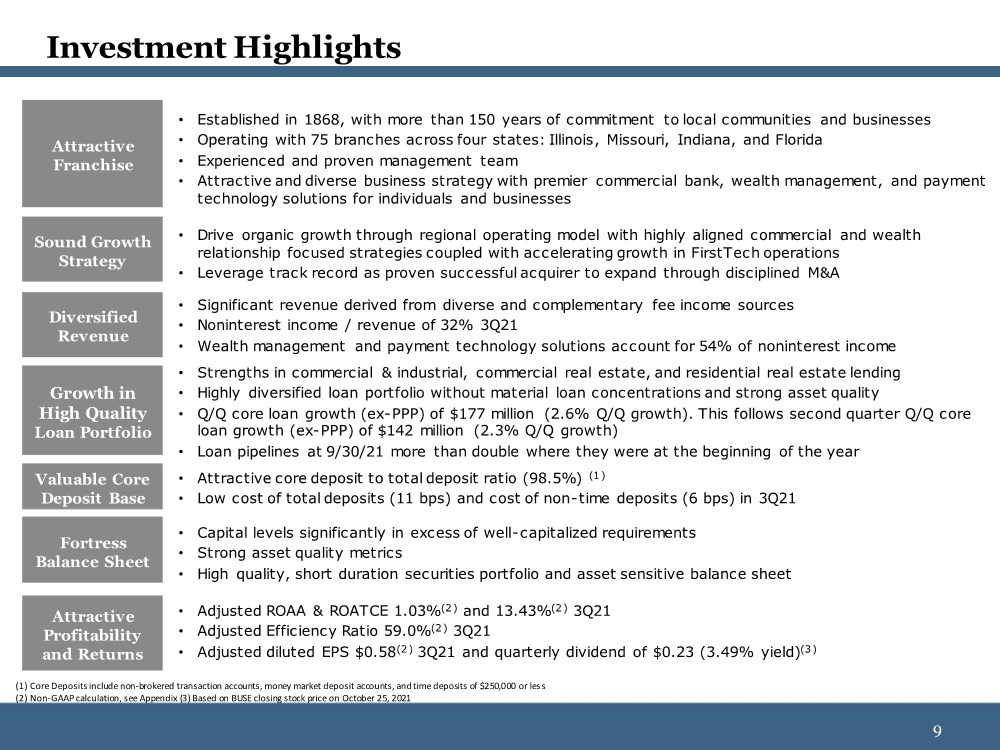
| 9 9 Investment Highlights • Established in 1868, with more than 150 years of commitment to local communities and businesses • Operating with 75 branches across four states: Illinois, Missouri, Indiana, and Florida • Experienced and proven management team • Attractive and diverse business strategy with premier commercial bank, wealth management, and payment technology solutions for individuals and businesses Attractive Franchise Sound Growth Strategy Valuable Core Deposit Base Fortress Balance Sheet Growth in High Quality Loan Portfolio Diversified Revenue • Drive organic growth through regional operating model with highly aligned commercial and wealth relationship focused strategies coupled with accelerating growth in FirstTech operations • Leverage track record as proven successful acquirer to expand through disciplined M&A • Attractive core deposit to total deposit ratio (98.5%) (1 ) • Low cost of total deposits (11 bps) and cost of non-time deposits (6 bps) in 3Q21 • Strengths in commercial & industrial, commercial real estate, and residential real estate lending • Highly diversified loan portfolio without material loan concentrations and strong asset quality • Q/Q core loan growth (ex-PPP) of $177 million (2.6% Q/Q growth). This follows second quarter Q/Q core loan growth (ex-PPP) of $142 million (2.3% Q/Q growth) • Loan pipelines at 9/30/21 more than double where they were at the beginning of the year • Significant revenue derived from diverse and complementary fee income sources • Noninterest income / revenue of 32% 3Q21 • Wealth management and payment technology solutions account for 54% of noninterest income • Capital levels significantly in excess of well-capitalized requirements • Strong asset quality metrics • High quality, short duration securities portfolio and asset sensitive balance sheet (1) Core Deposits include non-brokered transaction accounts, money market deposit accounts, and time deposits of $250,000 or less (2) Non-GAAP calculation, see Appendix (3) Based on BUSE closing stock price on October 25, 2021 Attractive Profitability and Returns • Adjusted ROAA & ROATCE 1.03%(2 ) and 13.43%(2 ) 3Q21 • Adjusted Efficiency Ratio 59.0%(2 ) 3Q21 • Adjusted diluted EPS $0.58(2 ) 3Q21 and quarterly dividend of $0.23 (3.49% yield)(3 ) |
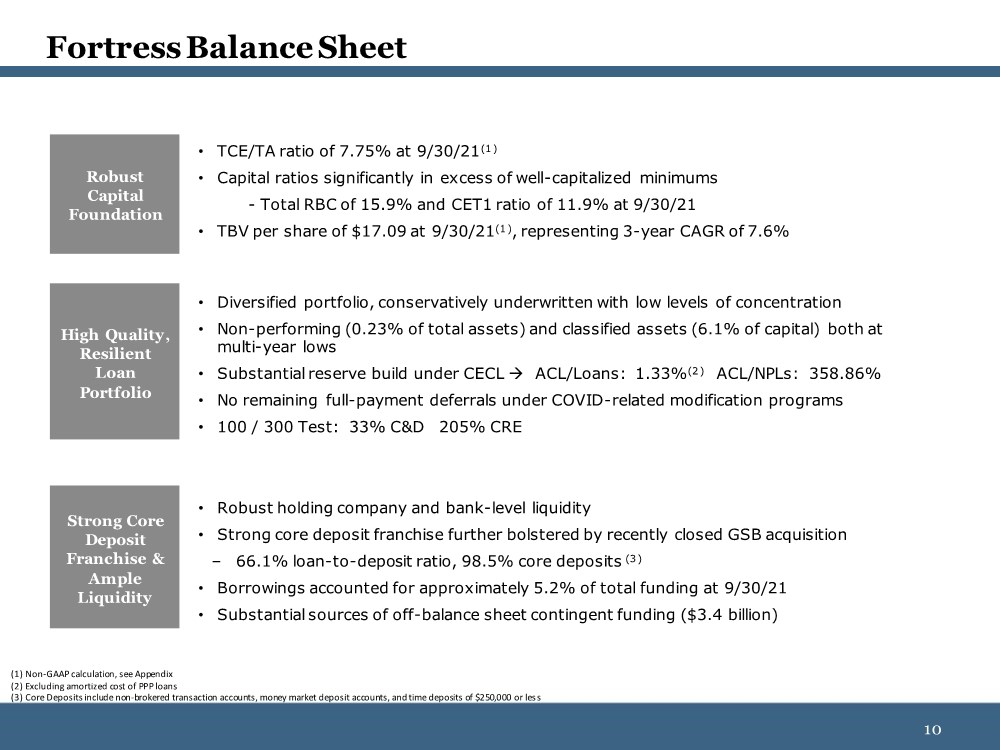
| 10 10 • TCE/TA ratio of 7.75% at 9/30/21(1 ) • Capital ratios significantly in excess of well-capitalized minimums - Total RBC of 15.9% and CET1 ratio of 11.9% at 9/30/21 • TBV per share of $17.09 at 9/30/21(1 ), representing 3-year CAGR of 7.6% • Diversified portfolio, conservatively underwritten with low levels of concentration • Non-performing (0.23% of total assets) and classified assets (6.1% of capital) both at multi-year lows • Substantial reserve build under CECL → ACL/Loans: 1.33%(2 ) ACL/NPLs: 358.86% • No remaining full-payment deferrals under COVID-related modification programs • 100 / 300 Test: 33% C&D 205% CRE • Robust holding company and bank-level liquidity • Strong core deposit franchise further bolstered by recently closed GSB acquisition – 66.1% loan-to-deposit ratio, 98.5% core deposits (3 ) • Borrowings accounted for approximately 5.2% of total funding at 9/30/21 • Substantial sources of off-balance sheet contingent funding ($3.4 billion) Fortress Balance Sheet (1) Non-GAAP calculation, see Appendix (2) Excluding amortized cost of PPP loans (3) Core Deposits include non-brokered transaction accounts, money market deposit accounts, and time deposits of $250,000 or less Robust Capital Foundation High Quality, Resilient Loan Portfolio Strong Core Deposit Franchise & Ample Liquidity |
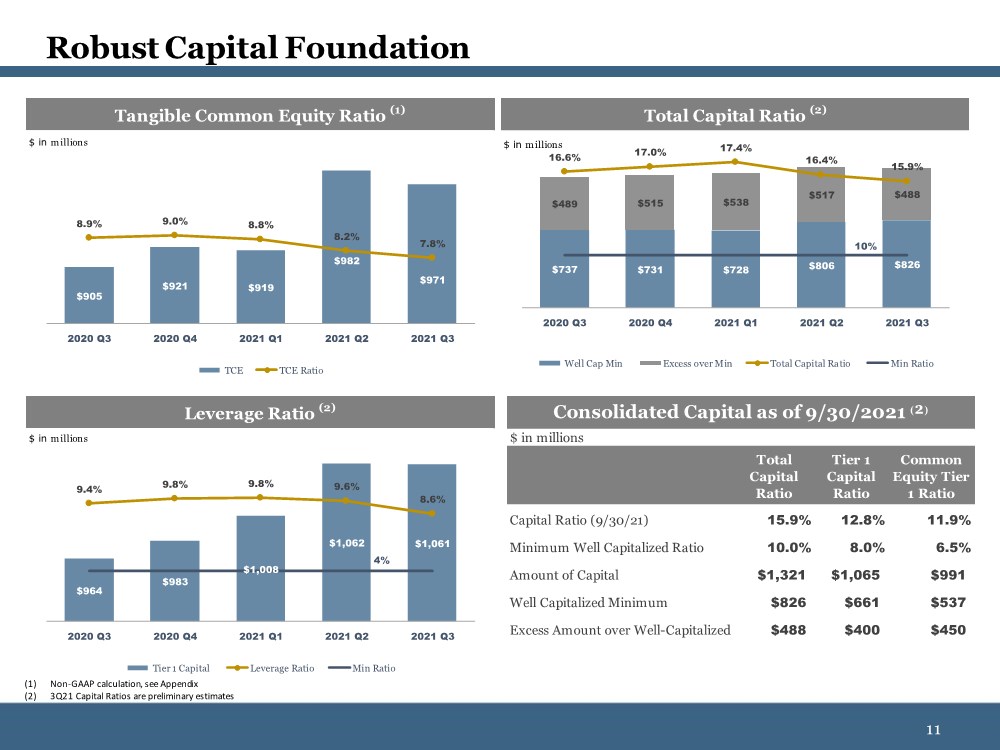
| 11 11 Leverage Ratio (2) $964 $983 $1,008 $1,062 $1,061 9.4% 9.8% 9.8% 9.6% 8.6% 4% 2020 Q3 2020 Q4 2021 Q1 2021 Q2 2021 Q3 Tier 1 Capital Leverage Ratio Min Ratio $ in millions Robust Capital Foundation (1) Non-GAAP calculation, see Appendix (2) 3Q21 Capital Ratios are preliminary estimates $ in millions Capital Ratio (9/30/21) 15.9% 12.8% 11.9% Minimum Well Capitalized Ratio 10.0% 8.0% 6.5% Amount of Capital $1,321 $1,065 $991 Well Capitalized Minimum $826 $661 $537 Excess Amount over Well-Capitalized Min $488 $400 $450 Total Capital Ratio Tier 1 Capital Ratio Common Equity Tier 1 Ratio Consolidated Capital as of 9/30/2021 ⁽²⁾ Total Capital Ratio (2) $ in millions $737 $731 $728 $806 $826 $489 $515 $538 $517 $488 16.6% 17.0% 17.4% 16.4% 15.9% 10% 2020 Q3 2020 Q4 2021 Q1 2021 Q2 2021 Q3 Well Cap Min Excess over Min Total Capital Ratio Min Ratio $ in millions ($ in millions) Tangible Common Equity Ratio (1) $905 $921 $919 $982 $971 8.9% 9.0% 8.8% 8.2% 7.8% 2020 Q3 2020 Q4 2021 Q1 2021 Q2 2021 Q3 TCE TCE Ratio $ in millions |
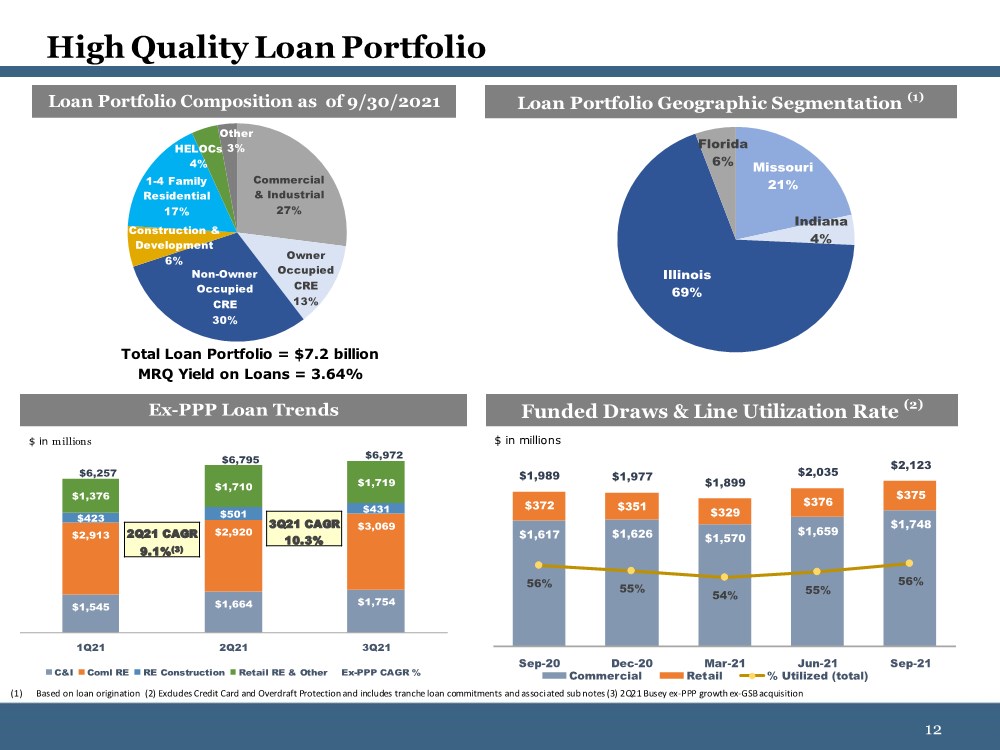
| 12 12 High Quality Loan Portfolio (1) Based on loan origination (2) Excludes Credit Card and Overdraft Protection and includes tranche loan commitments and associated sub notes (3) 2Q21 Busey ex-PPP growth ex-GSB acquisition 2Q21 CAGR 9.1% Loan Portfolio Geographic Segmentation (1) Missouri 21% Indiana 4% Illinois 69% Florida 6% Ex-PPP Loan Trends $1,545 $1,664 $1,754 $2,913 $2,920 $3,069 $423 $501 $431 $1,376 $1,710 $1,719 $6,257 $6,795 $6,972 1Q21 2Q21 3Q21 C&I Coml RE RE Construction Retail RE & Other Ex-PPP CAGR % $ in millions MRQ Yield on Loans = 3.64% Total Loan Portfolio = $7.2 billion Loan Portfolio Composition as of 9/30/2021 Commercial & Industrial 27% Owner Occupied CRE 13% Non-Owner Occupied CRE 30% Construction & Development 6% 1-4 Family Residential 17% HELOCs 4% Other 3% Funded Draws & Line Utilization Rate (2) $1,617 $1,626 $1,570 $1,659 $1,748 $372 $351 $329 $376 $375 $1,989 $1,977 $1,899 $2,035 $2,123 56% 55% 54% 55% 56% $1 $501 $1,001 $1,501 $2,001 $2,501 Sep-20 Dec-20 Mar-21 Jun-21 Sep-21 Commercial Retail % Utilized (total) $ in millions 3Q21 CAGR 10.3% 2Q21 CAGR 9.1%(3) |
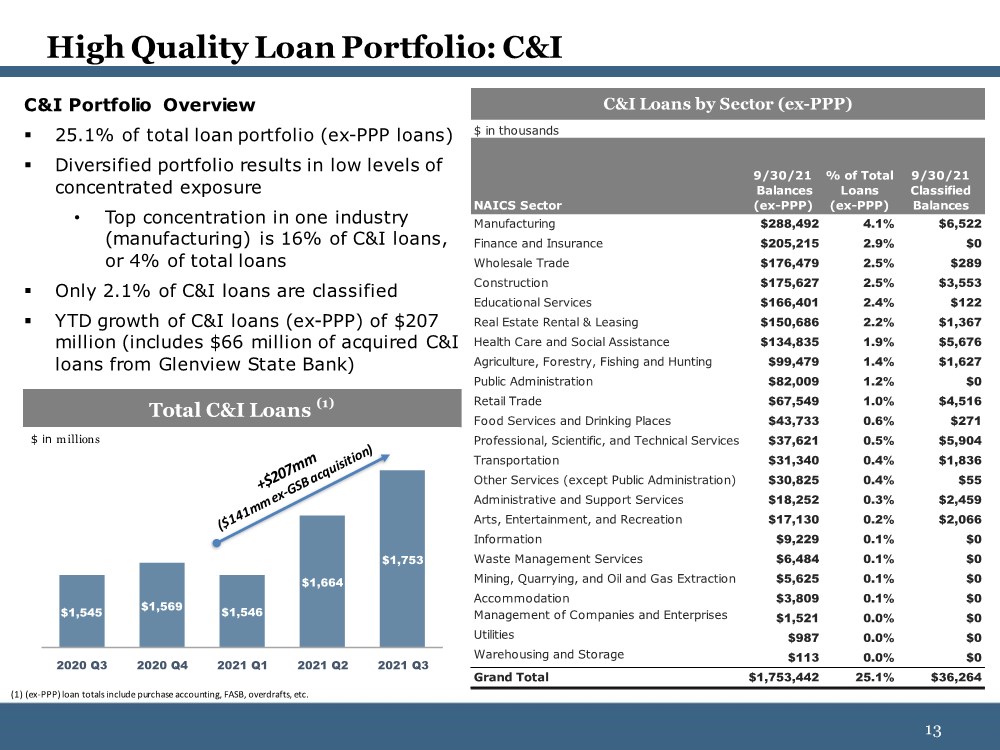
| 13 13 High Quality Loan Portfolio: C&I C&I Portfolio Overview ▪ 25.1% of total loan portfolio (ex-PPP loans) ▪ Diversified portfolio results in low levels of concentrated exposure • Top concentration in one industry (manufacturing) is 16% of C&I loans, or 4% of total loans ▪ Only 2.1% of C&I loans are classified ▪ YTD growth of C&I loans (ex-PPP) of $207 million (includes $66 million of acquired C&I loans from Glenview State Bank) (1) (ex-PPP) loan totals include purchase accounting, FASB, overdrafts, etc. Total C&I Loans (1) $1,545 $1,569 $1,546 $1,664 $1,753 2020 Q3 2020 Q4 2021 Q1 2021 Q2 2021 Q3 $ in millions $ in thousands NAICS Sector 9/30/21 Balances (ex-PPP) % of Total Loans (ex-PPP) 9/30/21 Classified Balances Manufacturing $288,492 4.1% $6,522 Finance and Insurance $205,215 2.9% $0 Wholesale Trade $176,479 2.5% $289 Construction $175,627 2.5% $3,553 Educational Services $166,401 2.4% $122 Real Estate Rental & Leasing $150,686 2.2% $1,367 Health Care and Social Assistance $134,835 1.9% $5,676 Agriculture, Forestry, Fishing and Hunting $99,479 1.4% $1,627 Public Administration $82,009 1.2% $0 Retail Trade $67,549 1.0% $4,516 Food Services and Drinking Places $43,733 0.6% $271 Professional, Scientific, and Technical Services $37,621 0.5% $5,904 Transportation $31,340 0.4% $1,836 Other Services (except Public Administration) $30,825 0.4% $55 Administrative and Support Services $18,252 0.3% $2,459 Arts, Entertainment, and Recreation $17,130 0.2% $2,066 Information $9,229 0.1% $0 Waste Management Services $6,484 0.1% $0 Mining, Quarrying, and Oil and Gas Extraction $5,625 0.1% $0 Accommodation $3,809 0.1% $0 Management of Companies and Enterprises $1,521 0.0% $0 Utilities $987 0.0% $0 Warehousing and Storage $113 0.0% $0 Grand Total $1,753,442 25.1% $36,264 C&I Loans by Sector (ex-PPP) |
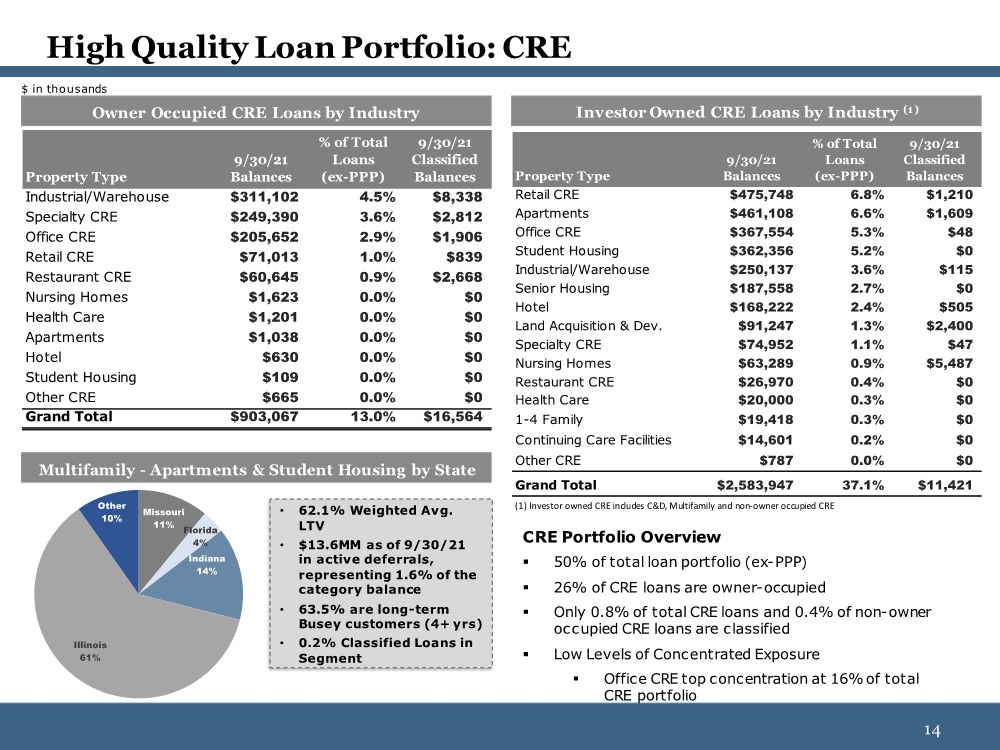
| 14 14 High Quality Loan Portfolio: CRE CRE Portfolio Overview ▪ 50% of total loan portfolio (ex-PPP) ▪ 26% of CRE loans are owner-occupied ▪ Only 0.8% of total CRE loans and 0.4% of non-owner occupied CRE loans are classified ▪ Low Levels of Concentrated Exposure ▪ Office CRE top concentration at 16% of total CRE portfolio Investor Owned CRE Loans by Industry (1) Owner Occupied CRE Loans by Industry Multifamily - Apartments & Student Housing by State $ in thousands • 62.1% Weighted Avg. LTV • $13.6MM as of 9/30/21 in active deferrals, representing 1.6% of the category balance • 63.5% are long-term Busey customers (4+ yrs) • 0.2% Classified Loans in Segment (1) Investor owned CRE includes C&D, Multifamily and non-owner occupied CRE Property Type 9/30/21 Balances % of Total Loans (ex-PPP) 9/30/21 Classified Balances Industrial/Warehouse $311,102 4.5% $8,338 Specialty CRE $249,390 3.6% $2,812 Office CRE $205,652 2.9% $1,906 Retail CRE $71,013 1.0% $839 Restaurant CRE $60,645 0.9% $2,668 Nursing Homes $1,623 0.0% $0 Health Care $1,201 0.0% $0 Apartments $1,038 0.0% $0 Hotel $630 0.0% $0 Student Housing $109 0.0% $0 Other CRE $665 0.0% $0 Grand Total $903,067 13.0% $16,564 Missouri 11% Florida 4% Indiana 14% Illinois 61% Other 10% Property Type 9/30/21 Balances % of Total Loans (ex-PPP) 9/30/21 Classified Balances Retail CRE $475,748 6.8% $1,210 Apartments $461,108 6.6% $1,609 Office CRE $367,554 5.3% $48 Student Housing $362,356 5.2% $0 Industrial/Warehouse $250,137 3.6% $115 Senior Housing $187,558 2.7% $0 Hotel $168,222 2.4% $505 Land Acquisition & Dev. $91,247 1.3% $2,400 Specialty CRE $74,952 1.1% $47 Nursing Homes $63,289 0.9% $5,487 Restaurant CRE $26,970 0.4% $0 Health Care $20,000 0.3% $0 1-4 Family $19,418 0.3% $0 Continuing Care Facilities $14,601 0.2% $0 Other CRE $787 0.0% $0 Grand Total $2,583,947 37.1% $11,421 |
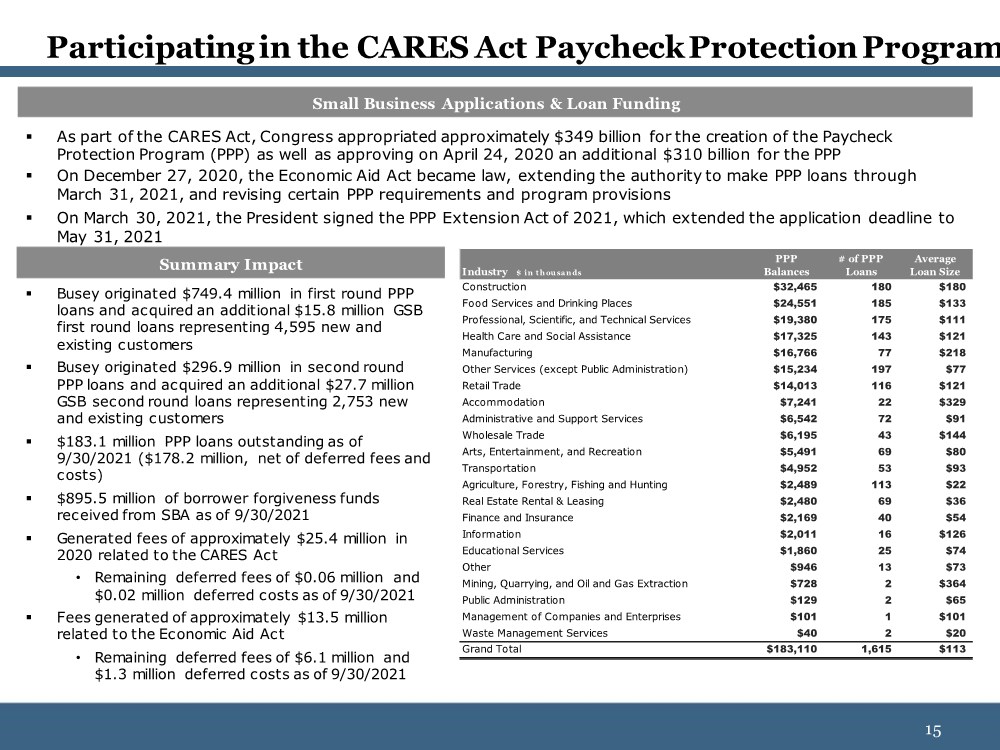
| 15 15 ▪ As part of the CARES Act, Congress appropriated approximately $349 billion for the creation of the Paycheck Protection Program (PPP) as well as approving on April 24, 2020 an additional $310 billion for the PPP ▪ On December 27, 2020, the Economic Aid Act became law, extending the authority to make PPP loans through March 31, 2021, and revising certain PPP requirements and program provisions ▪ On March 30, 2021, the President signed the PPP Extension Act of 2021, which extended the application deadline to May 31, 2021 ▪ Busey originated $749.4 million in first round PPP loans and acquired an additional $15.8 million GSB first round loans representing 4,595 new and existing customers ▪ Busey originated $296.9 million in second round PPP loans and acquired an additional $27.7 million GSB second round loans representing 2,753 new and existing customers ▪ $183.1 million PPP loans outstanding as of 9/30/2021 ($178.2 million, net of deferred fees and costs) ▪ $895.5 million of borrower forgiveness funds received from SBA as of 9/30/2021 ▪ Generated fees of approximately $25.4 million in 2020 related to the CARES Act • Remaining deferred fees of $0.06 million and $0.02 million deferred costs as of 9/30/2021 ▪ Fees generated of approximately $13.5 million related to the Economic Aid Act • Remaining deferred fees of $6.1 million and $1.3 million deferred costs as of 9/30/2021 Participating in the CARES Act Paycheck Protection Program Summary Impact Small Business Applications & Loan Funding Industry $ in t h ou sands PPP Balances # of PPP Loans Average Loan Size Construction $32,465 180 $180 Food Services and Drinking Places $24,551 185 $133 Professional, Scientific, and Technical Services $19,380 175 $111 Health Care and Social Assistance $17,325 143 $121 Manufacturing $16,766 77 $218 Other Services (except Public Administration) $15,234 197 $77 Retail Trade $14,013 116 $121 Accommodation $7,241 22 $329 Administrative and Support Services $6,542 72 $91 Wholesale Trade $6,195 43 $144 Arts, Entertainment, and Recreation $5,491 69 $80 Transportation $4,952 53 $93 Agriculture, Forestry, Fishing and Hunting $2,489 113 $22 Real Estate Rental & Leasing $2,480 69 $36 Finance and Insurance $2,169 40 $54 Information $2,011 16 $126 Educational Services $1,860 25 $74 Other $946 13 $73 Mining, Quarrying, and Oil and Gas Extraction $728 2 $364 Public Administration $129 2 $65 Management of Companies and Enterprises $101 1 $101 Waste Management Services $40 2 $20 Grand Total $183,110 1,615 $113 |
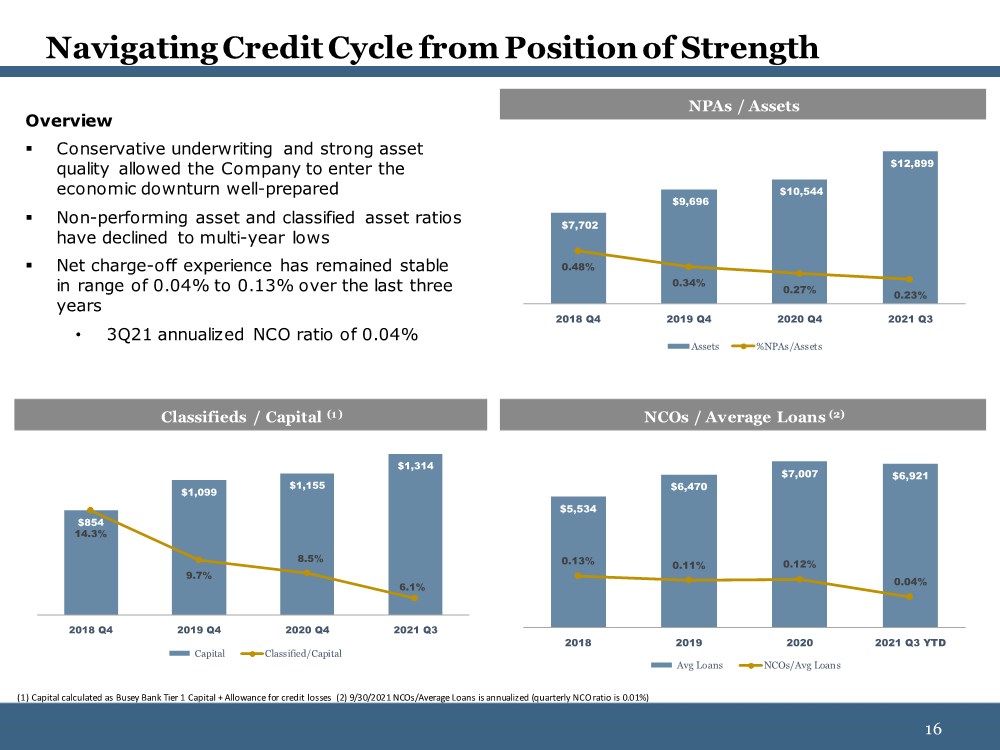
| 16 16 Navigating Credit Cycle from Position of Strength Overview ▪ Conservative underwriting and strong asset quality allowed the Company to enter the economic downturn well-prepared ▪ Non-performing asset and classified asset ratios have declined to multi-year lows ▪ Net charge-off experience has remained stable in range of 0.04% to 0.13% over the last three years • 3Q21 annualized NCO ratio of 0.04% (1) Capital calculated as Busey Bank Tier 1 Capital + Allowance for credit losses (2) 9/30/2021 NCOs/Average Loans is annualized (quarterly NCO ratio is 0.01%) NPAs / Assets $7,702 $9,696 $10,544 $12,899 0.48% 0.34% 0.27% 0.23% 2018 Q4 2019 Q4 2020 Q4 2021 Q3 Assets %NPAs/Assets Classifieds / Capital (1) NCOs / Average Loans (2) $854 $1,099 $1,155 $1,314 14.3% 9.7% 8.5% 6.1% 2018 Q4 2019 Q4 2020 Q4 2021 Q3 Capital Classified/Capital $5,534 $6,470 $7,007 $6,921 0.13% 0.11% 0.12% 0.04% 2018 2019 2020 2021 Q3 YTD Avg Loans NCOs/Avg Loans |
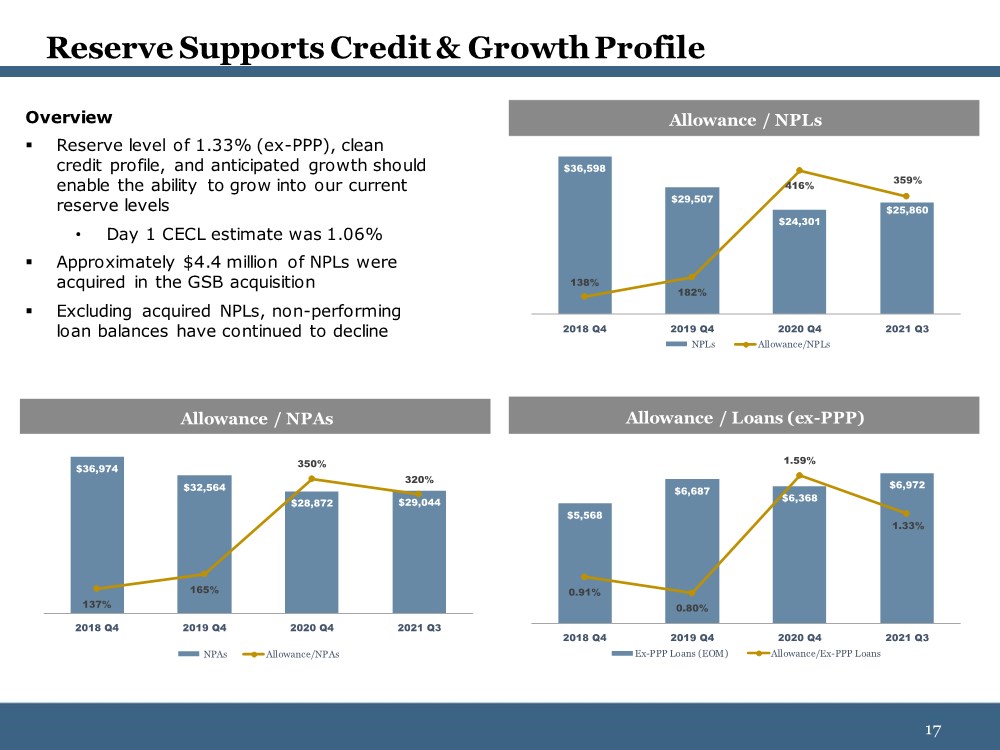
| 17 17 Reserve Supports Credit & Growth Profile Allowance / NPLs Allowance / NPAs Allowance / Loans (ex-PPP) $5,568 $6,687 $6,368 $6,972 0.91% 0.80% 1.59% 1.33% 2018 Q4 2019 Q4 2020 Q4 2021 Q3 Ex-PPP Loans (EOM) Allowance/Ex-PPP Loans $36,598 $29,507 $24,301 $25,860 138% 182% 416% 359% 2018 Q4 2019 Q4 2020 Q4 2021 Q3 NPLs Allowance/NPLs $36,974 $32,564 $28,872 $29,044 137% 165% 350% 320% 2018 Q4 2019 Q4 2020 Q4 2021 Q3 NPAs Allowance/NPAs Overview ▪ Reserve level of 1.33% (ex-PPP), clean credit profile, and anticipated growth should enable the ability to grow into our current reserve levels • Day 1 CECL estimate was 1.06% ▪ Approximately $4.4 million of NPLs were acquired in the GSB acquisition ▪ Excluding acquired NPLs, non-performing loan balances have continued to decline |
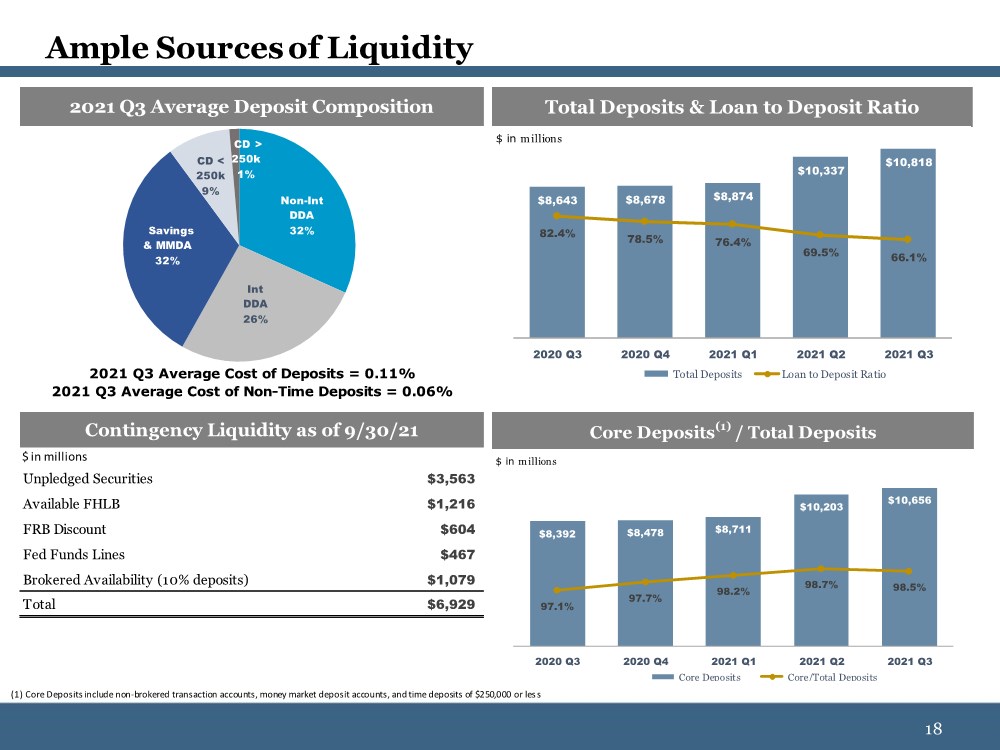
| 18 18 Ample Sources of Liquidity (1) Core Deposits include non-brokered transaction accounts, money market deposit accounts, and time deposits of $250,000 or less Total Deposits & Loan to Deposit Ratio $8,643 $8,678 $8,874 $10,337 $10,818 82.4% 78.5% 76.4% 69.5% 66.1% 2020 Q3 2020 Q4 2021 Q1 2021 Q2 2021 Q3 Total Deposits Loan to Deposit Ratio $ in millions ($ in millions) Core Deposits(1) / Total Deposits $8,392 $8,478 $8,711 $10,203 $10,656 97.1% 97.7% 98.2% 98.7% 98.5% 2020 Q3 2020 Q4 2021 Q1 2021 Q2 2021 Q3 Core Deposits Core/Total Deposits $ in millions $ in millions Unpledged Securities $3,563 Available FHLB $1,216 FRB Discount $604 Fed Funds Lines $467 Brokered Availability (10% deposits) $1,079 Total $6,929 Contingency Liquidity as of 9/30/21 2021 Q3 Average Deposit Composition Non-Int DDA 32% Int DDA 26% Savings & MMDA 32% CD < 250k 9% CD > 250k 1% 2021 Q3 Average Cost of Deposits = 0.11% 2021 Q3 Average Cost of Non-Time Deposits = 0.06% |
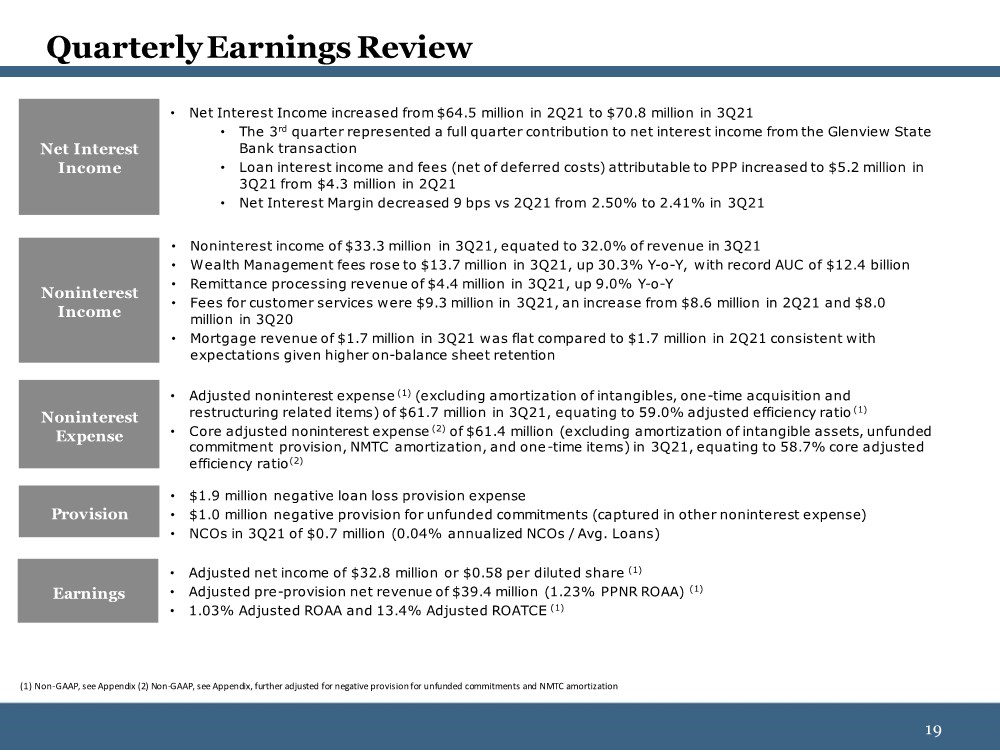
| 19 19 • Net Interest Income increased from $64.5 million in 2Q21 to $70.8 million in 3Q21 • The 3rd quarter represented a full quarter contribution to net interest income from the Glenview State Bank transaction • Loan interest income and fees (net of deferred costs) attributable to PPP increased to $5.2 million in 3Q21 from $4.3 million in 2Q21 • Net Interest Margin decreased 9 bps vs 2Q21 from 2.50% to 2.41% in 3Q21 Noninterest Expense • Noninterest income of $33.3 million in 3Q21, equated to 32.0% of revenue in 3Q21 • Wealth Management fees rose to $13.7 million in 3Q21, up 30.3% Y-o-Y, with record AUC of $12.4 billion • Remittance processing revenue of $4.4 million in 3Q21, up 9.0% Y-o-Y • Fees for customer services were $9.3 million in 3Q21, an increase from $8.6 million in 2Q21 and $8.0 million in 3Q20 • Mortgage revenue of $1.7 million in 3Q21 was flat compared to $1.7 million in 2Q21 consistent with expectations given higher on-balance sheet retention • Adjusted noninterest expense (1) (excluding amortization of intangibles, one-time acquisition and restructuring related items) of $61.7 million in 3Q21, equating to 59.0% adjusted efficiency ratio (1) • Core adjusted noninterest expense (2) of $61.4 million (excluding amortization of intangible assets, unfunded commitment provision, NMTC amortization, and one-time items) in 3Q21, equating to 58.7% core adjusted efficiency ratio(2) • Adjusted net income of $32.8 million or $0.58 per diluted share (1) • Adjusted pre-provision net revenue of $39.4 million (1.23% PPNR ROAA) (1) • 1.03% Adjusted ROAA and 13.4% Adjusted ROATCE (1) Earnings Noninterest Income Net Interest Income Quarterly Earnings Review Provision • $1.9 million negative loan loss provision expense • $1.0 million negative provision for unfunded commitments (captured in other noninterest expense) • NCOs in 3Q21 of $0.7 million (0.04% annualized NCOs / Avg. Loans) (1) Non-GAAP, see Appendix (2) Non-GAAP, see Appendix, further adjusted for negative provision for unfunded commitments and NMTC amortization |
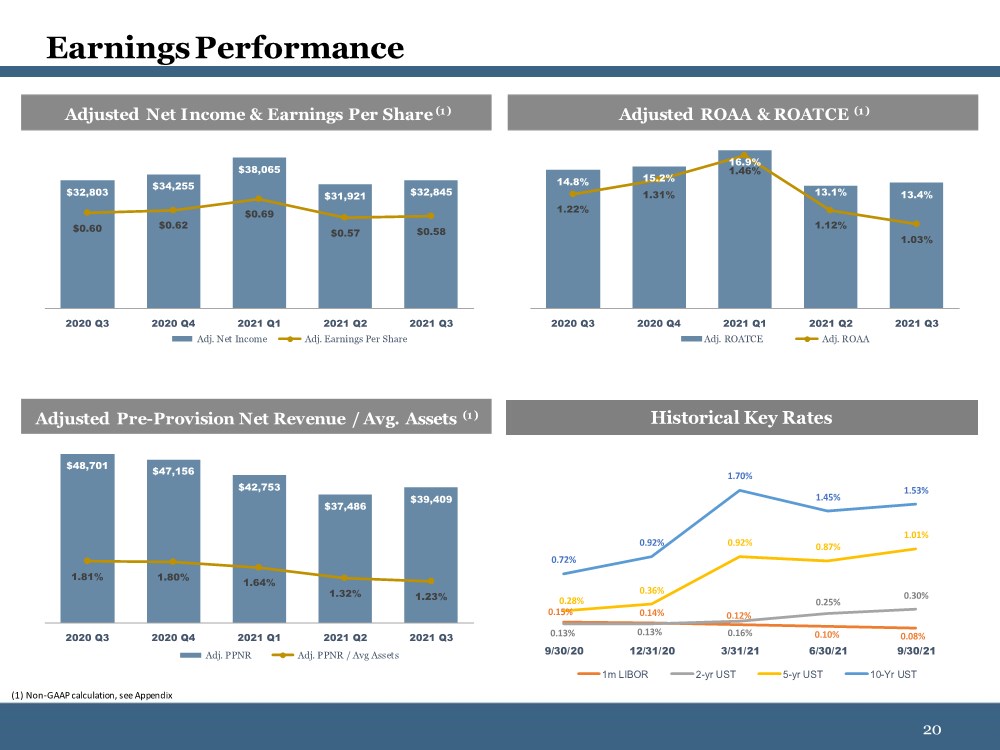
| 20 20 Earnings Performance (1) Non-GAAP calculation, see Appendix Adjusted ROAA & ROATCE (1) Adjusted Pre-Provision Net Revenue / Avg. Assets (1) Adjusted Net Income & Earnings Per Share (1) 14.8% 15.2% 16.9% 13.1% 13.4% 1.22% 1.31% 1.46% 1.12% 1.03% 2020 Q3 2020 Q4 2021 Q1 2021 Q2 2021 Q3 Adj. ROATCE Adj. ROAA $32,803 $34,255 $38,065 $31,921 $32,845 $0.60 $0.62 $0.69 $0.57 $0.58 2020 Q3 2020 Q4 2021 Q1 2021 Q2 2021 Q3 Adj. Net Income Adj. Earnings Per Share $48,701 $47,156 $42,753 $37,486 $39,409 1.81% 1.80% 1.64% 1.32% 1.23% 2020 Q3 2020 Q4 2021 Q1 2021 Q2 2021 Q3 Adj. PPNR Adj. PPNR / Avg Assets Historical Key Rates 0.15% 0.14% 0.12% 0.10% 0.08% 0.13% 0.13% 0.16% 0.25% 0.30% 0.28% 0.36% 0.92% 0.87% 1.01% 0.72% 0.92% 1.70% 1.45% 1.53% 9/30/20 12/31/20 3/31/21 6/30/21 9/30/21 1m LIBOR 2-yr UST 5-yr UST 10-Yr UST |
| 21 21 Net Interest Margin $64,579 $61,705 $61,620 $58,574 $59,090 $64,378 $2,477 $2,618 $2,469 $2,157 $1,726 $1,799 $4,474 $6,068 $9,502 $4,763 $4,306 $5,175 $71,530 $70,391 $73,591 $65,494 $65,121 $71,353 2020 Q2 2020 Q3 2020 Q4 2021 Q1 2021 Q2 2021 Q3 Net Interest Income Accretion PPP Income (Net fees + coupon) $ in thousands Net Interest Margin Bridge Net Interest Margin 3.26% 3.41% 3.03% 2.77% 2.65% 0.42% 0.37% 0.33% 0.29% 0.25% 2.86% 3.06% 2.72% 2.50% 2.41% 0.11% 0.10% 0.09% 0.06% 0.06% 2.82% 2.85% 2.66% 2.45% 2.30% 2020 Q3 2020 Q4 2021 Q1 2021 Q2 2021 Q3 Earning Assets Cost of Funds NIM Accretion Ex-PPP NIM(2) Net Interest Income(1) 2.41% - Existing loans amortize and paydown at higher rates than new loan production Rate Roll - Full quarter of Glenview State Bank drove the 9 bps reduction in NIM compared to 2Q21 Contribution from GSB + New loan volume yields in 3Q21 were 17 bps higher than in 2Q21, while net new funding yields (inclusive of line utilization changes) were 6 bps higher New Loan Volume Yields + PPP contribution increased $0.9 million mainly due to full forgiveness of loans as average balances declined to $292mm from $496mm in 2Q21 PPP Income + Portfolio yield stabilized in 3Q21 (1.33% v. 1.36% in 2Q21) while $480 million of deposit-driven excess liquidity growth pressured NIM Securities Portfolio & Excess Liquidity (1) Tax-Equivalent adjusted amounts (2) Ex-PPP NIM removes the balance of PPP loans and associated income as well as the equivalent amount of self-funding noninterest bearing deposits |

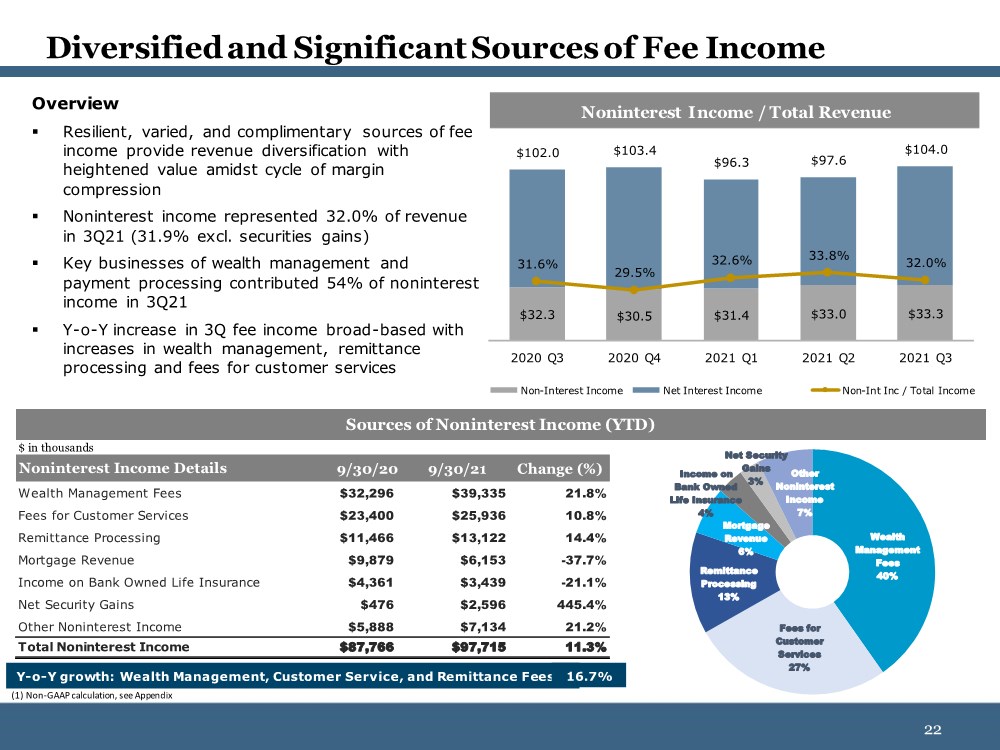
| 22 22 Overview ▪ Resilient, varied, and complimentary sources of fee income provide revenue diversification with heightened value amidst cycle of margin compression ▪ Noninterest income represented 32.0% of revenue in 3Q21 (31.9% excl. securities gains) ▪ Key businesses of wealth management and payment processing contributed 54% of noninterest income in 3Q21 ▪ Y-o-Y increase in 3Q fee income broad-based with increases in wealth management, remittance processing and fees for customer services Diversified and Significant Sources of Fee Income (1) Non-GAAP calculation, see Appendix Noninterest Income / Total Revenue $ in thousands 9/30/20 9/30/21 Change (%) Wealth Management Fees $32,296 $39,335 21.8% Fees for Customer Services $23,400 $25,936 10.8% Remittance Processing $11,466 $13,122 14.4% Mortgage Revenue $9,879 $6,153 -37.7% Income on Bank Owned Life Insurance $4,361 $3,439 -21.1% Net Security Gains $476 $2,596 445.4% Other Noninterest Income $5,888 $7,134 21.2% Total Noninterest Income $87,766 $97,715 11.3% Noninterest Income Details Sources of Noninterest Income (YTD) Wealth Management Fees 40% Fees for Customer Services 27% Remittance Processing 13% Mortgage Revenue 6% Income on Bank Owned Life Insurance 4% Net Security Gains 3% Other Noninterest Income 7% Y-o-Y growth: Wealth Management, Customer Service, and Remittance Fees 16.7% $32.3 $30.5 $31.4 $33.0 $33.3 $102.0 $103.4 $96.3 $97.6 $104.0 31.6% 29.5% 32.6% 33.8% 32.0% 2020 Q3 2020 Q4 2021 Q1 2021 Q2 2021 Q3 Non-Interest Income Net Interest Income Non-Int Inc / Total Income |
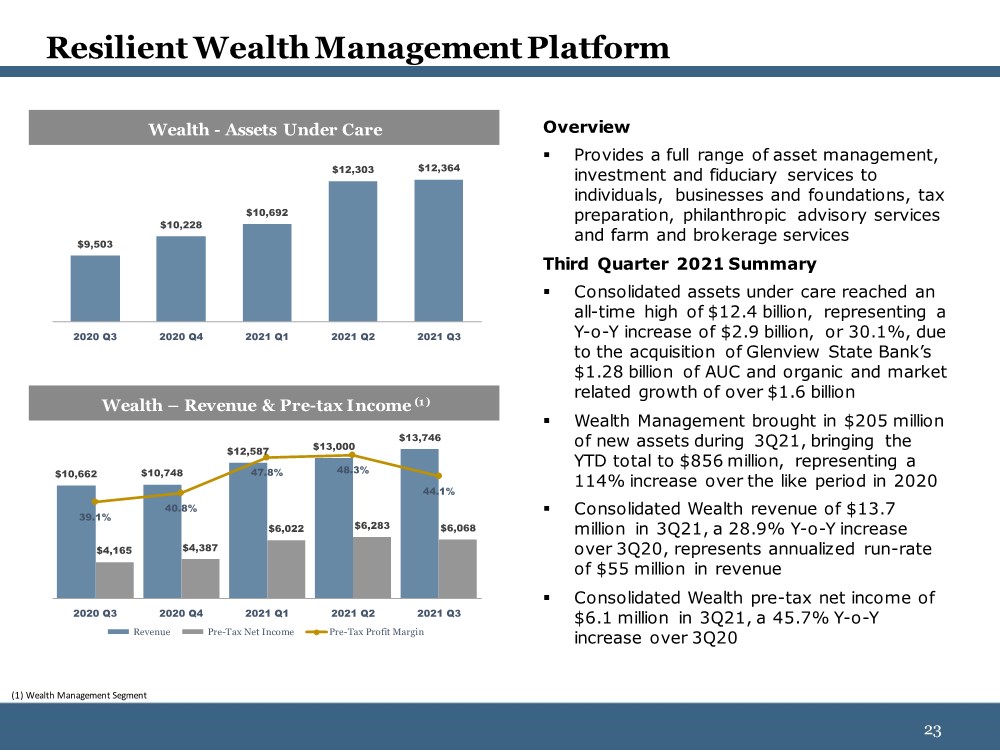
| 23 23 Resilient Wealth Management Platform Overview ▪ Provides a full range of asset management, investment and fiduciary services to individuals, businesses and foundations, tax preparation, philanthropic advisory services and farm and brokerage services Third Quarter 2021 Summary ▪ Consolidated assets under care reached an all-time high of $12.4 billion, representing a Y-o-Y increase of $2.9 billion, or 30.1%, due to the acquisition of Glenview State Bank’s $1.28 billion of AUC and organic and market related growth of over $1.6 billion ▪ Wealth Management brought in $205 million of new assets during 3Q21, bringing the YTD total to $856 million, representing a 114% increase over the like period in 2020 ▪ Consolidated Wealth revenue of $13.7 million in 3Q21, a 28.9% Y-o-Y increase over 3Q20, represents annualized run-rate of $55 million in revenue ▪ Consolidated Wealth pre-tax net income of $6.1 million in 3Q21, a 45.7% Y-o-Y increase over 3Q20 (1) Wealth Management Segment Wealth - Assets Under Care $9,503 $10,228 $10,692 $12,303 $12,364 2020 Q3 2020 Q4 2021 Q1 2021 Q2 2021 Q3 Wealth – Revenue & Pre-tax Income (1) $10,662 $10,748 $12,587 $13,000 $13,746 $4,165 $4,387 $6,022 $6,283 $6,068 39.1% 40.8% 47.8% 48.3% 44.1% 2020 Q3 2020 Q4 2021 Q1 2021 Q2 2021 Q3 Revenue Pre-Tax Net Income Pre-Tax Profit Margin |
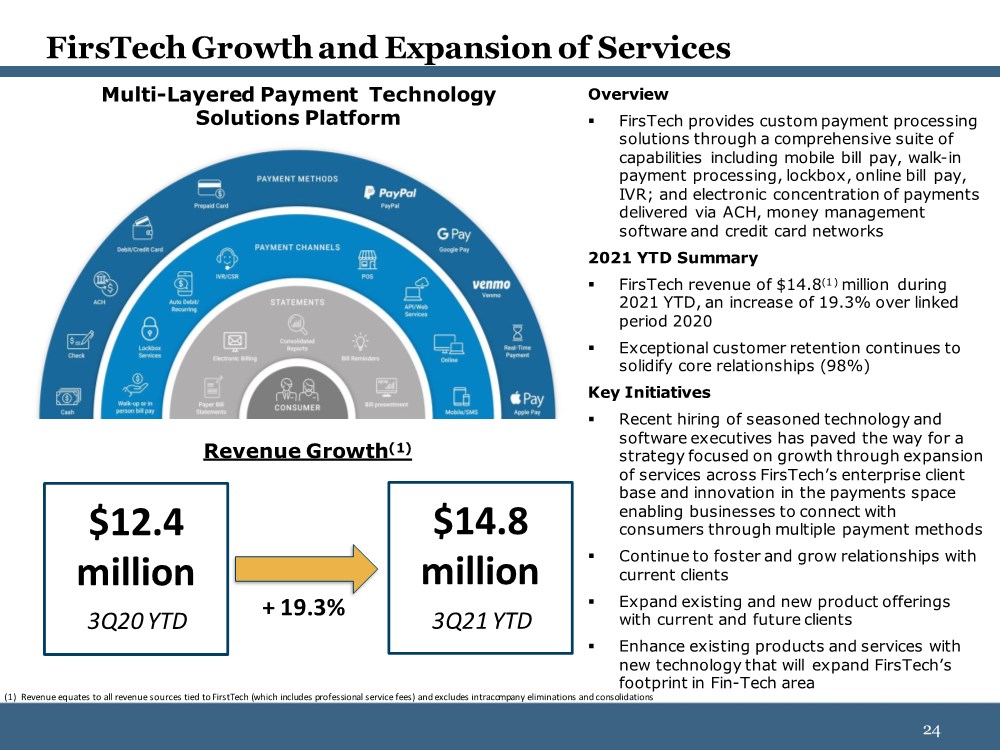
| 24 24 FirsTech Growth and Expansion of Services Overview ▪ FirsTech provides custom payment processing solutions through a comprehensive suite of capabilities including mobile bill pay, walk-in payment processing, lockbox, online bill pay, IVR; and electronic concentration of payments delivered via ACH, money management software and credit card networks 2021 YTD Summary ▪ FirsTech revenue of $14.8(1 ) million during 2021 YTD, an increase of 19.3% over linked period 2020 ▪ Exceptional customer retention continues to solidify core relationships (98%) Key Initiatives ▪ Recent hiring of seasoned technology and software executives has paved the way for a strategy focused on growth through expansion of services across FirsTech’s enterprise client base and innovation in the payments space enabling businesses to connect with consumers through multiple payment methods ▪ Continue to foster and grow relationships with current clients ▪ Expand existing and new product offerings with current and future clients ▪ Enhance existing products and services with new technology that will expand FirsTech’s footprint in Fin-Tech area Revenue Growth(1) Multi-Layered Payment Technology Solutions Platform (1) Revenue equates to all revenue sources tied to FirstTech (which includes professional service fees) and excludes intraco mpany eliminations and consolidations 3Q20 YTD 3Q21 YTD $12.4 million $14.8 million + 19.3% |
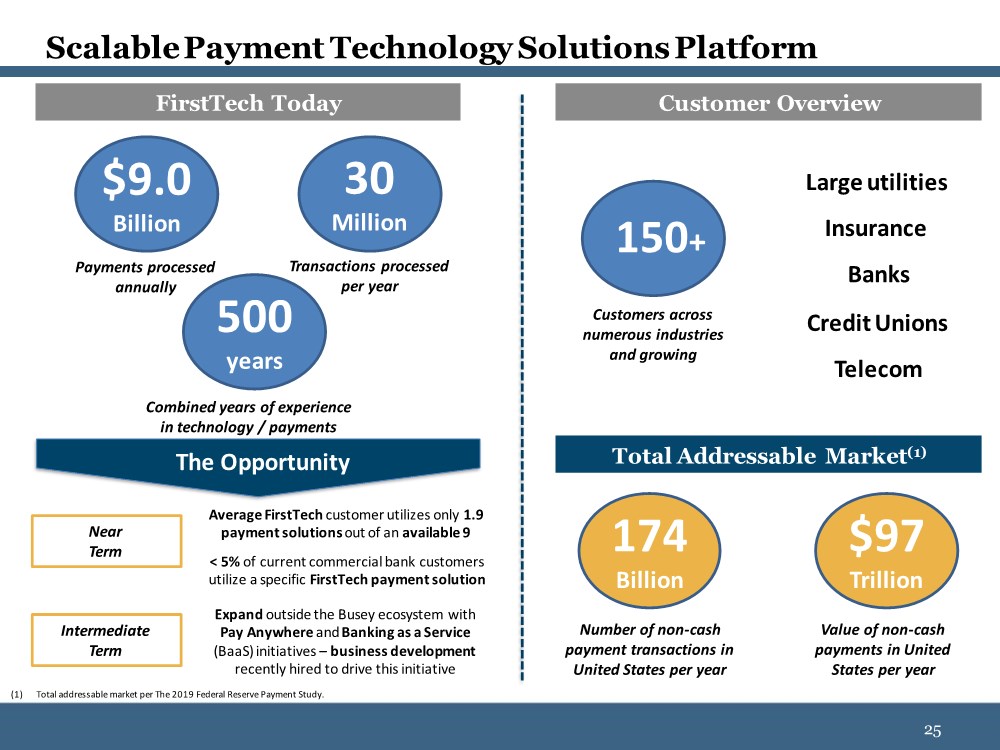
| 25 25 Scalable Payment Technology Solutions Platform Customer Overview FirstTech Today Total Addressable Market(1) (1) Total addressable market per The 2019 Federal Reserve Payment Study. 500 years Combined years of experience in technology / payments Transactions processed per year 30 Million $9.0 Billion Payments processed annually Customers across numerous industries and growing 150+ Large utilities Insurance Banks Credit Unions Number of non-cash payment transactions in United States per year 174 Billion Value of non-cash payments in United States per year $97 Trillion The Opportunity Telecom Average FirstTech customer utilizes only 1.9 payment solutions out of an available 9 < 5% of current commercial bank customers utilize a specific FirstTech payment solution Near Term Intermediate Term Expand outside the Busey ecosystem with Pay Anywhere and Banking as a Service (BaaS) initiatives – business development recently hired to drive this initiative |
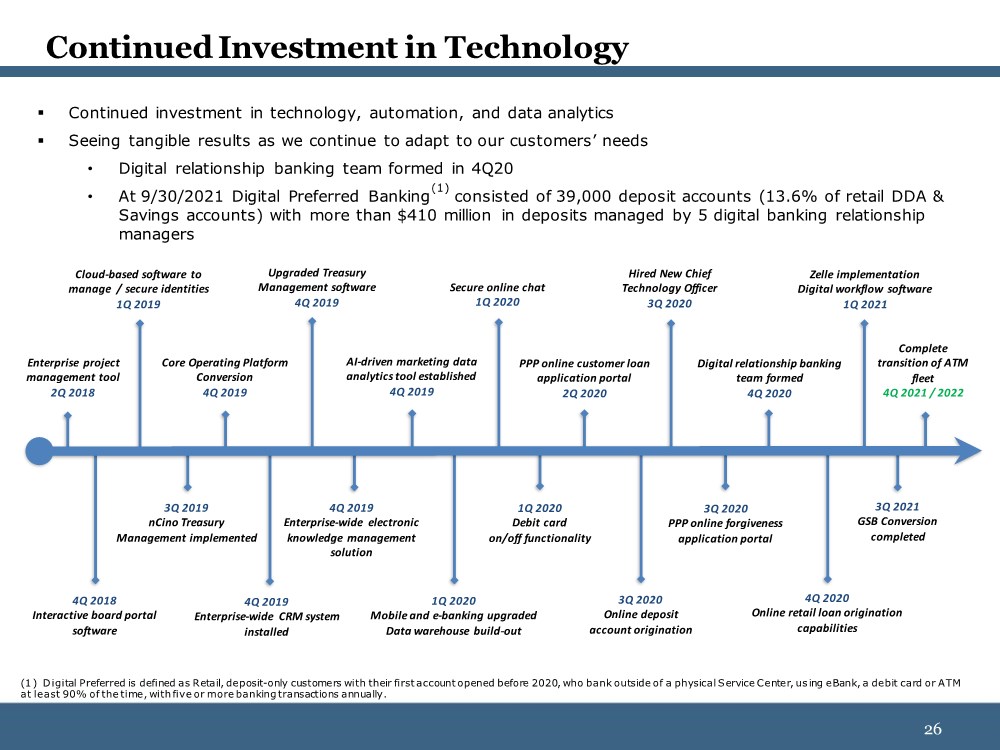
| 26 26 Continued Investment in Technology Enterprise project management tool 2Q 2018 4Q 2018 Interactive board portal software Cloud-based software to manage / secure identities 1Q 2019 3Q 2019 nCino Treasury Management implemented Core Operating Platform Conversion 4Q 2019 4Q 2019 Enterprise-wide CRM system installed Upgraded Treasury Management software 4Q 2019 4Q 2019 Enterprise-wide electronic knowledge management solution AI-driven marketing data analytics tool established 4Q 2019 1Q 2020 Mobile and e-banking upgraded Data warehouse build-out Secure online chat 1Q 2020 1Q 2020 Debit card on/off functionality 3Q 2020 Online deposit account origination Hired New Chief Technology Officer 3Q 2020 Digital relationship banking team formed 4Q 2020 4Q 2020 Online retail loan origination capabilities Zelle implementation Digital workflow software 1Q 2021 3Q 2021 GSB Conversion completed PPP online customer loan application portal 2Q 2020 Complete transition of ATM fleet 4Q 2021 / 2022 3Q 2020 PPP online forgiveness application portal ▪ Continued investment in technology, automation, and data analytics ▪ Seeing tangible results as we continue to adapt to our customers’ needs • Digital relationship banking team formed in 4Q20 • At 9/30/2021 Digital Preferred Banking(1) consisted of 39,000 deposit accounts (13.6% of retail DDA & Savings accounts) with more than $410 million in deposits managed by 5 digital banking relationship managers (1 ) Digital Preferred is defined as Retail, deposit-only customers with their first account opened before 2020, who bank outside of a physical Service Center, us ing eBank, a debit card or ATM at least 90% of the time, with five or more banking transactions annually. |
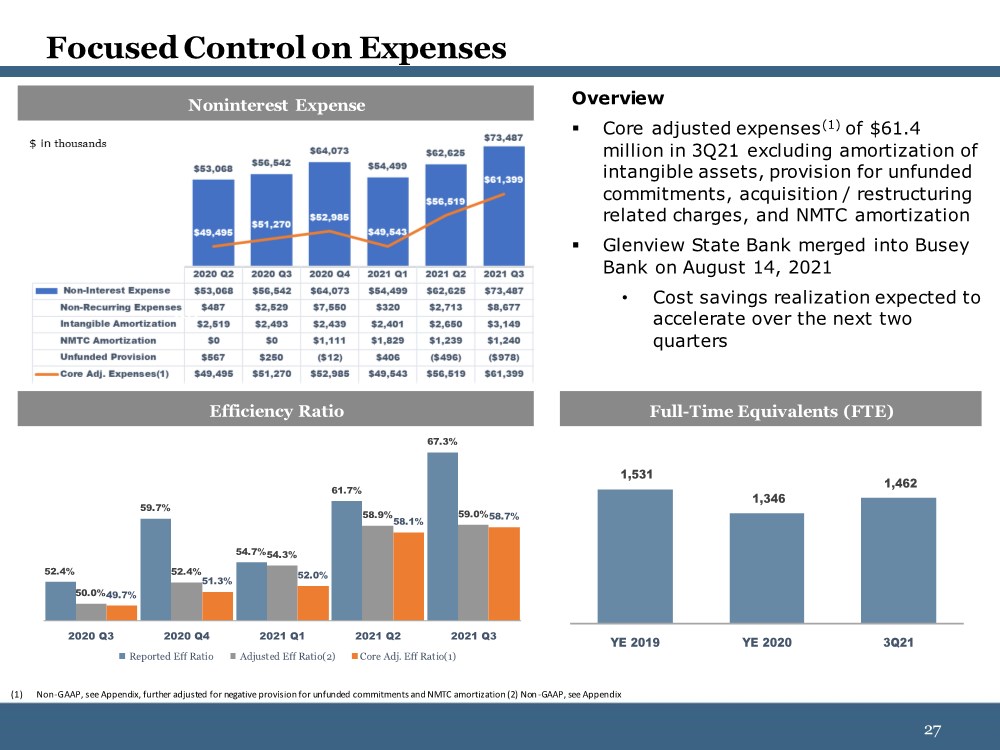
| 27 27 Focused Control on Expenses (1) Non-GAAP, see Appendix, further adjusted for negative provision for unfunded commitments and NMTC amortization (2) Non-GAAP, see Appendix Overview ▪ Core adjusted expenses(1) of $61.4 million in 3Q21 excluding amortization of intangible assets, provision for unfunded commitments, acquisition / restructuring related charges, and NMTC amortization ▪ Glenview State Bank merged into Busey Bank on August 14, 2021 • Cost savings realization expected to accelerate over the next two quarters Noninterest Expense Efficiency Ratio 52.4% 59.7% 54.7% 61.7% 67.3% 50.0% 52.4% 54.3% 58.9% 59.0% 49.7% 51.3% 52.0% 58.1% 58.7% 2020 Q3 2020 Q4 2021 Q1 2021 Q2 2021 Q3 Reported Eff Ratio Adjusted Eff Ratio(2) Core Adj. Eff Ratio(1) 1,531 1,346 1,462 YE 2019 YE 2020 3Q21 Full-Time Equivalents (FTE) |
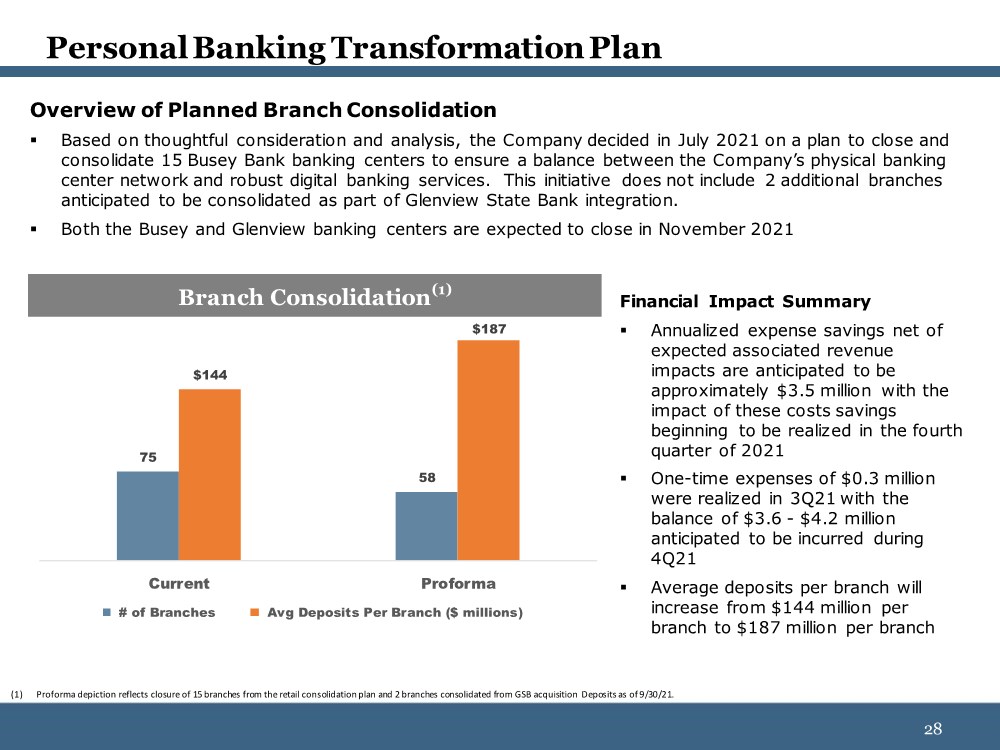
| 28 28 Personal Banking Transformation Plan Financial Impact Summary ▪ Annualized expense savings net of expected associated revenue impacts are anticipated to be approximately $3.5 million with the impact of these costs savings beginning to be realized in the fourth quarter of 2021 ▪ One-time expenses of $0.3 million were realized in 3Q21 with the balance of $3.6 - $4.2 million anticipated to be incurred during 4Q21 ▪ Average deposits per branch will increase from $144 million per branch to $187 million per branch Overview of Planned Branch Consolidation ▪ Based on thoughtful consideration and analysis, the Company decided in July 2021 on a plan to close and consolidate 15 Busey Bank banking centers to ensure a balance between the Company’s physical banking center network and robust digital banking services. This initiative does not include 2 additional branches anticipated to be consolidated as part of Glenview State Bank integration. ▪ Both the Busey and Glenview banking centers are expected to close in November 2021 (1) Proforma depiction reflects closure of 15 branches from the retail consolidation plan and 2 branches consolidated from GSB acquisition Deposits as of 9/30/21. Branch Consolidation(1) 75 58 $144 $187 Current Proforma # of Branches Avg Deposits Per Branch ($ millions) |
| 29 29 APPENDIX |
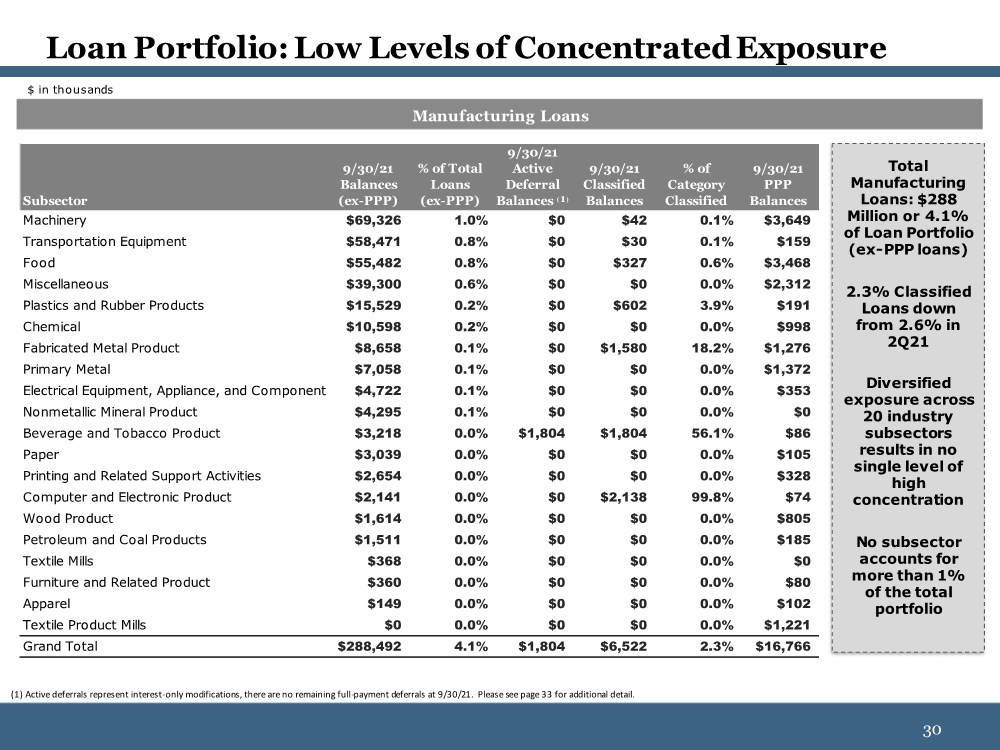
| 30 30 Loan Portfolio: Low Levels of Concentrated Exposure Manufacturing Loans Total Manufacturing Loans: $288 Million or 4.1% of Loan Portfolio (ex-PPP loans) 2.3% Classified Loans down from 2.6% in 2Q21 Diversified exposure across 20 industry subsectors results in no single level of high concentration No subsector accounts for more than 1% of the total portfolio $ in thousands (1) Active deferrals represent interest-only modifications, there are no remaining full-payment deferrals at 9/30/21. Please see page 33 for additional detail. Subsector 9/30/21 Balances (ex-PPP) % of Total Loans (ex-PPP) 9/30/21 Active Deferral Balances ⁽¹⁾ 9/30/21 Classified Balances % of Category Classified 9/30/21 PPP Balances Machinery $69,326 1.0% $0 $42 0.1% $3,649 Transportation Equipment $58,471 0.8% $0 $30 0.1% $159 Food $55,482 0.8% $0 $327 0.6% $3,468 Miscellaneous $39,300 0.6% $0 $0 0.0% $2,312 Plastics and Rubber Products $15,529 0.2% $0 $602 3.9% $191 Chemical $10,598 0.2% $0 $0 0.0% $998 Fabricated Metal Product $8,658 0.1% $0 $1,580 18.2% $1,276 Primary Metal $7,058 0.1% $0 $0 0.0% $1,372 Electrical Equipment, Appliance, and Component $4,722 0.1% $0 $0 0.0% $353 Nonmetallic Mineral Product $4,295 0.1% $0 $0 0.0% $0 Beverage and Tobacco Product $3,218 0.0% $1,804 $1,804 56.1% $86 Paper $3,039 0.0% $0 $0 0.0% $105 Printing and Related Support Activities $2,654 0.0% $0 $0 0.0% $328 Computer and Electronic Product $2,141 0.0% $0 $2,138 99.8% $74 Wood Product $1,614 0.0% $0 $0 0.0% $805 Petroleum and Coal Products $1,511 0.0% $0 $0 0.0% $185 Textile Mills $368 0.0% $0 $0 0.0% $0 Furniture and Related Product $360 0.0% $0 $0 0.0% $80 Apparel $149 0.0% $0 $0 0.0% $102 Textile Product Mills $0 0.0% $0 $0 0.0% $1,221 Grand Total $288,492 4.1% $1,804 $6,522 2.3% $16,766 |
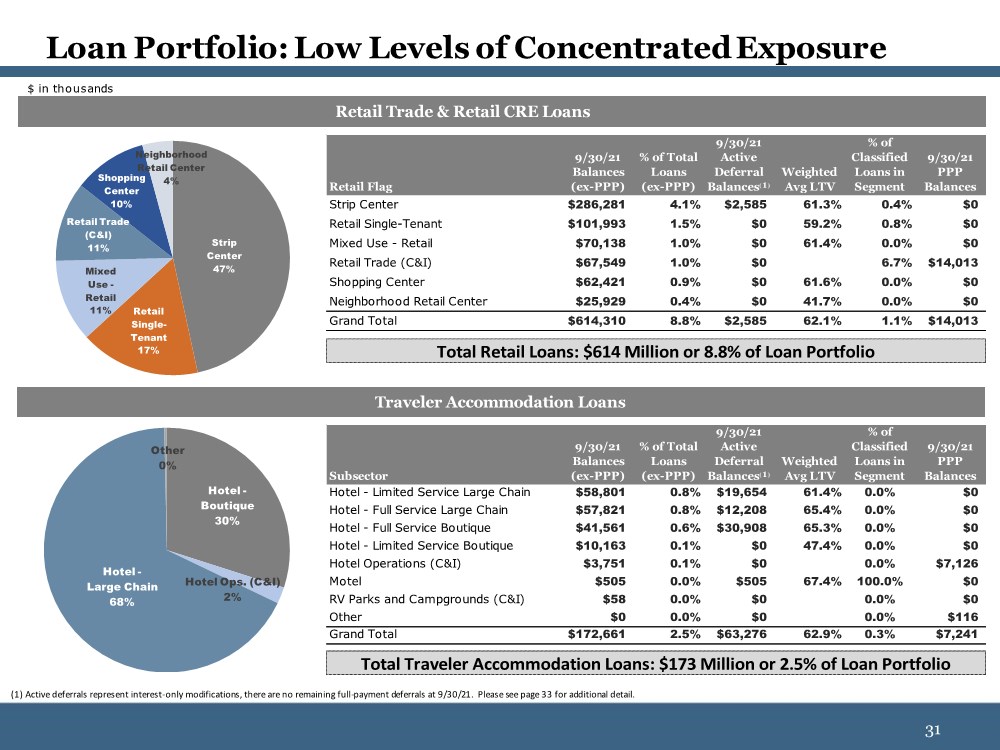
| 31 31 Loan Portfolio: Low Levels of Concentrated Exposure $ in thousands Retail Trade & Retail CRE Loans Traveler Accommodation Loans Strip Center 47% Retail Single- Tenant 17% Mixed Use - Retail 11% Retail Trade (C&I) 11% Shopping Center 10% Neighborhood Retail Center 4% Retail Flag 9/30/21 Balances (ex-PPP) % of Total Loans (ex-PPP) 9/30/21 Active Deferral Balances⁽¹⁾ Weighted Avg LTV % of Classified Loans in Segment 9/30/21 PPP Balances Strip Center $286,281 4.1% $2,585 61.3% 0.4% $0 Retail Single-Tenant $101,993 1.5% $0 59.2% 0.8% $0 Mixed Use - Retail $70,138 1.0% $0 61.4% 0.0% $0 Retail Trade (C&I) $67,549 1.0% $0 6.7% $14,013 Shopping Center $62,421 0.9% $0 61.6% 0.0% $0 Neighborhood Retail Center $25,929 0.4% $0 41.7% 0.0% $0 Grand Total $614,310 8.8% $2,585 62.1% 1.1% $14,013 Hotel - Boutique 30% Hotel Ops. (C&I) 2% Hotel - Large Chain 68% Other 0% Total Retail Loans: $614 Million or 8.8% of Loan Portfolio Subsector 9/30/21 Balances (ex-PPP) % of Total Loans (ex-PPP) 9/30/21 Active Deferral Balances⁽¹⁾ Weighted Avg LTV % of Classified Loans in Segment 9/30/21 PPP Balances Hotel - Limited Service Large Chain $58,801 0.8% $19,654 61.4% 0.0% $0 Hotel - Full Service Large Chain $57,821 0.8% $12,208 65.4% 0.0% $0 Hotel - Full Service Boutique $41,561 0.6% $30,908 65.3% 0.0% $0 Hotel - Limited Service Boutique $10,163 0.1% $0 47.4% 0.0% $0 Hotel Operations (C&I) $3,751 0.1% $0 0.0% $7,126 Motel $505 0.0% $505 67.4% 100.0% $0 RV Parks and Campgrounds (C&I) $58 0.0% $0 0.0% $0 Other $0 0.0% $0 0.0% $116 Grand Total $172,661 2.5% $63,276 62.9% 0.3% $7,241 Total Traveler Accommodation Loans: $173 Million or 2.5% of Loan Portfolio (1) Active deferrals represent interest-only modifications, there are no remaining full-payment deferrals at 9/30/21. Please see page 33 for additional detail. |
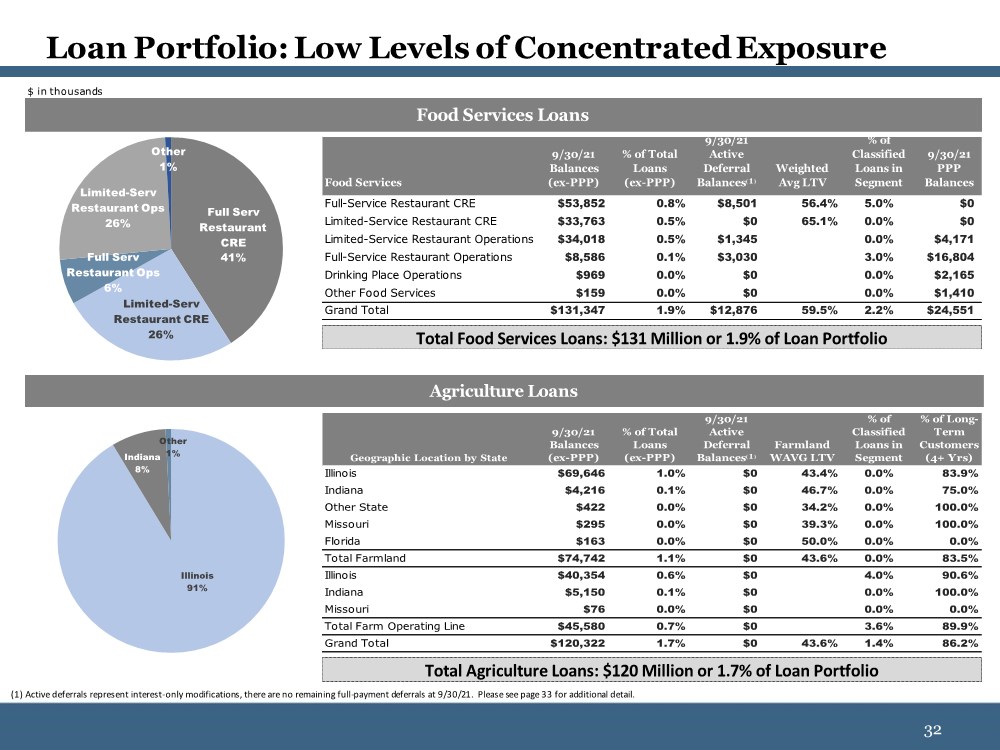
| 32 32 Loan Portfolio: Low Levels of Concentrated Exposure $ in thousands Agriculture Loans Food Services Loans Full Serv Restaurant CRE 41% Limited-Serv Restaurant CRE 26% Full Serv Restaurant Ops 6% Limited-Serv Restaurant Ops 26% Other 1% Food Services 9/30/21 Balances (ex-PPP) % of Total Loans (ex-PPP) 9/30/21 Active Deferral Balances⁽¹⁾ Weighted Avg LTV % of Classified Loans in Segment 9/30/21 PPP Balances Full-Service Restaurant CRE $53,852 0.8% $8,501 56.4% 5.0% $0 Limited-Service Restaurant CRE $33,763 0.5% $0 65.1% 0.0% $0 Limited-Service Restaurant Operations $34,018 0.5% $1,345 0.0% $4,171 Full-Service Restaurant Operations $8,586 0.1% $3,030 3.0% $16,804 Drinking Place Operations $969 0.0% $0 0.0% $2,165 Other Food Services $159 0.0% $0 0.0% $1,410 Grand Total $131,347 1.9% $12,876 59.5% 2.2% $24,551 Illinois 91% Indiana 8% Other 1% Total Food Services Loans: $131 Million or 1.9% of Loan Portfolio Geographic Location by State 9/30/21 Balances (ex-PPP) % of Total Loans (ex-PPP) 9/30/21 Active Deferral Balances⁽¹⁾ Farmland WAVG LTV % of Classified Loans in Segment % of Long- Term Customers (4+ Yrs) Illinois $69,646 1.0% $0 43.4% 0.0% 83.9% Indiana $4,216 0.1% $0 46.7% 0.0% 75.0% Other State $422 0.0% $0 34.2% 0.0% 100.0% Missouri $295 0.0% $0 39.3% 0.0% 100.0% Florida $163 0.0% $0 50.0% 0.0% 0.0% Total Farmland $74,742 1.1% $0 43.6% 0.0% 83.5% Illinois $40,354 0.6% $0 4.0% 90.6% Indiana $5,150 0.1% $0 0.0% 100.0% Missouri $76 0.0% $0 0.0% 0.0% Total Farm Operating Line $45,580 0.7% $0 3.6% 89.9% Grand Total $120,322 1.7% $0 43.6% 1.4% 86.2% Total Agriculture Loans: $120 Million or 1.7% of Loan Portfolio (1) Active deferrals represent interest-only modifications, there are no remaining full-payment deferrals at 9/30/21. Please see page 33 for additional detail. |
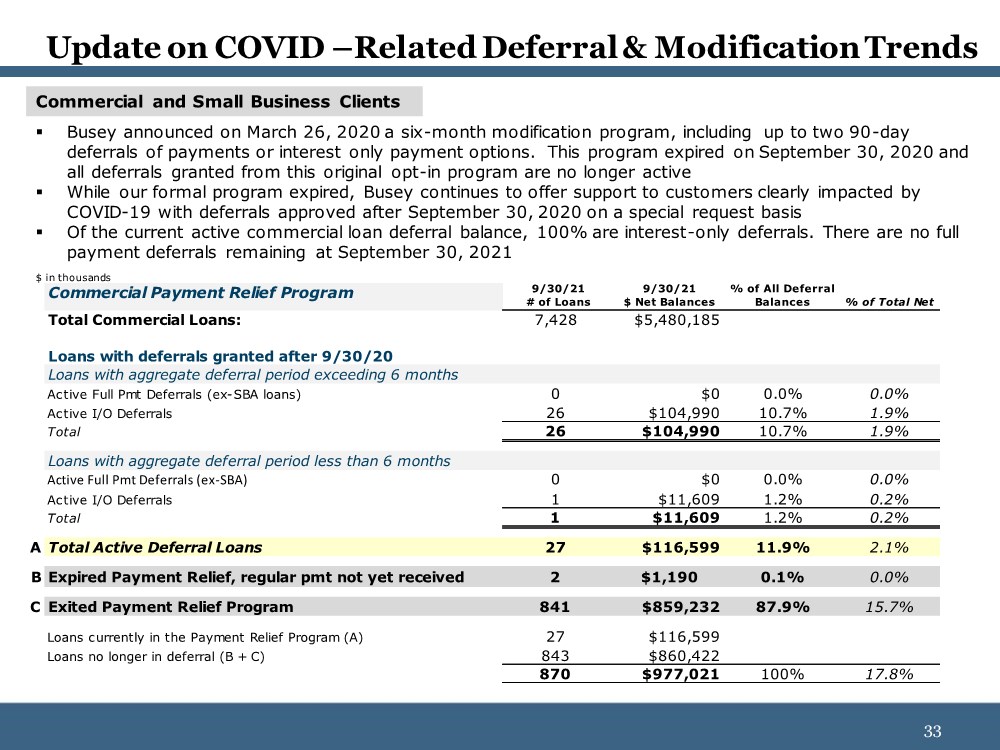
| 33 33 Update on COVID –Related Deferral & Modification Trends Commercial and Small Business Clients ▪ Busey announced on March 26, 2020 a six-month modification program, including up to two 90-day deferrals of payments or interest only payment options. This program expired on September 30, 2020 and all deferrals granted from this original opt-in program are no longer active ▪ While our formal program expired, Busey continues to offer support to customers clearly impacted by COVID-19 with deferrals approved after September 30, 2020 on a special request basis ▪ Of the current active commercial loan deferral balance, 100% are interest-only deferrals. There are no full payment deferrals remaining at September 30, 2021 Commercial Payment Relief Program 9/30/21 # of Loans 9/30/21 $ Net Balances % of All Deferral Balances % of Total Net Total Commercial Loans: 7,428 $5,480,185 Loans with deferrals granted after 9/30/20 Loans with aggregate deferral period exceeding 6 months Active Full Pmt Deferrals (ex-SBA loans) 0 $0 0.0% 0.0% Active I/O Deferrals 26 $104,990 10.7% 1.9% Total 26 $104,990 10.7% 1.9% Loans with aggregate deferral period less than 6 months Active Full Pmt Deferrals (ex-SBA) 0 $0 0.0% 0.0% Active I/O Deferrals 1 $11,609 1.2% 0.2% Total 1 $11,609 1.2% 0.2% A Total Active Deferral Loans 27 $116,599 11.9% 2.1% B Expired Payment Relief, regular pmt not yet received 2 $1,190 0.1% 0.0% C Exited Payment Relief Program 841 $859,232 87.9% 15.7% Loans currently in the Payment Relief Program (A) 27 $116,599 Loans no longer in deferral (B + C) 843 $860,422 870 $977,021 100% 17.8% $ in thousands |
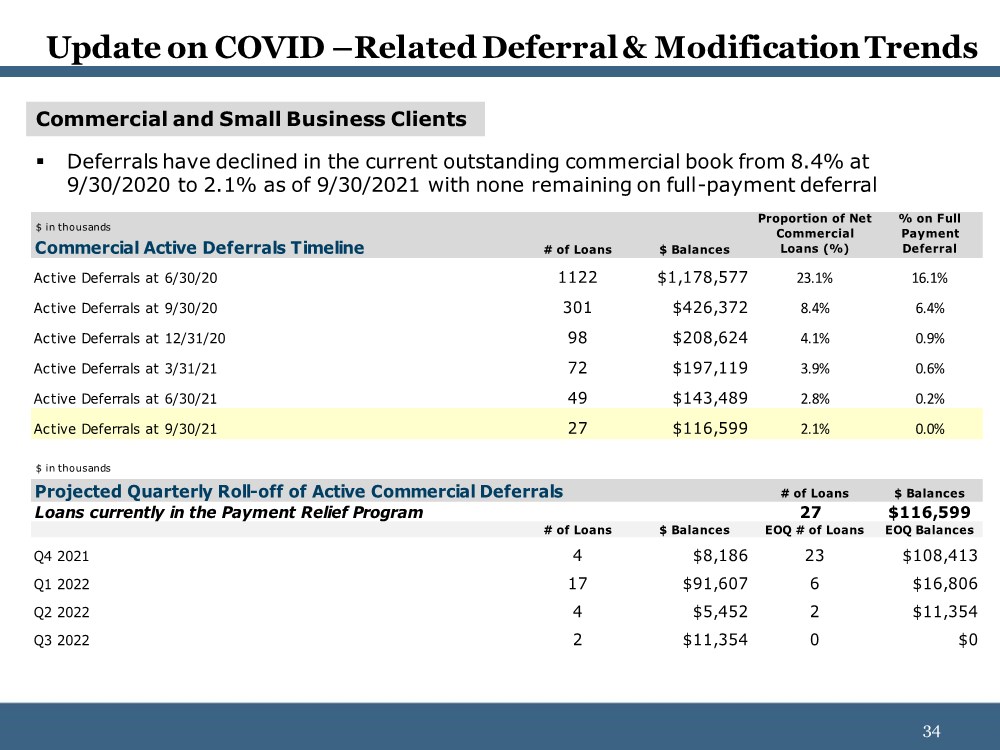
| 34 34 Update on COVID –Related Deferral & Modification Trends Commercial and Small Business Clients ▪ Deferrals have declined in the current outstanding commercial book from 8.4% at 9/30/2020 to 2.1% as of 9/30/2021 with none remaining on full-payment deferral Commercial Active Deferrals Timeline # of Loans $ Balances Proportion of Net Commercial Loans (%) % on Full Payment Deferral Active Deferrals at 6/30/20 1122 $1,178,577 23.1% 16.1% Active Deferrals at 9/30/20 301 $426,372 8.4% 6.4% Active Deferrals at 12/31/20 98 $208,624 4.1% 0.9% Active Deferrals at 3/31/21 72 $197,119 3.9% 0.6% Active Deferrals at 6/30/21 49 $143,489 2.8% 0.2% Active Deferrals at 9/30/21 27 $116,599 2.1% 0.0% Projected Quarterly Roll-off of Active Commercial Deferrals # of Loans $ Balances Loans currently in the Payment Relief Program 27 $116,599 # of Loans $ Balances EOQ # of Loans EOQ Balances Q4 2021 4 $8,186 23 $108,413 Q1 2022 17 $91,607 6 $16,806 Q2 2022 4 $5,452 2 $11,354 Q3 2022 2 $11,354 0 $0 $ in thousands $ in thousands |
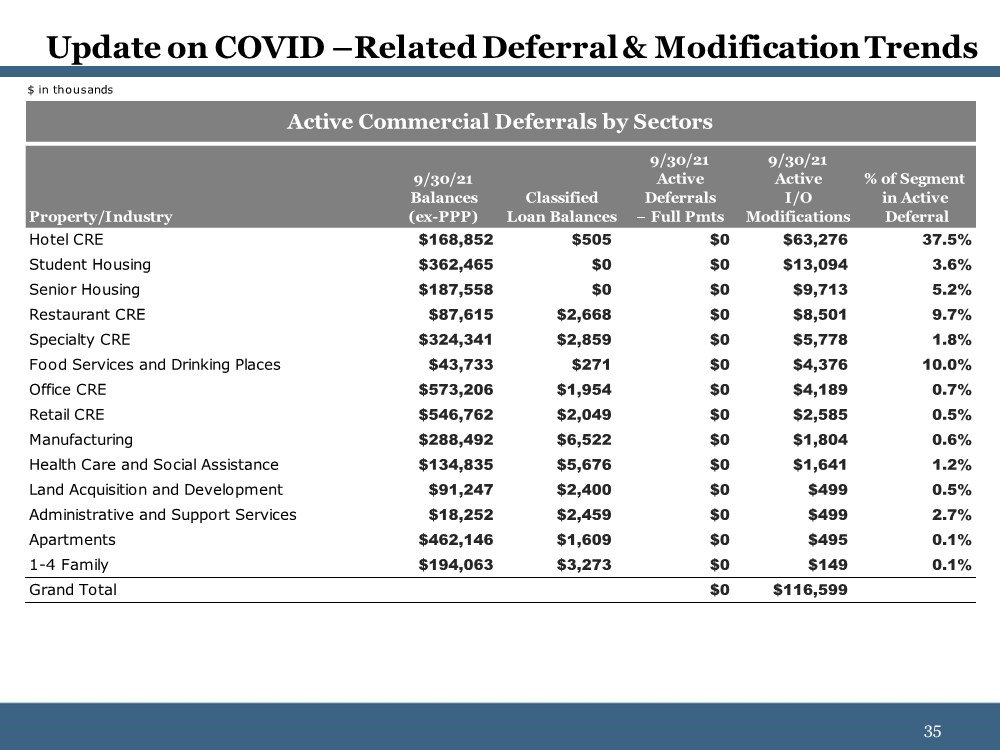
| 35 35 Update on COVID –Related Deferral & Modification Trends $ in thousands Property/Industry 9/30/21 Balances (ex-PPP) Classified Loan Balances 9/30/21 Active Deferrals − Full Pmts 9/30/21 Active I/O Modifications % of Segment in Active Deferral Hotel CRE $168,852 $505 $0 $63,276 37.5% Student Housing $362,465 $0 $0 $13,094 3.6% Senior Housing $187,558 $0 $0 $9,713 5.2% Restaurant CRE $87,615 $2,668 $0 $8,501 9.7% Specialty CRE $324,341 $2,859 $0 $5,778 1.8% Food Services and Drinking Places $43,733 $271 $0 $4,376 10.0% Office CRE $573,206 $1,954 $0 $4,189 0.7% Retail CRE $546,762 $2,049 $0 $2,585 0.5% Manufacturing $288,492 $6,522 $0 $1,804 0.6% Health Care and Social Assistance $134,835 $5,676 $0 $1,641 1.2% Land Acquisition and Development $91,247 $2,400 $0 $499 0.5% Administrative and Support Services $18,252 $2,459 $0 $499 2.7% Apartments $462,146 $1,609 $0 $495 0.1% 1-4 Family $194,063 $3,273 $0 $149 0.1% Grand Total $0 $116,599 Active Commercial Deferrals by Sectors |
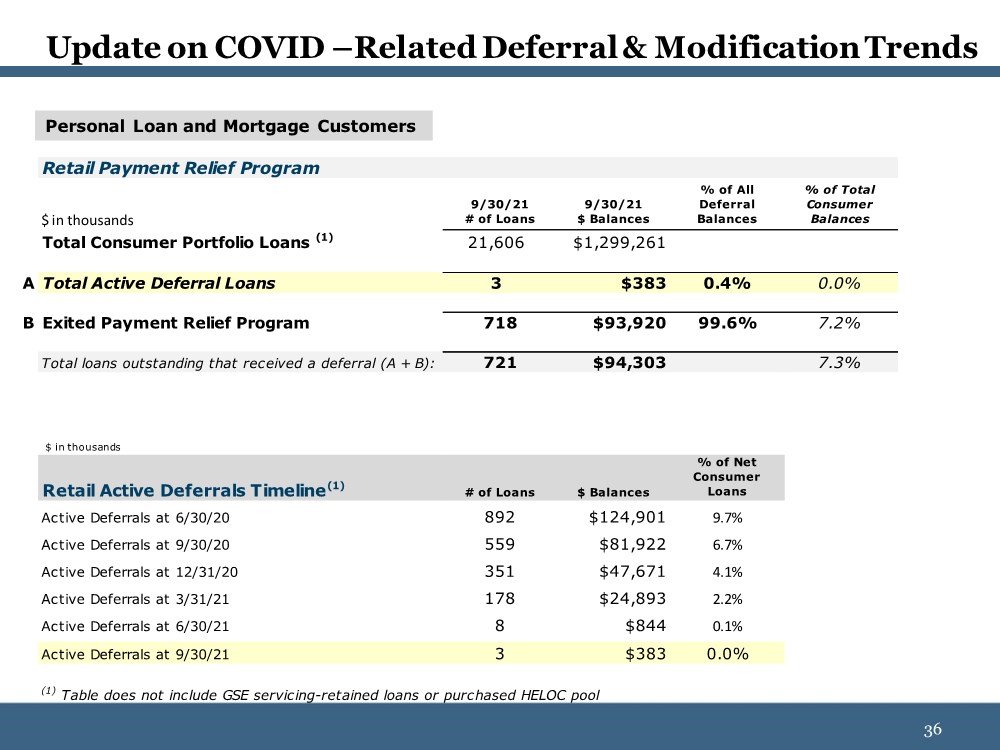
| 36 36 Update on COVID –Related Deferral & Modification Trends Personal Loan and Mortgage Customers Retail Payment Relief Program $ in thousands 9/30/21 # of Loans 9/30/21 $ Balances % of All Deferral Balances % of Total Consumer Balances Total Consumer Portfolio Loans (1) 21,606 $1,299,261 A Total Active Deferral Loans 3 $383 0.4% 0.0% B Exited Payment Relief Program 718 $93,920 99.6% 7.2% Total loans outstanding that received a deferral (A + B): 721 $94,303 7.3% Retail Active Deferrals Timeline(1) # of Loans $ Balances % of Net Consumer Loans Active Deferrals at 6/30/20 892 $124,901 9.7% Active Deferrals at 9/30/20 559 $81,922 6.7% Active Deferrals at 12/31/20 351 $47,671 4.1% Active Deferrals at 3/31/21 178 $24,893 2.2% Active Deferrals at 6/30/21 8 $844 0.1% Active Deferrals at 9/30/21 3 $383 0.0% (1) Table does not include GSE servicing-retained loans or purchased HELOC pool $ in thousands |
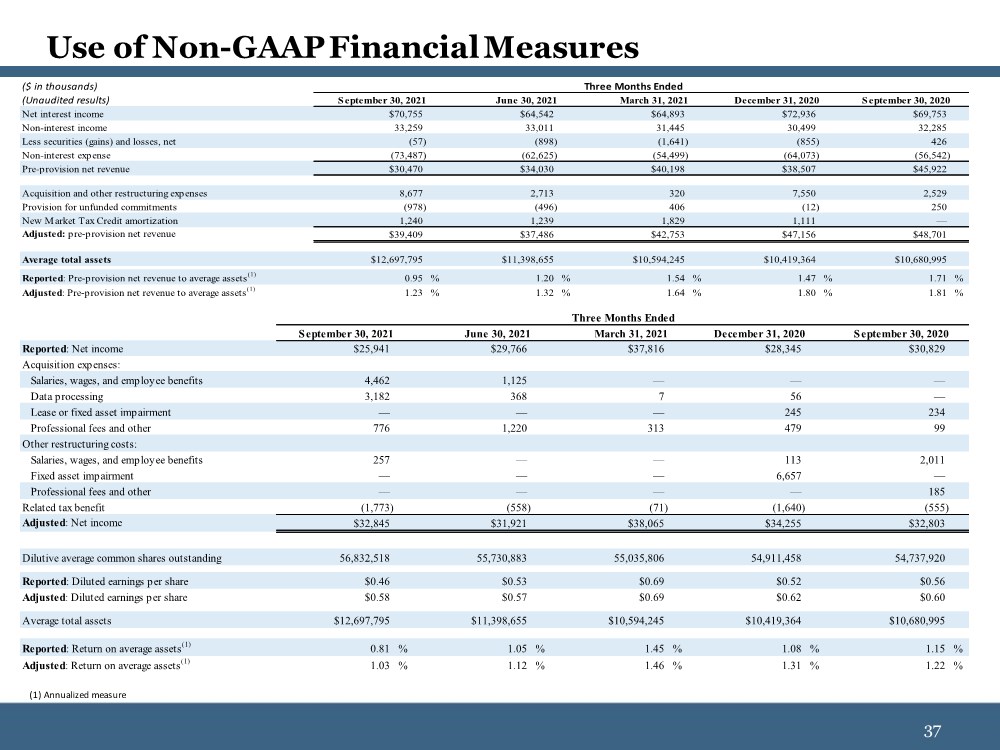
| 37 37 Use of Non-GAAP Financial Measures (1) Annualized measure ($ in thousands) (Unaudited results) September 30, 2021 June 30, 2021 March 31, 2021 December 31, 2020 September 30, 2020 Net interest income $70,755 $64,542 $64,893 $72,936 $69,753 Non-interest income 33,259 33,011 31,445 30,499 32,285 Less securities (gains) and losses, net (57) (898) (1,641) (855) 426 Non-interest expense (73,487) (62,625) (54,499) (64,073) (56,542) Pre-provision net revenue $30,470 $34,030 $40,198 $38,507 $45,922 Acquisition and other restructuring expenses 8,677 2,713 320 7,550 2,529 Provision for unfunded commitments (978) (496) 406 (12) 250 New Market Tax Credit amortization 1,240 1,239 1,829 1,111 — Adjusted: pre-provision net revenue $39,409 $37,486 $42,753 $47,156 $48,701 Average total assets $12,697,795 $11,398,655 $10,594,245 $10,419,364 $10,680,995 Reported: Pre-provision net revenue to average assets(1) 0.95 % 1.20 % 1.54 % 1.47 % 1.71 % Adjusted: Pre-provision net revenue to average assets(1) 1.23 % 1.32 % 1.64 % 1.80 % 1.81 % Three Months Ended September 30, 2021 June 30, 2021 March 31, 2021 December 31, 2020 September 30, 2020 Reported: Net income $25,941 $29,766 $37,816 $28,345 $30,829 Acquisition expenses: Salaries, wages, and employee benefits 4,462 1,125 — — — Data processing 3,182 368 7 56 — Lease or fixed asset impairment — — — 245 234 Professional fees and other 776 1,220 313 479 99 Other restructuring costs: Salaries, wages, and employee benefits 257 — — 113 2,011 Fixed asset impairment — — — 6,657 — Professional fees and other — — — — 185 Related tax benefit (1,773) (558) (71) (1,640) (555) Adjusted: Net income $32,845 $31,921 $38,065 $34,255 $32,803 Dilutive average common shares outstanding 56,832,518 55,730,883 55,035,806 54,911,458 54,737,920 Reported: Diluted earnings per share $0.46 $0.53 $0.69 $0.52 $0.56 Adjusted: Diluted earnings per share $0.58 $0.57 $0.69 $0.62 $0.60 Average total assets $12,697,795 $11,398,655 $10,594,245 $10,419,364 $10,680,995 Reported: Return on average assets(1) 0.81 % 1.05 % 1.45 % 1.08 % 1.15 % Adjusted: Return on average assets(1) 1.03 % 1.12 % 1.46 % 1.31 % 1.22 % Three Months Ended |
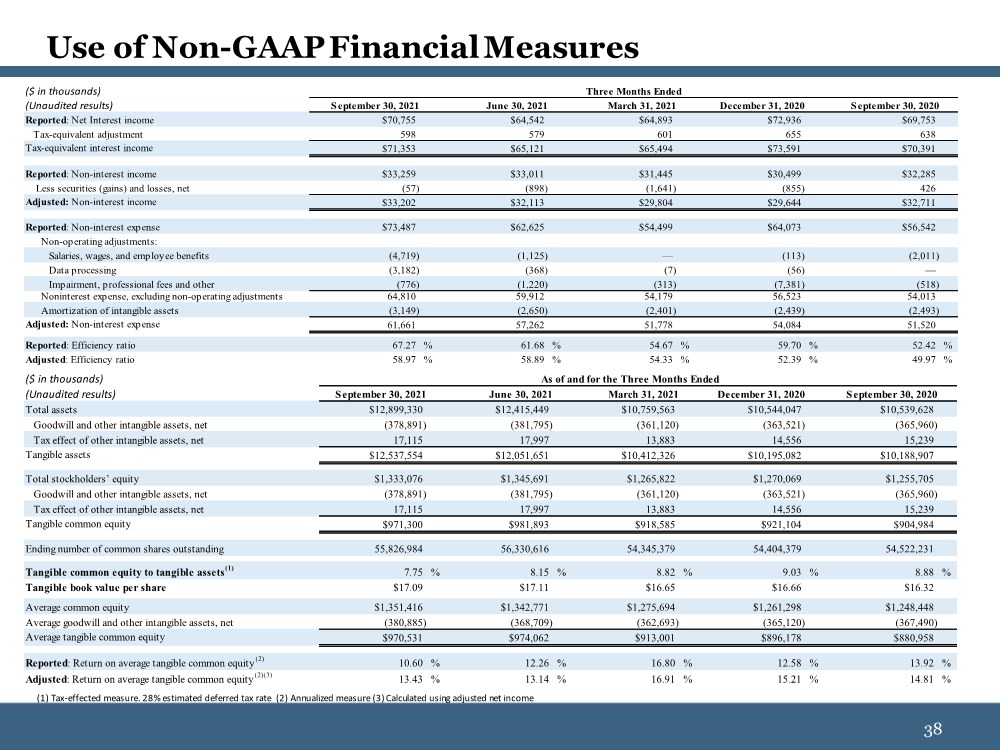
| 38 38 Use of Non-GAAP Financial Measures (1) Tax-effected measure. 28% estimated deferred tax rate (2) Annualized measure (3) Calculated using adjusted net income ($ in thousands) (Unaudited results) September 30, 2021 June 30, 2021 March 31, 2021 December 31, 2020 September 30, 2020 Total assets $12,899,330 $12,415,449 $10,759,563 $10,544,047 $10,539,628 Goodwill and other intangible assets, net (378,891) (381,795) (361,120) (363,521) (365,960) Tax effect of other intangible assets, net 17,115 17,997 13,883 14,556 15,239 Tangible assets $12,537,554 $12,051,651 $10,412,326 $10,195,082 $10,188,907 Total stockholders’ equity $1,333,076 $1,345,691 $1,265,822 $1,270,069 $1,255,705 Goodwill and other intangible assets, net (378,891) (381,795) (361,120) (363,521) (365,960) Tax effect of other intangible assets, net 17,115 17,997 13,883 14,556 15,239 Tangible common equity $971,300 $981,893 $918,585 $921,104 $904,984 Ending number of common shares outstanding 55,826,984 56,330,616 54,345,379 54,404,379 54,522,231 Tangible common equity to tangible assets(1) 7.75 % 8.15 % 8.82 % 9.03 % 8.88 % Tangible book value per share $17.09 $17.11 $16.65 $16.66 $16.32 Average common equity $1,351,416 $1,342,771 $1,275,694 $1,261,298 $1,248,448 Average goodwill and other intangible assets, net (380,885) (368,709) (362,693) (365,120) (367,490) Average tangible common equity $970,531 $974,062 $913,001 $896,178 $880,958 Reported: Return on average tangible common equity(2) 10.60 % 12.26 % 16.80 % 12.58 % 13.92 % Adjusted: Return on average tangible common equity(2)(3) 13.43 % 13.14 % 16.91 % 15.21 % 14.81 % As of and for the Three Months Ended ($ in thousands) (Unaudited results) September 30, 2021 June 30, 2021 March 31, 2021 December 31, 2020 September 30, 2020 Reported: Net Interest income $70,755 $64,542 $64,893 $72,936 $69,753 Tax-equivalent adjustment 598 579 601 655 638 Tax-equivalent interest income $71,353 $65,121 $65,494 $73,591 $70,391 Reported: Non-interest income $33,259 $33,011 $31,445 $30,499 $32,285 Less securities (gains) and losses, net (57) (898) (1,641) (855) 426 Adjusted: Non-interest income $33,202 $32,113 $29,804 $29,644 $32,711 Reported: Non-interest expense $73,487 $62,625 $54,499 $64,073 $56,542 Non-operating adjustments: Salaries, wages, and employee benefits (4,719) (1,125) — (113) (2,011) Data processing (3,182) (368) (7) (56) — Impairment, professional fees and other (776) (1,220) (313) (7,381) (518) Noninterest expense, excluding non-operating adjustments 64,810 59,912 54,179 56,523 54,013 Amortization of intangible assets (3,149) (2,650) (2,401) (2,439) (2,493) Adjusted: Non-interest expense 61,661 57,262 51,778 54,084 51,520 Reported: Efficiency ratio 67.27 % 61.68 % 54.67 % 59.70 % 52.42 % Adjusted: Efficiency ratio 58.97 % 58.89 % 54.33 % 52.39 % 49.97 % Three Months Ended |