Exhibit 99.2
| January 25, 2022 4Q21 QUARTERLY EARNINGS SUPPLEMENT |
| 2 2 Special Note Concerning Forward - Looking Statements Statements made in this document, other than those concerning historical financial information, may be considered forward - looking statements within the meaning of the Private Securities Litigation Reform Act of 1995 with respect to the financial condition, results of operations, plans, objectives, future performance and business of the Company. Forward - looking statements, which may be based upon beliefs, expectations and assumptions of the Company’s management and on information currently available to management, are generally identifiable by the use of words such as “believe,” “expect,” “anticipate,” “plan,” “intend,” “estimate,” “may,” “will,” “would,” “could,” “should” or other similar expressions. Additionally, all state men ts in this document, including forward - looking statements, speak only as of the date they are made, and the Company undertakes no obligation to update any statement in light of new information or future events. A number of factors, many of which are beyon d the Company’s ability to control or predict, could cause actual results to differ materially from those in the Company’s forw ard - looking statements. These factors include, among others, the following: (i) the strength of the local, state, national and international economy; (ii) the economic impact of any future terrorist threats or attacks, widespread disease or pandemics (including the COVID - 19 pandemic), or other adverse external events that could cause economic deterioration or instability in credit markets; (iii) changes in state and federal laws, regulations and governmental policies concerning the Company’s gener al business; (iv) changes in accounting policies and practice; (v) changes in interest rates and prepayment rates of the Company ’s assets (including the impact of The London Inter - bank Offered Rate phase - out); (vi) increased competition in the financial services sector and the inability to attract new customers; (vii) changes in technology and the ability to develop and mainta in secure and reliable electronic systems; (viii) the loss of key executives or associates; (ix) changes in consumer spending; (x) unexpected results of current and/or future acquisitions, which may include failure to realize the anticipated benefits o f a ny acquisition and the possibility that transaction costs may be greater than anticipated; (xi) unexpected outcomes of existing or new litigation involving the Company; and (xii) the economic impact of exceptional weather occurrences such as tornadoes, hurricanes, floods, and blizzards. These risks and uncertainties should be considered in evaluating forward - looking statements and undue reliance should not be placed on such statements. Additional information concerning the Company and its business, including additional factors that could materially affect its financial results, is included in the Company’s filings with th e S ecurities and Exchange Commission. |
| 3 3 Non - GAAP Financial Measures This document contains financial information determined other than in accordance with accounting principles generally accepted in the United States of America (“GAAP”). Management uses these “non - GAAP” measures in its analysis of the Company’s performance. Management also believes that these non - GAAP financial measures allow for better comparability of period to period operating performance. Additionally, the Company believes this information is utilized by regulators and market analysts to evaluate a company’s financial condition, and therefore, such information is useful to investors. These disclosures should not be viewed as a substitute for operating results determined in accordance with GAAP, nor are they necessarily comparable to non - GAAP performance measures that may be presented by other companies. A reconciliation of the non - GAAP measures used in this document to the most directly comparable GAAP measures is provided beginning on page 39 of this document. For more details on the Company’s non - GAAP measures, refer to the Company’s Quarterly Report on Form 10 - Q for the quarter ended September 30, 2021. |
| 4 4 Table of Contents Overview of First Busey Corporation (BUSE) 5 Diversified Business Model 6 Attractive Geographic Footprint 7 Experienced Management Team 8 Investment Highlights 10 Fortress Balance Sheet 11 Robust Capital Foundation 12 High Quality Loan Portfolio 13 Participating in the CARES Act Paycheck Protection Program 16 Pristine Credit Quality 17 Reserve Supports Credit & Growth Profile 18 Ample Sources of Liquidity 19 Quarterly Earnings Review 20 Earnings Performance 21 Net Interest Margin 22 Diversified and Significant Sources of Fee Income 23 Resilient and Growing Wealth Management Platform 24 FirsTech Growth and Expansion of Services 25 Continued Investment in Technology Enterprise - Wide 29 Focused Control on Expenses 30 Appendix: Additional Loan Portfolio Detail & Update on COVID 32 Appendix: Use of Non - GAAP Financial Measures 39 |
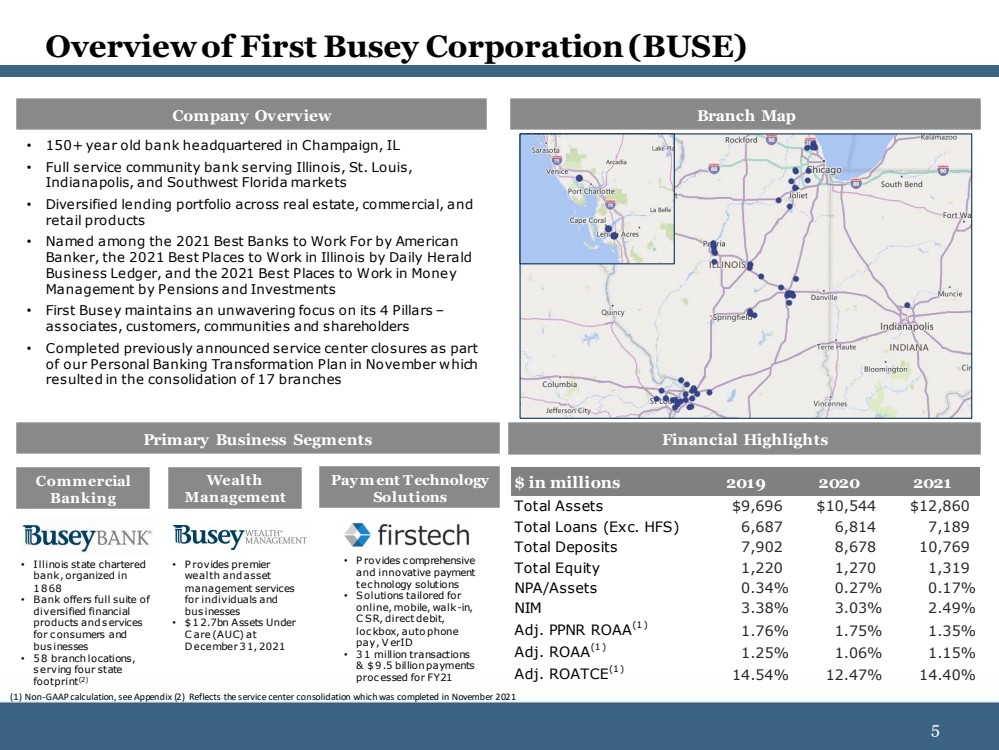
| 5 5 Overview of First Busey Corporation (BUSE) Company Overview Branch Map Primary Business Segments Financial Highlights Commercial Banking Wealth Management Payment Technology Solutions • Illinois state chartered bank, organized in 1868 • Bank offers full suite of diversified financial products and services for consumers and businesses • 58 branch locations, serving four state footprint (2) • Provides premier wealth and asset management services for individuals and businesses • $ 12.7 bn Assets Under Care (AUC) at December 31, 2021 • Provides comprehensive and innovative payment technology solutions • Solutions tailored for online, mobile, walk - in, CSR, direct debit, lockbox, auto phone pay, VerID • 31 million transactions & $9.5 billion payments processed for FY21 • 150+ year old bank headquartered in Champaign, IL • Full service community bank serving Illinois, St. Louis, Indianapolis, and Southwest Florida markets • Diversified lending portfolio across real estate, commercial, and retail products • Named among the 2021 Best Banks to Work For by American Banker, the 2021 Best Places to Work in Illinois by Daily Herald Business Ledger, and the 2021 Best Places to Work in Money Management by Pensions and Investments • First Busey maintains an unwavering focus on its 4 Pillars – associates, customers, communities and shareholders • Completed previously announced service center closures as part of our Personal Banking Transformation Plan in November which resulted in the consolidation of 17 branches (1) Non - GAAP calculation, see Appendix (2) Reflects the service center consolidation which was completed in November 2021 $ in millions 2019 2020 2021 Total Assets $9,696 $10,544 $12,860 Total Loans (Exc. HFS) 6,687 6,814 7,189 Total Deposits 7,902 8,678 10,769 Total Equity 1,220 1,270 1,319 NPA/Assets 0.34% 0.27% 0.17% NIM 3.38% 3.03% 2.49% Adj. PPNR ROAA (1) 1.76% 1.75% 1.35% Adj. ROAA (1) 1.25% 1.06% 1.15% Adj. ROATCE (1) 14.54% 12.47% 14.40% |
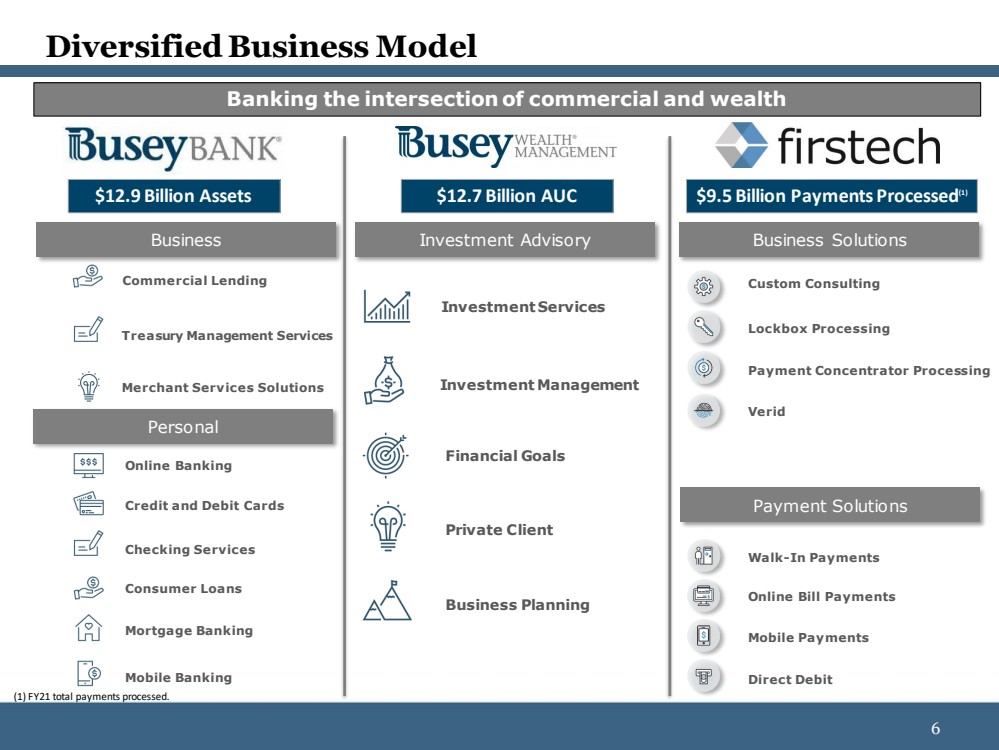
| 6 6 Online Banking Credit and Debit Cards Checking Services Consumer Loans Commercial Lending Personal Business Mortgage Banking Mobile Banking Diversified Business Model Investment Services Investment Management Financial Goals Private Client Business Planning Treasury Management Services Merchant Services Solutions Custom Consulting Lockbox Processing Payment Concentrator Processing Verid Walk - In Payments Online Bill Payments Mobile Payments Direct Debit Business Solutions Payment Solutions Investment Advisory Banking the intersection of commercial and wealth $12.9 Billion Assets $12.7 Billion AUC $9.5 Billion Payments Processed (1) (1) FY21 total payments processed. |
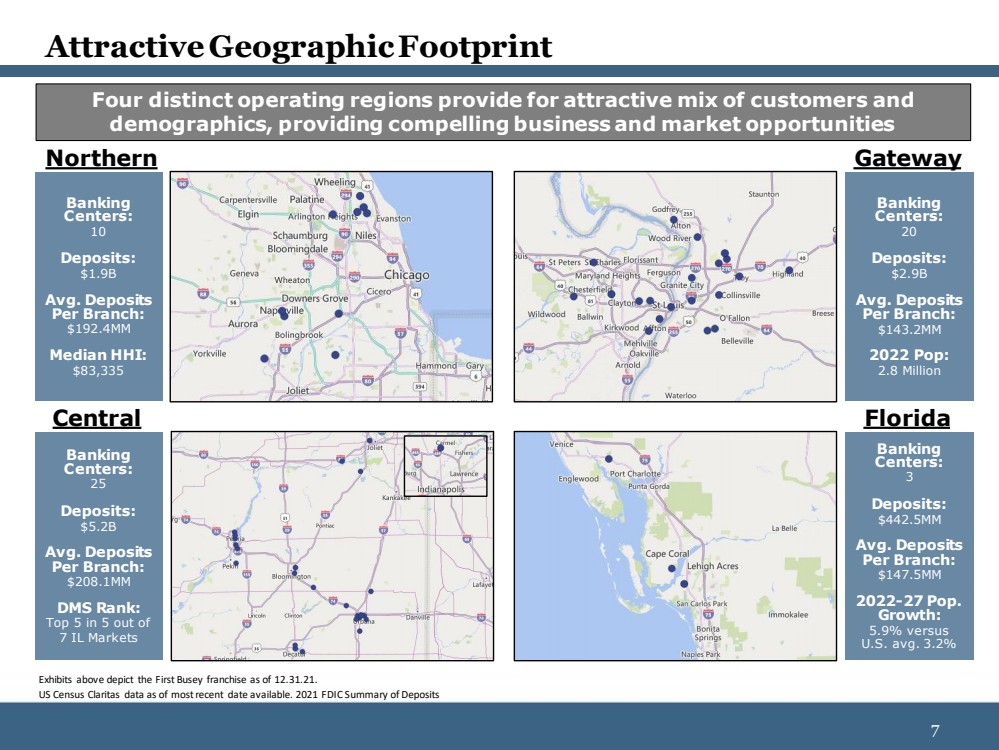
| 7 7 Banking Centers: 3 Deposits: $442.5MM Avg. Deposits Per Branch: $147.5MM 2022 - 27 Pop. Growth: 5 ..9% versus U.S. avg. 3 ..2% Banking Centers: 20 Deposits: $2.9B Avg. Deposits Per Branch: $143.2MM 2022 Pop: 2.8 Million Attractive Geographic Footprint Four distinct operating regions provide for attractive mix of customers and demographics, providing compelling business and market opportunities Northern Gateway Central Florida US Census Claritas data as of most recent date available. 2021 FDIC Summary of Deposits Exhibits above depict the First Busey franchise as of 12.31.21. Banking Centers: 10 Deposits: $1.9B Avg. Deposits Per Branch: $192.4MM Median HHI: $83,335 Banking Centers: 25 Deposits: $5.2B Avg. Deposits Per Branch: $208.1MM DMS Rank: Top 5 in 5 out of 7 IL Markets |
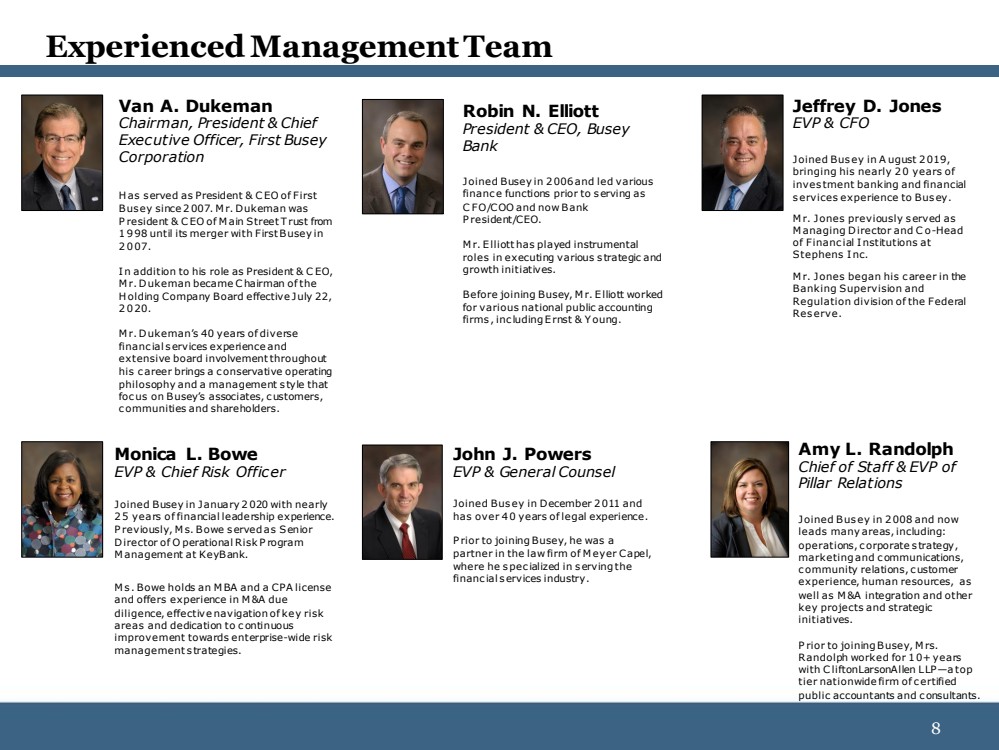
| 8 8 Experienced Management Team Van A. Dukeman Chairman, President & Chief Executive Officer, First Busey Corporation Has served as President & CEO of First Busey since 2007. Mr. Dukeman was President & CEO of Main Street Trust from 1998 until its merger with First Busey in 2007. In addition to his role as President & CEO, Mr. Dukeman became Chairman of the Holding Company Board effective July 22, 2020. Mr. Dukeman’s 40 years of diverse financial services experience and extensive board involvement throughout his career brings a conservative operating philosophy and a management style that focus on Busey’s associates, customers, communities and shareholders. Robin N. Elliott President & CEO, Busey Bank Joined Busey in 2006 and led various finance functions prior to serving as CFO/COO and now Bank President/CEO. Mr. Elliott has played instrumental roles in executing various strategic and growth initiatives. Before joining Busey, Mr. Elliott worked for various national public accounting firms, including Ernst & Young. Amy L. Randolph Chief of Staff & EVP of Pillar Relations Joined Busey in 2008 and now leads many areas, including: operations, corporate strategy, marketing and communications, community relations, customer experience, human resources, as well as M&A integration and other key projects and strategic initiatives. Prior to joining Busey, Mrs. Randolph worked for 10+ years with CliftonLarsonAllen LLP — a top tier nationwide firm of certified public accountants and consultants. John J. Powers EVP & General Counsel Joined Busey in December 2011 and has over 40 years of legal experience. Prior to joining Busey, he was a partner in the law firm of Meyer Capel, where he specialized in serving the financial services industry. Monica L. Bowe EVP & Chief Risk Officer Joined Busey in January 2020 with nearly 25 years of financial leadership experience. Previously, Ms. Bowe served as Senior Director of Operational Risk Program Management at KeyBank. Ms. Bowe holds an MBA and a CPA license and offers experience in M&A due diligence, effective navigation of key risk areas and dedication to continuous improvement towards enterprise - wide risk management strategies. Jeffrey D. Jones EVP & CFO Joined Busey in August 2019, bringing his nearly 20 years of investment banking and financial services experience to Busey. Mr. Jones previously served as Managing Director and Co - Head of Financial Institutions at Stephens Inc. Mr. Jones began his career in the Banking Supervision and Regulation division of the Federal Reserve. |
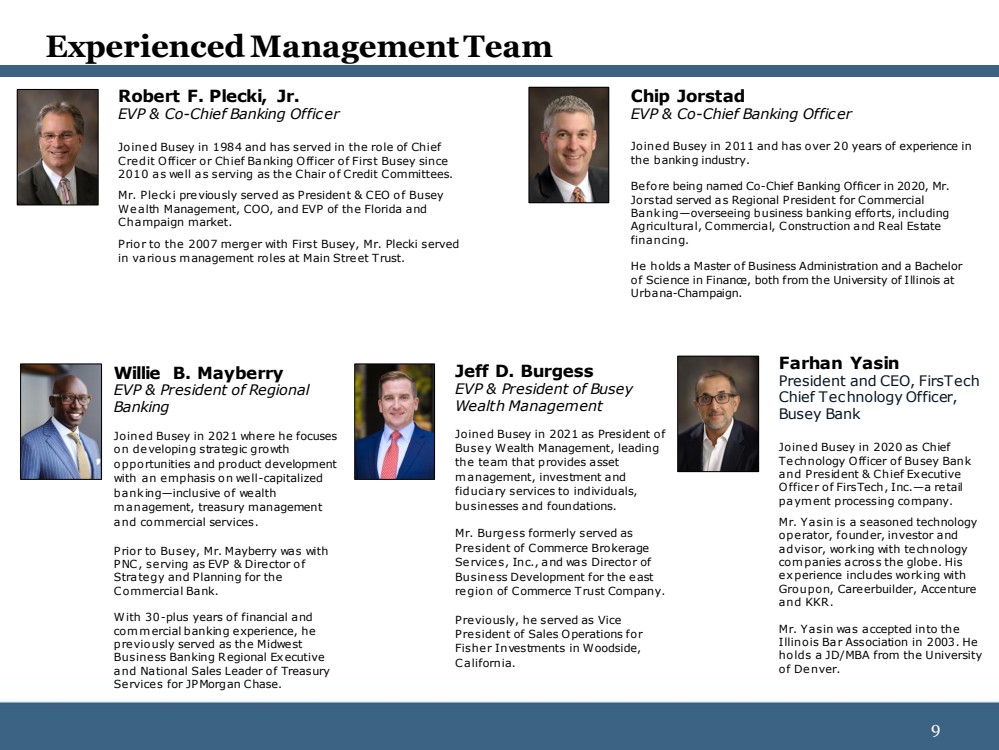
| 9 9 Experienced Management Team Robert F. Plecki, Jr. EVP & Co - Chief Banking Officer Joined Busey in 1984 and has served in the role of Chief Credit Officer or Chief Banking Officer of First Busey since 2010 as well as serving as the Chair of Credit Committees. Mr. Plecki previously served as President & CEO of Busey Wealth Management, COO, and EVP of the Florida and Champaign market. Prior to the 2007 merger with First Busey, Mr. Plecki served in various management roles at Main Street Trust. Chip Jorstad EVP & Co - Chief Banking Officer Joined Busey in 2011 and has over 20 years of experience in the banking industry. Before being named Co - Chief Banking Officer in 2020, Mr. Jorstad served as Regional President for Commercial Banking — overseeing business banking efforts, including Agricultural, Commercial, Construction and Real Estate financing. He holds a Master of Business Administration and a Bachelor of Science in Finance, both from the University of Illinois at Urbana - Champaign. Willie B. Mayberry EVP & President of Regional Banking Joined Busey in 2021 where he focuses on developing strategic growth opportunities and product development with an emphasis on well - capitalized banking — inclusive of wealth management, treasury management and commercial services. Prior to Busey, Mr. Mayberry was with PNC, serving as EVP & Director of Strategy and Planning for the Commercial Bank. With 30 - plus years of financial and commercial banking experience, he previously served as the Midwest Business Banking Regional Executive and National Sales Leader of Treasury Services for JPMorgan Chase. Jeff D. Burgess EVP & President of Busey Wealth Management Joined Busey in 2021 as President of Busey Wealth Management, leading the team that provides asset management, investment and fiduciary services to individuals, businesses and foundations. Mr. Burgess formerly served as President of Commerce Brokerage Services, Inc., and was Director of Business Development for the east region of Commerce Trust Company. Previously, he served as Vice President of Sales Operations for Fisher Investments in Woodside, California. Farhan Yasin President and CEO, FirsTech Chief Technology Officer, Busey Bank Joined Busey in 2020 as Chief Technology Officer of Busey Bank and President & Chief Executive Officer of FirsTech , Inc. — a retail payment processing company. Mr. Yasin is a seasoned technology operator, founder, investor and advisor, working with technology companies across the globe. His experience includes working with Groupon, Careerbuilder , Accenture and KKR. Mr. Yasin was accepted into the Illinois Bar Association in 2003. He holds a JD/MBA from the University of Denver. |
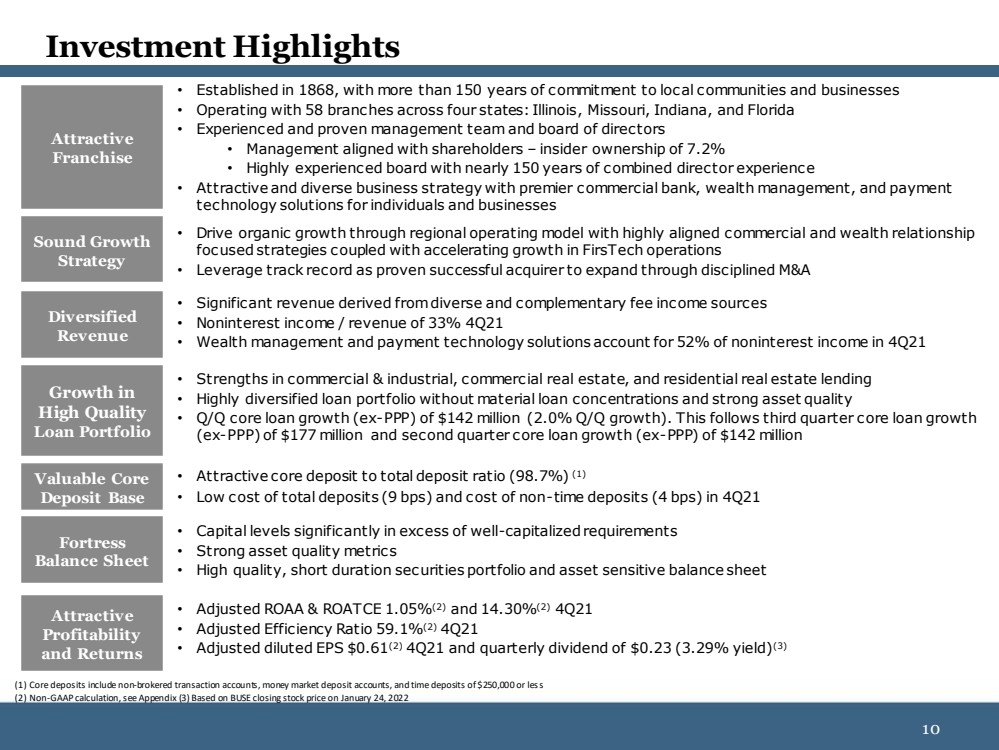
| 10 10 Investment Highlights • Established in 1868 , with more than 150 years of commitment to local communities and businesses • Operating with 58 branches across four states: Illinois , Missouri, Indiana, and Florida • Experienced and proven management team and board of directors • Management aligned with shareholders – insider ownership of 7.2% • Highly experienced board with nearly 150 years of combined director experience • Attractive and diverse business strategy with premier commercial bank, wealth management, and payment technology solutions for individuals and businesses Attractive Franchise Sound Growth Strategy Valuable Core Deposit Base Fortress Balance Sheet Growth in High Quality Loan Portfolio Diversified Revenue • Drive organic growth through regional operating model with highly aligned commercial and wealth relationship focused strategies coupled with accelerating growth in FirsTech operations • Leverage track record as proven successful acquirer to expand through disciplined M&A • Attractive core deposit to total deposit ratio (98.7%) (1) • Low cost of total deposits (9 bps) and cost of non - time deposits (4 bps) in 4Q21 • Strengths in commercial & industrial, commercial real estate, and residential real estate lending • Highly diversified loan portfolio without material loan concentrations and strong asset quality • Q/Q core loan growth (ex - PPP) of $142 million (2.0% Q/Q growth). This follows third quarter core loan growth (ex - PPP) of $177 million and second quarter core loan growth (ex - PPP) of $142 million • Significant revenue derived from diverse and complementary fee income sources • Noninterest income / revenue of 33% 4Q21 • Wealth management and payment technology solutions account for 52% of noninterest income in 4Q21 • Capital levels significantly in excess of well - capitalized requirements • Strong asset quality metrics • High quality, short duration securities portfolio and asset sensitive balance sheet (1) Core deposits include non - brokered transaction accounts, money market deposit accounts, and time deposits of $250,000 or les s (2) Non - GAAP calculation, see Appendix (3) Based on BUSE closing stock price on January 24, 2022 Attractive Profitability and Returns • Adjusted ROAA & ROATCE 1.05% (2) and 14.30% (2) 4Q21 • Adjusted Efficiency Ratio 59.1% (2) 4Q21 • Adjusted diluted EPS $0.61 (2) 4Q21 and quarterly dividend of $0.23 (3.29% yield) (3) |
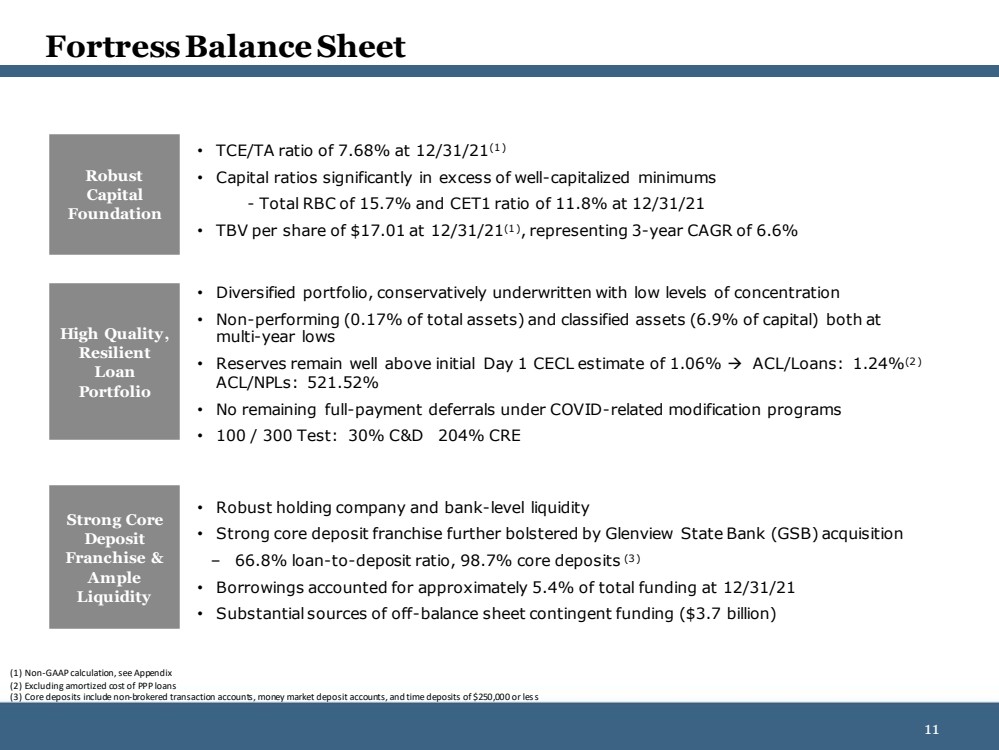
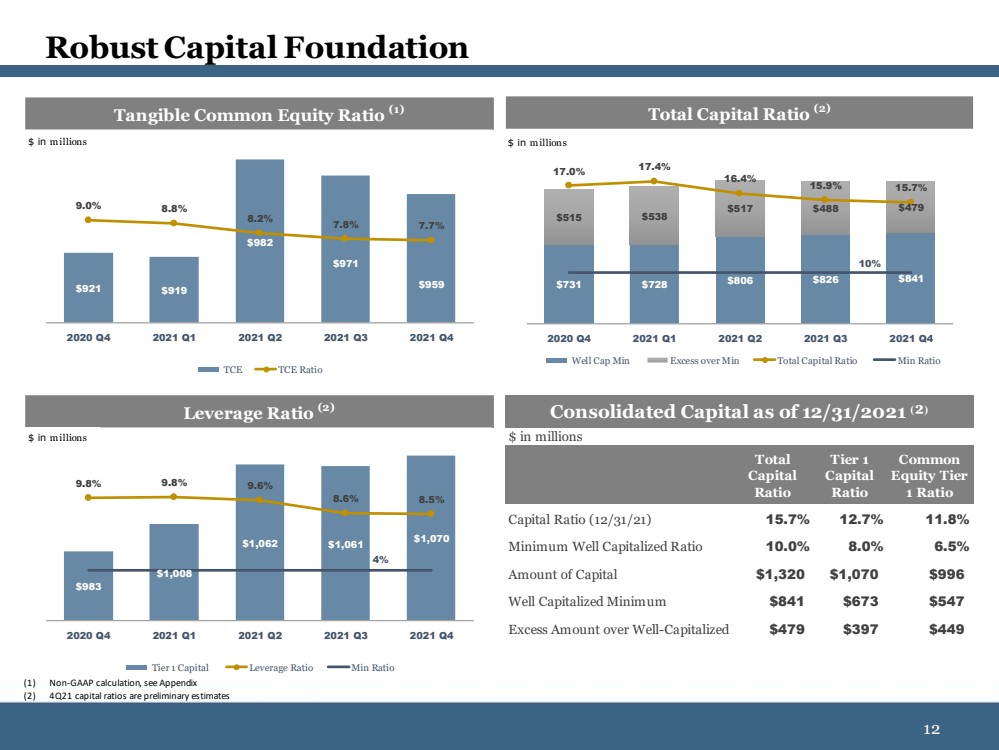
| 11 11 • TCE/TA ratio of 7.68% at 12/31/21 (1) • Capital ratios significantly in excess of well - capitalized minimums - Total RBC of 15.7% and CET1 ratio of 11.8% at 12/31/21 • TBV per share of $17.01 at 12/31/21 (1) , representing 3 - year CAGR of 6.6% • Diversified portfolio, conservatively underwritten with low levels of concentration • Non - performing (0.17% of total assets) and classified assets (6.9% of capital) both at multi - year lows • Reserves remain well above initial Day 1 CECL estimate of 1.06% → ACL/Loans: 1.24% (2) ACL/NPLs: 521.52% • No remaining full - payment deferrals under COVID - related modification programs • 100 / 300 Test: 30% C&D 204% CRE • Robust holding company and bank - level liquidity • Strong core deposit franchise further bolstered by Glenview State Bank (GSB) acquisition – 66.8% loan - to - deposit ratio, 98.7% core deposits (3) • Borrowings accounted for approximately 5.4% of total funding at 12/31/21 • Substantial sources of off - balance sheet contingent funding ($3.7 billion) Fortress Balance Sheet (1) Non - GAAP calculation, see Appendix (2) Excluding amortized cost of PPP loans (3) Core deposits include non - brokered transaction accounts, money market deposit accounts, and time deposits of $250,000 or les s Robust Capital Foundation High Quality, Resilient Loan Portfolio Strong Core Deposit Franchise & Ample Liquidity |
| 12 12 Leverage Ratio (2) $983 $1,008 $1,062 $1,061 $1,070 9.8% 9.8% 9.6% 8.6% 8.5% 4% 2020 Q4 2021 Q1 2021 Q2 2021 Q3 2021 Q4 Tier 1 Capital Leverage Ratio Min Ratio $ in millions Robust Capital Foundation (1) Non - GAAP calculation, see Appendix (2) 4Q21 capital ratios are preliminary estimates $ in millions Capital Ratio (12/31/21) 15.7% 12.7% 11.8% Minimum Well Capitalized Ratio 10.0% 8.0% 6.5% Amount of Capital $1,320 $1,070 $996 Well Capitalized Minimum $841 $673 $547 Excess Amount over Well-Capitalized Min $479 $397 $449 Total Capital Ratio Tier 1 Capital Ratio Common Equity Tier 1 Ratio Consolidated Capital as of 12/31/2021 ⁽ ² ⁾ ($ in millions) Tangible Common Equity Ratio (1) $921 $919 $982 $971 $959 9.0% 8.8% 8.2% 7.8% 7.7% 2020 Q4 2021 Q1 2021 Q2 2021 Q3 2021 Q4 TCE TCE Ratio $ in millions Total Capital Ratio (2) $ in millions $731 $728 $806 $826 $841 $515 $538 $517 $488 $479 17.0% 17.4% 16.4% 15.9% 15.7% 10% 2020 Q4 2021 Q1 2021 Q2 2021 Q3 2021 Q4 Well Cap Min Excess over Min Total Capital Ratio Min Ratio $ in millions |
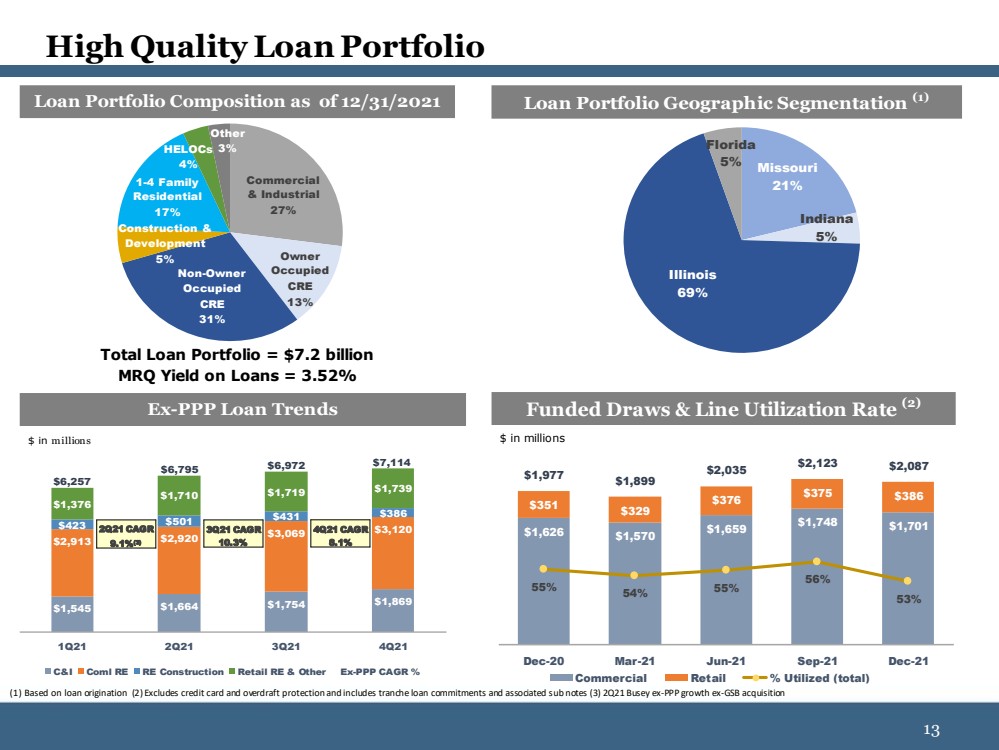
| 13 13 High Quality Loan Portfolio (1) Based on loan origination (2) Excludes credit card and overdraft protection and includes tranche loan commitments and as soc iated sub notes (3) 2Q21 Busey ex - PPP growth ex - GSB acquisition 2Q21 CAGR 9.1% Loan Portfolio Geographic Segmentation (1) Missouri 21% Indiana 5% Illinois 69% Florida 5% Ex-PPP Loan Trends $1,545 $1,664 $1,754 $1,869 $2,913 $2,920 $3,069 $3,120 $423 $501 $431 $386 $1,376 $1,710 $1,719 $1,739 $6,257 $6,795 $6,972 $7,114 1Q21 2Q21 3Q21 4Q21 C&I Coml RE RE Construction Retail RE & Other Ex-PPP CAGR % $ in millions 3Q21 CAGR 10.3% 2Q21 CAGR 9.1% (3) 4Q21 CAGR 8.1% Funded Draws & Line Utilization Rate (2) $1,626 $1,570 $1,659 $1,748 $1,701 $351 $329 $376 $375 $386 $1,977 $1,899 $2,035 $2,123 $2,087 55% 54% 55% 56% 53% $1 $501 $1,001 $1,501 $2,001 $2,501 Dec-20 Mar-21 Jun-21 Sep-21 Dec-21 Commercial Retail % Utilized (total) $ in millions Loan Portfolio Composition as of 12/31/2021 Commercial & Industrial 27% Owner Occupied CRE 13% Non - Owner Occupied CRE 31% Construction & Development 5% 1 - 4 Family Residential 17% HELOCs 4% Other 3% MRQ Yield on Loans = 3.52% Total Loan Portfolio = $7.2 billion |
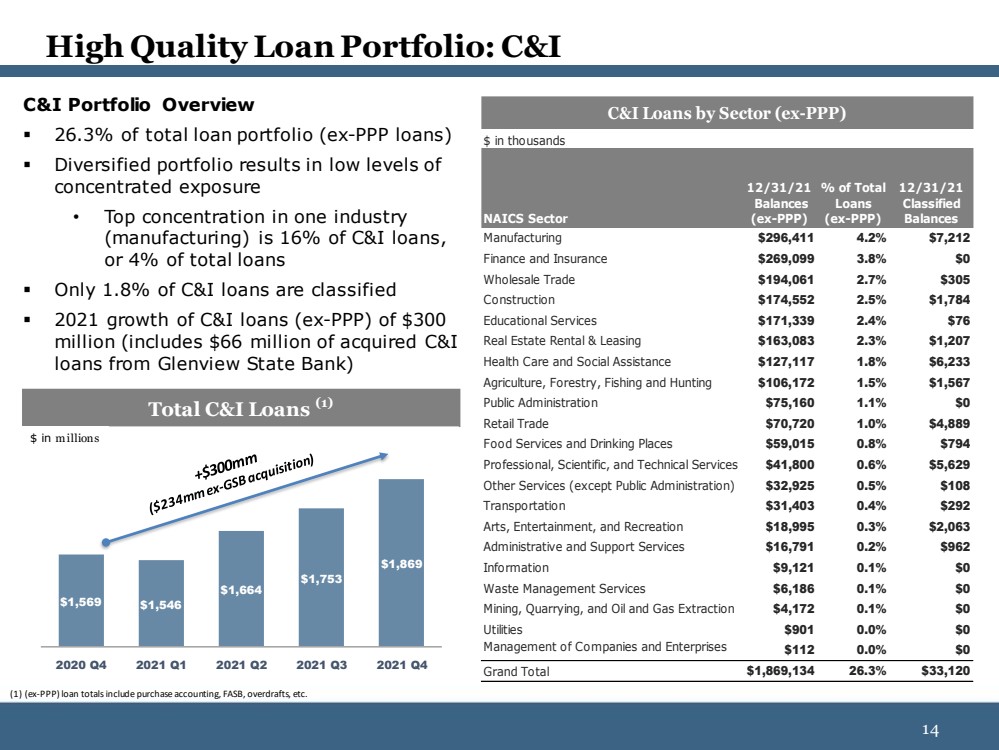
| 14 14 High Quality Loan Portfolio: C&I C&I Portfolio Overview ▪ 26.3% of total loan portfolio (ex - PPP loans) ▪ Diversified portfolio results in low levels of concentrated exposure • Top concentration in one industry (manufacturing) is 16% of C&I loans, or 4% of total loans ▪ Only 1.8% of C&I loans are classified ▪ 2021 growth of C&I loans (ex - PPP) of $300 million (includes $66 million of acquired C&I loans from Glenview State Bank) (1) (ex - PPP) loan totals include purchase accounting, FASB, overdrafts, etc. Total C&I Loans (1) $1,569 $1,546 $1,664 $1,753 $1,869 2020 Q4 2021 Q1 2021 Q2 2021 Q3 2021 Q4 $ in millions $ in thousands NAICS Sector 12/31/21 Balances (ex-PPP) % of Total Loans (ex-PPP) 12/31/21 Classified Balances Manufacturing $296,411 4.2% $7,212 Finance and Insurance $269,099 3.8% $0 Wholesale Trade $194,061 2.7% $305 Construction $174,552 2.5% $1,784 Educational Services $171,339 2.4% $76 Real Estate Rental & Leasing $163,083 2.3% $1,207 Health Care and Social Assistance $127,117 1.8% $6,233 Agriculture, Forestry, Fishing and Hunting $106,172 1.5% $1,567 Public Administration $75,160 1.1% $0 Retail Trade $70,720 1.0% $4,889 Food Services and Drinking Places $59,015 0.8% $794 Professional, Scientific, and Technical Services $41,800 0.6% $5,629 Other Services (except Public Administration) $32,925 0.5% $108 Transportation $31,403 0.4% $292 Arts, Entertainment, and Recreation $18,995 0.3% $2,063 Administrative and Support Services $16,791 0.2% $962 Information $9,121 0.1% $0 Waste Management Services $6,186 0.1% $0 Mining, Quarrying, and Oil and Gas Extraction $4,172 0.1% $0 Utilities $901 0.0% $0 Management of Companies and Enterprises $112 0.0% $0 Grand Total $1,869,134 26.3% $33,120 C&I Loans by Sector (ex-PPP) |
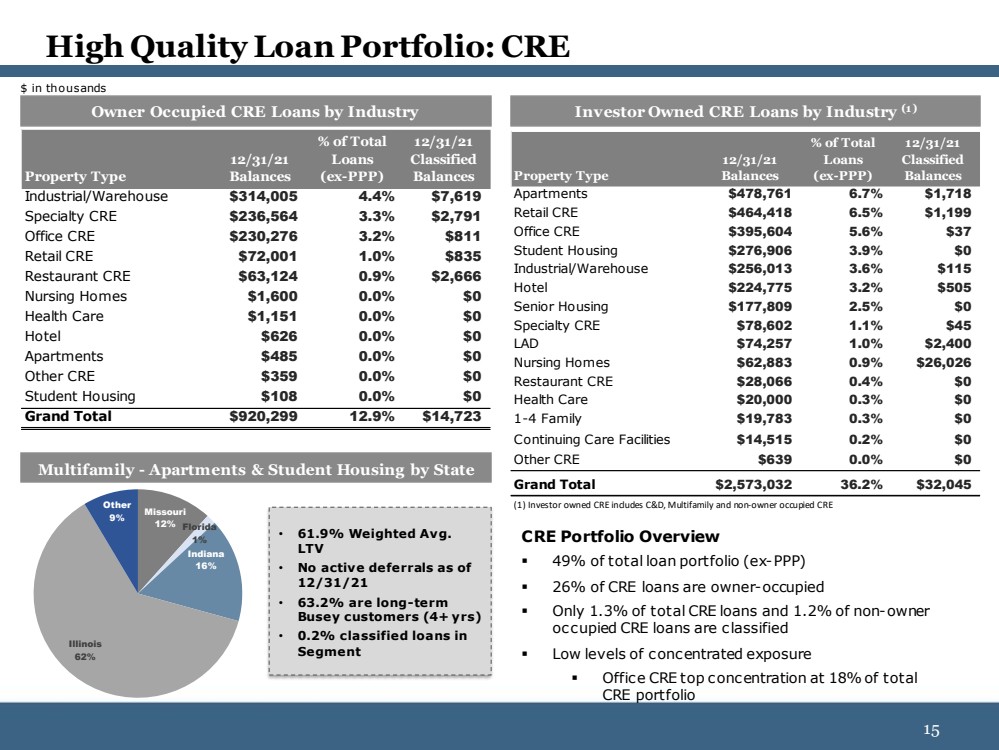
| 15 15 High Quality Loan Portfolio: CRE CRE Portfolio Overview ▪ 49% of total loan portfolio (ex - PPP) ▪ 26% of CRE loans are owner - occupied ▪ Only 1.3% of total CRE loans and 1.2% of non - owner occupied CRE loans are classified ▪ Low levels of concentrated exposure ▪ Office CRE top concentration at 18% of total CRE portfolio Investor Owned CRE Loans by Industry (1) Owner Occupied CRE Loans by Industry Multifamily - Apartments & Student Housing by State $ in thousands • 61.9% Weighted Avg. LTV • No active deferrals as of 12/31/21 • 63.2% are long - term Busey customers (4+ yrs) • 0.2% c lassified l oans in Segment (1) Investor owned CRE includes C&D, Multifamily and non - owner occupied CRE Property Type 12/31/21 Balances % of Total Loans (ex-PPP) 12/31/21 Classified Balances Industrial/Warehouse $314,005 4.4% $7,619 Specialty CRE $236,564 3.3% $2,791 Office CRE $230,276 3.2% $811 Retail CRE $72,001 1.0% $835 Restaurant CRE $63,124 0.9% $2,666 Nursing Homes $1,600 0.0% $0 Health Care $1,151 0.0% $0 Hotel $626 0.0% $0 Apartments $485 0.0% $0 Other CRE $359 0.0% $0 Student Housing $108 0.0% $0 Grand Total $920,299 12.9% $14,723 Missouri 12% Florida 1% Indiana 16% Illinois 62% Other 9% Property Type 12/31/21 Balances % of Total Loans (ex-PPP) 12/31/21 Classified Balances Apartments $478,761 6.7% $1,718 Retail CRE $464,418 6.5% $1,199 Office CRE $395,604 5.6% $37 Student Housing $276,906 3.9% $0 Industrial/Warehouse $256,013 3.6% $115 Hotel $224,775 3.2% $505 Senior Housing $177,809 2.5% $0 Specialty CRE $78,602 1.1% $45 LAD $74,257 1.0% $2,400 Nursing Homes $62,883 0.9% $26,026 Restaurant CRE $28,066 0.4% $0 Health Care $20,000 0.3% $0 1-4 Family $19,783 0.3% $0 Continuing Care Facilities $14,515 0.2% $0 Other CRE $639 0.0% $0 Grand Total $2,573,032 36.2% $32,045 |
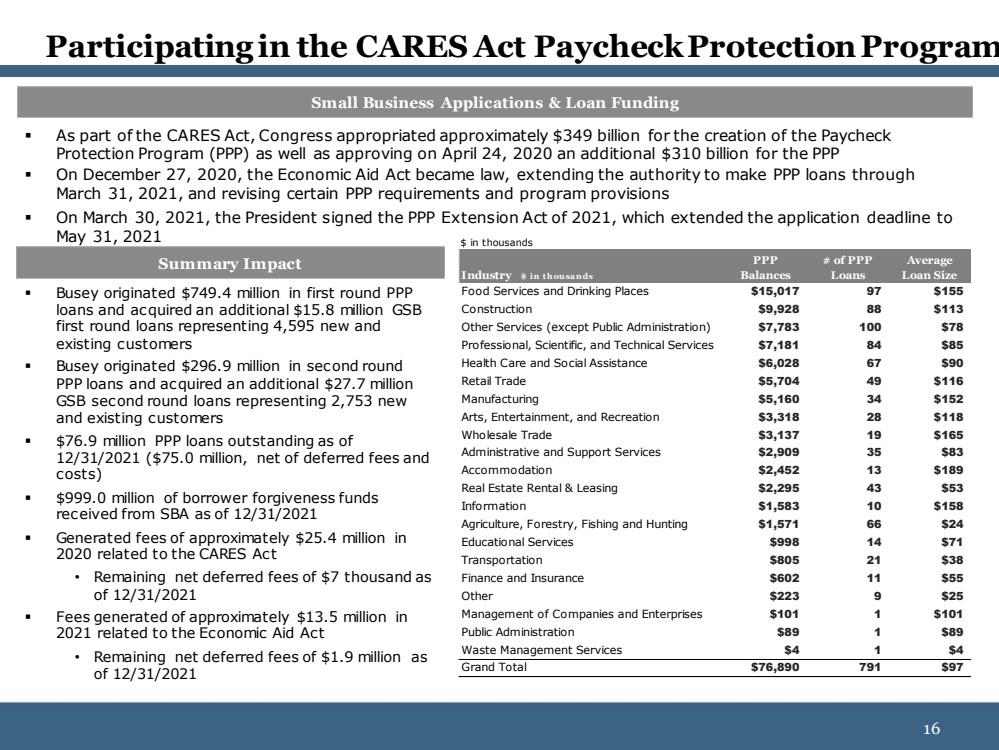
| 16 16 ▪ As part of the CARES Act, Congress appropriated approximately $349 billion for the creation of the Paycheck Protection Program (PPP) as well as approving on April 24, 2020 an additional $310 billion for the PPP ▪ On December 27, 2020, the Economic Aid Act became law, extending the authority to make PPP loans through March 31, 2021, and revising certain PPP requirements and program provisions ▪ On March 30, 2021, the President signed the PPP Extension Act of 2021, which extended the application deadline to May 31, 2021 ▪ Busey originated $749.4 million in first round PPP loans and acquired an additional $15.8 million GSB first round loans representing 4,595 new and existing customers ▪ Busey originated $296.9 million in second round PPP loans and acquired an additional $27.7 million GSB second round loans representing 2,753 new and existing customers ▪ $76.9 million PPP loans outstanding as of 12/31/2021 ($75.0 million, net of deferred fees and costs) ▪ $999.0 million of borrower forgiveness funds received from SBA as of 12/31/2021 ▪ Generated fees of approximately $25.4 million in 2020 related to the CARES Act • Remaining net deferred fees of $7 thousand as of 12/31/2021 ▪ Fees generated of approximately $13.5 million in 2021 related to the Economic Aid Act • Remaining net deferred fees of $1.9 million as of 12/31/2021 Participating in the CARES Act Paycheck Protection Program Summary Impact Small Business Applications & Loan Funding $ in thousands Industry $ in thousands PPP Balances # of PPP Loans Average Loan Size Food Services and Drinking Places $15,017 97 $155 Construction $9,928 88 $113 Other Services (except Public Administration) $7,783 100 $78 Professional, Scientific, and Technical Services $7,181 84 $85 Health Care and Social Assistance $6,028 67 $90 Retail Trade $5,704 49 $116 Manufacturing $5,160 34 $152 Arts, Entertainment, and Recreation $3,318 28 $118 Wholesale Trade $3,137 19 $165 Administrative and Support Services $2,909 35 $83 Accommodation $2,452 13 $189 Real Estate Rental & Leasing $2,295 43 $53 Information $1,583 10 $158 Agriculture, Forestry, Fishing and Hunting $1,571 66 $24 Educational Services $998 14 $71 Transportation $805 21 $38 Finance and Insurance $602 11 $55 Other $223 9 $25 Management of Companies and Enterprises $101 1 $101 Public Administration $89 1 $89 Waste Management Services $4 1 $4 Grand Total $76,890 791 $97 |
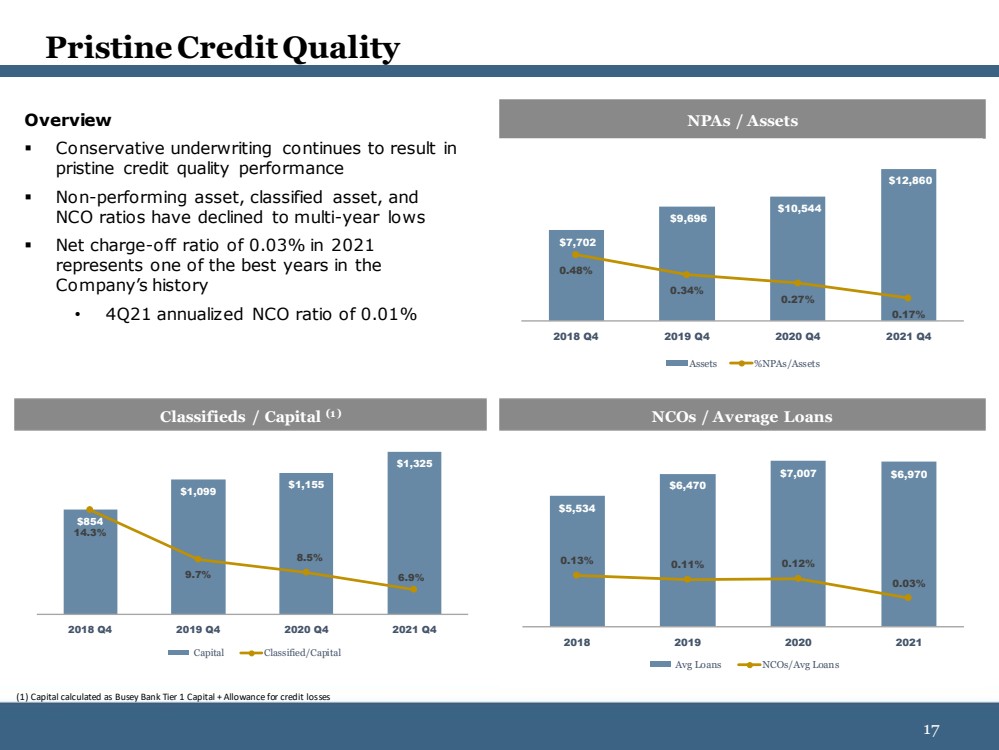
| 17 17 Pristine Credit Quality Overview ▪ C onservative underwriting continues to result in pristine credit quality performance ▪ Non - performing asset, classified asset, and NCO ratios have declined to multi - year lows ▪ Net charge - off ratio of 0.03% in 2021 represents one of the best years in the Company’s history • 4Q21 annualized NCO ratio of 0.01% (1) Capital calculated as Busey Bank Tier 1 Capital + Allowance for credit losses NPAs / Assets $7,702 $9,696 $10,544 $12,860 0.48% 0.34% 0.27% 0.17% 2018 Q4 2019 Q4 2020 Q4 2021 Q4 Assets %NPAs/Assets Classifieds / Capital (1) NCOs / Average Loans $854 $1,099 $1,155 $1,325 14.3% 9.7% 8.5% 6.9% 2018 Q4 2019 Q4 2020 Q4 2021 Q4 Capital Classified/Capital $5,534 $6,470 $7,007 $6,970 0.13% 0.11% 0.12% 0.03% 2018 2019 2020 2021 Avg Loans NCOs/Avg Loans |
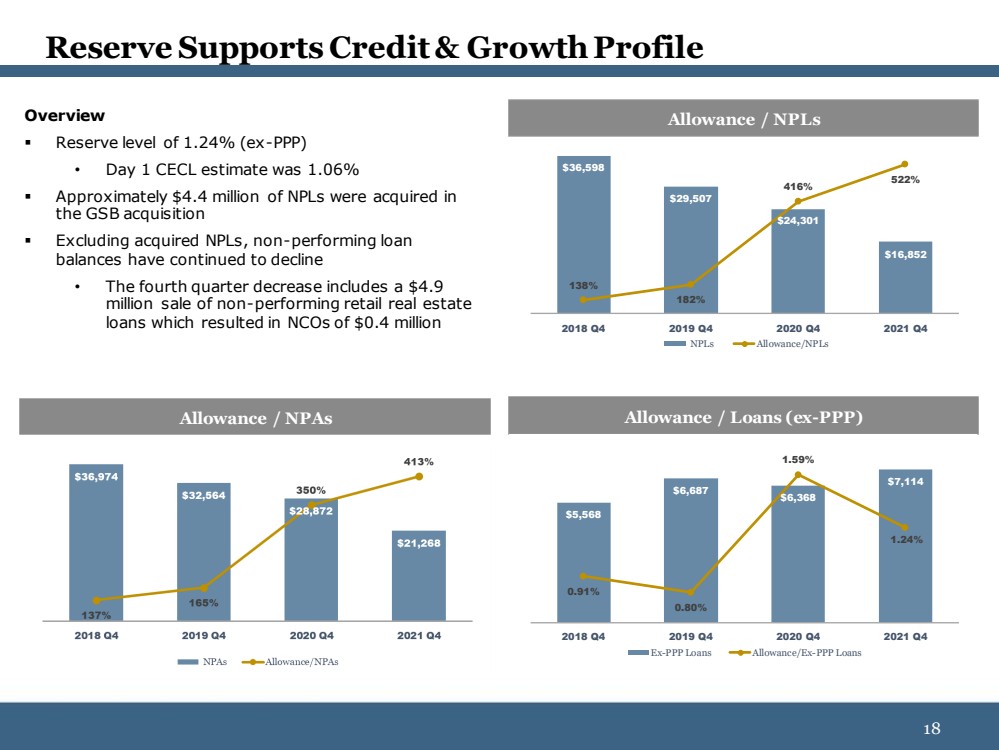
| 18 18 Reserve Supports Credit & Growth Profile Allowance / NPLs Allowance / NPAs Allowance / Loans (ex - PPP) $5,568 $6,687 $6,368 $7,114 0.91% 0.80% 1.59% 1.24% 2018 Q4 2019 Q4 2020 Q4 2021 Q4 Ex-PPP Loans Allowance/Ex-PPP Loans $36,598 $29,507 $24,301 $16,852 138% 182% 416% 522% 2018 Q4 2019 Q4 2020 Q4 2021 Q4 NPLs Allowance/NPLs Overview ▪ Reserve level of 1.24% (ex - PPP) • Day 1 CECL estimate was 1.06% ▪ Approximately $4.4 million of NPLs were acquired in the GSB acquisition ▪ Excluding acquired NPLs, non - performing loan balances have continued to decline • The fourth quarter decrease includes a $4.9 million sale of non - performing retail real estate loans which resulted in NCOs of $0.4 million |
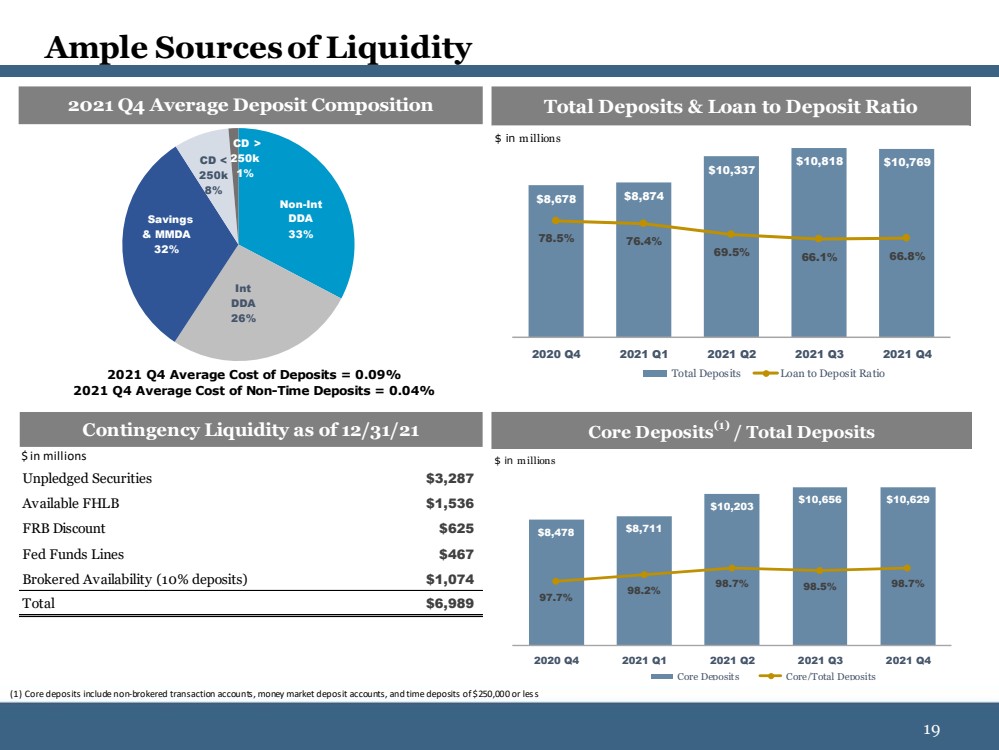
| 19 19 Ample Sources of Liquidity (1) Core deposits include non - brokered transaction accounts, money market deposit accounts, and time deposits of $250,000 or les s Total Deposits & Loan to Deposit Ratio $8,678 $8,874 $10,337 $10,818 $10,769 78.5% 76.4% 69.5% 66.1% 66.8% 2020 Q4 2021 Q1 2021 Q2 2021 Q3 2021 Q4 Total Deposits Loan to Deposit Ratio $ in millions ($ in millions) Core Deposits (1) / Total Deposits $8,478 $8,711 $10,203 $10,656 $10,629 97.7% 98.2% 98.7% 98.5% 98.7% 2020 Q4 2021 Q1 2021 Q2 2021 Q3 2021 Q4 Core Deposits Core/Total Deposits $ in millions $ in millions Unpledged Securities $3,287 Available FHLB $1,536 FRB Discount $625 Fed Funds Lines $467 Brokered Availability (10% deposits) $1,074 Total $6,989 Contingency Liquidity as of 12/31/21 Non - Int DDA 33% Int DDA 26% Savings & MMDA 32% CD < 250k 8% CD > 250k 1% 2021 Q4 Average Cost of Deposits = 0.09% 2021 Q4 Average Cost of Non-Time Deposits = 0.04% 2021 Q4 Average Deposit Composition |
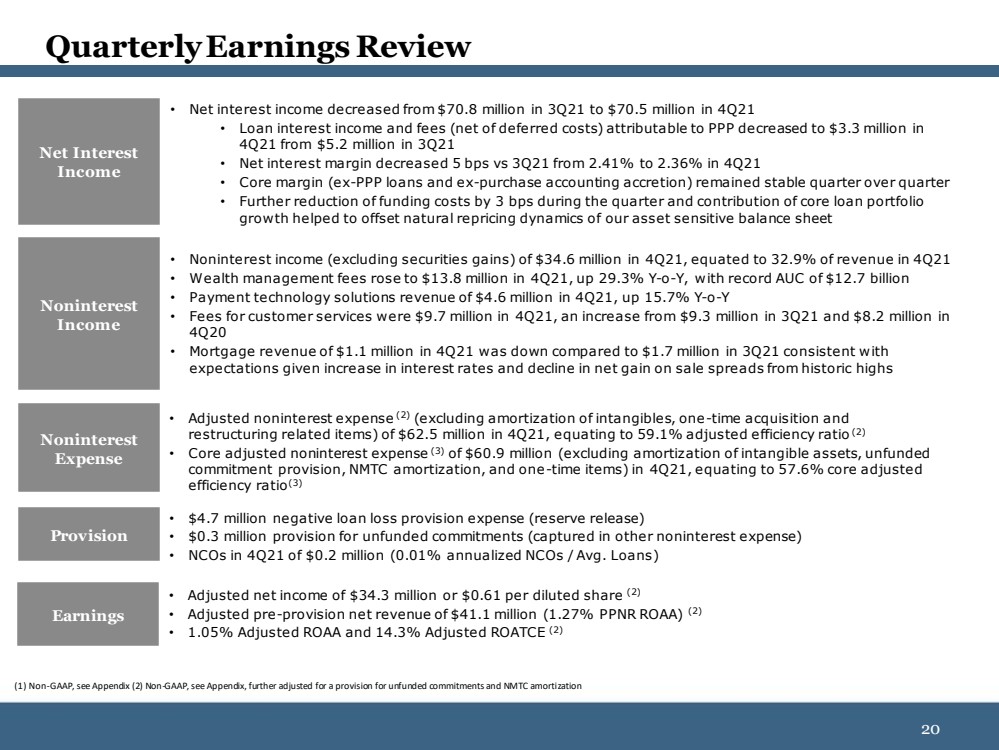
| 20 20 • Net interest income decreased from $70.8 million in 3Q21 to $70.5 million in 4Q21 • Loan interest income and fees (net of deferred costs) attributable to PPP decreased to $3.3 million in 4Q21 from $5.2 million in 3Q21 • Net interest margin decreased 5 bps vs 3Q21 from 2.41% to 2.36% in 4Q21 • Core margin (ex - PPP loans and ex - purchase accounting accretion) remained stable quarter over quarter • Further reduction of funding costs by 3 bps during the quarter and contribution of core loan portfolio growth helped to offset natural repricing dynamics of our asset sensitive balance sheet Noninterest Expense • Noninterest income (excluding securities gains) of $34.6 million in 4Q21, equated to 32.9% of revenue in 4Q21 • Wealth management fees rose to $13.8 million in 4Q21, up 29.3% Y - o - Y, with record AUC of $12.7 billion • Payment technology solutions revenue of $4.6 million in 4Q21, up 15.7% Y - o - Y • Fees for customer services were $9.7 million in 4Q21, an increase from $9.3 million in 3Q21 and $8.2 million in 4Q20 • Mortgage revenue of $1.1 million in 4Q21 was down compared to $1.7 million in 3Q21 consistent with expectations given increase in interest rates and decline in net gain on sale spreads from historic highs • Adjusted noninterest expense (2) (excluding amortization of intangibles, one - time acquisition and restructuring related items) of $62.5 million in 4Q21, equating to 59.1% adjusted efficiency ratio (2) • Core adjusted noninterest expense (3) of $60.9 million (excluding amortization of intangible assets, unfunded commitment provision, NMTC amortization, and one - time items) in 4Q21, equating to 57.6% core adjusted efficiency ratio (3) • Adjusted net income of $34.3 million or $0.61 per diluted share (2) • Adjusted pre - provision net revenue of $41.1 million (1.27% PPNR ROAA) (2) • 1.05% Adjusted ROAA and 14.3% Adjusted ROATCE (2) Earnings Noninterest Income Net Interest Income Quarterly Earnings Review Provision • $4.7 million negative loan loss provision expense (reserve release) • $0.3 million provision for unfunded commitments (captured in other noninterest expense) • NCOs in 4Q21 of $0.2 million (0.01% annualized NCOs / Avg. Loans) (1) Non - GAAP, see Appendix (2) Non - GAAP, see Appendix, further adjusted for a provision for unfunded commitments and NMTC amorti zation |
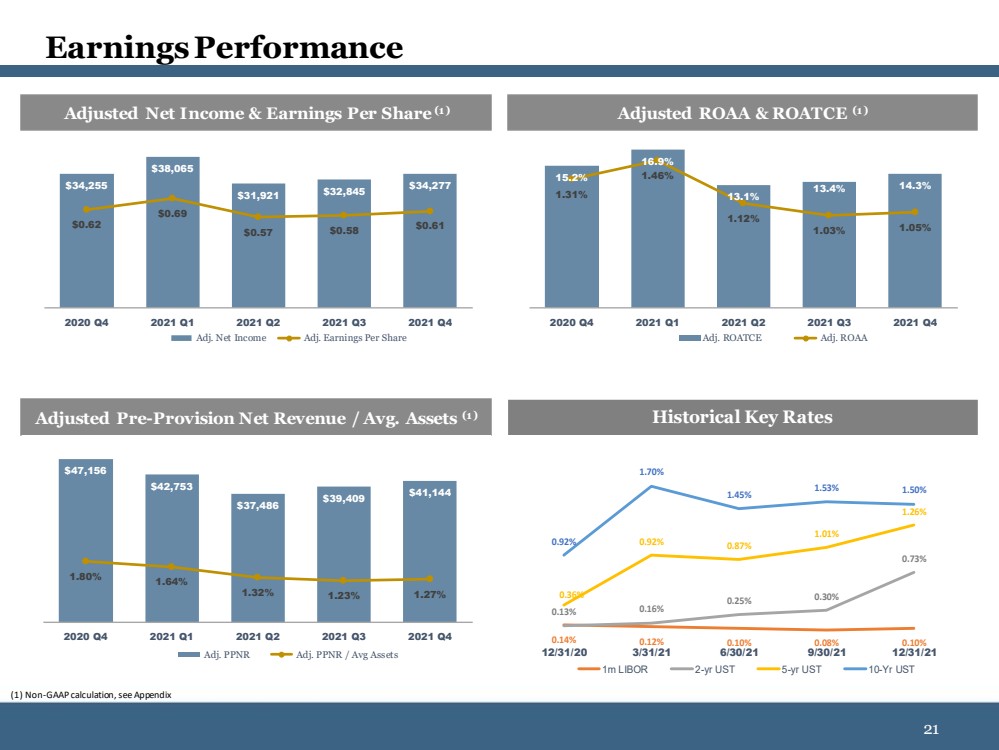
| 21 21 Earnings Performance (1) Non - GAAP calculation, see Appendix Adjusted ROAA & ROATCE (1) Adjusted Pre - Provision Net Revenue / Avg. Assets (1) Adjusted Net Income & Earnings Per Share (1) 15.2% 16.9% 13.1% 13.4% 14.3% 1.31% 1.46% 1.12% 1.03% 1.05% 2020 Q4 2021 Q1 2021 Q2 2021 Q3 2021 Q4 Adj. ROATCE Adj. ROAA $34,255 $38,065 $31,921 $32,845 $34,277 $0.62 $0.69 $0.57 $0.58 $0.61 2020 Q4 2021 Q1 2021 Q2 2021 Q3 2021 Q4 Adj. Net Income Adj. Earnings Per Share $47,156 $42,753 $37,486 $39,409 $41,144 1.80% 1.64% 1.32% 1.23% 1.27% 2020 Q4 2021 Q1 2021 Q2 2021 Q3 2021 Q4 Adj. PPNR Adj. PPNR / Avg Assets Historical Key Rates 0.14% 0.12% 0.10% 0.08% 0.10% 0.13% 0.16% 0.25% 0.30% 0.73% 0.36% 0.92% 0.87% 1.01% 1.26% 0.92% 1.70% 1.45% 1.53% 1.50% 12/31/20 3/31/21 6/30/21 9/30/21 12/31/21 1m LIBOR 2-yr UST 5-yr UST 10-Yr UST |
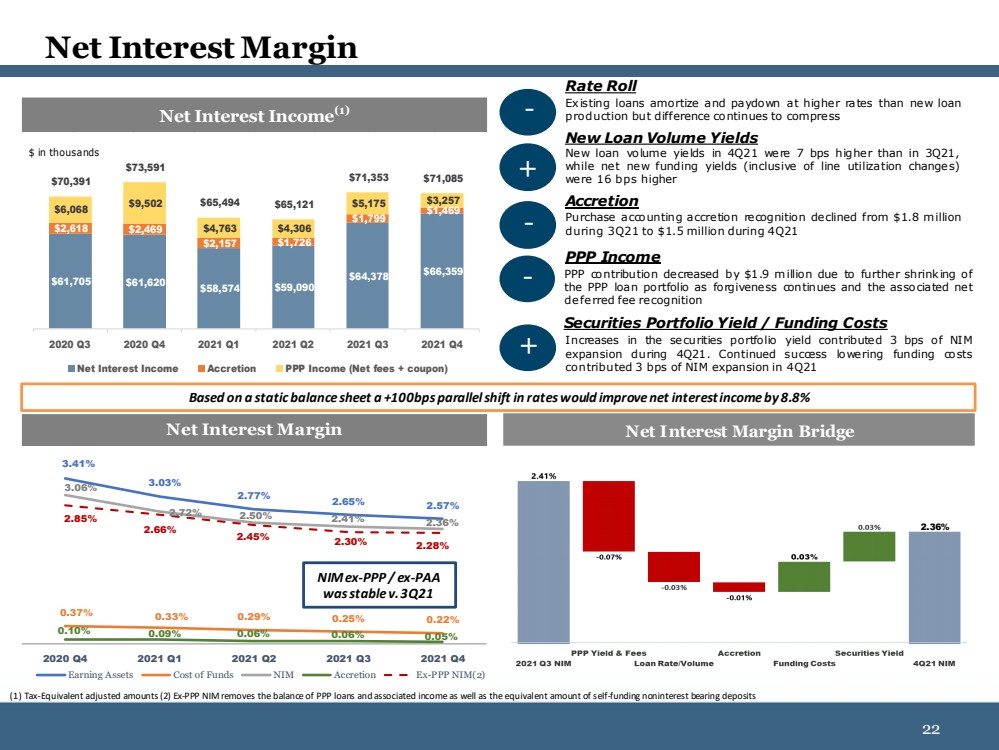
| 22 22 Net Interest Margin $61,705 $61,620 $58,574 $59,090 $64,378 $66,359 $2,618 $2,469 $2,157 $1,726 $1,799 $1,469 $6,068 $9,502 $4,763 $4,306 $5,175 $3,257 $70,391 $73,591 $65,494 $65,121 $71,353 $71,085 2020 Q3 2020 Q4 2021 Q1 2021 Q2 2021 Q3 2021 Q4 Net Interest Income Accretion PPP Income (Net fees + coupon) $ in thousands Net Interest Margin Bridge Net Interest Income (1) - Existing loans amortize and paydown at higher rates than new loan production but difference continues to compress Rate Roll - Purchase accounting accretion recognition declined from $ 1 .. 8 million during 3 Q 21 to $ 1 .. 5 million during 4 Q 21 Accretion + New loan volume yields in 4 Q 21 were 7 bps higher than in 3 Q 21 , while net new funding yields (inclusive of line utilization changes) were 16 bps higher New Loan Volume Yields PPP contribution decreased by $ 1 .. 9 million due to further shrinking of the PPP loan portfolio as forgiveness continues and the associated net deferred fee recognition PPP Income + Increases in the securities portfolio yield contributed 3 bps of NIM expansion during 4 Q 21 .. Continued success lowering funding costs contributed 3 bps of NIM expansion in 4 Q 21 Securities Portfolio Yield / Funding Costs (1) Tax - Equivalent adjusted amounts (2) Ex - PPP NIM removes the balance of PPP loans and associated income as well as the equival ent amount of self - funding noninterest bearing deposits 2.36% Net Interest Margin 3.41% 3.03% 2.77% 2.65% 2.57% 0.37% 0.33% 0.29% 0.25% 0.22% 3.06% 2.72% 2.50% 2.41% 2.36% 0.10% 0.09% 0.06% 0.06% 0.05% 2.85% 2.66% 2.45% 2.30% 2.28% 2020 Q4 2021 Q1 2021 Q2 2021 Q3 2021 Q4 Earning Assets Cost of Funds NIM Accretion Ex-PPP NIM(2) - NIM ex - PPP / ex - PAA was stable v. 3Q21 Based on a static balance sheet a +100bps parallel shift in rates would improve net interest income by 8.8% |
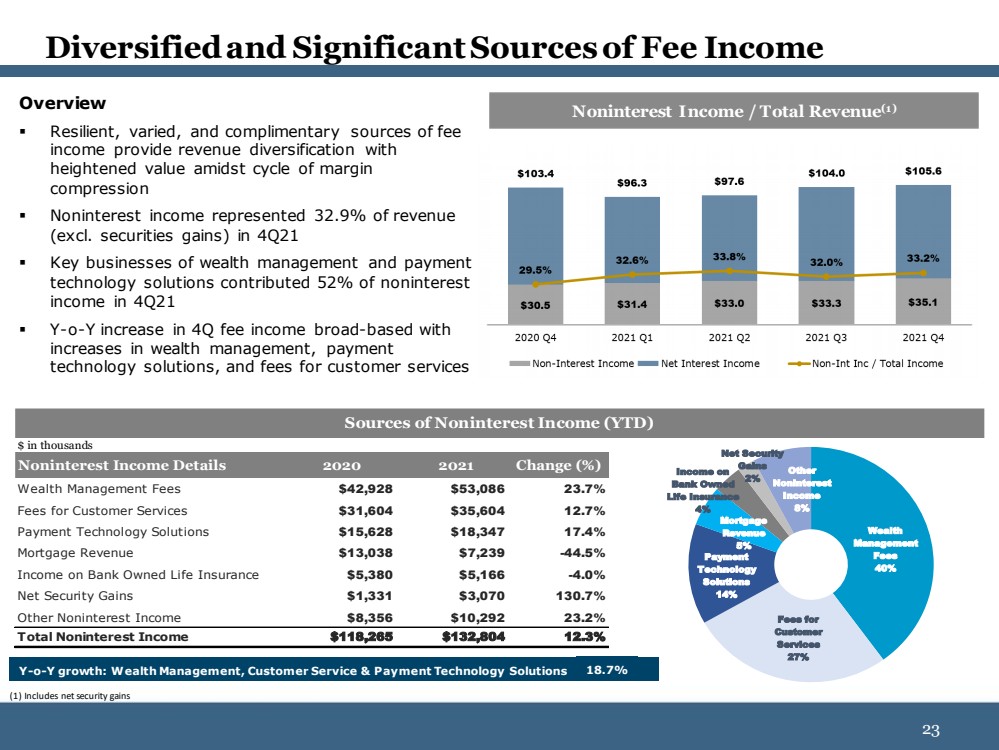
| 23 23 Overview ▪ Resilient, varied, and complimentary sources of fee income provide revenue diversification with heightened value amidst cycle of margin compression ▪ Noninterest income represented 32.9% of revenue (excl. securities gains) in 4Q21 ▪ Key businesses of wealth management and payment technology solutions contributed 52 % of noninterest income in 4Q21 ▪ Y - o - Y increase in 4Q fee income broad - based with increases in wealth management, payment technology solutions, and fees for customer services Diversified and Significant Sources of Fee Income Noninterest Income / Total Revenue (1) $ in thousands 2020 2021 Change (%) Wealth Management Fees $42,928 $53,086 23.7% Fees for Customer Services $31,604 $35,604 12.7% Payment Technology Solutions $15,628 $18,347 17.4% Mortgage Revenue $13,038 $7,239 -44.5% Income on Bank Owned Life Insurance $5,380 $5,166 -4.0% Net Security Gains $1,331 $3,070 130.7% Other Noninterest Income $8,356 $10,292 23.2% Total Noninterest Income $118,265 $132,804 12.3% Noninterest Income Details Sources of Noninterest Income (YTD) Wealth Management Fees 40% Fees for Customer Services 27% Payment Technology Solutions 14% Mortgage Revenue 5% Income on Bank Owned Life Insurance 4% Net Security Gains 2% Other Noninterest Income 8% Y - o - Y growth: Wealth Management, Customer Service & Payment Technology Solutions 18.7% (1) Includes net security gains |
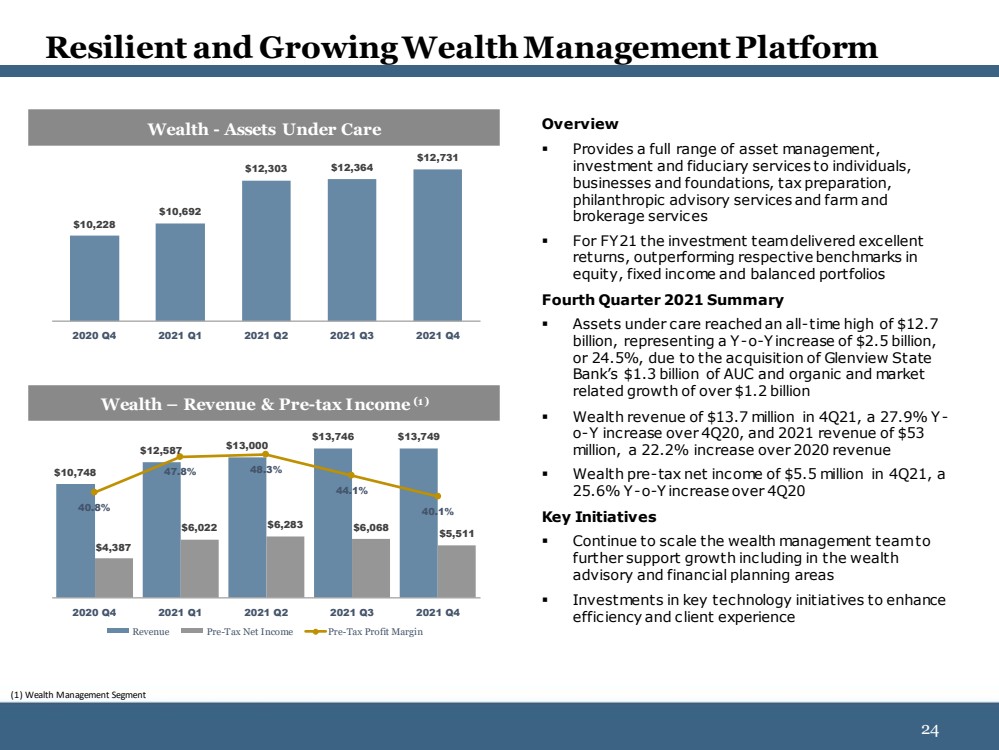
| 24 24 Resilient and Growing Wealth Management Platform Overview ▪ Provides a full range of asset management, investment and fiduciary services to individuals, businesses and foundations, tax preparation, philanthropic advisory services and farm and brokerage services ▪ For FY21 the investment team delivered excellent returns, outperforming respective benchmarks in equity, fixed income and balanced portfolios Fourth Quarter 2021 Summary ▪ Assets under care reached an all - time high of $12.7 billion, representing a Y - o - Y increase of $2.5 billion, or 24.5%, due to the acquisition of Glenview State Bank’s $1.3 billion of AUC and organic and market related growth of over $1.2 billion ▪ Wealth revenue of $13.7 million in 4Q21, a 27.9% Y - o - Y increase over 4Q20, and 2021 revenue of $53 million, a 22.2% increase over 2020 revenue ▪ Wealth pre - tax net income of $5.5 million in 4Q21, a 25.6% Y - o - Y increase over 4Q20 Key Initiatives ▪ Continue to scale the wealth management team to further support growth including in the wealth advisory and financial planning areas ▪ Investments in key technology initiatives to enhance efficiency and client experience (1) Wealth Management Segment Wealth - Assets Under Care $10,228 $10,692 $12,303 $12,364 $12,731 2020 Q4 2021 Q1 2021 Q2 2021 Q3 2021 Q4 Wealth – Revenue & Pre - tax Income (1) $10,748 $12,587 $13,000 $13,746 $13,749 $4,387 $6,022 $6,283 $6,068 $5,511 40.8% 47.8% 48.3% 44.1% 40.1% 2020 Q4 2021 Q1 2021 Q2 2021 Q3 2021 Q4 Revenue Pre-Tax Net Income Pre-Tax Profit Margin |
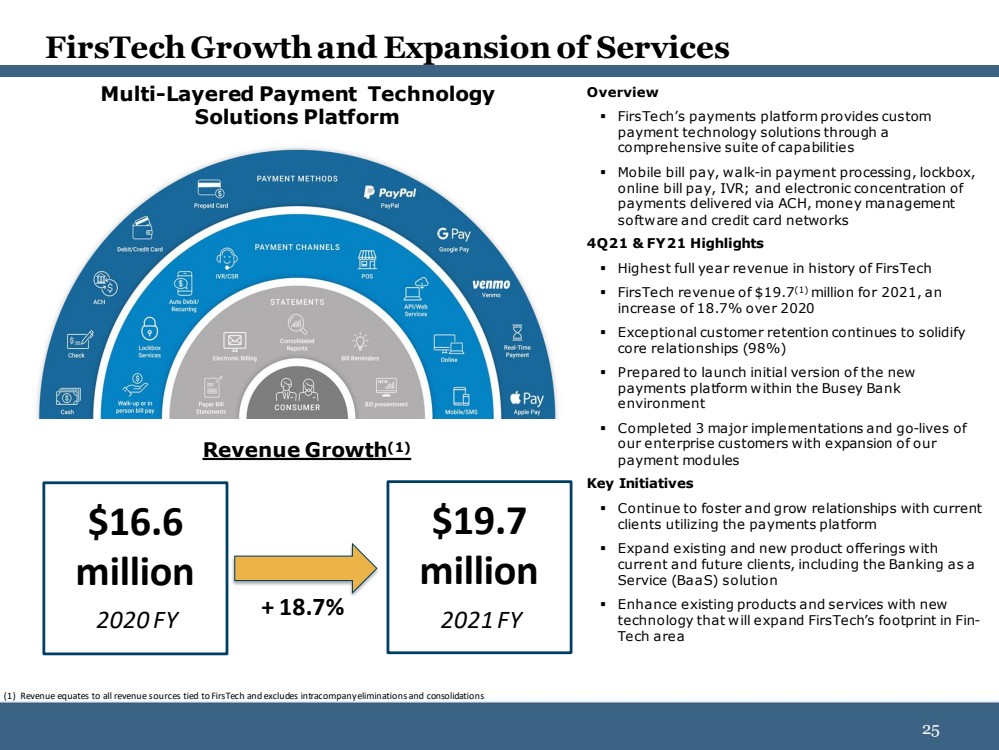
| 25 25 FirsTech Growth and Expansion of Services Overview ▪ FirsTech’s payments platform provides custom payment technology solutions through a comprehensive suite of capabilities ▪ Mobile bill pay, walk - in payment processing, lockbox, online bill pay, IVR; and electronic concentration of payments delivered via ACH, money management software and credit card networks 4Q21 & FY21 Highlights ▪ Highest full year revenue in history of FirsTech ▪ FirsTech revenue of $19.7 (1) million for 2021, an increase of 18.7% over 2020 ▪ Exceptional customer retention continues to solidify core relationships (98%) ▪ Prepared to launch initial version of the new payments platform within the Busey Bank environment ▪ Completed 3 major implementations and go - lives of our enterprise customers with expansion of our payment modules Key Initiatives ▪ Continue to foster and grow relationships with current clients utilizing the payments platform ▪ Expand existing and new product offerings with current and future clients, including the Banking as a Service (BaaS) solution ▪ Enhance existing products and services with new technology that will expand FirsTech’s footprint in Fin - Tech area Revenue Growth (1) Multi - Layered Payment Technology Solutions Platform (1) Revenue equates to all revenue sources tied to FirsTech and excludes intracompany eliminations and consolidations 2020 FY 2021 FY $16.6 million $19.7 million + 18.7% |
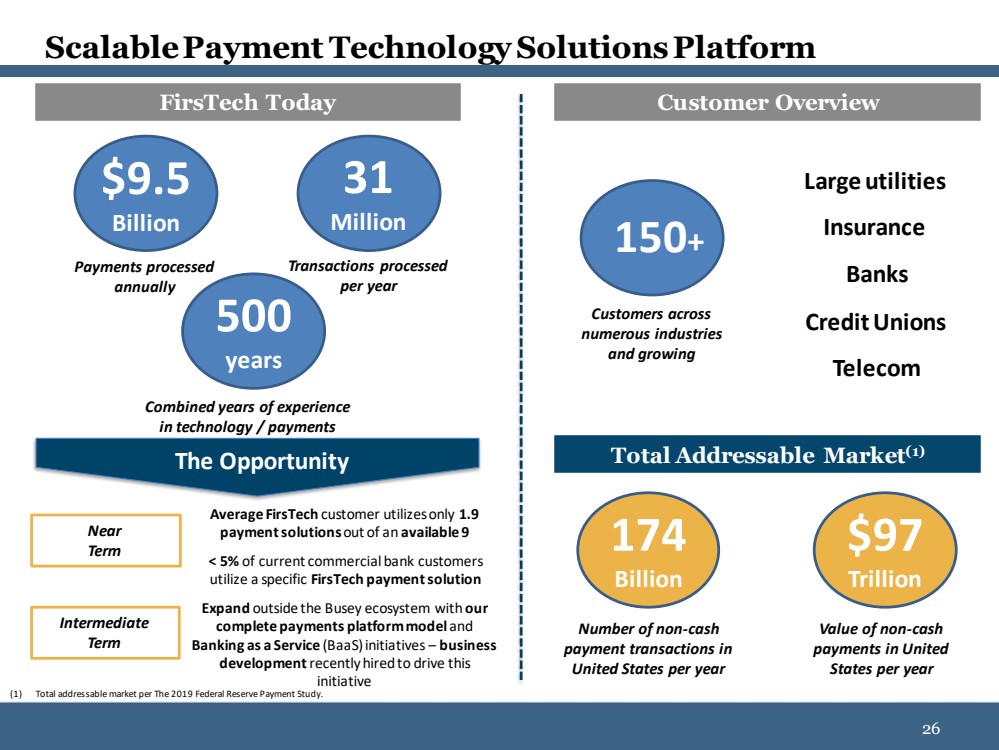
| 26 26 Scalable Payment Technology Solutions Platform Customer Overview FirsTech Today Total Addressable Market (1) (1) Total addressable market per The 2019 Federal Reserve Payment Study. 500 years Combined years of experience in technology / payments Transactions processed per year 31 Million $9.5 Billion Payments processed annually Customers across numerous industries and growing 150 + Large utilities Insurance Banks Credit Unions Number of non - cash payment transactions in United States per year 174 Billion Value of non - cash payments in United States per year $97 Trillion The Opportunity Telecom Average FirsTech customer utilizes only 1.9 payment solutions out of an available 9 < 5% of current commercial bank customers utilize a specific FirsTech payment solution Near Term Intermediate Term Expand outside the Busey ecosystem with our complete payments platform model and Banking as a Service (BaaS) initiatives – business development recently hired to drive this initiative |
| 27 27 Technology - First Leadership at FirsTech Farhan is a seasoned technology operator, founder, investor and advisor, working with technology companies across the globe .. His experience includes working with Groupon, CareerBuilder, Accenture and KKR .. In addition, Farhan co - founded DataClover, a company in the auto segment .. Farhan’s current and previous board experience includes Textkernel, Workterra, DataClover, RuMe and Big Shoulder’s Fund .. He is also a member of the Chicago Economic Club, a Leadership of Greater Chicago fellow and a mentor at 1871 .. Farhan was accepted into the Illinois Bar Association in 2003 .. He holds a JD/MBA from the University of Denver .. Humair is a proven executive leader with 20 - plus years of experience building and leading high growth product and technology organizations .. Humair’s tenure includes working with CareerBuilder, ADP, Skillsoft, and Oracle .. As a technology innovator, Humair takes a partnership approach to strategic growth .. Humair earned a Master of Science in Networking and Telecommunications from Pace University in New York .. He also holds a Bachelor of Business Administration in Computer Information Systems from Baruch College in New York and a Bachelor of Arts in Economics & Statistics from Bahauddin Zakariya University in Pakistan .. Senior leadership is comprised of innovative technologists that, when combined with the more than 60 full - time employees, has 500+ years of experience in technology and money movements Farhan Yasin President & CEO Humair Ghauri Chief Product & Technology Officer |

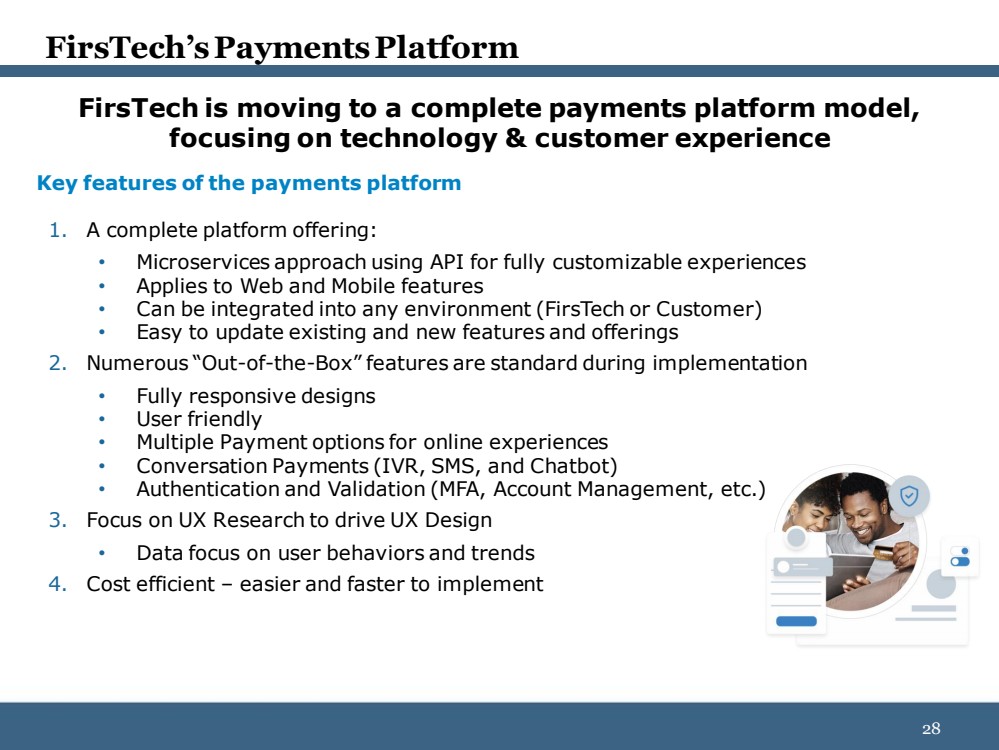
| 28 28 FirsTech is moving to a complete payments platform model, focusing on technology & customer experience Key features of the payments platform 1. A complete platform offering: • Microservices approach using API for fully customizable experiences • Applies to Web and Mobile features • Can be integrated into any environment (FirsTech or Customer) • Easy to update existing and new features and offerings 2. Numerous “Out - of - the - Box” features are standard during implementation • Fully responsive designs • User friendly • Multiple Payment options for online experiences • Conversation Payments (IVR, SMS, and Chatbot) • Authentication and Validation (MFA, Account Management, etc.) 3. Focus on UX Research to drive UX Design • Data focus on user behaviors and trends 4. Cost efficient – easier and faster to implement FirsTech’s Payments Platform |
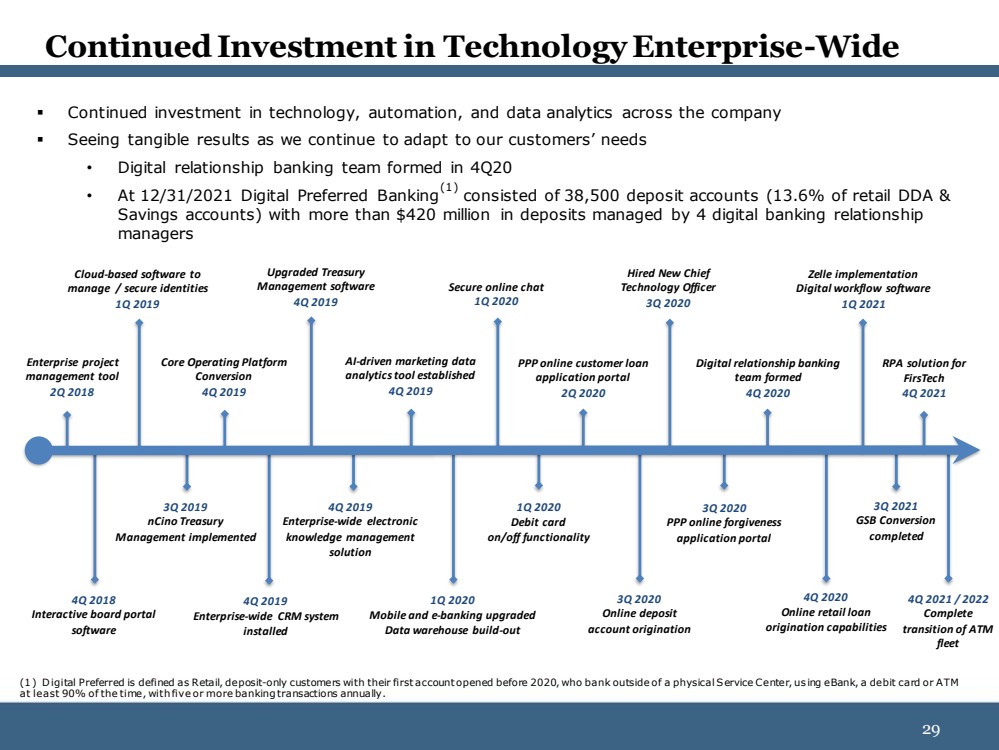
| 29 29 Continued Investment in Technology Enterprise - Wide Enterprise project management tool 2Q 2018 4Q 2018 Interactive board portal software Cloud - based software to manage / secure identities 1Q 2019 3Q 2019 nCino Treasury Management implemented Core Operating Platform Conversion 4Q 2019 4Q 2019 Enterprise - wide CRM system installed Upgraded Treasury Management software 4Q 2019 4Q 2019 Enterprise - wide electronic knowledge management solution AI - driven marketing data analytics tool established 4Q 2019 1Q 2020 Mobile and e - banking upgraded Data warehouse build - out Secure online chat 1Q 2020 1Q 2020 Debit card on/off functionality 3Q 2020 Online deposit account origination Hired New Chief Technology Officer 3Q 2020 Digital relationship banking team formed 4Q 2020 4Q 2020 Online retail loan origination capabilities Zelle implementation Digital workflow software 1Q 2021 3Q 2021 GSB Conversion completed PPP online customer loan application portal 2Q 2020 4Q 2021 / 2022 Complete transition of ATM fleet 3Q 2020 PPP online forgiveness application portal ▪ Continued investment in technology, automation, and data analytics across the company ▪ Seeing tangible results as we continue to adapt to our customers’ needs • Digital relationship banking team formed in 4Q20 • At 12/31/2021 Digital Preferred Banking (1) consisted of 38,500 deposit accounts (13.6% of retail DDA & Savings accounts) with more than $420 million in deposits managed by 4 digital banking relationship managers (1) Digital Preferred is defined as Retail, deposit - only customers with their first account opened before 2020, who bank outside of a physical Service Center, using eBank, a debit card or ATM at least 90% of the time, with five or more banking transactions annually. RPA solution for FirsTech 4Q 2021 |
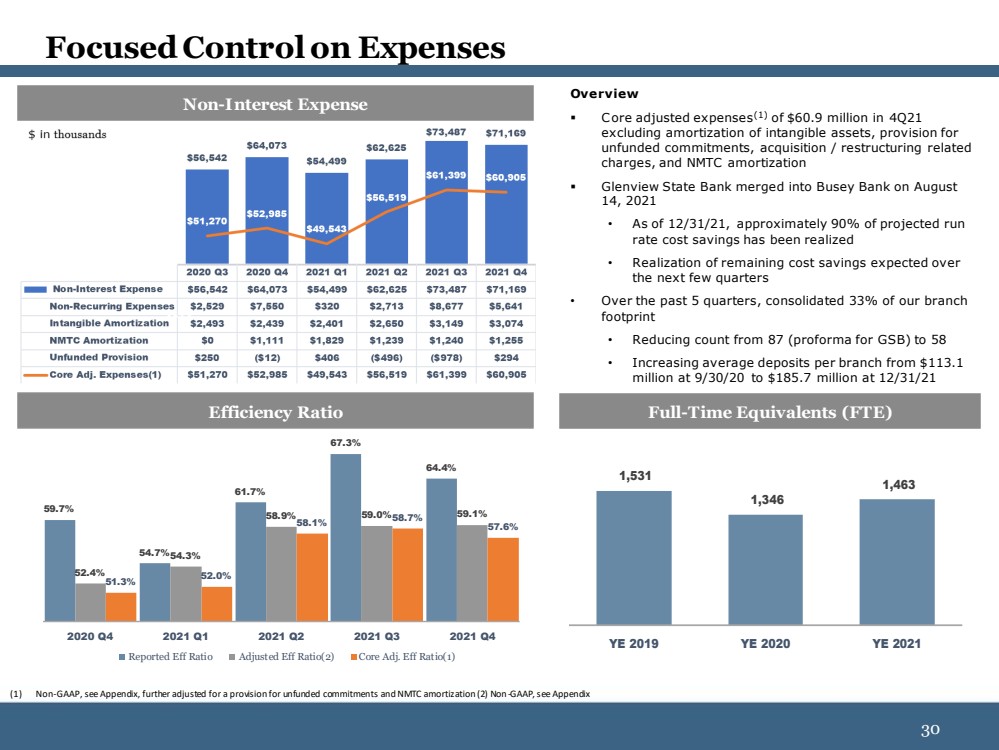
| 30 30 Focused Control on Expenses (1) Non - GAAP, see Appendix, further adjusted for a provision for unfunded commitments and NMTC amortization (2) Non - GAAP, see Append ix Overview ▪ Core adjusted expenses (1) of $60.9 million in 4Q21 excluding amortization of intangible assets, provision for unfunded commitments, acquisition / restructuring related charges, and NMTC amortization ▪ Glenview State Bank merged into Busey Bank on August 14, 2021 • As of 12/31/21, approximately 90% of projected run rate cost savings has been realized • Realization of remaining cost savings expected over the next few quarters • Over the past 5 quarters , consolidated 33% of our branch footprint • Re ducing count from 87 (proforma for GSB) to 58 • Increasing average deposits per branch from $ 113 ..1 million at 9/30/20 to $185.7 million at 12/31/21 N on - Interest Expense Efficiency Ratio 59.7% 54.7% 61.7% 67.3% 64.4% 52.4% 54.3% 58.9% 59.0% 59.1% 51.3% 52.0% 58.1% 58.7% 57.6% 2020 Q4 2021 Q1 2021 Q2 2021 Q3 2021 Q4 Reported Eff Ratio Adjusted Eff Ratio(2) Core Adj. Eff Ratio(1) 1,531 1,346 1,463 YE 2019 YE 2020 YE 2021 Full - Time Equivalents (FTE) |
| 31 31 APPENDIX |
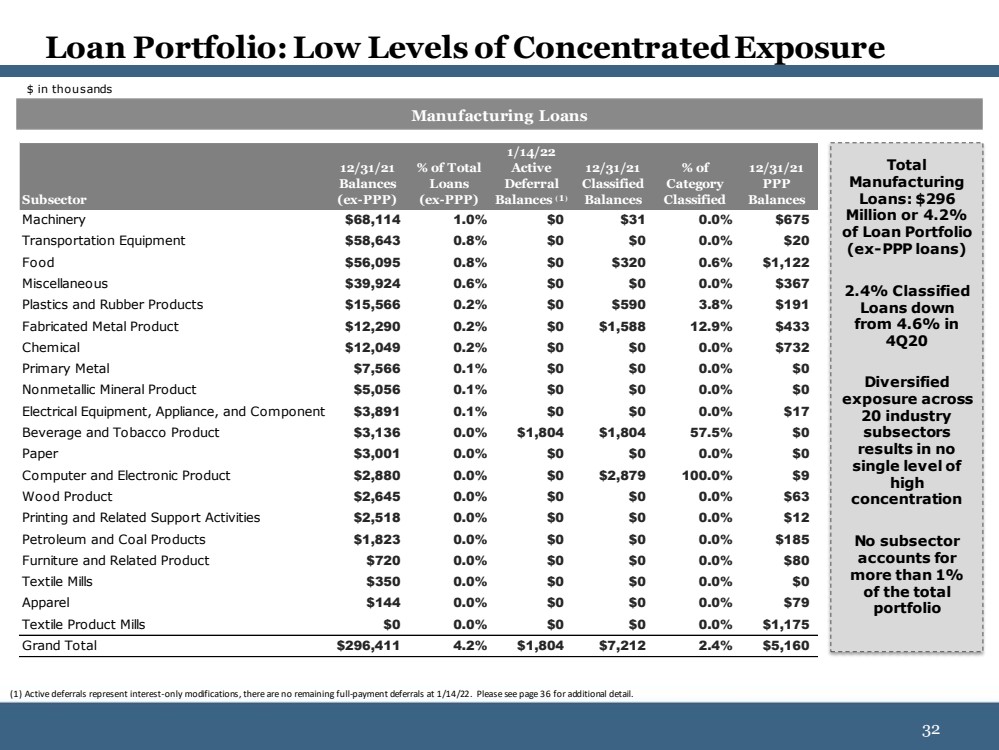
| 32 32 Loan Portfolio: Low Levels of Concentrated Exposure Manufacturing Loans Total Manufacturing Loans: $ 296 Million or 4 ..2 % of Loan Portfolio (ex - PPP loans) 2.4% Classified Loans down from 4.6% in 4Q20 Diversified exposure across 20 industry subsectors results in no single level of high concentration No subsector accounts for more than 1% of the total portfolio $ in thousands (1) Active deferrals represent interest - only modifications, there are no remaining full - payment deferrals at 1/14/22. Please se e page 36 for additional detail. Subsector 12/31/21 Balances (ex-PPP) % of Total Loans (ex-PPP) 1/14/22 Active Deferral Balances ⁽ ¹ ⁾ 12/31/21 Classified Balances % of Category Classified 12/31/21 PPP Balances Machinery $68,114 1.0% $0 $31 0.0% $675 Transportation Equipment $58,643 0.8% $0 $0 0.0% $20 Food $56,095 0.8% $0 $320 0.6% $1,122 Miscellaneous $39,924 0.6% $0 $0 0.0% $367 Plastics and Rubber Products $15,566 0.2% $0 $590 3.8% $191 Fabricated Metal Product $12,290 0.2% $0 $1,588 12.9% $433 Chemical $12,049 0.2% $0 $0 0.0% $732 Primary Metal $7,566 0.1% $0 $0 0.0% $0 Nonmetallic Mineral Product $5,056 0.1% $0 $0 0.0% $0 Electrical Equipment, Appliance, and Component $3,891 0.1% $0 $0 0.0% $17 Beverage and Tobacco Product $3,136 0.0% $1,804 $1,804 57.5% $0 Paper $3,001 0.0% $0 $0 0.0% $0 Computer and Electronic Product $2,880 0.0% $0 $2,879 100.0% $9 Wood Product $2,645 0.0% $0 $0 0.0% $63 Printing and Related Support Activities $2,518 0.0% $0 $0 0.0% $12 Petroleum and Coal Products $1,823 0.0% $0 $0 0.0% $185 Furniture and Related Product $720 0.0% $0 $0 0.0% $80 Textile Mills $350 0.0% $0 $0 0.0% $0 Apparel $144 0.0% $0 $0 0.0% $79 Textile Product Mills $0 0.0% $0 $0 0.0% $1,175 Grand Total $296,411 4.2% $1,804 $7,212 2.4% $5,160 |
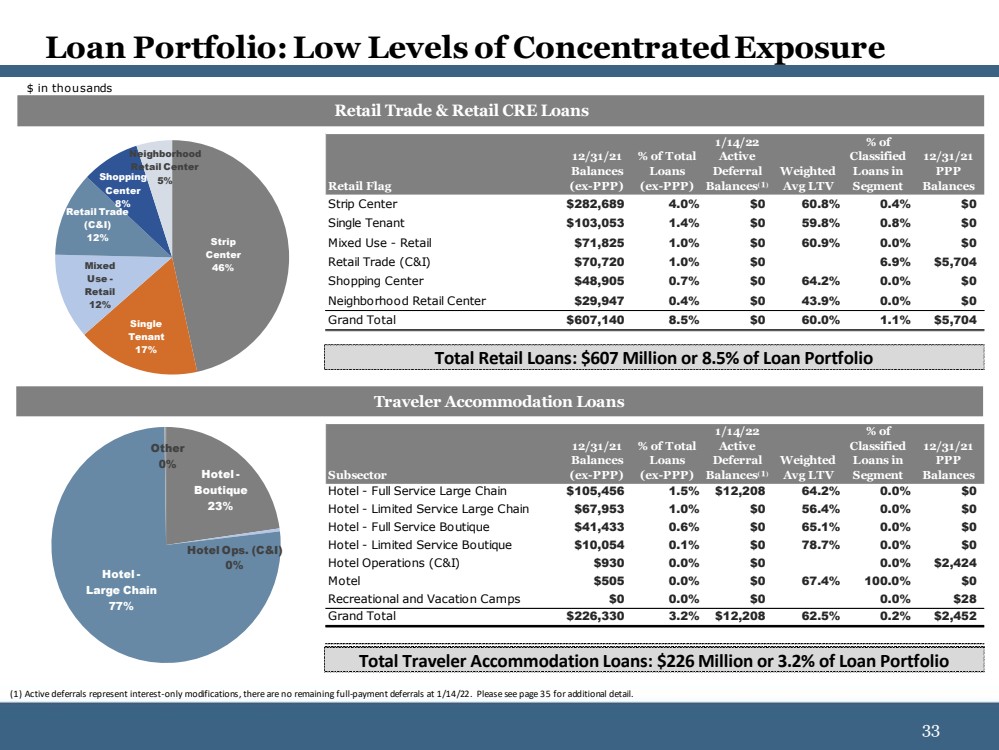
| 33 33 Loan Portfolio: Low Levels of Concentrated Exposure $ in thousands Retail Trade & Retail CRE Loans Traveler Accommodation Loans Strip Center 46% Single Tenant 17% Mixed Use - Retail 12% Retail Trade (C&I) 12% Shopping Center 8% Neighborhood Retail Center 5% Retail Flag 12/31/21 Balances (ex-PPP) % of Total Loans (ex-PPP) 1/14/22 Active Deferral Balances ⁽ ¹ ⁾ Weighted Avg LTV % of Classified Loans in Segment 12/31/21 PPP Balances Strip Center $282,689 4.0% $0 60.8% 0.4% $0 Single Tenant $103,053 1.4% $0 59.8% 0.8% $0 Mixed Use - Retail $71,825 1.0% $0 60.9% 0.0% $0 Retail Trade (C&I) $70,720 1.0% $0 6.9% $5,704 Shopping Center $48,905 0.7% $0 64.2% 0.0% $0 Neighborhood Retail Center $29,947 0.4% $0 43.9% 0.0% $0 Grand Total $607,140 8.5% $0 60.0% 1.1% $5,704 Hotel - Boutique 23% Hotel Ops. (C&I) 0% Hotel - Large Chain 77% Other 0% Subsector 12/31/21 Balances (ex-PPP) % of Total Loans (ex-PPP) 1/14/22 Active Deferral Balances ⁽ ¹ ⁾ Weighted Avg LTV % of Classified Loans in Segment 12/31/21 PPP Balances Hotel - Full Service Large Chain $105,456 1.5% $12,208 64.2% 0.0% $0 Hotel - Limited Service Large Chain $67,953 1.0% $0 56.4% 0.0% $0 Hotel - Full Service Boutique $41,433 0.6% $0 65.1% 0.0% $0 Hotel - Limited Service Boutique $10,054 0.1% $0 78.7% 0.0% $0 Hotel Operations (C&I) $930 0.0% $0 0.0% $2,424 Motel $505 0.0% $0 67.4% 100.0% $0 Recreational and Vacation Camps $0 0.0% $0 0.0% $28 Grand Total $226,330 3.2% $12,208 62.5% 0.2% $2,452 (1) Active deferrals represent interest - only modifications, there are no remaining full - payment deferrals at 1/14/22. Please se e page 35 for additional detail. Total Retail Loans: $607 Million or 8.5% of Loan Portfolio Total Traveler Accommodation Loans: $226 Million or 3.2% of Loan Portfolio |
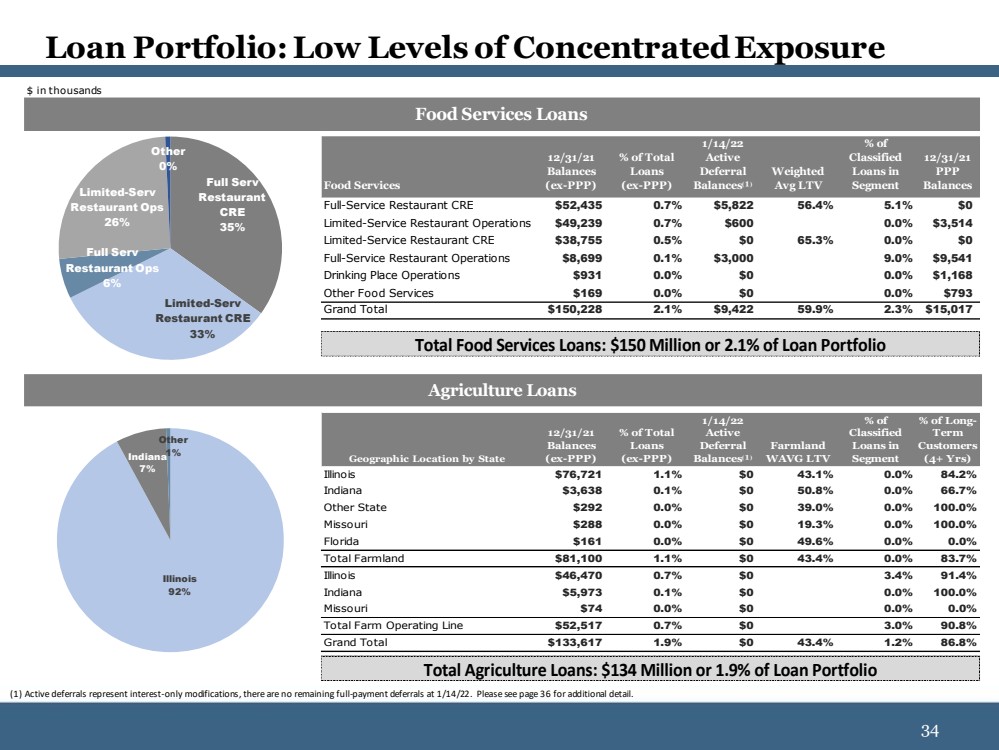
| 34 34 Loan Portfolio: Low Levels of Concentrated Exposure $ in thousands Agriculture Loans Food Services Loans Full Serv Restaurant CRE 35% Limited - Serv Restaurant CRE 33% Full Serv Restaurant Ops 6% Limited - Serv Restaurant Ops 26% Other 0% Food Services 12/31/21 Balances (ex-PPP) % of Total Loans (ex-PPP) 1/14/22 Active Deferral Balances ⁽ ¹ ⁾ Weighted Avg LTV % of Classified Loans in Segment 12/31/21 PPP Balances Full-Service Restaurant CRE $52,435 0.7% $5,822 56.4% 5.1% $0 Limited-Service Restaurant Operations $49,239 0.7% $600 0.0% $3,514 Limited-Service Restaurant CRE $38,755 0.5% $0 65.3% 0.0% $0 Full-Service Restaurant Operations $8,699 0.1% $3,000 9.0% $9,541 Drinking Place Operations $931 0.0% $0 0.0% $1,168 Other Food Services $169 0.0% $0 0.0% $793 Grand Total $150,228 2.1% $9,422 59.9% 2.3% $15,017 Illinois 92% Indiana 7% Other 1% Geographic Location by State 12/31/21 Balances (ex-PPP) % of Total Loans (ex-PPP) 1/14/22 Active Deferral Balances ⁽ ¹ ⁾ Farmland WAVG LTV % of Classified Loans in Segment % of Long- Term Customers (4+ Yrs) Illinois $76,721 1.1% $0 43.1% 0.0% 84.2% Indiana $3,638 0.1% $0 50.8% 0.0% 66.7% Other State $292 0.0% $0 39.0% 0.0% 100.0% Missouri $288 0.0% $0 19.3% 0.0% 100.0% Florida $161 0.0% $0 49.6% 0.0% 0.0% Total Farmland $81,100 1.1% $0 43.4% 0.0% 83.7% Illinois $46,470 0.7% $0 3.4% 91.4% Indiana $5,973 0.1% $0 0.0% 100.0% Missouri $74 0.0% $0 0.0% 0.0% Total Farm Operating Line $52,517 0.7% $0 3.0% 90.8% Grand Total $133,617 1.9% $0 43.4% 1.2% 86.8% (1) Active deferrals represent interest - only modifications, there are no remaining full - payment deferrals at 1/14/22. Please se e page 36 for additional detail. Total Agriculture Loans: $134 Million or 1.9% of Loan Portfolio Total Food Services Loans: $150 Million or 2.1% of Loan Portfolio |
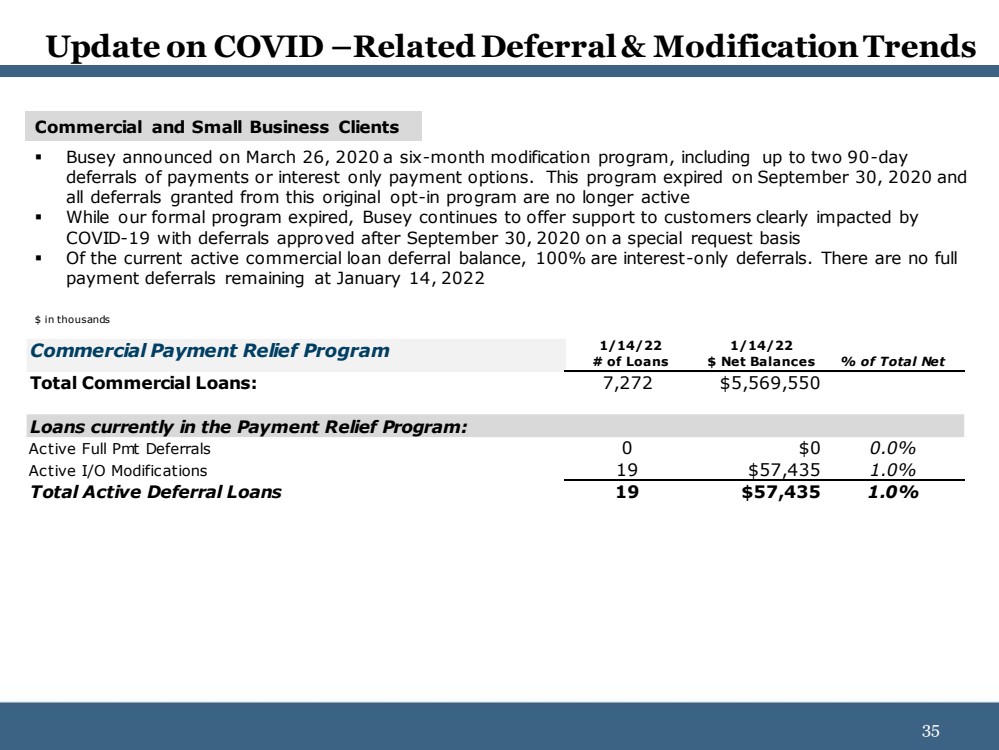
| 35 35 Update on COVID – Related Deferral & Modification Trends Commercial and Small Business Clients ▪ Busey announced on March 26, 2020 a six - month modification program, including up to two 90 - day deferrals of payments or interest only payment options. This program expired on September 30, 2020 and all deferrals granted from this original opt - in program are no longer active ▪ While our formal program expired, Busey continues to offer support to customers clearly impacted by COVID - 19 with deferrals approved after September 30, 2020 on a special request basis ▪ Of the current active commercial loan deferral balance, 100% are interest - only deferrals. There are no full payment deferrals remaining at January 14, 2022 $ in thousands Commercial Payment Relief Program 1/14/22 # of Loans 1/14/22 $ Net Balances % of Total Net Total Commercial Loans: 7,272 $5,569,550 Loans currently in the Payment Relief Program: Active Full Pmt Deferrals 0 $0 0.0% Active I/O Modifications 19 $57,435 1.0% Total Active Deferral Loans 19 $57,435 1.0% |
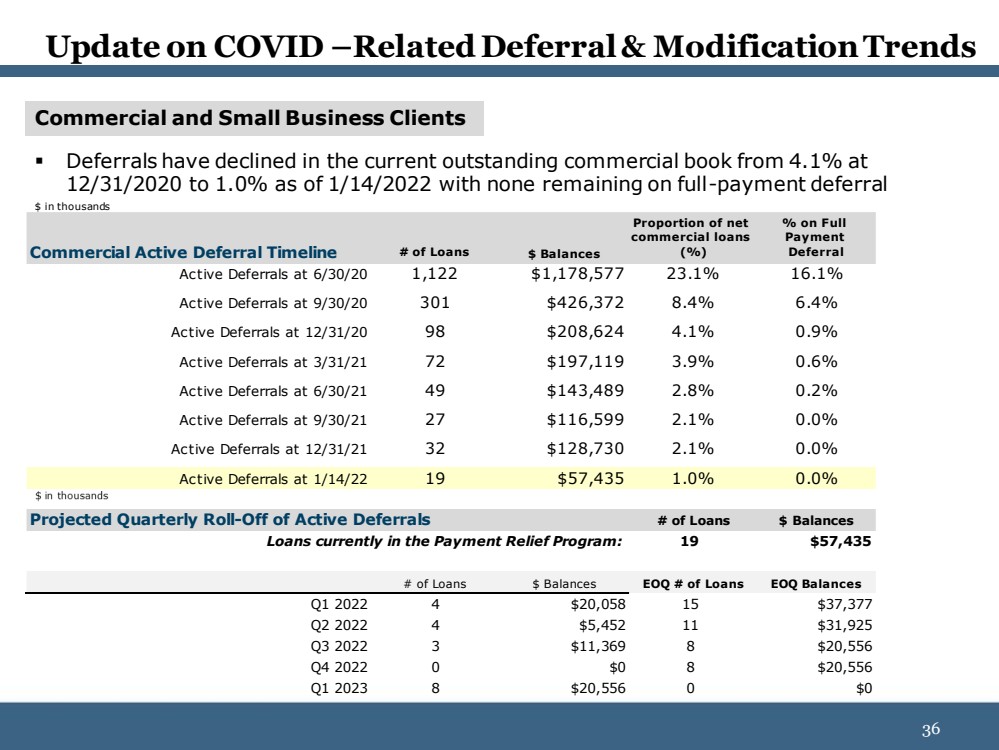
| 36 36 Update on COVID – Related Deferral & Modification Trends Commercial and Small Business Clients ▪ Deferrals have declined in the current outstanding commercial book from 4.1% at 12/31/2020 to 1.0% as of 1/14/2022 with none remaining on full - payment deferral $ in thousands Commercial Active Deferral Timeline # of Loans $ Balances Proportion of net commercial loans (%) % on Full Payment Deferral Active Deferrals at 6/30/20 1,122 $1,178,577 23.1% 16.1% Active Deferrals at 9/30/20 301 $426,372 8.4% 6.4% Active Deferrals at 12/31/20 98 $208,624 4.1% 0.9% Active Deferrals at 3/31/21 72 $197,119 3.9% 0.6% Active Deferrals at 6/30/21 49 $143,489 2.8% 0.2% Active Deferrals at 9/30/21 27 $116,599 2.1% 0.0% Active Deferrals at 12/31/21 32 $128,730 2.1% 0.0% Active Deferrals at 1/14/22 19 $57,435 1.0% 0.0% Projected Quarterly Roll-Off of Active Deferrals # of Loans $ Balances 19 $57,435 Next Reg Pmt Q # of Loans $ Balances EOQ # of Loans EOQ Balances Q1 2022 4 $20,058 15 $37,377 Q2 2022 4 $5,452 11 $31,925 Q3 2022 3 $11,369 8 $20,556 Q4 2022 0 $0 8 $20,556 Q1 2023 8 $20,556 0 $0 Loans currently in the Payment Relief Program: |
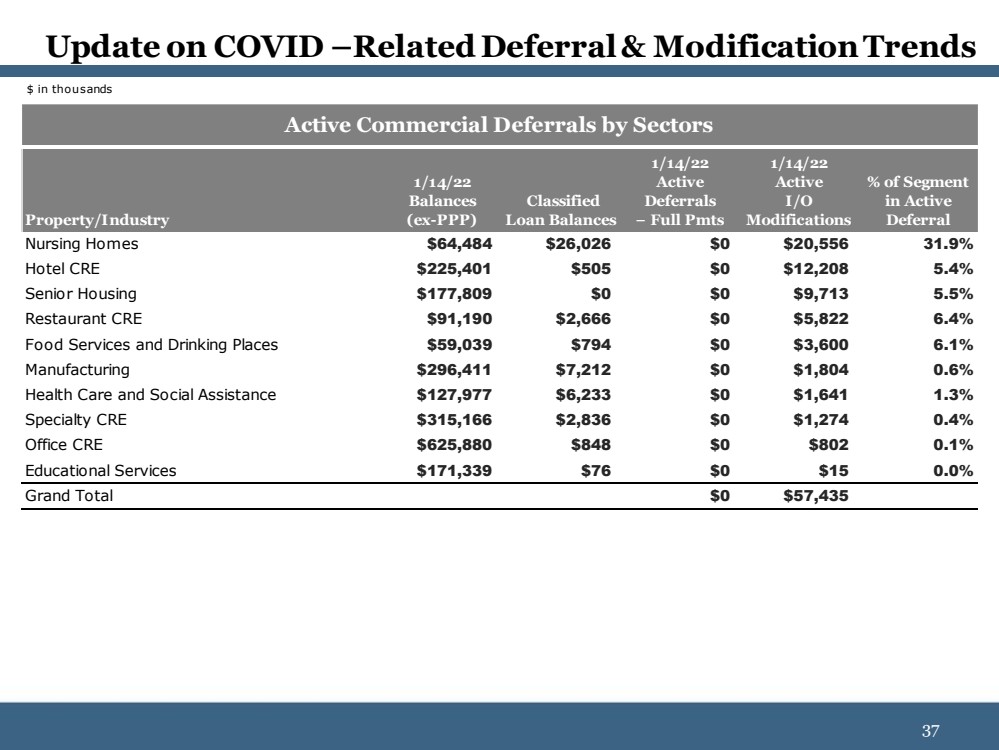
| 37 37 Update on COVID – Related Deferral & Modification Trends $ in thousands Property/Industry 1/14/22 Balances (ex-PPP) Classified Loan Balances 1/14/22 Active Deferrals − Full Pmts 1/14/22 Active I/O Modifications % of Segment in Active Deferral Nursing Homes $64,484 $26,026 $0 $20,556 31.9% Hotel CRE $225,401 $505 $0 $12,208 5.4% Senior Housing $177,809 $0 $0 $9,713 5.5% Restaurant CRE $91,190 $2,666 $0 $5,822 6.4% Food Services and Drinking Places $59,039 $794 $0 $3,600 6.1% Manufacturing $296,411 $7,212 $0 $1,804 0.6% Health Care and Social Assistance $127,977 $6,233 $0 $1,641 1.3% Specialty CRE $315,166 $2,836 $0 $1,274 0.4% Office CRE $625,880 $848 $0 $802 0.1% Educational Services $171,339 $76 $0 $15 0.0% Grand Total $0 $57,435 Active Commercial Deferrals by Sectors |
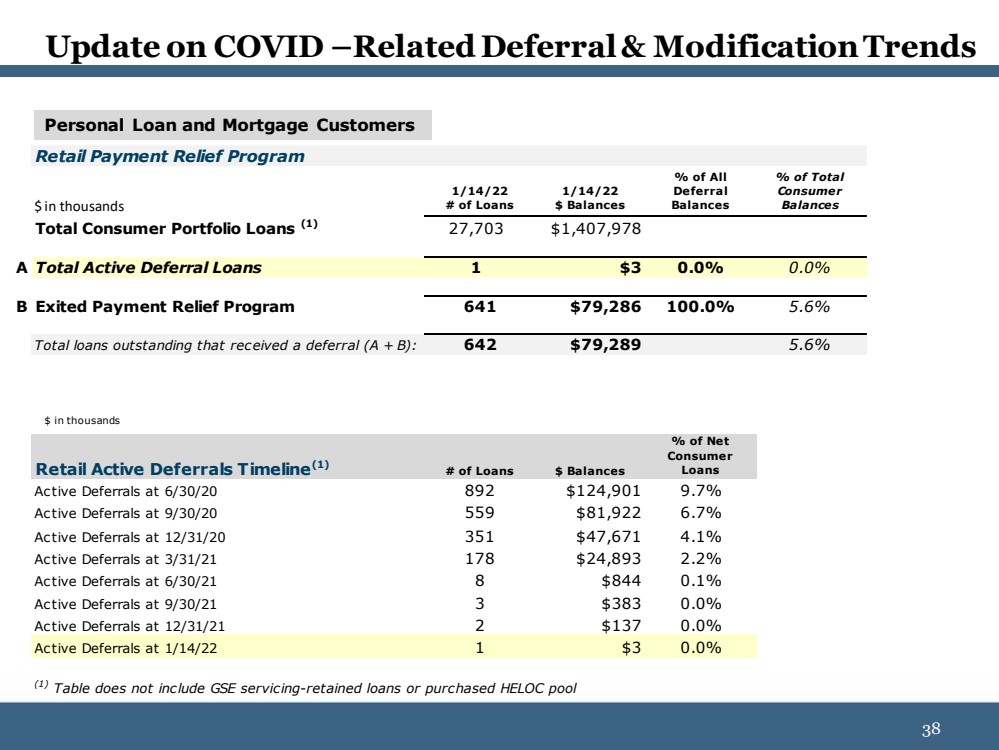
| 38 38 Update on COVID – Related Deferral & Modification Trends Personal Loan and Mortgage Customers $ in thousands Retail Payment Relief Program $ in thousands 1/14/22 # of Loans 1/14/22 $ Balances % of All Deferral Balances % of Total Consumer Balances Total Consumer Portfolio Loans (1) 27,703 $1,407,978 A Total Active Deferral Loans 1 $3 0.0% 0.0% B Exited Payment Relief Program 641 $79,286 100.0% 5.6% Total loans outstanding that received a deferral (A + B): 642 $79,289 5.6% Retail Active Deferrals Timeline (1) # of Loans $ Balances % of Net Consumer Loans Active Deferrals at 6/30/20 892 $124,901 9.7% Active Deferrals at 9/30/20 559 $81,922 6.7% Active Deferrals at 12/31/20 351 $47,671 4.1% Active Deferrals at 3/31/21 178 $24,893 2.2% Active Deferrals at 6/30/21 8 $844 0.1% Active Deferrals at 9/30/21 3 $383 0.0% Active Deferrals at 12/31/21 2 $137 0.0% Active Deferrals at 1/14/22 1 $3 0.0% (1) Table does not include GSE servicing-retained loans or purchased HELOC pool |
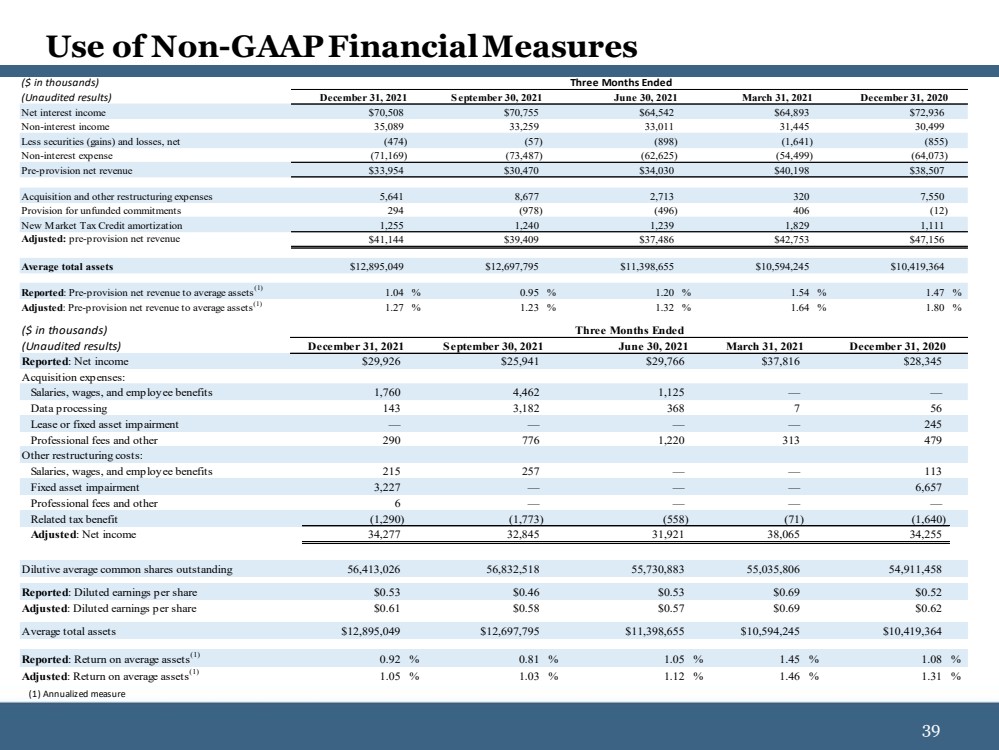
| 39 39 Use of Non - GAAP Financial Measures (1) Annualized measure ($ in thousands) (Unaudited results) December 31, 2021 September 30, 2021 June 30, 2021 March 31, 2021 December 31, 2020 Reported : Net income $29,926 $25,941 $29,766 $37,816 $28,345 Acquisition expenses: Salaries, wages, and employee benefits 1,760 4,462 1,125 — — Data processing 143 3,182 368 7 56 Lease or fixed asset impairment — — — — 245 Professional fees and other 290 776 1,220 313 479 Other restructuring costs: Salaries, wages, and employee benefits 215 257 — — 113 Fixed asset impairment 3,227 — — — 6,657 Professional fees and other 6 — — — — Related tax benefit (1,290) (1,773) (558) (71) (1,640) Adjusted : Net income 34,277 32,845 31,921 38,065 34,255 Dilutive average common shares outstanding 56,413,026 56,832,518 55,730,883 55,035,806 54,911,458 Reported : Diluted earnings per share $0.53 $0.46 $0.53 $0.69 $0.52 Adjusted : Diluted earnings per share $0.61 $0.58 $0.57 $0.69 $0.62 Average total assets $12,895,049 $12,697,795 $11,398,655 $10,594,245 $10,419,364 Reported : Return on average assets (1) 0.92 % 0.81 % 1.05 % 1.45 % 1.08 % Adjusted : Return on average assets (1) 1.05 % 1.03 % 1.12 % 1.46 % 1.31 % Three Months Ended ($ in thousands) (Unaudited results) December 31, 2021 September 30, 2021 June 30, 2021 March 31, 2021 December 31, 2020 Net interest income $70,508 $70,755 $64,542 $64,893 $72,936 Non-interest income 35,089 33,259 33,011 31,445 30,499 Less securities (gains) and losses, net (474) (57) (898) (1,641) (855) Non-interest expense (71,169) (73,487) (62,625) (54,499) (64,073) Pre-provision net revenue $33,954 $30,470 $34,030 $40,198 $38,507 Acquisition and other restructuring expenses 5,641 8,677 2,713 320 7,550 Provision for unfunded commitments 294 (978) (496) 406 (12) New Market Tax Credit amortization 1,255 1,240 1,239 1,829 1,111 Adjusted: pre-provision net revenue $41,144 $39,409 $37,486 $42,753 $47,156 Average total assets $12,895,049 $12,697,795 $11,398,655 $10,594,245 $10,419,364 Reported : Pre-provision net revenue to average assets (1) 1.04 % 0.95 % 1.20 % 1.54 % 1.47 % Adjusted : Pre-provision net revenue to average assets (1) 1.27 % 1.23 % 1.32 % 1.64 % 1.80 % Three Months Ended |
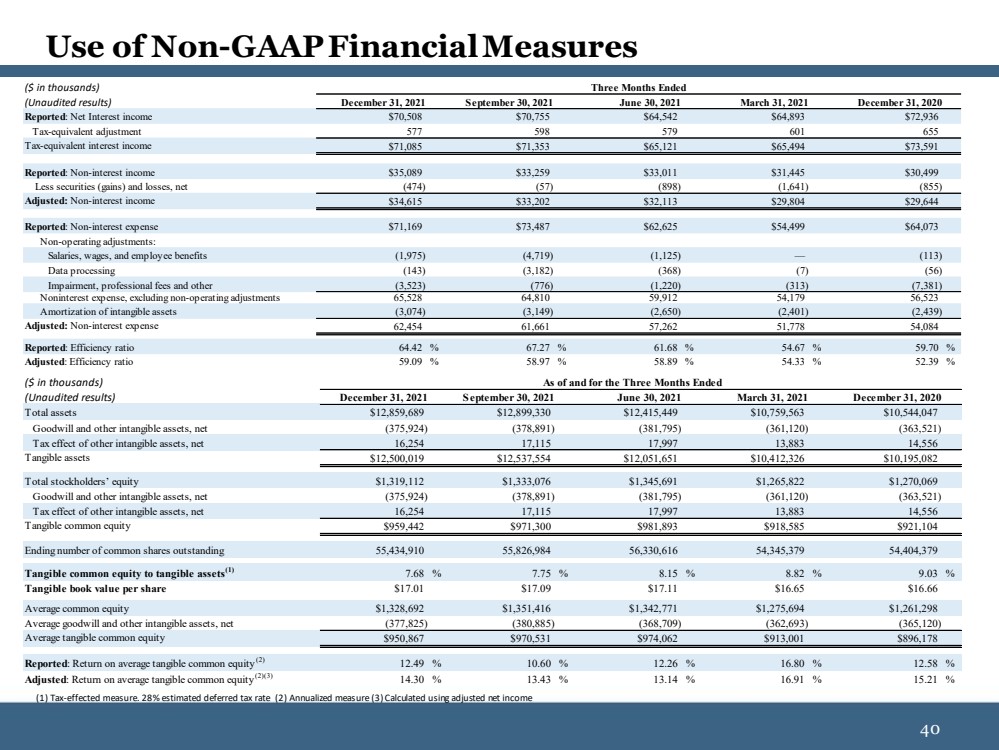
| 40 40 Use of Non - GAAP Financial Measures (1) Tax - effected measure. 28% estimated deferred tax rate (2) Annualized measure (3) Calculated using adjusted net income ($ in thousands) (Unaudited results) December 31, 2021 September 30, 2021 June 30, 2021 March 31, 2021 December 31, 2020 Total assets $12,859,689 $12,899,330 $12,415,449 $10,759,563 $10,544,047 Goodwill and other intangible assets, net (375,924) (378,891) (381,795) (361,120) (363,521) Tax effect of other intangible assets, net 16,254 17,115 17,997 13,883 14,556 Tangible assets $12,500,019 $12,537,554 $12,051,651 $10,412,326 $10,195,082 Total stockholders’ equity $1,319,112 $1,333,076 $1,345,691 $1,265,822 $1,270,069 Goodwill and other intangible assets, net (375,924) (378,891) (381,795) (361,120) (363,521) Tax effect of other intangible assets, net 16,254 17,115 17,997 13,883 14,556 Tangible common equity $959,442 $971,300 $981,893 $918,585 $921,104 Ending number of common shares outstanding 55,434,910 55,826,984 56,330,616 54,345,379 54,404,379 Tangible common equity to tangible assets (1) 7.68 % 7.75 % 8.15 % 8.82 % 9.03 % Tangible book value per share $17.01 $17.09 $17.11 $16.65 $16.66 Average common equity $1,328,692 $1,351,416 $1,342,771 $1,275,694 $1,261,298 Average goodwill and other intangible assets, net (377,825) (380,885) (368,709) (362,693) (365,120) Average tangible common equity $950,867 $970,531 $974,062 $913,001 $896,178 Reported : Return on average tangible common equity (2) 12.49 % 10.60 % 12.26 % 16.80 % 12.58 % Adjusted : Return on average tangible common equity (2)(3) 14.30 % 13.43 % 13.14 % 16.91 % 15.21 % As of and for the Three Months Ended ($ in thousands) (Unaudited results) December 31, 2021 September 30, 2021 June 30, 2021 March 31, 2021 December 31, 2020 Reported : Net Interest income $70,508 $70,755 $64,542 $64,893 $72,936 Tax-equivalent adjustment 577 598 579 601 655 Tax-equivalent interest income $71,085 $71,353 $65,121 $65,494 $73,591 Reported : Non-interest income $35,089 $33,259 $33,011 $31,445 $30,499 Less securities (gains) and losses, net (474) (57) (898) (1,641) (855) Adjusted: Non-interest income $34,615 $33,202 $32,113 $29,804 $29,644 Reported : Non-interest expense $71,169 $73,487 $62,625 $54,499 $64,073 Non-operating adjustments: Salaries, wages, and employee benefits (1,975) (4,719) (1,125) — (113) Data processing (143) (3,182) (368) (7) (56) Impairment, professional fees and other (3,523) (776) (1,220) (313) (7,381) Noninterest expense, excluding non-operating adjustments 65,528 64,810 59,912 54,179 56,523 Amortization of intangible assets (3,074) (3,149) (2,650) (2,401) (2,439) Adjusted: Non-interest expense 62,454 61,661 57,262 51,778 54,084 Reported : Efficiency ratio 64.42 % 67.27 % 61.68 % 54.67 % 59.70 % Adjusted : Efficiency ratio 59.09 % 58.97 % 58.89 % 54.33 % 52.39 % Three Months Ended |