Exhibit 13
financial discussion
OVERVIEW FOR 2003
This Financial Discussion should be read in conjunction with the information on Forward-Looking Statements and Risk Factors found at the end of the Financial Discussion.
Despite being faced with continuing challenges from the global economic environment, we delivered a very strong financial performance in 2003. Our ability to leverage our wide range of offerings resulted in double-digit earnings per share growth, strong operating cash flow, a healthy return on investment and an improved balance sheet for 2003. We continue to successfully implement our Circle the Customer – Circle the Globe growth strategy to generate strong financial results.
Several important items impacted our financial results in 2003.
Operating Performance
• We continued to find new markets in which to grow our business. Strong sales growth in Kay resulted from servicing the developing fast-casual restaurant market segment and food retail business. Professional Products introduced the first solid-based product offering for surgical instrument cleaning in the acute care market segment. Our International locations continue to expand the successful Pest Elimination business to new geographies.
• We made appropriate decisions to improve the profitability of certain business units. We have exited low-margin accounts within Professional Products, Textile Care and areas in Europe. This has negatively impacted sales growth in 2003.
• We continued to invest in future growth during 2003. This included investing in our sales-and-service force and in acquiring such businesses as Adams Healthcare. We also made investments to improve the service efficiency of GCS Service. While GCS Service had lower sales and an operating loss in 2003, we have better positioned the business for the long term.
• Our sales associates grew our business by gaining new independent and chain accounts, as well as growing business at existing customers.
• We faced competition in our markets and we countered with our innovative product offerings and our superior customer service.
Financial Performance
• Operating cash flow in 2003 continued to be very strong and allowed us to make acquisitions, pay down $108 million of debt, reacquire over $227 million of our common stock and make $75 million in additional voluntary contributions to our U.S. pension plan.
• Currency translation had a positive impact on our financial results in 2003, adding approximately $12 million to net income.
• An improvement in our annual effective income tax rate from 39.8 percent in 2002 to 38.1 percent in 2003 added approximately $7 million to net income. The acquisition of our former European joint venture business at the end of fiscal year 2001 has allowed us to have a more tax efficient structure.
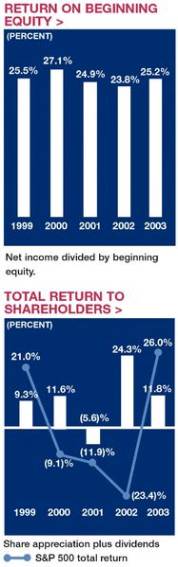
The combination of all of these factors helped us exceed all three of our long-term financial objectives in 2003. These objectives are (i) 15 percent growth in diluted income per common share, (ii) 20 percent return on beginning shareholders’ equity and (iii) an investment grade or “A” rated balance sheet. Specifically, here is what we accomplished:
• Diluted net income per share was $1.06 for 2003, up 33 percent from $0.80 in 2002. Included in 2003 net income is a gain of $11.1 million, or $6.7 million net of tax, from the sale of an equity investment. For 2002, net income includes (i) a transitional impairment charge of $4.0 million after tax ($0.02 per diluted share) from the adoption of Statement of Financial Accounting Standards (SFAS) No. 142, (ii) a one-time gain of $3.5 million after tax from benefit plan changes, (iii) special charges of $32.4 million after-tax related to restructuring activities and the integration of our European operations and (iv) a gain of $1.9 million after tax ($0.01 per diluted share) from discontinued operations. These items are of a non-recurring nature and are not necessarily indicative of future operating results.
• Return on beginning shareholders’ equity was 25 percent for 2003 compared with 24 percent in 2002. The items discussed above affected the return for 2002. Adjusting for these items, return on beginning shareholders’ equity was 27 percent. This was the twelfth consecutive year we exceeded our long-term financial objective of a 20 percent return on beginning shareholders’ equity.
• We maintained our debt rating within the “A” categories of the major rating agencies during 2003.
• As a result of our continued strong financial performance and related stock price increases, on June 6, 2003, we paid a two-for-one stock split in the form of a 100 percent stock dividend to shareholders of record on May 23, 2003. All per share, shares outstanding and market price data have been adjusted to reflect the stock split.
2004 Expectations
• We expect to acquire additional businesses which fit with our Circle the Customer – Circle the Globe growth strategy.
• We remain concerned about the possible adverse impact of global terrorism, unforeseen hostilities and public health epidemics on the sensitive travel and tourism industries.
• We expect currency translation to have a favorable impact on 2004 but to a lesser extent than we experienced in 2003.
20
CRITICAL ACCOUNTING POLICIES AND ESTIMATES
In May 2002, the Securities & Exchange Commission (SEC) issued a proposed rule: Disclosure in Management’s Discussion and Analysis about the Application of Critical Accounting Policies. Although the SEC has not issued a final rule yet, the following discussion has been prepared on the basis of the guidelines in the SEC rule proposal. If adopted as proposed, the rule would require disclosures connected with “estimates a company makes in applying its accounting policies.” However, such discussion would be limited to “critical accounting estimates,” or those that management believes meet two criteria in the proposal: “First, the accounting estimate must require a company to make assumptions about matters that are highly uncertain at the time the accounting estimate is made. Second, different estimates that the company reasonably could have used for the accounting estimate in the current period, or changes in the accounting estimate that are reasonably likely to occur from period to period, must have a material impact on the presentation of the company’s financial condition, changes in financial condition or results of operations.” Besides estimates that meet the “critical” estimate criteria, the company makes many other accounting estimates in preparing its financial statements and related disclosures. All estimates, whether or not deemed critical, affect reported amounts of assets, liabilities, revenues and expenses as well as disclosures of contingent assets and liabilities. Estimates are based on experience and other information available prior to the issuance of the financial statements. Materially different results can occur as circumstances change and additional information becomes known, even from estimates not deemed “critical” under the SEC rule proposal.
Revenue Recognition
We recognize revenue as services are performed or on product sales at the time title transfers to the customer. We record estimated reductions to revenue for customer programs and incentive offerings including pricing arrangements, promotions and other volume-based incentives at the time of sale. If market conditions were to decline, we may increase customer incentive offerings, which could reduce sales and gross profit margins at the time the incentive is offered.
Valuation Allowances and Accrued Liabilities
We estimate sales returns and allowances by analyzing historical returns and credits, and apply these trend rates to the most recent 12 months’ sales data to calculate estimated reserves for future credits. We estimate the allowance for doubtful accounts by analyzing accounts receivable balances by age, applying historical trend rates to the most recent 12 months’ sales, less actual write-offs to date. In addition, our estimates also include separately providing for 100 percent of specific customer balances when it is deemed probable that the balance is uncollectible. Actual results could differ from these estimates under different assumptions.
Estimates used to record liabilities related to pending litigation and environmental claims are based on our best estimate of probable future costs. We record the amounts that represent the points in the range of estimates that we believe are most probable or the minimum amounts when no amount within the range is a better estimate than any other amount. Potential insurance reimbursements are not anticipated in our accruals for environmental liabilities. While the final resolution of litigation and environmental contingencies could result in amounts different than current accruals, and therefore have an impact on our consolidated financial results in a future reporting period, we believe the ultimate outcome will not have a significant effect on our consolidated results of operations, financial position or cash flows.
Actuarially Determined Liabilities
The measurement of our pension and postretirement benefit obligations are dependent on a variety of assumptions determined by management and used by our actuaries. These assumptions affect the amount and timing of future contributions and expenses.
The assumptions used in developing the required estimates include discount rate, projected salary and health care cost increases, expected return or earnings on assets, retirement rates and mortality rates. The discount rate assumption is based on the investment yields available at year-end on corporate long-term bonds rated AA. Projected salary and health care cost increases are based on our long-term actual experience, the near-term outlook and assumed inflation. The expected return on plan assets reflects asset allocations, investment strategies and the views of investment managers over a long-term perspective. Retirement and mortality rates are based primarily on actual plan experience. The effects of actual results differing from our assumptions are accumulated and amortized over future periods and, therefore, generally affect our recognized expense in future periods. For 2003, our discount rates and projected salary increases used to determine our pension and postretirement obligations were lower than in 2002, while our expected return on plan assets remained unchanged.
We are self-insured in North America for most workers compensation, general liability and automotive liability losses, subject to per occurrence and aggregate annual liability limitations. We are insured for losses in excess of these limitations. We are also self-insured for health care claims for eligible participating employees, subject to certain deductibles and limitations. We determine our liabilities for claims incurred but not reported on an actuarial basis. A change in these assumptions would cause reported results to differ.
Income Taxes
Judgment is required to determine the annual effective income tax rate, deferred tax assets and liabilities and any valuation allowances recorded against net deferred tax assets. Our effective income tax rate is based on annual income, statutory tax rates and tax planning opportunities available in the various jurisdictions in which we operate. We establish liabilities or reserves when we believe that certain positions are likely to be challenged by authorities and we may not succeed, despite our belief that our tax return positions are fully supportable. We adjust these reserves in light of changing facts and circumstances, such as the progress of a tax audit. Our annual effective income tax rate includes the impact of reserve provisions and changes to reserves that we consider appropriate. This annual rate is then applied to our quarterly operating results. In the event that there is a significant one-time item recognized in our operating results, the tax attributable to that item would be separately calculated and recorded in the same period as the one-time item.
Tax regulations require items to be included in our tax returns at different times than the items are reflected in our financial statements. As a result, the effective income tax rate reflected in our financial statements differs from that reported in our tax returns. Some of these differences are permanent, such as expenses that are not deductible on our tax return, and some are temporary differences, such as depreciation expense. Temporary differences create deferred tax assets and liabilities. Deferred tax assets generally represent items that can be used as a
21
tax deduction or credit in our tax return in future years for which we have already recorded the tax benefit in our income statement. We establish valuation allowances for our deferred tax assets when the amount of expected future taxable income is not likely to support the utilization of the deduction or credit. Deferred tax liabilities generally represent items for which we have already taken a deduction in our tax return, but have not yet recognized that tax benefit in our financial statements. We have not recognized any deferred tax liabilities on undistributed international earnings because if those earnings were remitted to the United States, we believe any applicable income taxes would be substantially offset by available foreign tax credits.
A number of years may elapse before a particular tax matter, for which we have established a reserve, is audited and finally resolved. The number of tax years with open tax audits varies depending on the tax jurisdiction. In the United States, the Internal Revenue Service is currently examining our tax returns for 1999 through 2001. While it is often difficult to predict the final outcome or the timing of resolution of any particular tax matter, we believe that our reserves reflect the probable outcome of known tax contingencies. Unfavorable settlement of any particular issue would require the use of cash. Favorable resolution could result in reduced income tax expense reported in the financial statements in the future. Our tax reserves are generally presented in the balance sheet within other non-current liabilities.
Long-Lived and Intangible Assets
We periodically review our long-lived and intangible assets for impairment and assess whether significant events or changes in business circumstances indicate that the carrying value of the assets may not be recoverable. This could occur when the carrying amount of an asset exceeds the anticipated future undiscounted cash flows expected to result from the use of the asset and its eventual disposition. The amount of the impairment loss to be recorded, if any, is calculated as the excess of the asset’s carrying value over its estimated fair value. We also periodically reassess the estimated remaining useful lives of our long-lived assets. Changes to estimated useful lives would impact the amount of depreciation and amortization expense recorded in earnings. We have experienced no significant changes in the carrying value of our long-lived assets.
Statement of Financial Accounting Standards (SFAS) No. 142, Goodwill and Other Intangible Assets, requires that goodwill and certain intangible assets be assessed for impairment using fair value measurement techniques. Specifically, goodwill impairment is determined using a two-step process. Both the first step of determining the fair value of a reporting unit and the second step of determining the fair value of individual assets and liabilities of a reporting unit (including unrecognized intangible assets) are judgmental in nature and often involve the use of significant estimates and assumptions. Estimates of fair value are primarily determined using discounted cash flows, market comparisons and recent transactions. These valuation methodologies use significant estimates and assumptions, which include projected future cash flows (including timing), discount rate reflecting the risk inherent in future cash flows, perpetual growth rate, and determination of appropriate market comparables. Of the total goodwill included in our consolidated balance sheet, 15 percent is recorded in our U.S. Cleaning & Sanitizing reportable segment, 6 percent in our U.S. Other Services segment and 79 percent in our International Cleaning & Sanitizing segment.
In 2002, SFAS No. 142 became effective and as a result, we ceased to amortize goodwill in 2002. We were required to perform an initial impairment review of our goodwill at the beginning of 2002 under the guidelines of SFAS No. 142. The result of testing goodwill for impairment was a non-cash charge of $4.0 million after-tax ($0.02 per share). All of the impairment charge related to our Africa/Export operations due to the difficult economic environment in that region. We have continued to review our goodwill for impairment on an annual basis for all reporting units, including businesses reporting losses such as GCS Service, under the guidelines of SFAS No. 142.
Functional Currencies
In preparing the consolidated financial statements, we are required to translate the financial statements of our foreign subsidiaries from the currency in which they keep their accounting records, generally the local currency, into United States dollars. Assets and liabilities of these operations are translated at the exchange rates in effect at each fiscal year end. The translation adjustments related to assets and liabilities that arise from the use of differing exchange rates from period to period are included in accumulated other comprehensive income (loss) in shareholders’ equity. Income statement accounts are translated at the average rates of exchange prevailing during the year. We evaluate our International operations based on fixed rates of exchange; however, the different exchange rates from period to period impact the amount of reported income from our consolidated operations.
OPERATING RESULTS
Consolidated
(thousands, except per share) |
| 2003 |
| 2002 |
| 2001 |
| |||
|
|
|
|
|
|
|
| |||
Net sales |
| $ | 3,761,819 |
| $ | 3,403,585 |
| $ | 2,320,710 |
|
Operating income |
| $ | 482,658 |
| $ | 395,866 |
| $ | 318,179 |
|
Income |
|
|
|
|
|
|
| |||
Continuing operations before change in accounting |
| $ | 277,348 |
| $ | 211,890 |
| $ | 188,170 |
|
Change in accounting |
|
|
| (4,002 | ) |
|
| |||
Discontinued operations |
|
|
| 1,882 |
|
|
| |||
Net income |
| $ | 277,348 |
| $ | 209,770 |
| $ | 188,170 |
|
|
|
|
|
|
|
|
| |||
Diluted income per common share |
|
|
|
|
|
|
| |||
Continuing operations before change in accounting |
| $ | 1.06 |
| $ | 0.81 |
| $ | 0.72 |
|
Change in accounting |
|
|
| (0.02 | ) |
|
| |||
Discontinued operations |
|
|
| 0.01 |
|
|
| |||
Net income |
| $ | 1.06 |
| $ | 0.80 |
| $ | 0.72 |
|
Our consolidated net sales reached $3.8 billion for 2003, an increase of 11 percent over net sales of $3.4 billion in 2002. Excluding acquisitions and divestitures, consolidated net sales increased 10 percent. Changes in currency translation positively impacted the consolidated sales growth rate by 6 percentage points, primarily due to the strength of the euro against the U.S. dollar. Sales also benefited from aggressive new account sales, new products and selling more to existing customers.
22
|
| 2003 |
| 2002 |
| 2001 |
|
|
|
|
|
|
|
|
|
Gross profit as a percent of net sales |
| 50.9 | % | 50.4 | % | 51.7 | % |
Selling, general & administrative expenses as a percent of net sales |
| 38.1 | % | 37.7 | % | 38.0 | % |
Our consolidated gross profit margin in 2003 increased over 2002. In 2002, cost of sales included $9.0 million of restructuring costs. If these costs were excluded, the gross profit margin for 2002 would have been 50.7 percent. The increase in the margin for 2003 also benefited from business mix and cost reduction actions, partially offset by poor results in GCS Service during 2003.
Selling, general and administrative expenses for 2003 increased as a percentage of sales over 2002. The increase in the 2003 expense ratio is primarily due to an increase in sales-and-service investments, rising insurance costs, increased headcount and health care costs and startup expenses related to legal entity restructuring, partially offset by cost savings initiatives.
In the first quarter of 2002, we approved plans to undertake restructuring cost-saving actions. Restructuring savings were approximately $31 million and $16 million in 2003 and 2002, respectively. Most of these savings were reinvested in the business.
(thousands) |
| 2003 |
| 2002 |
| 2001 |
| |||
|
|
|
|
|
|
|
| |||
Operating income |
| $ | 482,658 |
| $ | 395,866 |
| $ | 318,179 |
|
Operating income as a percent of net sales |
| 12.8 | % | 11.6 | % | 13.7 | % | |||
Operating income for 2003 increased 22 percent over 2002. Excluding special charges in 2002 of $46 million, operating income in 2003 increased 9 percent over 2002. Adjusting for special charges, operating income in 2002 would have been 13.0 percent of net sales. The decline in 2003 operating income margins from this level reflects increased headcount and benefit costs and investments in the sales force partially offset by favorable sales volume increases and cost reduction initiatives.
Our net income was $277 million in 2003 as compared to $210 million in 2002, an increase of 32 percent. Net income in 2003 included a gain on the sale of an equity investment of $6.7 million after tax and a reduction in previously recorded restructuring expenses of $0.8 million after tax, offset by a write-off of $1.7 million of goodwill related to an international business sold in 2003. Net income in 2002 included a gain from discontinued operations of $1.9 million after tax, offset by special charges of $28.9 million after tax and a SFAS No. 142 transitional impairment charge of $4.0 million after tax. These items are of a non-recurring nature and are not necessarily indicative of future operating results. If these items are excluded from both 2003 and 2002, net income increased 13 percent for 2003. This improvement in net income reflected good fixed-rate operating income growth in our International segment, particularly in Europe. Currency translation also positively impacted net income by approximately $12 million due primarily to the strength of the euro against the U.S. dollar. The comparison of net income also benefited from a lower effective income tax rate in 2003 which was the result of cost savings initiatives, a lower overall international rate and improved international mix. Excluding the items of a non-recurring nature previously mentioned, net income for 2003 was 7.2 percent of net sales, up slightly from 7.1 percent in 2002.
2002 compared with 2001
Our consolidated net sales reached $3.4 billion for 2002, an increase of 47 percent over net sales of $2.3 billion in 2001. Business acquisitions, primarily the acquisition of the European joint venture, contributed to the overall sales growth for 2002. Excluding acquisitions, primarily the European joint venture, consolidated net sales increased 4 percent in 2002. Sales growth was experienced in most of our divisions. Changes in currency translation negatively impacted the consolidated sales growth rate by approximately 1 percentage point for 2002. Sales results reflected aggressive selling efforts, the benefits of investments in sales force training and productivity tools and new products, which were partially offset by the poor economic environment.
Our consolidated gross profit margin in 2002 decreased from 2001. Cost of sales included restructuring costs of $9.0 million for the year ended December 31, 2002. Excluding these restructuring charges, the gross profit margin would have been 50.7 percent for 2002. The gross profit margin was also negatively affected by the acquisition and consolidation of the European joint venture. The gross profit margin for 2001 on a pro forma basis (reflecting the European joint venture on a consolidated basis) was 50.2 percent. Our gross profit margin benefited from product mix improvements and cost reduction actions.
Selling, general and administrative expenses as a percent of sales for 2002 decreased when compared to 2001. The selling, general and administrative expense ratio on a pro forma basis (reflecting the consolidation of our European joint venture and the elimination of goodwill amortization) for 2001 was 37.5 percent. The increase in 2002 over the prior year pro forma expense ratio is partially due to stronger sales, which resulted in higher commissions and incentive-based compensation. This increase was partially offset by tight cost controls and savings related to restructuring activities in 2002.
During the first quarter of 2002, management approved various restructuring and other cost-saving actions, including costs to integrate our European operations, to streamline and improve our global operations. These actions resulted in pre-tax charges of approximately $51.8 million ($32.4 million after tax) in 2002. These charges were partially offset by a curtailment gain of $5.8 million ($3.5 million after tax) attributable to certain benefit plan changes. The restructuring included (i) a reduction of our global workforce during 2002, (ii) the closing of several facilities, (iii) the discontinuance of selected product lines and (iv) other actions. The expected cost savings related to restructuring activities began in 2002. Restructuring savings were approximately $16 million ($10 million after tax) in 2002. We have reinvested most of these savings in our business. Further details related to these restructuring expenses are included in Note 3 of the notes to consolidated financial statements.
Operating income for 2002 increased by 24 percent over 2001. Excluding special charges of $46 million, operating income for 2002 was 13.0 percent of net sales. This compared to 2001 pro forma operating income (reflecting the consolidation of our European joint venture and elimination of goodwill amortization) of $404 million, or 12.7 percent of net sales. This comparison of operating income margins reflects tight cost controls, savings from cost reduction initiatives and the sale of new products.
In addition to continuing operations, a legal issue related to the disposal of a business in 1992 was resolved during 2002, resulting in
23
the recognition of a gain from discontinued operations of approximately $1.9 million (net of income tax benefit of $1.1 million) or $0.01 per diluted share.
Our net income for 2002 was $210 million. Net income included restructuring charges of $32.4 million after tax, a curtailment gain of $3.5 million after tax, a gain from discontinued operations of $1.9 million after tax and a SFAS No. 142 transitional impairment charge of $4.0 million after tax. Excluding these items, our net income for 2002 increased 28 percent over net income of $188 million in 2001. This improvement reflected good operating income growth in most of our divisions, the additional operating income generated by the acquisition of the European joint venture and the elimination of goodwill amortization. This was partially offset by higher net interest expense due to increased borrowings primarily to finance our acquisition of the European joint venture. Currency translation benefited diluted net income by $0.01 per share for 2002. As a percentage of net sales, net income for 2002 was 6.2 percent. Excluding the items of a nonrecurring nature previously mentioned, net income for 2002 was 7.1 percent of net sales, down from 8.1 percent in 2001 due to the addition of the European joint venture.
OPERATING SEGMENT PERFORMANCE
Our operating segments have similar products and services and we are organized to manage our operations geographically. Our operating segments have been aggregated into three reportable segments: United States Cleaning & Sanitizing, United States Other Services, and International Cleaning & Sanitizing. We evaluate the performance of our International operations based on fixed management rates of currency exchange. Therefore, International sales and operating income totals, as well as the International financial information included in this financial discussion, are based on translation into U.S. dollars at the fixed currency exchange rates used by management for 2003. All other accounting policies of the reportable segments are consistent with accounting principles generally accepted in the United States of America and the accounting policies of the company described in Note 2 of the notes to consolidated financial statements. Additional information about our reportable segments is included in Note 16 of the notes to consolidated financial statements.
Sales by Operating Segment
(thousands) |
| 2003 |
| 2002 |
| 2001 |
| |||
|
|
|
|
|
|
|
| |||
Net sales |
|
|
|
|
|
|
| |||
United States |
|
|
|
|
|
|
| |||
Cleaning & Sanitizing |
| $ | 1,694,323 |
| $ | 1,615,171 |
| $ | 1,548,882 |
|
Other Services |
| 320,444 |
| 308,329 |
| 273,020 |
| |||
Total United States |
| 2,014,767 |
| 1,923,500 |
| 1,821,902 |
| |||
International Cleaning & Sanitizing |
| 1,560,557 |
| 1,497,935 |
| 474,089 |
| |||
Total |
| 3,575,324 |
| 3,421,435 |
| 2,295,991 |
| |||
Effect of foreign currency translation |
| 186,495 |
| (17,850 | ) | 24,719 |
| |||
Consolidated |
| $ | 3,761,819 |
| $ | 3,403,585 |
| $ | 2,320,710 |
|
The following chart presents the comparative percentage change in net sales for each of our operating segments for 2003 and 2002 (excluding Europe in 2002). European operations have been excluded in the percent change for 2002 since they were consolidated for the first time in 2002, making the percentage comparison not meaningful.
Sales Growth Information
|
| Percent Change from Prior Year |
| ||
|
| 2003 |
| 2002 |
|
|
|
|
|
|
|
Net sales |
|
|
|
|
|
United States Cleaning & Sanitizing |
|
|
|
|
|
Institutional |
| 5 | % | 6 | % |
Kay |
| 12 |
| 9 |
|
Textile Care |
| (10 | ) | 3 |
|
Professional Products |
| 9 |
| (4 | ) |
Water Care Services |
| 4 |
| (3 | ) |
Vehicle Care |
| 4 |
| 3 |
|
Food & Beverage |
| 3 |
| 1 |
|
Total United States Cleaning & Sanitizing |
| 5 | % | 4 | % |
United States Other Services |
|
|
|
|
|
Pest Elimination |
| 11 | % | 7 | % |
GCS Service |
| (7 | ) | 19 |
|
Total United States Other Services |
| 4 | % | 13 | % |
Total United States |
| 5 | % | 6 | % |
International Cleaning & Sanitizing |
|
|
|
|
|
Europe |
| 4 | % | — | % |
Asia Pacific |
| 3 |
| 2 |
|
Latin America |
| 7 |
| 9 |
|
Canada |
| 4 |
| 8 |
|
Other |
| 21 |
| 25 |
|
Total International Cleaning & Sanitizing (excluding Europe in 2002) |
| 4 | % | 7 | % |
Consolidated (excluding Europe in 2002) |
| 11 | % | 5 | % |
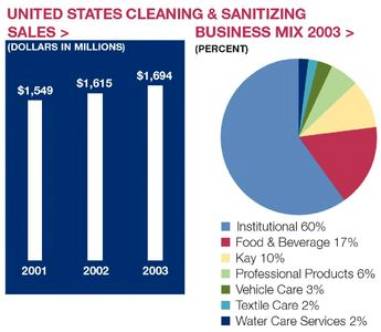
Sales of our United States Cleaning & Sanitizing operations were $1.7 billion in 2003 and increased 5 percent over net sales of $1.6 billion in 2002. Business acquisitions had no effect on the growth in sales for 2003. Sales benefited from good growth in our Kay and Professional Products operations, which were partially offset by lower sales in Textile Care. The increase in our Institutional division reflected its continued efforts to generate new accounts, the successful introduction of new products and improved customer service. Trends in the foodservice, hospitality and healthcare industries were challenging in early 2003 but showed signs of improvement late in the year. Kay's sales increase reflects solid growth in its food retail services business and to quickservice restaurants as well as through the introduction of new products and programs. Textile Care sales decreased, particularly to distributors, due
24
to soft industry demand and strong competition within the industry. Textile Care is focusing on improving its service and reestablishing its relationships with distributors in an effort to increase sales growth. Textile Care is also continuing to take a selective approach to new customers to ensure they meet our profit guidelines. Sales of Professional Products increased due to strong gains in the healthcare market offsetting the continuing phase-out of the specialty business. Our introduction of the first solid-based product offering to the acute care market in the second quarter of 2003 helped drive the sales growth in the healthcare market. Professional Products’ janitorial sales were also positively impacted in 2003 by a long-term supply agreement that began in December 2002. Effective January 2004, our Professional Products division was reorganized to better serve janitorial and healthcare customers by splitting the Professional Products division into two divisions, Professional Products and Healthcare. Our Food & Beverage sales were driven by improved retention and corporate account growth in the dairy, soft drink, meat and poultry and food markets. This increase was partially offset by a decrease in agricultural sales due to overall market weakness. Water Care Services had good growth in sales to the food and beverage, hospitality, healthcare and commercial accounts due to solid gains in new customer accounts. Vehicle Care sales were again driven by new business with major oil companies and successful new product introductions.
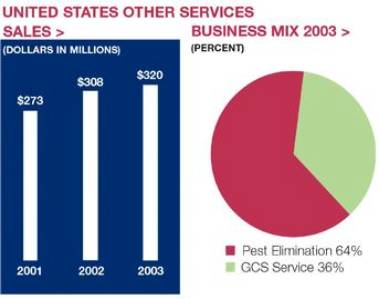
Sales of our United States Other Services operations increased 4 percent to $320 million in 2003, from $308 million in 2002. Business acquisitions had no effect on the growth in sales for 2003. Pest Elimination’s sales in 2003 reflected strong growth in both contract sales, due to the addition of new large accounts, and non-contract services, due to the aggressive efforts of the sales force. GCS Service sales decreased in 2003 due to service interruptions caused by the restructuring of field operations and the transition to a new centralized administration center, which began operation in 2003. In an effort to increase sales going forward, GCS Service implemented productivity improvement measures in the fourth quarter of 2003.

Management rate sales for our International Cleaning & Sanitizing segment were $1.6 billion for 2003, an increase of 4 percent over sales in 2002. Excluding the effects of acquisitions and divestitures, sales increased 3 percent. Sales in Europe, excluding the effects of acquisitions and divestitures, increased 2 percent. Successful new housekeeping and Ecotemp programs were partially offset by a weak European economy and strong competition. We are focusing on expanding our Pest Elimination business in Europe through acquisitions such as the Terminix operations in the United Kingdom, which was purchased in December 2002, and Nigiko with operations in France, acquired in January 2004. We expect to leverage the success of this business in the United States to become a global provider of pest elimination services. The increase in Asia Pacific was driven by Japan, New Zealand and Northeast Asia. In Japan, sales to chain restaurants and resort hotel customers improved and New Zealand is showing strong growth in its pest elimination services business. In Northeast Asia, Korea's growth was propelled by strong Institutional sales while China experienced excellent growth in its Food & Beverage sales. Good growth in these areas was partially offset by a sales decline in Australia due to soft Food & Beverage and Water Care business. Sales in Latin America, excluding acquisitions, grew 6 percent in 2003 and most Latin America countries experienced good growth except Venezuela, where a country-wide strike at the beginning of 2003 resulted in virtually no sales for the first two fiscal months of 2003. Mexico, the Caribbean and Central America all had double-digit sales growth in 2003. Growth in Latin America is being fueled by good growth in food retail programs, a demand for improved sanitation and expansion of pest elimination services. Sales in Canada increased due to continued focus on obtaining new customers and selling additional solutions to existing customers, partially offset by the impact of the Severe Acute Respiratory Syndrome (SARS) outbreak in Canada.
25
Operating Income by Operating Segment
(thousands) |
| 2003 |
| 2002 |
| 2001 |
| |||
|
|
|
|
|
|
|
| |||
Operating income |
|
|
|
|
|
|
| |||
United States |
|
|
|
|
|
|
| |||
Cleaning & Sanitizing |
| $ | 285,212 |
| $ | 271,838 |
| $ | 246,936 |
|
Other Services |
| 21,031 |
| 33,051 |
| 29,338 |
| |||
Total United States |
| 306,243 |
| 304,889 |
| 276,274 |
| |||
International Cleaning & Sanitizing |
| 159,866 |
| 138,373 |
| 44,575 |
| |||
Total |
| 466,109 |
| 443,262 |
| 320,849 |
| |||
Corporate |
| (4,834 | ) | (46,008 | ) | (4,938 | ) | |||
Effect of foreign currency translation |
| 21,383 |
| (1,388 | ) | 2,268 |
| |||
Consolidated |
| $ | 482,658 |
| $ | 395,866 |
| $ | 318,179 |
|
|
|
|
|
|
|
|
| |||
Operating income as a percent of net sales |
|
|
|
|
|
|
| |||
United States |
|
|
|
|
|
|
| |||
Cleaning & Sanitizing |
| 16.8 | % | 16.8 | % | 15.9 | % | |||
Other Services |
| 6.6 |
| 10.7 |
| 10.7 |
| |||
Total |
| 15.2 |
| 15.9 |
| 15.2 |
| |||
International Cleaning & Sanitizing |
| 10.2 |
| 9.2 |
| 9.4 |
| |||
Consolidated |
| 12.8 | % | 11.6 | % | 13.7 | % | |||
Operating income of our United States Cleaning & Sanitizing operations increased 5 percent in 2003. Operating income as a percent of sales remained the same in 2003 as 2002 due to the investments in developing the sales force and higher operating costs being offset by cost savings initiatives. We added 100 sales-and-service associates to our United States Cleaning & Sanitizing operations during 2003.
Operating income of United States Other Services operations decreased 36 percent. As a percentage of net sales, operating income decreased significantly as well. Pest Elimination had strong operating income growth, while GCS Service results reflected an operating loss. Strong growth in both contract and non-contract services, coupled with tight expense control, has helped fuel Pest Elimination’s growth. GCS Service results reflected an operating loss due to a decrease in sales resulting from operational issues encountered with a transition to a centralized administration center and the related costs invested in this initiative. This lost revenue adversely impacted operating income due to the relatively fixed nature of GCS Service’s expenses. During 2003, we added 95 sales-and-service associates to our United States Other Services operations.
Operating income of our International Cleaning & Sanitizing operations rose 16 percent in 2003 at management rates. Excluding the effects of acquisitions and divestitures, operating income increased 13 percent. Our international operating income margin also increased in 2003 over 2002. Operating income as a percent of net sales excluding acquisitions and divestitures was 10.7 in 2003 versus 9.7 in 2002. This result was due to good operating income growth and margin improvement in our European, Asia Pacific and Canadian businesses. Operating income growth was also good in Latin America. The primary reason for these significant improvements was due to the successful introduction of new products and programs as well as careful cost management. We added 80 sales-and-service associates to our International Cleaning & Sanitizing operations during 2003.
Operating income margins of our International operations are less than those realized for our U.S. operations. The lower International margins are due to (i) higher costs of importing raw materials and finished goods, (ii) the additional costs caused by the difference in scale of International operations where many operating locations are smaller in size and (iii) the additional cost of operating in numerous and diverse foreign jurisdictions. Proportionately larger investments in sales, technical support and administrative personnel are also necessary in order to facilitate the growth of our International operations.
2002 compared with 2001
Sales of our United States Cleaning & Sanitizing operations were $1.6 billion in 2002 and increased 4 percent over net sales of $1.5 billion in 2001. Business acquisitions had no effect on the growth in sales for 2002. Sales benefited from good growth in sales of U.S. Institutional and Kay operations. U.S. Institutional operations sales growth during 2002 reflected good growth driven primarily by the non-travel portion of the business. Trends in sales to the travel-related business also showed improvement over the course of 2002. Sales of Kay’s U.S. operations increased over 2001 with strong growth in both its food retail business and sales to the quickservice market. Textile Care sales increased from 2001 due to increased sales to existing customers as well as sales to new customers. Professional Products sales decreased in 2002 due to both a decline in the core sales of the Janitorial market and a decrease in the non-core specialty business reflecting a planned restructuring of the JaniSource business. Professional Products’ sales, however, were positively impacted at the end of 2002 due to a long-term supply agreement that became effective in December 2002. Water Care Services sales decreased from 2001 due to customer cost cutting and consolidations. Water Care also continued to exit non-core markets. Vehicle Care sales growth for 2002 was primarily due to new business with major oil companies as well as new product introductions. Food & Beverage sales increased slightly from 2001 with good growth in sales to the dairy, beverage and meat & poultry markets which were partially offset by weak agricultural sales.
Sales of United States Other Services operations increased 13 percent to $308 million in 2002, from $273 million in 2001. Excluding the effects of business acquisitions, sales increased 4 percent for 2002. Pest Elimination’s sales in 2002 included strong growth in non-contract services, and were partially offset by a slowdown in the growth of contract services. GCS Service sales growth increased over 2001, reflecting the continued expansion of its operations through acquisitions and a focus on integrating past acquisitions. Excluding the effects of businesses acquired, GCS Service sales decreased 1 percent for 2002. The results reflected the division’s focus on standardizing operating procedures and the impact of the hospitality slowdown on the GCS business. United States Other Services also includes modest sales from the addition of EcoSure operations in January 2002.
Management rate-based sales of our International Cleaning & Sanitizing operations reached $1.5 billion for 2002, an increase of 216 percent over sales of $0.5 billion in 2001. International Cleaning & Sanitizing includes European sales of $1.0 billion for 2002. Prior to 2002, we included the results of our former European joint venture operations in our financial statements using the equity method of accounting. Excluding Europe’s sales, International Cleaning & Sanitizing sales growth was 7 percent for 2002. Excluding all business acquisitions and divestitures, sales also increased 7 percent in 2002. European sales, although not consolidated prior to 2002, increased 8 percent over 2001 due to good growth in sales to the food and beverage markets and European acquisitions. For the Asia Pacific region, Japan, New Zealand
26
and China showed good sales growth for the year while Australia’s sales declined due to the sale of its Hygiene Services business. Asia Pacific’s sales increased 3 percent in 2002, excluding business acquisitions and divestitures. The increase in Asia Pacific sales was primarily from the institutional and food and beverage markets. Latin America sales increased 7 percent in 2002, excluding business acquisitions, with good growth in all countries except Venezuela due to the economic impact of the devaluation of its currency. Sales in Canada increased over the prior year due to good growth in sales to the institutional market.
Operating income of our United States Cleaning & Sanitizing operations was $272 million in 2002, an increase of 10 percent from operating income of $247 million in 2001. As a percentage of net sales, operating income increased from 15.9 percent in 2001 to 16.8 percent in 2002. The improvement in reported operating income margins reflected tight cost controls, savings from cost reduction initiatives, the sale of new products and the impact of adopting SFAS No. 142. Operating income in 2001 does not reflect the effect of SFAS No. 142, and thus includes amortization expenses related to goodwill of $10.6 million. If the provisions of SFAS No. 142 had been applied retroactively to January 1, 2001, operating income for our United States Cleaning & Sanitizing operations would have increased 6 percent and the operating income margin for our U.S. Cleaning & Sanitizing operations would have been 16.6 percent for 2001. We added 105 sales-and-service associates to our United States Cleaning & Sanitizing operations during 2002.
Operating income of our United States Other Services operations increased 13 percent to $33 million in 2002. The operating income margin for United States Other Services was 10.7 percent for both 2002 and 2001. Operating income in 2001 does not reflect the effect of SFAS No. 142 and includes $1.9 million of amortization expense related to goodwill. Excluding acquisitions and the effects of SFAS No. 142, operating income increased 3 percent over 2001. Excluding acquisitions and including the pro forma effects of SFAS No. 142 on 2001, the operating income margin for United States Other Services was 11.4 percent for both 2002 and 2001. Pest Elimination had strong operating income growth due to increased productivity and cost controls. Operating income for GCS Service declined due to investments in the division’s infrastructure and systems. During 2002, we added 75 sales-and-service associates to our United States Other Services operations.
Operating income of our International Cleaning & Sanitizing operations rose 210 percent to $138 million in 2002 from operating income of $45 million in 2001. The International operating income margin decreased from 9.4 percent in 2001 to 9.2 percent in 2002. Operating income in 2001 does not reflect the effect of SFAS No. 142 and includes $5.3 million of amortization expense related to goodwill. Excluding acquisitions and including the pro forma effects of SFAS No. 142 on 2001, operating income increased 15 percent over 2001. Excluding acquisitions (primarily Europe) and including the pro forma effects on SFAS No. 142 on 2001, the operating income margin for International increased to 10.3 percent of net sales from 9.6 percent in 2001. Significant operating income growth and margin improvement from Asia Pacific, Latin America and Canada contributed to the increase. We added 510 sales-and-service associates to our International Cleaning & Sanitizing operations, including Europe, during 2002.
Henkel-Ecolab
Prior to November 30, 2001, we operated cleaning and sanitizing businesses in Europe through a 50 percent economic interest in the Henkel-Ecolab joint venture. On November 30, 2001, we purchased from Henkel KGaA the remaining 50 percent interest of Henkel-Ecolab that we did not already own. Additional details related to this purchase are included in Note 5 of the notes to consolidated financial statements.
We consolidated Henkel-Ecolab’s operations effective with the November 30,2001 acquisition date and the end of Henkel-Ecolab’s fiscal year for 2001. Because we consolidate our International operations on the basis of their November 30 fiscal year ends, Henkel-Ecolab’s balance sheet was consolidated with our balance sheet as of year-end 2001. The income statement for the European operations was consolidated with our operations beginning in 2002.
Corporate
Our corporate operating expenses totaled $4.8 million in 2003, compared with $46.0 million in 2002 and $4.9 million in 2001.
Corporate operating expense in 2003 included a write-off of $1.7 million of goodwill related to an International business sold in 2003, $1.4 million of income for reductions in restructuring accruals and $4.5 million of expense for postretirement death benefits for retired executives. In 2002, the amount in corporate operating expense included restructuring and merger integration costs of $51.8 million, which were partially offset by a curtailment gain of $5.8 million related to benefit plan changes. Prior to 2002, corporate operating expense included overhead costs directly related to the European joint venture. In 2002 and 2003, these expenses were included in our International Cleaning & Sanitizing operating segment.
Interest and Income Taxes
Net interest expense for 2003 was $45 million, an increase of 3 percent over net interest expense of $44 million in 2002. The increase was primarily due to our euro-denominated debt and the strength of the euro against the U.S. dollar partially offset by lower debt levels.
Net interest expense of $44 million for 2002 increased 54 percent over net interest expense of $28 million in 2001. This increase was primarily due to higher debt levels incurred at year-end 2001 to finance the acquisition of the remaining 50 percent interest of our European joint venture which we did not already own.
Our effective income tax rate was 38.1 percent for 2003, compared with effective income tax rates of 39.8 percent and 40.5 percent in 2002 and 2001, respectively. Excluding the effects of the gain on the sale of an equity investment and the effect of special charges, the effective income tax rate was 38.0 percent for 2003. Excluding the effects of special charges in 2002, the estimated annual effective income tax rate was 39.5 percent. The reduction in the 2003 effective income tax rate was primarily due to a lower overall international rate and favorable international mix, as well as the tax savings opportunities that were available after the company’s acquisition of its European operations at the end of fiscal year 2001. The decrease in 2002 from prior years was principally due to the adoption of SFAS No. 142 at the beginning of 2002, which eliminated the amortization of goodwill and related income tax effects. Overall effective rates on International operations were higher in 2002 than in prior years, principally due to the addition of the European joint venture. This was partially offset by lower state income tax rates in 2002.
27
FINANCIAL POSITION
Our debt continued to be rated within the “A” categories by the major rating agencies during 2003. Significant changes in our financial position during 2003 and 2002 included the following:
• Total assets reached $3.2 billion at December 31, 2003, an increase of 13 percent over total assets of $2.9 billion at year-end 2002. Approximately $290 million of this increase was related to the strengthening of foreign currencies, primarily the euro. For example, 87 percent of the increase in accounts receivable was related to currency. The increase in goodwill in 2003 over 2002 was almost entirely related to currency. Other assets also increased significantly in 2003 due to a $75 million contribution to fund our U.S. pension plan.
In the liability section of the balance sheet, short-term debt was down significantly due to strong operating cash flow, which allowed us to pay down approximately $94 million of our short-term debt. Income taxes payable increased in 2003 over 2002 due to higher current income tax expense for 2003 as compared to 2002 and lower income tax payments made during the year compared to the prior year. Long-term debt also increased in 2003 due to currency as a large portion of our debt is denominated in euros.
During 2002 total assets increased to $2.9 billion from $2.5 billion at year-end 2001. Accounts receivable increased 8 percent over year end 2001, primarily due to the effect of business acquisitions during 2002, as well as due to the effect of exchange rates. Other assets also increased significantly from year-end 2001 due to payments totaling approximately $125 million to fund our U.S. pension plan during 2002. Other current liabilities increased from year-end 2001 primarily due to an increase in restructuring accruals and due to the effect of exchange rates.
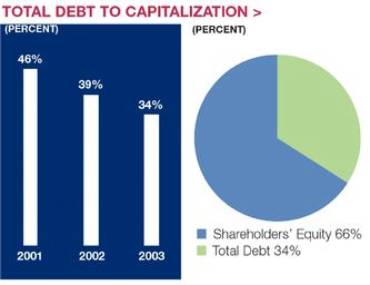
• Total debt was $675 million at December 31, 2003 and decreased from total debt of $700 million at year-end 2002. This decrease in total debt during 2003 was principally due to debt repayments made during the year, which were partially offset by the increase in debt due to the strengthening of foreign currencies, primarily the euro, during 2003. As of December 31,2003 the ratio of total debt to capitalization was 34 percent, down from 39 percent at year-end 2002 and 46 percent at year-end 2001. The lower debt to capitalization rate in 2003 and 2002 was due to debt repayments made during those years and increasing shareholders’ equity levels.
CASH FLOWS
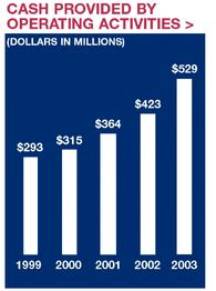
Cash provided by operating activities reached a new record high of $529 million for 2003, an increase from $423 million in 2002 and $364 million in 2001. The operating cash flow for 2003 increased over 2002 due to higher sales in 2003 and a lower contribution to the pension plan compared to 2002. Operating cash flows for 2003 were also higher than 2002 due to reduced payments on restructuring liabilities and lower estimated tax payments due to tax benefits on options exercised during 2003. The increase in operating cash flows for 2002 over 2001 reflected the additional cash flows from businesses acquired, primarily the European joint venture, as well as the improvement in accounts receivable and days sales outstanding. Historically, we have had strong operating cash flows and we anticipate this will continue. We expect to continue to use this cash flow to acquire new businesses, repurchase our common stock, invest in merchandising equipment and other capital assets and pay down debt.
Cash flows used for investing activities included capital expenditures of $212 million in 2003, $213 million in 2002 and $158 million in 2001. Worldwide additions of merchandising equipment, primarily cleaning and sanitizing product dispensers, accounted for approximately 70 percent of each year’s capital expenditures. Merchandising equipment is depreciated over 3 to 7 year lives. Cash used for businesses acquired included Adams Healthcare in 2003, Terminix Ltd. and Kleencare Hygiene in 2002 and Henkel-Ecolab in 2001.
Financing cash flow activity included cash used to reacquire shares and pay dividends and cash provided and used through our debt arrangements. Share repurchases totaled $227 million in 2003, $9 million in 2002 and $32 million in 2001. These repurchases were funded with operating cash flows and cash from the exercise of employee stock options. In October 2003, we announced a new authorization to repurchase up to 10 million additional shares of Ecolab common stock for the purpose of offsetting the dilutive effect of shares issued for stock option exercises and incentives and general corporate purposes.
In 2003, we increased our annual dividend rate for the twelfth consecutive year. We have paid dividends on our common stock for 67 consecutive years. Cash dividends declared per share of common stock, by quarter, for each of the last three years were as follows:
|
| First |
| Second |
| Third |
| Fourth |
| Year |
| |||||
|
|
|
|
|
|
|
|
|
|
|
| |||||
2003 |
| $ | 0.0725 |
| $ | 0.0725 |
| $ | 0.0725 |
| $ | 0.0800 |
| $ | 0.2975 |
|
2002 |
| 0.0675 |
| 0.0675 |
| 0.0675 |
| 0.0725 |
| 0.2750 |
| |||||
2001 |
| 0.0650 |
| 0.0650 |
| 0.0650 |
| 0.0675 |
| 0.2625 |
| |||||
28
LIQUIDITY AND CAPITAL RESOURCES
We currently expect to fund all of the requirements which are reasonably foreseeable for 2004, including new program investments, scheduled debt repayments, dividend payments, possible acquisitions and share repurchases from operating activities, cash reserves and short-term borrowings. In the event of a significant acquisition, funding may occur through additional long-term borrowings. Cash provided by operating activities reached an all time high of $529 million in 2003. While cash flows could be negatively affected by a decrease in revenues, we do not believe that our revenues are highly susceptible, over the short run, to rapid changes in technology within our industry. We have a $450 million U.S. commercial paper program and a 200 million Australian dollar commercial paper program. In June 2003, we established a $200 million European commercial paper program to provide a source of funding for our European and other international acquisitions and working capital requirements. All three programs are rated A-1 by Standard & Poor’s and P-1 by Moody’s. To support our commercial paper programs and other general business funding needs, we maintain a $275 million multi-year committed credit agreement which expires in December 2005 and a $175 million 364 day credit facility which expires in October 2004. We can draw directly on both credit facilities on a revolving credit basis. As of December 31, 2003, approximately $36 million of these credit facilities were committed to support outstanding commercial paper, leaving $414 million available for other uses. In January 2004, we issued 85 million euro (approximately $109 million at the date of the transaction) of commercial paper primarily to finance acquisitions subsequent to year-end. In addition, we have other committed and uncommitted credit lines of approximately $200 million with major international banks and financial institutions to support our general funding needs. Additional details on our credit facilities are included in Note 7 of the notes to consolidated financial statements.
During 2003, we voluntarily contributed $75 million to our U.S. pension plan. In making this contribution, we considered the normal growth in accrued plan benefits, the impact of lower year-end discount rates on the plan liability, our intent to improve the projected benefit obligation funding ratio and the 29 percent actual asset return on our pension plan in 2003. Our contributions to the pension plan did not have a material effect on our consolidated results of operations, financial condition or liquidity. We do not expect expense for our U.S. pension plan to increase significantly for 2004.
As described further in Note 5 of the consolidated financial statements, Henkel KGaA owns 28.2 percent of our common stock outstanding at December 31, 2003. In a December 2003 filing, Henkel reported that it may sell a portion or all of its holdings of Ecolab common stock and/or its holdings of common stock of The Clorox Company, or a combination of both, in connection with refinancing their pending acquisition of The Dial Corporation. Any dispositions by Henkel of any shares of Ecolab common stock would be done in accordance with the stockholder’s agreement between Henkel and Ecolab, including our right of first refusal, and applicable law.
We do not have relationships with unconsolidated entities or financial partnerships, such as entities often referred to as “structured finance” or “special purposes entities”, which are sometimes established for the purpose of facilitating off-balance sheet financial arrangements or other contractually narrow or limited purposes. As such, we are not exposed to any financing, liquidity, market or credit risk that could arise if we had engaged in such relationships.
A schedule of our obligations under various long-term debt agreements and operating leases with noncancelable terms in excess of one year are summarized in the following table:
(thousands) |
| Payments due by Period |
| |||||||||||||
Contractual obligations |
| Total |
| Less |
| 1-3 |
| 3-5 |
| More |
| |||||
Long-term debt |
| $ | 608,394 |
| $ | 3,953 |
| $ | 82,135 |
| $ | 367,021 |
| $ | 155,285 |
|
Operating leases |
| 138,525 |
| 35,726 |
| 51,136 |
| 29,392 |
| 22,271 |
| |||||
Total contractual cash obligations |
| $ | 746,919 |
| $ | 39,679 |
| $ | 133,271 |
| $ | 396,413 |
| $ | 177,556 |
|
We lease sales and administrative office facilities, distribution center facilities, computers and other equipment under longer-term operating leases. Vehicle leases are generally shorter in duration. The U.S. vehicle leases have guaranteed residual value requirements that have historically been satisfied by the proceeds on the sale of the vehicles. No amounts have been recorded for these guarantees in the table above as we believe that the potential recovery of value from the vehicles when sold will be greater than the residual value guarantee.
We do not have significant unconditional purchase obligations, or significant other commercial commitments, such as commitments under lines of credit, standby letters of credit, guarantees, standby repurchase obligations or other commercial commitments.
We are in compliance with all covenants and other requirements of our credit agreements and indentures. Additionally, we do not have any rating triggers that would accelerate the maturity dates of our debt.
A downgrade in our credit rating could limit or preclude our ability to issue commercial paper under our current programs. A credit rating downgrade could also adversely affect our ability to renew existing, or negotiate new credit facilities in the future and could increase the cost of these facilities. Should this occur, we could seek additional sources of funding, including issuing term notes or bonds. In addition, we have the ability at our option to draw upon our $450 million committed credit facilities prior to their termination.
MARKET RISK
We enter into contractual arrangements (derivatives) in the ordinary course of business to manage foreign currency exposure and interest rate risks. We do not enter into derivatives for trading purposes. Our use of derivatives is subject to internal policies that provide guidelines for control, counterparty risk and ongoing monitoring and reporting and is designed to reduce the volatility associated with movements in foreign exchange and interest rates on our income statement.
We enter into forward contracts, swaps and foreign currency options to hedge certain intercompany financial arrangements, and to hedge against the effect of exchange rate fluctuations on transactions related to cash flows and net investments denominated in currencies other than U.S. dollars. At December 31, 2003, we had approximately $239 million of foreign currency forward exchange contracts with face amounts denominated primarily in euros.
We manage interest expense using a mix of fixed and floating rate debt. To help manage borrowing costs, we may enter into interest rate swap agreements. Under these arrangements, we agree to exchange, at specified intervals, the difference between fixed and floating interest amounts calculated by reference to an agreed-upon notional principal amount. At year-end 2003, we had an interest rate swap that converts approximately euro 78 million (approximately $94 million U.S. dollars) of our Euronote debt from a fixed interest rate to a floating or variable
29
interest rate. This swap agreement is effective until February 2007. We also have an interest rate swap agreement on 50 million Australian dollars (approximately $36 million U.S. dollars) of Australian floating rate debt. This agreement is effective through November 2004 and has a fixed annual pay rate of approximately 6 percent. In September 2003, we entered into an interest rate swap agreement that converts $30 million of the 7.19% senior notes from a fixed interest rate to a floating or variable interest rate. This agreement is effective until January 2006.
Based on a sensitivity analysis (assuming a 10 percent adverse change in market rates) of our foreign exchange and interest rate derivatives and other financial instruments, changes in exchange rates or interest rates would not materially affect our financial position and liquidity. The effect on our results of operations would be substantially offset by the impact of the hedged items.
SUBSEQUENT EVENTS
In January 2004, we acquired Nigiko, a Paris-based provider of commercial pest elimination services throughout France. Nigiko pest elimination has annual sales of approximately $55 million. These operations will become part of our International Cleaning & Sanitizing operations in 2004.
In February 2004, we acquired Daydots International, a Texas-based provider of food safety products. Daydots has annual sales of approximately $22 million. These operations will become part of our U.S. Cleaning & Sanitizing operations in 2004.
FORWARD-LOOKING STATEMENTS AND RISK FACTORS
This financial discussion and other portions of this Annual Report to Shareholders contain various “Forward-Looking Statements” within the meaning of the Private Securities Litigation Reform Act of 1995. These include expectations concerning business progress and expansion, business acquisitions, currency translation, cash flows, debt repayments, susceptibility to changes in technology, global economic conditions and liquidity requirements. These statements, which represent our expectations or beliefs concerning various future events, are based on current expectations. Therefore, they involve a number of risks and uncertainties that could cause actual results to differ materially from those of such Forward-Looking Statements. These risks and uncertainties include the vitality of the foodservice, hospitality and travel industries; restraints on pricing flexibility due to competitive factors and customer and vendor consolidations; changes in oil or raw material prices or unavailability of adequate and reasonably priced raw materials; the occurrence of capacity constraints or the loss of a key supplier; the effect of future acquisitions or divestitures or other corporate transactions; our ability to achieve plans for past acquisitions; the costs and effects of complying with: (i) laws and regulations relating to the environment and to the manufacture, storage, distribution, efficacy and labeling of our products and (ii) changes in tax, fiscal, governmental and other regulatory policies; economic factors such as the worldwide economy, interest rates and currency movements, including, in particular, our exposure to foreign currency risk; the occurrence of (a) litigation or claims, (b) the loss or insolvency of a major customer or distributor, (c) war, (d) natural or manmade disasters (including acts of terrorism or hostilities which impact our markets) and, (e) severe weather conditions or public health epidemics affecting the foodservice, hospitality and travel industries; loss of, or changes in, executive management; our ability to continue product introductions and technological innovations; and other uncertainties or risks reported from time-to-time in our reports to the Securities and Exchange Commission. In addition, we note that our stock price can be affected by fluctuations in quarterly earnings. There can be no assurances that our earnings levels will meet investors’ expectations. We undertake no duty to update our Forward-Looking Statements.
30
consolidated statement of income
Year ended December 31 (thousands, except per share) |
| 2003 |
| 2002 |
| 2001 |
| |||
|
|
|
|
|
|
|
| |||
Net sales |
| $ | 3,761,819 |
| $ | 3,403,585 |
| $ | 2,320,710 |
|
Operating expenses |
|
|
|
|
|
|
| |||
Cost of sales (including special charges (income) of ($76) in 2003, $8,977 in 2002 and ($566) in 2001) |
| 1,845,202 |
| 1,687,597 |
| 1,120,254 |
| |||
Selling, general and administrative expenses |
| 1,433,551 |
| 1,283,091 |
| 881,453 |
| |||
Special charges |
| 408 |
| 37,031 |
| 824 |
| |||
Operating income |
| 482,658 |
| 395,866 |
| 318,179 |
| |||
Gain on sale of equity investment |
| 11,105 |
|
|
|
|
| |||
Interest expense, net |
| 45,345 |
| 43,895 |
| 28,434 |
| |||
Income from continuing operations before income taxes and equity in earnings of Henkel-Ecolab |
| 448,418 |
| 351,971 |
| 289,745 |
| |||
Provision for income taxes |
| 171,070 |
| 140,081 |
| 117,408 |
| |||
Equity in earnings of Henkel-Ecolab |
|
|
|
|
| 15,833 |
| |||
Income from continuing operations before cumulative effect of change in accounting |
| 277,348 |
| 211,890 |
| 188,170 |
| |||
Cumulative effect of change in accounting |
|
|
| (4,002 | ) |
|
| |||
Gain from discontinued operations |
|
|
| 1,882 |
|
|
| |||
Net income |
| $ | 277,348 |
| $ | 209,770 |
| $ | 188,170 |
|
|
|
|
|
|
|
|
| |||
Basic income per common share |
|
|
|
|
|
|
| |||
Income from continuing operations before change in accounting |
| $ | 1.07 |
| $ | 0.82 |
| $ | 0.74 |
|
Change in accounting |
|
|
| (0.02 | ) |
|
| |||
Gain from discontinued operations |
|
|
| 0.01 |
|
|
| |||
Net income |
| $ | 1.07 |
| $ | 0.81 |
| $ | 0.74 |
|
Diluted income per common share |
|
|
|
|
|
|
| |||
Income from continuing operations before change in accounting |
| $ | 1.06 |
| $ | 0.81 |
| $ | 0.72 |
|
Change in accounting |
|
|
| (0.02 | ) |
|
| |||
Gain from discontinued operations |
|
|
| 0.01 |
|
|
| |||
Net income |
| $ | 1.06 |
| $ | 0.80 |
| $ | 0.72 |
|
|
|
|
|
|
|
|
| |||
Weighted-average common shares outstanding |
|
|
|
|
|
|
| |||
Basic |
| 259,454 |
| 258,147 |
| 254,832 |
| |||
Diluted |
| 262,737 |
| 261,574 |
| 259,855 |
| |||
The accompanying notes are an integral part of the consolidated financial statements.
31
consolidated balance sheet
December 31 (thousands, except per share) |
| 2003 |
| 2002 |
| 2001 |
| |||
|
|
|
|
|
|
|
| |||
ASSETS |
|
|
|
|
|
|
| |||
Current assets |
|
|
|
|
|
|
| |||
Cash and cash equivalents |
| $ | 85,626 |
| $ | 49,205 |
| $ | 41,793 |
|
Accounts receivable, net |
| 626,002 |
| 553,154 |
| 514,074 |
| |||
Inventories |
| 309,959 |
| 291,506 |
| 279,785 |
| |||
Deferred income taxes |
| 75,820 |
| 71,147 |
| 53,781 |
| |||
Other current assets |
| 52,933 |
| 50,925 |
| 40,150 |
| |||
Total current assets |
| 1,150,340 |
| 1,015,937 |
| 929,583 |
| |||
Property, plant and equipment, net |
| 736,797 |
| 680,265 |
| 644,323 |
| |||
Goodwill, net |
| 797,211 |
| 695,700 |
| 596,925 |
| |||
Other intangible assets, net |
| 203,859 |
| 188,670 |
| 178,951 |
| |||
Other assets, net |
| 340,711 |
| 285,335 |
| 175,218 |
| |||
Total assets |
| $ | 3,228,918 |
| $ | 2,865,907 |
| $ | 2,525,000 |
|
|
|
|
|
|
|
|
| |||
LIABILITIES AND SHAREHOLDERS’ EQUITY |
|
|
|
|
|
|
| |||
Current liabilities |
|
|
|
|
|
|
| |||
Short-term debt |
| $ | 70,203 |
| $ | 160,099 |
| $ | 233,393 |
|
Accounts payable |
| 212,287 |
| 205,665 |
| 199,772 |
| |||
Compensation and benefits |
| 190,386 |
| 184,239 |
| 132,720 |
| |||
Income taxes |
| 59,829 |
| 12,632 |
| 18,887 |
| |||
Other current liabilities |
| 319,237 |
| 291,193 |
| 243,180 |
| |||
Total current liabilities |
| 851,942 |
| 853,828 |
| 827,952 |
| |||
Long-term debt |
| 604,441 |
| 539,743 |
| 512,280 |
| |||
Postretirement health care and pension benefits |
| 249,906 |
| 207,596 |
| 183,281 |
| |||
Other liabilities |
| 227,203 |
| 164,989 |
| 121,135 |
| |||
Shareholders’ equity (common stock, par value $1.00 per share; shares outstanding: 2003 – 257,417; 2002 – 129,940 and 2001 – 127,900) |
| 1,295,426 |
| 1,099,751 |
| 880,352 |
| |||
Total liabilities and shareholders’ equity |
| $ | 3,228,918 |
| $ | 2,865,907 |
| $ | 2,525,000 |
|
The accompanying notes are an integral part of the consolidated financial statements.
32
consolidated statement of cash flows
Year ended December 31 (thousands) |
| 2003 |
| 2002 |
| 2001 |
| |||
|
|
|
|
|
|
|
| |||
OPERATING ACTIVITIES |
|
|
|
|
|
|
| |||
Net income |
| $ | 277,348 |
| $ | 209,770 |
| $ | 188,170 |
|
Cumulative effect of change in accounting |
|
|
| 4,002 |
|
|
| |||
Gain from discontinued operations |
|
|
| (1,882 | ) |
|
| |||
Income from continuing operations |
| 277,348 |
| 211,890 |
| 188,170 |
| |||
Adjustments to reconcile income from continuing operations to cash provided by operating activities: |
|
|
|
|
|
|
| |||
Depreciation |
| 201,512 |
| 194,840 |
| 128,020 |
| |||
Amortization |
| 28,144 |
| 28,588 |
| 34,970 |
| |||
Deferred income taxes |
| 42,455 |
| 49,923 |
| (2,950 | ) | |||
Gain on sale of equity investment |
| (11,105 | ) |
|
|
|
| |||
Equity in earnings of Henkel-Ecolab |
|
|
|
|
| (15,833 | ) | |||
Henkel-Ecolab royalties and dividends |
|
|
|
|
| 23,928 |
| |||
Special charges – asset disposals |
| 1,684 |
| 6,180 |
| (566 | ) | |||
Other, net |
| 1,837 |
| 1,835 |
| (1,373 | ) | |||
Changes in operating assets and liabilities: |
|
|
|
|
|
|
| |||
Accounts receivable |
| (5,547 | ) | 78 |
| 20,570 |
| |||
Inventories |
| (2,902 | ) | (3,567 | ) | (8,014 | ) | |||
Other assets |
| (39,224 | ) | (141,926 | ) | (26,049 | ) | |||
Accounts payable |
| (13,329 | ) | (8,860 | ) | (7,451 | ) | |||
Other liabilities |
| 48,326 |
| 84,345 |
| 31,059 |
| |||
Cash provided by operating activities |
| 529,199 |
| 423,326 |
| 364,481 |
| |||
|
|
|
|
|
|
|
| |||
INVESTING ACTIVITIES |
|
|
|
|
|
|
| |||
Capital expenditures |
| (212,035 | ) | (212,757 | ) | (157,937 | ) | |||
Property disposals |
| 8,502 |
| 6,788 |
| 3,027 |
| |||
Capitalized software expenditures |
| (8,951 | ) | (4,490 | ) |
|
| |||
Businesses acquired and investments in affiliates |
| (31,726 | ) | (62,825 | ) | (469,804 | ) | |||
Sale of businesses and assets |
| 27,130 |
|
|
|
|
| |||
Cash used for investing activities |
| (217,080 | ) | (273,284 | ) | (624,714 | ) | |||
|
|
|
|
|
|
|
| |||
FINANCING ACTIVITIES |
|
|
|
|
|
|
| |||
Net issuances (repayments) of notes payable |
| (94,412 | ) | (368,834 | ) | 204,218 |
| |||
Long-term debt borrowings |
| 5,959 |
| 261,039 |
| 149,817 |
| |||
Long-term debt repayments |
| (13,270 | ) | (1,257 | ) | (16,283 | ) | |||
Reacquired shares |
| (227,145 | ) | (8,894 | ) | (32,164 | ) | |||
Cash dividends on common stock |
| (75,413 | ) | (69,583 | ) | (66,456 | ) | |||
Exercise of employee stock options |
| 126,615 |
| 45,531 |
| 19,356 |
| |||
Other, net |
| (313 | ) | (1,746 | ) | (975 | ) | |||
Cash provided by (used for) financing activities |
| (277,979 | ) | (143,744 | ) | 257,513 |
| |||
|
|
|
|
|
|
|
| |||
Effect of exchange rate changes on cash |
| 2,281 |
| 1,114 |
| 548 |
| |||
|
|
|
|
|
|
|
| |||
INCREASE (DECREASE) IN CASH AND CASH EQUIVALENTS |
| 36,421 |
| 7,412 |
| (2,172 | ) | |||
Cash and cash equivalents, beginning of year |
| 49,205 |
| 41,793 |
| 43,965 |
| |||
Cash and cash equivalents, end of year |
| $ | 85,626 |
| $ | 49,205 |
| $ | 41,793 |
|
The accompanying notes are an integral part of the consolidated financial statements.
33
consolidated statement of comprehensive income and shareholders’ equity
(thousands) |
| Common |
| Additional |
| Retained |
| Deferred |
| Accumulated |
| Treasury |
| Total |
| |||||||
|
|
|
|
|
|
|
|
|
|
|
|
|
|
|
| |||||||
BALANCE DECEMBER 31, 2000 |
| $ | 148,170 |
| $ | 283,587 |
| $ | 899,959 |
| $ | (7,895 | ) | $ | (89,075 | ) | $ | (477,739 | ) | $ | 757,007 |
|
|
|
|
|
|
|
|
|
|
|
|
|
|
|
|
| |||||||
Net income |
|
|
|
|
| 188,170 |
|
|
|
|
|
|
| 188,170 |
| |||||||
Foreign currency translation |
|
|
|
|
|
|
|
|
| (5,962 | ) |
|
| (5,962 | ) | |||||||
Other comprehensive loss |
|
|
|
|
|
|
|
|
| (586 | ) |
|
| (586 | ) | |||||||
Comprehensive income |
|
|
|
|
|
|
|
|
|
|
|
|
| 181,622 |
| |||||||
Cash dividends declared |
|
|
|
|
| (67,080 | ) |
|
|
|
|
|
| (67,080 | ) | |||||||
Stock options, including tax benefits |
| 1,564 |
| 34,985 |
|
|
|
|
|
|
|
|
| 36,549 |
| |||||||
Stock awards, net issuances |
|
|
| 880 |
|
|
| 14 |
|
|
| (180 | ) | 714 |
| |||||||
Business acquisitions |
|
|
|
|
|
|
|
|
|
|
| (501 | ) | (501 | ) | |||||||
Reacquired shares |
|
|
|
|
|
|
|
|
|
|
| (32,164 | ) | (32,164 | ) | |||||||
Amortization |
|
|
|
|
|
|
| 4,205 |
|
|
|
|
| 4,205 |
| |||||||
BALANCE DECEMBER 31, 2001 |
| 149,734 |
| 319,452 |
| 1,021,049 |
| (3,676 | ) | (95,623 | ) | (510,584 | ) | 880,352 |
| |||||||
|
|
|
|
|
|
|
|
|
|
|
|
|
|
|
| |||||||
Net income |
|
|
|
|
| 209,770 |
|
|
|
|
|
|
| 209,770 |
| |||||||
Foreign currency translation |
|
|
|
|
|
|
|
|
| 20,500 |
|
|
| 20,500 |
| |||||||
Other comprehensive income |
|
|
|
|
|
|
|
|
| 67 |
|
|
| 67 |
| |||||||
Minimum pension liability |
|
|
|
|
|
|
|
|
| (1,052 | ) |
|
| (1,052 | ) | |||||||
Comprehensive income |
|
|
|
|
|
|
|
|
|
|
|
|
| 229,285 |
| |||||||
Cash dividends declared |
|
|
|
|
| (71,156 | ) |
|
|
|
|
|
| (71,156 | ) | |||||||
Stock options, including tax benefits |
| 2,216 |
| 64,617 |
|
|
|
|
|
|
|
|
| 66,833 |
| |||||||
Stock awards, net issuances |
|
|
| 2,139 |
|
|
| (827 | ) |
|
| (658 | ) | 654 |
| |||||||
Business acquisitions |
|
|
|
|
|
|
|
|
|
|
| (116 | ) | (116 | ) | |||||||
Reacquired shares |
|
|
|
|
|
|
|
|
|
|
| (8,894 | ) | (8,894 | ) | |||||||
Amortization |
|
|
|
|
|
|
| 2,793 |
|
|
|
|
| 2,793 |
| |||||||
BALANCE DECEMBER 31, 2002 |
| 151,950 |
| 386,208 |
| 1,159,663 |
| (1,710 | ) | (76,108 | ) | (520,252 | ) | 1,099,751 |
| |||||||
|
|
|
|
|
|
|
|
|
|
|
|
|
|
|
| |||||||
Net income |
|
|
|
|
| 277,348 |
|
|
|
|
|
|
| 277,348 |
| |||||||
Foreign currency translation |
|
|
|
|
|
|
|
|
| 90,601 |
|
|
| 90,601 |
| |||||||
Other comprehensive loss |
|
|
|
|
|
|
|
|
| (865 | ) |
|
| (865 | ) | |||||||
Minimum pension liability |
|
|
|
|
|
|
|
|
| (9,530 | ) |
|
| (9,530 | ) | |||||||
Comprehensive income |
|
|
|
|
|
|
|
|
|
|
|
|
| 357,554 |
| |||||||
Cash dividends declared |
|
|
|
|
| (77,132 | ) |
|
|
|
|
|
| (77,132 | ) | |||||||
Stock options, including tax benefits |
| 3,596 |
| 136,941 |
|
|
|
|
|
|
|
|
| 140,537 |
| |||||||
Stock awards, net issuances |
|
|
| 604 |
|
|
| (253 | ) |
|
| (43 | ) | 308 |
| |||||||
Reacquired shares |
|
|
|
|
|
|
|
|
|
|
| (227,145 | ) | (227,145 | ) | |||||||
Amortization |
|
|
|
|
|
|
| 1,553 |
|
|
|
|
| 1,553 |
| |||||||
Stock dividend |
| 154,738 |
| (154,738 | ) |
|
|
|
|
|
|
|
| — |
| |||||||
|
|
|
|
|
|
|
|
|
|
|
|
|
|
|
| |||||||
BALANCE DECEMBER 31, 2003 |
| $ | 310,284 |
| $ | 369,015 |
| $ | 1,359,879 |
| $ | (410 | ) | $ | 4,098 |
| $ | (747,440 | ) | $ | 1,295,426 |
|
COMMON STOCK ACTIVITY
|
| 2003 |
| 2002 |
| 2001 |
| ||||||
Year ended December 31 (shares) |
| Common Stock |
| Treasury Stock |
| Common Stock |
| Treasury Stock |
| Common Stock |
| Treasury Stock |
|
Shares, beginning of year |
| 151,950,428 |
| (22,010,334 | ) | 149,734,067 |
| (21,833,949 | ) | 148,169,930 |
| (21,009,195 | ) |
Stock options |
| 3,595,961 |
|
|
| 2,216,361 |
|
|
| 1,564,137 |
|
|
|
Stock awards, net issuances |
|
|
| 12,241 |
|
|
| 25,065 |
|
|
| 21,382 |
|
Business acquisitions |
|
|
|
|
|
|
| (2,672 | ) |
|
| (15,017 | ) |
Reacquired shares |
|
|
| (6,666,861 | ) |
|
| (198,778 | ) |
|
| (831,119 | ) |
Stock dividend |
| 154,737,694 |
| (24,202,607 | ) |
|
|
|
|
|
|
|
|
Shares, end of year |
| 310,284,083 |
| (52,867,561 | ) | 151,950,428 |
| (22,010,334 | ) | 149,734,067 |
| (21,833,949 | ) |
The accompanying notes are an integral part of the consolidated financial statements.
34
notes to consolidated financial statements
NOTE 1 NATURE OF BUSINESS
Ecolab Inc. (the “company”) develops and markets premium products and services for the hospitality, foodservice, institutional and industrial markets. The company provides cleaning, sanitizing, pest elimination, maintenance and repair products, systems and services primarily to hotels and restaurants; healthcare and educational facilities; quickservice (fast-food and convenience stores) units; grocery stores; commercial and institutional laundries; light industry; dairy plants and farms; food and beverage processors; pharmaceutical and cosmetic facilities and the vehicle wash industry.
NOTE 2 SUMMARY OF SIGNIFICANT ACCOUNTING POLICIES
Principles of Consolidation
The consolidated financial statements include the accounts of the company and all majority-owned subsidiaries. Prior to November 30, 2001, the company accounted for its investment in Henkel-Ecolab under the equity method of accounting. As discussed further in Note 5, on November 30, 2001, the company acquired the remaining 50 percent interest of the European joint venture that it did not previously own, and Henkel-Ecolab became a wholly-owned subsidiary of the company. Because the company consolidates its international operations on the basis of their November 30 fiscal year ends, the balance sheet of the European operations was consolidated with the company’s balance sheet beginning with year-end 2001. The income statement for the European operations was consolidated with the company’s operations beginning in 2002. International subsidiaries are included in the financial statements on the basis of their November 30 fiscal year-ends to facilitate the timely inclusion of such entities in the company’s consolidated financial reporting. All intercompany transactions and profits are eliminated in consolidation.
Foreign Currency Translation
Financial position and results of operations of the company’s international subsidiaries generally are measured using local currencies as the functional currency. Assets and liabilities of these operations are translated at the exchange rates in effect at each fiscal year end. The translation adjustments related to assets and liabilities that arise from the use of differing exchange rates from period to period are included in accumulated other comprehensive income (loss) in shareholders’ equity. The cumulative translation gain as of year-end 2003 was $16,064,000. The cumulative translation loss as of year-end 2002 and 2001 was $74,537,000 and $95,037,000, respectively. Income statement accounts are translated at the average rates of exchange prevailing during the year. The different exchange rates from period to period impact the amount of reported income from the company’s international operations.
Cash and Cash Equivalents
Cash equivalents include highly-liquid investments with a maturity of three months or less when purchased.
Inventory Valuations
Inventories are valued at the lower of cost or market. Domestic chemical inventory costs are determined on a last-in, first-out (lifo) basis. LIFO inventories represented 29 percent, 30 percent and 29 percent of consolidated inventories at year-end 2003, 2002 and 2001, respectively. All other inventory costs are determined on a first-in, first-out (fifo) basis.
Property, Plant and Equipment
Property, plant and equipment are stated at cost. Merchandising equipment consists principally of various systems that dispense the company’s cleaning and sanitizing products and dishwashing machines. The dispensing systems are accounted for on a mass asset basis, whereby equipment is capitalized and depreciated as a group and written off when fully depreciated. Depreciation is charged to operations using the straight-line method over the assets’ estimated useful lives ranging from 5 to 50 years for buildings, 3 to 7 years for merchandising equipment and 3 to 11 years for machinery and equipment.
Goodwill and Other Intangible Assets
Goodwill and other intangible assets arise principally from business acquisitions. Goodwill represents the excess of the purchase price over the fair value of identifiable net assets acquired. Other intangible assets include primarily customer relationships, trademarks, patents and other technology. Other intangible assets are amortized on a straight-line basis over their estimated economic lives. The weighted-average useful life of other intangible assets was 12 years as of December 31, 2003.
The straight-line method of amortization reflects an appropriate allocation of the cost of the intangible assets to earnings in proportion to the amount of economic benefits obtained by the company in each reporting period. Total amortization expense related to other intangible assets during the years ended December 31, 2003, 2002 and 2001 was approximately $21.2 million, $16.9 million and $5.1 million, respectively. As of December 31, 2003, future estimated amortization expense related to amortizable other identifiable intangible assets for each of the next five years will be:
(thousands) |
|
|
|
| |
|
|
|
|
| |
2004 |
|
| $ | 21,341 |
|
2005 |
|
| 19,696 |
| |
2006 |
|
| 19,236 |
| |
2007 |
|
| 18,692 |
| |
2008 |
|
| 17,266 |
| |
Long-Lived Assets
The company periodically reviews its long-lived assets for impairment and assesses whether significant events or changes in business circumstances indicate that the carrying value of the assets may not be recoverable. An impairment loss is recognized when the carrying amount of an asset exceeds the anticipated future undiscounted cash flows expected to result from the use of the asset and its eventual disposition. The amount of the impairment loss to be recorded, if any, is calculated by the excess of the asset’s carrying value over its fair value.
35
Revenue Recognition
The company recognizes revenue as services are performed or on product sales at the time title transfers to the customer. The company records estimated reductions to revenue for customer programs and incentive offerings, including pricing arrangements, promotions and other volume-based incentives at the time of sale.
Income Per Common Share
The computations of the basic and diluted income from continuing operations per share amounts were as follows:
(thousands, except per share) |
| 2003 |
| 2002 |
| 2001 |
| |||
|
|
|
|
|
|
|
| |||
Income from continuing operations before change in accounting |
| $ | 277,348 |
| $ | 211,890 |
| $ | 188,170 |
|
|
|
|
|
|
|
|
| |||
Weighted-average common shares outstanding |
|
|
|
|
|
|
| |||
Basic |
| 259,454 |
| 258,147 |
| 254,832 |
| |||
Effect of dilutive stock options and awards |
| 3,283 |
| 3,427 |
| 5,023 |
| |||
Diluted |
| 262,737 |
| 261,574 |
| 259,855 |
| |||
|
|
|
|
|
|
|
| |||
Income from continuing operations before change in accounting per common share |
|
|
|
|
|
|
| |||
Basic |
| $ | 1.07 |
| $ | 0.82 |
| $ | 0.74 |
|
Diluted |
| $ | 1.06 |
| $ | 0.81 |
| $ | 0.72 |
|
All number of share and per share data for all periods presented have been adjusted to reflect the two-for-one stock split described in Note 9.
Restricted stock awards of approximately 52,800 shares for 2003, 203,550 shares for 2002 and 347,100 shares for 2001 were excluded from the computation of basic weighted-average shares outstanding because such shares were not yet vested at those dates.
Stock options to purchase approximately 4.3 million shares for 2003, 8.4 million shares for 2002 and 7.9 million shares for 2001 were not dilutive and, therefore, were not included in the computations of diluted common shares outstanding.
Stock-Based Compensation
The company measures compensation cost for its stock incentive and option plans using the intrinsic value-based method of accounting.
Had the company used the fair value-based method of accounting to measure compensation expense for its stock incentive and option plans and charged compensation cost against income, over the vesting periods, based on the fair value of options at the date of grant, net income and the related basic and diluted per common share amounts for 2003,2002 and 2001 would have been reduced to the pro forma amounts in the following table:
(thousands, except per share) |
| 2003 |
| 2002 |
| 2001 |
| |||
|
|
|
|
|
|
|
| |||
Net income, as reported |
| $ | 277,348 |
| $ | 209,770 |
| $ | 188,170 |
|
Add: Stock-based employee compensation expense included in reported net income, net of tax |
| 941 |
| 1,688 |
| 2,542 |
| |||
Deduct: Total stock-based employee compensation expense under fair value - based method, net of tax |
| (17,699 | ) | (15,145 | ) | (13,172 | ) | |||
Pro forma net income |
| $ | 260,590 |
| $ | 196,313 |
| $ | 177,540 |
|
|
|
|
|
|
|
|
| |||
Basic net income per common share |
|
|
|
|
|
|
| |||
As reported |
| $ | 1.07 |
| $ | 0.81 |
| $ | 0.74 |
|
Pro forma |
| 1.00 |
| 0.76 |
| 0.70 |
| |||
|
|
|
|
|
|
|
| |||
Diluted net income per common share |
|
|
|
|
|
|
| |||
As reported |
| 1.06 |
| 0.80 |
| 0.72 |
| |||
Pro forma |
| $ | 0.99 |
| $ | 0.75 |
| $ | 0.68 |
|
Note 10 to the consolidated financial statements contains the significant assumptions used in determining the underlying fair value of options.
Comprehensive Income
For the company, comprehensive income includes net income, foreign currency translation adjustments, minimum pension liabilities, gains and losses on derivative instruments designated and effective as cash flow hedges and nonderivative instruments designated and effective as foreign currency net investment hedges that are charged or credited to the accumulated other comprehensive income (loss) account in shareholders’ equity.
Derivative Instruments and Hedging Activities
The company uses foreign currency forward contracts, interest rate swaps and foreign currency debt to manage risks generally associated with foreign exchange rates, interest rates and net investments in foreign operations. The company does not hold derivative financial instruments of a speculative nature. On the date that the company enters into a derivative contract, it designates the derivative as (1) a hedge of (a) the fair value of a recognized asset or liability or (b) an unrecognized firm commitment (a “fair value” hedge), (2) a hedge of (a) a forecasted transaction or (b) the variability of cash flows that are to be received or paid in connection with a recognized asset or liability (a “cash flow”
36
hedge); or (3) a foreign-currency fair-value or cash flow hedge (a “foreign currency” hedge). The company formally documents all relationships between hedging instruments and hedged items, as well as its risk-management objective and strategy for undertaking various hedge transactions. The company also formally assesses (both at the hedge’s inception and on an ongoing basis) whether the derivatives that are used in hedging transactions have been highly effective in offsetting changes in the fair value or cash flows of hedged items and whether those derivatives may be expected to remain highly effective in future periods. When it is determined that a derivative is not (or has ceased to be) highly effective as a hedge, the company will discontinue hedge accounting prospectively. The company believes that on an ongoing basis its portfolio of derivative instruments will generally be highly effective as hedges. Hedge ineffectiveness during the years ended December 31, 2003, 2002 and 2001 was not significant.
All of the company’s derivatives are recognized on the balance sheet at their fair value. The earnings impact resulting from the change in fair value of the derivative instruments is recorded in the same line item in the consolidated statement of income as the underlying exposure being hedged.
Use of Estimates
The preparation of the company’s financial statements requires management to make certain estimates and assumptions that affect the reported amounts of assets and liabilities as of the date of the financial statements and the reported amounts of revenues and expenses during the reporting periods. Actual results could differ from these estimates.
New Accounting Pronouncements
In January 2003, the Financial Accounting Standards Board (“FASB”) issued FASB Interpretation No. 46, Consolidation of Variable Interest Entities (“FIN 46”). FIN 46 was subsequently revised in December 2003 by the issuance of FIN 46R to provide additional guidance on the application and scope of FIN 46. FIN 46 and FIN 46R provide accounting requirements for a business enterprise to consolidate related entities in which it is determined to be the primary beneficiary as a result of its variable economic interests. The interpretation provides guidance in judging multiple economic interests in an entity and in determining the primary beneficiary.
The interpretations outline consolidation and disclosure requirements for variable interest entities (“VIEs”). The company has reviewed the consolidation and disclosure requirements of FIN 46 and FIN 46R and determined that they have no current impact on the company.
In April 2003, the FASB issued Statement of Financial Accounting Standards (“SFAS”) No. 149, Amendment of Statement 133 on Derivative Instruments and Hedging Activities. This statement amends and clarifies financial accounting and reporting for derivative instruments, including certain derivative instruments embedded in other contracts and for hedging activities under SFAS No. 133, Accounting for Derivative Instruments and Hedging Activities. The company has reviewed the requirements of this standard and it has no current impact on the company.
In May 2003, the FASB issued SFAS No. 150, Accounting for Certain Financial Instruments with Characteristics of Both Liabilities and Equity. This statement established standards for how an issuer classifies and measures certain financial instruments with characteristics of both liabilities and equity. The company does not have any financial instruments subject to SFAS No. 150 as of December 31, 2003.
In December 2003, the FASB issued a revision to SFAS 132, Employers’ Disclosures about Pensions and Other Postretirement Benefits, which requires additional disclosures about the assets, obligations, cash flows, and periodic benefit costs of defined benefit pension plans and other defined benefit postretirement plans. Note 15 presents the new disclosure requirements for the company’s domestic plans. Disclosure of additional information about foreign plans is not required until the company’s next fiscal year.
Reclassifications
The consolidated balance sheet as of December 31, 2002 includes a reclassification of $12,522,000 of accumulated amortization to a long-lived asset that was previously classified as an other current liability to be consistent with the current period presentation.
NOTE 3 SPECIAL CHARGES
In the first quarter of 2002, management approved plans to undertake restructuring and cost saving actions during 2002, including costs related to the integration of the company’s European operations. These actions included global workforce reductions, facility closings and product line discontinuations. As a result, the company recorded restructuring expense of $47,767,000 ($29,867,000 after tax) for the year ended December 31, 2002. This includes $36,366,000 for employee termination benefits, $6,180,000 for asset disposals and $5,221,000 for other charges. The company also incurred merger integration costs of $4,032,000 ($2,521,000 after tax) related to European and other operations. Restructuring and merger integration costs have been included as “special charges” on the consolidated statement of income with a portion of restructuring expenses included as a component of “cost of sales”. Amounts included as a component of “cost of sales” include asset disposals of $6,180,000 and manufacturing related severance of $2,797,000 for the year ended December 31, 2002.
Also included in “special charges” on the consolidated statement of income for the year ended December 31, 2002 is a one-time curtailment gain of $5,791,000 ($3,501,000 after tax), related to changes to postretirement healthcare benefits made in the first quarter of 2002.
Restructuring liabilities are classified as a component of other current liabilities.
Employee termination benefit expenses in 2002 included 695 net personnel reductions through voluntary and involuntary terminations, with the possibility that some of these people may be replaced. Individuals were affected through facility closures and consolidation primarily within the corporate administrative, operations and research and development functions.
Asset disposals include inventory and property, plant, and equipment charges. Inventory charges for the year ended December 31, 2002 were $2,391,000 and reflect the discontinuance of product lines which are not consistent with the company’s long-term strategies. Property, plant and equipment charges during the year ended December 31, 2002 were $3,789,000 and reflect the downsizing and closure of production facilities as well as global changes to manufacturing and distribution operations in connection with the integration of European operations.
Other charges of $5,221,000 for the year ended December 31, 2002, include lease termination costs and other miscellaneous exit costs.
The company recorded restructuring and merger integration charges throughout 2002 and completed these activities by December 31, 2002.
During 2003, restructuring activity includes the reversal of
37
$1,359,000 of previously accrued severance costs as project expenses were favorable to previous estimates. Of this amount, $76,000 is included as a component of cost of sales and $1,283,000 is included as a component of “special charges”.
Also included in “special charges” is a write-off of $1,691,000 of goodwill related to an International business which was sold in 2003.
During the fourth quarter of 2001, the company incurred $940,000 in special charges to facilitate the acquisition of Henkel-Ecolab and to begin the integration process following the acquisition.
Management also approved various actions during the fourth quarter of 2000 to improve the long-term efficiency and competitiveness of the company and to reduce costs. These actions, which were completed in 2001, included personnel reductions, discontinuance of certain product lines, changes to certain manufacturing and distribution operations and the closing of selected sales and administrative offices. During 2001, revisions of prior year estimates related to inventory write-downs and severance amounts reduced 2001 cost of sales by $566,000 and special charges by $116,000, respectively.
For segment reporting purposes, each of these items has been included in the company’s corporate segment, which is consistent with the company’s internal management reporting. Changes to the restructuring liability accounts included the following:
(thousands) |
| Employee |
| Asset |
| Other |
| Total |
| ||||
|
|
|
|
|
|
|
|
|
| ||||
Restructuring liability, December 31, 2000 |
| $ | 2,763 |
| $ | 0 |
| $ | 1,290 |
| $ | 4,053 |
|
Cash payments |
| (2,594 | ) |
|
| (1,343 | ) | (3,937 | ) | ||||
Revisions to prior estimates |
| (169 | ) | (566 | ) | 53 |
| (682 | ) | ||||
Non-cash credits |
|
|
| 566 |
|
|
| 566 |
| ||||
Restructuring liability, December 31, 2001 |
| 0 |
| 0 |
| 0 |
| 0 |
| ||||
Initial expense and accrual |
| 36,366 |
| 6,180 |
| 5,221 |
| 47,767 |
| ||||
Cash payments |
| (16,033 | ) |
|
| (1,711 | ) | (17,744 | ) | ||||
Non-cash charges |
|
|
| (6,180 | ) |
|
| (6,180 | ) | ||||
Restructuring liability, December 31, 2002 |
| 20,333 |
| 0 |
| 3,510 |
| 23,843 |
| ||||
Cash payments |
| (16,770 | ) |
|
| (2,471 | ) | (19,241 | ) | ||||
Non-cash credits |
|
|
| 7 |
|
|
| 7 |
| ||||
Revisions to prior estimates |
| (1,352 | ) | (7 | ) |
|
| (1,359 | ) | ||||
Effect of foreign currency translation |
| 1,222 |
|
|
| 670 |
| 1,892 |
| ||||
Restructuring liability, December 31, 2003 |
| $ | 3,433 |
| $ | 0 |
| $ | 1,709 |
| $ | 5,142 |
|
Subject to further revisions to estimates, the remaining liability balance will be settled through periodic contractual payments.
NOTE 4 GAIN FROM DISCONTINUED OPERATIONS
During the first quarter of 2002, the company resolved a legal issue related to the disposal of its ChemLawn business in 1992. This resulted in the recognition of a gain from discontinued operations of $1,882,000 (net of income tax benefit of $1,079,000), or $0.01 per diluted share during the year ended December 31, 2002.
NOTE 5 HENKEL-ECOLAB
Prior to November 30, 2001, the company and Henkel KGaA, Düsseldorf, Germany (“Henkel”), each owned 50 percent of Henkel-Ecolab, a joint venture of their respective European institutional and industrial cleaning and sanitizing businesses. The company accounted for this investment in Henkel-Ecolab under the equity method of accounting. On November 30, 2001, Ecolab purchased the remaining 50 percent interest of this joint venture it did not already own from Henkel. Because the company consolidates its international operations on the basis of their November 30 fiscal year ends, the balance sheet of Henkel-Ecolab as of November 30, 2001 was consolidated with the company’s balance sheet beginning with year-end 2001. The income statement for the European operations was consolidated with the company’s operations beginning in 2002.
For 2001, Henkel-Ecolab results of operations and the company’s equity in earnings of Henkel-Ecolab included:
(thousands) |
| 2001 |
| |
|
|
|
| |
Henkel-Ecolab |
|
|
| |
Net sales |
| $ | 869,487 |
|
Gross profit |
| 419,635 |
| |
Income before income taxes |
| 67,286 |
| |
Net income |
| $ | 40,043 |
|
|
|
|
| |
Ecolab equity in earnings |
|
|
| |
Ecolab equity in net income |
| $ | 20,022 |
|
Ecolab royalty income from Henkel-Ecolab, net of income taxes |
| 2,123 |
| |
Amortization expense for the excess of cost over the underlying net assets of Henkel-Ecolab |
| (6,312 | ) | |
Equity in earnings of Henkel-Ecolab |
| $ | 15,833 |
|
Prior to November 30, 2001, the company’s investment in Henkel-Ecolab included the unamortized excess of the company’s investment over its equity in Henkel-Ecolab net assets. This excess was $92 million at November 30, 2001 and was included in goodwill, net at year-end 2001. The excess was being amortized on a straight-line basis over estimated economic useful lives of up to 30 years.
The company acquired the remaining 50 percent of Henkel-Ecolab for approximately 483.5 million euros, equal to approximately $432.7 million at rates of exchange prevailing at November 30, 2001, plus approximately $6.5 million of direct transaction related expenses.
The acquisition of Henkel-Ecolab was accounted for under the purchase method of accounting as a step-acquisition. Accordingly, the purchase price was applied to the 50 percent interest of Henkel-Ecolab being acquired.
The following table summarizes the estimated fair value of assets acquired and liabilities initially assumed at the date of acquisition and the final allocation made during 2002.
38
November 30, 2001 (thousands) |
| Initial |
| Final |
| ||
|
|
|
|
|
| ||
Current assets |
| $ | 178,705 |
| $ | 178,201 |
|
Property, plant and equipment |
| 66,538 |
| 67,966 |
| ||
Identifiable intangible assets |
| 119,257 |
| 119,203 |
| ||
Goodwill |
| 239,737 |
| 252,017 |
| ||
Other assets |
| 9,185 |
| 29,678 |
| ||
Total assets acquired |
| 613,422 |
| 647,065 |
| ||
Current liabilities |
| 115,559 |
| 130,199 |
| ||
Postretirement health care and pension benefits |
| 38,614 |
| 38,219 |
| ||
Other liabilities |
| 19,860 |
| 39,423 |
| ||
Total liabilities assumed |
| 174,033 |
| 207,841 |
| ||
Purchase price |
| $ | 439,389 |
| $ | 439,224 |
|
Identifiable intangible assets have a weighted-average useful life of approximately 14 years. Identifiable intangible assets included customer relationships of $83 million and intellectual property of $31 million. Goodwill was assigned to the International Cleaning & Sanitizing reportable segment. Approximately 30 percent of the goodwill will be deductible for income tax purposes.
Subsequent to the initial allocation of the purchase price, approximately $28.0 million of restructuring charges were incurred in connection with the acquisition of Henkel-Ecolab. These costs consisted of $24.1 million for employee termination benefits, $0.4 million for asset disposals, including inventory and property, plant and equipment, and $3.5 million for lease termination and other costs. Because the company acquired only 50 percent of Henkel-Ecolab, $14.0 million of these costs were treated as a liability assumed at the date of acquisition and have been treated as additional goodwill in 2002. The remaining $14.0 million, along with $1.9 million of merger integration costs, were treated as operating expenses during 2002 and are included in the “special charges” discussed in Note 3 to the consolidated financial statements.
The following unaudited pro forma financial information reflects the consolidated results of the company and Henkel-Ecolab assuming the acquisition had occurred at the beginning of 2001.
(thousands, except per share) |
| 2001 |
| |
|
| (unaudited) |
| |
Net sales |
| $ | 3,182,271 |
|
Income from continuing operations before cumulative effect of change in accounting |
| 192,009 |
| |
Diluted income from continuing operations before change in accounting per common share |
| $ | 0.74 |
|
These unaudited pro forma results are presented for information purposes only. These unaudited pro forma results also do not include the benefits of improvements from synergies the company anticipates it will realize. The results are not necessarily indicative of results that would have occurred had the acquisition been completed at the beginning of 2001, nor are they necessarily indicative of future operating results.
As part of the transaction, the stockholder’s agreement between the company and Henkel was amended and extended. The amended stockholder’s agreement provides, among other things, that Henkel is permitted to increase its ownership in the company to 35 percent of the company’s outstanding common stock. Henkel remains entitled to proportionate representation on the company’s board of directors.
Henkel beneficially owned 72.7 million shares, or approximately 28.2 percent, of the company’s outstanding common stock on December 31, 2003.
In 2003, 2002 and 2001, the company and its affiliates sold products and services in the amount of $3,426,000, $6,986,000 and $507,000 to Henkel or its affiliates, and purchased products and services in the amount of $71,265,000, $74,192,000 and $4,628,000 from Henkel or its affiliates. Prior to 2002, Henkel-Ecolab also acquired and sold products to Henkel. Transactions between Henkel and Ecolab’s European operations acquired on November 30, 2001, are reflected in the consolidated financial statements beginning in 2002. The transactions were made at prices comparable to prices charged to unrelated third parties.
NOTE 6 BUSINESS ACQUISITIONS AND DISPOSITIONS
Business Acquisitions
Business acquisitions made by the company during 2003, 2002 and 2001, excluding the acquisition of Henkel-Ecolab, were as follows:
Business Acquired |
| Date of |
| Ecolab |
| Estimated |
| |
|
|
|
|
|
| (unaudited) |
| |
|
|
|
|
|
|
|
| |
2003 |
|
|
|
|
|
|
| |
|
|
|
|
|
|
|
| |
Adams Healthcare |
| Dec. 2002 |
| Europe |
| $ | 19 |
|
|
|
|
|
|
|
|
|
|
2002 |
|
|
|
|
|
|
| |
|
|
|
|
|
|
|
| |
Kleencare Hygiene |
| Jan. 2002 |
| Europe |
| 30 |
| |
Audits International |
| Jan. 2002 |
| Pest |
| 3 |
| |
|
|
|
|
|
|
|
| |
Terminix Ltd. |
| Sept. 2002 |
| Europe |
| 65 |
| |
|
|
|
|
|
|
|
| |
2001 |
|
|
|
|
|
|
| |
|
|
|
|
|
|
|
| |
Ecolab S.A. – 23.5% interest in addition to prior 51% interest |
| Dec. 2000 |
| Latin America |
| 8 |
| |
|
|
|
|
|
|
|
| |
Randall International LLC – 25% interest |
| Jan. 2001 |
| Institutional |
| 8 |
| |
|
|
|
|
|
|
|
| |
Envirocare Service Pte. Ltd. |
| March 2001 |
| Asia Pacific |
| 1 |
| |
|
|
|
|
|
|
|
| |
Microbiotecnica |
| July 2001 |
| Latin America |
| 3 |
| |
|
|
|
|
|
|
|
| |
Commercial Parts & Services, Inc. |
| Oct. 2001 |
| GCS |
| 28 |
| |
The total cash consideration paid by the company for these acquisitions and cash adjustments to prior year acquisitions was approximately $32 million and $63 million for 2003 and 2002, respectively. The total cash consideration paid by the company for the 2001 acquisitions, excluding Henkel-Ecolab, was approximately $30 million, of which approximately $18 million was allocated to goodwill.
These acquisitions have been accounted for as purchases and, accordingly, the results of their operations have been included in the financial statements of the company from the dates of acquisition. Net sales and operating income of these businesses were not significant to the company’s consolidated results of operations, financial position and cash flows.
In January 2004, the company acquired Nigiko, a Paris-based provider of commercial pest elimination services throughout France. Nigiko pest elimination has annual sales of approximately $55 million. These operations will become part of the company’s International Cleaning & Sanitizing operations in 2004.
In February 2004, the company acquired Daydots International, a Texas-based provider of food safety products. Daydots has annual sales of approximately $22 million. These operations will become part of the company’s U.S. Cleaning & Sanitizing operations in 2004.
39
NOTE 6 BUSINESS ACQUISITIONS AND DISPOSITIONS
The changes in the carrying amount of goodwill for each of the company’s reportable segments for the years ended December 31, 2003 and 2002 are as follows:
|
| United States |
|
|
|
|
| |||||||||
(thousands) |
| Cleaning & |
| Other |
| Total |
| International |
| Consolidated |
| |||||
|
|
|
|
|
|
|
|
|
|
|
| |||||
Balance |
|
|
|
|
|
|
|
|
|
|
| |||||
December 31, 2001 |
| $ | 121,046 |
| $ | 44,796 |
| $ | 165,842 |
| $ | 431,083 |
| $ | 596,925 |
|
|
|
|
|
|
|
|
|
|
|
|
| |||||
Goodwill acquired during year* |
| 3,532 |
| 4,510 |
| 8,042 |
| 58,862 |
| 66,904 |
| |||||
|
|
|
|
|
|
|
|
|
|
|
| |||||
Foreign currency translation |
|
|
|
|
|
|
| 38,472 |
| 38,472 |
| |||||
|
|
|
|
|
|
|
|
|
|
|
| |||||
Impairment losses upon adoption of SFAS No. 142 on January 1, 2002 |
|
|
|
|
|
|
| (4,002 | ) | (4,002 | ) | |||||
|
|
|
|
|
|
|
|
|
|
|
| |||||
Impairment losses during 2002 |
| (2,599 | ) |
|
| (2,599 | ) |
|
| (2,599 | ) | |||||
|
|
|
|
|
|
|
|
|
|
|
| |||||
Balance |
|
|
|
|
|
|
|
|
|
|
| |||||
December 31, 2002 |
| 121,979 |
| 49,306 |
| 171,285 |
| 524,415 |
| 695,700 |
| |||||
|
|
|
|
|
|
|
|
|
|
|
| |||||
Goodwill acquired during year* |
| 367 |
| (377 | ) | (10 | ) | 825 |
| 815 |
| |||||
|
|
|
|
|
|
|
|
|
|
|
| |||||
Goodwill allocated to business dispositions |
|
|
|
|
|
|
| (2,708 | ) | (2,708 | ) | |||||
|
|
|
|
|
|
|
|
|
|
|
| |||||
Foreign currency translation |
|
|
|
|
|
|
| 103,404 |
| 103,404 |
| |||||
|
|
|
|
|
|
|
|
|
|
|
| |||||
Balance |
|
|
|
|
|
|
|
|
|
|
| |||||
December 31, 2003 |
| $ | 122,346 |
| $ | 48,929 |
| $ | 171,275 |
| $ | 625,936 |
| $ | 797,211 |
|
*All of the goodwill related to businesses acquired in 2003 and 2002 is expected to be tax deductible. Goodwill acquired in 2003 and 2002 also includes adjustments to prior year acquisitions. United States Other Services goodwill acquired during 2003 includes a reduction of $0.4 million for an adjustment related to the Audits International acquisition. International Cleaning and Sanitizing goodwill acquired during 2003 includes a reduction of $4.7 million for the Terminix acquisition primarily related to a finalization of the pension valuation at the date of acquisition.
Business Dispositions
In December 2002, the company sold its Darenas janitorial products distribution business based in Birmingham, United Kingdom. This sale resulted in a loss of approximately $1.7 million principally due to the amount of goodwill allocated to the disposed business. The annualized sales of this entity were approximately $30 million. In June 2003, the company sold its minority interest investment in Comac S.p.A., a floor care machine manufacturing company based in Verona, Italy, for a gain of approximately $11.1 million ($6.7 million after tax).The company accounted for this investment under the equity method of accounting. In September 2003, the company sold the consumer dermatology business of its recently acquired Adams Healthcare business at a nominal gain. Goodwill allocated to the sale of the dermatology business was approximately $1.0 million. The annualized sales of the dermatology business that was sold were approximately $2.5 million. These operations and investment were a part of the company’s International Cleaning & Sanitizing segment.
NOTE 7 BALANCE SHEET INFORMATION
December 31 (thousands) |
| 2003 |
| 2002 |
| 2001 |
| |||
|
|
|
|
|
|
|
| |||
ACCOUNTS RECEIVABLE, NET |
|
|
|
|
|
|
| |||
Accounts receivable |
| $ | 670,013 |
| $ | 589,149 |
| $ | 544,371 |
|
Allowance for doubtful accounts |
| (44,011 | ) | (35,995 | ) | (30,297 | ) | |||
Total |
| $ | 626,002 |
| $ | 553,154 |
| $ | 514,074 |
|
|
|
|
|
|
|
|
| |||
INVENTORIES |
|
|
|
|
|
|
| |||
Finished goods |
| $ | 159,633 |
| $ | 136,721 |
| $ | 124,657 |
|
Raw materials and parts |
| 152,127 |
| 156,628 |
| 156,754 |
| |||
Excess of fifo cost over lifo cost |
| (1,801 | ) | (1,843 | ) | (1,626 | ) | |||
Total |
| $ | 309,959 |
| $ | 291,506 |
| $ | 279,785 |
|
|
|
|
|
|
|
|
| |||
PROPERTY, PLANT AND EQUIPMENT, NET |
|
|
|
|
|
|
| |||
Land |
| $ | 26,921 |
| $ | 21,914 |
| $ | 20,349 |
|
Buildings and leaseholds |
| 243,795 |
| 231,119 |
| 221,054 |
| |||
Machinery and equipment |
| 589,620 |
| 525,359 |
| 452,611 |
| |||
Merchandising equipment |
| 949,553 |
| 821,109 |
| 743,404 |
| |||
Construction in progress |
| 21,488 |
| 18,830 |
| 22,217 |
| |||
|
| 1,831,377 |
| 1,618,331 |
| 1,459,635 |
| |||
Accumulated depreciation and amortization |
| (1,094,580 | ) | (938,066 | ) | (815,312 | ) | |||
Total |
| $ | 736,797 |
| $ | 680,265 |
| $ | 644,323 |
|
|
|
|
|
|
|
|
| |||
GOODWILL, NET |
|
|
|
|
|
|
| |||
Goodwill |
| $ | 992,622 |
| $ | 871,208 |
| $ | 763,211 |
|
Accumulated amortization |
| (195,411 | ) | (175,508 | ) | (166,286 | ) | |||
Total |
| $ | 797,211 |
| $ | 695,700 |
| $ | 596,925 |
|
|
|
|
|
|
|
|
| |||
OTHER INTANGIBLE ASSETS, NET |
|
|
|
|
|
|
| |||
Cost |
|
|
|
|
|
|
| |||
Customer relationships |
| $ | 153,479 |
| $ | 120,324 |
| $ | 104,277 |
|
Intellectual property |
| 77,793 |
| 71,104 |
| 66,418 |
| |||
Trademarks |
| 52,283 |
| 50,308 |
| 48,540 |
| |||
Other intangibles |
| 16,012 |
| 13,502 |
| 16,292 |
| |||
|
| 299,567 |
| 255,238 |
| 235,527 |
| |||
Accumulated amortization |
|
|
|
|
|
|
| |||
Customer relationships |
| (27,565 | ) | (9,238 | ) | (2,758 | ) | |||
Intellectual property |
| (45,809 | ) | (39,641 | ) | (35,800 | ) | |||
Trademarks |
| (9,313 | ) | (5,947 | ) | (5,097 | ) | |||
Other intangibles |
| (13,021 | ) | (11,742 | ) | (12,921 | ) | |||
Total |
| $ | 203,859 |
| $ | 188,670 |
| $ | 178,951 |
|
|
|
|
|
|
|
|
| |||
OTHER ASSETS, NET |
|
|
|
|
|
|
| |||
Deferred income taxes |
| $ | 43,168 |
| $ | 36,797 |
| $ | 56,952 |
|
Pension |
| 161,098 |
| 106,314 |
|
|
| |||
Other |
| 136,445 |
| 142,224 |
| 118,266 |
| |||
Total |
| $ | 340,711 |
| $ | 285,335 |
| $ | 175,218 |
|
|
|
|
|
|
|
|
| |||
SHORT-TERM DEBT |
|
|
|
|
|
|
| |||
Notes payable |
| $ | 66,250 |
| $ | 146,947 |
| $ | 230,306 |
|
Long-term debt, current maturities |
| 3,953 |
| 13,152 |
| 3,087 |
| |||
Total |
| $ | 70,203 |
| $ | 160,099 |
| $ | 233,393 |
|
|
|
|
|
|
|
|
| |||
OTHER CURRENT LIABILITIES |
|
|
|
|
|
|
| |||
Discounts and rebates |
| $ | 145,508 |
| $ | 127,418 |
| $ | 125,123 |
|
Other |
| 173,729 |
| 163,775 |
| 118,057 |
| |||
Total |
| $ | 319,237 |
| $ | 291,193 |
| $ | 243,180 |
|
|
|
|
|
|
|
|
| |||
LONG-TERM DEBT |
|
|
|
|
|
|
| |||
6.875% notes, due 2011 |
| $ | 149,101 |
| $ | 148,974 |
| $ | 148,847 |
|
5.375% Euronotes, due 2007 |
| 364,399 |
| 299,777 |
|
|
| |||
Commercial paper |
|
|
|
|
| 265,860 |
| |||
7.19% senior notes, due 2006 |
| 75,017 |
| 75,000 |
| 75,000 |
| |||
Other |
| 19,877 |
| 29,144 |
| 25,660 |
| |||
|
| 608,394 |
| 552,895 |
| 515,367 |
| |||
Long-term debt, current maturities |
| (3,953 | ) | (13,152 | ) | (3,087 | ) | |||
Total |
| $ | 604,441 |
| $ | 539,743 |
| $ | 512,280 |
|
40
The company has a $275 million Multicurrency Credit Agreement with a consortium of banks that has a term through 2005 and a $175 million 364-day Credit Agreement with a consortium of banks that has a term through October 2004. The company may borrow varying amounts in different currencies from time to time on a revolving credit basis. The company has the option of borrowing based on various short-term interest rates. Each agreement includes a covenant regarding the ratio of total debt to capitalization. No amounts were outstanding under these agreements at year-end 2003, 2002 and 2001.
These credit agreements support the company’s $450 million U.S. commercial paper program and its 200 million Australian dollar commercial paper program. The company had $64.1 million and $355.7 million in outstanding U.S. commercial paper at December 31, 2002 and 2001, respectively, with average annual interest rates of 1.4 percent and 2.0 percent, respectively. There was no U.S. commercial paper outstanding at December 31, 2003. The company also had 50.0 million, 50.0 million and 132.5 million of Australian dollar denominated commercial paper (in U.S. dollars, approximately $36 million, $28 million and $69 million, respectively) outstanding at December 31, 2003, 2002 and 2001, respectively, with average annual interest rates of 5.1 percent, 4.8 percent and 4.5 percent, respectively.
In June 2003, the company established a $200 million European commercial paper program to provide a source of funding for European and other international acquisitions and working capital requirements. The program is in addition to the company’s $450 million U.S. and 200 million Australian dollar programs. As of December 31, 2003, the company had not issued any European commercial paper. All three programs were rated A-1 by Standard & Poor’s and P-1 by Moody’s as of December 31,2003 and were supported by the company’s $275 million and $175 million committed credit facilities.
In February 2002, the company issued euro 300 million ($265.9 million at rates prevailing at that time) of 5.375 percent Euronotes, due February 2007. The proceeds from this debt issuance were used to repay a portion of the U.S. commercial paper outstanding as of December 31, 2001. Therefore, $265.9 million of commercial paper outstanding at December 31, 2001 was classified as long-term debt. As described further in Note 8, the company accounts for a majority of the transaction gains and losses related to the Euronotes as a component of the cumulative translation account within accumulated other comprehensive income (loss).
As of December 31, the weighted-average interest rate on notes payable was 6.3 percent in 2003, 4.6 percent in 2002 and 4.4 percent in 2001.
As of December 31, 2003, the aggregate annual maturities of long-term debt for the next five years were: 2004 - $3,953,000; 2005 -$4,136,000; 2006 - $77,999,000; 2007 - $366,267,000 and 2008 -$754,000.
Interest expense was $49,342,000 in 2003, $47,210,000 in 2002 and $31,477,000 in 2001. Interest income was $3,997,000 in 2003, $3,315,000 in 2002 and $3,043,000 in 2001. Total interest paid was $47,428,000 in 2003, $45,056,000 in 2002 and $26,402,000 in 2001.
NOTE 8 FINANCIAL INSTRUMENTS
Foreign Currency Forward Contracts
The company has entered into foreign currency forward contracts to hedge transactions related to intercompany debt, subsidiary royalties, product purchases, firm commitments and other intercompany transactions. The company uses these contracts to hedge against the effect of foreign currency exchange rate fluctuations on forecasted cash flows. These contracts generally relate to the company’s European operations and are denominated in euros. The company had foreign currency forward exchange contracts that totaled approximately $239 million at December 31, 2003, $199 million at December 31, 2002 and $130 million at December 31, 2001. These contracts generally expire within one year. In addition, at December 31, 2001 the company had approximately $190 million of foreign currency forward exchange contracts outstanding related to short-term financing of the Henkel-Ecolab acquisition. These contracts matured in February 2002. The gains and losses related to these contracts were included as a component of other comprehensive income until the hedged item is reflected in earnings.
Interest Rate Swap Agreements
The company enters into interest rate swap agreements to manage interest rate exposures and to achieve a desired proportion of variable and fixed rate debt.
In 2003, the company entered into an interest rate swap agreement that converts $30 million of the 7.19% senior notes from a fixed interest rate to a floating or variable interest rate. This agreement is effective until January 2006. The interest rate swap was designated as a fair value hedge and had an insignificant value as of December 31, 2003. The mark to market gain on this agreement has been recorded as part of interest expense and has been offset by the market to market on this portion of the 7.19% senior notes.
During 2002, the company entered into an interest rate swap agreement in connection with the issuance of its Euronotes. This agreement converts approximately euro 78 million (approximately $94 million at year-end 2003) of the Euronote debt from a fixed interest rate to a floating or variable interest rate and is effective until February 2007. This interest rate swap was designated as a fair value hedge and had a value of $6.4 million and $3.5 million as of December 31, 2003 and 2002, respectively. The mark to market gain on this agreement has been recorded as part of interest expense and has been offset by the loss recorded in interest expense on the mark to market on this portion of the Euronotes. There is no hedge ineffectiveness on this interest rate swap.
The company has also entered into an interest rate swap agreement to provide for a fixed rate of interest on the first 50 million Australian dollars (approximately $36 million at year-end 2003) of Australian floating-rate debt. This agreement is effective through November 2004 and has a fixed annual pay rate of approximately 6 percent. This interest rate swap agreement was designated as, and effective as, a cash flow hedge of the outstanding debt. The change in fair value of the interest rate swap is recorded in other comprehensive income and recognized as earnings to offset the forecasted hedged transactions as they occur.
Net Investment Hedges
In February 2002, the company issued euro 300 million of 5.375 percent Euronotes, due 2007. The company designated a portion (approximately euro 200 million at year-end 2002 and euro 290 million at year-end 2003) of this Euronote debt as a hedge of existing foreign currency exposures related to net investments the company has in certain European subsidiaries. Accordingly, the transaction gains and losses on this portion of the Euronotes that are designated and effective as hedges of the company’s net investments have been included as a component of the cumulative translation account within accumulated other comprehensive income (loss).Total transaction losses related to the Euronotes and charged to this shareholders’ equity account were $52.5 million and $26.0 million for the years ended December 31, 2003 and 2002,
41
respectively. Transaction gains and losses on the remaining portion of the Euronotes have been included in earnings and were offset by transaction gains and losses related to other euro denominated assets held by the company’s U.S. operations.
Credit Risk
The company is exposed to credit loss in the event of nonperformance of counterparties for foreign currency forward exchange contracts and interest rate swap agreements. The company’s risk is limited to the fair value of these contracts. The company monitors its exposure to credit risk by using credit approvals and credit limits and selecting major international banks and financial institutions as counterparties. The company does not anticipate nonperformance by any of these counter-parties.
Fair Value of Other Financial Instruments
The carrying amount and the estimated fair value of other financial instruments held by the company were:
December 31 (thousands) |
| 2003 |
| 2002 |
| 2001 |
| |||
|
|
|
|
|
|
|
| |||
Carrying amount |
|
|
|
|
|
|
| |||
Cash and cash equivalents |
| $ | 85,626 |
| $ | 49,205 |
| $ | 41,793 |
|
Notes payable |
| 30,050 |
| 54,847 |
| 71,466 |
| |||
Commercial paper |
| 36,200 |
| 92,100 |
| 424,700 |
| |||
Long-term debt (including current maturities) |
| 608,394 |
| 552,895 |
| 249,507 |
| |||
Fair value |
|
|
|
|
|
|
| |||
Long-term debt (including current maturities) |
| $ | 656,576 |
| $ | 588,003 |
| $ | 260,518 |
|
The carrying amounts of cash equivalents, notes payable and commercial paper approximate fair value because of their short maturities.
The fair value of long-term debt is based on quoted market prices for the same or similar debt instruments.
NOTE 9 SHAREHOLDERS’ EQUITY
The company’s common stock was split two-for-one in the form of a 100 percent stock dividend paid June 6, 2003 to shareholders of record on May 23, 2003. All per share data have been adjusted to reflect the stock split, except for prior year data in the Consolidated Balance Sheet and the Consolidated Statement of Comprehensive Income and Shareholders’ Equity.
Authorized common stock, par value $1.00 per share, was 400 million shares in 2003, and 200 million shares in 2002 and 2001. Treasury stock is stated at cost. Dividends declared per share of common stock were $0.2975 for 2003, $0.275 for 2002 and $0.2625 for 2001.
The company has 15 million shares, without par value, of authorized but unissued preferred stock.
Each share of outstanding common stock entitles the holder to one-fourth of a preferred stock purchase right. A right entitles the holder, upon occurrence of certain events, to buy one one-hundredth of a share of Series A Junior Participating Preferred Stock at a purchase price of $115, subject to adjustment. The rights, however, will not become exercisable unless and until, among other things, any person or group acquires 15 percent or more of the outstanding common stock of the company, or the company’s board of directors declares a holder of 10 percent or more of the outstanding common stock to be an “adverse person” as defined in the rights plan. Upon the occurrence of either of these events, the rights will become exercisable for common stock of the company (or in certain cases common stock of an acquiring company) having a market value of twice the exercise price of a right. The rights provide that the holdings by Henkel or its affiliates, subject to compliance by Henkel with certain conditions, will not cause the rights to become exercisable nor cause Henkel to be an “adverse person.” The rights are redeemable under certain circumstances at one cent per right and, unless redeemed earlier, will expire on March 11, 2006.
The company reacquired 6,218,000 shares of its common stock in 2003,165,000 shares in 2002 and 621,700 shares in 2001 through open and private market purchases under prior board authorizations. The equivalent number of shares reacquired on a post stock-split basis were 8,014,500 in 2003, 330,000 in 2002 and 1,243,000 shares in 2001. In October 2003, the company approved a new authorization to repurchase up to 10 million additional shares of Ecolab common stock for the purpose of offsetting the dilutive effect of shares issued for stock incentive plans and for general corporate purposes. As of December 31, 2003, 10.4 million shares remained to be purchased under all of the company’s repurchase programs. On a pre-split basis, the company also reacquired 448,861 shares of its common stock in 2003, 33,778 shares in 2002 and 209,419 shares in 2001 related to the exercise of stock options and the vesting of stock awards.
NOTE 10 STOCK INCENTIVE AND OPTION PLANS
The company’s stock incentive and option plans provide for grants of stock options and stock awards. Common shares available for grant as of December 31 were 8,674,459 for 2003, 12,305,052 for 2002 and 3,799,142 for 2001. Common shares available for grant reflect 12 million shares approved by shareholders during 2002 for issuance under the plans.
Options may be granted to purchase shares of the company’s stock at not less than fair market value at the date of grant. Options granted in 2003, 2002 and 2001 generally become exercisable over three years from date of grant and expire within ten years from date of grant. A summary of stock option activity and average exercise prices is as follows:
Shares |
| 2003 |
| 2002 |
| 2001 |
|
|
|
|
|
|
|
|
|
Granted |
| 4,765,823 |
| 4,912,674 |
| 5,334,052 |
|
Exercised |
| (6,383,227 | ) | (4,432,722 | ) | (3,128,274 | ) |
Canceled |
| (379,634 | ) | (1,473,670 | ) | (1,112,668 | ) |
December 31: |
|
|
|
|
|
|
|
Outstanding |
| 21,867,726 |
| 23,864,764 |
| 24,858,482 |
|
Exercisable |
| 12,823,743 |
| 14,444,562 |
| 15,393,806 |
|
Average exercise price per share |
| 2003 |
| 2002 |
| 2001 |
| |||
|
|
|
|
|
|
|
| |||
Granted |
| $ | 27.18 |
| $ | 24.24 |
| $ | 19.32 |
|
Exercised |
| 19.84 |
| 10.27 |
| 6.19 |
| |||
Canceled |
| 21.87 |
| 21.08 |
| 22.34 |
| |||
December 31: |
|
|
|
|
|
|
| |||
Outstanding |
| 20.87 |
| 19.35 |
| 16.87 |
| |||
Exercisable |
| $ | 17.96 |
| $ | 17.77 |
| $ | 15.46 |
|
42
Information related to stock options outstanding and stock options exercisable as of December 31, 2003, is as follows:
Options Outstanding |
| |||||||||||||
Range of |
| Options |
| Weighted-Average |
| Weighted-Average |
| |||||||
|
|
|
|
|
|
|
|
|
| |||||
$ | 5.38- | $ | 10.31 |
|
| 1,418,002 |
| 1.9 years |
| $ | 7.07 |
| ||
$ | 10.95- | $ | 18.96 |
|
| 5,370,187 |
| 6.9 years |
| 17.81 |
| |||
$ | 19.27- | $ | 20.06 |
|
| 5,176,870 |
| 6.4 years |
| 19.49 |
| |||
$ | 20.23- | $ | 24.34 |
|
| 5,206,844 |
| 8.7 years |
| 23.98 |
| |||
$ | 24.55- | $ | 27.39 |
|
| 4,695,823 |
| 10.0 years |
| $ | 27.23 |
| ||
Options Exercisable |
| |||||||||||
Range of |
| Options |
| Weighted-Average |
| |||||||
|
|
|
|
|
|
|
| |||||
$ | 5.38- | $ | 10.31 |
|
| 1,418,002 |
| $ | 7.07 |
| ||
$ | 10.95- | $ | 18.96 |
|
| 4,060,166 |
| 17.40 |
| |||
$ | 19.27- | $ | 20.06 |
|
| 5,151,290 |
| 19.48 |
| |||
$ | 20.23- | $ | 24.34 |
|
| 2,072,012 |
| 23.56 |
| |||
$ | 24.55- | $ | 27.39 |
|
| 122,273 |
| $ | 25.29 |
| ||
The weighted-average grant-date fair value of options granted in 2003, 2002 and 2001, and the significant assumptions used in determining the underlying fair value of each option grant, on the date of grant, utilizing the Black-Scholes option-pricing model, were as follows:
|
| 2003 |
| 2002 |
| 2001 |
| |||
|
|
|
|
|
|
|
| |||
Weighted-average grant date fair value of options granted |
|
|
|
|
|
|
| |||
Granted at market prices |
| $ | 7.85 |
| $ | 7.10 |
| $ | 5.63 |
|
Granted at prices exceeding market |
| — |
| — |
| $ | 2.37 |
| ||
|
|
|
|
|
|
|
| |||
Assumptions |
|
|
|
|
|
|
| |||
Risk-free interest rate |
| 3.5 | % | 3.6 | % | 4.7 | % | |||
Expected life |
| 6 years |
| 6 years |
| 6 years |
| |||
Expected volatility |
| 26.8 | % | 26.5 | % | 24.8 | % | |||
Expected dividend yield |
| 1.2 | % | 1.1 | % | 1.3 | % | |||
The expense associated with shares of restricted stock issued under the company’s stock incentive plan is based on the market price of the company’s stock at the date of grant and is amortized on a straight-line basis over the periods during which the restrictions lapse. Restricted stock awards generally vest over a 4-year period with 50 percent vesting 2 years after grant and the remaining 50 percent vesting 4 years after grant. Stock awards are not performance based and vest with continued employment. Stock awards are subject to forfeiture in the event of termination of employment. The company granted 10,500 shares in 2003, 67,200 shares in 2002 and 11,600 shares in 2001 under its restricted stock award program.
The company uses the intrinsic value-based method of accounting to measure compensation expense for its stock incentive and option plans. See Note 2 to the consolidated financial statements for the pro forma net income and related basic and diluted per common share amounts had the company used the fair value-based method of accounting to measure compensation expense.
NOTE 11 INCOME TAXES
Income from continuing operations before income taxes and equity in earnings of Henkel-Ecolab consisted of:
(thousands) |
| 2003 |
| 2002 |
| 2001 |
| |||
|
|
|
|
|
|
|
| |||
Domestic |
| $ | 286,003 |
| $ | 258,779 |
| $ | 249,026 |
|
Foreign |
| 162,415 |
| 93,192 |
| 40,719 |
| |||
Total |
| $ | 448,418 |
| $ | 351,971 |
| $ | 289,745 |
|
The provision for income taxes consisted of:
(thousands) |
| 2003 |
| 2002 |
| 2001 |
| |||
|
|
|
|
|
|
|
| |||
Federal and state |
| $ | 78,928 |
| $ | 59,601 |
| $ | 107,055 |
|
Foreign |
| 49,687 |
| 30,557 |
| 13,303 |
| |||
Currently payable |
| 128,615 |
| 90,158 |
| 120,358 |
| |||
|
|
|
|
|
|
|
| |||
Federal and state |
| 33,178 |
| 43,974 |
| (1,940 | ) | |||
Foreign |
| 9,277 |
| 5,949 |
| (1,010 | ) | |||
Deferred |
| 42,455 |
| 49,923 |
| (2,950 | ) | |||
|
|
|
|
|
|
|
| |||
Provision for income taxes |
| $ | 171,070 |
| $ | 140,081 |
| $ | 117,408 |
|
The company’s overall net deferred tax assets and deferred tax liabilities were comprised of the following:
December 31 (thousands) |
| 2003 |
| 2002 |
| 2001 |
| |||
|
|
|
|
|
|
|
| |||
Deferred tax assets |
|
|
|
|
|
|
| |||
Postretirement health care and pension benefits |
| $ | 1,008 |
| $ | 19,249 |
| $ | 47,792 |
|
Other accrued liabilities |
| 53,924 |
| 52,399 |
| 55,758 |
| |||
Loss carryforwards |
| 11,756 |
| 13,932 |
| 18,679 |
| |||
Other, net |
| 27,856 |
| 28,090 |
| 17,552 |
| |||
Valuation allowance |
| (2,719 | ) | (1,462 | ) | (1,462 | ) | |||
Total |
| 91,825 |
| 112,208 |
| 138,319 |
| |||
|
|
|
|
|
|
|
| |||
Deferred tax liabilities |
|
|
|
|
|
|
| |||
Property, plant and equipment basis differences |
| 61,062 |
| 53,320 |
| 40,956 |
| |||
Intangible assets |
| 49,465 |
| 38,696 |
| 26,381 |
| |||
Other, net |
| 4,714 |
| 3,273 |
| 5,403 |
| |||
Total |
| 115,241 |
| 95,289 |
| 72,740 |
| |||
|
|
|
|
|
|
|
| |||
Net deferred tax assets (liabilities) |
| $ | (23,416 | ) | $ | 16,919 |
| $ | 65,579 |
|
A reconciliation of the statutory U.S. federal income tax rate to the company’s effective income tax rate was:
|
| 2003 |
| 2002 |
| 2001 |
|
|
|
|
|
|
|
|
|
Statutory U.S. rate |
| 35.0 | % | 35.0 | % | 35.0 | % |
State income taxes, net of federal benefit |
| 2.7 |
| 3.2 |
| 4.2 |
|
Foreign operations |
| 0.5 |
| 1.0 |
| — |
|
Other, net |
| (0.1 | ) | 0.6 |
| 1.3 |
|
Effective income tax rate |
| 38.1 | % | 39.8 | % | 40.5 | % |
Cash paid for income taxes was approximately $90 million in 2003, $95 million in 2002 and $99 million in 2001.
43
No provision has been made for income taxes on the undistributed earnings of foreign subsidiaries. In the event of a distribution of these earnings, foreign tax credits would be available to substantially offset any amount of applicable income tax and foreign withholding taxes that might be payable on these earnings.
NOTE 12 RENTALS AND LEASES
The company leases sales and administrative office facilities, distribution center facilities, automobiles, computers and other equipment under operating leases. Rental expense under all operating leases was $81,781,000 in 2003, $77,593,000 in 2002 and $60,365,000 in 2001. As of December 31, 2003, future minimum payments under operating leases with noncancelable terms in excess of one year were:
(thousands) |
|
|
| |
2004 |
| $ | 35,726 |
|
2005 |
| 29,470 |
| |
2006 |
| 21,666 |
| |
2007 |
| 15,805 |
| |
2008 |
| 13,587 |
| |
Thereafter |
| 22,271 |
| |
Total |
| $ | 138,525 |
|
The company enters into operating leases in the U.S. for vehicles whose noncancellable terms are one year or less in duration with month-to-month renewal options. These leases have been excluded from the table above. The automobile leases have guaranteed residual values that have historically been satisfied primarily by the proceeds on the sale of the vehicles. No estimated losses have been recorded for these guarantees as the company believes, based upon the results of previous leasing arrangements, that the potential recovery of value from the vehicles when sold will be greater than the residual value guarantee.
NOTE 13 RESEARCH EXPENDITURES
Research expenditures that related to the development of new products and processes, including significant improvements and refinements to existing products, were $53,171,000 in 2003, $49,860,000 in 2002 and $33,103,000 in 2001.
NOTE 14 COMMITMENTS AND CONTINGENCIES
The company and certain subsidiaries are party to various environmental actions that have arisen in the ordinary course of business. These include possible obligations to investigate and mitigate the effects on the environment of the disposal or release of certain chemical substances at various sites, such as Superfund sites and other operating or closed facilities. The effect of these actions on the company’s financial position, results of operations and cash flows to date has not been significant. The company is currently participating in environmental assessments and remediation at a number of locations and environmental liabilities have been accrued reflecting management’s best estimate of future costs. At December 31, 2003, the accrual for environmental remediation costs was approximately $3.9 million. Potential insurance reimbursements are not anticipated in the company’s accruals for environmental liabilities.
The company is self-insured in North America for most workers compensation, general liability and automotive liability losses subject to per occurrence and aggregate annual liability limitations. The company is insured for losses in excess of these limitations. The company is also self-insured for health care claims for eligible participating employees subject to certain deductibles and limitations. The company determines its liability for claims incurred but not reported on an actuarial basis.
While the final resolution of these contingencies could result in expenses different than current accruals, and therefore have an impact on the company’s consolidated financial results in a future reporting period, management believes the ultimate outcome will not have a significant effect on the company’s consolidated results of operations, financial position or cash flows.
NOTE 15 RETIREMENT PLANS
Pension and Postretirement Health Care Benefits Plans
The company has a noncontributory defined benefit pension plan covering most of its U.S. employees. Effective January 1, 2003, the U.S. Pension Plan was amended to provide a cash balance type pension benefit to employees hired on or after the effective date. For participants enrolled prior to January 1, 2003, plan benefits are based on years of service and highest average compensation for five consecutive years of employment. For participants enrolled after December 31, 2002, plan benefits are based on contribution credits equal to a fixed percentage of their current salary and interest credits. The measurement date used for determining the U.S. Pension Plan assets and obligations was December 31. Various international subsidiaries also have defined benefit pension plans. Prior to the acquisition of Henkel-Ecolab at the end of fiscal 2001, the international plans were not significant. Beginning in 2002, the information below includes all of the company’s significant international defined benefit pension plans.
The company provides postretirement health care benefits to certain U.S. employees. The plan is contributory based on years of service and family status, with retiree contributions adjusted annually. The measurement date used to determine the U.S. postretirement healthcare plan assets and obligations was December 31. Certain employees outside the U.S. were covered under government-sponsored programs, which are not required to be fully funded. The expense and obligation for providing International postretirement healthcare benefits was not significant.
44
A reconciliation of changes in the benefit obligations and fair value of assets of the company’s plans is as follows:
|
| U.S. Pension Benefits |
| International |
| U.S. Postretirement Health Care |
| ||||||||||||||||||
(thousands) |
| 2003 |
| 2002 |
| 2001 |
| 2003 |
| 2002 |
| 2003 |
| 2002 |
| 2001 |
| ||||||||
Benefit obligation, beginning of year |
| $ | 485,155 |
| $ | 396,827 |
| $ | 347,430 |
| $ | 245,876 |
| $ | 172,328 |
| $ | 131,206 |
| $ | 134,116 |
| $ | 110,002 |
|
Service cost |
| 26,442 |
| 21,635 |
| 18,925 |
| 11,997 |
| 9,412 |
| 7,447 |
| 2,814 |
| 7,342 |
| ||||||||
Interest cost |
| 32,208 |
| 29,237 |
| 26,461 |
| 14,633 |
| 10,973 |
| 8,597 |
| 7,651 |
| 8,826 |
| ||||||||
Company contributions |
| — |
| — |
| — |
| — |
| 137 |
| — |
| — |
| — |
| ||||||||
Participant contributions |
| — |
| — |
| — |
| 1,515 |
| 68 |
| 1,856 |
| 1,214 |
| 1,045 |
| ||||||||
Acquisitions |
| — |
| — |
| — |
| 1,086 |
| 43,135 |
| — |
| — |
| — |
| ||||||||
Plan amendments, settlements and curtailments |
| — |
| — |
| 726 |
| (948 | ) | 1,522 |
| (1,930 | ) | (40,760 | ) | — |
| ||||||||
Changes in assumptions |
| 33,397 |
| 53,467 |
| 14,723 |
| — |
| — |
| 8,675 |
| 24,588 |
| 5,001 |
| ||||||||
Actuarial loss (gain) |
| (5,232 | ) | (1,889 | ) | 1,064 |
| 13,007 |
| (2,554 | ) | 7,828 |
| 8,659 |
| 7,531 |
| ||||||||
Benefits paid |
| (15,894 | ) | (14,122 | ) | (12,502 | ) | (11,892 | ) | (8,913 | ) | (8,649 | ) | (7,076 | ) | (5,631 | ) | ||||||||
Foreign currency translation |
| — |
| — |
| — |
| 46,632 |
| 19,768 |
| — |
| — |
| — |
| ||||||||
Benefit obligation, end of year |
| $ | 556,076 |
| $ | 485,155 |
| $ | 396,827 |
| $ | 321,906 |
| $ | 245,876 |
| $ | 155,030 |
| $ | 131,206 |
| $ | 134,116 |
|
|
|
|
|
|
|
|
|
|
|
|
|
|
|
|
|
|
| ||||||||
Fair value of plan assets, beginning of year |
| $ | 378,504 |
| $ | 311,164 |
| $ | 317,027 |
| $ | 134,089 |
| $ | 108,485 |
| $ | 18,911 |
| $ | 23,811 |
| $ | 27,128 |
|
Actual gains (losses) on plan assets |
| 107,192 |
| (43,112 | ) | (19,244 | ) | 9,400 |
| (9,438 | ) | 5,054 |
| (2,866 | ) | (1,627 | ) | ||||||||
Acquisitions |
| — |
| — |
| — |
| 263 |
| 23,331 |
| — |
| — |
| — |
| ||||||||
Company contributions |
| 75,000 |
| 124,574 |
| 25,883 |
| 12,743 |
| 7,794 |
| 4,807 |
| 3,828 |
| 2,896 |
| ||||||||
Participant contributions |
| — |
| — |
| — |
| 1,407 |
| 1,052 |
| 1,856 |
| 1,214 |
| 1,045 |
| ||||||||
Settlements |
| — |
| — |
| — |
| (547 | ) | — |
| — |
| — |
| — |
| ||||||||
Benefits paid |
| (15,894 | ) | (14,122 | ) | (12,502 | ) | (11,892 | ) | (7,800 | ) | (8,649 | ) | (7,076 | ) | (5,631 | ) | ||||||||
Foreign currency translation |
| — |
| — |
| — |
| 25,512 |
| 10,665 |
| — |
| — |
| — |
| ||||||||
Fair value of plan assets, end of year |
| $ | 544,802 |
| $ | 378,504 |
| $ | 311,164 |
| $ | 170,975 |
| $ | 134,089 |
| $ | 21,979 |
| $ | 18,911 |
| $ | 23,811 |
|
A reconciliation of the funded status for the pension and postretirement plans is as follows:
|
| U.S. Pension Benefits |
| International |
| U.S. Postretirement Health Care |
| ||||||||||||||||||||||||||
(thousands) |
| 2003 |
| 2002 |
| 2001 |
| 2003 |
| 2002 |
| 2003 |
| 2002 |
| 2001 |
| ||||||||||||||||
Funded status |
| $ | (11,274 | ) | $ | (106,651 | ) | $ | (85,663 | ) | $ | (150,931 | ) | $ | (111,787 | ) | $ | (133,051 | ) | $ | (112,295 | ) | $ | (110,305 | ) | ||||||||
Unrecognized actuarial loss |
| 160,939 |
| 201,006 |
| 73,641 |
| 44,123 |
| 25,881 |
| 63,559 |
| 56,823 |
| 20,644 |
| ||||||||||||||||
Unrecognized prior service cost (benefit) |
| 7,400 |
| 9,329 |
| 11,258 |
| 2,265 |
| (55 | ) | (34,059 | ) | (37,431 | ) | (6,893 | ) | ||||||||||||||||
Unrecognized net transition (asset) obligation |
| (2,105 | ) | (3,508 | ) | (4,911 | ) | 627 |
| 833 |
| — |
| — |
| — |
| ||||||||||||||||
Net amount recognized |
| $ | 154,960 |
| $ | 100,176 |
| $ | (5,675 | ) | $ | (103,916 | ) | $ | (85,128 | ) | $ | (103,551 | ) | $ | (92,903 | ) | $ | (96,554 | ) | ||||||||
The net amount recognized in the balance sheet and the accumulated benefit obligation is as follows:
|
| U.S. Pension Benefits |
| International |
| U.S. Postretirement Health Care |
| ||||||||||||||||||
(thousands) |
| 2003 |
| 2002 |
| 2001 |
| 2003 |
| 2002 |
| 2003 |
| 2002 |
| 2001 |
| ||||||||
Prepaid benefit cost |
| $ | 154,960 |
| $ | 100,176 |
| $ | — |
| $ | 26,533 |
| $ | 13,175 |
| $ | — |
| $ | — |
| $ | — |
|
Accrued benefit cost |
| — |
| — |
| (5,675 | ) | (146,180 | ) | (99,355 | ) | (103,551 | ) | (92,903 | ) | (96,554 | ) | ||||||||
Accumulated other comprehensive loss |
| — |
| — |
| — |
| 15,731 |
| 1,052 |
| — |
| — |
| — |
| ||||||||
Net amount recognized |
| $ | 154,960 |
| $ | 100,176 |
| $ | (5,675 | ) | $ | (103,916 | ) | $ | (85,128 | ) | $ | (103,551 | ) | $ | (92,903 | ) | $ | (96,554 | ) |
Accumulated benefit obligation |
| $ | 441,488 |
| $ | 375,406 |
| $ | 305,780 |
|
|
|
|
| $ | 155,030 |
| $ | 131,206 |
| $ | 134,116 |
| ||
45
For certain international pension plans, the accumulated benefit obligation exceeded the fair value of plan assets. Therefore, the company recognized a minimum pension liability in other comprehensive income of $14.5 million pre-tax ($9.5 million net of deferred tax asset) during 2003 and $1.1 million during 2002.
The aggregate projected benefit obligation, accumulated benefit obligation and fair value of plan assets for those plans with accumulated benefit obligations in excess of plan assets were $261,138,000, $238,819,000 and $95,655,000, respectively, at December 31, 2003, and $103,063,000, $90,428,000 and $14,163,000, respectively, at December 31, 2002. These plans relate to various international subsidiaries and are funded consistent with local practices and requirements. As of December 31, 2003 there were approximately $4.5 million of future post retirement benefits covered by insurance contracts.
Plan Assets
The company’s plan asset allocations for its U.S. defined benefit pension and postretirement health care benefits plans at December 31, 2003, 2002 and 2001, and target allocation for 2004 are as follows:
Asset |
| 2004 |
| Percentage of Plan Assets |
| ||||
Category |
| Percentage |
| 2003 |
| 2002 |
| 2001 |
|
|
|
|
|
|
|
|
|
|
|
Large Cap Equity |
| 43 | % | 46 | % | 43 | % | 39 | % |
Small Cap Equity |
| 12 |
| 13 |
| 12 |
| 10 |
|
International Equity |
| 15 |
| 15 |
| 15 |
| 20 |
|
Fixed Income |
| 25 |
| 22 |
| 25 |
| 24 |
|
Real Estate |
| 5 |
| 4 |
| 5 |
| 7 |
|
Total |
| 100 | % | 100 | % | 100 | % | 100 | % |
As of year-end 2003, the fixed income securities mature in periods up to 30 years, with a weighted average maturity of 5.6 years. The company’s U.S. investment strategy and policies are designed to maximize the possibility of having sufficient funds to meet the long-term liabilities of the pension fund, while achieving a balance between the goals of growing the assets of the plan and keeping risk at a reasonable level. Current income is not a key goal of the plan. The pension and health care plans’ demographic characteristics generally reflect a younger workforce relative to an average pension plan. Therefore, the asset allocation position reflects the ability and willingness to accept relatively more short-term variability in the performance of the pension plan portfolio in exchange for the expectation of a better funded status, better long-term returns and lower pension costs in the long run.
Since diversification is widely recognized as necessary to reduce risk, the pension fund is diversified across several asset classes and securities. Selected individual portfolios may be undiversified while maintaining the diversified nature of total plan assets.
The plan prohibits investing in letter stock, warrants and options, and engaging in short sales, margin transactions, or other specialized investment activities. The use of derivatives is also prohibited for the purpose of speculation or introducing leverage in the portfolio, circumventing the investment guidelines or taking risks that are inconsistent with the fund’s guidelines. Selected derivatives may only be used for hedging and transactional efficiency.
Cash Flows
The company’s funding policy for the U.S. pension plan is to achieve a return on assets that meets the long-term funding requirements identified by the projections of the pension plan’s actuaries while simultaneously satisfying the fiduciary responsibilities prescribed by ERISA. The company is not required to make any contributions to the U.S. pension plan and postretirement health care benefit plans in 2004.
Net Periodic Benefit Costs
Pension and postretirement health care benefits expense for the company’s operations was:
|
| U.S. Pension Benefits |
| International |
| U.S. Postretirement Health Care |
| |||||||||||||||||||
(thousands) |
| 2003 |
| 2002 |
| 2001 |
| 2003 |
| 2002 |
| 2003 |
| 2002 |
| 2001 |
| |||||||||
|
|
|
|
|
|
|
|
|
|
|
|
|
|
|
|
|
| |||||||||
Service cost - employee benefits earned during the year |
| $ | 26,442 |
| $ | 21,635 |
| $ | 18,925 |
| $ | 11,997 |
| $ | 9,412 |
| $ | 2,945 |
| $ | 2,814 |
| $ | 7,342 |
| |
Interest cost on benefit obligation |
| 32,208 |
| 29,237 |
| 26,461 |
| 14,633 |
| 10,973 |
| 8,597 |
| 7,651 |
| 8,826 |
| |||||||||
Adjustments for death benefits for retired executives |
| — |
| — |
| — |
| — |
| — |
| 4,502 |
| — |
| — |
| |||||||||
Expected return on plan assets |
| (42,411 | ) | (32,675 | ) | (28,862 | ) | (9,908 | ) | (8,556 | ) | (1,580 | ) | (2,071 | ) | (2,363 | ) | |||||||||
Recognition of net actuarial loss (gain) |
| 3,451 |
| — |
| — |
| 932 |
| 394 |
| 6,293 |
| 2,005 |
| — |
| |||||||||
Amortization of prior service cost (benefit) |
| 1,929 |
| 1,929 |
| 1,881 |
| 41 |
| 204 |
| (5,302 | ) | (4,431 | ) | (551 | ) | |||||||||
Amortization of net transition (asset) obligation |
| (1,403 | ) | (1,403 | ) | (1,403 | ) | 493 |
| 272 |
| — |
| — |
| — |
| |||||||||
Curtailment (gain) loss |
| — |
| — |
| — |
| — |
| 1,522 |
| — |
| (5,791 | ) | — |
| |||||||||
Total expense |
| $ | 20,216 |
| $ | 18,723 |
| $ | 17,002 |
| $ | 18,188 |
| $ | 14,221 |
| $ | 15,455 |
| $ | 177 |
| $ | 13,254 |
| |
46
Total international pension expense, excluding the 50 percent owned Henkel-Ecolab operations, was $1,641,000 in 2001.
The company also has U.S. noncontributory non-qualified defined benefit plans, which provide for benefits to employees in excess of limits permitted under its U.S. pension plan. The recorded obligation for these plans was approximately $19 million at December 31, 2003. The annual expense for these plans was approximately $4 million in 2003, $3 million in 2002 and $3 million in 2001.
Plan Assumptions
|
| U.S. Pension Benefits |
| International |
| U.S. Postretirement Health Care |
| ||||||||||
|
| 2003 |
| 2002 |
| 2001 |
| 2003 |
| 2002 |
| 2003 |
| 2002 |
| 2001 |
|
|
|
|
|
|
|
|
|
|
|
|
|
|
|
|
|
|
|
Weighted-average actuarial assumptions used to determine benefit obligations as of December 31: |
|
|
|
|
|
|
|
|
|
|
|
|
|
|
|
|
|
Discount rate |
| 6.25 | % | 6.75 | % | 7.50 | % | 5.39 | % | 5.42 | % | 6.25 | % | 6.75 | % | 7.50 | % |
Projected salary increase |
| 4.30 |
| 4.80 |
| 4.80 |
| 3.31 |
| 3.40 |
|
|
|
|
|
|
|
|
|
|
|
|
|
|
|
|
|
|
|
|
|
|
|
|
|
Weighted-average actuarial assumptions used to determine net cost: |
|
|
|
|
|
|
|
|
|
|
|
|
|
|
|
|
|
Discount rate |
| 6.75 |
| 7.50 |
| 7.75 |
| 5.11 |
| 5.37 |
| 6.75 |
| 7.50 |
| 7.75 |
|
Expected return on plan assets |
| 9.00 |
| 9.00 |
| 9.00 |
| 5.97 |
| 5.26 |
| 9.00 | % | 9.00 | % | 9.00 | % |
Projected salary increase |
| 4.80 | % | 4.80 | % | 4.80 | % | 3.25 | % | 3.36 | % |
|
|
|
|
|
|
The expected long-term rate of return is generally based on the pension plan’s asset mix, assumptions of equity returns based on historical long-term returns on asset categories, expectations for inflation, and estimates of the impact of active management of the assets.
For postretirement benefit measurement purposes, 9.0 percent (for pre-age 65 retirees) and 11.0 percent (for post-age 65 retirees) annual rates of increase in the per capita cost of covered health care were assumed for 2003. The rates were assumed to decrease by 1 percent each year until they reach 5 percent in 2008 for pre-age 65 retirees and 5 percent in 2010 for post-age 65 retirees and remain at those levels thereafter. Health care costs which are eligible for subsidy by the company are limited to a 4 percent annual increase beginning in 1996 for certain employees.
Assumed health care cost trend rates have a significant effect on the amounts reported for the company’s U.S. postretirement health care benefits plan. A one-percentage point change in the assumed health care cost trend rates would have the following effects:
|
| 1-Percentage Point |
| ||||
(thousands) |
| Increase |
| Decrease |
| ||
Effect on total of service and interest cost components |
| $ | 593 |
| $ | (575 | ) |
|
|
|
|
|
| ||
Effect on postretirement benefit obligation |
| 10,115 |
| (9,834 | ) | ||
Effective March 2002, the company changed its postretirement health care benefits plan to discontinue the employer subsidy for postretirement health care benefits for most active employees. These subsidized benefits will continue to be provided to certain defined active employees and all existing retirees. As a result of these actions, the company recorded a curtailment gain of approximately $6 million in the first quarter of 2002.
The Medicare Prescription Drug, Improvement and Modernization Act of 2003 (the Act) introduces a prescription drug benefit under Medicare as well as a federal subsidy to sponsors of retiree health care benefit plans. The company’s U.S. Postretirement Health Care Benefits plan offers prescription drug benefits. In accordance with FASB Staff Position No. FAS 106-1 Accounting and Disclosure Requirements Related to the Medicare Prescription Drug Benefits, Improvement and Modernization Act of 2003, the company has elected to defer recognition of the effects of the Act and any measures of benefit cost or benefit obligation in the financial statements or accompanying notes. Specific authoritative guidance on the accounting for the federal subsidy is pending and that guidance, when issued, could require the company to change previously reported information. The company does not anticipate that its plan will need to be amended in order to benefit from the new legislation and expects a favorable impact on future benefit expenses and the future financial status of the plan.
Savings Plan and ESOP
The company provides a 401(k) savings plan for substantially all U.S. employees. Prior to March 2002, employee contributions of up to 6 percent of eligible compensation were matched 50 percent by the company. In March 2002, the company changed its 401(k) savings plan and added an employee stock ownership plan (ESOP) feature to the existing plan. Employee before-tax contributions of up to 3 percent of eligible compensation are matched 100 percent by the company and employee before-tax contributions between 3 percent and 5 percent of eligible compensation are matched 50 percent by the company. The match is 100 percent vested immediately. Effective January 2003, the plan was amended to provide that all employee contributions which are invested in Ecolab stock will be part of the employee’s ESOP account while so invested. The company’s contributions are invested in Ecolab common stock and amounted to $14,854,000 in 2003, $12,905,000 in 2002 and $9,491,000 in 2001.
47
NOTE 16 OPERATING SEGMENTS
The company’s operating segments have generally similar products and services and the company is organized to manage its operations geographically. The company’s operating segments have been aggregated into three reportable segments.
The “United States Cleaning & Sanitizing” segment provides cleaning and sanitizing products and services to United States markets through its Institutional, Kay, Textile Care, Professional Products, Vehicle Care, Water Care Services and Food & Beverage operations.
The “United States Other Services” segment includes all other U.S. operations of the company. This segment provides pest elimination and kitchen equipment repair and maintenance through its Pest Elimination and GCS Service operations.
The company’s “International Cleaning & Sanitizing” segment provides cleaning and sanitizing product and service offerings to international markets in Europe, Asia Pacific, Latin America and Canada. Effective November 30, 2001, Henkel-Ecolab’s total assets were included in the company’s International Cleaning & Sanitizing operations. European operating data has been included beginning in 2002.
Information on the types of products and services of each of the company’s operating segments is included on the inside front cover under “Services/Products Provided” of the Ecolab Overview section of this Annual Report.
The company evaluates the performance of its international operations based on fixed management currency exchange rates. All other accounting policies of the reportable segments are consistent with accounting principles generally accepted in the United States of America and the accounting policies of the company described in Note 2 of these notes to consolidated financial statements. The profitability of the company’s operating segments is evaluated by management based on operating income. Intersegment sales and transfers were not significant.
Financial information for each of the company’s reportable segments is as follows:
|
| United States |
|
|
| Other |
| |||||||||||||||
(thousands) |
| Cleaning & |
| Other |
| Total |
| International |
| Foreign |
| Corporate Consolidated |
| |||||||||
Net sales |
|
|
|
|
|
|
|
|
|
|
|
|
|
|
| |||||||
2003 |
| $ | 1,694,323 |
| $ | 320,444 |
| $ | 2,014,767 |
| $ | 1,560,557 |
| $ | 186,495 |
|
|
| $ | 3,761,819 |
| |
2002 |
| 1,615,171 |
| 308,329 |
| 1,923,500 |
| 1,497,935 |
| (17,850 | ) |
|
| 3,403,585 |
| |||||||
2001 |
| 1,548,882 |
| 273,020 |
| 1,821,902 |
| 474,089 |
| 24,719 |
|
|
| 2,320,710 |
| |||||||
Operating income (loss) |
|
|
|
|
|
|
|
|
|
|
|
|
|
|
| |||||||
2003 |
| 285,212 |
| 21,031 |
| 306,243 |
| 159,866 |
| 21,383 |
| $ | (4,834 | ) | 482,658 |
| ||||||
2002 |
| 271,838 |
| 33,051 |
| 304,889 |
| 138,373 |
| (1,388 | ) | (46,008 | ) | 395,866 |
| |||||||
2001 |
| 246,936 |
| 29,338 |
| 276,274 |
| 44,575 |
| 2,268 |
| (4,938 | ) | 318,179 |
| |||||||
Depreciation & amortization |
|
|
|
|
|
|
|
|
|
|
|
|
|
|
| |||||||
2003 |
| 114,516 |
| 4,903 |
| 119,419 |
| 85,521 |
| 17,766 |
| 6,950 |
| 229,656 |
| |||||||
2002 |
| 112,303 |
| 4,615 |
| 116,918 |
| 105,765 |
| (6,703 | ) | 7,448 |
| 223,428 |
| |||||||
2001 |
| 118,298 |
| 5,384 |
| 123,682 |
| 28,587 |
| 4,782 |
| 5,939 |
| 162,990 |
| |||||||
Total assets |
|
|
|
|
|
|
|
|
|
|
|
|
|
|
| |||||||
2003 |
| 1,112,994 |
| 143,552 |
| 1,256,546 |
| 1,560,978 |
| 302,756 |
| 108,638 |
| 3,228,918 |
| |||||||
2002 |
| 1,067,226 |
| 129,498 |
| 1,196,724 |
| 1,423,309 |
| 173,497 |
| 72,377 |
| 2,865,907 |
| |||||||
2001 |
| 983,109 |
| 128,338 |
| 1,111,447 |
| 1,378,574 |
| (39,377 | ) | 74,356 |
| 2,525,000 |
| |||||||
Capital expenditures |
|
|
|
|
|
|
|
|
|
|
|
|
|
|
| |||||||
2003 |
| 117,361 |
| 3,726 |
| 121,087 |
| 80,271 |
| 10,536 |
| 141 |
| 212,035 |
| |||||||
2002 |
| 111,349 |
| 3,105 |
| 114,454 |
| 134,591 |
| (36,777 | ) | 489 |
| 212,757 |
| |||||||
2001 |
| $ | 114,427 |
| $ | 6,911 |
| $ | 121,338 |
| $ | 33,628 |
| $ | 2,271 |
| $ | 700 |
| $ | 157,937 |
|
Consistent with the company’s internal management reporting, corporate operating income includes special charges recorded for 2003, 2002 and 2001. In addition, corporate expense includes an adjustment made for death benefits for retired executives in 2003 and corporate overhead costs directly related to the Henkel-Ecolab joint venture in 2001. Corporate assets are principally cash and cash equivalents.
The company has two classes of products and services within its United States and International Cleaning & Sanitizing operations which comprise 10 percent or more of consolidated net sales. Sales of ware-washing products were approximately 23 percent, 23 percent and 26 percent of consolidated net sales in 2003, 2002 and 2001, respectively. Sales of laundry products and services were approximately 10 percent, 11 percent and 10 percent of consolidated net sales in 2003, 2002 and 2001, respectively. Sales of the Henkel-Ecolab operations acquired on November 30, 2001 are reflected in these percentages beginning in 2002.
Property, plant and equipment of the company’s United States and International operations were as follows:
December 31 (thousands) |
| 2003 |
| 2002 |
| 2001 |
| |||
United States |
| $ | 404,209 |
| $ | 418,973 |
| $ | 424,478 |
|
International |
| 288,951 |
| 230,196 |
| 219,807 |
| |||
Corporate |
| 0 |
| 4,653 |
| 4,429 |
| |||
Effect of foreign currency translation |
| 43,637 |
| 26,443 |
| (4,391 | ) | |||
Consolidated |
| $ | 736,797 |
| $ | 680,265 |
| $ | 644,323 |
|
48
NOTE 17 CHANGE IN ACCOUNTING
Effective January 1, 2002, the company adopted the provisions of SFAS No. 142, Goodwill and Other Intangible Assets. This statement discontinued the amortization of goodwill, subject to periodic impairment testing. The adjusted amounts shown below reflect the effect of retroactive application of the discontinuance of the amortization of goodwill as if the new method of accounting had been in effect during 2001. The adjusted information for 2001 presents the historical information prior to the acquisition of the former European joint venture.
|
| As Reported |
| Adjusted |
| |||||
(thousands, except per share) |
| 2003 |
| 2002 |
| 2001 |
| |||
|
|
|
|
|
|
|
| |||
Reported net income |
| $ | 277,348 |
| $ | 209,770 |
| $ | 188,170 |
|
Goodwill amortization (net of tax) |
|
|
|
|
| 18,471 |
| |||
Adjusted net income |
| $ | 277,348 |
| $ | 209,770 |
| $ | 206,641 |
|
|
|
|
|
|
|
|
| |||
Basic earnings per share Net income, as reported |
| $ | 1.07 |
| $ | 0.81 |
| $ | 0.74 |
|
Goodwill amortization (net of tax) |
| — |
| — |
| 0.07 |
| |||
Adjusted basic earnings per share |
| $ | 1.07 |
| $ | 0.81 |
| $ | 0.81 |
|
|
|
|
|
|
|
|
| |||
Diluted earnings per share Net income, as reported |
| $ | 1.06 |
| $ | 0.80 |
| $ | 0.72 |
|
Goodwill amortization (net of tax) |
| — |
| — |
| 0.07 |
| |||
Adjusted diluted earnings per share |
| $ | 1.06 |
| $ | 0.80 |
| $ | 0.80 |
|
Per share amounts do not necessarily sum due to rounding.
The company was required to test all existing goodwill for impairment as of January 1,2002 on a reporting unit basis. Generally, the company’s reporting units are its operating segments. Under SFAS No. 142, the fair value approach is used to test goodwill for impairment. This method differed from the company’s prior policy of using an undiscounted cash flows method for testing goodwill impairment. An impairment charge is recognized for the amount, if any, by which the carrying amount of goodwill exceeds its implied fair value. Fair values of reporting units were established using a discounted cash flow method. Where available and as appropriate, comparative market multiples were used to corroborate the results of the discounted cash flow method.
The result of testing goodwill for impairment in accordance with the adoption of SFAS No. 142, was a non-cash charge of $4.0 million after tax, or $0.02 per share, which is reported on the accompanying consolidated statement of income as a cumulative effect of a change in accounting in 2002. The impairment charge relates to the Africa/Export operations, which is part of the International Cleaning & Sanitizing reportable segment. The primary factor resulting in the impairment charge was the difficult economic environment in the region.
Under SFAS No. 142, goodwill must be tested annually for impairment. Based on the company’s testing in 2003 and 2002, there has been no additional impairment of goodwill. The company performs its annual goodwill impairment test during the second quarter. If circumstances change significantly within a reporting unit, the company would test it for impairment prior to the annual test for impairment.
49
NOTE 18 QUARTERLY FINANCIAL DATA (UNAUDITED)
(thousands, except per share) |
| First |
| Second |
| Third |
| Fourth |
| Year |
| |||||
|
|
|
|
|
|
|
|
|
|
|
| |||||
2003 |
|
|
|
|
|
|
|
|
|
|
| |||||
Net sales |
|
|
|
|
|
|
|
|
|
|
| |||||
United States Cleaning & Sanitizing |
| $ | 417,299 |
| $ | 430,901 |
| $ | 444,791 |
| $ | 401,332 |
| $ | 1,694,323 |
|
United States Other Services |
| 73,329 |
| 82,963 |
| 83,497 |
| 80,655 |
| 320,444 |
| |||||
International Cleaning & Sanitizing |
| 360,558 |
| 389,596 |
| 399,967 |
| 410,436 |
| 1,560,557 |
| |||||
Effect of foreign currency translation |
| 24,666 |
| 43,275 |
| 54,511 |
| 64,043 |
| 186,495 |
| |||||
Total |
| 875,852 |
| 946,735 |
| 982,766 |
| 956,466 |
| 3,761,819 |
| |||||
Cost of sales (including special charges (income) of $(45) and $(31) in first and fourth quarters) |
| 430,482 |
| 466,734 |
| 478,163 |
| 469,823 |
| 1,845,202 |
| |||||
Selling, general and administrative expenses |
| 344,033 |
| 358,783 |
| 357,923 |
| 372,812 |
| 1,433,551 |
| |||||
Special charges (income) |
| (197 | ) | (147 | ) | 1,224 |
| (472 | ) | 408 |
| |||||
Operating income |
|
|
|
|
|
|
|
|
|
|
| |||||
United States Cleaning & Sanitizing |
| 69,906 |
| 71,943 |
| 82,472 |
| 60,891 |
| 285,212 |
| |||||
United States Other Services |
| 3,647 |
| 6,785 |
| 8,755 |
| 1,844 |
| 21,031 |
| |||||
International Cleaning & Sanitizing |
| 25,717 |
| 38,147 |
| 48,694 |
| 47,308 |
| 159,866 |
| |||||
Corporate |
| 242 |
| 106 |
| (1,184 | ) | (3,998 | ) | (4,834 | ) | |||||
Effect of foreign currency translation |
| 2,022 |
| 4,384 |
| 6,719 |
| 8,258 |
| 21,383 |
| |||||
Total |
| 101,534 |
| 121,365 |
| 145,456 |
| 114,303 |
| 482,658 |
| |||||
Gain on sale of equity investment |
| — |
| — |
| 10,877 |
| 228 |
| 11,105 |
| |||||
Interest expense, net |
| 10,703 |
| 11,752 |
| 12,051 |
| 10,839 |
| 45,345 |
| |||||
Income before income taxes |
| 90,831 |
| 109,613 |
| 144,282 |
| 103,692 |
| 448,418 |
| |||||
Provision for income taxes |
| 35,513 |
| 42,458 |
| 56,843 |
| 36,256 |
| 171,070 |
| |||||
Net income |
| $ | 55,318 |
| $ | 67,155 |
| $ | 87,439 |
| $ | 67,436 |
| $ | 277,348 |
|
Basic net income per common share |
| $ | 0.21 |
| $ | 0.26 |
| $ | 0.34 |
| $ | 0.26 |
| $ | 1.07 |
|
Diluted net income per common share |
| $ | 0.21 |
| $ | 0.25 |
| $ | 0.33 |
| $ | 0.26 |
| $ | 1.06 |
|
Weighted-average common shares outstanding |
|
|
|
|
|
|
|
|
|
|
| |||||
Basic |
| 260,448 |
| 261,246 |
| 258,694 |
| 257,428 |
| 259,454 |
| |||||
Diluted |
| 263,637 |
| 264,553 |
| 261,609 |
| 260,628 |
| 262,737 |
| |||||
|
|
|
|
|
|
|
|
|
|
|
| |||||
2002 |
|
|
|
|
|
|
|
|
|
|
| |||||
Net sales |
|
|
|
|
|
|
|
|
|
|
| |||||
United States Cleaning & Sanitizing |
| $ | 392,349 |
| $ | 402,113 |
| $ | 426,339 |
| $ | 394,370 |
| $ | 1,615,171 |
|
United States Other Services |
| 70,490 |
| 78,824 |
| 81,629 |
| 77,386 |
| 308,329 |
| |||||
International Cleaning & Sanitizing |
| 340,933 |
| 373,151 |
| 380,328 |
| 403,523 |
| 1,497,935 |
| |||||
Effect of foreign currency translation |
| (17,663 | ) | (14,858 | ) | 6,570 |
| 8,101 |
| (17,850 | ) | |||||
Total |
| 786,109 |
| 839,230 |
| 894,866 |
| 883,380 |
| 3,403,585 |
| |||||
Cost of sales (including special charges of $5,184, $1,908, $301 and $1,584 in first, second, third and fourth quarters) |
| 395,945 |
| 413,425 |
| 434,195 |
| 444,032 |
| 1,687,597 |
| |||||
Selling, general and administrative expenses |
| 304,945 |
| 315,363 |
| 327,666 |
| 335,117 |
| 1,283,091 |
| |||||
Special charges |
| 12,296 |
| 11,818 |
| 2,109 |
| 10,808 |
| 37,031 |
| |||||
Operating income |
|
|
|
|
|
|
|
|
|
|
| |||||
United States Cleaning & Sanitizing |
| 64,940 |
| 68,979 |
| 80,361 |
| 57,558 |
| 271,838 |
| |||||
United States Other Services |
| 5,262 |
| 9,224 |
| 10,761 |
| 7,804 |
| 33,051 |
| |||||
International Cleaning & Sanitizing |
| 21,402 |
| 35,360 |
| 41,711 |
| 39,900 |
| 138,373 |
| |||||
Corporate |
| (17,480 | ) | (13,726 | ) | (2,411 | ) | (12,391 | ) | (46,008 | ) | |||||
Effect of foreign currency translation |
| (1,201 | ) | (1,213 | ) | 474 |
| 552 |
| (1,388 | ) | |||||
Total |
| 72,923 |
| 98,624 |
| 130,896 |
| 93,423 |
| 395,866 |
| |||||
Interest expense, net |
| 10,512 |
| 11,955 |
| 10,988 |
| 10,440 |
| 43,895 |
| |||||
Income from continuing operations before income taxes |
| 62,411 |
| 86,669 |
| 119,908 |
| 82,983 |
| 351,971 |
| |||||
Provision for income taxes |
| 25,370 |
| 35,008 |
| 47,826 |
| 31,877 |
| 140,081 |
| |||||
Income from continuing operations before change in accounting |
| 37,041 |
| 51,661 |
| 72,082 |
| 51,106 |
| 211,890 |
| |||||
Change in accounting for goodwill |
| (4,002 | ) |
|
|
|
|
|
| (4,002 | ) | |||||
Gain from discontinued operations |
| 1,882 |
|
|
|
|
|
|
| 1,882 |
| |||||
Net income |
| $ | 34,921 |
| $ | 51,661 |
| $ | 72,082 |
| $ | 51,106 |
| $ | 209,770 |
|
Basic income per common share |
|
|
|
|
|
|
|
|
|
|
| |||||
Income from continuing operations |
| $ | 0.14 |
| $ | 0.20 |
| $ | 0.28 |
| $ | 0.20 |
| $ | 0.82 |
|
Change in accounting for goodwill |
| (0.02 | ) |
|
|
|
|
|
| (0.02 | ) | |||||
Gain from discontinued operations |
| 0.01 |
|
|
|
|
|
|
| 0.01 |
| |||||
Net income |
| 0.14 |
| 0.20 |
| 0.28 |
| 0.20 |
| 0.81 |
| |||||
Diluted income per common share |
|
|
|
|
|
|
|
|
|
|
| |||||
Income from continuing operations |
| 0.14 |
| 0.20 |
| 0.28 |
| 0.19 |
| 0.81 |
| |||||
Change in accounting for goodwill |
| (0.02 | ) |
|
|
|
|
|
| (0.02 | ) | |||||
Gain from discontinued operations |
| 0.01 |
|
|
|
|
|
|
| 0.01 |
| |||||
Net income |
| $ | 0.13 |
| $ | 0.20 |
| $ | 0.28 |
| $ | 0.19 |
| $ | 0.80 |
|
Weighted-average common shares outstanding |
|
|
|
|
|
|
|
|
|
|
| |||||
Basic |
| 256,812 |
| 257,810 |
| 258,575 |
| 259,391 |
| 258,147 |
| |||||
Diluted |
| 260,361 |
| 261,225 |
| 261,223 |
| 262,416 |
| 261,574 |
| |||||
Special charges are included in corporate operating income. Per share amounts do not necessarily sum due to changes in share outstanding and rounding.
50
management and auditors’ reports
REPORT OF MANAGEMENT
Management is responsible for the integrity and objectivity of the consolidated financial statements. The statements have been prepared in accordance with accounting principles generally accepted in the United States of America and, accordingly, include certain amounts based on management’s best estimates and judgments.
To meet its responsibility, management has established and maintains a system of internal controls that provides reasonable assurance regarding the integrity and reliability of the financial statements and the protection of assets from unauthorized use or disposition. These systems are supported by qualified personnel, by an appropriate division of responsibilities and by an internal audit function. There are limits inherent in any system of internal controls since the cost of monitoring such systems should not exceed the desired benefit. Management believes that the company’s system of internal controls is effective and provides an appropriate cost/benefit balance.
The Board of Directors, acting through its Audit Committee composed solely of independent directors, is responsible for determining that management fulfills its responsibilities in the preparation of financial statements and maintains financial control of operations. The Audit Committee recommends to the Board of Directors the appointment of the company’s independent accountants, subject to ratification by the shareholders. It meets regularly with management, the internal auditors and the independent auditors.
The independent auditors provide an objective, independent review as to management’s discharge of its responsibilities insofar as they relate to the fair presentation of the consolidated financial statements. Their report is presented separately.
![]()
Allan L. Schuman
Chairman of the Board and
Chief Executive Officer
![]()
Steven L. Fritze
Executive Vice President and
Chief Financial Officer
REPORT OF INDEPENDENT AUDITORS
To the Shareholders and Directors Ecolab Inc.
In our opinion, the accompanying consolidated balance sheet and the related consolidated statements of income, of comprehensive income and shareholders’ equity and of cash flows present fairly, in all material respects, the consolidated financial position of Ecolab Inc. as of December 31, 2003, 2002 and 2001, and the consolidated results of its operations and its cash flows for each of the three years in the period ended December 31, 2003, in conformity with accounting principles generally accepted in the United States of America. These financial statements are the responsibility of Ecolab Inc.’s management; our responsibility is to express an opinion on these financial statements based on our audits. We conducted our audits of these statements in accordance with auditing standards generally accepted in the United States of America which require that we plan and perform the audit to obtain reasonable assurance about whether the financial statements are free of material misstatement. An audit includes examining, on a test basis, evidence supporting the amounts and disclosures in the financial statements, assessing the accounting principles used and significant estimates made by management, and evaluating the overall financial statement presentation. We believe that our audits provide a reasonable basis for our opinion.
As discussed in Note 17 to the consolidated financial statements, Ecolab Inc. changed the manner in which it accounts for goodwill and other intangible assets as of January 1, 2002.
![]()
PricewaterhouseCoopers LLP
Minneapolis, Minnesota
February 26, 2004
51
summary operating and financial data
December 31 (thousands, except per share) |
| 2003 |
| 2002 |
| 2001 |
| 2000 |
| 1999 |
| 1998 |
| 1997 |
| 1996 |
| 1995 |
| 1994 |
| 1993 |
| |||||||||||||
|
|
|
|
|
|
|
|
|
|
|
|
|
|
|
|
|
|
|
|
|
|
|
| |||||||||||||
OPERATIONS |
|
|
|
|
|
|
|
|
|
|
|
|
|
|
|
|
|
|
|
|
|
|
| |||||||||||||
Net sales |
|
|
|
|
|
|
|
|
|
|
|
|
|
|
|
|
|
|
|
|
|
|
| |||||||||||||
United States |
| $ | 2,014,767 |
| $ | 1,923,500 |
| $ | 1,821,902 |
| $ | 1,746,698 |
| $ | 1,605,385 |
| $ | 1,429,711 |
| $ | 1,251,517 |
| $ | 1,127,281 |
| $ | 1,008,910 |
| $ | 923,667 |
| $ | 850,648 |
| ||
International (at average rates of currency exchange during the year) |
| 1,747,052 |
| 1,480,085 |
| 498,808 |
| 483,963 |
| 444,413 |
| 431,366 |
| 364,524 |
| 341,231 |
| 310,755 |
| 265,544 |
| 234,981 |
| |||||||||||||
Total |
| 3,761,819 |
| 3,403,585 |
| 2,320,710 |
| 2,230,661 |
| 2,049,798 |
| 1,861,077 |
| 1,616,041 |
| 1,468,512 |
| 1,319,665 |
| 1,189,211 |
| 1,085,629 |
| |||||||||||||
Cost of sales (including special charges (income) of $(76) in 2003, $8,977 in 2002, $(566) in 2001 and $1,948 in 2000) |
| 1,845,202 |
| 1,687,597 |
| 1,120,254 |
| 1,056,263 |
| 963,476 |
| 874,793 |
| 745,256 |
| 694,791 |
| 622,342 |
| 550,308 |
| 505,836 |
| |||||||||||||
Selling, general and administrative expenses |
| 1,433,551 |
| 1,283,091 |
| 881,453 |
| 851,995 |
| 796,371 |
| 724,304 |
| 652,281 |
| 588,404 |
| 534,637 |
| 493,939 |
| 450,342 |
| |||||||||||||
Special charges, sale of business and merger expenses |
| 408 |
| 37,031 |
| 824 |
| (20,736 | ) |
|
|
|
|
|
|
|
|
|
| 8,000 |
|
|
| |||||||||||||
Operating income |
| 482,658 |
| 395,866 |
| 318,179 |
| 343,139 |
| 289,951 |
| 261,980 |
| 218,504 |
| 185,317 |
| 162,686 |
| 136,964 |
| 129,451 |
| |||||||||||||
Gain on sale of equity investment |
| 11,105 |
|
|
|
|
|
|
|
|
|
|
|
|
|
|
|
|
|
|
|
|
| |||||||||||||
Interest expense, net |
| 45,345 |
| 43,895 |
| 28,434 |
| 24,605 |
| 22,713 |
| 21,742 |
| 12,637 |
| 14,372 |
| 11,505 |
| 12,909 |
| 21,384 |
| |||||||||||||
Income from continuing operations before income taxes, equity earnings and changes in accounting principle |
| 448,418 |
| 351,971 |
| 289,745 |
| 318,534 |
| 267,238 |
| 240,238 |
| 205,867 |
| 170,945 |
| 151,181 |
| 124,055 |
| 108,067 |
| |||||||||||||
Provision for income taxes |
| 171,070 |
| 140,081 |
| 117,408 |
| 129,495 |
| 109,769 |
| 101,782 |
| 85,345 |
| 70,771 |
| 59,694 |
| 50,444 |
| 33,422 |
| |||||||||||||
Equity in earnings of Henkel-Ecolab |
|
|
|
|
| 15,833 |
| 19,516 |
| 18,317 |
| 16,050 |
| 13,433 |
| 13,011 |
| 7,702 |
| 10,951 |
| 8,127 |
| |||||||||||||
Income from continuing operations |
| 277,348 |
| 211,890 |
| 188,170 |
| 208,555 |
| 175,786 |
| 154,506 |
| 133,955 |
| 113,185 |
| 99,189 |
| 84,562 |
| 82,772 |
| |||||||||||||
Gain from discontinued operations |
|
|
| 1,882 |
|
|
|
|
|
|
| 38,000 |
|
|
|
|
|
|
|
|
|
|
| |||||||||||||
Changes in accounting principles |
|
|
| (4,002 | ) |
|
| (2,428 | ) |
|
|
|
|
|
|
|
|
|
|
|
| 715 |
| |||||||||||||
Net income, as reported |
| 277,348 |
| 209,770 |
| 188,170 |
| 206,127 |
| 175,786 |
| 192,506 |
| 133,955 |
| 113,185 |
| 99,189 |
| 84,562 |
| 83,487 |
| |||||||||||||
Adjustments |
|
|
|
|
| 18,471 |
| 17,762 |
| 16,631 |
| 14,934 |
| 11,195 |
| 10,683 |
| 8,096 |
| 12,757 |
| 3,658 |
| |||||||||||||
Adjusted net income |
| $ | 277,348 |
| $ | 209,770 |
| $ | 206,641 |
| $ | 223,889 |
| $ | 192,417 |
| $ | 207,440 |
| $ | 145,150 |
| $ | 123,868 |
| $ | 107,285 |
| $ | 97,319 |
| $ | 87,145 |
| ||
Income per common share, as reported |
|
|
|
|
|
|
|
|
|
|
|
|
|
|
|
|
|
|
|
|
|
|
| |||||||||||||
Basic - continuing operations |
| $ | 1.07 |
| $ | 0.82 |
| $ | 0.74 |
| $ | 0.82 |
| $ | 0.68 |
| $ | 0.60 |
| $ | 0.52 |
| $ | 0.44 |
| $ | 0.38 |
| $ | 0.31 |
| $ | 0.31 |
| ||
Basic - net income |
| 1.07 |
| 0.81 |
| 0.74 |
| 0.81 |
| 0.68 |
| 0.75 |
| 0.52 |
| 0.44 |
| 0.38 |
| 0.31 |
| 0.31 |
| |||||||||||||
Diluted - continuing operations |
| 1.06 |
| 0.81 |
| 0.72 |
| 0.79 |
| 0.65 |
| 0.58 |
| 0.50 |
| 0.43 |
| 0.37 |
| 0.31 |
| 0.30 |
| |||||||||||||
Diluted - net income |
| 1.06 |
| 0.80 |
| 0.72 |
| 0.78 |
| 0.65 |
| 0.72 |
| 0.50 |
| 0.43 |
| 0.37 |
| 0.31 |
| 0.30 |
| |||||||||||||
Adjusted income per common share |
|
|
|
|
|
|
|
|
|
|
|
|
|
|
|
|
|
|
|
|
|
|
| |||||||||||||
Basic - continuing operations |
| 1.07 |
| 0.82 |
| 0.81 |
| 0.89 |
| 0.74 |
| 0.66 |
| 0.56 |
| 0.48 |
| 0.41 |
| 0.36 |
| 0.32 |
| |||||||||||||
Basic - net income |
| 1.07 |
| 0.81 |
| 0.81 |
| 0.88 |
| 0.74 |
| 0.80 |
| 0.56 |
| 0.48 |
| 0.41 |
| 0.36 |
| 0.32 |
| |||||||||||||
Diluted - continuing operations |
| 1.06 |
| 0.81 |
| 0.80 |
| 0.86 |
| 0.72 |
| 0.63 |
| 0.54 |
| 0.47 |
| 0.40 |
| 0.35 |
| 0.31 |
| |||||||||||||
Diluted - net income |
| $ | 1.06 |
| $ | 0.80 |
| $ | 0.80 |
| $ | 0.85 |
| $ | 0.72 |
| $ | 0.77 |
| $ | 0.54 |
| $ | 0.47 |
| $ | 0.40 |
| $ | 0.35 |
| $ | 0.32 |
| ||
Weighted-average common shares outstanding – basic |
| 259,454 |
| 258,147 |
| 254,832 |
| 255,505 |
| 259,099 |
| 258,314 |
| 258,891 |
| 257,983 |
| 264,387 |
| 270,200 |
| 270,112 |
| |||||||||||||
Weighted-average common shares outstanding – diluted |
| 262,737 |
| 261,574 |
| 259,855 |
| 263,892 |
| 268,837 |
| 268,095 |
| 267,643 |
| 265,634 |
| 269,912 |
| 274,612 |
| 274,842 |
| |||||||||||||
|
|
|
|
|
|
|
|
|
|
|
|
|
|
|
|
|
|
|
|
|
|
|
| |||||||||||||
SELECTED INCOME STATEMENT RATIOS |
|
|
|
|
|
|
|
|
|
|
|
|
|
|
|
|
|
|
|
|
|
|
| |||||||||||||
Gross profit |
| 50.9 | % | 50.4 | % | 51.7 | % | 52.6 | % | 53.0 | % | 53.0 | % | 53.9 | % | 52.7 | % | 52.8 | % | 53.7 | % | 53.4 | % | |||||||||||||
Selling, general and administrative expenses |
| 38.1 |
| 37.7 |
| 38.0 |
| 38.2 |
| 38.9 |
| 38.9 |
| 40.4 |
| 40.1 |
| 40.5 |
| 41.5 |
| 41.5 |
| |||||||||||||
Operating income |
| 12.8 |
| 11.6 |
| 13.7 |
| 15.4 |
| 14.1 |
| 14.1 |
| 13.5 |
| 12.6 |
| 12.3 |
| 11.5 |
| 11.9 |
| |||||||||||||
Income from continuing operations before income taxes |
| 11.9 |
| 10.3 |
| 12.5 |
| 14.3 |
| 13.0 |
| 12.9 |
| 12.7 |
| 11.6 |
| 11.5 |
| 10.4 |
| 10.0 |
| |||||||||||||
Income from continuing operations |
| 7.4 |
| 6.2 |
| 8.1 |
| 9.3 |
| 8.6 |
| 8.3 |
| 8.3 |
| 7.7 |
| 7.5 |
| 7.1 |
| 7.6 |
| |||||||||||||
Effective income tax rate |
| 38.1 | % | 39.8 | % | 40.5 | % | 40.7 | % | 41.1 | % | 42.4 | % | 41.5 | % | 41.4 | % | 39.5 | % | 40.7 | % | 30.9 | % | |||||||||||||
|
|
|
|
|
|
|
|
|
|
|
|
|
|
|
|
|
|
|
|
|
|
|
| |||||||||||||
FINANCIAL POSITION |
|
|
|
|
|
|
|
|
|
|
|
|
|
|
|
|
|
|
|
|
|
|
| |||||||||||||
Current assets |
| $ | 1,150,340 |
| $ | 1,015,937 |
| $ | 929,583 |
| $ | 600,568 |
| $ | 577,321 |
| $ | 503,514 |
| $ | 509,501 |
| $ | 435,507 |
| $ | 358,072 |
| $ | 401,179 |
| $ | 311,051 |
| ||
Property, plant and equipment, net |
| 736,797 |
| 680,265 |
| 644,323 |
| 501,640 |
| 448,116 |
| 420,205 |
| 395,562 |
| 332,314 |
| 292,937 |
| 246,191 |
| 219,268 |
| |||||||||||||
Investment in Henkel-Ecolab |
|
|
|
|
|
|
| 199,642 |
| 219,003 |
| 253,646 |
| 239,879 |
| 285,237 |
| 302,298 |
| 284,570 |
| 255,804 |
| |||||||||||||
Goodwill, intangible and other assets |
| 1,341,781 |
| 1,169,705 |
| 951,094 |
| 412,161 |
| 341,506 |
| 293,630 |
| 271,357 |
| 155,351 |
| 107,573 |
| 88,416 |
| 105,607 |
| |||||||||||||
Total assets |
| $ | 3,228,918 |
| $ | 2,865,907 |
| $ | 2,525,000 |
| $ | 1,714,011 |
| $ | 1,585,946 |
| $ | 1,470,995 |
| $ | 1,416,299 |
| $ | 1,208,409 |
| $ | 1,060,880 |
| $ | 1,020,356 |
| $ | 891,730 |
| ||
Current liabilities |
| $ | 851,942 |
| $ | 853,828 |
| $ | 827,952 |
| $ | 532,034 |
| $ | 470,674 |
| $ | 399,791 |
| $ | 404,464 |
| $ | 327,771 |
| $ | 310,538 |
| $ | 253,665 |
| $ | 201,498 |
| ||
Long-term debt |
| 604,441 |
| 539,743 |
| 512,280 |
| 234,377 |
| 169,014 |
| 227,041 |
| 259,384 |
| 148,683 |
| 89,402 |
| 105,393 |
| 131,861 |
| |||||||||||||
Postretirement health care and pension benefits |
| 249,906 |
| 207,596 |
| 183,281 |
| 117,790 |
| 97,527 |
| 85,793 |
| 76,109 |
| 73,577 |
| 70,666 |
| 70,882 |
| 72,647 |
| |||||||||||||
Other liabilities |
| 227,203 |
| 164,989 |
| 121,135 |
| 72,803 |
| 86,715 |
| 67,829 |
| 124,641 |
| 138,415 |
| 133,616 |
| 128,608 |
| 93,917 |
| |||||||||||||
Shareholders’ equity |
| 1,295,426 |
| 1,099,751 |
| 880,352 |
| 757,007 |
| 762,016 |
| 690,541 |
| 551,701 |
| 519,963 |
| 456,658 |
| 461,808 |
| 391,807 |
| |||||||||||||
Total liabilities and shareholders’ equity |
| $ | 3,228,918 |
| $ | 2,865,907 |
| $ | 2,525,000 |
| $ | 1,714,011 |
| $ | 1,585,946 |
| $ | 1,470,995 |
| $ | 1,416,299 |
| $ | 1,208,409 |
| $ | 1,060,880 |
| $ | 1,020,356 |
| $ | 891,730 |
| ||
SELECTED CASH FLOW INFORMATION |
|
|
|
|
|
|
|
|
|
|
|
|
|
|
|
|
|
|
|
|
|
|
| |||||||||||||
Cash provided by operating activities |
| $ | 529,199 |
| $ | 423,326 |
| $ | 364,481 |
| $ | 315,486 |
| $ | 293,494 |
| $ | 235,642 |
| $ | 235,098 |
| $ | 254,269 |
| $ | 166,463 |
| $ | 169,346 |
| $ | 175,674 |
| ||
Depreciation and amortization |
| 229,656 |
| 223,428 |
| 162,990 |
| 148,436 |
| 134,530 |
| 121,971 |
| 100,879 |
| 89,523 |
| 76,279 |
| 66,869 |
| 60,609 |
| |||||||||||||
Capital expenditures |
| 212,035 |
| 212,757 |
| 157,937 |
| 150,009 |
| 145,622 |
| 147,631 |
| 121,667 |
| 111,518 |
| 109,894 |
| 88,457 |
| 68,321 |
| |||||||||||||
Cash dividends declared per common share |
| $ | 0.2975 |
| $ | 0.2750 |
| $ | 0.2625 |
| $ | 0.2450 |
| $ | 0.2175 |
| $ | 0.1950 |
| $ | 0.16750 |
| $ | 0.1450 |
| $ | 0.1288 |
| $ | 0.1138 |
| $ | 0.0988 |
| ||
|
|
|
|
|
|
|
|
|
|
|
|
|
|
|
|
|
|
|
|
|
|
|
| |||||||||||||
SELECTED FINANCIAL MEASURES/OTHER |
|
|
|
|
|
|
|
|
|
|
|
|
|
|
|
|
|
|
|
|
|
|
| |||||||||||||
Total debt |
| $ | 674,644 |
| $ | 699,842 |
| $ | 745,673 |
| $ | 370,969 |
| $ | 281,074 |
| $ | 295,032 |
| $ | 308,268 |
| $ | 176,292 |
| $ | 161,049 |
| $ | 147,213 |
| $ | 151,281 |
| ||
Total debt to capitalization |
| 34.2 | % | 38.9 | % | 45.9 | % | 32.9 | % | 26.9 | % | 29.9 | % | 35.8 | % | 25.3 | % | 26.1 | % | 24.2 | % | 27.9 | % | |||||||||||||
Book value per common share |
| $ | 5.03 |
| $ | 4.23 |
| $ | 3.44 |
| $ | 2.98 |
| $ | 2.94 |
| $ | 2.67 |
| $ | 2.14 |
| $ | 2.01 |
| $ | 1.76 |
| $ | 1.71 |
| $ | 1.45 |
| ||
Return on beginning equity |
| 25.2 | % | 23.8 | % | 24.9 | % | 27.1 | % | 25.5 | % | 34.9 | % | 25.8 | % | 24.8 | % | 21.5 | % | 21.6 | % | 23.3% |
| |||||||||||||
Dividends per share/diluted net income per common share |
| 28.1 | % | 34.4 | % | 36.2 | % | 31.4 | % | 33.2 | % | 27.1 | % | 33.5 | % | 34.1 | % | 35.3 | % | 36.7 | % | 32.4% |
| |||||||||||||
Annual common stock price range |
| $ | 27.92-23.08 |
| $ | 25.20-18.27 |
| $ | 22.10-14.25 |
| $ | 22.85-14.00 |
| $ | 22.22-15.85 |
| $ | 19.00-13.07 |
| $ | 14.00-9.07 |
| $ | 9.88-7.28 |
| $ | 7.94-5.00 |
| $ | 5.88-4.82 |
| $ | 5.96-4.54 |
| ||
Number of employees |
| 20,826 |
| 20,417 |
| 19,326 |
| 14,250 |
| 12,870 |
| 12,007 |
| 10,210 |
| 9,573 |
| 9,026 |
| 8,206 |
| 7,822 |
| |||||||||||||
The former Henkel-Ecolab is included as a consolidated subsidiary effective November 30, 2001. Adjusted results for 1993 through 2001 reflect the effect of retroactive application of the discontinuance of the amortization of goodwill as if SFAS No. 142 had been in effect since January 1, 1993. For 1993 through 1994 the adjustments also reflect adjustments to eliminate unusual items associated with Ecolab’s acquisition of Kay Chemical Company in December 1994. All per share, shares outstanding and market price data reflect the two-for-one stock splits declared in 2003,1997 and 1993. Return on beginning equity is net income divided by beginning shareholders’ equity.
52 - 53