Exhibit 13
Financial Discussion
OVERVIEW FOR 2005
This Financial Discussion should be read in conjunction with the information on Forward-Looking Statements and Risk Factors found at the end of the Financial Discussion.
We delivered a strong financial performance in 2005, despite being faced with significant increases in our raw material costs as well as continued challenges from the European economic environment. We achieved another year of double-digit income growth, record net sales of $4.5 billion and record cash flow from operating activities of $590 million.
Effective October 1, 2005, we elected to early-adopt the provisions of Statement of Financial Accounting Standards No. 123 (Revised 2004), Share-Based Payment (“SFAS No. 123R”), the new accounting standard for expensing stock options. As part of the transition to the new standard, all prior period financial statements have been restated to recognize share-based compensation expense historically reported in the notes to our consolidated financial statements.
In the fourth quarter of 2005 we also completed the repatriation of $223 million of foreign earnings into the United States pursuant to the provisions of the American Jobs Creation Act of 2004 (“AJCA”). The AJCA provided us with the opportunity to tax efficiently repatriate foreign earnings for qualifying investments specified in our reinvestment plan. As a result of the repatriation, we recorded a tax charge of $3.1 million in the fourth quarter of 2005.
OPERATING HIGHLIGHTS
• We effectively managed rising raw material costs as well as lackluster European economies.
• We continued our disciplined acquisition strategy with the acquisition of Midland Research Laboratories, a $16 million U.S. provider of water treatment products, and two small international businesses in Ireland and Thailand.
• We expanded our MarketGuard program globally to give food retailers worldwide access to effective food safety, pest elimination and floor care solutions to achieve high standards of cleanliness and sanitation in their operations.
• We introduced our 360º of Protection program for food service and hospitality customers, which provides a customized program to address the full spectrum of cleaning and sanitizing needs.
• We unveiled full cycle solutions for commercial laundries, designed specifically to meet laundry challenges and reduce total operating costs through a combination of chemistry, service, engineering, technology and water care solutions.
• We continued to invest in our sales-and-service force, adding associates to our sales team and making investments in their training and field technology tools.
FINANCIAL PERFORMANCE
• Consolidated net sales reached an all-time high of $4.5 billion for 2005, an increase of 8 percent over net sales of $4.2 billion in 2004. Excluding acquisitions and divestitures, consolidated net sales increased 7 percent.
• Our operating income for 2005 was $542 million and increased 11 percent over 2004. Excluding acquisitions and divestitures, operating income increased 10 percent.
• Diluted net income per share was $1.23 for 2005, up 13 percent over diluted net income per share of $1.09 in 2004. The dilutive per share amounts for both 2005 and 2004 include a charge of $0.10 per share for share-based compensation expense under the provisions of SFAS No. 123R.
• We achieved record cash flow from operating activities of $590 million in 2005, which helped us fund investments in business operations, make business acquisitions and reacquire $213 million of our common stock. It also allowed us to make additional voluntary contributions of $38 million to our United States pension plan and contributions of $27 million to various international pension plans.
• We increased our annual dividend rate for the fourteenth consecutive year. The dividend was increased 14 percent in December 2005 to an annual rate of $0.40 per common share. The increase reflects our earnings progress, strong financial position and our commitment to providing superior shareholder returns.


• Our return on beginning shareholders’ equity was 20 percent in 2005, including the expense associated with employee stock options, the fourteenth consecutive year in which we achieved our long-term financial objective of a 20 percent return on beginning shareholders’ equity.
• Currency translation continued to have an impact on our financial results, adding approximately $5 million to net income in 2005 following an $11 million benefit in 2004.
• A reduction in our annual effective income tax rate from 36.4 percent in 2004 to 35.9 percent in 2005 added approximately $3 million to net income. The reduction in the 2005 effective income tax rate was primarily due to the benefits of a lower overall international rate, favorable international mix and tax planning efforts, partially offset by the tax charge related to repatriated foreign earnings under AJCA.
• We continued our long-standing debt rating within the “A” categories of the major rating agencies during 2005.
2006 EXPECTATIONS
• We plan to continue to leverage our Circle the Customer - Circle the Globe strategy through cross-selling and cross-marketing of our many divisional products and service solutions, as well as introducing new, innovative products.
• We anticipate higher raw material and freight costs will continue to impact our operating income and present a challenge in 2006.
• We will continue to make appropriate pricing decisions to reflect the value provided by our products and services and protect operating margins.
• We expect to use our strong cash flow to make strategic business acquisitions which complement our growth strategy.
• We expect currency translation to have a negative impact in 2006.
• We will work to further reduce costs by reviewing and streamlining our business operations.
21
• We plan to make further investments in our sales-and-service force by continuing to add talented people and invest in their training and field technology tools.
CRITICAL ACCOUNTING POLICIES AND ESTIMATES
Our consolidated financial statements are prepared in accordance with accounting principles generally accepted in the United States of America (U.S. GAAP). We have adopted various accounting policies to prepare the consolidated financial statements in accordance with U.S. GAAP. Our most significant accounting policies are disclosed in Note 2 of the notes to the consolidated financial statements.
Preparation of our consolidated financial statements, in conformity with U.S. GAAP, requires us to make estimates and assumptions that affect the amounts reported in the consolidated financial statements and accompanying notes. Estimates are considered to be critical if they meet both of the following criteria: (1) the estimate requires assumptions to be made about matters that are highly uncertain at the time the accounting estimate is made, and (2) different estimates that the company reasonably could have used for the accounting estimate in the current period, or changes in the accounting estimate that are reasonably likely to occur from period to period, must have a material impact on the presentation of the company’s financial condition, changes in financial condition or results of operations.
Besides estimates that meet the “critical” estimate criteria, we make many other accounting estimates in preparing our financial statements and related disclosures. All estimates, whether or not deemed critical, affect reported amounts of assets, liabilities, revenues and expenses as well as disclosures of contingent assets and liabilities. Estimates are based on experience and other information available prior to the issuance of the financial statements. Materially different results can occur as circumstances change and additional information becomes known, even from estimates not deemed critical. Our critical accounting estimates include the following:
SHARE-BASED COMPENSATION
Effective October 1, 2005 we early-adopted SFAS No. 123R under the modified retrospective application method.
SFAS No. 123R requires us to measure compensation expense for share-based awards at fair value at the date of grant and recognize compensation expense over the service period for awards expected to vest. As part of the transition to the new standard, all prior period financial statements have been restated to recognize share-based compensation expense historically reported in the notes to the consolidated financial statements. We did not make any modifications to outstanding stock options in anticipation of adopting the new standard.
In the fourth quarter of 2005 we began using a lattice-based binomial model for valuing new stock option grants. We believe this model considers appropriate probabilities of option exercise and post-vesting termination which are more consistent with actual and projected experience, and therefore support more accurate valuation of a stock option. Upon the adoption of SFAS No. 123R we also began using the non-substantive vesting method for new grants to retirement eligible employees and started using a forfeiture estimate in the amount of compensation expense being recognized. This change from our historical practice of recognizing forfeitures as they occur did not result in the recognition of any cumulative adjustment to income.
Determining the fair value of share-based awards at the grant date requires judgment, including estimating expected volatility, exercise and post-vesting termination behavior, expected dividends and risk-free rates of return. Additionally, the expense that is recorded is dependent on the amount of share-based awards expected to be forfeited. If actual results differ significantly from these estimates, share-based compensation expense and our results of operations could be impacted. For additional information on the impact of the adoption of SFAS No. 123R, see Note 2. For additional information on our stock incentive and option plans, including significant assumptions used in determining fair value, see Note 9.
REVENUE RECOGNITION
We recognize revenue as services are performed or on product sales at the time title to the product and risk of loss transfers to the customer. Our sales policies do not provide for general rights of return and do not contain customer acceptance clauses. We record estimated reductions to revenue for customer programs and incentive offerings including pricing arrangements, promotions and other volume-based incentives at the time the sale is recorded. Depending on market conditions, we may increase customer incentive offerings, which could reduce sales and gross profit margins at the time the incentive is offered.
VALUATION ALLOWANCES AND ACCRUED LIABILITIES
We estimate sales returns and allowances by analyzing historical returns and credits, and apply these trend rates to the most recent 12 months’ sales data to calculate estimated reserves for future credits. We estimate the allowance for doubtful accounts by analyzing accounts receivable balances by age, applying historical write-off trend rates to the most recent 12 months’ sales, less actual write-offs to date. In addition, our estimates also include separately providing for 100 percent of specific customer balances when it is deemed probable that the balance is uncollectible. Actual results could differ from these estimates under different assumptions.
Estimates used to record liabilities related to pending litigation and environmental claims are based on our best estimate of probable future costs. We record the amounts that represent the points in the range of estimates that we believe are most probable or the minimum amounts when no amount within the range is a better estimate than any other amount. Potential insurance reimbursements are not anticipated in our accruals for environmental liabilities. While the final resolution of litigation and environmental contingencies could result in amounts different than current accruals, and therefore have an impact on our consolidated financial results in a future reporting period, we believe the ultimate outcome will not have a significant effect on our consolidated results of operations, financial position or cash flows.
ACTUARIALLY DETERMINED LIABILITIES
The measurement of our pension and postretirement benefit obligations are dependent on a variety of assumptions determined by management and used by our actuaries. These assumptions affect the amount and timing of future contributions and expenses.
The assumptions used in developing the required estimates include, among others, discount rate, projected salary and health care cost increases and expected return or earnings on assets. Beginning in 2005, the discount rate assumption for the U.S. Plans is determined by considering the average of bond yield curves constructed from a large population of high-quality, non-callable, corporate bond issues with maturity dates of six months to thirty years. Bond issues in the population are rated no less than Aa by Moody’s Investor Services or AA by Standard & Poors. A single equivalent discount rate reflects the matching of the plan liability cash flows to the yield curve. Prior to 2005, the discount rate assumption was based on the investment yields available at year-end on corporate long-term bonds rated AA. Projected salary and health care cost increases are based on our long-term actual experience, the near-term outlook and assumed inflation. The expected return on plan assets reflects asset allocations, investment strategies and the views of investment managers over a long-term perspective. The effects of actual results differing from our assumptions, as well as changes in assumptions, are reflected in the unrecognized actuarial loss and amortized over future periods and, therefore, generally affect our recognized expense in future periods.
22
Our unrecognized actuarial loss, on our U.S. pension plan has grown to $230 million over the last five years due primarily to the lowering of the discount rate during that period. Significant differences in actual experience or significant changes in assumptions may materially affect pension and other post-retirement obligations.
In determining our U.S. pension and postretirement obligations for 2005, our discount rates decreased from 5.75 percent at year-end 2004 to 5.57 percent while our projected salary increase was unchanged at 4.3 percent. Our expected return on plan assets used for determining 2005 expense decreased from 9.00 percent to 8.75 percent.
The effect on 2006 expense of a decrease in discount rate or expected return on assets assumption as of December 31, 2005 is shown below assuming no changes in benefit levels and no amortization of gains or losses for our major plans:
| | Effect on U.S. Pension Plan | |
| | | | Decline in | | Higher | |
(dollars in millions) | | Assumption | | Funded | | 2006 | |
Assumption | | Change | | Status | | Expense | |
| | | | | | | |
Discount rate | | -0.25 | pts | $ | 31.4 | | $ | 4.3 | |
Expected return on assets | | -0.25 | pts | N/A | | $ | 1.8 | |
| | | | | | | | | |
| | Effect on U.S. Postretirement
Health Care Benefits Plan | |
| | | | Decline in | | Higher | |
(dollars in millions) | | Assumption | | Funded | | 2006 | |
Assumption | | Change | | Status | | Expense | |
| | | | | | | |
Discount rate | | -0.25 | pts | $ | 5.0 | | $ | 0.8 | |
Expected return on assets | | -0.25 | pts | N/A | | $ | 0.1 | |
| | | | | | | | | |
See Note 14 of the notes to the consolidated financial statements for further discussion concerning our accounting policies, estimates, funded status, planned contributions and overall financial positions of our pension and post-retirement plan obligations.
We are self-insured in North America for most workers compensation, general liability and automotive liability losses, subject to per occurrence and aggregate annual liability limitations. We are insured for losses in excess of these limitations. We have recorded both a liability and an offsetting receivable for amounts in excess of these limitations. We are also self-insured for health care claims for eligible participating employees, subject to certain deductibles and limitations. We determine our liabilities for claims incurred but not reported on an actuarial basis. A change in these assumptions would cause reported results to differ.
INCOME TAXES
Judgment is required to determine the annual effective income tax rate, deferred tax assets and liabilities and any valuation allowances recorded against net deferred tax assets. Our effective income tax rate is based on annual income, statutory tax rates and tax planning opportunities available in the various jurisdictions in which we operate. We establish liabilities or reserves when we believe that certain positions are likely to be challenged by authorities and we may not succeed, despite our belief that our tax return positions are fully supportable. We adjust these reserves in light of changing facts and circumstances. Our annual effective income tax rate includes the impact of reserve provisions and changes to reserves that we consider appropriate. During interim periods, this annual rate is then applied to our year-to-date operating results. In the event that there is a significant one-time item recognized in our interim operating results, the tax attributable to that item would be separately calculated and recorded in the same period as the one-time item.
Tax regulations require items to be included in our tax returns at different times than the items are reflected in our financial statements. As a result, the effective income tax rate reflected in our financial statements differs from that reported in our tax returns. Some of these differences are permanent, such as expenses that are not deductible on our tax return, and some are temporary differences, such as depreciation expense. Temporary differences create deferred tax assets and liabilities. Deferred tax assets generally represent items that can be used as a tax deduction or credit in our tax return in future years for which we have already recorded the tax benefit in our income statement. We establish valuation allowances for our deferred tax assets when the amount of expected future taxable income is not likely to support the utilization of the deduction or credit. Deferred tax liabilities generally represent items for which we have already taken a deduction in our tax return, but have not yet recognized that tax benefit in our financial statements. Undistributed earnings of foreign subsidiaries are considered to have been reinvested indefinitely or available for distribution with foreign tax credits available to offset the amount of applicable income tax and foreign withholding taxes that might be payable on earnings. It is impractical to determine the amount of incremental taxes that might arise if all undistributed earnings were distributed.
A number of years may elapse before a particular tax matter, for which we have established a reserve, is audited and finally resolved. The number of tax years with open tax audits varies depending on the tax jurisdiction. In the United States, during 2004, the Internal Revenue Service completed their field work examination of our tax returns for 1999 through 2001. We expect the final resolution for these returns in 2006. While it is often difficult to predict the final outcome or the timing of resolution of any tax matter, we believe that our reserves reflect the probable outcome of known tax contingencies. Unfavorable settlement of any particular issue would require the use of cash. Favorable resolution could result in reduced income tax expense reported in the financial statements in the future. Our tax reserves are generally presented in the balance sheet within other non-current liabilities.
LONG-LIVED AND INTANGIBLE ASSETS
We periodically review our long-lived and intangible assets for impairment and assess whether significant events or changes in business circumstances indicate that the carrying value of the assets may not be recoverable. This could occur when the carrying amount of an asset exceeds the anticipated future undiscounted cash flows expected to result from the use of the asset and its eventual disposition. The amount of the impairment loss to be recorded, if any, is calculated as the excess of the asset’s carrying value over its estimated fair value. We also periodically reassess the estimated remaining useful lives of our long-lived assets. Changes to estimated useful lives would impact the amount of depreciation and amortization expense recorded in earnings. We have experienced no significant changes in the carrying value or estimated remaining useful lives of our long-lived assets.
We review our goodwill for impairment on an annual basis for all reporting units, including businesses reporting losses such as GCS Service. If circumstances change significantly within a reporting unit, we would test for impairment in addition to the annual test.
Goodwill and certain intangible assets are assessed for impairment using fair value measurement techniques. Specifically, goodwill impairment is determined using a two-step process. Both the first step of determining the fair value of a reporting unit and the second step of determining the fair value of individual assets and liabilities of a reporting unit (including unrecognized intangible assets) are judgmental in nature and often involve the use of significant estimates and assumptions. Estimates of fair value are primarily determined using discounted cash flows, market comparisons and recent transactions. These valuation methodologies use significant estimates and assumptions, which include projected future cash flows (including timing), discount rate reflecting the risk inherent in future cash flows, perpetual growth rate, and determination of appropriate market comparables. No impairments were recorded in 2005, 2004 or 2003 as a result of
23
the tests performed. Of the total goodwill included in our consolidated balance sheet, 20 percent is recorded in our United States Cleaning & Sanitizing reportable segment, 5 percent in our United States Other Services segment and 75 percent in our International segment.
FUNCTIONAL CURRENCIES
In preparing the consolidated financial statements, we are required to translate the financial statements of our foreign subsidiaries from thecurrency in which they keep their accounting records, generally the local currency, into United States dollars. Assets and liabilities of these operations are translated at the exchange rates in effect at each fiscal year end. The translation adjustments related to assets and liabilities that arise from the use of differing exchange rates from period to period are included in accumulated other comprehensive income (loss) in shareholders’ equity. Income statement accounts are translated at the average rates of exchange prevailing during the year. We evaluate our International operations based on fixed rates of exchange; however, the different exchange rates from period to period impact the amount of reported income from our consolidated operations.
OPERATING RESULTS
CONSOLIDATED
(thousands, except per share) | | 2005 | | 2004 | | 2003 | |
| | | | | | | |
Net sales | | $ | 4,534,832 | | $ | 4,184,933 | | $ | 3,761,819 | |
Operating income | | 542,420 | | 489,890 | | 455,009 | |
Net income | | 319,481 | | 282,693 | | 260,590 | |
Diluted net income per common share | | $ | 1.23 | | $ | 1.09 | | $ | 0.99 | |
Our consolidated net sales for 2005 increased 8 percent to $4.5 billion compared to $4.2 billion in 2004. Excluding acquisitions and divestitures, consolidated net sales increased 7 percent. Changes in currency translation positively impacted the consolidated sales growth rate by 1 percentage point. Sales benefited from new account gains, new product and service offerings and investments in the sales-and-service force.
| | 2005 | | 2004 | | 2003 | |
Gross profit as a percent of net sales | | 50.4 | % | 51.4 | % | 50.9 | % |
Selling, general & administrative expenses as a percent of net sales | | 38.4 | % | 39.6 | % | 38.8 | % |
Our consolidated gross profit margin for 2005 decreased from 2004. The decrease was primarily driven by higher delivered product costs, partially offset by selling price increases and cost savings programs.
Selling, general and administrative expenses as a percentage of sales improved for 2005 compared to 2004. The improvement in the 2005 expense ratio is primarily due to selling price increases, sales leverage and cost savings programs partially offset by investments in the sales-and-service force and research and development.
(thousands) | | 2005 | | 2004 | | 2003 | |
Operating income | | $ | 542,420 | | $ | 489,890 | | $ | 455,009 | |
Operating income as a percent of net sales | | 12.0 | % | 11.7 | % | 12.1 | % |
| | | | | | | | | | |
Operating income for 2005 increased 11 percent over 2004. As a percent of sales, operating income also increased from 2004. The increase in operating income in 2005 is due to sales volume and selling price increases, cost reduction initiatives and lower share-based compensation expense, partially offset by higher delivered product costs as well as investments in the sales-and-service force, research and development and technology. Operating income also benefited from significant operating improvement at GCS Service in 2005.
Our net income was $319 million in 2005, an increase of 13 percent as compared to $283 million in 2004. Net income in both years included items of a non-recurring nature that are not necessarily indicative of future operating results. Net income in 2005 included a tax charge of $3.1 million related to the repatriation of foreign earnings under the AJCA. Net income in 2004 included benefits from a reduction in previously recorded restructuring expenses of $0.6 million after tax and a gain on the sale of a small international business of $0.2 million after tax. Income tax expense and net income in 2004 also included a tax benefit of $1.9 million related to prior years. These benefits were more than offset by a charge of $1.6 million for in-process research and development as part of the acquisition of Alcide Corporation and a charge of $2.4 million after tax related to the disposal of a grease management product line. Excluding these items from both years, net income increased 14 percent for 2005. This increase in net income reflects improved operating income growth by most of our business units in the face of a challenging raw material cost environment. Currency translation positively impacted net income growth in 2005 by approximately $5 million. Our 2005 net income also benefited when compared to 2004 due to a lower overall effective income tax rate which was the result of a lower international rate, international mix and tax planning efforts. Excluding the items of a non-recurring nature previously mentioned, net income was 7 percent of net sales for both 2005 and 2004.
2004 COMPARED WITH 2003
Our consolidated net sales reached $4.2 billion for 2004, an increase of 11 percent over net sales of $3.8 billion in 2003. Excluding acquisitions and divestitures, consolidated net sales increased 9 percent. Changes in currency translation positively impacted the consolidated sales growth rate by 4.5 percentage points, primarily due to the strength of the euro against the U.S. dollar. Sales also benefited from aggressive new account sales, new product and service offerings and providing more solutions for existing customers.
Our consolidated gross profit margin for 2004 increased over 2003. The increase is principally due to the benefits of cost savings initiatives, acquisitions and favorable raw material prices, especially in Europe.
Selling, general and administrative expenses for 2004 increased as a percentage of sales over 2003. The increase in the 2004 expense ratio is primarily due to investments in the sales-and-service force, information technology, research and development, acquisitions and higher compensation costs due to the issuance of stock options under a reload feature and the acceleration of vesting associated with executive retirements.
Operating income for 2004 increased 8 percent over 2003. Operating income as a percent of sales decreased slightly from 2003. The increase in operating income in 2004 is due to favorable sales volume increases and cost reduction initiatives, partially offset by investments in technology, research and development and the sales-and-service force as well as higher compensation costs.
Our net income was $283 million in 2004 as compared to $261 million in 2003, an increase of 8 percent. Net income in both years included items of a non-recurring nature that are not necessarily indicative of future operating results. Net income in 2004 included benefits from a reduction in previously recorded restructuring expenses of $0.6 million after tax and a gain on the sale of a small international business of $0.2 million after tax. Income tax expense and net income in 2004 also included a tax benefit of $1.9 million related to prior years. These benefits were more than offset by a charge of $1.6 million for in-process research and development as part of the acquisition of Alcide Corporation and a charge of $2.4 million after tax related to the disposal of a grease management product line. Net income in 2003 included a gain on the sale of an equity investment of $6.7 million after tax and a reduction in previously recorded restructuring expenses of $0.8 million after tax, partially
24
offset by a write-off of $1.7 million of goodwill related to an international business sold in 2003. If these items are excluded from both 2004 and 2003, net income increased 12 percent for 2004. This net income improvement reflects improving operating income growth across most of our divisions. Our 2004 net income also benefited when compared to 2003 due to a lower effective income tax rate which was the result of a lower international rate, tax savings efforts and the favorable tax benefit related to prior years that was recorded in 2004. Excluding the items of a non-recurring nature previously mentioned, net income was 7 percent of net sales for both 2004 and 2003.
OPERATING SEGMENT PERFORMANCE
Our operating segments have similar products and services and we are organized to manage our operations geographically. Our operating segments have been aggregated into three reportable segments: United States Cleaning & Sanitizing, United States Other Services and International. We evaluate the performance of our International operations based on fixed management rates of currency exchange. Therefore, International sales and operating income totals, as well as the International financial information included in this financial discussion, are based on translation into U.S. dollars at the fixed currency exchange rates used by management for 2005. All other accounting policies of the reportable segments are consistent with U.S. GAAP and the accounting policies of the company described in Note 2 of the notes to consolidated financial statements. Additional information about our reportable segments is included in Note 15 of the notes to consolidated financial statements.
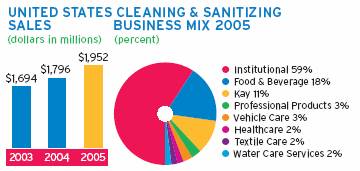
SALES BY OPERATING SEGMENT
(thousands) | | 2005 | | 2004 | | 2003 | |
Net sales | | | | | | | |
United States | | | | | | | |
Cleaning & Sanitizing | | $ | 1,952,220 | | $ | 1,796,355 | | $ | 1,694,323 | |
Other Services | | 375,234 | | 339,305 | | 320,444 | |
Total United States | | 2,327,454 | | 2,135,660 | | 2,014,767 | |
International | | 2,229,902 | | 2,126,840 | | 1,980,722 | |
Total | | 4,557,356 | | 4,262,500 | | 3,995,489 | |
Effect of foreign currency translation | | (22,524 | ) | (77,567 | ) | (233,670 | ) |
Consolidated | | $ | 4,534,832 | | $ | 4,184,933 | | $ | 3,761,819 | |
The following chart presents the comparative percentage change in net sales for each of our operating segments for 2005 and 2004.
SALES GROWTH INFORMATION
| | Percent Change
from Prior Year | |
| | 2005 | | 2004 | |
| | | | | |
Net sales | | | | | |
United States Cleaning & Sanitizing | | | | | |
Institutional | | 7 | % | 5 | % |
Kay | | 11 | | 16 | |
Textile Care | | 5 | | 6 | |
Professional Products | | 2 | | (15 | ) |
Healthcare | | 16 | | 6 | |
Water Care Services | | 34 | | 10 | |
Vehicle Care | | 12 | | (2 | ) |
Food & Beverage | | 9 | | 9 | |
Total United States Cleaning & Sanitizing | | 9 | % | 6 | % |
United States Other Services | | | | | |
Pest Elimination | | 12 | % | 10 | % |
GCS Service | | 8 | | (1 | ) |
Total United States Other Services | | 11 | % | 6 | % |
Total United States | | 9 | % | 6 | % |
International | | | | | |
Europe | | 3 | % | 8 | % |
Asia Pacific | | 8 | | 4 | |
Latin America | | 15 | | 13 | |
Canada | | 8 | | 4 | |
Other | | 18 | | 22 | |
Total International | | 5 | % | 7 | % |
Consolidated | | 8 | % | 11 | % |
Sales of our United States Cleaning & Sanitizing operations reached nearly $2.0 billion in 2005 and increased 9 percent over net sales of $1.8 billion in 2004. Excluding acquisitions and divestitures, sales increased 8 percent for 2005. Sales benefited from double-digit organic growth in our Kay, Healthcare and Vehicle Care divisions, along with good growth in our Institutional and Food & Beverage divisions. This sales performance reflects increased account retention and penetration through enhanced service, pricing, new product and program initiatives and aggressive new account sales efforts. Institutional results reflect sales growth in all end market segments, including travel, casual dining, healthcare, and government markets. Kay’s double-digit sales increase was led by strong gains in sales to its core quickservice customers and in its food retail services business. Textile Care sales increased this year, driven by price increases and growth at existing corporate account customers. Professional Products sales, excluding the impact of last year’s VIC acquisition, were flat in 2005 compared to 2004. Success with new floor care product introductions and growth in the corporate account and government segments was offset by a decline in sales through distributors to the janitorial market. Our Healthcare Division reported a double-digit sales increase versus last year primarily due to sales of new instrument care solids as well as waterless and antibacterial
25
skincare products. Water Care Services sales growth was primarily driven by the acquisition of Midland Research Laboratories. Excluding the acquisition of Midland, Water Care sales increased 5 percent for 2005 due to sales growth in the food and beverage market segment. Vehicle Care had a double-digit sales increase in 2005. The strong sales trend was driven by new product launches, selling price increases and customer retention. Sales also benefited from increased demand due to favorable wash conditions and weather patterns. Food & Beverage sales increased 9 percent compared to the prior year. Excluding the benefits of last year’s Alcide acquisition, Food & Beverage sales increased 5 percent for 2005 primarily due to gains in the dairy, food and soft drink markets reflecting increasing penetration of existing corporate accounts as well as new business.

Sales of our United States Other Services operations increased 11 percent to $375 million in 2005, from $339 million in 2004. Pest Elimination had double-digit sales growth in both core pest elimination contract and non-contract services, such as bird and termite work, fumigation, one-shot services and its food safety audit business. GCS Service sales grew 8 percent in 2005 as service and installed parts sales increased over last year. GCS continued to increase technician productivity and improve customer service satisfaction.

Management rate sales of our International operations were $2.2 billion in 2005, an increase of 5 percent over sales of $2.1 billion in 2004. Excluding acquisitions and divestitures, sales increased 4 percent for 2005. Sales in Europe, excluding acquisitions and divestitures, were up 2 percent from 2004. Sales continue to be affected by an overall weak European economy, particularly in the major central countries. Europe’s Institutional division had a modest sales increase in 2005 as weak trends in the janitorial distributor segment in Germany, Spain and Italy offset gains in sales to food distribution and chain accounts. Gains in Europe’s Food & Beverage, Healthcare and Pest Elimination businesses helped overcome the poor economic climate in Germany and reduced European tourism. Sales in Asia Pacific, excluding acquisitions and divestitures, increased 7 percent. The growth was primarily driven by East Asia, including continued growth in China. Sales in Japan increased modestly and Australia reported good growth versus 2004. Asia Pacific growth was driven by new corporate accounts and good results in the beverage and brewery segment. Double-digit sales growth in Latin America reflected growth in all countries over last year with Mexico, Chile and Argentina showing the strongest growth. Results were due to new account gains, growth of existing accounts and strong equipment sales. Sales in Canada increased in 2005, reflecting good results from all divisions.
OPERATING INCOME BY OPERATING SEGMENT
(thousands) | | 2005 | | 2004 | | 2003 | |
Operating income | | | | | | | |
United States | | | | | | | |
Cleaning & Sanitizing | | $ | 279,960 | | $ | 266,072 | | $ | 268,646 | |
Other Services | | 36,012 | | 20,447 | | 18,228 | |
Total United States | | 315,972 | | 286,519 | | 286,874 | |
International | | 227,864 | | 217,865 | | 207,057 | |
Total | | 543,836 | | 504,384 | | 493,931 | |
Corporate | | — | | (4,361 | ) | (4,834 | ) |
Effect of foreign currency translation | | (1,416 | ) | (10,133 | ) | (34,088 | ) |
Consolidated | | $ | 542,420 | | $ | 489,890 | | $ | 455,009 | |
Operating income as a percent of net sales | | | | | | | |
United States | | | | | | | |
Cleaning & Sanitizing | | 14.3 | % | 14.8 | % | 15.9 | % |
Other Services | | 9.6 | | 6.0 | | 5.7 | |
Total | | 13.6 | | 13.4 | | 14.2 | |
International | | 10.2 | | 10.2 | | 10.5 | |
Consolidated | | 12.0 | % | 11.7 | % | 12.1 | % |
| | | | | | | | | | | | | |
Operating income of our United States Cleaning & Sanitizing operations was $280 million in 2005, an increase of 5 percent from operating income of $266 million in 2004. As a percentage of net sales, operating income decreased from 14.8 percent in 2004 to 14.3 percent in 2005. Acquisitions and divestitures had no effect on the overall percentage increase in operating income. The increase in operating income in 2005 reflects the benefits of higher sales, increased pricing and lower share-based compensation expense being partially offset by higher delivered product costs. Operating income margins declined because the negative impact of higher delivered product costs more than offset the benefits of pricing, cost savings and sales leverage. The number of sales-and-service associates in our United States Cleaning & Sanitizing operations increased by 135 in 2005 including increases due to investment in our existing businesses and the effects of acquisitions.
Operating income of United States Other Services operations increased 76 percent to $36 million in 2005. The operating income margin for United States Other Services increased to 9.6 percent in 2005 from 6.0 percent in 2004. Pest Elimination had double-digit operating income growth and GCS Service results reflect sharp profitability improvement in 2005. The increase in operating income for Pest Elimination was driven by strong sales and leverage of sales and administrative teams, with pricing and productivity improvements offsetting cost increases. GCS Service narrowed its operating loss substantially in 2005 due to good sales growth and operational improvements. GCS Service operating income growth also benefited from a favorable comparison to 2004 which included a sales decline, increased marketing expenses and higher than expected costs resulting from centralizing the parts and administration activities. We added 105 sales-and-service associates to our United States Other Services operations in 2005.
Management rate operating income of International operations rose 5 percent to $228 million in 2005 from operating income of $218 million in 2004. The International operating income margin was 10.2 percent in both 2005 and 2004. Excluding the impact of acquisitions and divestitures occurring in 2005 and 2004, operating income increased 3 percent over 2004, and the International operating income margin remained the same at 10.2 percent for both 2005 and 2004. Sales growth, pricing initiatives, lower share-based compensation expense and cost efficiencies were partially offset by
26
higher delivered product costs, unfavorable business mix and investments. We added 390 sales-and-service associates to our International operations during 2005, reflecting investments in our core businesses and the impact of acquisitions.
Operating income margins of our International operations are generally less than those realized for our U.S. operations. The lower International margins are due to (i) the additional costs caused by the difference in scale of International operations where many operating locations are smaller in size, (ii) the additional cost of operating in numerous and diverse foreign jurisdictions and (iii) higher costs of importing raw materials and finished goods. Proportionately larger investments in sales, technical support and administrative personnel are also necessary in order to facilitate the growth of our International operations.
2004 COMPARED WITH 2003
Sales of our United States Cleaning & Sanitizing operations were $1.8 billion in 2004 and increased 6 percent over net sales of $1.7 billion in 2003. Excluding acquisitions and divestitures, sales increased 5 percent in 2004. Sales benefited from double-digit growth in our Kay Division, along with good growth in our Institutional Division. This sales performance reflects increased account retention through enhanced service, new product and program initiatives and aggressive new account sales efforts. Institutional results include sales increases in all end markets, including restaurant, lodging, healthcare, travel and government markets. Kay’s double-digit sales increase over 2003 was led by strong gains in sales to its core quickservice customers and in its food retail services business. New customers, better account penetration, new products and programs and more effective field sales coverage contributed to this sales increase. Textile Care sales increase was driven by a significant corporate account gain made early in the year and improved account retention. Professional Products sales, excluding the VIC acquisition, decreased 18 percent as sales growth in corporate accounts was more than offset by the planned phase down of the janitorial equipment distribution business and weak distributor sales. Sales in our Healthcare Division were driven by strong growth in instrument care solids and skincare products which were partially offset by the exit of a private label product line. Food & Beverage sales, excluding the benefits of the Alcide acquisition, increased 5 percent primarily due to improved retention and corporate account growth in sales to the dairy, soft drink and agri markets. Water Care Services had good sales growth in the dairy, canning, meat and food processing markets. Our Circle the Customer strategy continued to produce new account gains as our Water Care Services Division worked with our Food & Beverage and Healthcare divisions to drive its sales growth. Vehicle Care sales declined due to bad weather, the impact of higher fuel prices on customer purchase decisions and the sale of retail gas stations by major oil companies to smaller franchises, which correspondingly affects distributor sales.
Sales of our United States Other Services operations increased 6 percent to $339 million in 2004, from $320 million in 2003. Pest Elimination sales increased with good growth in both core pest elimination contract and non-contract services, such as bird work, the Stealth fly program, one-shot services and its food safety audit business. GCS Service sales decreased slightly in 2004, however, sales grew in the second half of the year as a result of an increase in direct parts revenue.
Management rate sales of our International operations reached $2.1 billion in 2004, an increase of 7 percent over sales of $2.0 billion in 2003. Excluding acquisitions and divestitures, sales increased 4 percent for 2004. Sales in Europe, excluding acquisitions and divestitures, were up 3 percent primarily due to successful new product launches, increased marketing and added sales-and-service headcount that was partially offset by the effects of a weak European economy. Europe’s Institutional division made significant improvement over its 2003 trend, and strength in its Healthcare and Textile Care businesses helped overcome Germany’s poor economic climate and reduced European tourism and beverage consumption. Sales in Asia Pacific, excluding divestitures, increased 5 percent, led by good results in East Asia and New Zealand. In Northeast Asia, China and Hong Kong led the sales increase with strong results in both Institutional and Food & Beverage. New Zealand sales increased over the prior year primarily due to growth in the Food & Beverage business. Sales in Japan and Australia were flat versus 2003. Sales growth in Latin America reflected good growth in all countries and was driven by the success in new business gains in global/regional accounts, continuing to implement the Circle the Customer growth strategy and the successful launch of new programs such as MarketGuard and LaunderCare. Sales in Canada increased, reflecting an improved hospitality industry and recovery from the impact of the Severe Acute Respiratory Syndrome (SARS) outbreak in Canada in 2003.
Operating income of our United States Cleaning & Sanitizing operations was $266 million in 2004, a decrease of 1 percent from operating income of $269 million in 2003. As a percentage of net sales, operating income decreased from 15.9 percent in 2003 to 14.8 percent in 2004. Excluding acquisitions and divestitures, operating income declined 4 percent from 2003 and the operating income margin also declined from 16.2 percent in 2003 to 14.8 percent in 2004. This decline is primarily due to investments in the sales-and-service force, research and development, information technology, higher compensation costs and higher delivered product cost. This was partially offset by favorable business mix and cost efficiency improvements. The number of sales-and service associates in our United States Cleaning & Sanitizing operations declined by 60 people in 2004, as the addition of 190 new associates was offset by a decrease of 250 people due to the divestiture of our grease management product line.
Operating income of our United States Other Services operations increased 12 percent to $20 million in 2004. The operating income margin for United States Other Services increased to 6.0 percent in 2004 from 5.7 percent in 2003. Pest Elimination had strong operating income growth, while GCS Service results reflected a slightly higher operating loss. The increase in operating income for Pest Elimination was driven by increased sales volume, lower product cost and general expense controls. GCS Service results reflected an operating loss due to a decline in sales, increased marketing expenses and higher than expected costs resulting from centralizing the parts and administration activities. During 2004, we added 15 sales-and-service associates to our United States Other Services operations. This is net of a decrease in GCS Service technicians.
Management rate operating income of International operations rose 5 percent to $218 million in 2004 from operating income of $207 million in 2003. The International operating income margin decreased from 10.5 percent in 2003 to 10.2 percent in 2004. Excluding the impact of acquisitions and divestitures occurring in 2004 and 2003, operating income increased 4 percent over 2003, and the International operating income margin was 10.0 percent in 2004 and 2003. The results were due to good operating income growth across all of our international regions. We added 640 sales-and-service associates to our International operations during 2004, reflecting our investment in our core business and the impact of acquisitions.
CORPORATE
We had no operating expenses in our corporate segment in 2005, compared with $4.4 million in 2004 and $4.8 million in 2003. In 2004, corporate operating expense included a charge of $1.6 million for in-process research and development as part of the acquisition of Alcide Corporation and a charge of $4.0 million related to the disposal of a grease management product line, which were partially offset by $0.9 million of income for reductions in restructuring accruals and a $0.3 million gain on the sale of a small international business.
27
Corporate operating expense in 2003 included a write-off of $1.7 million of goodwill related to an international business sold in 2003, $1.4 million of income for reductions in restructuring accruals and $4.5 million of expense for postretirement death benefits for retired executives.
INTEREST AND INCOME TAXES
Net interest expense decreased to $44 million in 2005. The decrease was caused by higher interest income during the year due to increased levels of cash and cash equivalents and short-term investments offset partially by a small increase in interest expense. Interest expense increased due to higher short-term debt levels during the year, partially offset by lower expense on our euro denominated debt due to a stronger U.S. dollar versus the euro.
Net interest expense for 2004 was $45 million and was flat when compared to interest expense in 2003 with a slight decrease in interest expense being offset by a similar decrease in interest income. Higher interest expense on our euro denominated debt due to the stronger euro was offset by lower interest expense on other notes payable.
Our effective income tax rate was 35.9 percent for 2005, compared with effective income tax rates of 36.4 percent and
38.1 percent in 2004 and 2003, respectively. Excluding the effects of the $3.1 million tax charge related to the repatriation of foreign earnings under the American Jobs Creation Act, the estimated annual effective income tax rate for 2005 was 35.2 percent. Excluding the effects of special charges mentioned above in the corporate section and a $1.9 million tax benefit related to prior years, the estimated annual effective income tax rate was 36.7 percent for 2004. Excluding the effects of the gain on the sale of an equity investment and the effect of special charges, the effective income tax rate was 37.9 percent for 2003. Reductions in our effective income tax rates over the last three years have primarily been due to a lower overall international rate, favorable international mix the impact of tax planning efforts.
FINANCIAL POSITION
Our debt continued to be rated within the “A” categories by the major rating agencies during 2005. Significant changes in our financial position during 2005 and 2004 included the following:
During 2005, total assets increased 2 percent to $3.8 billion from $3.7 billion at year-end 2004. Cash and cash equivalents increased to $104 million and short-term investments increased to $125 million due to continued strong operating cash flow, short-term borrowings and a decrease in cash used for businesses acquisition activity in 2005. Acquisitions added approximately
$35 million in assets to the balance sheet and our voluntary contribution to the U.S. Pension plan added $38 million to other assets. The value of non-U.S. assets on the balance sheet decreased by approximately $190 million during 2005 due to foreign currency translation as the U.S. dollar strengthened against most foreign currencies, primarily the euro which decreased in value by 11 percent.
Total liabilities increased approximately $29 million in 2005. This included an increase in total debt of $44 million due to short-term borrowings. Total liabilities also reflected a decrease due to the effects of currency translation.
Total assets reached $3.7 billion at December 31, 2004, an increase of 15 percent over total assets of $3.2 billion at year-end 2003. Acquisitions added approximately $233 million in assets to the balance sheet. Also, assets increased by approximately
$181 million related to the strengthening of foreign currencies, primarily the euro. Of the increase in accounts receivable, 53 percent is due to acquisitions and currency. The increase in goodwill is 65 percent due to acquisitions and 35 percent due to currency. The increase in other assets is primarily due to the $37 million voluntary contribution made in 2004 to fund the U.S. pension plan.
Total liabilities increased approximately $210 million in 2004. Again, acquisitions and currency accounted for a large portion of this increase, approximately 74 percent.
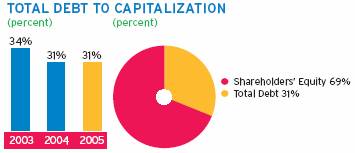
Total debt was $746 million at December 31, 2005, and increased from total debt of $702 million at year-end 2004. This increase in total debt during 2005 was primarily due to higher short-term borrowings to fund a portion of the AJCA repatriation, partially offset by a decrease in our euronotes due to the strengthening of the U.S. dollar against the euro during 2005. The ratio of total debt to capitalization was 31 percent at both year-end 2005 and 2004. The debt to capitalization ratio did not change in 2005 due to the increase in debt outstanding being offset by increasing shareholders’ equity levels.

CASH FLOWS
Cash provided by operating activities reached a record high of $590 million for 2005, an increase over $571 million in 2004 and $524 million in 2003. The increase in operating cash flow for 2005 over 2004 reflects our higher net income. Operating cash flow in 2005 benefited from sales volume and selling price increases along with improved collection of accounts receivable, as well as better inventory management and cost savings efforts. The increase in operating cash flow for 2004 over 2003 is due to increasing net income and a smaller contribution to the U.S. pension plan compared to 2003. The increase was partially offset by an increase in U.S. income tax payments in 2004 over 2003. Historically, we have had strong operating cash flows, and we anticipate this will continue. We expect to continue to use this cash flow to acquire new businesses, repurchase our common stock, pay down debt and meet our ongoing obligations and commitments.
Cash used for investing activities increased from 2004 due to $125 million of net purchases of short-term investments offset by lower acquisition activity. Cash used for investing activities included capital expenditures of $269 million in 2005, $276 million in 2004 and $212 million in 2003. Worldwide additions of merchandising equipment, primarily cleaning and sanitizing product dispensers, accounted for approximately 64 percent, 58 percent and 69 percent of each year’s capital expenditures in 2005, 2004 and 2003, respectively. Merchandising equipment is depreciated over 3 to 7 year lives. Cash used for businesses acquired included Midland Research Laboratories, Kilco Chemicals Ltd. and YSC Chemical Company in 2005, Nigiko, Daydots International, Elimco and certain business lines of VIC International in 2004, and Adams Healthcare in 2003.
Financing cash flow activity included cash used to reacquire shares of our common stock and pay dividends as well as cash provided and used through our debt arrangements. Share repurchases totaled $213 million in 2005, $165 million in 2004 and $227 million in
28
2003. These repurchases were funded with operating cash flows and cash from the exercise of employee stock options. In October 2003 we announced authorization to repurchase up to 10 million shares of Ecolab common stock. This authorization was concluded in the fourth quarter of 2005. In December 2004, we announced an authorization to repurchase up to 10 million additional shares of Ecolab common stock. As of December 31, 2005, approximately 9.8 million shares remained to be purchased under the December 2004 authorization. Shares are repurchased for the purpose of offsetting the dilutive effect of stock options and incentives and for general corporate purposes. During 2006, we expect to repurchase at least 3.5 million shares to offset the dilutive effect of stock options, based on our estimates of stock option exercises for 2006. Cash proceeds from the exercises as well as the tax benefits will provide a portion of the funding for this repurchase activity.
In 2005, we increased our annual dividend rate for the fourteenth consecutive year. We have paid dividends on our common stock for 69 consecutive years. Cash dividends declared per share of common stock, by quarter, for each of the last three years were as follows:
| | First | | Second | | Third | | Fourth | | | |
| | Quarter | | Quarter | | Quarter | | Quarter | | Year | |
| | | | | | | | | | | |
2005 | | $ | 0.0875 | | $ | 0.0875 | | $ | 0.0875 | | $ | 0.1000 | | $ | 0.3625 | |
2004 | | 0.0800 | | 0.0800 | | 0.0800 | | 0.0875 | | 0.3275 | |
2003 | | 0.0725 | | 0.0725 | | 0.0725 | | 0.0800 | | 0.2975 | |
| | | | | | | | | | | | | | | | |
LIQUIDITY AND CAPITAL RESOURCES
We currently expect to fund all of the requirements which are reasonably foreseeable for 2006, including new program investments, share repurchases, scheduled debt repayments, dividend payments, possible business acquisitions and pension contributions from operating activities, cash and short-term investment reserves and short-term borrowings. We will likely undertake long-term borrowing to refinance the euro 300 million ($355 million as of December 31, 2005) Euronotes before they mature in February 2007. In the event of a significant acquisition, funding may also occur through additional long-term borrowings. Cash provided by operating activities reached a record high of $590 million in 2005. While cash flows could be negatively affected by a decrease in revenues, we do not believe that our revenues are highly susceptible, in the short term, to rapid changes in technology within our industry. We have a $450 million U.S. commercial paper program and a $200 million European commercial paper program. Both programs are rated A-1 by Standard & Poor’s and P-1 by Moody’s. To support our commercial paper programs and other general business funding needs, we maintain a $450 million multi-year committed credit agreement which expires in August 2009 and under certain circumstances can be increased by $150 million for a total of $600 million. We can draw directly on the credit facility on a revolving credit basis. As of December 31, 2005, $88 million of this credit facility was committed to support outstanding European commercial paper, leaving $362 million available for other uses. In addition, we have other committed and uncommitted credit lines of approximately
$198 million with major international banks and financial institutions to support our general global funding needs. Additional details on our credit facilities are included in Note 6 of the notes to consolidated financial statements.
During 2005, we voluntarily contributed $38 million to our U.S. pension plan. In making this contribution, we considered the normal growth in accrued plan benefits, the impact of lower year-end discount rates on the plan liability and the tax deductibility of the contribution. Our contributions to the pension plan did not have a material effect on our consolidated results of operations, financial position or cash flows. We expect our U.S. pension plan expense to decrease to approximately $33 million in 2006 from
$35 million in 2005, primarily due to expected returns on a higher level of plan assets partially offset by a decrease in the discount rate from 5.75 percent to 5.57 percent for the 2006 expense calculation. The expected return on plan assets of 8.75 percent is consistent with 2005.
We do not have relationships with unconsolidated entities or financial partnerships, such as entities often referred to as “structured finance” or “special purposes entities”, which are sometimes established for the purpose of facilitating off-balance sheet financial arrangements or other contractually narrow or limited purposes. As such, we are not exposed to any financing, liquidity, market or credit risk that could arise if we had engaged in such relationships.
A schedule of our obligations under various notes payable, long-term debt agreements, operating leases with noncancelable terms in excess of one year, interest obligations and benefit payments are summarized in the following table:
| | Payments due by Period | | | |
(thousands) | | | | Less | | | | | | More | |
Contractual | | | | than | | 1-3 | | 3-5 | | than | |
obligations | | Total | | 1 Year | | Years | | Years | | 5 Years | |
| | | | | | | | | | | |
Notes payable | | $ | 146,725 | | $ | 146,725 | | $ | — | | $ | — | | $ | — | |
Long-term debt | | 599,576 | | 80,202 | | 362,434 | | 2,339 | | 154,601 | |
Operating leases | | 136,857 | | 41,227 | | 54,990 | | 29,781 | | 10,859 | |
Interest* | | 80,759 | | 30,958 | | 25,850 | | 21,876 | | 2,075 | |
Benefit payments** | | 569,000 | | 41,000 | | 93,000 | | 105,000 | | 330,000 | |
Total contractual cash obligations | | $ | 1,532,917 | | $ | 340,112 | | $ | 536,274 | | $ | 158,996 | | $ | 497,535 | |
* Interest on variable rate debt was calculated using the interest rate at year-end 2005.
** Benefit payments are paid out of the company’s pension and postretirement health care benefit plans.
In January 2006, we repaid our $75 million 7.19% senior notes when they became due. We expect to refinance our
euro 300 million ($355 million as of December 31, 2005) Euronotes before they become due in February 2007.
We are not required to make any contributions to our U.S. pension and postretirement health care benefit plans in 2006. However, in January 2006, we made a $45 million voluntary contribution to our U.S. pension plan. The maximum tax deductible contribution for 2006 is estimated to be approximately $50 to $60 million for our U.S. pension plan. We estimate contributions to be made to our international plans will approximate $15 to $20 million in 2006. These amounts have been excluded from the schedule of contractual obligations.
We lease sales and administrative office facilities, distribution center facilities, computers and other equipment under longer-term operating leases. Vehicle leases are generally shorter in duration. The U.S. vehicle leases have guaranteed residual value requirements that have historically been satisfied by the proceeds on the sale of the vehicles. No amounts have been recorded for these guarantees in the table above as we believe that the potential recovery of value from the vehicles when sold will be greater than the residual value guarantee.
Except for approximately $48 million of letters of credit supporting domestic and international commercial relationships and transactions, we do not have significant unconditional purchase obligations, or significant other commercial commitments, such as commitments under lines of credit, standby letters of credit, guarantees, standby repurchase obligations or other commercial commitments.
As of year-end 2005, we are in compliance with all covenants and other requirements of our credit agreements and indentures. Our $450 million multicurrency credit agreement includes a covenant regarding the ratio of the total debt to capitalization. Additionally, we do not have any rating triggers that would accelerate the maturity dates of our debt.
A downgrade in our credit rating could limit or preclude our ability to issue commercial paper under our current programs. A credit rating downgrade could also adversely affect our ability to renew existing, or negotiate new credit facilities in the future and could increase the cost
29
of these facilities. Should this occur, we could seek additional sources of funding, including issuing term notes or bonds. In addition, we have the ability at our option to draw upon our $450 million committed credit facilities prior to their termination and, under certain conditions, can increase this amount to $600 million.
MARKET RISK
We enter into contractual arrangements (derivatives) in the ordinary course of business to manage foreign currency exposure and interest rate risks. We do not enter into derivatives for trading purposes. Our use of derivatives is subject to internal policies that provide guidelines for control, counterparty risk and ongoing monitoring and reporting and is designed to reduce the volatility associated with movements in foreign exchange and interest rates on our income statement and cash flows.
We enter into forward contracts, swaps and foreign currency options to hedge certain intercompany financial arrangements, and to hedge against the effect of exchange rate fluctuations on transactions related to cash flows and net investments denominated in currencies other than U.S. dollars. As of December 31, 2005, we had approximately $395 million of foreign currency forward exchange contracts with face amounts denominated primarily in euros.
We manage interest expense using a mix of fixed and floating rate debt. To help manage borrowing costs, we may enter into interest rate swap agreements. Under these arrangements, we agree to exchange, at specified intervals, the difference between fixed and floating interest amounts calculated by reference to an agreed-upon notional principal amount. At year-end 2005, we had an interest rate swap that converts approximately euro 78 million (approximately $92 million U.S. dollars) of our Euronote debt from a fixed interest rate to a floating or variable interest rate. This swap agreement expires in February 2007. In September 2003, we entered into an interest rate swap agreement that converted $30 million of the 7.19% senior notes from a fixed interest rate to a floating or variable interest rate. This agreement expired in January 2006, when the notes reached final maturity.
Based on a sensitivity analysis (assuming a 10 percent adverse change in market rates) of our foreign exchange and interest rate derivatives and other financial instruments, changes in exchange rates or interest rates would not materially affect our financial position and liquidity. The effect on our results of operations would be substantially offset by the impact of the hedged items.
FORWARD-LOOKING STATEMENTS AND RISK FACTORS
This financial discussion and other portions of this Annual Report to Shareholders contain various “Forward-Looking Statements” within the meaning of the Private Securities Litigation Reform Act of 1995. These statements include expectations concerning business progress and expansion, business acquisitions, currency translation, cash flows, debt repayments, share repurchases, susceptibility to changes in technology, global economic conditions, pension expenses and potential contributions, and liquidity requirements. These statements, which represent our expectations or beliefs concerning various future events, are based on current expectations. Therefore, they involve a number of risks and uncertainties that could cause actual results to differ materially from those of such Forward-Looking Statements. These risks and uncertainties include: the vitality of the foodservice, hospitality, travel, healthcare and food processing industries; restraints on pricing flexibility due to competitive factors, customer or vendor consolidations and existing contractual obligations; changes in oil or raw material prices or unavailability of adequate and reasonably priced raw materials or substitutes therefore; the occurrence of capacity constraints or the loss of a key supplier or the inability to obtain or renew supply agreements on favorable terms; the effect of future acquisitions or divestitures or other corporate transactions; our ability to achieve plans for past acquisitions; the costs and effects of complying with: (i) laws and regulations relating to the environment and to the manufacture, storage, distribution, efficacy and labeling of our products, and (ii) changes in tax, fiscal, governmental and other regulatory policies; economic factors such as the worldwide economy, interest rates and currency movements, including, in particular, our exposure to foreign currency risk; the occurrence of (a) litigation or claims, (b) the loss or insolvency of a major customer or distributor, (c) war (including acts of terrorism or hostilities which impact our markets), (d) natural or manmade disasters, or (e) severe weather conditions or public health epidemics affecting the foodservice, hospitality and travel industries; loss of, or changes in, executive management; our ability to continue product introductions or reformulations and technological innovations; and other uncertainties or risks reported from time to time in our reports to the Securities and Exchange Commission. In addition, we note that our stock price can be affected by fluctuations in quarterly earnings. There can be no assurances that our earnings levels will meet investors’ expectations. We undertake no duty to update our Forward-Looking Statements.
30
Consolidated Statement of Income
Year ended December 31 (thousands, except per share) | | 2005 | | 2004 | | 2003 | |
| | | | | | | |
Net sales | | $ | 4,534,832 | | $ | 4,184,933 | | $ | 3,761,819 | |
| | | | | | | |
Operating expenses | | | | | | | |
Cost of sales (including special charges (income) of ($106) in 2004 and ($76) in 2003) | | 2,248,831 | | 2,033,492 | | 1,846,584 | |
Selling, general and administrative expenses | | 1,743,581 | | 1,657,084 | | 1,459,818 | |
Special charges | | | | 4,467 | | 408 | |
Operating income | | 542,420 | | 489,890 | | 455,009 | |
| | | | | | | |
Gain on sale of equity investment | | | | | | 11,105 | |
| | | | | | | |
Interest expense, net | | 44,238 | | 45,344 | | 45,345 | |
| | | | | | | |
Income before income taxes | | 498,182 | | 444,546 | | 420,769 | |
| | | | | | | |
Provision for income taxes | | 178,701 | | 161,853 | | 160,179 | |
Net income | | $ | 319,481 | | $ | 282,693 | | $ | 260,590 | |
| | | | | | | |
Net income per common share | | | | | | | |
Basic | | $ | 1.25 | | $ | 1.10 | | $ | 1.00 | |
Diluted | | $ | 1.23 | | $ | 1.09 | | $ | 0.99 | |
| | | | | | | |
Weighted-average common shares outstanding | | | | | | | |
Basic | | 255,741 | | 257,575 | | 259,454 | |
Diluted | | 260,098 | | 260,407 | | 262,737 | |
The accompanying notes are an integral part of the consolidated financial statements.
31
Consolidated Balance Sheet
December 31 (thousands, except per share) | | 2005 | | 2004 | | 2003 | |
| | | | | | | |
ASSETS | | | | | | | |
Current assets | | | | | | | |
Cash and cash equivalents | | $ | 104,378 | | $ | 71,231 | | $ | 85,626 | |
Short-term investments | | 125,063 | | | | | |
Accounts receivable, net | | 743,520 | | 738,266 | | 626,002 | |
Inventories | | 325,574 | | 338,603 | | 309,959 | |
Deferred income taxes | | 65,880 | | 76,038 | | 75,820 | |
Other current assets | | 57,251 | | 54,928 | | 52,933 | |
| | | | | | | |
Total current assets | | 1,421,666 | | 1,279,066 | | 1,150,340 | |
| | | | | | | |
Property, plant and equipment, net | | 835,503 | | 834,730 | | 736,797 | |
| | | | | | | |
Goodwill | | 937,019 | | 991,811 | | 797,211 | |
| | | | | | | |
Other intangible assets, net | | 202,936 | | 229,095 | | 203,859 | |
| | | | | | | |
Other assets, net | | 399,504 | | 381,472 | | 340,711 | |
Total assets | | $ | 3,796,628 | | $ | 3,716,174 | | $ | 3,228,918 | |
| | | | | | | |
LIABILITIES AND SHAREHOLDERS’ EQUITY | | | | | | | |
Current liabilities | | | | | | | |
Short-term debt | | $ | 226,927 | | $ | 56,132 | | $ | 70,203 | |
Accounts payable | | 277,635 | | 269,561 | | 212,287 | |
Compensation and benefits | | 214,131 | | 231,856 | | 190,386 | |
Income taxes | | 39,583 | | 22,709 | | 59,829 | |
Other current liabilities | | 361,081 | | 359,289 | | 319,237 | |
Total current liabilities | | 1,119,357 | | 939,547 | | 851,942 | |
| | | | | | | |
Long-term debt | | 519,374 | | 645,445 | | 604,441 | |
| | | | | | | |
Postretirement health care and pension benefits | | 302,048 | | 270,930 | | 249,906 | |
| | | | | | | |
Other liabilities | | 206,639 | | 262,111 | | 201,548 | |
| | | | | | | |
Shareholders’ equity (common stock, par value $1.00 per share; shares outstanding: 2005 - 254,143; 2004 - 257,542 and 2003 - 257,417) | | 1,649,210 | | 1,598,141 | | 1,321,081 | |
Total liabilities and shareholders’ equity | | $ | 3,796,628 | | $ | 3,716,174 | | $ | 3,228,918 | |
The accompanying notes are an integral part of the consolidated financial statements.
32
Consolidated Statement of Cash Flows
Year ended December 31 (thousands) | | 2005 | | 2004 | | 2003 | |
| | | | | | | |
OPERATING ACTIVITIES | | | | | | | |
Net income | | $ | 319,481 | | $ | 282,693 | | $ | 260,590 | |
Adjustments to reconcile net income to cash provided by operating activities: | | | | | | | |
Depreciation | | 222,712 | | 213,523 | | 201,512 | |
Amortization | | 34,223 | | 33,431 | | 26,591 | |
Deferred income taxes | | (13,021 | ) | 14,342 | | 36,796 | |
Share-based compensation expense | | 39,087 | | 44,660 | | 29,202 | |
Excess tax benefits from share-based payment arrangements | | (11,682 | ) | (11,556 | ) | (5,267 | ) |
Gain on sale of equity investment | | | | | | (11,105 | ) |
Disposal loss, net | | | | 3,691 | | | |
Charge for in-process research and development | | | | 1,600 | | | |
Special charges - asset disposals | | | | | | 1,684 | |
Other, net | | (882 | ) | (2,507 | ) | 1,837 | |
Changes in operating assets and liabilities: | | | | | | | |
Accounts receivable | | (44,839 | ) | (47,217 | ) | (5,547 | ) |
Inventories | | 2,553 | | (5,481 | ) | (2,902 | ) |
Other assets | | (21,853 | ) | (31,723 | ) | (39,224 | ) |
Accounts payable | | 18,987 | | 34,841 | | (13,329 | ) |
Other liabilities | | 45,370 | | 40,611 | | 43,094 | |
Cash provided by operating activities | | 590,136 | | 570,908 | | 523,932 | |
| | | | | | | |
INVESTING ACTIVITIES | | | | | | | |
Capital expenditures | | (268,783 | ) | (275,871 | ) | (212,035 | ) |
Property disposals | | 21,209 | | 18,373 | | 8,502 | |
Capitalized software expenditures | | (10,949 | ) | (9,688 | ) | (8,951 | ) |
Businesses acquired and investments in affiliates, net of cash acquired | | (26,967 | ) | (129,822 | ) | (31,726 | ) |
Sale of businesses and assets | | 1,441 | | 3,417 | | 27,130 | |
Proceeds from sales and maturities of short-term investments | | 60,625 | | | | | |
Purchases of short-term investments | | (185,688 | ) | | | | |
Cash used for investing activities | | (409,112 | ) | (393,591 | ) | (217,080 | ) |
| | | | | | | |
FINANCING ACTIVITIES | | | | | | | |
Net borrowings (repayments) of notes payable | | 96,683 | | (17,474 | ) | (94,412 | ) |
Long-term debt borrowings | | 4,664 | | 7,325 | | 5,959 | |
Long-term debt repayments | | (5,710 | ) | (6,632 | ) | (13,270 | ) |
Reacquired shares | | (213,266 | ) | (165,414 | ) | (227,145 | ) |
Cash dividends on common stock | | (89,807 | ) | (82,419 | ) | (75,413 | ) |
Exercise of employee stock options | | 49,726 | | 59,989 | | 126,615 | |
Excess tax benefits from share-based payment arrangements | | 11,682 | | 11,556 | | 5,267 | |
Other, net | | | | (800 | ) | (313 | ) |
Cash used for financing activities | | (146,028 | ) | (193,869 | ) | (272,712 | ) |
| | | | | | | |
Effect of exchange rate changes on cash | | (1,849 | ) | 2,157 | | 2,281 | |
| | | | | | | |
INCREASE (DECREASE) IN CASH AND CASH EQUIVALENTS | | 33,147 | | (14,395 | ) | 36,421 | |
Cash and cash equivalents, beginning of year | | 71,231 | | 85,626 | | 49,205 | |
Cash and cash equivalents, end of year | | $ | 104,378 | | $ | 71,231 | | $ | 85,626 | |
The accompanying notes are an integral part of the consolidated financial statements.
33
Consolidated Statement of Comprehensive Income and Shareholders’ Equity
| | | | | | | | Accumulated | | | | | |
| | | | Additional | | | | Other | | | | | |
| | Common | | Paid-in | | Retained | | Comprehensive | | Treasury | | | |
(thousands) | | Stock | | Capital | | Earnings | | Income(Loss) | | Stock | | Total | |
Balance December 31, 2002 | | $ | 151,950 | | $ | 453,450 | | $ | 1,110,707 | | $ | (76,108 | ) | $ | (520,252 | ) | $ | 1,119,747 | |
| | | | | | | | | | | | | |
Net income | | | | | | 260,590 | | | | | | 260,590 | |
Foreign currency translation | | | | | | | | 90,601 | | | | 90,601 | |
Other comprehensive loss | | | | | | | | (865 | ) | | | (865 | ) |
Minimum pension liability | | | | | | | | (9,530 | ) | | | (9,530 | ) |
Comprehensive income | | | | | | | | | | | | 340,796 | |
Cash dividends declared | | | | | | (77,132 | ) | | | | | (77,132 | ) |
Stock options and awards | | 3,596 | | 161,262 | | | | | | (43 | ) | 164,815 | |
Reacquired shares | | | | | | | | | | (227,145 | ) | (227,145 | ) |
Stock dividend | | 154,738 | | (154,738 | ) | | | | | | | — | |
Balance December 31, 2003 | | 310,284 | | 459,974 | | 1,294,165 | | 4,098 | | (747,440 | ) | 1,321,081 | |
| | | | | | | | | | | | | |
Net income | | | | | | 282,693 | | | | | | 282,693 | |
Foreign currency translation | | | | | | | | 71,029 | | | | 71,029 | |
Other comprehensive loss | | | | | | | | (2,674 | ) | | | (2,674 | ) |
Minimum pension liability | | | | | | | | (293 | ) | | | (293 | ) |
Comprehensive income | | | | | | | | | | | | 350,755 | |
Cash dividends declared | | | | | | (84,410 | ) | | | | | (84,410 | ) |
Stock options and awards | | 3,624 | | 115,238 | | | | | | 118 | | 118,980 | |
Business acquisitions | | 1,835 | | 55,314 | | | | | | | | 57,149 | |
Reacquired shares | | | | | | | | | | (165,414 | ) | (165,414 | ) |
Balance December 31, 2004 | | 315,743 | | 630,526 | | 1,492,448 | | 72,160 | | (912,736 | ) | 1,598,141 | |
| | | | | | | | | | | | | |
Net income | | | | | | 319,481 | | | | | | 319,481 | |
Foreign currency translation | | | | | | | | (50,516 | ) | | | (50,516 | ) |
Other comprehensive income | | | | | | | | 4,365 | | | | 4,365 | |
Minimum pension liability | | | | | | | | (16,245 | ) | | | (16,245 | ) |
Comprehensive income | | | | | | | | | | | | 257,085 | |
Cash dividends declared | | | | | | (92,728 | ) | | | | | (92,728 | ) |
Stock options and awards | | 2,860 | | 96,902 | | | | | | 216 | | 99,978 | |
Reacquired shares | | | | | | | | | | (213,266 | ) | (213,266 | ) |
Balance December 31, 2005 | | $ | 318,603 | | $ | 727,428 | | $ | 1,719,201 | | $ | 9,764 | | $ | (1,125,786 | ) | $ | 1,649,210 | |
COMMON STOCK ACTIVITY
| | 2005 | | 2004 | | 2003 | |
| | Common | | Treasury | | Common | | Treasury | | Common | | Treasury | |
Year ended December 31 (shares) | | Stock | | Stock | | Stock | | Stock | | Stock | | Stock | |
| | | | | | | | | | | | | |
Shares, beginning of year | | 315,742,759 | | (58,200,908 | ) | 310,284,083 | | (52,867,561 | ) | 151,950,428 | | (22,010,334 | ) |
Stock options | | 2,859,946 | | 18,666 | | 3,623,917 | | 1,200 | | 3,595,961 | | | |
Stock awards, net issuances | | | | 34,689 | | | | 24,460 | | | | 12,241 | |
Business acquisitions | | | | | | 1,834,759 | | | | | | | |
Reacquired shares | | | | (6,312,247 | ) | | | (5,359,007 | ) | | | (6,666,861 | ) |
Stock dividends | | | | | | | | | | 154,737,694 | | (24,202,607 | ) |
Shares, end of year | | 318,602,705 | | (64,459,800 | ) | 315,742,759 | | (58,200,908 | ) | 310,284,083 | | (52,867,561 | ) |
The accompanying notes are an integral part of the consolidated financial statements.
34
Notes to Consolidated Financial Statements
1. NATURE OF BUSINESS
Ecolab Inc. (the “company”) develops and markets premium products and services for the hospitality, foodservice, healthcare and industrial markets. The company provides cleaning, sanitizing, pest elimination, maintenance and repair products and services primarily to hotels and restaurants, healthcare and educational facilities, quickservice (fast-food and convenience stores) units, grocery stores, commercial and institutional laundries, light industry, dairy plants and farms, food and beverage processors, pharmaceutical and cosmetic facilities, and the vehicle wash industry.
2. SUMMARY OF SIGNIFICANT ACCOUNTING POLICIES
PRINCIPLES OF CONSOLIDATION
The consolidated financial statements include the accounts of the company and all majority-owned subsidiaries. International subsidiaries are included in the financial statements on the basis of their November 30 fiscal year-ends to facilitate the timely inclusion of such entities in the company’s consolidated financial reporting. All intercompany transactions and profits are eliminated in consolidation.
USE OF ESTIMATES
The preparation of the company’s financial statements requires management to make certain estimates and assumptions that affect the reported amounts of assets and liabilities as of the date of the financial statements and the reported amounts of revenues and expenses during the reporting periods. Actual results could differ from these estimates.
FOREIGN CURRENCY TRANSLATION
Financial position and results of operations of the company’s international subsidiaries generally are measured using local currencies as the functional currency. Assets and liabilities of these operations are translated at the exchange rates in effect at each fiscal year end. The translation adjustments related to assets and liabilities that arise from the use of differing exchange rates from period to period are included in accumulated other comprehensive income (loss) in shareholders’ equity. The cumulative translation gain as of year-end 2005, 2004 and 2003 was $8,057,000, $87,093,000 and $16,064,000, respectively. Income statement accounts are translated at the average rates of exchange prevailing during the year. The different exchange rates from period to period impact the amount of reported income from the company’s international operations.
CASH AND CASH EQUIVALENTS
Cash equivalents include highly liquid investments with a maturity of three months or less when purchased.
SHORT-TERM INVESTMENTS
Short-term investments at December 31, 2005, consist solely of auction-rate debt securities classified as available-for-sale, which are stated at estimated fair value. All of these securities held by the company as of December 31, 2005, have auction reset periods of 35 days or less and the carrying value approximates market value given the short reset periods. No unrealized or realized gains or losses were recognized related to short-term investments during the year ended December 31, 2005.
ALLOWANCE FOR DOUBTFUL ACCOUNTS
The company estimates the balance of allowance for doubtful accounts by analyzing accounts receivable balances by age and applying historical write-off trend rates to the most recent 12 months’ sales, less actual write-offs to date. The company estimates include separately providing for specific customer balances when it is deemed probable that the balance is uncollectible. Account balances are charged off against the allowance when it is probable the receivable will not be recovered.
The company’s allowance for doubtful accounts balance includes an allowance for the expected return of products shipped, and credits related to pricing or quantities shipped of approximately $5 million, $6 million and $7 million as of December 31, 2005, 2004 and 2003, respectively. This returns and credit activity is recorded directly to sales.
The following table summarizes the activity in the allowance for doubtful accounts:
(thousands) | | 2005 | | 2004 | | 2003 | |
| | | | | | | |
Beginning balance | | $ | 44,199 | | $ | 44,011 | | $ | 35,995 | |
Bad debt expense | | 11,589 | | 14,278 | | 18,403 | |
Write-offs | | (14,743 | ) | (16,504 | ) | (14,056 | ) |
Other* | | (2,194 | ) | 2,414 | | 3,669 | |
Ending balance | | $ | 38,851 | | $ | 44,199 | | $ | 44,011 | |
* Other amounts are primarily the effects of changes in currency.
INVENTORY VALUATIONS
Inventories are valued at the lower of cost or market. Domestic chemical inventory costs are determined on a last-in, first-out (lifo) basis. Lifo inventories represented 32 percent, 30 percent and 29 percent of consolidated inventories at year-end 2005, 2004 and 2003, respectively. All other inventory costs are determined on a first-in, first-out (fifo) basis.
PROPERTY, PLANT AND EQUIPMENT
Property, plant and equipment are stated at cost. Merchandising equipment consists principally of various systems that dispense the company’s cleaning and sanitizing products and dishwashing machines. The dispensing systems are accounted for on a mass asset basis, whereby equipment is capitalized and depreciated as a group and written off when fully depreciated. Depreciation is charged to operations using the straight-line method over the assets’ estimated useful lives ranging from 5 to 50 years for buildings, 3 to 7 years for merchandising equipment, and 3 to 11 years for machinery and equipment.
Expenditures for repairs and maintenance are charged to expense as incurred. Expenditures for major renewals and betterments, which significantly extend the useful lives of existing plant and equipment, are capitalized and depreciated.
Upon retirement or disposition of plant and equipment, the cost and related accumulated depreciation are removed from the accounts and any resulting gain or loss is recognized in income.
GOODWILL AND OTHER INTANGIBLE ASSETS
Goodwill and other intangible assets arise principally from business acquisitions. Goodwill represents the excess of the purchase price over the fair value of identifiable net assets acquired. Other intangible assets primarily include customer relationships, trademarks, patents and other technology. The fair value of identifiable intangible assets is estimated based upon discounted future cash flow projections. Other intangible assets are amortized on a straight-line basis over their estimated economic lives. The weighted-average useful life of other intangible assets was 14 years, 13 years and 12 years as of December 31, 2005, 2004 and 2003, respectively.
35
The weighted-average useful life by type of asset at December 31, 2005 is as follows:
| | Number of Years | |
Customer relationships | | 11 | |
Intellectual property | | 15 | |
Trademarks | | 20 | |
Other | | 7 | |
The straight-line method of amortization reflects an appropriate allocation of the cost of the intangible assets to earnings in proportion to the amount of economic benefits obtained by the company in each reporting period. Total amortization expense related to other intangible assets during the years ended December 31, 2005, 2004 and 2003 was approximately $23.5 million, $21.7 million and $21.2 million, respectively. As of December 31, 2005, future estimated amortization expense related to amortizable other identifiable intangible assets will be:
(thousands) | | | |
2006 | | $ | 23,271 | |
2007 | | 22,980 | |
2008 | | 22,706 | |
2009 | | 21,475 | |
2010 | | 20,629 | |
| | | | |
The company tests goodwill for impairment on an annual basis for all reporting units, including businesses currently reporting losses such as GCS Service. Generally, the company’s reporting units are its operating segments. An impairment charge is recognized for the amount, if any, by which the carrying amount of goodwill exceeds its implied fair value. Fair values of reporting units are established using a discounted cash flow method. Where available and as appropriate comparative market multiples are used to corroborate the results of the discounted cash flow method. Based on the company’s testing in 2005, 2004 and 2003, there has been no impairment of goodwill during these years. The company performs its annual goodwill impairment test during the second quarter. If circumstances change significantly within a reporting unit, the company would also test a reporting unit for impairment prior to the annual test.
LONG-LIVED ASSETS
The company periodically reviews its long-lived assets for impairment and assesses whether significant events or changes in business circumstances indicate that the carrying value of the assets may not be recoverable. An impairment loss may be recognized when the carrying amount of an asset exceeds the anticipated future undiscounted cash flows expected to result from the use of the asset and its eventual disposition. The amount of the impairment loss to be recorded, if any, is calculated by the excess of the asset’s carrying value over its fair value.
REVENUE RECOGNITION
The company recognizes revenue as services are performed or on product sales at the time title to the product and risk of loss transfers to the customer. The company’s sales policies do not provide for general rights of return and do not contain customer acceptance clauses. Trade accounts receivable are recorded at the invoiced amount and generally do not bear interest. The company records estimated reductions to revenue for customer programs and incentive offerings, including pricing arrangements, promotions and other volume-based incentives at the time the sale is recorded. The company also records estimated reserves for anticipated uncollectible accounts and for product returns and credits at the time of sale.
NET INCOME PER COMMON SHARE
The computations of the basic and diluted net income per share amounts were as follows:
(thousands, except per share) | | 2005 | | 2004 | | 2003 | |
| | | | | | | |
Net income | | $ | 319,481 | | $ | 282,693 | | $ | 260,590 | |
Weighted-average common shares outstanding | | | | | | | |
Basic | | 255,741 | | 257,575 | | 259,454 | |
Effect of dilutive stock options and awards | | 4,357 | | 2,832 | | 3,283 | |
Diluted | | 260,098 | | 260,407 | | 262,737 | |
Net income per common share | | | | | | | |
Basic | | $ | 1.25 | | $ | 1.10 | | $ | 1.00 | |
Diluted | | $ | 1.23 | | $ | 1.09 | | $ | 0.99 | |
Restricted stock awards of 22,175 shares for 2005, 62,300 shares for 2004 and 52,800 shares for 2003 were excluded from the computation of basic weighted-average shares outstanding because such shares were not yet vested at those dates.
Stock options to purchase approximately 7.1 million shares for 2005, 4.2 million shares for 2004 and 4.3 million shares for 2003 were not dilutive and, therefore, were not included in the computations of diluted common shares outstanding.
SHARE-BASED COMPENSATION
In December 2004, the Financial Accounting Standards Board (FASB) issued Statement of Financial Accounting Standards No. 123 (Revised 2004), “Share-Based Payment” (“SFAS No. 123R”). SFAS No. 123R eliminates accounting for share-based compensation transactions using the intrinsic value method prescribed in APB Opinion No. 25, “Accounting for Stock Issued to Employees,” and requires instead that such transactions be accounted for using a fair-value based approach.
Effective October 1, 2005, the company early-adopted SFAS No. 123R under the modified retrospective application method. SFAS No. 123R requires the company to measure compensation expense for share-based awards at fair value at the date of grant and recognize compensation expense over the service period for awards expected to vest. As part of the transition to the new standard, all prior period financial statements have been restated to recognize share-based compensation expense historically reported in the notes to the consolidated financial statements.
The effect of the change on current year results and previously reported amounts is:
| | Increase (Decrease) | |
(thousands, except per share) | | 2005 | | 2004 | | 2003 | |
Income before income taxes | | $ | (38,708 | ) | $ | (44,232 | ) | $ | (27,649 | ) |
Net income | | (24,488 | ) | (27,795 | ) | (16,758 | ) |
Net income per common share | | | | | | | |
Basic | | (0.10 | ) | (0.11 | ) | (0.07 | ) |
Diluted | | (0.10 | ) | (0.10 | ) | (0.07 | ) |
| | | | | | | |
Cash provided by operating activities | | (11,682 | ) | (11,556 | ) | (5,267 | ) |
Cash used for financing activities | | 11,682 | | 11,556 | | 5,267 | |
| | | | | | | | | | |
36
The beginning balances for 2003 have been restated as follows to recognize compensation expense for fiscal years 1995 through 2002, previously reported in the notes to the consolidated financial statements:
| | Other | | Additional | | | | | |
| | Liabilities | | Paid-in | | Retained | | Deferred | |
(thousands) | | (Non-current) | | Capital | | Earnings | | Compensation | |
Previously reported as of December 31, 2002 | | $ | 164,989 | | $ | 386,208 | | $ | 1,159,663 | | $ | (1,710 | ) |
Adjustment for change in accounting | | (19,996 | )* | 67,242 | | (48,956 | ) | 1,710 | |
As adjusted | | $ | 144,993 | | $ | 453,450 | | $ | 1,110,707 | | $ | — | |
*Non-current deferred tax liability
Effective with the company’s adoption of SFAS No. 123R, new stock option grants to retirement eligible recipients will be attributed to expense using the non-substantive vesting method and expensed at the time recipients attain age 55 with at least 5 years of service. If the company had used the non-substantive vesting method during all periods, net income for 2005, 2004 and 2003 would have been increased by approximately $2.5 million, $5.2 million and $0.4 million, respectively. In addition, the company previously accounted for forfeitures when they occurred. Commencing at the date of adoption, the company includes a forfeiture estimate in the amount of compensation expense being recognized. This change from the company’s historical practice of recognizing forfeitures as they occur did not result in the recognition of any cumulative adjustment to income. The company has used the actual tax effects of stock options and the transition guidance prescribed within SFAS No. 123R for establishing the pool of excess tax benefits (APIC pool).
COMPREHENSIVE INCOME
Comprehensive income includes net income, foreign currency translation adjustments, minimum pension liabilities, gains and losses on derivative instruments designated and effective as cash flow hedges and nonderivative instruments designated and effective as foreign currency net investment hedges that are charged or credited to the accumulated other comprehensive income (loss) account in shareholders’ equity.
DERIVATIVE INSTRUMENTS AND HEDGING ACTIVITIES
The company uses foreign currency forward contracts, interest rate swaps and foreign currency debt to manage risks generally associated with foreign exchange rates, interest rates and net investments in foreign operations. The company does not hold derivative financial instruments of a speculative nature. On the date that the company enters into a derivative contract, it designates the derivative as (1) a hedge of (a) the fair value of a recognized asset or liability or (b) an unrecognized firm commitment (a “fair value” hedge), (2) a hedge of (a) a forecasted transaction or (b) the variability of cash flows that are to be received or paid in connection with a recognized asset or liability (a “cash flow” hedge); or (3) a foreign currency fair-value or cash flow hedge (a “foreign currency” hedge). The company formally documents all relationships between hedging instruments and hedged items, as well as its risk-management objective and strategy for undertaking various hedge transactions. The company also formally assesses (both at the hedge’s inception and on an ongoing basis) whether the derivatives that are used in hedging transactions have been highly effective in offsetting changes in the fair value or cash flows of hedged items and whether those derivatives may be expected to remain highly effective in future periods. When it is determined that a derivative is not (or has ceased to be) highly effective as a hedge, the company will discontinue hedge accounting prospectively. The company believes that on an ongoing basis its portfolio of derivative instruments will generally be highly effective as hedges. Hedge ineffectiveness during the years ended December 31, 2005, 2004 and 2003 was not significant.
All of the company’s derivatives are recognized on the balance sheet at their fair value. The earnings impact resulting from the change in fair value of the derivative instruments is recorded in the same line item in the consolidated statement of income as the underlying exposure being hedged.
NEW ACCOUNTING PRONOUNCEMENTS
In December 2004, the FASB issued SFAS No. 123 (Revised 2004) “Share-Based Payment” (“SFAS No. 123R”). The Securities and Exchange Commission (SEC) staff issued Staff Accounting Bulletin No. 107 (SAB 107) in March 2005 to assist preparers by simplifying some of the implementation challenges of SFAS No. 123R while enhancing the information investors receive. The FASB has also issued various Staff Positions clarifying certain provisions of the new accounting standard. SFAS No. 123R addresses all forms of share-based payment awards, including shares issued under employee stock purchase plans, stock options, restricted stock and stock appreciation rights. SFAS No. 123R requires the company to expense share-based payment awards with compensation cost measured at the fair value of the award. In addition, SFAS No. 123R requires the benefits of tax deductions in excess of recognized compensation cost to be reported as a financing cash flow, rather than an operating cash flow. Effective October 1, 2005, the company early-adopted SFAS No. 123R under the modified retrospective application method in transitioning to the new standard. This method permits the company to apply the new accounting requirements on a retroactive basis. All prior period financial statements have been restated to recognize share-based compensation expense historically reported in the notes to the consolidated financial statements.
In December 2004, the FASB issued a FASB Staff Position (“FSP”) titled “Application of FASB Statement No. 109, Accounting for Income Taxes to the Tax Deduction on Qualified Production Activities Provided by the American Jobs Creation Act of 2004” (the “Act”) (“FSP 109-1”). Under the guidance in FSP 109-1, the deduction received under the provisions of the Act will be treated as a “special deduction” as described in SFAS No. 109. As such, the special deduction has no effect on deferred tax assets and liabilities existing at the enactment date. Rather, the impact of this deduction will be reported in the period in which the deduction is claimed on the company’s tax return. The company began including a modest benefit from this deduction in tax expense beginning in 2005.
In December 2004, the FASB issued an FSP titled “Accounting and Disclosure Guidance for the Foreign Earnings Repatriation Provision within the American Jobs Creation Act of 2004” (“FSP 109-2”). FSP 109-2 allowed the company time beyond the fourth quarter of 2004, the period of enactment, to evaluate the effect of the Act on its plans for reinvestment or repatriation of foreign earnings for purposes of applying SFAS No. 109. The Act includes a deduction for 85 percent of certain foreign earnings that are repatriated, as defined in the Act, at an effective tax cost of 5.25 percent on any such repatriated foreign earnings. Companies may elect to apply this provision to qualifying earnings repatriations in 2005. This Act provides the company the opportunity to tax efficiently repatriate foreign earnings for U.S. qualifying investments specified in a domestic reinvestment plan. In the fourth quarter of 2005 the company completed its evaluation for the reinvestment of foreign earnings in the United States pursuant to the provisions of the Act. As a result, the company repatriated $223 million of foreign earnings to the U.S. and recorded tax expense of $3.1 million, net of available foreign tax credits, in the fourth quarter of 2005.
In July 2005, the FASB issued a proposed interpretation titled
37
“Accounting for Uncertain Tax Positions, an interpretation of FASB Statement No. 109.” This proposed interpretation would clarify the accounting for uncertain tax positions in accordance with SFAS No. 109, “Accounting for Income Taxes.” The company would be required to recognize, in its financial statements, the best estimate of the impact of a tax position only if that position is probable of being sustained on audit based solely on the technical merits of the position. The proposed interpretation also would provide guidance on disclosure, accrual of interest and penalties, accounting in interim periods, and transition. The FASB plans to finalize the guidance during the first quarter of 2006. The cumulative effect of initially applying this proposed interpretation would be recognized as a change in accounting principle as of the end of the period in which this proposed interpretation is adopted.
No other new accounting pronouncement issued or effective during the fiscal year has had or is expected to have a material impact on the company’s consolidated financial statements.
3. SPECIAL CHARGES
In the first quarter of 2002, management approved plans to undertake restructuring and cost saving actions during 2002, including costs related to the integration of the company’s European operations. These actions included global workforce reductions, facility closings and product line discontinuations. As a result, the company recorded restructuring expense of $47.8 million ($29.9 million after tax) for the year ended December 31, 2002. These actions were substantially completed by December 31, 2003. Remaining amounts accrued at December 31, 2003 and through December 31, 2004, primarily represented contractual periodic payments to be made over time. At December 31, 2004, the accrued restructuring liabilities were satisfied.
Restructuring liabilities are classified as a component of other current liabilities.
During 2004 and 2003, restructuring activity includes the reversal of $927,000 and $1,359,000, respectively, of previously accrued severance and other costs as project expenses were favorable to previous estimates. Of this amount, for 2004 and 2003, $106,000 and $76,000, respectively, is included as a component of cost of sales and $821,000 and $1,283,000, respectively, is included as a component of “special charges”.
Also included in “special charges” for 2004 is a charge of $1.6 million of in-process research and development related to the Alcide acquisition, a loss of $4.0 million ($2.4 million after tax) on the disposal of a grease management product line and a gain of $0.3 million ($0.2 million after tax) on the disposal of a small international business. For 2003, “special charges” also includes a write-off of $1.7 million of goodwill related to an international business.
For segment reporting purposes, each of these items has been included in the company’s corporate segment, which is consistent with the company’s internal management reporting. Changes to the restructuring liability accounts included the following:
| | Employee | | | | | | | |
| | Termination | | Assets | | | | | |
(thousands) | | Benefits | | Disposals | | Other | | Total | |
Restructuring liability, December 31, 2002 | | $ | 20,333 | | $ | 0 | | $ | 3,510 | | $ | 23,843 | |
Cash payments | | (16,770 | ) | | | (2,471 | ) | (19,241 | ) |
Non-cash credits | | | | 7 | | | | 7 | |
Revisions to prior estimates | | (1,352 | ) | (7 | ) | | | (1,359 | ) |
Effect of foreign currency translation | | 1,222 | | | | 670 | | 1,892 | |
Restructuring liability, December 31, 2003 | | 3,433 | | 0 | | 1,709 | | 5,142 | |
Cash payments | | (3,130 | ) | | | (1,374 | ) | (4,504 | ) |
Revisions to prior estimates | | (490 | ) | | | (437 | ) | (927 | ) |
Effect of foreign currency translation | | 187 | | | | 102 | | 289 | |
Restructuring liability, December 31, 2004 | | $ | 0 | | $ | 0 | | $ | 0 | | $ | 0 | |
4. RELATED PARTY TRANSACTIONS
Henkel KGaA (“Henkel”) beneficially owned 72.7 million shares, or approximately 28.6 percent, of the company’s outstanding common stock on December 31, 2005. Under a stockholders’ agreement between the company and Henkel, Henkel is permitted ownership in the company of up to 35 percent of the company’s outstanding common stock. Henkel is also entitled to proportionate representation on the company’s board of directors.
In 2005, 2004 and 2003, the company and its affiliates sold products and services in the aggregate amounts of $3,574,000, $3,222,000 and $3,426,000, respectively, to Henkel or its affiliates, and purchased products and services in the amounts of $65,279,000, $70,946,000 and $71,265,000, respectively, from Henkel or its affiliates. The transactions with Henkel and its affiliates were made in the ordinary course of business and were negotiated at arm’s length.
38
5. BUSINESS ACQUISITIONS AND DISPOSITIONS
BUSINESS ACQUISITIONS
Business acquisitions made by the company during 2005, 2004 and 2003 were as follows:
| | | | | | Estimated | |
| | | | | | Annual Sales | |
Busines | | Date of | | | | Prior to | |
Acquired | | Acquisition | | Segment | | Acquisition | |
| | | | | | (millions)
(unaudited) | |
2005 | | | | | | | |
Associated Chemicals & Services, Inc. | | Jan. 2005 | | U.S. C&S | | $ | 16 | |
(Aka Midland Research) | | | | (Water Care) | | | |
YSC Chemical Company | | Feb. 2005 | | International | | 3 | |
| | | | (Asia Pacific Professional Products) | | | |
Kilco Chemicals Ltd. | | Apr. 2005 | | International | | 5 | |
| | | | (Europe Food & Beverage) | | | |
2004 | | | | | | | |
Nigiko | | Jan. 2004 | | International | | 55 | |
| | | | (Europe Pest Elimination) | | | |
Daydots International | | Feb. 2004 | | U.S. C&S | | 22 | |
| | | | (Institutional) | | | |
Elimco | | May 2004 | | International | | 4 | |
| | | | (Europe Pest Elimination) | | | |
Restoration and Maintenance unit of VIC International | | June 2004 | | U.S. C&S | | 5 | |
| | | | (Professional Products) | | | |
Alcide Corporation | | July 2004 | | U.S. C&S | | 24 | |
| | | | (Food & Beverage) | | | |
2003 | | | | | | | |
Adams Healthcare | | Dec. 2002 | | International | | 19 | |
| | | | (Europe Healthcare) | | | |
| | | | | | | | |
The total cash consideration paid by the company for acquisitions and investments in affiliates was approximately
$27 million, $130 million and $32 million for 2005, 2004 and 2003, respectively. In addition, 1,834,759 shares of common stock were issued with a market value of $57 million in the Alcide acquisition in 2004, plus $23,000 of cash in lieu of fractional shares. Total cash paid in 2004 and 2003 also includes payments of restructuring costs related to the acquisition of the remaining 50 percent interest of the former Henkel-Ecolab joint venture that were accrued in 2002. The aggregate purchase price has been reduced for any cash or cash equivalents acquired with the acquisitions.
These acquisitions have been accounted for as purchases and, accordingly, the results of their operations have been included in the financial statements of the company from the dates of acquisition. Net sales and operating income of these businesses were not significant to the company’s consolidated results of operations, financial position and cash flows.
Based upon purchase price allocations, the components of the aggregate purchase prices of the acquisitions made were as follows:
(millions) | | 2005 | | 2004 | | 2003 | |
Net tangible assets acquired | | $ | | $ | 14 | | $ | 18 | |
Identifiable intangible assets | | 8 | | 44 | | 13 | |
In-process research and development | | | | 2 | | | |
Goodwill | | 19 | | 127 | | 1 | |
Purchase price | | $ | 27 | | $ | 187 | | $ | 32 | |
| | | | | | | | | | |
The allocation of purchase price includes adjustments to preliminary allocations from prior periods, if any. During 2004, the company recorded a charge of $1.6 million for in-process research and development (“IPR&D”) as part of the allocation of purchase price in the Alcide acquisition. The value assigned to IPR&D is based on an independent appraiser’s valuation and was determined by identifying research projects in areas for which technological feasibility had not been established and no alternative uses for the technology existed. The values were determined by estimating the discounted amount of after-tax cash flows attributable to these projects. The future cash flows were discounted to present value utilizing a risk-adjusted rate of return that considered the uncertainty surrounding the successful development of the IPR&D.
The changes in the carrying amount of goodwill for each of the company’s reportable segments for the years ended December 31, 2005, 2004 and 2003 are as follows:
| | United States | | | | | |
| | | | | | Total | | | | | |
| | Cleaning & | | Other | | United | | | | | |
(thousands) | | Sanitizing | | Services | | States | | International | | Consolidated | |
| | | | | | | | | | | |
Balance December 31, 2002 | | $ | 121,979 | | $ | 49,306 | | $ | 171,285 | | $ | 524,415 | | $ | 695,700 | |
Goodwill acquired during year* | | 367 | | (377 | ) | (10 | ) | 825 | | 815 | |
Goodwill allocated to business dispositions | | | | | | | | (2,708 | ) | (2,708 | ) |
Foreign currency translation | | | | | | | | 103,404 | | 103,404 | |
Balance December 31, 2003 | | 122,346 | | 48,929 | | 171,275 | | 625,936 | | 797,211 | |
Goodwill acquired during year* | | 54,936 | | | | 54,936 | | 72,270 | | 127,206 | |
Goodwill allocated to business dispositions | | (69 | ) | | | (69 | ) | (25 | ) | (94 | ) |
Foreign currency translation | | | | | | | | 67,488 | | 67,488 | |
Balance December 31, 2004 | | 177,213 | | 48,929 | | 226,142 | | 765,669 | | 991,811 | |
Goodwill acquired during year* | | 13,234 | | | | 13,234 | | 6,162 | | 19,396 | |
Goodwill allocated to business dispositions | | (130 | ) | | | (130 | ) | (376 | ) | (506 | ) |
Foreign currency translation | | | | | | | | (73,682 | ) | (73,682 | ) |
Balance December 31,2005 | | $ | 190,317 | | $ | 48,929 | | $ | 239,246 | | $ | 697,773 | | $ | 937,019 | |
* For 2005 and 2004, goodwill related to businesses acquired of $3.5 million and $92.8 million, respectively, is expected to be tax deductible. All of the goodwill related to businesses acquired in 2003 is expected to be tax deductible. Goodwill acquired in 2005, 2004 and 2003 also includes adjustments to prior year acquisitions. United States Other Services goodwill acquired during 2003 includes a reduction of $0.4 million for an adjustment related to the Audits International acquisition. International goodwill acquired during 2003 includes a reduction of $4.7 million for the Terminix acquisition primarily related to a finalization of the pension valuation at the date of acquisition.
39
BUSINESS DISPOSITIONS
The company had no significant business dispositions in 2005. In April 2004, the company sold its grease management product line to National Fire Services of Gurnee, Illinois. This sale resulted in a loss of approximately $4.0 million ($2.4 million after tax). Sales of the grease management product line totaled approximately $20 million in 2003 and were included in the company’s U.S. Cleaning & Sanitizing operations. The company also recognized a gain of $0.3 million ($0.2 million after tax) on the sale of a small Hygiene Services business in its International operations.
In December 2002, the company sold its Darenas janitorial products distribution business based in Birmingham, United Kingdom. This sale resulted in a loss of approximately $1.7 million principally due to the amount of goodwill allocated to the disposed business. The annualized sales of this entity were approximately $30 million. In June 2003, the company sold its minority interest investment in Comac S.p.A., a floor care machine manufacturing company based in Verona, Italy, for a gain of approximately $11.1 million ($6.7 million after tax). The company accounted for this investment under the equity method of accounting. In September 2003, the company sold the consumer dermatology business of the Adams Healthcare business at a nominal gain. Goodwill allocated to the sale of the dermatology business was approximately $1.0 million. The annualized sales of the dermatology business that was sold were approximately $2.5 million. These operations and investment were a part of the company’s International segment.
6. BALANCE SHEET INFORMATION
December 31 (thousands) | | 2005 | | 2004 | | 2003 | |
Accounts Receivable, Net | | | | | | | |
Accounts receivable | | $ | 782,371 | | $ | 782,465 | | $ | 670,013 | |
Allowance for doubtful accounts | | (38,851 | ) | (44,199 | ) | (44,011 | ) |
Total | | $ | 743,520 | | $ | 738,266 | | $ | 626,002 | |
Inventories | | | | | | | |
Finished goods | | $ | 177,574 | | $ | 167,787 | | $ | 159,633 | |
Raw materials and parts | | 161,488 | | 176,336 | | 152,127 | |
Excess of fifo cost over lifo cost | | (13,488 | ) | (5,520 | ) | (1,801 | ) |
Total | | $ | 325,574 | | $ | 338,603 | | $ | 309,959 | |
Property, Plant and Property, Plant and Equipment, Net | | | | | | | |
Land | | $ | 32,164 | | $ | 34,469 | | $ | 26,921 | |
Buildings and leaseholds | | 283,487 | | 272,931 | | 243,795 | |
Machinery and equipment | | 617,408 | | 639,046 | | 589,620 | |
Merchandising equipment | | 1,072,853 | | 1,065,482 | | 949,553 | |
Construction in progress | | 32,426 | | 37,106 | | 21,488 | |
| | 2,038,338 | | 2,049,034 | | 1,831,377 | |
Accumulated depreciation and amortization | | (1,202,835 | ) | (1,214,304 | ) | (1,094,580 | ) |
Total | | $ | 835,503 | | $ | 834,730 | | $ | 736,797 | |
Other Intangible Assets, Net | | | | | | | |
Cost | | | | | | | |
Customer relationships | | $ | 176,778 | | $ | 189,572 | | $ | 153,479 | |
Intellectual property | | 41,887 | | 38,130 | | 77,793 | |
Trademarks | | 63,933 | | 62,874 | | 52,283 | |
Other intangibles | | 7,459 | | 17,104 | | 16,012 | |
| | 290,057 | | 307,680 | | 299,567 | |
Accumulated amortization | | | | | | | |
Customer relationships | | (55,328 | ) | (43,798 | ) | (27,565 | ) |
Intellectual property | | (9,901 | ) | (7,726 | ) | (45,809 | ) |
Trademarks | | (16,523 | ) | (12,764 | ) | (9,313 | ) |
Other intangibles | | (5,369 | ) | (14,297 | ) | (13,021 | ) |
Total | | $ | 202,936 | | $ | 229,095 | | $ | 203,859 | |
Other Assets, Net | | | | | | | |
Deferred income taxes | | $ | 42,618 | | $ | 49,478 | | $ | 43,168 | |
Pension | | 201,078 | | 170,625 | | 161,098 | |
Other | | 155,808 | | 161,369 | | 136,445 | |
Total | | $ | 399,504 | | $ | 381,472 | | $ | 340,711 | |
Short-Term Debt | | | | | | | |
Notes payable | | $ | 146,725 | | $ | 50,980 | | $ | 66,250 | |
Long-term debt, current maturities | | 80,202 | | 5,152 | | 3,953 | |
Total | | $ | 226,927 | | $ | 56,132 | | $ | 70,203 | |
Other Current Liabilities | | | | | | | |
Discounts and rebates | | $ | 152,774 | | $ | 154,957 | | $ | 145,508 | |
Other | | 208,307 | | 204,332 | | 173,729 | |
Total | | $ | 361,081 | | $ | 359,289 | | $ | 319,237 | |
Long-Term Debt | | | | | | | |
6.875% notes, due 2011 | | $ | 149,356 | | $ | 149,228 | | $ | 149,101 | |
5.375% Euronotes, due 2007 | | 355,246 | | 404,716 | | 364,399 | |
7.19% senior notes, due 2006 | | 74,673 | | 74,715 | | 75,017 | |
Other | | 20,301 | | 21,938 | | 19,877 | |
| | 599,576 | | 650,597 | | 608,394 | |
Long-term debt, current maturities | | (80,202 | ) | (5,152 | ) | (3,953 | ) |
Total | | $ | 519,374 | | $ | 645,445 | | $ | 604,441 | |
The company has a $450 million multicurrency credit agreement with a consortium of banks that has a term through August 2009. Under certain circumstances, this credit agreement can be increased by $150 million for a total of $600 million. The company may borrow varying amounts in different currencies from time to time on a revolving credit basis. The company has the option of borrowing based
40
on various short-term interest rates. This agreement includes a covenant regarding the ratio of total debt to capitalization. No amounts were outstanding under these agreements at year-end 2005, 2004 and 2003.
The multicurrency credit agreement supports the company’s $450 million U.S. commercial paper program and its $200 million European commercial paper program. The company had $8.8 million in outstanding U.S. commercial paper at December 31, 2004, with an average annual interest rate of 1.2 percent. There was no U.S. commercial paper outstanding at December 31, 2005 and 2003. The company had $88.2 million in outstanding European commercial paper at December 31, 2005, with an average annual interest rate of 2.4 percent. The company had no commercial paper outstanding under its European commercial paper program at December 31, 2004 and 2003. Both programs were rated A-1 by Standard & Poor’s and P-1 by Moody’s as of December 31, 2005.
In December 2004, the company terminated a third commercial paper program, its 200 million Australian dollar commercial paper program. The company had 50.0 million of Australian dollar denominated commercial paper outstanding at December 31, 2003 (in U.S. dollars, approximately $36 million), with an annual interest rate of 5.1 percent.
In February 2002, the company issued euro 300 million ($265.9 million at rates prevailing at that time) of 5.375 percent Euronotes, due February 2007. As described further in Note 7, the company accounts for the transaction gains and losses related to the Euronotes as a component of the cumulative translation account within accumulated other comprehensive income (loss). The company expects to refinance the Euronotes before they become due in 2007.
In January 2006, the company repaid the $75 million 7.19% senior notes when they became due.
As of December 31, the weighted-average interest rate on notes payable was 3.9 percent in 2005, 5.7 percent in 2004 and 6.3 percent in 2003.
As of December 31, 2005, the aggregate annual maturities of long-term debt for the next five years were: 2006 - $80,202,000; 2007 - $359,813,000; 2008 - $2,621,000, 2009 - $1,429,000 and 2010 - $910,000.
Interest expense was $49,796,000 in 2005, $48,479,000 in 2004 and $49,342,000 in 2003. Interest income was $5,558,000 in 2005, $3,135,000 in 2004 and $3,997,000 in 2003. Total interest paid was $49,407,000 in 2005, $47,014,000 in 2004 and $47,428,000 in 2003.
7. FINANCIAL INSTRUMENTS
FOREIGN CURRENCY FORWARD CONTRACTS
The company has entered into foreign currency forward contracts to hedge transactions related to intercompany debt, subsidiary royalties, product purchases, firm commitments and other intercompany transactions. The company uses these contracts to hedge against the effect of foreign currency exchange rate fluctuations on forecasted cash flows. These contracts generally relate to the company’s European operations and are denominated in euros. The company had foreign currency forward exchange contracts that totaled approximately $395 million at December 31, 2005, $239 million at December 31, 2004 and $239 million at December 31, 2003. These contracts generally expire within one year. The gains and losses related to these contracts were included as a component of other comprehensive income until the hedged item is reflected in earnings. As of December 31, 2005, other comprehensive income includes a cumulative gain of $0.3 million related to these contracts.
INTEREST RATE SWAP AGREEMENTS
The company enters into interest rate swap agreements to manage interest rate exposures and to achieve a desired proportion of variable and fixed rate debt.
In 2003, the company entered into an interest rate swap agreement that converted $30 million of the 7.19% senior notes from a fixed interest rate to a floating or variable interest rate. This agreement expired in January 2006. The interest rate swap was designated as a fair value hedge and had an insignificant value as of December 31, 2005. The mark to market gain on this agreement has been recorded as part of interest expense and has been offset by the mark to market on this portion of the 7.19% senior notes.
During 2002, the company entered into an interest rate swap agreement in connection with the issuance of its Euronotes. This agreement converts approximately euro 78 million (approximately $92 million at year-end 2005) of the Euronote debt from a fixed interest rate to a floating or variable interest rate and is effective until February 2007. This interest rate swap was designated as a fair value hedge and had a value of $4.0 million, $7.0 million and $6.4 million as of December 31, 2005, 2004 and 2003, respectively. The mark to market gain on this agreement has been recorded as part of interest expense and has been offset by the loss recorded in interest expense on the mark to market on this portion of the Euronotes. There is no hedge ineffectiveness on this interest rate swap.
The company also had an interest rate swap agreement to provide for a fixed rate of interest on the first 50 million Australian dollars of Australian floating-rate debt. This agreement expired in November 2004 and had a fixed annual pay rate of approximately 6 percent. This interest rate swap agreement was designated as, and effective as, a cash flow hedge of the outstanding debt. The change in fair value of the interest rate swap was recorded in other comprehensive income and recognized in earnings as part of interest expense to offset the forecasted hedged transactions as they occurred.
NET INVESTMENT HEDGES
In February 2002, the company issued euro 300 million of 5.375 percent Euronotes, due 2007. The company designated all euro 300 million at year-end 2005 and 2004 and euro 290 million at year-end 2003 of this Euronote debt as a hedge of existing foreign currency exposures related to net investments the company has in certain European subsidiaries. Accordingly, the transaction gains and losses on this portion of the Euronotes that are designated and effective as hedges of the company’s net investments have been included as a component of the cumulative translation account within accumulated other comprehensive income (loss). Total transaction gains and losses related to the Euronotes and charged to this shareholders’ equity account were a gain of $45.7 million for the year ended December 31, 2005 and losses of $39.6 million and $52.5 million for the years ended December 31, 2004, and 2003, respectively. Transaction gains and losses on any remaining portion of the Euronotes have been included in earnings and were offset by transaction gains and losses related to other euro denominated assets held by the company’s U.S. operations.
CREDIT RISK
The company is exposed to credit loss in the event of nonperformance of counterparties for foreign currency forward exchange contracts and interest rate swap agreements. The company monitors its exposure to credit risk by using credit approvals and credit limits and selecting major international banks and financial institutions as counterparties. The company does not anticipate nonperformance by any of these counterparties.
41
FAIR VALUE OF OTHER FINANCIAL INSTRUMENTS
The carrying amount and the estimated fair value of other financial instruments held by the company were:
December 31 (thousands) | | 2005 | | 2004 | | 2003 | |
| | | | | | | |
Carrying amount | | | | | | | |
Cash and cash equivalents | | $ | 104,378 | | $ | 71,231 | | $ | 85,626 | |
Short-term investments | | 125,063 | | | | | |
Accounts receivable | | 743,520 | | 738,266 | | 626,002 | |
Notes payable | | 58,525 | | 42,180 | | 30,050 | |
Commercial paper | | 88,200 | | 8,800 | | 36,200 | |
Long-term debt (including current maturities) | | 599,576 | | 650,597 | | 608,394 | |
Fair value | | | | | | | |
Long-term debt (including current maturities) | | $ | 623,040 | | $ | 690,066 | | $ | 656,576 | |
The carrying amounts of cash equivalents, short-term investments, accounts receivable, notes payable and commercial paper approximate fair value because of their short maturities.
The fair value of long-term debt is based on quoted market prices for the same or similar debt instruments.
8. SHAREHOLDERS’ EQUITY
The company’s common stock was split two-for-one in the form of a 100 percent stock dividend paid June 6, 2003 to shareholders of record on May 23, 2003. All per share data have been adjusted to reflect the stock split.
Authorized common stock, par value $1.00 per share, was 400 million shares in 2005, 2004 and 2003. Treasury stock is stated at cost. Dividends declared per share of common stock were $0.3625 for 2005, $0.3275 for 2004 and $0.2975 for 2003.
The company has 15 million shares, without par value, of authorized but unissued preferred stock. Of these 15 million shares, 1 million shares were designated as Series A Junior Participating Preferred Stock and 14 million shares were undesignated. In February 2006, the company’s board of directors authorized the renewal of the company’s shareholder rights plan and, in connection therewith, a decrease in the number of designated Series A Junior Participating Preferred Stock from 1 million to 400 thousand shares.
Under the company’s renewed shareholder rights plan, one preferred stock purchase right is issued for each outstanding share of the company’s common stock. A right entitles the holder, upon occurrence of certain events, to buy one one-thousandth of a share of Series A Junior Participating Preferred Stock at a purchase price of $135, subject to adjustment. The rights, however, do not become exercisable unless and until, among other things, any person or group acquires 15 percent or more of the outstanding common stock of the company, or the company’s board of directors declares a holder of 10 percent or more of the outstanding common stock to be an “adverse person” as defined in the rights plan. Upon the occurrence of either of these events, the rights will become exercisable for common stock of the company (or in certain cases common stock of an acquiring company) having a market value of twice the exercise price of a right. The rights provide that the holdings by Henkel KGaA or its affiliates at the time of the renewal of the rights plan, subject to compliance by Henkel with certain conditions, will not cause the rights to become exercisable nor cause Henkel to be an “adverse person.” The rights are redeemable under certain circumstances at one cent per right and, unless redeemed earlier, will expire on March 10, 2016.
The company reacquired 5,974,300 shares of its common stock in 2005, 4,581,400 shares of its common stock in 2004 and 6,218,000 shares in 2003 through open and private market purchases. The equivalent number of shares reacquired on a post stock-split basis was 8,014,500 in 2003. The company also reacquired 337,947 shares and 777,607 shares of its common stock in 2005 and 2004, respectively, related to the exercise of stock options and the vesting of stock awards. On a pre-split basis, the company reacquired 448,861 shares of its common stock in 2003 related to the exercise of stock options and the vesting of stock awards. In October 2003, the company’s Board of Directors authorized the repurchase of up to 10 million shares of the company’s common stock. This authorization was concluded during the quarter ended December 31, 2005. In December 2004, the company’s Board of Directors authorized the repurchase of up to 10 million additional shares of common stock, including shares to be repurchased under Rule
10b5-1. Shares are repurchased to offset the dilutive effect of stock options and incentives and for general corporate purposes. As of December 31, 2005, 9,801,400 shares remained to be purchased under the company’s repurchase authority. The company intends to repurchase all shares under this authorization, for which no expiration date has been established, in open market or privately negotiated transactions, subject to market conditions.
The company expects to repurchase at least 3.5 million shares during 2006 to offset the dilutive effect of stock options, based on estimates of stock option exercises for 2006. Cash proceeds from the exercises as well as the tax benefits will provide a portion of the funding for this repurchase activity.
9. STOCK INCENTIVE AND OPTION PLANS
The company’s stock incentive and option plans provide for grants of stock options, stock awards and other incentives. Common shares available for grant as of December 31 were 12,748,989 for 2005, 4,216,012 for 2004 and 8,674,459 for 2003. Common shares available for grant reflect 12 million shares approved by shareholders during 2002 and an additional 12 million shares approved in 2005 for issuance under the plans.
Almost all of the awards granted are non-qualified stock options granted to employees that vest annually in equal amounts over a three-year service period. Options may be granted to purchase shares of the company’s stock at not less than fair market value at the date of grant. These options generally expire within ten years from the grant date. The company recognizes compensation expense for these awards on a straight-line basis over the three-year vesting period. Upon adoption of SFAS No. 123R, new stock option grants to retirement eligible recipients will be attributed to expense using the non-substantive vesting method. A summary of stock option activity and average exercise prices is as follows:
Shares | | 2005 | | 2004 | | 2003 | |
| | | | | | | |
Granted | | 3,862,966 | | 4,876,408 | | 4,765,823 | |
Exercised | | (2,878,612 | ) | (3,625,117 | ) | (6,383,227 | ) |
Canceled | | (148,568 | ) | (386,512 | ) | (379,634 | ) |
December 31: | | | | | | | |
Outstanding | | 23,568,291 | | 22,732,505 | | 21,867,726 | |
Exercisable | | 16,461,958 | | 15,332,623 | | 12,823,743 | |
Average exercise | | | | | | | |
price per share | | 2005 | | 2004 | | 2003 | |
Granted | | $ | 33.93 | | $ | 33.49 | | $ | 27.18 | |
Exercised | | 17.27 | | 16.55 | | 19.84 | |
Canceled | | 29.03 | | 24.81 | | 21.87 | |
December 31: | | | | | | | |
Outstanding | | 26.61 | | 24.20 | | 20.87 | |
Exercisable | | $ | 23.87 | | $ | 21.31 | | $ | 17.96 | |
The total intrinsic value of options (the amount by which the stock price exceeded the exercise price of the option on the date of exercise) that were exercised during 2005, 2004 and 2003 was $45.3 million, $53.8 million and $36.4 million, respectively.
42
Information related to stock options outstanding and stock options exercisable as of December 31, 2005, is as follows:
Options Outstanding | |
| | | | | | Weighted- | |
Range of | | | | Weighted-Average | | Average | |
Exercise | | Options | | Remaining | | Exercise | |
Prices | | Outstanding | | Contractual Life | | Price | |
| | | | | | | |
$7.59-17.91* | | 1,094,939 | | 2.0 years | | $13.29 | |
$18.96-19.92 | | 4,957,960 | | 5.1 years | | 19.22 | |
$20.00-24.90* | | 4,629,462 | | 6.7 years | | 24.03 | |
$25.21-29.82* | | 4,843,293 | | 8.0 years | | 27.42 | |
$30.58-34.08* | | 4,672,276 | | 9.7 years | | 33.82 | |
$34.18-36.67 | | 3,368,139 | | 9.0 years | | 34.51 | |
$37.07-93.42* | | 2,222 | | 3.1 years | | $53.36 | |
* Includes 15,872 shares of Ecolab’s common stock subject to stock options which Ecolab assumed in connection with the acquisition of Alcide Corporation in June 2004.
Options Exercisable | |
| | | | Weighted- | |
Range of | | | | Average | |
Exercise | | Options | | Exercise | |
Prices | | Exercisable | | Price | |
| | | | | |
$7.59-17.91* | | 1,094,939 | | $13.29 | |
$18.96-19.92 | | 4,957,960 | | 19.22 | |
$20.00-24.90* | | 4,599,792 | | 24.02 | |
$25.21-29.82* | | 3,593,570 | | 27.41 | |
$30.58-34.08* | | 1,056,593 | | 33.19 | |
$34.18-36.67 | | 1,156,882 | | 34.52 | |
$37.07-93.42* | | 2,222 | | $53.36 | |
* Includes 15,872 shares of Ecolab’s common stock subject to stock options which Ecolab assumed in connection with the acquisition of Alcide Corporation in June 2004.
The total aggregate intrinsic value of options outstanding and options exercisable as of December 31, 2005 was $230.7 million and $206.2 million, respectively.
The lattice (binomial) option-pricing model was used to estimate the fair value of options at grant date beginning in the fourth quarter of 2005. The company’s primary employee option grant occurs during the fourth quarter. Prior to adoption of SFAS No. 123R, the Black-Scholes option-pricing model was used. The weighted-average grant-date fair value of options granted in 2005, 2004 and 2003, and the significant assumptions used in determining the underlying fair value of each option grant, on the date of grant were as follows:
| | 2005 | | 2004 | | 2003 | |
| | | | | | | |
Weighted-average grant-date fair value of options granted at market prices | | $ | 9.35 | | $ | 9.45 | | $ | 7.85 | |
| | | | | | | |
Assumptions | | | | | | | |
Risk-free rate of return | | 4.4 | % | 3.8 | % | 3.5 | % |
Expected life | | 6 years | | 6 years | * | 6 years | |
Expected volatility | | 24.3 | % | 25.5 | % | 26.8 | % |
Expected dividend yield | | 1.2 | % | 1.0 | % | 1.2 | % |
| | | | | | | | | | |
* During 2004 significant reload options were also granted with a weighted-average expected life of 3.5 years.
The risk-free rate of return is determined based on a yield curve of U.S. Treasury rates ranging from one month to ten years and a period commensurate with the expected life of the options granted. Expected volatility is established based on historical volatility of the company’s stock price. The expected dividend yield is determined based on the company’s annual dividend amount as a percentage of the average stock price at the time of the grant.
The expense associated with shares of restricted stock issued under the company’s stock incentive plans is based on the market price of the company’s stock at the date of grant and is amortized on a straight-line basis over the periods during which the restrictions lapse. The company currently has restricted stock outstanding that vests over periods between 12 and 36 months. Stock awards are not performance based and vest with continued employment. Stock awards are subject to forfeiture in the event of termination of employment. The company granted 11,479 shares in 2005, 13,550 shares in 2004 and 10,500 shares in 2003 under its restricted stock award program.
Total compensation expense related to share-based compensation plans was $39.1 million, ($24.7 million net of tax benefit) $44.7 million, ($28.1 million net of tax benefit) and $29.2 million ($17.7 million net of tax benefit) during 2005, 2004 and 2003, respectively.
A summary of non-vested stock options and stock award activity is as follows:
Non-Vested Stock Options and Stock Awards | |
| | | | Weighted- | | | | Weighted- | |
| | | | Average | | | | Average | |
| | | | Fair Value | | | | Fair Value | |
| | Stock | | at Grant | | Stock | | at Grant | |
| | Options | | Date | | Awards | | Date | |
December 31, 2004 | | 7,399,882 | | $ | 8.79 | | 62,300 | | $ | 24.20 | |
Granted | | 3,862,966 | | 9.35 | | 11,479 | | 32.74 | |
Vested/Earned | | (4,028,267 | ) | 8.37 | | (51,604 | ) | 22.52 | |
Forfeited/Cancelled | | (128,248 | ) | 8.91 | | — | | — | |
December 31, 2005 | | 7,106,333 | | $ | 9.33 | | 22,175 | | $ | 32.53 | |
As of December 31, 2005, there was $58.7 million of total measured but unrecognized compensation expense related to non-vested share-based compensation arrangements granted under our plans. That cost is expected to be recognized over a weighted-average period of 1.9 years.
Total cash received from the exercise of share-based instruments in 2005 was approximately $49.7 million.
The company generally issues authorized but previously unissued shares to satisfy stock option exercises. The company has a policy of repurchasing shares on the open market to offset the dilutive effect of stock options, as discussed in Note 8.
10. INCOME TAXES
Income before income taxes consisted of:
(thousands) | | 2005 | | 2004 | | 2003 | |
Domestic | | $ | 278,795 | | $ | 238,307 | | $ | 261,237 | |
Foreign | | 219,387 | | 206,239 | | 159,532 | |
Total | | $ | 498,182 | | $ | 444,546 | | $ | 420,769 | |
The provision for income taxes consisted of:
(thousands) | | 2005 | | 2004 | | 2003 | |
Federal and state | | $ | 121,409 | | $ | 79,830 | | $ | 73,696 | |
Foreign | | 70,313 | | 67,681 | | 49,687 | |
Currently payable | | 191,722 | | 147,511 | | 123,383 | |
| | | | | | | |
Federal and state | | (8,901 | ) | 13,470 | | 28,654 | |
Foreign | | (4,120 | ) | 872 | | 8,142 | |
Deferred | | (13,021 | ) | 14,342 | | 36,796 | |
| | | | | | | |
Provision for income taxes | | $ | 178,701 | | $ | 161,853 | | $ | 160,179 | |
43
The company’s overall net deferred tax assets and deferred tax liabilities were comprised of the following:
December 31 (thousands) | | 2005 | | 2004 | | 2003 | |
Deferred tax assets | | | | | | | |
Other accrued liabilities | | $ | 49,257 | | $ | 57,316 | | $ | 53,924 | |
Loss carryforwards | | 6,538 | | 11,709 | | 11,756 | |
Share-based compensation | | 45,718 | | 37,149 | | 26,557 | |
Other comprehensive income | | 42,028 | | 5,315 | | 4,700 | |
Other, net | | 24,739 | | 25,723 | | 26,954 | |
Valuation allowance | | (2,711 | ) | (2,847 | ) | (2,719 | ) |
Total | | 165,569 | | 134,365 | | 121,172 | |
Deferred tax liabilities | | | | | | | |
Postretirement health care and pension benefits | | 3,217 | | 4,672 | | 3,961 | |
Property, plant and equipment basis differences | | 61,489 | | 72,204 | | 61,062 | |
Intangible assets | | 73,853 | | 74,064 | | 49,465 | |
Other, net | | 2,631 | | 3,871 | | 4,445 | |
Total | | 141,190 | | 154,811 | | 118,933 | |
Net deferred tax assets (liabilities) | | $ | 24,379 | | $ | (20,446 | ) | $ | 2,239 | |
A reconciliation of the statutory U.S. federal income tax rate to the company’s effective income tax rate was:
| | 2005 | | 2004 | | 2003 | |
Statutory U.S. rate | | 35.0 | % | 35.0 | % | 35.0 | % |
State income taxes, net of federal benefit | | 2.3 | | 2.4 | | 2.7 | |
Foreign operations | | (2.0 | ) | (0.9 | ) | 0.5 | |
Reinvested earnings in U.S. under the American Jobs Creation Act | | 0.6 | | | | | |
Other, net | | | | (0.1 | ) | (0.1 | ) |
Effective income tax rate | | 35.9 | % | 36.4 | % | 38. 1 | % |
Cash paid for income taxes was approximately $165 million in 2005, $163 million in 2004 and $90 million in 2003.
As of December 31, 2005, the company had undistributed earnings of international affiliates of approximately $458 million. These earnings are considered to be reinvested indefinitely or available for distribution with foreign tax credits available to offset the amount of applicable income tax and foreign withholding taxes that might be payable on the earnings. It is impractical to determine the amount of incremental taxes that might arise if all undistributed earnings were distributed.
On October 22, 2004, the President signed the American Jobs Creation Act of 2004 (the “Act”). The Act provides a deduction for income from qualified domestic production activities, which will be phased in from 2005 through 2010. In return, the Act also provides for a two-year phase-out of the existing extra-territorial income exclusion (ETI) for foreign sales that was viewed to be inconsistent with international trade protocols by the European Union.
Under the guidance in FASB Staff Position No. 109-1, “Application of FASB Statement No. 109, Accounting for Income Taxes, to the Tax Deduction on Qualified Production Activities Provided by the American Jobs Creation Act of 2004”, the deduction will be treated as a “special deduction” as described in SFAS No. 109. As such, the special deduction has no effect on deferred tax assets and liabilities existing at the enactment date. Rather, the impact of this deduction will be reported in the period in which the deduction is claimed on the company’s tax return. The company began benefiting from this deduction with a modest benefit in 2005.
The Act also creates a temporary incentive for U.S. corporations to repatriate accumulated income earned abroad by providing an 85 percent dividends received deduction for certain dividends from controlled foreign corporations. In the fourth quarter of 2005 the company approved a plan for the reinvestment of foreign earnings in the United States pursuant to the provisions of the Act. The company repatriated $223 million of foreign earnings into the U.S. As a result of completing the repatriation, the company recorded tax expense of $3.1 million, net of available foreign tax credits, in the fourth quarter of 2005.
11. RENTALS AND LEASES
The company leases sales and administrative office facilities, distribution center facilities, automobiles, computers and other equipment under operating leases. Rental expense under all operating leases was $97,336,000 in 2005, $86,626,000 in 2004 and $81,781,000 in 2003. As of December 31, 2005, future minimum payments under operating leases with noncancelable terms in excess of one year were:
(thousands) | | | |
2006 | | $ | 41,227 | |
2007 | | 32,156 | |
2008 | | 22,834 | |
2009 | | 16,513 | |
2010 | | 13,268 | |
Thereafter | | 10,859 | |
Total | | $ | 136,857 | |
The company enters into operating leases in the U.S. for vehicles whose noncancelable terms are one year or less in duration with month-to-month renewal options. These leases have been excluded from the table above. The company estimates payments under such leases will approximate $46 million in 2006. These automobile leases have guaranteed residual values that have historically been satisfied primarily by the proceeds on the sale of the vehicles. No estimated losses have been recorded for these guarantees as the company believes, based upon the results of previous leasing arrangements, that the potential recovery of value from the vehicles when sold will be greater than the residual value guarantee.
12. RESEARCH EXPENDITURES
Research expenditures that related to the development of new products and processes, including significant improvements and refinements to existing products are expensed as incurred. Such costs were $68,372,000 in 2005, $61,471,000 in 2004 and $53,171,000 in 2003.
13. COMMITMENTS AND CONTINGENCIES
The company and certain subsidiaries are party to various lawsuits, claims and environmental actions that have arisen in the ordinary course of business. These include possible obligations to investigate and mitigate the effects on the environment of the disposal or release of certain chemical substances at various sites, such as Superfund sites and other operating or closed facilities. The effect of these actions on the company’s financial position, results of operations and cash flows to date has not been material. The company is currently participating in environmental assessments and remediation at a number of locations and environmental liabilities have been accrued reflecting management’s best estimate of future costs. At December 31, 2005, the accrual for environmental remediation costs was approximately $4.3 million. Potential insurance reimbursements are not anticipated in the company’s accruals for environmental liabilities.
The company is self-insured in North America for most workers compensation, general liability and automotive liability losses subject to per occurrence and aggregate annual liability limitations. The company is insured for losses in excess of these limitations. The company has recorded both a liability and an offsetting receivable for
44
amounts in excess of these limitations. The company is self-insured for health care claims for eligible participating employees subject to certain deductibles and limitations. The company determines its liability for claims incurred but not reported on an actuarial basis.
While the final resolution of these contingencies could result in expenses different than current accruals, and therefore have an impact on the company’s consolidated financial results in a future reporting period, management believes the ultimate outcome will not have a significant effect on the company’s consolidated results of operations, financial position or cash flows.
14. RETIREMENT PLANS
PENSION AND POSTRETIREMENT HEALTH CARE BENEFITS PLANS
The company has a noncontributory defined benefit pension plan covering most of its U.S. employees. Effective January 1, 2003, the U.S. pension plan was amended to provide a cash balance type pension benefit to employees hired on or after the effective date. For participants enrolled prior to January 1, 2003, plan benefits are based on years of service and highest average compensation for five consecutive years of employment. For participants enrolled after December 31, 2002, plan benefits are based on contribution credits equal to a fixed percentage of their current salary and interest credits. The measurement date used for determining the U.S. pension plan assets and obligations is December 31. Various international subsidiaries also have defined benefit pension plans. The measurement date used for determining the international pension plan assets and obligations is November 30. The information following includes all of the company’s significant international defined benefit pension plans.
The company provides postretirement health care benefits to certain U.S. employees. The plan is contributory based on years of service and family status, with retiree contributions adjusted annually. The measurement date used to determine the U.S. postretirement healthcare plan assets and obligations is December 31. Certain employees outside the U.S. are covered under government-sponsored programs, which are not required to be fully funded. The expense and obligation for providing international postretirement healthcare benefits is not significant.
A reconciliation of changes in the benefits obligations and fair value of assets of the company’s plans is as follows:
| | | | | | | | International | | U.S. Postretirement Health Care | |
| | U.S. Pension Benefits | | Pension Benefits | | Benefits | |
(thousands) | | 2005 | | 2004 | | 2003 | | 2005 | | 2004 | | 2003 | | 2005 | | 2004 | | 2003 | |
Benefit obligation, beginning of year | | $ | 667,936 | | $ | 556,076 | | $ | 485,155 | | $ | 372,045 | | $ | 321,906 | | $ | 245,876 | | $ | 158,030 | | $ | 155,030 | | $ | 131,206 | |
Service cost | | 38,948 | | 31,453 | | 26,442 | | 14,970 | | 13,409 | | 11,997 | | 3,085 | | 3,188 | | 7,447 | |
Interest cost | | 37,866 | | 34,192 | | 32,208 | | 18,307 | | 17,830 | | 14,633 | | 8,860 | | 9,041 | | 8,597 | |
Participant contributions | | | | | | | | 2,539 | | 2,503 | | 1,515 | | 2,467 | | 2,267 | | 1,856 | |
Acquisitions | | | | | | | | | | 1,441 | | 1,086 | | | | | | | |
Divestitures | | | | | | | | (58 | ) | (611 | ) | | | | | | | | |
Plan amendments, settlements and curtailments | | | | | | | | 18 | | 473 | | (948 | ) | (3,566 | ) | 288 | | (1,930 | ) |
Changes in assumptions | | 29,824 | | 52,728 | | 33,397 | | 34,676 | | | | | | 11,133 | | 10,046 | | 8,675 | |
Actuarial loss (gain)* | | (16,702 | ) | 10,801 | | (5,232 | ) | 13,666 | | 2,335 | | 13,007 | | (3,598 | ) | (11,257 | ) | 7,828 | |
Benefits paid | | (19,095 | ) | (17,314 | ) | (15,894 | ) | (14,622 | ) | (13,961 | ) | (11,892 | ) | (11,053 | ) | (10,573 | ) | (8,649 | ) |
Foreign currency translation | | | | | | | | (39,224 | ) | 26,720 | | 46,632 | | | | | | | |
Benefit obligation, end of year | | $ | 738,777 | | $ | 667,936 | | $ | 556,076 | | $ | 402,317 | | $ | 372,045 | | $ | 321,906 | | $ | 165,358 | | $ | 158,030 | | $ | 155,030 | |
| | | | | | | | | | | | | | | | | | | |
Fair value of plan assets, beginning of year | | $ | 618,133 | | $ | 544,802 | | $ | 378,504 | | $ | 201,482 | | $ | 170,975 | | $ | 134,089 | | $ | 21,740 | | $ | 21,979 | | $ | 18,911 | |
Actual gains on plan assets | | 42,171 | | 53,645 | | 107,192 | | 23,126 | | 7,006 | | 9,400 | | 1,499 | | 2,018 | | 5,054 | |
Acquisitions | | | | | | | | | | | | 263 | | | | | | | |
Company contributions | | 38,000 | | 37,000 | | 75,000 | | 27,273 | | 25,124 | | 12,743 | | 10,571 | | 6,049 | | 4,807 | |
Participant contributions | | | | | | | | 2,539 | | 2,503 | | 1,407 | | 2,467 | | 2,267 | | 1,856 | |
Settlements | | | | | | | | | | | | (547 | ) | | | | | | |
Benefits paid | | (19,095 | ) | (17,314 | ) | (15,894 | ) | (14,622 | ) | (13,961 | ) | (11,892 | ) | (11,053 | ) | (10,573 | ) | (8,649 | ) |
Foreign currency translation | | | | | | | | (19,655 | ) | 9,835 | | 25,512 | | | | | | | |
Fair value of plan assets, end of year | | $ | 679,209 | | $ | 618,133 | | $ | 544,802 | | $ | 220,143 | | $ | 201,482 | | $ | 170,975 | | $ | 25,224 | | $ | 21,740 | | $ | 21,979 | |
* The actuarial gain in 2004 for the U.S. Postretirement Health Care Benefits plan includes a gain of $15.5 million resulting from the enactment of the Medicare Prescription Drug, Improvement and Modernization Act of 2003.
45
A reconciliation of the funded status for the pension and postretirement plans is as follows:
| | | | | | | | International | | U.S. Postretirement Health Care | |
| | U.S. Pension Benefits | | Pension Benefits | | Benefits | |
(thousands) | | 2005 | | 2004 | | 2003 | | 2005 | | 2004 | | 2003 | | 2005 | | 2004 | | 2003 | |
| | | | | | | | | | | | | | | | | | | |
Funded status | | $ | (59,568 | ) | $ | (49,803 | ) | $ | (11,274 | ) | $ | (182,174 | ) | $ | (170,563 | ) | $ | (150,931 | ) | $ | (140,134 | ) | $ | (136,290 | ) | $ | (133,051 | ) |
Unrecognized actuarial loss | | 229,505 | | 215,466 | | 160,939 | | 82,672 | | 55,746 | | 44,123 | | 58,539 | | 56,467 | | 63,559 | |
Unrecognized prior service cost (benefit) | | 4,126 | | 5,664 | | 7,400 | | 1,425 | | 1,589 | | 2,265 | | (25,981 | ) | (28,075 | ) | (34,059 | ) |
Unrecognized net transition (asset) obligation | | | | (702 | ) | (2,105 | ) | (21 | ) | 357 | | 627 | | | | | | | |
Net amount recognized | | $ | 174,063 | | $ | 170,625 | | $ | 154,960 | | $ | (98,098 | ) | $ | (112,871 | ) | $ | (103,916 | ) | $ | (107,576 | ) | $ | (107,898 | ) | $ | (103,551 | ) |
The net amount recognized in the balance sheet and the accumulated benefit obligation is as follows:
| | | | | | | | International | | U.S. Postretirement Health Care | |
| | U.S. Pension Benefits | | Pension Benefits | | Benefits | |
(thousands) | | 2005 | | 2004 | | 2003 | | 2005 | | 2004 | | 2003 | | 2005 | | 2004 | | 2003 | |
Prepaid benefit cost | | $ | 174,063 | | $ | 170,625 | | $ | 154,960 | | $ | 27,015 | | $ | 28,986 | | $ | 26,533 | | $ | — | | $ | — | | $ | — | |
Accrued benefit cost | | | | | | | | (169,143 | ) | (162,730 | ) | (146,180 | ) | (107,576 | ) | (107,898 | ) | (103,551 | ) |
Intangible asset | | | | | | | | 1,211 | | 2,202 | | | | | | | | | |
Accumulated other comprehensive loss | | | | | | | | 42,819 | | 18,671 | | 15,731 | | | | | | | |
Net amount recognized | | $ | 174,063 | | $ | 170,625 | | $ | 154,960 | | $ | (98,098 | ) | $ | (112,871 | ) | $ | (103,916 | ) | $ | (107,576 | ) | $ | (107,898 | ) | $ | (103,551 | ) |
Accumulated benefit obligation | | $ | 599,996 | | $ | 522,214 | | $ | 441,488 | | $ | 358,837 | | $ | 335,628 | | $ | 283,464 | | $ | 165,358 | | $ | 158,030 | | $ | 155,030 | |
For certain international pension plans, the accumulated benefit obligations exceeded the fair value of plan assets. Therefore, the company recognized an addition to the minimum pension liability in other comprehensive income of $24.4 million pre-tax ($16.2 million net of deferred tax asset) during 2005, $0.4 million pre-tax ($0.3 million net of deferred tax asset) during 2004 and $14.5 million pre-tax ($9.5 million net of deferred tax asset) during 2003. As of December 31, 2005, accumulated other comprehensive income includes minimum pension liability adjustments of $40.4 million pre-tax ($27.1 million net of deferred tax asset).
The aggregate projected benefit obligation, accumulated benefit obligation and fair value of plan assets for those plans with accumulated benefit obligations in excess of plan assets were as follows:
| | December 31 | |
(thousands) | | 2005 | | 2004 | | 2003 | |
Aggregate projected benefit obligation | | $ | 338,254 | | $ | 316,609 | | $ | 261,138 | |
Accumulated benefit obligation | | 303,719 | | 286,165 | | 238,819 | |
Fair value of plan assets | | 136,937 | | 126,453 | | 95,655 | |
| | | | | | | | | | |
These plans relate to various international subsidiaries and are funded consistent with local practices and requirements. As of December 31, 2005, there were approximately $4.2 million of future postretirement benefits covered by insurance contracts.
PLAN ASSETS
UNITED STATES
The company’s plan asset allocations for its U.S. defined benefit pension and postretirement health care benefits plans at December 31, 2005, 2004 and 2003, and target allocation for 2006 are as follows:
| | 2006 | | | | | | | |
| | Target Asset | | | | | | | |
Asset | | Allocation | | Percentage of Plan Assets | |
Category | | Percentage | | 2005 | | 2004 | | 2003 | |
Large cap equity | | 43 | % | 43 | % | 44 | % | 46 | % |
Small cap equity | | 12 | | 12 | | 13 | | 13 | |
International equity | | 15 | | 16 | | 16 | | 15 | |
Fixed income | | 25 | | 24 | | 23 | | 22 | |
Real estate | | 5 | | 5 | | 4 | | 4 | |
Total | | 100 | % | 100 | % | 100 | % | 100 | % |
The company’s U.S. investment strategy and policies are designed to maximize the possibility of having sufficient funds to meet the long-term liabilities of the pension fund, while achieving a balance between the goals of asset growth of the plan and keeping risk at a reasonable level. Current income is not a key goal of the plan. The pension and health care plan’s demographic characteristics generally reflect a younger workforce relative to an average pension plan. Therefore, the asset allocation position reflects the ability and willingness to accept relatively more short-term variability in the performance of the pension plan portfolio in exchange for the expectation of a better funded status, better long-term returns and lower pension costs in the long run.
Since diversification is widely recognized as important to reduce unnecessary risk, the pension fund is diversified across several asset classes and securities. Selected individual portfolios may be undiversified while maintaining the diversified nature of total plan assets.
The company’s U.S. investment policies prohibit investing in letter stock, warrants and options, and engaging in short sales, margin transactions, or other specialized investment activities. The use of derivatives is also prohibited for the purpose of speculation or introducing leverage in the portfolio, circumventing the investment guidelines or taking risks that are inconsistent with the fund’s guidelines. Selected derivatives may only be used for hedging and transactional efficiency.
46
INTERNATIONAL
The company’s plan asset allocations for its international defined benefit pension plans at December 31, 2005, 2004 and 2003, and target allocation for 2006 are as follows:
| | 2006 | | | | | | | |
| | Target Asset | | | | | | | |
Asset | | Allocation | | Percentage of Plan Assets | |
Category | | Percentage | | 2005 | | 2004 | | 2003 | |
Equity Securities | | 58 | % | 58 | % | 40 | % | 48 | % |
Fixed Income | | 28 | | 28 | | 50 | | 43 | |
Real estate | | 4 | | 4 | | 4 | | 5 | |
Other | | 10 | | 10 | | 6 | | 4 | |
Total | | 100 | % | 100 | % | 100 | % | 100 | % |
Assets of funded retirement plans outside the U.S. are managed in each local jurisdiction and asset allocation strategy is set in accordance with local rules, regulations and practice. The funds are invested in a variety of stocks, fixed income and real estate investments and in some cases, the assets are managed by insurance companies which may offer a guaranteed rate of return. Total international pension plan assets represent 24% of total Ecolab pension plan assets worldwide.
AMENDMENTS
During 2004, the American Jobs Creation Act of 2004 (the “Act”) added a new Section 409A to the Internal Revenue Code (the “Code”) which significantly changed the federal tax law applicable to amounts deferred after December 31, 2004, under nonqualified deferred compensation plans. In response to this, the company amended the “Non-Employee Director Stock Option and Deferred Compensation Plan (“Director Plan”) and the Mirror Savings Plan in December 2004. The amendments (1) allow compensation that was “deferred” (as defined by the Act) prior to January 1, 2005, to qualify for “grandfathered” status and to continue to be governed by the law applicable to nonqualified deferred compensation prior to the addition of Internal Revenue Code Section 409A by the Act, and (2) cause deferred compensation that is deferred after December 31, 2004, to be in compliance with the requirements of Code Section 409A. For amounts deferred after December 31, 2004, the amendments generally (1) require that such amounts be distributed as a single lump sum payment as soon as practicable after the participant has had a separation of service, with the exception of payments to “key employees” (as defined by the Act) which lump sum payments are required to be held for 6 months after their separation from service, and (2) prohibit the acceleration of distribution of such amounts except for an unforeseeable emergency (as defined by the Act).
Additionally, in December 2004, the company amended the Supplemental Executive Retirement Plan (“SERP”) and the Mirror Pension Plan to (1) allow amounts deferred prior to January 1, 2005, to qualify for “grandfathered” status and to continue to be governed by the law applicable to nonqualified deferred compensation prior to the Act, and (2) temporarily freeze the accrual of benefits as of December 31, 2004, due to the uncertainty regarding the effect of the Act on such benefits. The Secretary of Treasury and the Internal Revenue Service are expected to issue regulations and/or other guidance with respect to the provisions of the new Act throughout 2006, and final amendments to comply with the Act are required by the end of 2006. The company currently intends to rescind the freeze, following issuance of regulations to ensure compliance for post-2004 benefit accruals.
CASH FLOWS
As of year-end 2005, the company’s estimate of benefits expected to be paid in each of the next five fiscal years, and in the aggregate for the five fiscal years thereafter for the company’s pension and postretirement health care benefit plans are as follows:
(thousands) | | | |
2006 | | $ | 41,000 | |
2007 | | 43,000 | |
2008 | | 50,000 | |
2009 | | 51,000 | |
2010 | | 54,000 | |
2011-2015 | | 330,000 | |
| | | | |
The company’s funding policy for the U.S. pension plan is to achieve and maintain a return on assets that meets the long-term funding requirements identified by the projections of the pension plan’s actuaries while simultaneously satisfying the fiduciary responsibilities prescribed in ERISA. The company also takes into consideration the tax deductibility of contributions to the benefit plans. The company is not required to make any contributions to the U.S. pension and postretirement health care benefit plans in 2006. In January 2006, the company made a voluntary contribution of $45 million to the U.S. pension plan. The maximum tax deductible contribution for 2006 is estimated to be $50 to $60 million for the U.S. pension plan. The company estimates contributions to be made to the international plans will approximate $15 to $20 million in 2006. These amounts have been excluded from the schedule of contractual obligations.
NET PERIODIC BENEFIT COSTS
Pension and postretirement health care benefits expense for the company’s operations was:
| | | | | | | | International | | U.S. Postretirement | |
| | U.S. Pension Benefits | | Pension Benefits | | Health Care Benefits | |
(thousands) | | 2005 | | 2004 | | 2003 | | 2005 | | 2004 | | 2003 | | 2005 | | 2004 | | 2003 | |
Service cost - employee benefits earned during the year | | $ | 38,948 | | $ | 31,453 | | $ | 26,442 | | $ | 14,970 | | $ | 13,409 | | $ | 11,997 | | $ | 3,085 | | $ | 3,188 | | $ | 2,945 | |
Interest cost on benefit obligation | | 37,866 | | 34,192 | | 32,208 | | 18,307 | | 17,830 | | 14,633 | | 8,860 | | 9,041 | | 8,597 | |
Adjustments for death benefits for retired executives | | | | | | | | | | | | | | | | | | 4,502 | |
Expected return on plan assets | | (53,114 | ) | (50,161 | ) | (42,411 | ) | (11,751 | ) | (11,403 | ) | (9,908 | ) | (1,770 | ) | (1,843 | ) | (1,580 | ) |
Recognition of net actuarial loss | | 10,026 | | 5,518 | | 3,451 | | 1,597 | | 1,458 | | 932 | | 5,734 | | 5,706 | | 6,293 | |
Amortization of prior service cost (benefit) | | 1,538 | | 1,736 | | 1,929 | | 162 | | 426 | | 41 | | (5,660 | ) | (5,696 | ) | (5,302 | ) |
Amortization of net transition (asset) obligation | | (702 | ) | (1,403 | ) | (1,403 | ) | 329 | | 333 | | 493 | | | | | | | |
Curtailment (gain) loss | | | | | | | | (40 | ) | (51 | ) | | | | | | | | |
Total expense | | $ | 34,562 | | $ | 21,335 | | $ | 20,216 | | $ | 23,574 | | $ | 22,002 | | $ | 18,188 | | $ | 10,249 | | $ | 10,396 | | $ | 15,455 | |
47
The company also has U.S. noncontributory non-qualified defined benefit plans, which provide for benefits to employees in excess of limits permitted under its U.S. pension plan. The recorded obligation for these plans was approximately $25 million at December 31, 2005. The annual expense for these plans was approximately $6 million in 2005, $5 million in 2004 and $4 million in 2003.
PLAN ASSUMPTIONS
| | | | International | | U.S. Postretirement | |
| | U.S. Pension Benefits | | Pension Benefits | | Health Care Benefits | |
(thousands) | | 2005 | | 2004 | | 2003 | | 2005 | | 2004 | | 2003 | | 2005 | | 2004 | | 2003 | |
| | | | | | | | | | | | | | | | | | | |
Weighted-average actuarial assumptions used to determine benefit obligations as of | | | | | | | | | | | | | | | | | | | |
December 31: | | | | | | | | | | | | | | | | | | | |
Discount rate | | 5.57 | % | 5.75 | % | 6.25 | % | 4.54 | % | 5.22 | % | 5.39 | % | 5.57 | % | 5.75 | % | 6.25 | % |
Projected salary increase | | 4.30 | | 4.30 | | 4.30 | | 3.15 | | 3.13 | | 3.31 | | | | | | | |
Weighted-average actuarial assumptions used to determine net cost: | | | | | | | | | | | | | | | | | | | |
Discount rate | | 5.75 | | 6.25 | | 6.75 | | 5.18 | | 5.37 | | 5.11 | | 5.75 | | 6.25 | | 6.75 | |
Expected return on plan assets | | 8.75 | | 9.00 | | 9.00 | | 5.68 | | 5.75 | | 5.97 | | 8.75 | % | 9.00 | % | 9.00 | % |
Projected salary increase | | 4.30 | % | 4.30 | % | 4.80 | % | 3.12 | % | 3.07 | % | 3.25 | % | | | | | | |
The expected long-term rate of return is generally based on the pension plan’s asset mix, assumptions of equity returns based on historical long-term returns on asset categories, expectations for inflation, and estimates of the impact of active management of the assets.
For postretirement benefit measurement purposes as of December 31, 2005, 9.0 percent (for pre-age 65 retirees) and 10.0 percent (for post-age 65 retirees) annual rates of increase in the per capita cost of covered health care were assumed. The rates were assumed to decrease by 1 percent each year until they reach 5 percent in 2009 for pre-age 65 retirees and 5 percent in 2010 for postage 65 retirees and remain at those levels thereafter. Health care costs which are eligible for subsidy by the company are limited to a maximum 4 percent annual increase beginning in 1996 for certain employees.
Assumed health care cost trend rates have a significant effect on the amounts reported for the company’s U.S. postretirement health care benefits plan. A one-percentage point change in the assumed health care cost trend rates would have the following effects:
| | 1-Percentage Point | |
(thousands) | | Increase | | Decrease | |
Effect on total of service and interest cost components | | $ | 482 | | $ | (435 | ) |
Effect on postretirement benefit obligation | | 9,040 | | (8,150 | ) |
| | | | | | | |
The Medicare Prescription Drug, Improvement and Modernization Act of 2003 introduces a prescription drug benefit under Medicare as well as a federal subsidy to sponsors of retiree health care benefit plans. The company’s U.S. postretirement health care benefits plan offers prescription drug benefits. The company amended its plan effective January 1, 2005, in order to obtain the benefits provided under this Act. In accordance with FSP No. 106-2 “Accounting and Disclosure Requirements Related to the Medicare Prescription Drug, Improvement and Modernization Act of 2003,” the company began recording favorable benefits of this Act in the third quarter of 2004, using the prospective transition method consistent with this guidance. The after-tax benefit for 2004 was approximately $1.0 million. The company recognized an actuarial gain and a reduction in its postretirement benefit obligation of $15.5 million at July 1, 2004, related to this Act.
SAVINGS PLAN AND ESOP
The company provides a 401(k) savings plan for substantially all U.S. employees. Employee before-tax contributions of up to 3 percent of eligible compensation are matched 100 percent by the company and employee before-tax contributions between 3 percent and 5 percent of eligible compensation are matched 50 percent by the company. The match is 100 percent vested immediately. Effective January 2003, the plan was amended to provide that all employee contributions which are invested in Ecolab stock will be part of the employee’s ESOP account while so invested. The company’s contributions are invested in Ecolab common stock and amounted to $17,390,000 in 2005, $15,822,000 in 2004 and $14,854,000 in 2003. Effective January 1, 2006, the plan was amended to allow employees to re-allocate company matching contributions in Ecolab common stock to other investment funds within the plan.
15. OPERATING SEGMENTS
The company’s operating segments have generally similar products and services, and the company is organized to manage its operations geographically. The company’s operating segments have been aggregated into three reportable segments.
The “United States Cleaning & Sanitizing” segment provides cleaning and sanitizing products and services to United States markets through its Institutional, Kay, Textile Care, Professional Products, Healthcare, Vehicle Care, Water Care Services and Food & Beverage operations.
The “United States Other Services” segment includes all other U.S. operations of the company. This segment provides pest elimination and kitchen equipment repair and maintenance through its Pest Elimination and GCS Service operations.
The company’s “International” segment provides cleaning and sanitizing product and service offerings as well as pest elimination services to international markets in Europe, Asia Pacific, Latin America and Canada.
Information on the types of products and services of each of the company’s operating segments is included on the inside front cover under “Services/Products Provided.”
The company evaluates the performance of its International operations based on fixed management currency exchange rates. All other accounting policies of the reportable segments are consistent with accounting principles generally accepted in the United States of America and the accounting policies of the company described in
48
Note 2 of these notes to consolidated financial statements. The profitability of the company’s operating segments is evaluated by management based on operating income.
Financial information for each of the company’s reportable segments is as follows:
| | United States | | | | Other | | | |
| | | | | | Total | | | | Foreign | | | | | |
| | Cleaning & | | Other | | United | | | | Currency | | | | | |
(thousands) | | Sanitizing | | Services | | States | | International | | Translation | | Corporate | | Consolidated | |
Net sales | | | | | | | | | | | | | | | |
2005 | | $ | 1,952,220 | | $ | 375,234 | | $ | 2,327,454 | | $ | 2,229,902 | | $ | (22,524 | ) | | | $ | 4,534,832 | |
2004 | | 1,796,355 | | 339,305 | | 2,135,660 | | 2,126,840 | | (77,567 | ) | | | 4,184,933 | |
2003 | | 1,694,323 | | 320,444 | | 2,014,767 | | 1,980,722 | | (233,670 | ) | | | 3,761,819 | |
Operating income (loss) | | | | | | | | | | | | | | | |
2005 | | 279,960 | | 36,012 | | 315,972 | | 227,864 | | (1,416 | ) | | | 542,420 | |
2004 | | 266,072 | | 20,447 | | 286,519 | | 217,865 | | (10,133 | ) | $ | (4,361 | ) | 489,890 | |
2003 | | 268,646 | | 18,228 | | 286,874 | | 207,057 | | (34,088 | ) | (4,834 | ) | 455,009 | |
Depreciation & amortization | | | | | | | | | | | | | | | |
2005 | | 123,644 | | 5,460 | | 129,104 | | 119,211 | | 1,948 | | 6,672 | | 256,935 | |
2004 | | 119,831 | | 5,254 | | 125,085 | | 118,781 | | (2,411 | ) | 5,499 | | 246,954 | |
2003 | | 114,516 | | 4,903 | | 119,419 | | 117,709 | | (14,422 | ) | 5,397 | | 228,103 | |
Total assets | | | | | | | | | | | | | | | |
2005 | | 1,348,706 | | 154,870 | | 1,503,576 | | 2,207,156 | | (137,934 | ) | 223,830 | | 3,796,628 | |
2004 | | 1,284,006 | | 146,701 | | 1,430,707 | | 2,183,499 | | 32,021 | | 69,947 | | 3,716,174 | |
2003 | | 1,112,994 | | 143,552 | | 1,256,546 | | 1,979,335 | | (115,601 | ) | 108,638 | | 3,228,918 | |
Capital expenditures | | | | | | | | | | | | | | | |
2005 | | 149,100 | | 7,246 | | 156,346 | | 112,110 | | 327 | | | | 268,783 | |
2004 | | 153,503 | | 4,993 | | 158,496 | | 121,973 | | (4,598 | ) | | | 275,871 | |
2003 | | $ | 117,361 | | $ | 3,726 | | $ | 121,087 | | $ | 102,413 | | $ | (11,606 | ) | $ | 141 | | $ | 212,035 | |
Consistent with the company’s internal management reporting, corporate operating income includes special charges included on the consolidated statement of income and recorded for 2004 and 2003. In addition, corporate expense includes an adjustment made for death benefits for retired executives in 2003. Corporate assets are principally cash and cash equivalents and short-term investments.
The company has two classes of products and services within its United States Cleaning & Sanitizing and International operations which comprise 10 percent or more of consolidated net sales. Sales of warewashing products were approximately 21 percent, 22 percent and 23 percent of consolidated net sales in 2005, 2004 and 2003, respectively. Sales of laundry products and services were approximately 11 percent, 10 percent and 10 percent of consolidated net sales in 2005, 2004 and 2003, respectively.
Property, plant and equipment of the company’s United States and International operations were as follows:
December 31 (thousands) | | 2005 | | 2004 | | 2003 | |
| | | | | | | |
United States | | $ | 504,072 | | $ | 476,804 | | $ | 404,209 | |
| | | | | | | |
International | | 346,531 | | 347,952 | | 349,252 | |
| | | | | | | |
Effect of foreign currency translation | | (15,100 | ) | 9,974 | | (16,664 | ) |
Consolidated | | $ | 835,503 | | $ | 834,730 | | $ | 736,797 | |
49
16. QUARTERLY FINANCIAL DATA (Unaudited)
(thousands, except per share) | | First Quarter | | Second Quarter | | Third Quarter | | Fourth Quarter | | Year | |
2005 | | | | | | | | | | | |
Net sales | | | | | | | | | | | |
United States Cleaning & Sanitizing | | $ | 467,179 | | $ | 496,808 | | $ | 510,476 | | $ | 477,757 | | $ | 1,952,220 | |
United States Other Services | | 85,810 | | 96,328 | | 98,315 | | 94,781 | | 375,234 | |
International | | 505,034 | | 560,119 | | 573,981 | | 590,768 | | 2,229,902 | |
Effect of foreign currency translation | | 11,857 | | 5,409 | | (17,999 | ) | (21,791 | ) | (22,524 | ) |
Total | | 1,069,880 | | 1,158,664 | | 1,164,773 | | 1,141,515 | | 4,534,832 | |
Cost of sales | | 526,975 | | 571,066 | | 572,862 | | 577,928 | | 2,248,831 | |
Selling, general and administrative expenses | | 424,918 | | 449,346 | | 429,464 | | 439,853 | | 1,743,581 | |
Operating income | | | | | | | | | | | |
United States Cleaning & Sanitizing | | 71,605 | | 72,660 | | 85,933 | | 49,762 | | 279,960 | |
United States Other Services | | 7,534 | | 10,287 | | 11,124 | | 7,067 | | 36,012 | |
International | | 37,403 | | 54,376 | | 66,744 | | 69,341 | | 227,864 | |
Effect of foreign currency translation | | 1,445 | | 929 | | (1,354 | ) | (2,436 | ) | (1,416 | ) |
Total | | 117,987 | | 138,252 | | 162,447 | | 123,734 | | 542,420 | |
Interest expense, net | | 11,190 | | 12,184 | | 11,529 | | 9,335 | | 44,238 | |
Income before income taxes | | 106,797 | | 126,068 | | 150,918 | | 114,399 | | 498,182 | |
Provision for income taxes | | 37,371 | | 44,667 | | 52,960 | | 43,703 | | 178,701 | |
Net income | | $ | 69,426 | | $ | 81,401 | | $ | 97,958 | | $ | 70,696 | | $ | 319,481 | |
Net income per common share | | | | | | | | | | | |
Basic | | $ | 0.27 | | $ | 0.32 | | $ | 0.38 | | $ | 0.28 | | $ | 1.25 | |
Diluted | | $ | 0.27 | | $ | 0.31 | | $ | 0.38 | | $ | 0.27 | | $ | 1.23 | |
Weighted-average common shares outstanding | | | | | | | | | | | |
Basic | | 256,272 | | 255,474 | | 255,817 | | 255,402 | | 255,741 | |
Diluted | | 260,626 | | 259,594 | | 259,911 | | 259,723 | | 260,098 | |
| | | | | | | | | | | |
2004 | | | | | | | | | | | |
Net sales | | | | | | | | | | | |
United States Cleaning & Sanitizing | | $ | 430,734 | | $ | 450,625 | | $ | 478,464 | | $ | 436,532 | | $ | 1,796,355 | |
United States Other Services | | 77,775 | | 85,875 | | 89,157 | | 86,498 | | 339,305 | |
International | | 483,807 | | 535,000 | | 547,871 | | 560,162 | | 2,126,840 | |
Effect of foreign currency translation | | (12,945 | ) | (28,789 | ) | (25,176 | ) | (10,657 | ) | (77,567 | ) |
Total | | 979,371 | | 1,042,711 | | 1,090,316 | | 1,072,535 | | 4,184,933 | |
Cost of sales (including special charges (income) of $(50), $(16) and $(40) in the first, second and fourth quarters, respectively | | 474,485 | | 504,992 | | 520,054 | | 533,961 | | 2,033,492 | |
Selling, general and administrative expenses | | 392,754 | | 409,771 | | 417,675 | | 436,884 | | 1,657,084 | |
Special charges (income) | | 3,805 | | (254 | ) | 1,345 | | (429 | ) | 4,467 | |
Operating income | | | | | | | | | | | |
United States Cleaning & Sanitizing | | 73,000 | | 71,086 | | 82,215 | | 39,771 | | 266,072 | |
United States Other Services | | 4,494 | | 7,432 | | 6,003 | | 2,518 | | 20,447 | |
International | | 35,695 | | 52,894 | | 68,188 | | 61,088 | | 217,865 | |
Corporate | | (3,755 | ) | 270 | | (1,345 | ) | 469 | | (4,361 | ) |
Effect of foreign currency translation | | (1,107 | ) | (3,480 | ) | (3,819 | ) | (1,727 | ) | (10,133 | ) |
Total | | 108,327 | | 128,202 | | 151,242 | | 102,119 | | 489,890 | |
Interest expense, net | | 11,173 | | 11,217 | | 11,566 | | 11,388 | | 45,344 | |
Income before income taxes | | 97,154 | | 116,985 | | 139,676 | | 90,731 | | 444,546 | |
Provision for income taxes | | 35,883 | | 43,339 | | 49,396 | | 33,235 | | 161,853 | |
Net income | | $ | 61,271 | | $ | 73,646 | | $ | 90,280 | | $ | 57,496 | | $ | 282,693 | |
Net income per common share | | | | | | | | | | | |
Basic | | $ | 0.24 | | $ | 0.29 | | $ | 0.35 | | $ | 0.22 | | $ | 1.10 | |
Diluted | | $ | 0.24 | | $ | 0.28 | | $ | 0.34 | | $ | 0.22 | | $ | 1.09 | |
Weighted-average common shares outstanding | | | | | | | | | | | |
Basic | | 257,025 | | 257,135 | | 258,368 | | 257,774 | | 257,575 | |
Diluted | | 260,227 | | 260,905 | | 262,252 | | 260,913 | | 260,407 | |
Special charges are included in corporate operating income. Per share amounts do not necessarily sum due to changes in the calculation of shares outstanding for each discrete period and rounding.
Quarterly results for 2004 and the first, second and third quarter of 2005 have been restated to reflect the effect of retroactive application of SFAS No. 123R, “Share-Based Payment”.
50
REPORTS OF MANAGEMENT AND INDEPENDENT REGISTERED PUBLIC ACCOUNTING FIRM
REPORTS OF MANAGEMENT
To the Shareholders:
MANAGEMENT’S RESPONSIBILITY FOR FINANCIAL STATEMENTS
Management is responsible for the integrity and objectivity of the consolidated financial statements. The statements have been prepared in accordance with accounting principles generally accepted in the United States of America and, accordingly, include certain amounts based on management’s best estimates and judgments.
The Board of Directors, acting through its Audit Committee composed solely of independent directors, is responsible for determining that management fulfills its responsibilities in the preparation of financial statements and maintains financial control of operations. The Audit Committee recommends to the Board of Directors the appointment of the company’s independent registered public accounting firm, subject to ratification by the shareholders. It meets regularly with management, the internal auditors and the independent auditors.
The independent registered public accounting firm has audited the consolidated financial statements included in this annual report and have expressed their opinion regarding whether these consolidated financial statements present fairly in all material respects our financial position and results of operation and cash flows as stated in their report presented separately herein.
MANAGEMENT’S REPORT ON INTERNAL CONTROL OVER FINANCIAL REPORTING
Management is responsible for establishing and maintaining adequate internal control over financial reporting, as such term is defined in Exchange Act Rule 13a-15(f). Under the supervision and with the participation of management, including the principal executive officer and principal financial officer, an evaluation of the design and operating effectiveness of internal control over financial reporting was conducted based on the framework in Internal Control - Integrated Framework issued by the Committee of Sponsoring Organizations of the Treadway Commission. Based on the evaluation under the framework in Internal Control - Integrated Framework, management concluded that internal control over financial reporting was effective as of December 31, 2005.
Management’s assessment of the effectiveness of the company’s internal control over financial reporting as of December 31, 2005, has been audited by PricwaterhouseCoopers LLP, an independent registered public accounting firm, as stated in their report which is included herein.
/s/ Douglas M. Baker, Jr. | |
Douglas M. Baker, Jr. |
President and Chief Executive Officer |
|
|
/s/ Steven L. Fritze | |
Steven L. Fritze |
Executive Vice President and Chief Financial Officer |
| | |
REPORT OF INDEPENDENT
REGISTERED PUBLIC ACCOUNTING FIRM
To the Shareholders and Directors of Ecolab Inc.:
We have completed integrated audits of Ecolab Inc.’s 2005 and 2004 consolidated financial statements and of its internal control over financial reporting as of December 31, 2005, and an audit of its 2003 consolidated financial statements in accordance with the standards of the Public Company Accounting Oversight Board (United States). Our opinions, based on our audits, are presented below.
CONSOLIDATED FINANCIAL STATEMENTS
In our opinion, the accompanying consolidated balance sheet and the related consolidated statements of income, of cash flows, of comprehensive income and shareholders’ equity present fairly, in all material respects, the financial position of Ecolab Inc. and its subsidiaries at December 31, 2005, 2004 and 2003, and the results of their operations and their cash flows for each of the three years in the period ended December 31, 2005, in conformity with accounting principles generally accepted in the United States of America. These financial statements are the responsibility of Ecolab Inc.’s management. Our responsibility is to express an opinion on these financial statements based on our audits. We conducted our audits of these statements in accordance with the standards of the Public Company Accounting Oversight Board (United States). Those standards require that we plan and perform the audit to obtain reasonable assurance about whether the financial statements are free of material misstatement. An audit of financial statements includes examining, on a test basis, evidence supporting the amounts and disclosures in the financial statements, assessing the accounting principles used and significant estimates made by management, and evaluating the overall financial statement presentation. We believe that our audits provide a reasonable basis for our opinion.
As discussed in Note 2 to the consolidated financial statements, Ecolab Inc. changed its method of accounting for share-based compensation as of October 1, 2005.
INTERNAL CONTROL OVER FINANCIAL REPORTING
Also, in our opinion, management’s assessment, included in the accompanying Management’s Report on Internal Control Over Financial Reporting, that the Company maintained effective internal control over financial reporting as of December 31, 2005 based on criteria established in Internal Control - Integrated Framework issued by the Committee of Sponsoring Organizations of the Treadway Commission (COSO), is fairly stated, in all material respects, based on those criteria. Furthermore, in our opinion, Ecolab Inc. maintained, in all material respects, effective internal control over financial reporting as of December 31, 2005, based on criteria established in Internal Control - Integrated Framework issued by the COSO. Ecolab Inc.’s management is responsible for maintaining effective internal control over financial reporting and for its assessment of the effectiveness of internal control over financial reporting. Our responsibility is to express opinions on management’s assessment and on the effectiveness of Ecolab Inc.’s internal control over financial reporting based on our audit. We conducted our audit of internal control over financial reporting in accordance with the standards of the Public Company Accounting Oversight Board (United States). Those standards require that we plan and perform the audit to obtain reasonable assurance about whether effective internal control over financial reporting was maintained in all material respects. An audit of internal control over financial reporting includes obtaining an understanding of internal control over financial reporting, evaluating management’s assessment, testing and evaluating the design and operating effectiveness of internal control, and performing such other procedures as we consider necessary in the circumstances. We believe that our audit provides a reasonable basis for our opinions.
A company’s internal control over financial reporting is a process designed to provide reasonable assurance regarding the reliability of financial reporting and the preparation of financial statements for external purposes in accordance with generally accepted accounting principles. A company’s internal control over financial reporting includes those policies and procedures that (i) pertain to the maintenance of records that, in reasonable detail, accurately and fairly reflect the transactions and dispositions of the assets of the company; (ii) provide reasonable assurance that transactions are recorded as necessary to permit preparation of financial statements in accordance with generally accepted accounting principles, and that receipts and expenditures of the company are being made only in accordance with authorizations of management and directors of the company; and (iii) provide reasonable assurance regarding prevention or timely detection of unauthorized acquisition, use, or disposition of the company’s assets that could have a material effect on the financial statements.
Because of its inherent limitations, internal control over financial reporting may not prevent or detect misstatements. Also, projections of any evaluation of effectiveness to future periods are subject to the risk that controls may become inadequate because of changes in conditions, or that the degree of compliance with the policies or procedures may deteriorate.
/s/ PricewaterhouseCoopers LLP | |
PricewaterhouseCoopers LLP
Minneapolis, Minnesota
February 24, 2006
51
Summary Operating and Financial Data
December 31 (thousands, except per share) | | 2005 | | 2004 | | 2003 | | 2002 | |
Operations | | | | | | | | | |
Net sales | | | | | | | | | |
United States | | $ | 2,327,454 | | $ | 2,135,660 | | $ | 2,014,767 | �� | $ | 1,923,500 | |
International (at average rates of currency exchange during the year) | | 2,207,378 | | 2,049,273 | | 1,747,052 | | 1,480,085 | |
Total | | 4,534,832 | | 4,184,933 | | 3,761,819 | | 3,403,585 | |
Cost of sales (including special charges (income) of $(106) in 2004, $(76) in 2003 and $8,977 in 2002, $(566) in 2001 and $1,948 in 2000) | | 2,248,831 | | 2,033,492 | | 1,846,584 | | 1,688,710 | |
Selling, general and administrative expenses | | 1,743,581 | | 1,657,084 | | 1,459,818 | | 1,304,239 | |
Special charges, sale of business and merger expenses | | | | 4,467 | | 408 | | 37,031 | |
Operating income | | 542,420 | | 489,890 | | 455,009 | | 373,605 | |
Gain on sale of equity investment | | | | | | 11,105 | | | |
Interest expense, net | | 44,238 | | 45,344 | | 45,345 | | 43,895 | |
Income from continuing operations before income taxes, equity earnings and changes in accounting principle | | 498,182 | | 444,546 | | 420,769 | | 329,710 | |
Provision for income taxes | | 178,701 | | 161,853 | | 160,179 | | 131,277 | |
Equity in earnings of Henkel-Ecolab | | | | | | | | | |
Income from continuing operations | | 319,481 | | 282,693 | | 260,590 | | 198,433 | |
Gain from discontinued operations | | | | | | | | 1,882 | |
Changes in accounting principle | | | | | | | | (4,002 | ) |
Net income, as reported | | 319,481 | | 282,693 | | 260,590 | | 196,313 | |
Adjustments | | | | | | | | | |
Adjusted net income | | $ | 319,481 | | $ | 282,693 | | $ | 260,590 | | $ | 196,313 | |
Income per common share, as reported | | | | | | | | | |
Basic - continuing operations | | $ | 1.25 | | $ | 1.10 | | $ | 1.00 | | $ | 0.77 | |
Basic - net income | | 1.25 | | 1.10 | | 1.00 | | 0.76 | |
Diluted - continuing operations | | 1.23 | | 1.09 | | 0.99 | | 0.76 | |
Diluted - net income | | 1.23 | | 1.09 | | 0.99 | | 0.75 | |
Adjusted income per common share | | | | | | | | | |
Basic - continuing operations | | 1.25 | | 1.10 | | 1.00 | | 0.77 | |
Basic - net income | | 1.25 | | 1.10 | | 1.00 | | 0.76 | |
Diluted - continuing operations | | 1.23 | | 1.09 | | 0.99 | | 0.76 | |
Diluted - net income | | $ | 1.23 | | $ | 1.09 | | $ | 0.99 | | $ | 0.75 | |
Weighted-average common shares outstanding - basic | | 255,741 | | 257,575 | | 259,454 | | 258,147 | |
Weighted-average common shares outstanding - diluted | | 260,098 | | 260,407 | | 262,737 | | 261,574 | |
| | | | | | | | | |
Selected Income Statement Ratios | | | | | | | | | |
Gross profit | | 50.4 | % | 51.4 | % | 50.9 | % | 50.4 | % |
Selling, general and administrative expenses | | 38.4 | | 39.6 | | 38.8 | | 38.3 | |
Operating income | | 12.0 | | 11.7 | | 12.1 | | 11.0 | |
Income from continuing operations before income taxes | | 11.0 | | 10.6 | | 11.2 | | 9.7 | |
Income from continuing operations | | 7.0 | | 6.8 | | 6.9 | | 5.8 | |
Effective income tax rate | | 35.9 | % | 36.4 | % | 38.1 | % | 39.8 | % |
| | | | | | | | | |
Financial Position | | | | | | | | | |
Current assets | | $ | 1,421,666 | | $ | 1,279,066 | | $ | 1,150,340 | | $ | 1,015,937 | |
Property, plant and equipment, net | | 835,503 | | 834,730 | | 736,797 | | 680,265 | |
Investment in Henkel-Ecolab | | | | | | | | | |
Goodwill, intangible and other assets | | 1,539,459 | | 1,602,378 | | 1,341,781 | | 1,169,705 | |
Total assets | | $ | 3,796,628 | | $ | 3,716,174 | | $ | 3,228,918 | | $ | 2,865,907 | |
| | | | | | | | | |
Current liabilities | | $ | 1,119,357 | | $ | 939,547 | | $ | 851,942 | | $ | 853,828 | |
Long-term debt | | 519,374 | | 645,445 | | 604,441 | | 539,743 | |
Postretirement health care and pension benefits | | 302,048 | | 270,930 | | 249,906 | | 207,596 | |
Other liabilities | | 206,639 | | 262,111 | | 201,548 | | 144,993 | |
Shareholders’ equity | | 1,649,210 | | 1,598,141 | | 1,321,081 | | 1,119,747 | |
Total liabilities and shareholders’ equity | | $ | 3,796,628 | | $ | 3,716,174 | | $ | 3,228,918 | | $ | 2,865,907 | |
| | | | | | | | | |
Selected Cash Flow Information | | | | | | | | | |
Cash provided by operating activities | | $ | 590,136 | | $ | 570,908 | | $ | 523,932 | | $ | 412,697 | |
Depreciation and amortization | | 256,935 | | 246,954 | | 228,103 | | 220,635 | |
Capital expenditures | | 268,783 | | 275,871 | | 212,035 | | 212,757 | |
Cash dividends declared per common share | | $ | 0.3625 | | $ | 0.3275 | | $ | 0.2975 | | $ | 0.2750 | |
| | | | | | | | | |
Selected Financial Measures/Other | | | | | | | | | |
Total debt | | $ | 746,301 | | $ | 701,577 | | $ | 674,644 | | $ | 699,842 | |
Total debt to capitalization | | 31.2 | % | 30.5 | % | 33.8 | % | 38.5 | % |
Book value per common share | | $ | 6.49 | | $ | 6.21 | | $ | 5.13 | | $ | 4.31 | |
Return on beginning equity | | 20.0 | % | 21.4 | % | 23.3 | % | 21.9 | % |
Dividends per share/diluted net income per common share | | 29.5 | % | 30.0 | % | 30.1 | % | 36.7 | % |
Annual common stock price range | | $ | 37.15-30.68 | | $ | 35.59-26.12 | | $ | 27.92-23.08 | | $ | 25.20-18.27 | |
Number of employees | | 22,404 | | 21,338 | | 20,826 | | 20,417 | |
52
December 31 (thousands, except per share) | | 2001 | | 2000 | | 1999 | | 1998 | | 1997 | | 1996 | | 1995 | |
Operations | | | | | | | | | | | | | | | |
Net sales | | | | | | | | | | | | | | | |
United States | | $ | 1,821,902 | | $ | 1,746,698 | | $ | 1,605,385 | | $ | 1,429,711 | | $ | 1,251,517 | | $ | 1,127,281 | | $ | 1,008,910 | |
International (at average rates of currency exchange during the year) | | 498,808 | | 483,963 | | 444,413 | | 431,366 | | 364,524 | | 341,231 | | 310,755 | |
Total | | 2,320,710 | | 2,230,661 | | 2,049,798 | | 1,861,077 | | 1,616,041 | | 1,468,512 | | 1,319,665 | |
Cost of sales (including special charges (income) of $(106) in 2004, $(76) in 2003 and $8,977 in 2002, $(566) in 2001 and $1,948 in 2000) | | 1,121,133 | | 1,056,899 | | 963,900 | | 875,102 | | 745,437 | | 694,909 | | 622,389 | |
Selling, general and administrative expenses | | 898,159 | | 864,072 | | 804,436 | | 730,170 | | 655,726 | | 590,641 | | 535,528 | |
Special charges, sale of business and merger expenses | | 824 | | (20,736 | ) | | | | | | | | | | |
Operating income | | 300,594 | | 330,426 | | 281,462 | | 255,805 | | 214,878 | | 182,962 | | 161,748 | |
Gain on sale of equity investment | | | | | | | | | | | | | | | |
Interest expense, net | | 28,434 | | 24,605 | | 22,713 | | 21,742 | | 12,637 | | 14,372 | | 11,505 | |
Income from continuing operations before income taxes, equity earnings and changes in accounting principle | | 272,160 | | 305,821 | | 258,749 | | 234,063 | | 202,241 | | 168,590 | | 150,243 | |
Provision for income taxes | | 110,453 | | 124,467 | | 106,412 | | 99,340 | | 83,911 | | 69,840 | | 59,323 | |
Equity in earnings of Henkel-Ecolab | | 15,833 | | 19,516 | | 18,317 | | 16,050 | | 13,433 | | 13,011 | | 7,702 | |
Income from continuing operations | | 177,540 | | 200,870 | | 170,654 | | 150,773 | | 131,763 | | 111,761 | | 98,622 | |
Gain from discontinued operations | | | | | | | | 38,000 | | | | | | | |
Changes in accounting principle | | | | (2,428 | ) | | | | | | | | | | |
Net income, as reported | | 177,540 | | 198,442 | | 170,654 | | 188,773 | | 131,763 | | 111,761 | | 98,622 | |
Adjustments | | 18,471 | | 17,762 | | 16,631 | | 14,934 | | 11,195 | | 10,683 | | 8,096 | |
Adjusted net income | | $ | 196,011 | | $ | 216,204 | | $ | 187,285 | | $ | 203,707 | | $ | 142,958 | | $ | 122,444 | | $ | 106,718 | |
Income per common share, as reported | | | | | | | | | | | | | | | |
Basic - continuing operations | | $ | 0.70 | | $ | 0.79 | | $ | 0.66 | | $ | 0.58 | | $ | 0.51 | | $ | 0.43 | | $ | 0.37 | |
Basic - net income | | 0.70 | | 0.78 | | 0.66 | | 0.73 | | 0.51 | | 0.43 | | 0.37 | |
Diluted - continuing operations | | 0.68 | | 0.76 | | 0.63 | | 0.56 | | 0.49 | | 0.42 | | 0.37 | |
Diluted - net income | | 0.68 | | 0.75 | | 0.63 | | 0.70 | | 0.49 | | 0.42 | | 0.37 | |
Adjusted income per common share | | | | | | | | | | | | | | | |
Basic - continuing operations | | 0.77 | | 0.86 | | 0.72 | | 0.64 | | 0.55 | | 0.47 | | 0.40 | |
Basic - net income | | 0.77 | | 0.85 | | 0.72 | | 0.79 | | 0.55 | | 0.47 | | 0.40 | |
Diluted - continuing operations | | 0.75 | | 0.83 | | 0.70 | | 0.62 | | 0.53 | | 0.46 | | 0.40 | |
Diluted - net income | | $ | 0.75 | | $ | 0.82 | | $ | 0.70 | | $ | 0.76 | | $ | 0.53 | | $ | 0.46 | | $ | 0.40 | |
Weighted-average common shares outstanding - basic | | 254,832 | | 255,505 | | 259,099 | | 258,314 | | 258,891 | | 257,983 | | 264,387 | |
Weighted-average common shares outstanding - diluted | | 259,855 | | 263,892 | | 268,837 | | 268,095 | | 267,643 | | 265,634 | | 269,912 | |
| | | | | | | | | | | | | | | |
Selected Income Statement Ratios | | | | | | | | | | | | | | | |
Gross profit | | 51.7 | % | 52.6 | % | 53.0 | % | 53.0 | % | 53.9 | % | 52.7 | % | 52.8 | % |
Selling, general and administrative expenses | | 38.7 | | 38.7 | | 39.2 | | 39.2 | | 40.6 | | 40.2 | | 40.6 | |
Operating income | | 13.0 | | 14.8 | | 13.7 | | 13.7 | | 13.3 | | 12.5 | | 12.3 | |
Income from continuing operations before income taxes | | 11.7 | | 13.7 | | 12.6 | | 12.6 | | 12.5 | | 11.5 | | 11.4 | |
Income from continuing operations | | 7.7 | | 9.0 | | 8.3 | | 8.1 | | 8.2 | | 7.6 | | 7.5 | |
Effective income tax rate | | 40.6 | % | 40.7 | % | 41.1 | % | 42.4 | % | 41.5 | % | 41.4 | % | 39.5 | % |
| | | | | | | | | | | | | | | |
Financial Position | | | | | | | | | | | | | | | |
Current assets | | $ | 929,583 | | $ | 600,568 | | $ | 577,321 | | $ | 503,514 | | $ | 509,501 | | $ | 435,507 | | $ | 358,072 | |
Property, plant and equipment, net | | 644,323 | | 501,640 | | 448,116 | | 420,205 | | 395,562 | | 332,314 | | 292,937 | |
Investment in Henkel-Ecolab | | | | 199,642 | | 219,003 | | 253,646 | | 239,879 | | 285,237 | | 302,298 | |
Goodwill, intangible and other assets | | 967,490 | | 422,812 | | 348,226 | | 297,264 | | 272,706 | | 155,403 | | 106,711 | |
Total assets | | $ | 2,541,396 | | $ | 1,724,662 | | $ | 1,592,666 | | $ | 1,474,629 | | $ | 1,417,648 | | $ | 1,208,461 | | $ | 1,060,018 | |
| | | | | | | | | | | | | | | |
Current liabilities | | $ | 827,952 | | $ | 532,034 | | $ | 470,674 | | $ | 399,791 | | $ | 404,464 | | $ | 327,771 | | $ | 310,538 | |
Long-term debt | | 512,280 | | 234,377 | | 169,014 | | 227,041 | | 259,384 | | 148,683 | | 89,402 | |
Postretirement health care and pension benefits | | 183,281 | | 117,790 | | 97,527 | | 85,793 | | 76,109 | | 73,577 | | 70,666 | |
Other liabilities | | 121,135 | | 72,803 | | 86,715 | | 67,829 | | 124,641 | | 138,415 | | 133,616 | |
Shareholders’ equity | | 896,748 | | 767,658 | | 768,736 | | 694,175 | | 553,050 | | 520,015 | | 455,796 | |
Total liabilities and shareholders’ equity | | $ | 2,541,396 | | $ | 1,724,662 | | $ | 1,592,666 | | $ | 1,474,629 | | $ | 1,417,648 | | $ | 1,208,461 | | $ | 1,060,018 | |
| | | | | | | | | | | | | | | |
Selected Cash Flow Information | | | | | | | | | | | | | | | |
Cash provided by operating activities | | $ | 358,508 | | $ | 309,813 | | $ | 290,098 | | $ | 233,727 | | $ | 234,126 | | $ | 253,819 | | $ | 166,463 | |
Depreciation and amortization | | 158,785 | | 143,212 | | 129,240 | | 117,646 | | 97,449 | | 86,791 | | 73,826 | |
Capital expenditures | | 157,937 | | 150,009 | | 145,622 | | 147,631 | | 121,667 | | 111,518 | | 109,894 | |
Cash dividends declared per common share | | $ | 0.2625 | | $ | 0.2450 | | $ | 0.2175 | | $ | 0.1950 | | $ | 0.1675 | | $ | 0.1450 | | $ | 0.1288 | |
| | | | | | | | | | | | | | | |
Selected Financial Measures/Other | | | | | | | | | | | | | | | |
Total debt | | $ | 745,673 | | $ | 370,969 | | $ | 281,074 | | $ | 295,032 | | $ | 308,268 | | $ | 176,292 | | $ | 161,049 | |
Total debt to capitalization | | 45.4 | % | 32.6 | % | 26.8 | % | 29.8 | % | 35.8 | % | 25.3 | % | 26.1 | % |
Book value per common share | | $ | 3.51 | | $ | 3.02 | | $ | 2.97 | | $ | 2.68 | | $ | 2.14 | | $ | 2.01 | | $ | 1.76 | |
Return on beginning equity | | 23.1 | % | 25.8 | % | 24.6 | % | 34.1 | % | 25.3 | % | 24.5 | % | 21.4 | % |
Dividends per share/diluted net income per common share | | 38.6 | % | 32.7 | % | 34.5 | % | 27.9 | % | 34.2 | % | 34.5 | % | 34.8 | % |
Annual common stock price range | | $ | 22.10-14.25 | | $ | 22.85-14.00 | | $ | 22.22-15.85 | | $ | 19.00-13.07 | | $ | 14.00-9.07 | | $ | 9.88-7.28 | | $ | 7.94-5.00 | |
Number of employees | | 19,326 | | 14,250 | | 12,870 | | 12,007 | | 10,210 | | 9,573 | | 9,026 | |
Results for 1995 through 2004 have been restated to reflect the effect of retroactive application of SFAS No. 123R, “Share-Based Payment”. The former Henkel-Ecolab joint venture is included as a consolidated subsidiary effective November 30, 2001. Adjusted results for 1995 through 2001 reflect the pro forma effect of the discontinuance of the amortization of goodwill as if SFAS No. 142 had been in effect since January 1, 1995. All per share, shares outstanding and market price data reflect the two-for-one stock splits declared in 2003 and 1997. Return on beginning equity is net income divided by beginning shareholders’ equity.
53