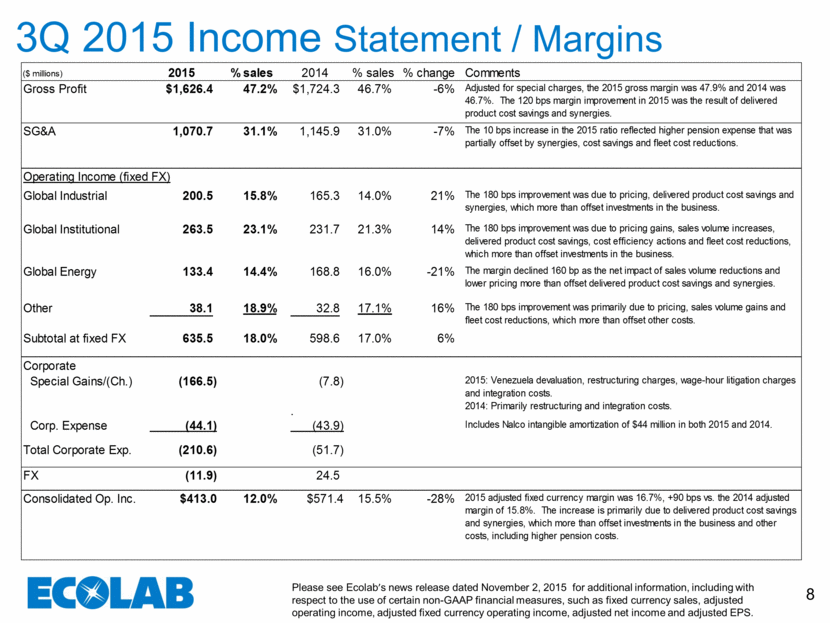
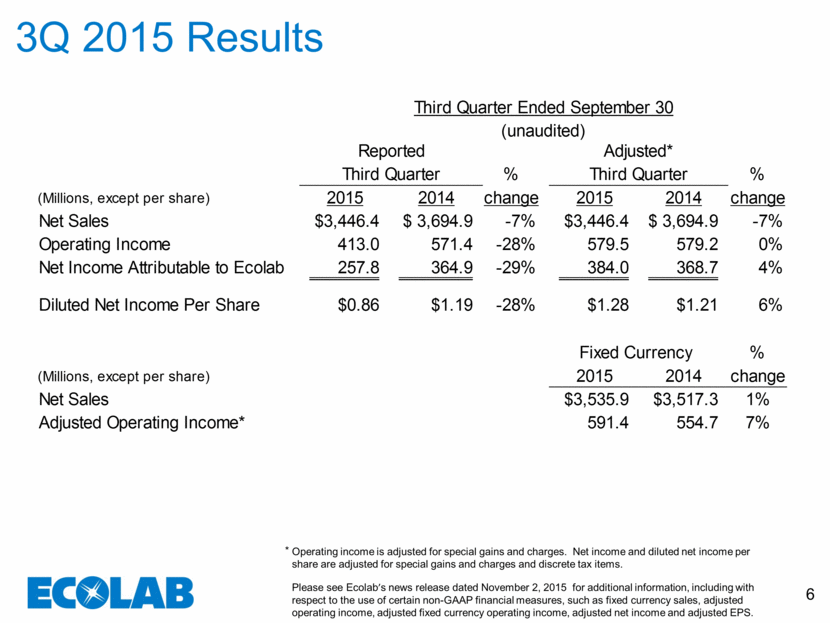
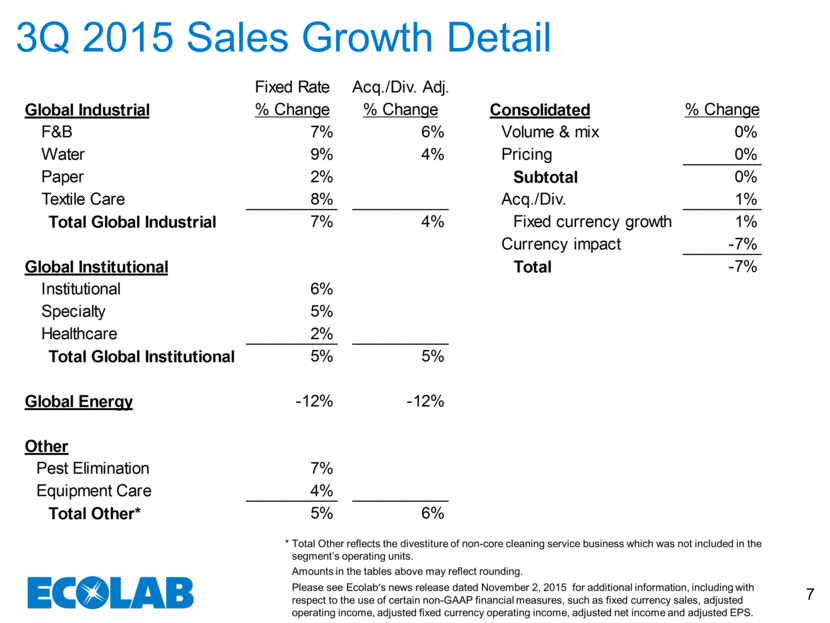
8 3Q 2015 Income Statement / Margins ($ millions) 2015 % sales 2014 % sales % change Comments 2014 2013 Gross Profit $1,626.4 47.2% $1,724.3 46.7% -6% Adjusted for special charges, the 2015 gross margin was 47.9% and 2014 was 46.7%. The 120 bps margin improvement in 2015 was the result of delivered product cost savings and synergies. Net sales $ 3,446.4 $ 3,694.9 -7% $ 14,280.5 $ 13,253.4 8% Fixed currency sales 3,535.9 3,517.3 Cost of sales (1) 1,820.0 1,970.6 -8% 7,679.1 7,161.2 7% SG&A 1,070.7 31.1% 1,145.9 31.0% -7% The 10 bps increase in the 2015 ratio reflected higher pension expense that was partially offset by synergies, cost savings and fleet cost reductions. Selling, general and administrative expenses 1,070.7 1,145.9 -7% 4,577.6 4,360.3 5% Gross profit $ 1,626.4 $ 1,724.3 Operating Income (fixed FX) Net Sales Global Industrial 200.5 15.8% 165.3 14.0% 21% The 180 bps improvement was due to pricing, delivered product cost savings and synergies, which more than offset investments in the business. Global Industrial $ 1,268.0 $ 1,183.9 7% $ 4,886.7 $ 4,742.8 3% Global Institutional 1,139.4 1,085.9 5% 4,314.5 4,152.5 4% Global Energy 926.8 1,055.7 -12% 4,283.3 3,427.3 25% Global Institutional 263.5 23.1% 231.7 21.3% 14% The 180 bps improvement was due to pricing gains, sales volume increases, delivered product cost savings, cost efficiency actions and fleet cost reductions, which more than offset investments in the business. Other 201.7 191.8 5% 750.3 709.3 6% Subtotal at fixed currency rates 3,535.9 3,517.3 1% 14,234.8 13,031.9 9% Global Energy 133.4 14.4% 168.8 16.0% -21% The margin declined 160 bp as the net impact of sales volume reductions and lower pricing more than offset delivered product cost savings and synergies. Currency impact (89.5) 177.6 45.7 221.5 Consolidated $ 3,446.4 $ 3,694.9 -7% $ 14,280.5 $ 13,253.4 8% Other 38.1 18.9% 32.8 17.1% 16% The 180 bps improvement was primarily due to pricing, sales volume gains and fleet cost reductions, which more than offset other costs. Operating Income Subtotal at fixed FX 635.5 18.0% 598.6 17.0% 6% Global Industrial $ 200.5 $ 165.3 21% $ 642.6 $ 603.0 7% Global Institutional 263.5 231.7 14% 821.2 768.2 7% Corporate Global Energy 133.4 168.8 -21% 634.9 458.9 38% Special Gains/(Ch.) (166.5) (7.8) 2015: Venezuela devaluation, restructuring charges, wage-hour litigation charges and integration costs. 2014: Primarily restructuring and integration costs. Other 38.1 32.8 16% 116.5 104.1 12% . Corporate (210.6) (51.7) (263.4) (409.1) Corp. Expense (44.1) (43.9) Includes Nalco intangible amortization of $44 million in both 2015 and 2014. Subtotal at fixed currency rates 424.9 546.9 -22% 1,951.8 1,525.1 28% Total Corporate Exp. (210.6) (51.7) Currency impact (11.9) 24.5 3.2 35.5 Consolidated $ 413.0 $ 571.4 -28% $ 1,955.0 $ 1,560.6 25% FX (11.9) 24.5 Consolidated Op. Inc. $413.0 12.0% $571.4 15.5% -28% 2015 adjusted fixed currency margin was 16.7%, +90 bps vs. the 2014 adjusted margin of 15.8%. The increase is primarily due to delivered product cost savings and synergies, which more than offset investments in the business and other costs, including higher pension costs. $3,337.8 $ 2,958.7 13% $ 6,209.9 $ 5,769.6 8% 1,828.6 1,608.9 14% 3,393.5 3,222.9 5% 1,083.3 981.7 10% 2,079.1 1,971.4 5% 73.6 41.6 123.3 83.0 Operating Income United States Cleaning & Sanitizing Other Services Total International Corporate Effect of foreign currency translation Consolidated
