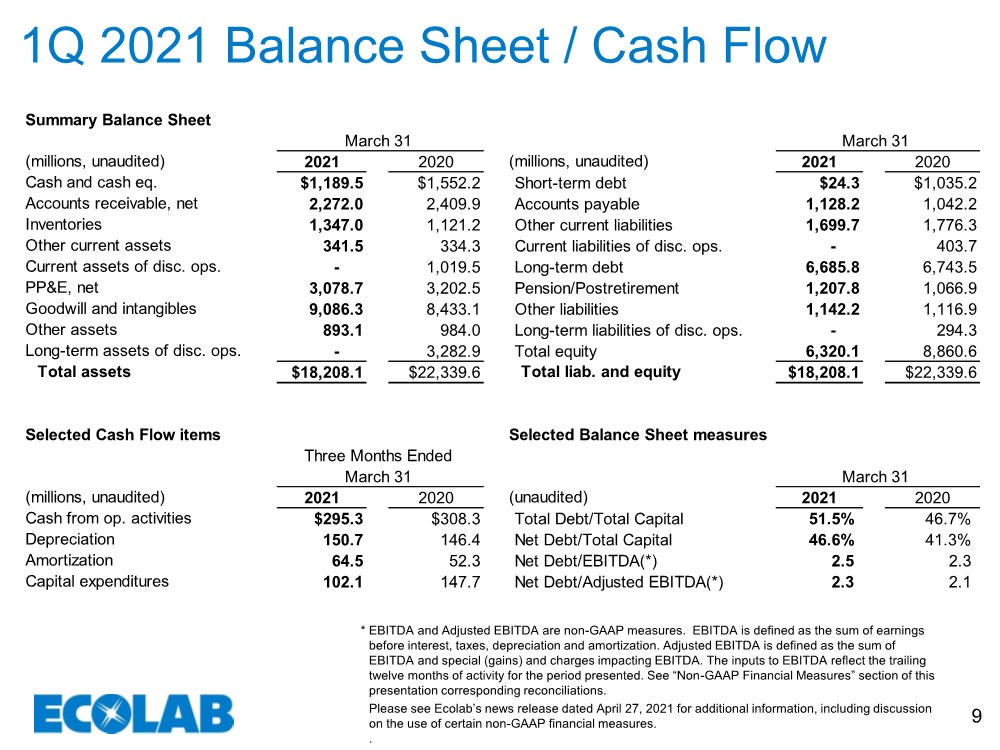
| Please see Ecolab’s news release dated April 27, 2021 for additional information, including discussion on the use of certain non-GAAP financial measures. .. 9 1Q 2021 Balance Sheet / Cash Flow EBITDA and Adjusted EBITDA are non-GAAP measures. EBITDA is defined as the sum of earnings before interest, taxes, depreciation and amortization. Adjusted EBITDA is defined as the sum of EBITDA and special (gains) and charges impacting EBITDA. The inputs to EBITDA reflect the trailing twelve months of activity for the period presented. See “Non-GAAP Financial Measures” section of this presentation corresponding reconciliations. * Summary Balance Sheet (millions, unaudited) 2021 2020 (millions, unaudited) 2021 2020 Cash and cash eq. $1,189.5 $1,552.2 Short-term debt $24.3 $1,035.2 Accounts receivable, net 2,272.0 2,409.9 Accounts payable 1,128.2 1,042.2 Inventories 1,347.0 1,121.2 Other current liabilities 1,699.7 1,776.3 Other current assets 341.5 334.3 Current liabilities of disc. ops. - 403.7 Current assets of disc. ops. - 1,019.5 Long-term debt 6,685.8 6,743.5 PP&E, net 3,078.7 3,202.5 Pension/Postretirement 1,207.8 1,066.9 Goodwill and intangibles 9,086.3 8,433.1 Other liabilities 1,142.2 1,116.9 Other assets 893.1 984.0 Long-term liabilities of disc. ops. - 294.3 Long-term assets of disc. ops. - 3,282.9 Total equity 6,320.1 8,860.6 Total assets $18,208.1 $22,339.6 Total liab. and equity $18,208.1 $22,339.6 Selected Cash Flow items (millions, unaudited) 2021 2020 (unaudited) 2021 2020 Cash from op. activities $295.3 $308.3 Total Debt/Total Capital 51.5% 46.7% Depreciation 150.7 146.4 Net Debt/Total Capital 46.6% 41.3% Amortization 64.5 52.3 Net Debt/EBITDA(*) 2.5 2.3 Capital expenditures 102.1 147.7 Net Debt/Adjusted EBITDA(*) 2.3 2.1 March 31 March 31 Three Months Ended Selected Balance Sheet measures March 31 March 31 |