Exhibit 99.1
Link to searchable text of slide shown above
Link to searchable text of slide shown above
Link to searchable text of slide shown above

Link to searchable text of slide shown above
Link to searchable text of slide shown above
Link to searchable text of slide shown above
Link to searchable text of slide shown above
Link to searchable text of slide shown above

Link to searchable text of slide shown above
Link to searchable text of slide shown above
Link to searchable text of slide shown above
Link to searchable text of slide shown above

Link to searchable text of slide shown above
Link to searchable text of slide shown above
Link to searchable text of slide shown above
Link to searchable text of slide shown above

Link to searchable text of slide shown above
Link to searchable text of slide shown above
Link to searchable text of slide shown above
Link to searchable text of slide shown above
Link to searchable text of slide shown above
Link to searchable text of slide shown above

Link to searchable text of slide shown above
Link to searchable text of slide shown above

Link to searchable text of slide shown above
Link to searchable text of slide shown above

Link to searchable text of slide shown above
Link to searchable text of slide shown above
Link to searchable text of slide shown above
Link to searchable text of slide shown above
Link to searchable text of slide shown above

Link to searchable text of slide shown above
Link to searchable text of slide shown above
Link to searchable text of slide shown above
Link to searchable text of slide shown above

Link to searchable text of slide shown above
Link to searchable text of slide shown above

Link to searchable text of slide shown above
Link to searchable text of slide shown above
Link to searchable text of slide shown above
Searchable text section of graphics shown above
[LOGO]
Investor Presentation
September 2004
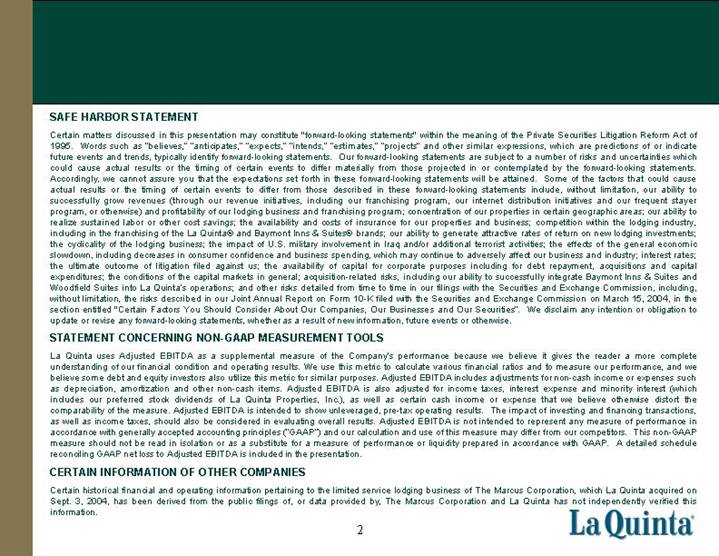
SAFE HARBOR STATEMENT
Certain matters discussed in this presentation may constitute “forward-looking statements” within the meaning of the Private Securities Litigation Reform Act of 1995. Words such as “believes,” “anticipates,” “expects,” “intends,” “estimates,” “projects” and other similar expressions, which are predictions of or indicate future events and trends, typically identify forward-looking statements. Our forward-looking statements are subject to a number of risks and uncertainties which could cause actual results or the timing of certain events to differ materially from those projected in or contemplated by the forward- looking statements. Accordingly, we cannot assure you that the expectations set forth in these forward-looking statements will be attained. Some of the factors that could cause actual results or the timing of certain events to differ from those described in these forward-looking statements include, without limitation, our ability to successfully grow revenues (through our revenue initiatives, including our franchising program, our internet distribution initiatives and our frequent stayer program, or otherwise) and profitability of our lodging business and franchising program; concentration of our properties in certain geographic areas; our ability to realize sustained labor or other cost savings; the availability and costs of insurance for our properties and business; competition within the lodging industry, including in the franchising of the La Quinta® and Baymont Inns & Suites® brands; our ability to generate attractive rates of return on new lodging investments; the cyclicality of the lodging business; the impact of U.S. military involvement in Iraq and/or additional terrorist activities; the effects of the general economic slowdown, including decreases in consumer confidence and business spending, which may continue to adversely affect our business and industry; interest rates; the ultimate outcome of litigation filed against us; the availability of capital for corporate purposes including for debt repayment, acquisitions and capital expenditures; the conditions of the capital markets in general; acquisition-related risks, including our ability to successfully integrate Baymont Inns & Suites and Woodfield Suites into La Quinta’s operations; and other risks detailed from time to time in our filings with the Securities and Exchange Commission, including, without limitation, the risks described in our Joint Annual Report on Form 10-K filed with the Securities and Exchange Commission on March 15, 2004, in the section entitled “Certain Factors You Should Consider About Our Companies, Our Businesses and Our Securities”. We disclaim any intention or obligation to update or revise any forward-looking statements, whether as a result of new information, future events or otherwise.
STATEMENT CONCERNING NON-GAAP MEASUREMENT TOOLS
La Quinta uses Adjusted EBITDA as a supplemental measure of the Company’s performance because we believe it gives the reader a more complete understanding of our financial condition and operating results. We use this metric to calculate various financial ratios and to measure our performance, and we believe some debt and equity investors also utilize this metric for similar purposes. Adjusted EBITDA includes adjustments for non-cash income or expenses such as depreciation, amortization and other non-cash items. Adjusted EBITDA is also adjusted for income taxes, interest expense and minority interest (which includes our preferred stock dividends of La Quinta Properties, Inc.), as well as certain cash income or expense that we believe otherwise distort the comparability of the measure. Adjusted EBITDA is intended to show unleveraged, pre-tax operating results. The impact of investing and financing transactions, as well as income taxes, should also be considered in evaluating overall results. Adjusted EBITDA is not intended to represent any measure of performance in accordance with generally accepted accounting principles (“GAAP”) and our calculation and use of this measure may differ from our competitors. This non-GAAP measure should not be read in isolation or as a substitute for a measure of performance or liquidity prepared in accordance with GAAP. A detailed schedule reconciling GAAP net loss to Adjusted EBITDA is included in the presentation.
CERTAIN INFORMATION OF OTHER COMPANIES
Certain historical financial and operating information pertaining to the limited service lodging business of The Marcus Corporation, which La Quinta acquired on Sept. 3, 2004, has been derived from the public filings of, or data provided by, The Marcus Corporation and La Quinta has not independently verified this information.
[LOGO]
2
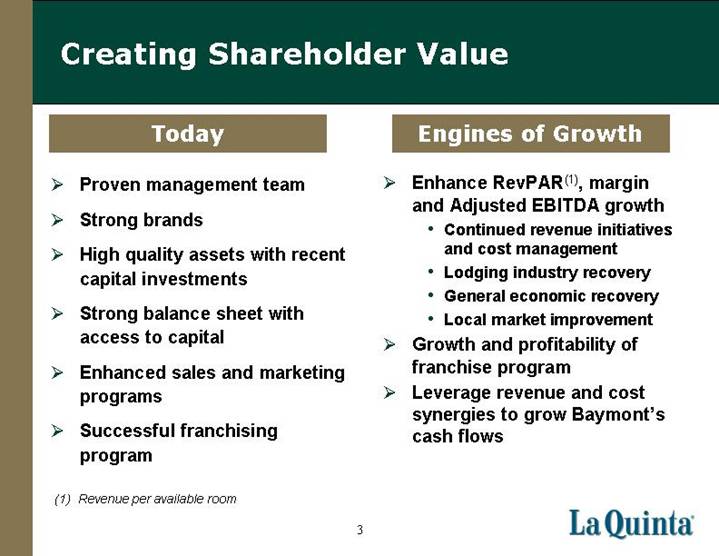
Creating Shareholder Value
Today
• Proven management team
• Strong brands
• High quality assets with recent capital investments
• Strong balance sheet with access to capital
• Enhanced sales and marketing programs
• Successful franchising program
Engines of Growth
• Enhance RevPAR(1), margin and Adjusted EBITDA growth
• Continued revenue initiatives and cost management
• Lodging industry recovery
• General economic recovery
• Local market improvement
• Growth and profitability of franchise program
• Leverage revenue and cost synergies to grow Baymont’s cash flows
(1) Revenue per available room
3
COMPANY OVERVIEW
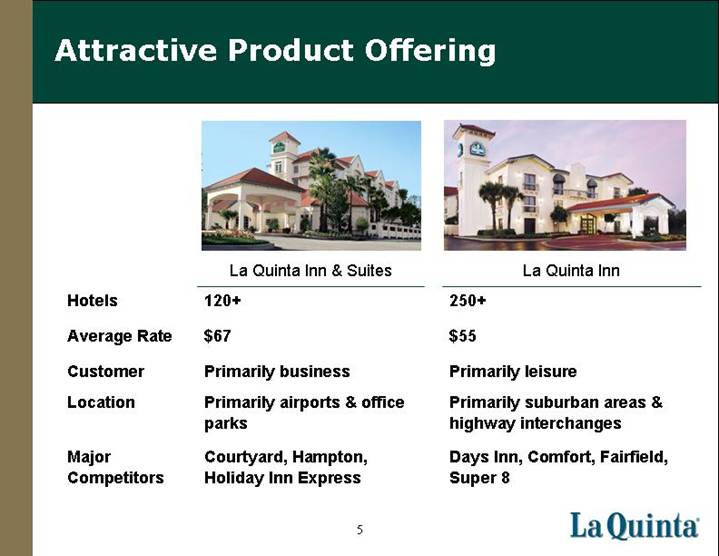
Attractive Product Offering
| | La Quinta Inn & Suites | | La Quinta Inn |
Hotels | | 120+ | | 250+ |
| | | | |
Average Rate | | $67 | | $55 |
| | | | |
Customer | | Primarily business | | Primarily leisure |
| | | | |
Location | | Primarily airports & office parks | | Primarily suburban areas & highway interchanges |
| | | | |
Major Competitors | | Courtyard, Hampton, Holiday Inn Express | | Days Inn, Comfort, Fairfield, Super 8 |
5
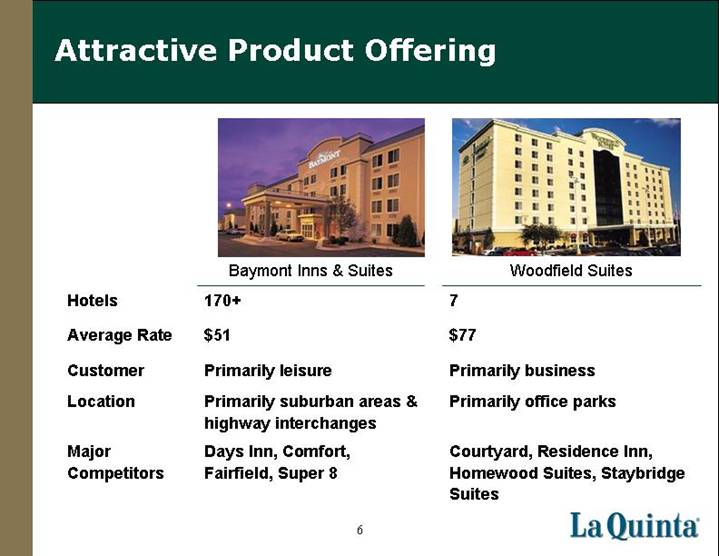
Attractive Product Offering
| | Baymont Inns & Suites | | Woodfield Suites |
Hotels | | 170+ | | 7 |
| | | | |
Average Rate | | $51 | | $77 |
| | | | |
Customer | | Primarily leisure | | Primarily business |
| | | | |
Location | | Primarily suburban areas & highway interchanges | | Primarily office parks |
| | | | |
Major Competitors | | Days Inn, Comfort, Fairfield, Super 8 | | Courtyard, Residence Inn, Homewood Suites, Staybridge Suites |
6
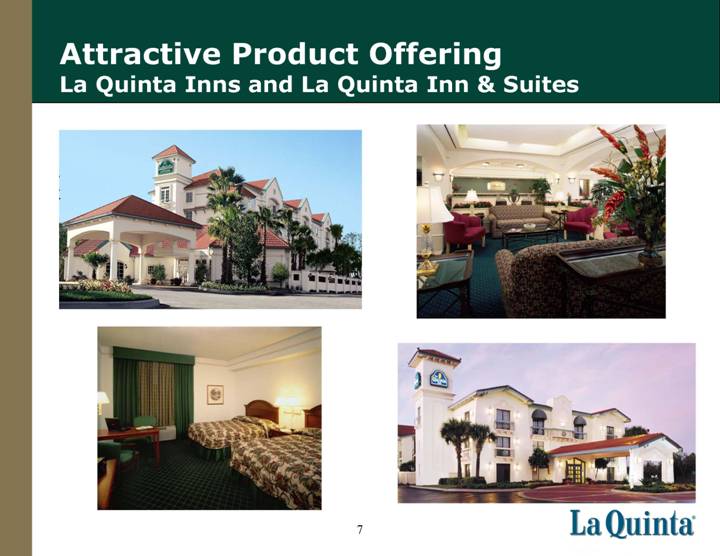
Attractive Product Offering
La Quinta Inns and La Quinta Inn & Suites
[GRAPHICS]
7
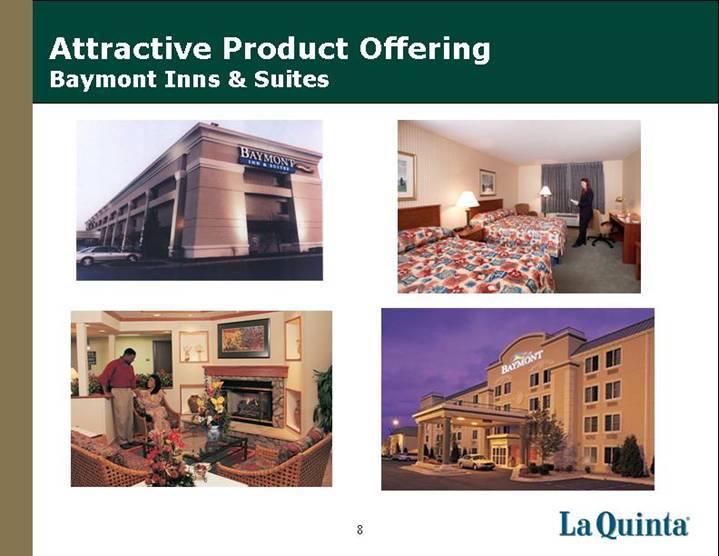
Attractive Product Offering
Baymont Inns & Suites
[GRAPHICS]
8
Attractive Product Offering
Woodfield Suites
[GRAPHICS]
9
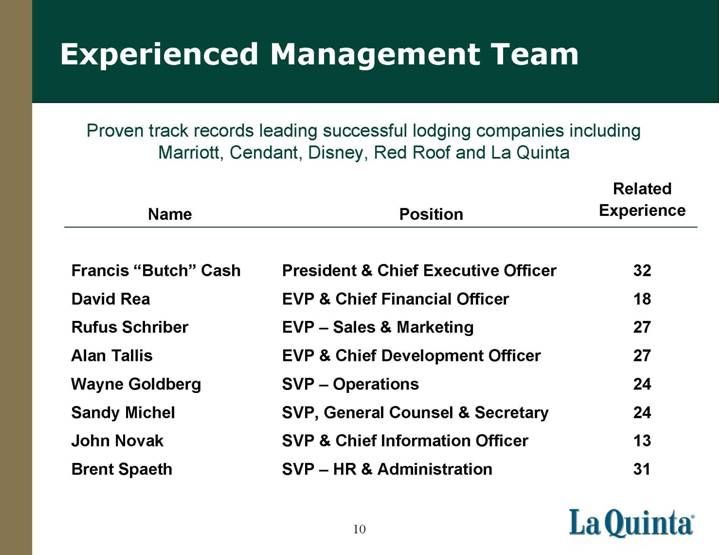
Experienced Management Team
Proven track records leading successful lodging companies including Marriott, Cendant, Disney, Red Roof and La Quinta
Name | | Position | | Related
Experience |
| | | | |
Francis “Butch” Cash | | President & Chief Executive Officer | | 32 |
David Rea | | EVP & Chief Financial Officer | | 18 |
Rufus Schriber | | EVP – Sales & Marketing | | 27 |
Alan Tallis | | EVP & Chief Development Officer | | 27 |
Wayne Goldberg | | SVP – Operations | | 24 |
Sandy Michel | | SVP, General Counsel & Secretary | | 24 |
John Novak | | SVP & Chief Information Officer | | 13 |
Brent Spaeth | | SVP – HR & Administration | | 31 |
10
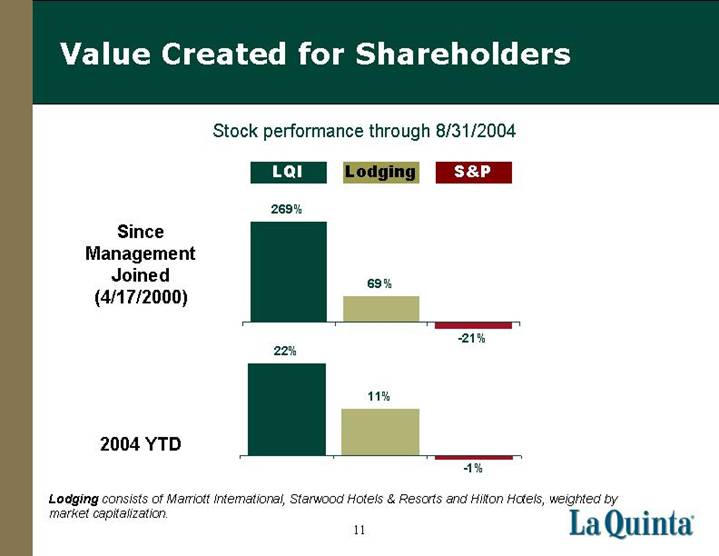
Value Created for Shareholders
Stock performance through 8/31/2004
Since Management Joined (4/17/2000)
[CHART]
2004 YTD
[CHART]
Lodging consists of Marriott International, Starwood Hotels & Resorts and Hilton Hotels, weighted by market capitalization.
11
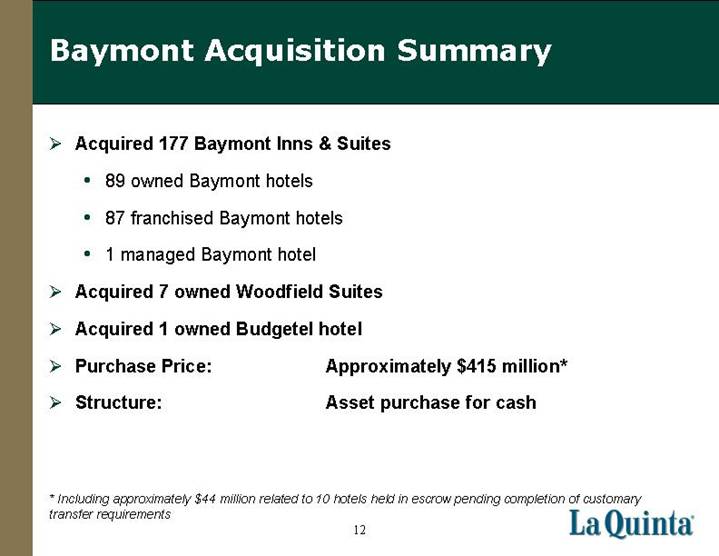
Baymont Acquisition Summary
• Acquired 177 Baymont Inns & Suites |
|
• 89 owned Baymont hotels |
• 87 franchised Baymont hotels |
• 1 managed Baymont hotel |
|
• Acquired 7 owned Woodfield Suites |
|
• Acquired 1 owned Budgetel hotel |
|
• Purchase Price: | | Approximately $415 million* |
|
• Structure: | | Asset purchase for cash |
| | | |
* Including approximately $44 million related to 10 hotels held in escrow pending completion of customary transfer requirements.
12
Baymont Acquisition Benefits
• Excellent strategic / operational fit
• Integrate a comparable type of asset and a business that runs similarly to La Quinta
• Diversify real estate concentration
• Expect to increase Baymont’s LTM 05/04 segment EBITDA of $33 million
• Enhance revenue performance
• Reduce operating costs
• Reduce corporate overhead by $4 million
• Expect to generate 10-12% cash on cash, unlevered returns in 2-3 years
• Purchased real estate at average of $37,000 per key (approximately $34,000 per key for Baymont real estate alone)
• Baymont replacement cost estimated at $55,000 per key
• Purchased business at attractive multiple
• 11x pro forma EBITDA of $37 million
13
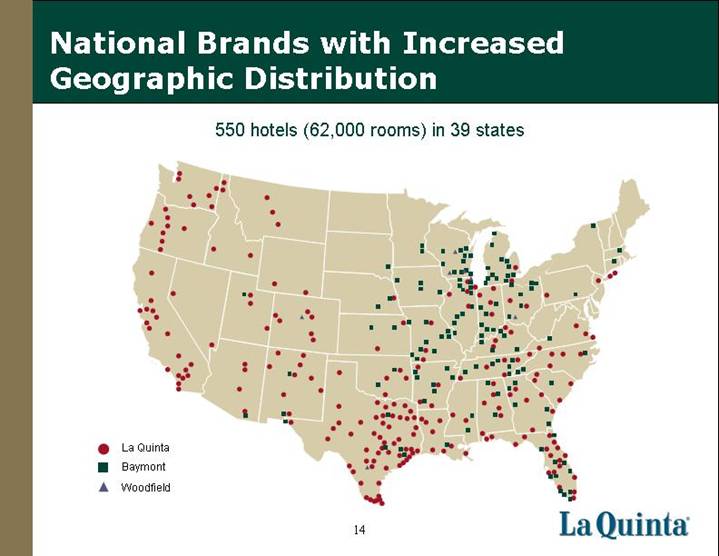
National Brands with Increased Geographic Distribution
550 hotels (62,000 rooms) in 39 states
[GRAPHIC]
14
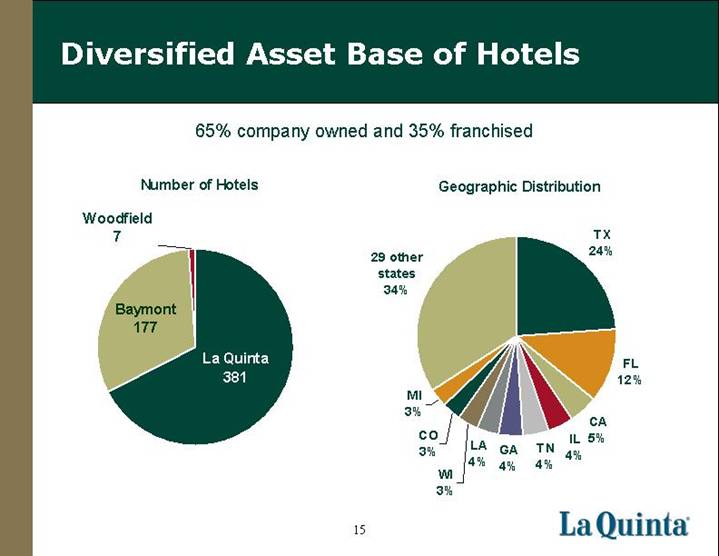
Diversified Asset Base of Hotels
65% company owned and 35% franchised
Number of Hotels
[CHART]
Geographic Distribution
[CHART]
15
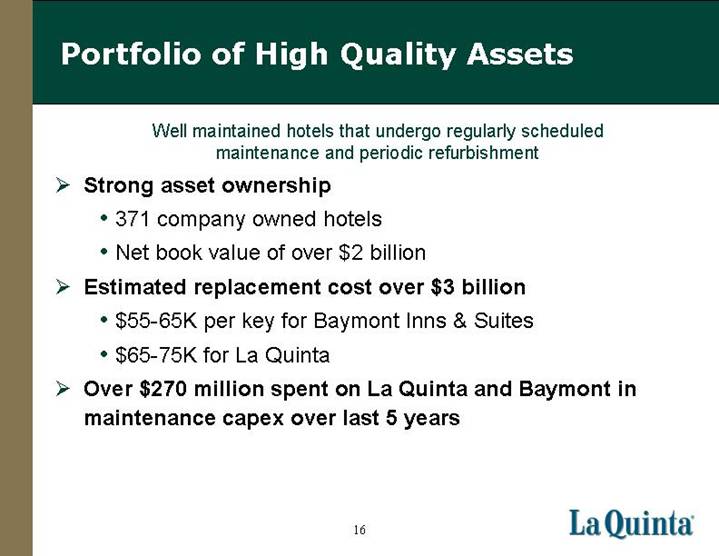
Portfolio of High Quality Assets
Well maintained hotels that undergo regularly scheduled maintenance and periodic refurbishment
• Strong asset ownership
• 371 company owned hotels
• Net book value of over $2 billion
• Estimated replacement cost over $3 billion
• $55-65K per key for Baymont Inns & Suites
• $65-75K for La Quinta
• Over $270 million spent on La Quinta and Baymont in maintenance capex over last 5 years
16
FINANCIAL REVIEW
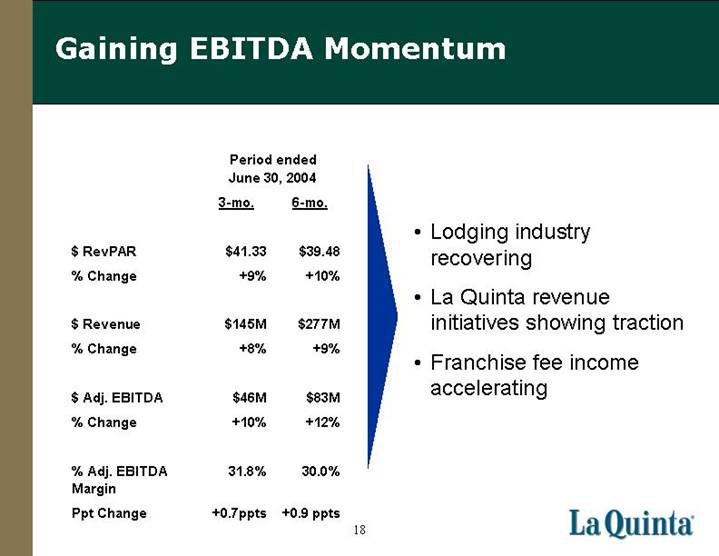
Gaining EBITDA Momentum
| | Period ended
June 30, 2004 | |
| | 3-mo. | | 6-mo. | |
| | | | | |
$ RevPAR | | $ | 41.33 | | $ | 39.48 | |
% Change | | +9 | % | +10 | % |
| | | | | |
$ Revenue | | $ | 145 | M | $ | 277 | M |
% Change | | +8 | % | +9 | % |
| | | | | |
Adj. EBITDA | | $ | 46 | M | $ | 83 | M |
% Change | | +10 | % | +12 | % |
| | | | | |
% Adj. EBITDA Margin | | 31.8 | % | 30.0 | % |
Ppt Change | | +0.7 | ppts | +0.9 | ppts |
• Lodging industry recovering
• La Quinta revenue initiatives showing traction
• Franchise fee income accelerating
18
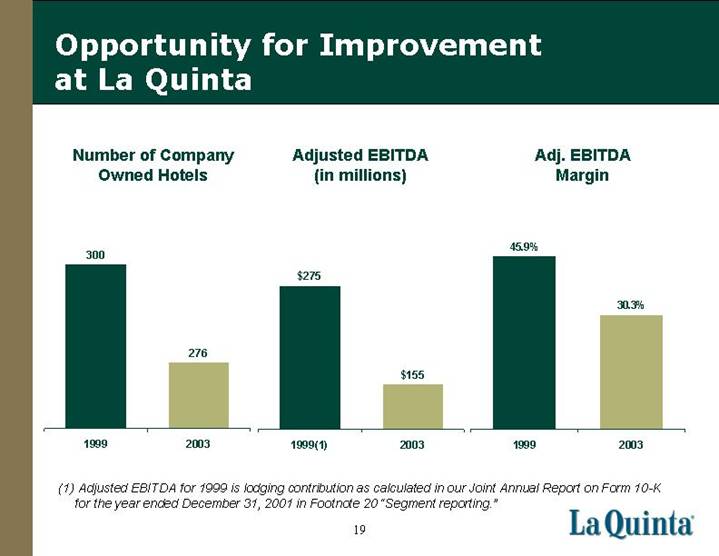
Opportunity for Improvement at La Quinta
Number of Company Owned Hotels
[CHART]
Adjusted EBITDA
(in millions)
[CHART]
Adj. EBITDA Margin
[CHART]
(1) Adjusted EBITDA for 1999 is lodging contribution as calculated in our Joint Annual Report on Form 10-K for the year ended December 31, 2001 in Footnote 20 “Segment reporting.”
19
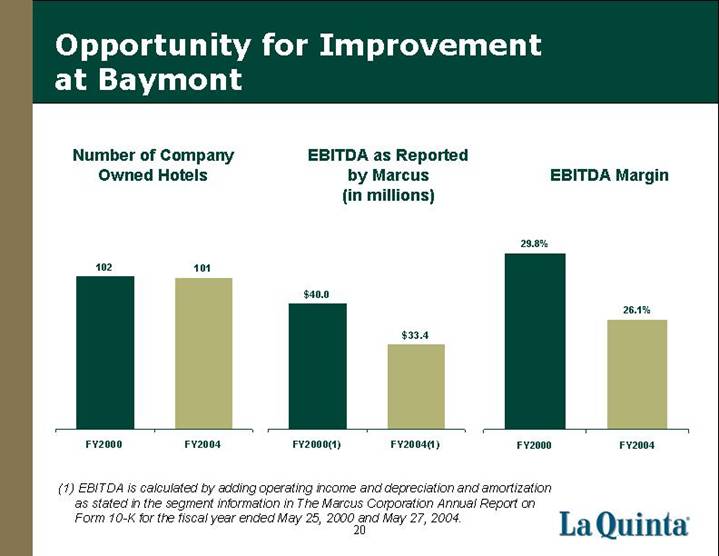
Opportunity for Improvement at Baymont
Number of Company Owned Hotels
[CHART]
EBITDA as Reported by Marcus
(in millions)
[CHART]
EBITDA Margin
[CHART]
(1) EBITDA is calculated by adding operating income and depreciation and amortization as stated in the segment information in The Marcus Corporation Annual Report on Form 10-K for the fiscal year ended May 25, 2000 and May 27, 2004.
20
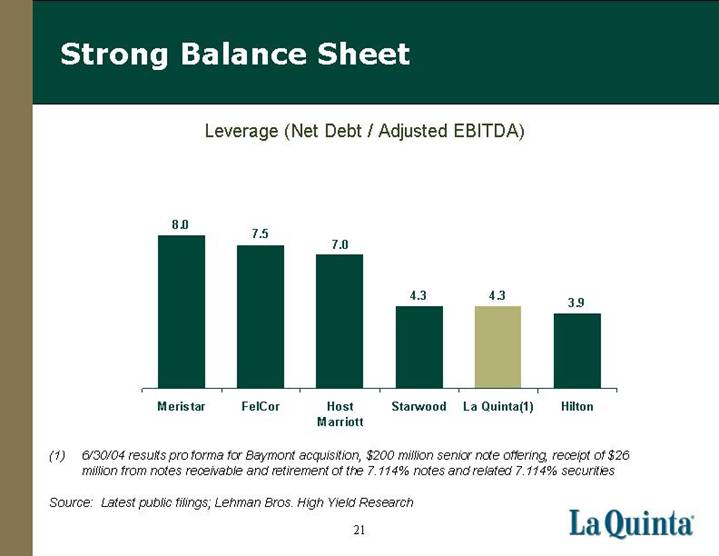
Strong Balance Sheet
Leverage (Net Debt / Adjusted EBITDA)
[CHART]
(1) 6/30/04 results pro forma for Baymont acquisition, $200 million senior note offering, receipt of $26 million from notes receivable, and retirement of the 7.114% notes and related 7.114% securities
Source: Latest public filings; Lehman Bros. High Yield Research
21
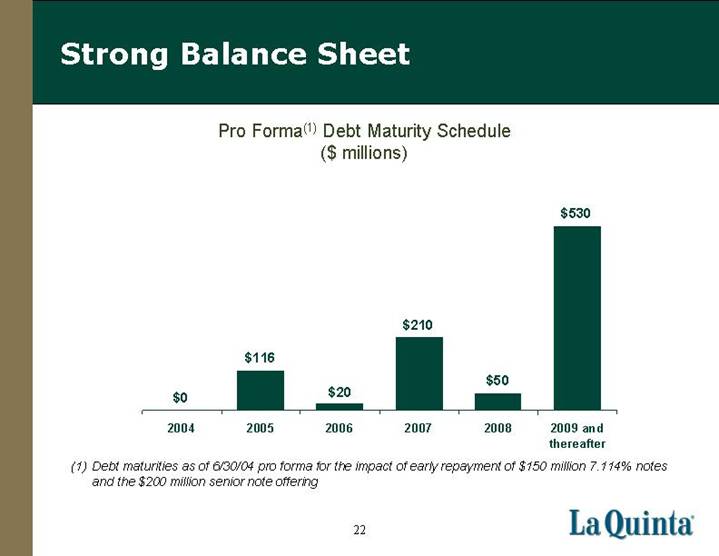
Strong Balance Sheet
Pro Forma(1) Debt Maturity Schedule
($ millions)
[CHART]
(1) Debt maturities as of 6/30/04 pro forma for the impact of early repayment of $150 million 7.114% notes and the $200 million senior note offering
22
ENGINES OF GROWTH
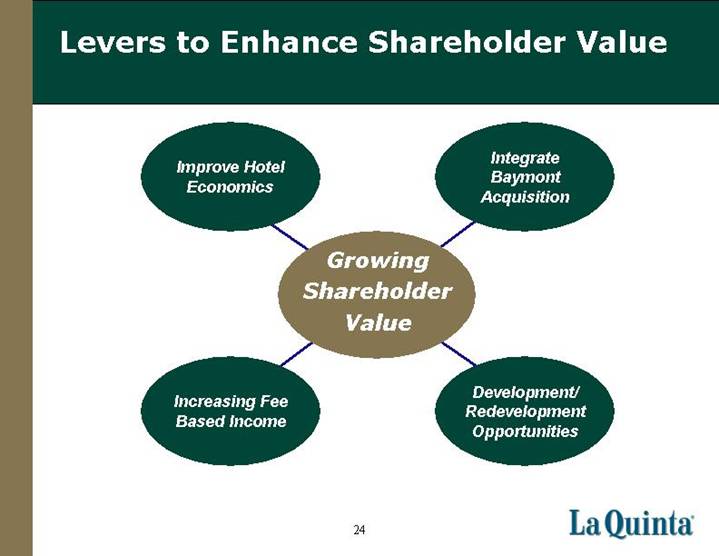
Levers to Enhance Shareholder Value
Growing Shareholder Value
Improve Hotel Economics
Integrate Baymont Acquisition
Increasing Fee Based Income
Development/ Redevelopment Opportunities
24
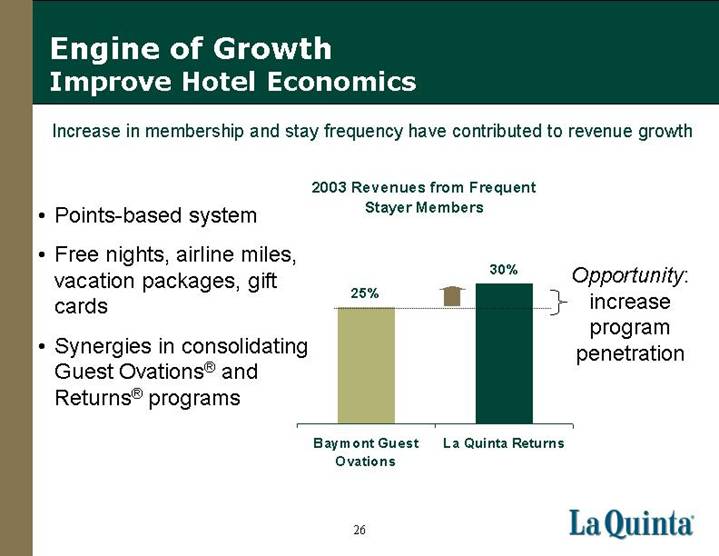
Engine of Growth
Improve Hotel Economics
Internet channels have led to significant RevPAR gains
Increase in
La Quinta Internet Bookings
First Half 2004 vs. First Half 2003
[CHART]
Internet Revenues 2003
[CHART]
Opportunity: leverage existing relationships and programs
25
Engine of Growth
Improve Hotel Economics
Increase in membership and stay frequency have contributed to revenue growth
• Points-based system
• Free nights, airline miles, vacation packages, gift cards
• Synergies in consolidating Guest Ovations® and Returns® programs
2003 Revenues from Frequent Stayer Members
[CHART]
Opportunity: increase program penetration
26
Engine of Growth
Improve Hotel Economics
La Quinta’s company operated call center produces significant volume
• Hotel direct | | 36 | % |
• Walk-in | | 28 | % |
• Call Center | | 16 | % |
• Internet | | 13 | % |
• GDS | | 7 | % |
2003 Call Center Revenues
[CHART]
Opportunity: improve call center production
27
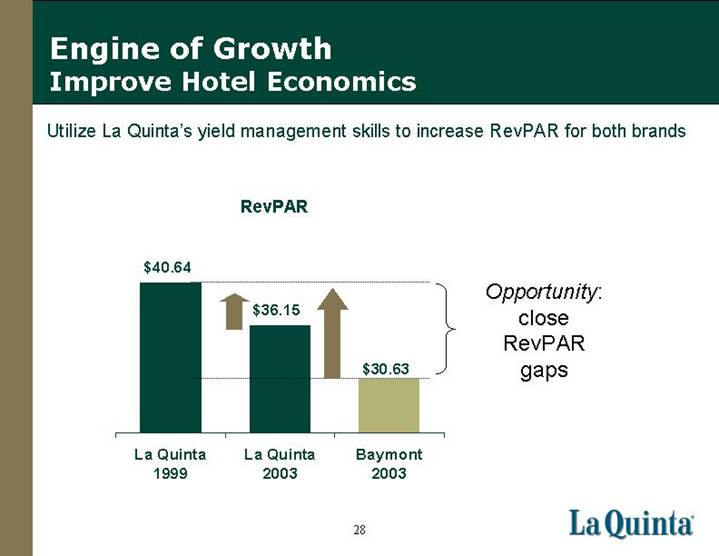
Engine of Growth
Improve Hotel Economics
Utilize La Quinta’s yield management skills to increase RevPAR for both brands
RevPAR
[CHART]
Opportunity: close RevPAR gaps
28
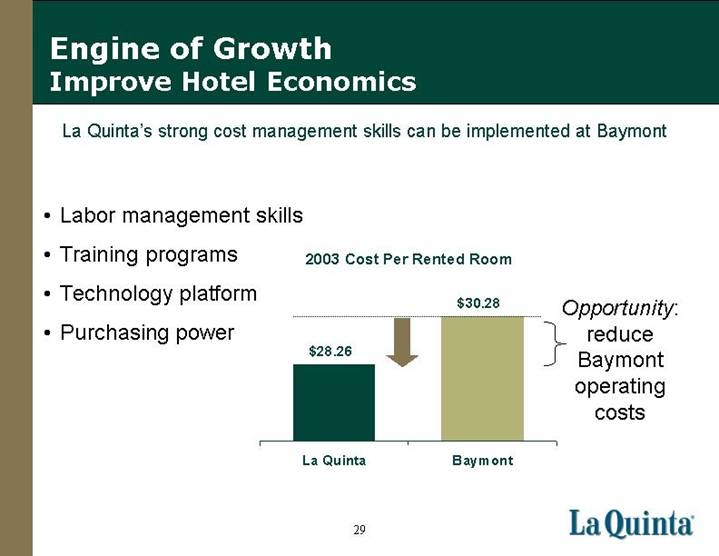
Engine of Growth
Improve Hotel Economics
La Quinta’s strong cost management skills can be implemented at Baymont
• Labor management skills
• Training programs
• Technology platform
• Purchasing power
2003 Cost Per Rented Room
[CHART]
Opportunity: reduce Baymont operating costs
29
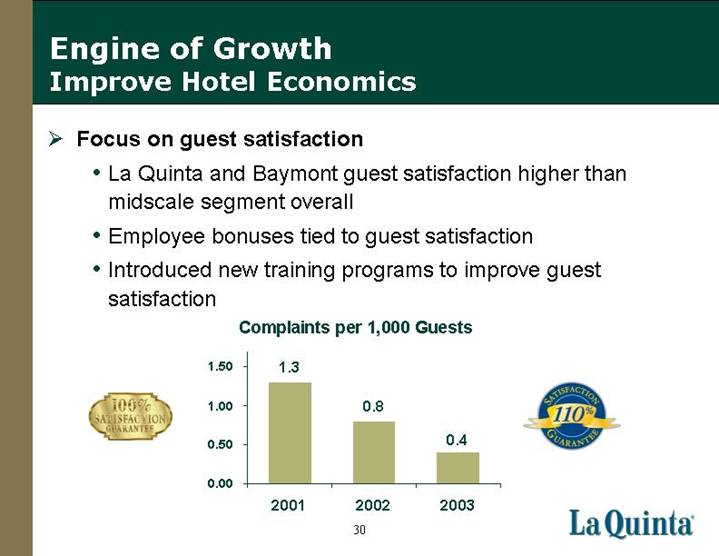
Engine of Growth
Improve Hotel Economics
• Focus on guest satisfaction
• La Quinta and Baymont guest satisfaction higher than midscale segment overall
• Employee bonuses tied to guest satisfaction
• Introduced new training programs to improve guest satisfaction
Complaints Per 1,000 Guests
[CHART]
30
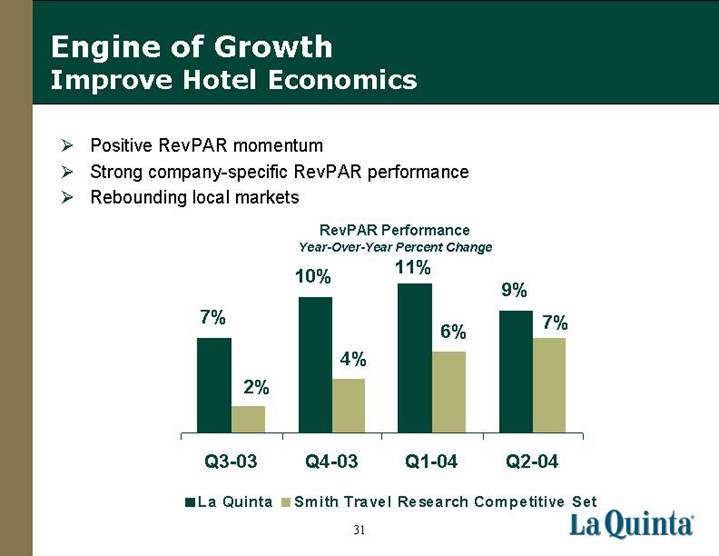
Engine of Growth
Improve Hotel Economics
• Positive RevPAR momentum
• Strong company-specific RevPAR performance
• Rebounding local markets
RevPAR Performance
Year-Over-Year Percent Change
[CHART]
31
Engine of Growth
Development/Redevelopment Opportunities
• Redevelop existing La Quinta locations
• High-demand markets with barriers to entry
• Improve property economics
• Rebrand selected Baymont and La Quinta hotels
• Improve network value of both brands
• ROI driven decision to convert
• Development/acquisition of additional hotels [GRAPHIC]
• Flagship locations
• May use JV partnership or wholly owned
[GRAPHIC]
32
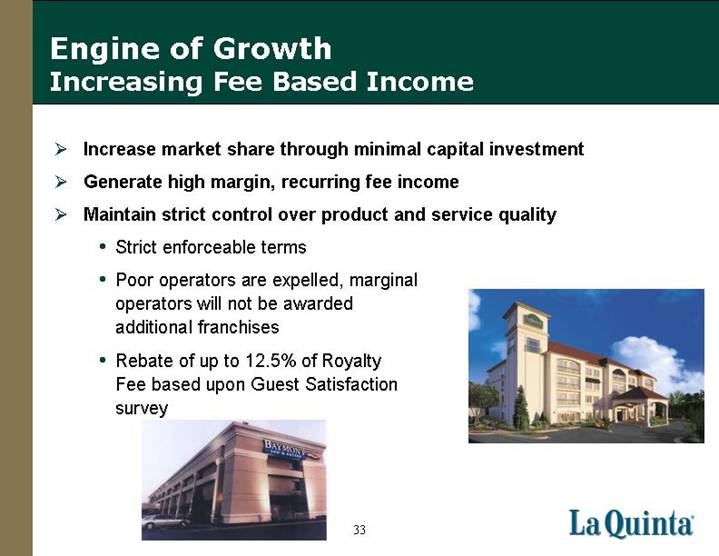
Engine of Growth
Increasing Fee Based Income
• Increase market share through minimal capital investment
• Generate high margin, recurring fee income
• Maintain strict control over product and service quality
• Strict enforceable terms
• Poor operators are expelled, marginal operators will not be awarded additional franchises [GRAPHIC]
• Rebate of up to 12.5% of Royalty Fee based upon Guest Satisfaction survey
[GRAPHIC]
33
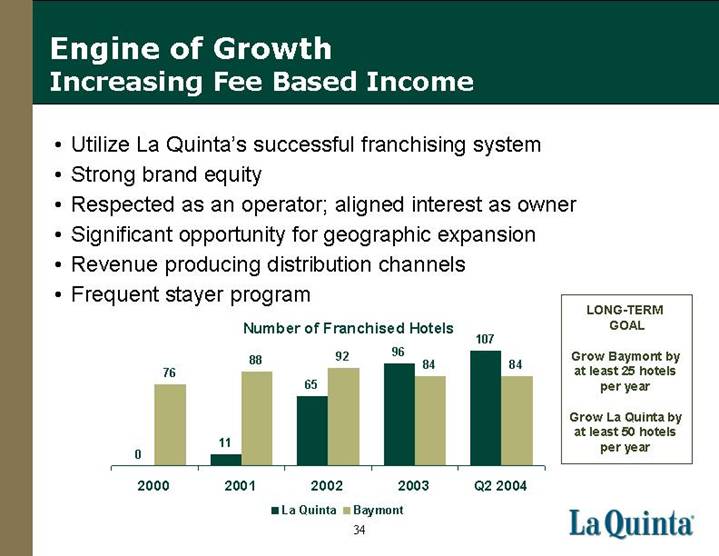
Engine of Growth
Increasing Fee Based Income
• Utilize La Quinta’s successful franchising system
• Strong brand equity
• Respected as an operator; aligned interest as owner
• Significant opportunity for geographic expansion
• Revenue producing distribution channels
• Frequent stayer program
Number of Franchised Hotels
[CHART]
LONG TERM GOAL
Grow Baymont by at least 25 hotels per year
Grow La Quinta by at least 50 hotels per year
34
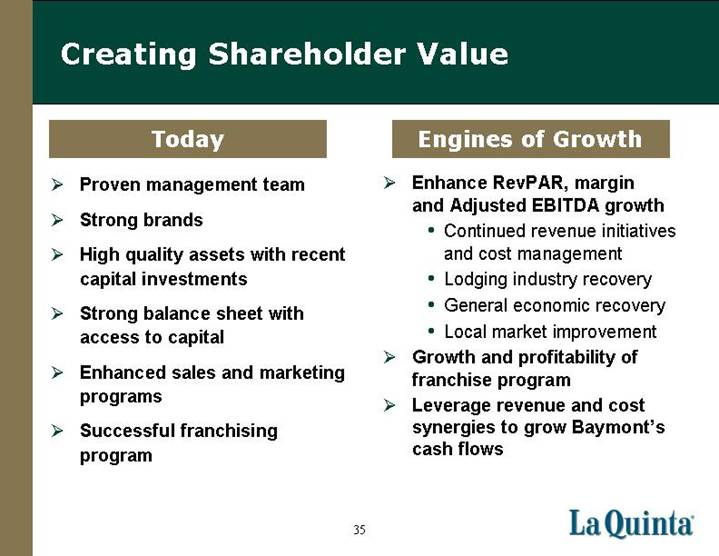
Creating Shareholder Value
Today
• Proven management team
• Strong brands
• High quality assets with recent capital investments
• Strong balance sheet with access to capital
• Enhanced sales and marketing programs
• Successful franchising program
Engines of Growth
• Enhance RevPAR, margin and Adjusted EBITDA growth
• Continued revenue initiatives and cost management
• Lodging industry recovery
• General economic recovery
• Local market improvement
• Growth and profitability of franchise program
• Leverage revenue and cost synergies to grow Baymont’s cash flows
35
[LOGO]
[LOGO] [LOGO]
APPENDIX
Adjusted EBITDA Reconciliation
| | Three Mos. Ended
June 30, | | Six Mos. Ended
June 30, | |
(in millions) | | 2004 | | 2003 | | 2004 | | 2003 | |
Net loss (per GAAP) | | $ | (6.8 | ) | $ | (13.6 | ) | $ | (19.1 | ) | $ | (63.9 | ) |
Depreciation & amortization | | 30.2 | | 32.4 | | 59.5 | | 63.8 | |
Impairment of PP&E | | 7.7 | | 4.6 | | 12.7 | | 66.6 | |
Minority interest | | 4.7 | | 4.6 | | 9.2 | | 9.1 | |
Income tax (benefit) expense | | (3.9 | ) | (6.6 | ) | (9.0 | ) | (39.6 | ) |
Interest, net | | 14.7 | | 16.5 | | 30.3 | | 30.8 | |
Other expense (income) | | (0.6 | ) | 4.0 | | (0.8 | ) | 7.1 | |
Discontinued operations | | — | | (0.2 | ) | — | | 0.1 | |
Adj. EBITDA (non-GAAP) | | $ | 46.0 | | $ | 41.7 | | $ | 82.8 | | $ | 74.0 | |
38
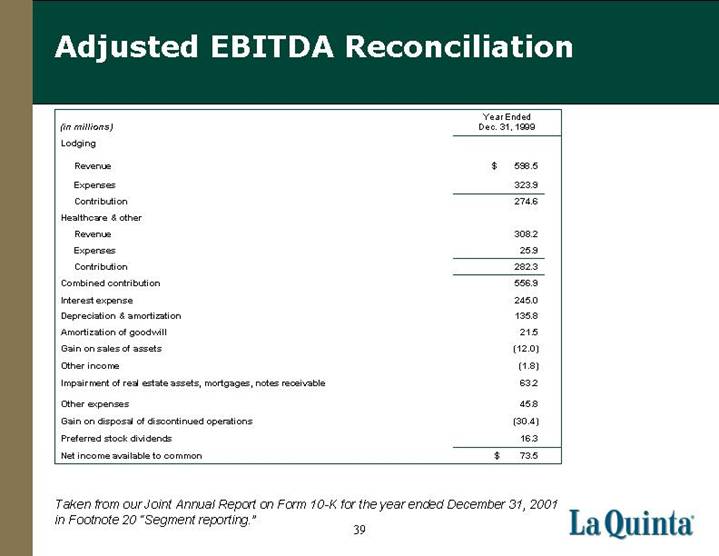
Adjusted EBITDA Reconciliation
(in millions) | | Year Ended
Dec. 31, 1999 | |
| | | |
Lodging | | | |
Revenue | | $ | 598.5 | |
Expenses | | 323.9 | |
Contribution | | 274.6 | |
Healthcare & other | | | |
Revenue | | 308.2 | |
Expenses | | 25.9 | |
Contribution | | 282.3 | |
Combined contribution | | 556.9 | |
Interest expense | | 245.0 | |
Depreciation & amortization | | 135.8 | |
Amortization of goodwill | | 21.5 | |
Gain on sales of assets | | (12.0 | ) |
Other income | | (1.8 | ) |
Impairment of real estate assets, mortgages, notes receivable | | 63.2 | |
Other expenses | | 45.8 | |
Gain on disposal of discontinued operations | | (30.4 | ) |
Preferred stock dividends | | 16.3 | |
Net income available to common | | $ | 73.5 | |
Taken from our Joint Annual Report on Form 10-K for the year ended December 31, 2001 in Footnote 20 “Segment reporting.”
39
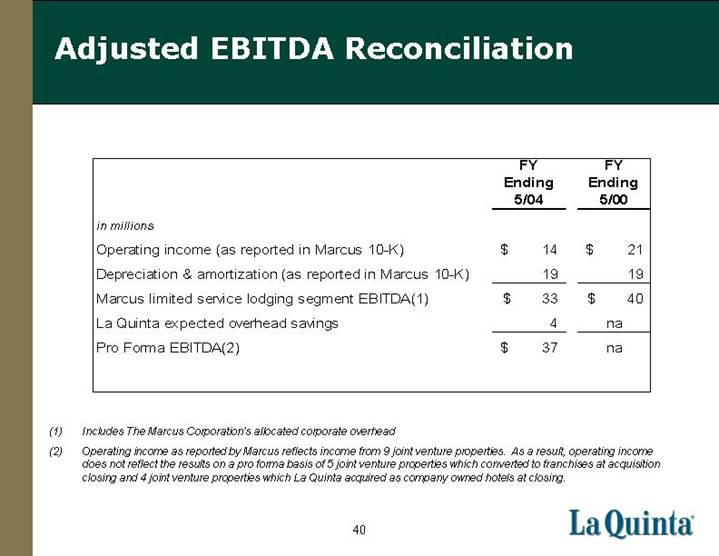
Adjusted EBITDA Reconciliation
in millions | | FY Ending
5/04 | | FY Ending
5/00 | |
| | | | | |
Operating income (as reported in Marcus 10-K) | | $ | 14 | | $ | 21 | |
Depreciation & amortization (as reported in Marcus 10-K) | | 19 | | 19 | |
Marcus limited service lodging segment EBITDA(1) | | $ | 33 | | $ | 40 | |
La Quinta expected overhead savings | | 4 | | na | |
Pro Forma EBITDA (2) | | $ | 37 | | na | |
(1) Includes The Marcus Corporation’s allocated corporate overhead
(2) Operating income as reported by Marcus reflects income from 9 joint venture properties. As a result, operating income does not reflect the results on a pro forma basis of 5 joint venture properties which converted to franchises at acquisition closing and 4 joint venture properties which La Quinta acquired as company owned hotels at closing.
40