PART I
ITEM 1BUSINESS
GENERAL
Panhandle Oil and Gas Inc. was founded in Range, Texas County, Oklahoma, in 1926, as Panhandle Cooperative Royalty Company and operated as a cooperative until 1979, when the Company merged into Panhandle Royalty Company, and its shares became publicly traded. On April 2, 2007, the Company’s name was changed to Panhandle Oil and Gas Inc. The name change was made to clear up confusion as to whether the Company was a royalty trust. Panhandle has never been a royalty trust.
While operating as a cooperative, the Company distributed most of its net income to shareholders as cash dividends. Upon conversion to a public company in 1979, although still paying dividends, the Company began to retain a substantial part of its cash flow to participate with a working interest in the drilling of wells on its mineral acreage and to purchase additional mineral acreage. Several acquisitions of additional mineral acreage and small companies were made in the ‘80s and ‘90s, and the acquisition of Wood Oil Company, as a wholly owned subsidiary, was consummated in October 2001. Wood Oil Company was merged into Panhandle Oil and Gas Inc. effective July 1, 2011.
The Company is involved in the acquisition, management and development of non-operated oil and natural gas properties, including wells located on the Company’s mineral and leasehold acreage. Panhandle’s mineral and leasehold properties are located primarily in Arkansas, New Mexico, North Dakota, Oklahoma and Texas, with properties also located in several other states. The majority of the Company’s oil, NGL and natural gas production is from wells located in Oklahoma and Arkansas.
In January 2006, the Company last split its Class A Common Stock on a two-for-one basis. In March 2007, the Company increased its authorized Class A Common Stock from 12 million shares to 24 million shares.
The Company’s office is located at Grand Centre, Suite 300, 5400 N. Grand Blvd., Oklahoma City, OK 73112; telephone – (405) 948-1560; facsimile – (405) 948-2038. The Company’s website is www.panhandleoilandgas.com.
The Company files periodic reports with the SEC on Forms 10-Q and 10-K. These forms, the Company’s annual report to shareholders and current press releases are available free of charge through our website as soon as reasonably practicable after they are filed with the SEC or made available to the public. Also, the Company posts copies of its various corporate governance documents on the website. From time to time, the Company posts other important disclosures to investors in the “Press Release” or “Upcoming Events” section of the website, as allowed by SEC rules.
Materials filed with the SEC may be read and copied at the SEC’s Public Reference Room at 100 F Street, N.E., Washington, D.C. 20549. Information on the operation of the Public Reference Room may be obtained by calling the SEC at 1-800-SEC-0330. The SEC also maintains an Internet website at www.sec.gov that contains reports, proxy and information statements, and other information regarding the Company that has been filed electronically with the SEC, including this Form 10-K.
BUSINESS STRATEGY
Typically, most of Panhandle’s revenues are derived from the production and sale of oil, NGL and natural gas (see Item 8 - “Financial Statements and Supplementary Data”). The Company’s oil and natural gas properties, including its mineral acreage, leasehold acreage and working and royalty interests
in producing wells are mainly in Oklahoma with other significant holdings in Arkansas, New Mexico, North Dakota and Texas (see Item 2 – “Properties”). Exploration and development of the Company’s oil and natural gas properties are conducted in association with oil and natural gas exploration and production companies, primarily larger independent companies. The Company does not operate any of its oil and natural gas properties, but has been an active working interest participant for many years in wells drilled on the Company’s mineral acres. The majority of the Company’s recent drilling participations have been on properties in which the Company owns mineral acreage. Most of these wells are in unconventional plays located in Oklahoma, Arkansas and Texas.
PRINCIPAL PRODUCTS AND MARKETS
The Company’s principal products, in order of revenue generated, are natural gas, crude oil and NGL. These products are sold to various purchasers, including pipeline and marketing companies, which service the areas where the Company’s producing wells are located. Since the Company does not operate any of the wells in which it owns an interest, it relies on the operating expertise of numerous companies that operate wells in the areas where the Company owns interests. This includes expertise in the drilling and completion of new wells, producing well operations and, in most cases, the marketing or purchasing of production from the wells. Natural gas and NGL sales are principally handled by the well operator and are normally contracted on a monthly basis with third-party natural gas marketers and pipeline companies. Payment for natural gas and NGL sold is received by the Company from the well operator or the contracted purchaser. Crude oil sales are generally handled by the well operator and payment for oil sold is received by the Company from the well operator or from the crude oil purchaser.
Prices of oil, NGL and natural gas are dependent on numerous factors beyond the control of the Company, including competition, weather, international events and circumstances, supply and demand, actions taken by OPEC, and economic, political and regulatory developments. Since demand for natural gas is generally highest during winter months, prices received for the Company’s natural gas production are subject to seasonal variations.
The Company enters into price risk management financial instruments (derivatives) to reduce the Company’s exposure to short-term fluctuations in the price of oil and natural gas. The derivative contracts apply only to a portion of the Company’s oil and natural gas production and provide only partial price protection against declines in oil and natural gas prices. These derivative contracts expose the Company to risk of financial loss and may limit the benefit of future increases in oil and natural gas prices. A more thorough discussion of these derivative contracts, including risk of financial loss, is contained in Item 7 - “Management’s Discussion and Analysis of Financial Condition and Results of Operations.”
COMPETITIVE BUSINESS CONDITIONS
The oil and natural gas industry is highly competitive, particularly in the search for new oil, NGL and natural gas reserves. Many factors affect Panhandle’s competitive position and the market for its products, which are beyond its control. Some of these factors include the quantity and price of foreign oil imports; domestic supply of oil, NGL and natural gas; changes in prices received for oil, NGL and natural gas production; business and consumer demand for refined oil products, NGL and natural gas; and the effects of federal and state regulation of the exploration for, production of and sales of oil, NGL and natural gas. Changes in existing economic conditions, political developments, weather patterns and actions taken by OPEC and other oil-producing countries have a dramatic influence on the price Panhandle receives for its oil, NGL and natural gas production.
The Company does not operate any of the wells in which it has an interest; rather it relies on companies with greater resources, staff, equipment, research and experience for operation of wells both
in the drilling and production phases. The Company’s business strategy is to use its strong financial base and its mineral and leasehold acreage ownership, coupled with its own geologic and economic evaluations, either to elect to participate in drilling operations with these larger companies or to lease or farmout its mineral or leasehold acreage while retaining a royalty interest. This strategy allows the Company to compete effectively in drilling operations it could not undertake on its own due to financial and personnel limitations while maintaining low overhead costs.
SOURCES AND AVAILABILITY OF RAW MATERIALS
The existence of recoverable oil, NGL and natural gas reserves in commercial quantities is essential to the ultimate realization of value from the Company’s mineral and leasehold acreage. These mineral and leasehold properties are essentially the raw materials to our business. The production and sale of oil, NGL and natural gas from the Company’s properties are essential to provide the cash flow necessary to sustain the ongoing viability of the Company. The Company reinvests a portion of its cash flow to purchase oil and natural gas mineral and leasehold acreage to assure the continued availability of acreage with which to participate in exploration and development drilling operations and, subsequently, the production and sale of oil, NGL and natural gas. This participation in exploration, development and production activities and purchase of additional acreage is necessary to continue to supply the Company with the raw materials with which to generate additional cash flow. Mineral and leasehold acreage purchases are made from many owners. The Company does not rely on any particular companies or persons for the purchases of additional mineral and leasehold acreage.
MAJOR CUSTOMERS
The Company’s oil, NGL and natural gas production is sold, in most cases, through its well operators to many different purchasers on a well-by-well basis. During 2013, sales through two separate well operators accounted for approximately 20% and 10% of the Company’s total oil, NGL and natural gas sales. During 2012, sales through three separate well operators accounted for approximately 15%, 13% and 10% of the Company’s total oil, NGL and natural gas sales. During 2011, sales through two separate well operators accounted for approximately 15% and 14% of the Company’s total oil, NGL and natural gas sales. Generally, if one purchaser declines to continue purchasing the Company’s production, several other purchasers can be located. Pricing is generally consistent from purchaser to purchaser.
PATENTS, TRADEMARKS, LICENSES, FRANCHISES AND ROYALTY AGREEMENTS
The Company does not own any patents, trademarks, licenses or franchises. Royalty agreements on wells producing oil, NGL and natural gas stemming from the Company’s ownership of mineral acreage generate a portion of the Company’s revenues. These royalties are tied to ownership of mineral acreage, and this ownership is perpetual, unless sold by the Company. Royalties are due and payable to the Company whenever oil, NGL or natural gas is produced and sold from wells located on the Company’s mineral acreage.
REGULATION
All of the Company’s well interests and non-producing properties are located onshore in the United States. Oil, NGL and natural gas production is subject to various taxes, such as gross production taxes and, in some cases, ad valorem taxes.
The State of Oklahoma and other states require permits for drilling operations, drilling bonds and reports concerning operations and impose other regulations relating to the exploration for and production of oil, NGL and natural gas. These states also have regulations addressing conservation matters, including provisions for the unitization or pooling of oil and natural gas properties and the regulation of
spacing, plugging and abandonment of wells. These regulations vary from state to state. As previously discussed, the Company relies on its well operators to comply with governmental regulations.
Various aspects of the Company’s oil and natural gas operations are regulated by agencies of the federal government. Transportation of natural gas in interstate commerce is generally regulated by the Federal Energy Regulatory Commission (“FERC”) pursuant to the Natural Gas Act of 1938 and the Natural Gas Policy Act of 1978 (“NGPA”). The intrastate transportation and gathering of natural gas (and operational and safety matters related thereto) may be subject to regulation by state and local governments.
FERC’s jurisdiction over interstate natural gas sales was substantially modified by the NGPA under which FERC continued to regulate the maximum selling prices of certain categories of natural gas sold in “first sales” in interstate and intrastate commerce. Effective January 1, 1993, however, the Natural Gas Wellhead Decontrol Act (the “Decontrol Act”) deregulated natural gas prices for all “first sales” of natural gas. Because “first sales” include typical wellhead sales by producers, all natural gas produced from the Company’s natural gas properties is sold at market prices, subject to the terms of any private contracts in effect. FERC’s jurisdiction over natural gas transportation was not affected by the Decontrol Act.
Sales of natural gas are affected by intrastate and interstate natural gas transportation regulation. Beginning in 1985, FERC adopted regulatory changes that have significantly altered the transportation and marketing of natural gas. FERC intended these changes to foster competition by transforming the role of interstate pipeline companies from wholesale marketers of natural gas to the primary role of natural gas transporters. As a result of the various omnibus rulemaking proceedings in the late 1980s and the individual pipeline restructuring proceedings of the early to mid-1990s, interstate pipelines must provide open and nondiscriminatory transportation and transportation-related services to all producers, natural gas marketing companies, local distribution companies, industrial end users and other customers seeking service. Through similar orders affecting intrastate pipelines that provide similar interstate services, FERC expanded the impact of open access regulations to intrastate commerce.
FERC has pursued other policy initiatives that have affected natural gas marketing. Most notable are: (1) permitting the large-scale divestiture of interstate pipeline-owned natural gas gathering facilities to affiliated or non-affiliated companies; (2) further development of rules governing the relationship of the pipelines with their marketing affiliates; (3) the publication of standards relating to the use of electronic bulletin boards and electronic data exchange by the pipelines to make transportation information available on a timely basis and to enable transactions to occur on a purely electronic basis; (4) further review of the role of the secondary market for released pipeline capacity and its relationship to open access service in the primary market; and (5) development of policy and promulgation of orders pertaining to its authorization of market-based rates (rather than traditional cost-of-service based rates) for transportation or transportation-related services upon the pipeline’s demonstration of lack of market control in the relevant service market.
As a result of these changes, sellers and buyers of natural gas have gained direct access to the particular pipeline services they need and are able to conduct business with a larger number of counter parties. These changes generally have improved the access to markets for natural gas while substantially increasing competition in the natural gas marketplace. The effect of future regulations by FERC and other regulatory agencies cannot be predicted.
Sales of oil are not regulated and are made at market prices. The price received from the sale of oil is affected by the cost of transporting it to market. Much of that transportation is through interstate common carrier pipelines. Effective January 1, 1995, FERC implemented regulations generally grandfathering all previously approved interstate transportation rates and establishing an indexing system
for those rates by which adjustments are made annually based on the rate of inflation, subject to certain conditions and limitations. Over time, these regulations tend to increase the cost of transporting oil by interstate pipelines, although some annual adjustments may result in decreased rates for a given year. These regulations have generally been upheld on judicial review. Every five years, FERC will examine the relationship between the annual change in the applicable index and the actual cost changes experienced by the oil pipeline industry.
ENVIRONMENTAL MATTERS
As the Company is directly involved in the extraction and use of natural resources, it is subject to various federal, state and local laws and regulations regarding environmental and ecological matters. Compliance with these laws and regulations may necessitate significant capital outlays; however, to date, the Company’s cost of compliance has been immaterial. The Company does not believe the existence of these environmental laws, as currently written and interpreted, will materially hinder or adversely affect the Company’s business operations; however, there can be no assurances of future events or changes in laws, or the interpretation of laws, governing our industry. Current discussions involving the governance of hydraulic fracturing in the future could have a material impact on the Company. Since the Company does not operate any wells in which it owns an interest, actual compliance with environmental laws is controlled by the well operators, with Panhandle being responsible for its proportionate share of the costs involved. As such, to its knowledge, the Company is not aware of any instances of non-compliance with existing laws and regulations. Absent an extraordinary event, any noncompliance is not likely to have a material adverse effect on the financial condition of the Company. Although the Company is not fully insured against all environmental risks, insurance coverage is maintained at levels which are customary in the industry.
EMPLOYEES
At September 30, 2013, Panhandle employed 21 people with five of the employees serving as executive officers. The President and CEO is also a director of the Company.
ITEM 1ARISK FACTORS
In addition to the other information included in this Form 10-K, the following risk factors should be considered in evaluating the Company’s business and future prospects. If any of the following risk factors should occur, the Company’s financial condition could be materially impacted and the holders of our securities could lose part or all of their investment in Panhandle. The risk factors described below are not exhaustive, and investors are encouraged to perform their own investigation with respect to the Company and its business. Investors should also read the other information in this Form 10-K, including the financial statements and related notes.
Uncertainty of economic conditions, worldwide and in the United States, may have a significant negative effect on operating results, liquidity and financial condition.
Effects of change in domestic and international economic conditions could include: (1) a decline in demand for oil, NGL and natural gas resulting in decreased oil, NGL and natural gas reserves due to curtailed drilling activity; (2) a decline in oil, NGL and natural gas prices; (3) risk of insolvency of well operators and oil, NGL and natural gas purchasers; (4) limited availability of certain insurance coverage; (5) limited access to derivative instruments; and (6) limited credit availability. A decline in reserves would lead to a decline in production, and either a production decline, or a decrease in oil, NGL and natural gas prices, would have a negative impact on the Company’s cash flow, profitability and value.
Oil, NGL and natural gas prices are volatile. Volatility in these prices can adversely affect operating results and the price of the Company’s common stock. This volatility also makes valuation of oil and natural gas producing properties difficult and can disrupt markets.
The supply of and demand for oil, NGL and natural gas impact the prices we realize on the sale of these commodities and, in turn, materially affect the Company’s financial results. Oil, NGL and natural gas prices have historically been, and will likely continue to be, volatile. The prices for oil, NGL and natural gas are subject to wide fluctuation in response to a number of factors, including:
Ÿworldwide economic conditions
Ÿeconomic, political, regulatory and tax developments
Ÿmarket uncertainty
Ÿchanges in the supply of and demand for oil, NGL and natural gas
Ÿavailability and capacity of necessary transportation and processing facilities
Ÿcommodity futures trading
Ÿregional price differentials
Ÿdiffering quality of oil produced (i.e., sweet crude versus heavy or sour crude)
Ÿdiffering quality and NGL content of natural gas produced
Ÿweather conditions
Ÿthe level of imports and exports of oil, NGL and natural gas
Ÿpolitical instability or armed conflicts in major oil and natural gas producing regions
Ÿactions taken by OPEC
Ÿcompetition from alternative sources of energy
Ÿtechnological advancements affecting energy consumption and energy supply
Price volatility makes it difficult to budget and project the return on investment in exploration and development projects and to estimate with precision the value of producing properties that are owned or acquired by the Company. In addition, volatile prices often disrupt the market for oil and natural gas properties, as buyers and sellers have more difficulty agreeing on the purchase price of properties. Revenues, results of operations, reserves and capital availability may fluctuate significantly as a result of variations in oil, NGL and natural gas prices and production performance.
Lower oil, NGL and natural gas prices may also trigger significant impairment write-downs on a portion of the Company’s properties and negatively affect the Company’s results of operations and its ability to borrow under its credit facility.
A substantial decline in oil, NGL and natural gas prices for a prolonged period of time would have a material adverse effect on the Company.
The Company’s financial position, results of operations, access to capital and the quantities of oil, NGL and natural gas that may be economically produced would be negatively impacted if oil, NGL and natural gas prices decrease significantly for an extended period of time. The ways in which such price decreases could have a material negative effect include:
Ÿcash flow would be reduced, decreasing funds available for capital expenditures employed to replace reserves and maintain or increase production
Ÿfuture undiscounted and discounted net cash flows from producing properties would decrease, possibly resulting in impairment expense that may be significant
Ÿcertain reserves may no longer be economic to produce, leading to lower proved reserves, production and cash flow
Ÿaccess to sources of capital, such as equity or long-term debt markets, could be severely limited or unavailable
The Company cannot control activities on properties it does not operate.
The Company does not operate any of the properties in which it has an interest and has very limited ability to exercise influence over the third-party operators of these properties. Our dependence on the third-party operators of our properties, and on the cooperation of other working interest owners in these properties, could negatively affect the following:
Ÿthe Company’s return on capital used in drilling or property acquisition
Ÿthe Company’s production and reserve growth rates
Ÿcapital required to drill and complete wells
Ÿsuccess and timing of drilling, development and exploitation activities on the Company’s properties
Ÿcompliance with environmental, safety and other regulations
Ÿlease operating expenses
Ÿplugging and abandonment costs, including well-site restorations
Dependency on each operator’s judgment, expertise and financial resources could result in unexpected future costs, lost revenues and/or capital restrictions to the extent they would cumulatively have a material adverse effect on the Company’s financial position and results of operations.
The Company’s derivative activities may reduce the cash flow received for oil and natural gas sales.
In order to manage exposure to price volatility on our oil and natural gas production, we enter into oil and natural gas derivative contracts for a portion of our expected production. Oil and natural gas price derivatives may limit the cash flow we actually realize and therefore reduce the Company’s ability to fund future projects. None of our oil and natural gas price derivative contracts are designated as hedges for accounting purposes; therefore, we record all derivative contracts at fair value on our balance sheet. Accordingly, these fair values may vary significantly from period to period, materially affecting reported earnings. The fair value of our oil and natural gas derivative instruments outstanding as of September 30, 2013, was a net asset of $425,198.
There is risk associated with our derivative contracts that involves the possibility that counterparties may be unable to satisfy contractual obligations to us. If any counterparty to our derivative instruments were to default or seek bankruptcy protection, it could subject a larger percentage of our future oil and natural gas production to commodity price changes and could have a negative effect on our ability to fund future projects.
There are also risks of financial loss associated with derivative instruments if there is an increase in the differential between the underlying price of the derivative contract and the actual received price.
A more thorough discussion of these derivative contracts, including risk of financial loss, is contained in Item 7 - “Management’s Discussion and Analysis of Financial Condition and Results of Operations.”
Lower oil, NGL and natural gas prices or negative adjustments to oil, NGL and natural gas reserves may result in significant impairment charges.
The Company has elected to utilize the successful efforts method of accounting for its oil and natural gas exploration and development activities. Exploration expenses, including geological and geophysical costs, rentals and exploratory dry holes, are charged against income as incurred. Costs of
successful wells and related production equipment and development dry holes are capitalized and amortized by property using the unit-of-production method (the ratio of oil, NGL and natural gas volumes produced to total proved or proved developed reserves) as oil, NGL and natural gas are produced.
All long-lived assets, principally the Company’s oil and natural gas properties, are monitored for potential impairment when circumstances indicate that the carrying value of the asset on our books may be greater than its future net cash flows. The need to test a property for impairment may result from declines in oil, NGL and natural gas sales prices or unfavorable adjustments to oil, NGL and natural gas reserves. Also, once assets are classified as held for sale, they are reviewed for impairment. Because of the uncertainty inherent in these factors, the Company cannot predict when or if future impairment charges will be recorded. If an impairment charge is recognized, cash flow from operating activities is not impacted, but net income and, consequently, shareholders’ equity are reduced. In periods when impairment charges are incurred, it could have a material adverse effect on our results of operations.
Our estimated proved reserves are based on many assumptions that may prove to be inaccurate. Any inaccuracies in these reserve estimates or underlying assumptions may materially affect the quantities and present value of our reserves.
It is not possible to measure underground accumulations of oil, NGL and natural gas with precision. Oil, NGL and natural gas reserve engineering requires subjective estimates of underground accumulations of oil, NGL and natural gas using assumptions concerning future prices of these commodities, future production levels, and operating and development costs. In estimating our reserves, we and our Independent Consulting Petroleum Engineering Firm make various assumptions with respect to many subject matters that may prove to be incorrect, including:
Ÿfuture oil, NGL and natural gas prices
Ÿproduction rates
Ÿreservoir pressures, decline rates, drainage areas and reservoir limits
Ÿinterpretation of subsurface conditions including geological and geophysical data
Ÿpotential for water encroachment or mechanical failures
Ÿlevels and timing of capital expenditures, lease operating expenses, production taxes and income taxes, and availability of funds for such expenditures
Ÿeffects of government regulation
If these assumptions prove to be incorrect, our estimates of reserves, the classifications of reserves based on risk of recovery and our estimates of the future net cash flows from our reserves could change significantly.
Our standardized measure of oil and natural gas reserves is calculated using the 12-month average price calculated as the unweighted arithmetic average of the first-day-of-the-month individual product prices for each month within the 12-month period prior to September 30 held flat over the life of the properties and operating costs in effect as of the date of estimation, less future estimated development, production and income tax expenses, and is discounted at 10% per annum to reflect the timing of future net revenue in accordance with the rules and regulations of the SEC. Over time, we may make material changes to reserve estimates to take into account changes in our assumptions and the results of actual development and production.
The reserve estimates made for fields that do not have a lengthy production history are less reliable than estimates for fields with lengthy production histories. A lack of production history may contribute to inaccuracy in our estimates of proved reserves, future production rates and the timing of development expenditures. Further, our lack of knowledge of all individual well information known to
the well operators such as incomplete well stimulation efforts, restricted production rates for various reasons and up to date well production data, etc. may cause differences in our reserve estimates.
Because PUD’s, under SEC reporting rules, may only be recorded if the wells they relate to are scheduled to be drilled within five years of the date of recording, the removal of PUD’s that are not developed within this five year period may be required. Removals of this nature may significantly reduce the quantity and present value of the Company’s oil, NGL and natural gas reserves.
Because forward-looking prices and costs are not used to estimate discounted future net cash flows from our estimated proved reserves, the standardized measure of our estimated proved reserves is not necessarily the same as the current market value of our estimated proved oil, NGL and natural gas reserves.
The timing of both our production and our incurrence of expenses in connection with the development and production of our properties will affect the timing of actual future net cash flows from proved reserves, and thus their actual present value. In addition, the 10% discount factor used when calculating discounted future net cash flows in compliance with the FASB statement on oil and natural gas producing activities disclosures may not be the most appropriate discount factor based on interest rates in effect from time to time and risks associated with the Company, or the oil and natural gas industry in general.
Failure to find or acquire additional reserves will cause reserves and production to decline materially from their current levels.
The rate of production from oil and natural gas properties generally declines as reserves are depleted. The Company’s proved reserves will decline materially as reserves are produced except to the extent that the Company acquires additional properties containing proved reserves, conducts additional successful exploration and development drilling, successfully applies new technologies or identifies additional behind-pipe zones (different productive zones within existing producing well bores) or secondary recovery reserves.
Drilling for oil and natural gas invariably involves unprofitable efforts, not only from dry wells, but also from wells that are productive but do not produce sufficient reserves to return a profit after deducting drilling, operating and other costs. In addition, wells that are profitable may not achieve a targeted rate of return. The Company relies on third-party operators’ interpretation of seismic data and other advanced technologies in identifying prospects and in conducting exploration and development activities. Nevertheless, prior to drilling a well, the seismic data and other technologies used do not allow operators to know conclusively whether oil, NGL or natural gas is present in commercial quantities.
Cost factors can adversely affect the economics of any project, and ultimately the cost of drilling, completing and operating a well is controlled by well operators and existing market conditions. Further, drilling operations may be curtailed, delayed or canceled as a result of numerous factors, including:
Ÿunexpected drilling conditions
Ÿtitle problems
Ÿpressure or irregularities in formations
Ÿequipment failures or accidents
Ÿfires, explosions, blowouts and surface cratering
Ÿlack of availability to market production via pipelines or other transportation
Ÿadverse weather conditions
Ÿenvironmental hazards or liabilities
Ÿgovernmental regulations
Ÿcost and availability of drilling rigs, equipment and services
Ÿexpected sales price to be received for oil, NGL or natural gas produced from the wells
Oil and natural gas drilling and producing operations involve various risks.
The Company is subject to all the risks normally incident to the operation and development of oil and natural gas properties, including:
Ÿwell blowouts, cratering, explosions and human related accidents
Ÿmechanical, equipment and pipe failures
Ÿadverse weather conditions and natural disasters
Ÿcivil disturbances and terrorist activities
Ÿoil, NGL and natural gas price reductions
Ÿenvironmental risks stemming from the use, production, handling and disposal of water, waste materials, hydrocarbons and other substances into the air, soil or water
Ÿtitle problems
Ÿlimited availability of financing
Ÿmarketing related infrastructure, transportation and processing limitations
Ÿregulatory compliance issues
As a non-operator, we are dependent on third-party operators and the contractors they hire for operational safety, environmental safety and compliance with regulations of governmental authorities.
The Company maintains insurance against many potential losses or liabilities arising from well operations in accordance with customary industry practices and in amounts believed by management to be prudent. However, this insurance does not protect the Company against all risks. For example, the Company does not maintain insurance for business interruption, acts of war or terrorism. Additionally, pollution and environmental risks generally are not fully insurable. These risks could give rise to significant uninsured costs that could have a material adverse effect on the Company’s business condition and financial results.
Debt level and interest rates may adversely affect our business.
The Company has a credit facility with Bank of Oklahoma (BOK) which consists of a revolving loan with a limit in the amount of $80,000,000. As of September 30, 2013, the Company had a balance of $8,262,256 drawn on the facility. The facility has a current borrowing base of $35,000,000, is secured by certain of the Company’s properties and contains certain restrictive covenants.
Should the Company incur substantial indebtedness under its credit facility to fund capital projects or for other reasons, there is risk of it adversely affecting our business operations as follows:
Ÿcash flows from operating activities required to service indebtedness may not be available for other purposes
Ÿcovenants contained in the Company’s borrowing agreement may limit our ability to borrow additional funds, pay dividends and make certain investments
Ÿany limitation on the borrowing of additional funds may affect our ability to fund capital projects and may also affect how we will be able to react to economic and industry changes
Ÿa significant increase in the interest rate on our credit facility will limit funds available for other purposes
Ÿchanges in prevailing interest rates may affect the Company’s capability to meet its debt service requirements, as its credit facility bears interest at floating rates
The borrowing base of our corporate revolving bank credit facility is subject to periodic redetermination and is based in part on oil, NGL and natural gas prices. A lowering of our borrowing base because of lower oil, NGL or natural gas prices, or for other reasons, could require us to repay indebtedness in excess of the newly established borrowing base, or we might need to further secure the debt with additional collateral. Our ability to meet any debt obligations depends on our future performance. General business, economic, financial and product pricing conditions, along with other factors, affect our future performance, and many of these factors are beyond our control. In addition, our failure to comply with the restrictive covenants relating to our credit facility could result in a default, which could adversely affect our business, financial condition and results of operations.
Future legislative or regulatory changes may result in increased costs and decreased revenues, cash flows and liquidity.
Companies that operate wells in which Panhandle owns a working interest are subject to extensive federal, state and local regulation. Panhandle, as a working interest owner, is therefore indirectly subject to these same regulations. New or changed laws and regulations such as those described below could have a material adverse effect on our business.
Federal Income Taxation
Proposals to repeal the expensing of intangible drilling costs, repeal the percentage depletion allowance and increase the amortization period of geological and geophysical expenses, if enacted, would increase and accelerate the Company’s payment of federal income taxes. As a result, these changes would decrease the Company’s cash flows available for developing its oil and natural gas properties.
Hydraulic Fracturing
The vast majority of oil and natural gas wells drilled in recent years have been, and future wells are expected to be, hydraulically fractured as a part of the process of completing the wells and putting them on production. This is true of the wells drilled in which the Company owns an interest. Hydraulic fracturing is a process that involves pumping water, sand and additives at high pressure into rock formations to stimulate oil and natural gas production. In developing plays where hydraulic fracturing, which requires large volumes of water, is necessary for successful development, the demand for water may exceed the supply. A lack of readily available water or a significant increase in the cost of water could cause delays or increased completion costs.
In addition to water, hydraulic fracturing fluid contains chemical additives designed to optimize production. Well operators are being required in certain states to disclose the components of these additives. Additional states and the federal government may follow with similar requirements or may restrict the use of certain additives. This could result in more costly or less effective development of wells.
Efforts to regulate hydraulic fracturing are increasing at the local, state and federal level. Several new regulations are being considered, including limiting water withdrawals and usage, limiting water disposition, restricting which additives may be used, implementing state-wide hydraulic fracturing moratoriums and temporary or permanent bans in certain environmentally sensitive areas. Public sentiment against hydraulic fracturing and shale gas production has become more vocal, which could result in more stringent permitting and compliance requirements. Consequences of these actions could potentially increase capital, compliance and operating costs significantly, as well as delay or halt the further development of oil and gas reserves on the Company’s properties.
Any of the above factors could have a material adverse effect on our financial position, results of operations or cash flows.
Climate Change
Studies have suggested that emission of certain gases, commonly referred to as "greenhouse gases," may be impacting the earth's climate. Methane, a primary component of natural gas, and carbon dioxide, a by-product of burning oil and natural gas, are examples of greenhouse gases. The U.S. Congress and various states have been evaluating, and in some cases implementing, climate-related legislation and other regulatory initiatives that restrict emissions of greenhouse gases. In December 2009, the Environmental Protection Agency (EPA) issued findings that methane and carbon dioxide present a health and safety issue such that they should be regulated under the Clean Air Act.
In November 2010, the EPA finalized its greenhouse gas reporting requirements for certain oil and gas production facilities that emit 25,000 metric tons or more of carbon dioxide equivalent per year. The rule requires annual reporting to the EPA of greenhouse gas emissions by such regulated facilities.
On April 17, 2012, the EPA issued final rules that established new air emission controls for crude oil and natural gas production and natural gas processing operations. The final rules require the use of reduced emission completions or “green completions” on all hydraulically-fractured wells completed or re-fractured after January 1, 2015. These rules may require the installation of new equipment to control emissions and other modifications by the third-party operators of wells in which we own an interest. Compliance with such rules could result in significant costs, including increased capital expenditures and operating costs.
These and any further restrictions resulting from federal or state legislation or regulations may have an effect on our ability to produce oil and natural gas, as well as the demand for oil, NGL and natural gas. Such changes may result in additional compliance obligations that could cumulatively have a material adverse effect on our financial condition, financial results and cash flows.
Shortages of oilfield equipment, services, qualified personnel and resulting cost increases could adversely affect results of operations.
The demand for qualified and experienced field personnel, geologists, geophysicists, engineers and other professionals in the oil and natural gas industry can fluctuate significantly, often in correlation with oil, NGL and natural gas prices, resulting in periodic shortages. When demand for rigs and equipment increases due to an increase in the number of wells being drilled, there have been shortages of drilling rigs, hydraulic fracturing equipment and personnel and other oilfield equipment. Higher oil, NGL and natural gas prices generally stimulate increased demand for, and result in increased prices of, drilling rigs, crews and associated supplies, equipment and services. These shortages or price increases could negatively affect the ability to drill wells and conduct ordinary operations by the operators of the Company’s wells, resulting in an adverse effect on the Company’s financial condition, cash flow and operating results.
Competition in the oil and natural gas industry is intense, and most of our competitors have greater financial and other resources than we do.
We compete in the highly competitive areas of oil and natural gas acquisition, development, exploration and production. We face intense competition from both major and independent oil and natural gas companies to acquire desirable producing properties, new properties for future exploration and human resource expertise necessary to effectively develop properties. We also face similar competition in obtaining sufficient capital to maintain drilling rights in all drilling units.
A substantial number of our competitors have financial and other resources significantly greater than ours and some of them are fully integrated oil and natural gas companies. These companies are able to pay more for development prospects and productive oil and natural gas properties and are able to define, evaluate, bid for, purchase and subsequently drill a greater number of properties and prospects than our financial or human resources permit, potentially reducing our ability to participate in drilling on certain of our acreage as a working interest owner. Our ability to develop and exploit our oil and natural gas properties and to acquire additional quality properties in the future will depend upon our ability to successfully evaluate, select and acquire suitable properties and join in drilling with reputable operators in this highly competitive environment.
Significant capital expenditures are required to replace our reserves and conduct our business.
The Company funds acquisition, exploration, development and production activities primarily through cash flows from operations and, to a lesser extent, borrowings under its credit facility. The timing and amount of capital necessary to carry out these activities can vary significantly as a result of product price fluctuations, property acquisitions, drilling results and the availability of drilling rigs, equipment, well services and transportation capacity.
Cash flows from operations and access to capital are subject to a number of variables, including the Company’s:
Ÿamount of proved reserves
Ÿvolume of oil, NGL and natural gas produced
Ÿreceived prices for oil, NGL and natural gas sold
Ÿability to acquire and produce new reserves
Ÿability to obtain financing
We may have limited ability to obtain the capital required to sustain our operations at current levels if our borrowing base under our credit facility is lowered as a result of decreased revenues, lower product prices, declines in reserves or for other reasons. Failure to sustain operations at current levels could have a material adverse effect on our financial condition, cash flow and results of operations.
We may be subject to information technology system failures, network disruptions, cyber-attacks or other breaches in data security.
Power, telecommunication or other system failures due to hardware or software malfunctions, computer viruses, vandalism, terrorism, natural disasters, fire, human error or by other means could significantly affect the Company’s ability to conduct its business. Though we have implemented complex network security measures, stringent internal controls and maintain offsite backup of all crucial electronic data, there cannot be absolute assurance that a form of system failure or data security breach will not have a material adverse effect on our financial condition and operations results.
ITEM 1BUNRESOLVED STAFF COMMENTS
None
ITEM 2PROPERTIES
At September 30, 2013, Panhandle’s principal properties consisted of (1) perpetual ownership of 255,300 net mineral acres, held principally in Arkansas, New Mexico, North Dakota, Oklahoma, Texas and six other states; (2) leases on 18,331 net acres primarily in Oklahoma: and (3) working interests, royalty interests or both in 6,105 producing oil and natural gas wells and 53 wells in the process of being drilled or completed.
Consistent with industry practice, the Company does not have current abstracts or title opinions on all of its mineral acreage and, therefore, cannot be certain that it has unencumbered title to all of these properties. In recent years, a few insignificant challenges have been made against the Company’s fee title to its acreage.
The Company pays ad valorem taxes on minerals owned in eleven states.
ACREAGE
Mineral Interests Owned
The following table of mineral acreage owned reflects, in each respective state, the number of net and gross acres, net and gross producing acres, net and gross acres leased, and net and gross acres open (unleased) as of September 30, 2013.
| | | | | | | | |
| | | | | | | | |
State | Net Acres | Gross Acres | Net Acres Producing (1) | Gross Acres Producing (1) | Net Acres Leased to Others (2) | Gross Acres Leased to Others (2) | Net Acres Open (3) | Gross Acres Open (3) |
Arkansas | 11,992 | 51,055 | 7,089 | 25,989 | 1,722 | 5,468 | 3,181 | 19,598 |
Colorado | 8,217 | 39,080 | - | - | - | - | 8,217 | 39,080 |
Florida | 3,832 | 8,212 | - | - | - | - | 3,832 | 8,212 |
Kansas | 3,082 | 11,816 | 144 | 1,200 | - | - | 2,938 | 10,616 |
Montana | 1,008 | 17,947 | - | - | - | - | 1,008 | 17,947 |
New Mexico | 57,374 | 174,300 | 1,381 | 7,205 | 160 | 320 | 55,833 | 166,775 |
North Dakota | 11,179 | 64,286 | 170 | 2,036 | 20 | 160 | 10,989 | 62,090 |
Oklahoma | 113,568 | 952,072 | 41,336 | 332,851 | 4,152 | 31,675 | 68,080 | 587,546 |
South Dakota | 1,825 | 9,300 | - | - | - | - | 1,825 | 9,300 |
Texas | 43,196 | 360,349 | 8,412 | 74,337 | 1,225 | 5,099 | 33,559 | 280,913 |
Other | 27 | 262 | - | - | - | - | 27 | 262 |
Total: | 255,300 | 1,688,679 | 58,532 | 443,618 | 7,279 | 42,722 | 189,489 | 1,202,339 |
(1) “Producing” represents the mineral acres in which Panhandle owns a royalty or working interest in a producing well. |
(2) “Leased” represents the mineral acres owned by Panhandle that are leased to third parties but not producing. |
(3) “Open” represents mineral acres owned by Panhandle that are not leased or in production. |
Leases
The following table reflects net mineral acres leased from others, lease expiration dates, and net leased acres held by production as of September 30, 2013.
| | | | | | | |
| | | | | | | |
State | Net Acres | Net Acres Expiring | Net Acres Held by Production |
| | 2014 | 2015 | 2016 | 2017 | 2018 | |
Arkansas | 1,738 | 118 | 91 | - | 27 | 4 | 1,498 |
Kansas | 2,117 | - | - | - | - | - | 2,117 |
Oklahoma | 12,873 | 233 | 20 | - | - | - | 12,620 |
Other | 1,603 | - | - | - | - | - | 1,603 |
TOTAL | 18,331 | 351 | 111 | - | 27 | 4 | 17,838 |
PROVED RESERVES
The following table summarizes estimates of proved reserves of oil, NGL and natural gas held by Panhandle as of September 30, 2013. All proved reserves are located onshore within the United States and are principally made up of small interests in 6,105 wells, which are predominately located in the Mid-Continent region. Other than this report, the Company’s reserve estimates are not filed with any other federal agency.
| | | | | | | | |
| | | | | | | | |
| | Barrels of Oil | | Barrels of NGL | | Mcf of Natural Gas | | Mcfe |
Net Proved Developed Reserves | | | | | | | | |
September 30, 2013 | | 1,037,721 | | 764,321 | | 82,298,833 | | 93,111,085 |
September 30, 2012 | | 849,548 | | 494,160 | | 65,733,119 | | 73,795,367 |
September 30, 2011 | | 759,989 | | 386,774 | | 60,193,878 | | 67,074,456 |
| | | | | | | | |
Net Proved Undeveloped Reserves | | | | | | | | |
September 30, 2013 | | 605,582 | | 851,805 | | 49,990,334 | | 58,734,656 |
September 30, 2012 | | 222,771 | | 294,582 | | 47,780,937 | | 50,885,055 |
September 30, 2011 | | 83,749 | | 404,874 | | 41,644,106 | | 44,575,844 |
| | | | | | | | |
Net Total Proved Reserves | | | | | | | | |
September 30, 2013 | | 1,643,303 | | 1,616,126 | | 132,289,167 | | 151,845,741 |
September 30, 2012 | | 1,072,319 | | 788,742 | | 113,514,056 | | 124,680,422 |
September 30, 2011 | | 843,738 | | 791,648 | | 101,837,984 | | 111,650,300 |
The 27.2 Bcfe increase in total proved reserves from 2012 to 2013 is a combination of the following factors:
ŸNegative performance revisions of 5.8 Bcfe, which consists of 8.8 Bcfe of positive proved developed revisions principally due to better than projected well performance attributable to properties in Arkansas and Oklahoma and 14.6 Bcfe of negative proved undeveloped revisions principally attributable to the removal of dry gas reserves which are no longer projected to be developed within 5 years from the date they were added to the proved undeveloped reserves.
ŸPositive pricing revisions of 3.4 Bcfe due to proved developed wells (3.1 Bcfe) and proved undeveloped locations (.3 Bcfe) reaching their economic limits later than previously projected, thus adding reserves, resulting from higher natural gas prices.
ŸProved developed reserve additions of 8.1 Bcfe principally resulting from:
a)The Company’s participation in ongoing development of conventional oil, NGL and natural gas plays utilizing horizontal drilling, including the Cleveland and Granite Wash plays in western Oklahoma and the Texas Panhandle, as well as the Marmaton and Hogshooter Wash plays in western Oklahoma.
b)The Company’s participation in ongoing development of unconventional natural gas plays utilizing horizontal drilling, including the Arkansas Fayetteville Shale and, to a much lesser extent, the Southeastern Oklahoma Woodford Shale.
c)The Company’s participation in ongoing development of unconventional oil, NGL and natural gas plays utilizing horizontal drilling in the Anadarko Basin Woodford Shale and Ardmore Basin Woodford Shale in western and southern Oklahoma.
ŸPUD additions of 32.8 Bcfe principally in the Fayetteville Shale play in Arkansas, the Anadarko Basin Woodford Shale and Ardmore Basin Woodford Shale in western and southern Oklahoma and the Cleveland and Granite Wash plays in western Oklahoma and the Texas Panhandle, as well as the Marmaton and Hogshooter Wash plays in western Oklahoma. These additions are the result of reservoir delineation proved by continuing drilling and well performance data in each of the referenced plays.
ŸProperty purchases of 1.7 Bcfe primarily in the Fayetteville Shale play in Arkansas.
ŸProduction of 13.0 Bcfe.
The following details the changes in proved undeveloped reserves for 2013 (Mcfe):
| |
| |
Beginning proved undeveloped reserves | 50,885,055 |
Proved undeveloped reserves transferred to proved developed | (12,124,203) |
Revisions | (14,309,809) |
Extensions and discoveries | 32,806,004 |
Purchases | 1,477,609 |
Ending proved undeveloped reserves | 58,734,656 |
The beginning PUD reserves were 50.9 Bcfe. A total of 12.1 Bcfe (24% of the beginning balance) were transferred to proved developed producing during 2013. The 14.3 Bcfe of negative revisions to PUD reserves consist of a positive pricing revision of 0.3 Bcfe offset by a 14.6 Bcfe (29% of the beginning balance) negative performance revision in 2013 as the result of removal of dry gas reserves which are no longer projected to be developed within 5 years from the date they were added. A total of 26.7 Bcfe (53% of the beginning balance) of PUD reserves were moved out of the category during 2013 as either the result of being transferred to proved developed or removed because they were no longer projected to be developed within 5 years from the date they were added to the proved undeveloped reserves. Only 21 PUD locations from 2009, representing 1% of total 2013 PUD reserves remain in the PUD category. We anticipate that all the Company’s PUD locations will be drilled and converted to PDP within five years of the date they were added. However, PUD locations and associated reserves which are no longer projected to be drilled within 5 years from the date they were added to the proved undeveloped reserves will be removed as revisions at the time that determination is made and in the event that there are undrilled PUD locations at the end of the five-year period, it is our intent to remove the reserves associated with those locations from our proved reserves as revisions.
The determination of reserve estimates is a function of testing and evaluating the production and development of oil and natural gas reservoirs in order to establish a production decline curve. The established production decline curves, in conjunction with oil and natural gas prices, development costs, production taxes and operating expenses, are used to estimate oil and natural gas reserve quantities and associated future net cash flows. As information is processed regarding the development of individual reservoirs and as market conditions change, over time estimated reserve quantities and future net cash flows will change as well. Estimated reserve quantities and future net cash flows are affected by changes in product prices. These prices have varied substantially in recent years and are expected to vary substantially from current pricing in the future.
In January 2010, the FASB updated its oil and natural gas estimation and disclosure requirements to align its requirements with the SEC’s modernized oil and natural gas reporting rules, which were effective for annual reports on Form 10−K for fiscal years ending on or after December 31, 2009. The update included the following changes: (1) permitting use of new technologies to determine proved reserves, if those technologies have been demonstrated empirically to lead to reliable conclusions about reserve volumes; (2) enabling companies to additionally disclose their probable and possible reserves to investors, in addition to their proved reserves; (3) allowing previously excluded resources, such as oil sands, to be classified as oil and natural gas reserves rather than mining reserves; (4) requiring companies to report the independence and qualifications of a preparer or auditor, based on current Society of Petroleum Engineers criteria; (5) requiring the filing of reports for companies that rely on a third party to prepare reserve estimates or conduct a reserve audit; and (6) requiring companies to report oil and natural gas reserves using an average price based upon the prior 12-month period, rather than year-end prices. The update was applied prospectively as a change in accounting principle that is inseparable from a change in accounting estimate and was effective for entities with annual reporting periods ending on or after December 31, 2009. Effective September 30, 2010, the Company adopted the new requirements. See Note 11 to the financial statements in Item 8 – “Financial Statements and Supplementary Data” for disclosures regarding our oil and natural gas reserves.
Proved oil and natural gas reserves are those quantities of oil and natural gas which, by analysis of geoscience and engineering data, can be estimated with reasonable certainty to be economically producible – from a given date forward, from known reservoirs, and under existing economic conditions, operating methods, and government regulations – prior to the time at which contracts providing the right to operate expire, unless evidence indicates that renewal is reasonably certain, regardless of whether deterministic or probabilistic methods are used for the estimation. The project to extract the hydrocarbons must have commenced, or the operator must be reasonably certain that it will commence the project within a reasonable time. The area of the reservoir considered as proved includes: (i) the area identified by drilling and limited by fluid contacts, if any, and (ii) adjacent undrilled portions of the reservoir that can, with reasonable certainty, be judged to be continuous with it and to contain economically producible oil or natural gas on the basis of available geoscience and engineering data. In the absence of data on fluid contacts, proved quantities in a reservoir are limited by the lowest known hydrocarbons as seen in a well penetration unless geoscience, engineering or performance data and reliable technology establishes a lower contact with reasonable certainty. Where direct observation from well penetrations has defined a highest known oil elevation and the potential exists for an associated natural gas cap, proved oil reserves may be assigned in the structurally higher portions of the reservoir only if geoscience, engineering or performance data and reliable technology establish the higher contact with reasonable certainty. Reserves, which can be produced economically through application of improved recovery techniques (including, but not limited to, fluid injection), are included in the proved classification when: (i) successful testing by a pilot project in an area of the reservoir with properties no more favorable than in the reservoir as a whole, the operation of an installed program in the reservoir or an analogous reservoir, or other evidence using reliable technology establishes the reasonable certainty of the engineering analysis on which the project or program was based; and (ii) the project has been approved for
development by all necessary parties and entities, including governmental entities. Existing economic conditions include prices and costs at which economic producibility from a reservoir is to be determined. The price shall be the average price during the 12-month period prior to the ending date of the period covered by the report, determined as an unweighted arithmetic average of the first-day-of-the-month price for each month within such period, unless prices are defined by contractual arrangements, excluding escalations based upon future conditions.
Developed oil and natural gas reserves are reserves of any category that can be expected to be recovered through existing wells with existing equipment and operating methods, or in which the cost of the required equipment is relatively minor compared to the cost of a new well, and through installed extraction equipment and infrastructure operational at the time of the reserve estimate, if the extraction is by means not involving a well.
Undeveloped oil and natural gas reserves are reserves of any category that are expected to be recovered from new wells on undrilled acreage or from existing wells where a relatively major expenditure is required for recompletion. Reserves on undrilled acreage are limited to those directly offsetting development spacing areas that are reasonably certain of production when drilled, unless evidence using reliable technology exists that establishes reasonable certainty of economic producibility at greater distances. Undrilled locations can be classified as having undeveloped reserves only if a development plan has been adopted indicating that they are scheduled to be drilled within five years, unless the specific circumstances justify a longer time. Under no circumstances shall estimates for undeveloped reserves be attributable to any acreage for which an application of fluid injection or other improved recovery technique is contemplated, unless such techniques have been proved effective by actual projects in the same reservoir or an analogous reservoir or by other evidence using reliable technology establishing reasonable certainty.
The independent consulting petroleum engineering firm of DeGolyer and MacNaughton of Dallas, Texas, calculated the Company’s oil, NGL and natural gas reserves as of September 30, 2013, 2012 and 2011 (see Exhibits 23 and 99).
The Company’s net proved oil, NGL and natural gas reserves (including certain undeveloped reserves described above) are located onshore in the United States. All studies have been prepared in accordance with regulations prescribed by the Securities and Exchange Commission. The reserve estimates were based on economic and operating conditions existing at September 30, 2013, 2012 and 2011. Since the determination and valuation of proved reserves is a function of testing and estimation, the reserves presented should be expected to change as future information becomes available.
ESTIMATED FUTURE NET CASH FLOWS
Set forth below are estimated future net cash flows with respect to Panhandle’s net proved reserves (based on the estimated units set forth above in Proved Reserves) for the year indicated, and the present value of such estimated future net cash flows, computed by applying a 10% discount factor as required by SEC rules and regulations. As of September 30, 2010, the Company adopted the SEC Rule, Modernization of Oil and Gas Reporting Requirements. In accordance with the SEC rule, the estimated future net cash flows were computed using the 12-month average price calculated as the unweighted arithmetic average of the first-day-of-the-month individual product prices for each month within the 12-month period prior to September 30 held flat over the life of the properties and applied to future production of proved reserves less estimated future development and production expenditures for these reserves. The amounts presented are net of operating costs and production taxes levied by the respective states. Prices used for determining future cash flows from oil, NGL and natural gas as of September 30, 2013, 2012 and 2011 were as follows: $89.06/Bbl, $27.28/Bbl, $3.33/Mcf; $89.41/Bbl, $35.70/Bbl, $2.51/Mcf; $90.28/Bbl, $38.91/Bbl, $3.81/Mcf, respectively. These future net cash flows based on SEC
pricing rules should not be construed as the fair market value of the Company’s reserves. A market value determination would need to include many additional factors, including anticipated oil, NGL and natural gas price and production cost increases or decreases, which could affect the economic life of the properties.
| | | | | | | | |
| | | | | | | | |
Estimated Future Net Cash Flows | | | | | | | | |
| 9/30/2013 | | 9/30/2012 | | 9/30/2011 |
Proved Developed | $ | 239,353,059 | | $ | 165,036,044 | | $ | 211,851,992 |
Proved Undeveloped | | 123,822,641 | | | 72,851,862 | | | 91,232,949 |
Income Tax Expense | | (131,397,192) | | | (83,543,516) | | | (107,111,317) |
Total Proved | $ | 231,778,508 | | $ | 154,344,390 | | $ | 195,973,624 |
| | | | | | | | |
10% Discounted Present Value of Estimated Future Net Cash Flows |
| 9/30/2013 | | 9/30/2012 | | 9/30/2011 |
Proved Developed | $ | 125,186,445 | | $ | 87,587,058 | | $ | 106,464,138 |
Proved Undeveloped | | 51,276,694 | | | 27,151,132 | | | 29,977,891 |
Income Tax Expense | | (74,788,243) | | | (47,323,902) | | | (58,059,595) |
Total Proved | $ | 101,674,896 | | $ | 67,414,288 | | $ | 78,382,434 |
OIL, NGL AND NATURAL GAS PRODUCTION
The following table sets forth the Company’s net production of oil, NGL and natural gas for the fiscal periods indicated.
| | | | | |
| | | | | |
| Year Ended | | Year Ended | | Year Ended |
| 9/30/2013 | | 9/30/2012 | | 9/30/2011 (1) |
Bbls - Oil | 234,084 | | 153,143 | | 104,141 |
Bbls - NGL | 111,897 | | 98,714 | | * |
Mcf - Natural Gas | 10,886,329 | | 9,072,298 | | 8,297,657 |
Mcfe | 12,962,215 | | 10,583,440 | | 8,922,503 |
(1) | Natural gas production includes NGL volumes. |
AVERAGE SALES PRICES AND PRODUCTION COSTS
The following tables set forth unit price and cost data for the fiscal periods indicated.
| | | | | | | | |
| | | | | | | | |
| Year Ended | | Year Ended | | Year Ended |
Average Sales Price | 9/30/2013 | | 9/30/2012 | | 9/30/2011 (1) |
Per Bbl, Oil | $ | 91.56 | | $ | 90.13 | | $ | 88.00 |
Per Bbl, NGL | $ | 27.67 | | $ | 33.23 | | | * |
Per Mcf, Natural Gas | $ | 3.31 | | $ | 2.62 | | $ | 4.13 |
Per Mcfe | $ | 4.68 | | $ | 3.86 | | $ | 4.87 |
(1)Proceeds from the sale of NGL have been included in natural gas sales and are therefore included in the price per Mcf of natural gas.
* The Company reported NGL reserves for the first time in its 2011 year-end reserve report. Increased drilling activity over the last two years in several western Oklahoma plays which produce significant NGL has resulted in meaningful NGL reserves and production for the Company. These reserve and production increases necessitated inclusion of NGL in the 2011 year-end reserve calculation and 2012 production volumes. In quarters prior to 2012, all NGL sales revenues were included with natural gas sales revenues.
| | | | | | | | |
| | | | | | | | |
| Year Ended | | Year Ended | | Year Ended |
Average Production (lifting) Costs | 9/30/2013 | | 9/30/2012 | | 9/30/2011 |
(Per Mcfe) | | | | | | | | |
Well Operating Costs (1) | $ | 0.92 | | $ | 0.86 | | $ | 0.95 |
Production Taxes (2) | | 0.14 | | | 0.14 | | | 0.16 |
| $ | 1.06 | | $ | 1.00 | | $ | 1.11 |
(1)Includes actual well operating costs, compression, handling and marketing fees paid on natural gas sales and other minor expenses associated with well operations.
(2)Includes production taxes only.
Approximately 30% of the Company’s oil, NGL and natural gas revenue is generated from royalty payments received on its mineral acreage. Royalty interests bear no share of the operating costs on those producing wells.
GROSS AND NET PRODUCTIVE WELLS AND DEVELOPED ACRES
The following table sets forth Panhandle’s gross and net productive oil and natural gas wells as of September 30, 2013. Panhandle owns either working interests, royalty interests or both in these wells. The Company does not operate any wells.
| | | | | | | | |
| | | | | | | | |
| | Gross Working Interest Wells | | Net Working Interest Wells | | Gross Royalty Only Wells | | Total Gross Wells |
Oil | | 242 | | 15.61 | | 1,009 | | 1,251 |
Natural Gas | | 1,796 | | 85.11 | | 3,058 | | 4,854 |
Total | | 2,038 | | 100.72 | | 4,067 | | 6,105 |
Panhandle’s average interest in royalty interest only wells is 0.84%. Panhandle’s average interest in working interest wells is 4.94% working interest and 4.80% net revenue interest.
Information on multiple completions is not available from Panhandle’s records, but the number is not believed to be significant. With regard to Gross Royalty Only Wells, some of these wells are in multi-well unitized fields. In such cases, the Company’s ownership in each unitized field is counted as one gross well as the Company does not have access to the actual well count in all of these unitized fields.
As of September 30, 2013, Panhandle owned 443,618 gross developed mineral acres and 58,532 net developed mineral acres. Panhandle has also leased from others 139,717 gross developed acres containing 17,838 net developed acres.
UNDEVELOPED ACREAGE
As of September 30, 2013, Panhandle owned 1,245,061 gross and 196,768 net undeveloped mineral acres, and leases on 6,923 gross and 493 net undeveloped acres.
DRILLING ACTIVITY
The following net productive development, exploratory and purchased wells and net dry development, exploratory and purchased wells in which the Company had either a working interest, a royalty interest or both were drilled and completed during the fiscal years indicated.
| | | | | | |
| | | | | | |
| | Net Productive | | Net Productive | | Net Dry |
| | Working Interest Wells | | Royalty Interest Wells | | Working Interest Wells |
Development Wells | | | | | | |
Fiscal years ended: | | | | | | |
September 30, 2013 | | 7.405905 | | 1.532470 | | 0.003906 |
September 30, 2012 | | 5.376408 | | 1.225832 | | 0.093438 |
September 30, 2011 | | 2.573391 | | 0.907650 | | 0.062188 |
| | | | | | |
Exploratory Wells | | | | | | |
Fiscal years ended: | | | | | | |
September 30, 2013 | | -- 0 -- | | 0.079589 | | 0.048446 |
September 30, 2012 | | 0.298974 | | 0.090654 | | 0.531250 |
September 30, 2011 | | 0.510643 | | 0.372957 | | 0.007813 |
| | | | | | |
Purchased Wells | | | | | | |
Fiscal years ended: | | | | | | |
September 30, 2013 | | -- 0 -- | | 0.218122 | | -- 0 -- |
September 30, 2012 | | 4.300626 | | 0.231430 | | -- 0 -- |
September 30, 2011 | | -- 0 -- | | 0.235058 | | -- 0 -- |
PRESENT ACTIVITIES
The following table sets forth the gross and net oil and natural gas wells drilling or testing as of September 30, 2013, in which Panhandle owns either a working interest, a royalty interest or both. These wells were not producing at September 30, 2013.
| | | |
| | | |
| Gross Wells | | Net Wells |
Oil | 26 | | 0.91 |
Natural Gas | 27 | | 1.02 |
OTHER FACILITIES
The Company has a lease on 12,369 square feet for its office in Oklahoma City, Oklahoma, which ends April 30, 2015.
SAFE HARBOR STATEMENT
This report, including information included in, or incorporated by reference from, future filings by the Company with the SEC, as well as information contained in written material, press releases and oral statements, contains, or may contain, certain statements that are “forward-looking statements,”
within the meaning of the federal securities laws. All statements, other than statements of historical facts, included or incorporated by reference in this report, which address activities, events or developments which are expected to, or anticipated will, or may, occur in the future, are forward-looking statements. The words “believes,” “intends,” “expects,” “anticipates,” “projects,” “estimates,” “predicts” and similar expressions are used to identify forward-looking statements.
These forward-looking statements include, among others, such things as: the amount and nature of our future capital expenditures; wells to be drilled or reworked; prices for oil, NGL and natural gas; demand for oil, NGL and natural gas; estimates of proved oil, NGL and natural gas reserves; development and infill drilling potential; drilling prospects; business strategy; production of oil, NGL and natural gas reserves; and expansion and growth of our business and operations.
These statements are based on certain assumptions and analyses made by the Company in light of experience and perception of historical trends, current conditions and expected future developments as well as other factors believed appropriate in the circumstances. However, whether actual results and development will conform to our expectations and predictions is subject to a number of risks and uncertainties, which could cause actual results to differ materially from our expectations.
One should not place undue reliance on any of these forward-looking statements. The Company does not currently intend to update forward-looking information and to release publicly the results of any future revisions made to forward-looking statements to reflect events or circumstances, which reflect the occurrence of unanticipated events, after the date of this report.
In order to provide a more thorough understanding of the possible effects of some of these influences on any forward-looking statements made, the following discussion outlines certain factors that in the future could cause results for 2014 and beyond to differ materially from those that may be presented in any such forward-looking statement made by or on behalf of the Company.
Commodity Prices. The prices received for oil, NGL and natural gas production have a direct impact on the Company’s revenues, profitability and cash flows as well as the ability to meet its projected financial and operational goals. The prices for crude oil, NGL and natural gas are dependent on a number of factors beyond the Company’s control, including: the demand for oil, NGL and natural gas; weather conditions in the continental United States (which can greatly influence the demand for natural gas at any given time as well as the price we receive for such natural gas); and the ability of current distribution systems in the United States to effectively meet the demand for oil, NGL and natural gas at any given time, particularly in times of peak demand which may result because of adverse weather conditions.
Oil prices are sensitive to foreign influences based on political, social or economic factors, any one of which could have an immediate and significant effect on the price and supply of oil. In addition, prices of both natural gas and oil are becoming more and more influenced by trading on the commodities markets, which has, at times, increased the volatility associated with these prices.
Uncertainty of Oil, NGL and Natural Gas Reserves. There are numerous uncertainties inherent in estimating quantities of proved reserves and their values, including many factors beyond the Company’s control. The oil, NGL and natural gas reserve data included in this report represents only an estimate of these reserves. Oil and natural gas reservoir engineering is a subjective and inexact process of estimating underground accumulations of oil, NGL and natural gas that cannot be measured in an exact manner. Estimates of economically recoverable oil, NGL and natural gas reserves depend on a number of variable factors, including historical production from the area compared with production from other producing areas and assumptions concerning future oil, NGL and natural gas prices, future operating costs, severance and excise taxes, development costs, and workover and remedial costs.
Some or all of these assumptions may vary considerably from actual results. For these reasons, estimates of the economically recoverable quantities of oil, NGL and natural gas and estimates of the future net cash flows from oil, NGL and natural gas reserves prepared by different engineers or by the same engineers but at different times may vary substantially. Accordingly, oil, NGL and natural gas reserve estimates may be subject to periodic downward or upward adjustments. Actual production, revenues and expenditures with respect to oil, NGL and natural gas reserves will vary from estimates, and those variances can be material.
The Company does not operate any of the properties in which it has an interest and has very limited ability to exercise influence over operations for these properties or their associated costs. Dependence on the operator and other working interest owners for these projects and the limited ability to influence operations and associated costs could materially and adversely affect the realization of targeted returns on capital in drilling or acquisition activities and targeted production growth rates.
The information regarding discounted future net cash flows included in this report is not necessarily the current market value of the estimated oil, NGL and natural gas reserves attributable to the Company’s properties. As required by the SEC, the estimated discounted future net cash flows from proved oil, NGL and natural gas reserves are determined based on the fiscal year’s 12-month average of the first-day-of-the-month individual product prices and costs as of the date of the estimate. Actual future prices and costs may be materially higher or lower. Actual future net cash flows are also affected, in part, by the amount and timing of oil, NGL and natural gas production, supply and demand for oil, NGL and natural gas and increases or decreases in consumption.
In addition, the 10% discount factor required by the SEC used in calculating discounted future net cash flows for reporting purposes is not necessarily the most appropriate discount factor based on interest rates in effect from time to time and the risks associated with operations of the oil and natural gas industry in general.
ITEM 3LEGAL PROCEEDINGS
There were no material legal proceedings involving Panhandle on September 30, 2013, or at the date of this report.
ITEM 4MINE SAFETY DISCLOSURES
Not applicable.
PART II
ITEM 5MARKET FOR COMMON EQUITY, RELATED STOCKHOLDER MATTERS AND ISSUER PURCHASES OF EQUITY SECURITIES
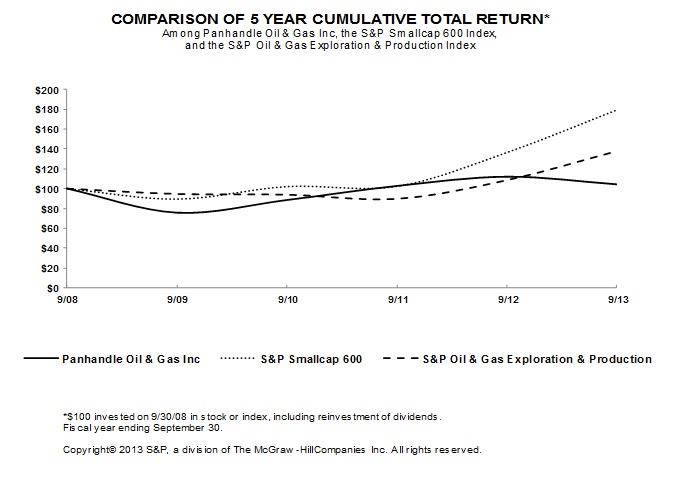
The above graph compares the 5-year cumulative total return provided shareholders on our Class A Common Stock (“Common Stock”) relative to the cumulative total returns of the S&P Smallcap 600 Index and the S&P Oil & Gas Exploration & Production Index. An investment of $100 (with reinvestment of all dividends) is assumed to have been made in our Common Stock and in each of the indexes on September 30, 2008, and its relative performance is tracked through September 30, 2013.
Since July 22, 2008, the Company’s Common Stock has been listed and traded on the New York Stock Exchange (symbol PHX). The following table sets forth the high and low trade prices of the Common Stock during the periods indicated:
| | | | | | |
| | | | | | |
Quarter Ended | | High | | Low |
December 31, 2011 | | $ | 36.00 | | $ | 26.18 |
March 31, 2012 | | $ | 33.74 | | $ | 28.05 |
June 30, 2012 | | $ | 30.57 | | $ | 24.16 |
September 30, 2012 | | $ | 33.49 | | $ | 27.85 |
December 31, 2012 | | $ | 31.70 | | $ | 24.70 |
March 31, 2013 | | $ | 30.63 | | $ | 26.83 |
June 30, 2013 | | $ | 31.12 | | $ | 27.00 |
September 30, 2013 | | $ | 32.86 | | $ | 27.27 |
At November 25, 2013, there were 1,474 holders of record of Panhandle’s Class A Common Stock and approximately 3,700 beneficial owners.
During the past two years, the Company has paid quarterly dividends of $.07 per share on its Common Stock. Approval by the Company’s Board is required before the declaration and payment of any dividends.
While the Company anticipates it will continue to pay dividends on its Common Stock, the payment and amount of future cash dividends will depend upon, among other things, financial condition, funds from operations, the level of capital and development expenditures, future business prospects, contractual restrictions and any other factors considered relevant by the Board.
The Company’s credit facility also contains a provision limiting the paying or declaring of a cash dividend during any fiscal year to 20% of net cash flow provided by operating activities from the Statement of Cash Flows of the preceding 12-month period. See Note 4 to the financial statements in Item 8 – “Financial Statements and Supplementary Data” for a further discussion of the credit facility.
Upon approval by the shareholders of the Company’s 2010 Restricted Stock Plan on March 11, 2010, the Board approved the purchase of the Company’s Common Stock, from time to time, equal to the aggregate number of shares of Common Stock awarded pursuant to the Company’s 2010 Restricted Stock Plan, contributed by the Company to its ESOP and credited to the accounts of directors pursuant to the Deferred Compensation Plan for Non-Employee Directors. The Board’s approval included an initial authorization to purchase up to $1.5 million of Common Stock, with a provision for subsequent authorizations without specific action by the Board. As the amount of Common Stock purchased under any authorization reaches $1.5 million, another $1.5 million is automatically authorized for Common Stock purchases unless the Board determines otherwise. Pursuant to these resolutions adopted by the Board, the purchase of additional $1.5 million increments of the Company’s Common Stock became authorized and approved effective March 29, 2011, March 14, 2012, and June 26, 2013. The shares are held in treasury and are accounted for using the cost method. There were no Common Stock purchases in the fourth quarter of fiscal year 2013. At September 30, 2013, and September 30, 2012, 10,907 and 10,660 (respectively) treasury shares were contributed to the Company’s ESOP on behalf of the ESOP participants.
ITEM 6SELECTED FINANCIAL DATA
The following table summarizes financial data of the Company for its last five fiscal years and should be read in conjunction with Item 7 – “Management’s Discussion and Analysis of Financial Condition and Results of Operations” and the Financial Statements of the Company, including the Notes thereto, included elsewhere in this report.
| | | | | | | | | | | | | | |
| | | | | | | | | | | | | | |
| As of and for the year ended September 30, |
| 2013 | | 2012 | | 2011 | | 2010 | | 2009 |
Revenues | | | | | | | | | | | | | | |
Oil, NGL and natural gas sales | $ | 60,605,878 | | $ | 40,818,434 | | $ | 43,469,130 | | $ | 44,068,947 | | $ | 37,421,688 |
Lease bonuses and rentals | | 938,846 | | | 7,152,991 | | | 352,757 | | | 1,120,674 | | | 188,906 |
Gains (losses) on derivative contracts | | 611,024 | | | 73,822 | | | 734,299 | | | 6,343,661 | | | (661,828) |
Income from partnerships | | 733,372 | | | 487,070 | | | 420,465 | | | 405,134 | | | 323,848 |
| | 62,889,120 | | | 48,532,317 | | | 44,976,651 | | | 51,938,416 | | | 37,272,614 |
Costs and expenses | | | | | | | | | | | | | | |
Lease operating expense | | 11,861,403 | | | 9,141,970 | | | 8,441,754 | | | 8,193,319 | | | 7,696,026 |
Production taxes | | 1,834,840 | | | 1,449,537 | | | 1,456,755 | | | 1,446,545 | | | 1,201,209 |
Exploration costs | | 9,795 | | | 979,718 | | | 1,025,542 | | | 1,583,773 | | | 711,582 |
Depreciation, depletion and amortization | | 21,945,768 | | | 19,061,239 | | | 14,712,188 | | | 19,222,123 | | | 28,168,933 |
Provision for impairment | | 530,670 | | | 826,508 | | | 1,728,162 | | | 605,615 | | | 2,464,520 |
Loss (gain) on asset sales, int. & other | | (785,401) | | | 39,493 | | | (68,325) | | | (1,028,148) | | | (2,677,407) |
Gen. and administrative | | 6,801,996 | | | 6,388,856 | | | 5,994,663 | | | 5,594,499 | | | 4,866,044 |
Bad debt expense (recovery) | | - | | | - | | | - | | | - | | | (185,272) |
| | 42,199,071 | | | 37,887,321 | | | 33,290,739 | | | 35,617,726 | | | 42,245,635 |
| | | | | | | | | | | | | | |
Income (loss) before provision | | | | | | | | | | | | | | |
(benefit) for income taxes | | 20,690,049 | | | 10,644,996 | | | 11,685,912 | | | 16,320,690 | | | (4,973,021) |
Provision (benefit) for income taxes | | 6,730,000 | | | 3,274,000 | | | 3,192,000 | | | 4,901,000 | | | (2,568,000) |
Net income (loss) | $ | 13,960,049 | | $ | 7,370,996 | | $ | 8,493,912 | | $ | 11,419,690 | | $ | (2,405,021) |
| | | | | | | | | | | | | | |
Basic and diluted earnings (loss) per share | $ | 1.67 | | $ | 0.88 | | $ | 1.01 | | $ | 1.36 | | $ | (0.29) |
Dividends declared per share | $ | 0.28 | | $ | 0.28 | | $ | 0.28 | | $ | 0.28 | | $ | 0.28 |
| | | | | | | | | | | | | | |
Weighted average shares outstanding | | | | | | | | | | | | | | |
Basic and diluted | | 8,356,904 | | | 8,360,931 | | | 8,393,890 | | | 8,422,387 | | | 8,397,337 |
| | | | | | | | | | | | | | |
Net cash provided by (used in): | | | | | | | | | | | | | | |
Operating activities | $ | 37,402,109 | | $ | 25,371,195 | | $ | 29,283,929 | | $ | 27,806,475 | | $ | 37,710,606 |
Investing activities | $ | (26,364,675) | | $ | (38,288,959) | | $ | (27,200,816) | | $ | (9,845,516) | | $ | (36,322,992) |
Financing activities | $ | (10,154,362) | | $ | 11,394,864 | | $ | (4,173,372) | | $ | (13,003,609) | | $ | (1,643,414) |
| | | | | | | | | | | | | | |
Total assets | $ | 147,838,430 | | $ | 135,186,730 | | $ | 111,424,193 | | $ | 105,124,839 | | $ | 108,549,632 |
Long-term debt | $ | 8,262,256 | | $ | 14,874,985 | | $ | - | | $ | - | | $ | 10,384,722 |
Shareholders' equity | $ | 95,655,486 | | $ | 83,852,146 | | $ | 78,802,317 | | $ | 73,581,996 | | $ | 64,122,343 |
ITEM 7MANAGEMENT’S DISCUSSION AND ANALYSIS OF FINANCIAL CONDITION AND RESULTS OF OPERATIONS
BUSINESS OVERVIEW
The Company’s principal line of business is to explore for, develop, produce and sell oil, NGL and natural gas. Results of operations are dependent primarily upon: reserve quantities and associated exploration and development costs in finding new reserves; production quantities and related production costs; and oil, NGL and natural gas sales prices.
Natural gas production was 20% higher in 2013 than in 2012. This production increase is the combined effect of added natural gas production from wells put on production during the first half of 2013 in the Fayetteville Shale and associated natural gas production from ongoing development on the Company’s mineral and leasehold acreage in the following oil and NGL rich plays:
ŸHorizontal Granite Wash and Hogshooter in western Oklahoma and the Texas Panhandle
ŸHorizontal Cleveland in western Oklahoma and the Texas Panhandle
ŸHorizontal Marmaton in western Oklahoma
ŸHorizontal Tonkawa in western Oklahoma
ŸHorizontal Anadarko Basin Woodford Shale in western Oklahoma
ŸHorizontal Ardmore Basin Woodford Shale in southern Oklahoma
Development in these plays has also resulted in a 53% and a 13% increase in 2013 oil and NGL production, respectively, as compared to 2012.
As of September 30, 2013, the Company owned an average 3.6% net revenue interest in 53 wells that were drilling or testing. As these wells begin producing and other scheduled wells are drilled and completed in the abovementioned plays, the Company anticipates fiscal 2014 oil and NGL production will increase over that of 2013, while 2014 natural gas production is expected to remain relatively flat to 2013.
The increased production of oil, NGL and natural gas in 2013, and higher natural gas and oil prices, partially offset by lower NGL prices, resulted in a 48% increase in revenues from the sale of oil, NGL and natural gas. Based on recent forward strip pricing for 2014, the Company expects 2014 average natural gas prices to be slightly higher (approximately $3.40 per Mcf), oil prices to be lower (approximately $88.00 per Bbl) and NGL prices to remain flat (approximately $28.00 per Bbl) to their corresponding average prices in 2013.
The Company’s proved developed oil, NGL and natural gas reserves increased in 2013, compared to 2012, by 19.3 Bcfe, or 26%. The increase is due primarily to successful drilling activities.
Management currently expects drilling on the Company’s acreage to result in capital expenditures for oil and natural gas activities of approximately $33 million during 2014. The Company will also continue to evaluate opportunities to acquire mineral acreage or producing properties. Acquisitions, if any, will be financed by a combination of available cash and the bank credit facility.
The Company had no off balance sheet arrangements during 2013 or prior years.
The following table reflects certain operating data for the periods presented:
| | | | | | | | | | | | |
| | | | | | | | | | | | |
| For the Year Ended September 30, |
| | | | Percent | | | | | Percent | | | |
| 2013 | | Incr. or (Decr.) | | 2012 | | Incr. or (Decr.) | | 2011 |
Production: | | | | | | | | | | | | |
Oil (Bbls) | | 234,084 | | 53% | | | 153,143 | | 47% | | | 104,141 |
NGL (Bbls) | | 111,897 | | 13% | | | 98,714 | | - | | | * |
Natural Gas (Mcf) | | 10,886,329 | | 20% | | | 9,072,298 | | 9% | | | 8,297,657 |
Mcfe | | 12,962,215 | | 22% | | | 10,583,440 | | 19% | | | 8,922,503 |
Average Sales Price: | | | | | | | | | | | | |
Oil (per Bbl) | $ | 91.56 | | 2% | | $ | 90.13 | | 2% | | $ | 88.00 |
NGL (per Bbl) | $ | 27.67 | | -17% | | $ | 33.23 | | - | | | * |
Natural Gas (Mcf) (1) | $ | 3.31 | | 26% | | $ | 2.62 | | -37% | | $ | 4.13 |
Mcfe | $ | 4.68 | | 21% | | $ | 3.86 | | -21% | | $ | 4.87 |
(1)Proceeds from the sale of NGL in 2011 were included in natural gas sales, and were therefore included in the price per Mcf of natural gas.
* The Company reported NGL reserves for the first time in its 2011 year-end reserve report. Increased drilling activity over the last few years in several western Oklahoma plays which produce significant NGL has resulted in meaningful NGL reserves and production for the Company. These reserve and production increases necessitated inclusion of NGL in the 2011 year-end reserve calculation and 2012 production volumes. In quarters prior to 2012, all NGL sales revenues were included with natural gas sales revenues.
RESULTS OF OPERATIONS
Fiscal Year 2013 Compared to Fiscal Year 2012
Overview
The Company recorded net income of $13,960,049, or $1.67 per share, in 2013, compared to net income of $7,370,996, or $0.88 per share, in 2012. Revenues increased in 2013 primarily due to higher oil and natural gas sales volumes and prices, partially offset by decreased lease bonuses received.
Expenses increased due to higher DD&A, LOE and G&A in 2013, partially offset by decreases in the provision for impairment and exploration costs and increases in other miscellaneous income. Significant well additions, through drilling, in 2013 increased production volumes, resulting in higher DD&A and LOE in 2013.
Oil, NGL and Natural Gas Sales
Oil, NGL and natural gas sales increased $19,787,444 or 48% for 2013, as compared to 2012. The increase was due to increased oil volumes of 53%, increased natural gas volumes of 20%, increased natural gas prices of 26% and a 2% increase in oil prices in 2013.
The oil and NGL production increase is primarily the result of horizontal drilling in the Marmaton/Cleveland, Hogshooter and Granite Wash in western Oklahoma, horizontal Cleveland drilling in the Texas Panhandle and horizontal Woodford Shale drilling in the Anadarko and Ardmore Basins in
southern Oklahoma. To a lesser extent, focused drilling in the Permian Basin in West Texas, the Bakken in North Dakota and the Mississippian in northern Oklahoma contributed to the oil and NGL production increase. The natural gas production increase was primarily driven by horizontal development drilling in the Arkansas Fayetteville Shale and natural gas production associated with the aforementioned oil and NGL drilling activity.
Production by quarter for 2013 and 2012 was as follows (Mcfe):
| | | | |
| | | | |
| | 2013 | | 2012 |
First quarter | | 3,008,365 | | 2,559,524 |
Second quarter | | 3,245,411 | | 2,654,485 |
Third quarter | | 3,229,800 | | 2,649,351 |
Fourth quarter | | 3,478,639 | | 2,720,080 |
Total | | 12,962,215 | | 10,583,440 |
Lease Bonus and Rentals
Lease bonuses and rentals decreased $6,214,145 in 2013. The decrease was mainly due to the Company leasing partial rights on 2,743 net mineral acres in Roger Mills County, Oklahoma, for $4.8 million and leasing 2,431 net acres in the horizontal Mississippian play in northern Oklahoma for $1.7 million in 2012. There were no large leases of the Company’s mineral acreage in 2013.
Gains (Losses) on Derivative Contracts
Realized and unrealized gains and losses are scheduled below:
| | | | | |
| | | | | |
Gains (Losses) on | | |
Derivative Contracts | 2013 | | 2012 |
Realized | $ | 13,555 | | $ | 462,033 |
Unrealized | | 597,469 | | | (388,211) |
Total | $ | 611,024 | | $ | 73,822 |
The increase in gains was mainly due to the natural gas collars and natural gas fixed price swaps being more beneficial in 2013, as NYMEX gas futures have fallen below the floor of the collars and the fixed gas prices of the swaps. As of September 30, 2013, the Company’s natural gas fixed price swaps have expiration dates of October, November and December 2013; the natural gas costless collar contracts have expiration dates of December 2013 and April 2014; the oil costless collar contracts have expiration dates of December 2013 and June 2014 and the oil fixed price swaps have an expiration date of December 2013.
Lease Operating Expenses (LOE)
LOE increased $2,719,433 or 30% in 2013. LOE costs per Mcfe of production increased from $.86 in 2012 to $.92 in 2013. The total LOE increase is primarily related to increased field operating costs of $726,095 in 2013 compared to 2012. Field operating costs increased mainly due to the large addition in the number of wells drilled in 2013. Field operating costs were $.40 per Mcfe in 2013 compared to $.42 per Mcfe in 2012, a 5% decrease. This decrease in rate is principally the result of fewer well workovers performed in 2013.
The increase in LOE related to field operating costs was also coupled with an increase in handling fees (primarily gathering, transportation and marketing costs) on natural gas of $1,993,338 in 2013, as compared to 2012. On a per Mcfe basis, these fees were up $.07 due to higher natural gas prices. Handling fees are mainly charged as a percent of natural gas sales, but can also be charged based on natural gas production volumes.
Exploration Costs
Exploration costs were $9,795 in 2013, compared to $979,718 in 2012, a $969,923 decrease. During 2013, leasehold impairment and expired leasehold totaled $70,638, compared to $377,942 during 2012, a $307,304 decrease. The decline was driven by lower provisions for expected lease expirations in 2013, as compared to 2012. Charges on three exploratory dry holes totaled $601,776 during 2012; whereas, in 2013 the Company had no exploratory dry holes and received a net credit adjustment of $60,843 for exploratory dry hole costs incurred in previous years.
Depreciation, Depletion and Amortization (DD&A)
DD&A increased $2,884,529 or 15% in 2013. DD&A per Mcfe was $1.69 in 2013, compared to $1.80 in 2012. DD&A increased $4,284,278 due to oil, NGL and natural gas production volumes increasing 22% in the 2013 period, compared to the 2012 period. An offsetting decrease of $1,399,749 was caused by an $.11 decrease in the DD&A rate. This rate decrease is principally due to positive performance and price revisions increasing ultimate reserves at September 30, 2013, for a significant number of wells.
Provision for Impairment
The provision for impairment decreased $295,838 in 2013, as compared to 2012. During 2013, impairment of $530,670 was recorded on five small fields in Oklahoma and Texas. These fields have one to a few wells and are more susceptible to impairment when a well in the field experiences downward reserve revisions, or when a newly completed well with low reserves is added to one of these fields. During the 2012 period, impairment of $826,508 was recorded on twelve small fields in Oklahoma.
Loss (Gain) on Asset Sales, Interest and Other
Loss (Gain) on Asset Sales, Interest and Other was a net gain of $785,401 in 2013, as compared to a net loss of $39,493 in 2012. The gain in 2013 was mainly the result of a class action lawsuit settlement of approximately $604,000 related to the underpayment of royalty revenues.
General and Administrative Costs (G&A)
G&A increased $413,140 or 6% in 2013. The increase is primarily related to increases in the following expense categories: personnel $442,013 and technical consulting $111,832. These were partially offset by decreases in legal fees, Board fees and other expenses of $140,705 in 2013. The increase in 2013 personnel related expenses was largely the result of restricted stock expense increases of $353,044. The increase in technical consulting in 2013 was principally due to increased engineering analysis to evaluate potential acquisitions. The decrease in legal expenses was a result of lower acquisition activity in 2013. The decrease in Board fees was the result of fewer members in 2013.
Provision (Benefit) for Income Taxes
The 2013 provision for income taxes of $6,730,000 was based on a pre-tax income of $20,690,049, as compared to a provision for income taxes of $3,274,000 in 2012, based on a pre-tax income of $10,644,996. The effective tax rate for 2013 was 33%, compared to an effective tax rate for 2012 of 31%. The 2013 effective tax rate increase of 2% was due to pre-tax income increasing 94% from 2012 to 2013, while the excess percentage depletion allowance (which is a permanent tax benefit) increased only 25% over the same period. This resulted in a greater proportion of pre-tax income being subject to income tax and thus increased the effective tax rate. The Company’s utilization of excess percentage depletion decreases the provision for income taxes. The benefit of excess percentage depletion is not directly related to the amount of recorded income or loss. Accordingly, in cases where the recorded income or loss is relatively small, the proportional effect of the excess percentage depletion on the effective tax rate may become significant.
Fiscal Year 2012 Compared to Fiscal Year 2011
Overview
The Company recorded net income of $7,370,996, or $0.88 per share, in 2012, compared to net income of $8,493,912, or $1.01 per share, in 2011. Revenues increased in 2012 primarily due to increased lease bonuses and higher oil and natural gas sales volumes, partially offset by lower natural gas prices.
Expenses increased due to higher DD&A, LOE and G&A in 2012, partially offset by decreases in the provision for impairment and exploration costs. Significant well additions through acquisition and drilling in 2012 increased production volumes and lifting costs, resulting in higher DD&A and LOE in 2012.
Oil, NGL and Natural Gas Sales
Oil, NGL and natural gas sales revenues decreased $2,650,696 or 6% for 2012, as compared to 2011. The decrease was due to lower natural gas prices of 37%, partially offset by increased oil volumes of 47%, increased natural gas volumes of 9% and a 2% increase in oil prices in 2012.
The oil production increase was due to continued drilling in western Oklahoma oily plays such as the horizontal Granite Wash, Cleveland, Tonkawa, Marmaton, Anadarko Basin Woodford Shale and other plays in Oklahoma, West Texas, Texas Panhandle and southeastern New Mexico. The natural gas production increase was mainly a result of production attributable to the acquisition in the Fayetteville Shale in Arkansas that the Company completed effective October 25, 2011. As of September 30, 2012, the Company owned an average 3.6% net revenue interest in 62 wells that were drilling or testing.
Production by quarter for 2012 and 2011 was as follows (Mcfe):
| | | |
| 2012 | | 2011 |
First quarter | 2,559,524 | | 2,208,218 |
Second quarter | 2,654,485 | | 2,152,011 |
Third quarter | 2,649,351 | | 2,129,160 |
Fourth quarter | 2,720,080 | | 2,433,114 |
Total | 10,583,440 | | 8,922,503 |
Lease Bonus and Rentals
Lease bonuses and rentals increased $6,800,234 in 2012. The increase was mainly due to the Company leasing 2,743 net mineral acres in Roger Mills County, Oklahoma, for $4.8 million. The rights leased were from the surface to 100 feet below the base of the Virgilian (commonly referred to as the Tonkawa). The Company also leased 2,431 net mineral acres in the horizontal Mississippian play in northern Oklahoma for $1.7 million. There were no large leases of the Company’s mineral acreage in 2011.
Gains (Losses) on Derivative Contracts
Realized and unrealized gains and losses are scheduled below:
| | | | | |
Gains (Losses) on | | |
Derivative Contracts | 2012 | | 2011 |
Realized | $ | 462,033 | | $ | 2,138,685 |
Unrealized | | (388,211) | | | (1,404,386) |
Total | $ | 73,822 | | $ | 734,299 |
The decrease in gains was mainly due to the natural gas basis protection swaps being less beneficial in 2012, as the basis differentials between NYMEX and CEGT and PEPL declined significantly. As of September 30, 2012, the Company’s natural gas basis protection swaps had an expiration date of December 2012; the natural gas costless collar contracts had expiration dates of October 2012 and January 2013; the oil costless collar contracts had an expiration date of December 2012.
Lease Operating Expenses (LOE)
LOE increased $700,216 or 8% in 2012. LOE costs per Mcfe of production decreased from $.95 in 2011 to $.86 in 2012. The total LOE increase was primarily related to increased field operating costs of $487,388 in 2012 compared to 2011. Field operating costs increased mainly due to the large addition of wells through acquisition and drilling in 2012. Field operating costs were $.42 per Mcfe in 2012 compared to $.44 per Mcfe in 2011, a 5% decrease. This decrease in rate was principally the result of fewer well workovers performed in 2012.
The increase in LOE related to field operating costs was also coupled with an increase in handling fees (primarily gathering, transportation and marketing costs) on natural gas of $212,828 in 2012, as compared to 2011. On a per Mcfe basis, these fees were down $.06 due to lower natural gas prices and the addition of significant oil production, which is unencumbered by these fees. Handling fees are mainly charged as a percent of natural gas sales but can also be charged based on natural gas production volumes.
Exploration Costs
Exploration costs were $979,718 in 2012 compared to $1,025,542 in 2011, a $45,824 decrease. During 2012, leasehold impairment and expired leasehold totaled $377,942 compared to $482,491 during 2011, a $104,549 decrease. The decline was driven by lower provisions for expected lease expirations in 2012, as compared to 2011. Charges on three exploratory dry holes totaled $601,776 during 2012; whereas, in 2011 the Company incurred exploratory dry hole costs on two wells totaling $543,051.
Depreciation, Depletion and Amortization (DD&A)
DD&A increased $4,349,051 or 30% in 2012. DD&A per Mcfe was $1.80 in 2012 compared to $1.65 in 2011. DD&A increased $2,738,695 due to oil, NGL and natural gas production volumes increasing 19% in the 2012 period compared to the 2011 period. The remaining increase of $1,610,356 was caused by a $.15 increase in the DD&A rate. This rate increase is mainly due to negative price revisions reducing ultimate reserves on a significant number of wells in reserves reported at September 30, 2012, as well as higher finding cost experienced in oil and liquids-rich areas where the Company is drilling and has had new wells come on line.
Provision for Impairment
The provision for impairment decreased $901,654 in 2012, as compared to 2011. During 2012, impairment of $826,508 was recorded on twelve small fields in Oklahoma. These fields have one to a few wells and are more susceptible to impairment when a well in the field experiences downward reserve revisions, or when a newly completed well with low reserves is added to one of these fields. During the 2011 period, impairment of $1,728,162 was recorded on nine small fields in Oklahoma and Texas.
General and Administrative Costs (G&A)
G&A increased $394,193 or 7% in 2012. The increase is primarily related to increases in the following expense categories: personnel $419,166 and legal fees $118,245. These were partially offset by decreases in technical consulting, Board fees, company insurance and other expenses of $143,218 in 2012. The increase in 2012 personnel related expenses was the result of additional employees and annual increases in salaries and bonuses totaling $206,806, restricted stock expense increase of $178,441 and higher ESOP expense of $25,475. The increase in legal expenses resulted from increased acquisition activity and a quiet title defense settlement in 2012.
Provision (Benefit) for Income Taxes
The 2012 provision for income taxes of $3,274,000 was based on a pre-tax income of $10,644,996, as compared to a provision for income taxes of $3,192,000 in 2011, based on a pre-tax income of $11,685,912. The effective tax rate for 2012 was 31%, compared to an effective tax rate for 2011 of 27%. The 2012 effective tax rate increase of 4% was due to increased state income taxes of $553,926, partially offset by an excess percentage depletion benefit increase of $112,524. The 2012 state income tax increase was a result of significantly higher lease bonus income in Oklahoma, combined with lower intangible drilling cost deductions from Oklahoma taxable income. The Company’s utilization of excess percentage depletion (which is a permanent tax benefit) decreases the provision for income taxes. The benefit of excess percentage depletion is not directly related to the amount of recorded income or loss. Accordingly, in cases where the recorded income or loss is relatively small, the proportional effect of the excess percentage depletion on the effective tax rate may become significant.
LIQUIDITY AND CAPITAL RESOURCES
At September 30, 2013, the Company had positive working capital of $7,504,588, as compared to positive working capital of $3,995,103 at September 30, 2012.
Liquidity
Cash and cash equivalents were $2,867,171 as of September 30, 2013, compared to $1,984,099 at September 30, 2012, an increase of $883,072. Cash flows for the 12 months ended September 30 are summarized as follows:
| | | | | | | | |
| | | | | | | | |
Net cash provided (used) by: | | | | | | | | |
| 2013 | | 2012 | | Change |
| | | | | | | | |
Operating activities | $ | 37,402,109 | | $ | 25,371,196 | | $ | 12,030,913 |
Investing activities | | (26,364,675) | | | (38,288,960) | | | 11,924,285 |
Financing activities | | (10,154,362) | | | 11,394,864 | | | (21,549,226) |
Increase (decrease) in cash and cash equivalents | $ | 883,072 | | $ | (1,522,900) | | $ | 2,405,972 |
Operating activities:
Net cash provided by operating activities increased $12,030,913 during 2013, as compared to 2012, the result of the following:
ŸReceipts of oil, NGL and natural gas sales (net of production taxes and gathering, transportation and marketing costs) increased $11,844,281.
ŸIncreased receipts from partnership distributions of $316,418 combined with lower income tax payments of $505,466.
ŸDecreased net realized gains on derivative contracts of $448,478.
ŸIncreased cash expenditures for field related LOE of $435,800.
Investing activities:
Net cash used in investing activities decreased $11,924,285 during 2013, as compared to 2012, due to:
ŸA decrease in cash used to acquire properties of $19,360,371 ($18.8 million was used in the first quarter of 2012 to acquire producing properties, leasehold and mineral acreage in Arkansas).
ŸLower lease bonus payments received during 2013 of $1,023,368, compared to $7,265,808 during 2012, which decreased cash provided by investing activities by $6,242,440.
ŸHigher drilling and completion activity during 2013 increased capital expenditures by $1,618,479.
Financing activities:
2013 net cash used in financing activities was $10,154,362, as compared to net cash provided by financing activities in 2012 of $11,394,864, resulting in a net increase of $21,549,226 of cash used in financing activities. This change is the result of the following:
ŸThe Company financed the first quarter 2012 acquisition of producing properties and leasehold in Arkansas by utilizing its bank credit facility and cash. For fiscal 2012, cash provided by financing activities through net borrowings was $14,874,985. For fiscal 2013, cash used in financing activities
to reduce outstanding borrowings was $6,612,729. The combined effect is a decrease in cash provided by financing activities of $21,487,714.
Capital Resources
Capital expenditures to drill and complete wells increased $1,618,479 (6%) in 2013, as compared to 2012. Oil and NGL rich plays in western Oklahoma and the Texas Panhandle account for the majority of 2013 drilling activity. Other active areas include the Arkansas Fayetteville Shale (dry natural gas), southern Oklahoma Woodford Shale (oil and NGL rich), Permian Basin of West Texas (oil and NGL rich) and Bakken Shale in North Dakota (oil).
Drilling continues to be active in the following oil and NGL rich plays where the Company owns mineral and leasehold acreage:
ŸHorizontal Granite Wash and Hogshooter in western Oklahoma and the Texas Panhandle
ŸHorizontal Cleveland in western Oklahoma and the Texas Panhandle
ŸHorizontal Marmaton in western Oklahoma
ŸHorizontal Tonkawa in western Oklahoma
ŸHorizontal Anadarko Basin Woodford Shale in western Oklahoma
ŸHorizontal Ardmore Basin Woodford Shale in southern Oklahoma
In addition to the $26,765,785 of capital expenditures for drilling and completion projects in 2013, mineral acreage in the Arkansas Fayetteville Shale and the southeast Oklahoma Woodford Shale was acquired for $783,750. Management continues to evaluate opportunities to acquire additional production or acreage.
Management currently expects to incur approximately $33 million of capital expenditures for drilling and completion projects during 2014. The shift of capital outlays more toward oil and NGL rich plays and less toward plays for dry natural gas is expected to result in increased oil and NGL production volumes in 2014, with expectations that natural gas production will level off. As experienced previously, the timing of new wells coming on line may cause intermittent increases or decreases in oil, NGL and natural gas production from quarter to quarter.
Since the Company is not the operator of any of its oil and natural gas properties, it is extremely difficult for us to precisely predict levels of future participation in the drilling and completion of new wells and associated capital expenditures.
Production of oil, NGL and natural gas increased 22% on an Mcfe basis during 2013, as compared to 2012. The production increase was the result of new production coming on line which exceeded the natural production decline of existing wells. We expect 2014 production volumes to exceed that of 2013 as drilling will result in new production coming on line throughout 2014.
Panhandle’s oil sales price has averaged 93% of NYMEX oil price during 2013. Based on this correlation, and NYMEX oil futures prices, we expect the Company’s average oil sales price for 2014 to approximate $88.00 per barrel. For 2013, NGL sales prices averaged 30% of NYMEX oil price; this would correlate to an average NGL sales price for 2014 of approximately $28.00 per barrel, which is also in line with management’s expectations.
For 2013, Panhandle’s natural gas sales price averaged 94% of NYMEX natural gas price. Based on NYMEX natural gas futures prices, management expects the Company’s average natural gas sales price for 2014 to approximate $3.40 per Mcf.
With continued oil and natural gas price volatility, management continues to evaluate opportunities for product price protection through additional hedging of the Company’s future oil and natural gas production. See Note 1 to the financial statements included in Item 8 – “Financial Statements and Supplementary Data” for a complete list of the Company’s outstanding derivative contracts.
The use of the Company’s cash provided by operating activities and resultant change to cash is summarized in the table below:
| | |
| | |
| Twelve months ended |
| 9/30/2013 |
| | |
Cash provided by operating activities | $ | 37,402,109 |
Cash used for: | | |
Capital expenditures - drilling and completion of wells | | 26,765,785 |
Quarterly dividends of $.07 per share | | 2,326,995 |
Treasury stock purchases | | 1,214,638 |
Net principal payments on credit facility | | 6,612,729 |
Other investing activities | | (401,110) |
Net cash used | | 36,519,037 |
| | |
Net increase (decrease) in cash | $ | 883,072 |
Outstanding borrowings on the credit facility at September 30, 2013, were $8,262,256.
Looking forward, the Company expects to fund overhead costs, capital additions related to the drilling and completion of wells, treasury stock purchases and dividend payments primarily from cash provided by operating activities and cash on hand. As management evaluates opportunities to acquire additional assets, additional borrowings utilizing our bank credit facility could be necessary. Also, during times of oil, NGL and natural gas price decreases, or increased capital expenditures, it may be necessary to utilize the credit facility further in order to fund these expenditures. The Company has availability ($26,737,744 at September 30, 2013) under its revolving credit facility and is in compliance with its debt covenants (current ratio, debt to EBITDA and dividends as a percent of operating cash flow). While the Company believes the availability could be increased (if needed) by placing more of the Company’s properties as security under the revolving credit facility, increases are at the discretion of the bank.
Based on expected capital expenditure levels and anticipated cash provided by operating activities for 2014, the Company has sufficient liquidity to fund its ongoing operations and, combined with availability under its credit facility, to fund acquisitions.
CONTRACTUAL OBLIGATIONS AND COMMITMENTS
The Company has a credit facility with Bank of Oklahoma (BOK) consisting of a revolving loan with a limit in the amount of $80,000,000, which is subject to a semi-annual borrowing base determination. The current borrowing base is $35,000,000 and is secured by certain of the Company’s properties with a carrying value of $40,042,933 at September 30, 2013. The revolving loan matures on November 30, 2017. Borrowings under the revolving loan are due at maturity. The revolving loan bears interest at the BOK prime rate plus a range of 0.375% to 1.125%, or 30 day LIBOR plus a range of 1.875% to 2.625% annually. The election of BOK prime or LIBOR is at the Company’s discretion. The
interest rate spread from LIBOR or the prime rate increases as a larger percent of the loan value of the Company’s oil and natural gas properties is advanced.
Determinations of the borrowing base are made semi-annually, whenever BOK believes there has been a material change in the value of the Company’s oil and natural gas properties or upon reasonable request by the Company. The loan agreement contains customary covenants, which, among other things, require periodic financial and reserve reporting and limit the Company’s incurrence of indebtedness, liens, dividends and acquisitions of treasury stock and require the Company to maintain certain financial ratios. At September 30, 2013, the Company was in compliance with these covenants.
The table below summarizes the Company’s contractual obligations and commitments as of September 30, 2013:
| | | | | | | | | | | | | | | |
| | | | | | | | | | | | | | | |
| | Payments due by period |
Contractual Obligations | | | | | Less than | | | | | | | | More than |
and Commitments | | Total | | 1 Year | | 1-3 Years | | 3-5 Years | | 5 Years |
Long-term debt obligations | | $ | 8,262,256 | | $ | - | | $ | 8,262,256 | | $ | - | | $ | - |
Building lease | | $ | 323,141 | | $ | 204,089 | | $ | 119,052 | | $ | - | | $ | - |
At September 30, 2013, the Company’s derivative contracts were in a net asset position of $425,198. The ultimate settlement amounts of the derivative contracts are unknown because they are subject to continuing market risk. Please read Item 7A – “Quantitative and Qualitative Disclosures about Market Risk” and Note 1 to the financial statements included in Item 8 – “Financial Statements and Supplementary Data” for additional information regarding the derivative contracts.
As of September 30, 2013, the Company’s asset retirement obligations were $2,393,190. Asset retirement obligations represent the Company’s share of the future expenditures to plug and abandon the wells in which the Company owns a working interest when the oil, NGL and natural gas reserves are depleted. These amounts were not included in the schedule above due to the uncertainty of timing of the obligations. Please read Note 1 to the financial statements included in Item 8 – “Financial Statements and Supplementary Data” for additional information regarding the Company’s asset retirement obligations.
CRITICAL ACCOUNTING POLICIES
Preparation of financial statements in conformity with accounting principles generally accepted in the United States requires management to make estimates, judgments and assumptions that affect the reported amounts of assets, liabilities, revenues and expenses, and the disclosure of contingent assets and liabilities. However, the accounting principles used by the Company generally do not change the Company’s reported cash flows or liquidity. Existing rules must be interpreted and judgments made on how the specifics of a given rule apply to the Company.
The more significant reporting areas impacted by management’s judgments and estimates are crude oil, NGL and natural gas reserve estimation; derivative contracts; impairment of assets; oil, NGL and natural gas sales revenue accruals; refundable production taxes and provision for income tax. Management’s judgments and estimates in these areas are based on information available from both internal and external sources, including engineers, geologists, consultants and historical experience in similar matters. Actual results could differ from the estimates as additional information becomes known. The oil, NGL and natural gas sales revenue accrual is particularly subject to estimate inaccuracies due to the Company’s status as a non-operator on all of its properties. As such, production and price information obtained from well operators is substantially delayed. This causes the estimation of recent production and prices used in the oil, NGL and natural gas revenue accrual to be subject to future change.
Oil, NGL and Natural Gas Reserves
Management considers the estimation of the Company’s crude oil, NGL and natural gas reserves to be the most significant of its judgments and estimates. These estimates affect the unaudited standardized measure disclosures included in Note 11 to the financial statements in Item 8 – “Financial Statements and Supplementary Data,” as well as DD&A and impairment calculations. Changes in crude oil, NGL and natural gas reserve estimates affect the Company’s calculation of DD&A, asset retirement obligations and assessment of the need for asset impairments. On an annual basis, with a semi-annual update, the Company’s Independent Consulting Petroleum Engineer, with assistance from Company staff, prepares estimates of crude oil, NGL and natural gas reserves based on available geologic and seismic data, reservoir pressure data, core analysis reports, well logs, analogous reservoir performance history, production data and other available sources of engineering, geological and geophysical information. Between periods in which reserves would normally be calculated, the Company updates the reserve calculations utilizing prices which are updated through the current period. In accordance with the SEC rules, the reserve estimates were based on average individual product prices during the 12-month period prior to September 30 determined as an unweighted arithmetic average of the first-day-of-the-month price for each month within such period, unless prices were defined by contractual arrangements, excluding escalations based upon future conditions. Based on the Company’s 2013 DD&A, a 10% change in the DD&A rate per Mcfe would result in a corresponding $2,194,577 annual change in DD&A expense. Crude oil, NGL and natural gas prices are volatile and largely affected by worldwide production and consumption and are outside the control of management. However, projected future crude oil, NGL and natural gas pricing assumptions are used by management to prepare estimates of crude oil, NGL and natural gas reserves and future net cash flows used in asset impairment assessments and in formulating management’s overall operating decisions.
Successful Efforts Method of Accounting
The Company has elected to utilize the successful efforts method of accounting for its oil and natural gas exploration and development activities. This means exploration expenses, including geological and geophysical costs, non-producing lease impairment, rentals and exploratory dry holes, are charged against income as incurred. Costs of successful wells and related production equipment and developmental dry holes are capitalized and amortized by property using the unit-of-production method (the ratio of oil, NGL and natural gas volumes produced to total proved or proved developed reserves is used to amortize the remaining asset basis on each producing property) as oil, NGL and natural gas is produced. The Company’s exploratory wells are all on-shore and primarily located in the Mid-Continent area. Generally, expenditures on exploratory wells comprise less than 10% of the Company’s total expenditures for oil and natural gas properties. This accounting method may yield significantly different operating results than the full cost method.
Derivative Contracts
The Company has entered into oil and natural gas costless collar contracts, oil and natural gas fixed swap contracts and natural gas basis protection swaps. These instruments are intended to reduce the Company’s exposure to short-term fluctuations in the price of oil and natural gas. Collar contracts set a fixed floor price and a fixed ceiling price and provide payments to the Company if the index price falls below the floor or require payments by the Company if the index price rises above the ceiling. Fixed swap contracts set a fixed price and provide for payments to the Company if the index price is below the fixed price, or require payments by the Company if the index price is above the fixed price. Basis protection swaps are derivatives that guarantee a price differential to NYMEX for natural gas from a specified delivery point (CEGT and PEPL historically). The Company receives a payment from the counterparty if the price differential is greater than the agreed terms of the contract and pays the
counterparty if the price differential is less than the agreed terms of the contract. These contracts cover only a portion of the Company’s oil and natural gas production and provide only partial price protection against declines in oil and natural gas prices. These derivative instruments expose the Company to risk of financial loss and may limit the benefit of future increases in prices. All of the Company’s derivative contracts are with Bank of Oklahoma and are secured.
The Company is required to recognize all derivative instruments as either assets or liabilities in the balance sheet at fair value. The accounting for changes in the fair value of a derivative depends on the intended use of the derivative and resulting designation. At September 30, 2013, the Company had no derivative contracts designated as cash flow hedges, and therefore, changes in the fair value of derivatives are reflected in earnings.
Impairment of Assets
All long-lived assets, principally oil and natural gas properties, are monitored for potential impairment when circumstances indicate that the carrying value of the asset may be greater than its estimated future net cash flows. The evaluations involve significant judgment since the results are based on estimated future events, such as inflation rates; future sales prices for oil, NGL and natural gas; future production costs; estimates of future oil, NGL and natural gas reserves to be recovered and the timing thereof; economic and regulatory climates and other factors. The Company estimates future net cash flows on its oil and natural gas properties utilizing differentially adjusted forward pricing curves for oil, NGL and natural gas and a discount rate in line with the discount rate we believe is most commonly used by the market participants (10% for all periods presented). The need to test a property for impairment may result from significant declines in sales prices or unfavorable adjustments to oil, NGL and natural gas reserves. A significant reduction in oil, NGL and natural gas prices (which are reviewed quarterly) or a decline in reserve volumes (which are re-evaluated semi-annually) would likely lead to additional impairment that may be material to the Company. Any assets held for sale are reviewed for impairment when the Company approves the plan to sell. Estimates of anticipated sales prices are highly judgmental and subject to material revision in future periods. Because of the uncertainty inherent in these factors, the Company cannot predict when or if future impairment charges will be recorded.
Non-producing oil and natural gas leases are assessed for impairment on a property-by-property basis for individually significant balances and on an aggregate basis for individually insignificant balances. If the assessment indicates an impairment, a loss is recognized by providing a valuation allowance at the level at which impairment was assessed. The impairment assessment is affected by economic factors such as the results of exploration activities, commodity price outlooks, remaining lease terms and potential shifts in business strategy employed by management. In the case of individually insignificant balances, the amount of the impairment loss recognized is determined by amortizing the portion of these properties’ costs, which the Company believes will not be transferred to proved properties over the remaining lives of the leases. Impairment loss is charged to exploration costs when recognized. As of September 30, 2013, the remaining carrying cost of non-producing oil and natural gas leases was $285,752.
Oil, NGL and Natural Gas Sales Revenue Accrual
The Company does not operate its oil and natural gas properties and, therefore, receives actual oil, NGL and natural gas sales volumes and prices (in the normal course of business) over a month later than the information is available to the operators of the wells. This being the case, on wells with greater significance to the Company, the most current available production data is gathered from the appropriate operators, and oil, NGL and natural gas index prices local to each well are used to estimate the accrual of revenue on these wells. Timely obtaining production data on all other wells from the operators is not feasible; therefore, the Company utilizes past production receipts and estimated sales price information to
estimate its accrual of revenue on all other wells each quarter. The oil, NGL and natural gas sales revenue accrual can be impacted by many variables including rapid production decline rates, production curtailments by operators, the shut-in of wells with mechanical problems and rapidly changing market prices for oil, NGL and natural gas. These variables could lead to an over or under accrual of oil, NGL and natural gas sales at the end of any particular quarter. Based on past history, the Company’s estimated accrual has been materially accurate.
Income Taxes
The estimation of the amounts of income tax to be recorded by the Company involves interpretation of complex tax laws and regulations, as well as the completion of complex calculations, including the determination of the Company’s percentage depletion deduction, if any. To calculate the exact excess percentage depletion allowance, a well-by-well calculation is, and can only be, performed at the end of each fiscal year. During interim periods, an estimate is made taking into account historical data and current pricing. The Company has certain state net operating loss carry forwards (NOLs) that are recognized as tax assets when assessed as more likely than not to be utilized before their expiration dates. Criteria such as expiration dates, future excess state depletion and reversing taxable temporary differences are evaluated to determine whether the NOLs are more likely than not to be utilized before they expire. If any NOLs are determined to no longer be more likely than not to be utilized, then a valuation allowance is recognized to reduce the tax benefit of such NOLs. Although the Company’s management believes its tax accruals are adequate, differences may occur in the future depending on the resolution of pending and new tax matters.
Refundable Production Taxes Accrual
The State of Oklahoma allows for refunds of production taxes on wells that are horizontally drilled. In order to qualify as a horizontally drilled well, the well must have been completed in a manner which encounters and subsequently produces from a geological formation at an angle in excess of seventy degrees from vertical and which laterally penetrates a minimum of one hundred and fifty feet into the pay zone of the formation. An operator has 18 months after a given tax year to file the appropriate forms with the Oklahoma Tax Commission requesting the refund of production taxes. The refund is limited to 48 months from first sales or well payout, whichever comes first. Horizontal drilling in Oklahoma over the past four years has resulted in the addition of numerous wells that qualify for the Oklahoma horizontal exemption, thus increasing the Company’s oil, NGL and natural gas sales subject to the accrual.
The Company does not operate any of its oil and natural gas properties and thus must rely on oil, NGL and natural gas sales and drilling information from the operators. The Company utilizes payment remittances from operators to estimate its refundable production tax accrual at the end of each quarterly period. The refundable production tax accrual can be impacted by many variables, including subsequent revenue adjustments received from operators and an operator’s failure to file timely with the Oklahoma Tax Commission requesting refunds. These variables could lead to an over or under accrual of production taxes at the end of any particular period. Based on historical experience, the estimated accrual has been materially accurate.
During the 2010 legislative session, the Oklahoma State Legislature passed House Bill 2432, which provided for the deferral of the payment of certain gross production tax rebates by the Oklahoma Tax Commission for the 12-month production periods ending June 30, 2010, (tax year 2010) and June 30, 2011, (tax year 2011) for horizontally drilled wells. These deferred payments are being paid out over a period of three years beginning July 1, 2012. As a concession to producers for accepting the three-year deferral period, the State of Oklahoma, beginning with July 1, 2012, production, reduced the production
tax rate rather than pay rebates in future periods. As such, the latest production date in the refundable production tax accrual is June 30, 2011.
The above description of the Company’s critical accounting policies is not intended to be an all-inclusive discussion of the uncertainties considered and estimates made by management in applying generally accepted accounting principles and policies. Results may vary significantly if different policies were used or required and if new or different information becomes known to management.
ITEM 7AQUANTITATIVE AND QUALITATIVE DISCLOSURES ABOUT MARKET RISK
Market Risk
Oil, NGL and natural gas prices historically have been volatile, and this volatility is expected to continue. Uncertainty continues to exist as to the direction of oil, NGL and natural gas price trends, and there remains a wide divergence in the opinions held in the industry. Being primarily a natural gas producer, the Company is more significantly impacted by changes in natural gas prices than by changes in oil or NGL prices. Longer term natural gas prices will be determined by the supply of and demand for natural gas as well as the prices of competing fuels, such as crude oil and coal. The market price of oil, NGL and natural gas in 2014 will impact the amount of cash generated from operating activities, which will in turn impact the level of the Company’s capital expenditures and production. Excluding the impact of the Company’s 2014 natural gas derivative contracts (see below), based on the Company’s estimated natural gas volumes for 2014, the price sensitivity for each $0.10 per Mcf change in wellhead natural gas price is approximately $1,100,000 for operating revenue. Based on the Company’s estimated oil volumes for 2014, the price sensitivity in 2014 for each $1.00 per barrel change in wellhead oil is approximately $300,000 for operating revenue.
Commodity Price Risk
The Company periodically utilizes derivative contracts to reduce its exposure to unfavorable changes in natural gas and oil prices. The Company does not enter into these derivatives for speculative or trading purposes. All of our outstanding derivative contracts are with Bank of Oklahoma and are secured. These arrangements cover only a portion of the Company’s production and provide only partial price protection against declines in natural gas and oil prices. These derivative contracts may expose the Company to risk of financial loss and limit the benefit of future increases in prices. For the Company’s natural gas fixed price swaps, a change of $.10 in the NYMEX Henry Hub forward strip prices would result in a change to pre-tax operating income of approximately $49,000. For the Company’s oil fixed price swaps, a change of $1.00 in the NYMEX WTI forward strip prices would result in a change to pre-tax operating income of approximately $16,000. For the Company’s natural gas collars, a change of $.10 in the basis differential from NYMEX Henry Hub forward strip pricing would result in a change to pre-tax operating income of approximately $107,000. For the Company’s oil collars, a change of $1.00 in the basis differential from NYMEX WTI forward strip prices would result in a change to pre-tax operating income of approximately $44,000.
Financial Market Risk
Operating income could also be impacted, to a lesser extent, by changes in the market interest rates related to the Company’s credit facility. The revolving loan bears interest at the BOK prime rate plus from 0.375% to 1.125%, or 30 day LIBOR plus from 1.875% to 2.625%. At September 30, 2013, the Company had $8,262,256 outstanding under this facility. At this point, the Company does not believe that its liquidity has been materially affected by the debt market uncertainties noted in the last few years and the Company does not believe that its liquidity will be impacted in the near future.
ITEM 8FINANCIAL STATEMENTS AND SUPPLEMENTARY DATA
| |
Management’s Annual Report on Internal Control Over Financial Reporting | 43 |
| |
Report of Registered Public Accounting Firm on Internal Control Over Financial Reporting | 44 |
| |
Report of Independent Registered Public Accounting Firm | 45 |
| |
Balance Sheets As of September 30, 2013 and 2012 | 46 |
| |
Statements of Operations for the Years Ended September 30, 2013, 2012 and 2011 | 48 |
| |
Statements of Stockholders’ Equity for the Years Ended September 30, 2013, 2012 and 2011 | 49 |
| |
Statements of Cash Flows for the Years Ended September 30, 2013, 2012 and 2011 | 50 |
| |
Notes to Financial Statements | 52 |
| |
Management’s Annual Report on Internal Control Over Financial Reporting
Management of the Company is responsible for establishing and maintaining adequate internal control over financial reporting. Internal control over financial reporting is defined in Rules 13a-15(f) and 15d-15(f) under the Securities Exchange Act of 1934 (the “Exchange Act”) as a process designed by, or under the supervision of, the Company’s principal executive and principal financial officers and effected by the Company’s board of directors, management and other personnel, to provide reasonable assurance regarding the reliability of financial reporting and the preparation of financial statements for external purposes in accordance with generally accepted accounting principles, and includes those policies and procedures that:
ŸPertain to the maintenance of records that in reasonable detail accurately and fairly reflect the transactions and dispositions of the assets of the Company;
ŸProvide reasonable assurance that transactions are recorded as necessary to permit preparation of financial statements in accordance with generally accepted accounting principles, and that receipts and expenditures of the Company are being made only in accordance with authorizations of management and directors of the Company; and
ŸProvide reasonable assurance regarding prevention or timely detection of unauthorized acquisition, use or disposition of the Company’s assets that could have a material effect on the financial statements.
Because of its inherent limitations, internal control over financial reporting may not prevent or detect misstatements. Also, projections of any evaluation of effectiveness to future periods are subject to the risk that controls may become inadequate because of changes in conditions, or that the degree of compliance with the policies or procedures may deteriorate. Internal control over financial reporting cannot provide absolute assurance of achieving financial reporting objectives because of its inherent limitations. Internal control over financial reporting is a process that involves human diligence and compliance and is subject to lapses in judgment and breakdowns resulting from human failures. Internal control over financial reporting also can be circumvented by collusion or improper management override. Because of such limitations, there is a risk that material misstatements may not be prevented or detected on a timely basis by internal control over financial reporting. However, these inherent limitations are known features of the financial reporting process. Therefore, it is possible to design into the process safeguards to reduce, though not eliminate, this risk.
The Company’s management assessed the effectiveness of the Company’s internal control over financial reporting as of September 30, 2013. In making this assessment, the Company’s management used the criteria set forth in Internal Control – Integrated Framework issued by the Committee of Sponsoring Organizations of the Treadway Commission (COSO). Based on our assessment, management has concluded that, as of September 30, 2013, the Company’s internal control over financial reporting was effective based on those criteria.
Our independent registered public accounting firm has issued an attestation report on our internal control over financial reporting. This report appears on the following page.
Report of Independent Registered Public Accounting Firm
on Internal Control Over Financial Reporting
The Board of Directors and Stockholders of
Panhandle Oil and Gas Inc.
We have audited Panhandle Oil and Gas Inc.’s internal control over financial reporting as of September 30, 2013, based on criteria established in Internal Control—Integrated Framework issued by the Committee of Sponsoring Organizations of the Treadway Commission (1992 framework) (the COSO criteria). Panhandle Oil and Gas Inc.’s management is responsible for maintaining effective internal control over financial reporting, and for its assessment of the effectiveness of internal control over financial reporting included in the accompanying Management’s Annual Report on Internal Control Over Financial Reporting. Our responsibility is to express an opinion on the Company’s internal control over financial reporting based on our audit.
We conducted our audit in accordance with the standards of the Public Company Accounting Oversight Board (United States). Those standards require that we plan and perform the audit to obtain reasonable assurance about whether effective internal control over financial reporting was maintained in all material respects. Our audit included obtaining an understanding of internal control over financial reporting, assessing the risk that a material weakness exists, testing and evaluating the design and operating effectiveness of internal control based on the assessed risk, and performing such other procedures as we considered necessary in the circumstances. We believe that our audit provides a reasonable basis for our opinion.
A company’s internal control over financial reporting is a process designed to provide reasonable assurance regarding the reliability of financial reporting and the preparation of financial statements for external purposes in accordance with generally accepted accounting principles. A company’s internal control over financial reporting includes those policies and procedures that (1) pertain to the maintenance of records that, in reasonable detail, accurately and fairly reflect the transactions and dispositions of the assets of the company; (2) provide reasonable assurance that transactions are recorded as necessary to permit preparation of financial statements in accordance with generally accepted accounting principles, and that receipts and expenditures of the company are being made only in accordance with authorizations of management and directors of the company; and (3) provide reasonable assurance regarding prevention or timely detection of unauthorized acquisition, use, or disposition of the company’s assets that could have a material effect on the financial statements.
Because of its inherent limitations, internal control over financial reporting may not prevent or detect misstatements. Also, projections of any evaluation of effectiveness to future periods are subject to the risk that controls may become inadequate because of changes in conditions, or that the degree of compliance with the policies or procedures may deteriorate.
In our opinion, Panhandle Oil and Gas Inc. maintained, in all material respects, effective internal control over financial reporting as of September 30, 2013, based on the COSO criteria.
We also have audited, in accordance with the standards of the Public Company Accounting Oversight Board (United States), the balance sheets of Panhandle Oil and Gas Inc. as of September 30, 2013 and 2012, and the related statements of operations, stockholders’ equity, and cash flows for each of the three years in the period ended September 30, 2013 and our report dated December 11, 2013 expressed an unqualified opinion thereon.
Oklahoma City, Oklahoma
December 11, 2013
Report of Independent Registered Public Accounting Firm
The Board of Directors and Stockholders of
Panhandle Oil and Gas Inc.
We have audited the accompanying balance sheets of Panhandle Oil and Gas Inc. (the Company) as of September 30, 2013 and 2012, and the related statements of operations, stockholders' equity, and cash flows for each of the three years in the period ended September 30, 2013. These financial statements are the responsibility of the Company’s management. Our responsibility is to express an opinion on these financial statements based on our audits.
We conducted our audits in accordance with the standards of the Public Company Accounting Oversight Board (United States). Those standards require that we plan and perform the audit to obtain reasonable assurance about whether the financial statements are free of material misstatement. An audit includes examining, on a test basis, evidence supporting the amounts and disclosures in the financial statements. An audit also includes assessing the accounting principles used and significant estimates made by management, as well as evaluating the overall financial statement presentation. We believe that our audits provide a reasonable basis for our opinion.
In our opinion, the financial statements referred to above present fairly, in all material respects, the financial position of Panhandle Oil and Gas Inc. at September 30, 2013 and 2012, and the results of its operations and its cash flows for each of the three years in the period ended September 30, 2013, in conformity with U.S. generally accepted accounting principles.
We also have audited, in accordance with the standards of the Public Company Accounting Oversight Board (United States), Panhandle Oil and Gas Inc.’s internal control over financial reporting as of September 30, 2013, based on criteria established in Internal Control—Integrated Framework issued by the Committee of Sponsoring Organizations of the Treadway Commission (1992 framework) and our report dated December 11, 2013, expressed an unqualified opinion thereon.
Oklahoma City, Oklahoma
December 11, 2013
Panhandle Oil and Gas Inc.
Balance Sheets
| | | | | |
| | | | | |
| September 30, |
| 2013 | | 2012 |
Assets | | | | | |
Current Assets: | | | | | |
Cash and cash equivalents | $ | 2,867,171 | | $ | 1,984,099 |
Oil, NGL and natural gas sales receivables | | 13,720,761 | | | 8,349,865 |
Refundable income taxes | | - | | | 325,715 |
Refundable production taxes | | 662,051 | | | 585,454 |
Deferred income taxes | | - | | | 121,900 |
Derivative contracts | | 425,198 | | | - |
Other | | 129,998 | | | 255,812 |
Total current assets | | 17,805,179 | | | 11,622,845 |
| | | | | |
Properties and equipment at cost, based on successful | | | | | |
efforts accounting: | | | | | |
Producing oil and natural gas properties | | 304,889,145 | | | 275,997,569 |
Non-producing oil and natural gas properties | | 8,932,905 | | | 10,150,561 |
Furniture and fixtures | | 737,368 | | | 668,004 |
| | 314,559,418 | | | 286,816,134 |
Less accumulated depreciation, depletion and | | | | | |
amortization | | (186,641,291) | | | (165,199,079) |
Net properties and equipment | | 127,918,127 | | | 121,617,055 |
| | | | | |
Investments | | 1,574,642 | | | 1,034,870 |
| | | | | |
Refundable production taxes | | 540,482 | | | 911,960 |
Total assets | $ | 147,838,430 | | $ | 135,186,730 |
(Continued on next page)
See accompanying notes.
Panhandle Oil and Gas Inc.
Balance Sheets
| | | | | |
| | | | | |
| September 30, |
| 2013 | | 2012 |
Liabilities and Stockholders' Equity | | | | | |
Current Liabilities: | | | | | |
Accounts payable | $ | 8,409,634 | | $ | 6,447,692 |
Derivative contracts | | - | | | 172,271 |
Deferred income taxes | | 127,100 | | | - |
Income taxes payable | | 751,992 | | | - |
Accrued liabilities and other | | 1,011,865 | | | 1,007,779 |
Total current liabilities | | 10,300,591 | | | 7,627,742 |
| | | | | |
Long-term debt | | 8,262,256 | | | 14,874,985 |
| | | | | |
Deferred income taxes | | 31,226,907 | | | 26,708,907 |
| | | | | |
Asset retirement obligations | | 2,393,190 | | | 2,122,950 |
| | | | | |
Stockholders' equity: | | | | | |
Class A voting common stock, $.0166 par value; | | | | | |
24,000,000 shares authorized, 8,431,502 issued at | | | | | |
September 30, 2013 and 2012 | | 140,524 | | | 140,524 |
Capital in excess of par value | | 2,587,838 | | | 2,020,229 |
Deferred directors' compensation | | 2,756,526 | | | 2,676,160 |
Retained earnings | | 96,454,449 | | | 84,821,395 |
| | 101,939,337 | | | 89,658,308 |
| | | | | |
Treasury stock, at cost; 200,248 shares at | | | | | |
September 30, 2013, and 181,310 shares at | | | | | |
September 30, 2012 | | (6,283,851) | | | (5,806,162) |
Total stockholders' equity | | 95,655,486 | | | 83,852,146 |
| | | | | |
Total liabilities and stockholders' equity | $ | 147,838,430 | | $ | 135,186,730 |
See accompanying notes.
Panhandle Oil and Gas Inc.
Statements of Operations
| | | | | | | | |
| | | | | | | | |
| Year ended September 30, |
| 2013 | | 2012 | | 2011 |
Revenues: | | | | | | | | |
Oil, NGL and natural gas sales | $ | 60,605,878 | | $ | 40,818,434 | | $ | 43,469,130 |
Lease bonuses and rentals | | 938,846 | | | 7,152,991 | | | 352,757 |
Gains (losses) on derivative contracts | | 611,024 | | | 73,822 | | | 734,299 |
Income from partnerships | | 733,372 | | | 487,070 | | | 420,465 |
| | 62,889,120 | | | 48,532,317 | | | 44,976,651 |
Costs and expenses: | | | | | | | | |
Lease operating expenses | | 11,861,403 | | | 9,141,970 | | | 8,441,754 |
Production taxes | | 1,834,840 | | | 1,449,537 | | | 1,456,755 |
Exploration costs | | 9,795 | | | 979,718 | | | 1,025,542 |
Depreciation, depletion and amortization | | 21,945,768 | | | 19,061,239 | | | 14,712,188 |
Provision for impairment | | 530,670 | | | 826,508 | | | 1,728,162 |
Loss (gain) on asset sales, interest and other | | (785,401) | | | 39,493 | | | (68,325) |
General and administrative | | 6,801,996 | | | 6,388,856 | | | 5,994,663 |
| | 42,199,071 | | | 37,887,321 | | | 33,290,739 |
Income (loss) before provision (benefit) | | | | | | | | |
for income taxes | | 20,690,049 | | | 10,644,996 | | | 11,685,912 |
Provision (benefit) for income taxes | | 6,730,000 | | | 3,274,000 | | | 3,192,000 |
| | | | | | | | |
Net income (loss) | $ | 13,960,049 | | $ | 7,370,996 | | $ | 8,493,912 |
| | | | | | | | |
Basic and diluted earnings per common share: | | | | | | | | |
Net income (loss) | $ | 1.67 | | $ | 0.88 | | $ | 1.01 |
See accompanying notes.
