| First Quarter 2007 Earnings Conference Call 19 Exhibit 99.3 (Furnished herewith) |

| Safe Harbor Statement & Disclosures The earnings call and accompanying material include forward-looking comments and information concerning the company’s projections, plans and objectives for the future, including estimates and assumptions with respect to economic, political, technological, weather, market acceptance and other factors that impact our businesses and customers. They also may include financial measures that are not in conformance with GAAP. Words such as “forecast,” “projection,” “outlook,” “expected,” “estimated,” “will,” “plan,” “anticipate,” “intend,” or other similar words or phrases often identify forward-looking statements. Actual results may differ materially from those projected in these forward-looking statements based on a number of factors and uncertainties. Additional information concerning factors that could cause actual results to differ materially is contained in the company’s most recent Form 8-K and periodic report filed with the Securities and Exchange Commission, and is incorporated by reference herein. Investors should refer to and consider the incorporated information on risks and uncertainties in addition to the information presented here. Investors should consider non-GAAP financial measures in addition to, and not as a substitute for, financial measures prepared in accordance with GAAP. The company, except as required by law, undertakes no obligation to update or revise its forward-looking statements whether as a result of new developments or otherwise. 20 |
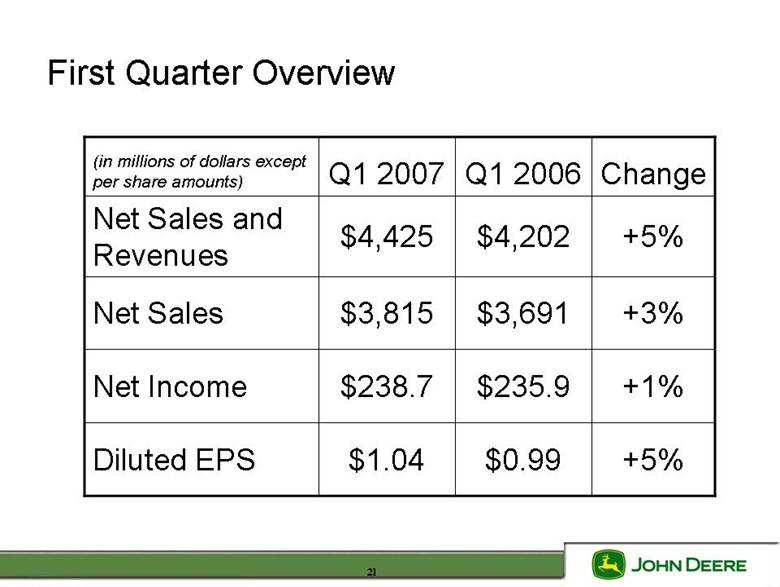
| First Quarter Overview +1% $235.9 $238.7 Net Income +5% $0.99 $1.04 Diluted EPS +3% $3,691 $3,815 Net Sales +5% $4,202 $4,425 Net Sales and Revenues Change Q1 2006 Q1 2007 (in millions of dollars except per share amounts) 21 |
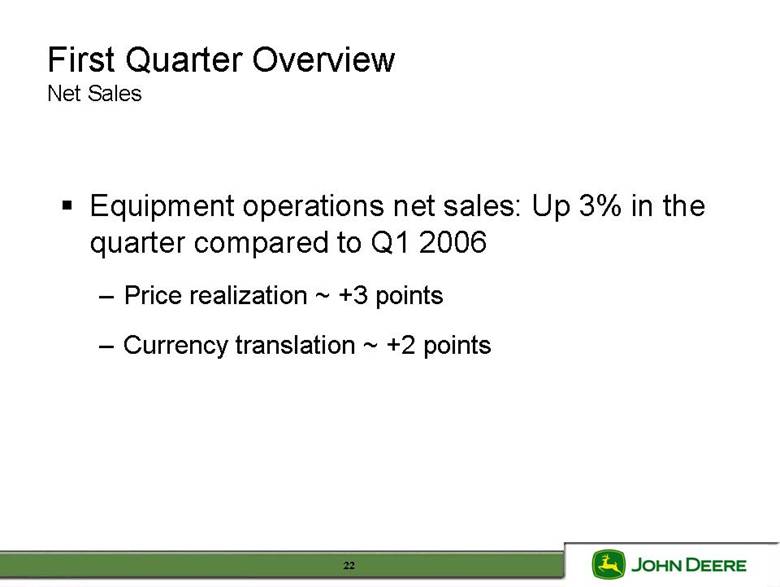
| Equipment operations net sales: Up 3% in the quarter compared to Q1 2006 Price realization ~ +3 points Currency translation ~ +2 points First Quarter Overview Net Sales 22 |
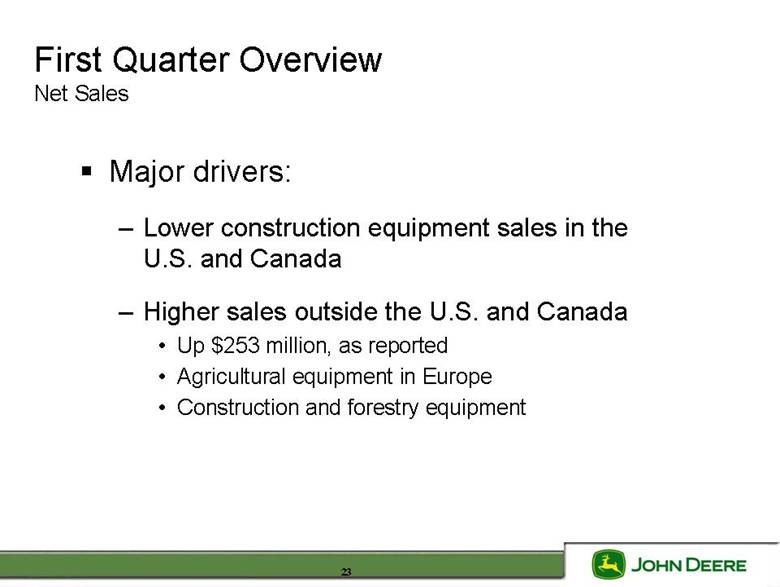
| Major drivers: Lower construction equipment sales in the U.S. and Canada Higher sales outside the U.S. and Canada Up $253 million, as reported Agricultural equipment in Europe Construction and forestry equipment First Quarter Overview Net Sales 23 |
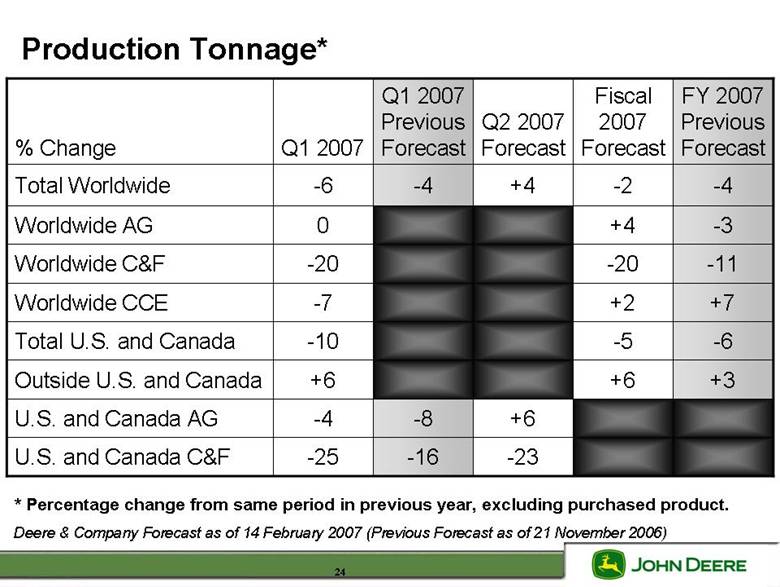
| Production Tonnage* Deere & Company Forecast as of 14 February 2007 (Previous Forecast as of 21 November 2006) -23 -16 -25 U.S. and Canada C&F +6 -8 -4 U.S. and Canada AG +3 +6 +6 Outside U.S. and Canada -6 -5 -10 Total U.S. and Canada +7 +2 -7 Worldwide CCE -11 -20 -20 Worldwide C&F -3 +4 0 Worldwide AG -4 -2 +4 -4 -6 Total Worldwide FY 2007 Previous Forecast Fiscal 2007 Forecast Q2 2007 Forecast Q1 2007 Previous Forecast Q1 2007 % Change * Percentage change from same period in previous year, excluding purchased product. 24 |
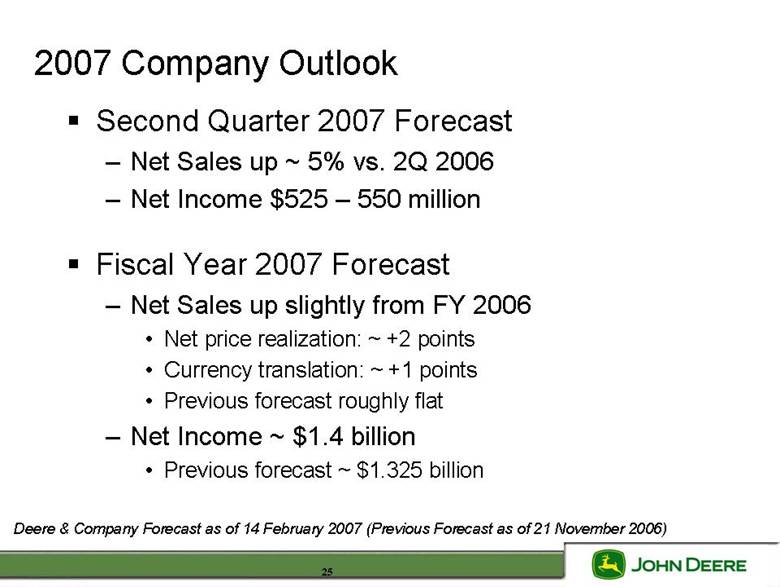
| 2007 Company Outlook Second Quarter 2007 Forecast Net Sales up ~ 5% vs. 2Q 2006 Net Income $525 – 550 million Fiscal Year 2007 Forecast Net Sales up slightly from FY 2006 Net price realization: ~ +2 points Currency translation: ~ +1 points Previous forecast roughly flat Net Income ~ $1.4 billion Previous forecast ~ $1.325 billion Deere & Company Forecast as of 14 February 2007 (Previous Forecast as of 21 November 2006) 25 |
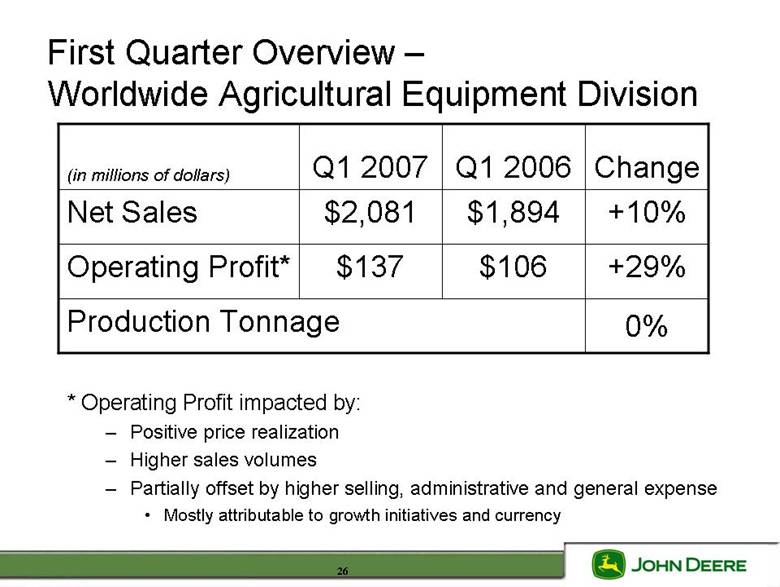
| First Quarter Overview – Worldwide Agricultural Equipment Division +29% $106 $137 Operating Profit* 0% Production Tonnage +10% $1,894 $2,081 Net Sales Change Q1 2006 Q1 2007 (in millions of dollars) * Operating Profit impacted by: Positive price realization Higher sales volumes Partially offset by higher selling, administrative and general expense Mostly attributable to growth initiatives and currency 26 |
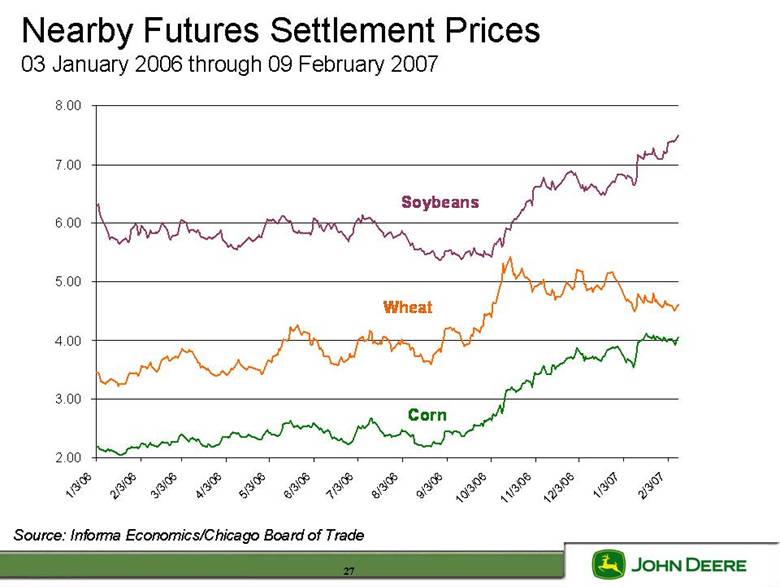
| Nearby Futures Settlement Prices 03 January 2006 through 09 February 2007 Source: Informa Economics/Chicago Board of Trade Corn Soybeans Wheat 2.00 3.00 4.00 5.00 6.00 7.00 8.00 1/3/06 2/3/06 3/3/06 4/3/06 5/3/06 6/3/06 7/3/06 8/3/06 9/3/06 10/3/06 11/3/06 12/3/06 1/3/07 2/3/07 27 |
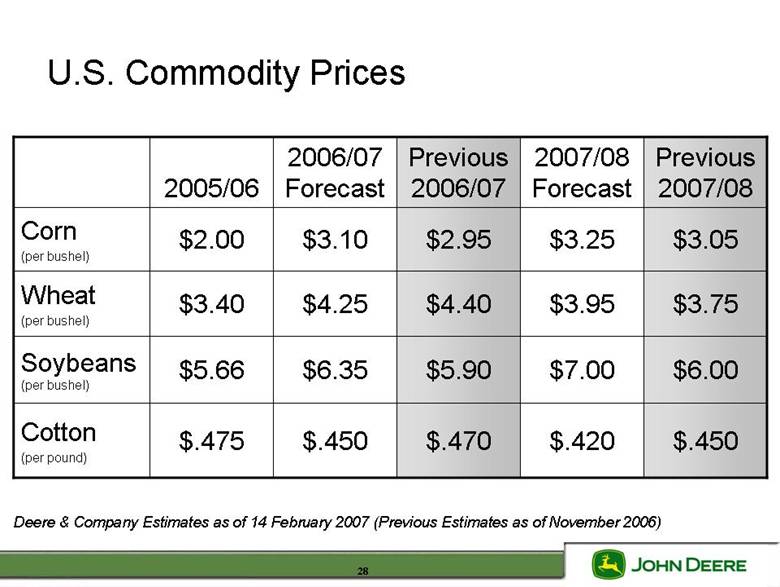
| U.S. Commodity Prices $.470 $5.90 $4.40 $2.95 Previous 2006/07 $.420 $7.00 $3.95 $3.25 2007/08 Forecast $.450 $6.00 $3.75 $3.05 Previous 2007/08 $.450 $6.35 $4.25 $3.10 2006/07 Forecast $.475 Cotton (per pound) $5.66 Soybeans (per bushel) $3.40 Wheat (per bushel) $2.00 Corn (per bushel) 2005/06 Deere & Company Estimates as of 14 February 2007 (Previous Estimates as of November 2006) 28 |
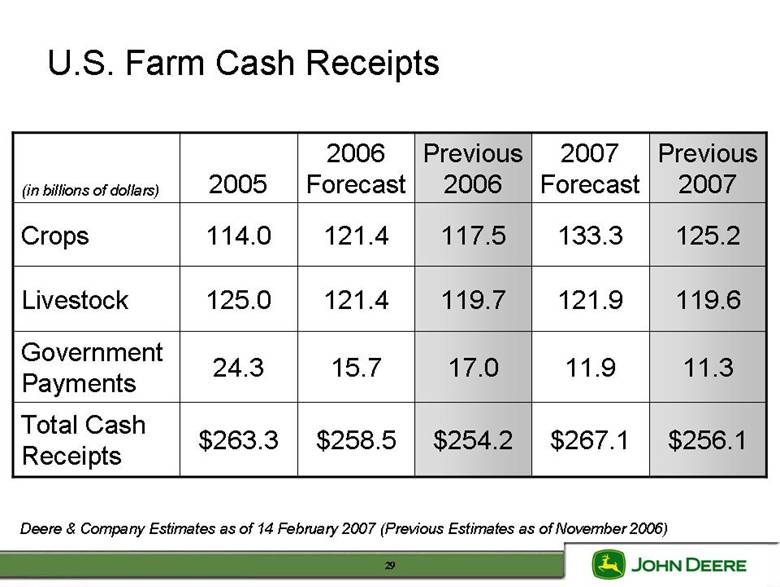
| U.S. Farm Cash Receipts $267.1 11.9 121.9 133.3 2007 Forecast $256.1 11.3 119.6 125.2 Previous 2007 $254.2 17.0 119.7 117.5 Previous 2006 $258.5 $263.3 Total Cash Receipts 15.7 24.3 Government Payments 121.4 125.0 Livestock 121.4 114.0 Crops 2006 Forecast 2005 (in billions of dollars) Deere & Company Estimates as of 14 February 2007 (Previous Estimates as of November 2006) 29 |
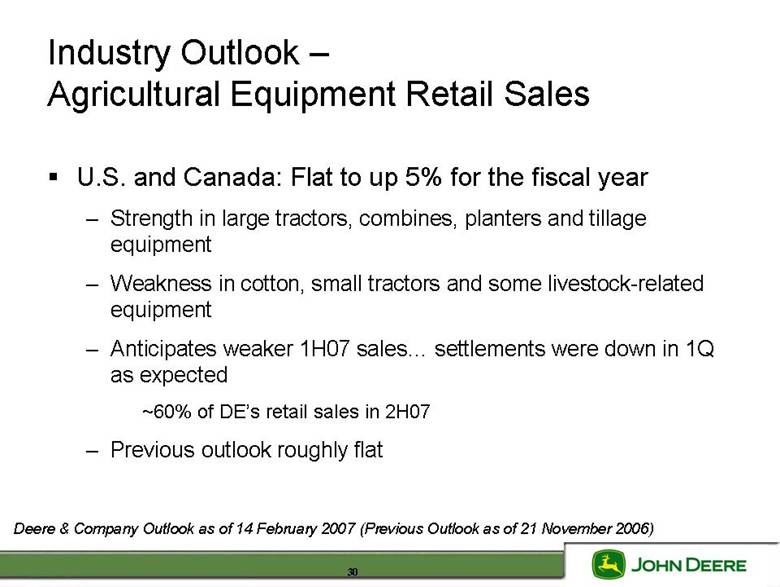
| Industry Outlook – Agricultural Equipment Retail Sales U.S. and Canada: Flat to up 5% for the fiscal year Strength in large tractors, combines, planters and tillage equipment Weakness in cotton, small tractors and some livestock-related equipment Anticipates weaker 1H07 sales settlements were down in 1Q as expected ~60% of DE’s retail sales in 2H07 Previous outlook roughly flat Deere & Company Outlook as of 14 February 2007 (Previous Outlook as of 21 November 2006) 30 |
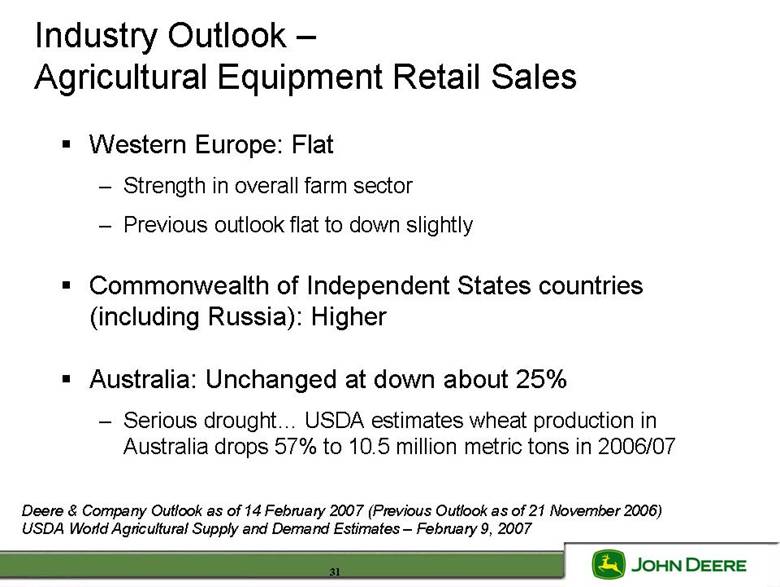
| Industry Outlook – Agricultural Equipment Retail Sales Western Europe: Flat Strength in overall farm sector Previous outlook flat to down slightly Commonwealth of Independent States countries (including Russia): Higher Australia: Unchanged at down about 25% Serious drought USDA estimates wheat production in Australia drops 57% to 10.5 million metric tons in 2006/07 Deere & Company Outlook as of 14 February 2007 (Previous Outlook as of 21 November 2006) USDA World Agricultural Supply and Demand Estimates – February 9, 2007 31 |
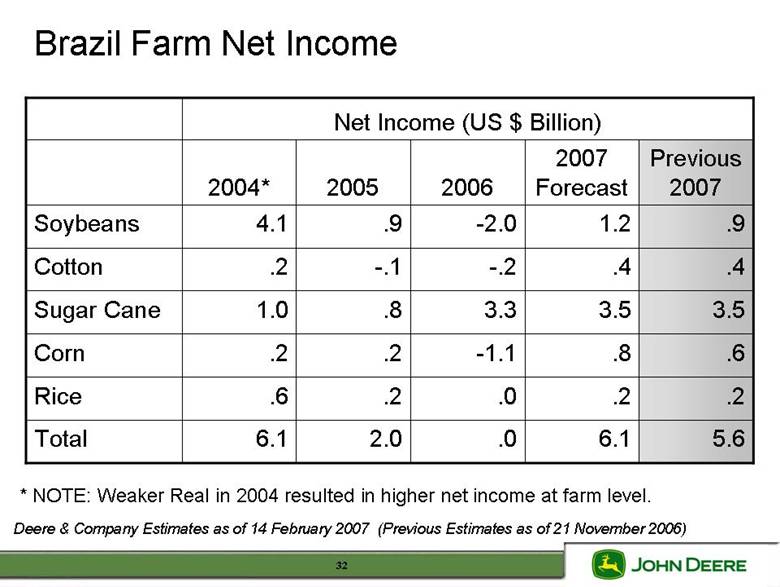
| Brazil Farm Net Income 6.1 .6 .2 1.0 .2 4.1 2004* 5.6 6.1 .0 2.0 Total .2 .2 .8 -.1 .9 2005 Net Income (US $ Billion) .2 .2 .0 Rice .6 .8 -1.1 Corn 3.5 3.5 3.3 Sugar Cane .4 .4 -.2 Cotton .9 1.2 -2.0 Soybeans Previous 2007 2007 Forecast 2006 Deere & Company Estimates as of 14 February 2007 (Previous Estimates as of 21 November 2006) * NOTE: Weaker Real in 2004 resulted in higher net income at farm level. 32 |
| Industry Outlook – Agricultural Equipment Retail Sales South America: Flat to up 5% Brazilian market showing signs of recovery Previous outlook down ~10% Deere & Company Outlook as of 14 February 2007 (Previous Outlook as of 21 November 2006) 33 |
| Deere & Company Outlook - Worldwide Agricultural Equipment Fiscal Year 2007 Forecast Net sales projected to be up ~8% Currency translation ~ +2 points Production tonnage projected up ~4% Deere & Company Forecast as of 14 February 2007 (Previous Forecast as of 21 November 2006) 34 |
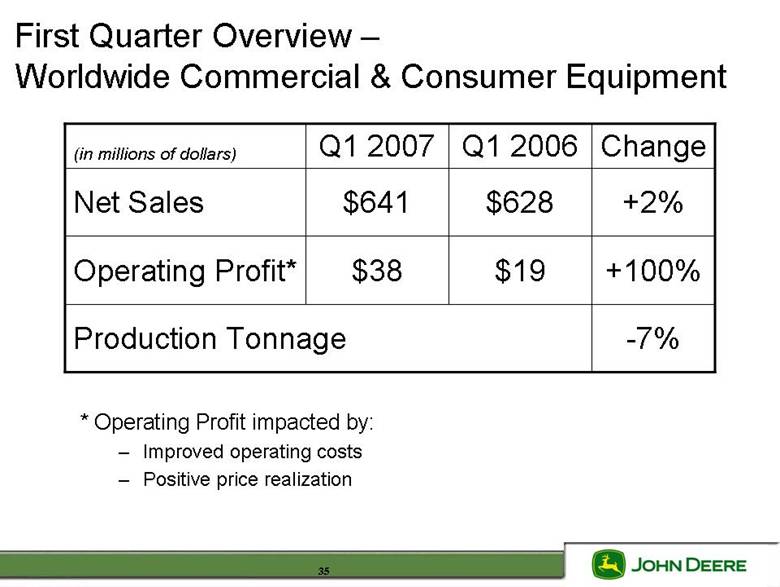
| First Quarter Overview – Worldwide Commercial & Consumer Equipment +100% $19 $38 Operating Profit* -7% Production Tonnage +2% $628 $641 Net Sales Change Q1 2006 Q1 2007 (in millions of dollars) * Operating Profit impacted by: Improved operating costs Positive price realization 35 |
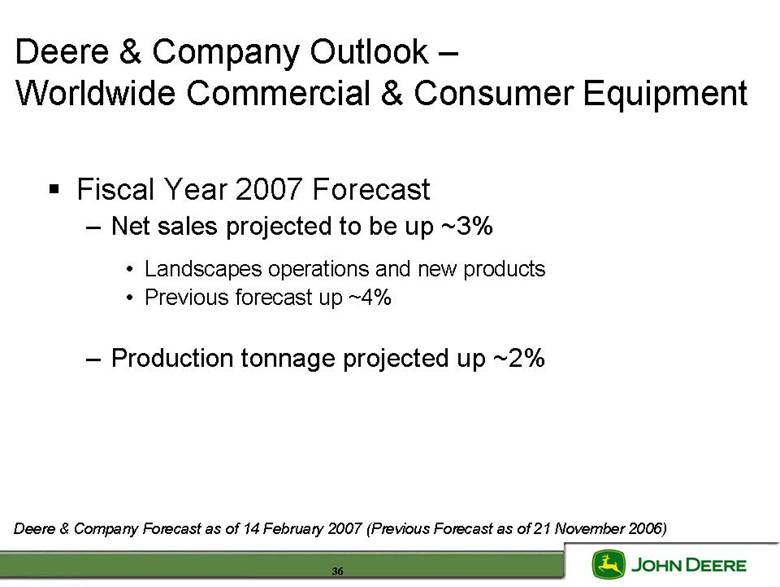
| Deere & Company Outlook – Worldwide Commercial & Consumer Equipment Fiscal Year 2007 Forecast Net sales projected to be up ~3% Landscapes operations and new products Previous forecast up ~4% Production tonnage projected up ~2% Deere & Company Forecast as of 14 February 2007 (Previous Forecast as of 21 November 2006) 36 |
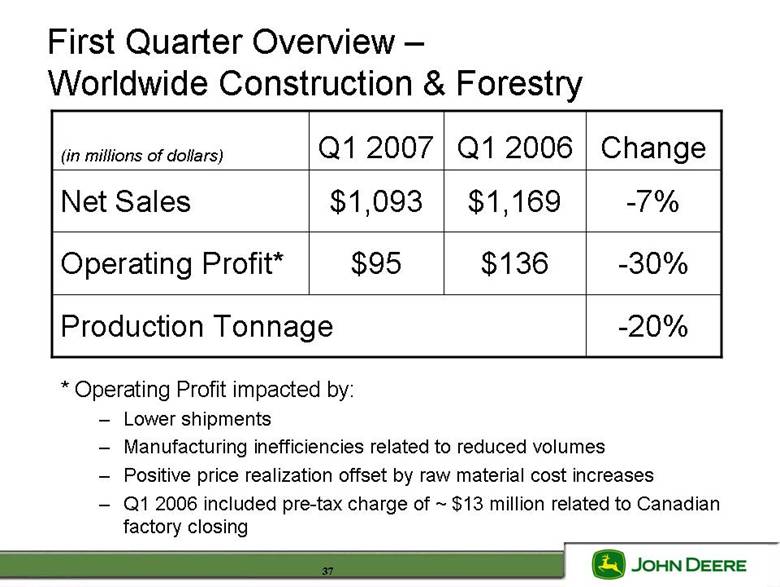
| First Quarter Overview – Worldwide Construction & Forestry -30% $136 $95 Operating Profit* -20% Production Tonnage -7% $1,169 $1,093 Net Sales Change Q1 2006 Q1 2007 (in millions of dollars) * Operating Profit impacted by: Lower shipments Manufacturing inefficiencies related to reduced volumes Positive price realization offset by raw material cost increases Q1 2006 included pre-tax charge of ~ $13 million related to Canadian factory closing 37 |
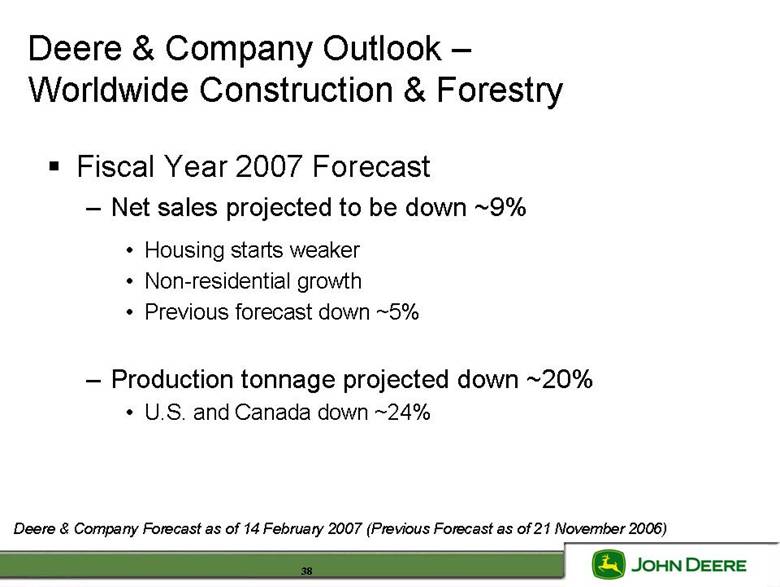
| Deere & Company Outlook – Worldwide Construction & Forestry Fiscal Year 2007 Forecast Net sales projected to be down ~9% Housing starts weaker Non-residential growth Previous forecast down ~5% Production tonnage projected down ~20% U.S. and Canada down ~24% Deere & Company Forecast as of 14 February 2007 (Previous Forecast as of 21 November 2006) 38 |
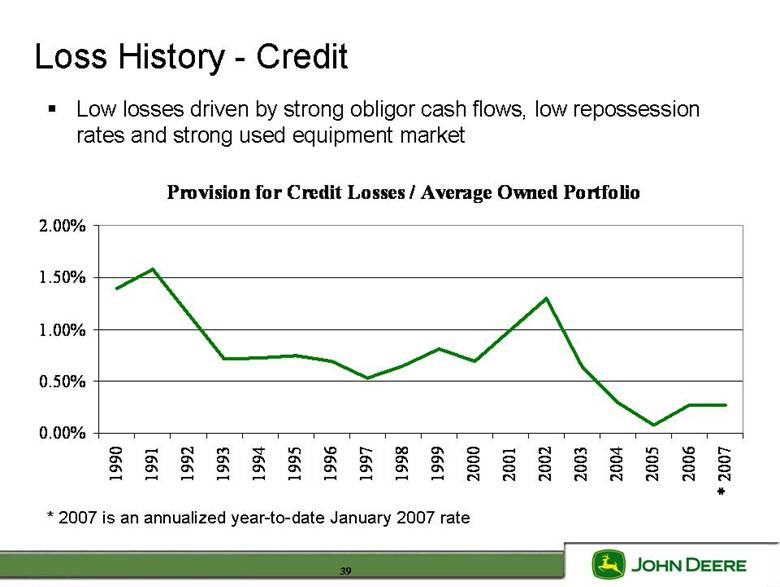
| Loss History - Credit Low losses driven by strong obligor cash flows, low repossession rates and strong used equipment market * 2007 is an annualized year-to-date January 2007 rate Provision for Credit Losses / Average Owned Portfolio 0.00% 0.50% 1.00% 1.50% 2.00% 1990 1991 1992 1993 1994 1995 1996 1997 1998 1999 2000 2001 2002 2003 2004 2005 2006 * 2007 39 |
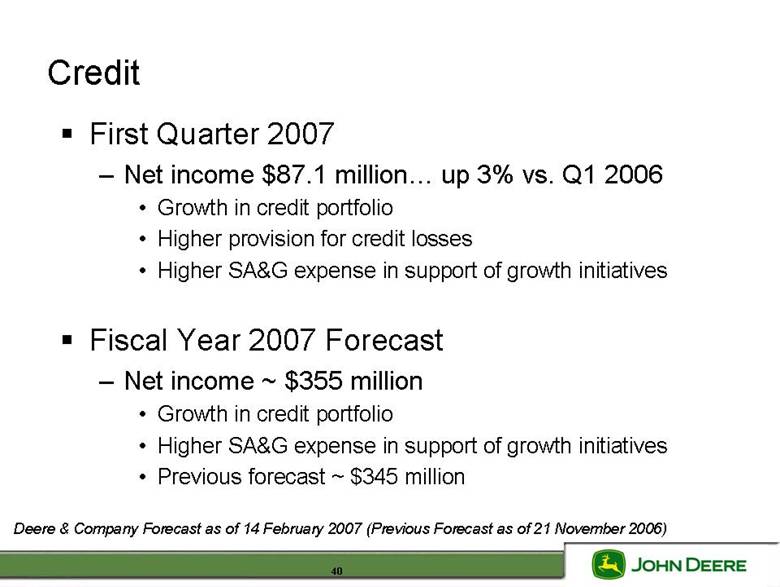
| Credit First Quarter 2007 Net income $87.1 million . . . up 3% vs. Q1 2006 Growth in credit portfolio Higher provision for credit losses Higher SA&G expense in support of growth initiatives Fiscal Year 2007 Forecast Net income ~ $355 million Growth in credit portfolio Higher SA&G expense in support of growth initiatives Previous forecast ~ $345 million Deere & Company Forecast as of 14 February 2007 (Previous Forecast as of 21 November 2006) 40 |
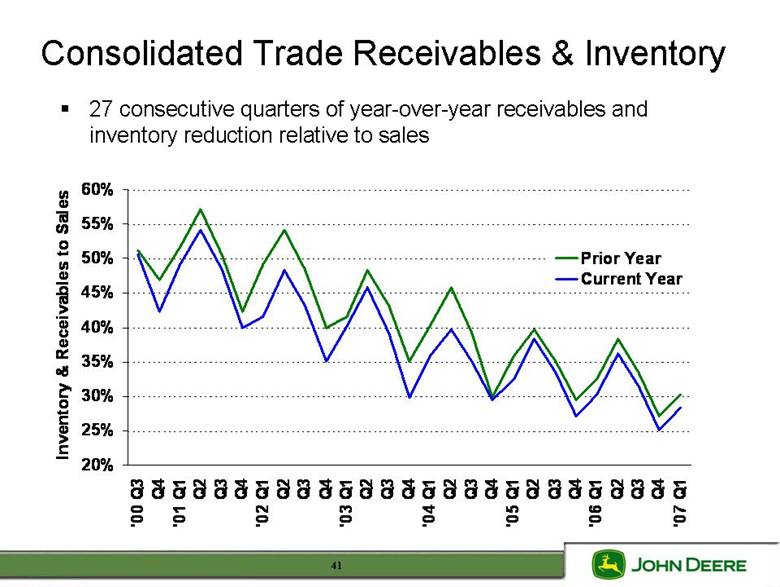
| 27 consecutive quarters of year-over-year receivables and inventory reduction relative to sales Consolidated Trade Receivables & Inventory 20% 25% 30% 35% 40% 45% 50% 55% 60% '00 Q3 Q4 '01 Q1 Q2 Q3 Q4 '02 Q1 Q2 Q3 Q4 '03 Q1 Q2 Q3 Q4 '04 Q1 Q2 Q3 Q4 '05 Q1 Q2 Q3 Q4 '06 Q1 Q2 Q3 Q4 '07 Q1 Inventory & Receivables to Sales Prior Year Current Year 41 |
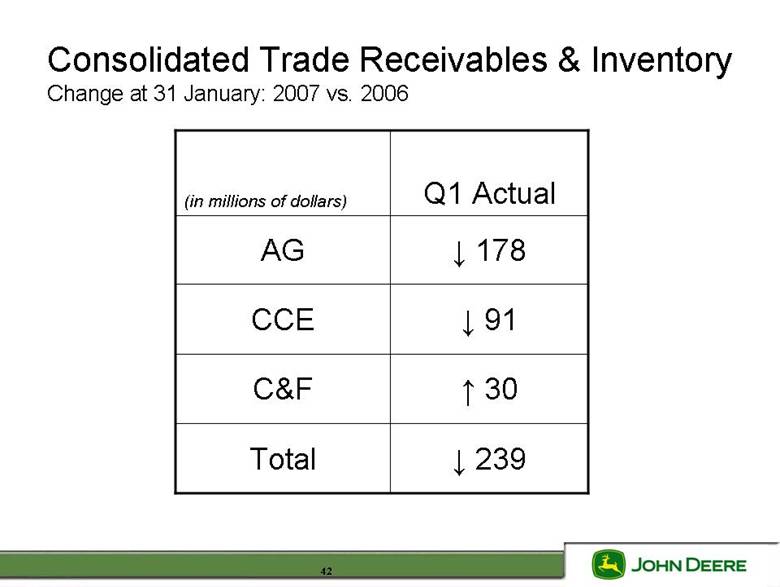
| Consolidated Trade Receivables & Inventory Change at 31 January: 2007 vs. 2006 Total C&F CCE AG (in millions of dollars) down 239 up 30 down 91 down 178 Q1 Actual 42 |
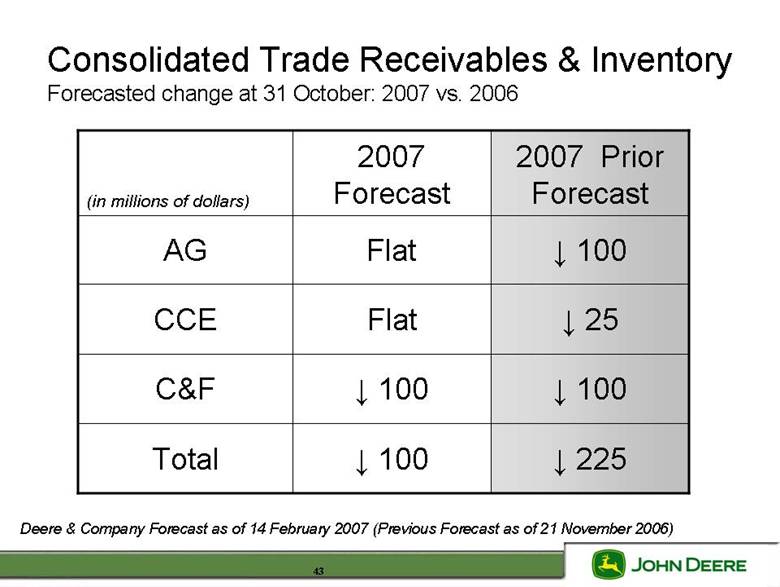
| Consolidated Trade Receivables & Inventory Forecasted change at 31 October: 2007 vs. 2006 Total C&F CCE AG (in millions of dollars) down 225 down 100 down 100 down 100 down 25 Flat down 100 Flat 2007 Prior Forecast 2007 Forecast Deere & Company Forecast as of 14 February 2007 (Previous Forecast as of 21 November 2006) 43 |
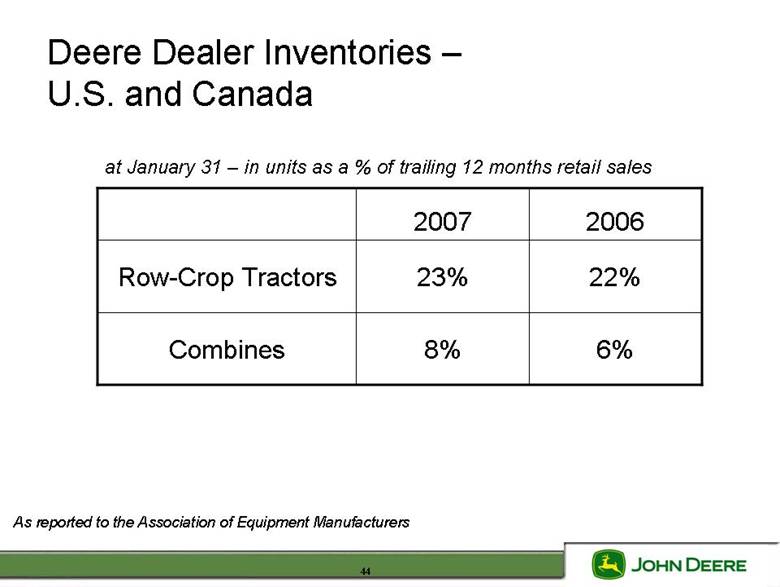
| Deere Dealer Inventories – U.S. and Canada 2006 2007 6% 8% Combines 23% 22% Row-Crop Tractors As reported to the Association of Equipment Manufacturers at January 31 – in units as a % of trailing 12 months retail sales 44 |
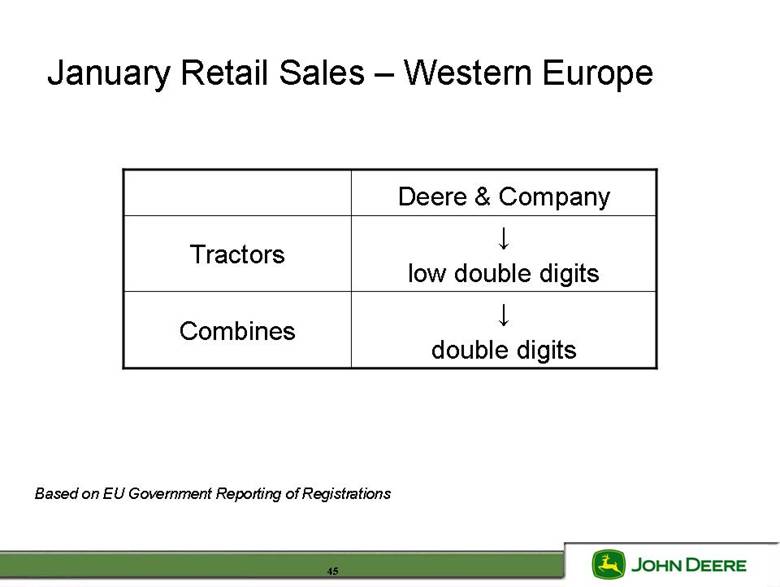
| January Retail Sales – Western Europe down double digits down low double digits Deere & Company Combines Tractors Based on EU Government Reporting of Registrations 45 |
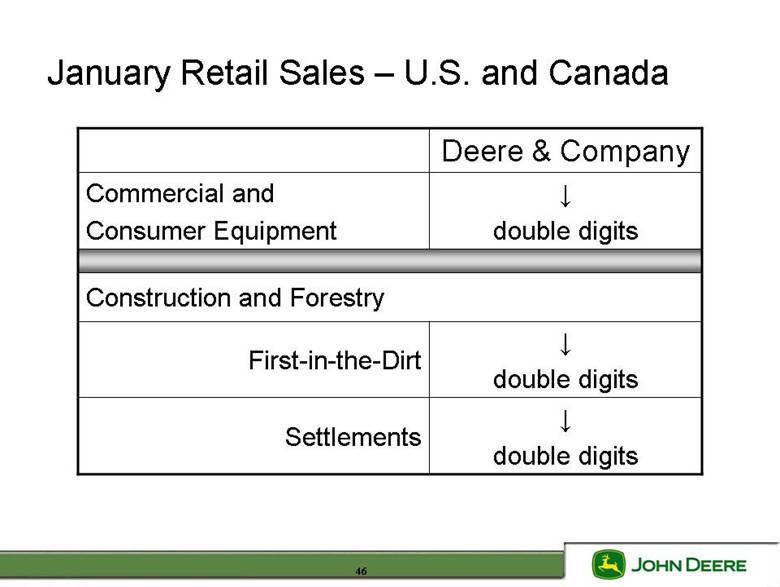
| January Retail Sales – U.S. and Canada down double digits First-in-the-Dirt down double digits Settlements Construction and Forestry down double digits Commercial and Consumer Equipment Deere & Company 46 |
| Shares Outstanding First Quarter 2007 Period ending shares outstanding: 227 million Average diluted shares outstanding for the quarter: 230 million 47 |
| Raw Material and Freight Equipment Operations First Quarter 2007 Up ~ $20 million vs. Q1 2006 Fiscal Year 2007 Forecast Up $175 - 225 million By Division Agricultural Equipment: ~ $75 million Commercial & Consumer Equipment: ~ $50 million Construction & Forestry: ~ $75 million Deere & Company Forecast as of 14 February 2007 48 |
| Research & Development Expense Equipment Operations First Quarter 2007 Up ~ 10% vs. Q1 2006 Fiscal Year 2007 Forecast Up ~ 11% Deere & Company Forecast as of 14 February 2007 49 |
| Selling, Administrative & General Expenses Equipment Operations First Quarter 2007 Up ~ 15% vs. Q1 2006 Includes ~ 6 points related to global growth initiatives and currency translation Fiscal Year 2007 Forecast anticipates Up ~ 8% vs. FY2006 Includes ~ 5 points related to global growth initiatives and currency translation Deere & Company Forecast as of 14 February 2007 50 |
| Tax Rate Equipment Operations First Quarter 2007 Effective tax rate of 35.5% Fiscal Year 2007 Forecast Assumes a tax rate of 34 – 35% Deere & Company Forecast as of 14 February 2007 51 |

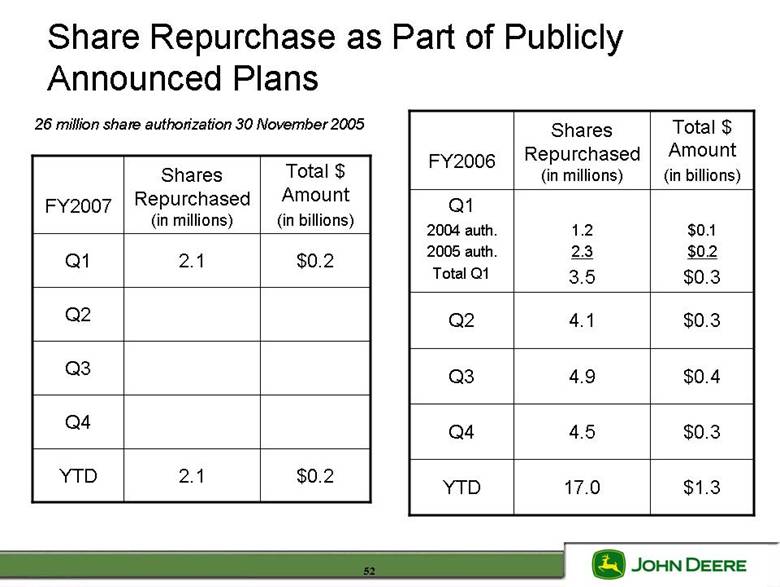
| Share Repurchase as Part of Publicly Announced Plans $0.1 $0.2 $0.3 1.2 2.3 3.5 Q1 2004 auth. 2005 auth. Total Q1 $1.3 17.0 YTD $0.3 4.5 Q4 $0.4 4.9 Q3 $0.3 4.1 Q2 Total $ Amount (in billions) Shares Repurchased(in millions) FY2006 $0.2 2.1 Q1 $0.2 2.1 YTD Q4 Q3 Q2 Total $ Amount (in billions) Shares Repurchased(in millions) FY2007 26 million share authorization 30 November 2005 52 |
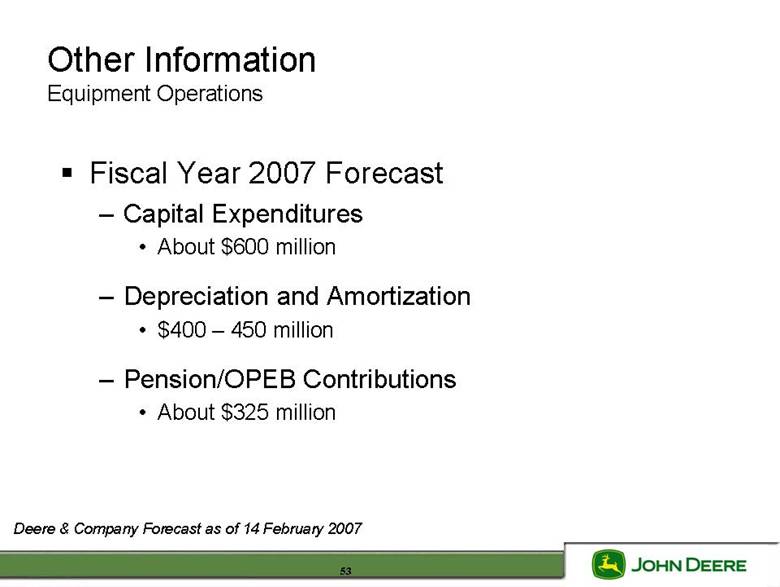
| Other Information Equipment Operations Fiscal Year 2007 Forecast Capital Expenditures About $600 million Depreciation and Amortization $400 – 450 million Pension/OPEB Contributions About $325 million Deere & Company Forecast as of 14 February 2007 53 |
| Deere’s second-quarter 2007 conference call is scheduled for 9:00 a.m. central time on Wednesday, May 16, 2007. 54 |
| Appendix 55 |

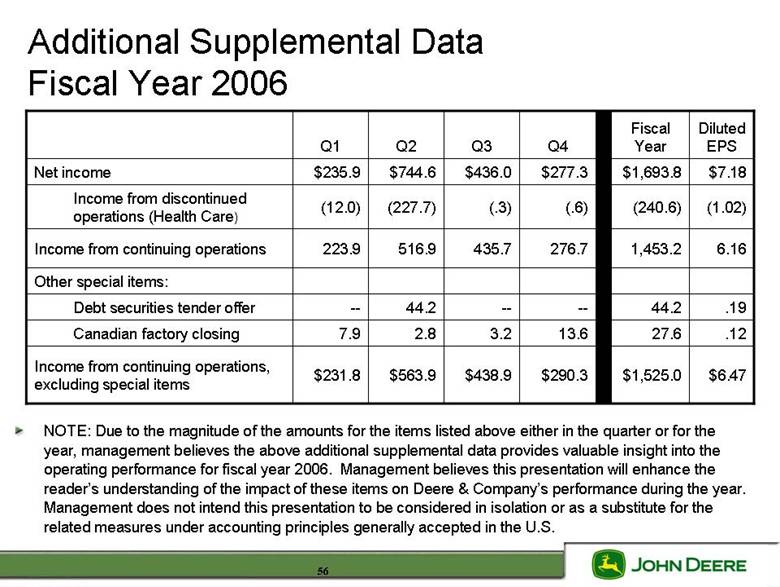
| NOTE: Due to the magnitude of the amounts for the items listed above either in the quarter or for the year, management believes the above additional supplemental data provides valuable insight into the operating performance for fiscal year 2006. Management believes this presentation will enhance the reader’s understanding of the impact of these items on Deere & Company’s performance during the year. Management does not intend this presentation to be considered in isolation or as a substitute for the related measures under accounting principles generally accepted in the U.S. Additional Supplemental Data Fiscal Year 2006 $290.3 13.6 -- 276.7 (.6) $277.3 Q4 $438.9 3.2 -- 435.7 (.3) $436.0 Q3 $6.47 $1,525.0 $563.9 $231.8 Income from continuing operations, excluding special items .12 27.6 2.8 7.9 Canadian factory closing .19 44.2 44.2 -- Debt securities tender offer Other special items: 6.16 1,453.2 516.9 223.9 Income from continuing operations (1.02) (240.6) (227.7) (12.0) Income from discontinued operations (Health Care) $7.18 $1,693.8 $744.6 $235.9 Net income Diluted EPS Fiscal Year Q2 Q1 56 |
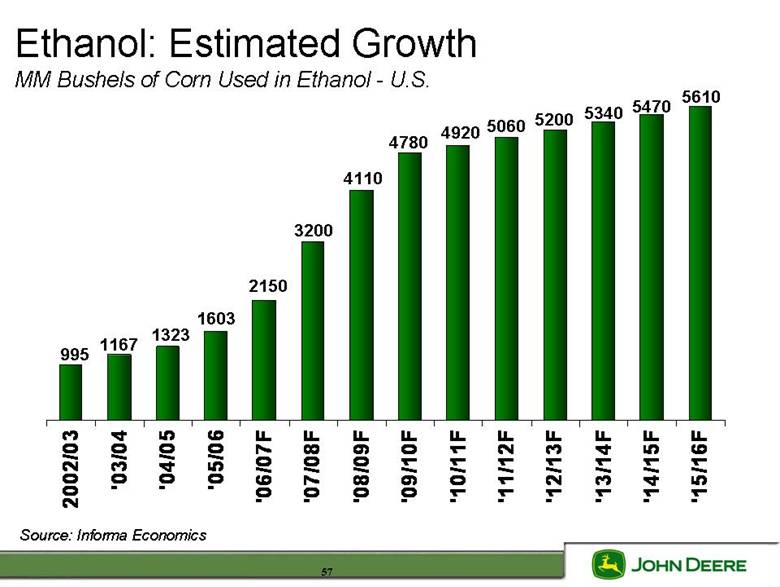
| Ethanol: Estimated Growth MM Bushels of Corn Used in Ethanol - U.S. 1167 995 1323 1603 2150 5060 4920 4780 4110 3200 5610 5470 5340 5200 Source: Informa Economics 57 |
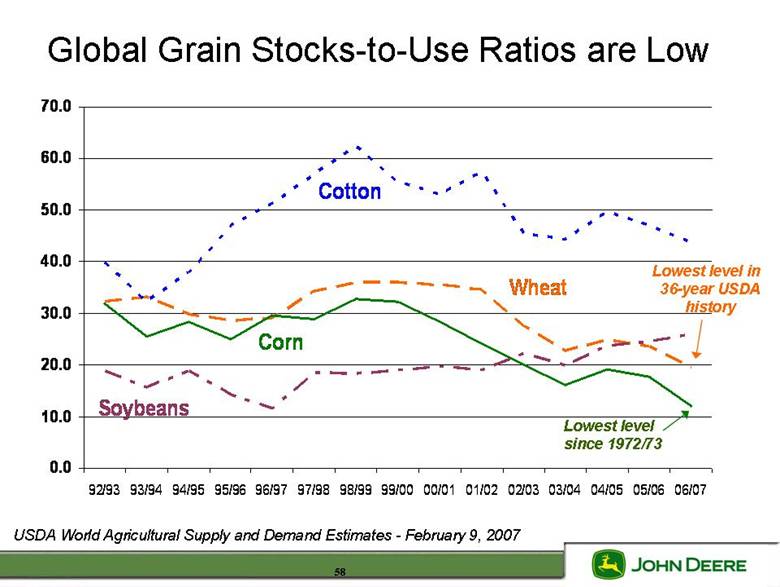
| Global Grain Stocks-to-Use Ratios are Low USDA World Agricultural Supply and Demand Estimates - February 9, 2007 Wheat Corn Soybeans Cotton 0.0 10.0 20.0 30.0 40.0 50.0 60.0 70.0 92/93 93/94 94/95 95/96 96/97 97/98 98/99 99/00 00/01 01/02 02/03 03/04 04/05 05/06 06/07 Lowest level in 36-year USDA history Lowest level since 1972/73 58 |