(Furnished herewith)
| Fourth Quarter 2007 Earnings Conference Call 25 Exhibit 99.3 (Furnished herewith) |

| Safe Harbor Statement & Disclosures The earnings call and accompanying material include forward-looking comments and information concerning the company’s projections, plans and objectives for the future, including estimates and assumptions with respect to economic, political, technological, weather, market acceptance and other factors that impact our businesses and customers. They also may include financial measures that are not in conformance with GAAP (accounting principles generally accepted in the United States of America). Words such as “forecast,” “projection,” “outlook,” “expected,” “estimated,” “will,” “plan,” “anticipate,” “intend,” or other similar words or phrases often identify forward-looking statements. Actual results may differ materially from those projected in these forward-looking statements based on a number of factors and uncertainties. Additional information concerning factors that could cause actual results to differ materially is contained in the company’s most recent Form 8-K and periodic report filed with the Securities and Exchange Commission, and is incorporated by reference herein. Investors should refer to and consider the incorporated information on risks and uncertainties in addition to the information presented here. Investors should consider non-GAAP financial measures in addition to, and not as a substitute for, financial measures prepared in accordance with GAAP. The company, except as required by law, undertakes no obligation to update or revise its forward-looking statements whether as a result of new developments or otherwise. 26 |
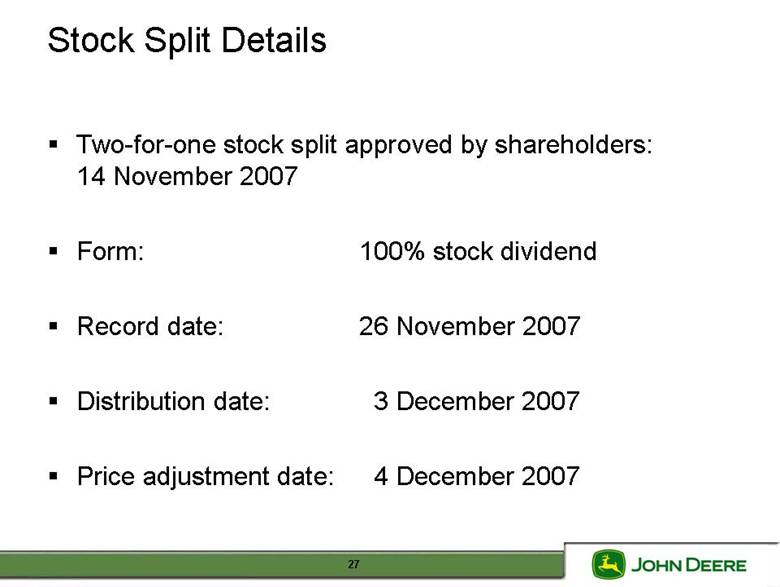
| Stock Split Details Two-for-one stock split approved by shareholders: 14 November 2007 Form: 100% stock dividend Record date: 26 November 2007 Distribution date: 3 December 2007 Price adjustment date: 4 December 2007 27 |
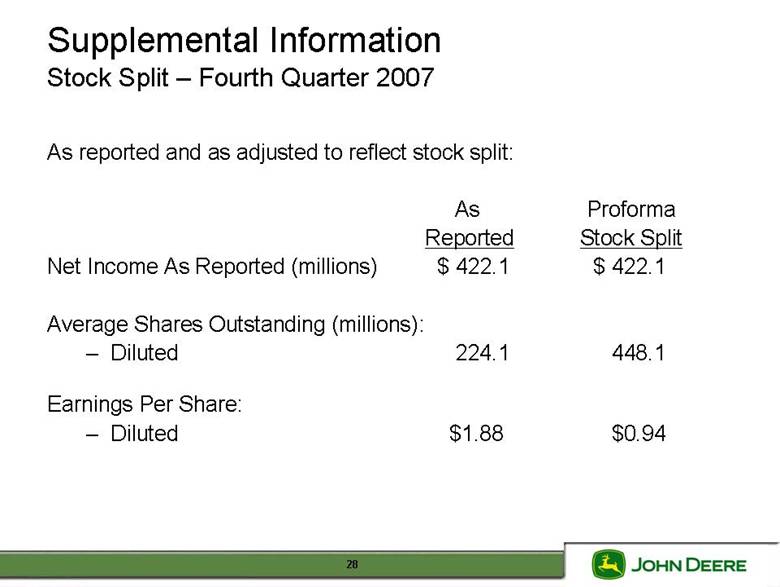
| Supplemental Information Stock Split – Fourth Quarter 2007 As reported and as adjusted to reflect stock split: As Proforma Reported Stock Split Net Income As Reported (millions) $ 422.1 $ 422.1 Average Shares Outstanding (millions): Diluted 224.1 448.1 Earnings Per Share: Diluted $1.88 $0.94 28 |
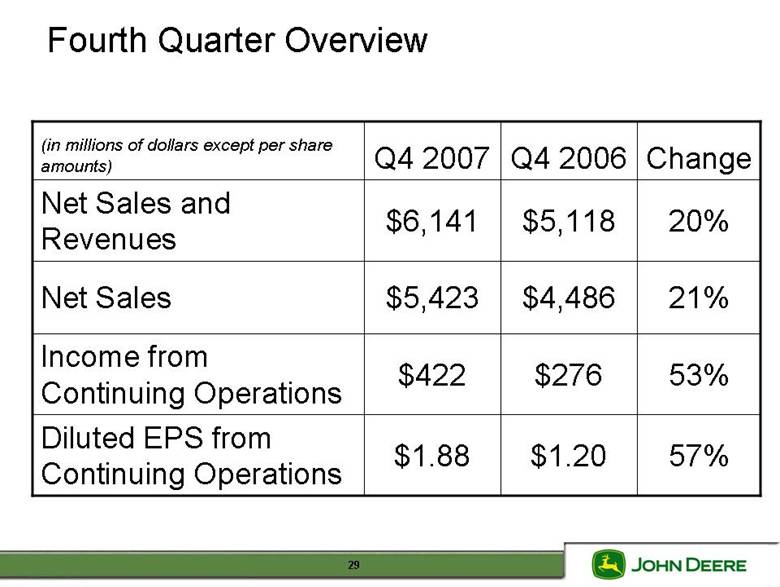
| Fourth Quarter Overview 53% $276 $422 Income from Continuing Operations 57% $1.20 $1.88 Diluted EPS from Continuing Operations 21% $4,486 $5,423 Net Sales 20% $5,118 $6,141 Net Sales and Revenues Change Q4 2006 Q4 2007 (in millions of dollars except per share amounts) 29 |
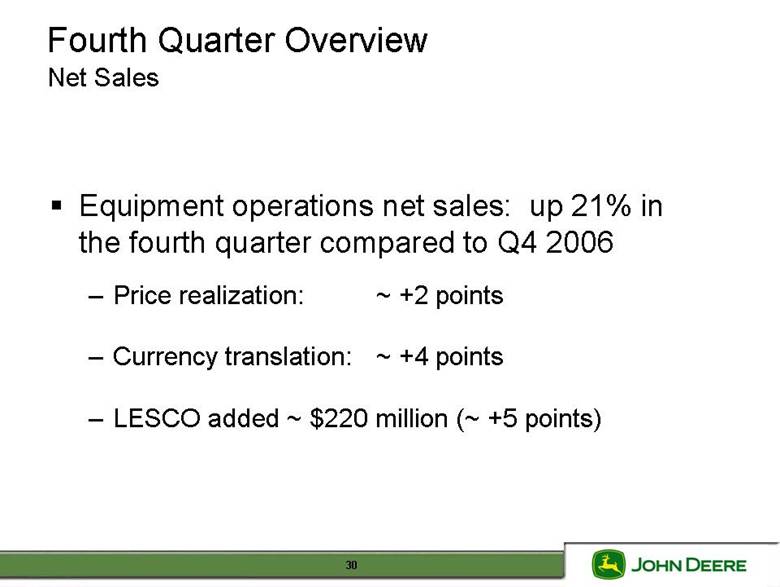
| Equipment operations net sales: up 21% in the fourth quarter compared to Q4 2006 Price realization: ~ +2 points Currency translation: ~ +4 points LESCO added ~ $220 million (~ +5 points) Fourth Quarter Overview Net Sales 30 |
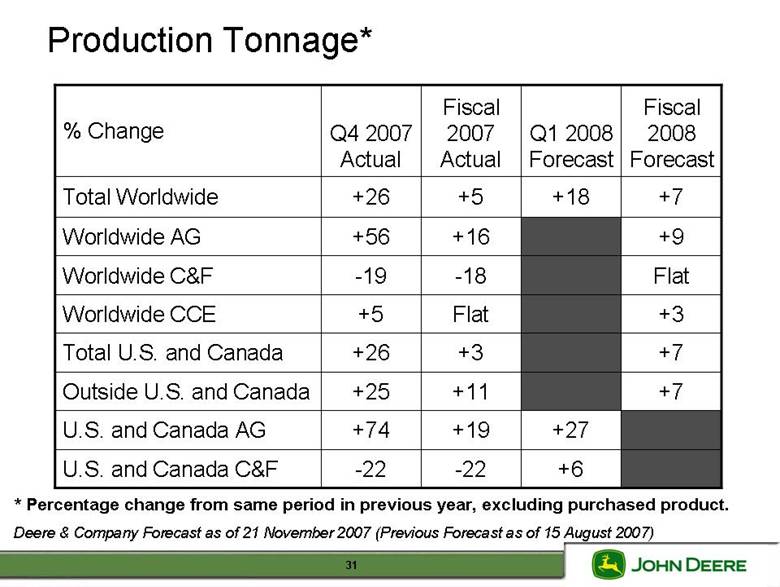
| Deere & Company Forecast as of 21 November 2007 (Previous Forecast as of 15 August 2007) -22 +74 +25 +26 +5 -19 +56 +26 Q4 2007 Actual +6 -22 U.S. and Canada C&F +27 +19 U.S. and Canada AG +7 +11 Outside U.S. and Canada +7 +3 Total U.S. and Canada +3 Flat Worldwide CCE Flat -18 Worldwide C&F +9 +16 Worldwide AG +7 +18 +5 Total Worldwide Fiscal 2008 Forecast Q1 2008 Forecast Fiscal 2007 Actual % Change * Percentage change from same period in previous year, excluding purchased product. Production Tonnage* 31 |
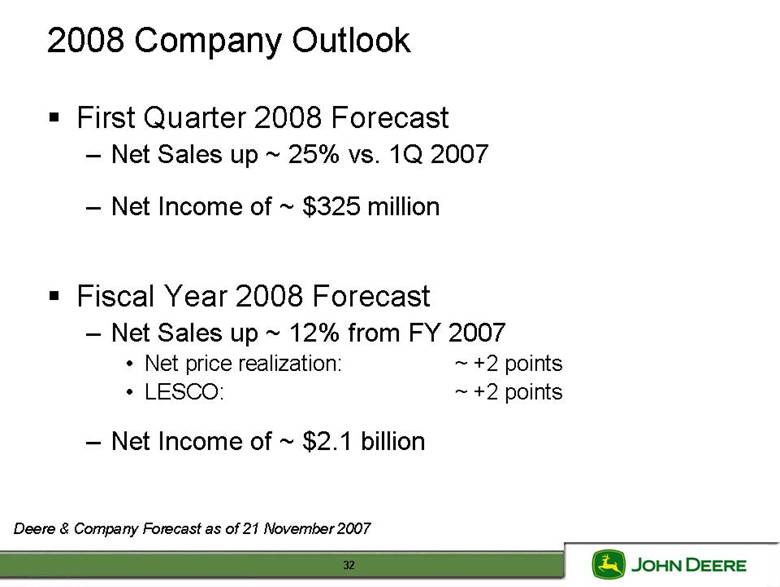
| 2008 Company Outlook First Quarter 2008 Forecast Net Sales up ~ 25% vs. 1Q 2007 Net Income of ~ $325 million Fiscal Year 2008 Forecast Net Sales up ~ 12% from FY 2007 Net price realization: ~ +2 points LESCO: ~ +2 points Net Income of ~ $2.1 billion Deere & Company Forecast as of 21 November 2007 32 |
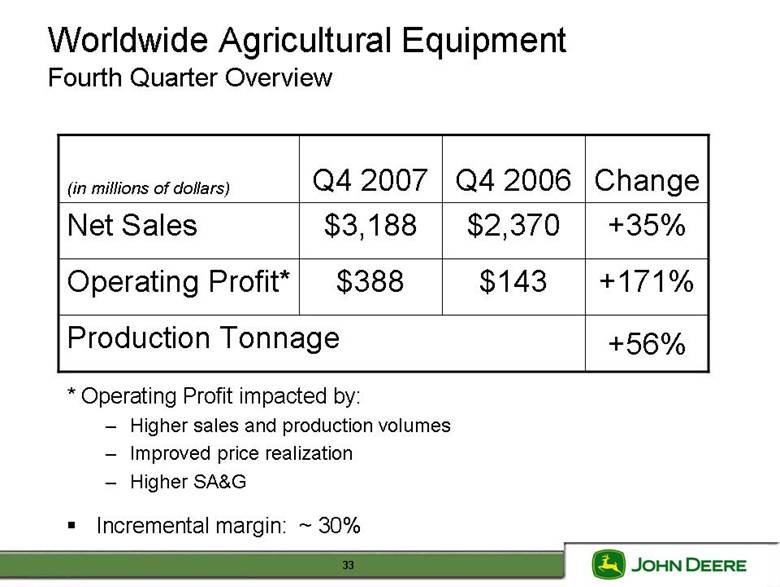
| +171% $143 $388 Operating Profit* +56% Production Tonnage +35% $2,370 $3,188 Net Sales Change Q4 2006 Q4 2007 (in millions of dollars) * Operating Profit impacted by: Higher sales and production volumes Improved price realization Higher SA&G Incremental margin: ~ 30% Worldwide Agricultural Equipment Fourth Quarter Overview 33 |
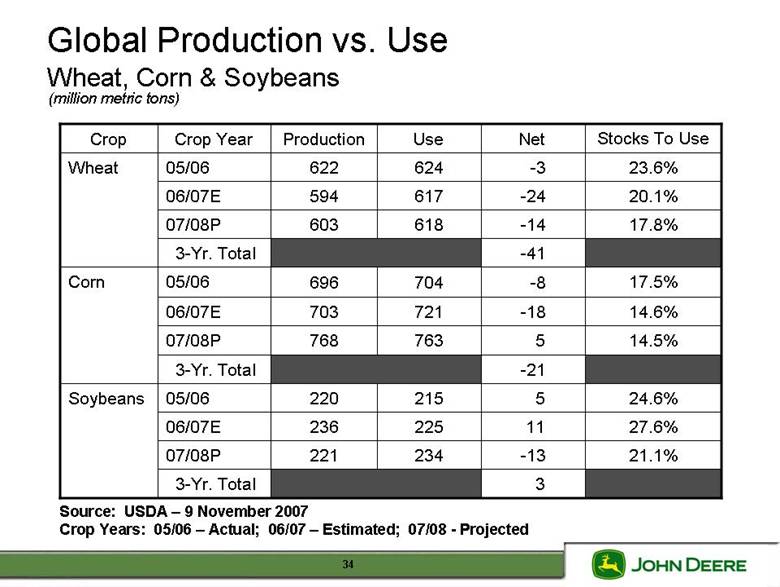
| Global Production vs. Use Wheat, Corn & Soybeans 21.1% -13 234 221 07/08P 27.6% 11 225 236 06/07E 24.6% 215 220 05/06 Soybeans -21 14.5% 763 768 07/08P 14.6% -18 721 703 06/07E 17.5% 704 696 05/06 Corn -41 17.8% -14 618 603 07/08P 20.1% -24 617 594 06/07E 23.6% 624 622 05/06 Wheat Stocks To Use Net Use Production Crop Year Crop (million metric tons) Source: USDA – 9 November 2007 Crop Years: 05/06 – Actual; 06/07 – Estimated; 07/08 - Projected 34 -3 3-Yr. Total -8 5 3-Yr. Total 5 3-Yr. Total 3 |
| U.S. Farm Cash Receipts Estimates 280.2 128.3 139.6 Previous 2008 294.3 134.0 148.0 2008 Forecast 281.9 133.1 135.0 Previous 2007 291.8 138.8 139.4 2007 Forecast 255.1 Total Cash Receipts Government Payments 119.3 Livestock 120.0 Crops 2006 Estimate (in billions of dollars) Deere & Company Forecast as of 21 November 2007 (Previous Forecast as of 15 August 2007) 35 15.8 13.6 13.8 12.3 12.3 |

| U.S. Commodity Price Estimates $.580 $7.65 $4.00 $3.25 Previous 2008/09 $.620 $9.50 $4.75 $3.50 2008/09 Forecast $.480 $7.45 $4.85 $2.90 Previous 2007/08 $.540 $9.40 $6.50 $3.30 2007/08 Forecast $.465 $6.43 $4.26 $3.05 2006/07 Estimate Cotton (per pound) Soybeans (per bushel) Wheat (per bushel) Corn (per bushel) Deere & Company Forecast as of 21 November 2007 (Previous Forecast as of 15 August 2007) 36 |

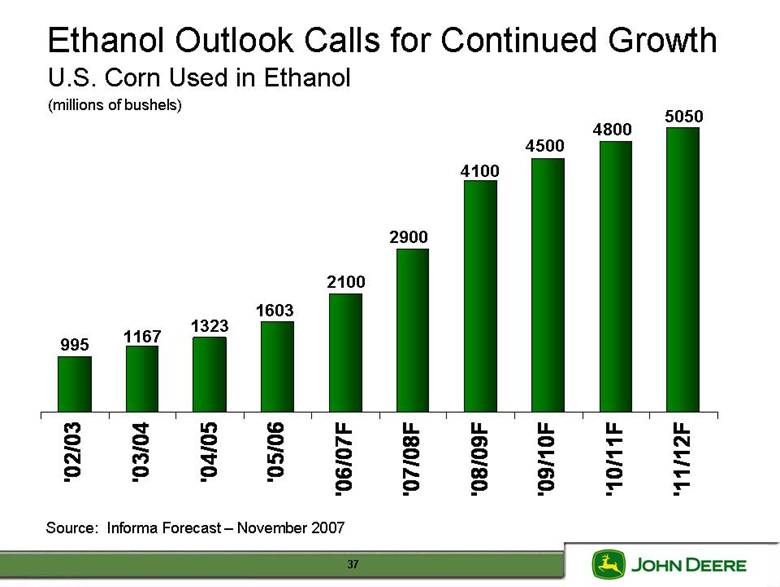
| 1167 995 1323 1603 2100 5050 4800 4500 4100 2900 Source: Informa Forecast – November 2007 Ethanol Outlook Calls for Continued Growth U.S. Corn Used in Ethanol (millions of bushels) '02/03 '03/04 '04/05 '05/06 '06/07F '07/08F '08/09F '09/10F '10/11F '11/12F 37 |
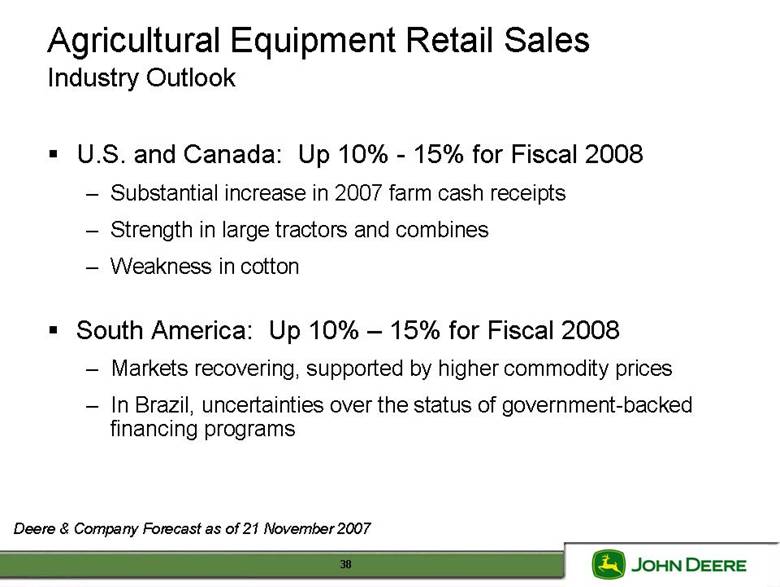
| Agricultural Equipment Retail Sales Industry Outlook U.S. and Canada: Up 10% - 15% for Fiscal 2008 Substantial increase in 2007 farm cash receipts Strength in large tractors and combines Weakness in cotton South America: Up 10% – 15% for Fiscal 2008 Markets recovering, supported by higher commodity prices In Brazil, uncertainties over the status of government-backed financing programs Deere & Company Forecast as of 21 November 2007 38 |
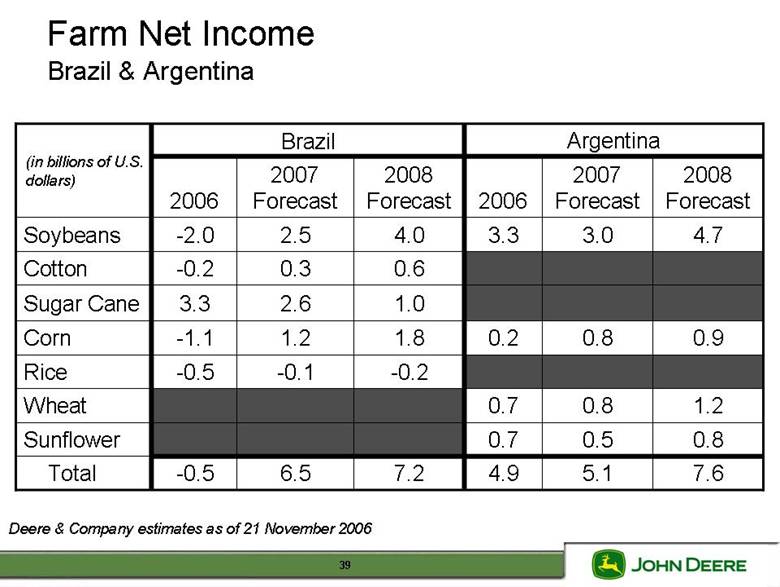
| Farm Net Income Brazil & Argentina 1.2 0.8 0.7 Wheat -0.2 -0.1 -0.5 Rice 4.9 0.7 0.2 3.3 2006 Argentina Brazil (in billions of U.S. dollars) 7.6 5.1 7.2 6.5 -0.5 0.8 0.5 Sunflower 0.9 0.8 1.8 1.2 -1.1 Corn 1.0 2.6 3.3 Sugar Cane 0.6 0.3 -0.2 Cotton 4.7 3.0 4.0 2.5 -2.0 Soybeans 2008 Forecast 2007 Forecast 2008 Forecast 2007 Forecast 2006 Deere & Company estimates as of 21 November 2006 39 Total |
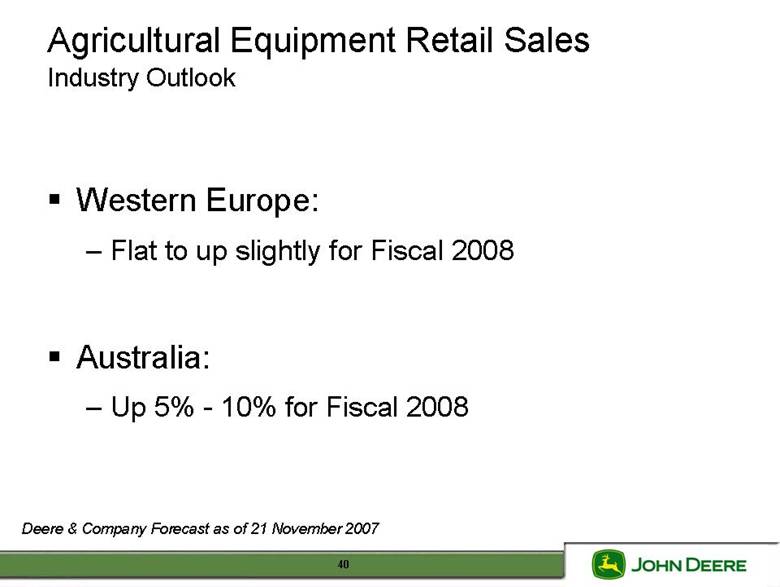
| Western Europe: Flat to up slightly for Fiscal 2008 Australia: Up 5% - 10% for Fiscal 2008 Deere & Company Forecast as of 21 November 2007 Agricultural Equipment Retail Sales Industry Outlook 40 |
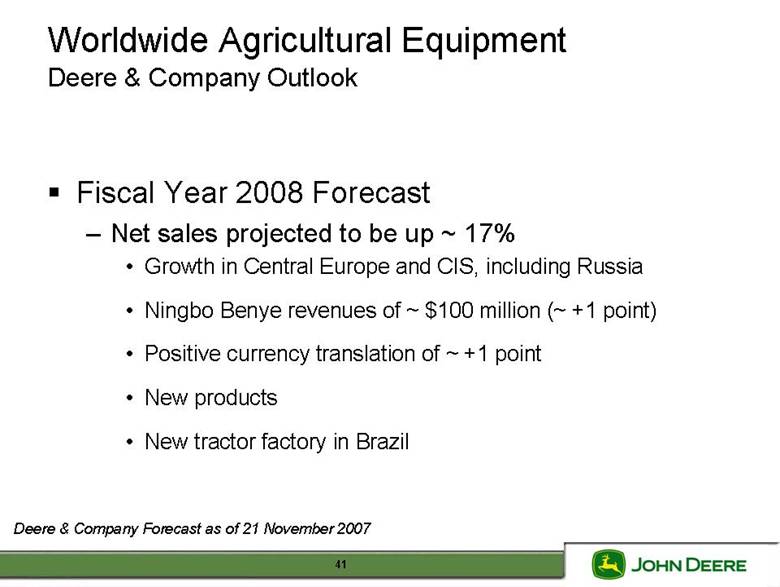
| Fiscal Year 2008 Forecast Net sales projected to be up ~ 17% Growth in Central Europe and CIS, including Russia Ningbo Benye revenues of ~ $100 million (~ +1 point) Positive currency translation of ~ +1 point New products New tractor factory in Brazil Deere & Company Forecast as of 21 November 2007 Worldwide Agricultural Equipment Deere & Company Outlook 41 |
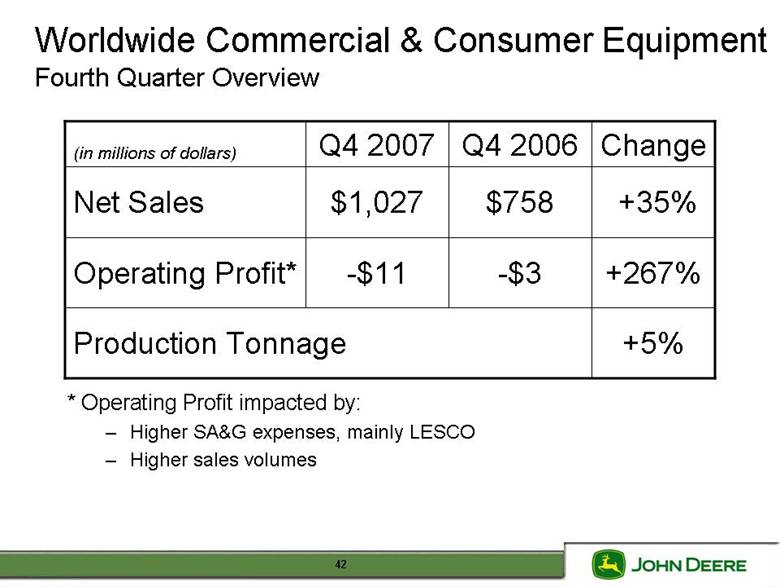
| +267% -$3 -$11 Operating Profit* +5% Production Tonnage +35% $758 $1,027 Net Sales Change Q4 2006 Q4 2007 (in millions of dollars) Worldwide Commercial & Consumer Equipment Fourth Quarter Overview * Operating Profit impacted by: Higher SA&G expenses, mainly LESCO Higher sales volumes 42 |
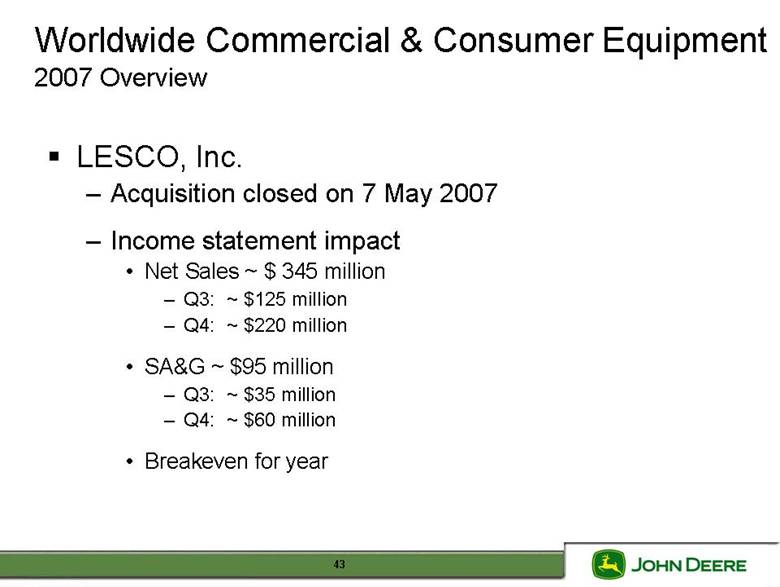
| LESCO, Inc. Acquisition closed on 7 May 2007 Income statement impact Net Sales ~ $ 345 million Q3: ~ $125 million Q4: ~ $220 million SA&G ~ $95 million Q3: ~ $35 million Q4: ~ $60 million Breakeven for year Worldwide Commercial & Consumer Equipment 2007 Overview 43 |
| Fiscal Year 2008 Forecast Net sales projected to be up ~ 10% U.S. economic factors Housing starts Regional drought New products Across many product areas LESCO Incremental increase of ~ $350 million Deere & Company Forecast as of 21 November 2007 Worldwide Commercial & Consumer Equipment Deere & Company Outlook 44 |

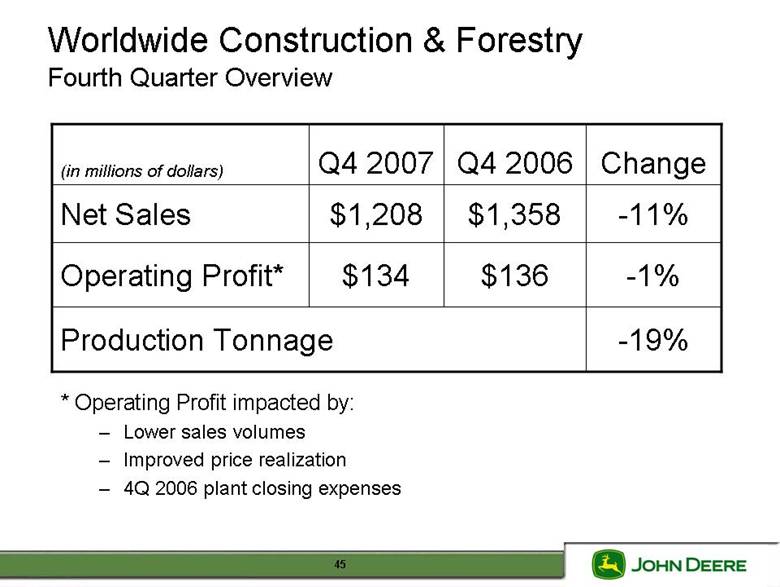
| -1% $136 $134 Operating Profit* -19% Production Tonnage -11% $1,358 $1,208 Net Sales Change Q4 2006 Q4 2007 (in millions of dollars) * Operating Profit impacted by: Lower sales volumes Improved price realization 4Q 2006 plant closing expenses Worldwide Construction & Forestry Fourth Quarter Overview 45 |
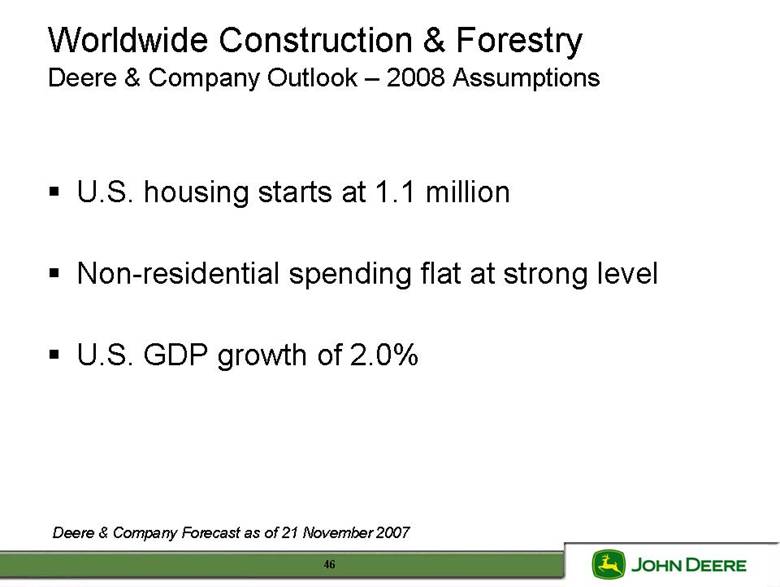
| U.S. housing starts at 1.1 million Non-residential spending flat at strong level U.S. GDP growth of 2.0% Deere & Company Forecast as of 21 November 2007 Worldwide Construction & Forestry Deere & Company Outlook – 2008 Assumptions 46 |
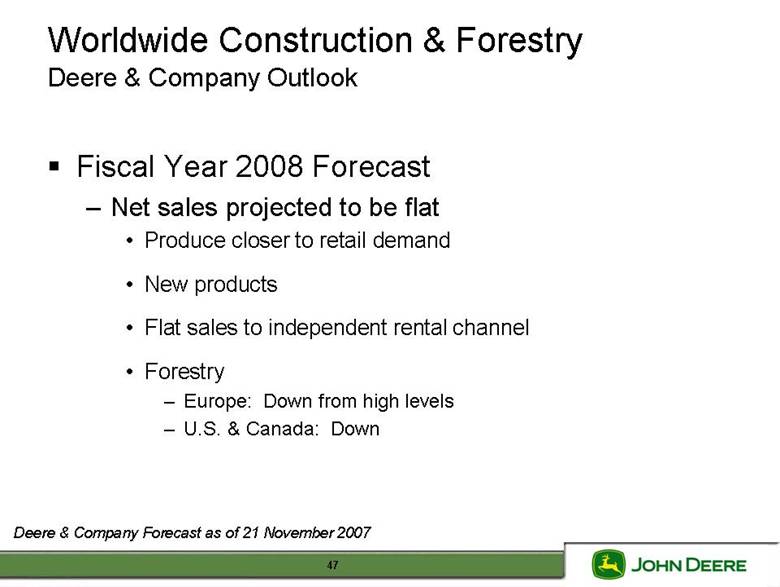
| Fiscal Year 2008 Forecast Net sales projected to be flat Produce closer to retail demand New products Flat sales to independent rental channel Forestry Europe: Down from high levels U.S. & Canada: Down Deere & Company Forecast as of 21 November 2007 Worldwide Construction & Forestry Deere & Company Outlook 47 |
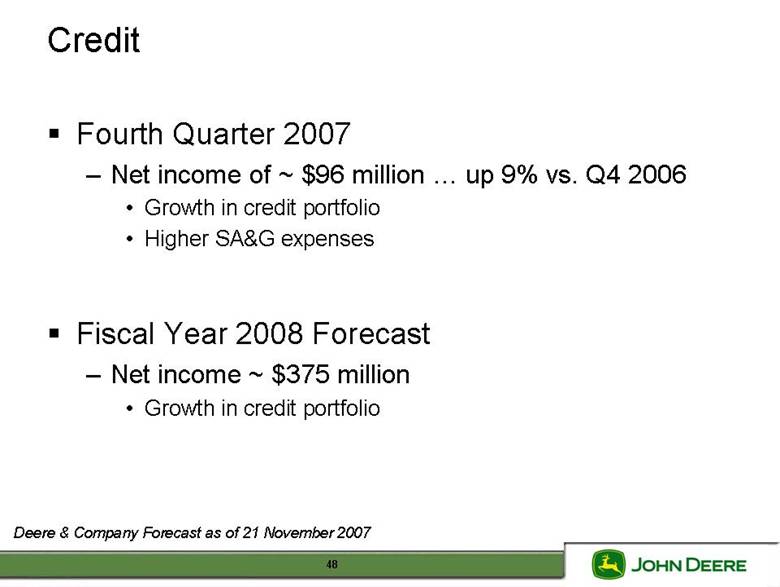
| Fourth Quarter 2007 Net income of ~ $96 million up 9% vs. Q4 2006 Growth in credit portfolio Higher SA&G expenses Fiscal Year 2008 Forecast Net income ~ $375 million Growth in credit portfolio Deere & Company Forecast as of 21 November 2007 Credit 48 |
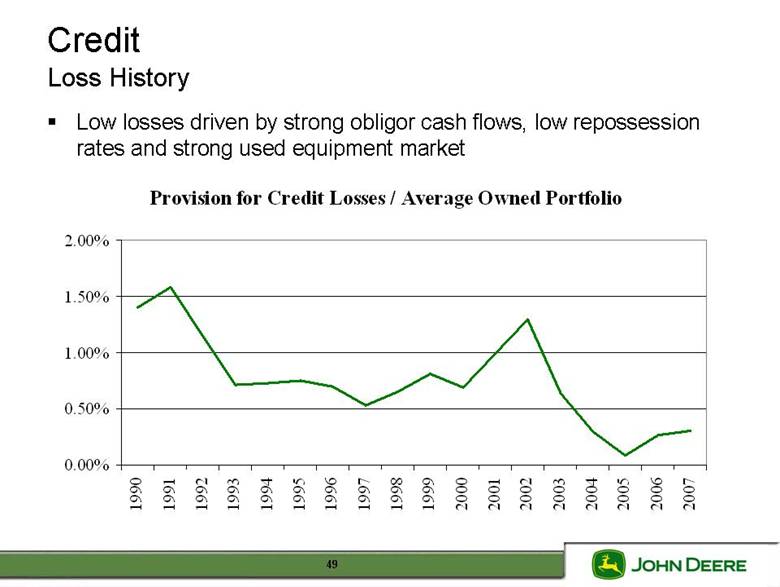
| Low losses driven by strong obligor cash flows, low repossession rates and strong used equipment market Credit Loss History 49 Provision for Credit Losses / Average Owned Portfolio 0.00% 0.50% 1.00% 1.50% 2.00% 1990 1991 1992 1993 1994 1995 1996 1997 1998 1999 2000 2001 2002 2003 2004 2005 2006 2007 |
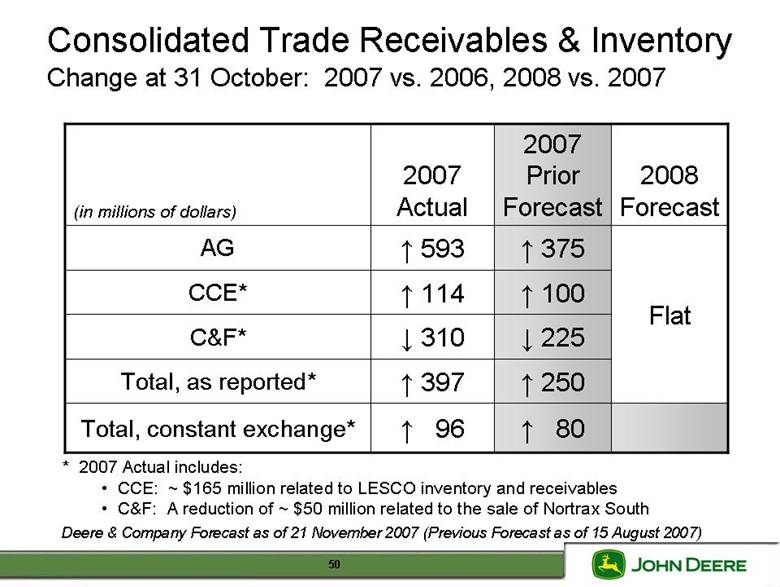
| Flat 2008 Forecast 80 250 225 100 375 2007 Prior Forecast 397 Total, as reported* 96 Total, constant exchange* C&F* CCE* AG (in millions of dollars) 310 114 593 2007 Actual Deere & Company Forecast as of 21 November 2007 (Previous Forecast as of 15 August 2007) * 2007 Actual includes: CCE: ~ $165 million related to LESCO inventory and receivables C&F: A reduction of ~ $50 million related to the sale of Nortrax South Consolidated Trade Receivables & Inventory Change at 31 October: 2007 vs. 2006, 2008 vs. 2007 50 |
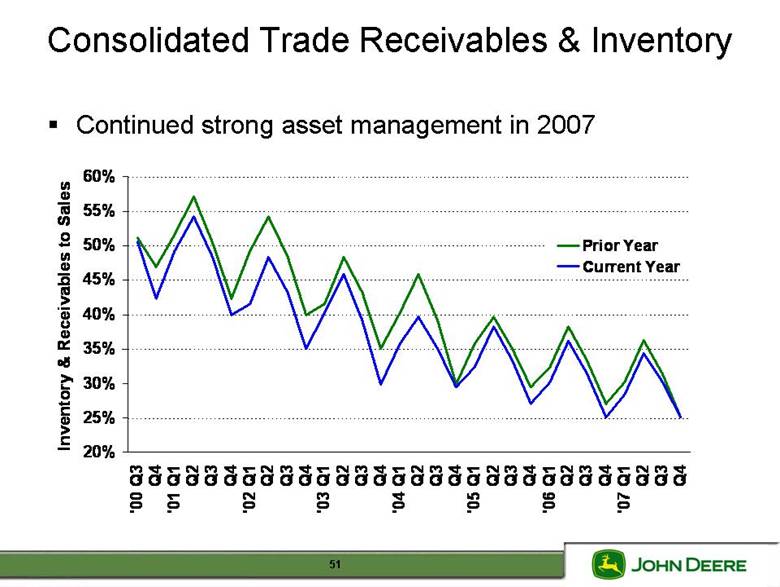
| Continued strong asset management in 2007 Consolidated Trade Receivables & Inventory 20% 25% 30% 35% 40% 45% 50% 55% 60% '00 Q3 Q4 '01 Q1 Q2 Q3 Q4 '02 Q1 Q2 Q3 Q4 '03 Q1 Q2 Q3 Q4 '04 Q1 Q2 Q3 Q4 '05 Q1 Q2 Q3 Q4 '06 Q1 Q2 Q3 Q4 '07 Q1 Q2 Q3 Q4 Inventory & Receivables to Sales Prior Year Current Year 51 |
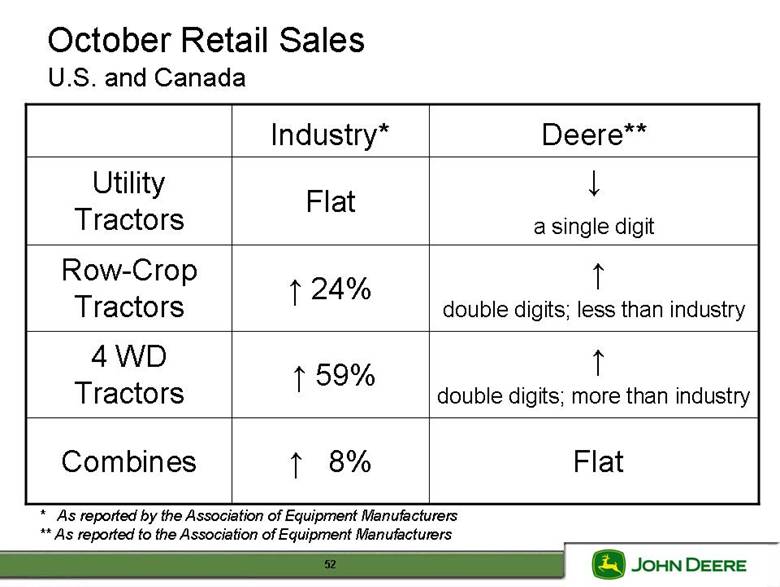
| Flat double digits; more than industry double digits; less than industry a single digit Deere** 59% 4 WD Tractors 8% Combines 24% Flat Industry* Row-Crop Tractors Utility Tractors * As reported by the Association of Equipment Manufacturers ** As reported to the Association of Equipment Manufacturers October Retail Sales U.S. and Canada 52 |
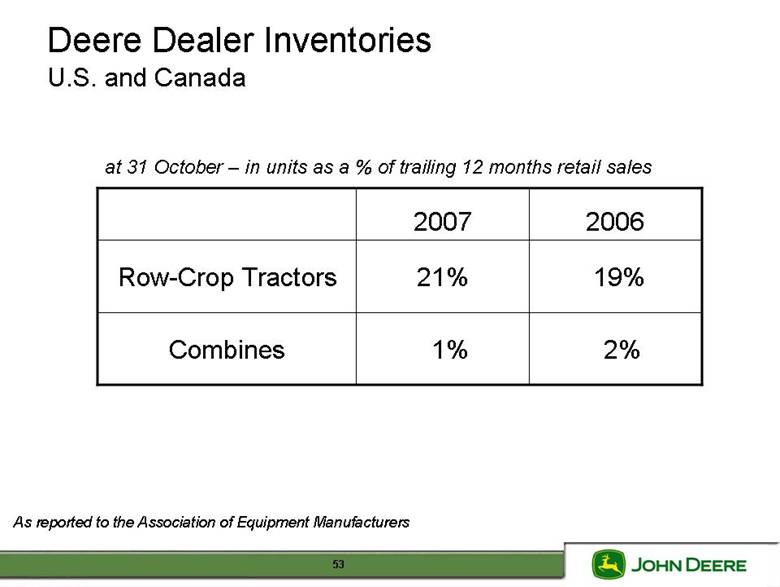
| 2006 2007 Combines 21% 19% Row-Crop Tractors As reported to the Association of Equipment Manufacturers at 31 October – in units as a % of trailing 12 months retail sales Deere Dealer Inventories U.S. and Canada 53 1% 2% |
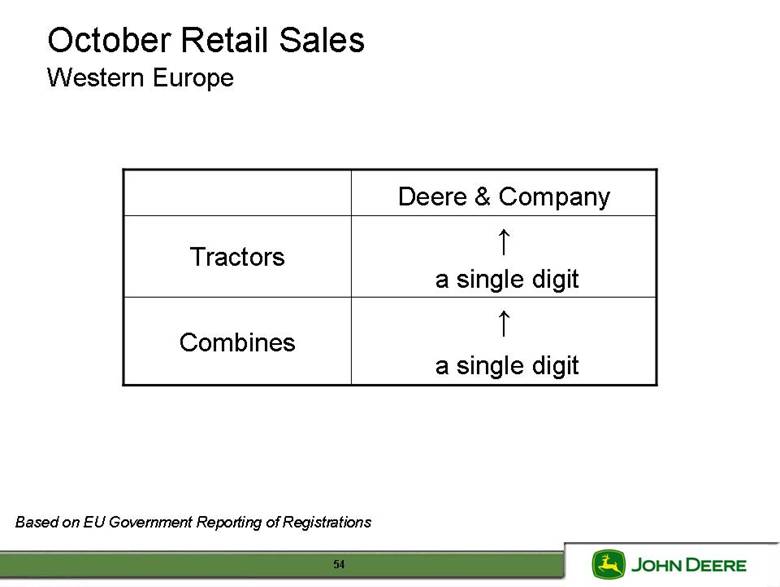
| a single digit a single digit Deere & Company Combines Tractors Based on EU Government Reporting of Registrations October Retail Sales Western Europe 54 |
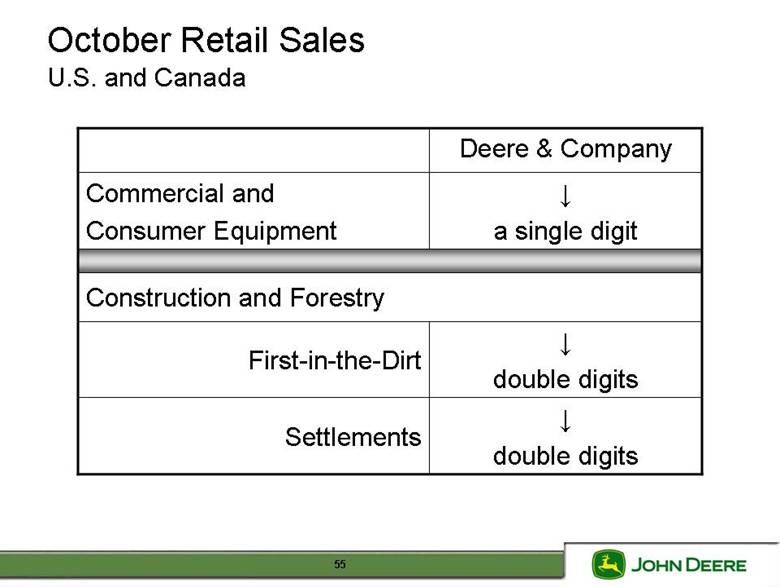
| double digits First-in-the-Dirt double digits Settlements Construction and Forestry a single digit Commercial and Consumer Equipment Deere & Company October Retail Sales U.S. and Canada 55 |
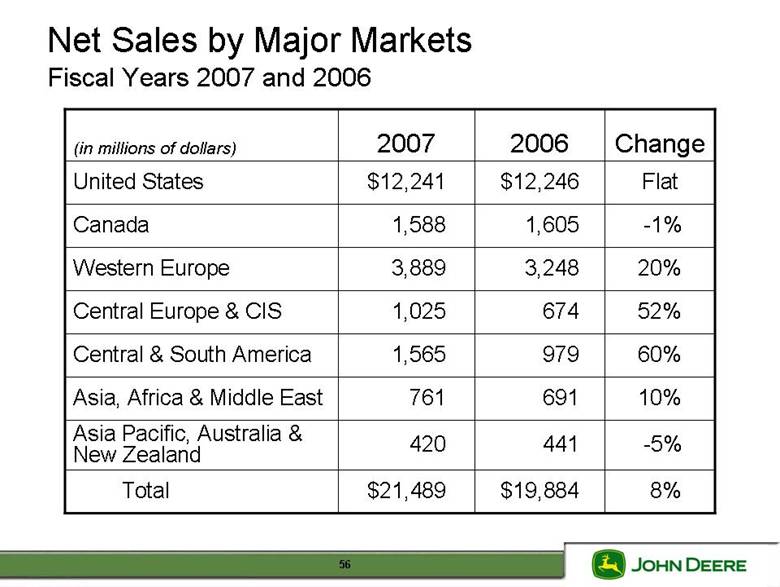
| 10% Asia, Africa & Middle East -1% Canada 20% Western Europe 52% Central Europe & CIS 60% Central & South America -5% Asia Pacific, Australia & New Zealand Flat $12,246 $12,241 United States $19,884 $21,489 Change 2006 2007 (in millions of dollars) Net Sales by Major Markets Fiscal Years 2007 and 2006 56 Total 8% 420 441 1,565 979 1,025 674 3,889 3,248 1,588 1,605 761 691 |
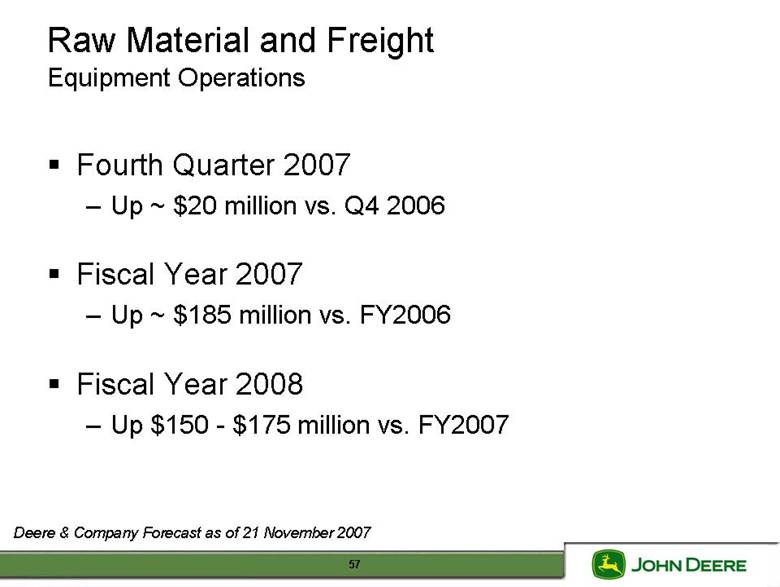
| Fourth Quarter 2007 Up ~ $20 million vs. Q4 2006 Fiscal Year 2007 Up ~ $185 million vs. FY2006 Fiscal Year 2008 Up $150 - $175 million vs. FY2007 Deere & Company Forecast as of 21 November 2007 Raw Material and Freight Equipment Operations 57 |
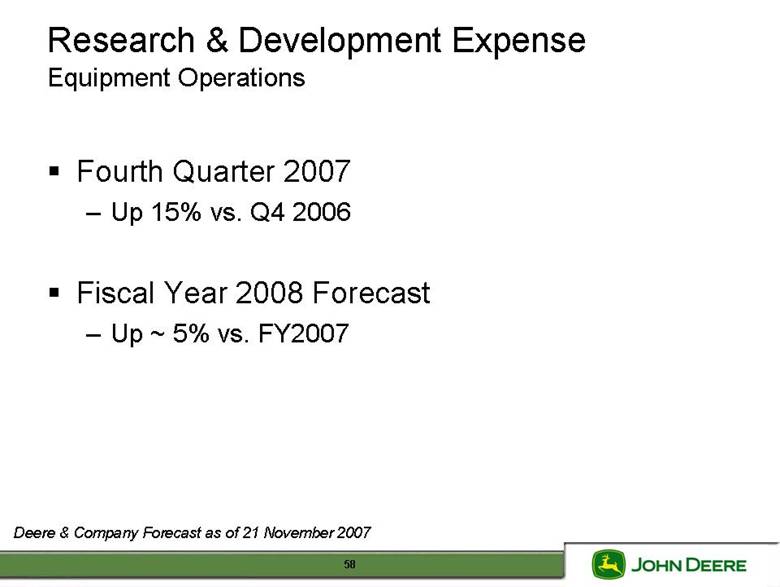
| Deere & Company Forecast as of 21 November 2007 Research & Development Expense Equipment Operations Fourth Quarter 2007 Up 15% vs. Q4 2006 Fiscal Year 2008 Forecast Up ~ 5% vs. FY2007 58 |
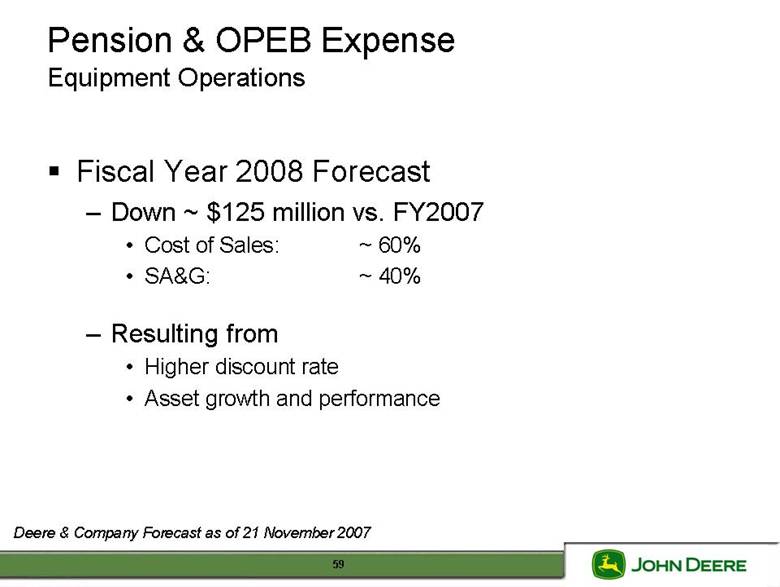
| Deere & Company Forecast as of 21 November 2007 Pension & OPEB Expense Equipment Operations Fiscal Year 2008 Forecast Down ~ $125 million vs. FY2007 Cost of Sales: ~ 60% SA&G: ~ 40% Resulting from Higher discount rate Asset growth and performance 59 |
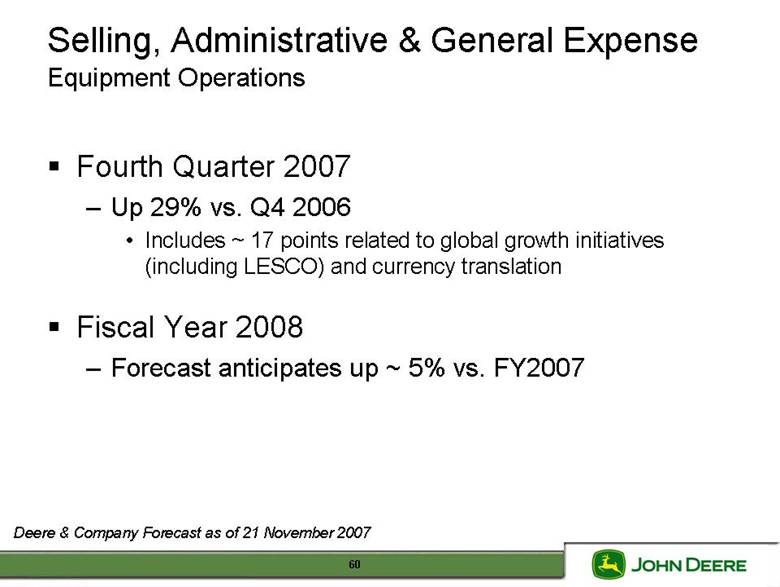
| Fourth Quarter 2007 Up 29% vs. Q4 2006 Includes ~ 17 points related to global growth initiatives (including LESCO) and currency translation Fiscal Year 2008 Forecast anticipates up ~ 5% vs. FY2007 Deere & Company Forecast as of 21 November 2007 Selling, Administrative & General Expense Equipment Operations 60 |
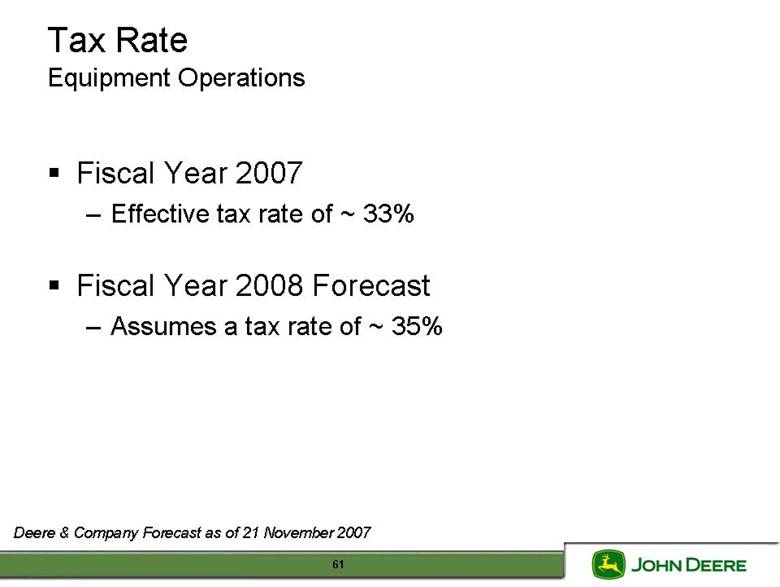
| Fiscal Year 2007 Effective tax rate of ~ 33% Fiscal Year 2008 Forecast Assumes a tax rate of ~ 35% Deere & Company Forecast as of 21 November 2007 Tax Rate Equipment Operations 61 |
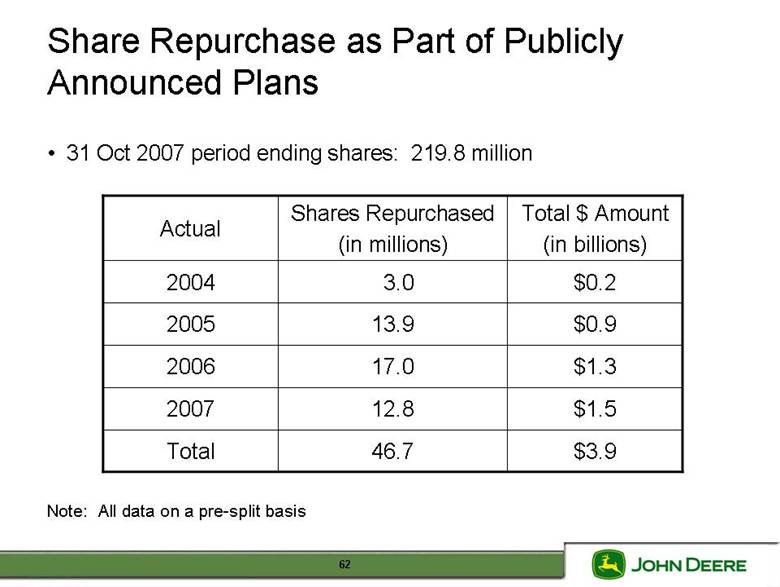
| Share Repurchase as Part of Publicly Announced Plans Total $ Amount (in billions) Shares Repurchased (in millions) Actual $0.2 2004 $3.9 46.7 Total $1.5 12.8 2007 $1.3 17.0 2006 $0.9 13.9 2005 Note: All data on a pre-split basis 62 31 Oct 2007 period ending shares: 219.8 million 3.0 |
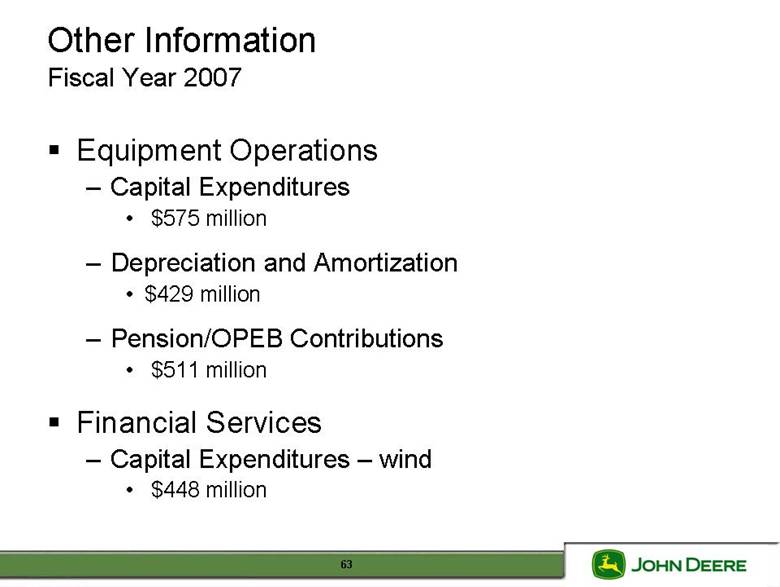
| Equipment Operations Capital Expenditures $575 million Depreciation and Amortization $429 million Pension/OPEB Contributions $511 million Financial Services Capital Expenditures – wind $448 million Other Information Fiscal Year 2007 63 |
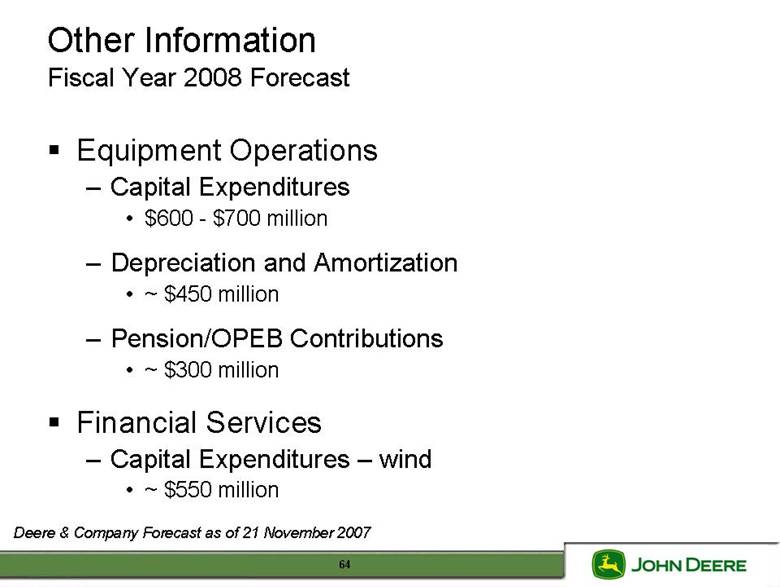
| Equipment Operations Capital Expenditures $600 - $700 million Depreciation and Amortization ~ $450 million Pension/OPEB Contributions ~ $300 million Financial Services Capital Expenditures – wind ~ $550 million Other Information Fiscal Year 2008 Forecast Deere & Company Forecast as of 21 November 2007 64 |
| Appendix 65 |

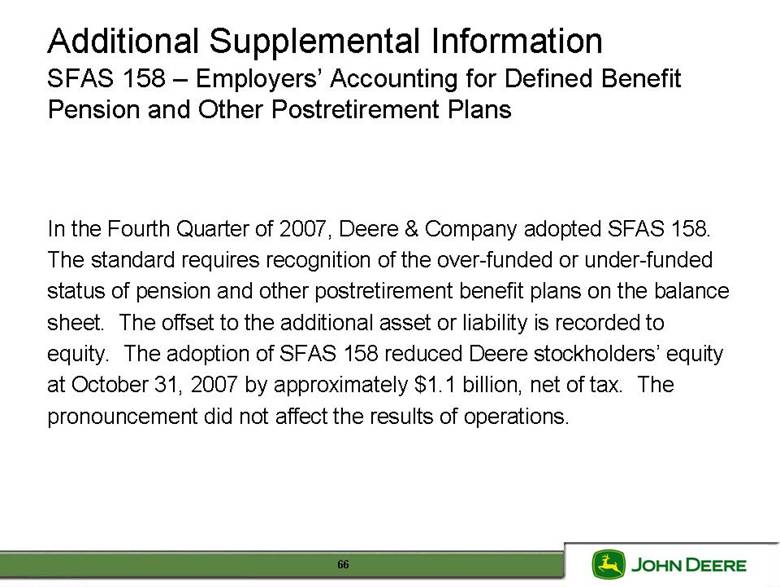
| Additional Supplemental Information SFAS 158 – Employers’ Accounting for Defined Benefit Pension and Other Postretirement Plans 66 In the Fourth Quarter of 2007, Deere & Company adopted SFAS 158. The standard requires recognition of the over-funded or under-funded status of pension and other postretirement benefit plans on the balance sheet. The offset to the additional asset or liability is recorded to equity. The adoption of SFAS 158 reduced Deere stockholders’ equity at October 31, 2007 by approximately $1.1 billion, net of tax. The pronouncement did not affect the results of operations. |
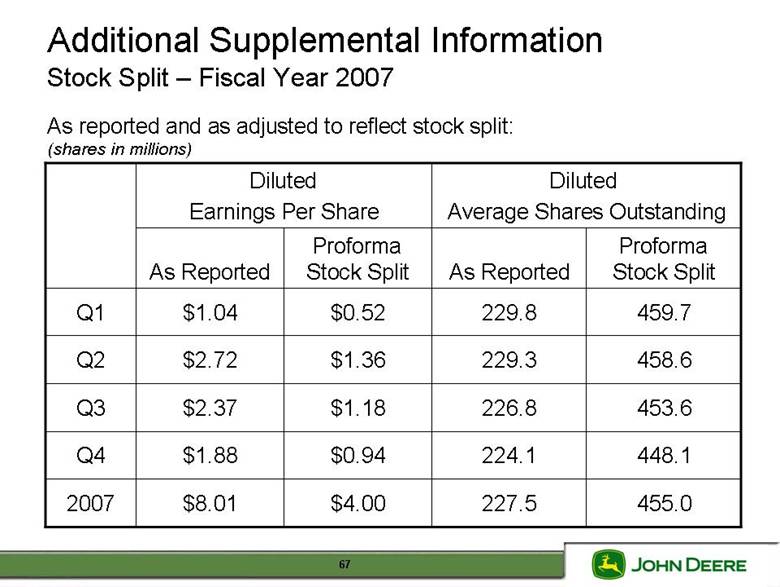
| Additional Supplemental Information Stock Split – Fiscal Year 2007 455.0 227.5 $4.00 $8.01 2007 448.1 224.1 $0.94 $1.88 Q4 453.6 226.8 $1.18 $2.37 Q3 458.6 229.3 $1.36 $2.72 Q2 459.7 229.8 $0.52 $1.04 Q1 Proforma Stock Split As Reported Proforma Stock Split As Reported As reported and as adjusted to reflect stock split: (shares in millions) 67 Diluted Earnings Per Share Diluted Average Shares Outstanding |
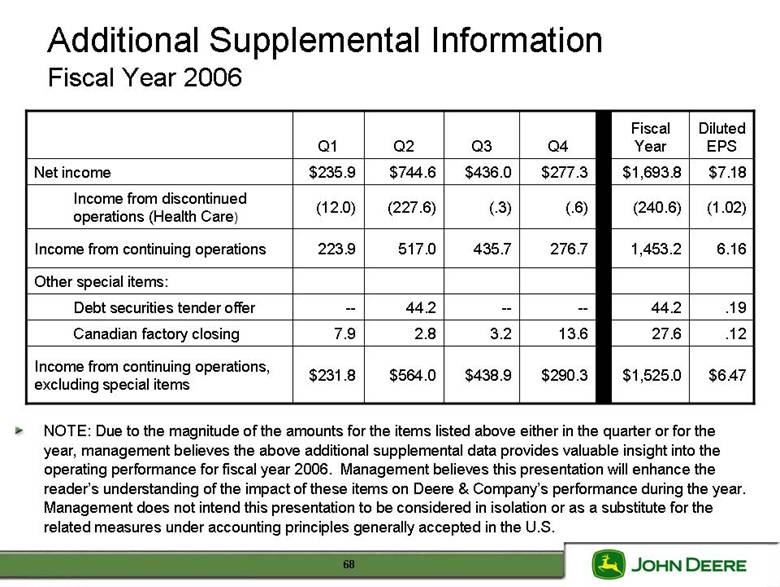
| NOTE: Due to the magnitude of the amounts for the items listed above either in the quarter or for the year, management believes the above additional supplemental data provides valuable insight into the operating performance for fiscal year 2006. Management believes this presentation will enhance the reader’s understanding of the impact of these items on Deere & Company’s performance during the year. Management does not intend this presentation to be considered in isolation or as a substitute for the related measures under accounting principles generally accepted in the U.S. $290.3 13.6 -- 276.7 (.6) $277.3 Q4 $438.9 3.2 -- 435.7 (.3) $436.0 Q3 $6.47 $1,525.0 $564.0 $231.8 Income from continuing operations, excluding special items .12 27.6 2.8 7.9 Canadian factory closing .19 44.2 44.2 -- Debt securities tender offer Other special items: 6.16 1,453.2 517.0 223.9 Income from continuing operations (1.02) (240.6) (227.6) (12.0) Income from discontinued operations (Health Care) $7.18 $1,693.8 $744.6 $235.9 Net income Diluted EPS Fiscal Year Q2 Q1 Additional Supplemental Information Fiscal Year 2006 68 |
| Deere’s first-quarter 2008 conference call is scheduled for 9:00 a.m. central time on Wednesday, February 13, 2008 69 |