Exhibit 99.3
(Furnished herewith)
| First Quarter 2008 Earnings Conference Call 20 |

| Safe Harbor Statement & Disclosures The earnings call and accompanying material include forward-looking comments and information concerning the company’s projections, plans and objectives for the future, including estimates and assumptions with respect to economic, political, technological, weather, market acceptance and other factors that impact our businesses and customers. They also may include financial measures that are not in conformance with GAAP (accounting principles generally accepted in the United States of America). Words such as “forecast,” “projection,” “outlook,” “expected,” “estimated,” “will,” “plan,” “anticipate,” “intend,” or other similar words or phrases often identify forward- looking statements. Actual results may differ materially from those projected in these forward-looking statements based on a number of factors and uncertainties. Additional information concerning factors that could cause actual results to differ materially is contained in the company’s most recent Form 8-K and periodic report filed with the Securities and Exchange Commission, and is incorporated by reference herein. Investors should refer to and consider the incorporated information on risks and uncertainties in addition to the information presented here. Investors should consider non- GAAP financial measures in addition to, and not as a substitute for, financial measures prepared in accordance with GAAP. The company, except as required by law, undertakes no obligation to update or revise its forward- looking statements whether as a result of new developments or otherwise. 21 |
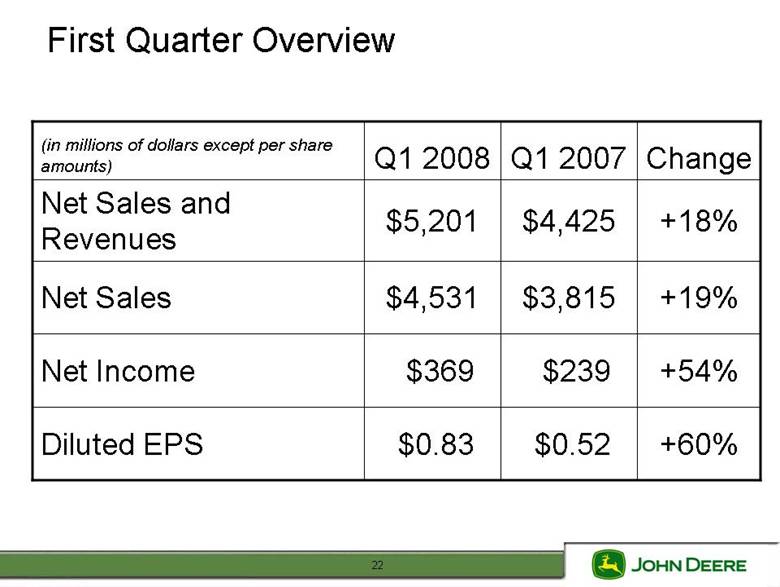
| First Quarter Overview (in millions of dollars except per share amounts) Q1 2008 Q1 2007 Change Net Sales and Revenues $5,201 $4,425 +18% Net Sales $4,531 $3,815 +19% Net Income $369 $239 +54% Diluted EPS $0.83 $0.52 +60% 22 |
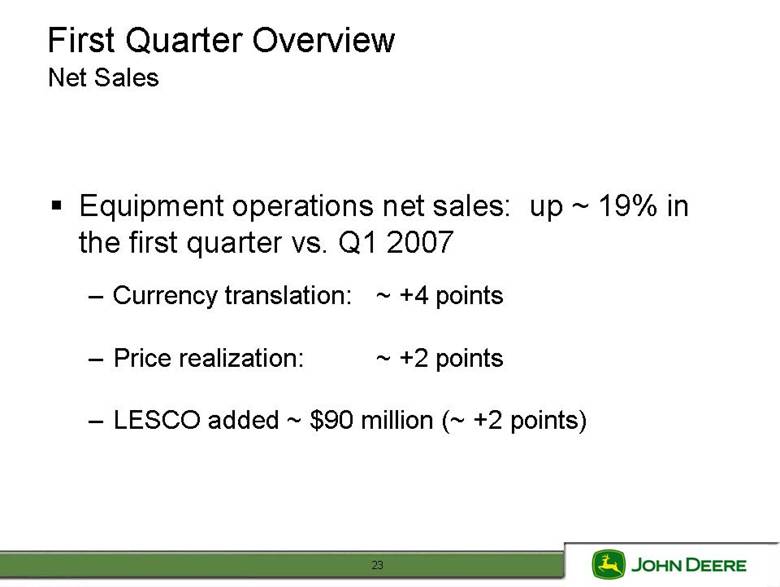
| First Quarter Overview Net Sales • Equipment operations net sales: up ~ 19% in the first quarter vs. Q1 2007 – Currency translation: ~ +4 points – Price realization: ~ +2 points – LESCO added ~ $90 million (~ +2 points) 23 |
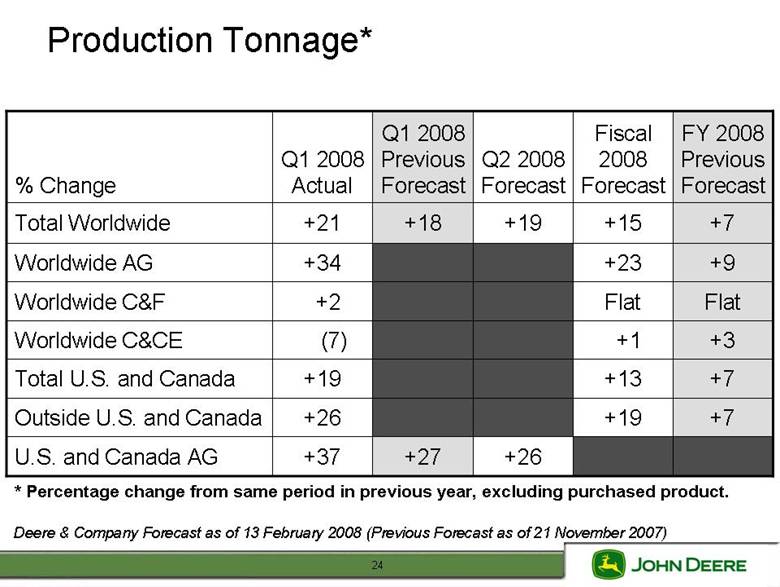
| Production Tonnage* % Change Q1 2008 Actual Q1 2008 Previous Forecast Q2 2008 Forecast Fiscal 2008 Forecast FY 2008 Previous Forecast Total Worldwide +21 +18 +19 +15 +7 Worldwide AG +34 +23 +9 Worldwide C&F +2 Flat Flat Worldwide C&CE (7) +1 +3 Total U.S. and Canada +19 +13 +7 Outside U.S. and Canada +26 +19 +7 U.S. and Canada AG +37 +27 +26 * Percentage change from same period in previous year, excluding purchased product. i) 24 Deere & Company Forecast as of 13 February 2008 (Prevous Forecast as of 21 November 2007 |
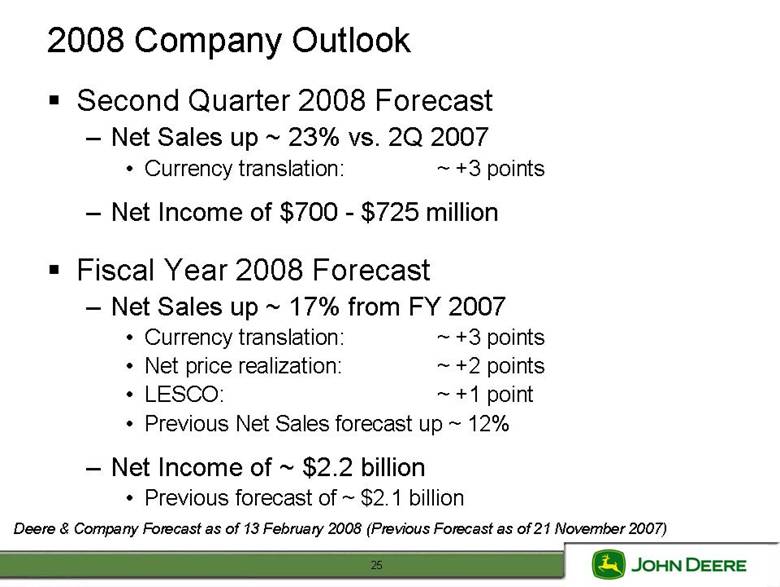
| 2008 Company Outlook • Second Quarter 2008 Forecast – Net Sales up ~ 23% vs. 2Q 2007 • Currency translation: ~ +3 points – Net Income of $700 -$725 million • Fiscal Year 2008 Forecast – Net Sales up ~ 17% from FY 2007 • Currency translation: ~ +3 points • Net price realization: ~ +2 points • LESCO: ~ +1 point • Previous Net Sales forecast up ~ 12% – Net Income of ~ $2.2 billion • Previous forecast of ~ $2.1 billion i) 25 Deere & Company Forecast as of 13 February 2008 (Prevous Forecast as of 21 November 2007 |
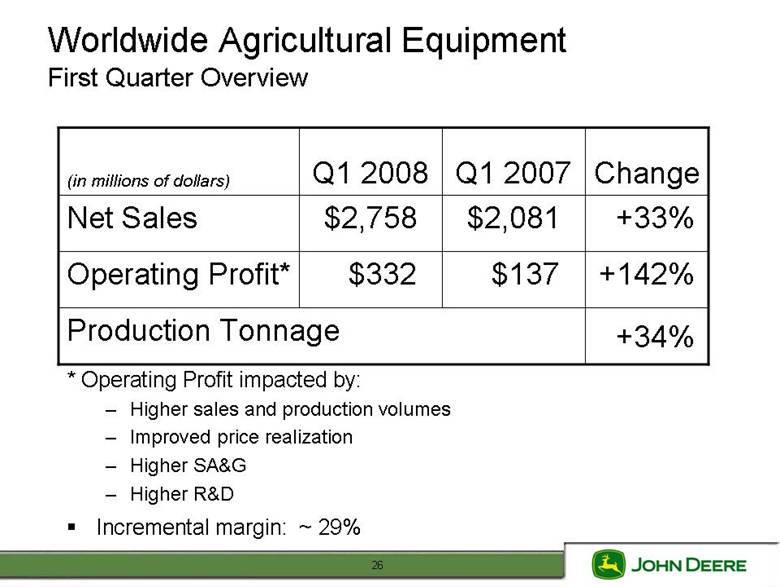
| Worldwide Agricultural Equipment First Quarter Overview (in millions of dollars) Q1 2008 Q1 2007 Change Net Sales $2,758 $2,081 +33% Operating Profit* $332 $137 +142% Production Tonnage +34% * Operating Profit impacted by: – Higher sales and production volumes – Improved price realization – Higher SA&G – Higher R&D • l i26 Incrementamargn: ~ 29% |
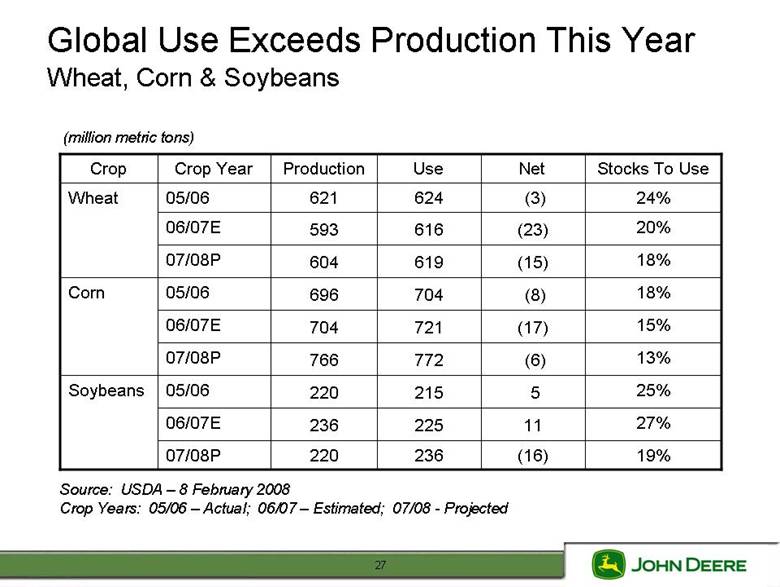
| Global Use Exceeds Production This Year Wheat, Corn & Soybeans (million metric tons) Crop Crop Year Production Use Net Stocks To Use Wheat 05/06 621 624 (3) 24% 06/07E 593 616 (23) 20% 07/08P 604 619 (15) 18% Corn 05/06 696 704 (8) 18% 06/07E 704 721 (17) 15% 07/08P 766 772 (6) 13% Soybeans 05/06 220 215 5 25% 06/07E 236 225 11 27% 07/08P 220 236 (16) 19% Source: USDA – 8 February 2008 Crop Years: 05/06 – Actual; 06/07 – Estimated; 07/08 -Projected 27 |
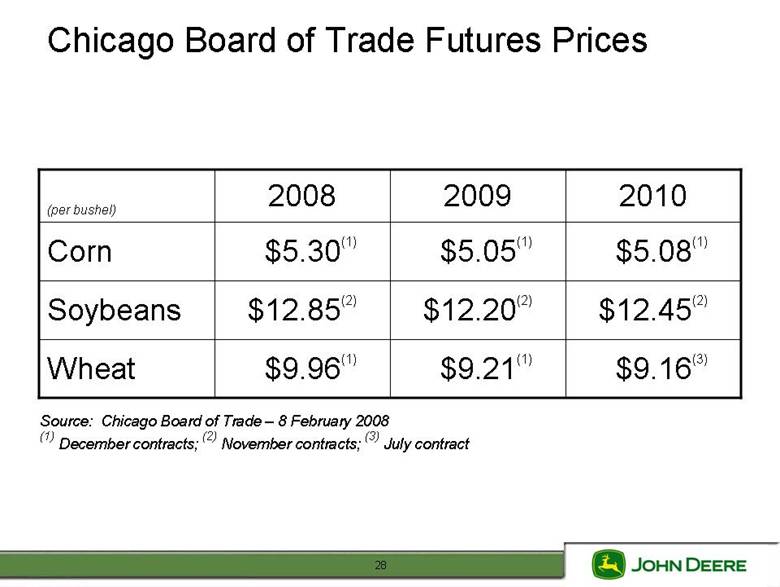
| Chicago Board of Trade Futures Prices (per b ushel) 2008 2009 2010 Corn $5.30(1) $5.05(1) $5.08(1) Soybeans $12.85(2) $12.20(2) $12.45(2) Wheat $9.96(1) $9.21(1) $9.16(3) Source: Chicago Board of Trade – 8 February 2008 ) (1) December contracts; (2November contracts; (3) July contract 28 |
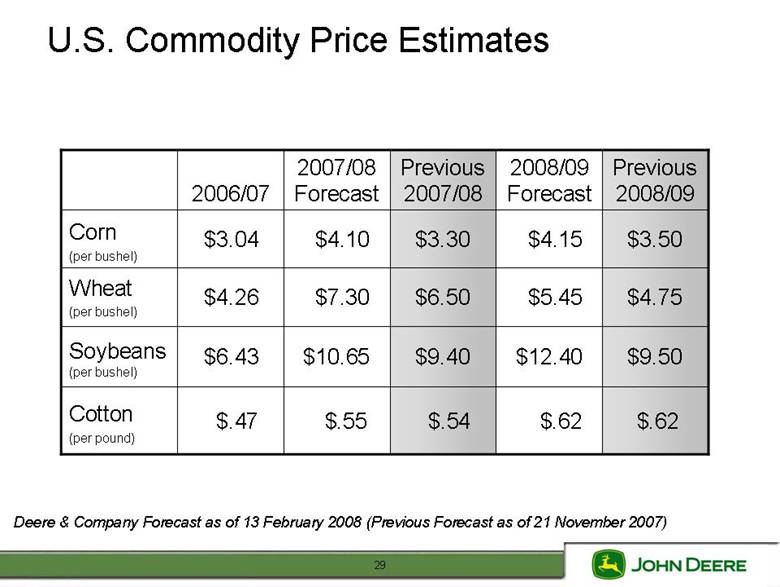
| U.S. Commodity Price Estimates 2006/07 2007/08 Forecast Previous 2007/08 2008/09 Forecast Previous 2008/09 Corn (per bushel) $3.04 $4.10 $3.30 $4.15 $3.50 Wheat (per bushel) $4.26 $7.30 $6.50 $5.45 $4.75 Soybeans (per bushel) $6.43 $10.65 $9.40 $12.40 $9.50 Cotton (per pound) $.47 $.55 $.54 $.62 $.62 ) 29 Deere & Company Forecast as of 13 February 2008 (Prev ious Forecast as of 21 November 2007 |
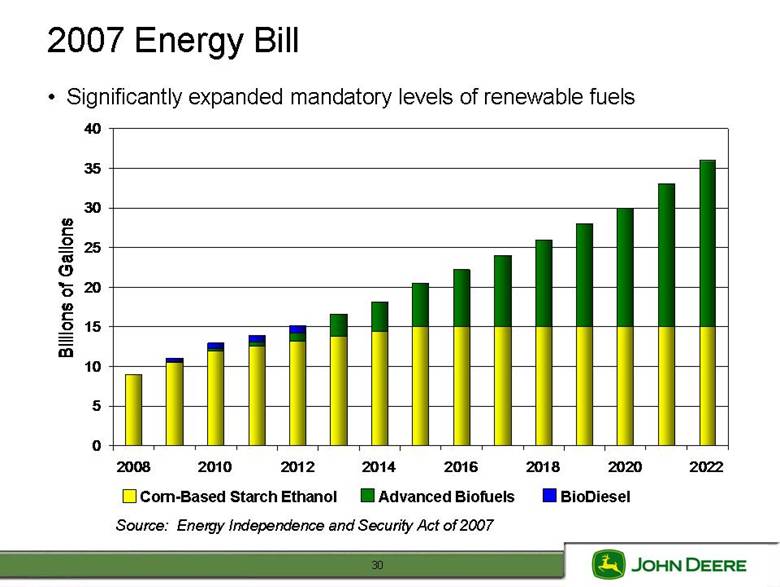
| 2007 Energy Bill • Significantly expanded mandatory levels of renewable fuels 40 35 Billions of Gallons 30 25 20 15 10 5 0 2008 2010 2012 2014 2016 2018 2020 2022 Corn-Based Starch Ethanol Advanced Biofuels BioDiesel i30 Source: Energy Independence and Securty Act of 2007 |
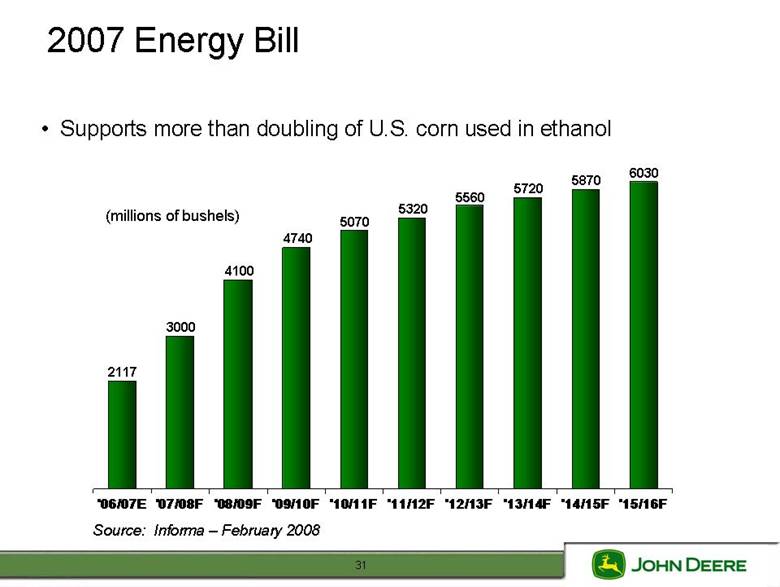
| 2007 Energy Bill • Supports more than doubling of U.S. corn used in ethanol 5870 5720 5560 (millions of bushels) 5320 5070 4740 4100 3000 2117 '06/07E '07/08F '08/09F '09/10F '10/11F '11/12F '12/13F '13/14F '14/15F '15/16F 31 Source: Informa – February 2008 |
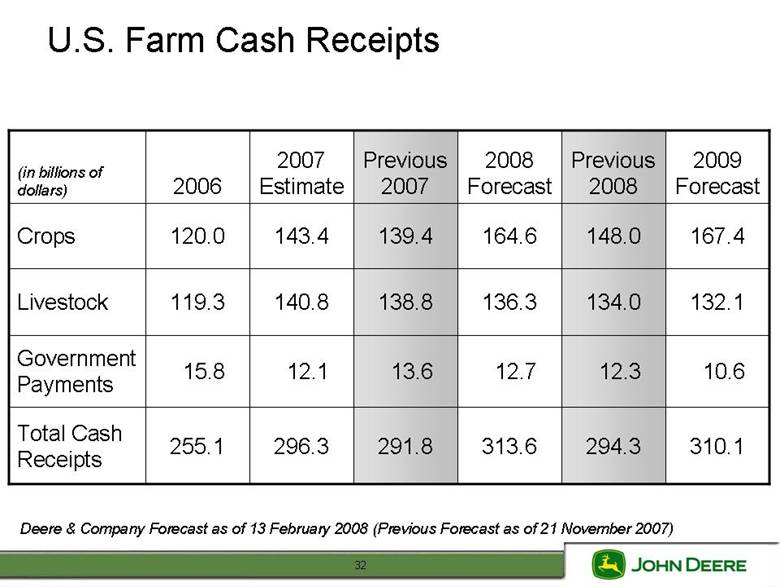
| U.S. Farm Cash Receipts (in billions of dollars) 2006 2007 Estimate Previous 2007 2008 Forecast Previous 2008 2009 Forecast Crops 120.0 143.4 139.4 164.6 148.0 167.4 Livestock 119.3 140.8 138.8 136.3 134.0 132.1 Government Payments 15.8 12.1 13.6 12.7 12.3 10.6 Total Cash Receipts 255.1 296.3 291.8 313.6 294.3 310.1 i) 32 Deere & Company Forecast as of 13 February 2008 (Prevous Forecast as of 21 November 2007 |
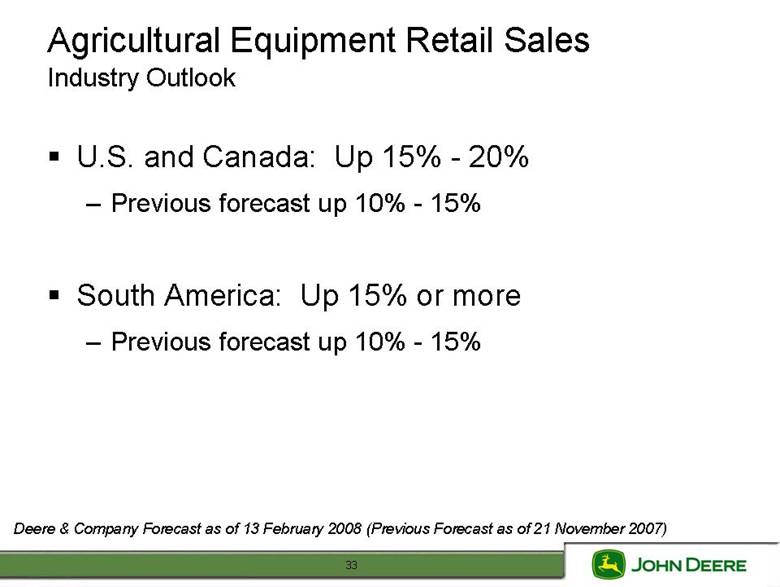
| Agricultural Equipment Retail Sales Industry Outlook • U.S. and Canada: Up 15% -20% – Previous forecast up 10% -15% • South America: Up 15% or more – Previous forecast up 10% -15% i) 33 Deere & Company Forecast as of 13 February 2008 (Prevous Forecast as of 21 November 2007 |
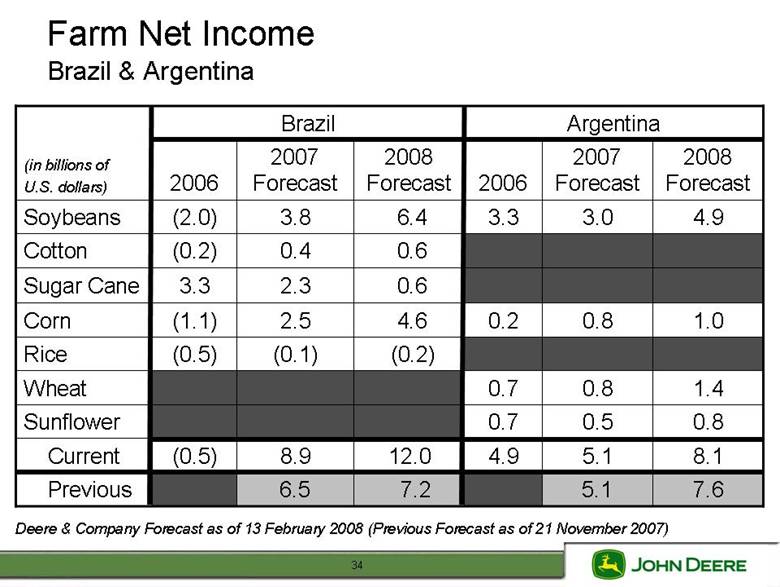
| Farm Net Income Brazil & Argentina (in billions of U.S. dollars) Brazil Argentina 2006 2007 Forecast 2008 Forecast 2006 2007 Forecast 2008 Forecast Soybeans (2.0) 3.8 6.4 3.3 3.0 4.9 Cotton (0.2) 0.4 0.6 Sugar Cane 3.3 2.3 0.6 Corn (1.1) 2.5 4.6 0.2 0.8 1.0 Rice (0.5) (0.1) (0.2) Wheat 0.7 0.8 1.4 Sunflower 0.7 0.5 0.8 Current (0.5) 8.9 12.0 4.9 5.1 8.1 Previous 6.5 7.2 5.1 7.6 i) 34 Deere & Company Forecast as of 13 February 2008 (Prevous Forecast as of 21 November 2007 |
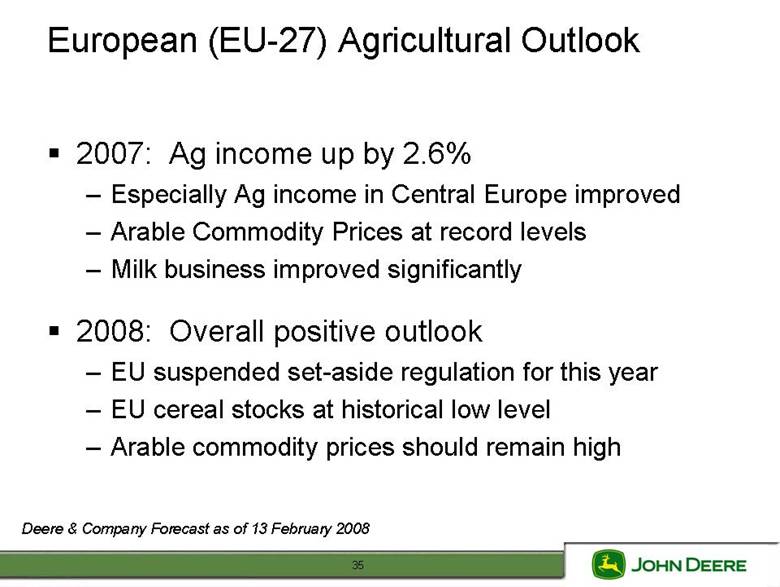
| European (EU-27) Agricultural Outlook • 2007: Ag income up by 2.6% – Especially Ag income in Central Europe improved – Arable Commodity Prices at record levels – Milk business improved significantly • 2008: Overall positive outlook – EU suspended set-aside regulation for this year – EU cereal stocks at historical low level – Arable commodity prices should remain high 35 Deere & Company Forecast as of 13 February 2008 |
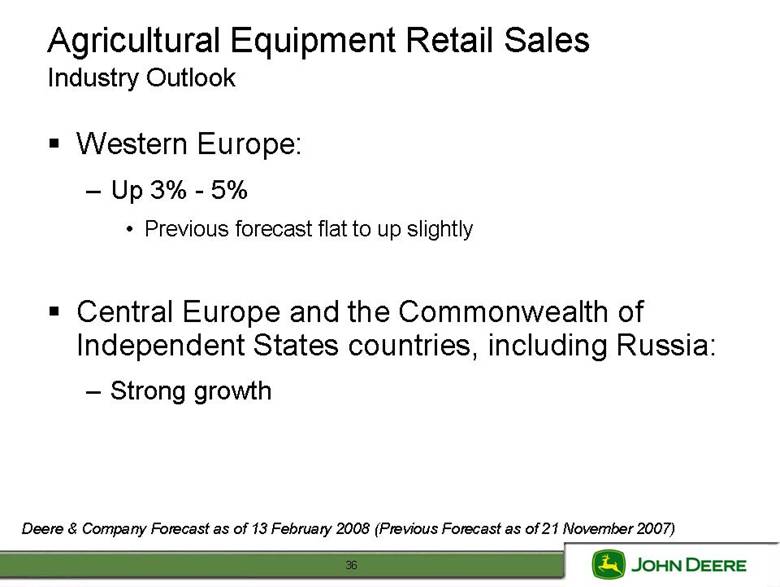
| Agricultural Equipment Retail Sales Industry Outlook • Western Europe: –Up 3% -5% • Previous forecast flat to up slightly • Central Europe and the Commonwealth of Independent States countries, including Russia: – Strong growth i) 36 Deere & Company Forecast as of 13 February 2008 (Prevous Forecast as of 21 November 2007 |
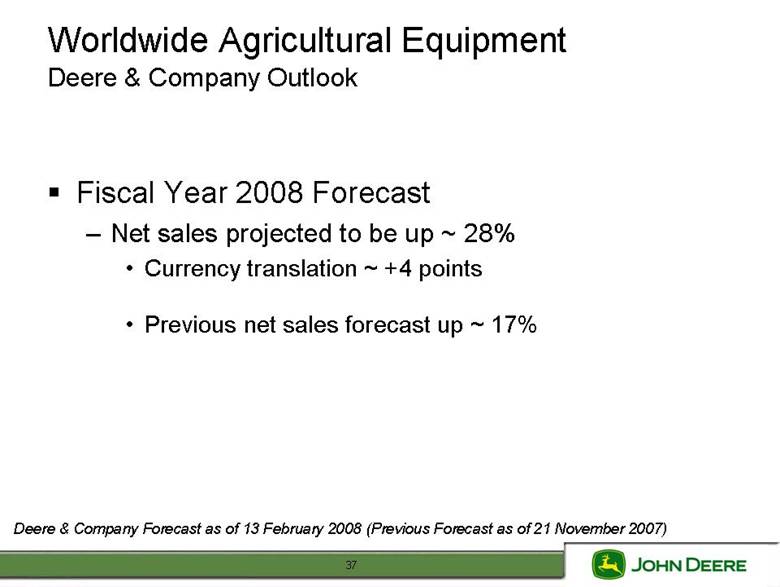
| Worldwide Agricultural Equipment Deere & Company Outlook • Fiscal Year 2008 Forecast – Net sales projected to be up ~ 28% • Currency translation ~ +4 points • Previous net sales forecast up ~ 17% i) 37 Deere & Company Forecast as of 13 February 2008 (Prevous Forecast as of 21 November 2007 |
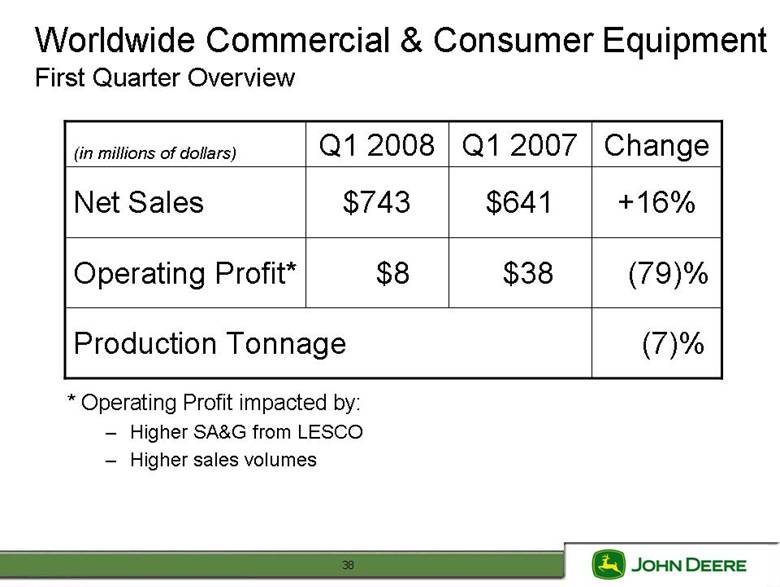
| Worldwide Commercial & Consumer Equipment First Quarter Overview (in millions of dollars) Q1 2008 Q1 2007 Change Net Sales $743 $641 +16% Operating Profit* $8 $38 (79)% Production Tonnage (7)% * Operating Profit impacted by: – Higher SA&G from LESCO – Higher sales volumes 38 |
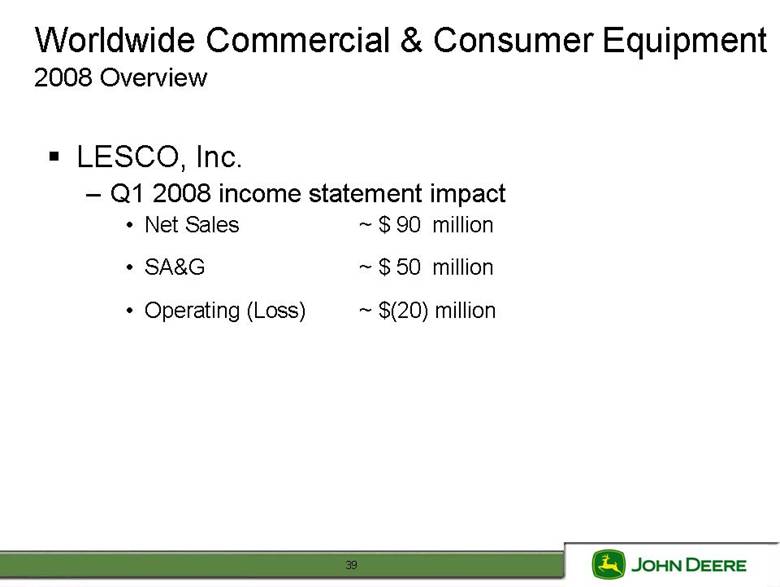
| Worldwide Commercial & Consumer Equipment 2008 Overview • LESCO, Inc. – Q1 2008 income statement impact • Net Sales ~ $ 90 million • SA&G ~ $ 50 million • Operating (Loss) ~ $(20) million 39 |
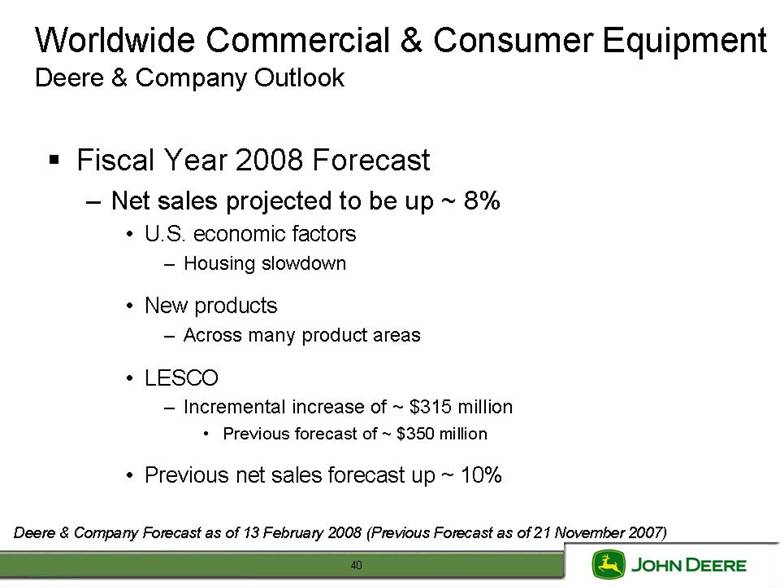
| Worldwide Commercial & Consumer Equipment Deere & Company Outlook • Fiscal Year 2008 Forecast – Net sales projected to be up ~ 8% • U.S. economic factors – Housing slowdown • New products – Across many product areas • LESCO – Incremental increase of ~ $315 million • Previous forecast of ~ $350 million • Previous net sales forecast up ~ 10% i) 40 Deere & Company Forecast as of 13 February 2008 (Prevous Forecast as of 21 November 2007 |
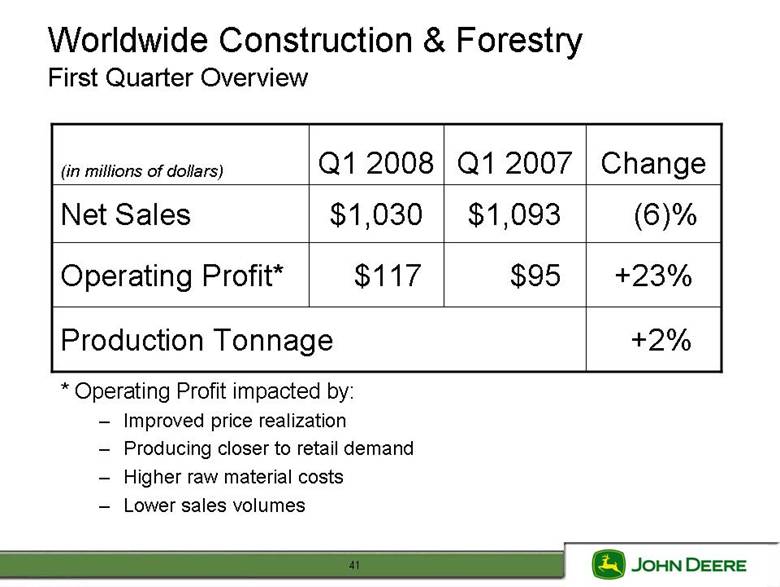
| Worldwide Construction & Forestry First Quarter Overview (in millions of dollars) Q1 2008 Q1 2007 Change Net Sales $1,030 $1,093 (6)% Operating Profit* $117 $95 +23% Production Tonnage +2% * Operating Profit impacted by: – Improved price realization – Producing closer to retail demand – Higher raw material costs – Lower sales volumes 41 |
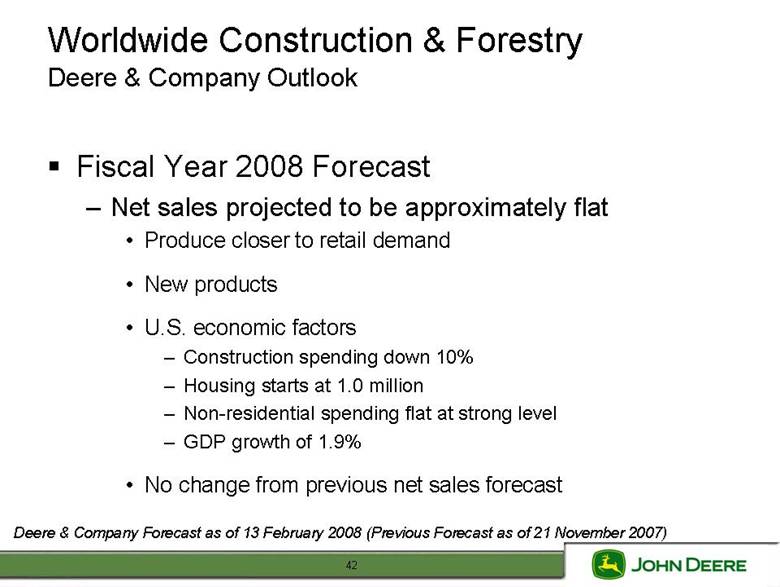
| Worldwide Construction & Forestry Deere & Company Outlook • Fiscal Year 2008 Forecast – Net sales projected to be approximately flat • Produce closer to retail demand • New products • U.S. economic factors – Construction spending down 10% – Housing starts at 1.0 million – Non-residential spending flat at strong level – GDP growth of 1.9% • No change from previous net sales forecast i) 42 Deere & Company Forecast as of 13 February 2008 (Prevous Forecast as of 21 November 2007 |
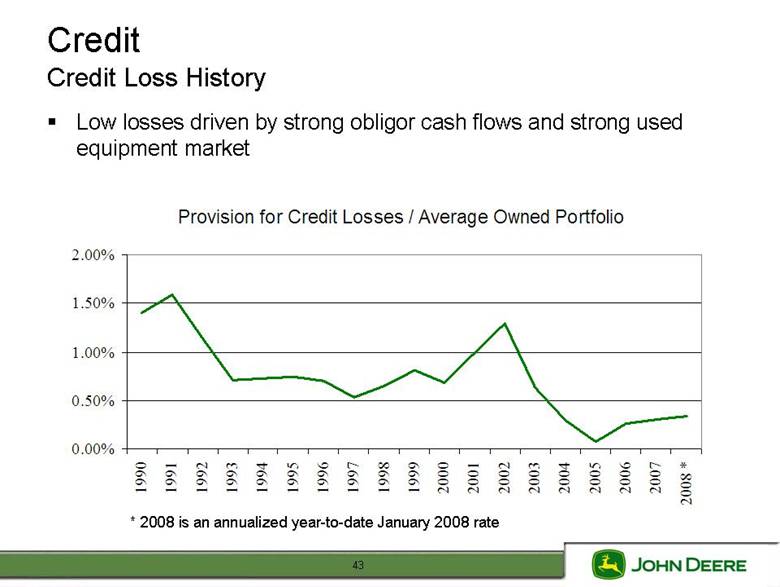
| Credit Credit Loss History • Low losses driven by strong obligor cash flows and strong used equipment market Provision for Credit Losses / Average Owned Portfolio 2.00% 1.50% 1.00% 0.50% 0.00% 199019911992199319941995199619971998199920002001200220032004200520062007 2008 * * 2008 is an annuali 43 zed year-to-date January 2008 rate |
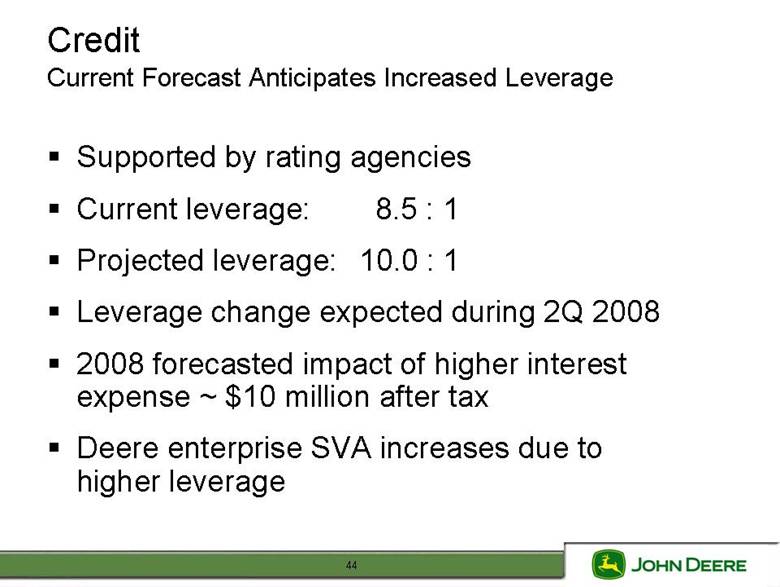
| Credit Current Forecast Anticipates Increased Leverage • Supported by rating agencies • Current leverage: 8.5 : 1 • Projected leverage: 10.0 : 1 • Leverage change expected during 2Q 2008 • 2008 forecasted impact of higher interest expense ~ $10 million after tax • Deere enterprise SVA increases due to higher leverage 44 |
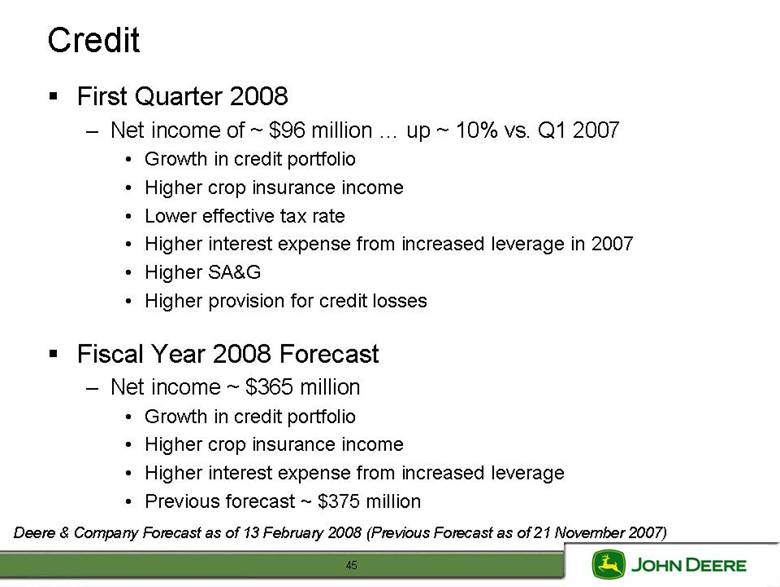
| Credit • First Quarter 2008 – Net income of ~ $96 million up ~ 10% vs. Q1 2007 • Growth in credit portfolio • Higher crop insurance income • Lower effective tax rate • Higher interest expense from increased leverage in 2007 • Higher SA&G • Higher provision for credit losses • Fiscal Year 2008 Forecast – Net income ~ $365 million • Growth in credit portfolio • Higher crop insurance income • Higher interest expense from increased leverage • Previous forecast ~ $375 million i) 45 Deere & Company Forecast as of 13 February 2008 (Prevous Forecast as of 21 November 2007 |
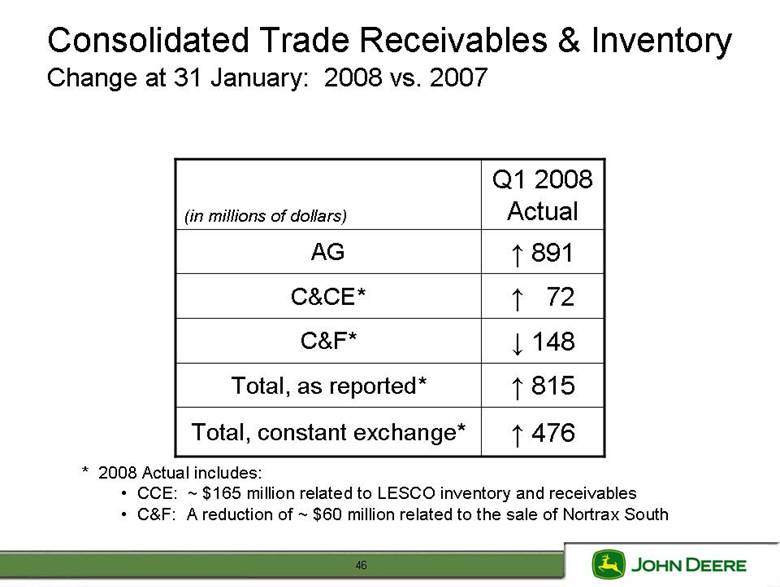
| Consolidated Trade Receivables & Inventory Change at 31 January: 2008 vs. 2007 (in millions of dollars) Q1 2008 Actual AG 891 C&CE* 72 C&F* 148 Total, as reported* 815 Total, constant exchange* 476 * 2008 Actual includes: • CCE: ~ $165 million related to LESCO inventory and receivables • C&F: A reduction of ~ $60 million related to the sale of Nortrax South 46 |
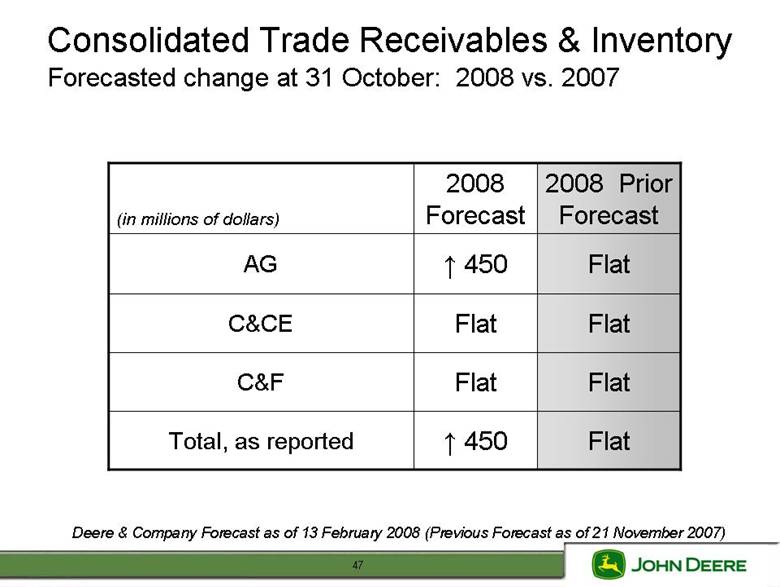
| Consolidated Trade Receivables & Inventory Forecasted change at 31 October: 2008 vs. 2007 (in millions of dollars) 2008 Forecast 2008 Prior Forecast AG . 450 Flat C&CE Flat Flat C&F Flat Flat Total, as reported . 450 Flat i) 47 Deere & Company Forecast as of 13 February 2008 (Prevous Forecast as of 21 November 2007 |
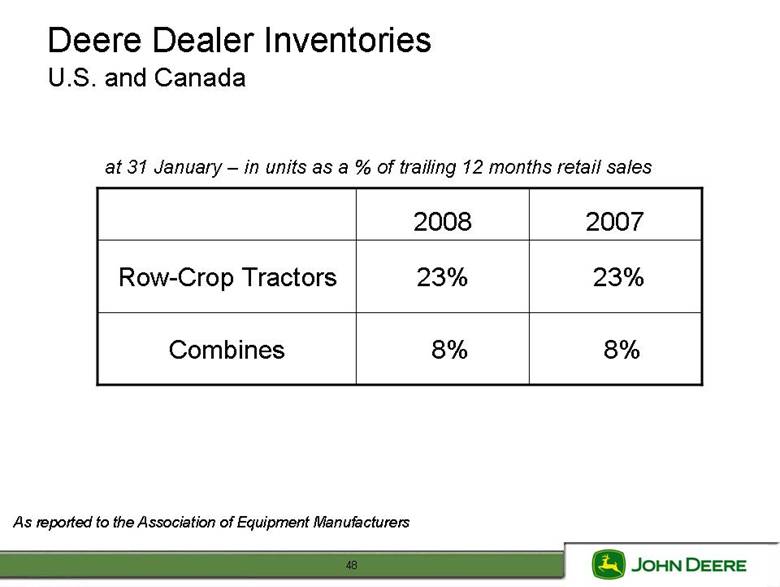
| Deere Dealer Inventories U.S. and Canada at 31 January – in units as a % of trailing 12 months retail sales 2008 2007 Row-Crop Tractors 23% 23% Combines 8% 8% iati 48 As reported to the Assocon of Equipment Manufacturers |
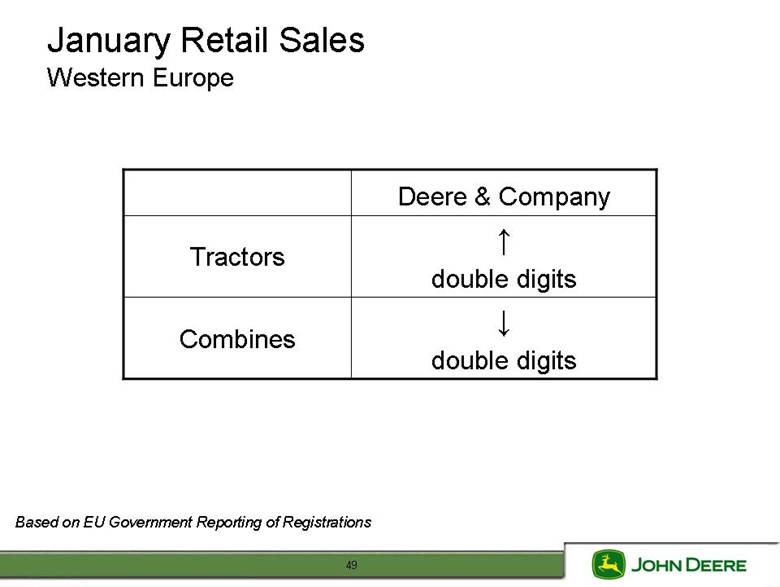
| January Retail Sales Western Europe Deere & Company Tractors . double digits Combines . double digits iions 49 Based on EU Government Reportng of Registrat |
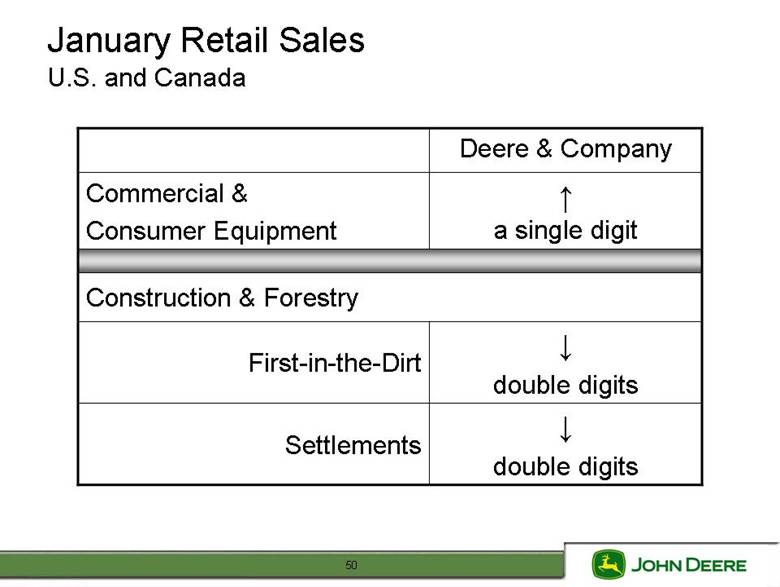
| January Retail Sales U.S. and Canada Deere & Company Commercial & Consumer Equipment a single digit Construction & Forestry Firstin- the-Dirt double digits Settlements double digits 50 |
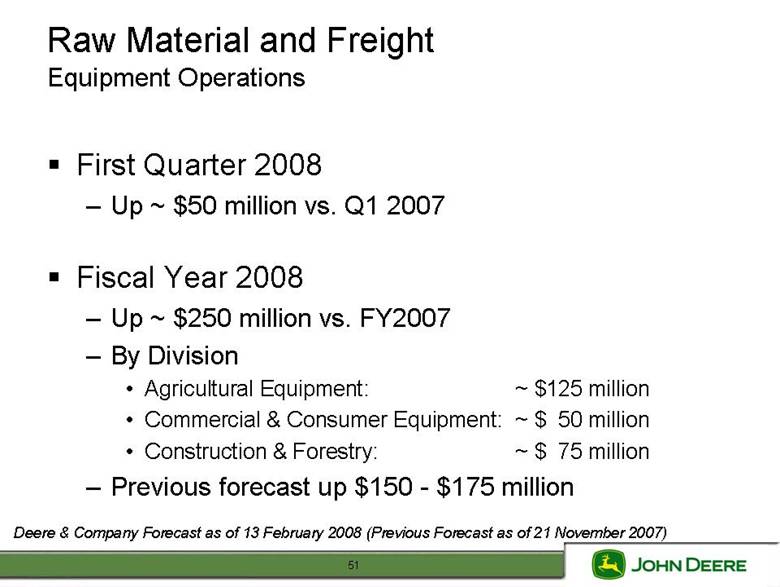
| Raw Material and Freight Equipment Operations • First Quarter 2008 – Up ~ $50 million vs. Q1 2007 • Fiscal Year 2008 – Up ~ $250 million vs. FY2007 – By Division • Agricultural Equipment: ~ $125 million • Commercial & Consumer Equipment: ~ $ 50 million • Construction & Forestry: ~ $ 75 million – Previous forecast up $150 -$175 million i) 51 Deere & Company Forecast as of 13 February 2008 (Prevous Forecast as of 21 November 2007 |
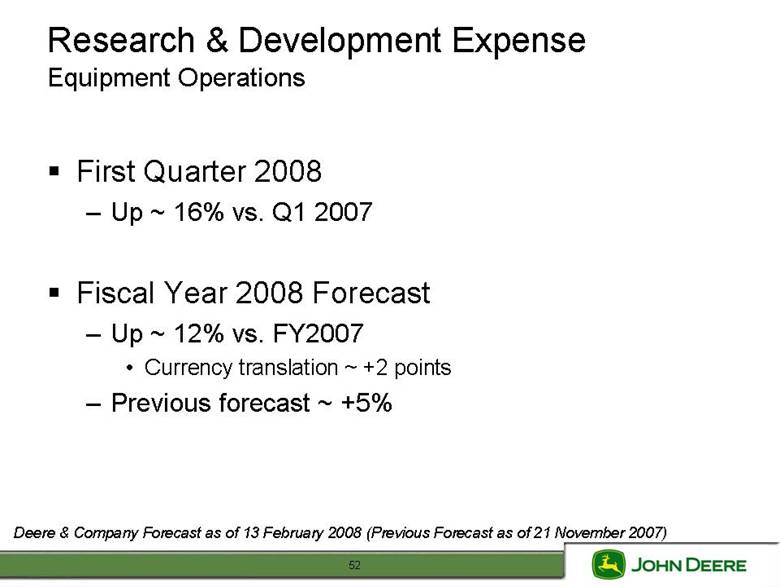
| Research & Development Expense Equipment Operations • First Quarter 2008 – Up ~ 16% vs. Q1 2007 • Fiscal Year 2008 Forecast – Up ~ 12% vs. FY2007 • Currency translation ~ +2 points – Previous forecast ~ +5% i) 52 Deere & Company Forecast as of 13 February 2008 (Prevous Forecast as of 21 November 2007 |
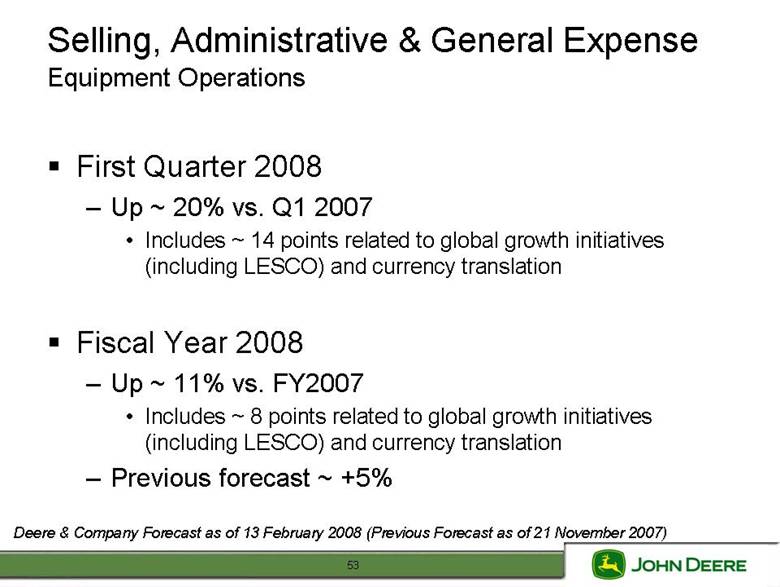
| Selling, Administrative & General Expense Equipment Operations • First Quarter 2008 – Up ~ 20% vs. Q1 2007 • Includes ~ 14 points related to global growth initiatives (including LESCO) and currency translation • Fiscal Year 2008 – Up ~ 11% vs. FY2007 • Includes ~ 8 points related to global growth initiatives (including LESCO) and currency translation – Previous forecast ~ +5% i) 53 Deere & Company Forecast as of 13 February 2008 (Prevous Forecast as of 21 November 2007 |
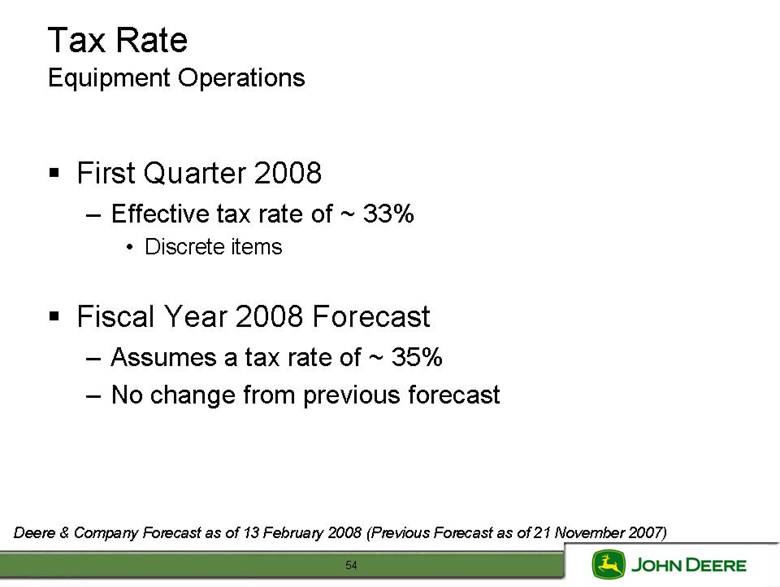
| Tax Rate Equipment Operations • First Quarter 2008 – Effective tax rate of ~ 33% • Discrete items • Fiscal Year 2008 Forecast – Assumes a tax rate of ~ 35% – No change from previous forecast i) 54 Deere & Company Forecast as of 13 February 2008 (Prevous Forecast as of 21 November 2007 |
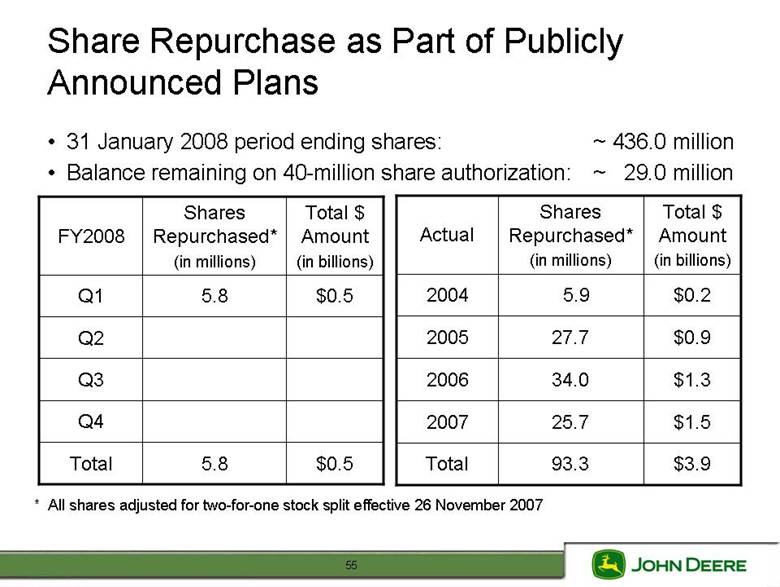
| Share Repurchase as Part of Publicly Announced Plans • 31 January 2008 period ending shares: ~ 436.0 million • Balance remaining on 40-million share authorization: ~ 29.0 million FY2008 Shares Repurchased* (in millions) Total $ Amount (in billions) Q1 5.8 $0.5 Q2 Q3 Q4 Total 5.8 $0.5 Actual Shares Repurchased* (in millions) Total $ Amount (in billions) 2004 5.9 $0.2 2005 27.7 $0.9 2006 34.0 $1.3 2007 25.7 $1.5 Total 93.3 $3.9 * All shares adjusted for two-for-one stock split effective 26 November 2007 55 |
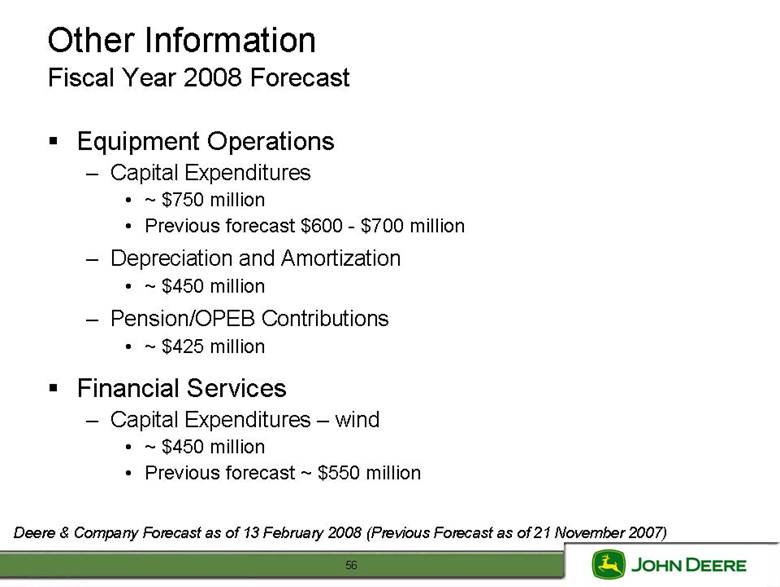
| Other Information Fiscal Year 2008 Forecast • Equipment Operations – Capital Expenditures • ~ $750 million • Previous forecast $600 -$700 million – Depreciation and Amortization • ~ $450 million – Pension/OPEB Contributions • ~ $425 million • Financial Services – Capital Expenditures – wind • ~ $450 million • Previous forecast ~ $550 million i) 56 Deere & Company Forecast as of 13 February 2008 (Prevous Forecast as of 21 November 2007 |
| Appendix 57 |

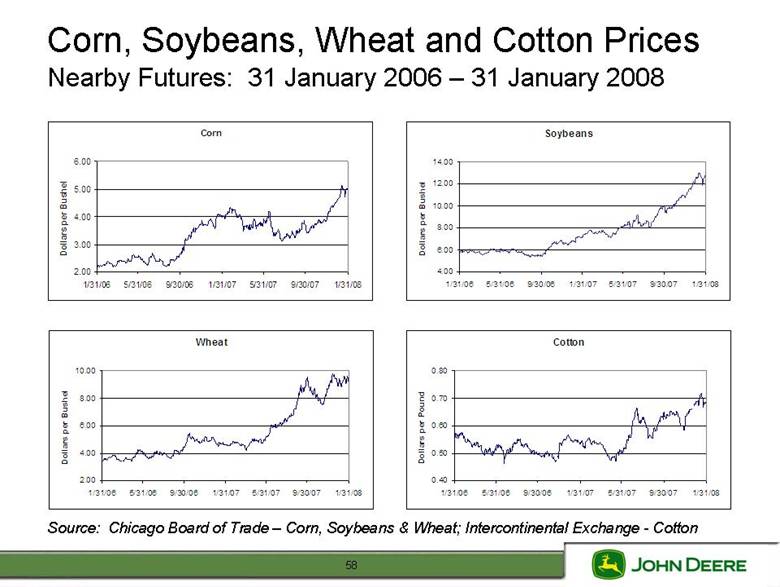
| Corn, Soybeans, Wheat and Cotton Prices Nearby Futures: 31 January 2006 – 31 January 2008 /5//06 1 /5//1/ Corn 2.0 0 3.0 0 4.0 0 5.0 0 6.0 0 1/31 06 319/ 30/06 31/ 07 31/07 9/3007 31/08 Dollars per Bushel /5//06 9 //5//1/ Soybeans 4. 00 6. 00 8. 00 10.0 0 12.0 0 14.0 0 1/3 106 31 30/ 06 1/3 107 3 1/07 9/30 07 31/0 8 Dollars per Bushel /5//06 9 //5//1/ i;il/5 //1//1/ 58 Wheat 2. 00 4. 00 6. 00 8. 00 10.0 0 1/3 106 31 30/ 06 1/3 107 3 1/07 9/30 07 31/0 8 Dollars per Bushel Source: Chcago Board of Trade – Corn, Soybeans & Wheat Intercontnenta Exchange -Cotton Cotton 0. 40 0. 50 0. 60 0. 70 0. 80 1/3 106 31/ 06 9/3 006 3 1/07 5/31/ 07 9/3 007 31/0 8 Dollars per Pound |
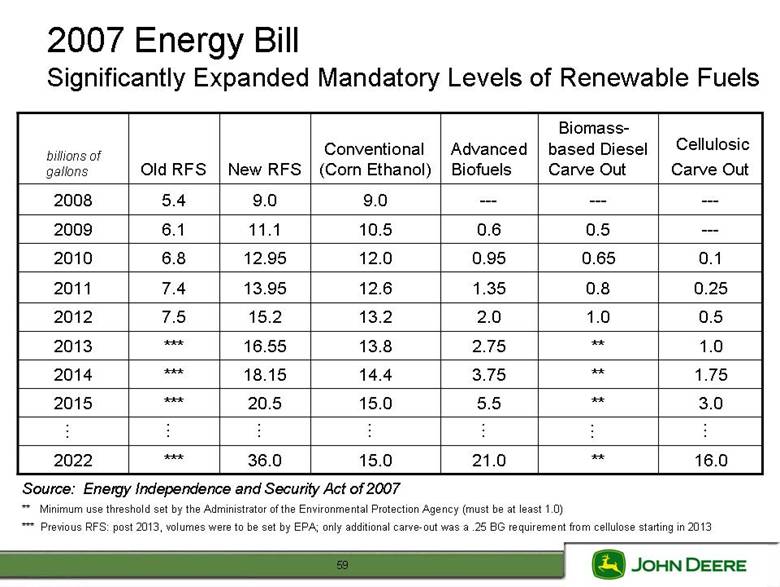
| 2007 Energy Bill Significantly Expanded Mandatory Levels of Renewable Fuels billions of gallons Old RFS New RFS Conventional (Corn Ethanol) Advanced Biofuels Biomassbased Diesel Carve Out Cellulosic Carve Out 2008 5.4 9.0 9.0 2009 6.1 11.1 10.5 0.6 0.5 2010 6.8 12.95 12.0 0.95 0.65 0.1 2011 7.4 13.95 12.6 1.35 0.8 0.25 2012 7.5 15.2 13.2 2.0 1.0 0.5 2013 *** 16.55 13.8 2.75 ** 1.0 2014 *** 18.15 14.4 3.75 ** 1.75 2015 *** 20.5 15.0 5.5 ** 3.0 2022 *** 36.0 15.0 21.0 ** 16.0 Source: Energy Independence and Security Act of 2007 ** Minimum use threshold set by the Administrator of the Environmental Protection Agency (must be atleast 1.0) *** il; litilillul i59 Prevous RFS: post 2013, voumes were to be set by EPAony addona carve-out was a .25 BG requrement from ceose startingn 2013 |
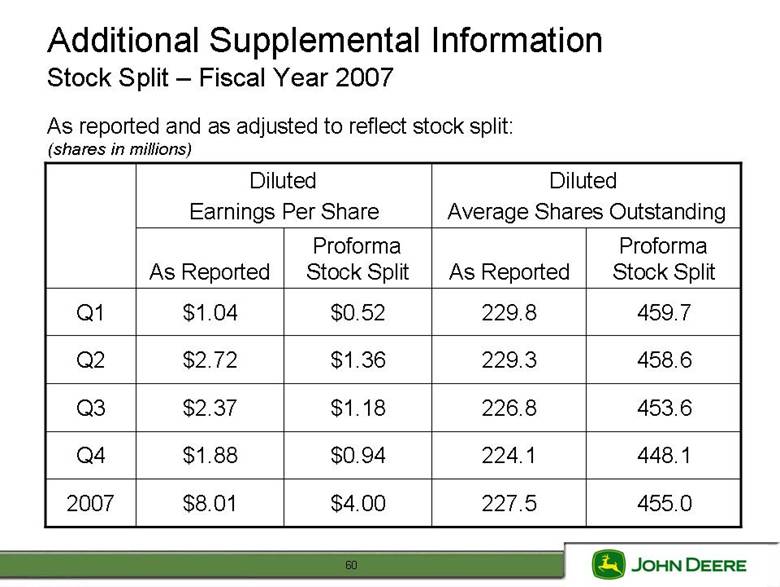
| Additional Supplemental Information Stock Split – Fiscal Year 2007 As reported and as adjusted to reflect stock split: (shares in millions) 2007 Q4 Q3 Q2 Q1 litlit ii60 455.0 227.5 $4.00 $8.01 448.1 224.1 $0.94 $1.88 453.6 226.8 $1.18 $2.37 458.6 229.3 $1.36 $2.72 459.7 229.8 $0.52 $1.04 Proforma Stock SpAs Reported Proforma Stock SpAs Reported Diluted Average Shares Outstandng Diluted Earnngs Per Share |
| Deere’s second-quarter 2008 conference call is scheduled for 9:00 a.m. central time on Wednesday, May 14, 2008 61 |