| Safe Harbor Statement & Disclosures The earnings call and accompanying material include forward-looking comments and information concerning the company’s projections, plans and objectives for the future, including estimates and assumptions with respect to economic, political, technological, weather, market acceptance and other factors that impact our businesses and customers. They also may include financial measures that are not in conformance with GAAP (accounting principles generally accepted in the United States of America). Words such as “forecast,” “projection,” “outlook,” “prospects,” “expected,” “estimated,” “will,” “plan,” “anticipate,” “intend,” “believe,” or other similar words or phrases often identify forward-looking statements. Actual results may differ materially from those projected in these forward-looking statements based on a number of factors and uncertainties. Additional information concerning factors that could cause actual results to differ materially is contained in the company’s most recent Form 8-K and periodic report filed with the Securities and Exchange Commission, and is incorporated by reference herein. Investors should refer to and consider the incorporated information on risks and uncertainties in addition to the information presented here. Investors should consider non-GAAP financial measures in addition to, and not as a substitute for, financial measures prepared in accordance with GAAP. The company, except as required by law, undertakes no obligation to update or revise its forward-looking statements whether as a result of new developments or otherwise. The call and accompanying materials are not an offer to sell or a solicitation of offers to buy any of the company’s securities. 24 |
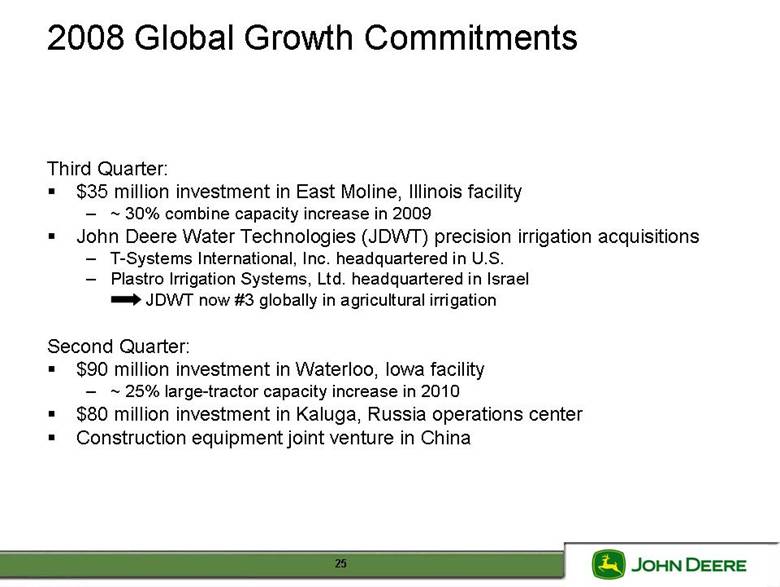
| 2008 Global Growth Commitments Third Quarter: $35 million investment in East Moline, Illinois facility – ~ 30% combine capacity increase in 2009 John Deere Water Technologies (JDWT) precision irrigation acquisitions – T-Systems International, Inc. headquartered in U.S. – Plastro Irrigation Systems, Ltd. headquartered in Israel JDWT now #3 globally in agricultural irrigation Second Quarter: $90 million investment in Waterloo, Iowa facility – ~ 25% large-tractor capacity increase in 2010 $80 million investment in Kaluga, Russia operations center Construction equipment joint venture in China 25 |
| Third Quarter Overview +7% $537 $575 Net Income +12% $1.18 $1.32 Diluted EPS +18% $5,985 $7,070 Net Sales +17% $6,634 $7,739 Net Sales and Revenues Change Q3 2007 Q3 2008 (in millions of dollars except per share amounts) 26 |
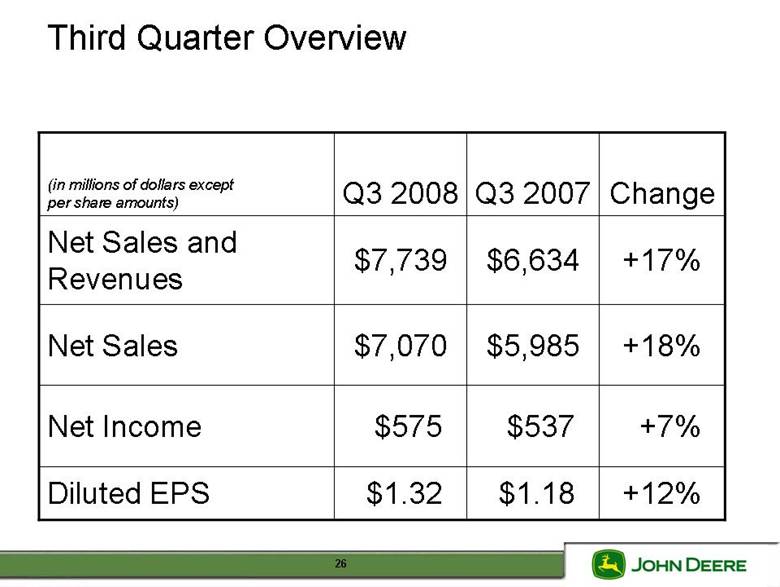
| Third Quarter Overview Net Sales Equipment operations net sales: up ~ 18% in Q3 2008 vs. Q3 2007 – Currency translation: ~ 5 points – Price realization: ~ 2 points – Acquisitions: ~ 2 points 27 |

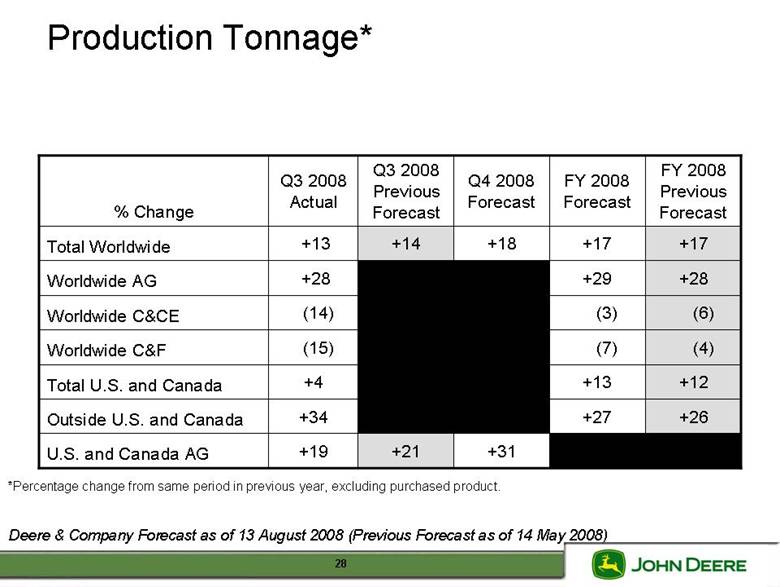
| *Percentage change from same period in previous year, excluding purchased product. Production Tonnage* (4) (7) (15) Worldwide C&F +31 +21 +19 U.S. and Canada AG +26 +27 +34 Outside U.S. and Canada +12 +13 +4 Total U.S. and Canada (6) (3) (14) Worldwide C&CE +28 +29 +28 Worldwide AG +17 +17 +18 +14 +13 Total Worldwide FY 2008 Previous Forecast FY 2008 Forecast Q4 2008 Forecast Q3 2008 Previous Forecast Q3 2008 Actual % Change Deere & Company Forecast as of 13 August 2008 (Previous Forecast as of 14 May 2008) 28 |
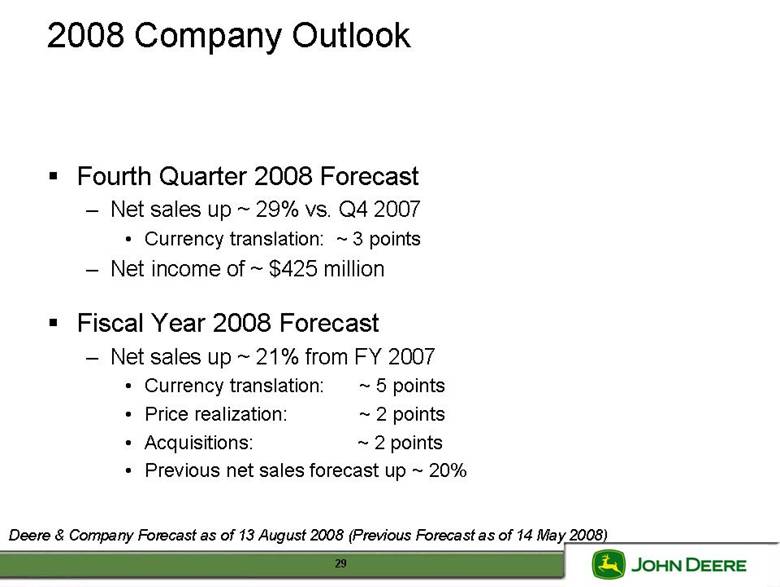
| 2008 Company Outlook Fourth Quarter 2008 Forecast – Net sales up ~ 29% vs. Q4 2007 • Currency translation: ~ 3 points – Net income of ~ $425 million Fiscal Year 2008 Forecast – Net sales up ~ 21% from FY 2007 • Currency translation: ~ 5 points • Price realization: ~ 2 points • Acquisitions: ~ 2 points • Previous net sales forecast up ~ 20% Deere & Company Forecast as of 13 August 2008 (Previous Forecast as of 14 May 2008) 29 |
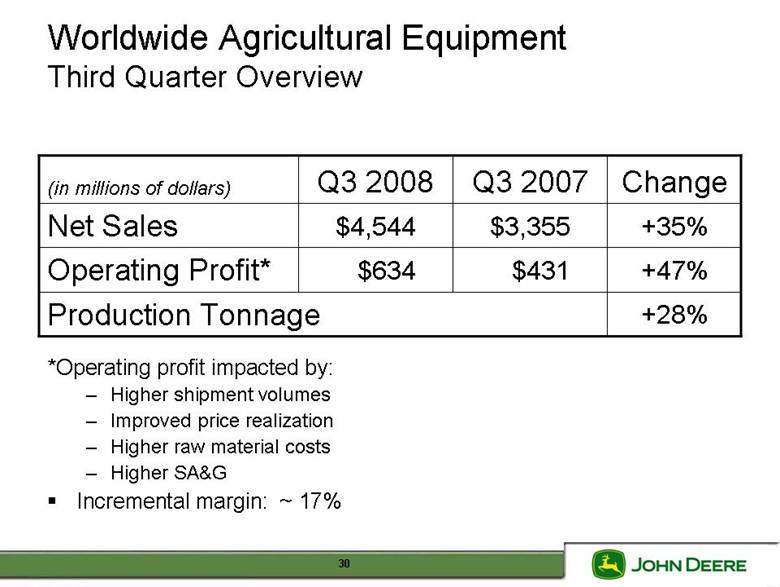
| Worldwide Agricultural Equipment Third Quarter Overview +47% $431 $634 Operating Profit* +28% Production Tonnage +35% $3,355 $4,544 Net Sales Change Q3 2007 Q3 2008 (in millions of dollars) *Operating profit impacted by: – Higher shipment volumes – Improved price realization – Higher raw material costs – Higher SA&G Incremental margin: ~ 17% 30 |
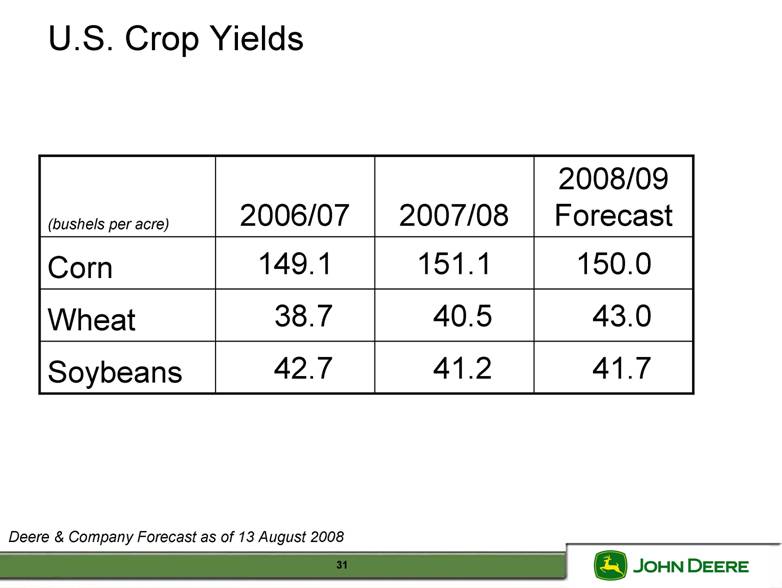
| U.S. Crop Yields Deere & Company Forecast as of 13 August 2008 41.7 41.2 42.7 Soybeans 43.0 40.5 38.7 Wheat 150.0 151.1 149.1 Corn 2008/09 Forecast 2007/08 2006/07 (bushels per acre) 31 |
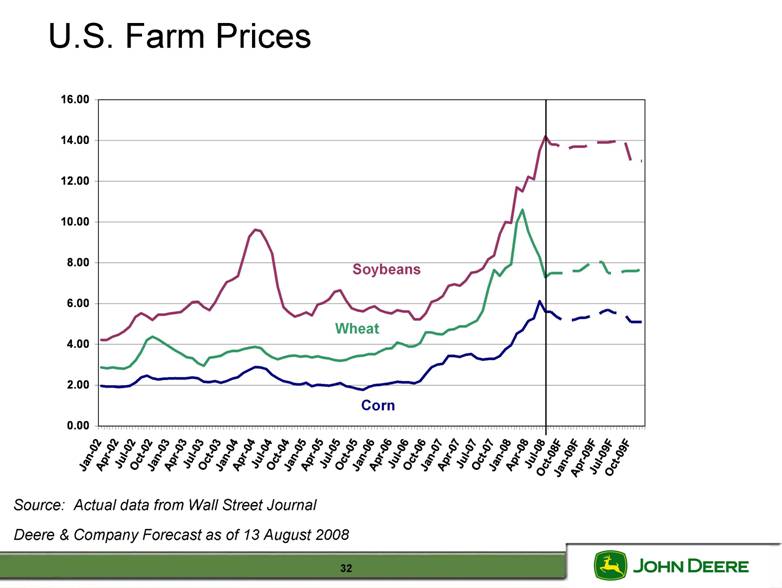
| Deere & Company Forecast as of 13 August 2008 U.S. Farm Prices 0.00 2.00 4.00 6.00 8.00 10.00 12.00 14.00 16.00 Jan -02 Apr-02 Jul-02 Oct-02 Jan -03 Apr-03 Jul-03 Oct-03 Jan -04 Apr-04 Jul-04 Oct-04 Jan -05 Apr-05 Jul-05 Oct-05 Jan -06 Apr-06 Jul-06 Oct-06 Jan -07 Apr-07 Jul-07 Oct-07 Jan -08 Apr-08 Jul-08 Oct-08F Jan-09F Apr-09F Jul-09F Oct-09F Soybeans Corn Wheat Source: Actual data from Wall Street Journal 32 |
|
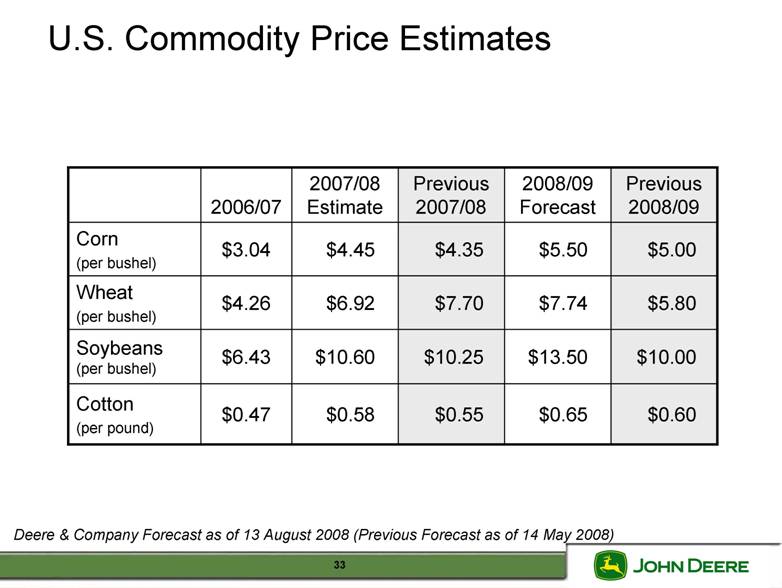
$0.60 $10.00 $5.80 $5.00 Previous 2008/09 $0.65 $13.50 $7.74 $5.50 2008/09 Forecast $0.55 $10.25 $7.70 $4.35 Previous 2007/08 $0.58 $10.60 $6.92 $4.45 2007/08 Estimate $0.47 $6.43 $4.26 $3.04 2006/07 Cotton (per pound) Soybeans (per bushel) Wheat (per bushel) Corn (per bushel) Deere & Company Forecast as of 13 August 2008 (Previous Forecast as of 14 May 2008) U.S. Commodity Price Estimates 33 |
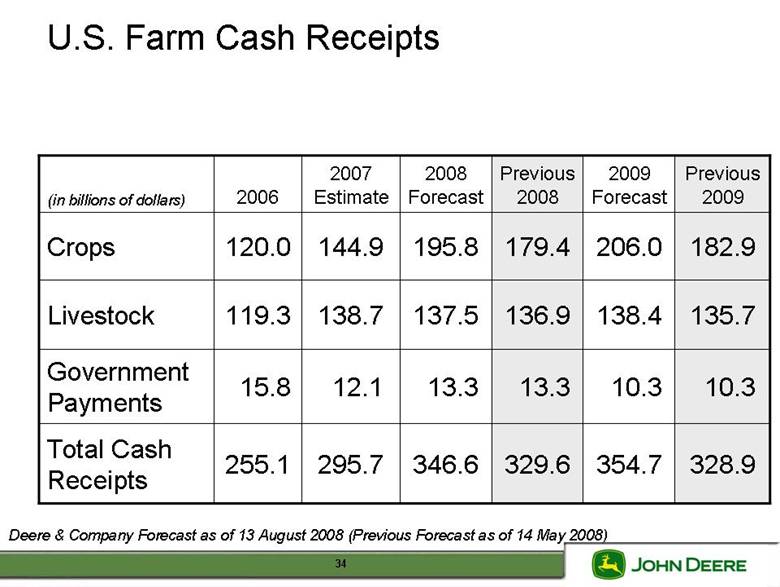
| U.S. Farm Cash Receipts 354.7 10.3 138.4 206.0 2009 Forecast 329.6 13.3 136.9 179.4 Previous 2008 328.9 10.3 135.7 182.9 Previous 2009 346.6 13.3 137.5 195.8 2008 Forecast 295.7 12.1 138.7 144.9 2007 Estimate 255.1 Total Cash Receipts 15.8 Government Payments 119.3 Livestock 120.0 Crops 2006 (in billions of dollars) Deere & Company Forecast as of 13 August 2008 (Previous Forecast as of 14 May 2008) 34 |
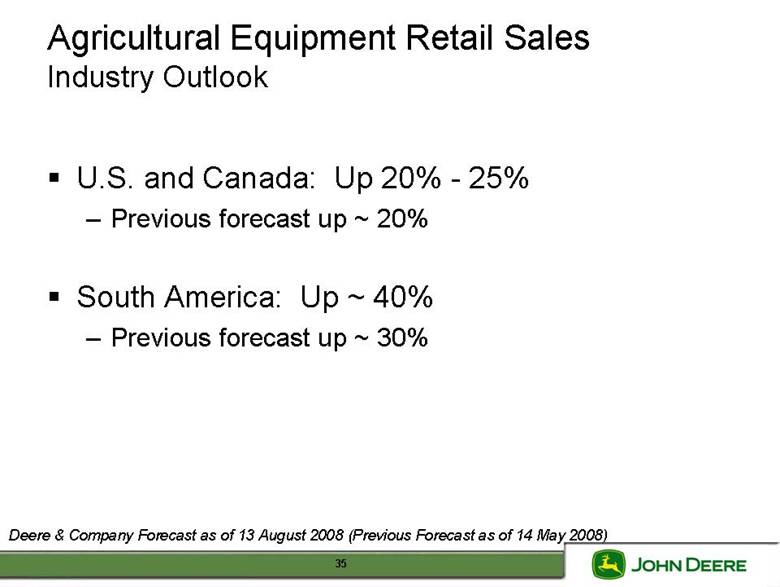
| Agricultural Equipment Retail Sales Industry Outlook U.S. and Canada: Up 20% - 25% – Previous forecast up ~ 20% South America: Up ~ 40% – Previous forecast up ~ 30% Deere & Company Forecast as of 13 August 2008 (Previous Forecast as of 14 May 2008) 35 |
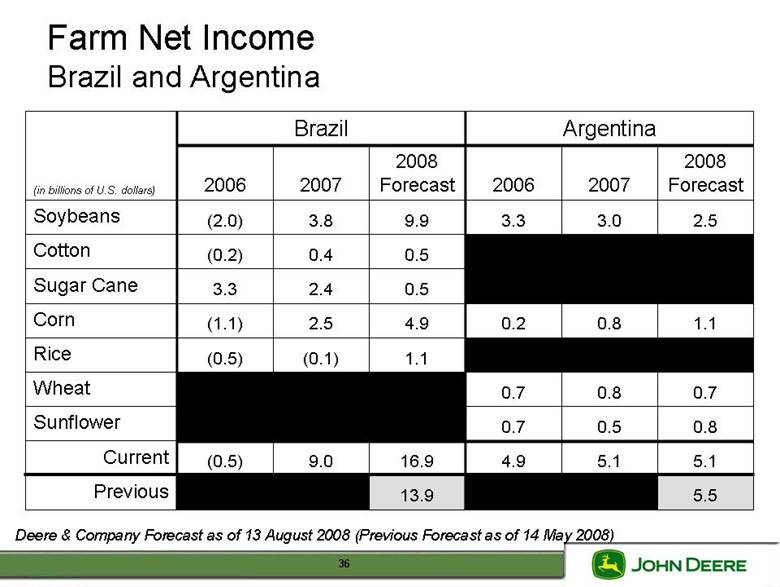
| Deere & Company Forecast as of 13 August 2008 (Previous Forecast as of 14 May 2008) Farm Net Income Brazil and Argentina 5.5 13.9 Previous 5.1 5.1 4.9 16.9 9.0 (0.5) Current 0.8 0.5 0.7 Sunflower 0.7 0.8 0.7 Wheat 1.1 (0.1) (0.5) Rice 1.1 0.8 0.2 4.9 2.5 (1.1) Corn 0.5 2.4 3.3 Sugar Cane 0.5 0.4 (0.2) Cotton 2.5 3.0 3.3 9.9 3.8 (2.0) Soybeans 2008 Forecast 2007 2006 2008 Forecast 2007 2006 Argentina Brazil (in billions of U.S. dollars) 36 |
| European (EU-27) Agricultural Update 2008 overall positive outlook – EU suspended set-aside regulation – High crop prices create hedging opportunities – Rising input costs encourage equipment and technology solutions Medium-term prospects – Improvements for pork sector – Income up in new member states – Higher degree of specialization – Slight shift to crops from livestock farming Deere & Company Forecast as of 13 August 2008 37 |
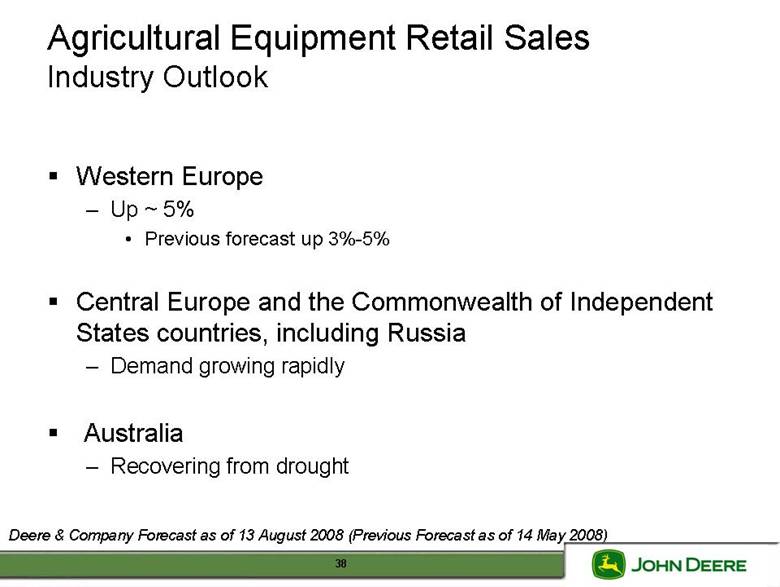
| Agricultural Equipment Retail Sales Industry Outlook Western Europe – Up ~ 5% • Previous forecast up 3%-5% Central Europe and the Commonwealth of Independent States countries, including Russia – Demand growing rapidly Australia – Recovering from drought Deere & Company Forecast as of 13 August 2008 (Previous Forecast as of 14 May 2008) 38 |
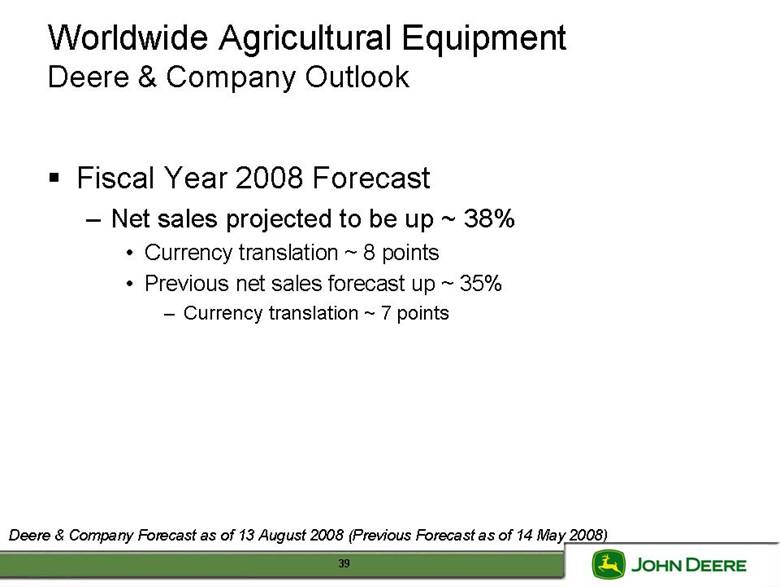
| Worldwide Agricultural Equipment Deere & Company Outlook Fiscal Year 2008 Forecast – Net sales projected to be up ~ 38% • Currency translation ~ 8 points • Previous net sales forecast up ~ 35% – Currency translation ~ 7 points Deere & Company Forecast as of 13 August 2008 (Previous Forecast as of 14 May 2008) 39 |
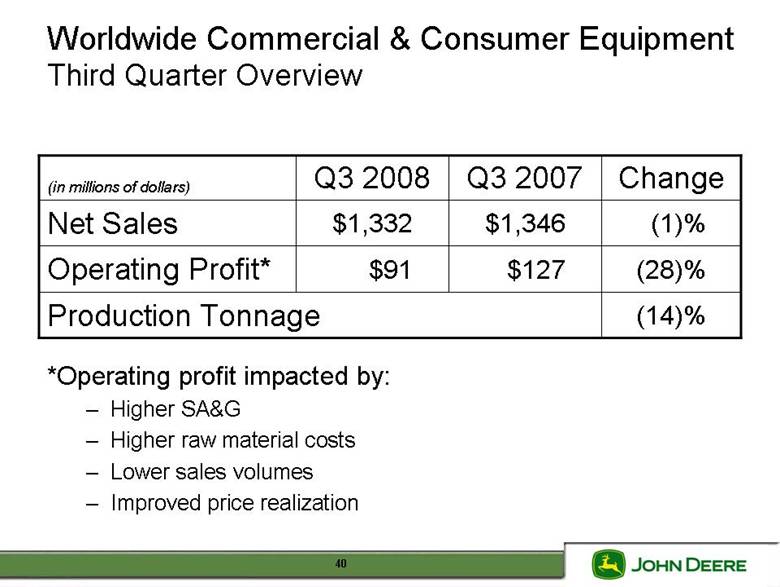
| Worldwide Commercial & Consumer Equipment Third Quarter Overview (28)% $127 $91 Operating Profit* (14)% Production Tonnage (1)% $1,346 $1,332 Net Sales Change Q3 2007 Q3 2008 (in millions of dollars) *Operating profit impacted by: – Higher SA&G – Higher raw material costs – Lower sales volumes – Improved price realization 40 |
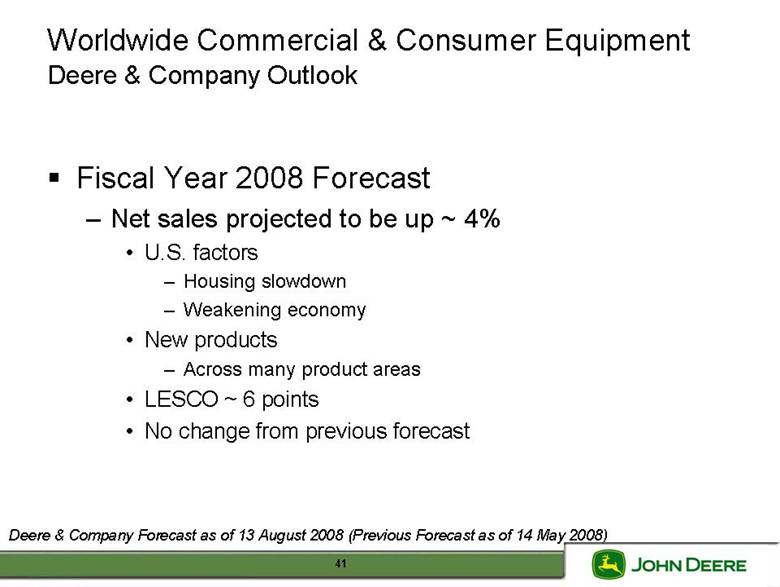
| Worldwide Commercial & Consumer Equipment Deere & Company Outlook Fiscal Year 2008 Forecast – Net sales projected to be up ~ 4% • U.S. factors – Housing slowdown – Weakening economy • New products – Across many product areas • LESCO ~ 6 points • No change from previous forecast Deere & Company Forecast as of 13 August 2008 (Previous Forecast as of 14 May 2008) 41 |
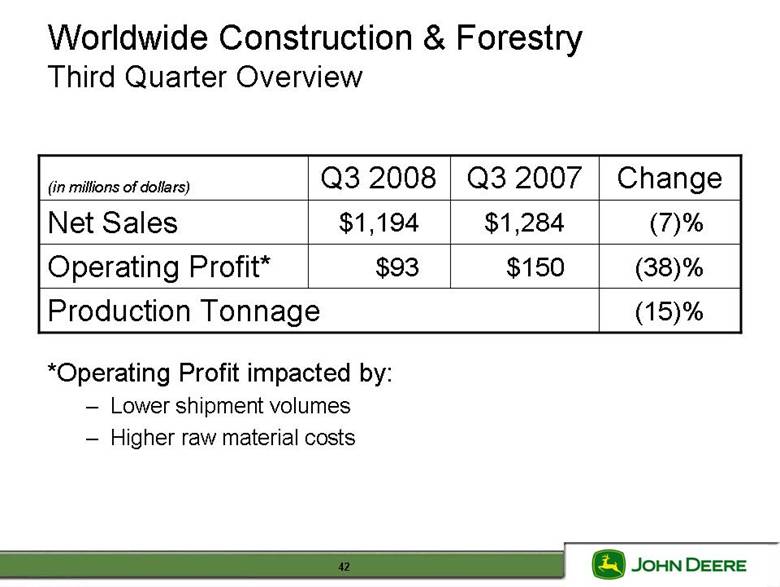
| Worldwide Construction & Forestry Third Quarter Overview (38)% $150 $93 Operating Profit* (15)% Production Tonnage (7)% $1,284 $1,194 Net Sales Change Q3 2007 Q3 2008 (in millions of dollars) *Operating Profit impacted by: – Lower shipment volumes – Higher raw material costs 42 |
| Worldwide Construction & Forestry Deere & Company Outlook Fiscal Year 2008 Forecast – Net sales projected to be down ~ 5% • U.S. economic factors – Housing starts at 0.9 million – Non-residential spending up ~ 6.7% – GDP growth of ~ 1.6% • Deere benefitting from – Higher sales outside the U.S. and Canada – New products – Producing closer to retail demand • Previous net sales forecast down ~ 3% Deere & Company Forecast as of 13 August 2008 (Previous Forecast as of 14 May 2008) 43 |
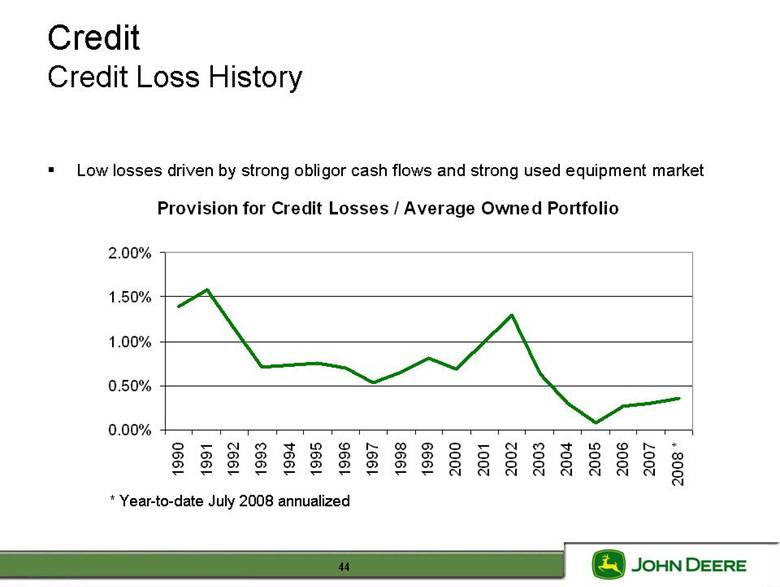
| Provision for Credit Losses / Average Owned Portfolio 0.00% 0.50% 1.00% 1.50% 2.00% 1990 1991 1992 1993 1994 1995 1996 1997 1998 1999 2000 2001 2002 2003 2004 2005 2006 2007 2008 * Credit Credit Loss History Low losses driven by strong obligor cash flows and strong used equipment market * Year-to-date July 2008 annualized 44 |
| Credit Third Quarter 2008 – Net income of ~ $80 million • Higher SA&G • Increase in leverage • Increase in the provision for credit losses • Lower income from receivable sales • Growth in credit portfolio • Higher commissions from crop insurance Fiscal Year 2008 Forecast – Net income of ~ $335 million • Previous forecast ~ $350 million Deere & Company Forecast as of 13 August 2008 (Previous Forecast as of 14 May 2008) 45 |
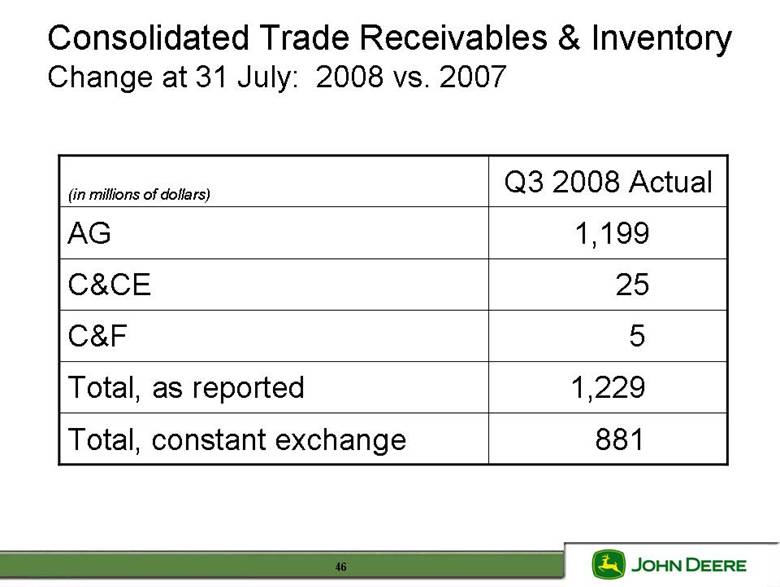
| Consolidated Trade Receivables & Inventory Change at 31 July: 2008 vs. 2007 881 Total, constant exchange 1,229 Total, as reported C&F C&CE AG (in millions of dollars) 5 25 1,199 Q3 2008 Actual 46 |
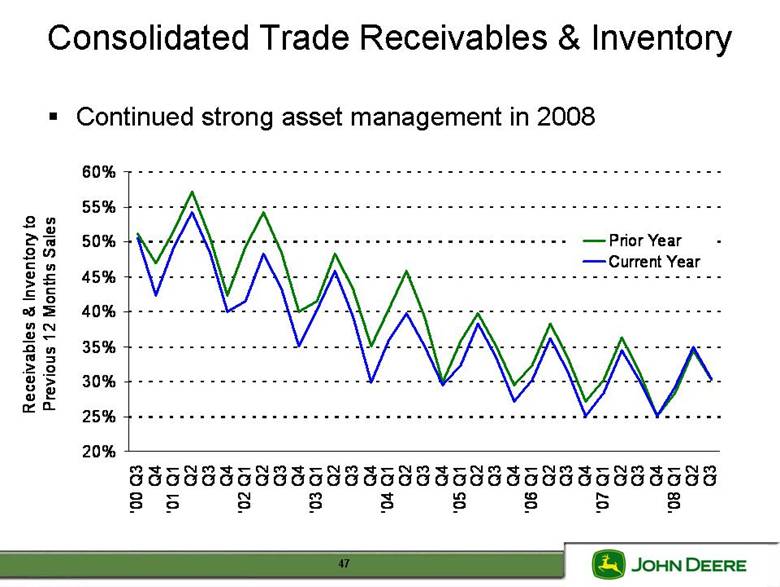
| 20% 25% 30% 35% 40% 45% 50% 55% 60% ‘00 Q3 Q4 '01 Q1 Q2 Q3 Q4 ‘02 Q1 Q2 Q3 Q4 ‘03 Q1 Q2 Q3 Q4 ‘04 Q1 Q2 Q3 Q4 ‘05 Q1 Q2 Q3 Q4 ‘06 Q1 Q2 Q3 Q4 ‘07 Q1 Q2 Q3 Q4 ‘08 Q1 Q2 Q3 Receivables & Inventory to Previous 12 Months Sales Prior Year Current Year Consolidated Trade Receivables & Inventory Continued strong asset management in 2008 47 |
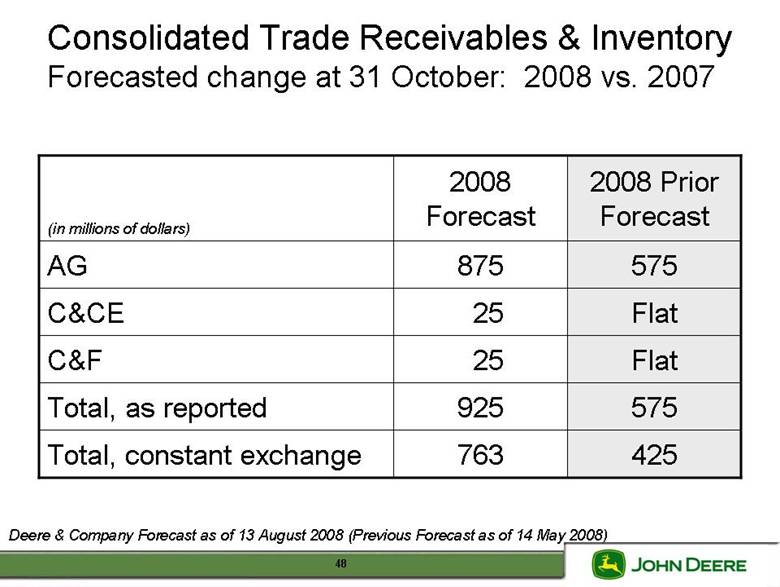
| 425 763 Total, constant exchange 575 925 Total, as reported Flat Flat 575 2008 Prior Forecast 25 25 875 2008 Forecast C&F C&CE AG (in millions of dollars) Consolidated Trade Receivables & Inventory Forecasted change at 31 October: 2008 vs. 2007 Deere & Company Forecast as of 13 August 2008 (Previous Forecast as of 14 May 2008) 48 |
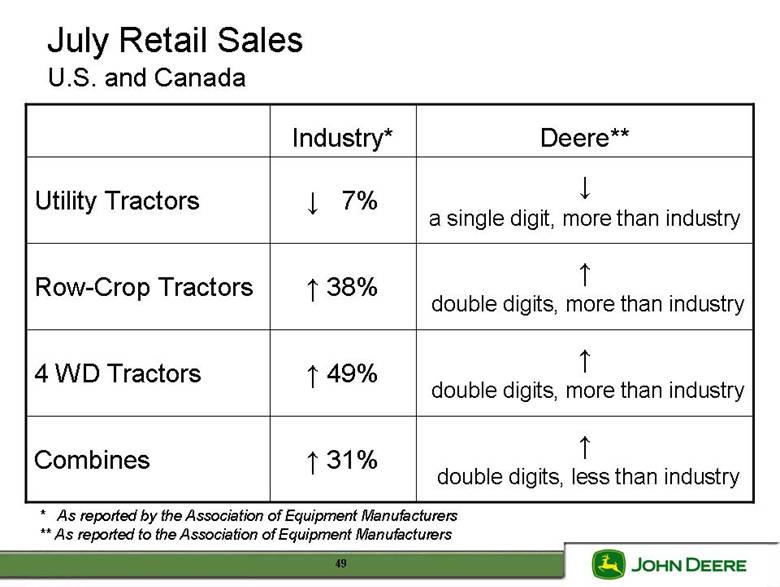
| . double digits, less than industry . double digits, more than industry . double digits, more than industry . a single digit, more than industry Deere** . 49% 4 WD Tractors . 31% Combines . 38% . 7% Industry* Row-Crop Tractors Utility Tractors * As reported by the Association of Equipment Manufacturers ** As reported to the Association of Equipment Manufacturers July Retail Sales U.S. and Canada 49 |
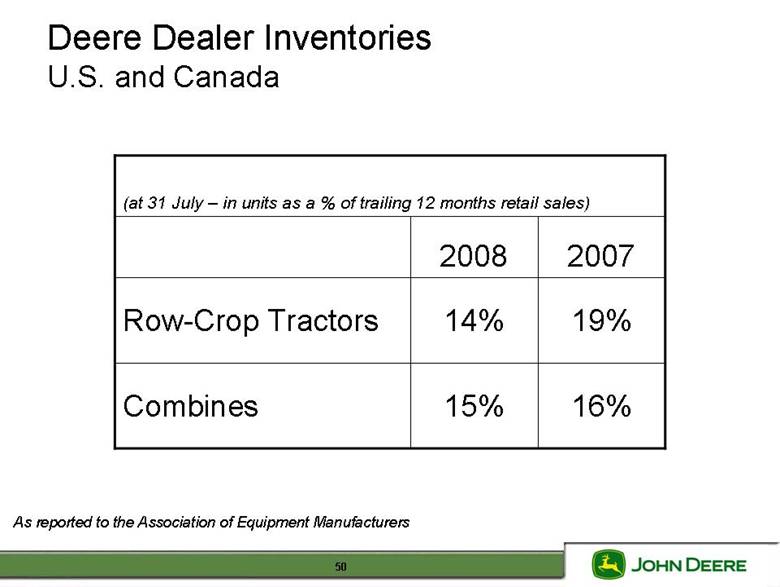
| (at 31 July – in units as a % of trailing 12 months retail sales) 2007 2008 16% 15% Combines 14% 19% Row-Crop Tractors As reported to the Association of Equipment Manufacturers Deere Dealer Inventories U.S. and Canada 50 |
| July 2008 Retail Sales Western Europe . triple digits . a single digit Deere & Company Combines Tractors Based on EU Government Reporting of Registrations 51 |

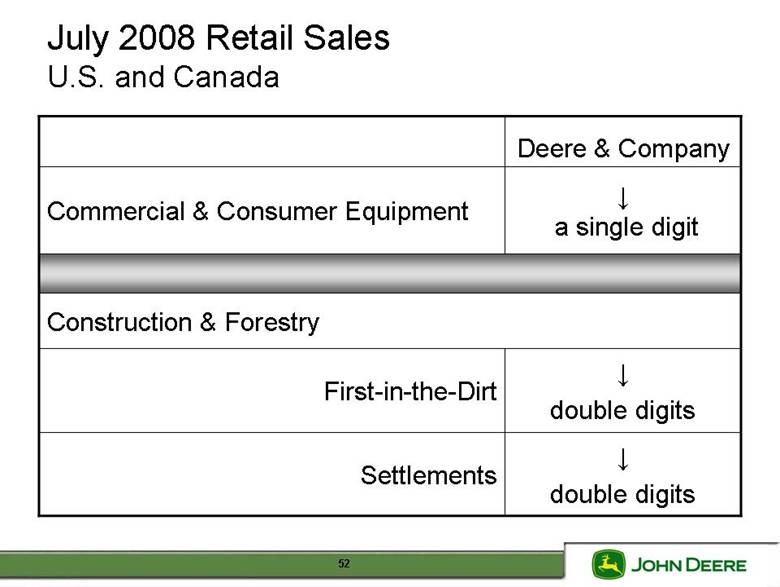
| . double digits First-in-the-Dirt . double digits Settlements Construction & Forestry . a single digit Commercial & Consumer Equipment Deere & Company July 2008 Retail Sales U.S. and Canada 52 |
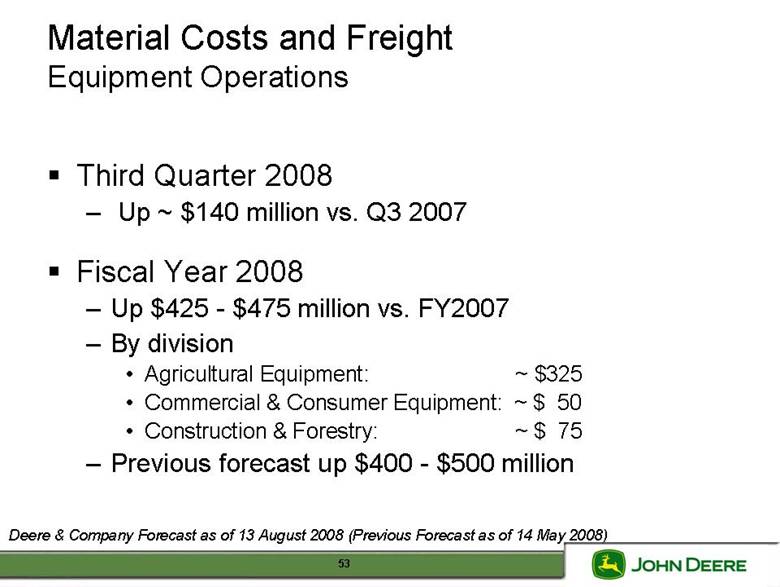
| Material Costs and Freight Equipment Operations Third Quarter 2008 – Up ~ $140 million vs. Q3 2007 Fiscal Year 2008 – Up $425 - $475 million vs. FY2007 – By division • Agricultural Equipment: ~ $325 • Commercial & Consumer Equipment: ~ $ 50 • Construction & Forestry: ~ $ 75 – Previous forecast up $400 - $500 million Deere & Company Forecast as of 13 August 2008 (Previous Forecast as of 14 May 2008) 53 |
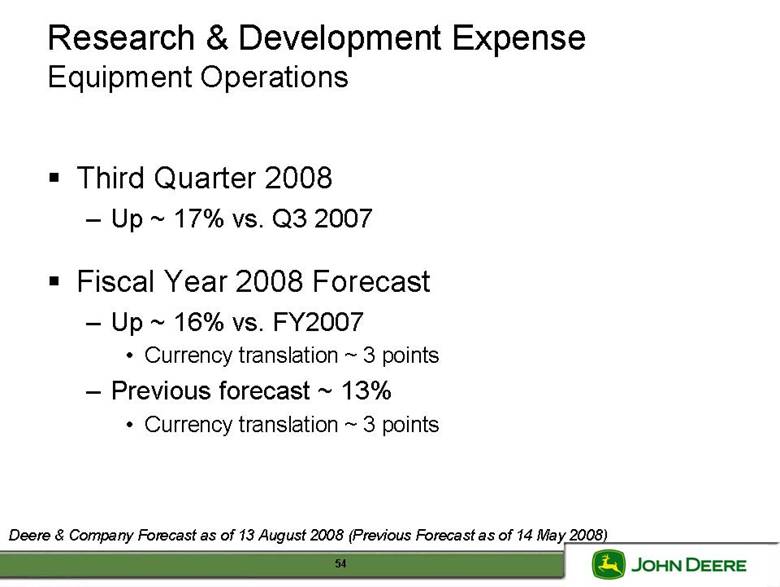
| Research & Development Expense Equipment Operations Third Quarter 2008 – Up ~ 17% vs. Q3 2007 Fiscal Year 2008 Forecast – Up ~ 16% vs. FY2007 • Currency translation ~ 3 points – Previous forecast ~ 13% • Currency translation ~ 3 points Deere & Company Forecast as of 13 August 2008 (Previous Forecast as of 14 May 2008) 54 |
| Selling, Administrative & General Expense Equipment Operations Third Quarter 2008 – Up ~ 16% vs. Q3 2007 • Includes ~ 7 points related to global growth initiatives and currency translation Fiscal Year 2008 – Up ~ 16% vs. FY 2007 • Includes ~ 10 points related to global growth initiatives (including LESCO) and currency translation – Previous forecast ~ 15% Deere & Company Forecast as of 13 August 2008 (Previous Forecast as of 14 May 2008) 55 |

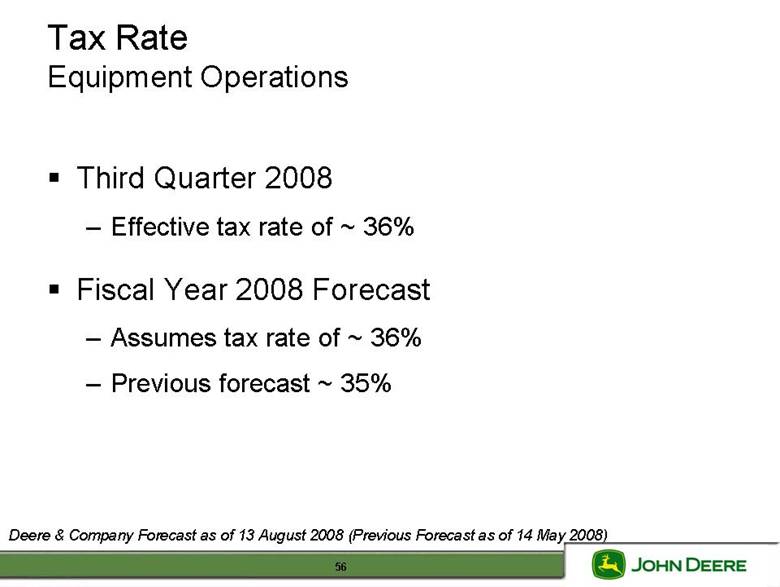
| Tax Rate Equipment Operations Third Quarter 2008 – Effective tax rate of ~ 36% Fiscal Year 2008 Forecast – Assumes tax rate of ~ 36% – Previous forecast ~ 35% Deere & Company Forecast as of 13 August 2008 (Previous Forecast as of 14 May 2008) 56 |
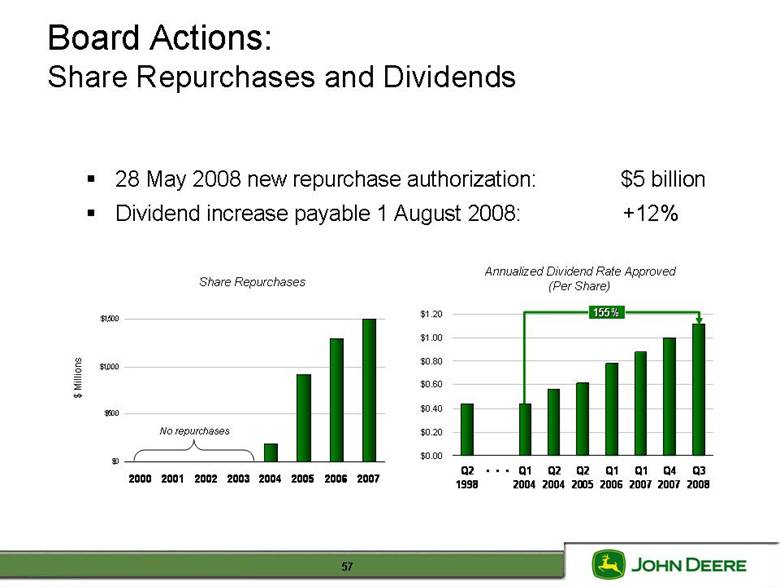
| 28 May 2008 new repurchase authorization: $5 billion Dividend increase payable 1 August 2008: +12% $0 $500 $1,000 $1,500 2000 2001 2002 2003 2004 2005 2006 2007 Share Repurchases $ Millions Annualized Dividend Rate Approved (Per Share) No repurchases $0.00 $0.20 $0.40 $0.60 $0.80 $1.00 $1.20 Q2 1998 Q1 2004 Q2 2004 Q2 2005 Q1 2006 Q1 2007 Q4 2007 Q3 2008 . . . 155% 155% Board Actions: Share Repurchases and Dividends 57 |
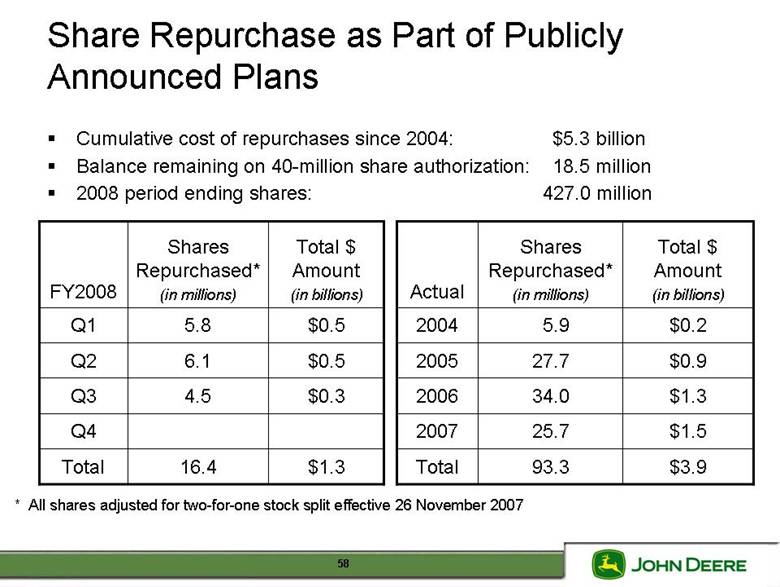
| Share Repurchase as Part of Publicly Announced Plans Total $ Amount (in billions) Shares Repurchased* (in millions) FY2008 $0.5 5.8 Q1 $1.3 16.4 Total Q4 $0.3 4.5 Q3 $0.5 6.1 Q2 Total $ Amount (in billions) Shares Repurchased* (in millions) Actual $0.2 5.9 2004 $3.9 93.3 Total $1.5 25.7 2007 $1.3 34.0 2006 $0.9 27.7 2005 Cumulative cost of repurchases since 2004: $5.3 billion Balance remaining on 40-million share authorization: 18.5 million 2008 period ending shares: 427.0 million * All shares adjusted for two-for-one stock split effective 26 November 2007 58 |
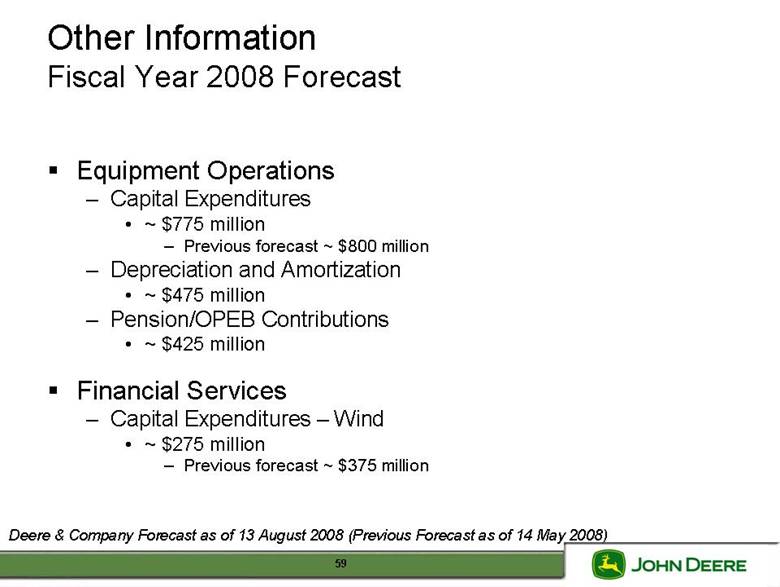
| Other Information Fiscal Year 2008 Forecast Equipment Operations – Capital Expenditures • ~ $775 million – Previous forecast ~ $800 million – Depreciation and Amortization • ~ $475 million – Pension/OPEB Contributions • ~ $425 million Financial Services – Capital Expenditures – Wind • ~ $275 million – Previous forecast ~ $375 million Deere & Company Forecast as of 13 August 2008 (Previous Forecast as of 14 May 2008) 59 |
| Appendix 60 |
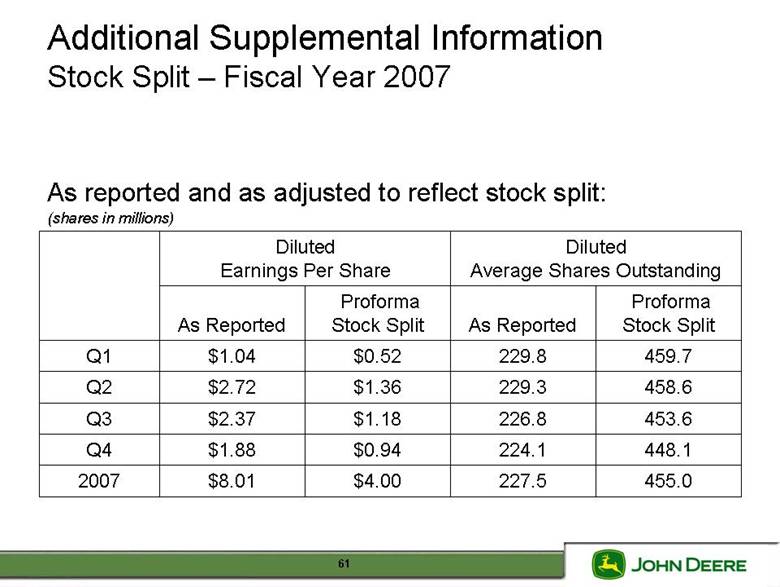
| Additional Supplemental Information Stock Split – Fiscal Year 2007 As reported and as adjusted to reflect stock split: (shares in millions) 455.0 227.5 $4.00 $8.01 2007 448.1 224.1 $0.94 $1.88 Q4 453.6 226.8 $1.18 $2.37 Q3 458.6 229.3 $1.36 $2.72 Q2 459.7 229.8 $0.52 $1.04 Q1 Proforma Stock Split As Reported Proforma Stock Split As Reported Diluted Average Shares Outstanding Diluted Earnings Per Share 61 |
| Deere’s fourth quarter 2008 conference call is scheduled for 9:00 a.m. central time on Wednesday, November 26, 2008 62 |