Exhibit 99.3
| 1 4Q 2019 Earnings Call 27 November 2019 24 |

| 2 Safe Harbor Statement & Disclosures The earnings call and accompanying material include forward-looking comments and information concerning the company’s plans and projections for the future, including estimates and assumptions with respect to economic, political, technological, weather, market acceptance, acquisitions and divestitures of businesses, anticipated transaction costs, the integration of new businesses, anticipated benefits of acquisitions, and other factors that impact our businesses and customers. They also may include financial measures that are not in conformance with accounting principles generally accepted in the United States of America (GAAP). Words such as “forecast,” “projection,” “outlook,” “prospects,” “expected,” “estimated,” “will,” “plan,” “anticipate,” “intend,” “believe,” or other similar words or phrases often identify forward-looking statements. Actual results may differ materially from those projected in these forward-looking statements based on a number of factors and uncertainties. Additional information concerning factors that could cause actual results to differ materially is contained in the company’s most recent Form 8-K and periodic report filed with the U.S. Securities and Exchange Commission, and is incorporated by reference herein. Investors should refer to and consider the incorporated information on risks and uncertainties in addition to the information presented here. The company, except as required by law, undertakes no obligation to update or revise its forward-looking statements whether as a result of new developments or otherwise. The call and accompanying materials are not an offer to sell or a solicitation of offers to buy any of the company’s securities. Non-GAAP Financial Measures This presentation includes the following non-GAAP financial measures on an historical basis: adjusted net income and adjusted diluted EPS. Please refer to the supplemental information located at the end of this presentation for a reconciliation of these historical non-GAAP financial measures to the most directly comparable historical GAAP financial measures and other important information. 25 |
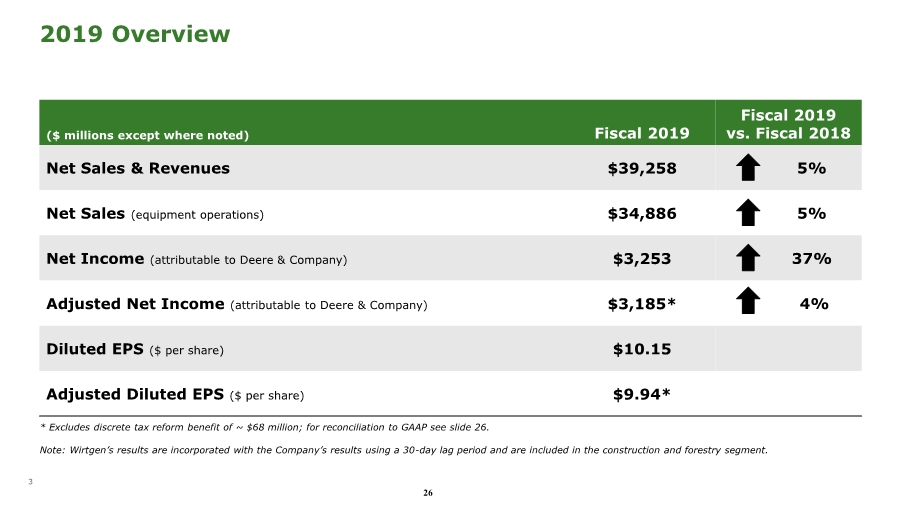
| 3 2019 Overview ($ millions except where noted) Fiscal 2019 Fiscal 2019 vs. Fiscal 2018 Net Sales & Revenues $39,258 5% Net Sales (equipment operations) $34,886 5% Net Income (attributable to Deere & Company) $3,253 37% Adjusted Net Income (attributable to Deere & Company) $3,185* 4% Diluted EPS ($ per share) $10.15 Adjusted Diluted EPS ($ per share) $9.94* * Excludes discrete tax reform benefit of ~ $68 million; for reconciliation to GAAP see slide 26. Note: Wirtgen’s results are incorporated with the Company’s results using a 30-day lag period and are included in the construction and forestry segment. 26 |
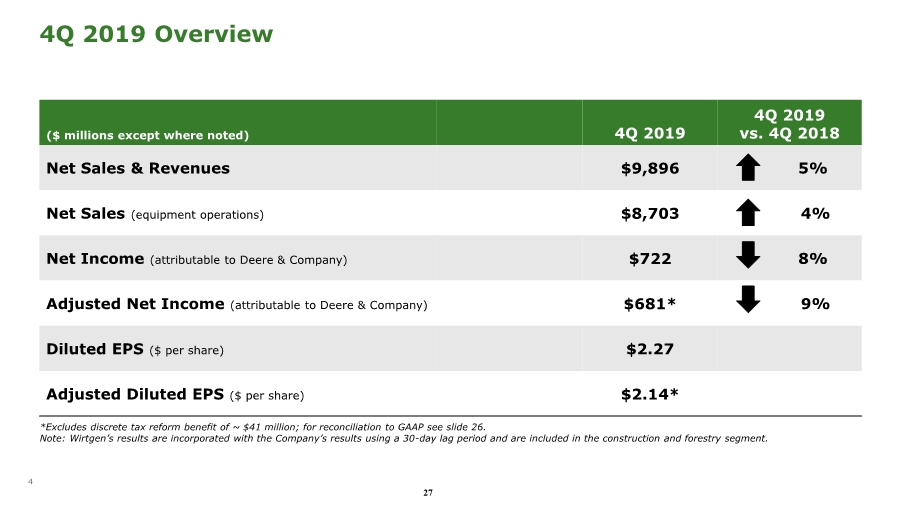
| 4 4Q 2019 Overview ($ millions except where noted) 4Q 2019 4Q 2019 vs. 4Q 2018 Net Sales & Revenues $9,896 5% Net Sales (equipment operations) $8,703 4% Net Income (attributable to Deere & Company) $722 8% Adjusted Net Income (attributable to Deere & Company) $681* 9% Diluted EPS ($ per share) $2.27 Adjusted Diluted EPS ($ per share) $2.14* *Excludes discrete tax reform benefit of ~ $41 million; for reconciliation to GAAP see slide 26. Note: Wirtgen’s results are incorporated with the Company’s results using a 30-day lag period and are included in the construction and forestry segment. 27 |
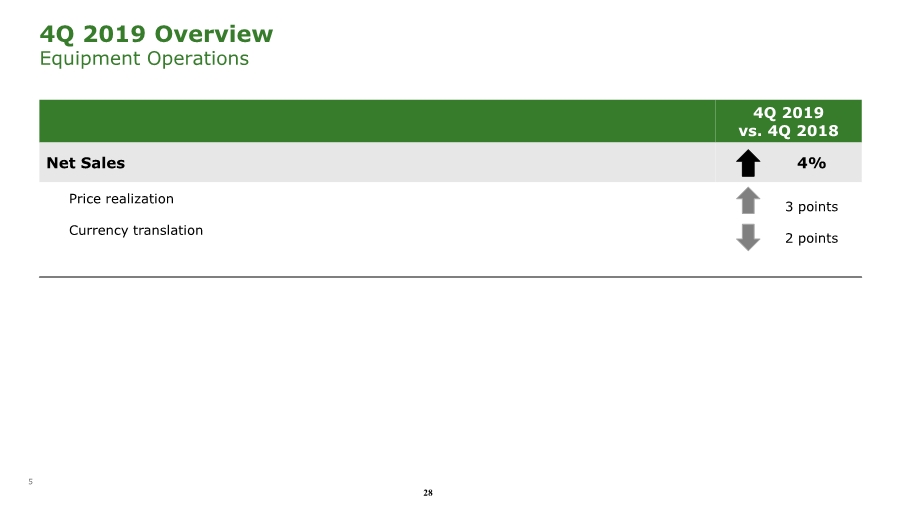
| 5 4Q 2019 Overview Equipment Operations 4Q 2019 vs. 4Q 2018 Net Sales 4% Price realization Currency translation 3 points 2 points 28 |
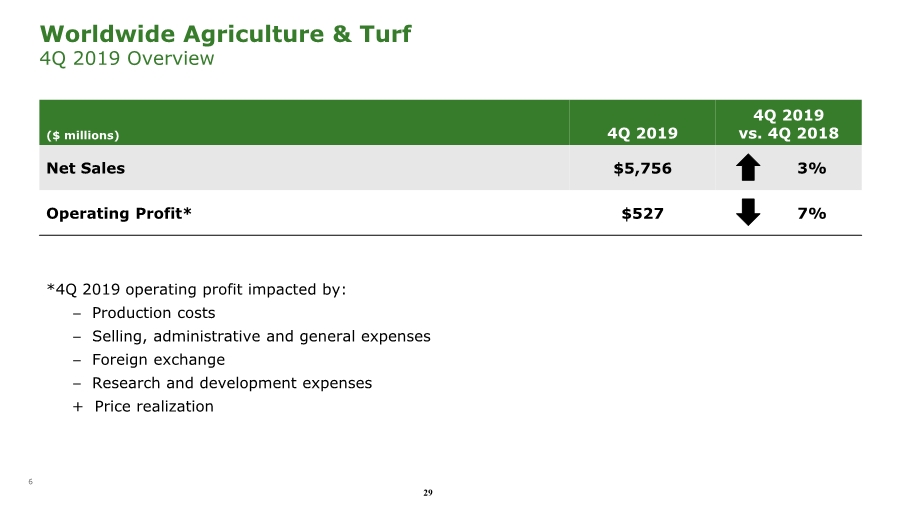
| 6 Worldwide Agriculture & Turf 4Q 2019 Overview ($ millions) 4Q 2019 4Q 2019 vs. 4Q 2018 Net Sales $5,756 3% Operating Profit* $527 7% *4Q 2019 operating profit impacted by: − Production costs − Selling, administrative and general expenses − Foreign exchange − Research and development expenses + Price realization 29 |
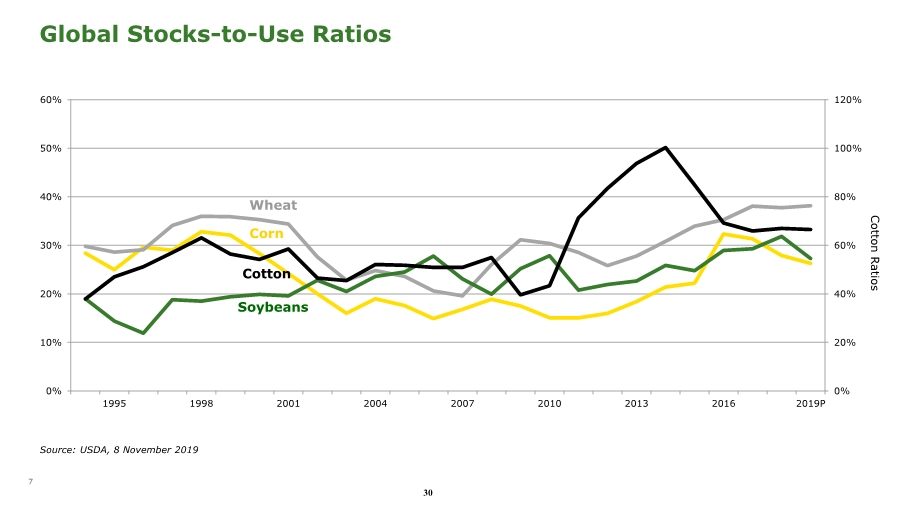
| 7 Global Stocks-to-Use Ratios Source: USDA, 8 November 2019 0% 20% 40% 60% 80% 100% 120% 0% 10% 20% 30% 40% 50% 60% 1995 1998 2001 2004 2007 2010 2013 2016 2019P Cotton Ratios Cotton Wheat Corn Soybeans 30 |
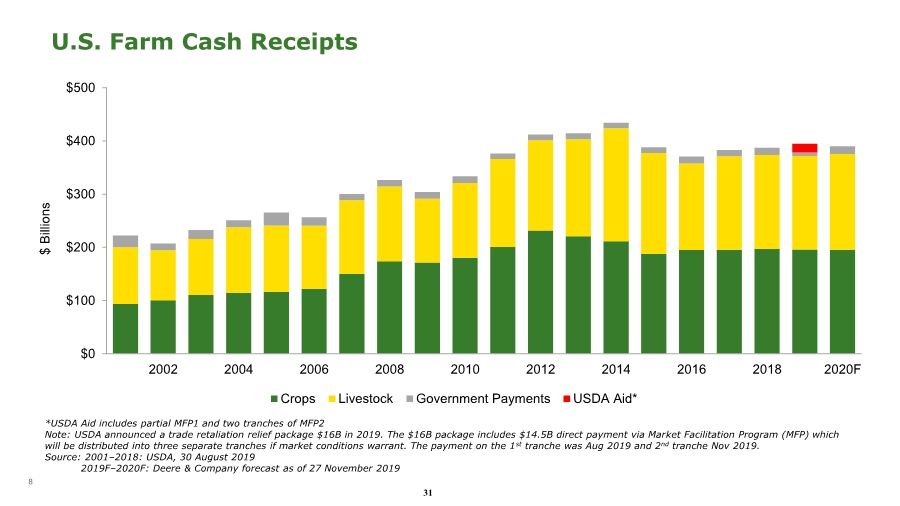
| 8 U.S. Farm Cash Receipts $0 $100 $200 $300 $400 $500 2002 2004 2006 2008 2010 2012 2014 2016 2018 2020F $ Billions Crops Livestock Government Payments USDA Aid* *USDA Aid includes partial MFP1 and two tranches of MFP2 Note: USDA announced a trade retaliation relief package $16B in 2019. The $16B package includes $14.5B direct payment via Market Facilitation Program (MFP) which will be distributed into three separate tranches if market conditions warrant. The payment on the 1st tranche was Aug 2019 and 2nd tranche Nov 2019. Source: 2001–2018: USDA, 30 August 2019 2019F–2020F: Deere & Company forecast as of 27 November 2019 31 |
| 9 Fiscal 2020 Forecast U.S. and Canada Ag Down ~5% EU 28 Ag ~ Flat South America Ag (tractors and combines) ~ Flat Asia Ag ~ Flat U.S. and Canada Turf and Utility ~ Flat Agriculture & Turf Industry Outlook Source: Deere & Company forecast as of 27 November 2019 32 |

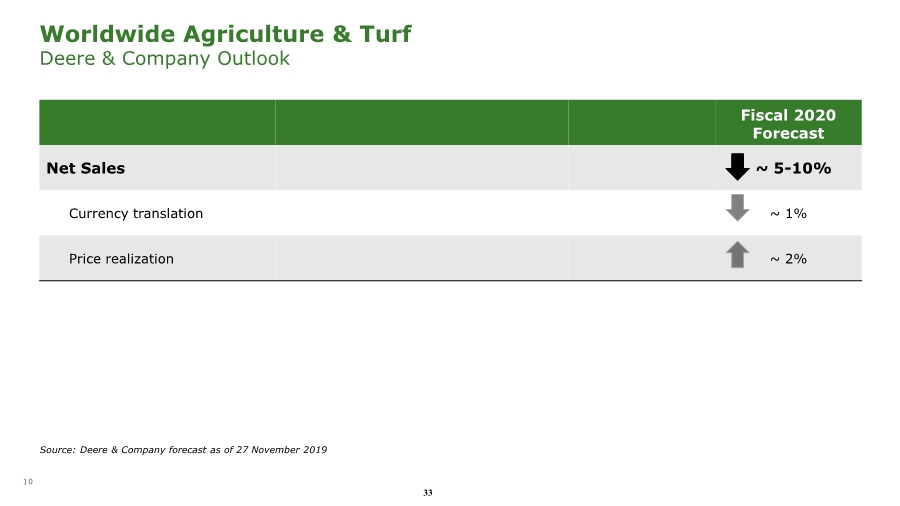
| 10 Worldwide Agriculture & Turf Deere & Company Outlook Fiscal 2020 Forecast Net Sales ~ 5-10% Currency translation ~ 1% Price realization ~ 2% Source: Deere & Company forecast as of 27 November 2019 33 |
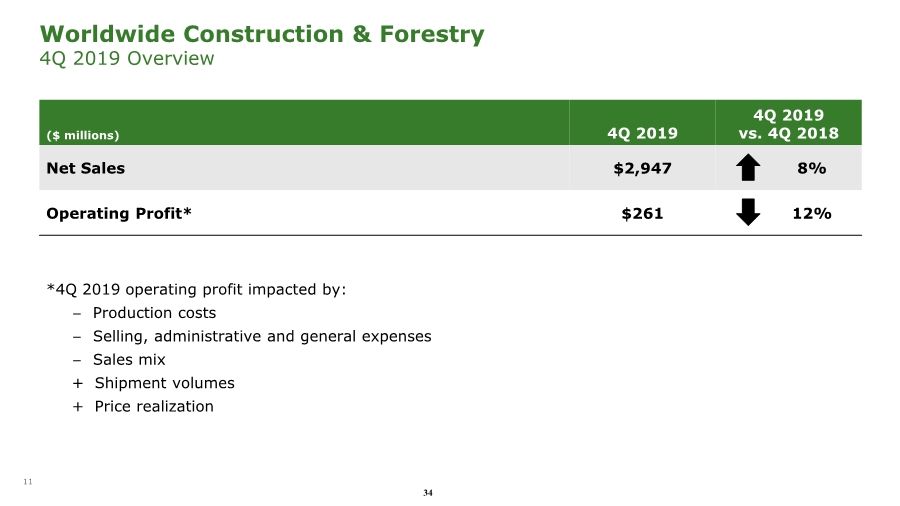
| 11 ($ millions) 4Q 2019 4Q 2019 vs. 4Q 2018 Net Sales $2,947 8% Operating Profit* $261 12% Worldwide Construction & Forestry 4Q 2019 Overview *4Q 2019 operating profit impacted by: − Production costs − Selling, administrative and general expenses − Sales mix + Shipment volumes + Price realization 34 |
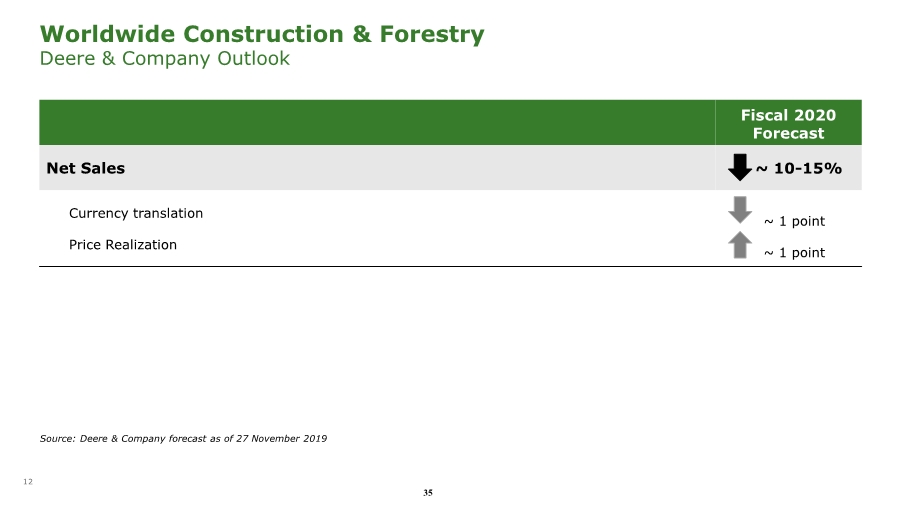
| 12 Fiscal 2020 Forecast Net Sales ~ 10-15% Currency translation Price Realization ~ 1 point ~ 1 point Worldwide Construction & Forestry Deere & Company Outlook Source: Deere & Company forecast as of 27 November 2019 35 |
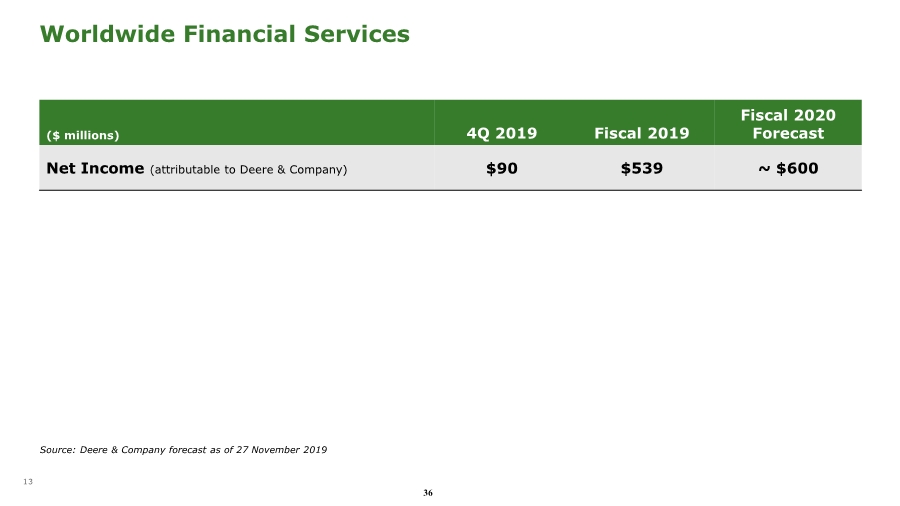
| 13 Worldwide Financial Services ($ millions) 4Q 2019 Fiscal 2019 Fiscal 2020 Forecast Net Income (attributable to Deere & Company) $90 $539 ~ $600 Source: Deere & Company forecast as of 27 November 2019 36 |
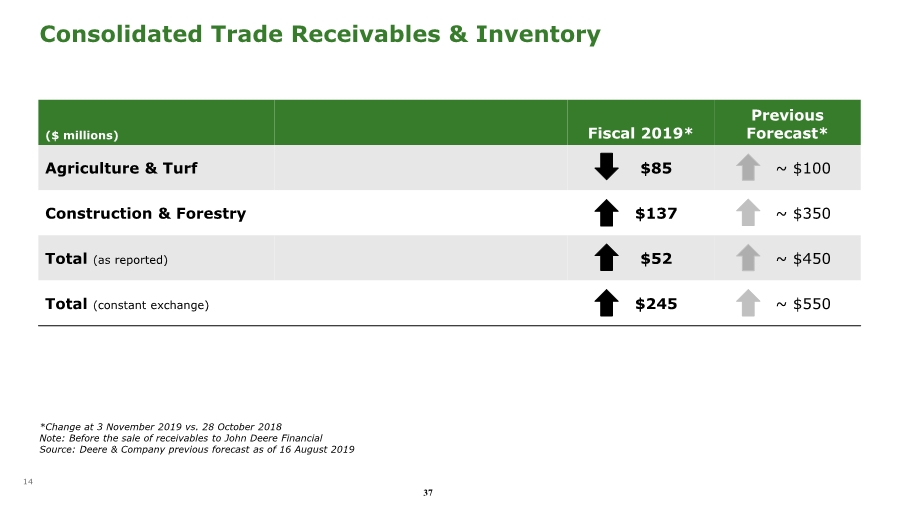
| 14 Consolidated Trade Receivables & Inventory ($ millions) Fiscal 2019* Previous Forecast* Agriculture & Turf $85 ~ $100 Construction & Forestry $137 ~ $350 Total (as reported) $52 ~ $450 Total (constant exchange) $245 ~ $550 *Change at 3 November 2019 vs. 28 October 2018 Note: Before the sale of receivables to John Deere Financial Source: Deere & Company previous forecast as of 16 August 2019 37 |
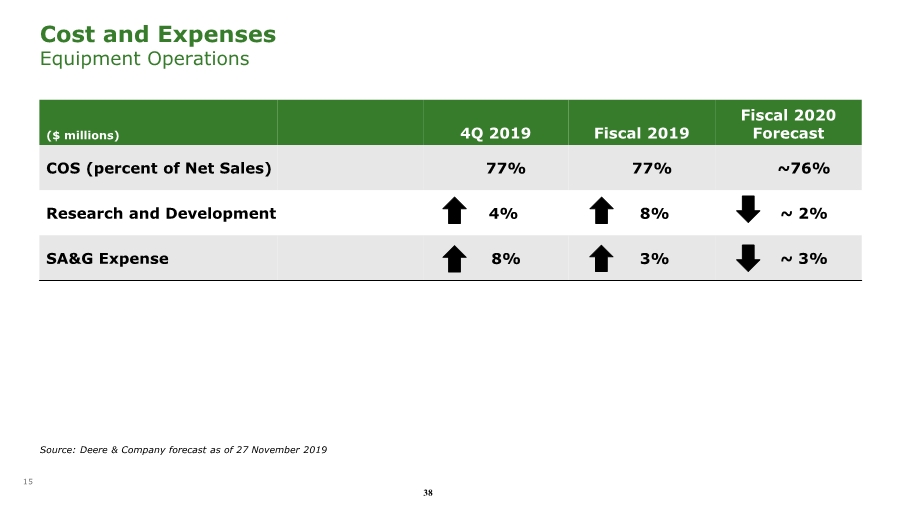
| 15 ($ millions) 4Q 2019 Fiscal 2019 Fiscal 2020 Forecast COS (percent of Net Sales) 77% 77% ~76% Research and Development 4% 8% ~ 2% SA&G Expense 8% 3% ~ 3% Source: Deere & Company forecast as of 27 November 2019 Cost and Expenses Equipment Operations 38 |
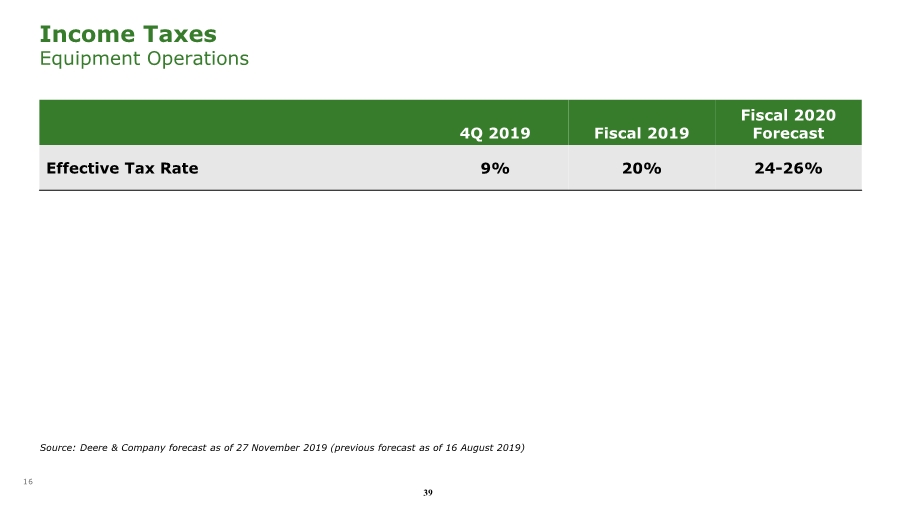
| 16 4Q 2019 Fiscal 2019 Fiscal 2020 Forecast Effective Tax Rate 9% 20% 24-26% Income Taxes Equipment Operations Source: Deere & Company forecast as of 27 November 2019 (previous forecast as of 16 August 2019) 39 |
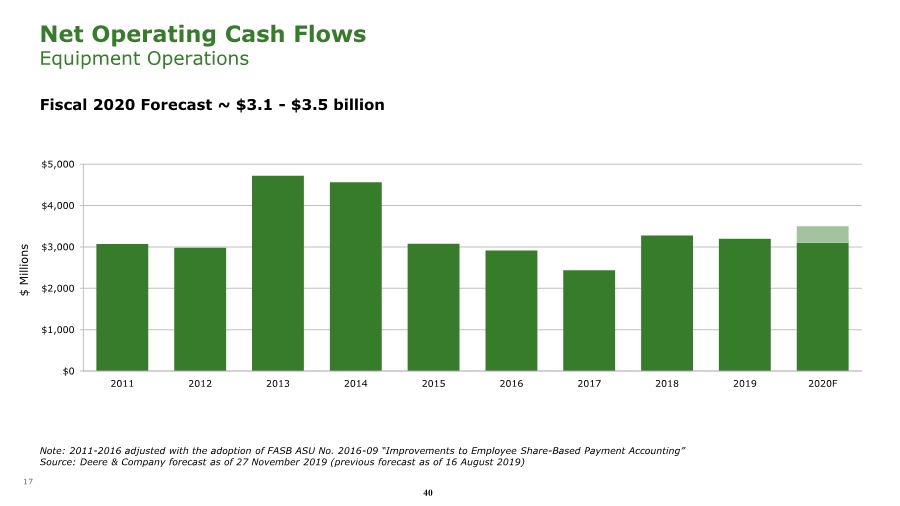
| 17 Net Operating Cash Flows Equipment Operations Fiscal 2020 Forecast ~ $3.1 - $3.5 billion $0 $1,000 $2,000 $3,000 $4,000 $5,000 2011 2012 2013 2014 2015 2016 2017 2018 2019 2020F $ Millions Note: 2011-2016 adjusted with the adoption of FASB ASU No. 2016-09 “Improvements to Employee Share-Based Payment Accounting” Source: Deere & Company forecast as of 27 November 2019 (previous forecast as of 16 August 2019) 40 |
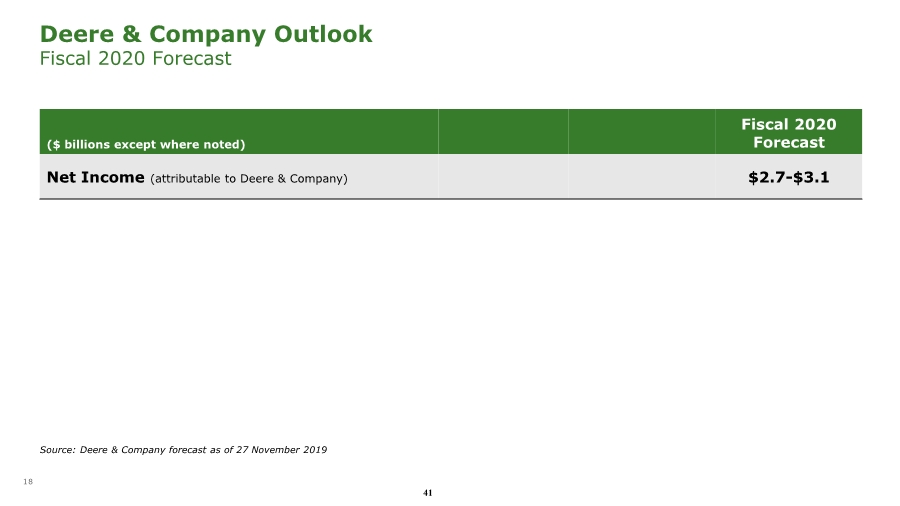
| 18 Source: Deere & Company forecast as of 27 November 2019 ($ billions except where noted) Fiscal 2020 Forecast Net Income (attributable to Deere & Company) $2.7-$3.1 Deere & Company Outlook Fiscal 2020 Forecast 41 |
| 19 Appendix 42 |

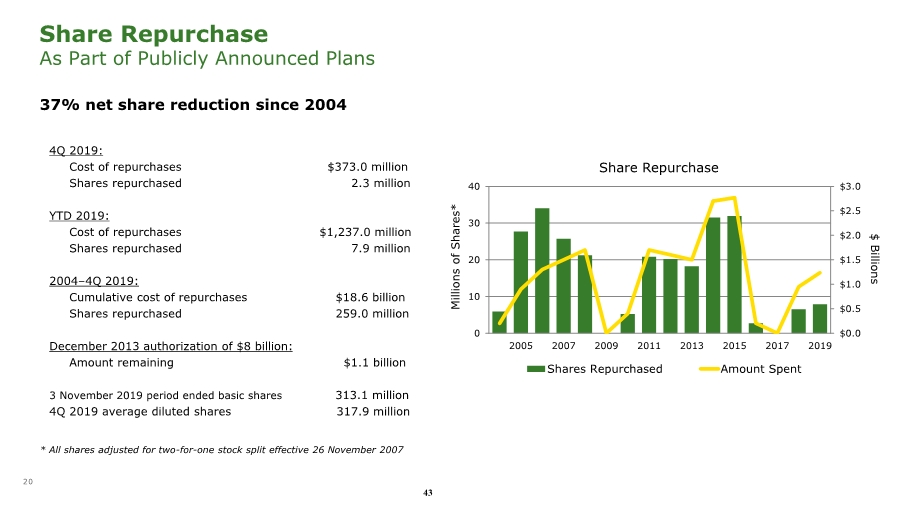
| 20 Share Repurchase As Part of Publicly Announced Plans * All shares adjusted for two-for-one stock split effective 26 November 2007 4Q 2019: Cost of repurchases $373.0 million Shares repurchased 2.3 million YTD 2019: Cost of repurchases $1,237.0 million Shares repurchased 7.9 million 2004–4Q 2019: Cumulative cost of repurchases $18.6 billion Shares repurchased 259.0 million December 2013 authorization of $8 billion: Amount remaining $1.1 billion 3 November 2019 period ended basic shares 313.1 million 4Q 2019 average diluted shares 317.9 million $0.0 $0.5 $1.0 $1.5 $2.0 $2.5 $3.0 0 10 20 30 40 2005 2007 2009 2011 2013 2015 2017 2019 $ Billions Millions of Shares* Shares Repurchased Amount Spent Share Repurchase 37% net share reduction since 2004 43 |
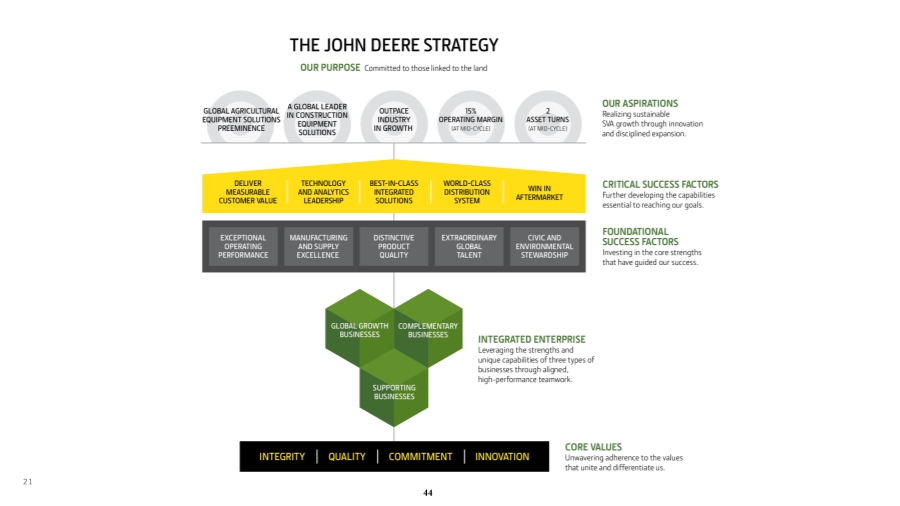
| 21 44 |
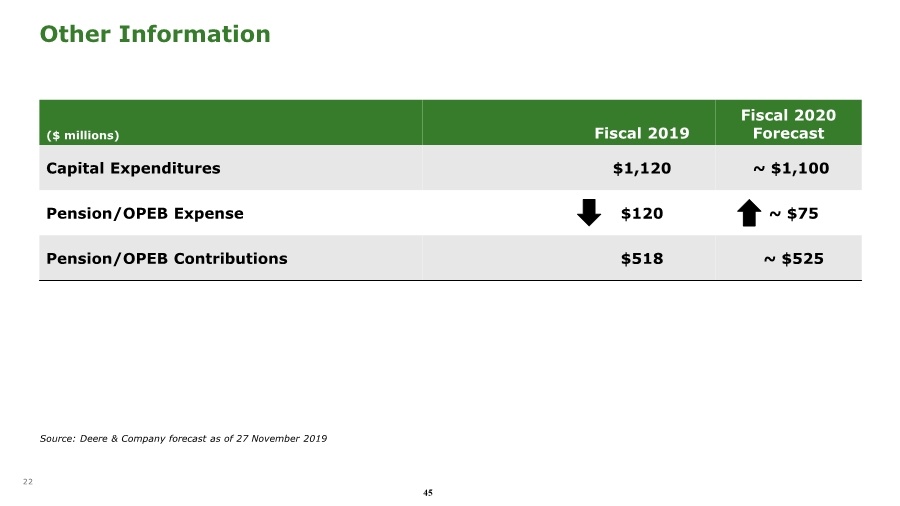
| 22 ($ millions) Fiscal 2019 Fiscal 2020 Forecast Capital Expenditures $1,120 ~ $1,100 Pension/OPEB Expense $120 ~ $75 Pension/OPEB Contributions $518 ~ $525 Other Information Source: Deere & Company forecast as of 27 November 2019 45 |
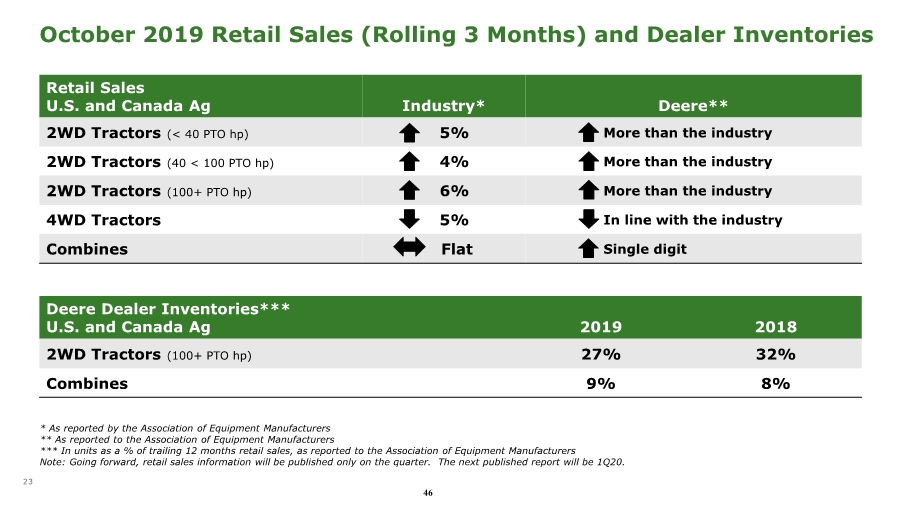
| 23 October 2019 Retail Sales (Rolling 3 Months) and Dealer Inventories Retail Sales U.S. and Canada Ag Industry* Deere** 2WD Tractors (< 40 PTO hp) 5% More than the industry 2WD Tractors (40 < 100 PTO hp) 4% More than the industry 2WD Tractors (100+ PTO hp) 6% More than the industry 4WD Tractors 5% In line with the industry Combines Flat Single digit Deere Dealer Inventories*** U.S. and Canada Ag 2019 2018 2WD Tractors (100+ PTO hp) 27% 32% Combines 9% 8% * As reported by the Association of Equipment Manufacturers ** As reported to the Association of Equipment Manufacturers *** In units as a % of trailing 12 months retail sales, as reported to the Association of Equipment Manufacturers Note: Going forward, retail sales information will be published only on the quarter. The next published report will be 1Q20. 46 |
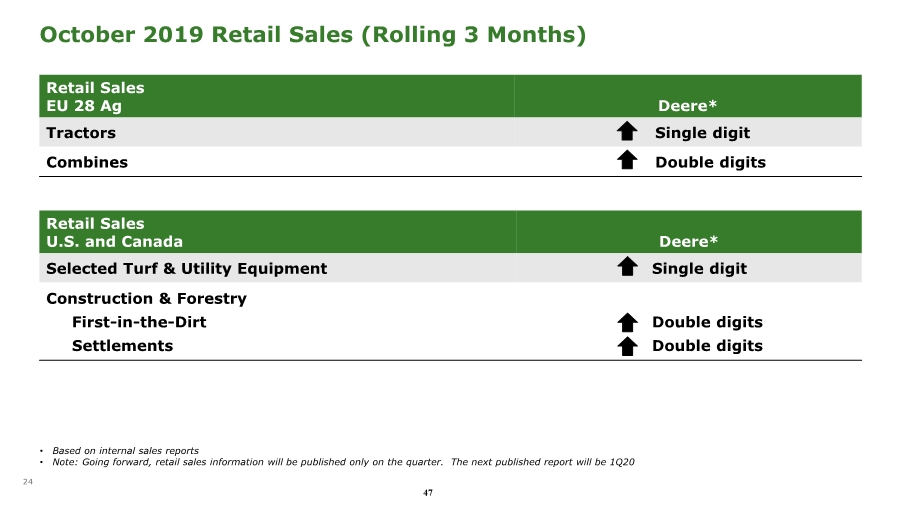
| 24 Retail Sales U.S. and Canada Deere* Selected Turf & Utility Equipment Single digit Construction & Forestry First-in-the-Dirt Settlements Double digits Double digits October 2019 Retail Sales (Rolling 3 Months) Retail Sales EU 28 Ag Deere* Tractors Single digit Combines Double digits • Based on internal sales reports • Note: Going forward, retail sales information will be published only on the quarter. The next published report will be 1Q20 47 |
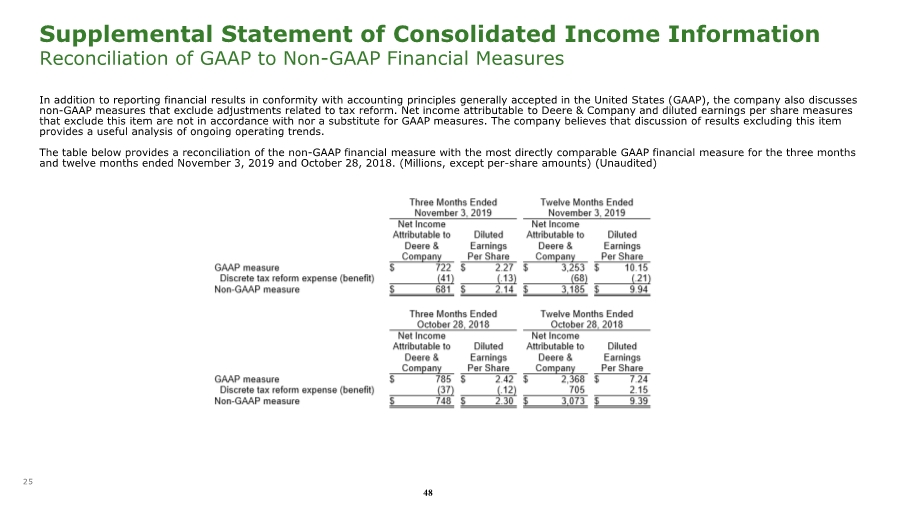
| 25 Supplemental Statement of Consolidated Income Information Reconciliation of GAAP to Non-GAAP Financial Measures In addition to reporting financial results in conformity with accounting principles generally accepted in the United States (GAAP), the company also discusses non-GAAP measures that exclude adjustments related to tax reform. Net income attributable to Deere & Company and diluted earnings per share measures that exclude this item are not in accordance with nor a substitute for GAAP measures. The company believes that discussion of results excluding this item provides a useful analysis of ongoing operating trends. The table below provides a reconciliation of the non-GAAP financial measure with the most directly comparable GAAP financial measure for the three months and twelve months ended November 3, 2019 and October 28, 2018. (Millions, except per-share amounts) (Unaudited) 48 |
| Deere & Company’s 1Q 2020 earnings call is scheduled for 9:00 a.m. central time on Friday, 21 February 2020 49 |