UNITED STATES
SECURITIES AND EXCHANGE COMMISSION
WASHINGTON, D.C. 20549
FORM 10-Q
(Mark One)
☒ QUARTERLY REPORT PURSUANT TO SECTION 13 OR 15(d) OF THE SECURITIES EXCHANGE ACT OF 1934
For the quarterly period ended May 2, 2021
or
☐ TRANSITION REPORT PURSUANT TO SECTION 13 OR 15(d) OF THE SECURITIES EXCHANGE ACT OF 1934
For the transition period from ____ to ____
Commission file no: 1-4121
DEERE & COMPANY
(Exact name of registrant as specified in its charter)
| | |
Delaware | | 36-2382580 |
One John Deere Place
Moline, Illinois 61265
(Address of principal executive offices)
Telephone Number: (309) 765-8000
Securities Registered Pursuant to Section 12(b) of the Act:
| | | | | |
Title of each class | | Trading symbol | | Name of each exchange on which registered | |
Common stock, $1 par value | | DE | | New York Stock Exchange | |
8½% Debentures Due 2022 | | DE22 | | New York Stock Exchange | |
6.55% Debentures Due 2028 | | DE28 | | New York Stock Exchange | |
Indicate by check mark whether the registrant: (1) has filed all reports required to be filed by Section 13 or 15(d) of the Securities Exchange Act of 1934 during the preceding 12 months (or for such shorter period that the registrant was required to file such reports), and (2) has been subject to such filing requirements for the past 90 days.
Yes ☒ No ☐
Indicate by check mark whether the registrant has submitted electronically every Interactive Data File required to be submitted pursuant to Rule 405 of Regulation S-T (§232.405 of this chapter) during the preceding 12 months (or for such shorter period that the registrant was required to submit such files).
Yes ☒ No ☐
Indicate by check mark whether the registrant is a large accelerated filer, an accelerated filer, a non-accelerated filer, a smaller reporting company, or an emerging growth company. See the definitions of “large accelerated filer,” “accelerated filer,” “smaller reporting company,” and “emerging growth company” in Rule 12b-2 of the Exchange Act.
Large accelerated filer | ☒ | Accelerated filer | ☐ |
Non-accelerated filer | ☐ | Smaller reporting company | ☐ |
| Emerging growth company | ☐ |
If an emerging growth company, indicate by check mark if the registrant has elected not to use the extended transition period for complying with any new or revised financial accounting standards provided pursuant to Section 13(a) of the Exchange Act. ☐
Indicate by check mark whether the registrant is a shell company (as defined in Rule 12b-2 of the Exchange Act).
Yes ☐ No ☒
At May 2, 2021, 311,942,092 shares of common stock, $1 par value, of the registrant were outstanding.
PART I. FINANCIAL INFORMATION
| | | | | | | |
ITEM 1. FINANCIAL STATEMENTS | | | | | | | |
DEERE & COMPANY | | | | | | | |
STATEMENT OF CONSOLIDATED INCOME | | | | | | | |
For the Three Months Ended May 2, 2021 and May 3, 2020 | | | | | | | |
(In millions of dollars and shares except per share amounts) Unaudited | | | | | | | |
|
| 2021 |
| 2020 |
| ||
Net Sales and Revenues | | | | | | | |
Net sales |
| $ | 10,998 | | $ | 8,224 | |
Finance and interest income | | | 809 | |
| 849 | |
Other income | | | 251 | |
| 180 | |
Total | | | 12,058 | |
| 9,253 | |
| | | | | | | |
Costs and Expenses | | | | | | | |
Cost of sales | | | 7,928 | |
| 6,294 | |
Research and development expenses | | | 377 | |
| 406 | |
Selling, administrative and general expenses | | | 838 | |
| 906 | |
Interest expense | | | 268 | |
| 342 | |
Other operating expenses | | | 335 | |
| 377 | |
Total | | | 9,746 | |
| 8,325 | |
| | | | | | | |
Income of Consolidated Group before Income Taxes | | | 2,312 | |
| 928 | |
Provision for income taxes | | | 530 | |
| 245 | |
| | | | | | | |
Income of Consolidated Group | | | 1,782 | |
| 683 | |
Equity in income (loss) of unconsolidated affiliates | | | 8 | |
| (17) | |
| | | | | | | |
Net Income | | | 1,790 | |
| 666 | |
Less: Net income attributable to noncontrolling interests | | | | |
| | |
Net Income Attributable to Deere & Company |
| $ | 1,790 | | $ | 666 | |
| | | | | | | |
Per Share Data | | | | | | | |
Basic |
| $ | 5.72 | | $ | 2.13 | |
Diluted |
| $ | 5.68 | | $ | 2.11 | |
| | | | | | | |
Average Shares Outstanding | | | | | | | |
Basic | | | 312.8 | |
| 313.2 | |
Diluted | | | 315.2 | |
| 316.2 | |
| | | | | | | |
See Condensed Notes to Interim Consolidated Financial Statements.
2
| | | | | | | |
DEERE & COMPANY | | | | | | | |
STATEMENT OF CONSOLIDATED COMPREHENSIVE INCOME | | | | | | | |
For the Three Months Ended May 2, 2021 and May 3, 2020 | | | | | | | |
(In millions of dollars) Unaudited | | | | | | | |
|
| 2021 |
| 2020 |
| ||
| | | | | | |
|
Net Income |
| $ | 1,790 | | $ | 666 | |
| | | | | | | |
Other Comprehensive Income (Loss), Net of Income Taxes | | | | | | | |
Retirement benefits adjustment | | | 91 | |
| 57 | |
Cumulative translation adjustment | | | 37 | |
| (441) | |
Unrealized gain (loss) on derivatives | | | 3 | |
| (8) | |
Unrealized gain (loss) on debt securities | | | (13) | |
| 6 | |
Other Comprehensive Income (Loss), Net of Income Taxes | | | 118 | |
| (386) | |
| | | | | | | |
Comprehensive Income of Consolidated Group | | | 1,908 | |
| 280 | |
Less: Comprehensive income attributable to noncontrolling interests | | | | |
| | |
Comprehensive Income Attributable to Deere & Company |
| $ | 1,908 | | $ | 280 | |
| | | | | | | |
See Condensed Notes to Interim Consolidated Financial Statements.
3
| | | | | | | |
DEERE & COMPANY | | | | | | | |
STATEMENT OF CONSOLIDATED INCOME | | | | | | | |
For the Six Months Ended May 2, 2021 and May 3, 2020 | | | | | | | |
(In millions of dollars and shares except per share amounts) Unaudited | | | | | | | |
|
| 2021 |
| 2020 |
| ||
Net Sales and Revenues | | | | | | | |
Net sales |
| $ | 19,049 | | $ | 14,754 | |
Finance and interest income | | | 1,644 | |
| 1,745 | |
Other income | | | 477 | |
| 385 | |
Total | | | 21,170 | |
| 16,884 | |
| | | | | | | |
Costs and Expenses | | | | | | | |
Cost of sales | | | 13,734 | |
| 11,371 | |
Research and development expenses | | | 743 | |
| 831 | |
Selling, administrative and general expenses | | | 1,607 | |
| 1,715 | |
Interest expense | | | 538 | |
| 678 | |
Other operating expenses | | | 708 | |
| 792 | |
Total | | | 17,330 | |
| 15,387 | |
| | | | | | | |
Income of Consolidated Group before Income Taxes | | | 3,840 | |
| 1,497 | |
Provision for income taxes | | | 838 | |
| 295 | |
| | | | | | | |
Income of Consolidated Group | | | 3,002 | |
| 1,202 | |
Equity in income (loss) of unconsolidated affiliates | | | 12 | |
| (18) | |
| | | | | | | |
Net Income | | | 3,014 | |
| 1,184 | |
Less: Net income attributable to noncontrolling interests | | | 1 | |
| 2 | |
Net Income Attributable to Deere & Company |
| $ | 3,013 | | $ | 1,182 | |
| | | | | | | |
Per Share Data | | | | | | | |
Basic |
| $ | 9.62 | | $ | 3.77 | |
Diluted |
| $ | 9.55 | | $ | 3.73 | |
| | | | | | | |
Average Shares Outstanding | | | | | | | |
Basic | | | 313.1 | |
| 313.3 | |
Diluted | | | 315.6 | |
| 316.7 | |
| | | | | | | |
See Condensed Notes to Interim Consolidated Financial Statements.
4
| | | | | | | |
DEERE & COMPANY | | | | | | | |
STATEMENT OF CONSOLIDATED COMPREHENSIVE INCOME | | | | | | | |
For the Six Months Ended May 2, 2021 and May 3, 2020 | | | | | | | |
(In millions of dollars) Unaudited | | | | | | | |
|
| 2021 |
| 2020 |
| ||
| | | | | | |
|
Net Income |
| $ | 3,014 | | $ | 1,184 | |
| | | | | | | |
Other Comprehensive Income (Loss), Net of Income Taxes | | | | | | | |
Retirement benefits adjustment | | | 154 | |
| 287 | |
Cumulative translation adjustment | | | 433 | |
| (398) | |
Unrealized gain (loss) on derivatives | | | 7 | |
| (8) | |
Unrealized gain (loss) on debt securities | | | (15) | |
| 11 | |
Other Comprehensive Income (Loss), Net of Income Taxes | | | 579 | |
| (108) | |
| | | | | | | |
Comprehensive Income of Consolidated Group | | | 3,593 | |
| 1,076 | |
Less: Comprehensive income attributable to noncontrolling interests | | | 1 | |
| 2 | |
Comprehensive Income Attributable to Deere & Company |
| $ | 3,592 | | $ | 1,074 | |
| | | | | | | |
See Condensed Notes to Interim Consolidated Financial Statements.
5
| | | | | | | | | | |
DEERE & COMPANY | | | | | | | | | | |
CONDENSED CONSOLIDATED BALANCE SHEET | | | | | | | | | | |
(In millions of dollars) Unaudited | | | | | | | | | | |
|
| May 2 |
| November 1 |
| May 3 |
| |||
| | 2021 | | 2020 | | 2020 |
| |||
Assets | | | | | | | | | | |
Cash and cash equivalents |
| $ | 7,182 | | $ | 7,066 | | $ | 8,900 | |
Marketable securities | | | 668 | |
| 641 | |
| 626 | |
Receivables from unconsolidated affiliates | | | 31 | |
| 31 | |
| 32 | |
Trade accounts and notes receivable – net | | | 6,158 | |
| 4,171 | |
| 5,986 | |
Financing receivables – net | | | 30,994 | |
| 29,750 | |
| 27,256 | |
Financing receivables securitized – net | | | 4,107 | |
| 4,703 | |
| 4,685 | |
Other receivables | | | 1,473 | |
| 1,220 | |
| 1,212 | |
Equipment on operating leases – net | | | 7,108 | |
| 7,298 | |
| 7,245 | |
Inventories | | | 6,042 | |
| 4,999 | |
| 6,171 | |
Property and equipment – net | | | 5,704 | |
| 5,817 | |
| 5,685 | |
Investments in unconsolidated affiliates | | | 182 | |
| 193 | |
| 192 | |
Goodwill | | | 3,190 | |
| 3,081 | |
| 2,917 | |
Other intangible assets – net | | | 1,310 | |
| 1,327 | |
| 1,311 | |
Retirement benefits | | | 951 | |
| 863 | |
| 960 | |
Deferred income taxes | | | 1,724 | |
| 1,499 | |
| 1,435 | |
Other assets | | | 2,155 | |
| 2,432 | |
| 2,713 | |
Total Assets |
| $ | 78,979 | | $ | 75,091 | | $ | 77,326 | |
| | | | | | | | | | |
Liabilities and Stockholders’ Equity | | | | | | | | | | |
| | | | | | | | | | |
Liabilities | | | | | | | | | | |
Short-term borrowings | | $ | 9,911 | | $ | 8,582 | | $ | 11,179 | |
Short-term securitization borrowings | | | 4,106 | |
| 4,682 | |
| 4,640 | |
Payables to unconsolidated affiliates | | | 155 | |
| 105 | |
| 91 | |
Accounts payable and accrued expenses | | | 10,527 | |
| 10,112 | |
| 9,072 | |
Deferred income taxes | | | 533 | |
| 519 | |
| 475 | |
Long-term borrowings | | | 33,346 | |
| 32,734 | |
| 34,324 | |
Retirement benefits and other liabilities | | | 5,305 | |
| 5,413 | |
| 5,680 | |
Total liabilities | | | 63,883 | |
| 62,147 | |
| 65,461 | |
| | | | | | | | | | |
Commitments and contingencies (Note 18) | | | | | | | | | | |
| | | | | | | | | | |
Stockholders’ Equity | | | | | | | | | | |
Common stock, $1 par value (issued shares at | | | 4,999 | |
| 4,895 | |
| 4,713 | |
Common stock in treasury | | | (19,052) | |
| (18,065) | |
| (17,690) | |
Retained earnings | | | 34,105 | |
| 31,646 | |
| 30,556 | |
Accumulated other comprehensive income (loss) | | | (4,960) | |
| (5,539) | |
| (5,715) | |
Total Deere & Company stockholders’ equity | | | 15,092 | |
| 12,937 | |
| 11,864 | |
Noncontrolling interests | | | 4 | |
| 7 | |
| 1 | |
Total stockholders’ equity | | | 15,096 | |
| 12,944 | |
| 11,865 | |
Total Liabilities and Stockholders’ Equity | | $ | 78,979 | | $ | 75,091 | | $ | 77,326 | |
| | | | | | | | | | |
See Condensed Notes to Interim Consolidated Financial Statements.
6
| | | | | | | |
DEERE & COMPANY | | | | | | | |
STATEMENT OF CONSOLIDATED CASH FLOWS | | | | | | | |
For the Six Months Ended May 2, 2021 and May 3, 2020 | | | | | | | |
(In millions of dollars) Unaudited | | | | | | | |
|
| 2021 |
| 2020 |
| ||
Cash Flows from Operating Activities | | |
| | |
| |
Net income |
| $ | 3,014 | | $ | 1,184 | |
Adjustments to reconcile net income to net cash provided by operating activities: | | | | | | | |
Provision (credit) for credit losses | | | (24) | |
| 107 | |
Provision for depreciation and amortization | | | 1,054 | |
| 1,067 | |
Impairment charges | | | 50 | |
| 114 | |
Share-based compensation expense | | | 45 | |
| 48 | |
Undistributed earnings of unconsolidated affiliates | | | 11 | |
| (8) | |
Credit for deferred income taxes | | | (213) | |
| (61) | |
Changes in assets and liabilities: | | | | | | | |
Trade, notes, and financing receivables related to sales | | | (1,124) | |
| (491) | |
Inventories | | | (1,193) | |
| (496) | |
Accounts payable and accrued expenses | | | 318 | |
| (707) | |
Accrued income taxes payable/receivable | | | 54 | |
| (173) | |
Retirement benefits | | | (5) | |
| 58 | |
Other | | | (201) | |
| 134 | |
Net cash provided by operating activities | | | 1,786 | |
| 776 | |
| | | | | | | |
Cash Flows from Investing Activities | | | | | | | |
Collections of receivables (excluding receivables related to sales) | | | 10,367 | |
| 9,624 | |
Proceeds from maturities and sales of marketable securities | | | 47 | |
| 39 | |
Proceeds from sales of equipment on operating leases | | | 1,011 | |
| 898 | |
Cost of receivables acquired (excluding receivables related to sales) | | | (11,359) | |
| (9,367) | |
Acquisitions of businesses, net of cash acquired | | | (19) | |
| | |
Purchases of marketable securities | | | (74) | |
| (71) | |
Purchases of property and equipment | | | (320) | |
| (441) | |
Cost of equipment on operating leases acquired | | | (764) | |
| (960) | |
Collateral on derivatives – net | | | (255) | | | 319 | |
Other | | | (21) | |
| (11) | |
Net cash provided by (used for) investing activities | | | (1,387) | |
| 30 | |
| | | | | | | |
Cash Flows from Financing Activities | | | | | | | |
Increase in total short-term borrowings | | | 212 | |
| 1,138 | |
Proceeds from long-term borrowings | | | 3,967 | |
| 7,275 | |
Payments of long-term borrowings | | | (3,157) | |
| (3,315) | |
Proceeds from issuance of common stock | | | 116 | |
| 70 | |
Repurchases of common stock | | | (1,044) | |
| (263) | |
Dividends paid | | | (480) | |
| (481) | |
Other | | | (55) | |
| (81) | |
Net cash provided by (used for) financing activities | | | (441) | |
| 4,343 | |
| | | | | | | |
Effect of Exchange Rate Changes on Cash, Cash Equivalents, and Restricted Cash | | | 151 | |
| (102) | |
| | | | | | | |
Net Increase in Cash, Cash Equivalents, and Restricted Cash | | | 109 | | | 5,047 | |
Cash, Cash Equivalents, and Restricted Cash at Beginning of Period | | | 7,172 | |
| 3,956 | |
Cash, Cash Equivalents, and Restricted Cash at End of Period | | $ | 7,281 | | $ | 9,003 | |
| | | | | | | |
See Condensed Notes to Interim Consolidated Financial Statements.
7
| | | | | | | | | | | | | | | | | | | | | | | |
DEERE & COMPANY | | ||||||||||||||||||||||
STATEMENT OF CHANGES IN CONSOLIDATED STOCKHOLDERS’ EQUITY | | ||||||||||||||||||||||
For the Three and Six Months Ended May 2, 2021 and May 3, 2020 | | ||||||||||||||||||||||
(In millions of dollars) Unaudited | | ||||||||||||||||||||||
| | | | | Total Stockholders’ Equity | | | | | | |||||||||||||
| | | | | Deere & Company Stockholders | | |
| | | | | | ||||||||||
| | | | | | | | | | Accumulated | | | | | | | |||||||
| | Total | | | | | | | | Other | | | | | Redeemable | | |||||||
| | Stockholders’ | | Common | | Treasury | | Retained | | Comprehensive | | Noncontrolling | | | Noncontrolling | | |||||||
|
| Equity |
| Stock |
| Stock |
| Earnings |
| Income (Loss) |
| Interests |
|
| Interest | | |||||||
| | | | | | | | | | | | | | | | | |
| | | |
| |
Three Months Ended May 3, 2020 | | | | | | | | | | | | | | | | | | | | | |||
Balance February 2, 2020 |
| $ | 11,930 | | $ | 4,675 | | $ | (17,549) | | $ | 30,129 | | $ | (5,329) | | $ | 4 | | | $ | 14 | |
Net income | |
| 666 | | | | | | | | | 666 | | | | | | | | | | | |
Other comprehensive loss | |
| (386) | | | | | | | | | | | | (386) | | | | | | | | |
Repurchases of common stock | |
| (149) | | | | | | (149) | | | | | | | | | | | | | | |
Treasury shares reissued | |
| 8 | | | | | | 8 | | | | | | | | | | | | | | |
Dividends declared | |
| (241) | | | | | | | | | (238) | | | | | | (3) | | | | | |
Noncontrolling interest redemption (Note 22) | | | | | | | | | | | | | | | | | | | | | | (14) | |
Stock options and other | |
| 37 | | | 38 | | | | | | (1) | | | | | | | | | | | |
Balance May 3, 2020 | | $ | 11,865 | | $ | 4,713 | | $ | (17,690) | | $ | 30,556 | | $ | (5,715) | | $ | 1 | | | | | |
| | | | | | | | | | | | | | | | | | | | | | | |
Six Months Ended May 3, 2020 | | | | | | | | | | | | | | |
| | | |
| | |||
Balance November 3, 2019 |
| $ | 11,417 | | $ | 4,642 | | $ | (17,474) | | $ | 29,852 | | $ | (5,607) | | $ | 4 | | | $ | 14 |
|
Net income | |
| 1,183 | | | | | | | | | 1,182 | | | | | | 1 | | | | 1 | |
Other comprehensive loss | |
| (108) | | | | | | | | | | | | (108) | | | | | | | | |
Repurchases of common stock | |
| (263) | | | | | | (263) | | | | | | | | | | | | | | |
Treasury shares reissued | |
| 47 | | | | | | 47 | | | | | | | | | | | | | | |
Dividends declared | |
| (480) | | | | | | | | | (477) | | | | | | (3) | | | | (1) | |
Noncontrolling interest redemption (Note 22) | | | | | | | | | | | | | | | | | | | | | | (14) | |
Stock options and other | |
| 69 | | | 71 | | | | | | (1) | | | | | | (1) | | | | | |
Balance May 3, 2020 | | $ | 11,865 | | $ | 4,713 | | $ | (17,690) | | $ | 30,556 | | $ | (5,715) | | $ | 1 | | | | | |
| | | | | | | | | | | | | | | | | | | | | | | |
Three Months Ended May 2, 2021 | | | | | | | | | | | | | | | | | | | | | |||
Balance January 31, 2021 | | $ | 14,086 | | $ | 4,942 | | $ | (18,377) | | $ | 32,596 | | $ | (5,078) | | $ | 3 | | | | | |
Net income | | | 1,790 | | | | | | | | | 1,790 | | | | | | | | | | | |
Other comprehensive income | | | 118 | | | | | | | | | | | | 118 | | | | | | | | |
Repurchases of common stock | | | (692) | | | | | | (692) | | | | | | | | | | | | | | |
Treasury shares reissued | | | 17 | | | | | | 17 | | | | | | | | | | | | | | |
Dividends declared | | | (282) | | | | | | | | | (282) | | | | | | | | | | | |
Stock options and other | | | 59 | | | 57 | | | | | | 1 | | | | | | 1 | | | | | |
Balance May 2, 2021 | | $ | 15,096 | | $ | 4,999 | | $ | (19,052) | | $ | 34,105 | | $ | (4,960) | | $ | 4 | | | | | |
| | | | | | | | | | | | | | | | | | | | | | | |
Six Months Ended May 2, 2021 | �� | | | | | | | | | | | | | | | | | | | | |||
Balance November 1, 2020 | | $ | 12,944 | | $ | 4,895 | | $ | (18,065) | | $ | 31,646 | | $ | (5,539) | | $ | 7 | | | | | |
ASU No. 2016-13 adoption (Note 3) | | | (35) | | | | | | | | | (35) | | | | | | | | | | | |
Net income | | | 3,014 | | | | | | | | | 3,013 | | | | | | 1 | | | | | |
Other comprehensive income | | | 579 | | | | | | | | | | | | 579 | | | | | | | | |
Repurchases of common stock | | | (1,044) | | | | | | (1,044) | | | | | | | | | | | | | | |
Treasury shares reissued | | | 57 | | | | | | 57 | | | | | | | | | | | | | | |
Dividends declared | | | (520) | | | | | | | | | (520) | | | | | | | | | | | |
Stock options and other | | | 101 | | | 104 | | | | | | 1 | | | | | | (4) | | | | | |
Balance May 2, 2021 | | $ | 15,096 | | $ | 4,999 | | $ | (19,052) | | $ | 34,105 | | $ | (4,960) | | $ | 4 | | | | | |
| | | | | | | | | | | | | | | | | | | | | | | |
See Condensed Notes to Interim Consolidated Financial Statements.
8
Condensed Notes to Interim Consolidated Financial Statements (Unaudited)
(1) Organization and Consolidation
The information in the notes and related commentary are presented in a format which includes data grouped as follows:
Consolidated – Represents the consolidation of the equipment operations and financial services. References to “Deere & Company” or “the Company” refer to the entire enterprise.
Equipment Operations – Represents the enterprise without financial services, while including the Company’s production and precision agriculture operations, small agriculture and turf operations, construction and forestry operations, and other corporate assets, liabilities, revenues, and expenses not reflected within financial services.
Financial Services – Includes primarily the Company’s financing operations.
Beginning in fiscal year 2021, the Company implemented a new strategy, operating model, and reporting structure. With this change, the Company’s agriculture and turf operations were divided into two new segments: production and precision agriculture and small agriculture and turf. There were no changes to the construction and forestry and financial services segments. In addition, at the beginning of fiscal year 2021 the Company also reclassified goodwill from identifiable operating assets to corporate assets for segment reporting, as goodwill is no longer considered in evaluating the operating performance of the segments. Additional information on the new segments and the segment financial results are presented in Note 10. Prior period segment information was recast for a consistent presentation. References to agriculture and turf include both production and precision agriculture and small agriculture and turf.
The Company uses a 52/53 week fiscal year with quarters ending on the last Sunday in the reporting period. The second quarter ends for fiscal year 2021 and 2020 were May 2, 2021 and May 3, 2020, respectively. Both second quarters contained 13 weeks, while both year-to-date periods contained 26 weeks.
Prior to November 2, 2020, the operating results of the Wirtgen Group (Wirtgen) were incorporated into the Company’s consolidated financial statements using a one-month lag period. In the first quarter of 2021, the reporting lag was eliminated resulting in one additional month of Wirtgen activity in the first quarter and the year-to-date period. The effect was an increase to “Net sales” of $270 million, which the Company considers immaterial to construction and forestry’s annual net sales. Prior period results were not restated.
Variable Interest Entities
The Company consolidates certain variable interest entities (VIEs) related to retail note securitizations (see Note 12).
The Company also has an interest in a joint venture that manufactures construction equipment in Brazil for local and overseas markets. The joint venture is a VIE; however, the Company is not the primary beneficiary. Therefore, the entity’s financial results are not fully consolidated in the Company’s consolidated financial statements, but are included on the equity basis. The maximum exposure to loss was $7 million, $5 million, and $13 million at May 2, 2021, November 1, 2020, and May 3, 2020, respectively.
(2) Summary of Significant Accounting Policies and Cash Flow Information
The interim consolidated financial statements of Deere & Company have been prepared by the Company, without audit, pursuant to the rules and regulations of the U.S. Securities and Exchange Commission (SEC). Certain information and footnote disclosures normally included in annual financial statements prepared in accordance with accounting principles generally accepted in the U.S. have been condensed or omitted as permitted by such rules and regulations. All adjustments, consisting of normal recurring adjustments, have been included. Management believes the disclosures are adequate to present fairly the financial position, results of operations, and cash flows at the dates and for the periods presented. It is suggested these interim consolidated financial statements be read in conjunction with the consolidated financial statements and the notes thereto appearing in the Company’s latest annual report on Form 10-K. Results for interim periods are not necessarily indicative of those to be expected for the fiscal year.
The preparation of financial statements in conformity with accounting principles generally accepted in the U.S. requires management to make estimates and assumptions that affect the reported amounts and related disclosures. The COVID pandemic has resulted in uncertainties in the Company’s business, which may result in actual results differing from those estimates.
9
Cash Flow Information
All cash flows from the changes in trade accounts and notes receivable are classified as operating activities in the statement of consolidated cash flows as these receivables arise from sales to the Company’s customers. Cash flows from financing receivables that are related to sales to the Company’s customers are also included in operating activities. The remaining financing receivables are related to the financing of equipment sold by independent dealers and are included in investing activities.
The Company had the following non-cash operating and investing activities that were not included in the statement of consolidated cash flows. The Company transferred inventory to equipment on operating leases of approximately $267 million and $254 million in the first six months of 2021 and 2020, respectively. The Company also had accounts payable related to purchases of property and equipment of approximately $40 million and $46 million at May 2, 2021 and May 3, 2020, respectively.
The Company’s restricted cash held at May 2, 2021, November 1, 2020, May 3, 2020, and November 3, 2019 was as follows in millions of dollars:
| | | | | | | | | | | | | |
| | May 2 | | November 1 | | May 3 | | November 3 | | ||||
| | 2021 | | 2020 | | 2020 | | 2019 | | ||||
Equipment operations | | $ | 12 | | $ | 11 | | $ | 11 | | $ | 21 | |
Financial services | | | 87 | | | 95 | | | 92 | | | 78 | |
Total | | $ | 99 | | $ | 106 | | $ | 103 | | $ | 99 | |
The equipment operations’ restricted cash relates to miscellaneous operational activities. The financial services restricted cash primarily relates to securitization of financing receivables (see Note 12). The restricted cash is recorded in “Other assets” in the consolidated balance sheet.
(3) New Accounting Standards
New Accounting Standards Adopted
In the first quarter of 2021, the Company adopted Financial Accounting Standards Board (FASB) Accounting Standards Update (ASU) No. 2016-13, Measurement of Credit Losses on Financial Instruments, which establishes Accounting Standards Codification (ASC) 326, Financial Instruments - Credit Losses. This ASU was adopted using a modified-retrospective approach. The ASU, along with related amendments, revised the measurement of credit losses for financial assets measured at amortized cost from an incurred loss to an expected loss methodology. The ASU affects receivables, debt securities, net investment in leases, and most other financial assets that represent a right to receive cash.
The Company holds deposits from dealers (dealer deposits), which are recorded in “Accounts payable and accrued liabilities” to absorb certain credit losses. Prior to adopting this ASU, the allowance for credit losses was estimated on probable credit losses incurred after consideration of recoveries from dealer deposits. The ASU considers dealer deposits and certain credit insurance contracts as freestanding credit enhancements. As a result, after adoption, credit losses recovered from dealer deposits and certain credit insurance contracts are presented in “Other income” and no longer as part of the allowance for credit losses or the provision for credit losses. The ASU also modified the treatment of the estimated write-off of delinquent receivables by no longer including the estimated benefit of charges to the dealer deposits in the write-off amount. This change increases the estimated write-offs on delinquent financing receivables with the benefit of credit losses recovered from dealer deposits presented in “Other income.” This benefit, in both situations, is recorded when the dealer deposits are charged and no longer based on estimated recoveries.
The effects of adopting the ASU on the consolidated balance sheet were as follows in millions of dollars:
| | | | | | | | | | |
| | November 1 | | Cumulative Effect | | November 2 | | |||
| | 2020 | | from Adoption | | 2020 | | |||
Assets | | | | | | | | | | |
Trade accounts and note receivable - net | | $ | 4,171 | | $ | 2 | | $ | 4,173 | |
Financing receivables - net | | | 29,750 | | | (27) | | | 29,723 | |
Financing receivables securitized - net | | | 4,703 | | | (4) | | | 4,699 | |
Deferred income taxes | | | 1,499 | | | 1 | | | 1,500 | |
| | | | | | | | | | |
Liabilities | | | | | | | | | | |
Accounts payable and accrued expenses | | $ | 10,112 | | $ | 14 | | $ | 10,126 | |
Deferred income taxes | | | 519 | | | (7) | | | 512 | |
| | | | | | | | | | |
Stockholders’ equity | | | | | | | | | | |
Retained earnings | | $ | 31,646 | | $ | (35) | | $ | 31,611 | |
10
Note 11 contains additional disclosures as well as the Company’s updated allowance for credit losses accounting policy.
The Company also adopted the following standards in 2021, none of which had a material effect on the Company’s consolidated financial statements:
| | |
No. 2018-15 | Customer’s Accounting for Implementation Costs Incurred in a Cloud Computing Arrangement That Is a Service Contract, which amends ASC 350-40, Intangibles – Goodwill and Other – Internal-Use Software | |
No. 2019-04 | Codification Improvements to Topic 326, Financial Instruments – Credit Losses, Topic 815, Derivatives and Hedging, and Topic 825, Financial Instruments | |
No. 2021-01 | Reference Rate Reform (Topic 848): Scope | |
New Accounting Standards to be Adopted
The Company will adopt the following standards in future periods, none of which are expected to have a material effect on the Company’s consolidated financial statements:
| | |
No. 2019-12 | Simplifying the Accounting for Income Taxes, which amends ASC 740, Income Taxes | |
No. 2020-08 | Codification Improvements to Subtopic 310-20, Receivables – Nonrefundable Fees and Other Costs | |
(4) Revenue Recognition
The Company’s revenue by primary geographical market, major product line, and timing of revenue recognition was as follows in millions of dollars:
| | | | | | | | | | | | | | | | |
| | Three Months Ended May 2, 2021 | | |||||||||||||
|
| Production & Precision Ag |
| Small Ag & Turf |
| Construction |
| Financial |
| Total | | |||||
Primary geographical markets: | | | | | | | | | | | |
| | |
| |
United States | | $ | 2,211 | | $ | 1,838 | | $ | 1,481 | | $ | 608 | | $ | 6,138 | |
Canada | | | 252 | | | 144 | | | 320 | |
| 153 | |
| 869 | |
Western Europe | | | 589 | | | 738 | | | 514 | |
| 26 | |
| 1,867 | |
Central Europe and CIS | | | 531 | | | 160 | | | 209 | |
| 9 | |
| 909 | |
Latin America | | | 700 | | | 103 | | | 220 | |
| 60 | |
| 1,083 | |
Asia, Africa, Australia, New Zealand, and Middle East | | | 319 | | | 444 | | | 393 | | | 36 | | | 1,192 | |
Total | | $ | 4,602 | | $ | 3,427 | | $ | 3,137 | | $ | 892 | | $ | 12,058 | |
| | | | | | | | | | | | | | | | |
Major product lines: | | | | | | | | | | | |
| | |
| |
Production agriculture | | $ | 4,466 | | | | | | | | | | | $ | 4,466 | |
Small agriculture | | | | | $ | 2,417 | | | | |
| | |
| 2,417 | |
Turf | | | | | | 898 | | | | |
| | |
| 898 | |
Construction | | | | | | | | $ | 1,232 | |
| | |
| 1,232 | |
Compact construction | | | | | | | | | 396 | | | | | | 396 | |
Roadbuilding | | | | | | | | | 1,066 | |
| | |
| 1,066 | |
Forestry | | | | | | | | | 343 | |
| | |
| 343 | |
Financial products | | | 12 | | | 10 | | | 5 | | $ | 892 | |
| 919 | |
Other | | | 124 | | | 102 | | | 95 | |
| | |
| 321 | |
Total | | $ | 4,602 | | $ | 3,427 | | $ | 3,137 | | $ | 892 | | $ | 12,058 | |
| | | | | | | | | | | | | | | | |
Timing of revenue recognition: | | | | | | | | | | | |
| | |
| |
Revenue recognized at a point in time | | $ | 4,562 | | $ | 3,412 | | $ | 3,114 | | $ | 26 | | $ | 11,114 | |
Revenue recognized over time | | | 40 | | | 15 | | | 23 | | | 866 | | | 944 | |
Total | | $ | 4,602 | | $ | 3,427 | | $ | 3,137 | | $ | 892 | | $ | 12,058 | |
11
| | | | | | | | | | | | | | | | |
|
| Six Months Ended May 2, 2021 | | |||||||||||||
| | Production & Precision Ag |
| Small Ag & Turf |
| Construction |
| Financial |
| Total | | |||||
Primary geographical markets: | | | | | | | | | | | | | | | | |
United States | | $ | 3,820 | | $ | 3,261 | | $ | 2,683 | | $ | 1,206 | | $ | 10,970 | |
Canada | | | 364 | | | 223 | | | 508 | |
| 307 | |
| 1,402 | |
Western Europe | | | 1,038 | | | 1,224 | | | 953 | |
| 50 | |
| 3,265 | |
Central Europe and CIS | | | 692 | | | 244 | | | 387 | |
| 18 | |
| 1,341 | |
Latin America | | | 1,213 | | | 180 | | | 390 | |
| 119 | |
| 1,902 | |
Asia, Africa, Australia, New Zealand, and Middle East | | | 623 | | | 845 | | | 746 | | | 76 | | | 2,290 | |
Total | | $ | 7,750 | | $ | 5,977 | | $ | 5,667 | | $ | 1,776 | | $ | 21,170 | |
| | | | | | | | | | | | | | | | |
Major product lines: | | | | | | | | | | | |
| | |
| |
Production agriculture | | $ | 7,478 | | | | | | | | | | | $ | 7,478 | |
Small agriculture | | | | | $ | 4,228 | | | | |
| | |
| 4,228 | |
Turf | | | | | | 1,549 | | | | |
| | |
| 1,549 | |
Construction | | | | | | | | $ | 2,119 | |
| | |
| 2,119 | |
Compact construction | | | | | | | | | 742 | | | | | | 742 | |
Roadbuilding | | | | | | | | | 1,976 | |
| | |
| 1,976 | |
Forestry | | | | | | | | | 633 | | | | |
| 633 | |
Financial products | | | 28 | | | 20 | | | 12 | | $ | 1,776 | |
| 1,836 | |
Other | | | 244 | | | 180 | | | 185 | |
| | |
| 609 | |
Total | | $ | 7,750 | | $ | 5,977 | | $ | 5,667 | | $ | 1,776 | | $ | 21,170 | |
| | | | | | | | | | | | | | | | |
Timing of revenue recognition: | | | | | | | | | | | |
| | |
| |
Revenue recognized at a point in time | | $ | 7,668 | | $ | 5,946 | | $ | 5,614 | | $ | 50 | | $ | 19,278 | |
Revenue recognized over time | | | 82 | | | 31 | | | 53 | | | 1,726 | | | 1,892 | |
Total | | $ | 7,750 | | $ | 5,977 | | $ | 5,667 | | $ | 1,776 | | $ | 21,170 | |
| | | | | | | | | | | | | | | | |
| | Three Months Ended May 3, 2020 | | |||||||||||||
|
| Production & Precision Ag |
| Small Ag & Turf |
| Construction |
| Financial |
| Total | | |||||
Primary geographical markets: | | | | | | | | | | | |
| | |
| |
United States | | $ | 1,841 | | $ | 1,540 | | $ | 1,263 | | $ | 604 | | $ | 5,248 | |
Canada | | | 177 | | | 89 | | | 166 | |
| 151 | |
| 583 | |
Western Europe | | | 540 | | | 571 | | | 358 | | | 22 | |
| 1,491 | |
Central Europe and CIS | | | 258 | | | 80 | | | 140 | | | 8 | |
| 486 | |
Latin America | | | 394 | | | 64 | | | 135 | | | 60 | |
| 653 | |
Asia, Africa, Australia, New Zealand, and Middle East | | | 221 | | | 290 | | | 251 | | | 30 | | | 792 | |
Total | | $ | 3,431 | | $ | 2,634 | | $ | 2,313 | | $ | 875 | | $ | 9,253 | |
| | | | | | | | | | | | | | | | |
Major product lines: | | | | | | | | | | | |
| | |
| |
Production agriculture | | $ | 3,280 | | | | | | | | | | | $ | 3,280 | |
Small agriculture | | | | | $ | 1,771 | | | | |
| | |
| 1,771 | |
Turf | | | | | | 806 | | | | |
| | |
| 806 | |
Construction | | | | | | | | $ | 877 | |
| | |
| 877 | |
Compact construction | | | | | | | | | 339 | | | | | | 339 | |
Roadbuilding | | | | | | | | | 723 | |
| | |
| 723 | |
Forestry | | | | | | | | | 254 | |
| | |
| 254 | |
Financial products | | | 13 | | | 8 | | | 6 | | $ | 875 | |
| 902 | |
Other | | | 138 | | | 49 | | | 114 | |
| | |
| 301 | |
Total | | $ | 3,431 | | $ | 2,634 | | $ | 2,313 | | $ | 875 | | $ | 9,253 | |
| | | | | | | | | | | | | | | | |
Timing of revenue recognition: | | | | | | | | | | | |
| | |
| |
Revenue recognized at a point in time | | $ | 3,396 | | $ | 2,620 | | $ | 2,287 | | $ | 26 | | $ | 8,329 | |
Revenue recognized over time | | | 35 | | | 14 | | | 26 | | | 849 | | | 924 | |
Total | | $ | 3,431 | | $ | 2,634 | | $ | 2,313 | | $ | 875 | | $ | 9,253 | |
12
| | | | | | | | | | | | | | | | |
| | Six Months Ended May 3, 2020 | | |||||||||||||
|
| Production & Precision Ag |
| Small Ag & Turf |
| Construction |
| Financial |
| Total | | |||||
Primary geographical markets: | | | | | | | | | | | | | | | | |
United States | | $ | 3,276 | | $ | 2,605 | | $ | 2,283 | | $ | 1,247 | | $ | 9,411 | |
Canada | | | 261 | | | 143 | | | 338 | | | 307 | |
| 1,049 | |
Western Europe | | | 905 | | | 984 | | | 697 | | | 44 | |
| 2,630 | |
Central Europe and CIS | | | 389 | | | 169 | | | 299 | | | 18 | |
| 875 | |
Latin America | | | 778 | | | 135 | | | 294 | | | 126 | |
| 1,333 | |
Asia, Africa, Australia, New Zealand, and Middle East | | | 410 | | | 605 | | | 507 | | | 64 | | | 1,586 | |
Total | | $ | 6,019 | | $ | 4,641 | | $ | 4,418 | | $ | 1,806 | | $ | 16,884 | |
| | | | | | | | | | | | | | | | |
Major product lines: | | | | | | | | | | | |
| | |
| |
Production agriculture | | $ | 5,706 | | | | | | | | | | | $ | 5,706 | |
Small agriculture | | | | | $ | 3,249 | | | | | | | |
| 3,249 | |
Turf | | | | | | 1,274 | | | | | | | |
| 1,274 | |
Construction | | | | | | | | $ | 1,718 | | | | |
| 1,718 | |
Compact construction | | | | | | | | | 627 | | | | | | 627 | |
Roadbuilding | | | | | | | | | 1,328 | | | | |
| 1,328 | |
Forestry | | | | | | | | | 528 | | | | |
| 528 | |
Financial products | | | 34 | | | 14 | | | 13 | | $ | 1,806 | |
| 1,867 | |
Other | | | 279 | | | 104 | | | 204 | | | | |
| 587 | |
Total | | $ | 6,019 | | $ | 4,641 | | $ | 4,418 | | $ | 1,806 | | $ | 16,884 | |
| | | | | | | | | | | | | | | | |
Timing of revenue recognition: | | | | | | | | | | | |
| | |
| |
Revenue recognized at a point in time | | $ | 5,941 | | $ | 4,615 | | $ | 4,366 | | $ | 52 | | $ | 14,974 | |
Revenue recognized over time | | | 78 | | | 26 | | | 52 | | | 1,754 | | | 1,910 | |
Total | | $ | 6,019 | | $ | 4,641 | | $ | 4,418 | | $ | 1,806 | | $ | 16,884 | |
Following is a description of the Company’s major product lines:
Production agriculture – Includes net sales of large and certain mid-size tractors and associated attachments, combines, cotton pickers, cotton strippers, and sugarcane harvesters, sugarcane loaders and pull behind scrapers, tillage, seeding, and application equipment, including sprayers, nutrient management and soil preparation machinery, and related attachments and service parts.
Small agriculture – Includes net sales of mid-size and utility tractors, self-propelled forage harvesters, hay and forage equipment, balers, mowers, and related attachments and service parts.
Turf – Includes net sales of turf and utility equipment, including riding lawn equipment, golf course equipment, utility vehicles, and commercial mowing equipment, along with a broad line of associated implements, other outdoor power products, and related service parts.
Construction – Includes net sales of a broad range of machines used in construction, earthmoving, and material handling, including backhoe loaders, crawler dozers and loaders, four-wheel-drive loaders, excavators, motor graders, articulated dump trucks, and related attachments and service parts.
Compact construction – Includes net sales of smaller construction equipment, including compact excavators, compact track loaders, compact wheel loaders, skid steers, landscape loaders, and related attachments and service parts.
Roadbuilding – Includes net sales of equipment used in roadbuilding and renovation, including milling machines, recyclers, slipform pavers, surface miners, asphalt pavers, compactors, tandem and static rollers, mobile crushers and screens, mobile and stationary asphalt plants, and related attachments and service parts.
Forestry – Includes net sales of equipment used in timber harvesting, including log skidders, feller bunchers, log loaders, log forwarders, log harvesters, and related attachments and service parts.
Financial products – Includes finance and interest income primarily from retail notes related to sales of John Deere equipment to end customers, wholesale financing to dealers of John Deere equipment, and revolving charge accounts; lease income from retail leases of John Deere equipment; and revenue from extended warranties.
13
Other – Includes sales of components to other equipment manufacturers that are included in “Net sales”; and revenue earned over time from precision guidance, telematics, and other information enabled solutions, revenue from service performed at Company owned dealerships and service centers, gains on disposition of property and businesses, trademark licensing revenue, and other miscellaneous revenue items that are included in “Other income.”
The Company invoices in advance of recognizing the sale of certain products and the revenue for certain services. These items are primarily for premiums for extended warranties, advance payments for future equipment sales, and subscription and service revenue related to precision guidance and telematic services. These advanced customer payments are presented as deferred revenue, a contract liability, in “Accounts payable and accrued expenses” in the consolidated balance sheet. The deferred revenue received, but not recognized in revenue, including extended warranty premiums also shown in Note 18, was $1,249 million, $1,090 million, and $1,077 million at May 2, 2021, November 1, 2020, and May 3, 2020, respectively. The contract liability is reduced as the revenue is recognized. During the three months ended May 2, 2021 and May 3, 2020, $111 million and $97 million, respectively, of revenue was recognized from deferred revenue that was recorded as a contract liability at the beginning of the respective fiscal year. During the six months ended May 2, 2021 and May 3, 2020, $335 million and $278 million, respectively, of revenue was recognized from deferred revenue that was recorded as a contract liability at the beginning of the respective fiscal year.
The Company entered into contracts with customers to deliver equipment and services that have not been recognized at May 2, 2021 because the equipment or services have not been provided. These contracts primarily relate to extended warranty and certain precision guidance and telematic services. The amount of unsatisfied performance obligations for contracts with an original duration greater than one year is $962 million at May 2, 2021. The estimated revenue to be recognized by fiscal year follows in millions of dollars: remainder of 2021 - $199, 2022 - $318, 2023 - $224, 2024 - $130, 2025 - $58, 2026 - $30 and later years - $3. The Company discloses unsatisfied performance obligations with an original contract duration greater than one year. The contracts with an expected duration of one year or less are generally for sales to dealers and end customers for equipment, service parts, repair services, and certain telematics services.
During 2020, and to a much lesser extent in 2021, the Company provided short-term payment relief on trade accounts and notes receivables to independent dealers and certain other customers that were negatively affected by the economic effects of COVID. The relief was provided both in regional programs and case-by-case situations with creditworthy customers. This relief generally included payment deferrals not exceeding three months, extending interest-free periods for up to an additional three months with the total interest-free period not to exceed one year, or reducing interest rates for a maximum of three months. The trade receivable balance granted relief since the beginning of the pandemic that remained outstanding at May 2, 2021 was not material.
(5) Other Comprehensive Income Items
The after-tax changes in accumulated other comprehensive income (loss) was as follows in millions of dollars:
| | | | | | | | | | | | | | | | |
|
| |
| | |
| | |
| | |
| Total |
| ||
| | | | | | | Unrealized | | Unrealized | | Accumulated | | ||||
| | Retirement | | Cumulative | | Gain (Loss) | | Gain (Loss) | | Other | | |||||
| | Benefits | | Translation | | on | | on | | Comprehensive | | |||||
| | Adjustment | | Adjustment | | Derivatives | | Debt Securities | | Income (Loss) | | |||||
Balance November 3, 2019 | | $ | (3,915) | | $ | (1,651) |
| $ | (60) | | $ | 19 | | $ | (5,607) | |
Other comprehensive income (loss) items before reclassification | |
| 186 | | | (398) | | | (13) | | | 11 | |
| (214) | |
Amounts reclassified from accumulated other comprehensive income | |
| 101 | | | | | | 5 | | | | |
| 106 | |
Net current period other comprehensive income (loss) | |
| 287 | |
| (398) | |
| (8) | |
| 11 | |
| (108) | |
Balance May 3, 2020 | | $ | (3,628) | | $ | (2,049) | | $ | (68) | | $ | 30 | | $ | (5,715) | |
| | | | | | | | | | | | | | | | |
Balance November 1, 2020 | | $ | (3,918) | | $ | (1,596) | | $ | (58) | | $ | 33 | | $ | (5,539) | |
Other comprehensive income (loss) items before reclassification | | | 31 | | | 433 | | | | | | (15) | | | 449 | |
Amounts reclassified from accumulated other comprehensive income | | | 123 | | | | | | 7 | | | | | | 130 | |
Net current period other comprehensive income (loss) | | | 154 | | | 433 | | | 7 | | | (15) | | | 579 | |
Balance May 2, 2021 | | $ | (3,764) |
| $ | (1,163) |
| $ | (51) |
| $ | 18 |
| $ | (4,960) | |
14
Following are amounts recorded in and reclassifications out of other comprehensive income (loss), and the income tax effects, in millions of dollars. Retirement benefits adjustment reclassifications for actuarial gain (loss), prior service (credit) cost, and settlements are included in net periodic pension and other postretirement benefit costs (see Note 8).
| | | | | | | | | | |
|
| Before |
| Tax |
| After |
| |||
| | Tax | | (Expense) | | Tax |
| |||
Three Months Ended May 2, 2021 | | Amount | | Credit | | Amount |
| |||
Cumulative translation adjustment | | $ | 37 | | | | | $ | 37 | |
Unrealized gain (loss) on derivatives: | | | | | | | | | | |
Reclassification of realized (gain) loss to: | | | | | | | | | | |
Interest rate contracts – Interest expense | | | 4 | | $ | (1) | | | 3 | |
Net unrealized gain (loss) on derivatives | | | 4 | | | (1) | | | 3 | |
Unrealized gain (loss) on debt securities: | | | | | | | | | | |
Unrealized holding gain (loss) | | | (14) | | | 1 | | | (13) | |
Net unrealized gain (loss) on debt securities | | | (14) | | | 1 | | | (13) | |
Retirement benefits adjustment: | | | | | | | | | | |
Net actuarial gain (loss) | | | 41 | | | (9) | | | 32 | |
Reclassification to Other operating expenses through amortization of: | | | | | | | | | | |
Actuarial (gain) loss | | | 72 | | | (19) | | | 53 | |
Prior service (credit) cost | | | 2 | | | | | | 2 | |
Settlements | | | 5 | | | (1) | | | 4 | |
Net unrealized gain (loss) on retirement benefits adjustment | | | 120 | | | (29) | | | 91 | |
Total other comprehensive income (loss) |
| $ | 147 | | $ | (29) | | $ | 118 | |
| | | | | | | | | | |
|
| Before |
| Tax |
| After |
| |||
| | Tax | | (Expense) | | Tax |
| |||
Six Months Ended May 2, 2021 | | Amount | | Credit | | Amount |
| |||
Cumulative translation adjustment |
| $ | 431 | | $ | 2 | | $ | 433 | |
Unrealized gain (loss) on derivatives: | | | | | | | | | | |
Reclassification of realized (gain) loss to: | | | | | | | | | | |
Interest rate contracts – Interest expense | | | 9 | | | (2) | | | 7 | |
Net unrealized gain (loss) on derivatives | | | 9 | | | (2) | | | 7 | |
Unrealized gain (loss) on debt securities: | | | | | | | | | | |
Unrealized holding gain (loss) | | | (17) | | | 2 | | | (15) | |
Net unrealized gain (loss) on debt securities | | | (17) | | | 2 | | | (15) | |
Retirement benefits adjustment: | | | | | | | | | | |
Net actuarial gain (loss) | | | 40 | | | (9) | | | 31 | |
Reclassification to Other operating expenses through amortization of: | | | | | | | | | | |
Actuarial (gain) loss | | | 142 | | | (36) | | | 106 | |
Prior service (credit) cost | | | 4 | | | (1) | | | 3 | |
Settlements | | | 18 | | | (4) | | | 14 | |
Net unrealized gain (loss) on retirement benefits adjustment | | | 204 | | | (50) | | | 154 | |
Total other comprehensive income (loss) |
| $ | 627 | | $ | (48) | | $ | 579 | |
15
| | | | | | | | | | |
|
| Before |
| Tax |
| After |
| |||
| | Tax | | (Expense) | | Tax |
| |||
Three Months Ended May 3, 2020 | | Amount | | Credit | | Amount |
| |||
Cumulative translation adjustment |
| $ | (441) | | | | | $ | (441) | |
Unrealized gain (loss) on derivatives: | | | | | | | | | | |
Unrealized hedging gain (loss) | | | (15) | | $ | 3 | | | (12) | |
Reclassification of realized (gain) loss to: | | | | | | | | | | |
Interest rate contracts – Interest expense | | | 4 | | | | | | 4 | |
Net unrealized gain (loss) on derivatives | | | (11) | | | 3 | | | (8) | |
Unrealized gain (loss) on debt securities: | | | | | | | | | | |
Unrealized holding gain (loss) | | | 8 | | | (2) | | | 6 | |
Net unrealized gain (loss) on debt securities | | | 8 | | | (2) | | | 6 | |
Retirement benefits adjustment: | | | | | | | | | | |
Net actuarial gain (loss) | | | 1 | | | (1) | | | | |
Reclassification to Other operating expenses through amortization of: | | | | | | | | | | |
Actuarial (gain) loss | | | 69 | | | (17) | | | 52 | |
Prior service (credit) cost | | | 2 | | | | | | 2 | |
Settlements | | | 3 | | | | | | 3 | |
Net unrealized gain (loss) on retirement benefits adjustment | | | 75 | | | (18) | | | 57 | |
Total other comprehensive income (loss) |
| $ | (369) | | $ | (17) | | $ | (386) | |
| | | | | | | | | | |
|
| Before |
| Tax |
| After |
| |||
| | Tax | | (Expense) | | Tax |
| |||
Six Months Ended May 3, 2020 | | Amount | | Credit | | Amount |
| |||
Cumulative translation adjustment |
| $ | (398) |
| | | | $ | (398) | |
Unrealized gain (loss) on derivatives: | | | | | | | | | | |
Unrealized hedging gain (loss) | | | (17) | | $ | 4 | | | (13) | |
Reclassification of realized (gain) loss to: | | | | | | | | | | |
Interest rate contracts – Interest expense | | | 6 | | | (1) | | | 5 | |
Net unrealized gain (loss) on derivatives | | | (11) | | | 3 | | | (8) | |
Unrealized gain (loss) on debt securities: | | | | | | | | | | |
Unrealized holding gain (loss) | | | 14 | | | (3) | | | 11 | |
Net unrealized gain (loss) on debt securities | | | 14 | | | (3) | | | 11 | |
Retirement benefits adjustment: | | | | | | | | | | |
Net actuarial gain (loss) | | | 247 | | | (61) | | | 186 | |
Reclassification to Other operating expenses through amortization of: | | | | | | | | | | |
Actuarial (gain) loss | | | 138 | | | (45) | | | 93 | |
Prior service (credit) cost | | | 4 | | | (1) | | | 3 | |
Settlements | | | 6 | | | (1) | | | 5 | |
Net unrealized gain (loss) on retirement benefits adjustment | | | 395 | | | (108) | | | 287 | |
Total other comprehensive income (loss) |
| | | | $ | (108) | | $ | (108) | |
(6) Dividends Declared and Paid
Dividends declared and paid on a per share basis were as follows:
| | | | | | | | | | | | | |
| | Three Months Ended | | Six Months Ended |
| ||||||||
| | May 2 | | May 3 | | May 2 | | May 3 |
| ||||
| | 2021 | | 2020 | | 2021 | | 2020 |
| ||||
Dividends declared |
| $ | .90 |
| $ | .76 |
| $ | 1.66 |
| $ | 1.52 | |
Dividends paid | | $ | .76 | | $ | .76 | | $ | 1.52 | | $ | 1.52 | |
16
(7) Earnings Per Share
A reconciliation of basic and diluted net income per share attributable to Deere & Company follows in millions, except per share amounts:
| | | | | | | | | | | | | |
| | Three Months Ended | | Six Months Ended |
| ||||||||
| | May 2 | | May 3 | | May 2 | | May 3 |
| ||||
| | 2021 | | 2020 | | 2021 | | 2020 |
| ||||
Net income attributable to Deere & Company |
| $ | 1,790 |
| $ | 666 |
| $ | 3,013 |
| $ | 1,182 | |
Average shares outstanding | | | 312.8 | |
| 313.2 | | | 313.1 | |
| 313.3 | |
Basic per share | | $ | 5.72 | | $ | 2.13 | | $ | 9.62 | | $ | 3.77 | |
| | | | | | | | | | | | | |
Average shares outstanding | | | 312.8 | |
| 313.2 | | | 313.1 | |
| 313.3 | |
Effect of dilutive share-based compensation | | | 2.4 | |
| 3.0 | | | 2.5 | |
| 3.4 | |
Total potential shares outstanding | | | 315.2 | |
| 316.2 | | | 315.6 | |
| 316.7 | |
Diluted per share | | $ | 5.68 | | $ | 2.11 | | $ | 9.55 | | $ | 3.73 | |
During the second quarter and first six months of 2021, 0 shares were antidilutive. During the second quarter and first six months of 2020, 1.0 million shares and .6 million shares, respectively, were excluded from the above per share computation because the incremental shares would have been antidilutive.
(8) Pension and Other Postretirement Benefits
The Company has several defined benefit pension plans and postretirement benefit (OPEB) plans, primarily health care and life insurance plans, covering its U.S. employees and employees in certain foreign countries.
The worldwide components of net periodic pension cost consisted of the following in millions of dollars:
| | | | | | | | | | | | | |
| | Three Months Ended | | Six Months Ended |
| ||||||||
| | May 2 | | May 3 | | May 2 | | May 3 |
| ||||
| | 2021 | | 2020 | | 2021 | | 2020 |
| ||||
Service cost |
| $ | 83 |
| $ | 77 |
| $ | 168 |
| $ | 161 | |
Interest cost | | | 69 | |
| 87 | | | 138 | |
| 174 | |
Expected return on plan assets | | | (200) | |
| (204) | | | (400) | |
| (409) | |
Amortization of actuarial loss | | | 65 | |
| 62 | | | 128 | |
| 124 | |
Amortization of prior service cost | | | 3 | |
| 3 | | | 6 | |
| 6 | |
Settlements | | | 5 | |
| 3 | | | 18 | |
| 6 | |
Net cost | | $ | 25 | | $ | 28 | | $ | 58 | | $ | 62 | |
The worldwide components of net periodic OPEB cost consisted of the following in millions of dollars:
| | | | | | | | | | | | | |
| | Three Months Ended | | Six Months Ended |
| ||||||||
| | May 2 | | May 3 | | May 2 | | May 3 |
| ||||
| | 2021 | | 2020 | | 2021 | | 2020 |
| ||||
Service cost |
| $ | 12 |
| $ | 12 |
| $ | 24 |
| $ | 24 | |
Interest cost | | | 25 | |
| 35 | | | 51 | |
| 72 | |
Expected return on plan assets | | | (20) | |
| (12) | | | (39) | |
| (24) | |
Amortization of actuarial loss | | | 7 | |
| 7 | | | 14 | |
| 14 | |
Amortization of prior service credit | | | (1) | |
| (1) | | | (2) | |
| (2) | |
Curtailments | | | | | | | | | | | | 21 | |
Net cost | | $ | 23 | | $ | 41 | | $ | 48 | | $ | 105 | |
The components of net periodic pension and OPEB costs excluding the service cost component are included in the line item “Other operating expenses” in the statement of consolidated income.
17
In the first quarter of 2020, the Company remeasured the U.S. salary OPEB health care plans due to the U.S. voluntary employee-separation program (see Note 22), which resulted in a $21 million curtailment loss.
During the first six months of 2021, the Company contributed approximately $68 million to its pension plans and $85 million to its OPEB plans. The Company presently anticipates contributing an additional $33 million to its pension plans and $757 million to its OPEB plans during the remainder of fiscal year 2021. The anticipated OPEB contributions include a voluntary $700 million in the fourth quarter to a U.S. plan, which will increase plan assets. The pension and OPEB contributions exceeding the voluntary amount primarily include direct benefit payments from Company funds.
(9) Income Taxes
The Company’s unrecognized tax benefits at May 2, 2021, November 1, 2020, and May 3, 2020 were $751 million, $668 million, and $610 million, respectively. The liability at May 2, 2021, November 1, 2020, and May 3, 2020 consisted of approximately $189 million, $134 million, and $145 million, respectively, which would affect the effective tax rate if the tax benefits were recognized. The remaining liability was related to tax positions for which there are offsetting tax receivables, or the uncertainty was only related to timing. The Company expects that any reasonably possible change in the amounts of unrecognized tax benefits in the next 12 months would not be significant.
(10) Segment Reporting
Beginning in fiscal year 2021, the Company implemented a new strategy, operating model, and reporting structure. With this change, the Company’s agriculture and turf operations were divided into two new segments, which are described as follows:
The production and precision agriculture segment is responsible for defining, developing, and delivering global equipment and technology solutions to unlock customer value for production-scale growers of large grains, small grains, cotton, and sugar. Main products include large and certain mid-size tractors, combines, cotton pickers, sugarcane harvesters and loaders, and soil preparation, seeding, application and crop care equipment.
The small agriculture and turf segment is responsible for defining, developing, and delivering market-driven products to support mid-size and small growers and producers globally as well as turf customers. The operations are principally organized to support production systems for dairy and livestock, high-value crops, and turf and utility operators. Primary products include certain mid-size and small tractors, as well as hay and forage equipment, riding and commercial lawn equipment, golf course equipment, and utility vehicles.
There were no reporting changes for the construction and forestry and financial services segments. As a result, the Company has four reportable segments.
18
Worldwide net sales and revenues, operating profit, and identifiable assets by segment were as follows in millions of dollars. Operating profit is income from continuing operations before corporate expenses, certain external interest expense, certain foreign exchange gains and losses, and income taxes. Operating profit of the financial services segment includes the effect of interest expense and foreign exchange gains and losses. Reconciling items to net income are primarily corporate expenses, certain external interest expense, certain foreign exchange gains and losses, pension and OPEB benefit costs excluding the service cost component, and net income attributable to noncontrolling interests.
| | | | | | | | | | | | | | | | | |
| | Three Months Ended | | Six Months Ended |
| ||||||||||||
| | May 2 | | May 3 | | % | | May 2 | | May 3 | | % |
| ||||
| | 2021 | | 2020 | | Change | | 2021 | | 2020 | | Change |
| ||||
Net sales and revenues: |
| |
|
| |
|
|
|
| | |
| |
|
|
| |
Production & precision ag net sales |
| $ | 4,529 | | $ | 3,365 | | +35 |
| $ | 7,599 | | $ | 5,872 | | +29 | |
Small ag & turf net sales | | | 3,390 | | | 2,603 | | +30 | | | 5,904 | | | 4,583 | | +29 | |
Construction & forestry net sales | | | 3,079 | |
| 2,256 | | +36 | | | 5,546 | |
| 4,299 | | +29 | |
Financial services revenues | | | 892 | |
| 875 | | +2 | | | 1,776 | |
| 1,806 | | -2 | |
Other revenues | | | 168 | |
| 154 | | +9 | | | 345 | |
| 324 | | +6 | |
Total net sales and revenues |
| $ | 12,058 | | $ | 9,253 | | +30 |
| $ | 21,170 | | $ | 16,884 | | +25 | |
Operating profit: | | | | | | | | | | | | | | | | | |
Production & precision ag |
| $ | 1,007 | | $ | 568 | | +77 |
| $ | 1,651 | | $ | 786 | | +110 | |
Small ag & turf | | | 648 | | | 226 | | +187 | | | 1,117 | | | 381 | | +193 | |
Construction & forestry | | | 489 | |
| 96 | | +409 | | | 756 | |
| 189 | | +300 | |
Financial services | | | 295 | |
| 75 | | +293 | | | 553 | |
| 254 | | +118 | |
Total operating profit | | | 2,439 | |
| 965 | | +153 | | | 4,077 | |
| 1,610 | | +153 | |
Reconciling items | | | (119) | |
| (54) | | +120 | | | (226) | |
| (133) | | +70 | |
Income taxes | | | (530) | |
| (245) | | +116 | | | (838) | |
| (295) | | +184 | |
Net income attributable to Deere & Company |
| $ | 1,790 | | $ | 666 | | +169 |
| $ | 3,013 | | $ | 1,182 | | +155 | |
| | | | | | | | | | | | | | | | | |
Intersegment sales and revenues: | | | | | | | | | | | | | | | | | |
Production & precision ag net sales |
| $ | 7 | | $ | 7 | | |
| $ | 13 | | $ | 14 | | -7 | |
Small ag & turf net sales | | | 4 | | | 1 | | +300 | | | 8 | | | 1 | | +700 | |
Construction & forestry net sales | | | | | | | | | | | | |
| | | | |
Financial services | | | 62 | |
| 93 | | -33 | | | 112 | |
| 159 | | -30 | |
| | | | | | | | | | | | | | | | | |
Outside the U.S. and Canada: | | | | | | | | | | | | | | | | | |
Net sales and revenues |
| $ | 5,051 | | $ | 3,422 | | +48 |
| $ | 8,798 | | $ | 6,424 | | +37 | |
Operating profit | | | 1,003 | |
| 232 | | +332 | | | 1,633 | |
| 533 | | +206 | |
At the beginning of fiscal year 2021, the Company reclassified goodwill from identifiable operating segment assets to corporate assets for segment reporting, as goodwill is no longer considered in evaluating the operating performance of the segments. Prior period amounts have been restated for a consistent presentation.
| | | | | | | | | | |
|
| May 2 |
| November 1 | | May 3 |
| |||
| | 2021 | | 2020 | | 2020 |
| |||
Identifiable assets: | | | | | | | | | | |
Production & precision ag |
| $ | 6,602 | | $ | 5,708 | | $ | 6,328 | |
Small ag & turf | | | 3,605 | | | 3,266 | | | 3,485 | |
Construction & forestry | | | 6,500 | |
| 6,322 | |
| 6,984 | |
Financial services | | | 50,849 | |
| 48,719 | |
| 48,664 | |
Corporate | | | 11,423 | |
| 11,076 | |
| 11,865 | |
Total assets |
| $ | 78,979 | | $ | 75,091 | | $ | 77,326 | |
19
(11) Financing Receivables
The Company monitors the credit quality of financing receivables based on delinquency status. Past due balances of financing receivables still accruing finance income represent the total balance held (principal plus accrued interest) with any payment amounts 30 days or more past the contractual payment due date. Non-performing financing receivables represent loans for which the Company has ceased accruing finance income. The Company ceases accruing finance income, and accrued finance income previously recognized is reversed when these receivables are generally 90 days delinquent. Generally, when receivables are 120 days delinquent the estimated uncollectible amount from the customer is written off to the allowance for credit losses. Finance income for non-performing receivables is recognized on a cash basis. Accrual of finance income is generally resumed when the receivable becomes contractually current and collections are reasonably assured.
Due to the economic effects of COVID, the Company provided short-term payment relief to dealers and retail customers during 2020, and to a much lesser extent in 2021. The relief was provided in regional programs and on a case-by-case basis with customers that were generally current in their payment obligations. Financing receivables granted relief since the beginning of the pandemic that remained outstanding at May 2, 2021 represented approximately 4 percent of the financing receivables balance. The majority of financing receivables granted short-term relief are beyond the deferral period and have either resumed making payments or are reported as delinquent based on the modified payment schedule.
While the Company implemented a new strategy in fiscal year 2021 resulting in new operating segments, assets managed by financial services, including most financing receivables and equipment on operating leases, continue to be evaluated by market (agriculture and turf or construction and forestry).
The credit quality analysis of retail notes, financing leases, and revolving charge accounts (collectively, customer receivables), was as follows in millions of dollars at May 2, 2021:
| | | | | | | | | | | | | | | | | | | | | | | | | |
| | Year of Origination | | ||||||||||||||||||||||
| | 2021 | | 2020 | | 2019 | | 2018 | | 2017 | | Prior | | Revolving Charge Accounts | | Total | | ||||||||
Customer receivables: |
|
|
|
|
|
|
|
|
|
|
|
|
|
|
|
|
|
|
|
|
|
|
|
| |
Agriculture and turf | | | | | | | | | | | | | | | | | | | | | | | | | |
Current | | $ | 6,017 | | $ | 8,375 | | $ | 4,436 | | $ | 2,402 | | $ | 1,136 | | $ | 494 | | $ | 3,221 | | $ | 26,081 | |
30-59 days past due | | | 20 | | | 64 | | | 41 | | | 19 | | | 10 | | | 5 | | | 20 | | | 179 | |
60-89 days past due | | | 5 | | | 34 | | | 18 | | | 9 | | | 4 | | | 2 | | | 5 | | | 77 | |
90+ days past due | | | | | | | | | 1 | | | 1 | | | | | | | | | | | | 2 | |
Non-performing | | | 2 | | | 51 | | | 69 | | | 54 | | | 29 | | | 33 | | | 16 | | | 254 | |
Construction and forestry | | | | | | | | | | | | | | | | | | | | | | | | | |
Current | | | 1,568 | | | 2,077 | | | 1,106 | | | 454 | | | 118 | | | 22 | | | 81 | | | 5,426 | |
30-59 days past due | | | 21 | | | 43 | | | 35 | | | 14 | | | 5 | | | 1 | | | 3 | | | 122 | |
60-89 days past due | | | 6 | | | 13 | | | 12 | | | 7 | | | 3 | | | 1 | | | 1 | | | 43 | |
90+ days past due | | | | | | 2 | | | 10 | | | 5 | | | 6 | | | 3 | | | | | | 26 | |
Non-performing | | | 1 | | | 38 | | | 37 | | | 22 | | | 11 | | | 7 | | | 1 | | | 117 | |
Total customer receivables | | $ | 7,640 | | $ | 10,697 | | $ | 5,765 | | $ | 2,987 | | $ | 1,322 | | $ | 568 | | $ | 3,348 | | $ | 32,327 | |
20
The credit quality analysis of customer receivables was as follows in millions of dollars at November 1, 2020 and May 3, 2020:
| | | | | | | | | | | | | | | | | | | |
| | November 1, 2020 | | May 3, 2020 | | ||||||||||||||
| | Retail Notes & Financing Leases | | Revolving Charge Accounts | | Total | | Retail Notes & Financing Leases | | Revolving Charge Accounts | | Total | | ||||||
Customer receivables: | | | | | | | | | | | | | | | | | | | |
Agriculture and turf | | | | | | | | | | | | | | | | | | | |
Current | | $ | 21,597 | | $ | 3,787 | | $ | 25,384 | | $ | 19,178 | | $ | 3,282 | | $ | 22,460 | |
30-59 days past due | | | 135 | | | 13 | | | 148 | | | 215 | | | 32 | | | 247 | |
60-89 days past due | | | 64 | | | 4 | | | 68 | | | 103 | | | 13 | | | 116 | |
90+ days past due | | | 2 | | | | | | 2 | | | 3 | | | | | | 3 | |
Non-performing | | | 263 | | | 6 | | | 269 | | | 310 | | | 42 | | | 352 | |
Construction and forestry | | | | | | | | | | | | | | | | | | | |
Current | | | 4,859 | | | 88 | | | 4,947 | | | 4,169 | | | 78 | | | 4,247 | |
30-59 days past due | | | 111 | | | 2 | | | 113 | | | 174 | | | 4 | | | 178 | |
60-89 days past due | | | 55 | | | 1 | | | 56 | | | 58 | | | 2 | | | 60 | |
90+ days past due | | | 14 | | | | | | 14 | | | 18 | | | | | | 18 | |
Non-performing | | | 106 | | | 1 | | | 107 | | | 176 | | | 1 | | | 177 | |
Total customer receivables | | $ | 27,206 | | $ | 3,902 | | $ | 31,108 | | $ | 24,404 | | $ | 3,454 | | $ | 27,858 | |
The credit quality analysis of wholesale receivables was as follows in millions of dollars at May 2, 2021:
| | | | | | | | | | | | | | | | | | | | | | | | | |
| | Year of Origination | | ||||||||||||||||||||||
| | 2021 | | 2020 | | 2019 | | 2018 | | 2017 | | Prior | | Revolving | | Total | | ||||||||
Wholesale receivables: |
|
|
|
|
|
|
|
|
|
|
|
|
|
|
|
|
|
|
|
|
|
|
|
| |
Agriculture and turf | | | | | | | | | | | | | | | | | | | | | | | | | |
Current | | $ | 191 | | $ | 144 | | $ | 55 | | $ | 13 | | $ | 4 | | $ | 1 | | $ | 2,146 | | $ | 2,554 | |
30-59 days past due | | | | | | | | | | | | | | | | | | | | | | | | | |
60-89 days past due | | | | | | | | | | | | | | | | | | | | | | | | | |
90+ days past due | | | | | | | | | | | | | | | | | | | | | | | | | |
Non-performing | | | | | | | | | 22 | | | | | | | | | | | | | | | 22 | |
Construction and forestry | | | | | | | | | | | | | | | | | | | | | | | | | |
Current | | | 5 | | | 10 | | | 15 | | | 1 | | | 1 | | | 3 | | | 341 | | | 376 | |
30-59 days past due | | | | | | | | | | | | | | | | | | | | | | | | | |
60-89 days past due | | | | | | | | | | | | | | | | | | | | | | | | | |
90+ days past due | | | | | | | | | | | | | | | | | | | | | | | | | |
Non-performing | | | | | | | | | | | | | | | | | | | | | | | | | |
Total wholesale receivables | | $ | 196 | | $ | 154 | | $ | 92 | | $ | 14 | | $ | 5 | | $ | 4 | | $ | 2,487 | | $ | 2,952 | |
The credit quality analysis of wholesale receivables was as follows in millions of dollars at November 1, 2020 and May 3, 2020:
| | | | | | | |
| | November 1 | | May 3 | | ||
| | 2020 | | 2020 | | ||
Wholesale receivables: | | | | | | | |
Agriculture and turf | | | | | | | |
Current | | $ | 3,010 | | $ | 3,704 | |
30-59 days past due | | | | | | | |
60-89 days past due | | | | | | | |
90+ days past due | | | | | | | |
Non-performing | | | 47 | | | 62 | |
Construction and forestry | | | | | | | |
Current | | | 472 | | | 510 | |
30-59 days past due | | | | | | | |
60-89 days past due | | | | | | | |
90+ days past due | | | | | | | |
Non-performing | | | | | | 2 | |
Total wholesale receivables | | $ | 3,529 | | $ | 4,278 | |
The allowance for credit losses is an estimate of the credit losses expected over the life of the Company’s receivable portfolio. The Company measures expected credit losses on a collective basis when similar risk characteristics exist. Risk characteristics
21
considered by the Company include finance product category, market, geography, credit risk, and remaining duration. Receivables that do not share risk characteristics with other receivables in the portfolio are evaluated on an individual basis. Non-performing financing receivables are included in the estimate of expected credit losses.
The Company utilizes loss forecast models, which are selected based on the size and credit risk of the underlying pool of receivables, to estimate expected credit losses. Transition matrix models are used for large and complex customer receivable pools, while weighted average remaining maturity models are used for smaller and less complex customer receivable pools. Expected credit losses on wholesale receivables are based on historical loss rates, adjusted for current economic conditions. The modeled expected credit losses are adjusted based on reasonable and supportable forecasts, which may include economic indicators such as commodity prices, industry equipment sales, unemployment rates, and housing starts. Management reviews each model’s output quarterly, and qualitative adjustments are incorporated as necessary.
An analysis of the allowance for credit losses and investment in financing receivables follows in millions of dollars during the periods:
| | | | | | | | | | | | | |
| | Retail Notes | | Revolving | | | | | | | | ||
| | & Financing | | Charge | | Wholesale | | | | | |||
| | Leases | | Accounts | | Receivables | | Total | | ||||
Three Months Ended May 2, 2021 | | | | | | | | | | | | | |
Allowance: |
|
|
|
|
|
|
|
|
|
| | |
|
Beginning of period balance |
| $ | 180 |
| $ | 24 | | $ | 7 | | $ | 211 | |
Provision (credit) | | | (17) | | | (6) | | | | | | (23) | |
Write-offs | | | (15) | | | (9) | | | | | | (24) | |
Recoveries | | | 4 | | | 10 | | | | | | 14 | |
End of period balance |
| $ | 152 |
| $ | 19 | | $ | 7 | | $ | 178 | |
| | | | | | | | | | | | | |
Six Months Ended May 2, 2021 | | | | | | | | | | | | | |
Allowance: |
| | | | | | | | | | | | |
Beginning of period balance |
| $ | 133 |
| $ | 43 | | $ | 8 | | $ | 184 | |
ASU No. 2016-13 adoption | | | 44 | | | (13) | | | | | | 31 | |
Provision (credit) | | | (13) | | | (16) | | | (1) | | | (30) | |
Write-offs | | | (23) | | | (14) | | | | | | (37) | |
Recoveries | | | 10 | | | 19 | | | | | | 29 | |
Translation adjustments | | | 1 | | | | | | | | | 1 | |
End of period balance |
| $ | 152 |
| $ | 19 | | $ | 7 | | $ | 178 | |
Financing receivables: | | | | | | | | | | | | | |
End of period balance |
| $ | 28,979 |
| $ | 3,348 | | $ | 2,952 | | $ | 35,279 | |
| | | | | | | | | | | | | |
| | Retail Notes | | Revolving | | | | | | |
| ||
| | & Financing | | Charge | | Wholesale | | | |
| |||
| | Leases | | Accounts | | Receivables | | Total | | ||||
Three Months Ended May 3, 2020 | | | | | | | | | | | | | |
Allowance: |
| |
|
| |
|
| |
|
| |
| |
Beginning of period balance | | $ | 106 |
| $ | 40 | | $ | 11 | | $ | 157 | |
Provision | |
| 65 | | | 20 | | | | |
| 85 | |
Write-offs | |
| (26) | | | (23) | | | | |
| (49) | |
Recoveries | |
| 3 | | | 6 | | | | |
| 9 | |
Translation adjustments | |
| (7) | | | | | | | |
| (7) | |
End of period balance | | $ | 141 | | $ | 43 | | $ | 11 | | $ | 195 | |
| | | | | | | | | | | | | |
Six Months Ended May 3, 2020 | | | | | | | | | | | | | |
Allowance: |
|
|
|
|
|
|
|
|
|
| | | |
Beginning of period balance | | $ | 107 |
| $ | 40 | | $ | 3 | | $ | 150 | |
Provision | |
| 82 | | | 18 | | | 6 | |
| 106 | |
Write-offs | |
| (45) | | | (29) | | | | |
| (74) | |
Recoveries | |
| 6 | | | 14 | | | | |
| 20 | |
Translation adjustments | | | (9) | | | | | | 2 | |
| (7) | |
End of period balance | | $ | 141 | | $ | 43 | | $ | 11 | | $ | 195 | |
Financing receivables: | | | | | | | | | | | | | |
End of period balance | | $ | 24,404 |
| $ | 3,454 | | $ | 4,278 | | $ | 32,136 | |
22
The allowance for credit losses on financing receivables decreased $33 million in the second quarter of 2021, primarily due to lower expected losses on retail notes and financing leases in the construction and forestry market and better than expected performance of accounts granted payment relief due to the economic effects of COVID. The allowance for credit losses on revolving charge accounts also decreased in the second quarter of 2021, reflecting strong payment performance due to continued improvement in the agricultural market. For the first six months of 2021, the allowance for credit losses on financing receivables decreased slightly, as the reductions noted above were largely offset by the impact of adopting ASU No. 2016-13.
A troubled debt restructuring is generally the modification of debt in which a creditor grants a concession it would not otherwise consider to a debtor that is experiencing financial difficulties. These modifications may include a reduction of the stated interest rate, an extension of the maturity date, a reduction of the face amount or maturity amount of the debt, or a reduction of accrued interest. During the first six months of 2021, the Company identified 199 receivable contracts, primarily retail notes, as troubled debt restructurings with aggregate balances of $8 million pre-modification and $7 million post-modification. During the first six months of 2020, there were 259 receivable contracts, primarily wholesale receivables in Argentina, identified as troubled debt restructurings with aggregate balances of $94 million pre-modification and $83 million post-modification. The short-term payment relief related to COVID, mentioned earlier, did not meet the definition of a troubled debt restructuring. During these same periods, there were no significant troubled debt restructurings that subsequently defaulted and were written off. At May 3, 2021, the Company had 0 commitments to lend to borrowers whose accounts were modified in troubled debt restructurings.
(12) Securitization of Financing Receivables
The Company, as a part of its overall funding strategy, periodically transfers certain financing receivables (retail notes) into VIEs that are special purpose entities (SPEs), or non-VIE banking operations, as part of its asset-backed securities programs (securitizations). The structure of these transactions is such that the transfer of the retail notes did not meet the accounting criteria for sales of receivables, and is, therefore, accounted for as a secured borrowing. SPEs utilized in securitizations of retail notes differ from other entities included in the Company’s consolidated statements because the assets they hold are legally isolated. Use of the assets held by the SPEs or the non-VIEs is restricted by terms of the documents governing the securitization transactions.
In these securitizations, the retail notes are transferred to certain SPEs or to non-VIE banking operations, which in turn issue debt to investors. The debt securities issued to the third party investors resulted in secured borrowings, which are recorded as “Short-term securitization borrowings” on the balance sheet. The securitized retail notes are recorded as “Financing receivables securitized – net” on the balance sheet. The total restricted assets on the consolidated balance sheet related to these securitizations include the financing receivables securitized less an allowance for credit losses, and other assets primarily representing restricted cash. Restricted cash results from contractual requirements in securitized borrowing arrangements and serves as a credit enhancement. The restricted cash is used to satisfy payment deficiencies, if any, in the required payments on secured borrowings. The balance of restricted cash is contractually stipulated and is either a fixed amount as determined by the initial balance of the financing receivables securitized or a fixed percentage of the outstanding balance of the securitized financing receivables. The restriction is removed either after all secured borrowing payments are made or proportionally as these receivables are collected and borrowing obligations reduced. For those securitizations in which retail notes are transferred into SPEs, the SPEs supporting the secured borrowings are consolidated unless the Company does not have both the power to direct the activities that most significantly impact the SPEs’ economic performance and the obligation to absorb losses or the right to receive benefits that could potentially be significant to the SPEs. No additional support to these SPEs beyond what was previously contractually required has been provided during the reporting periods.
In certain securitizations, the Company consolidates the SPEs since it has both the power to direct the activities that most significantly impact the SPEs’ economic performance through its role as servicer of all the receivables held by the SPEs and the obligation through variable interests in the SPEs to absorb losses or receive benefits that could potentially be significant to the SPEs. The restricted assets (retail notes securitized, allowance for credit losses, and other assets) of the consolidated SPEs totaled $2,875 million, $2,898 million, and $3,017 million at May 2, 2021, November 1, 2020, and May 3, 2020, respectively. The liabilities (short-term securitization borrowings and accrued interest) of these SPEs totaled $2,833 million, $2,856 million, and $2,977 million at May 2, 2021, November 1, 2020, and May 3, 2020, respectively. The credit holders of these SPEs do not have legal recourse to the Company’s general credit.
23
In certain securitizations, the Company transfers retail notes to non-VIE banking operations, which are not consolidated since the Company does not have a controlling interest in the entities. The Company’s carrying values and interests related to the securitizations with the unconsolidated non-VIEs were restricted assets (retail notes securitized, allowance for credit losses, and other assets) of $397 million, $576 million, and $542 million at May 2, 2021, November 1, 2020, and May 3, 2020, respectively. The liabilities (short-term securitization borrowings and accrued interest) were $383 million, $554 million, and $515 million at May 2, 2021, November 1, 2020, and May 3, 2020, respectively.
In certain securitizations, the Company transfers retail notes into bank-sponsored, multi-seller, commercial paper conduits, which are SPEs that are not consolidated. The Company does not service a significant portion of the conduits’ receivables, and therefore, does not have the power to direct the activities that most significantly impact the conduits’ economic performance. These conduits provide a funding source to the Company (as well as other transferors into the conduit) as they fund the retail notes through the issuance of commercial paper. The Company’s carrying values and variable interest related to these conduits were restricted assets (retail notes securitized, allowance for credit losses, and other assets) of $926 million, $1,327 million, and $1,221 million at May 2, 2021, November 1, 2020, and May 3, 2020, respectively. The liabilities (short-term securitization borrowings and accrued interest) related to these conduits were $893 million, $1,275 million, and $1,154 million at May 2, 2021, November 1, 2020, and May 3, 2020, respectively.
The Company’s carrying amount of the liabilities to the unconsolidated conduits, compared to the maximum exposure to loss related to these conduits, which would only be incurred in the event of a complete loss on the restricted assets, was as follows in millions of dollars:
| | | | |
|
| May 2 |
| |
| | 2021 | | |
Carrying value of liabilities |
| $ | 893 | |
Maximum exposure to loss | | | 926 | |
The total assets of unconsolidated VIEs related to securitizations were approximately $35 billion at May 2, 2021.
The components of consolidated restricted assets related to secured borrowings in securitization transactions were as follows in millions of dollars:
| | | | | | | | | | |
|
| May 2 |
| November 1 |
| May 3 |
| |||
| | 2021 | | 2020 | | 2020 |
| |||
Financing receivables securitized (retail notes) |
| $ | 4,122 | | $ | 4,716 | | $ | 4,703 | |
Allowance for credit losses | | | (15) | |
| (13) | |
| (18) | |
Other assets | | | 91 | |
| 98 | |
| 95 | |
Total restricted securitized assets |
| $ | 4,198 | | $ | 4,801 | | $ | 4,780 | |
The components of consolidated secured borrowings and other liabilities related to securitizations were as follows in millions of dollars:
| | | | | | | | | | |
|
| May 2 |
| November 1 |
| May 3 |
| |||
| | 2021 | | 2020 | | 2020 |
| |||
Short-term securitization borrowings |
| $ | 4,106 | | $ | 4,682 | | $ | 4,640 | |
Accrued interest on borrowings | | | 3 | |
| 3 | |
| 6 | |
Total liabilities related to restricted securitized assets |
| $ | 4,109 | | $ | 4,685 | | $ | 4,646 | |
The secured borrowings related to these restricted securitized retail notes are obligations that are payable as the retail notes are liquidated. Repayment of the secured borrowings depends primarily on cash flows generated by the restricted assets. Due to the Company’s short-term credit rating, cash collections from these restricted assets are not required to be placed into a segregated collection account until immediately prior to the time payment is required to the secured creditors. At May 2, 2021, the maximum remaining term of all securitized retail notes was approximately six years.
24
(13) Inventories
Most inventories owned by Deere & Company and its U.S. equipment subsidiaries and certain foreign equipment subsidiaries are valued at cost on the “last-in, first-out” (LIFO) method. If all of the Company’s inventories had been valued on a “first-in, first-out” (FIFO) method, estimated inventories by major classification in millions of dollars would have been as follows:
| | | | | | | | | | |
|
| May 2 |
| November 1 |
| May 3 |
| |||
| | 2021 | | 2020 | | 2020 |
| |||
Raw materials and supplies |
| $ | 2,469 | | $ | 1,995 | | $ | 2,394 | |
Work-in-process | | | 967 | |
| 648 | |
| 722 | |
Finished goods and parts | | | 4,334 | |
| 4,006 | |
| 4,646 | |
Total FIFO value | | | 7,770 | |
| 6,649 | |
| 7,762 | |
Less adjustment to LIFO value | | | 1,728 | |
| 1,650 | |
| 1,591 | |
Inventories |
| $ | 6,042 | | $ | 4,999 | | $ | 6,171 | |
(14) Goodwill and Other Intangible Assets–Net
The changes in amounts of goodwill by operating segments were as follows in millions of dollars:
| | | | | | | | | | | | | |
|
| Production & |
| Small Ag |
| Construction |
| | |
| |||
| | Precision Ag | | & Turf | | & Forestry | | Total |
| ||||
Goodwill at November 3, 2019 | | $ | 310 | | $ | 264 | | $ | 2,343 | | $ | 2,917 | |
Translation adjustments and other | |
| (5) | |
| (4) | | | 9 | | | | |
Goodwill at May 3, 2020 | | $ | 305 | | $ | 260 | | $ | 2,352 | | $ | 2,917 | |
| | | | | | | | | | | | | |
Goodwill at November 1, 2020 | | $ | 333 | | $ | 268 | | $ | 2,480 | | $ | 3,081 | |
Acquisition | | | 12 | | | | | | | | | 12 | |
Translation adjustments and other | | | 10 | | | (2) | | | 89 | | | 97 | |
Goodwill at May 2, 2021 | | $ | 355 | | $ | 266 | | $ | 2,569 | | $ | 3,190 | |
There were 0 accumulated goodwill impairment losses in the reported periods.
The components of other intangible assets were as follows in millions of dollars:
| | | | | | | | | | |
|
| May 2 |
| November 1 |
| May 3 |
| |||
| | 2021 | | 2020 | | 2020 |
| |||
Amortized intangible assets: | | | | | | | | | | |
Customer lists and relationships | | $ | 549 | | $ | 535 | | $ | 509 | |
Technology, patents, trademarks, and other | | | 1,097 | |
| 1,056 | |
| 1,006 | |
Total at cost | | | 1,646 | |
| 1,591 | |
| 1,515 | |
Less accumulated amortization: | | | | |
| | |
| | |
Customer lists and relationships | | | 136 | | | 113 | | | 93 | |
Technology, patents, trademarks, and other | | | 323 | | | 274 | | | 234 | |
Total accumulated amortization | | | 459 | | | 387 | | | 327 | |
Amortized intangible assets, net | | | 1,187 | | | 1,204 | | | 1,188 | |
Unamortized intangible assets: | | | | | | | | | | |
In-process research and development | | | 123 | | | 123 | | | 123 | |
Other intangible assets – net | | $ | 1,310 | | $ | 1,327 | | $ | 1,311 | |
The amortization of other intangible assets in the second quarter and the first six months of 2021 was $27 million and $62 million, and for 2020 was $26 million and $51 million, respectively. The estimated amortization expense for the next five years is as follows in millions of dollars: remainder of 2021 – $55, 2022 – $109, 2023 – $107, 2024 – $103, 2025 – $100, and 2026 –$98.
25
(15) Total Short-Term Borrowings
Total short-term borrowings were as follows in millions of dollars:
| | | | | | | | | | |
| | May 2 | | November 1 | | May 3 | | |||
|
| 2021 |
| 2020 |
| 2020 | | |||
Equipment Operations | | |
| | |
| | |
| |
Commercial paper | | | | | | | | $ | 466 | |
Notes payable to banks | | $ | 122 | | $ | 192 | | | 439 | |
Finance lease obligations due within one year | | | 24 | | | 21 | | | 13 | |
Long-term borrowings due within one year | |
| 206 | |
| 79 | |
| 480 | |
Total | |
| 352 | |
| 292 | |
| 1,398 | |
Financial Services | | | | | | | | | | |
Commercial paper | |
| 2,259 | |
| 1,238 | |
| 2,958 | |
Notes payable to banks | |
| 89 | |
| 182 | |
| 236 | |
Long-term borrowings due within one year | |
| 7,211 | |
| 6,870 | |
| 6,587 | |
Total | |
| 9,559 | |
| 8,290 | |
| 9,781 | |
Short-term borrowings | |
| 9,911 | |
| 8,582 | |
| 11,179 | |
Short-term securitization borrowings | | |
| | |
| | |
| |
Equipment Operations | | | 14 | | | 26 | | | 37 | |
Financial Services | | | 4,092 | | | 4,656 | | | 4,603 | |
Total | | | 4,106 | | | 4,682 | | | 4,640 | |
Total short-term borrowings |
| $ | 14,017 |
| $ | 13,264 |
| $ | 15,819 | |
(16) Long-Term Borrowings
Long-term borrowings were as follows in millions of dollars. The financial services medium-term notes include fair value adjustments related to interest rate swaps.
| | | | | | | | | | |
| | May 2 | | November 1 | | May 3 | | |||
|
| 2021 |
| 2020 |
| 2020 | | |||
Equipment Operations | | |
| | |
| | |
| |
U.S. dollar notes and debentures: | | | | | | | | | | |
8½% debentures due 2022 | | | | | $ | 105 | | $ | 105 | |
2.60% notes due 2022 | | $ | 1,000 | |
| 1,000 | |
| 1,000 | |
2.75% notes due 2025 | | | 700 | | | 700 | | | 700 | |
6.55% debentures due 2028 | |
| 200 | |
| 200 | |
| 200 | |
5.375% notes due 2029 | |
| 500 | |
| 500 | |
| 500 | |
3.10% notes due 2030 | | | 700 | | | 700 | | | 700 | |
8.10% debentures due 2030 | |
| 250 | |
| 250 | |
| 250 | |
7.125% notes due 2031 | |
| 300 | |
| 300 | |
| 300 | |
3.90% notes due 2042 | |
| 1,250 | |
| 1,250 | |
| 1,250 | |
2.875% notes due 2049 | | | 500 | | | 500 | | | 500 | |
3.75% notes due 2050 | | | 850 | | | 850 | | | 850 | |
Euro notes: | | | | | | | | | | |
.5% notes due 2023 (€500 principal) | | | 606 | | | 584 | | | 548 | |
1.375% notes due 2024 (€800 principal) | | | 969 | | | 934 | | | 876 | |
1.85% notes due 2028 (€600 principal) | | | 727 | | | 700 | | | 657 | |
2.20% notes due 2032 (€600 principal) | | | 727 | | | 700 | | | 657 | |
1.65% notes due 2039 (€650 principal) | | | 788 | | | 759 | | | 712 | |
Finance lease obligations and other notes | |
| 115 | |
| 153 | |
| 204 | |
Less debt issuance costs and debt discounts | | | 58 | | | 61 | | | 62 | |
Total |
| | 10,124 |
| | 10,124 |
| | 9,947 | |
Financial Services |
| | |
| | |
| | | |
Notes and debentures: | | | | | | | | | | |
Medium-term notes: (principal as of: May 2, 2021 - $21,800, November 1, 2020 - $20,996, May 3, 2020 - $22,565) |
| | 22,161 | | | 21,661 | | | 23,326 | |
Other notes | |
| 1,121 | |
| 1,003 | |
| 1,111 | |
Less debt issuance costs and debt discounts | | | 60 | | | 54 | | | 60 | |
Total | |
| 23,222 | |
| 22,610 | |
| 24,377 | |
Long-term borrowings |
| $ | 33,346 | | $ | 32,734 | | $ | 34,324 | |
26
(17) Leases
Lessee
Operating and finance lease right of use assets and liabilities were as follows in millions of dollars:
| | | | | | | | | | |
| | May 2 | | November 1 | | May 3 | | |||
| | 2021 | | 2020 | | 2020 | | |||
Operating leases: | | | | | | | | | | |
Other assets | | $ | 345 | | $ | 324 | | $ | 341 | |
Accounts payable and accrued expenses | | | 328 | | | 305 | | | 319 | |
| | | | | | | | | | |
Finance leases: | | | | | | | | | | |
Property and equipment - net | | $ | 73 | | $ | 63 | | $ | 43 | |
| | | | | | | | | | |
Short-term borrowings | | $ | 24 | | $ | 21 | | $ | 13 | |
Long-term borrowings | | | 45 | | | 39 | | | 26 | |
Total finance lease liabilities | | $ | 69 | | $ | 60 | | $ | 39 | |
Right of use assets obtained in exchange for lease liabilities were as follows in millions of dollars:
| | | | | | | |
| | Six Months Ended | | ||||
| | May 2, 2021 | | May 3, 2020 | | ||
Operating leases | | $ | 71 | | $ | 10 | |
Finance leases | | | 23 | | | 18 | |
Lessor
The Company leases equipment manufactured or sold by the Company and a limited amount of non-Deere equipment to retail customers through sales-type, direct financing, and operating leases. Sales-type and direct financing leases are reported in “Financing receivables - net” on the consolidated balance sheet. Operating leases are reported in “Equipment on operating leases - net” on the consolidated balance sheet.
Lease revenues earned by the Company were as follows in millions of dollars:
| | | | | | | | | | | | | |
| | Three Months Ended | | Six Months Ended | | ||||||||
| | May 2, 2021 | | May 3, 2020 | | May 2, 2021 | | May 3, 2020 | | ||||
Sales-type and direct financing lease revenues | | $ | 34 | | $ | 32 | | $ | 70 | | $ | 68 | |
Operating lease revenues | | | 358 | | | 369 | | | 721 | | | 743 | |
Variable lease revenues | | | 6 | | | 6 | | | 12 | | | 11 | |
Total lease revenues | | $ | 398 | | $ | 407 | | $ | 803 | | $ | 822 | |
The Company estimates the residual values for operating leases at lease inception based on several factors, including lease term, expected hours of usage, historical wholesale sale prices, return experience, intended use of the equipment, market dynamics and trends, and dealer residual guarantees. The Company reviews residual value estimates during the lease term and tests the carrying value of its operating lease assets for impairment when events or circumstances necessitate. In the second quarter of 2020, the Company recorded impairment losses on operating leases of $22 million due to higher expected equipment return rates and lower estimated values of used construction equipment. Operating lease impairments are recorded in “Other operating expenses.”
The Company discusses with lessees and dealers options to purchase the equipment or extend the lease prior to lease maturity. Equipment returned to the Company upon termination of leases is remarketed by the Company. In the second quarter of 2020, the Company recorded impairment losses on matured operating lease inventory of $10 million due to lower estimated values of used construction equipment. These impairment losses are included in “Other operating expenses.”
Due to the significant, negative effects of COVID, the Company provided short-term payment relief to lessees during 2020, and to a much lesser extent in 2021. The relief, which included payment deferrals of three months or less, was provided in regional programs and on a case-by-case basis with customers that were generally current in their payment obligations. The operating leases granted relief since the beginning of the pandemic that remained outstanding at May 2, 2021 represented approximately 3 percent of the Company’s operating lease portfolio.
27
(18) Commitments and Contingencies
The Company generally determines its total warranty liability by applying historical claims rate experience to the estimated amount of equipment that has been sold and is still under warranty based on dealer inventories and retail sales. The historical claims rate is primarily determined by a review of five-year claims costs and current quality developments.
The premiums for extended warranties are primarily recognized in income in proportion to the costs expected to be incurred over the contract period. These unamortized extended warranty premiums (deferred revenue) included in the following table totaled $681 million and $602 million at May 2, 2021 and May 3, 2020, respectively.
A reconciliation of the changes in the warranty liability and unearned premiums was as follows in millions of dollars:
| | | | | | | | | | | | | |
| | Three Months Ended | | Six Months Ended |
| ||||||||
| | May 2 | | May 3 | | May 2 | | May 3 |
| ||||
| | 2021 | | 2020 | | 2021 | | 2020 |
| ||||
Beginning of period balance |
| $ | 1,803 |
| $ | 1,792 |
| $ | 1,743 |
| $ | 1,800 | |
Payments | | | (202) | |
| (223) | | | (417) | |
| (453) | |
Amortization of premiums received | | | (65) | |
| (51) | | | (128) | |
| (110) | |
Accruals for warranties | | | 248 | |
| 210 | | | 495 | |
| 432 | |
Premiums received | | | 90 | |
| 69 | | | 163 | |
| 134 | |
Foreign exchange | | | 2 | |
| (30) | | | 20 | |
| (36) | |
End of period balance | | $ | 1,876 | | $ | 1,767 | | $ | 1,876 | | $ | 1,767 | |
At May 2, 2021, the Company had approximately $384 million of guarantees issued primarily to banks outside the U.S. and Canada related to third-party receivables for the retail financing of John Deere equipment. The Company may recover a portion of any required payments incurred under these agreements from repossession of the equipment collateralizing the receivables. At May 2, 2021, the Company had accrued losses of approximately $16 million under these agreements. The maximum remaining term of the receivables guaranteed at May 2, 2021 was approximately six years.
At May 2, 2021, the Company had commitments of approximately $246 million for the construction and acquisition of property and equipment. Also, at May 2, 2021, the Company had restricted assets of $70 million, primarily as collateral for borrowings and restricted other assets. See Note 12 for additional restricted assets associated with borrowings related to securitizations.
The Company also had other miscellaneous contingent liabilities totaling approximately $60 million at May 2, 2021. The accrued liability for these contingencies was not material at May 2, 2021.
The Company is subject to various unresolved legal actions which arise in the normal course of its business, the most prevalent of which relate to product liability (including asbestos-related liability), retail credit, employment, patent, and trademark matters. The Company believes the reasonably possible range of losses for these unresolved legal actions would not have a material effect on its consolidated financial statements.
(19) Fair Value Measurements
Fair value is defined as the price that would be received to sell an asset or paid to transfer a liability in an orderly transaction between market participants at the measurement date. To determine fair value, the Company uses various methods including market and income approaches. The Company utilizes valuation models and techniques that maximize the use of observable inputs. The models are industry-standard models that consider various assumptions including time values and yield curves as well as other economic measures. These valuation techniques are consistently applied.
Level 1 measurements consist of quoted prices in active markets for identical assets or liabilities. Level 2 measurements include significant other observable inputs such as quoted prices for similar assets or liabilities in active markets; identical assets or liabilities in inactive markets; observable inputs such as interest rates and yield curves; and other market-corroborated inputs. Level 3 measurements include significant unobservable inputs.
28
The fair values of financial instruments that do not approximate the carrying values were as follows in millions of dollars. Long-term borrowings exclude finance lease liabilities (see Note 17).
| | | | | | | | | | | | | | | | | | | |
| | May 2, 2021 | | November 1, 2020 | | May 3, 2020 |
| ||||||||||||
| | Carrying | | Fair | | Carrying | | Fair | | Carrying | | Fair |
| ||||||
Financing receivables – net: |
| | |
| | |
| | | | | | | | | | | | |
Equipment operations | | $ | 99 | | $ | 94 | | $ | 105 | | $ | 103 | | $ | 118 | | $ | 111 | |
Financial services | | | 30,895 | | | 31,071 | | | 29,645 | | | 29,838 |
| | 27,138 | | | 27,317 | |
Total | | $ | 30,994 | | $ | 31,165 | | $ | 29,750 | | $ | 29,941 | | $ | 27,256 | | $ | 27,428 | |
| | | | | | | | | | | | | | | | | | | |
Financing receivables securitized – net: | | | | | | | |
| | | | | | | | | | | |
Equipment operations | | $ | 15 | | $ | 15 | | $ | 26 | | $ | 26 | | $ | 37 | | $ | 35 | |
Financial services | | | 4,092 | | | 4,173 | | | 4,677 | | | 4,773 | | | 4,648 | | | 4,722 | |
Total | | $ | 4,107 | | $ | 4,188 | | $ | 4,703 | | $ | 4,799 | | $ | 4,685 | | $ | 4,757 | |
| | | | | | | | | | | | | | | | | | | |
Short-term | | | | | | | |
| | | | | | | | | | | |
Equipment operations | | $ | 14 | | $ | 15 | | $ | 26 | | $ | 26 | | $ | 37 | | $ | 37 | |
Financial services | | | 4,092 | | | 4,117 | | | 4,656 | | | 4,698 | | | 4,603 | | | 4,632 | |
Total | | $ | 4,106 | | $ | 4,132 | | $ | 4,682 | | $ | 4,724 | | $ | 4,640 | | $ | 4,669 | |
| | | | | | | | | | | | | | | | | | | |
Long-term borrowings due within one year: | | | | | | | | | | | | | | | | | | | |
Equipment operations | | $ | 206 | | $ | 211 | | $ | 79 |
| $ | 78 | | $ | 480 | | $ | 477 | |
Financial services | | | 7,211 | | | 7,293 | |
| 6,870 | |
| 6,936 | |
| 6,587 | | | 6,609 | |
Total | | $ | 7,417 | | $ | 7,504 | | $ | 6,949 | | $ | 7,014 | | $ | 7,067 | | $ | 7,086 | |
| | | | | | | | | | | | | | | | | | | |
Long-term borrowings: | | | | | | | | | | | | | | | | | | | |
Equipment operations | | $ | 10,079 | | $ | 11,391 | | $ | 10,085 |
| $ | 11,837 | | $ | 9,921 | | $ | 11,192 | |
Financial services | | | 23,222 | | | 23,701 | |
| 22,610 | |
| 23,170 | |
| 24,377 | | | 24,537 | |
Total | | $ | 33,301 | | $ | 35,092 | | $ | 32,695 | | $ | 35,007 | | $ | 34,298 | | $ | 35,729 | |
Fair value measurements above were Level 3 for all financing receivables, Level 3 for equipment operations short-term securitization borrowings, and Level 2 for all other borrowings.
Fair values of the financing receivables that were issued long-term were based on the discounted values of their related cash flows at interest rates currently being offered by the Company for similar financing receivables. The fair values of the remaining financing receivables approximated the carrying amounts.
Fair values of long-term borrowings and short-term securitization borrowings were based on current market quotes for identical or similar borrowings and credit risk, or on the discounted values of their related cash flows at current market interest rates. Certain long-term borrowings have been swapped to current variable interest rates. The carrying values of these long-term borrowings included adjustments related to fair value hedges.
29
Assets and liabilities measured at fair value on a recurring basis in millions of dollars follow, excluding the Company’s cash equivalents, which were carried at cost that approximates fair value and consisted primarily of money market funds and time deposits. Level 3 marketable securities were transferred to Level 2 in 2021.
| | | | | | | | | | |
|
| May 2 |
| November 1 |
| May 3 |
| |||
| | 2021 | | 2020 | | 2020 |
| |||
Level 1: | | | | | | | | | | |
Marketable securities | | | | | | | | | | |
International equity securities | | $ | 2 | | $ | 2 | | $ | 2 | |
U.S. equity fund | | | 71 | | | 62 | | | 62 | |
U.S. government debt securities | | | 59 | |
| 55 | |
| 50 | |
Total Level 1 marketable securities | | | 132 | | | 119 | | | 114 | |
| | | | | | | | | | |
Level 2: | | | | | | | | | | |
Marketable securities | | | | | | ��� | | | | |
U.S. government debt securities | | | 121 | | | 113 | | | 104 | |
Municipal debt securities | | | 69 | |
| 68 | |
| 63 | |
Corporate debt securities | | | 202 | |
| 188 | |
| 177 | |
International debt securities | | | 4 | | | 2 | | | 2 | |
Mortgage-backed securities | | | 140 | |
| 147 | |
| 165 | |
Total Level 2 marketable securities | | | 536 | |
| 518 | |
| 511 | |
Other assets | | | | | | | | | | |
Derivatives: | | | | | | | | | | |
Interest rate contracts | | | 368 | |
| 669 | |
| 842 | |
Foreign exchange contracts | | | 30 | |
| 48 | |
| 92 | |
Cross-currency interest rate contracts | | | 4 | |
| 8 | |
| 17 | |
Total Level 2 other assets |
| | 402 | | | 725 | | | 951 | |
Accounts payable and accrued expenses | | | | | | | | | | |
Derivatives: | | | | | | | | | | |
Interest rate contracts |
| | 132 | | | 88 | | | 131 | |
Foreign exchange contracts | | | 89 | |
| 26 | |
| 68 | |
Cross-currency interest rate contracts | | | 2 | | | 1 | | | | |
Total Level 2 accounts payable and accrued expenses |
| | 223 | | | 115 | | | 199 | |
| | | | | | | | | | |
Level 3: | | | | | | | | | | |
Marketable securities | | | | | | | | | | |
International debt securities |
| | | | | 4 | | | 1 | |
The contractual maturities of debt securities at May 2, 2021 in millions of dollars are shown below. Actual maturities may differ from those scheduled as a result of prepayments by the issuers. Because of the potential for prepayment on mortgage-backed securities, they are not categorized by contractual maturity. Mortgage-backed securities were primarily issued by U.S. government sponsored enterprises.
| | | | | | | |
| | Amortized | | Fair | | ||
| | Cost | | Value | | ||
Due in one year or less |
| $ | 20 | | $ | 21 | |
Due after one through five years | | | 90 | | | 94 | |
Due after five through 10 years | | | 124 | | | 127 | |
Due after 10 years | | | 207 | | | 213 | |
Mortgage-backed securities | | | 136 | | | 140 | |
Debt securities |
| $ | 577 |
| $ | 595 | |
30
Fair value, nonrecurring measurements from impairments, excluding financing receivables with specific allowances which were not significant, were as follows in millions of dollars. Equipment on operating leases – net and Other assets fair value for November 1, 2020 represents the fair value assessment at May 3, 2020.
| | | | | | | | | | | | | | | | | | | | | | |
| | Fair Value | | Losses | | |||||||||||||||||
| | | | | | | | | | | Three Months Ended | | Six Months Ended | | ||||||||
| | May 2 | | November 1 | | May 3 | | May 2 | | May 3 | | May 2 | | May 3 | | |||||||
|
| 2021 |
| 2020 |
| 2020 |
| 2021 |
| 2020 |
| 2021 |
| 2020 |
| |||||||
Other receivables | | | | | $ | 1 | | | | | | | | | | | | | | | | |
Equipment on operating leases – net | | | | | $ | 371 | | $ | 371 | | | | | $ | 22 | | | | | $ | 22 | |
Property and equipment – net | | | | | $ | 135 | | $ | 70 | | | | | $ | 62 | | $ | 44 | | $ | 62 | |
Investments in unconsolidated affiliates | | | | | $ | 19 | | $ | 10 | | | | | $ | 20 | | | | | $ | 20 | |
Other assets | | | | | $ | 59 | | $ | 59 | | | | | $ | 10 | | $ | 6 | | $ | 10 | |
The following is a description of the valuation methodologies the Company uses to measure certain financial instruments on the balance sheet at fair value:
Marketable Securities – The portfolio of investments, except for the Level 3 measurement international debt securities, is primarily valued on a market approach (matrix pricing model) in which all significant inputs are observable or can be derived from or corroborated by observable market data such as interest rates, yield curves, volatilities, credit risk, and prepayment speeds. Funds are primarily valued using the fund’s net asset value, based on the fair value of the underlying securities. The Level 3 measurement international debt securities are primarily valued using an income approach based on discounted cash flows using yield curves derived from limited, observable market data.
Derivatives – The Company’s derivative financial instruments consist of interest rate swaps, foreign currency futures, forwards and swaps, and cross-currency interest rate swaps. The portfolio is valued based on an income approach (discounted cash flow) using market observable inputs, including swap curves and both forward and spot exchange rates for currencies.
Financing Receivables – Specific reserve impairments are based on the fair value of the collateral, which is measured using a market approach (appraisal values or realizable values). Inputs include a selection of realizable values.
Other Receivables – The impairment was based on the expected realization of value-added tax receivables related to a closed factory operation (see Note 22).
Equipment on Operating Leases – Net – The impairments are based on an income approach (discounted cash flow), using the contractual payments, plus estimates of return rates and equipment sale price at lease maturity. Inputs include historical return rates and realized sales values (see Note 22).
Property and Equipment – Net – The impairments are measured at the lower of the carrying amount, or fair value. The valuations were based on cost and market approaches. The inputs include replacement cost estimates adjusted for physical deterioration and economic obsolescence or quoted prices when available (see Note 22).
Investment in Unconsolidated Affiliates – Other than temporary impairments for investments are measured as the difference between the implied fair value and the carrying value of the investments or the estimated realization amount (see Note 22).
Other Assets – The impairments of matured operating lease inventory are measured at the fair value of that inventory. The valuations were based on a market approach. The inputs include sales of comparable assets (see Note 22).
(20) Derivative Instruments
It is the Company’s policy that derivative transactions are executed only to manage exposures arising in the normal course of business and not for the purpose of creating speculative positions or trading. The Company’s financial services operations manage the relationship of the types and amounts of their funding sources to their receivable and lease portfolio in an effort to diminish risk due to interest rate and foreign currency fluctuations, while responding to favorable financing opportunities. The Company also has foreign currency exposures at some of its foreign and domestic operations related to buying, selling, and financing in currencies other than the functional currencies. In addition, the Company has interest rate exposure at certain
31
equipment operations units for below market retail financing programs that are used as sales incentives and are offered for extended periods.
All derivatives are recorded at fair value on the balance sheet. Cash collateral received or paid is not offset against the derivative fair values on the balance sheet. Each derivative is designated as a cash flow hedge, a fair value hedge, or remains undesignated. All designated hedges are formally documented as to the relationship with the hedged item as well as the risk-management strategy. Both at inception and on an ongoing basis the hedging instrument is assessed as to its effectiveness. If and when a derivative is determined not to be highly effective as a hedge, the underlying hedged transaction is no longer likely to occur, the hedge designation is removed, or the derivative is terminated, hedge accounting is discontinued.
Cash Flow Hedges
Certain interest rate contracts (swaps) were designated as hedges of future cash flows from borrowings. The total notional amounts of the receive-variable/pay-fixed interest rate contracts at May 2, 2021, November 1, 2020, and May 3, 2020 were $1,850 million, $1,550 million, and $2,450 million, respectively. Fair value gains or losses on cash flow hedges were recorded in OCI and are subsequently reclassified into interest expense in the same periods during which the hedged transactions affected earnings. These amounts offset the effects of interest rate changes on the related borrowings. The cash flows from these contracts were recorded in operating activities in the statement of consolidated cash flows.
The amount of loss recorded in OCI at May 2, 2021 that is expected to be reclassified to interest expense or other operating expenses in the next twelve months if interest rates or exchange rates remain unchanged is approximately $4 million after-tax. NaN gains or losses were reclassified from OCI to earnings based on the probability that the original forecasted transaction would not occur.
Fair Value Hedges
Certain interest rate contracts (swaps) were designated as fair value hedges of borrowings. The total notional amounts of the receive-fixed/pay-variable interest rate contracts at May 2, 2021, November 1, 2020, and May 3, 2020 were $8,340 million, $7,239 million, and $8,983 million, respectively. The fair value gains or losses on these contracts were generally offset by fair value gains or losses on the hedged items (fixed-rate borrowings) with both items recorded in interest expense.
The amounts recorded in the consolidated balance sheet related to borrowings designated in fair value hedging relationships were as follows in millions of dollars:
| | | | | | | | | | | | | |
| | | | | Cumulative Increase (Decrease) of Fair |
| |||||||
| | | | | Value Hedging Adjustments Included in | | |||||||
| | | | | the Carrying Amount | | |||||||
| | Carrying | | Active | | | | |
| ||||
| | Amount of | | Hedging | | Discontinued | | | | | |||
| | Hedged Item | | Relationships | | Relationships | | Total |
| ||||
May 2, 2021 | | | | | | | | | | | | | |
Long-term borrowings due within one year |
| $ | 163 |
| $ | 1 |
| $ | (1) |
| | | |
Long-term borrowings | | | 8,502 | | | 190 | | | 171 | | $ | 361 | |
| | | | | | | | | | | | | |
November 1, 2020 | | | | | | | | | | | | | |
Long-term borrowings due within one year | | $ | 155 | | $ | 2 | | $ | 3 | | $ | 5 | |
Long-term borrowings | | | 7,725 | | | 543 | | | 122 | | | 665 | |
| | | | | | | | | | | | | |
May 3, 2020 | | | | | | | | | | | | | |
Long-term borrowings due within one year | | $ | 214 | | | | | $ | (2) | | $ | (2) | |
Long-term borrowings | | | 9,496 | | $ | 726 | | | 36 | |
| 762 | |
Long-term borrowings due within one year are presented in short-term borrowings.
32
Derivatives not designated as hedging instruments
The Company has certain interest rate contracts (swaps), foreign exchange contracts (futures, forwards, and swaps), and cross-currency interest rate contracts (swaps), which were not formally designated as hedges. These derivatives were held as economic hedges for underlying interest rate or foreign currency exposures, primarily for certain borrowings, purchases or sales of inventory, and below market retail financing programs. The total notional amounts of these interest rate swaps at May 2, 2021, November 1, 2020, and May 3, 2020 were $8,694 million, $8,514 million, and $7,975 million, the foreign exchange contracts were $6,239 million, $4,903 million, and $4,430 million, and the cross-currency interest rate contracts were $151 million, $113 million, and $89 million, respectively. The fair value gains or losses from the interest rate contracts were recognized currently in interest expense or net sales and the gains or losses from foreign exchange contracts in cost of sales or other operating expenses, generally offsetting over time the expenses on the exposures being hedged. The cash flows from these non-designated contracts were recorded in operating activities in the statement of consolidated cash flows.
Fair values of derivative instruments in the condensed consolidated balance sheet were as follows in millions of dollars:
| | | | | | | | | | |
|
| May 2 |
| November 1 |
| May 3 |
| |||
Other Assets | | 2021 | | 2020 | | 2020 |
| |||
Designated as hedging instruments: | | | | | | | | | | |
Interest rate contracts |
| $ | 301 | | $ | 586 | | $ | 758 | |
| | | | | | | | | | |
Not designated as hedging instruments: | | | | | | | | | | |
Interest rate contracts | | | 67 | |
| 83 | |
| 84 | |
Foreign exchange contracts | | | 30 | |
| 48 | |
| 92 | |
Cross-currency interest rate contracts | | | 4 | |
| 8 | |
| 17 | |
Total not designated | | | 101 | |
| 139 | |
| 193 | |
| | | | | | | | | | |
Total derivative assets |
| $ | 402 | | $ | 725 | | $ | 951 | |
| | | | | | | | | | |
Accounts Payable and Accrued Expenses | | | | | | | | | | |
Designated as hedging instruments: | | | | | | | | | | |
Interest rate contracts |
| $ | 80 | | $ | 14 | | $ | 30 | |
| | | | | | | | | | |
Not designated as hedging instruments: | | | | | | | | | | |
Interest rate contracts | | | 52 | | | 74 | | | 101 | |
Foreign exchange contracts | | | 89 | |
| 26 | |
| 68 | |
Cross-currency interest rate contracts | | | 2 | |
| 1 | |
| | |
Total not designated | | | 143 | |
| 101 | |
| 169 | |
| | | | | | | | | | |
Total derivative liabilities |
| $ | 223 | | $ | 115 | | $ | 199 | |
The classification and gains (losses) including accrued interest expense related to derivative instruments on the statement of consolidated income consisted of the following in millions of dollars:
| | | | | | | | | | | | | |
| | Three Months Ended | | Six Months Ended |
| ||||||||
| | May 2 | | May 3 | | May 2 | | May 3 |
| ||||
| | 2021 | | 2020 | | 2021 | | 2020 |
| ||||
Fair Value Hedges: |
|
|
|
| | |
|
|
|
| | |
|
Interest rate contracts - Interest expense |
| $ | (170) | | $ | 415 |
| $ | (225) | | $ | 511 | |
| | | | | | | | | | | | | |
Cash Flow Hedges: | | | | | | | | | | | | | |
Recognized in OCI | | | | | | | | | | | | | |
Interest rate contracts - OCI (pretax) | | | | |
| (15) | | | | |
| (17) | |
| | | | | | | | | | | | | |
Reclassified from OCI | | | | | | | | | | | | | |
Interest rate contracts - Interest expense | | | (4) | |
| (4) | | | (9) | |
| (6) | |
| | | | | | | | | | | | | |
Not Designated as Hedges: | | | | | | | | | | | | | |
Interest rate contracts - Net sales | | $ | 5 | | $ | (20) | | $ | 5 | | $ | (24) | |
Interest rate contracts - Interest expense * |
| | | | | 1 |
| | (4) | | | 3 | |
Foreign exchange contracts - Cost of sales | | | (48) | |
| 81 | | | (100) | | | 92 | |
Foreign exchange contracts - Other operating * | | | (78) | |
| 175 | | | (204) | |
| 174 | |
Total not designated |
| $ | (121) | | $ | 237 |
| $ | (303) | | $ | 245 | |
* Includes interest and foreign exchange gains (losses) from cross-currency interest rate contracts.
33
Counterparty Risk and Collateral
Derivative instruments are subject to significant concentrations of credit risk to the banking sector. The Company manages individual counterparty exposure by setting limits that consider the credit rating of the counterparty, the credit default swap spread of the counterparty, and other financial commitments and exposures between the Company and the counterparty banks. All interest rate derivatives are transacted under International Swaps and Derivatives Association (ISDA) documentation. Some of these agreements include credit support provisions. Each master agreement permits the net settlement of amounts owed in the event of default or termination.
Certain of the Company’s derivative agreements contain credit support provisions that may require the Company to post collateral based on the size of the net liability positions and credit ratings. The aggregate fair value of all derivatives with credit-risk-related contingent features that were in a net liability position at May 2, 2021, November 1, 2020, and May 3, 2020, was $136 million, $89 million, and $130 million, respectively. In accordance with the limits established in these agreements, the Company posted 0 cash collateral at May 2, 2021, November 1, 2020, and May 3, 2020. In addition, the Company paid $8 million of collateral, either in cash or pledged securities, that was outstanding at May 2, 2021 to participate in an international futures market to hedge currency exposure, not included in the table below.
Derivatives are recorded without offsetting for netting arrangements or collateral. The impact on the derivative assets and liabilities related to netting arrangements and any collateral received or paid was as follows in millions of dollars:
| | | | | | | | | | | | | |
| | Gross Amounts | | Netting | | | | | |
| |||
May 2, 2021 |
| Recognized |
| Arrangements |
| Collateral |
| Net Amount |
| ||||
Assets |
| $ | 402 |
| $ | (125) |
| $ | (21) |
| $ | 256 | |
Liabilities | | | 223 | | | (125) | | | (1) | | | 97 | |
| | | | | | | | | | | | | |
| | Gross Amounts | | Netting | | | | | |
| |||
November 1, 2020 |
| Recognized |
| Arrangements |
| Collateral |
| Net Amount |
| ||||
Assets | | $ | 725 |
| $ | (93) | | $ | (274) |
| $ | 358 | |
Liabilities | | | 115 | | | (93) | | | | | | 22 | |
| | | | | | | | | | | | | |
|
| Gross Amounts |
| Netting |
| |
| | |
| |||
May 3, 2020 | | Recognized | | Arrangements | | Collateral | | Net Amount |
| ||||
Assets | | $ | 951 | | $ | (125) | | $ | (319) | | $ | 507 | |
Liabilities | |
| 199 | |
| (125) | | | | |
| 74 | |
(21) Stock Option and Restricted Stock Awards
In December 2020, the Company granted stock options to employees for the purchase of 269 thousand shares of common stock at an exercise price of $254.83 per share and a binomial lattice model fair value of $62.73 per share at the grant date. At May 2, 2021, options for 2.8 million shares were outstanding with a weighted-average exercise price of $125.50 per share. The Company also granted 212 thousand restricted stock units to employees and non-employee directors in the first six months of 2021, of which 165 thousand are subject to service based only conditions and 47 thousand are subject to performance/service based conditions. The weighted-average fair value of the service based only units at the grant date was $258.42 per unit based on the market price of a share of underlying common stock. The fair value of the performance/service based units at the grant date was $245.73 per unit based on the market price of a share of underlying common stock excluding dividends. At May 2, 2021, the Company was authorized to grant an additional 17.7 million shares under the equity incentive plan.
(22) Special Items
During the first quarter of 2021, the fixed assets in an asphalt plant factory in Germany were impaired by $38 million, pretax and after-tax. The Company also continued to assess its manufacturing locations, resulting in additional long-lived asset impairments of $12 million pretax. The impairments were the result of a decline in forecasted financial performance that indicated it was probable future cash flows would not cover the carrying amount of the net assets. These impairments were offset by a favorable indirect tax ruling in Brazil of $58 million pretax. See Note 19 for fair value measurement information.
| | | | | | | | | | | | | |
| | Six Months Ended | | ||||||||||
| | May 2, 2021 | | ||||||||||
Expense (benefit): | | Production & Precision Ag |
| Small Ag & Turf |
| Construction & Forestry |
| Total | | ||||
Long-lived asset impairments – Cost of sales | | $ | 5 | | $ | 3 | | $ | 42 | | $ | 50 | |
Brazil indirect tax – Cost of sales | | | (53) | | | | | | (5) | | | (58) | |
Total expense (benefit) | | $ | (48) | | $ | 3 | | $ | 37 | | $ | (8) | |
34
In the second quarter of 2020, the fixed assets in an asphalt plant factory in Germany were impaired by $62 million pretax and after-tax. The impairment is the result of a decline in forecasted financial performance that indicated it was probable future cash flows would not cover the carrying amount of the net assets. The equipment on operating leases and matured operating lease inventory were impaired by $22 million and $10 million pretax, respectively, with an income tax benefit of approximately $9 million. The impairments were the result of higher expected equipment return rates and lower estimated values of used construction equipment than originally estimated with the probable effect that the future cash flows will not cover the carrying amount of the net assets. A minority investment in a construction equipment company headquartered in South Africa was impaired by $20 million pretax and after-tax. The impairment was the result of an other than temporary decline in value. See Note 19 for fair value measurement information.
| | | | | | | | | | |
| | Six Months Ended | | |||||||
| | May 3, 2020 | | |||||||
Expense: |
| Construction & Forestry |
| Financial Services |
| Total | | |||
Long-lived asset impairments – Cost of sales | | $ | 62 | | | | | $ | 62 | |
Investments in unconsolidated affiliates impairment – Equity in loss of unconsolidated affiliate | | | 20 | | | | | | 20 | |
Equipment on operating leases & matured operating lease inventory impairments – Other operating expenses | | | | | $ | 32 | | | 32 | |
Total expense | | $ | 82 | | $ | 32 | | $ | 114 | |
Employee-Separation Programs
During the first quarter of 2020, the Company announced a broad voluntary employee-separation program for the U.S. salaried workforce that continues the efforts to create a more efficient organization structure and reduce operating costs. The program provided for cash payments based on years of service. The expense was recorded primarily in the period in which the employees irrevocably accepted the separation offer. The payments for the program were also substantially made in the first quarter of 2020. Included in the total pretax expense is a non-cash charge of $21 million resulting from a curtailment in certain OPEB plans (see Note 8), which was recorded outside of operating profit in “Other operating expense.”
| | | | | | | | | | | | | | | | |
| | Six Months Ended | | |||||||||||||
| | May 3, 2020 | | |||||||||||||
|
| Production & Precision Ag |
| Small Ag & Turf |
| Construction & Forestry |
| Financial Services |
| Total | | |||||
Cost of sales | | $ | 21 | | $ | 11 | | $ | 9 | | | | | $ | 41 | |
Research and development expenses | | | 7 | | | 7 | | | 4 | | | | | | 18 | |
Selling, administrative and general expenses | | | 18 | | | 19 | | | 14 | | $ | 3 | | | 54 | |
Total operating profit impact | | $ | 46 | | $ | 37 | | $ | 27 | | $ | 3 | | | 113 | |
Other operating expenses | | | | | | | | | | | | | | | 23 | |
Total expense | | | | | | | | | | | | | | $ | 136 | |
Redeemable Noncontrolling Interest
In the second quarter of 2020, the minority interest holder in Hagie Manufacturing Company, LLC exercised its right to sell the remaining 20 percent interest to the Company for $14 million. The arrangement was accounted for as an equity transaction with 0 gain or loss recorded in the statement of consolidated income. This operation is included in the Company’s production and precision agriculture segment.
35
ITEM 2. MANAGEMENT’S DISCUSSION AND ANALYSIS OF FINANCIAL CONDITION AND RESULTS OF OPERATIONS
RESULTS OF OPERATIONS
Overview
Organization
The Company’s equipment operations generate revenues and cash primarily from the sale of equipment to John Deere dealers and distributors. The equipment operations manufacture and distribute a full line of agricultural equipment; a variety of commercial and consumer equipment; and a broad range of equipment for construction, roadbuilding, and forestry. The Company’s financial services primarily provide credit services, which mainly finance sales and leases of equipment by John Deere dealers and trade receivables purchased from the equipment operations. In addition, financial services offers extended equipment warranties. The information in the following discussion is presented in a format that includes information grouped as consolidated, equipment operations, and financial services. The Company also views its operations as consisting of two geographic areas, the U.S. and Canada, and outside the U.S. and Canada. The Company’s operating segments consist of production and precision agriculture, small agriculture and turf, construction and forestry, and financial services.
Trends and Economic Conditions
Industry sales of large agricultural machinery in the U.S. and Canada are expected to be up about 25 percent for 2021 compared to the prior year. Industry sales of turf and utility equipment in the U.S. and Canada are expected to be up about 10 percent in 2021. Industry sales of agricultural machinery in Europe are also forecast to be up about 10 percent. In South America, industry sales of tractors and combines are projected to be up about 20 percent in 2021. Industry sales of agricultural machinery in Asia are forecast to be up slightly. Construction industry sales in U.S. and Canada for 2021 are expected to increase about 15 to 20 percent, while compact construction equipment in the U.S. and Canada are forecast to increase about 20 to 25 percent. In forestry, global industry sales are expected to be 15 to 20 percent higher. The Company’s financial services operations are expected to benefit from improvement on operating lease residual values, income earned on a higher average portfolio, a lower provision for credit losses, and more favorable financing spreads for fiscal year 2021 compared to the prior year.
Items of concern include uncertainty of the effectiveness of governmental and private sector actions to address COVID, trade agreements, the uncertainty of the results of monetary and fiscal policies, the impact of elevated levels of sovereign and state debt, capital market disruptions, changes in demand and pricing for new and used equipment, geopolitical events, and the other items discussed in the “Safe Harbor Statement” below. Significant fluctuations in foreign currency exchange rates and volatility in the price of many commodities could also impact the Company’s results. The future financial effects of COVID are unknown due to many factors. As a result, predicting the Company’s forecasted financial performance is subject to many assumptions.
The Company’s results were delivered across its entire business lineup, reflecting strong worldwide markets for farm and construction equipment. The Company’s smart industrial operating strategy continues to have a significant impact on performance while also helping customers do their jobs in a more profitable and sustainable manner. While the Company is performing well, increased supply-chain pressures are expected through the remainder of the year. The Company is working closely with key suppliers to secure the parts and components that its customers need to deliver essential food production and infrastructure. Despite these challenges, the Company is on track for a strong year and well positioned to unlock greater value for its customers and other stakeholders in the future.
36
COVID Effects and Actions
The effects of COVID and the related actions of governments and other authorities to contain COVID continue to affect the Company’s operations, results, cash flows, and forecasts.
The U.S. government and many other governments in countries where the Company operates have designated the Company an essential critical infrastructure business. This designation allows the Company to operate in support of its customers to the extent possible.
The Company’s first priority in addressing the effects of COVID continues to be the health, safety, and overall welfare of its employees. The Company effectively activated previously established business continuity plans and proactively implemented health and safety measures at its operations around the world.
The Company broadened its supply base to minimize the impact of potential supply chain disruptions on its ability to meet customer demand. While the impact to operations during the first six months of 2021 was not material, the Company continues to monitor the situation and work closely with suppliers.
The Company continued to work closely with distribution channel and equipment user customers in the first half of 2021 in connection with short-term payment relief on obligations owed to the Company. Financing receivables and operating leases granted relief since the beginning of the pandemic that remained outstanding at May 2, 2021 represented about 4 percent and 3 percent of the portfolio balances, respectively. The trade receivable balance granted relief that remained outstanding at May 2, 2021 was not material. Additional information is presented in Notes 4, 11, and 17.
2021 Compared with 2020
The following table provides the net sales and revenues and net income attributable to Deere & Company in millions of dollars and diluted earnings per share in dollars:
| | | | | | | | | | | | | | | | | |
| | Three Months Ended | | Six Months Ended | | ||||||||||||
| | May 2 | | May 3 | | % | | May 2 | | May 3 | | % | | ||||
| | 2021 | | 2020 | | Change | | 2021 | | 2020 | | Change | | ||||
Net sales and revenues | | $ | 12,058 | | $ | 9,253 | | +30 | | $ | 21,170 | | $ | 16,884 | | +25 | |
Net income attributable to Deere & Company | | | 1,790 | | | 666 | | +169 | | | 3,013 | | | 1,182 | | +155 | |
Diluted earnings per share | | | 5.68 | | | 2.11 | | | | | 9.55 | | | 3.73 | | | |
In the second quarter of 2020, the Company recorded impairments totaling $114 million pretax and $105 million after-tax related to certain fixed assets, operating lease equipment, and a minority investment in a construction equipment company headquartered in South Africa (see Note 22). In the first six months of 2020, total voluntary employee-separation program (VSEP) expense recognized was $136 million pretax.
37
The worldwide equipment operations net sales, operating profit, and net income in millions of dollars, and price realization and the effect of currency translation are shown below. Also shown are U.S. and Canada, and outside U.S. and Canada equipment operations net sales in millions of dollars, price realization, and currency translation.
| | | | | | | | | | | | | | | | | |
| | Three Months Ended | | Six Months Ended | | ||||||||||||
| | May 2 | | May 3 | | % | | May 2 | | May 3 | | % | | ||||
Worldwide equipment operations: | | 2021 | | 2020 | | Change | | 2021 | | 2020 | | Change | | ||||
Net sales | | $ | 10,998 | | $ | 8,224 | | +34 | | $ | 19,049 | | $ | 14,754 | | +29 | |
Operating profit | | | 2,144 | | $ | 890 | | +141 | | $ | 3,524 | | | 1,356 | | +160 | |
Net income | | | 1,568 | | | 606 | | +159 | | | 2,586 | | | 985 | | +163 | |
Price realization | | | | | | | | +7 | | | | | | | | +6 | |
Currency translation | | | | | | | | +3 | | | | | | | | +2 | |
| | | | | | | | | | | | | | | | | |
U.S. and Canada equipment operations: | | | | | | | | | | | | | | | | | |
Net sales | | | 6,157 | | | 4,998 | | +23 | | | 10,686 | | | 8,748 | | +22 | |
Price realization | | | | | | | | +5 | | | | | | | | +5 | |
Currency translation | | | | | | | | +1 | | | | | | | | +1 | |
| | | | | | | | | | | | | | | | | |
Outside U.S. and Canada equipment operations: | | | | | | | | | | | | | | | | | |
Net sales | | | 4,841 | | | 3,226 | | +50 | | | 8,363 | | | 6,006 | | +39 | |
Price realization | | | | | | | | +9 | | | | | ��� | | | +8 | |
Currency translation | | | | | | | | +7 | | | | | | | | +4 | |
The discussion on net sales and operating profit is included in the Business Segment Results below.
The cost of sales to net sales ratio and other significant statement of consolidated income changes were as follows in millions of dollars:
| | | | | | | | | | | | | | | | | |
| | Three Months Ended | | Six Months Ended | | ||||||||||||
| | May 2 | | May 3 | | % | | May 2 | | May 3 | | % | | ||||
| | 2021 | | 2020 | | Change | | 2021 | | 2020 | | Change | | ||||
Cost of sales to net sales | | | 72.1% | | | 76.5% | | | | | 72.1% | | | 77.1% | | | |
| | | | | | | | | | | | | | | | | |
Other income | | $ | 251 | | $ | 180 | | +39 | | $ | 477 | | $ | 385 | | +24 | |
Research and development expenses | | | 377 | | | 406 | | -7 | | | 743 | | | 831 | | -11 | |
Selling, administrative and general expenses | | | 838 | | | 906 | | -8 | | | 1,607 | | | 1,715 | | -6 | |
Other operating expenses | | | 335 | | | 377 | | -11 | | | 708 | | | 792 | | -11 | |
The cost of sales to net sales ratio decreased in the second quarter and the first six months primarily due to price realization and impairments recorded in 2020 (see Note 22). The first six months of 2020 were also impacted by VSEP costs. Other income increased in both periods due to gains on the disposition of operating lease equipment in 2021 and unrealized gains on equity securities. Research and development expenses decreased in both periods from efficiencies gained and timing of project initiatives. Selling, administrative and general expenses decreased in both periods primarily due to a lower provision for credit losses and VSEP costs recorded in 2020 (see Note 22), partially offset by higher incentive compensation. Other operating expenses decreased in both periods primarily due to impairments on operating lease residual values and losses on the disposition of operating lease equipment in 2020 and lower depreciation of equipment on operating leases.
38
Business Segment Results
Production and Precision Agriculture. The production and precision agriculture segment results were as follows in millions of dollars:
| | | | | | | | | | | | | | | | | |
| | Three Months Ended | | Six Months Ended | | ||||||||||||
| | May 2 | | May 3 | | % | | May 2 | | May 3 | | % | | ||||
| | 2021 | | 2020 | | Change | | 2021 | | 2020 | | Change | | ||||
Net sales | | $ | 4,529 | | $ | 3,365 | | +35 | | $ | 7,599 | | $ | 5,872 | | +29 | |
Operating profit | | | 1,007 | | | 568 | | +77 | | | 1,651 | | | 786 | | +110 | |
Operating margin | | | 22.2% | | | 16.9% | | | | | 21.7% | | | 13.4% | | | |
Production and precision agriculture sales increased for the quarter due to higher shipment volumes and price realization. Operating profit rose primarily due to price realization and higher shipment volumes / sales mix. These items were partially offset by higher production costs.
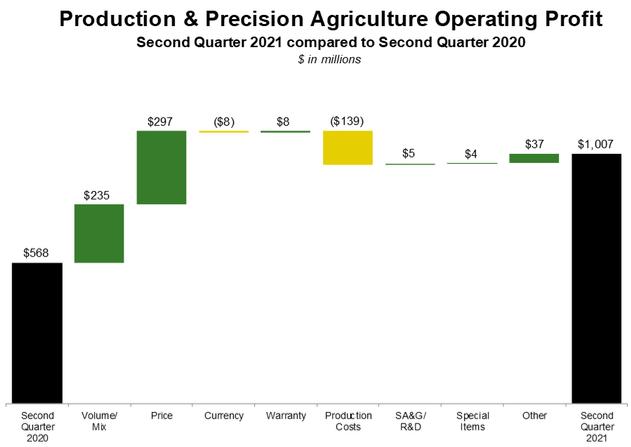
Sales for the first six months increased mainly as a result of higher shipment volumes and price realization. Operating profit for the first six months increased primarily resulting from price realization, higher shipment volumes / sales mix, and a favorable indirect tax ruling in Brazil. The prior period was also impacted by voluntary employee-separation program expenses. Partially offsetting these factors were higher production costs.
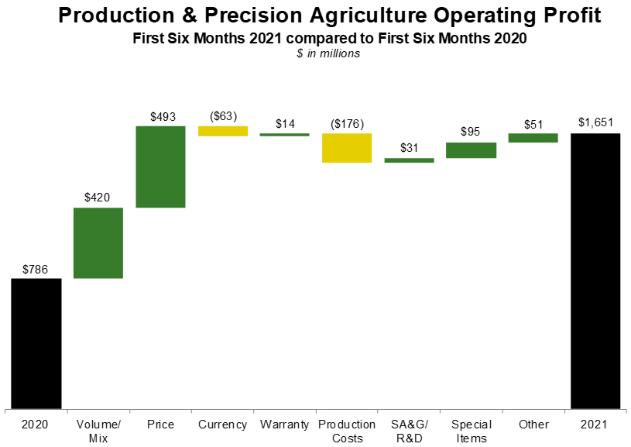
39
Small Agriculture and Turf. The small agriculture and turf segment results were as follows in millions of dollars:
| | | | | | | | | | | | | | | | | |
| | Three Months Ended | | Six Months Ended | | ||||||||||||
| | May 2 | | May 3 | | % | | May 2 | | May 3 | | % | | ||||
| | 2021 | | 2020 | | Change | | 2021 | | 2020 | | Change | | ||||
Net sales | | $ | 3,390 | | $ | 2,603 | | +30 | | $ | 5,904 | | $ | 4,583 | | +29 | |
Operating profit | | | 648 | | | 226 | | +187 | | | 1,117 | | | 381 | | +193 | |
Operating margin | | | 19.1% | | | 8.7% | | | | | 18.9% | | | 8.3% | | | |
Small agriculture and turf sales for the quarter increased due to higher shipment volumes, price realization, and the favorable effects of foreign currency translation. Operating profit increased primarily due to higher shipment volumes / sales mix, price realization, and the favorable effects of foreign currency exchange. These items were partially offset by higher production costs.
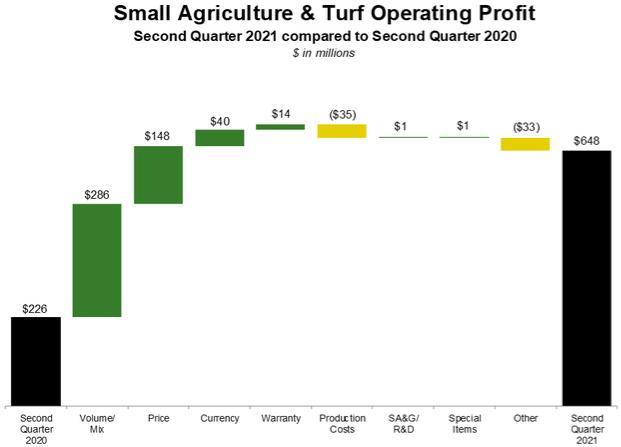
Sales for the first six months increased mainly as a result of higher shipment volumes, price realization, and the favorable effects of foreign currency translation. Operating profit for the first six months increased primarily resulting from higher shipment volumes / sales mix, price realization, and the favorable effects of foreign currency exchange. The prior period was also impacted by voluntary employee-separation program expenses. Partially offsetting these factors were higher production costs.
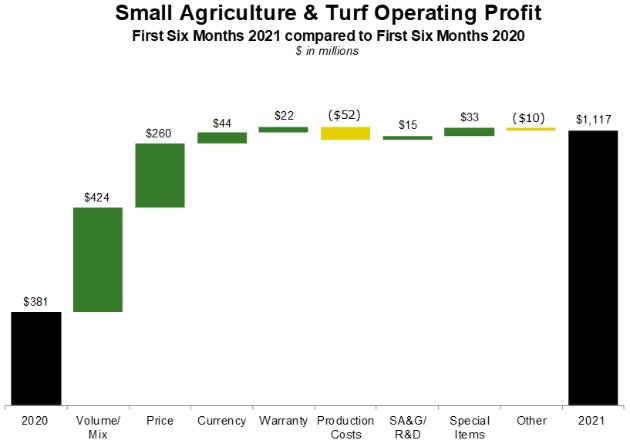
40
Construction and Forestry. The construction and forestry segment results were as follows in millions of dollars:
| | | | | | | | | | | | | | | | | |
| | Three Months Ended | | Six Months Ended | | ||||||||||||
| | May 2 | | May 3 | | % | | May 2 | | May 3 | | % | | ||||
| | 2021 | | 2020 | | Change | | 2021 | | 2020 | | Change | | ||||
Net sales | | $ | 3,079 | | $ | 2,256 | | +36 | | $ | 5,546 | | $ | 4,299 | | +29 | |
Operating profit | | | 489 | | | 96 | | +409 | | | 756 | | | 189 | | +300 | |
Operating margin | | | 15.9% | | | 4.3% | | | | | 13.6% | | | 4.4% | | | |
Construction and forestry sales moved higher for the quarter primarily due to higher shipment volumes, price realization, and the favorable effects of foreign currency translation. Operating profit increased due to higher shipment volumes / sales mix and price realization. Results for the prior period were affected by impairments in certain fixed assets and an unconsolidated equipment company headquartered in South Africa (see Note 22).
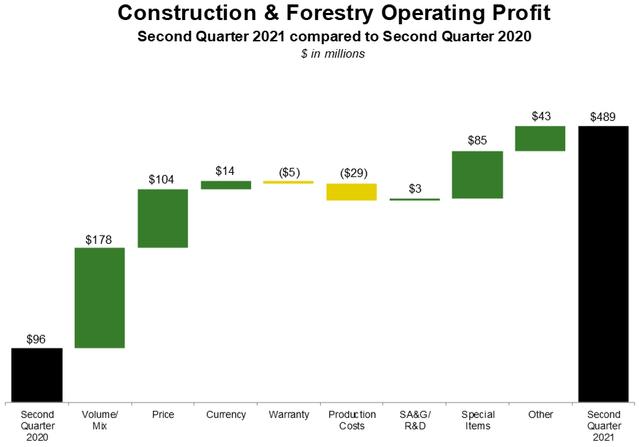
The segment’s six-month sales also increased due to higher shipment volumes, price realization, and the favorable effects of foreign currency translation. The first six-month’s operating profit moved higher mainly due to increased shipment volumes / sales mix and price realization. The prior period was also impacted by voluntary employee-separation program expenses and impairments in certain fixed assets and an unconsolidated equipment company headquartered in South Africa (see Note 22).
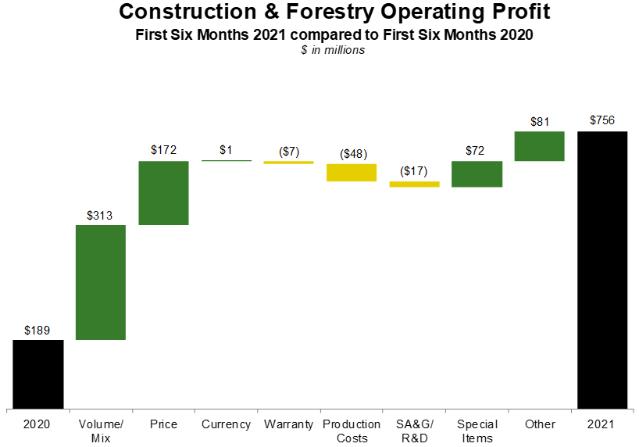
41
Financial Services. The financial services segment revenue, interest expense, operating profit, and net income was as follows in millions of dollars:
| | | | | | | | | | | | | | | | | |
| | Three Months Ended | | Six Months Ended | | ||||||||||||
| | May 2 | | May 3 | | % | | May 2 | | May 3 | | % | | ||||
| | 2021 | | 2020 | | Change | | 2021 | | 2020 | | Change | | ||||
Revenue (including intercompany revenue) | | $ | 954 | | $ | 967 | | -1 | | $ | 1,888 | | $ | 1,965 | | -4 | |
Interest expense | | | 181 | | | 266 | | -32 | | | 369 | | | 541 | | -32 | |
Operating profit | | | 295 | | | 75 | | +293 | | | 553 | | | 254 | | +118 | |
Net income | | | 222 | | | 60 | | +270 | | | 427 | | | 197 | | +117 | |
Financial services operating profit increased for the quarter and the first six months primarily due to a lower provision for credit losses, improvement on operating lease residual values, and more favorable financing spreads. Results last year also included impairments on lease residual values (see Note 22). The average balance of receivables and leases financed was 4 percent higher in the second quarter and 3 percent higher in the first six months of 2021, compared with the same periods last year. Interest expense decreased in the second quarter and first six months of 2021 primarily as a result of lower average borrowing rates.
Safe Harbor Statement
Safe Harbor Statement under the Private Securities Litigation Reform Act of 1995: Statements under “Overview” and other forward-looking statements herein that relate to future events, expectations, and trends involve factors that are subject to change, and risks and uncertainties that could cause actual results to differ materially. Some of these risks and uncertainties could affect particular lines of business, while others could affect all of the Company’s businesses.
The Company’s agricultural equipment businesses are subject to a number of uncertainties including the factors that affect farmers’ confidence and financial condition. These factors include demand for agricultural products, world grain stocks, weather conditions, soil conditions, harvest yields, prices for commodities and livestock, crop and livestock production expenses, availability of transport for crops, trade restrictions and tariffs (e.g., China), global trade agreements, the level of farm product exports (including concerns about genetically modified organisms), the growth and sustainability of non-food uses for some crops (including ethanol and biodiesel production), real estate values, available acreage for farming, the land ownership policies of governments, changes in government farm programs and policies, international reaction to such programs, changes in and effects of crop insurance programs, changes in environmental regulations and their impact on farming practices, animal diseases (e.g., African swine fever) and their effects on poultry, beef and pork consumption and prices and on livestock feed demand, and crop pests and diseases and the impact of the COVID pandemic on the agricultural industry including demand for, and production and exports of, agricultural products, and commodity prices.
The production and precision agriculture business is dependent on agricultural conditions, and relies on hardware and software, guidance, connectivity and digital solutions, and automation and machine intelligence. Many factors contribute to the Company’s precision agriculture sales and results, including the impact to customers’ profitability or sustainability outcomes; the rate of adoption and use by customers; availability of technological innovations; speed of research and development; effectiveness of partnerships with third-parties; and the dealer channel’s ability to support and service precision technology solutions.
Factors affecting the outlook for the Company’s small agriculture and turf equipment include agricultural conditions, consumer confidence, weather conditions, customer profitability, labor supply, consumer borrowing patterns, consumer purchasing preferences, housing starts and supply, infrastructure investment, spending by municipalities and golf courses, and consumable input costs.
Consumer spending patterns, real estate and housing prices, the number of housing starts, interest rates, commodity prices such as oil and gas, the levels of public and non-residential construction, and investment in infrastructure affect sales and results of the Company’s construction and forestry equipment. Prices for pulp, paper, lumber and structural panels affect sales of forestry equipment.
Many of the factors affecting production and precision agriculture, small agriculture and turf, and construction and forestry segments, have been and may continue to be impacted by global economic conditions, including those resulting from the COVID pandemic and responses to the pandemic taken by governments and other authorities.
42
All of the Company’s businesses and its results are affected by general economic conditions in the global markets and industries in which the Company operates; customer confidence in general economic conditions; government spending and taxing; foreign currency exchange rates and their volatility, especially fluctuations in the value of the U.S. dollar; interest rates (including the availability of IBOR reference rates); inflation and deflation rates; changes in weather patterns; the political and social stability of the global markets in which the Company operates; the effects of, or response to, terrorism and security threats; wars and other conflicts; natural disasters; and the spread of major epidemics (including the COVID pandemic) and government and industry responses to epidemics such as travel restrictions and extended shut down of businesses.
Uncertainties related to the magnitude and duration of the COVID pandemic may significantly adversely affect the Company’s business and outlook. These uncertainties include: the duration and impact of any resurgence in COVID cases in any country, state, or region; the emergence, contagiousness, and threat of new and different strains of COVID; the availability, acceptance, and effects of vaccines; prolonged reduction or closure of the Company’s operations, or a delayed recovery in our operations; additional closures as mandated or otherwise made necessary by governmental authorities; disruptions in the supply chain and a prolonged delay in resumption of operations by one or more key suppliers, or the failure of any key suppliers; the Company’s ability to meet commitments to customers on a timely basis as a result of increased costs and supply challenges; the ability to receive goods on a timely basis and at anticipated costs; increased logistics costs; delays in the Company’s strategic initiatives as a result of reduced spending on research and development; additional operating costs due to remote working arrangements, adherence to social distancing guidelines and other COVID-related challenges; increased risk of cyber attacks on network connections used in remote working arrangements; increased privacy-related risks due to processing health-related personal information; legal claims related to personal protective equipment designed, made, or provided by the Company or alleged exposure to COVID on Company premises; absence of employees due to illness; the impact of the pandemic on the Company’s customers and dealers, and their delays in their plans to invest in new equipment; requests by the Company’s customers or dealers for payment deferrals and contract modifications; the impact of disruptions in the global capital markets and/or declines in the Company’s financial performance, outlook or credit ratings, which could impact the Company’s ability to obtain funding in the future; and the impact of the pandemic on demand for our products and services as discussed above. It remains unclear when a sustained economic recovery could occur and what a recovery may look like. All of these factors could materially and adversely affect our business, liquidity, results of operations and financial position.
Significant changes in market liquidity conditions, changes in the Company’s credit ratings and any failure to comply with financial covenants in credit agreements could impact access to funding and funding costs, which could reduce the Company’s earnings and cash flows. Financial market conditions could also negatively impact customer access to capital for purchases of the Company’s products and customer confidence and purchase decisions, borrowing and repayment practices, and the number and size of customer loan delinquencies and defaults. A debt crisis in Europe, Latin America, or elsewhere could negatively impact currencies, global financial markets, social and political stability, funding sources and costs, asset and obligation values, customers, suppliers, demand for equipment, and Company operations and results. The Company’s investment management activities could be impaired by changes in the equity, bond and other financial markets, which would negatively affect earnings.
The withdrawal of the United Kingdom from the European Union and the perceptions as to the impact of the withdrawal may adversely affect business activity, political stability and economic conditions in the United Kingdom, the European Union and elsewhere. The economic conditions and outlook could be further adversely affected by (i) uncertainty regarding any new or modified trade arrangements between the United Kingdom and the European Union and/or other countries, (ii) the risk that one or more other European Union countries could come under increasing pressure to leave the European Union, or (iii) the risk that the euro as the single currency of the Eurozone could cease to exist. Any of these developments, or the perception that any of these developments are likely to occur, could affect economic growth or business activity in the United Kingdom or the European Union, and could result in the relocation of businesses, cause business interruptions, lead to economic recession or depression, and impact the stability of the financial markets, availability of credit, currency exchange rates, interest rates, financial institutions, and political, financial and monetary systems. Any of these developments could affect our businesses, liquidity, results of operations and financial position.
Additional factors that could materially affect the Company’s operations, access to capital, expenses and results include changes in, uncertainty surrounding and the impact of governmental trade, banking, monetary and fiscal policies, including financial regulatory reform and its effects on the consumer finance industry, derivatives, funding costs and other areas; governmental programs, policies, and tariffs for the benefit of certain industries or sectors; sanctions in particular jurisdictions; retaliatory actions to such changes in trade, banking, monetary and fiscal policies; actions by central banks; actions by financial and securities regulators; actions by environmental, health and safety regulatory agencies, including those related to engine emissions, carbon and other greenhouse gas
43
emissions, noise and the effects of climate change; changes to GPS radio frequency bands or their permitted uses; changes in labor and immigration regulations; changes to accounting standards; changes in tax rates, estimates, laws and regulations and Company actions related thereto; changes to and compliance with privacy regulations; changes to and compliance with economic sanctions and export controls laws and regulations; compliance with U.S. and foreign laws when expanding to new markets and otherwise; and actions by other regulatory bodies.
Other factors that could materially affect results include production, design and technological innovations and difficulties, including capacity and supply constraints and prices; the loss of or challenges to intellectual property rights whether through theft, infringement, counterfeiting or otherwise; the availability and prices of strategically sourced materials, components and whole goods; delays or disruptions in the Company’s supply chain or the loss of liquidity by suppliers; disruptions of infrastructures that support communications, operations or distribution; the failure of customers, dealers, suppliers or the Company to comply with laws, regulations and Company policy pertaining to employment, human rights, health, safety, the environment, sanctions, export controls, anti-corruption, privacy and data protection and other ethical business practices; events that damage the Company’s reputation or brand; significant investigations, claims, lawsuits or other legal proceedings; start-up of new plants and products; the success of new product initiatives or business strategies; changes in customer product preferences and sales mix; gaps or limitations in rural broadband coverage, capacity and speed needed to support technology solutions; oil and energy prices, supplies and volatility; the availability and cost of freight; actions of competitors in the various industries in which the Company competes, particularly price discounting; dealer practices especially as to levels of new and used field inventories; changes in demand and pricing for used equipment and resulting impacts on lease residual values; labor relations and contracts; changes in the ability to attract, develop, engage, and retain qualified personnel; acquisitions and divestitures of businesses; greater than anticipated transaction costs; the integration of new businesses; the failure or delay in closing or realizing anticipated benefits of acquisitions, joint ventures or divestitures; the inability to deliver precision technology and agricultural solutions to customers; the implementation of the smart industrial operating strategy and other organizational changes; the failure to realize anticipated savings or benefits of cost reduction, productivity, or efficiency efforts; difficulties related to the conversion and implementation of enterprise resource planning systems; security breaches, cybersecurity attacks, technology failures and other disruptions to the Company’s and suppliers’ information technology infrastructure; changes in Company declared dividends and common stock issuances and repurchases; changes in the level and funding of employee retirement benefits; changes in market values of investment assets, compensation, retirement, discount and mortality rates which impact retirement benefit costs; and significant changes in health care costs.
The liquidity and ongoing profitability of John Deere Capital Corporation and other credit subsidiaries depend largely on timely access to capital in order to meet future cash flow requirements, and to fund operations, costs, and purchases of the Company’s products. If general economic conditions deteriorate or capital markets become more volatile, including as a result of the COVID pandemic, funding could be unavailable or insufficient. Additionally, customer confidence levels may result in declines in credit applications and increases in delinquencies and default rates, which could materially impact write-offs and provisions for credit losses.
The Company’s forward-looking statements are based upon assumptions relating to the factors described above, which are sometimes based upon estimates and data prepared by government agencies. Such estimates and data are often revised. The Company, except as required by law, undertakes no obligation to update or revise its forward-looking statements, whether as a result of new developments or otherwise. Further information concerning the Company and its businesses, including factors that could materially affect the Company’s financial results, is included in the Company’s other filings with the SEC (including, but not limited to, the factors discussed in Item 1A. Risk Factors of the Company’s most recent annual report on Form 10-K and quarterly reports on Form 10-Q).
Critical Accounting Policies
See the Company’s critical accounting policies discussed in the Management’s Discussion and Analysis of the most recent annual report filed on Form 10-K. There have been no material changes to these policies, other than as described below related to the allowance for credit losses, as a result of the adoption of ASU No. 2016-13 during the first quarter of 2021.
The allowance for credit losses is an estimate of the credit losses expected over the life of the Company’s receivable portfolio. The Company measures expected credit losses on a collective basis when similar risk characteristics exist. Risk characteristics considered by the Company include finance product category, market, geography, credit risk, and remaining duration. Receivables that do not share risk characteristics with other receivables in the portfolio are evaluated on an individual basis.
44
The Company utilizes loss forecast models, which are selected based on the size and credit risk of the underlying pool of receivables, to estimate expected credit losses. Transition matrix models are used for large and complex customer receivable pools, while weighted average remaining maturity models are used for smaller and less complex customer receivable pools. Expected credit losses on wholesale receivables are based on historical loss rates, adjusted for current economic conditions. The modeled expected credit losses are adjusted based on reasonable and supportable forecasts, which may include economic indicators such as commodity prices, industry equipment sales, unemployment rates, and housing starts. Management reviews each model’s output quarterly, and qualitative adjustments are incorporated as necessary. While the Company believes its allowance is sufficient to provide for losses over the life of its existing receivable portfolio, different assumptions or changes in economic conditions would result in changes to the allowance for credit losses and the provision for credit losses.
CAPITAL RESOURCES AND LIQUIDITY
The discussion of capital resources and liquidity has been organized to review separately, where appropriate, the Company’s consolidated totals, equipment operations, and financial services operations.
Consolidated
Positive cash flows from consolidated operating activities in the first six months of 2021 were $1,786 million. This cash inflow resulted primarily from net income adjusted for non-cash provisions, an increase in accounts payable and accrued expenses, and a change in net accrued income taxes payable/receivable, partially offset by a seasonal increase in receivables related to sales and inventories. Cash outflows from investing activities were $1,387 million in the first six months of 2021, primarily due to the cost of receivables and equipment on operating leases acquired exceeding collections of receivables (excluding receivables related to sales) and proceeds from sales of equipment on operating leases by $745 million, purchases of property and equipment of $320 million, a change in collateral on derivatives – net of $255 million, and purchases of marketable securities exceeding proceeds from maturities and sales by $27 million. Negative cash flows from financing activities were $441 million in the first six months of 2021 primarily due to repurchases of common stock of $1,044 million and dividends paid of $480 million, partially offset by an increase in borrowings of $1,022 million and proceeds from issuance of common stock of $116 million (resulting from the exercise of stock options). Cash, cash equivalents, and restricted cash increased $109 million during the first six months of this year.
Positive cash flows from consolidated operating activities in the first six months of 2020 were $776 million. This cash inflow resulted primarily from net income adjusted for non-cash provisions and a change in net retirement benefits, partially offset by a seasonal increase in receivables related to sales and inventories, a decrease in accounts payable and accrued expenses, and a change in accrued income taxes payable/receivable. Cash inflows from investing activities were $30 million in the first six months of 2020, primarily due to a change in collateral on derivatives – net of $319 million, and collections of receivables (excluding receivables related to sales) and proceeds from sales of equipment on operating leases exceeding the cost of these receivables and the cost of equipment on operating leases acquired by $195 million, partially offset by purchases of property and equipment of $441 million and purchases of marketable securities exceeding proceeds from maturities and sales by $32 million. Positive cash flows from financing activities were $4,343 million in the first six months of 2020 primarily due to an increase in borrowings of $5,098 million and proceeds from issuance of common stock of $70 million (resulting from the exercise of stock options), partially offset by dividends paid of $481 million and repurchases of common stock of $263 million. Cash, cash equivalents, and restricted cash increased $5,047 million during the first six months of 2020. The increase in cash was primarily related to equipment operations long-term borrowing issuances to provide added liquidity due to the financial uncertainty created by COVID in 2020.
The Company has access to most global markets at a reasonable cost and expects to have sufficient sources of global funding and liquidity to meet its funding needs. Sources of liquidity for the Company include cash and cash equivalents, marketable securities, funds from operations, the issuance of commercial paper and term debt, the securitization of retail notes (both public and private markets), and committed and uncommitted bank lines of credit. The Company’s commercial paper outstanding at May 2, 2021, November 1, 2020, and May 3, 2020 was $2,259 million, $1,238 million, and $3,424 million, respectively, while the total cash and cash equivalents and marketable securities position was $7,850 million, $7,707 million, and $9,526 million, respectively. The total cash and cash equivalents and marketable securities held by foreign subsidiaries was $4,972 million, $5,010 million, and $4,034 million at May 2, 2021, November 1, 2020, and May 3, 2020, respectively.
Lines of Credit. The Company also has access to bank lines of credit with various banks throughout the world. Worldwide lines of credit totaled $8,211 million at May 2, 2021, $5,741 million of which were unused. For the purpose of computing unused credit lines, commercial paper, and short-term bank borrowings, excluding secured borrowings and the current portion of long-term borrowings, were primarily considered to constitute utilization.
45
Included in the total credit lines at May 2, 2021 was a 364-day credit facility agreement of $3,000 million expiring in fiscal April 2022. In addition, total credit lines included long-term credit facility agreements of $2,500 million expiring in fiscal April 2025 and $2,500 million expiring in fiscal March 2026. These credit agreements require John Deere Capital Corporation (Capital Corporation) to maintain its consolidated ratio of earnings to fixed charges at not less than 1.05 to 1 for each fiscal quarter and the ratio of senior debt, excluding securitization indebtedness, to capital base (total subordinated debt and stockholder’s equity excluding accumulated other comprehensive income (loss)) at not more than 11 to 1 at the end of any fiscal quarter. The credit agreements also require the equipment operations to maintain a ratio of total debt to total capital (total debt and stockholders’ equity excluding accumulated other comprehensive income (loss)) of 65 percent or less at the end of each fiscal quarter. Under this provision, the Company’s excess equity capacity and retained earnings balance free of restriction at May 2, 2021 was $14,445 million. Alternatively under this provision, the equipment operations had the capacity to incur additional debt of $26,826 million at May 2, 2021. All of these credit agreement requirements have been met during the periods included in the financial statements.
Debt Ratings. To access public debt capital markets, the Company relies on credit rating agencies to assign short-term and long-term credit ratings to the Company’s securities as an indicator of credit quality for fixed income investors. A security rating is not a recommendation by the rating agency to buy, sell, or hold Company securities. A credit rating agency may change or withdraw Company ratings based on its assessment of the Company’s current and future ability to meet interest and principal repayment obligations. Each agency’s rating should be evaluated independently of any other rating. Lower credit ratings generally result in higher borrowing costs, including costs of derivative transactions, and reduced access to debt capital markets. The senior long-term and short-term debt ratings and outlook currently assigned to unsecured Company debt securities by the rating agencies engaged by the Company are as follows:
| | | | | | | |
|
| Senior |
| |
| |
|
| | Long-Term | | Short-Term | | Outlook |
|
Fitch Ratings | | A | | F1 | | Stable | |
Moody’s Investors Service, Inc. |
| A2 |
| Prime-1 |
| Stable | |
Standard & Poor’s |
| A |
| A-1 |
| Stable | |
Trade accounts and notes receivable primarily arise from sales of goods to independent dealers. Trade receivables increased $1,987 million during the first six months of 2021, primarily due to a seasonal increase and higher overall demand. These receivables increased $172 million, compared to a year ago, primarily due to an increase in demand. The ratios of worldwide trade accounts and notes receivable to the last 12 months’ net sales were 17 percent at May 2, 2021, compared to 13 percent at November 1, 2020 and 18 percent at May 3, 2020. Production and precision agriculture trade receivables increased $247 million, small agriculture and turf trade receivables increased $17 million, and construction and forestry trade receivables decreased $92 million, compared to a year ago. The percentage of total worldwide trade receivables outstanding for periods exceeding 12 months was 2 percent at May 2, 2021, 3 percent at November 1, 2020, and 3 percent at May 3, 2020.
Deere & Company stockholders’ equity was $15,092 million at May 2, 2021, compared with $12,937 million at November 1, 2020 and $11,864 million at May 3, 2020. The increase of $2,155 million during the first six months of 2021 resulted primarily from net income attributable to Deere & Company of $3,013 million, a change in the cumulative translation adjustment of $433 million, a change retirement benefits adjustment of $154 million, and an increase in common stock of $104 million, partially offset by dividends declared of $520 million and an increase in treasury stock of $987 million.
The Company plans to make a voluntary contribution to its U.S. OPEB plan for $700 million in the fourth quarter of 2021.
Equipment Operations
The Company’s equipment businesses are capital intensive and are subject to seasonal variations in financing requirements for inventories and certain receivables from dealers. The equipment operations sell a significant portion of their trade receivables to financial services. To the extent necessary, funds provided from operations are supplemented by external financing sources.
Cash provided by operating activities of the equipment operations, including intercompany cash flows, in the first six months of 2021 was $2,507 million. This resulted primarily from cash inflows from net income adjusted for non-cash provisions, an increase in accounts payable and accrued expenses, and a change in accrued income taxes payable/receivable. Partially offsetting these operating cash inflows were cash outflows from an increase in inventories and trade and financing receivables held by the equipment operations. Cash, cash equivalents, and restricted cash increased $138 million in the first six months of 2021.
46
Cash provided by operating activities of the equipment operations, including intercompany cash flows, in the first six months of 2020 was $842 million. This resulted primarily from cash inflows from net income adjusted for non-cash provisions and a change in net retirement benefits. Partially offsetting these operating cash inflows were cash outflows from a decrease in accounts payable and accrued expenses, a seasonal increase in inventories and trade and financing receivables held by the equipment operations, and a change in accrued income taxes payable/receivable. Cash, cash equivalents, and restricted cash increased $4,281 million in the first six months of 2020. The increase in cash was primarily related to equipment operations long-term borrowing issuances to provide added liquidity due to the financial uncertainty created by COVID in 2020.
Trade receivables held by the equipment operations increased $212 million during the first six months and decreased $194 million from a year ago. The equipment operations sell a significant portion of their trade receivables to financial services. See the previous consolidated discussion of trade receivables.
Inventories increased by $1,043 million during the first six months, primarily reflecting a seasonal increase, increased overall demand, and foreign currency translation. Inventories decreased by $129 million compared to a year ago. A majority of these inventories are valued on the last-in, first-out (LIFO) method. The ratios of inventories on a first-in, first-out (FIFO) basis (see Note 13), which approximates current cost, to the last 12 months’ cost of sales were 30 percent at May 2, 2021, compared to 28 percent at November 1, 2020 and 31 percent at May 3, 2020.
Total interest-bearing debt, excluding finance lease liabilities, of the equipment operations was $10,421 million at May 2, 2021, compared with $10,382 million at November 1, 2020 and $11,343 million at May 3, 2020. The ratios of debt to total capital (total interest-bearing debt and stockholders’ equity) were 41 percent, 45 percent, and 49 percent at May 2, 2021, November 1, 2020, and May 3, 2020, respectively.
In the second quarter of 2020, the equipment operations issued three tranches of notes in the U.S. with aggregate principal totaling $2,250 million that are due from 2025 to 2050. The equipment operations also issued Euro-Medium-Term notes with aggregate principal totaling €2,000 million (approximately $2,170 million based on the exchange rate at the issue date) that are due from 2024 to 2032. In the second quarter of 2020, the equipment operations issued commercial paper in the U.S. with aggregate principal totaling $466 million, of which $448 million had an original term greater than 90 days. None of the commercial paper was repaid in the second quarter of 2020 and was presented in “Increase in total short-term borrowings” in the consolidated statement of cash flows.
Property and equipment cash expenditures for the equipment operations in the first six months of 2021 were $319 million, compared with $440 million in the same period last year. Capital expenditures for the equipment operations in 2021 are estimated to be approximately $925 million.
Financial Services
The financial services operations rely on their ability to raise substantial amounts of funds to finance their receivable and lease portfolios. Their primary sources of funds for this purpose are a combination of commercial paper, term debt, securitization of retail notes, equity capital, and borrowings from Deere & Company.
During the first six months of 2021, the cash provided by operating and financing activities was used primarily to increase receivables and leases. Cash flows provided by operating activities, including intercompany cash flows, were $948 million in the first six months. Cash used for investing activities totaled $2,544 million in the first six months of 2021 primarily due an increase in trade and wholesale receivables of $1,246 million, the cost of receivables (excluding trade and wholesale) and cost of equipment on operating leases acquired exceeding the collection of these receivables and proceeds from sales of equipment on operating leases by $1,007 million, a change in collateral on derivatives - net of $254 million, and purchases of marketable securities exceeding proceeds from maturities and sales by $29 million. Cash provided by financing activities totaled $1,540 million, resulting primarily from an increase in external borrowings of $1,136 million and an increase in borrowings from Deere & Company of $562 million, partially offset by dividends paid to Deere & Company of $145 million. Cash, cash equivalents, and restricted cash decreased $29 million in the first six months of 2021.
During the first six months of 2020, the cash provided by operating activities and financing activities was used primarily to increase trade and wholesale receivables. Cash flows provided by operating activities, including intercompany cash flows, were $991 million in the first six months of 2020. Cash used for investing activities totaled $329 million in the first six months of 2020 primarily due to an increase in trade and wholesale receivables of $673 million and purchases of marketable securities exceeding proceeds from maturities and sales by $32 million. These cash outflows were partially offset by cash inflows from a change in collateral on derivatives - net of $319 million, and collections of receivables (excluding trade and wholesale) and proceeds from sales of equipment
47
on operating leases exceeding the cost of these receivables and the cost of equipment on operating leases acquired by $94 million. Cash provided by financing activities totaled $148 million, resulting primarily from an increase in borrowings from Deere & Company of $292 million and an increase in external borrowings of $94 million, partially offset by dividends paid to Deere & Company of $225 million. Cash, cash equivalents, and restricted cash increased $766 million in the first six months of 2020.
Receivables and leases held by the financial services operations consist of retail notes originated in connection with retail sales of new and used equipment by dealers of John Deere products, retail notes from non-Deere equipment customers, trade receivables, wholesale notes, revolving charge accounts, credit enhanced international export financing generally involving John Deere products, sales-type and direct financing leases, and operating leases. Total receivables and leases increased $2,460 million during the first six months of 2021 and increased $3,236 million in the past 12 months. Acquisition volumes of receivables (excluding trade and wholesale) and leases were 18 percent higher in the first six months of 2021, compared with the same period last year, as volumes of retail notes, financing leases, and revolving charge accounts were higher, while volumes of operating leases were lower. The amount of total trade receivables and wholesale notes increased compared to November 1, 2020 and May 3, 2020.
Total external interest-bearing debt of the financial services operations was $36,873 million at May 2, 2021, compared with $35,556 million at November 1, 2020 and $38,761 million at May 3, 2020. Total external borrowings have changed generally corresponding with the level of receivable and lease portfolio, the level of cash and cash equivalents, the change in payables owed to Deere & Company, and the change in investment from Deere & Company. The financial services operations’ ratio of interest-bearing debt, including intercompany debt, to stockholder’s equity was 7.7 to 1 at May 2, 2021, compared with 7.8 to 1 at November 1, 2020 and 8.3 to 1 at May 3, 2020.
Capital Corporation has a revolving credit agreement to utilize bank conduit facilities to securitize retail notes (see Note 12). At May 2, 2021, this facility had a total capacity, or “financing limit,” of up to $2,000 million of secured financings at any time. After a two-year revolving period, unless the banks and Capital Corporation agree to renew, Capital Corporation would liquidate the secured borrowings over time as payments on the retail notes are collected. At May 2, 2021, $1,261 million of short-term securitization borrowings was outstanding under the agreement.
In the first six months of 2021, the financial services operations issued $1,009 million and retired $1,573 million of retail note securitization borrowings. In addition, during the first six months of 2021, the financial services operations issued $3,967 million and retired $3,127 million of long-term borrowings, which were primarily medium-term notes.
Dividends and Other Events
The Company’s Board of Directors at its meeting on May 26, 2021 declared a quarterly dividend of $.90 per share payable August 9, 2021, to stockholders of record on June 30, 2021.
In May 2021, the Company’s financial services operations entered into a retail note securitization using its bank conduit facility that resulted in securitization borrowings of $723 million.
Supplemental Consolidating Information
The supplemental consolidating data presented on the subsequent pages is presented for informational purposes. The equipment operations represents the enterprise without financial services. The equipment operations includes the Company’s production and precision agriculture operations, small agriculture and turf operations, construction and forestry operations, and other corporate assets, liabilities, revenues, and expenses not reflected within financial services. Transactions between the “equipment operations” and “financial services” have been eliminated to arrive at the consolidated financial statements.
The equipment operations and financial services participate in different industries. The equipment operations primarily generate earnings and cash flows by manufacturing and distributing equipment, service parts, and technology solutions to dealers and end users. Financial services primarily finances sales and leases by dealers of new and used equipment that is largely manufactured by the Company. The financial services’ earnings and cash flows generally are finance income received from customer payments less interest expense, and depreciation on equipment subject to an operating lease. These two businesses are capitalized differently and have separate performance metrics. The supplemental consolidating data assists management in evaluating these two businesses.
48
| | | | | | | | | | | | | | | | | | | | | | | | | | |
DEERE & COMPANY | | | ||||||||||||||||||||||||
SUPPLEMENTAL CONSOLIDATING DATA | | | ||||||||||||||||||||||||
STATEMENT OF INCOME | | | ||||||||||||||||||||||||
For the Three Months Ended May 2, 2021 and May 3, 2020 | | | ||||||||||||||||||||||||
(In millions of dollars) Unaudited | | | ||||||||||||||||||||||||
| | EQUIPMENT | | FINANCIAL | | | | | | | ||||||||||||||||
| | OPERATIONS1 | | SERVICES | | ELIMINATIONS | | CONSOLIDATED | |
| ||||||||||||||||
| | 2021 | | 2020 | | 2021 | | 2020 | | 2021 | | 2020 | | 2021 | | 2020 | |
| ||||||||
Net Sales and Revenues |
| |
|
| | |
| |
|
| | |
| |
|
| | |
| |
|
| | | | |
Net sales | | $ | 10,998 | | $ | 8,224 | | | | | | | | | | | | | | $ | 10,998 | | $ | 8,224 | | |
Finance and interest income | | | 29 | |
| 23 | | $ | 853 | | $ | 906 | | $ | (73) | | $ | (80) | | | 809 | | | 849 | 2 | |
Other income | | | 228 | |
| 181 | | | 101 | |
| 61 | | | (78) | |
| (62) | | | 251 | |
| 180 | 3 | |
Total | | | 11,255 | |
| 8,428 | | | 954 | |
| 967 | | | (151) | |
| (142) | | | 12,058 | |
| 9,253 | | |
| | | | | | | | | | | | | | | | | | | | | | | | | | |
Costs and Expenses | | | | | | | | | | | | | | | | | | | | | | | | | | |
Cost of sales | | | 7,929 | |
| 6,294 | | | | | | | | | (1) | |
| | | | 7,928 | | | 6,294 | 4 | |
Research and development expenses | | | 377 | |
| 406 | | | | | | | | | | | | | | | 377 | | | 406 | | |
Selling, administrative and general expenses | | | 734 | |
| 700 | | | 107 | |
| 208 | | | (3) | |
| (2) | | | 838 | |
| 906 | 4 | |
Interest expense | | | 100 | |
| 83 | | | 181 | |
| 266 | | | (13) | |
| (7) | | | 268 | |
| 342 | 5 | |
Interest compensation to Financial Services | | | 60 | |
| 73 | | | | | | | | | (60) | |
| (73) | | | | | | | 5 | |
Other operating expenses | | | 40 | |
| 21 | | | 369 | |
| 416 | | | (74) | |
| (60) | | | 335 | |
| 377 | 6 | |
Total | | | 9,240 | |
| 7,577 | | | 657 | |
| 890 | | | (151) | |
| (142) | | | 9,746 | |
| 8,325 | | |
| | | | | | | | | | | | | | | | | | | | | | | | | | |
Income before Income Taxes | | | 2,015 | |
| 851 | | | 297 | |
| 77 | | | | |
| | | | 2,312 | |
| 928 | | |
Provision for income taxes | | | 454 | |
| 228 | | | 76 | |
| 17 | | | | |
| | | | 530 | |
| 245 | | |
| | | | | | | | | | | | | | | | | | | | | | | | | | |
Income after Income Taxes | | | 1,561 | |
| 623 | | | 221 | |
| 60 | | | | |
| | | | 1,782 | |
| 683 | | |
Equity in income (loss) of unconsolidated affiliates | | | 7 | |
| (17) | | | 1 | |
| | | | | | | | | | 8 | | | (17) | | |
| | | | | | | | | | | | | | | | | | | | | | | | | | |
Net Income | | | 1,568 | |
| 606 | | | 222 | |
| 60 | | | | |
| | | | 1,790 | |
| 666 | | |
Less: Net income attributable to noncontrolling interests | | | | |
| | | | | | | | | | | | | | | | | | | | | |
Net Income Attributable to Deere & Company | | $ | 1,568 | | $ | 606 | | $ | 222 | | $ | 60 | | | | | | | | $ | 1,790 | | $ | 666 | | |
| | | | | | | | | | | | | | | | | | | | | | | | | | |
1 The equipment operations represents the enterprise without financial services. The equipment operations includes the Company’s production and precision agriculture operations, small agriculture and turf operations, construction and forestry operations, and other corporate assets, liabilities, revenues, and expenses not reflected within financial services.
2 Elimination of financial services’ interest income earned from equipment operations.
3 Elimination of equipment operations’ margin from inventory transferred to equipment on operating leases (see Note 2).
4 Elimination of intercompany service fees.
5 Elimination of equipment operations’ interest expense to financial services.
6 Elimination of financial services’ lease depreciation expense related to inventory transferred to equipment on operating leases.
49
| | | | | | | | | | | | | | | | | | | | | | | | | | |
DEERE & COMPANY | | | ||||||||||||||||||||||||
SUPPLEMENTAL CONSOLIDATING DATA (Continued) | | | ||||||||||||||||||||||||
STATEMENT OF INCOME | | | ||||||||||||||||||||||||
For the Six Months Ended May 2, 2021 and May 3, 2020 | | | ||||||||||||||||||||||||
(In millions of dollars) Unaudited | | | ||||||||||||||||||||||||
| | EQUIPMENT | | FINANCIAL | | | | | | | ||||||||||||||||
| | OPERATIONS1 | | SERVICES | | ELIMINATIONS | | CONSOLIDATED | |
| ||||||||||||||||
| | 2021 | | 2020 | | 2021 | | 2020 | | 2021 | | 2020 | | 2021 | | 2020 | |
| ||||||||
Net Sales and Revenues |
| | |
| | |
| | |
| | |
| | |
| | |
| | |
| | |
| |
Net sales | | $ | 19,049 | | $ | 14,754 | | | | | | | | | | | | | | $ | 19,049 | | $ | 14,754 | | |
Finance and interest income | | | 62 | |
| 49 | | $ | 1,716 | | $ | 1,841 | | $ | (134) | | $ | (145) | | | 1,644 | | | 1,745 | 2 | |
Other income | | | 447 | |
| 391 | | | 172 | |
| 124 | | | (142) | |
| (130) | | | 477 | |
| 385 | 3 | |
Total | | | 19,558 | |
| 15,194 | | | 1,888 | |
| 1,965 | | | (276) | |
| (275) | | | 21,170 | |
| 16,884 | | |
| | | | | | | | | | | | | | | | | | | | | | | | | | |
Costs and Expenses | | | | | | | | | | | | | | | | | | | | | | | | | | |
Cost of sales | | | 13,735 | |
| 11,372 | | | | | | | | | (1) | |
| (1) | | | 13,734 | | | 11,371 | 4 | |
Research and development expenses | | | 743 | |
| 831 | | | | | | | | | | | | | | | 743 | | | 831 | | |
Selling, administrative and general expenses | | | 1,387 | |
| 1,373 | | | 224 | |
| 346 | | | (4) | |
| (4) | | | 1,607 | |
| 1,715 | 4 | |
Interest expense | | | 195 | |
| 146 | | | 369 | |
| 541 | | | (26) | |
| (9) | | | 538 | |
| 678 | 5 | |
Interest compensation to Financial Services | | | 108 | |
| 137 | | | | | | | | | (108) | |
| (137) | | | | | | | 5 | |
Other operating expenses | | | 107 | |
| 92 | | | 738 | |
| 824 | | | (137) | |
| (124) | | | 708 | |
| 792 | 6 | |
Total | | | 16,275 | |
| 13,951 | | | 1,331 | |
| 1,711 | | | (276) | |
| (275) | | | 17,330 | |
| 15,387 | | |
| | | | | | | | | | | | | | | | | | | | | | | | | | |
Income before Income Taxes | | | 3,283 | |
| 1,243 | | | 557 | |
| 254 | | | | |
| | | | 3,840 | |
| 1,497 | | |
Provision for income taxes | | | 706 | |
| 237 | | | 132 | |
| 58 | | | | |
| | | | 838 | |
| 295 | | |
| | | | | | | | | | | | | | | | | | | | | | | | | | |
Income after Income Taxes | | | 2,577 | |
| 1,006 | | | 425 | |
| 196 | | | | |
| | | | 3,002 | |
| 1,202 | | |
Equity in income (loss) of unconsolidated affiliates | | | 10 | |
| (19) | | | 2 | |
| 1 | | | | | | | | | 12 | | | (18) | | |
| | | | | | | | | | | | | | | | | | | | | | | | | | |
Net Income | | | 2,587 | |
| 987 | | | 427 | |
| 197 | | | | |
| | | | 3,014 | |
| 1,184 | | |
Less: Net income attributable to noncontrolling interests | | | 1 | |
| 2 | | | | |
| | | | | | | | | | 1 | | | 2 | | |
Net Income Attributable to Deere & Company | | $ | 2,586 | | $ | 985 | | $ | 427 | | $ | 197 | | | | | | | | $ | 3,013 | | $ | 1,182 | | |
| | | | | | | | | | | | | | | | | | | | | | | | | | |
1 The equipment operations represents the enterprise without financial services. The equipment operations includes the Company’s production and precision agriculture operations, small agriculture and turf operations, construction and forestry operations, and other corporate assets, liabilities, revenues, and expenses not reflected within financial services.
2 Elimination of financial services’ interest income earned from equipment operations.
3 Elimination of equipment operations’ margin from inventory transferred to equipment on operating leases (see Note 2).
4 Elimination of intercompany service fees.
5 Elimination of equipment operations’ interest expense to financial services.
6 Elimination of financial services’ lease depreciation expense related to inventory transferred to equipment on operating leases.
50
| | | | | | | | | | | | | | | | | | | | | | | | | | | | | | | | | | | | | | |
DEERE & COMPANY | | | | | | | | | | | | | | | | | | | | | | | | | | | | | | |||||||||
SUPPLEMENTAL CONSOLIDATING DATA (Continued) | | | | | | | | | | | | | | | | | | | | | | | | | | | | | | |||||||||
CONDENSED BALANCE SHEET | | | | | | | | | | | | | | | | | | | | | | | | | | | | | | |||||||||
(In millions of dollars) Unaudited | | | | | | | | | | | | | | | | | | | | | | | | | | | | | | |||||||||
| | EQUIPMENT | | FINANCIAL | | | | | | | ||||||||||||||||||||||||||||
| | OPERATIONS1 | | SERVICES | | ELIMINATIONS | | CONSOLIDATED | | | ||||||||||||||||||||||||||||
| | May 2 | | Nov 1 | | May 3 | | May 2 | | Nov 1 | | May 3 | | May 2 | | Nov 1 | | May 3 | | May 2 | | Nov 1 | | May 3 | | | ||||||||||||
| | 2021 | | 2020 | | 2020 | | 2021 | | 2020 | | 2020 | | 2021 | | 2020 | | 2020 | | 2021 | | 2020 | | 2020 | | | ||||||||||||
Assets |
|
|
|
|
|
|
|
|
|
|
|
|
|
|
|
|
|
|
|
|
|
|
|
|
|
|
|
|
|
|
|
|
|
|
|
| | |
Cash and cash equivalents | | $ | 6,282 | | $ | 6,145 | | $ | 7,466 | | $ | 900 | | $ | 921 | | $ | 1,434 | | | | | | | | | | | $ | 7,182 | | $ | 7,066 | | $ | 8,900 | | |
Marketable securities | | | 5 | |
| 7 | |
| 3 | | | 663 | |
| 634 | |
| 623 | | | | |
| | |
| | | | 668 | |
| 641 | |
| 626 | | |
Receivables from unconsolidated affiliates | | | 5,986 | |
| 5,290 | |
| 2,248 | | | | | | | | | | | $ | (5,955) | | $ | (5,259) | | $ | (2,216) | | | 31 | | | 31 | | | 32 | 7 | |
Trade accounts and notes receivable – net | | | 1,225 | |
| 1,013 | |
| 1,419 | | | 6,222 | |
| 4,238 | |
| 6,050 | | | (1,289) | |
| (1,080) | |
| (1,483) | | | 6,158 | |
| 4,171 | |
| 5,986 | 8 | |
Financing receivables – net | | | 99 | |
| 106 | |
| 118 | | | 30,895 | |
| 29,644 | |
| 27,138 | | | | |
| | |
| | | | 30,994 | |
| 29,750 | |
| 27,256 | | |
Financing receivables securitized – net | | | 15 | | | 26 | | | 37 | | | 4,092 | |
| 4,677 | |
| 4,648 | | | | |
| | |
| | | | 4,107 | |
| 4,703 | |
| 4,685 | | |
Other receivables | | | 1,338 | |
| 1,117 | |
| 1,072 | | | 162 | |
| 151 | |
| 148 | | | (27) | |
| (48) | |
| (8) | | | 1,473 | |
| 1,220 | |
| 1,212 | 8 | |
Equipment on operating leases – net | | | | | | | | | | | | 7,108 | |
| 7,298 | |
| 7,245 | | | | |
| | |
| | | | 7,108 | |
| 7,298 | |
| 7,245 | | |
Inventories | | | 6,042 | |
| 4,999 | |
| 6,171 | | | | | | | | | | | | | | | | | | | | | 6,042 | | | 4,999 | | | 6,171 | | |
Property and equipment – net | | | 5,667 | |
| 5,778 | |
| 5,642 | | | 37 | |
| 39 | |
| 43 | | | | |
| | |
| | | | 5,704 | |
| 5,817 | |
| 5,685 | | |
Investments in unconsolidated affiliates | | | 161 | |
| 174 | |
| 175 | | | 21 | |
| 19 | |
| 17 | | | | |
| | |
| | | | 182 | |
| 193 | |
| 192 | | |
Goodwill | | | 3,190 | |
| 3,081 | |
| 2,917 | | | | | | | | | | | | | | | | | | | | | 3,190 | | | 3,081 | | | 2,917 | | |
Other intangible assets – net | | | 1,310 | |
| 1,327 | |
| 1,311 | | | | |
| | |
| | | | | |
| | |
| | | | 1,310 | |
| 1,327 | |
| 1,311 | | |
Retirement benefits | | | 947 | |
| 859 | |
| 908 | | | 61 | |
| 59 | |
| 58 | | | (57) | |
| (55) | |
| (6) | | | 951 | |
| 863 | |
| 960 | 9 | |
Deferred income taxes | | | 1,926 | |
| 1,763 | |
| 1,796 | | | 53 | |
| 45 | |
| 52 | | | (255) | |
| (309) | |
| (413) | | | 1,724 | |
| 1,499 | |
| 1,435 | 10 | |
Other assets | | | 1,522 | |
| 1,439 | |
| 1,506 | | | 635 | |
| 994 | |
| 1,208 | | | (2) | |
| (1) | |
| (1) | | | 2,155 | |
| 2,432 | |
| 2,713 | | |
Total Assets | | $ | 35,715 | | $ | 33,124 | | $ | 32,789 | | $ | 50,849 | | $ | 48,719 | | $ | 48,664 | | $ | (7,585) | | $ | (6,752) | | $ | (4,127) | | $ | 78,979 | | $ | 75,091 | | $ | 77,326 | | |
| | | | | | | | | | | | | | | | | | | | | | | | | | | | | | | | | | | | | | |
Liabilities and Stockholders’ Equity | | | | | | | | | | | | | | | | | | | | | | | | | | | | | | | | | | | | | | |
| | | | | | | | | | | | | | | | | | | | | | | | | | | | | | | | | | | | | | |
Liabilities | | | | | | | | | | | | | | | | | | | | | | | | | | | | | | | | | | | | | | |
Short-term borrowings | | $ | 352 | | $ | 292 | | $ | 1,398 | | $ | 9,559 | | $ | 8,290 | | $ | 9,781 | | | | | | | | | | | $ | 9,911 | | $ | 8,582 | | $ | 11,179 | | |
Short-term securitization borrowings | | | 14 | | | 26 | | | 37 | | | 4,092 | |
| 4,656 | |
| 4,603 | | | | |
| | |
| | | | 4,106 | |
| 4,682 | |
| 4,640 | | |
Payables to unconsolidated affiliates | | | 155 | |
| 104 | |
| 91 | | | 5,955 | |
| 5,260 | |
| 2,216 | | $ | (5,955) | | $ | (5,259) | | $ | (2,216) | | | 155 | |
| 105 | |
| 91 | 7 | |
Accounts payable and accrued expenses | | | 9,919 | |
| 9,114 | |
| 8,416 | | | 1,926 | |
| 2,127 | |
| 2,149 | | | (1,318) | |
| (1,129) | |
| (1,493) | | | 10,527 | |
| 10,112 | |
| 9,072 | 8 | |
Deferred income taxes | | | 390 | |
| 385 | |
| 395 | | | 398 | |
| 443 | |
| 493 | | | (255) | |
| (309) | |
| (413) | | | 533 | |
| 519 | |
| 475 | 10 | |
Long-term borrowings | | | 10,124 | |
| 10,124 | |
| 9,947 | | | 23,222 | |
| 22,610 | |
| 24,377 | | | | |
| | |
| | | | 33,346 | |
| 32,734 | |
| 34,324 | | |
Retirement benefits and other liabilities | | | 5,253 | |
| 5,366 | |
| 5,584 | | | 109 | |
| 102 | |
| 101 | | | (57) | |
| (55) | |
| (5) | | | 5,305 | |
| 5,413 | |
| 5,680 | 9 | |
Total liabilities | | | 26,207 | | | 25,411 | | | 25,868 | | | 45,261 | | | 43,488 | | | 43,720 | | | (7,585) | | | (6,752) | | | (4,127) | | | 63,883 | | | 62,147 | | | 65,461 | | |
| | | | | | | | | | | | | | | | | | | | | | | | | | | | | | | | | | | | | | |
Commitments and contingencies (Note 18) | | | | | | | | | | | | | | | | | | | | | | | | | | | | | | | | | | | | | | |
| | | | | | | | | | | | | | | | | | | | | | | | | | | | | | | | | | | | | | |
Stockholders’ Equity | | | | | | | | | | | | | | | | | | | | | | | | | | | | | | | | | | | | | | |
Total Deere & Company stockholders’ equity | | | 15,092 | |
| 12,937 | |
| 11,864 | | | 5,588 | | | 5,231 | | | 4,944 | | | (5,588) | | | (5,231) | | | (4,944) | | | 15,092 | | | 12,937 | | | 11,864 | 11 | |
Noncontrolling interests | | | 4 | |
| 7 | |
| 1 | | | | | | | | | | | | | | | | | | | | | 4 | | | 7 | | | 1 | | |
Financial Services’ equity | | | (5,588) | |
| (5,231) | |
| (4,944) | | | | | | | | | | | | 5,588 | | | 5,231 | | | 4,944 | | | | | | | | | | 11 | |
Adjusted total stockholders’ equity | | | 9,508 | |
| 7,713 | |
| 6,921 | | | 5,588 | |
| 5,231 | |
| 4,944 | | | | |
| | |
| | | | 15,096 | |
| 12,944 | |
| 11,865 | | |
Total Liabilities and Stockholders’ Equity | | $ | 35,715 | | $ | 33,124 | | $ | 32,789 | | $ | 50,849 | | $ | 48,719 | | $ | 48,664 | | $ | (7,585) | | $ | (6,752) | | $ | (4,127) | | $ | 78,979 | | $ | 75,091 | | $ | 77,326 | | |
| | | | | | | | | | | | | | | | | | | | | | | | | | | | | | | | | | | | | | |
1 The equipment operations represents the enterprise without financial services. The equipment operations includes the Company’s production and precision agriculture operations, small agriculture and turf operations, construction and forestry operations, and other corporate assets, liabilities, revenues, and expenses not reflected within financial services.
7 Elimination of receivables / payables between equipment operations and financial services.
8 Reclassification of sales incentive accruals on receivables sold to financial services.
9 Reclassification of net pension assets / liabilities.
10 Reclassification of deferred tax assets / liabilities in the same taxing jurisdictions.
11 Elimination of financial services’ equity.
51
| | | | | | | | | | | | | | | | | | | | | | | | | | |
DEERE & COMPANY | | | ||||||||||||||||||||||||
SUPPLEMENTAL CONSOLIDATING DATA (Continued) | | | ||||||||||||||||||||||||
STATEMENT OF CASH FLOWS | | | ||||||||||||||||||||||||
For the Six Months Ended May 2, 2021 and May 3, 2020 | | | ||||||||||||||||||||||||
(In millions of dollars) Unaudited | | | | | | | | | | | | | | | | | | | | | | | | | | |
| | EQUIPMENT | | FINANCIAL | | | | | | | ||||||||||||||||
| | OPERATIONS1 | | SERVICES | | ELIMINATIONS | | CONSOLIDATED | | | ||||||||||||||||
| | 2021 | | 2020 | | 2021 | | 2020 | | 2021 | | 2020 | | 2021 | | 2020 | | | ||||||||
Cash Flows from Operating Activities |
| |
|
| |
|
| |
|
| |
|
| |
|
| |
|
| |
|
| |
|
| |
Net income | | $ | 2,587 | | $ | 987 | | $ | 427 | | $ | 197 | | | | | | | | $ | 3,014 | | $ | 1,184 | | |
Adjustments to reconcile net income to net cash provided by operating activities: | | | | | | | | | | | | | | | | | | | | | | | | | | |
Provision (credit) for credit losses | |
| 2 | |
| 9 | |
| (26) | |
| 98 | |
| | |
| | |
| (24) | |
| 107 | | |
Provision for depreciation and amortization | |
| 543 | |
| 515 | |
| 581 | |
| 621 | | $ | (70) | | $ | (69) | |
| 1,054 | |
| 1,067 | 12 | |
Impairment charges | | | 50 | |
| 82 | |
| | |
| 32 | |
| | |
| | |
| 50 | |
| 114 | | |
Share-based compensation expense | | | | | | | | | | | | | | | 45 | | | 48 | | | 45 | | | 48 | 13 | |
Undistributed earnings of unconsolidated affiliates | |
| 158 | |
| 218 | |
| (2) | |
| (1) | |
| (145) | |
| (225) | |
| 11 | |
| (8) | 14 | |
Provision (credit) for deferred income taxes | |
| (170) | |
| 9 | |
| (43) | |
| (70) | |
| | |
| | |
| (213) | |
| (61) | | |
Changes in assets and liabilities: | | | | | | | | | | | | | | | | | | | | | | | | | | |
Trade, notes, and financing receivables related to sales | |
| (170) | |
| (80) | | | | | | | | | (954) | | | (411) | | | (1,124) | | | (491) | 15, 17, 18 | |
Inventories | |
| (926) | |
| (242) | | | | | | | | | (267) | | | (254) | | | (1,193) | | | (496) | 16 | |
Accounts payable and accrued expenses | |
| 527 | |
| (659) | |
| (1) | |
| 30 | |
| (208) | |
| (78) | |
| 318 | |
| (707) | 17 | |
Accrued income taxes payable/receivable | |
| 77 | |
| (154) | |
| (23) | |
| (19) | |
| | |
| | |
| 54 | |
| (173) | | |
Retirement benefits | |
| (8) | |
| 50 | |
| 3 | |
| 8 | |
| | |
| | |
| (5) | |
| 58 | | |
Other | |
| (163) | |
| 107 | |
| 32 | |
| 95 | |
| (70) | |
| (68) | |
| (201) | |
| 134 | 12, 13, 16 | |
Net cash provided by operating activities | |
| 2,507 | |
| 842 | |
| 948 | |
| 991 | |
| (1,669) | |
| (1,057) | |
| 1,786 | |
| 776 | | |
| | | | | | | | | | | | | | | | | | | | | | | | | | |
Cash Flows from Investing Activities | | | | | | | | | | | | | | | | | | | | | | | | | | |
Collections of receivables (excluding receivables related to sales) | | | | | | | |
| 11,187 | |
| 10,385 | |
| (820) | |
| (761) | |
| 10,367 | |
| 9,624 | 15 | |
Proceeds from maturities and sales of marketable securities | |
| 2 | |
| | |
| 45 | |
| 39 | |
| | |
| | |
| 47 | |
| 39 | | |
Proceeds from sales of equipment on operating leases | | | | | | | |
| 1,011 | |
| 898 | |
| | |
| | |
| 1,011 | |
| 898 | | |
Cost of receivables acquired (excluding receivables related to sales) | | | | | | | |
| (12,080) | |
| (9,885) | |
| 721 | |
| 518 | |
| (11,359) | |
| (9,367) | 15 | |
Acquisitions of businesses, net of cash acquired | | | (19) | | | | |
| | |
| | |
| | |
| | |
| (19) | |
| | | |
Purchases of marketable securities | | | | |
| | |
| (74) | |
| (71) | |
| | |
| | |
| (74) | |
| (71) | | |
Purchases of property and equipment | |
| (319) | |
| (440) | |
| (1) | |
| (1) | |
| | |
| | |
| (320) | |
| (441) | | |
Cost of equipment on operating leases acquired | | | | | | | |
| (1,125) | |
| (1,304) | |
| 361 | |
| 344 | |
| (764) | |
| (960) | 16 | |
Increase in trade and wholesale receivables | | | | | | | |
| (1,246) | |
| (673) | |
| 1,246 | |
| 673 | |
| | |
| | 15 | |
Collateral on derivatives – net | | | (1) | | | | | | (254) | | | 319 | | | | | | | | | (255) | | | 319 | | |
Other | |
| (38) | |
| (40) | |
| (7) | |
| (36) | |
| 24 | |
| 65 | |
| (21) | |
| (11) | 14, 18 | |
Net cash provided by (used for) investing activities | |
| (375) | |
| (480) | |
| (2,544) | |
| (329) | |
| 1,532 | |
| 839 | |
| (1,387) | |
| 30 | | |
| | | | | | | | | | | | | | | | | | | | | | | | | | |
Cash Flows from Financing Activities | | | | | | | | | | | | | | | | | | | | | | | | | | |
Increase (decrease) in total short-term borrowings | |
| (84) | |
| 554 | |
| 296 | |
| 584 | |
| | |
| | |
| 212 | |
| 1,138 | | |
Change in intercompany receivables/payables | |
| (562) | |
| (292) | |
| 562 | |
| 292 | |
| | |
| | |
| | |
| | | |
Proceeds from long-term borrowings | |
| | |
| 4,602 | |
| 3,967 | |
| 2,673 | |
| | |
| | |
| 3,967 | |
| 7,275 | | |
Payments of long-term borrowings | |
| (30) | |
| (152) | |
| (3,127) | |
| (3,163) | |
| | |
| | |
| (3,157) | |
| (3,315) | | |
Proceeds from issuance of common stock | |
| 116 | |
| 70 | | | | | | | | | | | | | | | 116 | | | 70 | | |
Repurchases of common stock | |
| (1,044) | |
| (263) | | | | | | | | | | | | | | | (1,044) | | | (263) | | |
Dividends paid | |
| (480) | |
| (481) | |
| (145) | | | (225) | |
| 145 | | | 225 | |
| (480) | | | (481) | 14 | |
Other | |
| (34) | |
| (61) | |
| (13) | |
| (13) | |
| (8) | |
| (7) | |
| (55) | |
| (81) | 14 | |
Net cash provided by (used for) financing activities | |
| (2,118) | |
| 3,977 | |
| 1,540 | |
| 148 | |
| 137 | |
| 218 | |
| (441) | |
| 4,343 | | |
| | | | | | | | | | | | | | | | | | | | | | | | | | |
Effect of Exchange Rate Changes on Cash, Cash Equivalents, and Restricted Cash | |
| 124 | |
| (58) | |
| 27 | |
| (44) | |
| | |
| | |
| 151 | |
| (102) | | |
| | | | | | | | | | | | | | | | | | | | | | | | | | |
Net Increase (Decrease) in Cash, Cash Equivalents, and Restricted Cash | |
| 138 | |
| 4,281 | |
| (29) | |
| 766 | |
| | |
| | |
| 109 | |
| 5,047 | | |
Cash, Cash Equivalents, and Restricted Cash at Beginning of Period | |
| 6,156 | |
| 3,196 | |
| 1,016 | |
| 760 | |
| | |
| | |
| 7,172 | |
| 3,956 | | |
Cash, Cash Equivalents, and Restricted Cash at End of Period | | $ | 6,294 | | $ | 7,477 | | $ | 987 | | $ | 1,526 | | | | | | | | $ | 7,281 | | $ | 9,003 | | |
| | | | | | | | | | | | | | | | | | | | | | | | | | |
1 The equipment operations represents the enterprise without financial services. The equipment operations includes the Company’s production and precision agriculture operations, small agriculture and turf operations, construction and forestry operations, and other corporate assets, liabilities, revenues, and expenses not reflected within financial services.
12 Elimination of depreciation on leases related to inventory transferred to equipment on operating leases (see Note 2).
13 Reclassification of share-based compensation expense.
14 Elimination of dividends from financial services to the equipment operations, which are included in the equipment operations’ net cash provided by operating activities, and capital investments in financial services from the equipment operations.
15 Primarily reclassification of receivables related to the sale of equipment.
16 Reclassification of lease agreements with direct customers.
17 Reclassification of sales incentive accruals on receivables sold to financial services.
18 Elimination and reclassification of the effects of financial services’ partial financing of the construction and forestry retail locations sales and subsequent collection of those amounts.
52
Item 3. QUANTITATIVE AND QUALITATIVE DISCLOSURES ABOUT MARKET RISK
See the Company’s most recent annual report filed on Form 10-K (Part II, Item 7A). There has been no material change in this information.
Item 4. CONTROLS AND PROCEDURES
The Company’s principal executive officer and its principal financial officer have concluded that the Company’s disclosure controls and procedures (as defined in Rules 13a-15(e) and 15d-15(e) of the Securities Exchange Act of 1934, as amended (the Exchange Act)) were effective as of May 2, 2021, based on the evaluation of these controls and procedures required by Rule 13a-15(b) or 15d-15(b) of the Exchange Act. During the second quarter, there were no changes that have materially affected or are reasonably likely to materially affect the Company’s internal control over financial reporting.
PART II. OTHER INFORMATION
Item 1. Legal Proceedings
The Company is subject to various unresolved legal actions which arise in the normal course of its business, the most prevalent of which relate to product liability (including asbestos-related liability), retail credit, employment, patent, and trademark matters. Item 103 of the SEC’s Regulation S-K requires disclosure of certain environmental matters when a governmental authority is a party to the proceedings and the proceedings involve potential monetary sanctions that John Deere reasonably believes could exceed $300,000. The following matter is disclosed solely pursuant to that requirement: on October 3, 2018, the Provincia Santa Fe Ministerio de Medio Ambiente of Argentina issued a Notice of Violation to Industrias John Deere Argentina in connection with alleged groundwater contamination at the site; the Company worked with the appropriate authorities to implement corrective actions to remediate the site. On December 16, 2019, the Provincia Santa Fe Ministerio de Medio Ambiente issued a Notice of Fine. The current amount of the fine is approximately $357,000. The Company has filed an appeal, which is still pending. On March 26, 2021, the Company received a notice from the Provincia Santa Fe Ministerio de Medio Ambiente requesting payment of the fine. The Company is evaluating its response. The Company believes the reasonably possible range of losses for this and other unresolved legal actions would not have a material effect on its financial statements.
Item 1A. Risk Factors
See the Company’s most recent annual report filed on Form 10-K (Part I, Item 1A). There has been no material change in this information. The risks described in the annual report on Form 10-K, and the “Safe Harbor Statement” in this report, are not the only risks faced by the Company. Additional risks and uncertainties may also materially affect the Company’s business, financial condition, or operating results. One should not consider the risk factors to be a complete discussion of risks, uncertainties, and assumptions.
Item 2. Unregistered Sales of Equity Securities and Use of Proceeds
The Company’s purchases of its common stock during the second quarter of 2021 were as follows:
| | | | | | | | | | |
|
| |
| | |
| Total Number of |
| |
|
| | | | | | | Shares Purchased as | | Maximum Number of |
|
| | Total Number of | | | | | Part of Publicly | | Shares that May Yet Be |
|
| | Shares | | | | | Announced Plans or | | Purchased under the |
|
| | Purchased | | Average Price | | Programs (1) | | Plans or Programs (1) |
| |
Period | | (thousands) | | Paid Per Share | | (thousands) | | (millions) |
| |
Feb 1 to Feb 28 | | 587 |
| $ | 317.53 | | 587 | | 21.1 | |
Mar 1 to Mar 28 | | 677 | | | 362.06 | | 677 | | 20.4 | |
Mar 29 to May 2 | | 694 | | | 376.30 | | 694 | | 19.7 | |
Total | | 1,958 | | | | | 1,958 | | | |
| (1) | During the second quarter of 2021, the Company had a share repurchase plan that was announced in December 2019 to purchase up to $8,000 million of shares of the Company’s common stock. The maximum number of shares that may yet be purchased under this plan was based on the end of the second quarter closing share price of $370.85 per share. At the end of the second quarter of 2021, $7,305 million of common stock remained to be purchased under the plan. |
53
Item 3. Defaults Upon Senior Securities
None.
Item 4. Mine Safety Disclosures
Not applicable.
Item 5. Other Information
Not applicable.
Item 6. Exhibits
Certain instruments relating to long-term borrowings constituting less than 10 percent of the registrant’s total assets are not filed as exhibits herewith pursuant to Item 601(b)(4)(iii)(A) of Regulation S-K. The registrant will file copies of such instruments upon request of the Commission.
| |
| |
3.1 | |
| |
3.2 | Bylaws, as amended (Exhibit 3.1 to Form 8-K of registrant filed on December 3, 2020, Securities and Exchange Commission File Number 1-4121*) |
| |
10.1 | |
| |
10.2 | |
| |
10.3 | |
| |
31.1 | |
| |
31.2 | |
| |
32 | |
| |
101.SCH | Inline XBRL Taxonomy Extension Schema Document |
| |
101.CAL | Inline XBRL Taxonomy Extension Calculation Linkbase Document |
| |
101.DEF | Inline XBRL Taxonomy Extension Definition Linkbase Document |
| |
101.LAB | Inline XBRL Taxonomy Extension Label Linkbase Document |
| |
101.PRE | Inline XBRL Taxonomy Extension Presentation Linkbase Document |
| |
104 | Cover Page Interactive Data File (formatted as Inline XBRL and contained in Exhibit 101) |
| |
* Incorporated by reference. Copies of these exhibits are available from the Company upon request.
54
SIGNATURES
Pursuant to the requirements of the Securities Exchange Act of 1934, the registrant has duly caused this report to be signed on its behalf by the undersigned thereunto duly authorized.
| | | | |
| DEERE & COMPANY | |||
| | |||
| | |||
Date: | May 27, 2021 | | By: | /s/ Ryan D. Campbell |
| | | | Ryan D. Campbell |
55