EVERSOURCE ENERGY YEAR END 2024 EARNINGS REPORT February 12, 2025 EVERSOURCE ENERGY YEAR END 2024 EARNINGS REPORT Exhibit 99.3
EVERSOURCE ENERGY YEAR END 2024 EARNINGS REPORT Safe Harbor Statement All per-share amounts in this presentation are reported on a diluted basis. The only common equity securities that are publicly traded are common shares of Eversource Energy. The earnings discussion includes financial measures that are not recognized under generally accepted accounting principles (non-GAAP) referencing earnings and EPS excluding losses on the sales and impairments of the offshore wind equity method investments, a loss on the pending sale of the Aquarion water distribution business, a loss on the disposition of land that was initially acquired to construct the Northern Pass Transmission project and was subsequently abandoned, and certain transaction and transition costs. EPS by business is also a non-GAAP financial measure and is calculated by dividing the net income attributable to common shareholders of each business by the weighted average diluted Eversource Energy common shares outstanding for the period. The earnings and EPS of each business do not represent a direct legal interest in the assets and liabilities of such business, but rather represent a direct interest in Eversource Energy's assets and liabilities as a whole. Eversource Energy uses these non-GAAP financial measures to evaluate and provide details of earnings results by business and to more fully compare and explain results without including these items. This information is among the primary indicators management uses as a basis for evaluating performance and planning and forecasting of future periods. Management believes the impacts of the losses on the offshore wind equity method investments, the loss on the pending sale of the Aquarion water distribution business, the loss on the disposition of land associated with an abandoned project, and transaction and transition costs are not indicative of Eversource Energy's ongoing costs and performance. Management views these charges as not directly related to the ongoing operations of the business and therefore not an indicator of baseline operating performance. Due to the nature and significance of the effect of these items on net income attributable to common shareholders and EPS, management believes that the non-GAAP presentation is a more meaningful representation of Eversource Energy's financial performance and provides additional and useful information to readers of this report in analyzing historical and future performance of the business. These non-GAAP financial measures should not be considered as alternatives to reported net income attributable to common shareholders or EPS determined in accordance with GAAP as indicators of Eversource Energy's operating performance. This document includes statements concerning Eversource Energy's expectations, beliefs, plans, objectives, goals, strategies, assumptions of future events, future financial performance or growth and other statements that are not historical facts. These statements are "forward-looking statements" within the meaning of U.S. federal securities laws. Generally, readers can identify these forward-looking statements through the use of words or phrases such as "estimate," "expect," "pending," "anticipate," "intend," "plan," "project," "believe," "forecast," "would," "should," "could" and other similar expressions. Forward-looking statements involve risks and uncertainties that may cause actual results or outcomes to differ materially from those included in the forward-looking statements. Forward-looking statements are based on the current expectations, estimates, assumptions or projections of management and are not guarantees of future performance. These expectations, estimates, assumptions or projections may vary materially from actual results. Accordingly, any such statements are qualified in their entirety by reference to, and are accompanied by, the following important factors that may cause our actual results or outcomes to differ materially from those contained in our forward-looking statements, including, but not limited to cyberattacks or breaches, including those resulting in the compromise of the confidentiality of our proprietary information and the personal information of our customers; the ability to qualify for investment tax credits and investment tax credit adders; variability in the costs and final investment returns of the Revolution Wind and South Fork Wind offshore wind projects as it relates to the purchase price post-closing adjustment under the terms of the sale agreement for these projects; disruptions in the capital markets or other events that make our access to necessary capital more difficult or costly; changes in economic conditions, including impact on interest rates, tax policies, and customer demand and payment ability; ability or inability to commence and complete our major strategic development projects and opportunities; acts of war or terrorism, physical attacks or grid disturbances that may damage and disrupt our electric transmission and electric, natural gas, and water distribution systems; actions or inaction of local, state and federal regulatory, public policy and taxing bodies; substandard performance of third-party suppliers and service providers; fluctuations in weather patterns, including extreme weather due to climate change; changes in business conditions, which could include disruptive technology or development of alternative energy sources related to our current or future business model; contamination of, or disruption in, our water supplies; changes in levels or timing of capital expenditures; changes in laws, regulations, Presidential executive orders or regulatory policy, including compliance with environmental laws and regulations; changes in accounting standards and financial reporting regulations; actions of rating agencies; and other presently unknown or unforeseen factors. Other risk factors are detailed in Eversource Energy's reports filed with the Securities and Exchange Commission (SEC). They are updated as necessary and available on Eversource Energy's website at www.eversource.com and on the SEC's website at www.sec.gov and management encourages you to consult such disclosures. All such factors are difficult to predict and contain uncertainties that may materially affect Eversource Energy's actual results, many of which are beyond our control. You should not place undue reliance on the forward-looking statements, as each speaks only as of the date on which such statement is made, and, except as required by federal securities laws, Eversource Energy undertakes no obligation to update any forward-looking statement or statements to reflect events or circumstances after the date on which such statement is made or to reflect the occurrence of unanticipated events.

EVERSOURCE ENERGY YEAR END 2024 EARNINGS REPORT Agenda Business Update ▪ 2024 Key Accomplishments ▪ Financial & Operational Excellence ▪ The Future of Eversource 2 Joe Nolan Chairman, President & CEO John Moreira EVP, CFO & Treasurer Financial Update ▪ Aquarion Water Sale ▪ 2024 Financial Results ▪ Regulatory Update ▪ Earnings Guidance and Updated Investment Plan
EVERSOURCE ENERGY YEAR END 2024 EARNINGS REPORT EVERSOURCE ENERGY YEAR END 2024 EARNINGS REPORT FEBRUARY 12, 2025 Chairman, President & Chief Executive Officer Joe Nolan Business Update
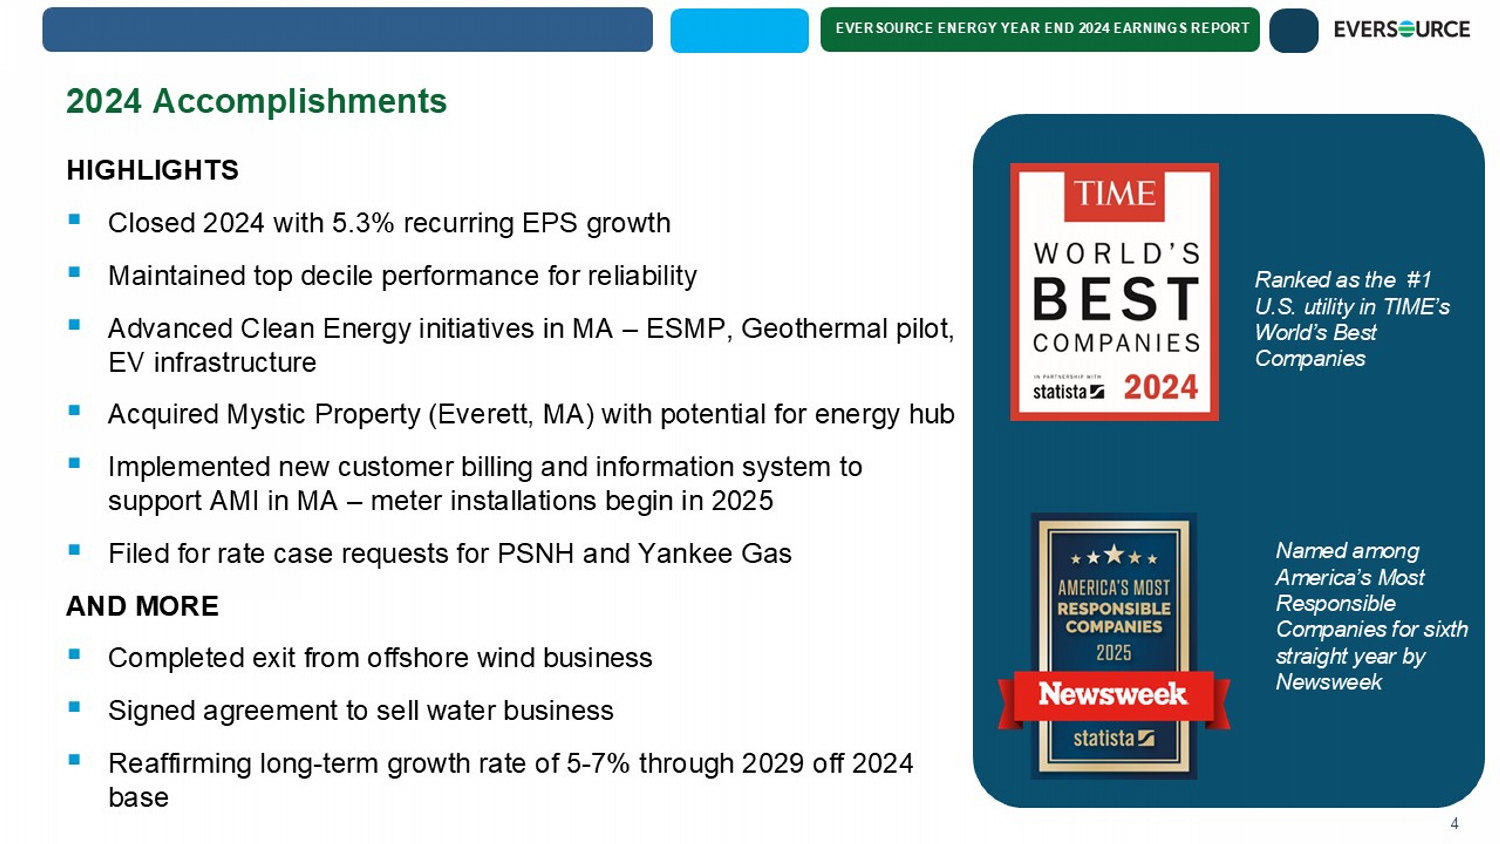
EVERSOURCE ENERGY YEAR END 2024 EARNINGS REPORT 2024 Accomplishments HIGHLIGHTS ▪ Closed 2024 with 5.3% recurring EPS growth ▪ Maintained top decile performance for reliability ▪ Advanced Clean Energy initiatives in MA – ESMP, Geothermal pilot, EV infrastructure ▪ Acquired Mystic Property (Everett, MA) with potential for energy hub ▪ Implemented new customer billing and information system to support AMI in MA – meter installations begin in 2025 ▪ Filed for rate case requests for PSNH and Yankee Gas AND MORE ▪ Completed exit from offshore wind business ▪ Signed agreement to sell water business ▪ Reaffirming long - term growth rate of 5 - 7% through 2029 off 2024 base 4 Ranked as the #1 U.S. utility in TIME’s World’s Best Companies Named among America’s Most Responsible Companies for sixth straight year by Newsweek
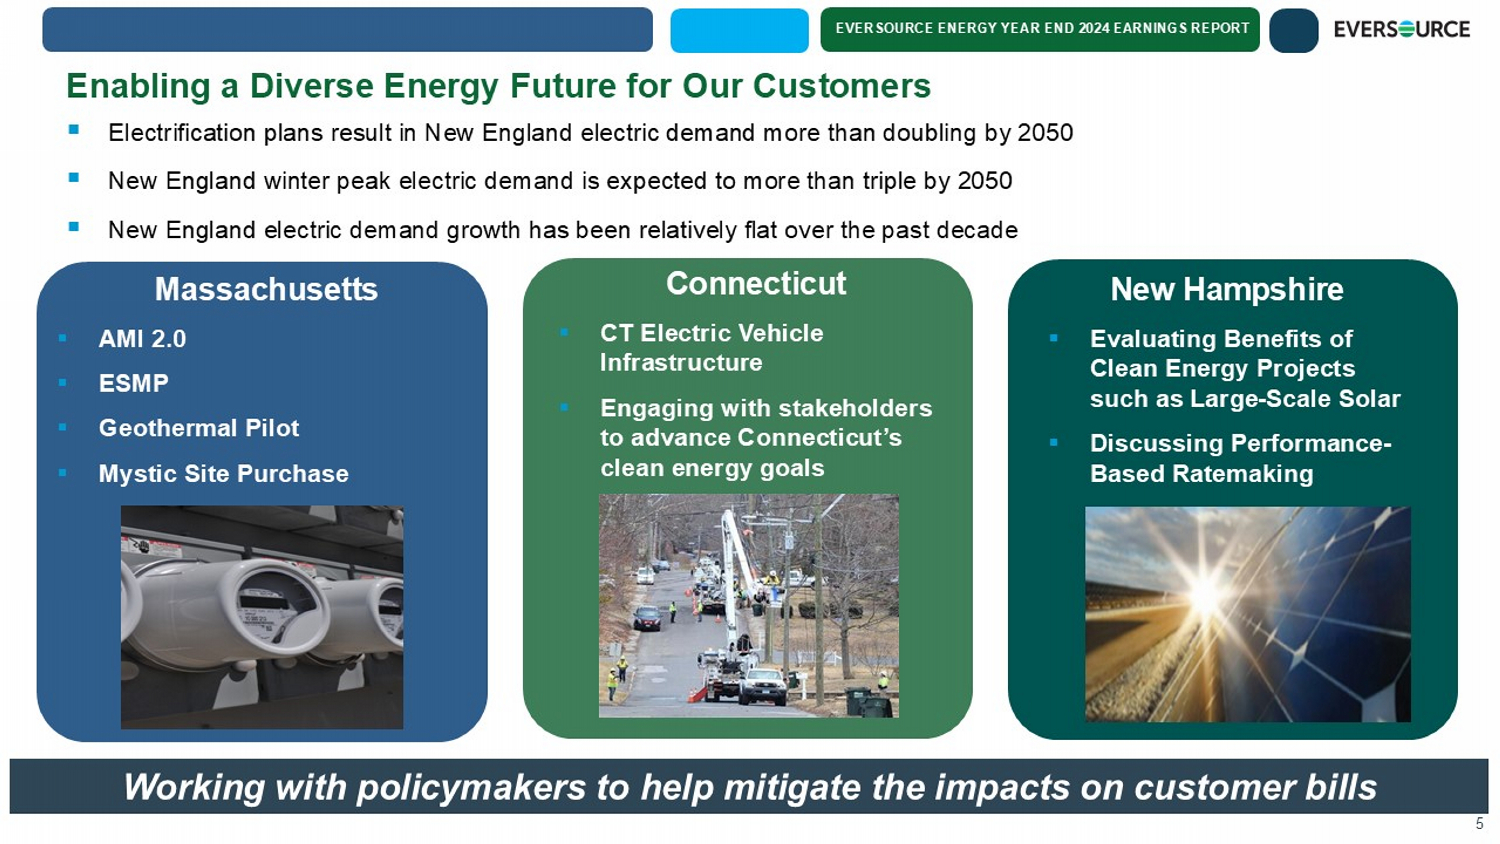
EVERSOURCE ENERGY YEAR END 2024 EARNINGS REPORT Enabling a Diverse Energy Future for Our Customers ▪ Electrification plans result in New England electric demand more than doubling by 2050 ▪ New England winter peak electric demand is expected to more than triple by 2050 ▪ New England electric demand growth has been relatively flat over the past decade 5 Massachusetts ▪ AMI 2.0 ▪ ESMP ▪ Geothermal Pilot ▪ Mystic Site Purchase Connecticut ▪ CT Electric Vehicle Infrastructure ▪ Engaging with stakeholders to advance Connecticut’s clean energy goals New Hampshire ▪ Evaluating Benefits of Clean Energy Projects such as Large - Scale Solar ▪ Discussing Performance - Based Ratemaking Working with policymakers to help mitigate the impacts on customer bills
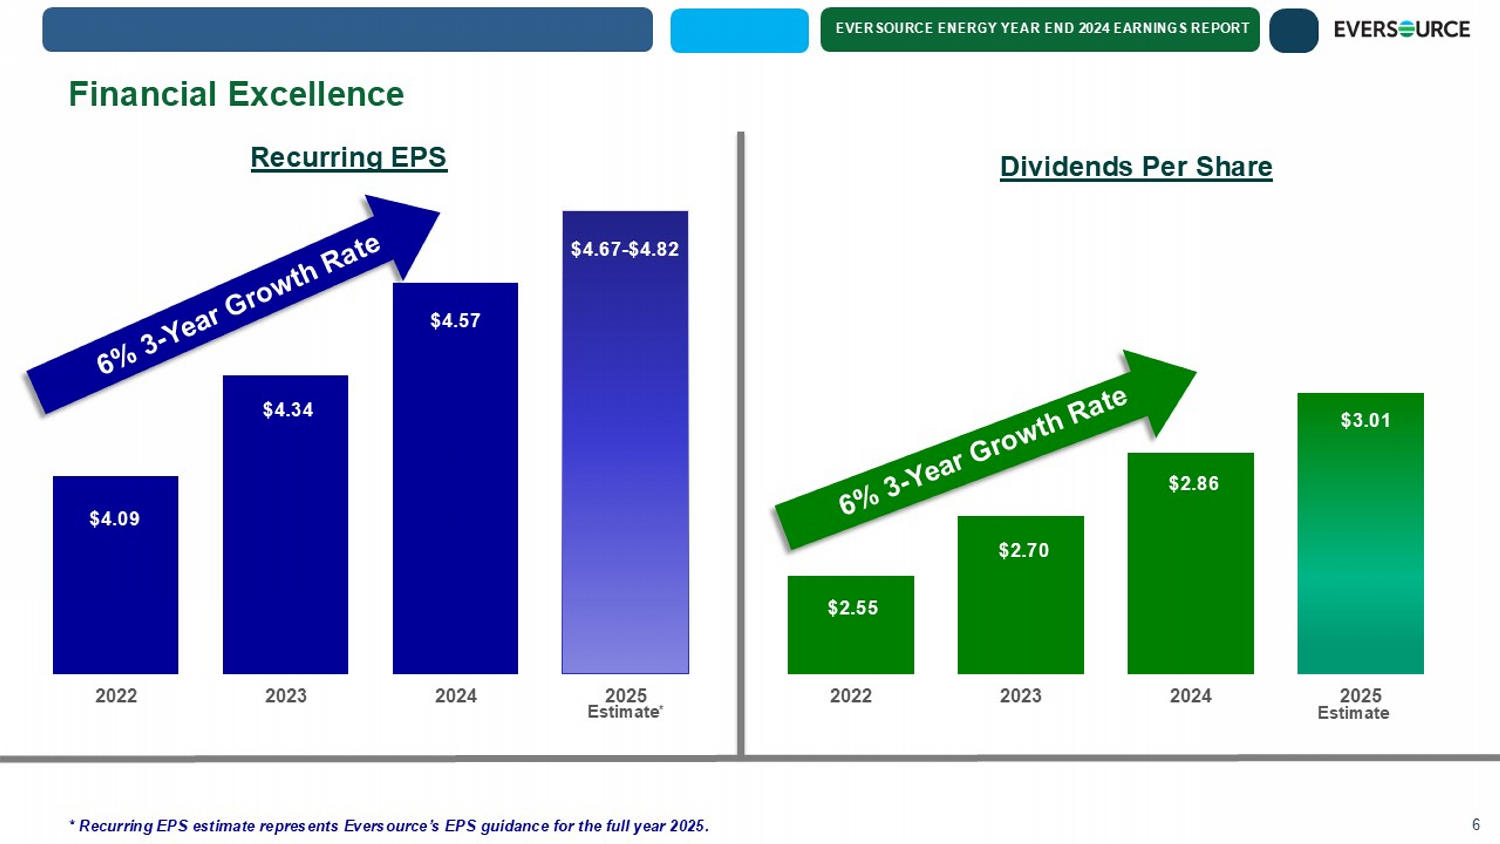
EVERSOURCE ENERGY YEAR END 2024 EARNINGS REPORT Financial Excellence 6 $4.09 $4.34 $4.57 $4.67 - $4.82 2022 2023 2024 2025 Estimate * * Recurring EPS estimate represents Eversource’s EPS guidance for the full year 2025. $2.55 $2.70 $2.86 $3.01 2022 2023 2024 2025 Recurring EPS Dividends Per Share Estimate
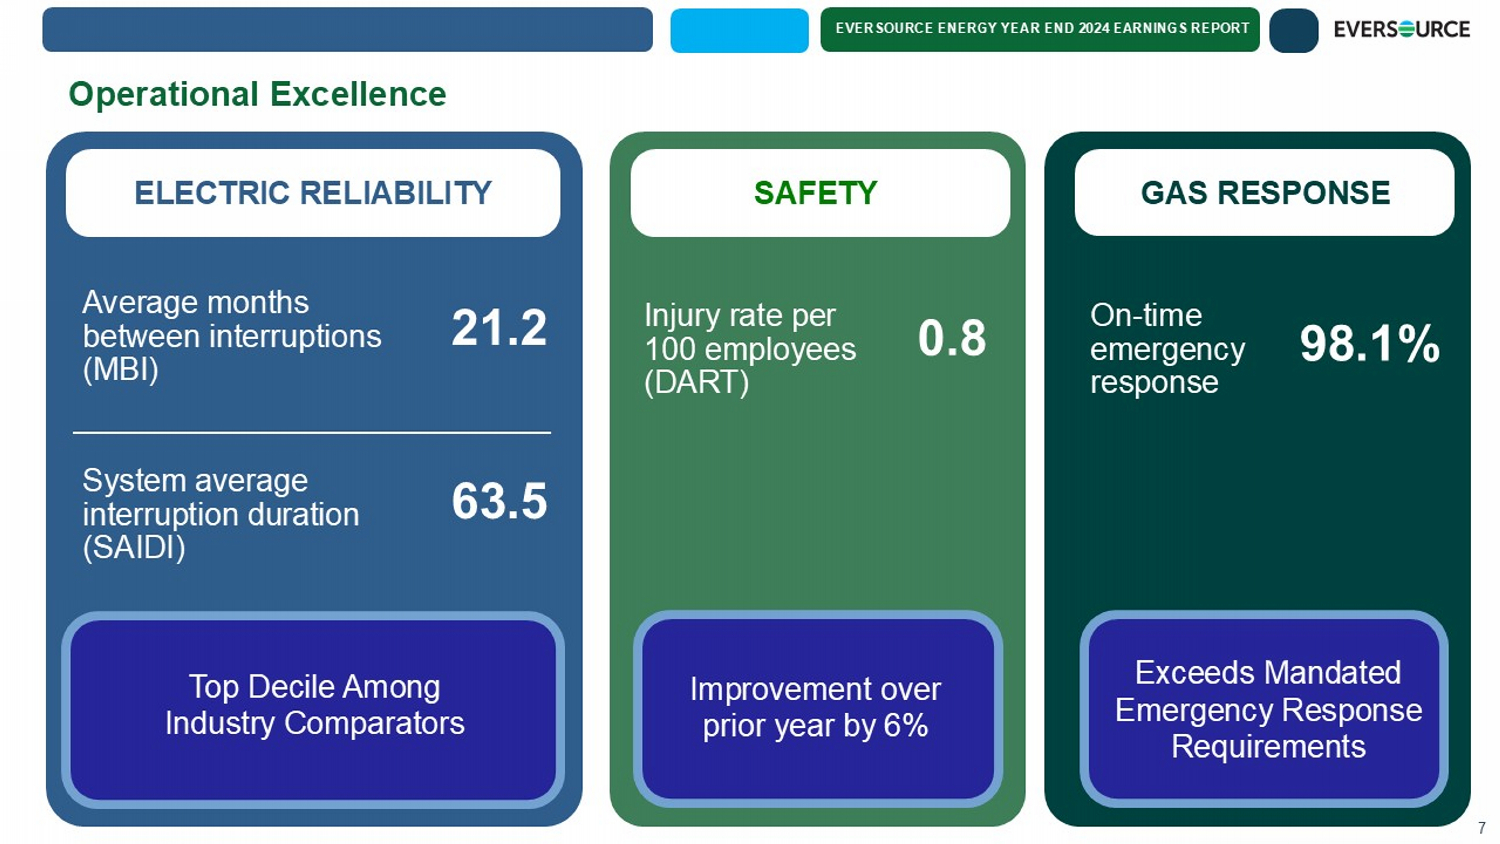
EVERSOURCE ENERGY YEAR END 2024 EARNINGS REPORT Operational Excellence 7 Average months between interruptions (MBI) System average interruption duration (SAIDI) Injury rate per 100 employees (DART) ELECTRIC RELIABILITY 21.2 63.5 SAFETY GAS RESPONSE 0.8 On - time emergency response 98.1% Top Decile Among Industry Comparators Improvement over prior year by 6% Exceeds Mandated Emergency Response Requirements
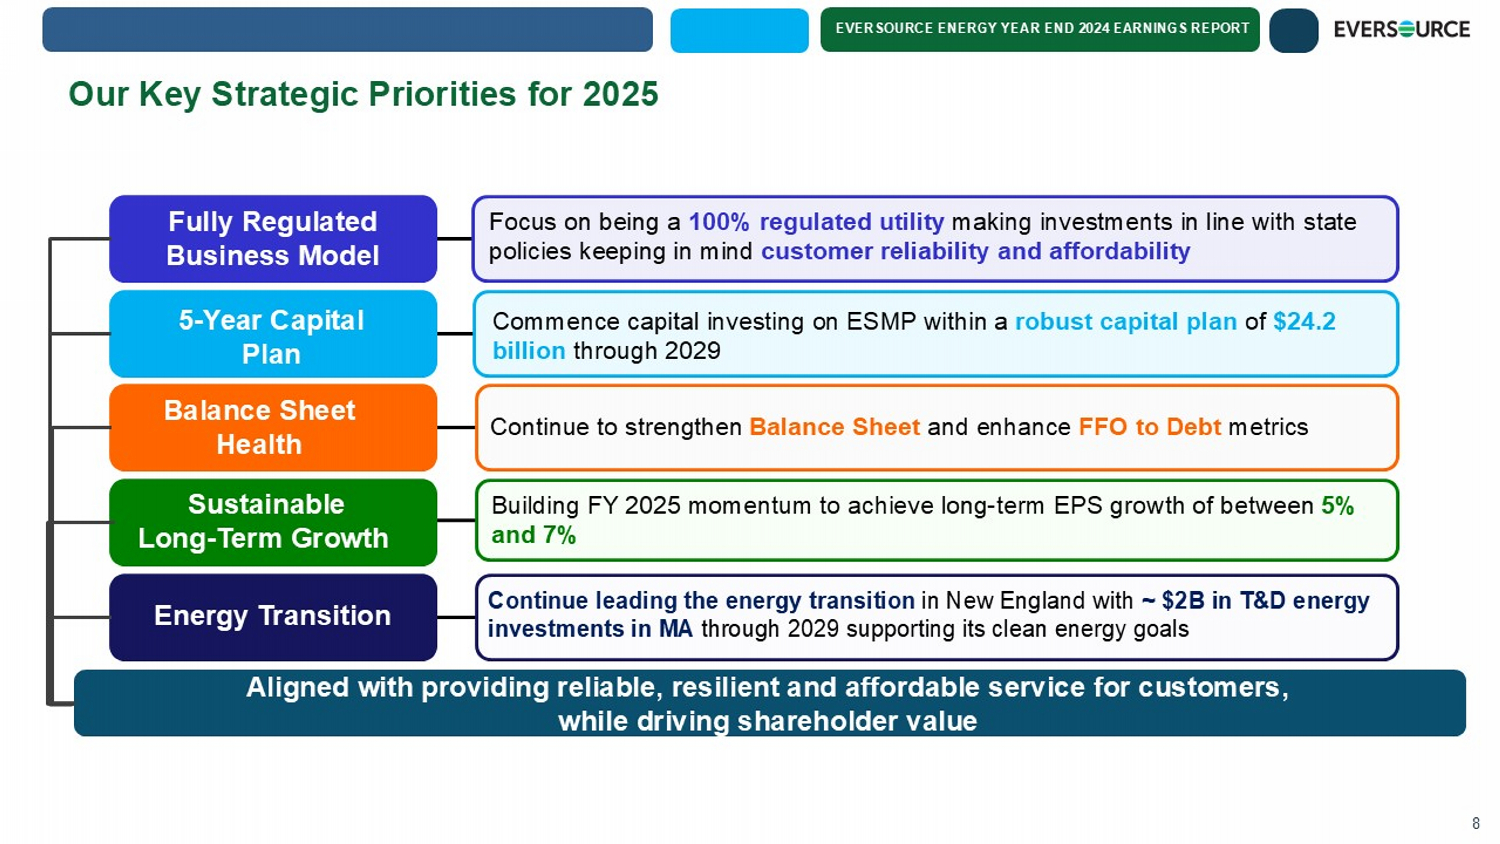
EVERSOURCE ENERGY YEAR END 2024 EARNINGS REPORT Aligned with providing reliable, resilient and affordable service for customers, while driving shareholder value Our Key Strategic Priorities for 2025 Building FY 2025 momentum to achieve long - term EPS growth of between 5% and 7% Fully Regulated Business Model Balance Sheet Health Energy Transition Focus on being a 100% regulated utility making investments in line with state policies keeping in mind customer reliability and affordability Continue to strengthen Balance Sheet and enhance FFO to Debt metrics Continue leading the energy transition in New England with ~ $2B in T&D energy investments in MA through 2029 supporting its clean energy goals 5 - Year Capital Plan Commence capital investing on ESMP within a robust capital plan of $24.2 billion through 2029 Sustainable Long - Term Growth 8
EVERSOURCE ENERGY YEAR END 2024 EARNINGS REPORT EVERSOURCE ENERGY YEAR END 2024 EARNINGS REPORT FEBRUARY 12, 2025 Executive Vice President, Chief Financial Officer & Treasurer John Moreira Financial Update
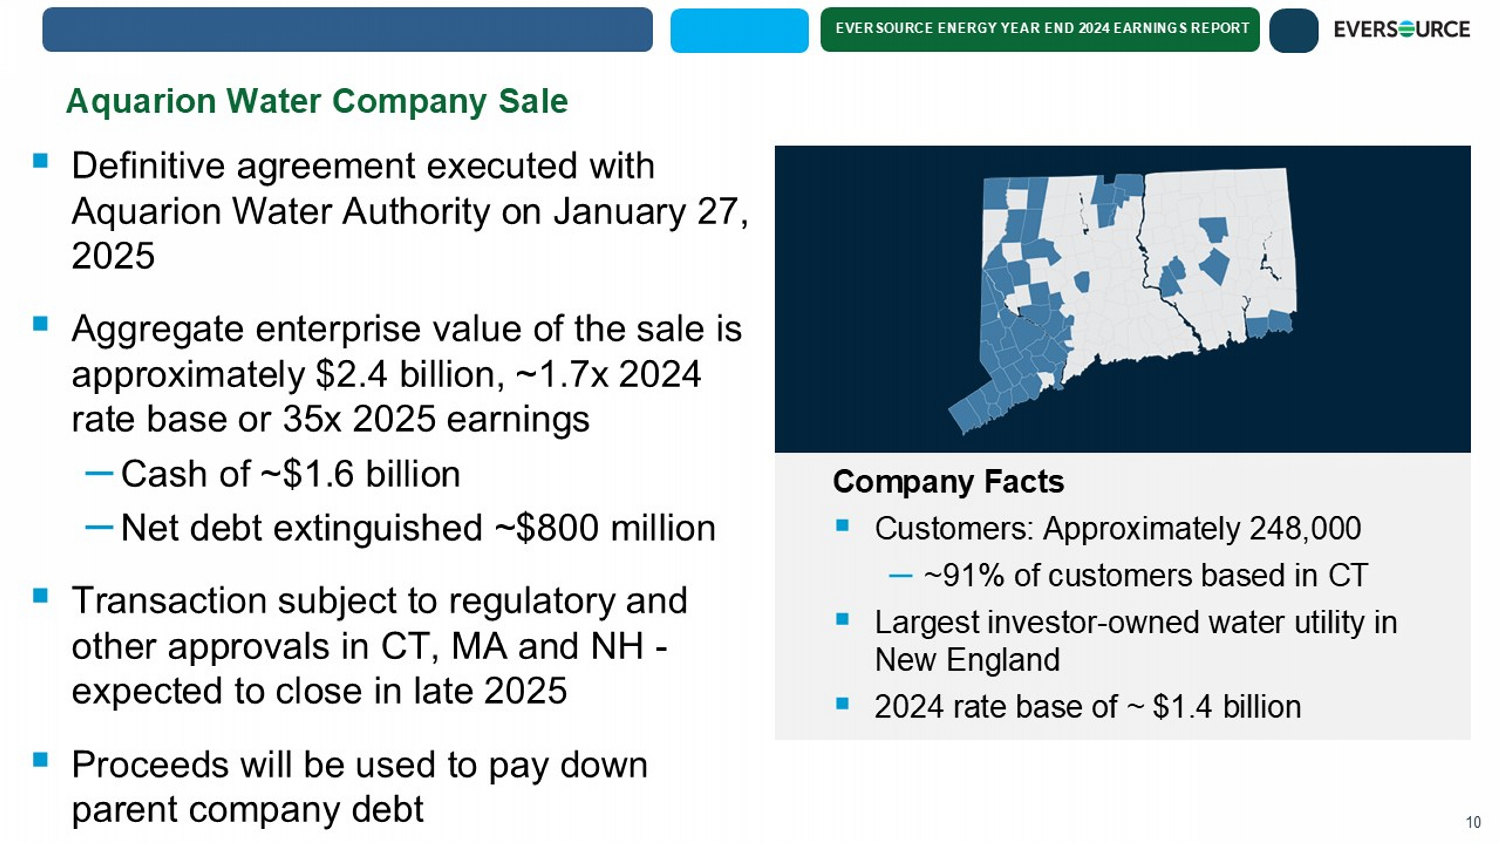
EVERSOURCE ENERGY YEAR END 2024 EARNINGS REPORT Aquarion Water Company Sale ▪ Definitive agreement executed with Aquarion Water Authority on January 27, 2025 ▪ Aggregate enterprise value of the sale is approximately $2.4 billion, ~1.7x 2024 rate base or 35x 2025 earnings – Cash of ~$1.6 billion – Net debt extinguished ~$800 million ▪ Transaction subject to regulatory and other approvals in CT, MA and NH - expected to close in late 2025 ▪ Proceeds will be used to pay down parent company debt 10 Company Facts ▪ Customers: Approximately 248,000 – ~ 91% of customers based in CT ▪ Largest investor - owned water utility in New England ▪ 2024 rate base of ~ $1.4 billion
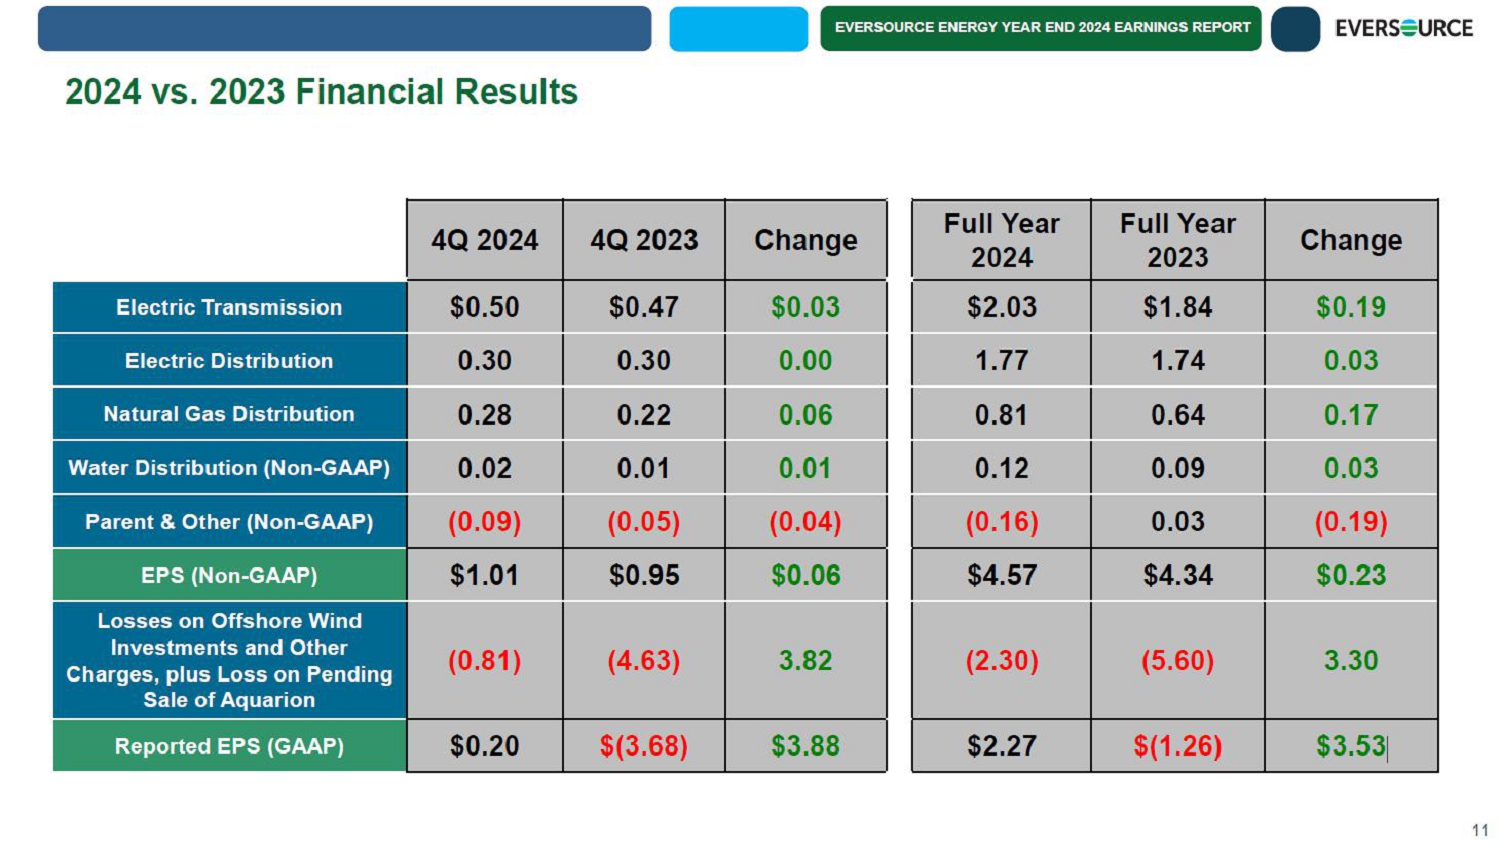
EVERSOURCE ENERGY YEAR END 2024 EARNINGS REPORT 2024 vs. 2023 Financial Results 11 4Q 2024 4Q 2023 Change Full Year 2024 Full Year 2023 Change Electric Transmission $0.50 $0.47 $0.03 $2.03 $1.84 $0.19 Electric Distribution 0.30 0.30 0.00 1.77 1.74 0.03 Natural Gas Distribution 0.28 0.22 0.06 0.81 0.64 0.17 Water Distribution (Non-GAAP) 0.02 0.01 0.01 0.12 0.09 0.03 Parent Other (Non-GAAP) (0.09) (0.05) (0.04) (0.16) 0.03 (0.19) EPS (Non-GAAP) $1.01 $0.95 $0.06 $4.57 $4.34 $0.23 Losses on Offshore Wind Investments and Other Charges, plus Loss on Pending Sale of Aquarion (0.81) (4.63) 3.82 (2.30) (5.60) 3.30 Reported EPS (GAAP) $0.20 $(3.68) $3.88 $2.27 $(1.26) $3.53
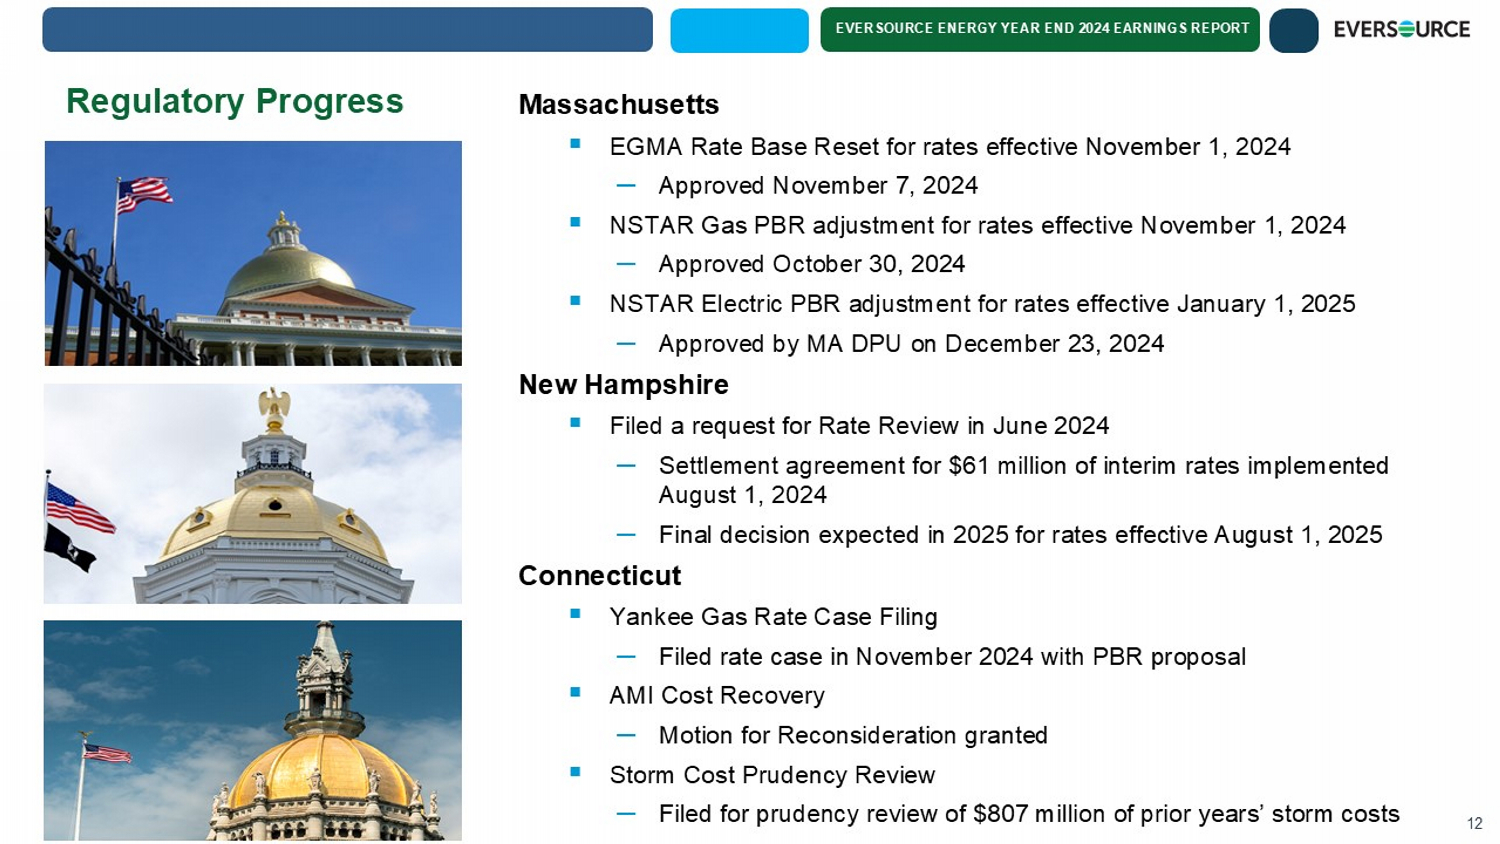
EVERSOURCE ENERGY YEAR END 2024 EARNINGS REPORT Regulatory Progress Massachusetts ▪ EGMA Rate Base Reset for rates effective November 1, 2024 – Approved November 7, 2024 ▪ NSTAR Gas PBR adjustment for rates effective November 1, 2024 – Approved October 30, 2024 ▪ NSTAR Electric PBR adjustment for rates effective January 1, 2025 – Approved by MA DPU on December 23, 2024 New Hampshire ▪ Filed a request for Rate Review in June 2024 – Settlement agreement for $61 million of interim rates implemented August 1, 2024 – Final decision expected in 2025 for rates effective August 1, 2025 Connecticut ▪ Yankee Gas Rate Case Filing – Filed rate case in November 2024 with PBR proposal ▪ AMI Cost Recovery – Motion for Reconsideration granted ▪ Storm Cost Prudency Review – Filed for prudency review of $807 million of prior years’ storm costs 12

EVERSOURCE ENERGY YEAR END 2024 EARNINGS REPORT $ in Millions $1.9 Billion Increase in 2025 - 2028 Core Business Investments Primarily in Transmission 13 26% 44% 25% 5% Feb 2024 Plan* Electric Transmission Electric Distribution Natural Gas Distribution IT and Facilities 28% 43% 24% 5% Feb 2025 Plan* Electric Transmission Electric Distribution Natural Gas Distribution IT and Facilities $923 $601 $304 $27 $0 $200 $400 $600 $800 $1,000 $1,200 $1,400 $1,600 $1,800 $2,000 Spending Increase from February 2024 Plan Electric Transmission Electric Distribution Natural Gas Distribution IT and Facilities ~$1.9 Billion * The charts above represent segment percentages of total investments for the period 2025 to 2028, the years of overlap between the two plans. The water segment has been excluded from both plans due to the pending sale of Aquarion.
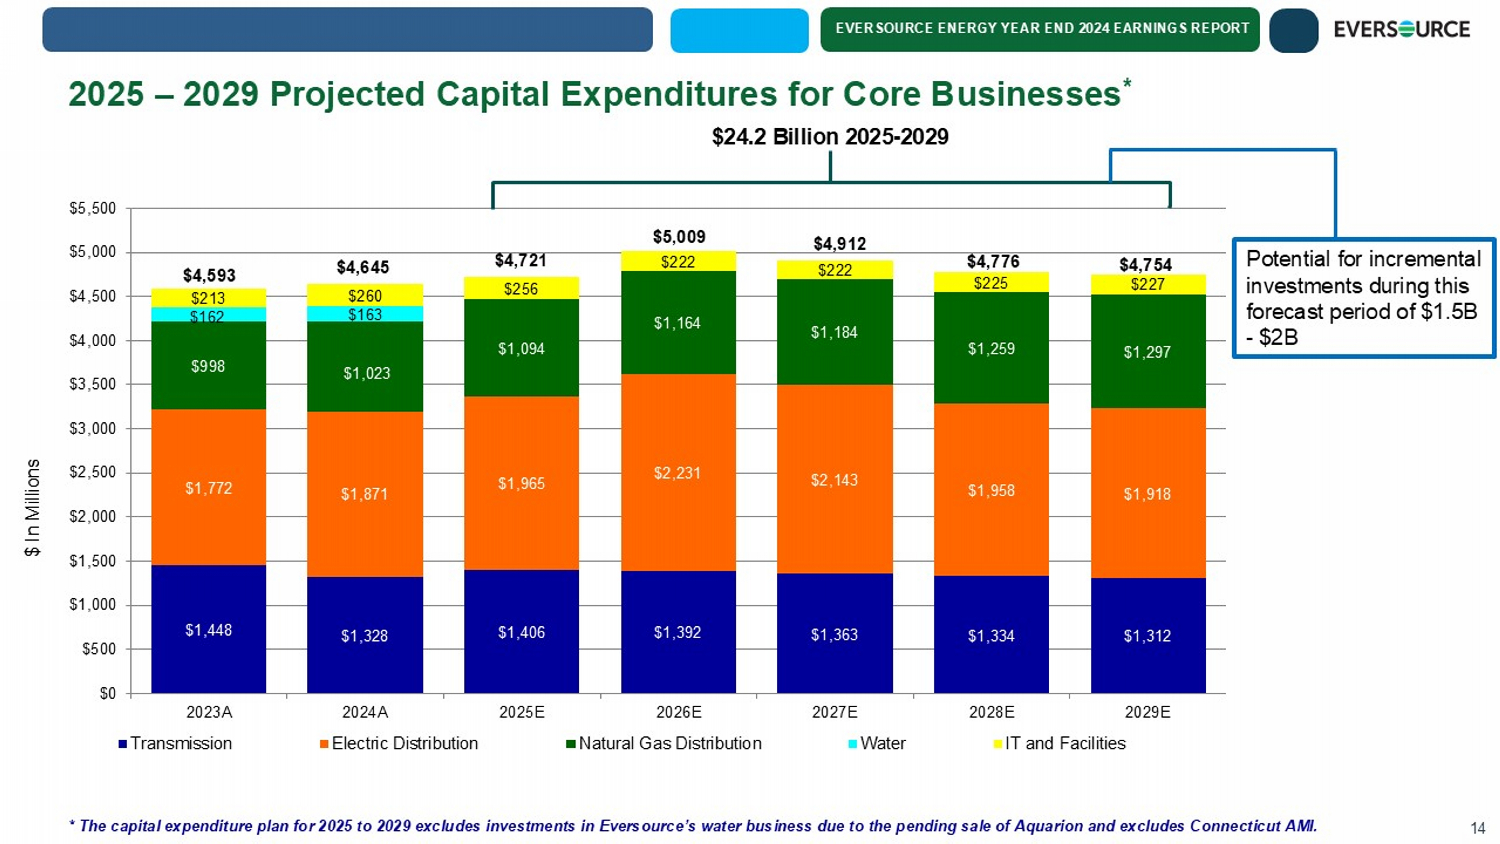
EVERSOURCE ENERGY YEAR END 2024 EARNINGS REPORT $1,448 $1,328 $1,406 $1,392 $1,363 $1,334 $1,312 $1,772 $1,871 $1,965 $2,231 $2,143 $1,958 $1,918 $998 $1,023 $1,094 $1,164 $1,184 $1,259 $1,297 $162 $163 $213 $260 $256 $222 $222 $225 $227 $4,593 $4,645 $4,721 $5,009 $4,912 $4,776 $4,754 $0 $500 $1,000 $1,500 $2,000 $2,500 $3,000 $3,500 $4,000 $4,500 $5,000 $5,500 2023A 2024A 2025E 2026E 2027E 2028E 2029E Transmission Electric Distribution Natural Gas Distribution Water IT and Facilities $ In Millions $24.2 Billion 2025 - 2029 2025 – 2029 Projected Capital Expenditures for Core Businesses * 14 * The capital expenditure plan for 2025 to 2029 excludes investments in Eversource’s water business due to the pending sale o f A quarion and excludes Connecticut AMI. Potential for incremental investments during this forecast period of $1.5B - $2B
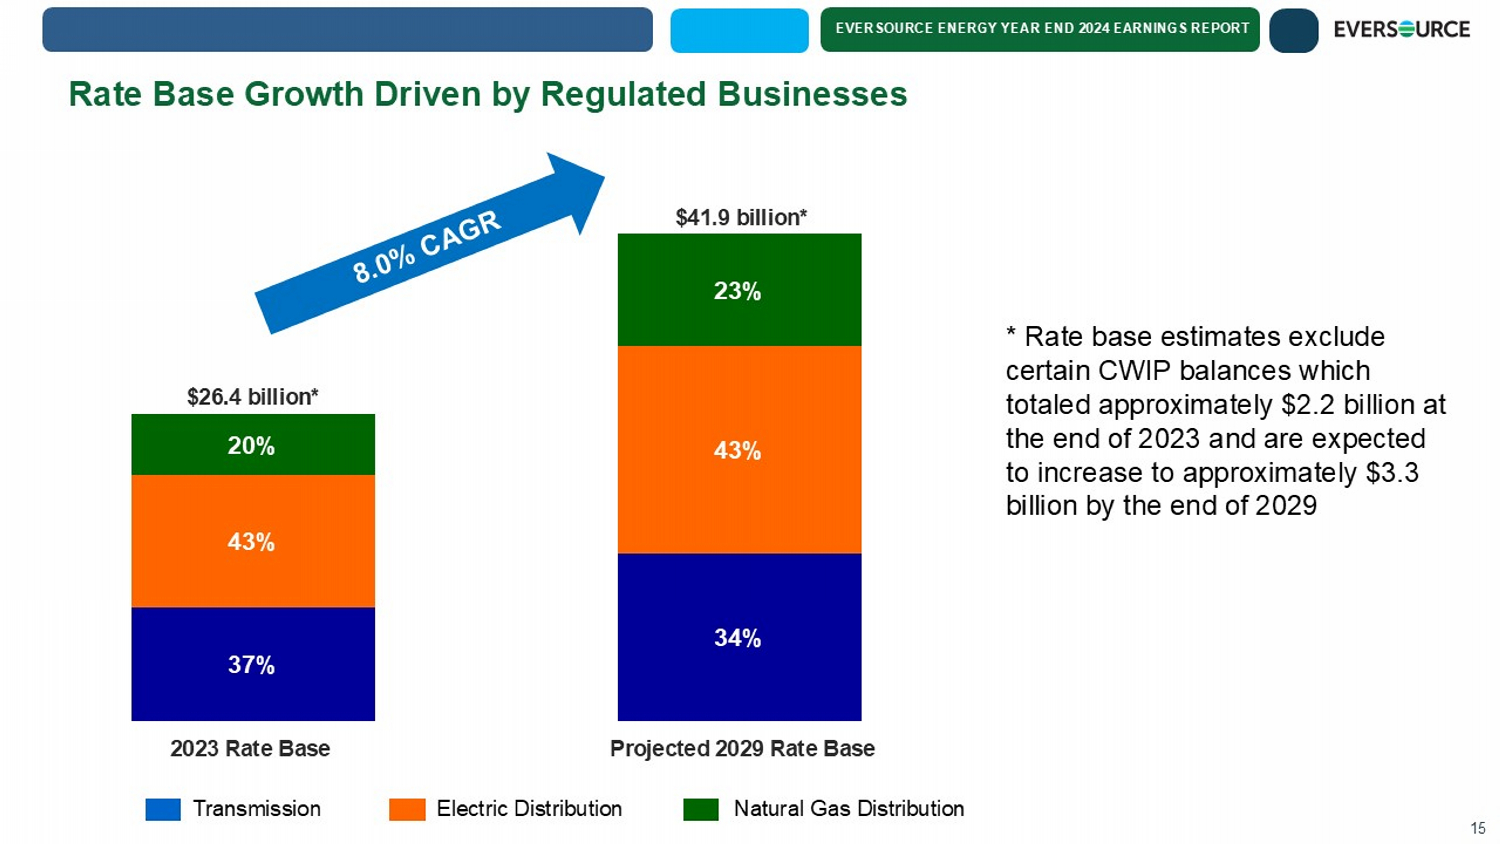
EVERSOURCE ENERGY YEAR END 2024 EARNINGS REPORT 37% 34% 43% 43% 20% 23% 2023 Rate Base Projected 2029 Rate Base $26.4 billion* $41.9 billion* * Rate base estimates exclude certain CWIP balances which totaled approximately $2.2 billion at the end of 2023 and are expected to increase to approximately $3.3 billion by the end of 2029 Rate Base Growth Driven by Regulated Businesses 15 Transmission Electric Distribution Natural Gas Distribution
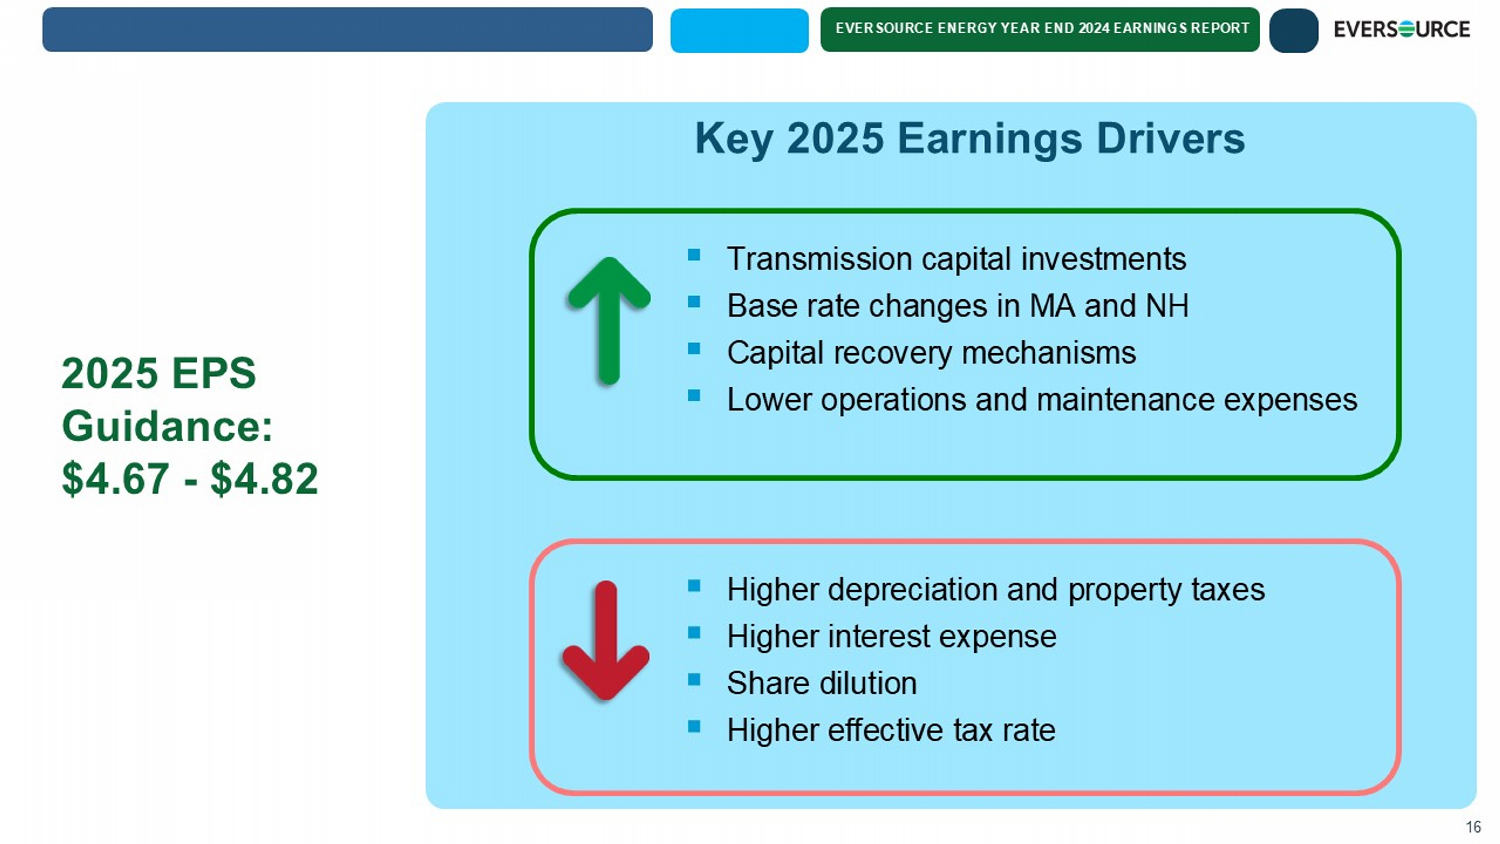
EVERSOURCE ENERGY YEAR END 2024 EARNINGS REPORT Key 2025 Earnings Drivers 2025 EPS Guidance: $4.67 - $4.82 ▪ Transmission capital investments ▪ Base rate changes in MA and NH ▪ Capital recovery mechanisms ▪ Lower operations and maintenance expenses 16 ▪ Higher depreciation and property taxes ▪ Higher interest expense ▪ Share dilution ▪ Higher effective tax rate
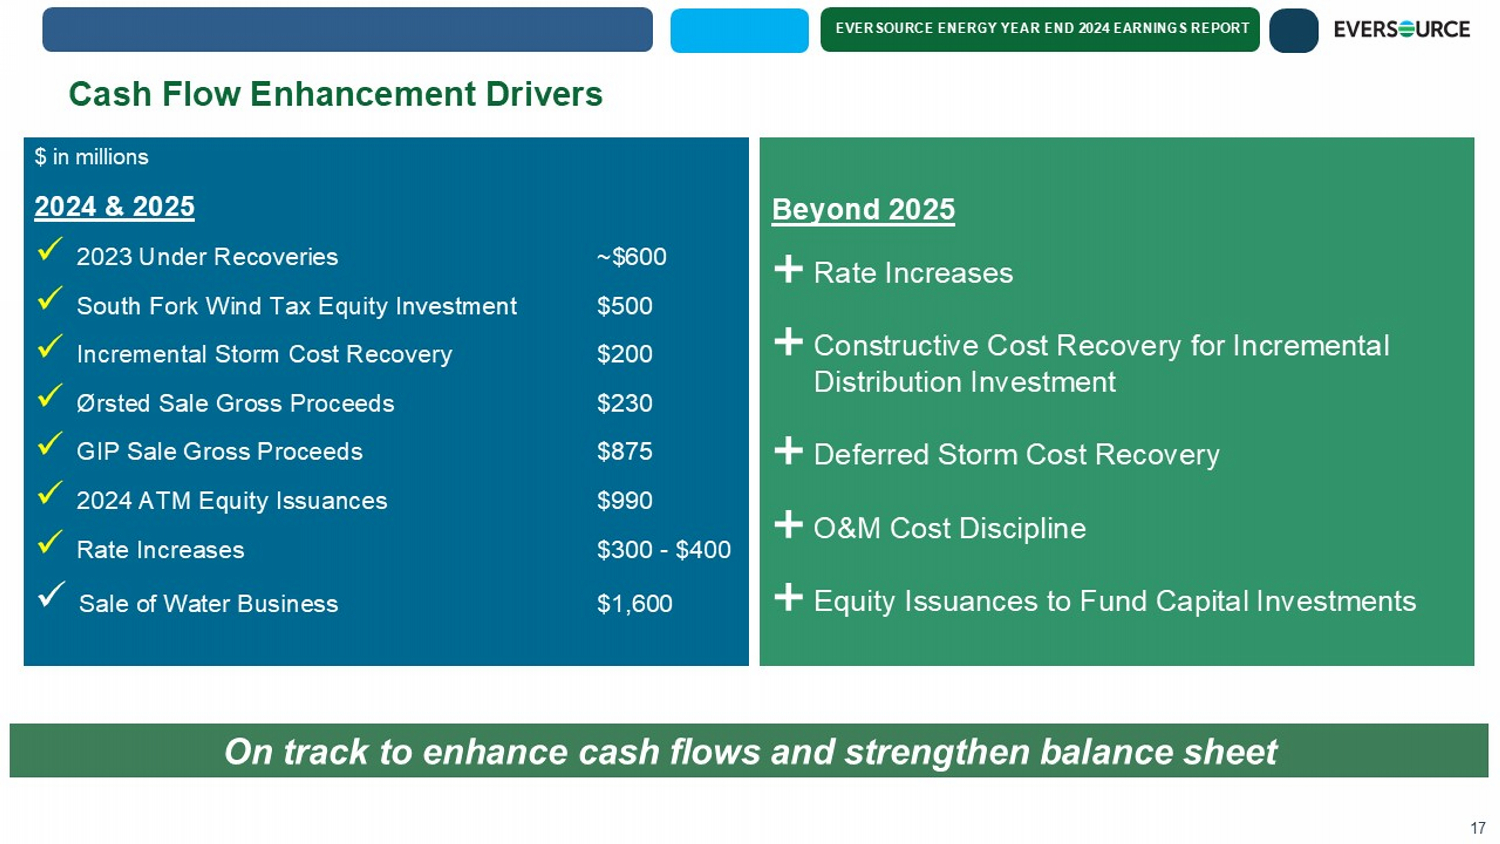
EVERSOURCE ENERGY YEAR END 2024 EARNINGS REPORT Cash Flow Enhancement Drivers 17 $ in millions 2024 & 2025 x 2023 Under Recoveries ~$600 x South Fork Wind Tax Equity Investment $500 x Incremental Storm Cost Recovery $200 x Ørsted Sale Gross Proceeds $230 x GIP Sale Gross Proceeds $875 x 2024 ATM Equity Issuances $990 x Rate Increases $300 - $400 Sale of Water Business $1,600 Beyond 2025 Rate Increases Constructive Cost Recovery for Incremental Distribution Investment Deferred Storm Cost Recovery O&M Cost Discipline Equity Issuances to Fund Capital Investments On track to enhance cash flows and strengthen balance sheet
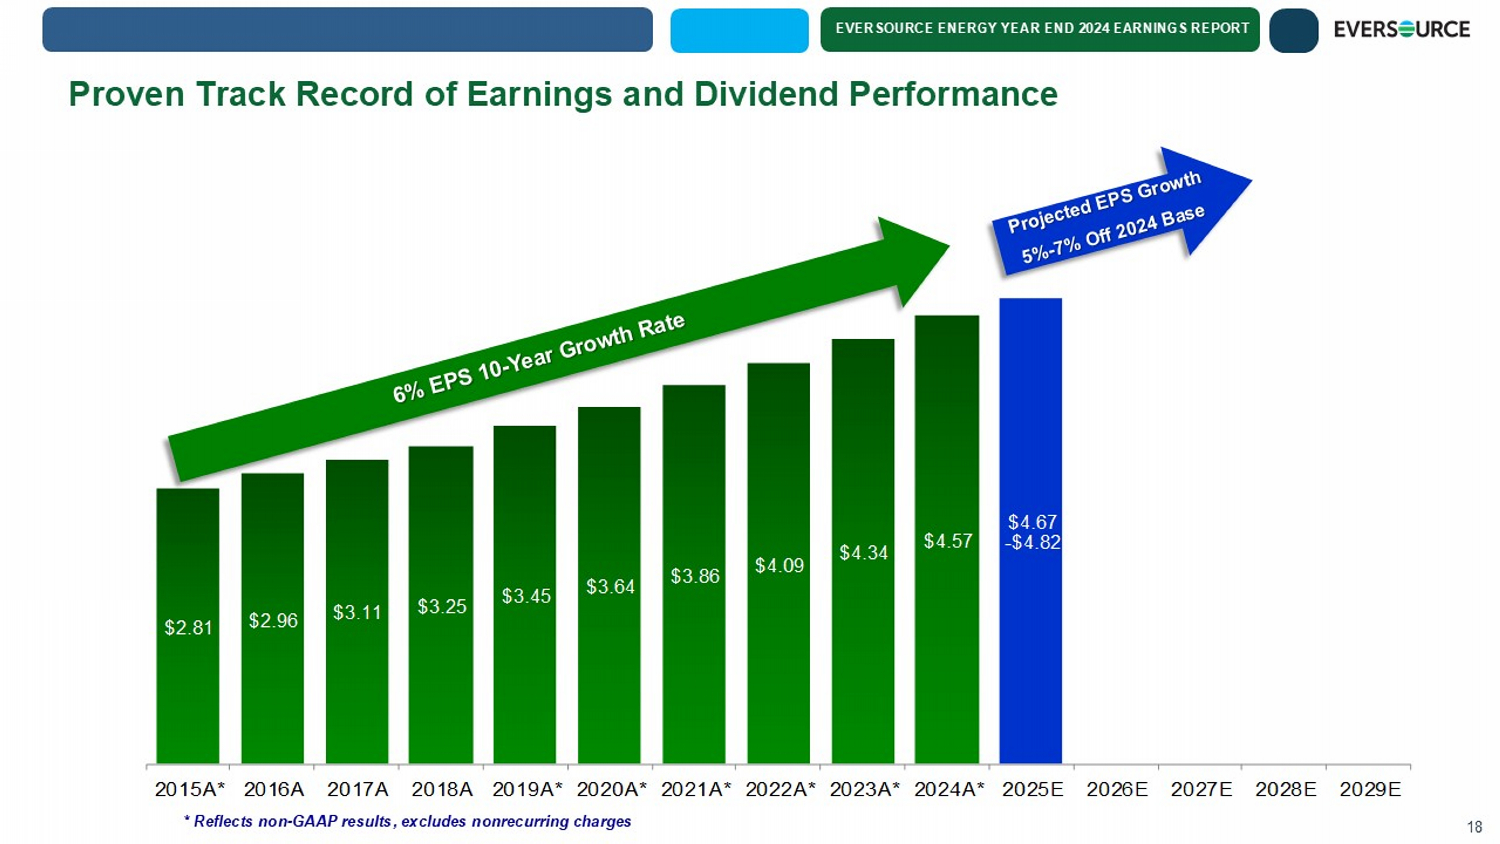
EVERSOURCE ENERGY YEAR END 2024 EARNINGS REPORT $2.81 $2.96 $3.11 $3.25 $3.45 $3.64 $3.86 $4.09 $4.34 $4.57 $4.67 - $4.82 2015A* 2016A 2017A 2018A 2019A* 2020A* 2021A* 2022A* 2023A* 2024A* 2025E 2026E 2027E 2028E 2029E * Reflects non - GAAP results, excludes nonrecurring charges 18 Proven Track Record of Earnings and Dividend Performance

EVERSOURCE ENERGY YEAR END 2024 EARNINGS REPORT APPENDIX 19

EVERSOURCE ENERGY YEAR END 2024 EARNINGS REPORT $450 $441 $497 $341 $269 $260 $502 $611 $635 $675 $861 $854 $376 $354 $260 $347 $204 $198 $1,328 $1,406 $1,392 $1,363 $1,334 $1,312 $0 $200 $400 $600 $800 $1,000 $1,200 $1,400 $1,600 2024A 2025E 2026E 2027E 2028E 2029E CL&P NSTAR Electric PSNH $ in Millions Other concepts under development Projected Transmission Capital Expenditures 20
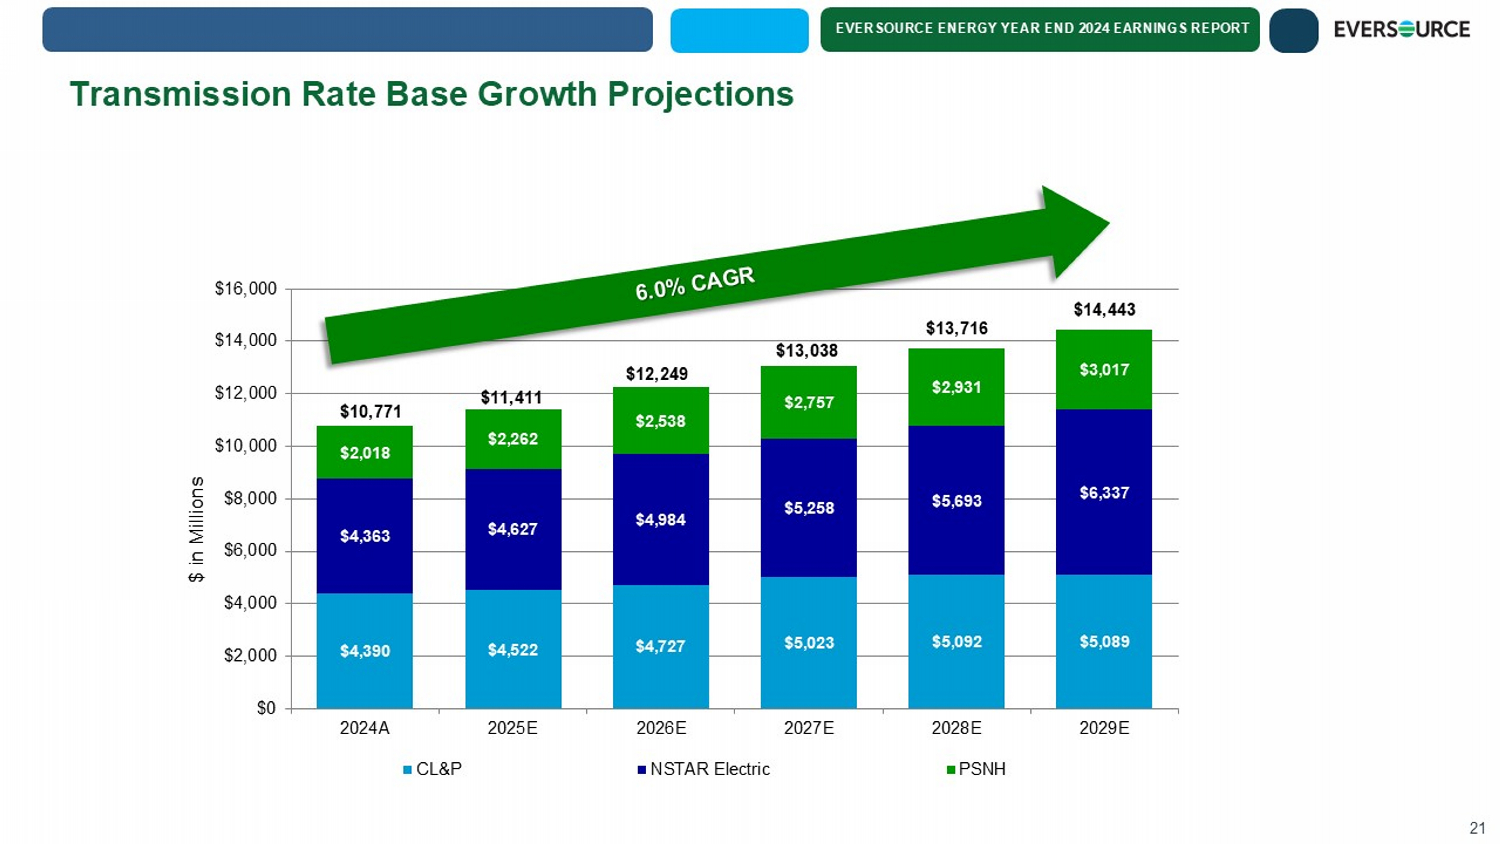
EVERSOURCE ENERGY YEAR END 2024 EARNINGS REPORT $4,390 $4,522 $4,727 $5,023 $5,092 $5,089 $4,363 $4,627 $4,984 $5,258 $5,693 $6,337 $2,018 $2,262 $2,538 $2,757 $2,931 $3,017 $10,771 $11,411 $12,249 $13,038 $13,716 $14,443 $0 $2,000 $4,000 $6,000 $8,000 $10,000 $12,000 $14,000 $16,000 2024A 2025E 2026E 2027E 2028E 2029E CL&P NSTAR Electric PSNH $ in Millions Transmission Rate Base Growth Projections 21
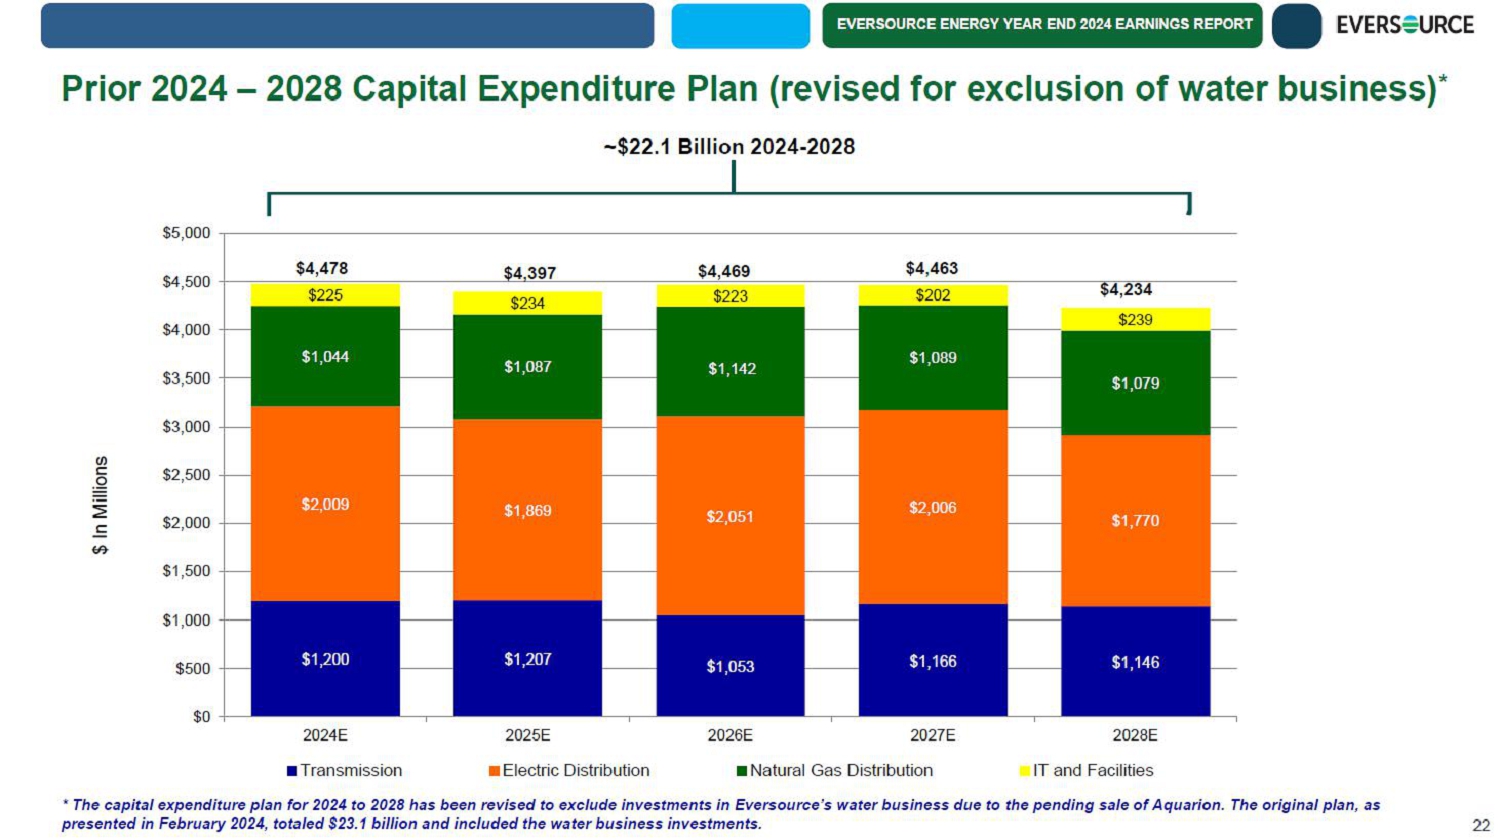
EVERSOURCE ENERGY YEAR END 2024 EARNINGS REPORT $1,200 $1,207 $1,053 $1,166 $1,146 $2,009 $1,869 $2,051 $2,006 $1,770 $1,044 $1,087 $1,142 $1,089 $1,079 $225 $234 $223 $202 $239 $0 $500 $1,000 $1,500 $2,000 $2,500 $3,000 $3,500 $4,000 $4,500 $5,000 2024E 2025E 2026E 2027E 2028E Transmission Electric Distribution Natural Gas Distribution IT and Facilities $ In Millions ~$22.1 Billion 2024-2028 Prior 2024 - 2028 Capital Expenditure Plan (revised for exclusion of water business)* 22 $4,478 $4,397 $4,469 $4,463 $4,234 * The capital expenditure plan for 2024 to 2028 has been revised to exclude investments in Eversource's water business due to the pending sale of Aquarion. The original plan, as presented in February 2024, totaled $23.1 billion and included the water business investments.
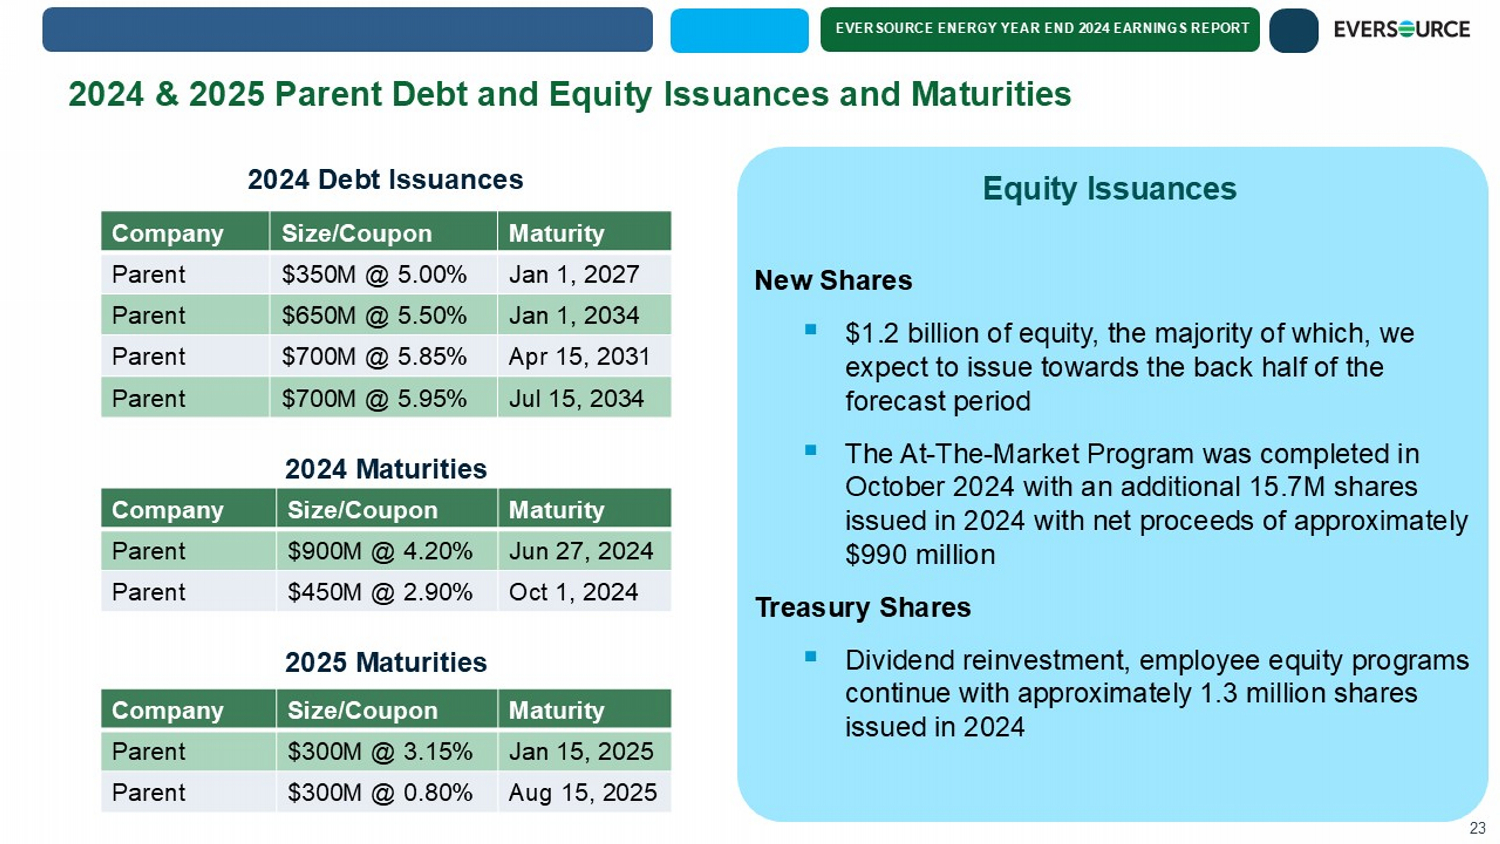
EVERSOURCE ENERGY YEAR END 2024 EARNINGS REPORT 2024 & 2025 Parent Debt and Equity Issuances and Maturities 23 Maturity Size/Coupon Company Jun 27, 2024 $900M @ 4.20% Parent Oct 1, 2024 $450M @ 2.90% Parent 2024 Debt Issuances 2024 Maturities Maturity Size/Coupon Company Jan 1, 2027 $350M @ 5.00% Parent Jan 1, 2034 $650M @ 5.50% Parent Apr 15, 2031 $700M @ 5.85% Parent Jul 15, 2034 $700M @ 5.95% Parent New Shares ▪ $1.2 billion of equity, the majority of which, we expect to issue towards the back half of the forecast period ▪ The At - The - Market Program was completed in October 2024 with an additional 15.7M shares issued in 2024 with net proceeds of approximately $ 990 million Treasury Shares ▪ Dividend reinvestment, employee equity programs continue with approximately 1.3 million shares issued in 2024 Equity Issuances 2025 Maturities Maturity Size/Coupon Company Jan 15, 2025 $300M @ 3.15% Parent Aug 15, 2025 $300M @ 0.80% Parent
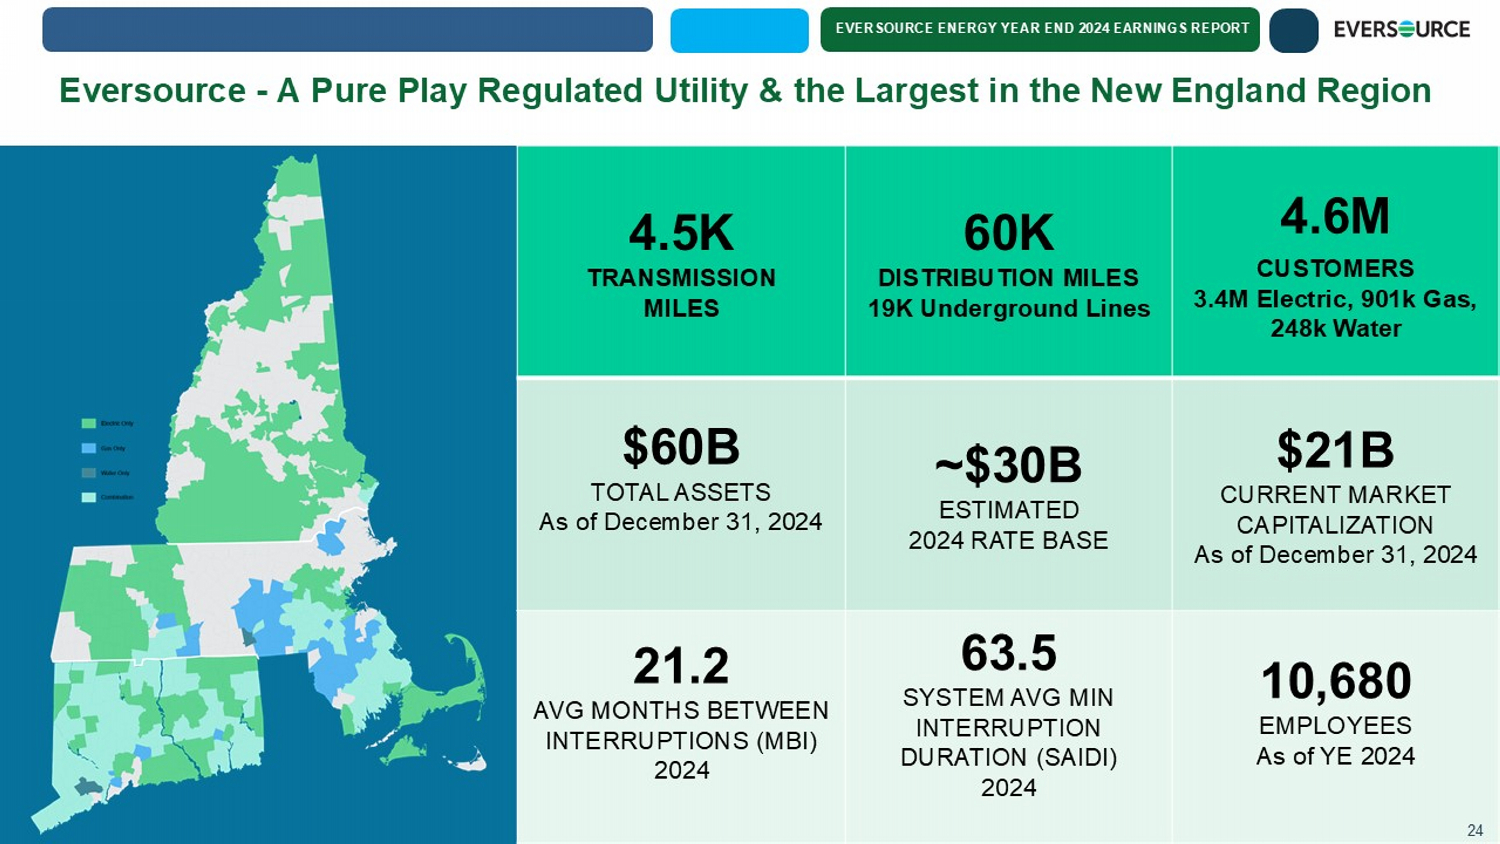
EVERSOURCE ENERGY YEAR END 2024 EARNINGS REPORT Eversource - A Pure Play Regulated Utility & the Largest in the New England Region 24 4.6M CUSTOMERS 3.4M Electric, 901k Gas, 248k Water 60K DISTRIBUTION MILES 19K Underground Lines 4.5K TRANSMISSION MILES $21B CURRENT MARKET CAPITALIZATION As of December 31, 2024 ~$30B ESTIMATED 2024 RATE BASE $60B TOTAL ASSETS As of December 31, 2024 10,680 EMPLOYEES As of YE 2024 63.5 SYSTEM AVG MIN INTERRUPTION DURATION (SAIDI) 2024 21.2 AVG MONTHS BETWEEN INTERRUPTIONS (MBI) 2024 24