UBS Natural Gas and Utility Conference February 28, 2007 Energy / Growth / Leadership Exhibit 99 |
2 Safe Harbor Provisions This presentation contains statements concerning NU’s expectations, plans, objectives, future financial performance and other statements that are not historical facts. These statements are “forward-looking statements” within the meaning of the Private Securities Litigation Reform Act of 1995. In some cases, a listener can identify these forward-looking statements by words such as “estimate”, “expect”, “anticipate”, “intend”, “plan”, “believe”, “forecast”, “should”, “could”, and similar expressions. Forward-looking statements involve risks and uncertainties that may cause actual results or outcomes to differ materially from those included in the forward-looking statements. Factors that may cause actual results to differ materially from those included in the forward-looking statements include, but are not limited to, actions by state and federal regulatory bodies; competition and industry restructuring; changes in economic conditions; changes in weather patterns; changes in laws, regulations or regulatory policy; changes in levels and timing of capital expenditures; developments in legal or public policy doctrines; technological developments; changes in accounting standards and financial reporting regulations; fluctuations in the value of our remaining competitive electricity positions; actions of rating agencies; and other presently unknown or unforeseen factors. Other risk factors are detailed from time to time in our reports to the Securities and Exchange Commission. We undertake no obligation to update the information contained in any forward-looking statements to reflect developments or circumstances occurring after the statement is made. |
3 Agenda for Today 2006 accomplishments 2006 financial performance 2007 guidance Regulated investment strategy Rate cases Legislative update |
4 2006 Highlights Competitive businesses Sold competitive generation for $1.34 billion (including $320 million of assumed debt) Sold retail business Served out more than 50% of wholesale obligations Sold most services businesses Regulated businesses Completed Bethel-Norwalk Completed Northern Wood Power Project Commenced construction of 3 remaining SW Connecticut projects Secured legislative endorsement for PSNH coal plant scrubber Settled WMECO distribution rate issues without rate case Filed settlement this week on PSNH distribution rate case Filed Yankee Gas rate case Financial Met earnings guidance Strengthened balance sheet considerably |
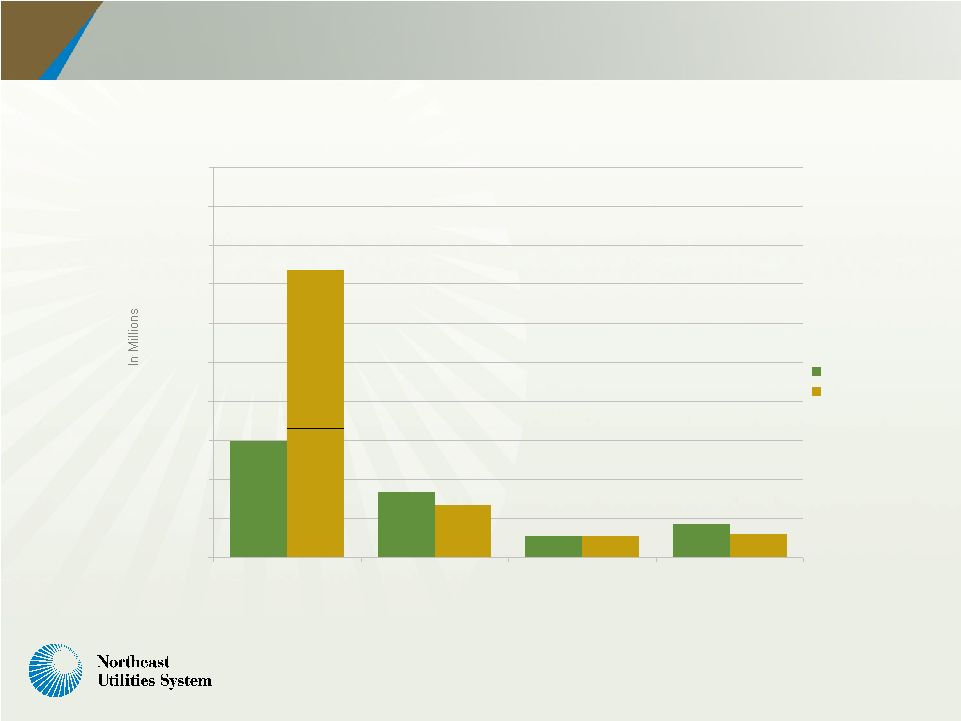
5 $122.3 $41.1 $197.5 $59.8 $2.0 -$18.7 ($20.0) $0.0 $20.0 $40.0 $60.0 $80.0 $100.0 $120.0 $140.0 $160.0 $180.0 $200.0 2005 2006 2006 Regulated/Parent Results Distribution and Regulated Generation Transmission Parent/Other $115.8 $81.7* *$74 million from PLR and $7.7 million from competitive generation sale |
6 $60.0 $33.9 $17.3 $147.6 $27.0 $11.0 $11.9 $11.1 $0.0 $20.0 $40.0 $60.0 $80.0 $100.0 $120.0 $140.0 $160.0 $180.0 $200.0 2005 2006 Distribution/Regulated Generation Results CL&P PSNH WMECO $65.9 *$74 million from PLR and $7.7 million from competitive generation sale Yankee Gas $81.7* |
7 2007 Guidance Primary Drivers 2006 Actual 2007 Guidance In 2007 Distribution/Regulated Generation $0.75* $0.80 - $0.90 PSNH, Yankee Gas rate cases, retail sales Transmission $0.39 $0.50 - $0.60 Increased investment Parent & Other Affiliates $0.02 $0.00 - $0.05 Cash from generation sale Total, Excluding Competitive Businesses $1.16 $1.30 - $1.55 All the above *Excludes CL&P PLR and impact of competitive generation sale |
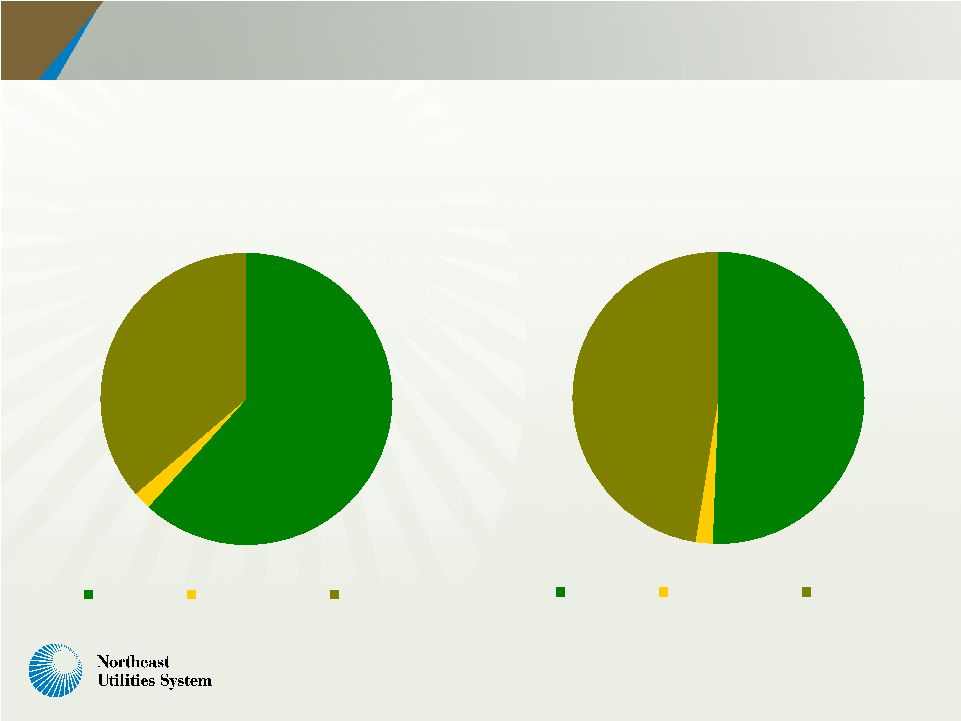
8 Improved Balance Sheet $3,442 $116 $2,032 Total Debt Preferred Stock Common Equity $2,965 $116 $2,798 Total Debt Preferred Stock Common Equity 9/30/05 12/31/06 |
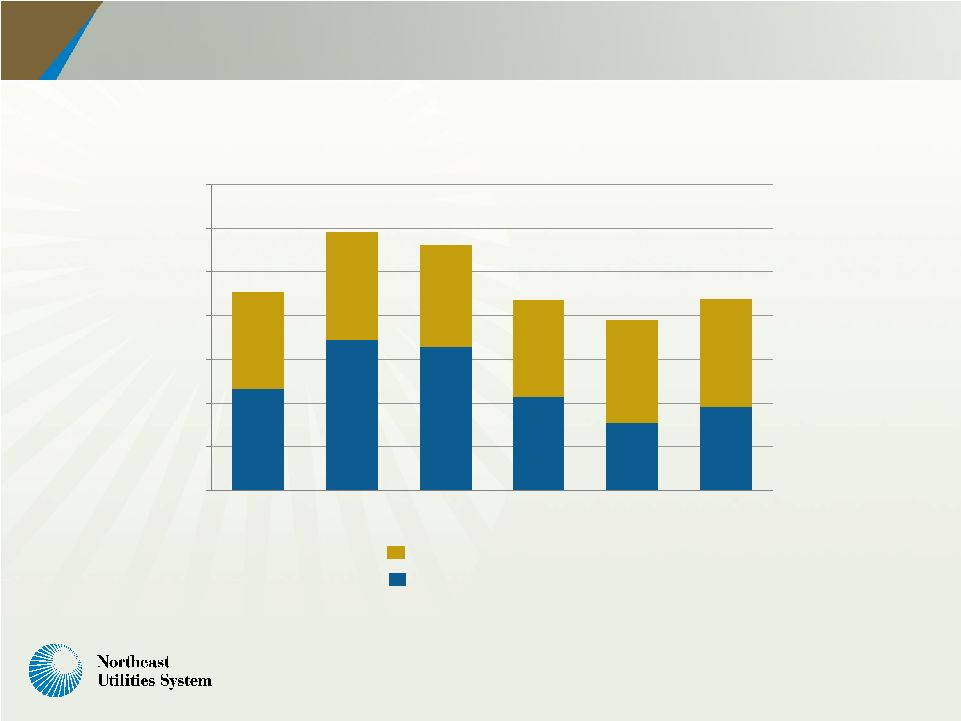
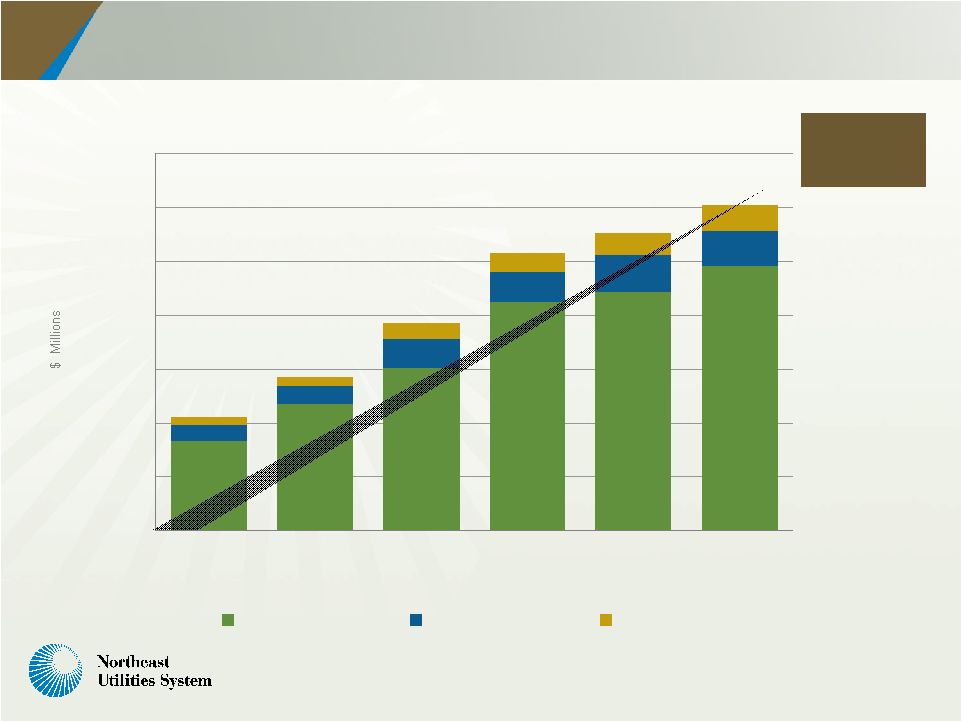
9 2007-2011 Projected Capital Expenditures $0 $200 $400 $600 $800 $1,000 $1,200 $1,400 Distribution Capex Transmission Capex 2006 Actual 2007 2010 2011 2008 2009 $908* $779* $874* $1,183* $1,126* $880* *Excludes approximately $18 million per year at corporate service companies |
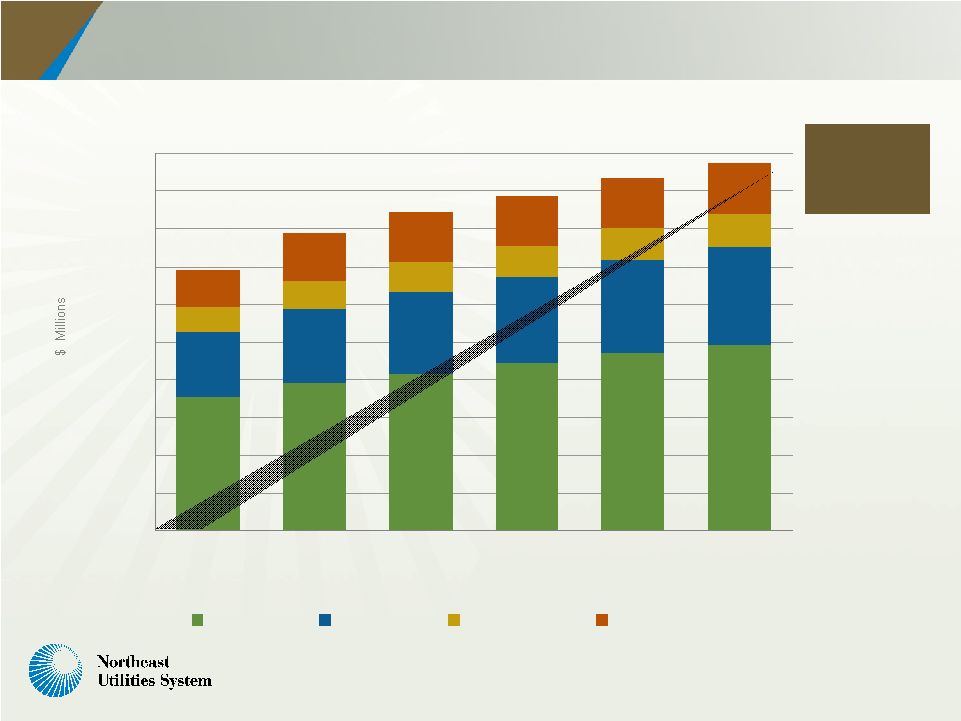
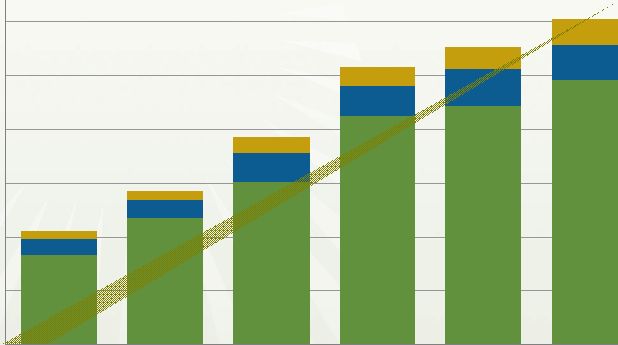
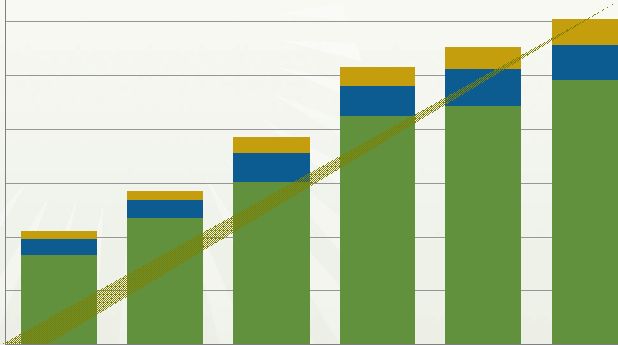
10 Projected Distribution and Regulated Generation Year-End Rate Base $1,765 $1,964 $2,083 $2,220 $2,359 $2,466 $868 $974 $1,092 $1,153 $1,225 $1,293 $340 $367 $388 $406 $422 $436 $493 $646 $655 $656 $669 $679 $0 $500 $1,000 $1,500 $2,000 $2,500 $3,000 $3,500 $4,000 $4,500 $5,000 2006 2007 2008 2009 2010 2011 CL&P PSNH WMECO Yankee Gas Projected Distribution & Generation Rate Base CAGR of 7% |
11 Major Distribution/Regulated Generation Projects Yankee Gas’s 1.2 Bcf liquid natural gas production facility in Waterbury, CT $108 million cost About 90 percent complete Scheduled to be in service for 2007- 2008 heating season Will enhance reliability, help insulate customers from price volatility Conversion of PSNH’s 50 MW Schiller unit in Portsmouth, NH from coal to wood $74 million cost Commenced operation in December Enhances fuel diversity, reduces sulfur, NOx, mercury emissions |
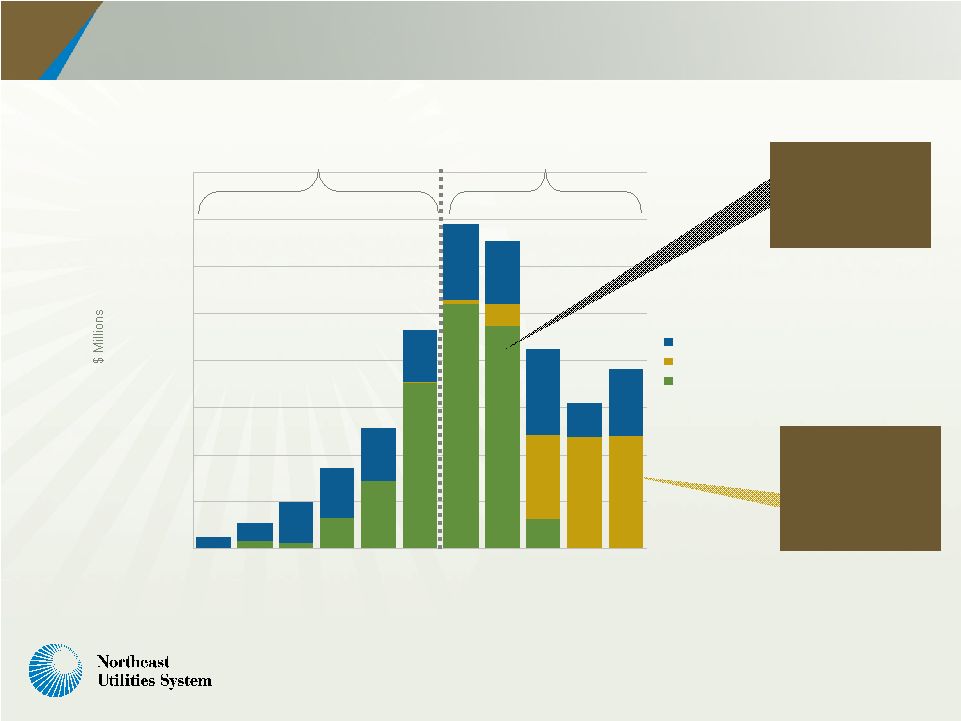
12 The Next Five Years: Transmission Capital Expenditures $0.00 $100.00 $200.00 $300.00 $400.00 $500.00 $600.00 $700.00 $800.00 2001 2002 2003 2004 2005 2006 2007 2008 2009 2010 2011 Other NEEWS Major CT Historic Forecast Up To $2.5 Billion • The New England East-West Solution (NEEWS) family of projects is growing in scope and definition. • Over the next three years, a high level of capital spending is associated with projects that have already received siting approval. $1,062 Million $1.1 Billion of major CT projects in 2007-2011 forecast period; $1.65 billion in total NEEWS family of projects estimated at $710 million during the 2007- 2011 forecast period |
13 Projected Transmission Year-End Rate Base $840 $2,117 $2,218 $2,461 $140 $175 $276 $282 $335 $325 $75 $80 $132 $173 $208 $239 $1,512 $1,173 $0 $500 $1,000 $1,500 $2,000 $2,500 $3,000 $3,500 2006 2007 2008 2009 2010 2011 CL&P PSNH WMECO Transmission Rate Base 2006-2011 CAGR of 23% *Reflects FERC approved 50% CWIP for southwest CT projects * * * |
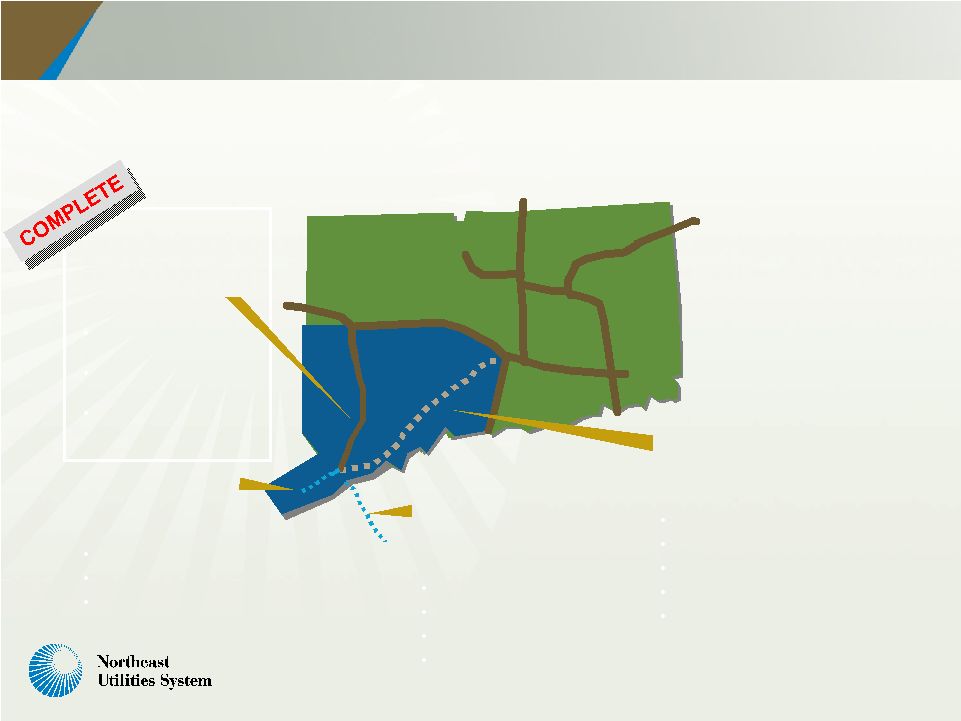
14 Four Major SW Connecticut Projects – A $1.65 Billion Investment SWCT improvements have been a top priority in each of ISO-NE’s last four regional transmission expansion plans. Our four major projects there total about $1.65 billion in investment. 50% of CT Load Bethel-Norwalk 345 kV Underground & Overhead $350 Million 21 miles 345kV (56% underground) 10 miles 115kV (100% underground) Completed October 2006 at a cost of $340 million Middletown-Norwalk 345 kV Underground & Overhead $1,047 Million (NU Share) Glenbrook Cables 115 kV underground $183 Million 9 miles 115kV underground Projected in-service date: 2008 Under contract – construction under way, 20% complete Long Island Cable 138 kV cross sound $72 Million (NU share) 11 miles 138kV submarine cable Joint project with LIPA Projected in-service date: 2008 Under contract – cable being manufactured 69 miles 345kV (35% underground) 57 miles 115kV (1% underground) Joint project with United Illuminating Projected in-service date: 2009 Construction under way, 16% complete |
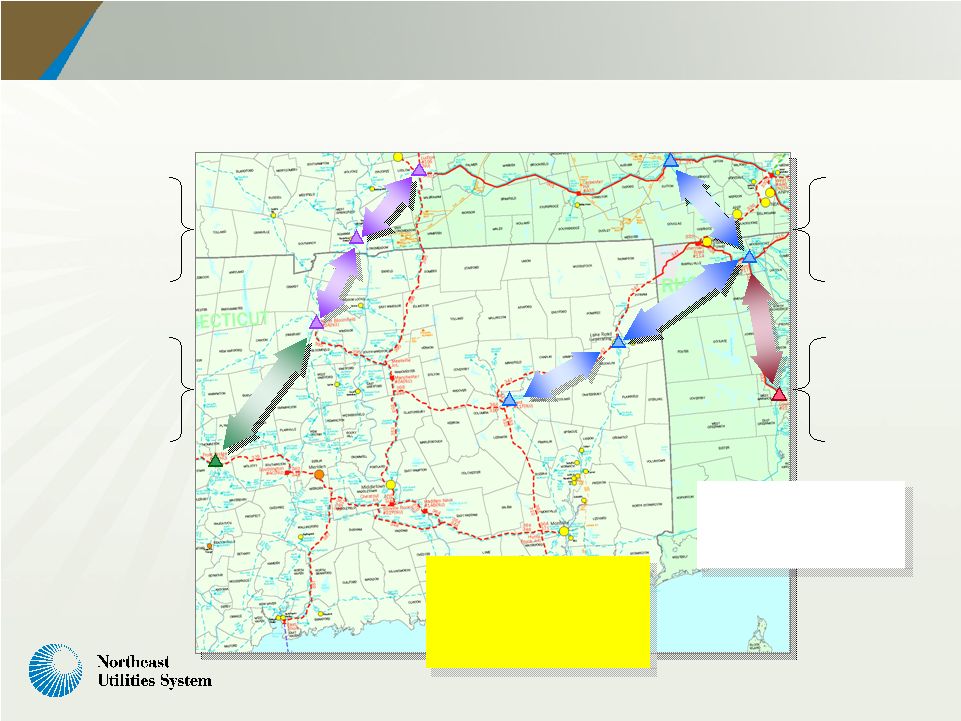
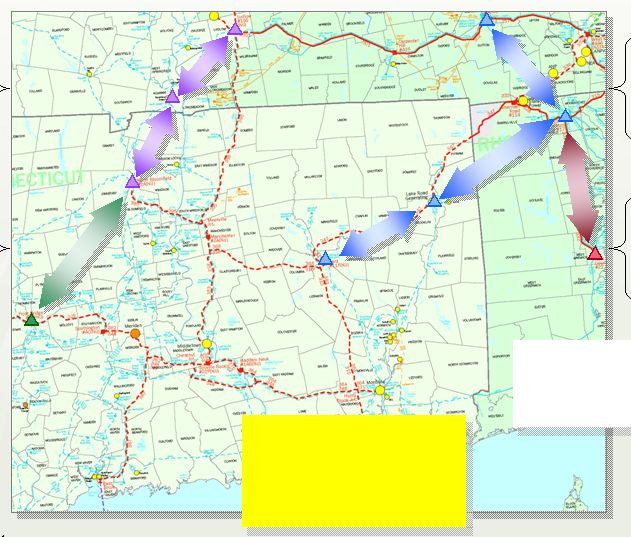
15 LUDLOW MILBURY CARD NORTH BLOOMFIELD Rhode Island Connecticut Springfield Interstate FROSTBRIDGE AGAWAM WEST FARNUM KENT COUNTY LAKE ROAD We Have Selected the Preferred Routes For NEEWS The four components, identified to date, are: A Rhode Island Reliability Component A CT East-West Reliability Component A Springfield Reliability Component An Interstate Reliability Component Total Planning Grade Estimate: $1.1 - $1.4 Billion Post-NEEWS Import Capability is expected to grow to 3600 MW |
16 Rate Case Status: Transmission NU’s FERC-approved transmission tariffs fully track all transmission costs We have forward-looking rates, adjusted every six months, with an annual true-up provision to ensure timely recovery of transmission investment FERC decision on New England transmission ROE issued on October 31, 2006 Base ROE set at 10.2% for the period 2/1/2005 through 10/31/2006 and 10.9% beyond that Incentive adders include: 50 basis points for joining an RTO 100 basis points for new transmission identified by ISO-NE within its regional system planning process November 30 th request for rehearing by New England transmission owners – apparent 30 basis point error in base ROE Other parties seeking to reduce incentive ROEs |
17 Rate Case Status – Distribution, Regulated Generation DTE approved settlement effective 1/1/07 Settlement filed 2/26/07 to be effective 7/1/07 Pending To be filed around mid-year and effective early 2008 Rate case status 9.6% 6.4% 5.9% 7.5% Actual 2006 Regulatory ROE 8% - 12% 9.62% for Generation; 9.67% for Distribution per settlement 9.9% 9.85% Allowed ROE $127 million $360 million $224 million $740 million Average common equity supporting rate base in 2006 WMECO PSNH Yankee Gas CL&P |
18 PSNH Distribution Rate Case Settlement Joint settlement with NHPUC staff, Consumer Advocate filed this week Proposed effective date of 7/1/07 Key elements 9.67% ROE, 7.55% overall cost of capital Transmission tracker to be reset annually $37.7 million estimated annualized increase ($26.45 million for distribution; $11.24 million for transmission) in addition to $24.5 million increase effective 7/1/06 Incremental increase includes: $8.76 million, 12-month increase to recoup revenues not collected between 7/1/06 and 6/30/07 $9.2 million related to storm costs to be recovered over three years Generation ROE of 9.62% unaffected |
19 Yankee Rate Case Highlights Net increase of $37 million (8.4%) Base rate increase of $68 million Lower pipeline, commodity charges due to LNG facility of $26.5 million Savings from expected property tax abatement of $4 million Expected effective date of July 1, 2007 Most recent increase January 1, 2005 $68 million base rate increase driven by: Improved returns ($17.5 million)* Higher rate base ($14 million)* Amortization of deferred hardship and environment remediation costs ($11 million) Higher O&M ($11 million, including $3 million for LNG facility electricity)* Higher depreciation over July 1, 2005 – June 30, 2006 test year ($9 million)* Higher property and other taxes ($6 million)* *Partially related to LNG facility – Overall total related to LNG facility about $20 million |
20 WMECO Rate Settlement Approved by DTE Rates effective January 1, 2007 $1 million distribution increase, plus pension, other trackers, higher energy costs resulted in 17.8% increase $3 million distribution increase to be effective January 1, 2008 Expect distribution ROE to remain in 9-10% range through 2008 Next rate case to be filed around 7/1/08 |
21 Legislative Update Connecticut 2005: Energy Independence Act Grants/loans for customer-side generation $200/kw one-time incentives to host utilities 15-year capacity-only conventional generation contracts with utilities $25/kw one-time incentives to utilities Bids submitted to the DPUC in December 2006 2007: Legislation Governor and legislative leadership identified energy as one of top 3 priorities Focus initially on conservation, renewable energy, incenting new generation, possible tax reductions Session ends June 6 New Hampshire 2006: Legislation Approved enabling bill to install scrubber at Merrimack by 7/1/13 2007: Legislation Considering legislation to allow PSNH to build another biomass unit |
22 NU’s Transformation Producing Solid Results, Prospects Strategic plan elements announced one year ago are on or ahead of schedule Financial flexibility is significantly improved Financial performance consistent with projections Transmission business is growing rapidly to meet customer needs Distribution results expected to improve as reasonable rate case outcomes are implemented Additional infrastructure needs being identified |