Searchable text section of graphics shown above
[LOGO]
[GRAPHIC]
Building Shareholder Value – The Next Chapter
Investor Day
May 12, 2005
New York
This presentation contains certain statements related to future results, or states our intentions, beliefs and expectations or predictions for the future which are forward-looking statements as that term is defined in the Private Securities Litigation Reform Act of 1995. These forward-looking statements are subject to certain risks and uncertainties that could cause actual results to differ materially from either historical or anticipated results depending on a variety of factors.
Potential factors that could impact results include: general economic conditions in different countries in which we do business around the world, changes in global equity and fixed income markets that could affect the return on invested assets, fluctuations in exchange and interest rates that could influence revenue and expense, rating agency actions that could affect our ability to borrow funds, funding of our various pension plans, changes in the competitive environment, changes in commercial property and casualty markets and commercial premium rates that could impact revenues, changes in revenues and earnings due to the elimination of contingent commissions, other uncertainties surrounding a new compensation model, the impact of regulatory investigations brought by state attorneys general and state insurance regulators related to our compensation arrangements with underwriters and related issues, the impact of class actions and individual lawsuits including client class actions, securities class actions, derivative actions, and ERISA class actions, the cost of resolution of other contingent liabilities and loss contingencies, and the difference in ultimate paid claims in our underwriting companies from actuarial estimates.
Further information concerning the Company and its business, including factors that potentially could materially affect the Company’s financial results, is contained in the Company’s filings with the Securities and Exchange Commission.
1
[GRAPHIC]
Building Shareholder Value – The Next Chapter
Investor Day
May 12, 2005
New York
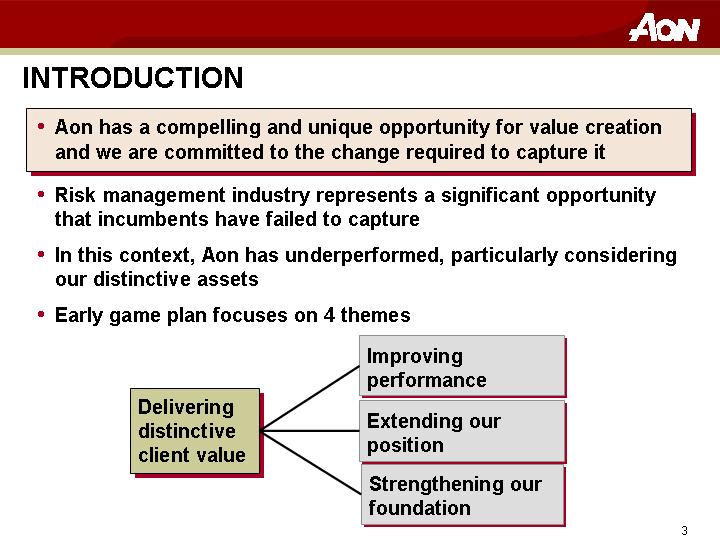
INTRODUCTION
• Aon has a compelling and unique opportunity for value creation and we are committed to the change required to capture it
• Risk management industry represents a significant opportunity that incumbents have failed to capture
• In this context, Aon has underperformed, particularly considering our distinctive assets
• Early game plan focuses on 4 themes
| | | Improving performance |
| | | |
| Delivering distinctive client value | | Extending our position |
| | | |
| | | Strengthening our foundation |
3
TOPICS
1. Industry view
2. Aon position
3. Beginning the next chapter
4
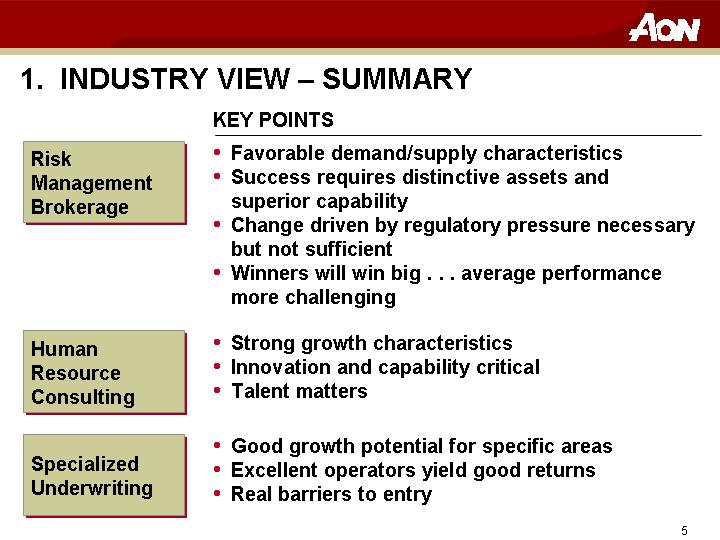
1. INDUSTRY VIEW – SUMMARY
| | KEY POINTS |
| | |
Risk Management Brokerage | | • | Favorable demand/supply characteristics |
| | • | Success requires distinctive assets and superior capability |
| | • | Change driven by regulatory pressure necessary but not sufficient |
| | • | Winners will win big . . . average performance more challenging |
| | | |
Human Resource Consulting | | • | Strong growth characteristics |
| | • | Innovation and capability critical |
| | • | Talent matters |
| | | |
Specialized Underwriting | | • | Good growth potential for specific areas |
| | • | Excellent operators yield good returns |
| | • | Real barriers to entry |
5
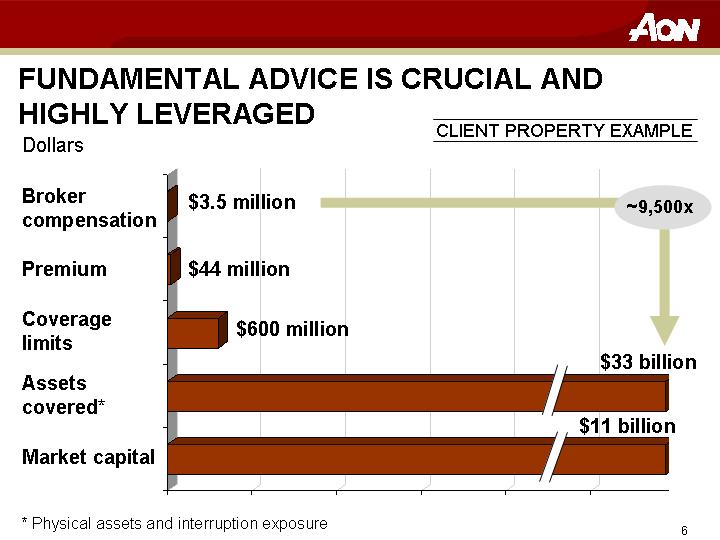
FUNDAMENTAL ADVICE IS CRUCIAL AND HIGHLY LEVERAGED
Dollars | | CLIENT PROPERTY EXAMPLE |
[CHART]
* Physical assets and interruption exposure
6
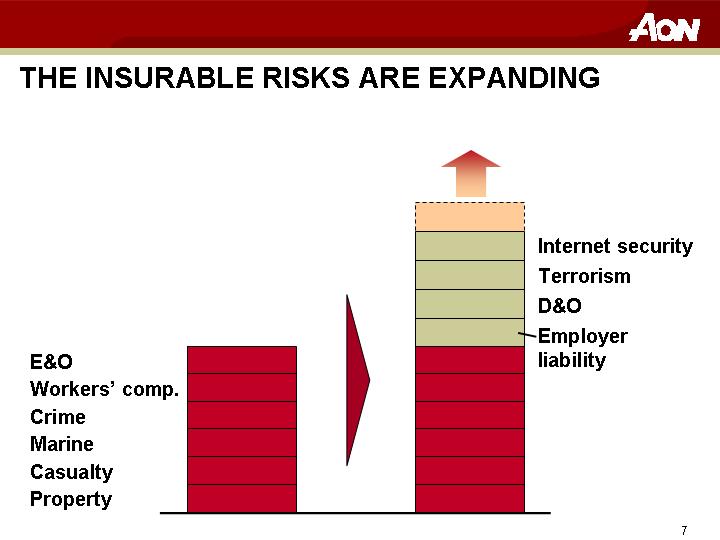
THE INSURABLE RISKS ARE EXPANDING
E&O | | | | Internet security |
| | | | |
Workers’ comp. | | | | Terrorism |
| | | | |
Crime | | | | D&O |
| | [CHART] | | |
Marine | | | | Employer liability |
| | | | |
Casualty | | | | |
| | | | |
Property | | | | |
7
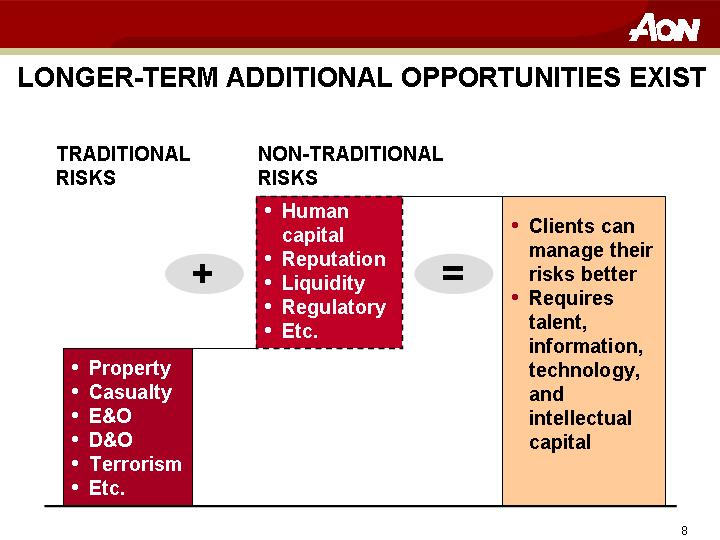
LONGER-TERM ADDITIONAL OPPORTUNITIES EXIST
TRADITIONAL RISKS | | NON-TRADITIONAL RISKS | | |
| | | | |
| | • | Human capital | | | • | Clients can manage their risks better |
| | | | | | | |
| | • | Reputation | | | • | Requires talent, information, technology, and |
| | | | | | | intellectual capital |
+ | | • | Liquidity | | = | |
| | | | | | |
| | • | Regulatory | | | |
| | | | | | |
| | • | Etc. | | | |
| | | | |
• | Property | | | | |
| | | | | |
• | Casualty | | | | |
| | | | | |
• | E&O | | | | |
| | | | | |
• | D&O | | | | |
| | | | | |
• | Terrorism | | | | |
| | | | | |
• | Etc. | | | | |
8
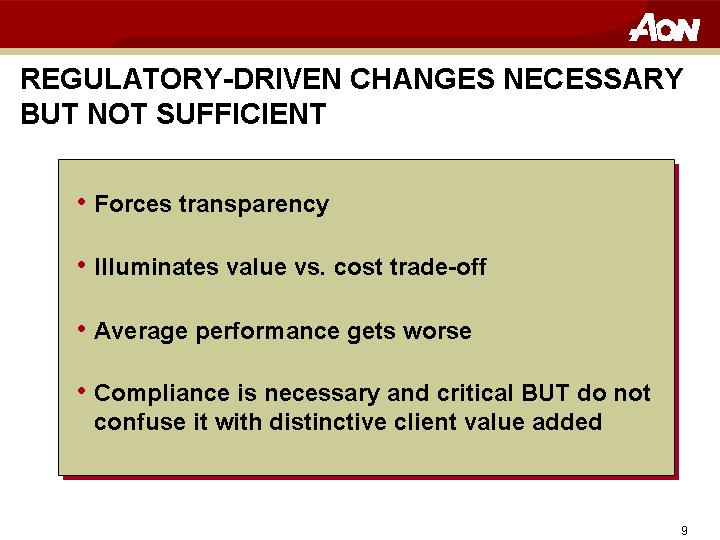
REGULATORY-DRIVEN CHANGES NECESSARY BUT NOT SUFFICIENT
• Forces transparency
• Illuminates value vs. cost trade-off
• Average performance gets worse
• Compliance is necessary and critical BUT do not confuse it with distinctive client value added
9
WINNERS WILL HAVE DISTINCTIVE ASSETS AND SUPERIOR CAPABILITY
• Focus on basics of client relationship
• Deep talent across products, industries, geographies
• Global servicing platform and network
• Technology and risk advice tools
• Transparency and clarity for clients on value vs. cost
• Efficient operating platform
10
CONSULTING IS GROWING WITH SUCCESS DRIVEN BY INNOVATION AND CAPABILITY
• $13 billion HR consulting industry growing at 4%
• Growth in consulting, healthcare, executive compensation, and emerging practices
• Clients more sophisticated and demand more value
• Outsourcing has potential, but economics are challenged
11
SPECIALIZED UNDERWRITING IS AN ATTRACTIVE SEGMENT
• Less exposed to overall industry cycles
• Acquisition cost management is critical
• Client relationships and persistency are key profit drivers
• Best performers systematically drive down costs
• Scale, sales force and expertise present effective entry barriers
12
2. AON POSITION – SUMMARY
| | KEY POINTS |
| | | |
Operating Performance | | • | Distinctive assets |
| | • | Distinctive capability |
| | • | Disappointing execution |
| | | |
Financial Performance | | • | Historical financial results unacceptable |
| | • | Improved 1Q 2005 results driven by discontinued operations and expense program |
| | • | Strong cash flow and balance sheet position |
13
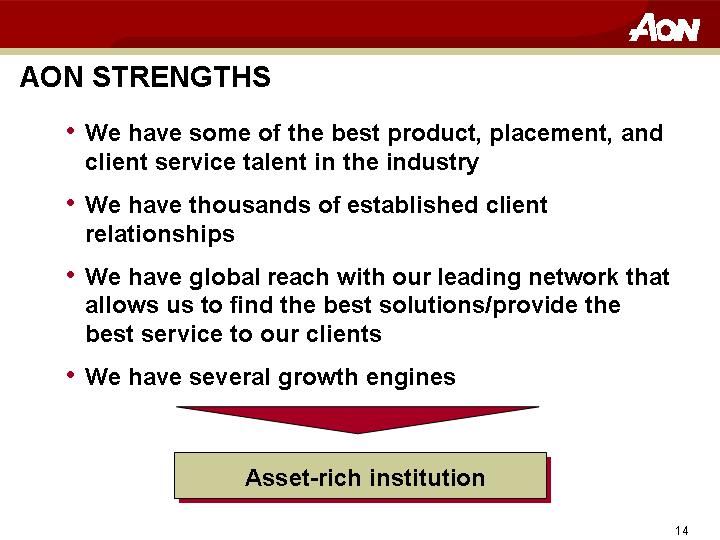
AON STRENGTHS
• We have some of the best product, placement, and client service talent in the industry
• We have thousands of established client relationships
• We have global reach with our leading network that allows us to find the best solutions/provide the best service to our clients
• We have several growth engines
[GRAPHIC]
Asset-rich institution
14
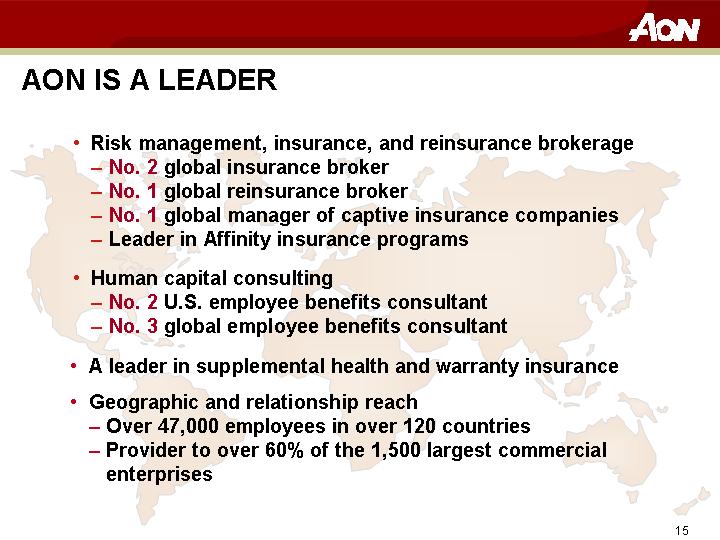
AON IS A LEADER
[GRAPHIC]
• Risk management, insurance, and reinsurance brokerage
• No. 2 global insurance broker
• No. 1 global reinsurance broker
• No. 1 global manager of captive insurance companies
• Leader in Affinity insurance programs
• Human capital consulting
• No. 2 U.S. employee benefits consultant
• No. 3 global employee benefits consultant
• A leader in supplemental health and warranty insurance
• Geographic and relationship reach
• Over 47,000 employees in over 120 countries
• Provider to over 60% of the 1,500 largest commercial enterprises
15
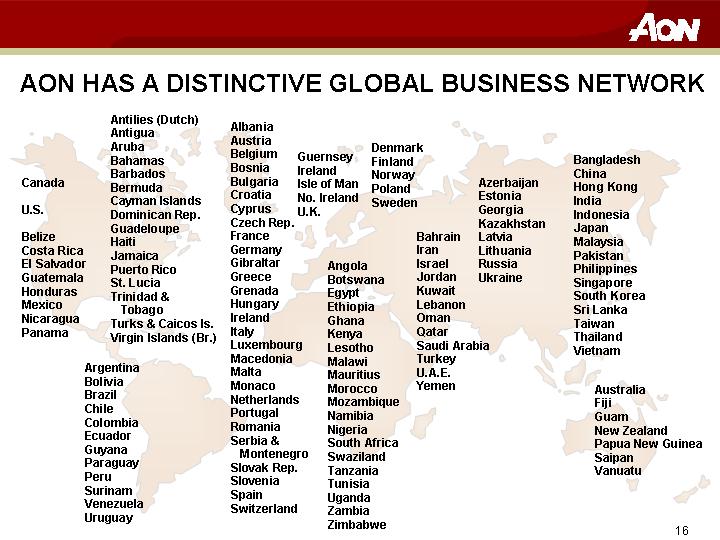
AON HAS A DISTINCTIVE GLOBAL BUSINESS NETWORK
[GRAPHIC]
16
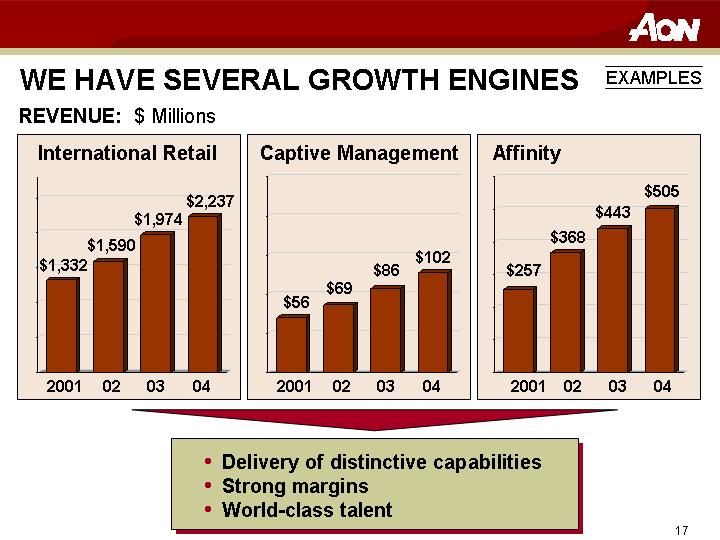
WE HAVE SEVERAL GROWTH ENGINES | | EXAMPLES |
REVENUE: $ Millions
International Retail | | Captive Management | | Affinity |
| | | | |
[CHART] | | [CHART] | | [CHART] |
[GRAPHIC]
• Delivery of distinctive capabilities
• Strong margins
• World-class talent
17
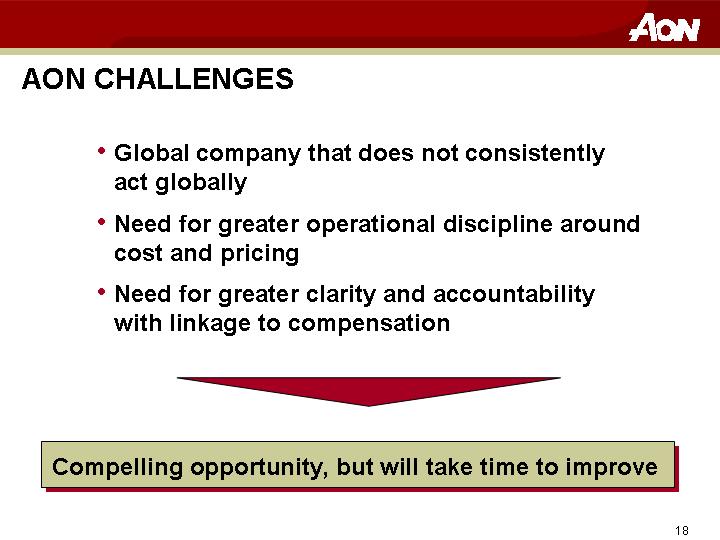
AON CHALLENGES
• Global company that does not consistently act globally
• Need for greater operational discipline around cost and pricing
• Need for greater clarity and accountability with linkage to compensation
[GRAPHIC]
Compelling opportunity, but will take time to improve
18
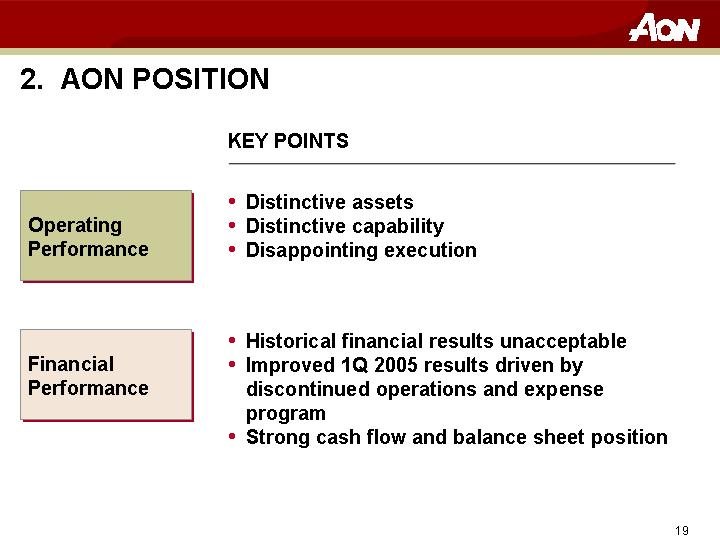
2. AON POSITION
| | KEY POINTS |
| | | |
Operating Performance | | • | Distinctive assets |
| | • | Distinctive capability |
| | • | Disappointing execution |
| | | |
Financial Performance | | • | Historical financial results unacceptable |
| | • | Improved 1Q 2005 results driven by discontinued operations and expense program |
| | • | Strong cash flow and balance sheet position |
19
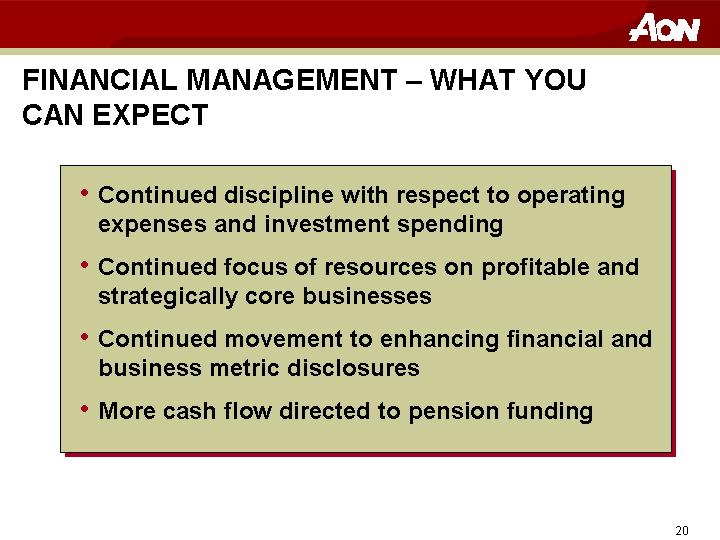
FINANCIAL MANAGEMENT – WHAT YOU CAN EXPECT
• Continued discipline with respect to operating expenses and investment spending
• Continued focus of resources on profitable and strategically core businesses
• Continued movement to enhancing financial and business metric disclosures
• More cash flow directed to pension funding
20
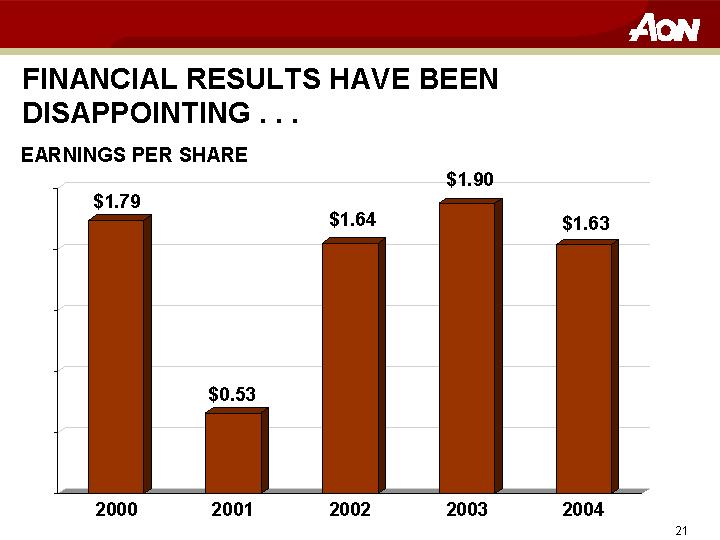
FINANCIAL RESULTS HAVE BEEN DISAPPOINTING . . .
EARNINGS PER SHARE
[CHART]
21
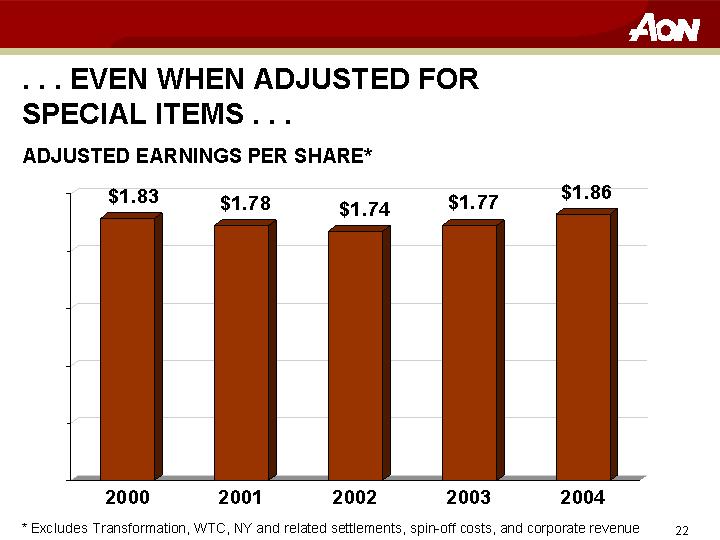
. . . EVEN WHEN ADJUSTED FOR SPECIAL ITEMS . . .
ADJUSTED EARNINGS PER SHARE*
[CHART]
* Excludes Transformation, WTC, NY and related settlements, spin-off costs, and corporate revenue
22
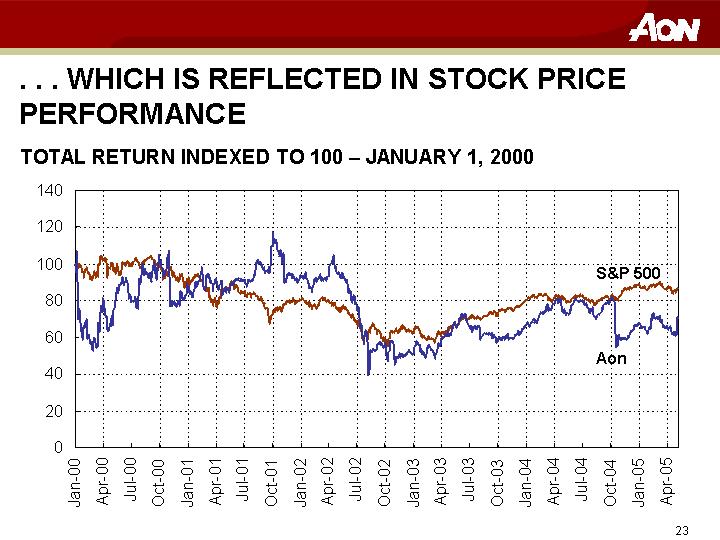
. . . WHICH IS REFLECTED IN STOCK PRICE PERFORMANCE
TOTAL RETURN INDEXED TO 100 – JANUARY 1, 2000
[CHART]
23
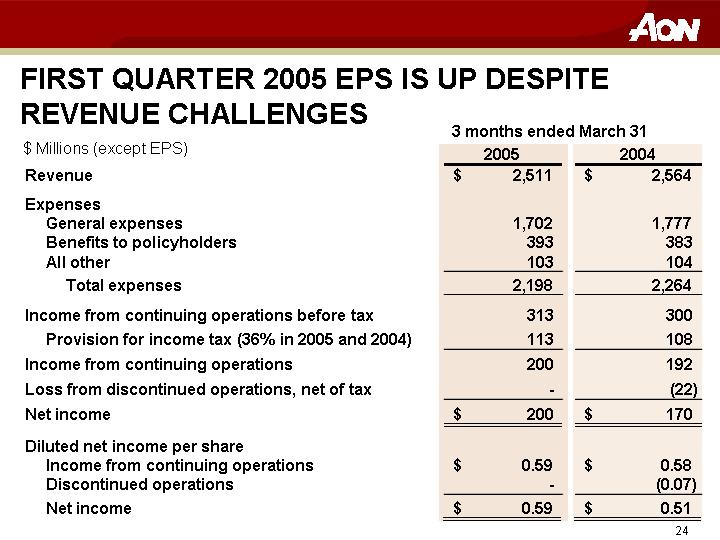
FIRST QUARTER 2005 EPS IS UP DESPITE REVENUE CHALLENGES
| | 3 months ended March 31 | |
$ Millions (except EPS) | | 2005 | | 2004 | |
Revenue | | $ | 2,511 | | $ | 2,564 | |
| | | | | |
Expenses | | | | | |
General expenses | | 1,702 | | 1,777 | |
Benefits to policyholders | | 393 | | 383 | |
All other | | 103 | | 104 | |
Total expenses | | 2,198 | | 2,264 | |
| | | | | |
Income from continuing operations before tax | | 313 | | 300 | |
Provision for income tax (36% in 2005 and 2004) | | 113 | | 108 | |
Income from continuing operations | | 200 | | 192 | |
Loss from discontinued operations, net of tax | | — | | (22 | ) |
Net income | | $ | 200 | | $ | 170 | |
| | | | | |
Diluted net income per share | | | | | |
Income from continuing operations | | $ | 0.59 | | $ | 0.58 | |
Discontinued operations | | — | | (0.07 | ) |
Net income | | $ | 0.59 | | $ | 0.51 | |
24
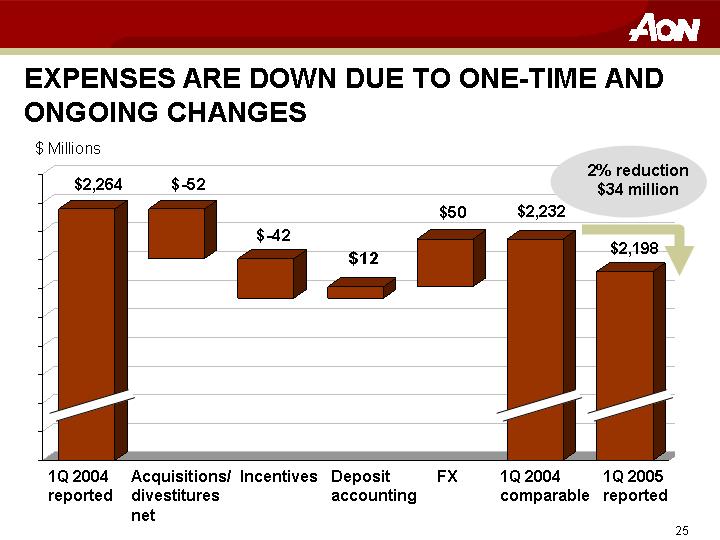
EXPENSES ARE DOWN DUE TO ONE-TIME AND ONGOING CHANGES
[CHART]
25
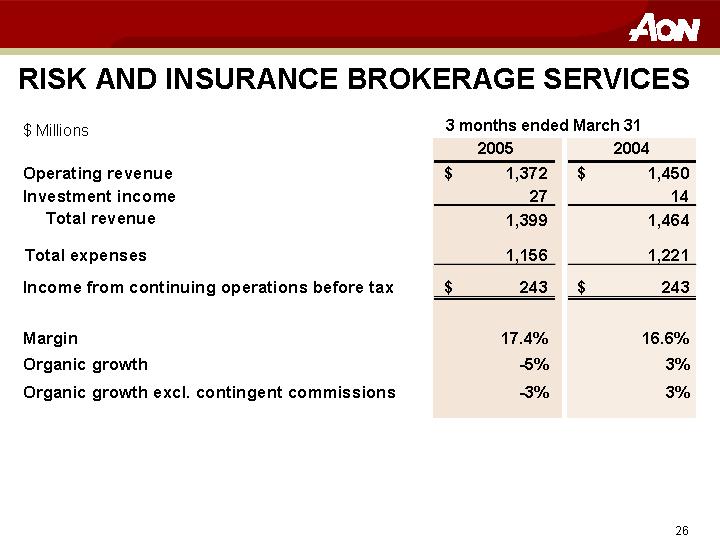
RISK AND INSURANCE BROKERAGE SERVICES
| | 3 months ended March 31 | |
$ Millions | | 2005 | | 2004 | |
Operating revenue | | $ | 1,372 | | $ | 1,450 | |
Investment income | | 27 | | 14 | |
Total revenue | | 1,399 | | 1,464 | |
| | | | | |
Total expenses | | 1,156 | | 1,221 | |
Income from continuing operations before tax | | $ | 243 | | $ | 243 | |
| | | | | |
Margin | | 17.4 | % | 16.6 | % |
Organic growth | | -5 | % | 3 | % |
Organic growth excl. contingent commissions | | -3 | % | 3 | % |
26
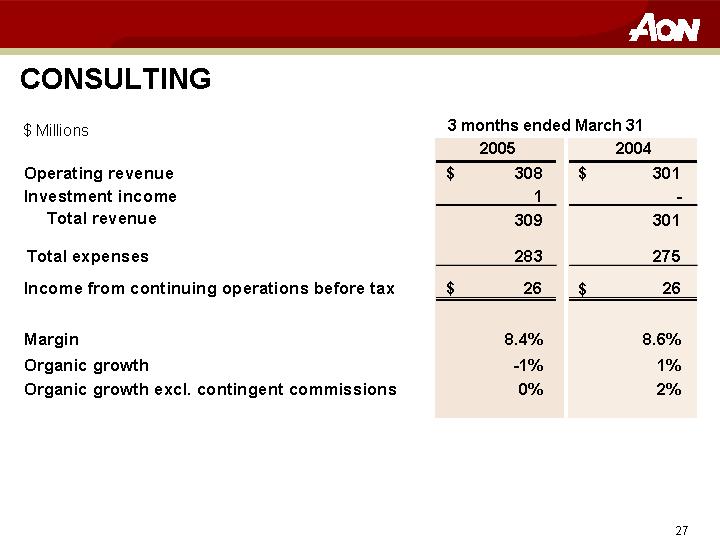
CONSULTING
| | 3 months ended March 31 | |
$ Millions | | 2005 | | 2004 | |
Operating revenue | | $ | 308 | | $ | 301 | |
Investment income | | 1 | | — | |
Total revenue | | 309 | | 301 | |
| | | | | |
Total expenses | | 283 | | 275 | |
| | | | | |
Income from continuing operations before tax | | $ | 26 | | $ | 26 | |
| | | | | |
Margin | | 8.4 | % | 8.6 | % |
Organic growth | | -1 | % | 1 | % |
Organic growth excl. contingent commissions | | 0 | % | 2 | % |
27
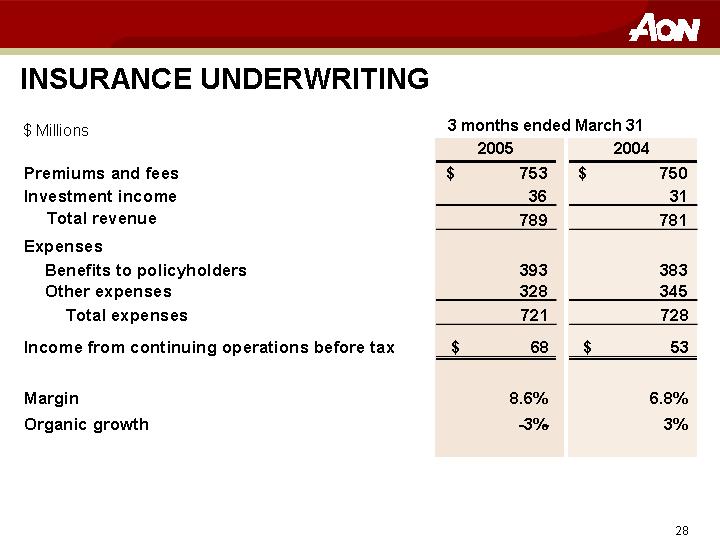
INSURANCE UNDERWRITING
| | 3 months ended March 31 | |
$ Millions | | 2005 | | 2004 | |
Premiums and fees | | $ | 753 | | $ | 750 | |
Investment income | | 36 | | 31 | |
Total revenue | | 789 | | 781 | |
| | | | | |
Expenses | | | | | |
Benefits to policyholders | | 393 | | 383 | |
Other expenses | | 328 | | 345 | |
Total expenses | | 721 | | 728 | |
| | | | | |
Income from continuing operations before tax | | $ | 68 | | $ | 53 | |
| | | | | |
Margin | | 8.6 | % | 6.8 | % |
Organic growth | | -3 | % | 3 | % |
28
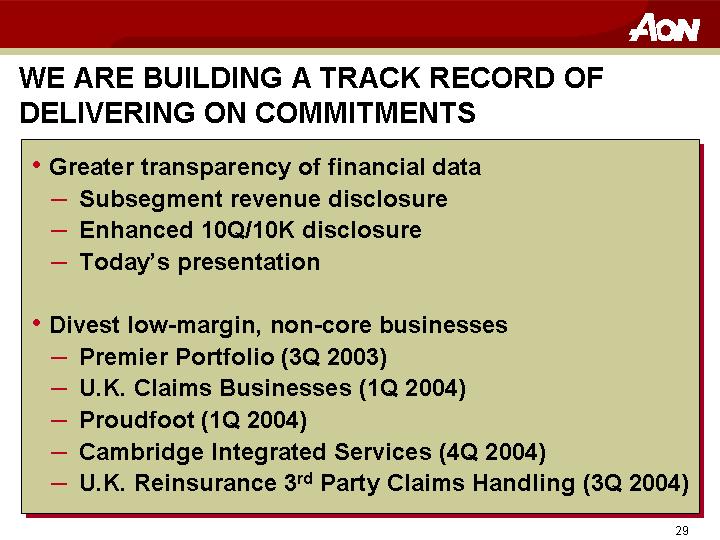
WE ARE BUILDING A TRACK RECORD OF DELIVERING ON COMMITMENTS
• Greater transparency of financial data
• Subsegment revenue disclosure
• Enhanced 10Q/10K disclosure
• Today’s presentation
• Divest low-margin, non-core businesses
• Premier Portfolio (3Q 2003)
• U.K. Claims Businesses (1Q 2004)
• Proudfoot (1Q 2004)
• Cambridge Integrated Services (4Q 2004)
• U.K. Reinsurance 3rd Party Claims Handling (3Q 2004)
29
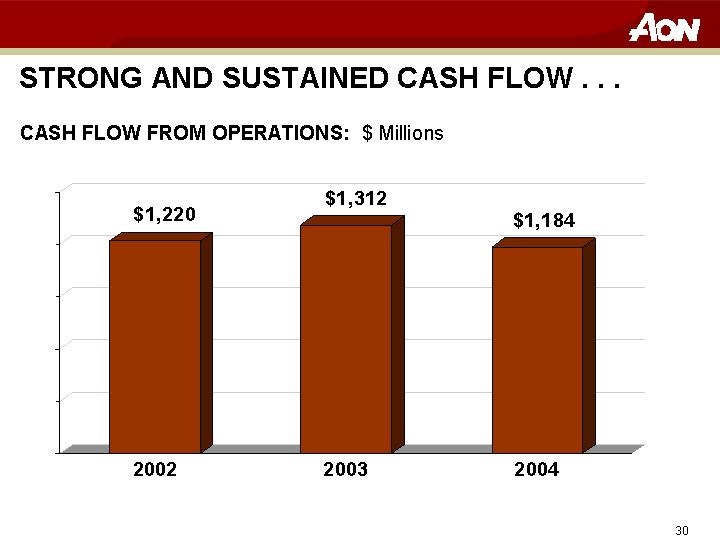
STRONG AND SUSTAINED CASH FLOW . . .
CASH FLOW FROM OPERATIONS: $ Millions
[CHART]
30
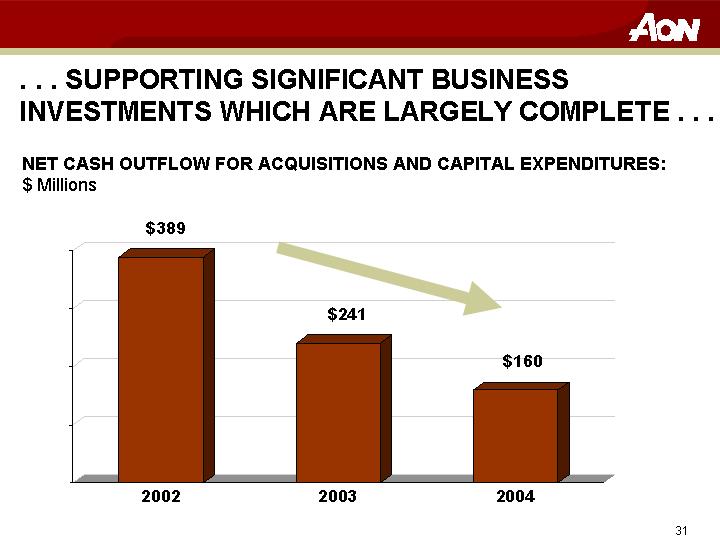
. . . SUPPORTING SIGNIFICANT BUSINESS INVESTMENTS WHICH ARE LARGELY COMPLETE . . .
NET CASH OUTFLOW FOR ACQUISITIONS AND CAPITAL EXPENDITURES: $ Millions
[CHART]
31
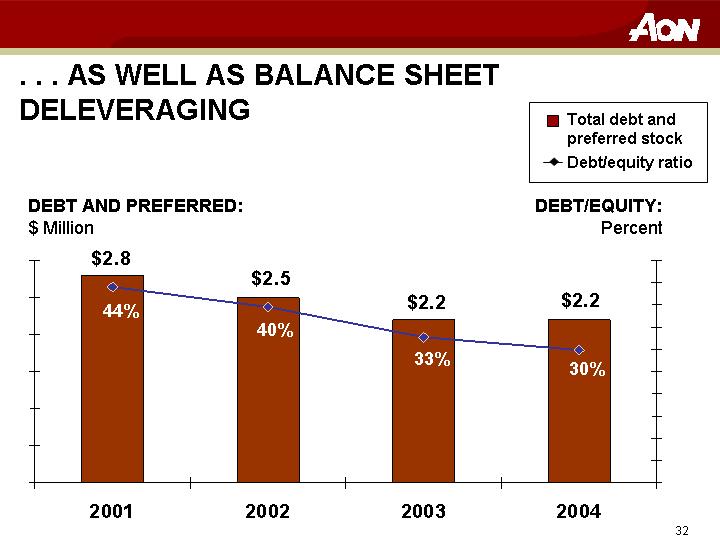
. . . AS WELL AS BALANCE SHEET DELEVERAGING
[CHART]
DEBT AND PREFERRED: | | DEBT/EQUITY: |
$ Million | | Percent |
32
INCREASING USE OF FREE CASH FLOW FOR PENSION PLANS . . .
(-OVER)/UNDER FUNDED: $ Millions
[CHART]
33
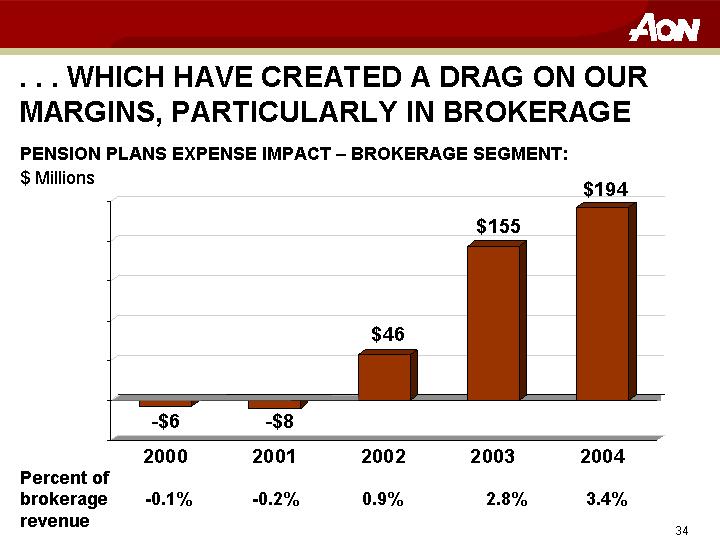
. . . WHICH HAVE CREATED A DRAG ON OUR MARGINS, PARTICULARLY IN BROKERAGE
PENSION PLANS EXPENSE IMPACT – BROKERAGE SEGMENT: $ Millions
[CHART]
Percent of brokerage revenue | | -0.1 | % | -0.2 | % | 0.9 | % | 2.8 | % | 3.4 | % |
34
FINANCIAL MANAGEMENT – WHAT YOU CAN EXPECT
• Continued discipline with respect to operating expenses and investment spending
• Continued focus of resources on profitable and strategically core businesses
• Continued movement to enhancing financial and business metric disclosures
• More cash flow directed to pension funding
35
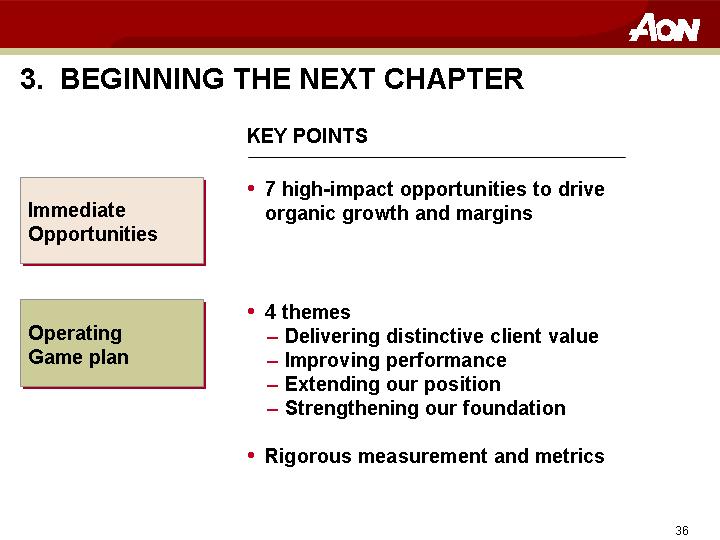
3. BEGINNING THE NEXT CHAPTER
KEY POINTS
Immediate Opportunities | | • 7 high-impact opportunities to drive organic growth and margins |
| | |
Operating Game plan | | • 4 themes • Delivering distinctive client value • Improving performance • Extending our position • Strengthening our foundation |
| | |
| | • Rigorous measurement and metrics |
36
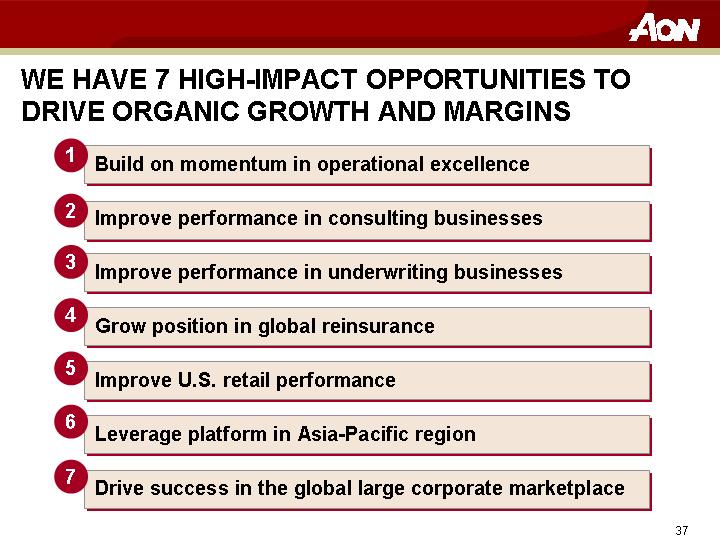
WE HAVE 7 HIGH-IMPACT OPPORTUNITIES TO DRIVE ORGANIC GROWTH AND MARGINS
1 Build on momentum in operational excellence
2 Improve performance in consulting businesses
3 Improve performance in underwriting businesses
4 Grow position in global reinsurance
5 Improve U.S. retail performance
6 Leverage platform in Asia-Pacific region
7 Drive success in the global large corporate marketplace
37
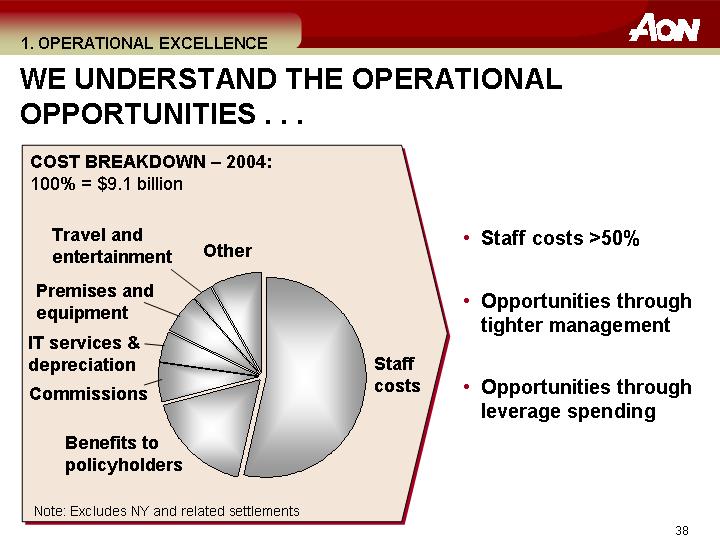
1. OPERATIONAL EXCELLENCE
WE UNDERSTAND THE OPERATIONAL OPPORTUNITIES . . .
COST BREAKDOWN – 2004:
100% = $9.1 billion
[CHART]
Note: Excludes NY and related settlements
• Staff costs >50%
• Opportunities through tighter management
• Opportunities through leverage spending
38
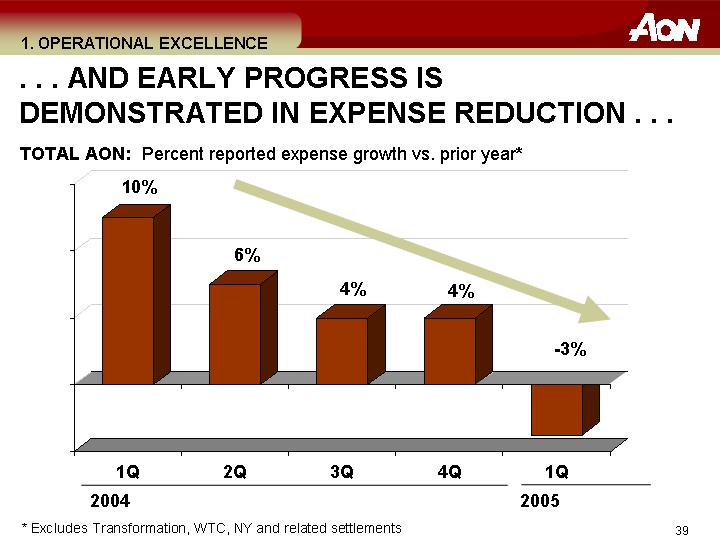
. . . AND EARLY PROGRESS IS DEMONSTRATED IN EXPENSE REDUCTION . . .
TOTAL AON: Percent reported expense growth vs. prior year*
[CHART]
* Excludes Transformation, WTC, NY and related settlements
39
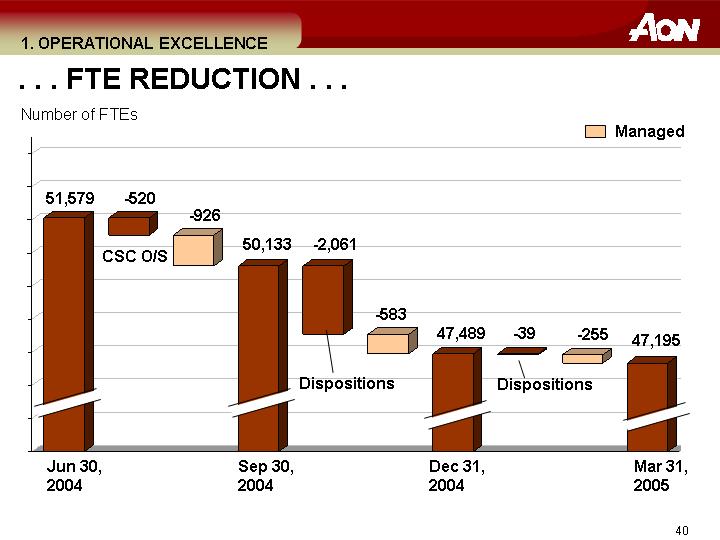
. . . FTE REDUCTION . . .
Number of FTEs
[CHART]
40
. . . AND COMPENSATION
• Aggressively managing head count through attrition and hiring discipline
• Modifications to incentive programs
• Better alignment with performance and growth
• All plans have an overall Aon component
• 20% of significant awards paid in 3-year restricted stock
• Modifications to benefit programs
• Modified 401(k) – $18 million in savings
• Closing all major defined-benefit programs
• Modified U.S. medical plan to mitigate cost increase
41
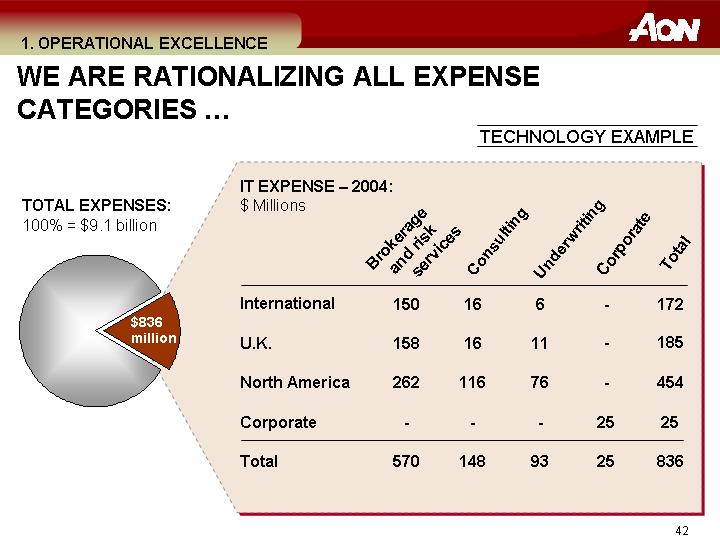
WE ARE RATIONALIZING ALL EXPENSE CATEGORIES …
TECHNOLOGY EXAMPLE
TOTAL EXPENSES:
100% = $9.1 billion
[CHART]
IT EXPENSE – 2004:
$ Millions
| | Brokerage
and risk
services | | Consulting | | Underwriting | | Corporate | | Total | |
International | | 150 | | 16 | | 6 | | — | | 172 | |
| | | | | | | | | | | |
U.K. | | 158 | | 16 | | 11 | | — | | 185 | |
| | | | | | | | | | | |
North America | | 262 | | 116 | | 76 | | — | | 454 | |
| | | | | | | | | | | |
Corporate | | — | | — | | — | | 25 | | 25 | |
| | | | | | | | | | | |
Total | | 570 | | 148 | | 93 | | 25 | | 836 | |
42
. . . AND ARE MAKING PROGRESS
• Infrastructure outsourcing: U.K. successful, U.S. in process
• Exploring outsourcing/offshoring of certain application support and development activities
• Leverage applications across businesses and geographies
• Client-facing technology being deployed worldwide
• Leverage investment in core processing systems
• Common support tools
• Standardize HR and Finance systems
43
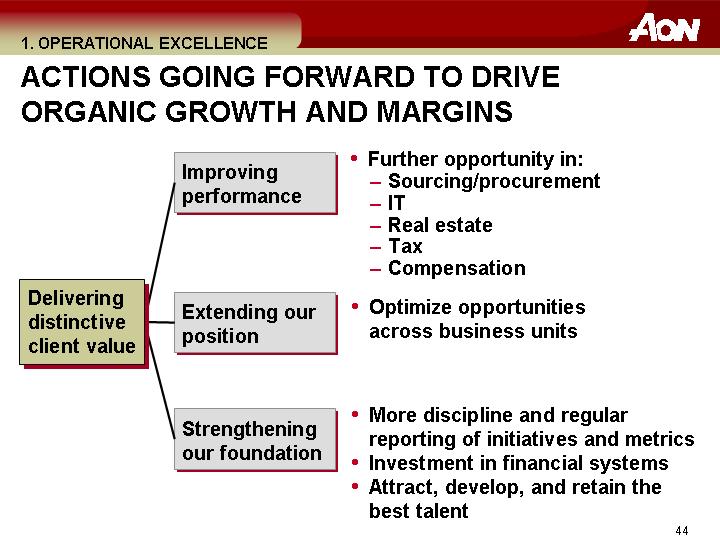
ACTIONS GOING FORWARD TO DRIVE ORGANIC GROWTH AND MARGINS
Delivering distinctive client value | | Improving performance | | • Further opportunity in: |
| | | • Sourcing/procurement |
| | | • IT |
| | | • Real estate |
| | | • Tax |
| | | • Compensation |
| | | |
| Extending our position | | • Optimize opportunities across business units |
| | | |
| Strengthening our foundation | | • More discipline and regular reporting of initiatives and metrics |
| | • Investment in financial systems |
| | • Attract, develop, and retain the best talent |
44
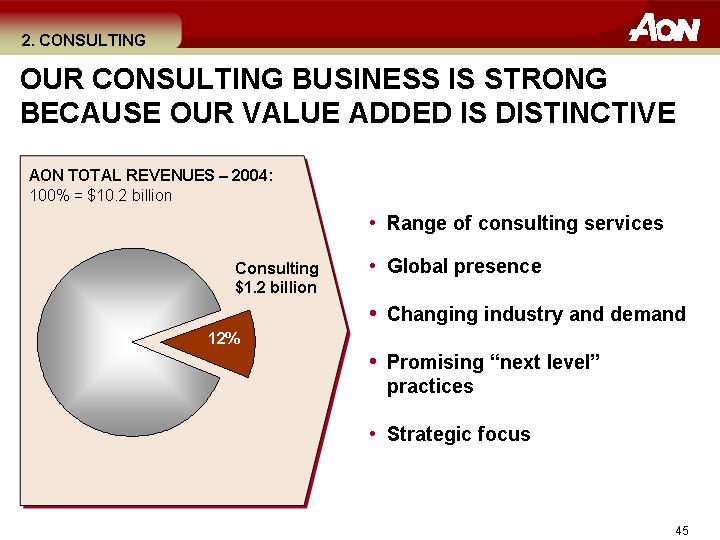
2. CONSULTING
OUR CONSULTING BUSINESS IS STRONG BECAUSE OUR VALUE ADDED IS DISTINCTIVE
AON TOTAL REVENUES – 2004:
100% = $10.2 billion
[CHART]
• Range of consulting services
• Global presence
• Changing industry and demand
• Promising “next level” practices
• Strategic focus
45
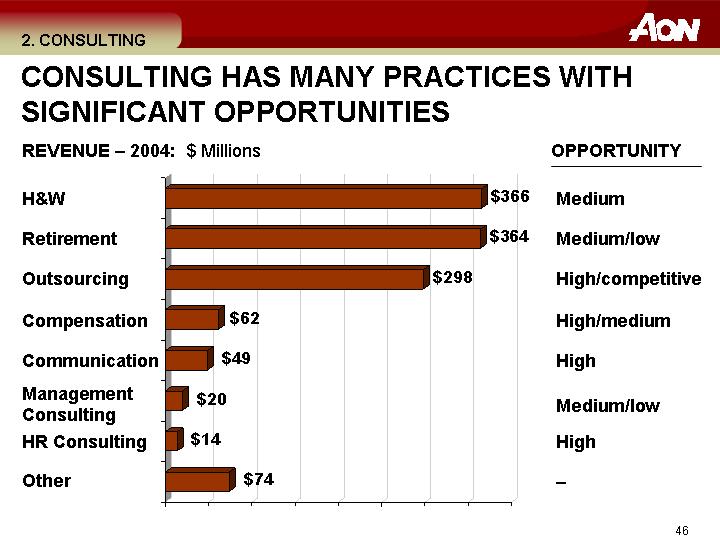
CONSULTING HAS MANY PRACTICES WITH SIGNIFICANT OPPORTUNITIES
REVENUE – 2004: $ Millions | | | | OPPORTUNITY |
| | | | |
| | | | Medium |
| | | | |
| | | | Medium/low |
| | | | |
| | | | High/competitive |
| | | | |
| | | | High/medium |
| | [CHART] | | |
| | | | High |
| | | | |
| | | | Medium/low |
| | | | |
| | | | High |
| | | | |
| | | | – |
46
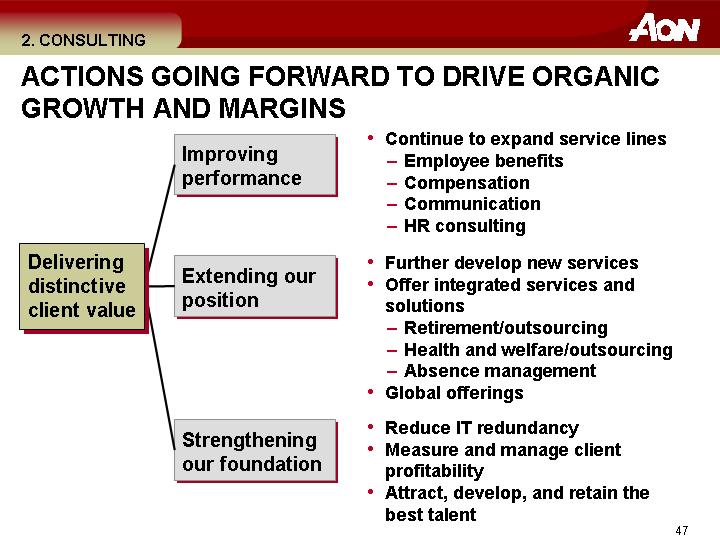
ACTIONS GOING FORWARD TO DRIVE ORGANIC GROWTH AND MARGINS
Delivering distinctive client value | | Improving performance | | • Continue to expand service lines |
| | | • Employee benefits |
| | | • Compensation |
| | | • Communication |
| | | • HR consulting |
| | | |
| Extending our position | | • Further develop new services |
| | | • Offer integrated services and solutions |
| | | • Retirement/outsourcing |
| | | • Health and welfare/outsourcing |
| | | • Absence management |
| | | • Global offerings |
| | | |
| Strengthening our foundation | | • Reduce IT redundancy |
| | • Measure and manage client profitability |
| | • Attract, develop, and retain the best talent |
47
3. UNDERWRITING
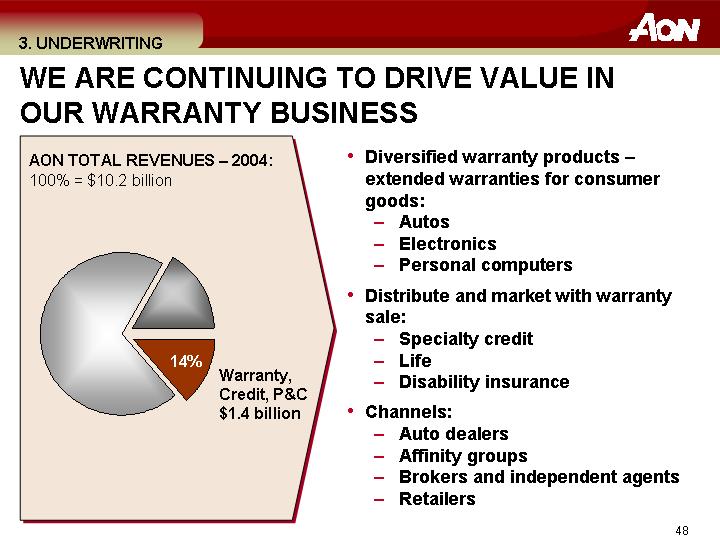
WE ARE CONTINUING TO DRIVE VALUE IN OUR WARRANTY BUSINESS
AON TOTAL REVENUES – 2004:
100% = $10.2 billion
[CHART]
• Diversified warranty products – extended warranties for consumer goods:
• Autos
• Electronics
• Personal computers
• Distribute and market with warranty sale:
• Specialty credit
• Life
• Disability insurance
• Channels:
• Auto dealers
• Affinity groups
• Brokers and independent agents
• Retailers
48
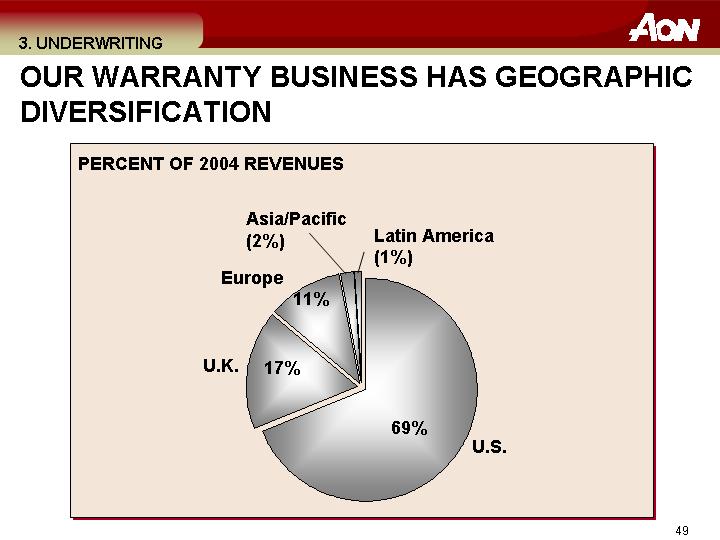
OUR WARRANTY BUSINESS HAS GEOGRAPHIC DIVERSIFICATION
PERCENT OF 2004 REVENUES
[CHART]
49
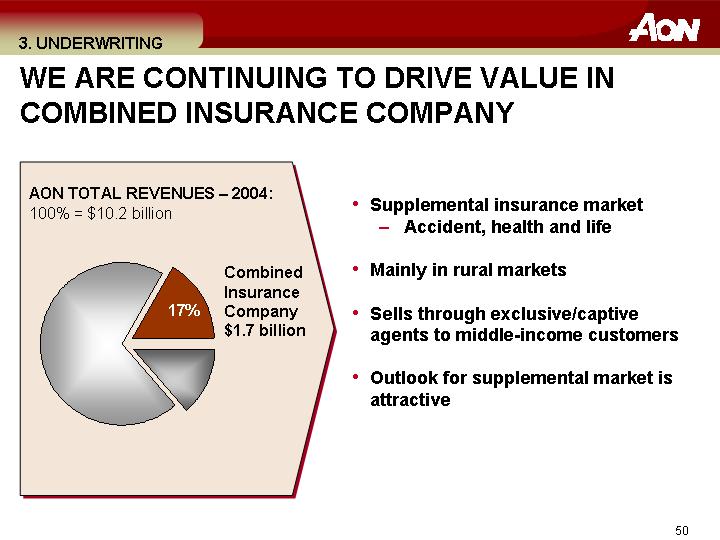
WE ARE CONTINUING TO DRIVE VALUE IN COMBINED INSURANCE COMPANY
AON TOTAL REVENUES – 2004:
100% = $10.2 billion
[CHART]
• Supplemental insurance market
• Accident, health and life
• Mainly in rural markets
• Sells through exclusive/captive agents to middle-income customers
• Outlook for supplemental market is attractive
50
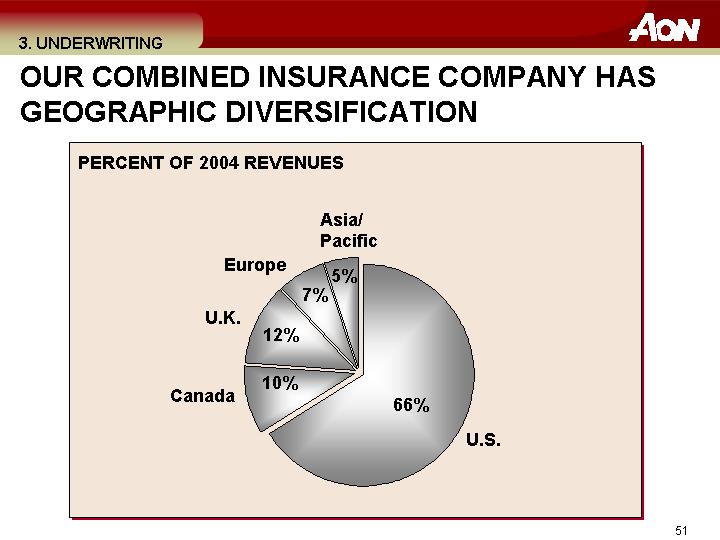
OUR COMBINED INSURANCE COMPANY HAS GEOGRAPHIC DIVERSIFICATION
PERCENT OF 2004 REVENUES
[CHART]
51
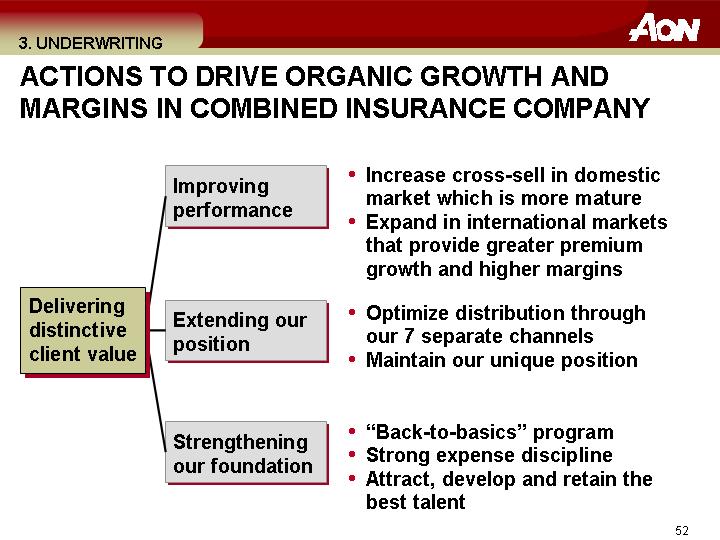
ACTIONS TO DRIVE ORGANIC GROWTH AND MARGINS IN COMBINED INSURANCE COMPANY
Delivering distinctive client value | | Improving performance | | • Increase cross-sell in domestic market which is more mature |
| | | • Expand in international markets that provide greater premium growth and higher margins |
| | | |
| Extending our position | | • Optimize distribution through our 7 separate channels |
| | | • Maintain our unique position |
| | | |
| Strengthening our foundation | | • “Back-to-basics” program |
| | • Strong expense discipline |
| | • Attract, develop and retain the best talent |
52
4. REINSURANCE AND RELATED SERVICES
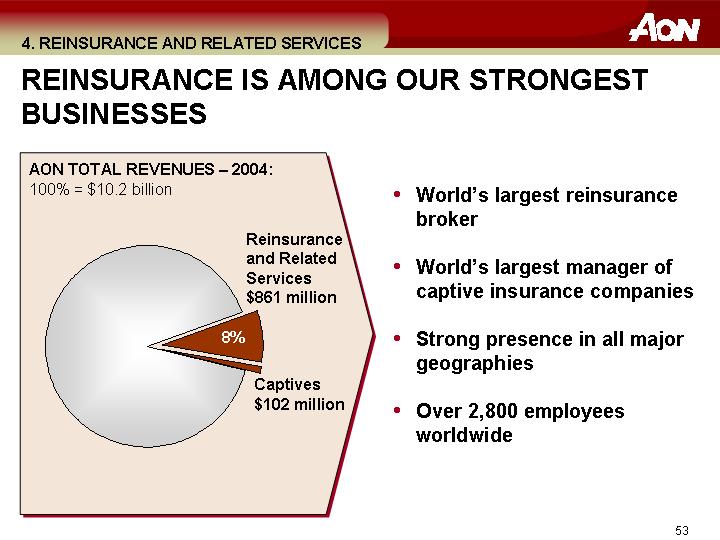
REINSURANCE IS AMONG OUR STRONGEST BUSINESSES
AON TOTAL REVENUES – 2004:
100% = $10.2 billion
[CHART]
• World’s largest reinsurance broker
• World’s largest manager of captive insurance companies
• Strong presence in all major geographies
• Over 2,800 employees worldwide
53
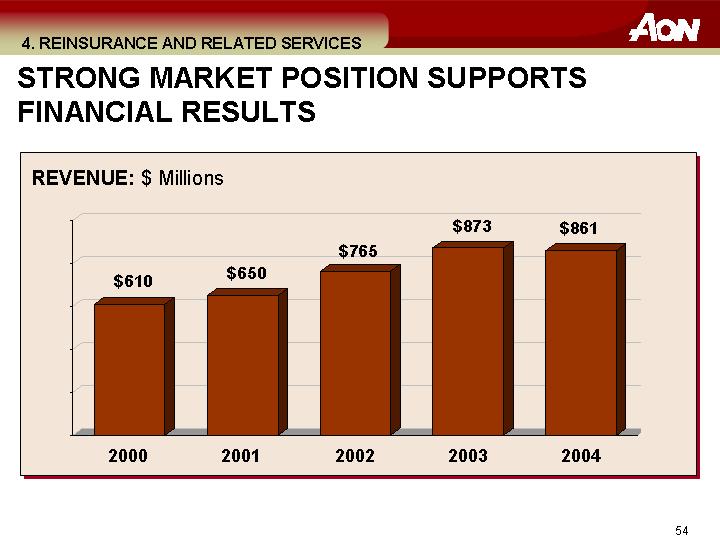
STRONG MARKET POSITION SUPPORTS FINANCIAL RESULTS
REVENUE: $ Millions
[CHART]
54
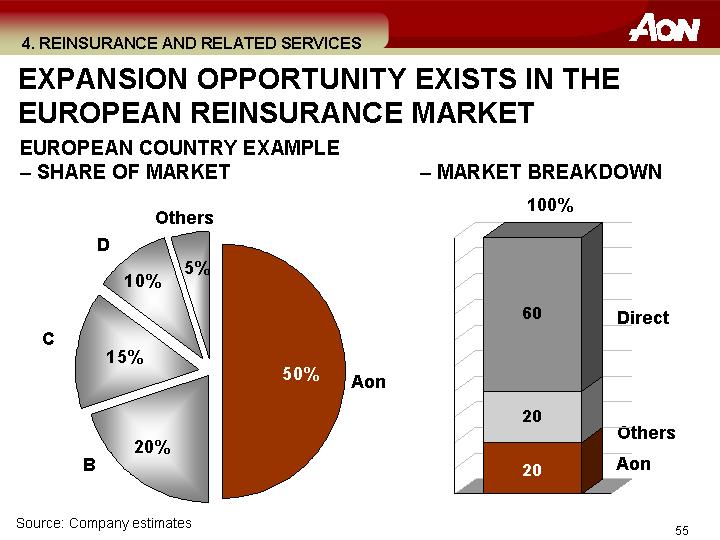
EXPANSION OPPORTUNITY EXISTS IN THE EUROPEAN REINSURANCE MARKET
EUROPEAN COUNTRY EXAMPLE
• SHARE OF MARKET | | • MARKET BREAKDOWN |
| | |
[CHART] | | [CHART] |
Source: Company estimates
55
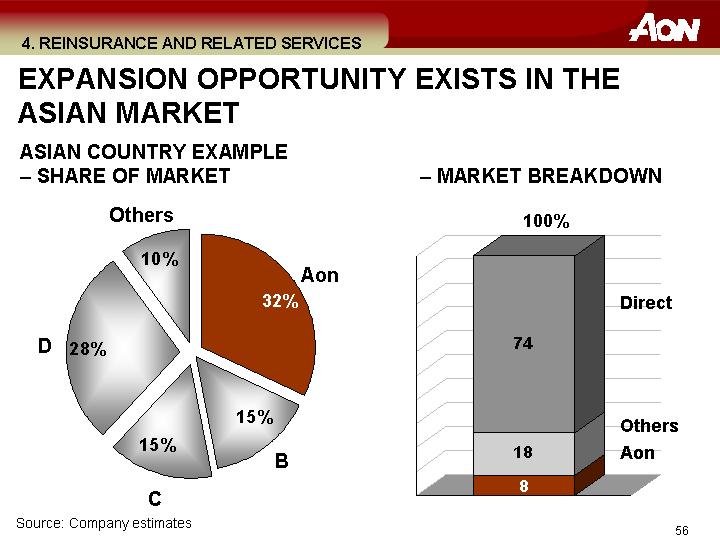
EXPANSION OPPORTUNITY EXISTS IN THE ASIAN MARKET
ASIAN COUNTRY EXAMPLE
• SHARE OF MARKET | | • MARKET BREAKDOWN |
| | |
[CHART] | | [CHART] |
Source: Company estimates
56
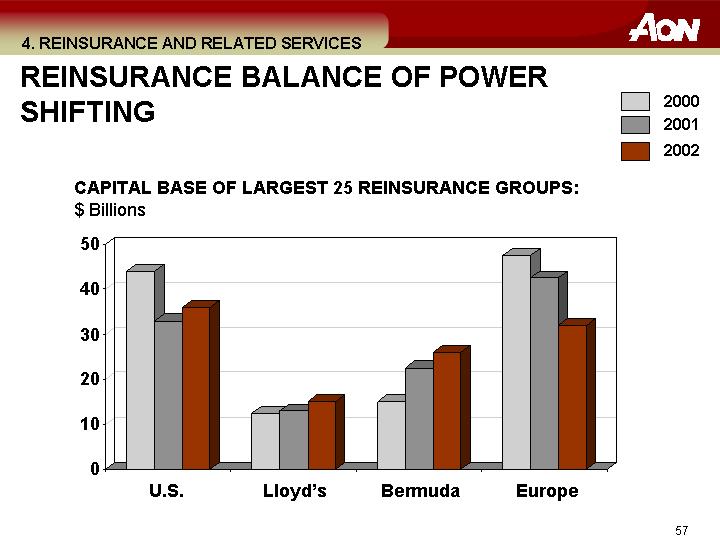
REINSURANCE BALANCE OF POWER SHIFTING
CAPITAL BASE OF LARGEST 25 REINSURANCE GROUPS: $ Billions
[CHART]
57
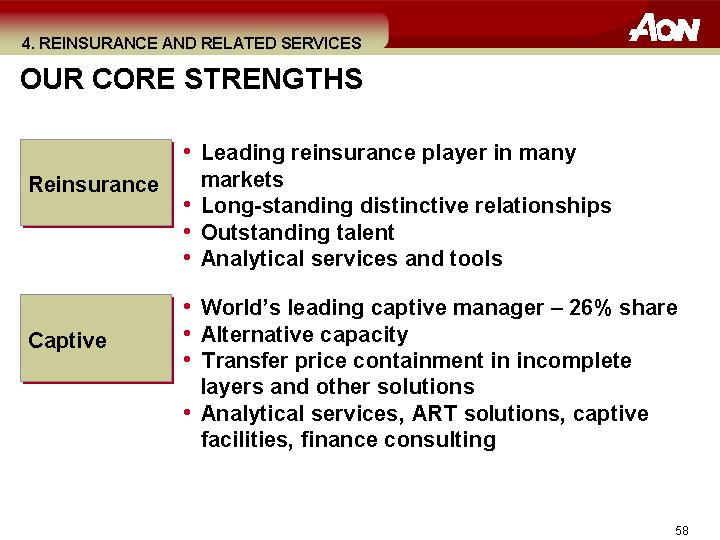
OUR CORE STRENGTHS
Reinsurance
• Leading reinsurance player in many markets
• Long-standing distinctive relationships
• Outstanding talent
• Analytical services and tools
Captive
• World’s leading captive manager – 26% share
• Alternative capacity
• Transfer price containment in incomplete layers and other solutions
• Analytical services, ART solutions, captive facilities, finance consulting
58
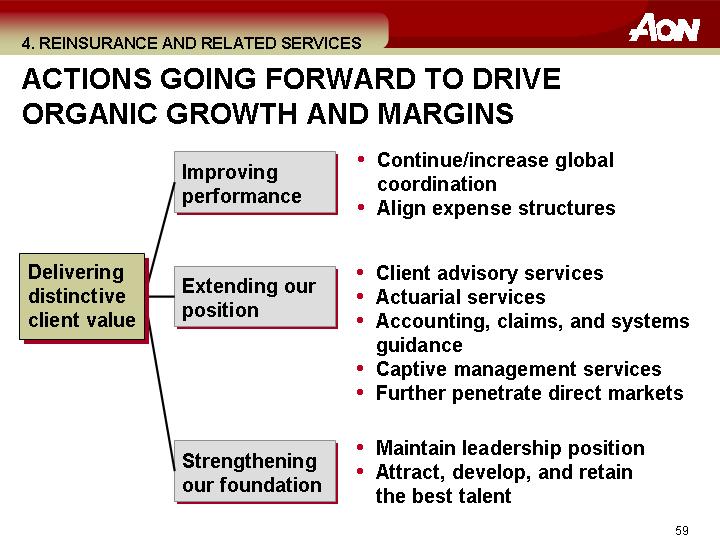
ACTIONS GOING FORWARD TO DRIVE ORGANIC GROWTH AND MARGINS
Delivering distinctive client value | | Improving performance | | • Continue/increase global coordination |
| | | • Align expense structures |
| | | |
| Extending our position | | • Client advisory services |
| | | • Actuarial services |
| | | • Accounting, claims, and systems guidance |
| | | • Captive management services |
| | | • Further penetrate direct markets |
| | | |
| Strengthening our foundation | | • Maintain leadership position |
| | • Attract, develop, and retain the best talent |
59
5. U.S. RETAIL
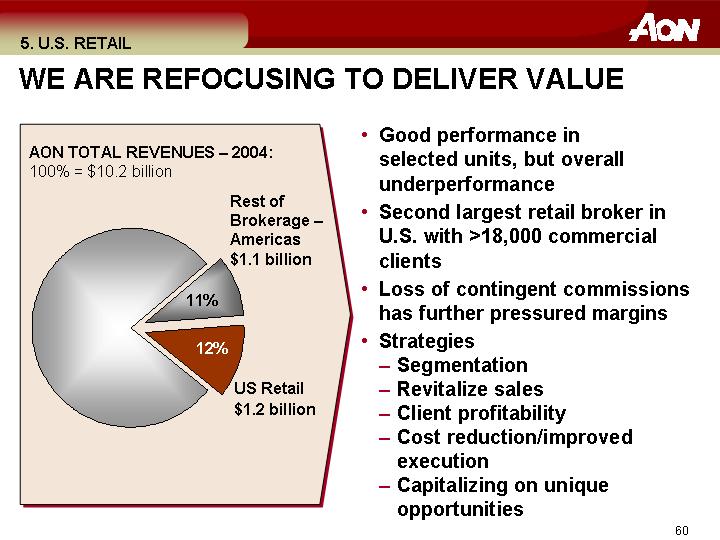
WE ARE REFOCUSING TO DELIVER VALUE
AON TOTAL REVENUES – 2004:
100% = $10.2 billion
[CHART]
• Good performance in selected units, but overall underperformance
• Second largest retail broker in U.S. with >18,000 commercial clients
• Loss of contingent commissions has further pressured margins
• Strategies
• Segmentation
• Revitalize sales
• Client profitability
• Cost reduction/improved execution
• Capitalizing on unique opportunities
60
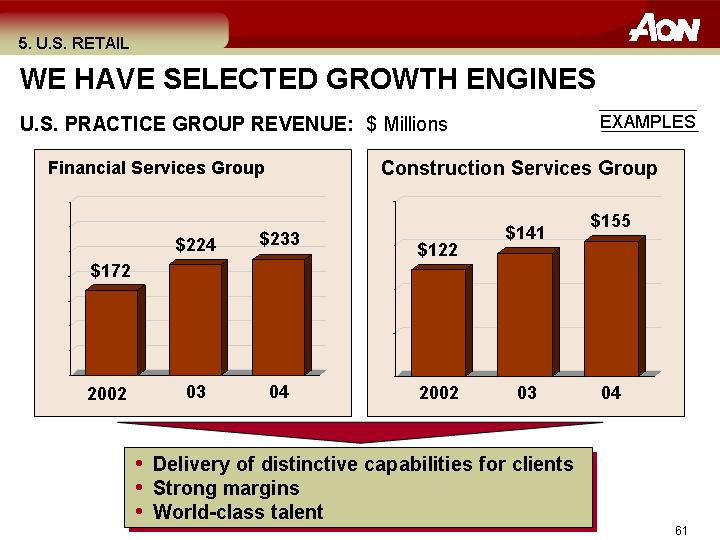
WE HAVE SELECTED GROWTH ENGINES
U.S. PRACTICE GROUP REVENUE: $ Millions | | EXAMPLES |
| | |
Financial Services Group | | Construction Services Group |
| | |
[CHART] | | [CHART] |
• Delivery of distinctive capabilities for clients
• Strong margins
• World-class talent
61
WE ARE REFINING OUR SEGMENTATION
• Global Large Corporate (GLC)
• Strategic Risk Offices (SROs)
• 12 SROs
• Predominately accounts > $250 thousand in Aon revenue
• Commercial Risk Offices (CROs)
• 40 smaller offices
• Predominately mid-market accounts
• Blended office approach with Aon Consulting for Health and Welfare businesses
62
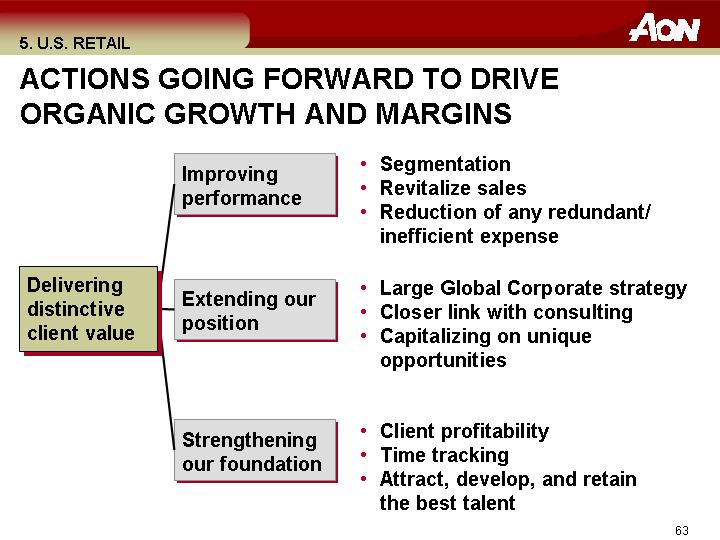
ACTIONS GOING FORWARD TO DRIVE ORGANIC GROWTH AND MARGINS
| | Improving | • Segmentation |
| | performance | • Revitalize sales |
| | | • Reduction of any redundant/inefficient expense |
| | | |
Delivering | | Extending our
position | • Large Global Corporate strategy |
distinctive | | • Closer link with consulting |
client value | | • Capitalizing on unique opportunities |
| | | |
| | Strengthening | • Client profitability |
| | our foundation | • Time tracking |
| | | • Attract, develop, and retain the best talent |
63
6. ASIA-PACIFIC
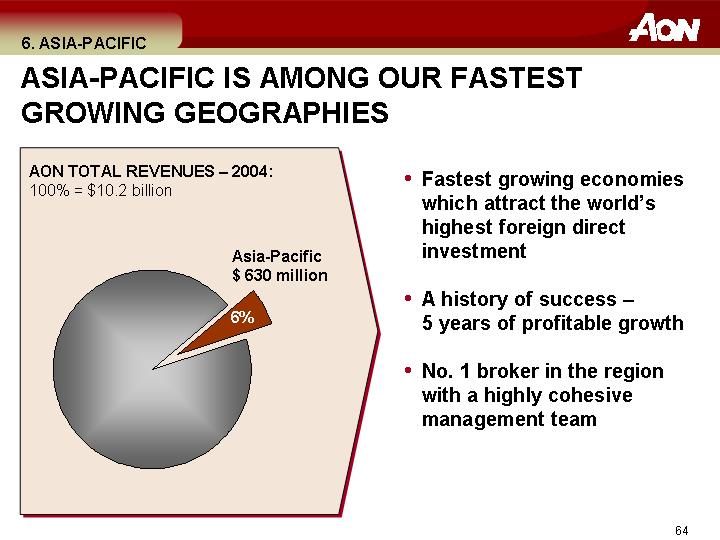
ASIA-PACIFIC IS AMONG OUR FASTEST GROWING GEOGRAPHIES
AON TOTAL REVENUES – 2004:
100% = $10.2 billion
[CHART]
• Fastest growing economies which attract the world’s highest foreign direct investment
• A history of success – 5 years of profitable growth
• No. 1 broker in the region with a highly cohesive management team
64
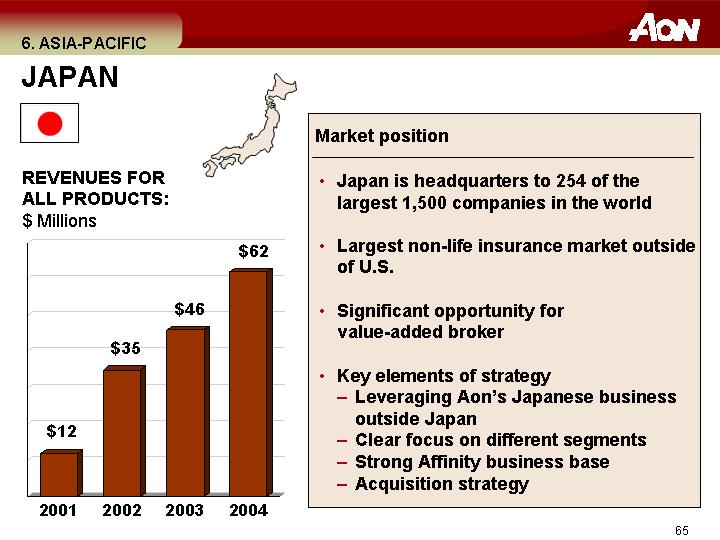
JAPAN
[GRAPHIC]
REVENUES FOR ALL PRODUCTS:
$ Millions
[CHART]
Market position
• Japan is headquarters to 254 of the largest 1,500 companies in the world
• Largest non-life insurance market outside of U.S.
• Significant opportunity for value-added broker
• Key elements of strategy
• Leveraging Aon’s Japanese business outside Japan
• Clear focus on different segments
• Strong Affinity business base
• Acquisition strategy
65
CHINA
[GRAPHIC]
Market position
• Very high FDI will continue to drive growth … these are our clients and they are doing business here
• Domestic Chinese corporations also growing rapidly and in turn are increasingly investing overseas
• Aon is 1st foreign broker licensed in China
• Dominant broker in energy, power, infrastructure, underdeveloped liability market
66
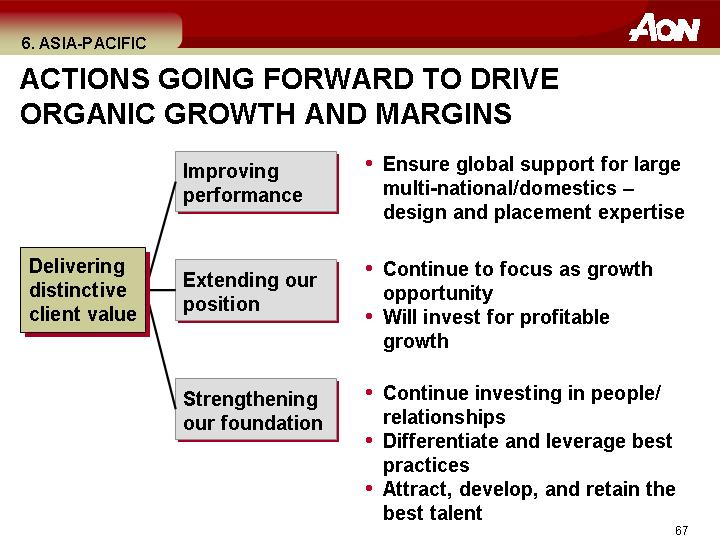
ACTIONS GOING FORWARD TO DRIVE ORGANIC GROWTH AND MARGINS
| | Improving | • Ensure global support for large multi-national/domestics – |
| | performance | design and placement expertise |
| | | |
| | | |
Delivering | | Extending our
position | • Continue to focus as growth opportunity |
distinctive | | • Will invest for profitable growth |
client value | | |
| | | |
| | Strengthening | • Continue investing in people/relationships |
| | our foundation | • Differentiate and leverage best practices |
| | | • Attract, develop, and retain the best talent |
67
7. GLOBAL LARGE CORPORATE
LARGE SEGMENT IS A MAJOR OPPORTUNITY
TOP 1,500 GLOBAL COMPANIES BY SALES
[CHART]
• 60%+ penetration of the top 1,500 companies
• High penetration in some major countries
• Establishment of Global Large Corporate unit
• Key enablers
• Strategic Account Management
• Global Business Units
• Global Practice Groups
• Design and Placement
68
INTEGRATED ACCOUNT PLANNING AND CLIENT RELATIONSHIP MANAGEMENT CRITICAL
• Increasingly broad relationships with clients
• Multi-product
• Multi-country
• Integrated account planning and structured client relationship management should allow Aon to capture the increased opportunities
69
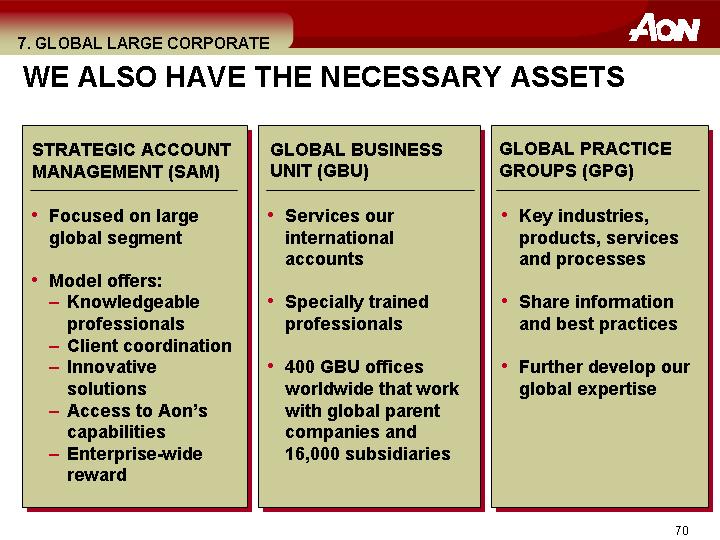
WE ALSO HAVE THE NECESSARY ASSETS
STRATEGIC ACCOUNT | | GLOBAL BUSINESS | | GLOBAL PRACTICE |
MANAGEMENT (SAM) | | UNIT (GBU) | | GROUPS (GPG) |
| | | | |
• Focused on large global segment | | • Services our international | | • Key industries, products, services |
| | accounts | | and processes |
• Model offers: | | | | |
• Knowledgeable professionals | | • Specially trained professionals | | • Share information and best |
• Client coordination | | | | practices |
• Innovative solutions | | • 400 GBU offices worldwide that | | |
• Access to Aon’s capabilities | | work with global parent companies | | • Further develop our global |
• Enterprise-wide reward | | and 16,000 subsidiaries | | expertise |
70
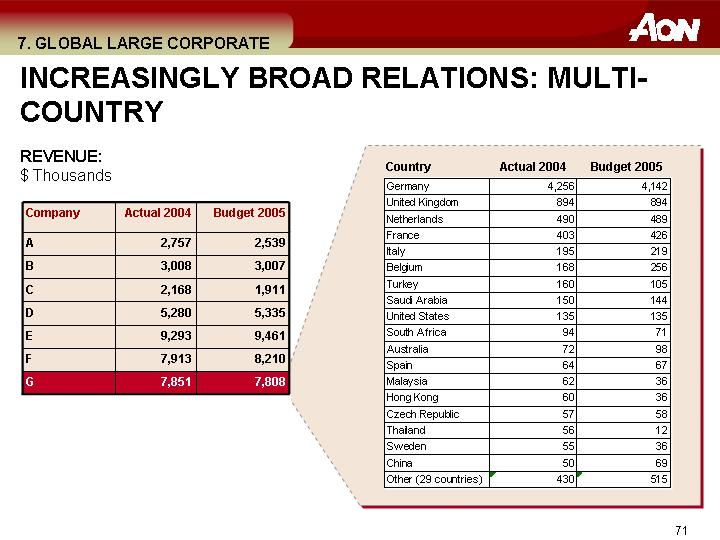
INCREASINGLY BROAD RELATIONS: MULTI-COUNTRY
REVENUE:
$ Thousands
Company | | Actual 2004 | | Budget 2005 | |
A | | 2,757 | | 2,539 | |
B | | 3,008 | | 3,007 | |
C | | 2,168 | | 1,911 | |
D | | 5,280 | | 5,335 | |
E | | 9,293 | | 9,461 | |
F | | 7,913 | | 8,210 | |
G | | 7,851 | | 7,808 | |
Country | | Actual 2004 | | Budget 2005 | |
Germany | | 4,256 | | 4,142 | |
United Kingdom | | 894 | | 894 | |
Netherlands | | 490 | | 489 | |
France | | 403 | | 426 | |
Italy | | 195 | | 219 | |
Belgium | | 168 | | 256 | |
Turkey | | 160 | | 105 | |
Saudi Arabia | | 150 | | 144 | |
United States | | 135 | | 135 | |
South Africa | | 94 | | 71 | |
Australia | | 72 | | 98 | |
Spain | | 64 | | 67 | |
Malaysia | | 62 | | 36 | |
Hong Kong | | 60 | | 36 | |
Czech Republic | | 57 | | 58 | |
Thailand | | 56 | | 12 | |
Sweden | | 55 | | 36 | |
China | | 50 | | 69 | |
Other (29 countries) | | 430 | | 515 | |
71
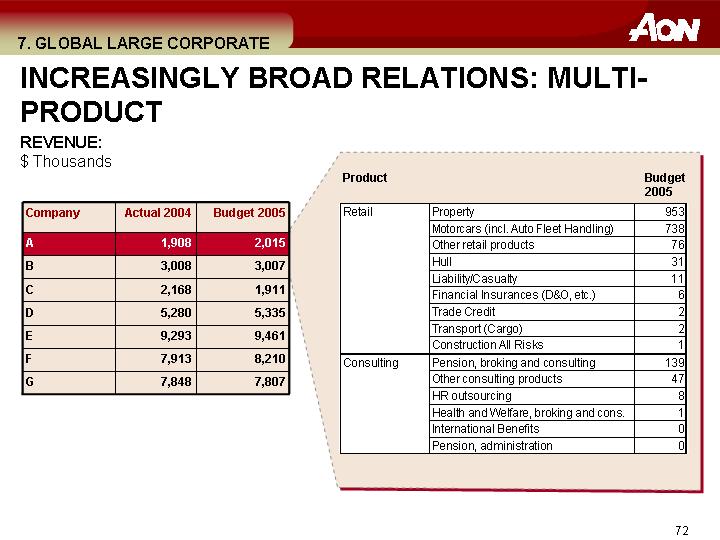
INCREASINGLY BROAD RELATIONS: MULTI-PRODUCT
REVENUE:
$ Thousands
Company | | Actual 2004 | | Budget 2005 | |
A | | 1,908 | | 2,015 | |
B | | 3,008 | | 3,007 | |
C | | 2,168 | | 1,911 | |
D | | 5,280 | | 5,335 | |
E | | 9,293 | | 9,461 | |
F | | 7,913 | | 8,210 | |
G | | 7,848 | | 7,807 | |
Product | | Budget
2005 | |
Retail | Property | | 953 | |
| Motorcars (incl. Auto Fleet Handling) | | 738 | |
| Other retail products | | 76 | |
| Hull | | 31 | |
| Liability/Casualty | | 11 | |
| Financial Insurances (D&O, etc.) | | 6 | |
| Trade Credit | | 2 | |
| Transport (Cargo) | | 2 | |
| Construction All Risks | | 1 | |
Consulting | Pension, broking and consulting | | 139 | |
| Other consulting products | | 47 | |
| HR outsourcing | | 8 | |
| Health and Welfare, broking and cons. | | 1 | |
| International Benefits | | 0 | |
| Pension, administration | | 0 | |
72
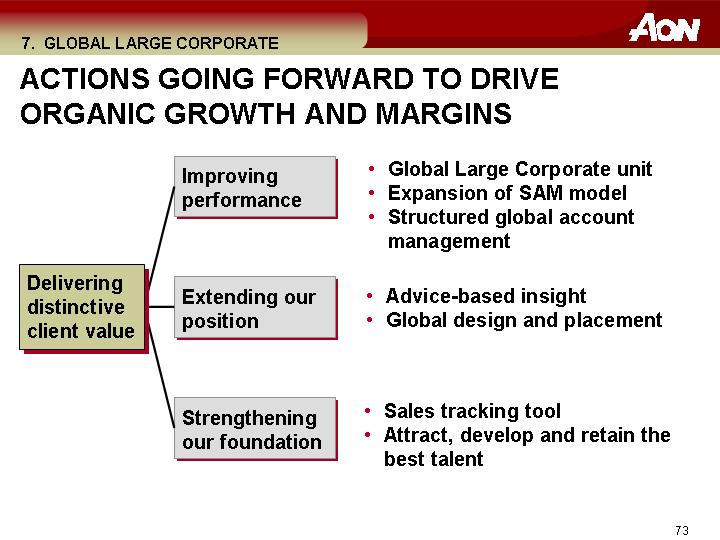
ACTIONS GOING FORWARD TO DRIVE ORGANIC GROWTH AND MARGINS
| | Improving | • Global Large Corporate unit |
| | performance | • Expansion of SAM model |
| | | • Structured global account management |
| | | |
Delivering | | Extending our
position | • Advice-based insight |
distinctive | | • Global design and placement |
client value | | |
| | | |
| | Strengthening | • Sales tracking tool |
| | our foundation | • Attract, develop and retain the best talent |
73
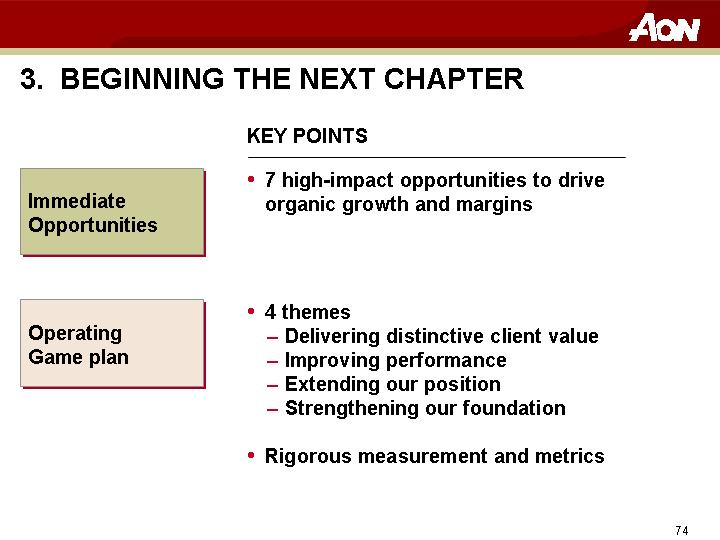
3. BEGINNING THE NEXT CHAPTER
| | KEY POINTS |
| | |
Immediate Opportunities | | • 7 high-impact opportunities to drive organic growth and margins |
| | |
Operating Game plan | | • 4 themes |
| | • Delivering distinctive client value |
| | • Improving performance |
| | • Extending our position |
| | • Strengthening our foundation |
| | |
| | • Rigorous measurement and metrics |
74
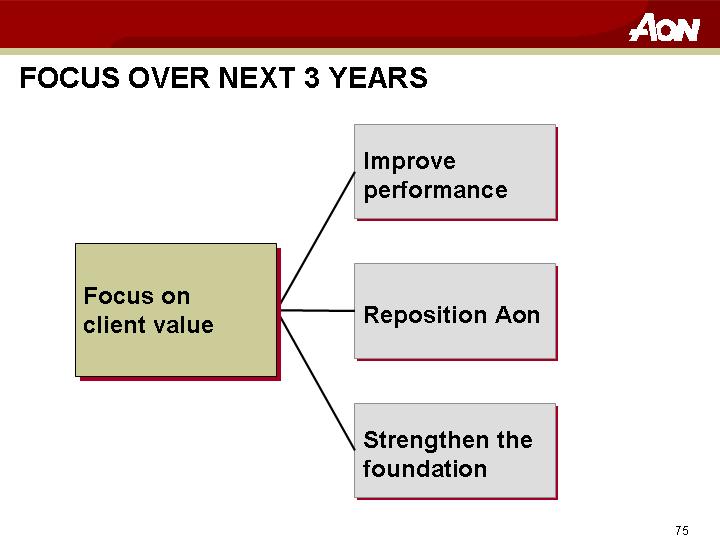
FOCUS OVER NEXT 3 YEARS
Focus on
client value | | Improve performance |
| |
| Reposition Aon |
| |
| Strengthen the foundation |
75
SUMMARY
• Aon has a compelling and unique opportunity for value creation and we are committed to the change required to capture it
• Risk management industry represents a significant opportunity that incumbents have failed to capture
• In this context, Aon has underperformed, particularly considering our distinctive assets
• Early game plan focuses on 4 themes
76